UNITED STATES

SECURITIES AND EXCHANGE COMMISSION

Washington, D.C. 20549

FORM 10-K

(Mark One)
10-K/A

Amendment No. 1

x
þANNUAL REPORT PURSUANT TO SECTION 13 OR 15(d) OF THE SECURITIES EXCHANGE ACT OF 1934

For the fiscal year ended June 30, 2016

2023

OR

¨
¨TRANSITION REPORT PURSUANT TO SECTION 13 OR 15(d) OF THE SECURITIES EXCHANGE ACT OF 1934

For the transition period from to

Commission file number: 001-34249

FARMER BROS. CO.

CO

(Exact Name of Registrant as Specified in Its Charter)

Delaware 95-0725980
Delaware(State or other jurisdiction of incorporation or
organization)
 95-0725980
(State of Incorporation)(I.R.S. Employer Identification No.)

1912 Farmer Brothers Drive, Northlake, Texas76262

(Address of Principal Executive Offices; Zip Code)
682-549-6600
(Registrant’s Telephone Number, Including Area Code)

13601 North Freeway, Suite 200, Fort Worth, Texas 76177
(Address of Principal Executive Offices; Zip Code)

888-998-2468
Registrant’s telephone number, including area code

Securities registered pursuant to Section 12(b) of the Act:

Title of Each ClassTrading Symbol(s)Name of Each Exchange on Which
Registered
Common Stock, $1.00 par value $1.00 per shareFARMThe NASDAQNasdaq Global Select Market

Securities registered pursuant to Section 12(g) of the Act: None

Indicate by check mark if the registrant is a well-known seasoned issuer, as defined in Rule 405 of the Securities Act. YES ¨    NO  þ

Nox

Indicate by check mark if the registrant is not required to file reports pursuant to Section 13 or Section 15(d) of the Act. YES ¨    NO  þ

No x

Indicate by check mark whether the registrant:registrant (1) has filed all reports required to be filed by Section 13 or 15(d) of the Securities Exchange Act of 1934 during the preceding 12 months (or for such shorter period that the registrant was required to file such reports), and (2) has been subject to such filing requirements for the past 90 days. YES  þYes x NO ¨

Indicate by check mark whether the registrant has submitted electronically and posted on its corporate Web site, if any, every Interactive Data File required to be submitted and posted pursuant to Rule 405 of Regulation S-T (§232.405 of this chapter) during the preceding 12 months (or for such shorter period that the registrant was required to submit and post such files). YES  þYesx NO ¨

Indicate by check mark if disclosure of delinquent filers pursuant to Item 405 of Regulation S-K (§229.405) is not contained herein, and will not be contained, to the best of registrant’s knowledge, in definitive proxy or information statements incorporated by reference in Part III of this Form 10-K or any amendment to this Form 10-K. ¨

Indicate by check mark whether the registrant is a large accelerated filer, an accelerated filer, a non-accelerated filer, or a smaller reporting company, or an emerging growth company. See the definitions of “large accelerated filer,” “accelerated filer”filer,” “smaller reporting company,” and “smaller reporting“emerging growth company” in Rule 12b-2 of the Exchange Act. (Check one):

Large accelerated filer  

Large accelerated filer¨Accelerated filerx
Non-accelerated filer¨Smaller reporting company¨
Emerging growth company¨

If an emerging growth company, indicate by check mark if the registrant has elected not to use the extended transition period for complying with any new or revised financial accounting standards provided pursuant to Section 13(a) of the Exchange Act. ¨        Accelerated filer  þ        Non-accelerated filer  ¨        Smaller

Indicate by check mark whether the registrant has filed a report on and attestation to its management’s assessment of the effectiveness of its internal control over financial reporting company  ¨

(Do not check if a smaller reporting company)
under Section 404(b) of the Sarbanes-Oxley Act (15 U.S.C. 7262(b)) by the registered public accounting firm that prepared or issued its audit report. x

Indicate by check mark whether the registrant is a shell company (as defined in Rule 12b-2 of the Exchange Act).

YES ¨NO þ

x

The aggregate market value of the voting and non-voting common equity held by non-affiliates computed by reference toof the registrant as of December 31, 2022, the last business day of the registrant’s most recently completed second fiscal quarter, was $96.3 million based upon the closing price at whichreported for such date on the Farmer Bros. Co. common stock was sold on December 31, 2015 was $278.4 million.

Nasdaq Global Select Market.

As of September 12, 2016October 1, 2023, the registrant had 16,781,56119,279,970 shares outstanding of its common stock, par value $1.00 per share, which is the registrant’s only class of common stock.

Auditor NameAuditor LocationAuditor Firm ID
Grant Thornton LLPDallas, Texas248

DOCUMENTS INCORPORATED BY REFERENCE

Specified portions of the registrant’s definitive proxy statement to be filed with the U.S. Securities and Exchange Commission (“SEC”) pursuant to Regulation 14A in connection with the registrant’s 2016 Annual Meeting of Stockholders (the “Proxy Statement”) are incorporated by reference into Part III of this report. Such Proxy Statement will be filed with the SEC not later than 120 days after the conclusion of the registrant’s fiscal year ended June 30, 2016.


TABLE OF CONTENTS

PART IIII 4
ITEM 1.Business
ITEM 1A.Risk Factors
ITEM 1B.Unresolved Staff Comments
ITEM 2.Properties
ITEM 3.Legal Proceedings
ITEM 4.Mine Safety Disclosures
PART II
ITEM 5.Market for Registrant's Common Equity, Related Stockholder Matters and Issuer Purchases of Equity Securities
ITEM 6.Selected Financial Data
ITEM 7.Management's Discussion and Analysis of Financial Condition and Results of Operations
ITEM 7A.Quantitative and Qualitative Disclosures About Market Risk
ITEM 8.Financial Statements and Supplementary Data
ITEM 9.Changes in and Disagreements with Accountants on Accounting and Financial Disclosure
ITEM 9A.Controls and Procedures
ITEM 9B.Other Information
PART III
ITEM 10.Directors, Executive Officers and Corporate Governance
ITEM 11.Executive Compensation
ITEM 12.Security Ownership of Certain Beneficial Owners and Management and Related Stockholder Matters
ITEM 13.Certain Relationships and Related Transactions, and Director Independence
ITEM 14.Principal Accountant Fees and Services
PART IV  
PART IV51
ITEM 15.Exhibits and Financial Statement Schedules
ITEM 16.Form 10-K Summary
SIGNATURES

i

EXPLANATORY NOTE

Farmer Bros. Co. (“Farmer Bros.” or the “Company”) is filing this Amendment No. 1 on Form 10-K/A (this “Amendment”) to its Form 10-K for the fiscal year ended June 30, 2023, which was filed with the Securities and Exchange Commission (the “SEC”) on September 12, 2023 (the “Original Filing”).

This Amendment is being filed for the purpose of providing the information required by Items 10 through 14 of Part III of Form 10-K. This information was previously omitted from the Original Filing in reliance on General Instruction G(3) to Form 10-K, which permits the above-referenced Items to be incorporated in the Annual Report on Form 10-K by reference from a definitive proxy statement, if such definitive proxy statement is filed no later than 120 days after the last day of the Company’s fiscal year on June 30, 2023.

In accordance with Rule 12b-15 under the Securities Exchange Act of 1934, as amended (the “Exchange Act”), the cover page to the Original Filing and Items 10 through 14 of Part III of the Original Filing are hereby amended and restated in their entirety. In addition, pursuant to Rule 12b-15 under the Exchange Act, the Company is including Item 15 of Part IV, solely to file the certifications required under Section 302 of the Sarbanes-Oxley Act of 2002 with this Amendment.

Except as described above, no other changes have been made to the Original Filing. This Amendment does not affect any other section of the Original Filing not otherwise discussed herein and continues to speak as of the date of the Original Filing. The Company has not updated the disclosures contained in the Original Filing to reflect any events that occurred subsequent to the date of the Original Filing. Accordingly, this Amendment should be read in conjunction with the Company’s other filings made with the SEC subsequent to the filing of the Original Filing.

ii

CAUTIONARY NOTE REGARDING FORWARD-LOOKING STATEMENTS

This reportAmendment and other documents we file with the SEC contain forward-looking statements“forward-looking statements” within the meaning of Section 27A of the Securities Act of 1933, as amended (the “Securities Act”), and Section 21E of the Exchange Act, that are based on current expectations, estimates, forecasts and projections about us, our future performance, our financial condition, our products, our business strategy, our beliefs and our management’s assumptions. In addition, we, or others on our behalf, may make forward-looking statements in press releases or written statements, or in our communications and discussions with investors and analysts in the normal course of business through meetings, webcasts, phone calls and conference calls. These forward-looking statements can be identified by the use of words like “anticipates,” “estimates,” “projects,” “expects,” “plans,” “believes,” “intends,” “will,” “could,” “may,” “assumes” and other words of similar meaning. These statements are based on management’s beliefs, assumptions, estimates and observations of future events based on information available to our management at the time the statements are made and include any statements that do not relate to any historical or current fact. These statements are not guarantees of future performance and they involve certain risks, uncertainties and assumptions that are difficult to predict. Actual outcomes and results may differ materially from what is expressed, implied or forecast by our forward-looking statements due in part to the risks, uncertainties and assumptions set forth below in Part I, Item 1A, 1.A., Risk Factors as well as Part II, Item 7, Management’s Discussion and Analysis of this report,Financial Condition and Results of Operations, of the Original Filing, as well as those discussed elsewhere in this reportthe Original Filing and other factors described from time to time in our filings with the SEC. Reference is made

Factors that could cause actual results to differ materially from those in particular to forward-looking statements regarding construction, relocationinclude, but are not limited to, severe weather, levels of consumer confidence in national and operationlocal economic business conditions, the impact of our new Texas facility,labor shortages, the timing andincrease of costs due to inflation, an economic downturn caused by any pandemic, epidemic or other disease outbreak, comparable or similar to COVID-19, the success of our relocation plan, productturnaround strategy, the impact of capital improvement projects, the adequacy and availability of capital resources to fund our existing and planned business operations and our capital expenditure requirements, our ability to meet financial covenant requirements in our Credit Facility, which could impact, among other things, our liquidity, the relative effectiveness of compensation-based employee incentives in causing improvements in our performance, the capacity to meet the demands of our large national account customers, the extent of execution of plans for the growth of our business and achievement of financial metrics related to those plans, our success in retaining and/or attracting qualified employees, our success in adapting to technology and new commerce channels, the effect of the capital markets as well as other external factors on stockholder value, fluctuations in availability and cost of green coffee, competition, organizational changes, the effectiveness of our hedging strategies in reducing price and interest rate risk, changes in consumer preferences, our ability to provide sustainability in ways that do not materially impair profitability, changes in the strength of the economy, including any effects from inflation, business conditions in the coffee industry and food industry in general, our continued success in attracting new customers, variances from budgeted sales expenses, earnings per share (EPS),mix and liquiditygrowth rates, weather and capital resources. We intendspecial or unusual events, as well as other risks described in this Amendment and other factors described from time to time in our filings with the SEC.

Given these risks and uncertainties, you should not rely on forward-looking statements as a prediction of actual results. Any or all of the forward-looking statements contained in this Amendment and any other public statement made by us, including by our management, may turn out to speak only atbe incorrect. We are including this cautionary note to make applicable and take advantage of the datesafe harbor provisions of this report and do not undertakethe Private Securities Litigation Reform Act of 1995 for forward-looking statements. We expressly disclaim any obligation to update or revise theseany forward-looking statements, whether as a result of new information, future events, changes in assumptions or otherwise, except as required under federal securities laws and the rules and regulations of the SEC.

iii


PART I

III

ITEM 10.
Item 1.BusinessDirectors, Executive Officers and Corporate Governance
Overview
Farmer Bros. Co.

Directors

Each director of the Company is to be elected annually and serve until his or her successor has been elected and qualified, or until his or her death, resignation, retirement, disqualification or removal from office.

The authorized number of directors is set forth in the Company’s Second Amended and Restated Certificate of Incorporation (“Certificate of Incorporation”) and shall consist of not less than five nor more than nine members, the exact number of which shall be fixed from time to time by resolution of the Board. The authorized number of directors is currently eight. Any vacancy on the Board that results from an increase in the number of directors may be filled by a majority of the directors then in office, provided that a quorum is present, and any other vacancy occurring on the Board may be filled by a majority of the directors then in office, even if less than a quorum, or by the sole remaining director. Any director elected to fill a vacancy not resulting from an increase in the number of directors will have the same remaining term as that of his or her predecessor. Subject to the rights, if any, of the holders of shares of Preferred Stock then outstanding, any or all of the directors of the Company may be removed from office at any time, with or without cause, in accordance with the DGCL.

All of the present directors were elected to their current terms by the stockholders. There are no family relationships among any directors or executive officers of the Company. Except as disclosed below, none of the directors is a director of any other publicly held company. Except as otherwise disclosed herein, there are no arrangements or understandings between any of our directors and any other person pursuant to which any person was selected as a director.

Set forth below are the biographies of each director, including their ages and positions and offices held with the Company as of the date hereof.

Allison M. Boersma, age 58, has served on our Board since 2017 and is currently the Chief Financial Officer and Chief Operating Officer of BRG Sports Inc., a Delaware corporation (including its consolidated subsidiaries unlesscorporate holding company of leading brands that design, develop and market innovative sports equipment, protective products, apparel and related accessories. The company’s core football brand, Riddell, is the context otherwise requires,industry leader in football helmet technology and innovation. Ms. Boersma has served as the “Company,” “we,” “us,” “our” or “Farmer Bros.”)finance and operations leader for BRG Sports since April 2016, responsible for financial oversight, including planning, treasury and risk management; leadership of global sourcing, manufacturing and distribution; strategic planning and acquisitions; and manufacturing strategy. Ms. Boersma has also served as Chief Financial Officer and Chief Operating Officer of Riddell Inc., since May 2014, and Senior Vice President Finance and Chief Financial Officer of Riddell, from February 2009 to May 2014. Previously, Ms. Boersma was a finance executive with Kraft Foods, a multinational confectionery, food and beverage conglomerate, for over 17 years, with various positions of increasing responsibility, including serving as Senior Director Finance, Global Procurement, from May 2007 to February 2009, with leadership and oversight of commodity hedging and risk management, including for coffee; execution of global strategies to improve supplier performance; commodity tracking and derivative accounting. Other positions with Kraft included Controller, Grocery Sector; Controller, Meals Division; Director, Sales Finance, Kraft Food Services Division; and Senior Manager, Corporate Financial Business Analysis. Ms. Boersma began her career as a Senior Auditor with Coopers & Lybrand. Ms. Boersma received her undergraduate degree in Accountancy from the University of Illinois Champaign-Urbana, and her Masters of Management, Marketing and Finance, from JL Kellogg Graduate School of Management.

Stacy Loretz-Congdon, age 64, has served on our Board since 2018. She retired at the end of 2016 after 26 years of service at Core-Mark Holding Company, Inc. (formerly NASDAQ: CORE), one of the largest marketers of fresh and broad-line supply solutions to the convenience retail industry in North America, where she served in various capacities, including as Senior Vice President, Chief Financial Officer and Assistant Secretary from December 2006 to May 2016 and Executive Advisor from May 2016 through December 2016. From January 2003 to December 2006, Ms. Loretz-Congdon served as Core-Mark’s Vice President of Finance and Treasurer and from November 1999 to January 2003 served as Core-Mark’s Corporate Treasurer. Ms. Loretz-Congdon joined Core-Mark in 1990. Ms. Loretz-Congdon’s experience at Core-Mark included oversight of all finance functions, including all corporate finance disciplines, strategy execution, risk mitigation, investor relations, as well as involvement with benefits, executive compensation and technology initiatives. During her tenure as Senior Vice President and Chief Financial Officer, Ms. Loretz-Congdon served on the Information Technology Steering Committee and the Investment Committee at Core-Mark, as well as a board member of all Core-Mark subsidiaries. Core-Mark was a Fortune 500, publicly traded company listed on the Nasdaq Global Market until September 2021 when it merged with Performance Food Group Company (NYSE: PFGC). In 2015, Ms. Loretz-Congdon was named as one of the Top 50 female CFOs in the Fortune 500 by Business Insider and Woman of the Year by Convenience Store News. Prior to joining Core-Mark, Ms. Loretz-Congdon was an auditor for Coopers & Lybrand. Ms. Loretz-Congdon received her Bachelor of Science degree in Accounting from California State University, San Francisco.


David A. Pace, age 64, has served on our Board since 2023 and has served as interim Chairman of our Board since October 11, 2023. Previously Mr. Pace served as Co-Chief Executive Officer of Tastemaker Acquisition Corp. (NASDAQ: TMKR), a special purpose acquisition company, where he also served as a director. Mr. Pace previously served as Chief Executive Officer and President of Jamba Inc. (formerly NASDAQ: JMBA), a leading restaurant retailer of better-for-you food and beverage offerings, from March 2016 to September 2018, where he also served as a director from 2012 until September 2018. Prior to that, Mr. Pace served in a variety of executive roles at Bloomin’ Brands, Inc. (NASDAQ: BLMN), one of the largest casual dining restaurant companies in the world, including most recently as President of Carrabba’s Italian Grill from 2014 to 2016 after previously serving as Executive Vice President and Chief Resource Officer from 2010 to 2014. Earlier in his career, Mr. Pace held various leadership roles at Starbucks Corporation (NASDAQ: SBUX), PepsiCo, Inc. (NASDAQ: PEP) and YUM! Brands, Inc. (NYSE: YUM). Mr. Pace currently serves as Chairman of the board of directors of Red Robin Gourmet Burgers, Inc. (NASDAQ: RRGB), a casual dining chain, after initially joining the board as a director in August 2019. Mr. Pace has also served as a director of Authentic Restaurant Brands, a restaurant portfolio company of Garnett Station Partners, since May 2022, and as a member of the Ownership Advisory Board for the NHL’s Dallas Stars since 2017. Mr. Pace earned his B.S. in Industrial and Labor Relations from Cornell University.

Alfred Poe, age 74, has served as a member of our Board since 2020 and served as Chairman of the Board from June 30, 2023 to October 11, 2023. Mr. Poe is currently the Chief Executive Officer of AJA Restaurant Corp., serving as such since 1999. From 1997 to 2002, he was the Chief Executive Officer of Superior Nutrition Corporation, a national coffee roaster, wholesalerprovider of nutrition products. He was Chairman of the Board and Chief Executive Officer of MenuDirect Corporation from 1997 to 1999. Mr. Poe was a Corporate Vice President of Campbell Soup Company from 1991 through 1996. From 1993 through 1996, he was the President of the Campbell’s Meal Enhancement Group. From 1982 to 1991, Mr. Poe held various positions, including Vice President, Brands Director and Commercial Director with Mars, Inc. Mr. Poe currently serves on the board of directors of B&G, Foods, Inc., a manufacturer and distributor of coffee, teashelf-stable food and culinary products. We servehousehold products across the United States, Canada and Puerto Rico and a wide varietypublicly traded company listed on the New York Stock Exchange, since 1997. Mr. Poe has previously served on the boards of customers,directors of Centerplate, Inc. and State Street Bank. Mr. Poe earned a B.S. in Electrical Engineering from smallBrooklyn Polytechnic and an MBA from Harvard University.

Bradley L. Radoff, age 50, has served on our Board since 2022 and currently serves as a private investor. Mr. Radoff served as Principal of Fondren Management LP, a private investment management company, from 2005 to December 2021. Mr. Radoff previously served as a Portfolio Manager at Third Point LLC, a registered investment advisory firm, from 2006 to 2009. He also served as Managing Director of Lonestar Capital Management LLC, a registered investment advisory firm, from 2003 to 2004. Mr. Radoff also previously served as a director of Citadel Investment Group LLC, a global financial institution, from 2000 to 2003. Mr. Radoff has served as a director of Enzo Biochem, Inc. (NYSE: ENZ), an integrated diagnostics, clinical lab and life sciences company, since January 2022, where he also serves as Chair of the Audit Committee. Mr. Radoff has served as a director of Harte Hanks, Inc. (NASDAQ: HHS), a leading global customer experience company, since May 2021. Mr. Radoff previously served as a director of VAALCO Energy, Inc. (NYSE: EGY), a Texas-based independent restaurantsenergy company, from June 2020 to January 2022, Support.com, Inc. (formerly NASDAQ: SPRT), a leading provider of cloud-based software and foodservice operatorsservices, from June 2016 until its merger in September 2021, and Pogo Producing Company (formerly NYSE: PPP), an oil and gas exploration, development and production company, from March 2007 until the completion of its sale to large institutional buyers like restaurantPlains Exploration & Production Company in November 2007. Mr. Radoff graduated summa cum laude with a B.S. in Economics from The Wharton School at the University of Pennsylvania.


John D. Robinson, age 64, has served on our Board since 2021 and convenience store chains, hotels, casinos, hospitals,is currently an operating partner focusing on food and gourmet coffee houses,beverage opportunities at Sequel Holdings, a private equity firm, serving in such role since 2017. Currently, Mr. Robinson serves as wellChairman of the Board of Chairmans Foods, a Sequel portfolio company. Prior to joining Sequel, from 2009 to 2015, Mr. Robinson was Managing Partner for Rutherford Wine Studios LLC, dba The Ranch Winery, a wine co-packing and processing facility in Napa Valley, CA, which was sold to E&J Gallo Winery in 2015. Prior to that, he held leadership roles at Morningstar Foods, Dean Foods Company and Robinson Dairy. Mr. Robinson received a Bachelor of Science in Business Administration from the University of Arizona.

Waheed Zaman, age 63, has served on our Board since September 2021 Since April 2017, Mr. Zaman has served the Chief Executive Officer of W&A Consulting, a consulting and advisory firm, where he advises senior executives on transformational change and consults with leaders and teams on personal success and leadership practices to ensure organizational effectiveness and strategy execution. Mr. Zaman’s prior experience includes his service in multiple roles with the Hershey Company, including his service as grocery chainsSenior Vice President, Chief Corporate Strategy and Administrative Officer and also as Chief Knowledge, Strategy and Technology Officer. While serving in such roles, Mr. Zaman was responsible for Hershey’s corporate strategy, knowledge and insights (including consumer, shopper, and category insights), information technology, and shared service functions. Prior to his service at the Hershey Company, Mr. Zaman served as Senior Vice President, Global Product Supply for Chiquita Brands International, reporting to the CEO. He was responsible for the largest integrated supply chain from farm to shelf in the Fresh Produce sector, with private brandresponsibility for banana production and consumer-branded coffee products. Withsourcing in Central and Latin America, salads manufacturing in North America and logistics and shipping operations on the ground in North America and Europe. Prior to his service in a robust product line, including organic, Direct Trade, Direct Trade Verified Sustainable coffees or DTVSsupply chain role, Mr. Zaman served as Chief Information Officer of Chiquita. Prior to his service with Chiquita, Mr. Zaman held leadership roles at the Procter & Gamble Company. Mr. Zaman is a past recipient of the Supply Chain Leaders of America Lifetime Achievement Award, a Member of the World 50 Executive Forums in Strategy, Supply Chain, IT and other sustainably-produced coffees, icedDigital Transformation, and hot teas, cappuccino, spices,a past member of the Board of Visitors of the University of Maryland Baltimore County and baking/biscuit mixes, among others, we offerthe McKinsey Analytics Council. Mr. Zaman holds a comprehensive approach to our customers by providing not onlybachelor’s degree with a breadthdouble major in Computer Science and Policy Studies from Dartmouth College.

Executive Officers

The following table sets forth the current executive officers of high-quality products, but also value-added services such as market insight, beverage planning, and equipment placement and service. We were founded in 1912, incorporated in California in 1923, and reincorporated in Delaware in 2004. We operate in one business segment.

Corporate Relocation
In an effort to make the Company more competitive and better positioned to capitalize on growth opportunities, in fiscal 2015 we began the process of relocating our corporate headquarters, product development lab, and manufacturing and distribution operations from Torrance, California to a new facility housing these operations currently under construction in Northlake, Texas (the “New Facility”).
Closure and Saleas of the Torrance Facility
We begandate hereof. At each annual meeting of the processBoard of closing our Torrance facilityDirectors, the Board of Directors formally re-appoints the executive officers, and all executive officers serve at the pleasure of the Board of Directors. No executive officer has any family relationship with any director or nominee, or any other executive officer.

Name Age Title Executive Officer Since
John E. Moore III 53 Interim Chief Executive Officer 2023
Brad Bollner 51 Interim Chief Financial Officer 2023
Amber D. Jefferson 52 Chief Human Resources Officer 2021
Jared G. Vitemb 40 Vice President, General Counsel, Chief Compliance Officer and Secretary 2022
Thomas E. Bauer 59 Vice President, Head of DSD 2023

John Moore was appointed interim Chief Executive Officer, effective October 1, 2023. Mr. Moore has served as the Company’s Head of Coffee since July 2023. Before joining the Company, Mr. Moore served as the chief executive officer for Vassilaros Coffee. Prior to Vassilaros, he was the New York senior trader and general manager at Volcafe Specialty Coffee, the chief executive officer and Managing Partner of FAL Coffee Inc. and the vice president of sales and marketing at Octavio Inc., dba Dallis Coffee. Mr. Moore has 30 years of experience in the springcoffee industry and has extensive experience in every stage of 2015 in phases, as follows:

Manufacturingthe coffee value chain, from farms and Distribution. In the fourth quarter of fiscal 2015, we transitioned our coffeemills to barista and roasting grinding and packaging functions from our Torrance, California production facility and consolidated them with our Houston, Texas and Portland, Oregon production facilities, and moved our Houston distribution operations to our Oklahoma City, Oklahoma distribution center.
Corporate Headquarters. During the first half of fiscal 2016, we transferred our primary administrative offices from Torrance to temporary leased offices in Fort Worth, Texas near the New Facility, including the transfer or new hire of approximately 140 employees.
Sale of Spice Assets. In order to focus on our core product offerings,working both in the second quarterUnited States and internationally. Mr. Moore has founded and led several businesses, including Jolly Roger Imports, ELIXIR Cocktail & Espresso Bar and the German expansion of fiscal 2016, we completedNew York Gourmet GmbH & Co. Mr. Moore is also a Certified Q grader and Cup of Excellence Head Judge. He received a Bachelor of Science degree from Earlham College.


Brad Bollner was appointed interim Chief Financial Officer, effective October 1, 2023. Mr. Bollner has served as the saleCompany’s Vice President of certain assets associatedFinance since October 2022. During his more than 25-year finance career, Mr. Bollner has served as Director of Business Analytics at Dave and Busters, Senior Director of Finance at Vail Resorts, Inc. and Vice President – Inventory Planning and Allocation at GameStop Corp. He holds a Bachelor of Science degree in finance and economics from Trinity University and a certification with our manufacture,distinction from Harvard Business Analytics Program.

Amber D. Jefferson joined the Company as Chief Human Resources Officer in October 2021. As Chief Human Resources Officer, Ms. Jefferson’s responsibilities include overseeing the Human Resources, Risk Management and Safety functions. Prior to joining the Company, Ms. Jefferson served as Head of Human Resources KNA Sales & e-Commerce at the Kellogg Company, a global consumer packaged goods company specializing in cereal, cookies, crackers, natural organic and salty snacks production from October 2012 to October 2021, where she was responsible for leading all facets of talent strategies, organizational effectiveness, leadership & capability development, and day-to-day HR operations across the North America region. From 2012 through 2018, Ms. Jefferson held HR leadership roles across various divisions within Kellogg including their Away From Home and Walmart business. Prior to 2012, she held leadership roles with Brinker International, Sabre, Texas Health Resources, The American Lung Association and The American Red Cross. Ms. Jefferson received a Bachelor of Science degree from Texas A&M University and a Master of Science in Healthcare Administration and a Master of Business Administration from Texas Woman’s University.

Jared Vitemb joined the Company as Vice President, General Counsel, Chief Compliance Officer and Secretary in March 2022. Mr. Vitemb’s current responsibilities include overseeing the Company’s Legal and Compliance functions. Prior to joining the Company, Mr. Vitemb held various positions with FTS International Services, Inc., an oilfield services company, from September 2017 to March 2022, where he last served as Senior Vice President, General Counsel, Chief Compliance Officer and Secretary. From March 2014 to September 2017, Mr. Vitemb worked as an in-house attorney for Dean Foods Company, a dairy processing and distribution company. Prior to 2014, he was in private practice, primarily with the law firm of raw, processedGardere Wynne Sewell LLP in Dallas, Texas. Mr. Vitemb received a B.A. in History and blended spicesa J.D. from The University of Texas.

Tom Bauer joined Farmer Brothers in 2023 as the head of direct store delivery (DSD), where he oversees the Company’s DSD operations, sales, logistics, equipment services and certain other culinary products (collectively,product marketing teams. Prior to joining the “Spice Assets”)Company, Mr. Bauer served as the vice president of sales and national accounts at Emerald Brand and as the senior director of national accounts and central U.S. operations for DS Services. From 1999 to Harris Spice2013, he served in a number of leadership positions at Standard Coffee Service Company, Inc. (“Harris”). We provided certain post-closing transition services to Harris which concludedCommunity Coffee, Anheuser Busch and PepsiCo. Mr. Bauer currently serves as the vice chair on National Automatic Merchandising Association’s (NAMA) Coffee Service Committee and on the NAMA Foundation Board of Trustees. He earned a bachelor’s degree from the University of Northern Colorado

Corporate Governance

Board Meeting and Attendance

The Board held 19 meetings during the fourth quarter of fiscal 2016. The sale of the Spice Assets does not represent a strategic shift for us and is not expected to have a material impact on our results of operations because we will continue to sell a complete portfolio of spice and other culinary products purchased from Harris under a supply agreement to our direct-store-delivery, or DSD, customers.

Sale of the Torrance Facility. In the fourth quarter of fiscal 2016, we entered into a purchase and sale agreement to sell the Torrance facility. Subsequent to the fiscal year end, the sale of the Torrance facility closed on July 15, 2016. We have agreed to lease back the Torrance facility on a triple net basis through October 31, 2016, subject to two one-month extensions, at our option. As ofended June 30, 2016, the Torrance facility continued to house certain administrative functions2023 (“fiscal 2023”), including four regular meetings and serve as a distribution facility and branch warehouse pending transition of the remaining Torrance operations to our other facilities.
Construction of the New Facility
In the first quarter of15 special meetings. During fiscal 2016, we entered into a lease agreement, (as amended the "Lease Agreement"), for the New Facility to be constructed by the lessor,2023, each director attended at its expense. The Lease Agreement included an option to purchase the New Facility at a purchase price based on a percentageleast 75% of the total project cost asnumber of meetings of the closing date. InBoard (held during the fourth quarterperiod for which he or she served as a director) and committees of


fiscal 2016, we exercised the purchase option to acquireBoard on which he or she served (during the partially constructed New Facilityperiods that he or she served). The independent directors generally meet in executive session in connection with a targeted closing date ineach regularly scheduled Board meeting. Under the first quarter of fiscal 2017. Construction of and relocation to the New FacilityCompany’s Corporate Governance Guidelines, continuing directors are expected to attend the Company’s annual meeting of stockholders absent a valid reason. Seven of eight directors who were then serving were present at the 2022 Annual Meeting of Stockholders (the “2022 Annual Meeting”).


Charters; Code of Conduct and Ethics; Corporate Governance Guidelines

The Board maintains charters for its committees, including the Audit Committee, Compensation Committee, Nominating and Corporate Governance Committee, and the ad hoc Technology Committee and Strategy and Capital Allocation Committee. In addition, the Board has adopted a written Code of Conduct and Ethics for all employees, officers and directors. The Board maintains Corporate Governance Guidelines as a framework to promote the functioning of the Board and its committees and to set forth a common set of expectations as to how the Board should perform its functions. Current standing and ad hoc committee charters, the Code of Conduct and Ethics and the Corporate Governance Guidelines are available on the Company’s website at www.farmerbros.com. Information contained on the website is not incorporated by reference in, or considered part of, this Proxy Statement.

Board Committees

The Board of Directors has three standing committees: the Audit Committee, Compensation Committee, and Nominating and Corporate Governance Committee. Summary information about each of these committees is set forth below.

Additionally, from time to time, the Board has established ad hoc or other committees, on an interim basis, to assist the Board with its consideration of specific matters, and it expects to continue to do so as it may determine to be completedprudent and advisable in the third quarterfuture. In December 2021, the Board established an ad hoc Technology Committee for the purpose of fiscal 2017.

Products
We are a national coffee roaster, wholesaler and distributor of coffee, tea and culinary products manufactured under supply agreements, under our owned brands, as well as under private labels on behalf of certain customers. Our product categories consistassisting with the review of the following:
a robust line of roasttechnological and ground coffee, including organic, Direct Trade, DTVS and other sustainably-produced offerings;
frozen liquid coffee;
flavored and unflavored iced and hot teas;
culinary products including gelatins and puddings, soup bases, dressings, gravy and sauce mixes, pancake and biscuit mixes, jellies and preserves, and coffee-related products such as coffee filters, sugar and creamers;
spices; and
other beverages including cappuccino, cocoa, granitas, and ready-to-drink iced coffee.
Our owned brand products are sold primarily into the foodservice channel. Our primary brands include Farmer Brothers™, Artisan Collection by Farmer Brothers™, Superior® and Metropolitan™. Our Artisan coffee products include Direct Trade, Fair Trade Certified™, Rainforest Alliance Certified™, organic and proprietary blends. In addition, we sell whole bean and roast and ground flavored and unflavored coffee products under the Un Momento®,Collaborative Coffee™, Cain's™ and McGarvey® brands at retail. Our roast and ground coffee products are sold in traditional packaging, including bags and fractional packages, as well as single-serve packaging. For a descriptioncybersecurity needs of the amount of net sales attributedCompany. Further, in February 2023, the Board established the Strategy and Capital Allocation Committee to each of our product categories in fiscal 2016, 2015review, evaluate and 2014, see Management's Discussionmake recommendations to the Board regarding strategic and Analysis of Financial Conditionsfinancial initiatives and Results of Operations—Results of Operations included in Part II, Item 7 of this report.
Business Strategy
Overview
We develop great tasting products delivered with concierge serviceopportunities available to the Company, with the goal of strengthening the Company’s financial position and maximizing value provided to shareholders.

Audit Committee

The Audit Committee is a positive impactstanding committee of the Board established in accordance with Section 3(a)(58)(A) of the Securities Exchange Act of 1934, as amended (the “Exchange Act”). The Audit Committee’s principal purposes are to oversee, on our customersbehalf of the Board, the accounting and financial reporting processes of the Company and the planet. Throughaudit of the Company’s financial statements. As described in its charter, available on the Company’s website under Corporate Governance - Committee Charters, the Audit Committee’s responsibilities include assisting the Board in overseeing: (i) the integrity of the Company’s financial statements; (ii) the independent auditor’s qualifications and independence; (iii) the performance of the Company’s independent auditor and internal audit function; (iv) the Company’s compliance with legal and regulatory requirements relating to accounting and financial reporting matters; (v) the Company’s system of disclosure controls and procedures, internal control over financial reporting that management has established, and compliance with ethical standards adopted by the Company; and (vi) the Company’s framework and guidelines with respect to risk assessment and risk management. The Audit Committee is directly and solely responsible for the appointment, dismissal, compensation, retention and oversight of the work of any independent auditor engaged by the Company for the purpose of preparing or issuing an audit report or performing other audit, review or attest services for the Company. The independent auditor reports directly to the Audit Committee.

During fiscal 2023, the Audit Committee held five regular meetings and one special meeting. Allison M. Boersma currently serves as Chair, and Stacy Loretz-Congdon, Bradley L. Radoff, and Waheed Zaman currently serve as members of the Audit Committee. All directors who currently serve on the Audit Committee meet the Nasdaq composition requirements, including the requirements regarding financial literacy and financial sophistication, and the Board has determined that all such directors are independent under Rule 5605 of the Nasdaq Stock Market, Inc. Marketplace Rules (“Nasdaq Listing Rules”), and the rules of the SEC regarding audit committee membership. The Board has determined that Ms. Boersma, Ms. Loretz-Congdon and Mr. Radoff are “audit committee financial experts” as defined in Item 407(d) of Regulation S-K under the Exchange Act.

Compensation Committee

The Compensation Committee is a standing committee of the Board. As described in its charter, available on the Company’s website under Governance—Governance Overview—Committee Charters, the Compensation Committee’s principal purposes are to discharge the Board���s responsibilities related to compensation of the Company’s executive officers and administer the Company’s incentive and equity compensation plans. The Compensation Committee’s objectives and philosophy with respect to the fiscal 2023 executive compensation program, and the actions taken by the Compensation Committee in fiscal 2023 with respect to the compensation of our sustainability, stewardship, environmental efforts,Named Executive Officers, are described below under the heading “Compensation Discussion and leadership weAnalysis.”


The Compensation Committee also is responsible for evaluating and making recommendations to the Board regarding director compensation. In addition, the Compensation Committee is responsible for conducting an annual risk evaluation of the Company’s compensation practices, policies and programs.

During fiscal 2023, the Compensation Committee held three regular meetings and three special meetings. John D. Robinson currently serves as Chair and Allison M. Boersma, David A. Pace and Waheed Zaman currently serve as members of the Compensation Committee. The Board has determined that all current Compensation Committee members are not only committedindependent under the Nasdaq Listing Rules.

Compensation Committee Interlocks and Insider Participation

Ms. Boersma and Messrs. Robinson, Pace, Poe and Zaman were members of the Compensation Committee during fiscal 2023. None of the members of the Compensation Committee is or has been an executive officer of the Company, nor did any of them have any relationships requiring disclosure by the Company under Item 404 of Regulation S-K. None of the Company’s executive officers served as a director or a member of a compensation committee (or other committee serving an equivalent function) of any other entity, an executive officer of which served as a director of the Company or member of the Compensation Committee during fiscal 2023.

Nominating and Corporate Governance Committee

The Nominating and Corporate Governance Committee is a standing committee of the Board. As described in its charter, available on the Company’s website under Corporate Governance—Committee Charters, the Nominating and Corporate Governance Committee’s principal purposes are (i) monitoring the Company’s corporate governance structure; (ii) assisting the Board in fulfilling its oversight responsibilities with respect to serving the finest products available, consideringmanagement of risks associated with corporate governance; (iii) ensuring that the costBoard is appropriately constituted in order to meet its fiduciary obligations, including by identifying individuals qualified to become Board members and members of Board committees, recommending to the Board director nominees for the next annual meeting of stockholders or for appointment to vacancies on the Board, and recommending to the Board membership on Board committees (including committee chairs); (iv) leading the Board in its annual review of the Board’s performance; (v) conducting the annual performance review of the Chief Executive Officer and communicating the results to the Board; and (vi) overseeing succession planning for senior management.

During fiscal 2023, the Nominating and Corporate Governance Committee held four regular meetings. Ms. Loretz-Congdon currently serves as Chair, and David A. Pace, Bradley L. Radoff and John D. Robinson currently serve as members of the Nominating and Corporate Governance Committee. The Board has determined that all current Nominating and Corporate Governance Committee members are independent under the Nasdaq Listing Rules.

Other Committees

In December 2021, the Board established the Technology Committee for the purpose of assisting with the review of the technological and cybersecurity needs of the customer, but also insistCompany. As described in its charter, available on their sustainable cultivation, manufacturethe Company’s website under Governance—Governance Overview—Committee Charters, the Technology Committee’s principal purposes include: (i) overseeing the quality and distribution whenever possible.

effectiveness of the Company’s cybersecurity strategy; and (ii) overseeing the Company’s technology strategy. Waheed Zaman currently serves as Chair, and Stacy Loretz-Congdon and Allison M. Boersma currently serve as members of the Technology Committee. The Technology Committee met four times in fiscal 2023 and will be dissolved following the Annual Meeting. The full Board will then absorb the Technology Committee’s responsibilities.

In orderFebruary 2023, the Board established the Strategy and Capital Allocation Committee to achieve our mission, we have had to grow existing capabilitiesreview, evaluate and develop new ones over the years. More recently, we have undertaken initiatives such as, but not limitedmake recommendations to the following:

develop new productsBoard regarding strategic and financial initiatives and opportunities available to the Company, with the goal of strengthening the Company’s financial position and maximizing value provided to shareholders. Further detail regarding the responsibilities, structure and operations of the Strategy and Capital Allocation Committee are described in response to demographicits charter, which is available on the Company’s website under Governance—Governance Overview—Committee Charters. Alfred Poe currently serves as Chair, and other trends to better competeJohn D. Robinson, Bradley L. Radoff and David A. Pace serve as members of the Strategy and Capital Allocation Committee. The Strategy and Capital Allocation Committee met four times in areasfiscal 2023.


Board Diversity

The below Board Diversity Matrix reports self-identified diversity statistics for the Board of Directors.

Board Diversity Matrix
  As of September 1, 2022  As of October 1, 2023 
Total Number of Directors 8  7 
  Female  Male  Non-
Binary
  Did Not
Disclose
Gender
  Female  Male  Non-
Binary
  Did Not
Disclose
Gender
 
Part I: Gender Identity                                
Directors  2   6   0   0   2   5   0   0 
Part II: Demographic Background
African American or Black  0   1   0   0   0   1   0   0 
Alaskan Native or Native American  0   0   0   0   0   0   0   0 
Asian or South Asian  0   1   0   0   0   1   0   0 
Hispanic or Latinx  0   0   0   0   0   0   0   0 
Native Hawaiian or Pacific Islander  0   0   0   0   0   0   0   0 
White  2   4   0   0   2   3   0   0 
Two or More Races or Ethnicities  0   0   0   0   0   0   0   0 
LGBTQ+  0   0   0   0   0   0   0   0 
Military Veterans  0   1   0   0   0   0   0   0 
Directors with disabilities  0   0   0   0   0   0   0   0 
Did Not Disclose Demographic Background  0   0   0   0   0   0   0   0 

Board Leadership Structure

Under our Amended and Restated By-Laws (“By-Laws”), the Board, in its discretion, may choose a Chairman of the Board. If there is a Chairman of the Board, such person may exercise such powers as premium coffee and tea;

rethink aspects of our Company culture to improve productivity and employee engagement and to attract talent;
embrace sustainability across our operations,provided in the qualityBy-Laws or assigned by the Board. Christopher P. Mottern was appointed as Chairman of our products,the Board in January 2020, and served as wellChairman of the Board until his resignation, which became effective as how we treat our coffee growers;of 5:00 p.m. (Central Time) on June 30, 2023. Effective immediately following Mr. Mottern’s resignation, on June 30, 2023, the Board appointed Alfred Poe as Chairman of the Board. Mr. Poe ceased serving as Chairman of the Board on October 11, 2023 and
ensure our systems Mr. Pace assumed the role on an interim basis and processes providecontinues to serve as the highest quality products at a competitive cost, protection from cyber-risk, and a safe environment for our employees and partners.
We differentiate ourselves ininterim Chairman of the marketplace through our product offerings and through our customer service model, which includes:
a wide varietyBoard as of coffee product offerings and packaging options across numerous brands and quality tiers;


beverage equipment placement and service;
hassle-free inventory and product procurement management;
DSD service;
merchandising support; and
product and menu insights.
Our services are conducted primarily in person through Route Sales Representatives, or RSRs, who develop personal relationships with chefs, restaurant owners and food buyers at their delivery locations. We also provide comprehensive coffee programs to our national account customers, including private brand development, green coffee procurement, hedging, category management, sustainable sourcing and supply chain management.
We distribute our owned brands primarily through our DSD network, while continuing to support and grow our private label and other national account business. Although currently a small portionthe date of our distribution, we also distribute directly to consumers through our website and sell certain products such as Un Momento®, Collaborative Coffee™, Cain's™ and McGarvey® at retail.
Strategic Initiatives
We are focused onthis Proxy Statement.

Notwithstanding the following strategies to reduce costs, streamline our supply chain, improvecurrent separation of Chairman of the breadth of products and services we provide to our customers, and better position the Company to attract new customers:

Reduce Costs to Compete More Effectively
New Facility. In fiscal 2015, we commenced work on a corporate relocation plan to replace our aging production facility in Torrance, California with a more efficient, state-of-the-art facility to be located in Northlake, Texas. We undertook this endeavor, in part, to pursue improved production efficiency to allow us to provide a more cost-competitive offering of high-quality products. We believe the expected improvements in production efficiency, combined with the wind-down and sale of our Torrance facility, should allow us to operate at a lower cost, generally.
Third-Party Logistics. During the second half of fiscal 2016, we replaced our long-haul fleet operations with third-party logistics ("3PL"). We expect that this transportation arrangement will reduce our fuel consumption and empty trailer miles, while improving our intermodal and trailer cube utilization.
Vendor Managed Inventory. During the second half of fiscal 2016, we entered into a vendor managed inventory arrangement with a third party. We anticipate that the use of vendor managed inventory arrangements will result in a reduction in raw material, finished goods and logistics costs, while improving packaging innovation and fulfillment.
Warehouse Management. Subsequent to the fiscal year end, we entered into an agreement with a third party to provide warehouse management services for our New Facility.  We expect the warehouse management services to facilitate cost savings by leveraging the third party's expertise in opening new facilities, implementing lean management practices, improving performance on certain key performance metrics, and standardizing best practices.
Optimize Sales, Pricing and Portfolio of Products
Pricing and Products. In fiscal 2016, we built capability to more strategically optimize our pricing strategy across product, channel, customer and geographic segments. This process is designed to improve our average margins as well as retention rates. In addition, we continued our prior work optimizing SKU count and identifying opportunities to consolidate suppliers to improve costs and supply chain efficiency.
DSD Reorganization. During the second half of fiscal 2016, we began to realign our DSD organization by undertaking initiatives intended to streamline communication and decision making, enhance branch organizational structure, and improve customer focus, including initiatives toward a comprehensive training program for all DSD team members to strengthen customer engagement.


Accelerate Customer Acquisition Efforts. In fiscal 2016, we executed a regional test of our first advertising and lead generation campaign designed to improve our new customer acquisition rate within our DSD network.
Strategic Investment in Assets and Evaluation of Cost Structure
Asset Utilization. We continue to look for ways to deploy our personnel, systems, assets and infrastructure to create or enhance stockholder value. Areas of focus have included corporate staffing and structure, methods of procurement, logistics, inventory management, supporting technology, and real estate assets.
Branch Consolidation and Property Sales. In an effort to streamline our branch operations, in the fourth quarter of fiscal 2016, we sold two Northern California branch properties, with a third Northern California property under contract for sale, and we acquired a new branch facility in Hayward, California.
Acquisitions. One of our investment priorities is exploring acquisitions that we believe will enhance long-term stockholder value and complement or enhance our product, equipment, service and/or distribution offerings to existing and new customer bases. For example, on September 9, 2016, through a newly-formed, wholly-owned subsidiary, we entered into an asset purchase agreement to acquire substantially all of the assets of China Mist Brands, Inc., dba China Mist Tea Company ("China Mist") for an aggregate purchase price of $11.3 million, with $10.8 million to be paid in cash at closing and $0.5 million to be paid as earnout if certain sales levels are achieved in the calendar years of 2017 and 2018. The transaction is expected to close during the second quarter of fiscal 2017. We anticipate that the acquisition of China Mist will give us a greater presence in the high-growth premium tea industry. See Note 24, Subsequent Events, of the Notes to Consolidated Financial Statements included in Part II, Item 8 of this report.
Corporate Capabilities and Alignment to Create Stockholder Value
Investment in Human Resources. In fiscal 2016, we hired Isaac N. Johnston, Jr. as our TreasurerBoard and Chief FinancialExecutive Officer, and Carolyn Suzanne Gargis as our VP of Human Relations. Each of these individuals brings a proven track record at both large consumer packaged goods operations as well as experience in dealing with smaller and more entrepreneurial companies. In addition, in fiscal 2016, we continued to emphasize greater alignment of employee individual goals with Company goals under our compensation plans in order to focus the entire organization on the effort to create value for our stockholders.
Drive High-Growth Product Categories and Address Broader Customer Needs
Introduction of Collaborative Coffee™ and Redesign of Un Momento®Branded Retail Products. In an effort to address what we believe to be unmet consumer needs and improve margin within the retail grocery environment, in fiscal 2016 we launched the Collaborative Coffee brand into the retail grocery channel and completed a packaging redesign and product portfolio optimization of our Un Momento® retail branded product line. Collaborative Coffee™ offers coffee enthusiasts a super-premium, verified direct trade coffee at an approachable price. Un Momento® delivers Millennial Hispanic consumers appealing flavor variety and premium coffee at an exceptional value.
Expand Sustainability Leadership
Sustainability. We believe that our collective efforts in measuring our social and environmental impact, creating programs for waste, water and energy reduction, promoting partnerships in our supply chain that aim at supply chain stability and food security, and focusing on employee engagement place us in a unique position to help retailers and foodservice operators create differentiated coffee programs that can include sustainable supply chains, direct trade purchasing, training and technical assistance, recycling and composting networks, and packaging material reductions. During fiscal 2016, we submitted our second third-party verified Carbon Disclosure Project survey for Scope 1, 2 and 3 emissions (direct emissions, indirect emissions from consumption of purchased electricity, heat or steam and other indirect emissions). Further, we published a sustainability report based on the Global Reporting Initiative’s compliance standard.
LEED® Certified Facilities. Our Portland production and distribution facility was one of the first in the Northwest to achieve LEED® Silver Certification. We anticipate that our corporate offices at the New Facility will also be LEED® certified.


Expansion of Direct Trade Verified Sustainable Program. In fiscal 2016, we completed our first third-party audit and verification of our DTVS program for sourcing green coffee. DTVS is an impact-based product or raw material sourcing framework that utilizes data-based sustainability metrics to influence an inclusive, collaborative approach to sustainability along the supply chain. To evaluate whether coffee is DTVS, we follow an outcome-based evaluation framework. The outcome of this evaluation weighs on where we invest our resources within our supply chain and has led to an increased level of transparency for us. DTVS represents a growing percentage of our coffee portfolio.
Green Coffee Traceability. We are committed to the inclusion of more sustainably-sourced coffees in our supply chain. Regulatory and reputational risks can increase when customers, roasters and suppliers cannot see back into their supply chain. To address these concerns, as well as to deepen our commitment to the longevityChairman of the coffee industry, in fiscal 2016 we began requiring our immediate suppliers of green coffee to enhance their reporting of traceability information on each lot of coffee sold to us.
Charitable Activities
We view charitable involvement as a part of our corporate responsibility and sustainability model: Social, Environmental, and Economic Development, or SEED. We endorse and support communities where our customers, employees, businesses, and suppliers are located, and who have enthusiastically supported us over the past 100 years. Our objectiveBoard is to provide support toward a mission of supply chain stability with a focus on food security.
Recipient organizations include those with strong local and regional networks that ensure that families have access to nutritious food. Donations may take the form of corporate cash contributions, product donations, employee volunteerism, and workplace giving (with or without matching contributions).
Recipient organizations include Feeding America, Mercy Corps, Ronald McDonald House, and local food banks.
We support industry organizations such as World Coffee Research, which commits to grow, protect, and enhance supplies of quality coffee while improving the livelihoods of the families who produce it, and the Specialty Coffee Association of America ("SCAA") Sustainability Council and the Coalition for Coffee Communities, which are focused on sustainability in coffee growing regions.
Our employee-driven CAFÉ Crew organizes employee involvement at local charities and fund raisers, including running in the Chicago Marathon in support of Team Ronald McDonald House, riding in the Ride Against Hunger supported by Tarrant Area Food Bank, supporting delivery for Meals on Wheels, and hosting local food drives.
All of our usable and near expiring products or products with damaged packaging are donated to Feeding America affiliated food banks nationwide, in an effort to fully eliminate edible food waste from the landfill.
Industry and Market Leadership
We have made the following investments in an effort to ensure we are well-positioned within the industry to take advantage of category trends, industry insights, and general coffee and tea knowledge to grow our business:
Coffee Industry Leadership. Through our dedication to the craft of sourcing, blending and roasting coffee, and our participation and/or leadership positions with the SCAA, National Coffee Association, Coalition for Coffee Communities, International Women's Coffee Alliance, International Foodservice Manufacturers Association, Pacific Coast Coffee Association, Roasters Guild and World Coffee Research, we work to help shape the future of the coffee industry. We believe that due to our commitment to the industry, large retail and foodservice operators are drawn to working with us. We were among the first coffee roasters in the nation to receive SCAA certification of a state-of-the-art coffee lab and operate Public Domain®, a specialty coffeehouse in Portland, Oregon. Upon completion, we plan to submit our product development lab at the New Facility for SCAA certification.
Market Insight and Consumer Research. We have developed a market insight capability internally that reinforces our business-to-business positioning as a thought leader in the coffee industry. We provide trend insights that help our customers create winning products and integrated marketing strategies for their own coffee brands.


Within this, we are focused on understanding key demographic groups such as Millennials and Hispanics, and key channel trends.
Raw Materials and Supplies
Our primary raw material is green coffee, an agricultural commodity traded on the Commodities and Futures Exchange that is subject to price fluctuations. Over the past five years, coffee “C” market price per pound ranged from approximately $1.02 to $2.90. The coffee “C” market price as of June 30, 2016 and 2015 was $1.46 and $1.32 per pound, respectively. Our principal packaging materials include cartonboard, corrugated and plastic. We also use a significant amount of electricity, natural gas, and other energy sources to operate our production and distribution facilities.
We purchase green coffee beans from multiple coffee regions around the world. Although coffee “C” market prices in fiscal 2016 were relatively low compared to historical levels, there can be no assurance that green coffee prices will remain at these levels in the future. Some of the Arabica coffee beans we purchase do not trade directly on the commodity markets. Rather, we purchase these coffee beans on a negotiated basis from coffee brokers, exporters and growers, including Direct Trade, DTVS and Fair Trade Certified™ sources and Rainforest Alliance Certified™ farms. Fair Trade Certified™ provides an assurance that farmer groups are receiving the Fair Trade minimum price and an additional premium for certified organic products through arrangements with cooperatives. Direct Trade and DTVS products provide similar assurance except that the arrangements are provided directly to farmers instead of through cooperatives in an effort to promote investment in better and more sustainable farming practices as well as to ensure a fairer price. Rainforest Alliance Certified™ coffee is grown using methods that help promote and preserve biodiversity, conserve scarce natural resources, and help farmers build sustainable lives. Our business model strives to reduce the impact of green coffee price fluctuations on our financial results and to protect and stabilize our margins, principally through customer arrangements and derivative instruments, as further explained in Note 7, Derivative Instruments, of the Notes to Consolidated Financial Statements included in Part II, Item 8 of this report.
Intellectual Property
We own a number of United States trademarks and service marks that have been registered with the United States Patent and Trademark Office. We also own other trademarks and service marks for which we have filed applications for U.S. registration. We have licenses to use certain trademarks outside of the United States and to certain product formulas, all subject to the terms of the agreements under which such licenses are granted. We believe our trademarks and service marks are integral to customer identification of our products. It is not possible to assess the impact of the loss of such identification. Depending on the jurisdiction, trademarks are generally valid as long as they are in use and/or their registrations are properly maintained and they have not been found to have become generic. Registrations of trademarks can also generally be renewed indefinitely as long as the trademarks are in use. In addition, we own numerous copyrights, registered and unregistered, registered domain names, and proprietary trade secrets, technology, know-how processes and other proprietary rights that are not registered.
Seasonality
We experience some seasonal influences. The winter months are generally the strongest sales months. However, our product line and geographic diversity provide some sales stability during the warmer months when coffee consumption ordinarily decreases. Additionally, we usually experience an increase in sales during the summer and early fall months from seasonal businesses located in vacation areas and from grocery retailers ramping up inventory for the winter selling season. Because of the seasonality of our business, results for any quarter are not necessarily indicative of the results that may be achieved for the full fiscal year.
Distribution
We operate production facilities in Portland, Oregon and Houston, Texas. Distribution takes place out of our Portland facility as well as three separate distribution centers in Northlake, Illinois; Oklahoma City, Oklahoma; and Moonachie, New Jersey. As of June 30, 2016, the Torrance facility continued to house certain administrative functions and serve as a distribution facility and branch warehouse pending transition of the remaining Torrance operations to our other facilities. Upon completion, the New Facility will serve as a production facility and distribution center for our products. Our products reach our customers primarily in two ways: through our nationwide DSD network of 450 delivery routes and 109 branch warehouses as of June 30, 2016, or direct-shipped via common carriers or third-party distributors.


DSD sales are made “off-truck” to our customers at their places of business by our RSRs who generally are responsible for soliciting selling and collecting agenda items from and otherwise maintaining our customer accounts. Our DSD business includes office coffee services whereby we provide office coffee products, including a variety of coffee brands and blends, brewing and beverage equipment, and foodservice supplies directly to offices. We operate a large fleet of trucks and other vehicles to distribute and deliver our products, and we rely on 3PL service providers for our long-haul distribution. We maintain inventory levels at each branch warehouse to promote minimal interruption in supply. We also sell directly to consumers through our website.
Customers
We serve a wide variety of customers, from small independent restaurants and foodservice operators to large institutional buyers like restaurant and convenience store chains, hotels, casinos, hospitals, and gourmet coffee houses, as well as grocery chains with private brand and consumer-branded coffee products. Although no single customer accounted for 10% or more of our net sales in anymembers of the last three fiscal years, we have several large national account customers,Board and the loss of or reduction in sales to one or more of which would be likely to haveChief Executive Officer, and the Chief Executive Officer is generally responsible for leading discussions during Board meetings. This structure allows for effective and efficient Board meetings and information flow on important matters affecting the Company. As required under the Nasdaq Listing Rules, a material adverse effect on our results of operations. During fiscal 2016, our top five customers accounted for approximately 19% of our net sales.
Most of our customers rely on us for distribution; however, some of our customers use third-party distribution or conduct their own distribution. Some of our customers are “price” buyers, seeking the low-cost provider with little concern about service, while others find great value in the service programs we provide. We offer a full return policy to ensure satisfaction and extended terms for those customers who qualify.
Competition
The coffee industry is highly competitive, including with respect to price, product quality, service, convenience and innovation, and competition could become increasingly more intense due to the relatively low barriers to entry. We face competition from many sources, including the institutional foodservice divisions of multi-national manufacturers of retail products many of which have greater financial and other resources than we do, such as The J.M. Smucker Company (Folgers Coffee), Dunkin' Brands Group, Inc., The Kraft Heinz Company (Maxwell House Coffee) and Massimo Zanetti Beverage, wholesale foodservice distributors such as Sysco Corporation and US Foods, regional institutional coffee roasters such as S&D Coffee & Tea (Cott Corporation) and Boyd Coffee Company, and specialty coffee suppliers such as Keurig Green Mountain, Inc., Rogers Family Company, Distant Lands Coffee, Mother Parkers Tea & Coffee Inc., Starbucks Corporation and Peet’s Coffee & Tea. As many of our customers are small foodservice operators, we also compete with cash and carry and club stores (physical and on-line) such as Costco, Sam’s Club and Restaurant Depot and on-line retailers such as Amazon. We also face competition from growth in the single-serve, ready-to-drink coffee beverage and cold-brewed coffee channels, as well as competition from other beverages, such as soft drinks (including highly caffeinated energy drinks), juices, bottled water, teas and other beverages.
We believe our longevity, product quality and offerings, national distribution network, coffee industry and sustainability leadership, market insight, comprehensive approach to customer relationship management, and superior customer service are the major factors that differentiate us from our competitors. We compete well when these factors are valued by our customers, and we are less effective when only price matters. Our customer base is price sensitive, and we are often faced with price competition.
Working Capital
We finance our operations internally and through borrowings under our existing credit facility. For a description of our liquidity and capital resources, see Results of Operations and Liquidity, Capital Resources and Financial Conditionincluded in Part II, Item 7 of this report and Note 18, Other Current Liabilities,majority of the Notes to Consolidated Financial Statements included in Part II, Item 8members of this report. Our working capital needs are greater ina listed company’s board of directors must qualify as “independent,” as affirmatively determined by the months leading up to our peak sales period during the winter months, which we typically finance with cash flows from operations. In anticipationboard of our peak sales period, we typically increase inventory in the first quarterdirectors. The Board has determined that, other than Mr. Maserang, all members of the fiscal year. We use various techniques including demand forecastingBoard are independent and planning to determine appropriate inventory levels for seasonal demand.


Regulatory Environment
The conduct of our businesses, including, among other things, the production, storage, distribution, sale, labeling, quality and safety of our products, and occupational safety and health practices, are subject to various laws and regulations administered by federal, state and local governmental agencies in the United States. Our facilities are subject to various laws and regulations regarding the release of material into the environment and the protection of the environment in other ways. We are not a party to any material legal proceedings arising under these regulations except as described in Note 22, Commitments and Contingencies, of the Notes to Consolidated Financial Statements included in Part II, Item 8 of this report.
Employees
On June 30, 2016, we employed 1,634 employees, 508 of whom are subject to collective bargaining agreements.
Other
The nature of our business does not provide for maintenance of or reliance upon a sales backlog. None of our business is subject to renegotiation of profits or termination of contracts or subcontracts at the election of the government. We have no material revenues from foreign operations or long-lived assets located in foreign countries.
Available Information
Our Internet website address is http://www.farmerbros.com (the website address is not intended to function as a hyperlink, and the information contained in our website is not intended to be part of this filing), where we make available, free of charge, through a link maintained on our website under the heading “Investor Relations—SEC Filings,” copies of our annual report on Form 10-K, quarterly reports on Form 10-Q and current reports on Form 8-K, including amendments thereto, as soon as reasonably practicable after filing such material electronically or otherwise furnishing it to the SEC. Copies of our Corporate Governance Guidelines, the Charterseach of the Audit, Compensation, and Nominating and Corporate Governance Committees of the Board are composed solely of Directors, and our Code of Conduct and Ethics can also be found on our website.


Item 1A.Risk Factors
You should carefully consider eachindependent directors. Due principally to the size of the following factors,Board, the Board has not formally designated a lead independent director and believes that as well as the other information in this report, in evaluating our businessa result thereof, non-employee director and prospects. The risks and uncertainties described below are not the only ones we face. Additional risks and uncertainties not presently known to us or that we currently consider immaterial may also negatively affect our business operations. If anyexecutive sessions of the following risks actually occurs, our businessBoard, which are attended solely by non-employee directors or independent directors, as applicable, result in an open and financial results could be harmed. Infree flow of discussion of any and all matters that case, the trading price of our common stock could decline.
Relocationany director may believe relevant to the New Facility may be unsuccessful Company and/or less successful than we presently anticipate, which may adversely affect our business, operating resultsits management.


Although the roles of Chairman and financial condition.

We cannot guaranteeChief Executive Officer are currently filled by different individuals, no single leadership model is right for all companies at all times, and the Company has no bylaw or policy in place that wemandates this leadership structure. The Nominating and Corporate Governance Committee will be successful in implementing the relocationevaluate and recommend to the New FacilityBoard any changes in accordancethe Board’s leadership structure.

Board’s Role in Risk Oversight

The Board recognizes that although management is responsible for identifying risk and risk controls related to business activities and developing programs and recommendations to determine the sufficiency of risk identification and the appropriate manner in which to control risk, the Board plays a critical role in the oversight of risk. The Board implements its risk oversight responsibilities by having management provide periodic briefing and informational sessions on the significant risks that the Company faces and how the Company is seeking to control risk if and when appropriate. In some cases, a Board committee is responsible for oversight of specific risk topics. For example, the Audit Committee has oversight responsibility of risks associated with our expectations, in a timely manner or at all, which may adversely impact our business, operating resultsfinancial accounting and audits, internal control over financial condition. Relocationreporting, and the Company’s major financial risk exposures, including commodity risk and risks relating to hedging programs. Regarding cybersecurity, the Board temporarily assigned primary oversight responsibility to the New Facility could disrupt our supply chain and ongoing operations, which could adversely affect our ability to deliver products both on a timely basis and in accordance with customer requirements,Technology Committee, but placed the effect of which could delay revenues or result in lost business opportunities. Our existing production facilities in Portland and Houston have been operating at much higher utilization rates than they have historically pending completionChairwoman of the New Facility. InAudit Committee on the eventTechnology Committee and made a second member of significant increases in demandthe Audit Committee the Chairman of the Technology Committee to ensure that precede the completionAudit Committee remained well informed of the Company’s cybersecurity risks. The Board decided to end this temporary assignment and relocationdissolve the Technology Committee following the Annual Meeting and reassign those responsibilities to the New Facility, we may be required to increase staffing, including through temporary labor and overtime, use third-party manufacturers, lease additional production facilities, or some combinationfull Board. The Compensation Committee has oversight responsibility of those alternatives or others to satisfy demand. There can be no assurance that we would be able to identify appropriate third-party providers on a timely basis or at all. In addition, our success depends, in large part, on our ability to attract and retain skilled people. Competition for the best people in many of our key positions may be intense, and we may not be able to attract and retain sufficiently skilled people at the New Facility. Costs associated with the exit from our Torrance facility and the construction and relocation to, and operation of, the New Facility may exceed our expectations, which could interfere with our ability to achieve our business objectives or could cause us to incur indebtedness in amounts in excess of expectations. In addition, failure to satisfy the conditions of governmental incentivesrisks relating to the New Facility could resultCompany’s compensation policies and practices. At each regular meeting, or more frequently as needed, the Board considers reports from the Audit Committee and Compensation Committee which provide detail on risk management issues and management’s response. The Board, as a whole, examines specific business risks in higher than expected costs.

Increasesits periodic reviews of the individual business units, and also of the Company as a whole as part of its regular reviews, including as part of the strategic planning process, annual budget review and approval, and data and cyber security review. Beyond formal meetings, the Board and its committees have regular access to senior executives, including the Company’s Chief Executive Officer and Chief Financial Officer. The Company believes that its leadership structure promotes effective Board oversight of risk management because the Board directly, and through its various committees, is regularly provided by management with the information necessary to appropriately monitor, evaluate and assess the Company’s overall risk management, and all directors are involved in the costrisk oversight function.

Compensation-Related Risk

As part of green coffee could reduceits risk oversight role, our gross marginCompensation Committee annually considers whether our compensation policies and profit.

Our primary raw material is green coffee, an agricultural commodity traded on the Commodities and Futures Exchange that is subject to price fluctuations. Although coffee “C” market prices in fiscal 2016 were relatively low compared to historical levels, there can be no assurance that green coffee prices will remain at these levels in the future. The supply and price of green coffee may be impacted by, among other things, weather, natural disasters, real or perceived supply shortages, crop disease (such as coffee rust) and pests, general increase in farm inputs and costs of production, political and economic conditions, labor actions, foreign currency fluctuations, armed conflict in coffee producing nations, acts of terrorism, government actions and trade barriers, and the actions of producer organizations that have historically attempted to influence green coffee prices through agreements establishing export quotas or by restricting coffee supplies. Speculative trading in coffee commodities can also influence coffee prices. Additionally, specialty green coffees tend to trade on a negotiated basis at a premium above the “C” market price which premium, depending on the supply and demand at the time of purchase, may be significant. Increases in the “C” market price may also impactpractices for all employees, including our ability to enter into green coffee purchase commitments at a fixed price or at a price to be fixed whereby the price at which the base “C” market price will be fixed has not yet been established. There can be no assurance that our purchasing practices and hedging activities will mitigate future price risk. As a result, increases in the cost of green coffee could have an adverse impact on our profitability.
Our efforts to secure an adequate supply of quality coffees may be unsuccessful and impact our ability to supply our customers or expose us to commodity price risk.
Maintaining a steady supply of green coffee is essential to keeping inventory levels low while securing sufficient stock to meet customer needs. Some of the Arabica coffee beans we purchase do not trade directly on the commodity markets. Rather, we purchase these coffee beans on a negotiated basis from coffee brokers, exporters and growers. If any of these supply relationships deteriorate, we may be unable to procure a sufficient quantity of high‑quality coffee beans at prices acceptable to us or at all. Further, non-performance by suppliers could expose us to credit and supply risk under coffee purchase commitments for delivery in the future. In addition, the political situation in many of the Arabica coffee growing regions, including Africa, Indonesia, and Central and South America, can be unstable, and such instability could affect our


ability to purchase coffee from those regions. If green coffee beans from a region become unavailable or prohibitively expensive, we could be forced to use alternative coffee beans or discontinue certain blends, which could adversely impact our sales. A raw material shortage could result in a deterioration of our relationship with our customers, decreased revenues or could impair our ability to expand our business.
Changes in green coffee commodity prices may not be immediately reflected in our cost of goods sold and may increase volatility in our results.
We purchase over-the-counter coffee derivative instruments to enable us to lock in the price of green coffee commodity purchases on our behalf or at the direction of our customers under commodity-based pricing arrangements. Although we account for certain coffee-related derivative instruments as accounting hedges, the portion of open hedging contractsexecutive officers, create risks that are not 100% effective as cash flow hedges and those that are not designated as accounting hedges are marked to period-end market price and unrealized gains or losses based on whether the period-end market price was higher or lower than the price we locked-in are recognized in our financial results at the end of each reporting period. If the period-end green coffee commodity prices decline below our locked in price for these derivative instruments, we will be required to recognize the resulting losses in our results of operations. Further, changes in commodity prices and the number of coffee-related derivative instruments held could have a significant impact on cash deposit requirements under our broker and counterparty agreements. Such transactions could cause volatility in our results because the recognition of losses and the offsetting gains may occur in different fiscal periods. Rapid, sharp decreases in the cost of green coffee could also force us to lower sales prices before realizing cost reductions in our green coffee inventory.
Our business and results of operations are highly dependent upon sales of roast and ground coffee products. Any decrease in the demand for coffee could materially adversely affect our business and financial results.
Sales of roast and ground coffee represented approximately 61%, 61% and 60% of our net sales in the fiscal years ended June 30, 2016, 2015 and 2014, respectively. Demand for our products is affected by, among other things, consumer tastes and preferences, global economic conditions, demographic trends and competing products. Any decrease in demand for our roast and ground coffee products would cause our sales and profitability to decline.
Price increases may not be sufficient to offset cost increases or may result in volume declines which could adversely impact our revenues and gross margin.
Customers generally pay for our products based either on an announced price schedule or under commodity-based pricing arrangements whereby the changes in green coffee commodity costs are passed through to the customer. The pricing schedule is generally subject to adjustment, either on contractual terms or in accordance with periodic product price adjustments, which may result in a lag in our ability to correlate the changes in our prices with fluctuations in the cost of raw materials and other inputs. Depending on contractual restrictions, we may be unable to pass some or all of these cost increases to our customers by increasing the selling prices of our products. If we are not successful in increasing selling prices sufficiently to offset increased raw material and other input costs, including packaging, direct labor and other overhead, or if our sales volume decreases significantly as a result of price increases, our results of operations and financial condition may be adversely affected.
We rely on co-packers to provide our supply of tea, spice and culinary products. Any failure by co-packers to fulfill their obligations or any termination or renegotiation of our co-pack agreements could adversely affect our results of operations.
We have a number of supply agreements with co-packers that require them to provide us with specific finished goods, including tea, spice and culinary products. For some of our products we essentially rely upon a single co-packer as our sole-source for the product. The failure for any reason of any such sole-source or other co-packer to fulfill its obligations under the applicable agreements with us or the termination or renegotiation of any such co-pack agreement could result in disruptions to our supply of finished goods and have an adverse effect on our results of operations. Additionally, our co-packers are subject to risk, including labor disputes, union organizing activities, financial liquidity, inclement weather, natural disasters, supply constraints, and general economic and political conditions that could limit their ability to timely provide us with acceptable products, which could disrupt our supply of finished goods, or require that we incur additional expense by providing financial accommodations to the co-packer or taking other steps to seek to minimize or avoid supply disruption, such as establishing a new co-pack arrangement with another provider. A new co-pack arrangement may not be available on terms as favorable to us as our existing co-pack arrangements, if at all.


Competition in the coffee industry and beverage category could impact our profitability.
The coffee industry is highly competitive, including with respect to price, product quality, service, convenience and innovation, and competition could become increasingly more intense due to the relatively low barriers to entry. We face competition from many sources, including the institutional foodservice divisions of multi-national manufacturers of retail products many of which have greater financial and other resources than we do, wholesale foodservice distributors, regional institutional coffee roasters, and specialty coffee suppliers. As many of our customers are small foodservice operators, we also compete with cash and carry and club stores and on-line retailers. If we do not succeed in differentiating ourselves through, among other things, our product and service offerings, then our competitive position may be weakened and our sales and profitability may be materially adversely affected. If, due to competitive pressures or contractual restrictions, we are required to reduce prices to attract market share or we are unable to increase prices in response to commodity and other cost increases, our results of operations could be adversely affected if we are not able to increase sales volumes to offset the margin declines. Increased competition in the single-serve, ready-to-drink coffee beverage and cold-brewed coffee channels, as well as competition from other beverages, such as soft drinks (including highly caffeinated energy drinks), juices, bottled water, teas and other beverages, may also have an adverse impact on sales of our coffee products.
We face exposure to other commodity cost fluctuations, which could impact our margins and profitability.
In addition to green coffee, we are exposed to cost fluctuations in other commodities under supply arrangements, including tea, spices, and packaging materials such as cartonboard, corrugated and plastic. We purchase certain finished goods and packaging materials under cost-plus supply arrangements whereby our cost may increase based on an increase in the underlying commodity price. The cost of these commodities depend on various factors beyond our control, including economic and political conditions, foreign currency fluctuations, and global weather patterns. Unlike green coffee, we do not purchase any derivative instruments to hedge cost fluctuations in these other commodities. As a result, to the extent we are unable to pass along such costs to our customers through price increases, our margins and profitability will decrease.
Increase in the cost, disruption of supply or shortage of energy or fuel could affect our profitability.
We operate a large fleet of trucks and other vehicles to distribute and deliver our products, and we rely on 3PL service providers for our long-haul distribution. Certain products are also distributed by third parties or direct shipped via common carrier. In addition, we use a significant amount of electricity, natural gas and other energy sources to operate our production and distribution facilities. An increase in the price, disruption of supply or shortage of fuel and other energy sources that may be caused by increasing demand or by events such as natural disasters, power outages, or the like, could lead to higher electricity, transportation and other commodity costs, including the pass-through of such costs under our agreements with 3PL service providers and other suppliers, that could negatively impact our profitability.
Loss of business from one or more of our large national account customers and efforts by these customers to improve their profitability could have a material adverse effect on our operations.
We have several large national account customers, the loss of or reduction in sales to one or more of which isreasonably likely to have a material adverse effect on our resultsCompany. In fiscal 2023, the Compensation Committee noted several design features of operations. We generally doour compensation programs that reduce the likelihood of excessive risk-taking, including, but not have long-term contractslimited to, the following:

·A good balance of fixed and at-risk compensation, as well as an appropriate balance of cash and equity-based compensation.

·Management incentive programs are based on multiple metrics, including strategic, individual and operational measures.

·The Compensation Committee is directly involved in setting short- and long-term incentive performance targets and payout intervals, assessing performance against targets, and reviewing/approving the performance goals for the CEO and other executives.

·The Compensation Committee revises the short- and long-term incentive programs annually based on feedback received from shareholders in connection with the Company’s stockholder engagement campaigns, so as to ensure the Company’s compensation practices align with shareholder expectations.

·Executive annual short-term incentive awards are generally capped at 200% of the target opportunity and the performance-based restricted stock units in the long-term incentive plan are capped at 225% of target opportunity.


·Long-term equity awards are generally made on an annual basis which creates overlapping vesting periods and ensures that management remains exposed to the risks of their decision-making through their unvested equity-based awards for the period during which the business risks are likely to materialize.

·Long-term compensation for senior executives is comprised of restricted stock units that vest ratably over three years and performance-based restricted stock units that are earned based on three-year performance goals. Company shares are inherently subject to the risks of the business, and the combination of options and performance-based restricted stock units ensure that management participates in these risks.

·The number of performance-based restricted stock units ultimately earned by the Company’s executives and employees are determined at the end of a three-year performance period based on adjusted EBITDA performance and total shareholder return (“TSR”) metrics that are tracked during the performance period.

·The Company has significant share ownership requirements for executives and non-employee directors. Executive officers are required to hold share-based compensation awards until meeting their ownership requirements. Company shares held by management are inherently subject to the risks of the business.

·Executive compensation is benchmarked annually relative to pay levels and practices at peer companies.

·The Company has a clawback policy in place that provides for the mandatory recovery of both cash- and equity-based compensation paid on the basis of the achievement of financial performance measures in the event of an accounting restatement.

·The Company prohibits employees and directors from hedging or pledging its securities.

·The Compensation Committee is composed solely of independent directors and retains an independent compensation consultant to provide a balanced perspective on compensation programs and practices. The Compensation Committee approves all pay decisions for executive officers.

Stockholder Engagement

The Company has a history of actively engaging with our customers. Accordingly,stockholders. We believe that strong corporate governance should include regular engagement with our customers can stop purchasingstockholders. We have a long-standing, robust stockholder outreach program through which we solicit feedback on our products at any time without penaltycorporate governance, executive compensation program, disclosure practices, and are freeenvironmental and social impact programs and goals. Investor feedback is shared with our Board as received.

Delinquent Section 16(a) Reports

Section 16(a) of the Exchange Act requires our directors, certain of our officers, and persons who beneficially own more than 10% of the Company’s Common Stock to purchase productsfile reports of stock ownership and changes in ownership (Forms 3, 4 and 5) in shares with the SEC. To our knowledge, based solely on our records and certain written representations received from our competitors. Thereexecutive officers and directors, during the fiscal year ended June 30, 2023, all persons related to the Company that are required to file these insider trading reports have filed them in a timely manner, except for a Form 4 filed on October 19, 2023 for D. Deverl Maserang II (i) to disclose reportable transactions which occurred on September 13, 2023, September 15, 2023 and October 1, 2023 and (ii) to correct the number of securities beneficially owned by him, whether directly or indirectly, through the date of filing. Copies of the insider trading reports can be no assurance thatfound on the Company’s website at www.farmerbros.com.

ITEM 11.Executive Compensation

Compensation Discussion and Analysis

This Compensation Discussion and Analysis describes our customers will continueexecutive compensation philosophy, objectives, and programs, the decisions made under those programs and factors considered by our Compensation Committee in fiscal 2023 with respect to purchase our products in the same quantities as they have in the past. In addition, because of the competitive environment facing manycompensation of our customers, they have increasingly soughtNamed Executive Officers.


Fiscal 2023 Named Executive Officers

NameTitle (as of June 30, 2023)
D. Deverl Maserang IIFormer President and Chief Executive Officer
Scott R. DrakeFormer Chief Financial Officer
Amber D. JeffersonChief Human Resources Officer
Jared G. VitembVice President, General Counsel, Chief Compliance Officer and Secretary
Ruben E. InofuentesFormer Chief Supply Chain Officer
Maurice S. J. MoragneFormer Chief Sales Officer

Recent Changes in Management

The Company experienced turnover of certain senior management during and after the 2023 fiscal year. Effective February 17, 2023, the Company terminated Ruben E. Inofuentes, its former Chief Supply Chain Officer, and Maurice S.J. Moragne, its former Chief Sales Officer, as part of an effort to improve their profitability through pricing concessions and more favorable trade terms. Tostreamline the extent we provide pricing concessions or favorable trade terms, our margins would be reduced. If we are unable to continue to offer terms that are acceptable to our customers, they may reduce purchases of our products which would adversely affect our financial performance. Requirements that may be imposed on us by our customers, such as sustainability, inventory management or product specification requirements, may have an adverse effect on our results of operations. Additionally, our customers may face financial difficulties, bankruptcy or other business disruptions that may impact their operations and their purchases from us and may affect their ability to pay us for products which could adversely affect our sales and profitability.


We rely on information technology and are dependent on enterprise resource planning software in our operations. Any material failure, inadequacy, interruption or security failure of that technology could affect our ability to effectively operate our business.
Our ability to effectively manage our business, maintain financial accuracy and efficiency, comply with regulatory, financial reporting, legal and tax requirements, and coordinate the production, distribution and sale of our products depends significantly on the reliability, capacity and integrity of information technology systems on which we rely. We are also dependent on enterprise resource planning software for some of our information technology systems and support. The failure of these systems to operate effectively and continuously, problems with transitioning to upgraded or replacement systems, including, without limitation,Company’s leadership team in connection with the relocationCompany’s strategic priority to reduce overhead costs and drive profitability. Their respective duties were assumed by various other employees of the Company.

Further, following the end of the 2023 fiscal year, the Company transitioned its Chief Executive Officer and Chief Financial Officer positions. The Company (i) terminated without cause the employment of D. Deverl Maserang II, its former President and Chief Executive Officer, effective September 30, 2023 (the “Maserang Separation”) and (ii) terminated without cause the employment of Scott R. Drake, effective October 1, 2023 (the “Drake Separation”). Following the Maserang Separation and the Drake Separation, effective October 1, 2023, (i) the Company appointed John E. Moore III to serve as Interim Chief Executive Officer of the Company and (ii) the Company appointed Brad Bollner to serve as Interim Chief Financial Officer of the Company. Prior to their appointments, Messrs. Moore and Bollner were serving with the Company as Head of Coffee and Vice President of Finance, respectively.

Executive Summary

Our executive compensation programs are designed to:

·attract, retain, and motivate talented executives with competitive pay and incentives;

·reward positive results by aligning the economic interests of our executive officers with those of our stockholders;

·motivate executive officers to achieve our short-term and long-term goals by providing “at risk” compensation, the value of which is ultimately based on our future performance, without creating undue risk-taking behavior nor unduly emphasizing short-term performance over long-term value creation; and

·maintain total compensation and relative amounts of base salary, annual, and long-term incentive compensation competitive with those amounts paid by peer companies to remain competitive in the market for talent.

We believe that this design appropriately focuses our executive officers on the creation of long-term value without creating undue risk-taking behavior. We continued to focus on these key design elements in addressing the impact of and our response to the New Facility, flawsCOVID-19 pandemic and its related impact on our compensation programs.

Compensation Policies and Practices—Good Governance

Consistent with our commitment to strong corporate governance, in third-party software, or a breach in securityfiscal 2023, our Board followed the compensation policies and practices described below to drive performance and serve our stockholders’ long-term interests:

What We Do

·Our Compensation Committee is composed solely of independent directors, and regularly meets in executive session without members of management present.


·Our Compensation Committee retains an independent compensation consultant to provide it with advice on matters related to executive compensation.

·Our Compensation Committee regularly reviews and assesses the potential risks of our compensation policies and practices.

·The structure of our executive compensation program includes a mix of cash and equity-based compensation, with an emphasis on performance-based compensation.

·The competitiveness of our executive compensation program is assessed by comparison to the compensation programs of peer group companies that are similar to us in terms of industry, annual revenue, and/or other business characteristics.

·Our clawback policy, which was amended and restated in fiscal 2024 for purposes of compliance with Section 10D of the Exchange Act and the Nasdaq listing standards, provides for the mandatory recovery of both cash- and equity-based compensation paid on the basis of the achievement of financial performance measures in the event of an accounting restatement.

·We maintain meaningful stock ownership guidelines for directors and executive officers that promote a long-term stockholder perspective.

What We Do Not Do

·We do not provide for excise tax gross-ups in connection with severance or other payments or benefits arising in connection with a change in control.

·We do not provide for “single trigger” change in control payments or benefits.

·We do not provide guaranteed base salary increases or guaranteed bonuses.

·We do not provide supplemental pension benefits to our Named Executive Officers.

·We do not provide excessive perquisites.

·We do not permit (absent stockholder approval in the case of repricing/exchanging), and have not engaged in, the practice of backdating or re-pricing/exchanging stock options.

·We do not allow directors or executive officers to hedge or short sell Company stock.

·We do not allow directors or executive officers to pledge shares as collateral for a loan or in a margin account.

Results of these systems could result in delays in processing replenishment orders fromRecent Advisory Votes, Stockholder Outreach and Changes for 2023

Every year, the Company provides stockholders with the opportunity for an annual vote to approve its executive compensation program on an advisory basis.

At our branch warehouses, an inability to record input costs or product sales accurately or at all, an impaired understanding2021 Annual Meeting, approximately 46.13% of our stockholders supported our advisory vote on executive compensation and at our 2022 Annual Meeting, approximately 58.41% of our stockholders supported our advisory vote on executive compensation.

In connection with and following our 2021 and 2022 say-on-pay vote, we conducted an extensive engagement campaign to better understand our investors’ views on our executive compensation program:

·We reached out to investors representing approximately 47% of our common shares outstanding, as of our 2021 Annual Meeting, with invitations to discuss our officer compensation program and provide direct feedback to members of our Compensation Committee.

·We held discussions with investors representing approximately 15% of our common shares outstanding as of our 2021 Annual Meeting.

·Following our 2022 say-on-pay vote, we held additional outreach this fiscal year with many of our larger holders and discussed our 2022 compensation during these outreach efforts.


Based on our discussions with stockholders following our 2021 and 2022 Annual Meetings, we found that stockholders tended to be focused on the following categories:

·Compensation Amounts: Stockholders did not express concern about the amount of compensation paid to the officers, nor did they express concern about any misalignment between pay and performance.

·Mix of Compensation: Stockholders generally expressed a preference that the officer team have a uniform mix of long-term incentives.

·Benchmarking Peer Group: Stockholders were supportive of the set of companies selected by the Compensation Committee to benchmark officer compensation. Certain stockholders expressed a view that peer companies should be similar in size and industry to Farmer Bros.

·Incentives Plan Metrics: Stockholders were generally supportive of using EBITDA as the featured annual incentive plan metric, and understood the unique approach to goal-setting given the Company’s challenging situation. Several suggested that the Compensation Committee consider return on capital, revenue growth, cash flow, working capital and measuring performance on a per-share basis going forward. Several stockholders expressed a desire for TSR to have a greater weighting for future PBRSU awards. As discussed below, for fiscal 2023 we increased the influence of the TSR modifier and for fiscal 2024 we have added return on invested capital to our metrics, among other changes.

·Incentive Plan Design: Shareholders generally understood and supported the unique annual and long-term incentive design adopted by the Committee as a response to the challenging operating environment caused by the COVID-19 pandemic, as described in our prior year proxy disclosure. Shareholders did express a preference for measuring PBRSU performance over a full three-year period.

We believe stockholders’ concern was primarily with respect to our LTI program. In response to the stockholder feedback we received and to better align our executive compensation program with our corporate strategy, the Compensation Committee made several material changes to our executive compensation program that took effect during fiscal 2023, as described in detail below:

·The Compensation Committee removed several companies from the compensation peer group that were relatively larger than the Company in terms of revenue, and added several that are closer in revenues to the Company. These changes are described in greater detail the section below titled “Benchmarking and Peer Group Companies.”

·For fiscal 2023 PBRSU awards, the TSR modifier was changed to have greater influence on the award outcome. For fiscal 2023 awards, TSR goals have been set based on the Company’s absolute cumulative TSR over a full three-year period (fiscal 2023 through 2025). The Company’s absolute TSR over this three year period can modify amounts earned by adjusted EBITDA performance by a factor of 0.80x to 1.5x (an increase from the 1.2x factor from prior awards). Adjusted EBITDA will be measured over three one-year measurement periods and generate a payout factor at the end of the three years based on the average achievement over the three years. This payout factor will then be subject to modification based on the Company’s absolute cumulative three-year as follows:

Absolute 3-year Cumulative TSRModification Factor
≤ 25.0%0.8x
-25.0% to +24.9%1.0x
+25.0% to +49.9%1.20x
+50.0% to +99.9%1.33x
≥ 100%1.50x

The purpose of the absolute TSR modifier above is to incentivize achievement of superior shareholder returns over a three-year period.

·In addition to placing greater weighting on TSR, shareholders generally expressed a preference that all officers have the same mix of long-term incentive award vehicles with at least 50% of the awards granted in PBRSUs. As such, 50% of LTI granted to officers for the fiscal 2023 was granted in PBRSUs (an increase from 40% from prior year for NEOs other than our CEO which has been awarded 50% of LTI in PBRSUs in prior years).


Although our 2022 say-on-pay proposal received increased support from stockholders relative to the 2021 say-on-pay proposal, we continued our outreach to stockholders as discussed above and in response to those conversations, we began taking steps to implement a new LTI program for fiscal 2024 to further align with the feedback we have received from stockholders in reference to our LTI program. We made significant changes to our executive compensation program for fiscal year 2024 based largely on the metrics and design that our stockholders told us they prefer to see. We intend to continue to seek and respond to stockholder concerns regarding our executive compensation in future years. Our new LTI program for fiscal year 2024 for NEOs consists of the following design features:

·A mix of 50% time-based RSUs and 50% PBRSUs

·The PBRSUs will measure return on invested capital (“ROIC”), which are based on the achievement of certain thresholds over a three-year period.

·The ROIC thresholds over the fiscal 2024 to fiscal 2026 performance period are as follows: (1) an annualized average ROIC of 4.3% for a minimum threshold and a 50% payout; (2) an annualized average ROIC of 6.1% for a target threshold and a 100% payout; and (3) an annualized average ROIC of 7.9% for a maximum threshold and a 200% payout.

·The move to ROIC as the principal measure in our LTI program differentiates from the Adjusted EBITDA metric that we use in our STI program.

·The switch to a cumulative 3 year performance metric based on ROIC was based on feedback from our stockholder outreach program.

·A new peer group that includes smaller companies to orient the Compensation Committee towards a total group that more closely reflects the size of the Company following the TreeHouse transaction.

Oversight of the Executive Compensation Program

Compensation Committee

Under its charter, the Compensation Committee has the duty, among other things, to assess the overall executive compensation structure of the Company, including the compensation for our President and Chief Executive Officer and each of our other Named Executive Officers. In exercising this authority, the Compensation Committee determines the forms and amount of executive compensation appropriate to achieve the Compensation Committee’s strategic objectives, including base salary, bonus, incentive or performance-based compensation, equity awards and other benefits.

Compensation Consultant

The Compensation Committee has the authority to retain the services of outside consultants to assist it in performing its responsibilities. In fiscal 2023, the Compensation Committee engaged Meridian Compensation Partners, LLC, an independent compensation consultant (“Meridian”) to provide advisory and consulting services relating to the Company’s executive officer and director compensation programs, consultation regarding short-term and long-term incentive plan design, consultation regarding CEO pay ratio disclosure, and consultation regarding corporate governance practices and general Compensation Committee matters and processes. In fiscal 2023, the Compensation Committee also engaged Meridian to help determine the compensation of our President and Chief Executive Officer, as well as our other Named Executive Officers.

Meridian provided no other services to the Company or its affiliates during fiscal 2023 other than as described above. The Compensation Committee has determined that Meridian is “independent” according to the criteria required by the SEC in Rule 10C-1 of the Exchange Act.

Management’s Role in Establishing Compensation

The compensation of the Named Executive Officers is determined by the Compensation Committee, taking into account the input and recommendations of our President and Chief Executive Officer regarding compensation for those executive officers, and taking into account the input of the Nominating and Corporate Governance Committee and Chairman regarding performance of our President and Chief Executive Officer. The Compensation Committee has sole authority for all final compensation determinations regarding our President and Chief Executive Officer. In fiscal 2023, our President and Chief Executive Officer, Chief Human Resources Officer and General Counsel routinely attended the meetings of the Compensation Committee to provide input, as requested by the Compensation Committee and, in the case of the General Counsel, to act as secretary for the meeting; however, no executive officer has any role in approving his or her own compensation, and neither our President and Chief Executive Officer nor any other Named Executive Officer is present during the portion of the meeting at which the Compensation Committee considers their compensation. The Compensation Committee regularly meets in executive session, without members of the management team present, when discussing and approving executive compensation.


Benchmarking and Peer Group Companies

The Compensation Committee compares the pay levels and programs for the Company’s executive officers to compensation information from a relevant peer group as well as information from published survey sources. The Compensation Committee uses this comparative data as a reference point in its review and determination of executive compensation but also considers competitive compensation practices and other relevant factors based on the members’ collective experience in setting pay. Accordingly, the Compensation Committee does not generally establish compensation at specific benchmark percentiles.

When setting compensation, the Compensation Committee considers other factors in addition to market data, including:

·individual performance;

·impact on long-term stockholder value creation;

·impact on development and execution of Company strategy;

·experience and tenure in role;

·retention;

·trends and competitive factors impacting the labor market;

·internal alignment;

·the impact of macroeconomic conditions, inflationary pressures on the business and management’s actions to respond to the uncertain market in fiscal 2023; and

·scope of responsibility.

The Compensation Committee, with the assistance of Meridian, developed and approved the following peer group for purposes of benchmarking the compensation levels of our Named Executive Officers relative to our peers and informing fiscal 2023 pay levels for our Named Executive Officers:

Beyond Meat, Inc.Bridgford Foods Corporation
Calavo Growers, Inc.Freshpet, Inc.
Hostess Brands, Inc.J&J Snack Foods Corp.
John B Sanfilippo & Son, Inc.MGP Ingredients, Inc.
NewAge, Inc.SunOpta, Inc.
The Duckhorn Portfolio, Inc.The Simply Good Foods Company
Utz Brands, Inc.Vital Farms, Inc.
Whole Earth Brands, Inc.

The Compensation Committee evaluates our peer group annually and makes adjustments to this peer group when appropriate to reflect changes in relative size or operations and results, and reduced operational efficiency. Failure to effectively allocate and manage our resources to support our information technology infrastructure could result in transaction errors, processing inefficiencies,of the loss of customers, business disruptions,Company or the loss of sensitive or confidential data through security breach or otherwise. Significant capital investments could be required to remediate any potential problems or to otherwise protect against security breachesits peers, or to address problemschanges resulting from mergers, acquisitions or other structural changes. As such, during fiscal 2023, the Compensation Committee made additional changes to the peer group set to remove larger companies and add smaller companies so that the group on the whole is closer in revenue size to Farmer Bros. Specifically, the Committee removed J&J Snack Foods Corp., Utz Brands, Inc., Hostess Brands, Inc., The Simply Good Foods Company, Calavo Growers, Inc. and John B. Sanfilippo & Son, Inc. as each of these had reported revenues greater than $1 billion at the time of the Committee’s review. The Compensation Committee then added The Vita Coco Company, Inc., BRC Inc., Vintage Wine Estates, Inc. and Village Farms International, Inc. as each had reported revenues closer to Farmer Bros. revenues at the time of the Committee’s review. These companies were used for benchmarking officer compensation for fiscal 2023 to inform fiscal 2024 pay decisions.


Fiscal 2023 Named Executive Officer Compensation Mix

In fiscal 2023, the Compensation Committee’s compensation decisions with respect to our Named Executive Officers, including the revisions to the LTI program for fiscal 2024, reflected strong alignment between pay and performance. We believe that our compensation programs were therefore also strongly aligned with the long-term interests of our stockholders.

The following charts illustrate, with respect to our President and Chief Executive Officer and our other Named Executive Officers as a group, the base salary, target short-term cash incentive compensation, and target long-term equity incentive compensation as a percentage of target total direct compensation for fiscal 2023. As shown below, a significant portion of Named Executive Officer target direct compensation is “at risk” variable compensation rather than fixed compensation, reflecting our philosophy of aligning Named Executive Officer compensation with performance generally and stockholder value creation specifically.


Key Elements of Fiscal 2023 Executive Compensation Program

Below are the key elements of the Company’s fiscal 2023 executive compensation program applicable to our Named Executive Officers.

What We PayWhy and How We Pay It
Base Salary

·       Base salary comprises fixed cash compensation that is designed to provide a reasonable level of Company-wide and individual performance.

·       Base salaries are reviewed annually and adjusted when appropriate (increases are neither fixed nor guaranteed).

·       Competitive base salaries are a key component of attracting and retaining executive talent.

Short-Term Cash Incentives

·       Annual cash incentives constitute variable “at risk” compensation, payable in cash based on Company-wide and individual performance. These awards are designed to reward achievement of annual financial objectives as well as near term strategic objectives that create momentum that is expected to foster the long-term success of the Company’s business.

·       Company-wide metrics and targets are derived from, and intended to promote, our near-term business strategy.

·       Individual targets are consistent with our focus on both quantitative and qualitative priorities and thereby reward both attainment of objective metrics and individual contributions.

Long-Term Incentives

·       Stock options, Restricted Stock Units (“RSUs”) and Performance-based Restricted Stock Units (“PBRSUs”) subject to both performance- and time-based vesting conditions are designed to create direct alignment with stockholder objectives, provide a focus on long-term value creation, retain critical talent over extended timeframes and enable key employees to share in value creation.

·       Performance-based award metrics and targets align with long-term business strategy as well as stock price appreciation creating shareholder value.

Severance Benefits

·       Severance benefits provide income and health insurance protection to our Named Executive Officers in connection with certain involuntary terminations of employment. These severance benefits are designed to enable the Named Executive Officers to focus on the best interests of the Company and its stockholders, including in circumstances that may jeopardize the individual’s job security.

·       Enhanced severance benefits are available if the termination of employment occurs in connection with a change in control to ensure continued focus on the best alternatives for the Company and its stockholders, free from distractions caused by personal uncertainties associated with the heightened risk to job security that arises for senior executives in the transactional context.

·       Severance benefits are also key to attracting and retaining key talent.

Retirement and Welfare Benefits

·       A standard complement of retirement, health, welfare and insurance benefits, offered to our Named Executive Officers on terms generally similar to those available to other employees, provides important protections and stability for our Named Executive Officers and their families that help enable our Named Executive Officers to remain focused on their work responsibilities.

·       These are generally low-cost benefits with a higher perceived value that are intended to help keep our overall compensation package competitive.

Perquisites

·       We provide limited perquisites as well as relocation assistance, each intended to facilitate the operation of the Company’s business and to assist the Company in recruiting and retaining key executives.

·       These are also low-cost benefits with a higher perceived value that are intended to help keep our overall compensation package competitive.

Base Salary

Consistent with the established executive compensation philosophy and objectives described above, and utilizing the peer comparisons provided by breaches.Meridian, the Compensation Committee approved fiscal 2023 annual base salaries for the Named Executive Officers as shown in the table below.


Named Executive Officers Fiscal 2023
Annual Base
Salary(1)
  Fiscal 2022
Annual Base
Salary(1)
  Annual Base
Salary
Percentage
Change
 
D. Deverl Maserang II  714,000   680,000   5%
Scott R. Drake  463,500   450,000   3%
Amber D. Jefferson  336,000   320,000   5%
Jared G. Vitemb  315,000   300,000   5%
Ruben E. Inofuentes  360,500   350,000   3%
Maurice S. J. Moragne  372,725   355,000   5%

(1)            Annual base salary as of the end of the applicable fiscal year.

Short-Term Cash Incentives for Fiscal 2023

Fiscal 2023 awards were designed to place a significant portion of each Named Executive Officer’s annual cash compensation “at risk” and were designed to align the near-term focus of our Named Executive Officers with our business goals for the relevant period. Due to the longer term impacts of the COVID-19 pandemic on the restaurant industry specifically impacting our base business, the Company’s 2023 short-term incentive plan focused on achieving a minimum performance threshold for Company-wide financial results.

For the fiscal 2023 Short-Term Cash Incentive Program, the Compensation Committee used adjusted EBITDA as the relevant performance metric and set a minimum threshold for achievement (described below) which, if achieved, the Compensation Committee believed would reflect a meaningful level of Company profitability and would be aligned with our strategic plan to deliver long-term value to our stockholders. Generating EBITDA is critically important during this unprecedented time in the Company’s history which is why adjusted EBITDA was the primary performance metric for the fiscal 2023 annual cash incentive program and an important factor in the fiscal 2023 PBRSU awards.

The Company must remain in compliance with the financial covenants under the Company’s credit facility, and as such, the Compensation Committee believes it is important to incentivize management to drive adjusted EBITDA in excess of what is required under the Company’s credit facility, while ensuring that any payouts generated from adjusted EBITDA achievement are affordable and do not put the Company in a compromising cash situation. As such, the Compensation Committee determined that (i) any payouts above threshold adjusted EBITDA achievement levels would be discretionary and (ii) no Short-Term Incentive payments would be made to the extent that such payments would reduce the Company’s adjusted EBITDA below the level required by the financial covenants applicable to the Company at the time. The Committee has since changed the design as described above.

For this purpose, “adjusted EBITDA” was defined as net (loss) income excluding the impact of: (i) income taxes; (ii) interest expense; (iii) income from short-term investments; (iv) depreciation and amortization expense; (v) ESOP and share-based compensation expense; (vi) non-cash impairment losses; (vii) non-cash pension withdrawal expense; (viii) other similar non-cash expenses; (ix) restructuring and other transition expenses; (x) non-recurring stockholder-related expenses; (xi) acquisition costs (and related revenues only during the same fiscal year); (xii) capital issuance expenses; (xiii) out of period external legal expenses; (xiv) business segment disposition expenses (and exclusion of related gain on sales); (xv) net gain or loss on sale of assets other than M&A or business segment disposition; and (xvi) non-recurring and/or extraordinary expenses.

In fiscal 2023, our Named Executive Officers received no short term incentive awards as the Company did not achieve its threshold adjusted EBTIDA goal.


The following table shows such achievement compared to Company-wide performance threshold for fiscal 2023.

Metric Adjusted
EBITDA
Target
  Threshold
Goal
  Actual
Achievement
  Actual
Achievement
Compared to
Target
Performance
  Payout for Fiscal
2023 Company-
wide
Performance
 
Adjusted EBITDA $22M $16.5M $(14.2)M  0%  0%

The following table shows such target achievement compared to actual earned short-term cash incentive for fiscal 2023.

Named Executive Officers Fiscal 2023 Target Short
Term Cash Incentive
  Fiscal 2023 Target Short
Term Earned Cash
Incentive
 
D. Deverl Maserang II $714,000  $0 
Scott R. Drake $347,625  $0 
Amber D. Jefferson $201,600  $0 
Jared G. Vitemb $189,000  $0 
Ruben E. Inofuentes $216,300  $0 
Maurice S. J. Moragne $223,650  $0 

Long-Term Incentive Compensation

Awards

The fiscal 2023 long-term incentives were designed to be competitive with market and directly align our incentives with our long-term business priorities and compensation outcomes to Company performance and shareholder interests. The Compensation Committee believes that the fiscal 2023 long-term incentive program facilitates strong pay for performance alignment in that the RSUs only appreciate in value to the extent that the stock price appreciates, and the PBRSUs only vest to the extent that the performance goals are achieved, placing the emphasis on stock price and stockholder alignment on internal Company performance and business strategy. The Compensation Committee also believes that long-term incentives serve as a retention tool for key executives, which is particularly important in this competitive market for talent. In addition, if wethe Compensation Committee has continued to revise the LTI program for fiscal 2024, including revising the PBRSU measure to include ROIC based on a cumulative three year performance. These changes have been made to improve the structure of the program moving forward to better align with shareholder interests.

Our practice historically has been to grant annual normal-cycle long-term incentive awards generally in the second quarter of the fiscal year, with interim grants for new hires and promotions after the annual grant date being made on the first day of the calendar month following the hire or promotion, as applicable.

Fiscal 2023 Awards

Restricted Stock Units

In fiscal 2023, the RSUs granted to each of our Named Executive Officers under the 2017 Plan, other than Mr. Vitemb, vest ratably over three years, with one-third of the total number of shares subject to each such RSUs vesting on each of the first three anniversaries of the grant date, contingent on continued employment. Mr. Vitemb was not a Named Executive Officer at the time the 2023 LTI grants were made; consequently, his grants consisted of 50% time-based RSUs and 50% performance-based RSUs.


Performance-Based Restricted Stock Units

In fiscal 2023, the PBRSUs granted to our Named Executive Officers under the 2017 Plan cliff vest at the end of the three-year performance period based upon achievement of adjusted EBITDA (as defined above for purposes of fiscal 2023 cash incentive) performance goals for the performance period July 1, 2022 through June 30, 2025. During this unprecedented period of uncertainty and challenging operating environment for Farmer Bros., generating EBITDA is critically important to our success, including our ability to meet financing covenants, create shareholder value and afford incentive compensation to attract and retain key talent in a highly competitive labor market. As such, adjusted EBITDA is the featured performance metric for both our short- and long-term incentive plans. The Compensation Committee continuously evaluates alternative incentive plan performance metrics and expects that the use of the same metric in both short- and long-term plans was only a temporary practice. As described above, for fiscal 2024 the Company will use separate metrics for short- and long-term incentive goals and expects to continue this practice going forward. For the fiscal 2023 awards, adjusted EBITDA targets for each year of the performance period are unableset independently at the beginning of the year due to prevent security breaches, we may experiencethe rapidly changing realities of our business during the pandemic and the inflationary environment that followed. This preserves the incentive of pay-for-performance by making the targets challenging but achievable based on the business environment for the applicable performance year. For fiscal 2024, the Company will use cumulative three year performance periods and expects to continue that practice going forward.

For fiscal 2023, performance against adjusted EBITDA targets for each year will determine a losspayout factor for that year which can range from 0% to 150% of critical datatarget. At the end of the 3-year performance period, the average payout factor for each of the three one-year adjusted EBITDA measurement periods will be calculated. This three-year average payout factor for adjusted EBITDA performance is then subject to modification based on Farmer Bros. three-year TSR (the “three-year TSR modifier”) which is applied to the preliminary payout factor determined by the EBITDA target to determine a final payout factor between 0% and 225% of target for the full 3-year measurement period for PBRSUs. No PBRSUs can be earned or suffer financialpaid prior to the conclusion of the full three-year measurement period when the final full three-year achievement is determined.

Our performance goals for adjusted EBITDA are based on business forecasts and relevant expectations reflecting our strategic plans and aspirations to grow our business. The Compensation Committee has historically established aggressive, yet achievable performance goals intended to motivate the Company’s executive officers to achieve internal goals and results that will benefit the Company’s stockholders, while maintaining strong alignment between pay and performance. With the limited number of shares available for issuance under the 2017 Plan, this annual as opposed to three-year target setting preserves the incentive of equity awards. Actual achievement of the three-year performance goals for the PBRSU awards granted in fiscal 2023 will be reflected in our proxy statement that reports the payouts at the end of the three-year performance period.

The PBRSUs that were granted to Messrs. Maserang and Drake for the performance period spanning July 1, 2020-June 30, 2023 were certified by the Compensation Committee in September 2023. The performance metrics yielded an award of approximately 0.533 shares of common stock for each PBRSU granted to Messrs. Maserang and Drake, or reputational damage or penalties123,453 and 11,207 shares of common stock, respectively. More specifically, 67% of the total EBITDA target for the PBRSUs was used, but this was reduced by 20% because of the unauthorized disclosureTSR modifier.

Employment and Change in Control Severance Agreements

The Company is party to an Employment Agreement, dated September 6, 2019, with its former President and Chief Executive Officer, Deverl Maserang (the “Maserang Employment Agreement”), as well as severance agreements with each of confidential information belongingthe Named Executive Officers other than Messrs. Maserang, Moragne and Inofuentes. During fiscal 2023, but following the departure of Messrs. Moragne and Inofuentes, the Company adopted and approved certain revisions to us the form of severance agreement for executive officers, and on June 30, 2023, entered into new severance agreements with each Named Executive Officer, other than Messrs. Maserang, Moragne and Inofuentes, on such form (each, a “Severance Agreement” and collectively, the “Severance Agreements”). The Severance Agreements superseded and replaced the prior change in control severance agreement in place between the Company and the related Named Executive Officer, effective as of June 30, 2023. A detailed description of the severance benefits each Named Executive Officer is due to receive based on their Employment Agreement and/or Severance Agreement is set forth below under the heading “Named Executive Officer Compensation-Potential Payments Upon Termination or Change in Control.”

These agreements were entered into, and continue in effect, to our customers or suppliers. Our insurance policies do not cover lossesachieve the following objectives: (a) assure the Named Executive Officers’ full attention and dedication to the Company, free from distractions caused by security breaches.personal uncertainties and risks related to a pending or threatened change in control; (b) assure the Named Executive Officers’ objectivity with respect to stockholders’ interests in a change in control scenario; (c) assure the fair treatment of the Named Executive Officers in the event of a termination without cause or resignation for good reason following a following a change in control; (d) formalize the Company’s historic severance practices in the event of a termination without cause or resignation with good reason outside of a change in control; and (e) attract and retain key talent during uncertain times. The agreements are structured so that payments and benefits are provided if there is a qualifying termination of employment (“single trigger”), either by us (other than for “Cause,” disability or death), or by the Named Executive Officer in connection with a resignation for “Good Reason” (as each term is defined in the Severance Agreements or the Maserang Employment Agreement, as applicable).


Interruption

Retirement and Welfare Benefits

The Named Executive Officers receive the same welfare benefits as those received by our employees generally, including medical, dental, life, disability and accident insurance.

The Named Executive Officers are eligible on the same basis as our employees generally to participate in the Company’s 401(k) plan. The value of the Named Executive Officers’ 401(k) balances depends solely on the performance of investment alternatives selected by the applicable Named Executive Officer from among the alternatives offered to all participants. All investment options in the 401(k) are market-based, meaning there are no “above-market” or guaranteed rates of return.

The Company match is currently made in Company stock to help the Company manage its cash position as it emerges from the impacts of COVID-19. Through our shareholder outreach program, we learned that many of our supply chain, includingshareholders are concerned about dilution. So, effective January 1, 2023, we eliminated the 4% non-elective contribution and changed the Company match to 100% of the first 3% each eligible employee contributes plus 50% on the next 2% they contribute. This model will allow the Company to take advantage of the “safe harbor” provisions of the regulations applicable to its 401(k) and remain competitive in a disruption in operations at anychallenging labor market, while reducing the dilutive effects of the match.

Perquisites

We believe that offering certain limited perquisites facilitates the operation of our productionbusiness, allows our Named Executive Officers to better focus their time, attention and distribution facilities, could affect our ability to manufacture or distribute products and could adversely affectcapabilities on our business, and sales.

assists the Company in recruiting and retaining key executives. We rely on a limited number of production and distribution facilities. A disruption in operations at any of these facilities or any other disruptionalso believe that the perquisites offered to our Named Executive Officers are generally consistent with practices among companies in our supply chain relatingpeer group.

It is the Company’s and the Compensation Committee’s intention to green coffee supply, service by our 3PL service providers or common carriers, supplycontinually assess business needs and evolving practices to ensure that perquisite offerings are competitive and reasonable.

Compensation Policies and Practices

Stock Ownership Guidelines

The Board has adopted Stock Ownership Guidelines to further align the interests of raw materials and finished goods under vendor-managed inventory arrangements, or otherwise, whetherthe Company’s executive officers with the interests of the Company’s stockholders. Under the stock ownership guidelines, an executive officer is not permitted to sell any shares of Common Stock received as a result of casualty, natural disaster, power loss, telecommunications failure, terrorism, labor shortages, contractual disputes or other causes, could significantly impair our ability to operate our businessgrants under the Company’s long-term incentive plans unless the executive officer achieves and adversely affect our relationship with our customers. In such event, we may also be forced to contract with alternative, and possibly more expensive, suppliers or service providers, which would adversely affect our profitability. Additionally,maintains the majority of our green coffee comes through the Ports of Houston and Seattle. Any interruption to port operations, highway arteries, gas mains or electrical serviceapplicable threshold share ownership level set forth in the areas where we operatetable below. Further, under the stock ownership guidelines, a non-employee director is expected to own and hold during his or obtain productsher service as a Board member a number of shares of Common Stock with a value of at least four times his or inventory could restrict our abilityher annual cash retainer for service on the Board, and is not permitted to manufacturesell any shares of Common Stock received as grants under the Company’s long-term incentive plans unless and distribute our products for saleuntil the non-employee director achieves and would adversely impact our business.

Our failure to accurately forecast demand for our productsmaintains this threshold share ownership level.

Shares of Common Stock that count toward satisfaction of these guidelines include: (i) shares of Common Stock owned outright by the executive officer or quickly respond to forecast changes couldnon-employee director and his or her immediate family members who share the same household, whether held individually or jointly; (ii) restricted stock or restricted stock units (whether or not the restrictions have an adverse effect on our sales.

Based upon our forecastslapsed); (iii) shares of customer demand, we set target levelsCommon Stock held in trust for the manufacturebenefit of our productsthe executive officer or non-employee director or his or her family; and for(iv) shares of Common Stock issuable under vested options held by the purchase of green coffee in advance of customer orders. If our forecasts exceed demand, we could experience excess inventoryexecutive officer or non-employee director.

PositionValue of Shares Owned
Chief Executive Officer3x base salary
Other Executive Officers1x base salary
Non-Employee Directors4x Annual Cash Retainer


Insider Trading Policy (Including Anti-Hedging and manufacturing capacity and/or price decreases or we could be required to write-down expired or obsolete inventory, which could adversely impact our financial performance. Alternatively, if demand for our products increases more than we currently forecast and we are unable to satisfy increases in demand through our current manufacturing capacity or appropriate third-party providers, or we are unable to obtain sufficient raw materials inventories under vendor-managed inventory arrangements, we may not be able to satisfy customer demand for our products which could have an adverse impact on our sales and reputation.

We depend on the expertise of key personnel. The unexpected loss of one or more of these keyAnti-Pledging Policies)

Our insider trading policy prohibits all employees, or difficulty recruiting and retaining qualified personnel could have a material adverse effect on our operations and competitive position.

Our success largely depends on the efforts and abilities of our executive officers, directors, consultants and other key personnel. There is limited management depth in certain key positions throughout the Company. We must continue to recruit, retain and motivate management and other employees sufficiently to maintain our current business and support our projected growth and strategic initiatives. The loss of key employees could adversely affect our operations and competitive position. We do not maintain key person life insurance policies on any of our executive officers.


Investment in acquisitions could disrupt our ongoing business, not result in the anticipated benefits and present risks not originally contemplated.
We have invested and in the future may invest in acquisitions which may involve risks and uncertainties, including the risks involved with entering new product categories or geographic regions, the difficulty in integrating newly-acquired businesses or brands, contingent risks associated with the past operations of or other unanticipated problems arising in any acquired business, the challenges of achieving strategic objectives and other benefits expected from acquisitions, the diversion of our attention and resources from our operations and other initiatives, the potential impairment of acquired assets and liabilities, the performance of underlying products, capabilities or technologies, and the potential loss of key personnel and customersassociates of the acquired businesses. Additionally,Company and certain of their family members from, among other things, purchasing or selling any type of security, whether the issuer of that security is the Company or any other company, while aware of material, non-public information relating to the issuer of the security or from providing such acquisitionsmaterial, non-public information to any person who may resulttrade while aware of such information. The insider trading policy also prohibits employees from engaging in potentially dilutive issuances of our equity securities, the incurrence of additional debt, restructuring charges and the recognition of significant charges for depreciation and amortization related to intangible assets. There can be no assurance that any such acquisitions will be identified or that we will be able to consummate any such acquisitions on terms favorable to us or at all. If any such acquisitions are not successful, our business and results of operations could be adversely affected.
Volatility in the equity markets could reduce the value of our investment portfolio.
The value of our investment portfolio may be adversely affected by interest rate fluctuations, downgrades in credit ratings, illiquidity in the capital markets and other factors which may result in other than temporary declines in the value of our investments. Any of these events could cause us to record impairment chargesshort sales with respect to our investment portfoliosecurities, purchasing or pledging Company stock on margin and entering into derivative or similar transactions (i.e., puts, calls, options, forward contracts, collars, swaps or exchange agreements) with respect to realize lossesour securities. We also have procedures that require trades by certain insiders, including our directors and executive officers, to be pre-cleared by appropriate Company personnel. Additionally, such insiders are generally prohibited from conducting transactions involving the purchase or sale of the Company’s securities from 12:01 a.m. New York City time on the salefourteenth calendar day before the end of investments. We have incurred operating losseseach of the Company’s four fiscal quarters (including fiscal year end) through 11:59 p.m. New York City time on the business day following the date of the public release containing the Company’s quarterly (including annual) results of operations.

Clawback Policy on Executive Compensation in Restatement Situations

In August 2023, for purposes of compliance with Section 10D of the Exchange Act and the Nasdaq listing standards, the Compensation Committee approved the Company’s Amended and Restated Policy on Executive Compensation in Restatement Situations (the “Clawback Policy”). The Clawback Policy provides that, in the past and if we incur operating losses inevent the future on a continual basis, a portion or all of this investment portfolio may beCompany is required to be liquidated to fund those losses.

Increased severe weather patterns may increase commodity costs, damage our facilities and disrupt our production capabilities and supply chain.
There is increasing concern that a gradual increase in global average temperaturesprepare an accounting restatement due to increased concentration of carbon dioxide and other greenhouse gases in the atmosphere have caused and will continue to cause significant changes in weather patterns around the globe and an increase in the frequency and severity of extreme weather events. Major weather phenomena like El Niño and La Niña are dramatically affecting coffee growing countries. The wet and dry seasons are becoming unpredictable in timing and duration, causing improper developmentmaterial noncompliance of the coffee cherries. A large portionCompany with any financial reporting requirement under the federal securities laws, the Company will recover (on a pre-tax basis) the amount of incentive-based compensation received by its current and former executive officers in excess of the global coffee supply comes from Brazil and soamount of incentive-based compensation that would have been received had it been determined based on the climate and growing conditions in that country carry heightened importance. Decreased agricultural productivity in certain regions as a result of changing weather patterns may affect the quality, limit the availability or increase the cost of key agricultural commodities, such as green coffee and tea, which are important ingredientsrestated amount, subject to limited exceptions.

Accounting Standards

Financial Accounting Standards Board (FASB) Accounting Standards Codification (ASC) Topic 718 requires us to recognize an expense for our products. We have experienced storm-related damages and disruptions to our operations in the recent past related to both winter storms as well as heavy rainfall and flooding. Increased frequency or duration of extreme weather conditions could also damage our facilities, impair production capabilities, disrupt our supply chain or impact demand for our products. As a result, the effects of climate change could have a long-term adverse impact on our business and results of operations.

Volatility in the equity markets or interest rate fluctuations could substantially increase our pension funding requirements and negatively impact our financial position.
At June 30, 2016, the projected benefit obligation under our single employer defined benefit pension plans exceeded the fair value of share-based compensation awards. Grants of stock options, restricted stock and PBRSUs under the Company’s long-term incentive plans are accounted for under FASB ASC Topic 718. The Compensation Committee considers the accounting implications of significant compensation decisions, especially in connection with decisions that relate to our long-term incentive program. As accounting standards change, the Company may revise certain programs to appropriately align accounting expenses of our share-based compensation awards with our overall executive compensation philosophy and objectives.


Summary Compensation Table

The following table sets forth summary information concerning compensation awarded to, earned by, or paid to each of our Named Executive Officers for all services rendered in all capacities to the Company and its subsidiaries in the last three fiscal years. For a complete understanding of the table, please read the footnotes and narrative disclosures that follow the table.

Name and
Principal
Position
 Year  Salary
($)
  Bonus
($)
  Stock
Awards
($)
  Option
Awards
($)
  Non-Equity
Incentive Plan
Compensation
($)
  All Other
Compensation
($)
  Total
($)
 
(a) (b)  (c)  (d)  (e)  (f)  (g)  (h)  (i) 
D. Deverl Maserang II(1) 2023   704,846   -   1,499,994   -   -   9,900   2,214,740 
Former Principal Executive Officer 2022   676,154   -   2,006,755   -   598,400   20,900   3,292,209 
  2021   615,574   -   1,899,995   -   660,000   11,114   3,186,683 
Scott R. Drake(2) 2023   459,865   -   449,997   -   -   13,908   923,770 
Former Principal Financial Officer 2022   397,500   -   712,160   -   297,000   19,119   1,425,779 
  2021   349,758   -   344,989   -   281,250   14,226   990,223 
Amber D. Jefferson(3) 2023   331,692   -   224,998   -   -   15,176   571,866 
Chief Human Resources Officer 2022   221,538   -   249,996   -   168,960   10,359   650,853 

Jared G. Vitemb(4)

Vice President, General Counsel, Secretary and Chief Compliance Officer

 2023   310,961   -   224,998   -   -   16,759   552,718 
Maurice S.J. Moragne(5) 2023   283,078   -   299,994   -   -   204,074   787,146 
Former Chief Sales Officer 2022   352,115   -   267,567   -   170,400   20,606   810,688 
  2021   340,000   -   289,986   74,998   204,000   10,994   844,980 
Ruben E. Inofuentes(6) 2023   281,795   -   274,995   -   -   109,242   666,032 
Former Chief Supply Chain Officer 2022   348,077   -   245,266   -   159,600   20,675   773,618 
  2021   317,114   -   359,992   -   204,000   11,248   892,354 


(1)Mr. Maserang joined as our President and Chief Executive Officer effective September 13, 2019. On September 30, 2023, Mr. Maserang was terminated without cause, and he ceased to serve as President and Chief Executive Officer of the Company. On October 1, 2023, the Company appointed John E. Moore III to serve as interim Chief Executive Officer of the Company.
(2)Mr. Drake joined as our Chief Financial Officer effective March 23, 2020. On October 1, 2023, Mr. Drake was terminated without cause, and he ceased to serve as Chief Financial Officer of the Company. On October 1, 2023, the Company appointed Brad Bollner to serve as interim Chief Financial Officer of the Company.
(3)Ms. Jefferson joined as our Chief Human Resources Officer effective October 11, 2021.
(4)Mr. Vitemb joined as our Vice President, General Counsel, Secretary and Chief Compliance Officer effective March 2022. Mr. Vitemb was not an NEO in fiscal 2022.
(5)Mr. Moragne joined as our Chief Sales Officer effective June 8, 2020, and served in such role until his separation from the Company effective February 17, 2023. Given Mr. Moragne’s departure from the Company during fiscal 2023, Mr. Moragne’s compensation amounts are reflective of partial year service.
(6)Mr. Inofuentes joined as our Chief Supply Chain Officer effective November 15, 2019, and served in such role until his separation from the Company effective February 17, 2023. Given Mr. Inofuentes’ departure from the Company during fiscal 2023, Mr. Inofuentes’ compensation amounts are reflective of partial year service.

Salary (Column C)

The amounts reported in column C represent base salaries earned by each of the Named Executive Officers for the fiscal year indicated, prorated based on applicable start dates during the fiscal year or the dates of resignation or termination. The amounts shown include amounts contributed by the employee to the Company’s 401(k) Plan.

Bonus (Column D)

This column reflects that no cash-based bonus payments outside of an incentive plan assets. were made during the fiscal years set forth. All non-equity incentive plan compensation for services performed during the fiscal year by the Named Executive Officers under the 2017 Plan is shown in column G.

Stock Awards (Column E)

The difference betweenamounts in column E for fiscal 2021 represent the projected benefit obligationaggregate grant date fair value of the PBRSU award received by each of Mr. Maserang and Mr. Inofuentes in connection with the commencement of their respective employment in fiscal 2021. The amounts in column E for fiscal 2022 include the aggregate grant date fair value of the annual PBRSU awards received by each of Messrs. Maserang, Drake, Inofuentes, and Moragne and the annual RSU awards received by each of Messrs. Maserang, Drake, Inofuentes and Moragne. The amounts in column E for fiscal 2023 include the aggregate grant date fair value of the annual PBRSU awards received by each of Messrs. Maserang, Drake, Inofuentes and Moragne and Ms. Jefferson, the annual RSU awards received by each of Messrs. Maserang, Drake, Vitemb, Inofuentes and Moragne and Ms. Jefferson and the annual CSRSU award received by Mr. Vitemb. A discussion of the assumptions used in calculating the amounts in this column may be found in Note 14 to our audited consolidated financial statements for the fiscal year ended June 30, 2023 included in our 2023 Form 10-K, except that, as required by applicable SEC rules, we did not reduce the amounts in this column for any forfeitures relating to service-based (time-based) vesting conditions.

For annual PBRSU awards in each of fiscal 2023, fiscal 2022 and fiscal 2021, we have reported the fair value of plan assets, or the funded statusaward based upon the probable satisfaction of the plans, significantly affectsperformance conditions as of the net periodic benefit costgrant date. The maximum aggregate grant date fair value that would have been received if the highest level of performance was achieved in fiscal 2021 would have been $1,709,998 for Mr. Maserang, $155,246 for Mr. Drake, $161,998 for Mr. Inofuentes, and ongoing funding requirements$96,744 for Mr. Moragne. The maximum aggregate grant date fair value that would have been received if the highest level of those plans. Amongperformance was achieved in fiscal 2022 would have been $1,505,077 for Mr. Maserang, $187,297 for Mr. Drake, $147,166 for Mr. Inofuentes, and $160,540 for Mr. Moragne. The maximum aggregate grant date fair value that would have been received if the highest level of performance was achieved in fiscal 2023 would have been $1,687,492 for Mr. Maserang, $520,607 for Mr. Drake, $309,369 for Mr. Inofuentes, $337,493 for Mr. Moragne and $253,124 for Ms. Jefferson. These amounts do not reflect the Company’s expense for accounting purposes for these awards, and do not represent the actual value that may be realized by the Named Executive Officers. For further information on these awards, see the Grants of Plan-Based Awards Table and Outstanding Equity Awards at Fiscal Year-End Table in this Amendment.


Option Awards (Column F)

The amounts reported in column F represent the aggregate grant date fair value of stock option awards computed in accordance with FASB ASC Topic 718. The stock option awards granted in fiscal 2021 reflects awards received by Mr. Moragne in connection with commencement of his employment. A discussion of the assumptions used in calculating the amounts in this column may be found in Note 13 to our audited consolidated financial statements for the fiscal year ended June 30, 2023 included in our 2023 Form 10-K, except that, as required by applicable SEC rules, we did not reduce the amounts in this column for any risk of forfeiture relating to service-based (time-based) vesting conditions. For further information on these awards, see the Grants of Plan-Based Awards Table and Outstanding Equity Awards at Fiscal Year-End Table in this Amendment.

Non-Equity Incentive Plan Compensation (Column G)

The amounts reported in column G represent the aggregate dollar value of the annual incentives earned by the Named Executive Officers under the 2017 Plan for fiscal 2022 and 2021 under the short-term incentive plan for the relevant fiscal year. As a result of the Company’s failure to achieve threshold levels of performance in fiscal 2023, no payouts are reported for any of the Named Executive Officers during that period. In accordance with SEC rules, the actual annual incentive amounts earned by the Named Executive Officers are reflected in the Summary Compensation Table in the fiscal year earned, even though these annual incentive amounts are paid in the subsequent fiscal year.

As a result of the Company’s failure to achieve threshold levels of performance in fiscal 2021, no payouts are reported for any of the Named Executive Officers during that period.

All Other Compensation (Column H)

The amounts reported in column H include the following:

All Other Compensation(1)
Name Year  Company Contributions
to 401(k) Plan ($)(2)
  Relocation Expense
($)(3)
  Payments Under
Severance Agreements
 
D. Deverl Maserang IIr 2023   9,900   -   - 
Formerp Principal Executive Office 2022   20,900   -   - 
  2021   11,114   -   - 
Scott R. Drake 2023   13,908   -   - 
Former Principal Financial Officer 2022   19,119   -   - 
  2021   14,226   -   - 
Amber D. Jeffersonr 2023   15,176   -   - 
Chief Human Resources Office 2022   10,359   -   - 
Jared G. Vitemb
Vice President, General Counsel, Secretary and Chief Compliance Officer
 2023   16,759   -   - 
Maurice S.J. Moragne 2023   11,922   91,796   100,356 
Former Chief Sales Officer 2022   20,606   -   - 
  2021   10,994   -   - 
Ruben E. Inofuentes 2023   12,184   -   97,058 
Former Chief Supply Chain Officer 2022   20,675   -   - 
  2021   11,248   -   - 


(1)Except as set forth in the table, the total value of all perquisites and other personal benefits received by each of our Named Executive Officers did not exceed $10,000 in fiscal 2023 and has been excluded from the table.
(2)Represents the Company’s contribution under the 401(k) including the Company matching contribution and the Qualified Non-elective Contribution (QNEC). Company contributions (and any earnings thereon) are 100% vested. The QNEC contributions are given in Company Common Stock.
(3)The figure presented in this column for Mr. Moragne reflects relocations expenses paid on behalf of the Company in connection with Mr. Moragne’s move from North Carolina to Texas.

Total Compensation (Column I)

The amounts reported in column I are the sum of columns C through H for each of the Named Executive Officers.

Fiscal 2023 Grants of Plan-Based Awards

The following table sets forth, for each of our Named Executive Officers, the plan-based awards granted to each of our Named Executive Officers during fiscal 2023.

    Estimated Future Payouts Under
Non-Equity Incentive Plan
Awards
  Estimated Future Payouts Under
Equity Incentive Plan Awards(1)
  All Other
Stock
Awards

Number of
Shares of:
  All Other
Option
Awards:
Number of
Securities
  Exercise
or Base

Price of
Option
  Grant Date
Fair Value of
Stock and
 
Name Grant Date Threshold
($)(3)
  Target
($)(3)
  Maximum
($)(3)
  Threshold
(#)
  Target
(#)
  Maximum
(#)
  Stock or
Units (#)
  Underlying
Options (#)
  Awards
($/Sh)
  Option
Awards(2)
 
(a) (b) (c)  (d)  (e)  (f)  (g)  (h)  (i)  (j)  (k)  (l) 
D. Deverl Maserang II
Former Principal Executive Officer
 11/1/2022  -   -   -   -   -   -   117,187   -   -   749,997 
  11/1/2022  -   -   -   0   117,187   263,370   -   -   -   749,997 
Scott R. Drake
Former Principal Financial Officer
 11/1/2022  -   -   -   -   -   -   35,156   -   -   224,998 
  11/1/2022  -   -   -   0   35,156   81,344   -   -   -   224,998 
Amber D. Jefferson
Chief Human Resources Officer
 11/1/2022  -   -   -   -   -   -   17,578   -   -   112,499 
  11/1/2022  -   -   -   0   17,578   39,550   -   -   -   112,499 
Jared G. Vitemb
Vice President, General Counsel, Secretary and Chief Compliance Officer
 11/1/2022  -   -   -   -   -   -   17,578   -   -   112,499 
  11/1/2022  -   -   -   -   -   -   17,578   -   -   112,499 
Maurice S.J. Moragne
Former Chief Sales Officer
 11/1/2022  -   -   -   -   -   -   23,437   -   -   149,997 
  11/1/2022  -   -   -   0   23,437   52,733   -   -   -   149,997 
Ruben E. Inofuentes
Former Chief Supply Chain Officer
 11/1/2022  -   -   -   -   -   -   21,484   -   -   137,498 
  11/1/2022  -   -   -   0   21,484   48,338   -   -   -   137,498 


(1)Represents PBRSU awards granted to our Named Executive Officers in fiscal 2023 which cliff vest based upon achievement of adjusted EBITDA performance goals and TSR for the performance period of July 1, 2022 through June 30, 2025. Each year, performance targets for adjusted EBITDA will be established, performance in each of those years will create a bank of shares between 0% to 150% of the target amount, depending on the extent to which the Company meets or exceeds the achievement of the performance goals. At the end of the three-year performance period a TSR modifier is applied which can increase or decrease the cumulative number of shares earned based on adjusted EBITDA by as much as 50%. All shares, including banked shares will be forfeited if the executive voluntarily leaves the Company prior to the end of the performance period. With the exception of Ms. Jefferson, all of these grants have been forfeited as of the date of filing and no shares will vest for Messrs. Maserang, Drake, Moragne, and Inofuentes
(2)Reflects the grant date fair value of restricted stock and PBRSU awards computed in accordance with FASB ASC Topic 718. A discussion of the assumptions used in calculating the amounts in this column may be found in Note 14 to our audited consolidated financial statements for the fiscal year ended June 30, 2023, included in our 2023 Form 10-K, except that, as required by applicable SEC rules, we did not reduce the amounts in this column for any risk of forfeiture relating to service-based (time-based) vesting conditions. The amount reported for PBRSU awards is based upon the probable satisfaction of the performance conditions as of the grant date.
(3)Represents annual cash incentive opportunities under the Short-Term Cash Incentive Program based on the Company’s achievement of certain metrics, as determined by the Compensation Committee. Our Named Executive Officers received a cash payout at Target under the Short-Term Cash Incentive Program in fiscal 2023, based on the Compensation Committee’s discretion once threshold performance was achieved. Annual cash incentive awards earned by our Named Executive Officers for performance in respect of a fiscal year are paid during the subsequent fiscal year. Such earned awards are included in the “Non-Equity Incentive Plan Compensation” column of the Summary Compensation Table.


Outstanding Equity Awards at Fiscal Year-End

The following table sets forth summary information regarding the outstanding equity awards at June 30, 2023 granted to each of our Named Executive Officers.

  Option Awards  Stock Awards 
Name Number of
Securities
Underlying
Unexercised
Options (#)
Exercisable(1)
  Number of
Securities
Underlying
Unexercised
Options (#)
Unexercisable(1)
  Equity
Incentive
Plan Awards:
Number of
Securities
Underlying
Unexercised
Unearned
Options (#)
  Option
Exercise
Price ($)
  Option
Expiration
Date
  Number of
Shares or
Units of
Stock That
Have Not
Vested
(#)(2)
  Market
Value of
Shares
or Units
of Stock
That
Have Not
Vested
($)(3)
  Equity
Incentive
Plan
Awards:
Number of
Unearned
Shares,
Units or
Other
Rights
That Have
Not Vested
(#)(4)
  Equity Incentive
Plan Awards:
Market or Payout
Value of
Unearned Shares,
Units or Other
Rights That Have
Not Vested ($)(3)
 
(a) (b)  (c)  (d)  (e)  (f)  (g)  (h)  (i)  (j) 
D. Deverl Maserang II
Former Principal Executive Officer
  223,713   -   -  $13.13   9/13/2026   -   -   -   - 
   -   -   -   -   -   -   -   231,707   641,828 
   -   -   -   -   -   -   -   112,613   311,938 
   -   -   -   -   -   -   -   117,187   324,608 
   -   -  ��-   -   -   52,515   145,467   -   - 
   -   -   -   -   -   75,075   207,958   -   - 
   -   -   -   -   -   117,187   324,608   -   - 
Scott R. Drake
Former Principal Financial Officer
  88,495   -   -  $6.72   4/01/2027   -   -   -   - 
   -   -   -   -   -   -   -   21,036   58,270 
   -   -   -   -   -   -   -   14,014   38,819 
   -   -   -   -   -   -   -   35,156   97,382 
   -   -   -   -   -   9,536   26,415   -   - 
   -   -   -   -   -   6,671   18,479   -   - 
   -   -   -   -   -   14,014   38,819   -   - 
   -   -   -   -   -   36,765   101,590   -   - 
   -   -   -   -   -   35,156   97,382   -   - 
Amber D. Jefferson
Chief Human Resources Officer
  -   -   -   -   -   -   -   17,578   48,691 
   -   -   -   -   -   32,581   90,249   -   - 
   -   -   -   -   -   17,578   48,691   -   - 
Jared G. Vitemb
Vice President, General Counsel, Secretary and Chief Compliance Officer
  -   -   -   -   -   31,034   85,964   -   - 
   -   -   -   -   -   17,578   48,691   -   - 
   -   -   -   -   -   17,578   48,691   -   - 
Maurice S.J. Moragne(5)
Former Chief Sales Officer
  -   -   -   -   -   -   -   -   - 
Ruben E. Inofuentes(6)
Former Chief Supply Chain Officer
  -   -   -   -   -   -   -   -   - 

(1)Stock options vest in equal ratable installments on each of the first three anniversaries of the date of grant, contingent on continued employment through the applicable vesting date, and subject to accelerated vesting in certain circumstances.
(2)Restricted stock units vest in equal ratable installments on each of the first three anniversaries of the date of grant, contingent on continued employment through the applicable vesting date, and subject to accelerated vesting in certain circumstances.
(3)The market value was calculated by multiplying the closing price of our Common Stock on June 30, 2023 ($2.77) by the number of shares of Common Stock underlying the unvested restricted stock or PBRSUs.
(4)PBRSU awards cliff vest following the expiration of the three-year performance period upon the certification by the Compensation Committee of the Company’s achievement of performance goals for the three-year performance, subject to certain continued employment conditions and subject to the acceleration provisions of the 2017 Plan and restricted stock unit award agreement. At the end of the three-year performance period, the number of PBRSUs that actually vest will be 0% to 200% of the target amount, depending on the extent to which the Company meets or exceeds the achievement of those performance goals measured over the full three-year performance period, with payouts for performance between threshold and target, and between target and maximum determined by reference to a matrix established by the Compensation Committee. The target number of PBRSUs is presented in the table.
(5)Mr. Inofuentes forfeited all then-unvested equity awards upon his separation from the Company in February 2023.
(6)Mr. Moragne forfeited all then-unvested equity awards upon his separation from the Company in February 2023.


Option Exercises and Stock Vested

  Option Awards  Stock Awards 
Name Number of Shares
Acquired on
Exercise (#)
  Value Realized on
Exercise ($)
  Number of Shares
Acquired on
Vesting (#)
  Value Realized on
Vesting ($)
 
(a) (b)  (c)  (d)  (e) 
D. Deverl Maserang II
Former Principal Executive Officer
  -   -   213,505   642,370 
Scott R. Drake
Former Principal Financial Officer
                -                 -   71,183   240,727 
Amber D. Jefferson
Chief Human Resources Officer
  -   -   -   - 
Jared G. Vitemb
Vice President, General Counsel, Secretary and Chief Compliance Officer
  -   -   -   - 
Maurice S.J. Moragne
Former Chief Sales Officer
  -   -   14,103   71,069 
Ruben E. Inofuentes
Former Chief Supply Chain Officer
  -   -   30,793   155,658 

Pension Benefits

None of our Named Executive Officers are entitled to payments or other factors, changesbenefits at, following, or in interest rates, mortality rates, early retirement rates, mixconnection with retirement.

Change in Control and Termination Arrangements

The Company previously entered into change in control severance agreements with each of plan asset investments, investment returnsthe Named Executive Officers other than Mr. Maserang. On June 30, 2023, Mr. Drake, Mr. Vitemb, Ms. Jefferson and certain other key executives other than Mr. Maserang (each, an “Executive”) entered into Severance Agreements with the Company on the revised form approved by the Compensation Committee, each of which superseded and replaced the prior change in control severance agreement in place between the Company and the market valuerelated Executive, effective as of plan assets can affect the level of plan funding, cause volatilityJune 30, 2023.

The severance obligations payable to Mr. Maserang are set forth in the net periodic benefit cost, increase our future funding requirementsMaserang Employment Agreement and requirethat certain Change in Control Severance Agreement with the Company, dated September 6, 2019 (the “Maserang CIC Agreement”), each as further described below.

In connection with their separations from the Company, (i) on March 23, 2023, Mr. Inofuentes entered into a General Release and Separation Agreement with the Company (the “Inofuentes Separation Agreement”), which superseded and replaced his prior Change in Control Severance Agreement with the Company and (ii) on March 25, 2023, Mr. Moragne entered into a General Release and Separation Agreement with the Company (the “Moragne Separation Agreement”), which superseded and replaced his prior Change in Control Severance Agreement with the Company. The severance payments and benefits received by Messrs. Moragne and Inofuentes in connection with their respective terminations are set forth below.


Severance Agreements

Under the Severance Agreements, if an Executive is terminated other than for “Cause” (as defined below) or resigns for “Good Reason” (as defined below) (each, a “Qualifying Termination”), in each case during the period beginning on the effective date of a “Change in Control” (as defined below) and ending on the first anniversary of such date (such period, the “Change in Control Period”), then such Executive will be eligible to receive the following severance benefits (less applicable tax withholdings), as further described in and payable pursuant to the Pension Benefit Guaranty Corporation.

Our sales and distribution network is costly to maintain.
Our sales and distribution network requires a large investment to maintain and operate. Costs include the fluctuating cost of gasoline, diesel and oil, costs associated with managing, purchasing, leasing, maintaining and insuring a fleet of delivery vehicles, the cost of maintaining distribution centers and branch warehouses throughout the country, the cost of our


long-haul distribution, and the cost of hiring, training and managing our sales force. Many of these costs are beyond our control, and many are fixed rather than variable. Some competitors use alternate methods of distribution that fix, control, reduce or eliminate manyterms of the costs associated with our methodrelated Severance Agreement:

Accrued benefits, including earned but unpaid salary, bonus payment for the previous fiscal year (if any), vacation time and reimbursements, payable in a lump sum on the first regular pay date following the Executive’s separation from service;

A payment of an amount equal to two (2) times the sum of base salary and the amount the executive would pay on an annual basis for COBRA, payable in a lump sum within the fifteen (15) day period following the Qualifying Termination;

A lump sum payment equal to a pro-rated portion of target bonus, payable in a lump sum within the fifteen (15) day period following the Qualifying Termination; and

Up to $20,000 in outplacement services.

If an Executive experiences a Qualifying Termination outside of distribution.

We are self-insuredthe Change in Control Period, then such Executive will be eligible to receive the following severance benefits (less applicable tax withholdings), as further described in and our reserves maypayable pursuant to the terms of the related Severance Agreement:

Accrued benefits, including earned but unpaid salary, bonus payment for the previous fiscal year (if any), vacation time and reimbursements, payable in a lump sum payment on the first regular pay date following the Executive’s separation from service, subject to the limitations described in the related Severance Agreement;

An amount equal to the sum of base salary and the amount the executive would pay on an annual basis for COBRA, payable in regular bi-weekly installments on the Company’s regular pay dates, commencing on the first regular pay date following the Executive’s separation from service; and

A payment equal to a pro-rated portion of annual bonus based on actual performance, payable on the date such payments are made to similarly situated employees, but in no event later than September 15 of the year following such Executive’s separation from service.

To receive the severance benefits above upon a Qualifying Termination, the Executive must sign and not be sufficient to cover future claims.

We are self-insured for many risks up to significant deductible amounts. The premiums associated with our insurance continue to increase. General liability, fire, workers’ compensation, directors and officers liability, life, employee medical, dental and vision, and automobile risks presentrevoke a large potential liability. While we accrue for this liability based on historicalgeneral release of claims experience, future claims may exceed claims we have incurredin favor of the Company by the deadline set forth in the past. Shouldrelated Severance Agreement.

In addition, if an Executive experiences a different numberseparation from service on account of claims occur compareddeath or disability, then such Executive or such Executive’s estate, as applicable, will be eligible to what was estimated orreceive the costfollowing severance benefits (less applicable tax withholdings), as further described in and payable pursuant to the terms of the claims increase beyond what was anticipated, reserves recorded may not be sufficientrelated Severance Agreement:

Accrued benefits, including earned but unpaid salary, bonus payment for the previous fiscal year (if any), vacation time and reimbursements, payable in a lump sum payment on the sixtieth (60th) calendar day following the Executive’s separation from service; and

A payment in an amount equal to twelve times the monthly cost for COBRA, payable in a lump sum payment on the sixtieth (60th) calendar day following the Executive’s separation from service.

If any of the payments provided for under the Severance Agreements or otherwise payable to any Executive would constitute “parachute payments” within the meaning of Section 280G of the Internal Revenue Code and the accruals may need to be adjusted accordingly in future periods.

Competitors may be able to duplicate our roasting and blending methods, which could harm our competitive position.
We consider our roasting and blending methods essential to the flavor and richness of our coffees and, therefore, essential to our brand. Because our roasting methods cannot be patented, we would be unable to prevent competitors from copying these methods if such methods became known. If our competitors copy our roasts or blends, the value of our brand may be diminished, and we may lose customers to our competitors. In addition, competitors may be able to develop roasting or blending methods that are more advanced than our production methods, which may also harm our competitive position.
Employee strikes and other labor-related disruptions may adversely affect our operations.
We have union contracts relating to a significant portion of our workforce. Although we believe union relations have been amicable in the past, there is no assurance that this will continue in the future or that we will not be subject to future union organizing activity. There are potential adverse effectsthe related excise tax under Section 4999 of labor disputes with our own employeesthe Internal Revenue Code, then such Executive will be entitled to receive either full payment of benefits or by others who provide warehousing, transportation (lines, truck drivers, 3PL service providers) or cargo handling (longshoremen), both domestic and foreign, of our raw materials or other products. Strikes or work stoppages or other business interruptions could occur if we are unable to renew collective bargaining agreements on satisfactory terms or enter into new agreements on satisfactory terms,such lesser amount which could impair manufacturing and distribution of our products orwould result in a lossno portion of sales, which could adversely impact our business, financial condition orthe benefits being subject to the excise tax, whichever results of operations. The terms and conditions of existing, renegotiated or new collective bargaining agreements could also increase our costs or otherwise affect our ability to fully implement future operational changes to enhance our efficiency or to adapt to changing business needs or strategy.
We could face significant withdrawal liability if we withdraw from participation in the multiemployer pension plans in which we participate.
We participate in two multiemployer defined benefit pension plansgreater amount of after-tax benefits to such Executive.

The Severance Agreements each have a one-year term and one multiemployer defined contribution pension planprovide for certain union employees. We make periodic contributionsautomatic renewal for additional one-year periods thereafter, unless the Company or the related Executive provides notice of non-renewal to these plans to allow them to meet their pension benefit obligations to their participants. the other party.


For purposes of the Severance Agreements:

A “Change in Control” generally will be deemed to have occurred at any of the following times:

oUpon the acquisition by any person, entity or group of beneficial ownership of 50% or more of either the then-outstanding Common Stock or the combined voting power of the Company’s then-outstanding securities entitled to vote generally in the election of directors;

oUpon the approval of the stockholders of the Company of a reorganization, merger, consolidation, complete liquidation, or dissolution of the Company, the sale or disposition of all or substantially all of the assets of the Company or any similar corporate transaction (other than any transaction with respect to which persons who were the stockholders of the Company immediately prior to such transaction continue to hold shares of Common Stock representing at least 50% of the outstanding Common Stock of the Company or such surviving entity or parent or affiliate thereof immediately after such transaction); or

oAt the time individuals who were members of the Board at the effective time of the Severance Agreement (or whose election, or nomination for election, was approved by a vote of at least a majority of the members of the Board at the effective time of the Severance Agreement, but excluding any such individual whose initial election or assumption of office occurs as a result of either an actual or threatened election contest) cease for any reason to constitute at least a majority of the Board.

“Cause” means (a) the willful and continued failure of the executive to perform the executive’s material job duties with the Company and/or its subsidiaries (other than any such failure resulting from becoming disabled), after a written demand for substantial performance is delivered to the executive by the Company which specifically identifies the manner in which the Company believes that the executive has not substantially performed the executive’s duties and the executive has had an opportunity for thirty (30) days to cure such failure after receipt of such written demand; (b) engaging in an act (whether by act or omission) of willful misconduct, fraud, embezzlement, misappropriation or theft which results in damage to the Company and/or its subsidiaries; (c) conviction of the executive of, or the executive pleading guilty or nolo contendere to, a felony (other than a violation of a motor vehicle or moving violation law) or a misdemeanor if such misdemeanor (A) is reasonably expected to or actually causes material damage to the Company and/or its subsidiaries; or (B) involves the commission of a criminal act against the Company and/or its subsidiaries; or (d) the breach by the executive of any material provision of, or inaccuracy in any material respect of any representation made by the executive in, the Company’s policies or any agreement to which the executive is party with the Company or its affiliates, that is not cured within thirty (30) days of written notice from the Company setting forth with reasonable particularity such breach or inaccuracy, provided that, if such breach or inaccuracy is not capable of being cured within 30 days after receipt of such notice, the executive shall not be entitled to such cure period.

“Good Reason” means, without the executive’s consent: (a) a material reduction in the executive’s base salary, other than pursuant to a reduction applicable to all executives or employees of the Company generally; (b) a move of the executive’s primary place of work more than fifty (50) miles from its current location; or (c) a material diminution in the executive’s normal duties and responsibilities, including, but not limited to, the assignment without the executive’s consent of any diminished duties and responsibilities which are inconsistent with the executive’s positions, duties and responsibilities with the Company and/or its subsidiaries on the date of the Severance Agreement, or a materially adverse change in the executive’s reporting responsibilities or titles as in effect on the date of the Severance Agreement, or any removal of the executive from or any failure to re-elect the executive to any of such positions, except in connection with the termination of the executive’s employment for Cause or upon death, the executive becoming disabled, voluntary resignation or other termination of employment by the executive without Good Reason; provided that, in each case, the executive must provide at least thirty (30) days’ prior written notice of termination for Good Reason within thirty (30) days after the occurrence of the event that the executive claims constitutes Good Reason, and the Company shall have the opportunity to cure such circumstances within thirty (30) days of receipt of such notice. For the avoidance of doubt, Good Reason shall not exist hereunder unless and until the 30-day cure period following receipt by the Company of the executive’s written notice expires and the Company shall not have cured such circumstances, and in such case the executive’s employment shall terminate for Good Reason on the day following expiration of such 30-day notice period.


In the event we withdraw from participationof a Named Executive Officer’s termination of employment other than for “Cause” or due to death or “Disability”, or in onethe event of a Named Executive Officer’s “Resignation for Good Reason” (each, as defined in the Severance Agreements), in each case, in connection with a Change in Control or moreThreatened Change in Control, each of these plans, we couldthe Named Executive Officers will be required to make an additional lump-sum contributionentitled to the plan. Our withdrawal liability for any multiemployer pension plan would depend on the extent of the plan’s funding of vested benefits. Future collective bargaining negotiations may result in our withdrawal from the remaining multiemployer pension plans in which we participatepayments and if successful, may result in a withdrawal liability, the amount of which could be material to our results of operations and cash flows.

Restrictive covenants in our credit facility may limit our ability to make investments or otherwise restrict our ability to pursue our business strategies.
Our credit facility contains various covenants that limit our ability to, among other things, make investments; incur additional indebtedness; create, incur, assume or permit any liens on our property; pay dividends under certain circumstances; and consolidate, merge, sell or otherwise dispose of all or substantially all of our assets. Our credit facility also contains financial covenants relating to the maintenance of a fixed charge coverage ratio in certain circumstances. Our ability to meet those covenants may be affected by events beyond our control, and there can be no assurance that we will meet those covenants. The breach of any of these covenants could result in a default under the credit facility.


Future impairment charges could adversely affect our operating results.
We perform an asset impairment analysis on an annual basis or whenever events occur that may indicate possible existence of impairment. Failure to achieve our forecasted operating results, due to weaknessbenefits shown in the economic environment or other factors, and declines in our market capitalization, among other things, could result in impairment of our intangible assets and goodwill and adversely affect our operating results.
We rely on independent certification for a number of our coffee products. Loss of certification could harm our business.
A number of our Artisan coffee products are independently certified as “Rainforest Alliance,” “Organic” and “Fair Trade.” We must comply withtables below.

Maserang Employment Agreement

Under the requirements of independent organizations and certification authorities in orderMaserang Employment Agreement, Mr. Maserang is eligible to label our products as certified. The loss of any independent certifications could adversely affect our reputation and competitive position, which could harm our business.

Possible legislation or regulation intended to address concerns about climate change could adversely affect our results of operations, cash flows and financial condition.
Governmental agencies are evaluating changes in laws to address concerns about the possible effects of greenhouse gas emissions on climate. Increased public awareness and concern over climate change may increase the likelihood of more proposals to reduce or mitigate the emission of greenhouse gases. Laws enacted that directly or indirectly affect our suppliers (through an increasereceive severance payments in the costevent of production or their ability to produce satisfactory products) or our business (through an impact on our inventory availability, cost of goods sold, operations or demand for the products we sell) could adversely affect our business, financial condition, results of operations and cash flows. Compliance with any new or more stringent laws or regulations, or stricter interpretations of existing laws, including increased government regulations to limit carbon dioxide and other greenhouse gas emissions as a result of concern over climate change, could require us to reduce emissions and to incur compliance costs which could affect our profitability or impede the production or distribution of our products, which could affect our results of operations, cash flows and financial condition. In addition, public expectations for reductions in greenhouse gas emissions could result in increased energy, transportation and raw material costs and may require us to make additional investments in facilities and equipment.
Our operating results may have significant fluctuations from period to period which could have a negative effect on our stock price.
Our operating results may fluctuate from period to period as a result of a number of factors, including fluctuationshis termination without Cause (as defined in the price and supply of green coffee, fluctuationsMaserang Employment Agreement) or resignation with Good Reason (as defined in the selling prices of our products, the success of our hedging strategy, competition, changes in consumer preferences, seasonality, our ability to retain and attract customers, our ability to manage inventory and fulfillment operations and maintain gross margin, and period and year-end LIFO inventory adjustments. Fluctuations in our operating results due to these factors or for any other reason could cause our stock price to decline. In addition, price and volume fluctuations in the stock market as a whole may affect the market price of our stock in ways that may be unrelated to our financial performance. Accordingly, we believe that period-to-period comparisons of our operating results are not necessarily meaningful, and such comparisons should not be relied upon as indicators of future performance.
If we experience a deterioration in operating performance, operating losses may recur and, as a result, could lead to increased leverage which may harm our financial condition and results of operations.
We incurred an operating loss in fiscal 2012 and a net loss in fiscal 2013 and 2012. If our current strategies are unsuccessful, we may not achieve the levels of sales and earnings we expect. As a result, we could suffer additional losses in future years and our stock price could decline leading to deterioration in our credit rating, which could limit the availability of additional financing and increase the cost of obtaining financing. In addition, an increase in leverage could raise the likelihood of a financial covenant breach which in turn could limit our access to existing funding under our credit facility.


Our ability to fund the costs associated with the New Facility, satisfy our lease obligations and make payments of principal and interest on our indebtedness depends on our future performance. Should we experience a deterioration in operating performance, we will have less cash inflows from operations available to meet these obligations. In addition, if such deterioration were to lead to the closure of leased facilities, we would need to fund the costs of terminating those leases. If we are unable to generate sufficient cash flows from operations in the future to satisfy these financial obligations, we may be required to, among other things:
seek additional financing in the debt or equity markets;
refinance or restructure all or a portion of our indebtedness;
sell selected assets; or
reduce or delay planned capital or operating expenditures.
Such measures might not be sufficient to enable us to satisfy our financial obligations. In addition, any such financing, refinancing or sale of assets might not be available on economically favorable terms.
Customer quality control problems may adversely affect our brands thereby negatively impacting our sales.
Our success depends on our ability to provide customers with high-quality products and service. Although we take measures to ensure that we sell only fresh products, we have no control over our products once they are purchased by our customers. Accordingly, customers may prepare our products inconsistent with our standards, or store our products for longer periods of time, potentially affecting product quality. Clean water is critical to the preparation of coffee beverages. We have no ability to ensure that our customers use a clean water supply to prepare coffee beverages. If consumers do not perceive our products and service to be of high quality, then the value of our brands may be diminished and, consequently, our operating results and sales may be adversely affected.
Adverse public or medical opinions about caffeine may harm our business and reduce our sales.
Coffee contains caffeine and other active compounds, the health effects of some of which are not fully understood. A number of research studies conclude or suggest that excessive consumption of caffeine may lead to increased adverse health effects. An unfavorable report or other negative publicity or litigation on the health effects of caffeine or other compounds present in coffee could significantly reduce the demand for coffee which could harm our business and reduce our sales. In addition, we could be subject to litigation relating to the existence of such compounds in our coffee which could be costly and adversely affect our business.
Instances or reports linking us to food safety issues could harm our business and lead to potential product recalls or product liability claims.
Selling products for human consumption involves inherent legal risks. Instances or reports of food safety issues involving our products,Maserang Employment Agreement), whether or not accurate, such as unclean water supply, food-borne illnesses, food tampering, food contamination or mislabeling, could damage the value of our brands, negatively impact sales of our products, and potentially lead to product recalls, product liability claims, litigation or damages. A significant product liability claim against us, whether or not successful, or a widespread product recall may reduce our sales and harm our business.
Government regulations affecting the conduct of our business could increase our operating costs, reduce demand for our products or result in litigation.
The conduct of our business is subject to various laws and regulations. These laws and regulations and interpretations thereof are subject to change as a result of political, economic or social events. Such changes may include changes in: food and drug laws, including the Food Safety Modernization Act of 2011 which requires, among other things, that food facilities conduct contamination hazard analyses, implement risk-based preventive controls and develop track-and-trace capabilities; laws relating to product labeling, advertising and marketing practices; laws regarding ingredients used in our products; and increased regulatory scrutiny of, and increased litigation involving, product claims and concerns regarding the effects on health of ingredients in, or attributes of, our products. Any new laws and regulations or changes in existing laws and regulations or the interpretations thereof could require us to change certain of our operational processes and procedures, or implement new ones, and may increase our operating and compliance costs. If we fail to complyconnection with applicable laws and


regulations, we may be subject to civil remedies, including fines, injunctions, recalls or seizures, as well as potential criminal sanctions, which could have a material adverse effect on our results of operations.
Significant additional labeling or warning requirements may increase our costs and adversely affect sales of the affected products.
Various jurisdictions may seek to adopt significant additional product labeling (such as requiring labeling of products that contain genetically modified organisms) or warning requirements or limitations on the availability of our products relating to the content or perceived adverse health consequences of certain of our products. If these types of requirements become applicable to one or more of our major products, they may inhibit sales of such products. In addition, for example, we are subject to the California Safe Drinking Water and Toxic Enforcement Act of 1986 (commonly known as “Proposition 65”), a law which requires that a specific warning appear on any product sold in California that contains a substance listed by that State as having been found to cause cancer or birth defects. The Council for Education and Research on Toxics (“CERT”) has filed suit against a number of companies as defendants, including our subsidiary, Coffee Bean International, Inc., which sell coffee in California for allegedly failing to issue clear and reasonable warnings in accordance with Proposition 65 that the coffee they produce, distribute and sell contains acrylamide. Any action under Proposition 65 would likely seek statutory penalties and costs of enforcement, as well as a requirement to provide warnings and other notices to customers or remove acrylamide from finished products (which may be impossible). If we were required to add warning labels to any of our products or place warnings in certain locations where our products are sold, sales of those products could suffer not only in those locations but elsewhere. Any change in labeling requirements for our products also may lead to an increase in packaging costs or interruptions or delays in packaging deliveries.
Litigation pending against us could expose us to significant liabilities and damage our reputation.
We are currently party to various legal and other proceedings, and additional claims may arise in the future. See Note 22, Commitments and Contingencies, of the Notes to Consolidated Financial Statements included in Part II, Item 8 of this report. Regardless of the merit of particular claims, litigation may be expensive, time-consuming, operationally disruptive and distracting to management, and could negatively affect our brand name and image and subject us to statutory penalties and costs of enforcement. We can provide no assurances as to the outcome of any litigation or the resolution of any other claims against us. An adverse outcome of any litigation or other claim could negatively affect our financial condition, results of operations or liquidity.
Compliance with regulations affecting publicly traded companies has resulted in increased costs and may continue to result in increased costs in the future.
As a publicly traded company, we are subject to laws, accounting and reporting requirements, tax rules and other regulations and requirements, including those imposed by the SEC and NASDAQ. Our efforts to comply with these requirements and regulations have resulted in, and are likely to continue to result in, increased expenses and a diversion of substantial management time and attention from revenue-generating activities to compliance activities. Because these laws and regulations are subject to varying interpretations, their application in practice may evolve over time as new guidance becomes available. This evolution may result in continuing uncertainty regarding compliance matters and additional costs necessitated by ongoing revisions to our disclosure and governance practices. Failure to comply with such regulations could have a material adverse effect on our business and stock price.
Concentration of ownership among our principal stockholders may dissuade potential investors from purchasing our stock, may prevent new investors from influencing significant corporate decisions and may result in a lower trading price for our stock than if ownership of our stock was less concentrated.
As of September 12, 2016, members of the Farmer family or entities controlled by the Farmer family (including trusts) beneficially owned approximately 32.4% of our outstanding common stock, including members of the Farmer family or entities controlled by the Farmer family (including trusts) comprising a group for purposes of Section 13 of the Securities Exchange Act of 1934, as amended (the “Exchange Act”) identified in a Schedule 13D/A filed with the SEC on September 8, 2016. As a result, these stockholders, acting together, may be able to influence the outcome of stockholder votes, including votes concerning the election and removal of directors, the amendment of our charter documents, and approval of significant corporate transactions. This level of concentrated ownership may have the effect of delaying or preventing a change in control. Upon the management or voting controloccurrence of either of the Company. In addition, this significant concentrationaforementioned events, contingent upon the execution and non-revocation of share ownership


may adversely affect the trading pricea general release of our common stock if investors perceive disadvantagesclaims in owning stock in a company with such concentrated ownership.
Future sales of shares by existing stockholders could cause our stock price to decline.
All of our outstanding shares are eligible for sale in the public market, subject in certain cases to limitations under Rule 144 of the Securities Act of 1933, as amended (the “Securities Act”). Also, shares subject to outstanding options and restricted stock under our long-term incentive plan are eligible for sale in the public market to the extent permitted by the provisions of various vesting agreements, our stock ownership guidelines, and Rule 144 under the Securities Act. If these shares are sold, or if it is perceived that they will be sold in the public market, the trading price of our common stock could decline.
Anti-takeover provisions could make it more difficult for a third party to acquire us.
Our Board of Directors has the authority to issue up to 500,000 shares of preferred stock and to determine the price, rights, preferences, privileges and restrictions, including voting rights, of those shares without any further vote or action by stockholders. The rights of the holders of our common stock may be subject to, and may be adversely affected by, the rights of the holders of any preferred stock that may be issued in the future. The issuance of preferred stock may have the effect of delaying, deterring or preventing a change in controlfavor of the Company withoutby Mr. Maserang by the deadline set forth in the Maserang Employment Agreement, Mr. Maserang would be eligible to receive the following severance benefits (less applicable tax withholdings), as further action by stockholdersdescribed in and may adversely affectpayable pursuant to the voting and other rightsterms of the holdersMaserang Employment Agreement:

The sum of his base salary then in effect and his target annual bonus for the fiscal year in which his separation from service occurs, payable in equal installments for a period of twelve (12) months;

Partially Company-paid COBRA coverage under the Company’s health plan for himself and his spouse for a period of twelve (12) months following his separation from service;

An annual bonus for the fiscal year in which his separation from service occurs, based on actual achievement against the Performance Criteria (as defined in the Maserang Employment Agreement), prorated for the period that Mr. Maserang was employed during the relevant fiscal year; and

If such termination occurs after the end of the fiscal year, but before any bonus for the fiscal year is paid, then the payment of any such earned bonus.

Maserang Change in Control Severance Agreement

Pursuant to the Maserang CIC Agreement, in the event (i) a Change in Control occurs and Mr. Maserang’s employment is terminated for reasons other than for Cause (as defined in the Maserang CIC Agreement), disability or death, or Mr. Maserang resigns for Good Reason (as defined in the Maserang CIC Agreement) or (ii) a Threatened Change in Control (as defined below) occurs and Mr. Maserang’s employment is terminated for reasons other than for Cause (as defined in the Maserang CIC Agreement), disability or death, or Mr. Maserang resigns for Good Reason (as defined in the Maserang CIC Agreement) during the Threatened Change in Control Period (as defined below), Mr. Maserang would be eligible to receive the following severance benefits (less applicable tax withholdings), as further described in and payable pursuant to the terms of our common stock.

Further, certain provisionsthe Maserang Employment Agreement:

An amount equal to two (2) times the sum of his base salary and an amount equal to his target bonus for the fiscal year in which the date of termination occurs, payable in a lump sum within thirty (30) days after his separation from service;

A payment equal to one hundred percent (100%) of his target bonus for the fiscal year in which the date of termination occurs, prorated for the period that he was employed during such fiscal year, such payment to be made in a lump sum within thirty (30) days after the end of the Company’s fiscal year in which the date of his termination occurs;

Continuation, for the twenty-four (24) month period following his date of termination, of the health, dental, and life insurance benefits coverage provided to Mr. Maserang at his date of termination, unless Mr. Maserang commences employment prior to the end of the twenty four (24) month period and qualifies for substantially equivalent insurance benefits with his new employer, in which case, such insurance coverages shall end on the date of qualification; and

Up to $25,000 in outplacement services.

For purposes of our charter documents, includingthe Maserang CIC Agreement, a classified board“Threatened Change in Control” means any bona fide pending tender offer for any class of directors, provisions eliminating the ability of stockholdersCompany’s outstanding shares, or any pending bona fide offer to takeacquire the Company by merger or consolidation, or any other pending action by written consent, and provisions limiting the ability of stockholdersor plan to raise matters ateffect, or which would lead to, a meeting of stockholders without giving advance notice, may have the effect of delaying or preventing changesChange in control or managementControl of the Company which could have an adverse effectas determined by the Board as composed on the market price of our stock. In addition, our charter documents do not permit cumulative voting, which may make it more difficult for a third party to gain control of our Board of Directors. Further, we are subject to the anti-takeover provisions of Section 203effective date of the Delaware General Corporation Law,Maserang CIC Agreement. The “Threatened Change in Control Period” means the period commencing on the first day the actions described in the preceding sentence become manifest and shall end when such actions are abandoned or the Change in Control occurs.


Inofuentes Separation Agreement

On February 17, 2023 (“Inofuentes Separation Date”), Mr. Inofuentes’ employment with the Company was terminated without cause. In connection with Mr. Inofuentes’ termination, the Company and Mr. Inofuentes entered into the Inofuentes Separation Agreement, pursuant to which will prohibit us from engagingthe Company agreed to pay Mr. Inofuentes fifty-two (52) weeks of severance pay, equal to his base salary (an aggregate amount of $360,500, less applicable tax withholdings), paid in a “business combination” with an “interested stockholder” for a period of three yearsbi-weekly installments on the Company’s regular pay dates, commencing on the first regular pay date after the Inofuentes Separation Date that is at least eight (8) days after the date of the transaction inInofuentes Separation Agreement. The Inofuentes Separation Agreement also contains a general release of claims from Mr. Inofuentes, as well as other customary provisions.

Moragne Separation Agreement

On February 17, 2023 (“Moragne Separation Date”), Mr. Moragne’s employment with the Company was terminated without cause. In connection with Mr. Moragne’s termination, the Company and Mr. Moragne entered into the Moragne Separation Agreement, pursuant to which the person became an interested stockholder, even if such combination is favored by a majorityCompany agreed to pay Mr. Moragne fifty-two (52) weeks of stockholders, unlessseverance pay, equal to his base salary (an aggregate amount of $372,750, less applicable tax withholdings), paid in bi-weekly installments on the business combination is approved in a prescribed manner. The application of Section 203 also could have the effect of delaying or preventing a change in control or management.


Item 1.B.Unresolved Staff Comments
None. 


Item 2.Properties
Our current production and distribution facilities are as follows:
LocationApproximate Square FeetPurposeStatus
Northlake, TX(1)538,000
Under constructionLeased
Houston, TX330,877
Manufacturing and warehouseOwned
Portland, OR114,000
Manufacturing and distributionLeased
Northlake, IL89,837
Distribution and warehouseLeased
Oklahoma City, OK142,115
Distribution and warehouseOwned
Moonachie, NY41,404
Distribution and warehouseLeased
Torrance, CA(2)665,000
Distribution and warehouseLeased
_____________
(1) Upon completion, the New Facility will house our manufacturing, distribution, product development lab and corporate headquarters. In the fourth quarter of fiscal 2016, we exercised the purchase option under the Lease Agreement to acquire the partially constructed New Facility with a targeted closing date inCompany’s regular pay dates, commencing on the first quarter of fiscal 2017. Construction of and relocation toregular pay date after the New Facility are expected to be completed inMoragne Separation Date that is at least eight (8) days after the third quarter of fiscal 2017. In the interim, we have leased 32,000 square feet of temporary office space in Fort Worth, Texas near the New Facility to house our primary administrative offices. See Note 4, New Facility Lease Obligation,date of the Notes to Consolidated Financial Statements includedMoragne Separation Agreement. The Moragne Separation Agreement also contains a general release of claims from Mr. Moragne, as well as other customary provisions.

Potential Payments Upon Termination or Change in Part II, Item 8 of this report.

(2)
We sold the Torrance facility on July 15, 2016, subject to a lease back as described in Note 24, Subsequent Events, of the Notes to Consolidated Financial Statements included in Part II, Item 8 of this report. As of June 30, 2016, the Torrance facility continued to house certain administrative functions and serve as a distribution facility and a branch warehouse pending transition of the remaining Torrance operations to our other facilities.
As of June 30, 2016, we stage our products in 109 branch warehouses throughout the contiguous United States. These branch warehouses and our distribution centers, taken together, represent a vital part of our business, but no individual branch warehouse is material to the business as a whole. Our branch warehouses vary in size from approximately 1,000 to 50,000 square feet.
Approximately 52% of our facilities are leased with a variety of expiration dates through 2021. The lease on the Portland facility expires in 2018 and has options to renew up to an additional 10 years.
We calculate our utilization for all of our production facilities on an aggregate basis based on the number of product pounds manufactured during the actual number of production shifts worked during an average week, compared to the number of product pounds that could be manufactured based on the maximum number of production shifts that could be operated during the week (assuming three shifts per day, seven days per week), in each case, based on our current product mix. Utilization rates for our production facilities were approximately 90%, 66% and 65% during the fiscal years ended June 30, 2016, 2015 and 2014, respectively. The higher utilization rate in fiscal 2016 was primarily due to wind-down of production at our Torrance facility and the addition of those production volumes to our Portland and Houston production facilities.
We believe that our Portland and Houston production facilities, together with our existing distribution centers and branch warehouses, will provide adequate capacity for our current operations pending completion of the New Facility. In the event of significant increases in demand that precede the completion of and relocation to the New Facility, we may be required to increase staffing, including through temporary labor and overtime, use third-party manufacturers, lease additional production facilities or some combination of those alternatives or others to satisfy demand.
Item 3.Legal Proceedings
For information regarding legal proceedings in which we are involved, see Note 22, Commitments and Contingencies, of the Notes to Consolidated Financial Statements included in Part II, Item 8 of this report.

Item 4.Mine Safety Disclosures
Not applicable.


PART II
Item 5.Market for Registrant’s Common Equity, Related Stockholder Matters and Issuer Purchases of Equity Securities
Market Information
Our common stock trades on the NASDAQ Global Select Market under the symbol “FARM.” Control

The following table sets forth the quarterly highestimated payments and low sales prices ofbenefits that would be provided to our common stock as reported by NASDAQNamed Executive Officers upon termination or a change in control, assuming the trigger event took place on June 30, 2023, except for each quarter duringMessrs. Moragne and Inofuentes, for whom the last two fiscal years.

  Year Ended June 30, 2016 Year Ended June 30, 2015
  High Low High Low
1st Quarter $28.16
 $20.90
 $29.10
 $20.29
2nd Quarter $32.94
 $26.99
 $31.86
 $26.01
3rd Quarter $31.63
 $24.04
 $32.50
 $22.72
4th Quarter $32.50
 $26.69
 $25.96
 $23.39
On September 12, 2016,table reports what Messrs. Inofuentes and Moragne received in connection with their respective departures from the last sale price reportedCompany on NASDAQ for our common stock was $33.46 per share.
Holders
As of September 12, 2016, there were approximately 2,250 holders of record. Determination of holders of record is based upon the number of record holdersFebruary 17, 2023. The estimated payments and individual participants in security position listings. This does not include persons whose stock is in nominee or “street name” accounts through brokers.
Dividends
The Company’s Board of Directors has omitted the payment of a quarterly dividend since the third quarter of fiscal 2011. The amount, if any, of dividendsbenefits that may have been provided to be paidMessrs. Drake and Maserang in the future will depend uponevent a termination or change in control took place on June 30, 2023 are provided below because Messrs. Drake and Maserang were still employed by the Company’s then available cash, anticipated cash needs, overall financial condition, credit agreement restrictions, future prospects for earningsCompany on such date and cash flows,until their separations from the Company October 1, 2023 and September 30, 2023, respectively. The actual amount of payments and benefits can only be determined at the time of such a termination or change in control, and therefore the actual amounts may vary from the estimated amounts in the tables below. Descriptions of how such payments and benefits are determined under the circumstances, material conditions and obligations applicable to the receipt of payments or benefits and other material factors regarding such agreements, as well as other relevant factors. For a descriptionmaterial assumptions that we have made in calculating the estimated compensation, follow these tables.


Name Termination
Without Cause or
Resignation for
Good Reason
Outside of Change
in Control Period(1)
  Termination
Without Cause or
Resignation for
Good Reason Within
Change in Control
Period(2)
  Termination
Without Cause or
Resignation for
Good Reason Within
Threatened Change
in Control Period(3)
  Termination for
Cause or
Resignation Absent
Good Reason
 
D. Deverl Maserang II(4)
Former Principal Executive Officer
                
Base Salary Continuation(5)  1,428,000   2,856,000   2,856,000   714,000 
Annual Incentive Payments(6)  0   0   0   0 
Value of Accelerated Stock Options  0   0   0   0 
Value of Accelerated Restricted Stock  0   678,033   678,033   0 
Value of Accelerated PBRSUs  0   1,278,374   1,278,374   0 
Health and Dental Insurance  16,042   32,084   32,084   0 
Outplacement Services  0   25,000   25,000   0 
Total Pre-Tax Benefit  1,444,042   4,869,491   4,869,491   714,000 
Scott R. Drake(7)
Former Principal Financial Officer
Base Salary Continuation(8)  463,500   927,000   -   0 
Annual Incentive Payments(6)  0   0   -   0 
Value of Accelerated Stock Options  0   0   -   0 
Value of Accelerated Restricted Stock  0   282,685   -   0 
Value of Accelerated PBRSUs  0   194,471   -   0 
Health and Dental Insurance  24,887   49,754   -   0 
Outplacement Services  0   20,000   -   0 
Total Pre-Tax Benefit  488,387   1,424,156   -   0 
Amber D. Jefferson
Chief Human Resources Officer
Base Salary Continuation(8)  336,000   672,000   -   0 
Annual Incentive Payments(6)  0   0   -   0 
Value of Accelerated Stock Options  0   0   -   0 
Value of Accelerated Restricted Stock  0   138,940   -   0 
Value of Accelerated PBRSUs  0   48,691   -   0 
Health and Dental Insurance  8,319   16,638   -   0 
Outplacement Services  0   20,000   -   0 
Total Pre-Tax Benefit  344,319   896,269   -   0 
Jared G. Vitemb
Vice President, General Counsel, Secretary and
Chief Compliance Officer
Base Salary Continuation(8)  315,000   630,000   -   0 
Annual Incentive Payments(6)  0   0   -   0 
Value of Accelerated Stock Options  0   0   -   0 
Value of Accelerated Restricted Stock  0   183,346   -   0 
Value of Accelerated PBRSUs  0   0   -   0 
Health and Dental Insurance  0   0   -   0 
Outplacement Services  0   20,000   -   0 
Total Pre-Tax Benefit  315,000   833,346   -   0 


(1)“Change in Control Period” has the meaning set forth in the Severance Agreements, except with regard to Mr. Maserang. With regard to Mr. Maserang, “Change in Control” period refers to the twenty-four (24) month period following the effective date of a Change in Control (as defined in the Maserang Employment Agreement). The amounts reflected in this column for Mr. Maserang assume that his separation does not occur during a Threatened Change in Control Period (as defined above).
(2)“Change in Control Period” has the meaning set forth in the Severance Agreements, except with regard to Mr. Maserang. With regard to Mr. Maserang, “Change in Control” period refers to the twenty-four (24) month period following the effective date of a Change in Control (as defined in the Maserang Employment Agreement).
(3)Payments made in connection with a “Threatened Change in Control” are only applicable to Mr. Maserang.
(4)As discussed above, Mr. Maserang’s employment with the Company was terminated without cause effective September 30, 2023. In connection with the Maserang Separation, the Company paid to Mr. Maserang $1,428,000, payable in accordance with the terms of the Maserang Employment Agreement. As previously disclosed, in connection with the Maserang Separation, the Company agreed to accelerate the vesting of 35,806 then-unvested restricted stock units, effective as of September 30, 2023.
(5)Amounts include Mr. Maserang’s base salary as well as 100% of his target bonus.  
(6)Because the Company did not meet its fiscal 2023 Adjusted EBITDA target, no annual incentives are payable pursuant to the Severance Agreements, the Maserang CIC Agreement or the Maserang Employment Agreement.
(7)As discussed above, Mr. Drake’s employment with the Company was terminated without cause effective October 1, 2023. In connection with the Drake Separation, the Company paid to Mr. Drake $463,500, payable in accordance with the Severance Agreement entered into between Mr. Drake and the Company on June 30, 2023.
(8)Amounts include Named Executive Officer’s base salary as well as amounts such Named Executive Officer would pay on an annual basis for COBRA.

Value of Accelerated Vesting of Equity Awards

Under the terms of the creditNamed Executive Officers’ outstanding awards, in the event of death or “Disability” (as defined in the applicable plan):

a pro rata portion of any unvested restricted stock units will vest; and

outstanding PBRSU awards will remain outstanding and the participant will be eligible to earn a pro-rata portion of the number of PBRSU awards that would have been earned based on actual performance through the end of the performance period (amounts shown in the tables above assume 100% of the target PBRSU awards were earned at the end of the performance period).


Under the applicable award agreement, if a Change in Control (as defined in the applicable plan) occurs and a participant’s awards are not continued, converted, assumed or replaced by the Company or a parent or subsidiary of the Company, or a Successor Entity (as defined in the applicable plan), such awards will become fully exercisable and/or payable, and all forfeiture, repurchase and other restrictions on such awards will lapse immediately prior to such Change in Control. In the paymentcase of dividends, see Liquidity, Capital Resources and Financial Condition included in Part II, Item 7 of this report, and Note 15, Bank Loan,PBRSU awards, the vested shares will be a prorated number of the Notes to Consolidated Financial Statements includedtarget PBRSU awards. The amounts in Part II, Item 8 of this report.

Equity Compensation Plan Information
This information appearsthe tables above assume all awards were continued, converted, assumed, or replaced in Equity Compensation Plan Informationincludedconnection with a Change in Part III, Item 12 of this report.
Performance Graph
The following graph depictsControl.

If there is a comparison ofChange in Control and the total cumulative stockholder return on our common stock for each of the last five fiscal years relative to the performance of the Russell 2000 Index, the Value Line Food Processing Index and a peer group index. The graph assumes an initial investment of $100.00 at the beginning of the five year period and that all dividends paidNamed Executive Officer’s employment is terminated by companies included in these indices have been reinvested.

Because no published peer group is similar to the Company's portfolio of business, the Company created a peer group index that includeswithout Cause or by the participant for Good Reason, in either case, within twenty-four months following companies: B&G Foods, Inc., Boulder Brands, Inc., Coffee Holding Co. Inc., Dunkin' Brands Group, Inc., National Beverage Corp., SpartanNash Company, Inventure Foods, Inc. and Treehouse Foods, Inc. the Change in Control:

100% of any unvested restricted stock or restricted stock units will vest; and

the target number of PBRSU awards will be deemed to have immediately vested as of the date of termination of service.

The companies in the peer group index are in the same industry as Farmer Bros. Co. with product offerings that overlap with the Company's product offerings. Boulder Brands, Inc. is no longer a public company and has been excluded from the peer group index in fiscal 2016.

The historical stock price performancevalue of the Company’s common stockaccelerated awards shown in the performance graph below istables above was calculated using the closing price of our Common Stock on June 30, 2023 ($2.77).

Under the applicable plan, the Plan Administrator also has discretionary authority regarding accelerated vesting of awards in certain circumstances. The amounts in the tables above assume such discretionary authority was not necessarily indicativeexercised.

Company Benefit Plans

The tables and discussion above do not reflect the value of future stock price performance. The Russell 2000 Index,accrued and unused paid days off, disability benefits under the Value Line Food Processing IndexCompany’s group health plan, the value of retiree medical, vision and dental insurance benefits, and group life insurance, if any, that would be paid and/or provided to each Named Executive Officer following termination of employment, because, in each case, these benefits are generally available to all regular Company employees similarly situated in age, years of service and date of hire and do not discriminate in favor of the Named Executive Officers.

CEO to Median Employee Pay Ratio

In accordance with applicable SEC rules, we are providing the ratio of the annual total compensation of our CEO to the median of the annual total compensation of our other employees, excluding our CEO. For fiscal 2023, as calculated in accordance with the requirements of Item 402(c)(2)(x) of Regulation S-K, the annual total compensation of our CEO was $2,214,740 as disclosed in the “Summary Compensation Table”, the median of the annual total compensation of our employees other than the CEO was $58,817, and the peer group index are included for comparative purposes only. They do not necessarily reflect management's opinion that such indices are an appropriate measure forratio of our CEO’s annual total compensation to the relative performancemedian of the stock involved, and they are not intended to forecast or be indicative of possible future performanceannual total compensation of our common stock.


Comparisonother employees was 38 to 1.

We believe the ratio presented above is a reasonable estimate calculated in a manner consistent with Item 402(u) of Five-Year Cumulative Total Return
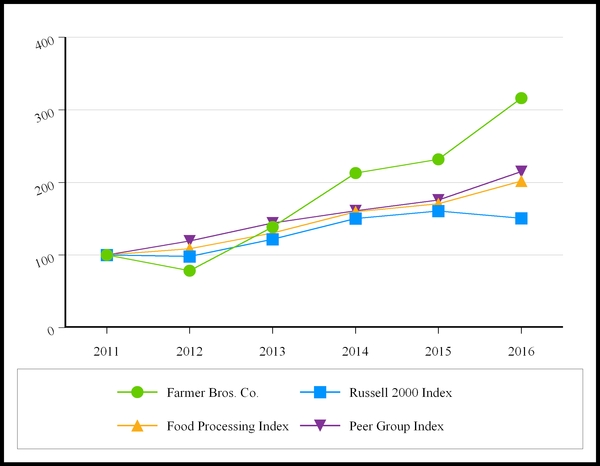
Farmer Bros. Co., Russell 2000 Index, Value Line Food Processing Index and Peer Group Index
(Performance Results ThroughRegulation S-K. We determined our median employee based on total direct compensation paid to all of our employees (consisting of approximately 1,172 individuals active as of June 30, 2016)
  2011
 2012
 2013
 2014
��2015
 2016
Farmer Bros. Co. $100.00
 $78.50
 $138.66
 $213.12
 $231.76
 $316.17
Russell 2000 Index $100.00
 $97.92
 $121.63
 $150.38
 $160.61
 $150.70
Value Line Food Processing Index $100.00
 $108.65
 $130.34
 $159.51
 $170.55
 $202.07
Peer Group Index $100.00
 $119.31
 $144.21
 $160.87
 $175.66
 $215.12
Source: Value Line Publishing, LLC


Item 6.Selected Financial Data
The following selected consolidated financial data should be read in conjunction with Management's Discussion and Analysis of Financial Condition and Results of Operations, Risk Factors, and our consolidated financial statements and the notes thereto included elsewhere in this report. The historical results do not necessarily indicate results expected for any future period.
 Year Ended June 30,
(In thousands, except per share data)2016 2015 2014 2013 2012
Consolidated Statement of Operations Data:         
Net sales$544,382
 $545,882
 $528,380
 $513,869
 $498,701
Cost of goods sold$335,907
 $348,846
 $332,466
 $328,693
 $332,309
Restructuring and other transition expenses(1)$16,533
 $10,432
 $
 $
 $
Net gains from sale of Spice Assets(2)$(5,603) $
 $
 $
 $
Net (gains) losses from sales of assets$(2,802) $394
 $(3,814) $(4,467) $(268)
Income (loss) from operations$8,179
 $3,284
 $8,916
 $372
 $(21,846)
Income (loss) from operations per common share—diluted$0.49
 $0.20
 $0.56
 $0.02
 $(1.41)
Income tax (benefit) expense(3)$(79,997) $402
 $705
 $(825) $(347)
Net income (loss)(4)$89,918
 $652
 $12,132
 $(8,462) $(26,576)
Net income (loss) per common share—basic$5.45
 $0.04
 $0.76
 $(0.54) $(1.72)
Net income (loss) per common share—diluted$5.41
 $0.04
 $0.76
 $(0.54) $(1.72)
Cash dividends declared per common share$
 $
 $
 $
 $
          
 June 30,
(In thousands)2016 2015 2014 2013 2012
Consolidated Balance Sheet Data:         
Total assets(5)$368,991
 $240,943
 $266,177
 $244,136
 $257,916
Deferred income taxes$80,786
 $751
 $414
 $467
 $861
Capital lease obligations(6)$2,359
 $5,848
 $9,703
 $12,168
 $15,867
Long-term borrowings under revolving credit facility$
 $
 $
 $10,000
 $
Earn-out payable-RLC acquisition(7)$100
 $200
 $
 $
 $
Long-term derivative liabilities$
 $25
 $
 $1,129
 $
Total liabilities(8)$186,397
 $150,932
 $151,313
 $162,298
 $174,364
_____________ 
(1) See Note 3, Corporate Relocation Plan, of the Notes to Consolidated Financial Statements included in Part II, Item 8 of this report.
(2) See Note 5, Sale of Spice Assets, of the Notes to Consolidated Financial Statements included in Part II, Item 8 of this report.
(3) Includes non-cash income tax benefit of $80.3 million in fiscal 2016 from the release of valuation allowance on deferred tax assets. See Note 20, Income Taxes, of the Notes to Consolidated Financial Statements included in Part II, Item 8 of this report.
(4) Includes: (a) beneficial effect of liquidation of LIFO inventory quantities of $4.2 million, $4.9 million, $0, $1.1 million and $14.2 million in fiscal 2016, 2015, 2014, 2013 and 2012, respectively; and (b) $5.6 million in impairment losses on goodwill and intangible assets and $4.6 million in pension withdrawal expense in fiscal 2012.
(5) Includes $28.1 million in assets at June 30, 2016 recorded in "Property, plant and equipment" to offset New Facility lease obligation recorded in "Other long-term liabilities"related the New Facility included in "Property, plant and equipment" as the deemed owner of the New Facility.
(6) Excludes imputed interest.


(7) See Note 2, Acquisition, of the Notes to Consolidated Financial Statements included in Part II, Item 8 of this report.
(8) Includes $28.1 million New Facility lease obligation at June 30, 2016 recorded in “Other long-term liabilities.”
See Note 19, Other Long-Term Liabilities, of the Notes to Consolidated Financial Statements included in Part II, Item 8 of this report.


Item 7.Management’s Discussion and Analysis of Financial Condition and Results of Operations
The following discussion contains forward-looking statements that involve risks and uncertainties. Our actual results could differ materially from those anticipated in these forward-looking statements as a result of many factors. The results of operations2023) for the fiscal yearsyear ended June 30, 2016, 20152023. Total direct compensation was calculated using internal human resources records and 2014 are not necessarily indicative ofincluded base salary (wages earned based on our payroll records), cash incentive awards earned for the results that may be expected for any future period. The following discussion should be read in combination with the consolidated financial statementsperiod, and the notes thereto included in Part II, Item 8annual grant date fair value of this reportlong-term incentive awards during fiscal 2023.

Because the SEC rules for identifying the median employee and withcalculating the Risk Factors” described in Part I, Item 1A of this report.


Overview
We arepay ratio based on that employee’s annual total compensation allow companies to adopt a national coffee roaster, wholesaler and distributor of coffee, tea and culinary products manufactured under supply agreements, under our owned brands, as well as under private labels on behalf of certain customers. We were founded in 1912, incorporated in California in 1923, and reincorporated in Delaware in 2004. We operate in one business segment.
We serve a wide variety of customers, from small independent restaurantsmethodologies, to apply certain exclusions, and foodservice operators to large institutional buyers like restaurantsmake reasonable estimates and convenience store chains, hotels, casinos, hospitals,assumptions that reflect their compensation practices, the pay ratio reported by other companies may not be comparable to the pay ratio reported above, as other companies may have different employment and gourmet coffee houses, as well as grocery chains with private brandcompensation practices and consumer-branded coffee products. Through our sustainability, stewardship, environmental efforts,may utilize different methodologies, exclusions, estimates and leadershipassumptions in calculating their own pay ratios.


Pay Versus Performance

As required by Item 402(v) of Regulation S-K, we are not only committed to servingproviding the finest products available, consideringfollowing information regarding the cost needs ofrelationship between our financial performance and the customer, but also insist on their sustainable cultivation, manufacture and distribution whenever possible. Our product categories consist of a robust line of roast and ground coffee, including organic, Direct Trade, DTVS and sustainably-produced offerings; frozen liquid coffee; flavored and unflavored iced and hot teas; culinary products including gelatins and puddings, soup bases, dressings, gravy and sauce mixes, pancake and biscuit mixes, jellies and preserves, and coffee-related products such as coffee filters, sugar and creamers; spices; and other beverages including cappuccino, cocoa, granitas, and ready-to-drink iced coffee. We offer a comprehensive approach“compensation actually paid” to our customersprincipal executive officer (“PEO”) and our non-PEO NEOs (on average). Compensation actually paid, or “CAP,” is an amount calculated using methodology prescribed by providingSEC rules and differs from the compensation actually received by our named executive officers. The Compensation Committee does not only a breadth of high-quality products, but also value-added services such as market insight, beverage planning, and equipment placement and service.

We operate production facilities in Portland, Oregon and Houston, Texas. Distribution takes place out of our Portland facility as well as three separate distribution centers in Northlake, Illinois; Oklahoma City, Oklahoma; and Moonachie, New Jersey. As of June 30, 2016, the Torrance facility continued to house certain administrative functions, serveutilize CAP as a distribution facilitybasis for making compensation decisions. For further information concerning our compensation philosophy and branch warehouse pending transition of the remaining Torrance operations to our other facilities. Upon completion, the New Facility will serve as a production facility and distribution center for our products.
Our products reach our customers primarily in two ways: through our nationwide DSD network of 450 delivery routes and 109 branch warehouses at June 30, 2016, or direct-shipped via common carriers or third-party distributors. We operate a large fleet of trucks and other vehicles to distribute and deliver our products, andhow we rely on 3PL service providers for our long-haul distribution. DSD sales are made “off-truck” to our customers at their places of business.
Corporate Relocation
In an effort to make the Company more competitive and better positioned to capitalize on growth opportunities, in fiscal 2015 we began the process of relocating our corporate headquarters, product development lab, and manufacturing and distribution operations from Torrance, California to a new facility housing these operations currently under construction in Northlake, Texas (the “Corporate Relocation Plan”). Approximately 350 positions were impacted as a result of the Torrance facility closure.


The significant milestones associatedalign executive compensation with our Corporate Relocation Plan are as follows:
EventDate
Announced Corporate Relocation PlanQ3 fiscal 2015
Transitioned coffee processing and packaging from Torrance production facility
and consolidated them with Houston and Portland production facilities
Q4 fiscal 2015
Moved Houston distribution operationsperformance, please refer to Oklahoma City distribution centerQ4 fiscal 2015
Entered into the lease agreement and development management agreement for New FacilityQ1 fiscal 2016
Commenced construction of New FacilityQ1 fiscal 2016
Transitioned primary administrative offices from Torrance to temporary leased offices in Fort Worth, TexasQ1-Q2 fiscal 2016
Sold Spice Assets to HarrisQ2 fiscal 2016
Principal design work completed on New FacilityQ3 fiscal 2016
Completed transition services to Harris and ceased spice processing and packaging at Torrance facilityQ4 fiscal 2016
Entered into purchase and sale agreement to sell Torrance facilityQ4 fiscal 2016
Exercised purchase option on New FacilityQ4 fiscal 2016
Closed sale of Torrance facilityQ1 fiscal 2017
Close on purchase option for New FacilityEstimated Q1 fiscal 2017
Exit from Torrance facilityEstimated Q2 fiscal 2017
Completion of construction and relocation to New FacilityEstimated Q3 fiscal 2017
See Liquidity, Capital Resources and Financial Condition below for further details of the impact of these activities on our financial condition and liquidity.
Recent Developments
On September 9, 2016, we entered into an asset purchase agreement to acquire substantially all of the assets of China Mist Brands, Inc., for an aggregate purchase price of $11.3 million, with $10.8 million to be paid in cash at closing and $0.5 million to be paid as earnout if certain sales levels are achieved in the calendar years of 2017 and 2018. The transaction is expected to close during the second quarter of fiscal 2017. We anticipate that the acquisition of China Mist will give us a greater presence in the high-growth premium tea industry. See Note 24, Subsequent Events, of the Notes to Consolidated Financial Statements included in Part II, Item 8 of this report.
Important Factors Affecting Our Results of Operations
We have identified factors that affect our industry and business which we expect to also play an important role in our future growth and profitability. Some of these factors include:
Compensation Discussion & Analysis.

Pay Versus Performance Table

        Average
Summary
 
  Average  Value of Initial Fixed
$100 Investment Based
on:
     Company 
Year
(1)
 
 Summary
Compensation
Table Total
for PEO
($)
  Compensation
Actually Paid
to PEO(2)(3)
($)
  Compensation
Table Total for
Non-PEO
NEOs
($)
  Compensation
Actually Paid
to Non-PEO
NEOs(2)(3)
($)
  Total
Shareholder
Return
($)
  Peer
Group
TSR(4)
($)
  Net
Income
(GAAP)(5)
($)
 
  Selected
Measure:
Adjusted
EBITDA(5)(6)
($)
 
(a) (b)  (c)  (d)  (e)  (f)  (g)  (h)  (i) 
2023  2,214,740   201,865   700,306   307,900   37.74   115.92   (79,180)  (16,380)
2022  3,292,209   (1,451,470)  915,235   365,754   63.90   112.95   (16,255)  19,059 
2021  3,186,683   6,428,881   797,159   1,156,355   172.89   146.03   (42,225)  16,611 

(1)
DemographicThe Principal Executive Officer (“PEO”) in all three reporting years is D. Deverl Maserang II. The non-PEO NEOs in the 2023 reporting year are Scott R. Drake, Amber D. Jefferson, Ruben E. Inofuentes, Maurice S.J. Moragne and Channel Trends.Our success is dependent upon our ability to develop new productsJared G. Vitemb. The non-PEO NEOs in response to demographicthe 2022 reporting year are Scott R. Drake, Ruben E. Inofuentes, Maurice S.J. Moragne and other trends to better competeAmber D. Jefferson. The non-PEO NEOs in areas such as premium coffeethe 2021 reporting year are Scott R. Drake, Ruben E. Inofuentes, Maurice S.J. Moragne, Jennifer H. Brown and tea, including expansion of our product portfolio by investing resources in what we believe to be key growth categories, including the launch of our Metropolitan™ single cup coffee, expanded seasonal coffee and specialty beverages, new shelf-stable coffee products, new hot teas, the introduction of Collaborative Coffee™ branded products into the retail grocery channel, and the packaging redesign and product portfolio optimization of our Un Momento® retail branded product line.
Ronald J. Friedman.
Fluctuations in Green Coffee Prices. Our primary raw material is green coffee, an agricultural commodity traded on the Commodities and Futures Exchange that is subject to price fluctuations. Over the past five years, coffee “C” market price per pound ranged from approximately $1.02 to $2.90. The coffee “C” market price as of June 30, 2016 and 2015 was $1.46 and $1.32 per pound, respectively. The price and availability of green coffee directly impacts our results of operations. For additional details, see Risk Factors in Part I, Item 1A of this report.

(2)The following table details the applicable adjustments that were made to determine compensation actually paid to our PEO and non-PEO NEOs (on average), calculated in accordance with Item 402(v) of Regulation S-K. To determine CAP, the amounts reported in the “Total” column of the Summary Compensation Table (“SCT”) for the applicable year were adjusted as follows:

  2023  2022  2021 
     Average     Average     Average 
  PEO
($)
  Non-
PEO
NEOs
($)
  PEO
($)
  Non-
PEO
NEOs
($)
  PEO
($)
  Non-
PEO
NEOs
($)
 
Summary Compensation Table (SCT) Total  2,214,740   700,306   3,292,209   915,235   3,186,683   797,159 
Less Stock Award Value Reported in SCT for the Covered Year  (1,499,994)  (294,996)  (2,006,755)  (368,747)  (1,899,995)  (303,491)
Plus Year End Fair Value of Equity Awards Granted During the Covered Year that Remain Outstanding and Unvested as of Last Day of the Covered Year  649,216   103,429   1,056,305   233,293   4,939,608   574,404 
Plus Year over Year Change in Fair Value as of the Last Day of the Covered Year of Outstanding and Unvested Equity Awards Granted in Prior Years  (461,188)  (37,495)  (3,177,131)  (305,802)  202,586   75,339 
Plus Fair Value as of Vesting Date of Equity Awards Granted and Vested in the Covered Year  0   0   0   0   0   0 
Plus Year over Year Change in Fair Value as of the Vesting Date of Equity Awards Granted in Prior Years that Vested During the Covered Year  (700,909)  (52,201)  (132,863)  (81,645)  0   24,021 
Less Fair Value at the End of the Prior Year of Equity Awards that Failed to Meet Vesting Conditions in the Covered Year  0   (111,143)  (483,235)  (26,579)  0   (11,076)
Compensation Actually Paid  201,865   307,900   (1,451,470)  365,754   6,428,881   1,156,355 


(3)
Hedging Strategy. We are exposedThe assumptions we used to market risk of losses due to changes in coffee commodity prices. Our business model strives to reducecalculate the impact of green coffee price fluctuations on our financial resultsvalues for restricted stock performance and to protect and stabilize our margins, principally through customer arrangements and derivative instruments, as further explained in Note 7, Derivative Instruments, of the Notes to Consolidated Financial Statementsperformance share awards included in Part II, Item 8the calculation of this report. In each of fiscal 2016 and fiscal 2015, a lower percentage of our roast and ground coffee volume was based on a price schedule and a higher percentage was sold“compensation actually paid” did not differ materially from those used to customers under commodity-based pricing arrangements as compared to fiscal 2014.
calculate grant date fair value for such awards.
Sustainability. With an increasing focus on sustainability across the coffee and foodservice industry, and particularly from the customers we serve, it is important for us to embrace sustainability across our operations, in the quality of our products, as well as, how we treat our coffee growers. We believe that our collective efforts in measuring our social and environmental impact, creating programs for waste, water and energy reduction, promoting partnerships in our supply chain that aim at supply chain stability and food security, and focusing on employee engagement place us in a unique position to help retailers and foodservice operators create differentiated coffee programs that can include sustainable supply chains, direct trade purchasing, training and technical assistance, recycling and composting networks, and packaging material reductions.
Supply Chain Efficiencies and Competition. In order to compete effectively and capitalize on growth opportunities, we must continue to evaluate and undertake initiatives to reduce costs and streamline our supply chain. We undertook the Corporate Relocation Plan, in part, to pursue improved production efficiency to allow us to provide a more cost-competitive offering of high-quality products. We continue to look for ways to deploy our personnel, systems, assets and infrastructure to create or enhance stockholder value. Areas of focus have included corporate staffing and structure, methods of procurement, logistics, inventory management, supporting technology, and real estate assets.

(4)The peer group (“Peer Group”) selected by the Company for purposes of the total shareholder return (“TSR”) benchmarking for the pay versus performance disclosures is the same peer group the Company uses for its performance graph in the Annual Report on Form 10-K pursuant to Item 201(e) of Regulation S-K. The Peer Group consists of Beyond Meat, Inc., Bridgford Foods Corporation, Calavo Growers, Inc., Freshpet, Inc., Hostess Brands, Inc., J&J Snack Foods Corp., John B Sanfilippo & Son, Inc., MGP Ingredients, Inc., NewAge, Inc., SunOpta, Inc., The Duckhorn Portfolio, Inc., The Simply Good Foods Company, Utz Brands, Inc., Vital Farms, Inc. and Whole Earth Brands, Inc.

(5)Values shown are in thousands.

(6)We present Adjusted EBITDA in our quarterly earnings releases, which is a non-GAAP financial measurement. We use Adjusted EBITDA as a performance measure, which permits a comparative assessment of our operating performance relative to our performance based upon GAAP results while isolating the effects of some items that vary from period to period without any correlation to core operating performance or that vary widely among similar companies. For further information regarding the calculation of adjusted EBITDA for fiscal 2023, 2022 and 2021, refer to our Annual Report on Form 10-K and the Compensation Discussion and Analysis in the Definitive Proxy Statement for each fiscal year.

Financial Performance Measures

The following is a list of financial performance measures, which in our assessment represent the most important measures used by the Company to link compensation actually paid to the Company’s PEO and non-PEO NEOs to Company performance for fiscal 2023:

Adjusted EBTIDA

TSR

Both adjusted EBITDA and TSR are used for purposes of determining payouts for the 2023 PBRSU Grants under our 2023 LTI plan. Our Company Selected Measure, Adjusted EBITDA, is also used as the sole metric in the 2023 STI Plan. Please refer to the Compensation Discussion and Analysis for a further description of these metrics and how they are used in the Company’s executive compensation programs.

Relationship Between Pay and Performance

The graph below reflects, for each fiscal year presented, the relationship between the compensation actually paid to our PEO and non-PEO NEOs (on average), the Company’s cumulative indexed TSR and our peer group TSR:

The graph below reflects, for each fiscal year presented, the relationship between the compensation actually paid to our PEO and our non-PEO NEOs (on average) and the Company’s net income (loss).


The graph below reflects, for each fiscal year presented, the relationship between the compensation actually paid to our PEO and our non-PEO NEOs (on average) and the Company-Selected Measure, Adjusted EBITDA.

Director Compensation

Non-Employee Director Compensation

The compensation program for our non-employee directors is intended to fairly compensate our non-employee directors for the time and effort required of a director given the size and complexity of the Company’s operations. Portions of the compensation program utilize our stock in order to further align the interests of the directors with all other stockholders of the Company and to motivate the directors to focus on the long-term financial interest of the Company. Directors who are Company employees are not paid any additional fees for serving on the Board or for attending Board meetings.


The Company’s non-employee director compensation program is as follows:

Form of Non-Employee
Director Compensation
Director Compensation Program
Annual Board Cash Retainer
Market Opportunities. We have invested$60,000
Committee Chair Cash Retainer$10,000 for Nominating and Corporate Governance Committee, Strategy and Capital Allocation Committee, and Technology Committee

$15,000 for Compensation Committee

$20,000 for Audit Committee
Non-Chair Committee Cash Retainer$7,500 for Compensation Committee, Nominating and Corporate Governance Committee, Strategy and Capital Allocation Committee, and Technology Committee

$10,000 for Audit Committee
Chairman of the Board Cash Retainer$50,000, with no additional fees for committee service
Meeting Fees$2,000, only paid for Board or committee meetings in excess of seven in a fiscal year
Annual Equity Award Value$95,000
Expense ReimbursementPayment or reimbursement of reasonable travel expenses from outside the futuregreater Dallas-Fort Worth area, in accordance with Company policy, incurred in connection with attendance at Board and committee meetings, as well as payment or reimbursement of amounts incurred in connection with director continuing education
OtherAd hoc committee fees are determined from time to time by the Board, as needed

The annual grant of restricted stock is generally made on the date on which the Company holds its annual meeting of stockholders or such other date as the Board may determine, in each case, subject to any blackout period under the Company’s insider trading policy. In fiscal 2023, the annual grant of restricted stock units were made on February 10, 2023. Each of Waheed Zaman, Alfred Poe, Stacy Loretz-Congdon, Allison Boersma and John Robinson received a grant of 23,023 restricted stock units based on the $4.47 closing price per share of our Common Stock on February 10, 2023 (for an aggregate amount of $102,912.81). The 2022 Annual Meeting was moved such that it occurred 13 months following the 2021 Annual Meeting. Accordingly, these grants included an additional month of equity compensation to compensate those Board members who served for 13 months, rather than 12 months for the period ending at the 2022 Annual Meeting. Christopher Mottern received a grant of 12,397 restricted stock units based on the $4.47 closing price per share of our Common Stock on February 10, 2023 for an aggregate amount of $55,414.59. Mr. Mottern received a smaller grant, with a vesting date of June 30, 2023 because the Company had agreed that he would resign from the Board on June 30, 2023 pursuant to the October 30, 2022 Cooperation Agreement (the “Cooperation Agreement”) between the Company and the Stockholder Parties, as that term is defined in the Cooperation Agreement. David Pace received a grant of 21,252 restricted stock units based on the $4.47 closing price per share of our Common Stock on February 10, 2023 (for an aggregate amount of $94,966.14). Mr. Pace received a smaller grant because he joined the Board following the 2022 Annual Meeting and did not, therefore, need to be compensated for an additional month of service. Bradley Radoff received a grant of 24,794 restricted stock units based on the $4.47 closing price per share of our Common Stock on February 10, 2023 (for an aggregate amount of $110,129.18). Mr. Radoff received a larger grant because he joined the Board on November 1, 2022 pursuant to the Cooperation Agreement but did not receive an equity grant for his approximately 2.5 months of service prior to January 12, 2023. Except for Mr. Mottern’s grant, Such grants cliff vest on the earlier of the 2023 Annual Meeting or the one-year anniversary of the grant date, subject to continued service to the Company through the vesting date and the acceleration provisions of the Farmer Bros. Co. Amended and Restated 2017 Long-Term Incentive Plan (the “2017 Plan”) and the restricted stock unit award agreement.

Stock Ownership Guidelines

Under the Company’s stock ownership guidelines, a non-employee director is expected to own and hold during his or her service as a Board member a number of shares of Common Stock with a value of at least four times their annual retainer, and is not permitted to sell any shares of Common Stock received as grants under the Company’s long-term incentive plans unless and until the non-employee director achieves and maintains this threshold share ownership level.


Shares of Common Stock that count toward satisfaction of these guidelines include (to the extent applicable):

(i) shares of Common Stock owned outright by the non-employee director and his or her immediate family members who share the same household, whether held individually or jointly; (ii) restricted stock or restricted stock units (whether or not the restrictions have lapsed); (iii) shares of Common Stock held in trust for the benefit of the non-employee director or his or her family; and (iv) shares of Common Stock issuable under vested options held by the non-employee director.

Director Compensation Table

The following table sets forth non-employee director compensation for fiscal 2023:

Director Fees
Earned or
Paid in
Cash ($)
  Stock
Awards
($)(1)
  Total ($) 
Allison M. Boersma  105,375   102,913   208,288 
Stacy Loretz-Congdon  93,875   102,913   196,788 
Christopher P. Mottern(2)  128,500   55,415   183,915 
Alfred Poe  98,555   102,913   201,468 
John D. Robinson  104,125   102,913   207,038 
Waheed Zaman  93,875   102,913   196,788 
Bradley L. Radoff  37,500   110,129   147,629 
David A. Pace  31,250   94,966   126,216 
Charles Marcy(3)  70,042   N/A   70,042 

(1)Represents the full grant date fair value of restricted stock granted to each non-employee director in fiscal 2023, computed in accordance with FASB ASC Topic 718. A discussion of the assumptions used in calculating the amounts in this column may investbe found in acquisitions that we believe will enhance long-term stockholder value and complement or enhanceNote 16 to our product, equipment, service and/or distribution offerings to existing and new customer bases. For example, subsequent toaudited consolidated financial statements for the fiscal year end,ended June 30, 2023, included in our Annual Report on September 9, 2016,Form 10-K for the fiscal year ended June 30, 2023, except that, as required by applicable SEC rules, we entered into an asset purchase agreementdid not reduce the amounts in this column for any risk of forfeiture relating to acquire substantially allservice-based (time-based) vesting conditions.
(2)Mr. Mottern was appointed as Chairman of the assets of China MistBoard in January 2020, and served as described in Note 24, Subsequent Events,Chairman of the Notes to Consolidated Financial Statements included in Part II, Item 8 of this report. We anticipate thatBoard until his resignation, which became effective on June 30, 2023. Effective immediately following Mr. Mottern’s resignation, on June 30, 2023, the acquisition of China Mist will give us a greater presence in the high-growth premium tea industry. Additionally, in the first quarter of fiscal 2015 we acquired substantially allBoard appointed Alfred Poe as Chairman of the assets of Rae' Launo Corporation (“RLC”)Board.
(3)Mr. Marcy did not receive an equity grant following the 2022 Annual Meeting because he did not stand for re-election to the Board at the 2022 Annual Meeting. Mr. Marcy was appointed to the Board in 2013 and served as described in Note 2, Acquisition, ofa director until the Notes to Consolidated Financial Statements included in Part II, Item 8 of this report.2022 Annual Meeting.
Capacity Utilization. We calculate our utilization for all

Director Indemnification

Under the Company’s Certificate of our production facilities on an aggregate basis based onIncorporation and By-Laws, the numbercurrent and former directors are entitled to indemnification and advancement of product pounds manufactured during the actual number of production shifts worked during an average week, compared to the number of product pounds that could be manufactured based on the maximum number of production shifts that could be operated during the week (assuming three shifts per day, seven days per week), in each case, based on our current product mix. Utilization rates for our production facilities were approximately 90%, 66% and 65% during the fiscal years ended June 30, 2016, 2015 and 2014, respectively. The higher utilization rate in fiscal 2016 was due to the wind-down of production at our Torrance facility and the addition of those production volumes to our Portland and Houston production facilities. Since most of our customers do not commit to long-term firm production schedules, we are unable to forecast the level of customer orders with certainty to maximize utilization of manufacturing capacity. As a result, our production facility capacity utilization generally remains less than 100%.


Results of Operations
Fiscal Years Ended June 30, 2016 and 2015
Financial Highlights
Gross profit increased 5.8% to $208.5 million in fiscal 2016expenses from $197.0 million in fiscal 2015.
Gross margin increased to 38.3% in fiscal 2016 from 36.1% in fiscal 2015.
Income from operations increased 149.1% to $8.2 million in fiscal 2016 from $3.3 million in fiscal 2015.
Net income was $89.9 million, or $5.41 per diluted common share, in fiscal 2016, primarily due to non-cash income tax benefit of $80.3 million from the release of valuation allowance on deferred tax assets, compared to $0.7 million, or $0.04 per diluted common share, in fiscal 2015.
Fiscal 2016 Strategic Initiatives
In fiscal 2016, we undertook initiatives to reduce costs, streamline our supply chain, improve the breadth of products and services we provide to our customers, and better position the Company to attract new customers. These initiatives included the following:
Corporate Relocation Plan. We continued to execute on the Corporate Relocation Plan that we initiated in the third quarter of fiscal 2015 by executing on the milestones described above under Corporate Relocation.
Third-Party Logistics. During the second halffullest extent permitted by Delaware corporate law. The Board has approved a form of fiscal 2016, we replaced our long-haul fleet operations with 3PL. We expect that this transportation arrangement will reduce our fuel consumption and empty trailer miles, while improving our intermodal and trailer cube utilization.
Vendor Managed Inventory. During the second half of fiscal 2016, weIndemnification Agreement (“Indemnification Agreement”) to be entered into a vendor managed inventory arrangementbetween the Company and its directors and officers. The Board may from time to time authorize the Company to enter into additional indemnification agreements with a third party. We anticipate that the use of vendor managed inventory arrangements will result in a reduction in raw material, finished goodsfuture directors and logistics costs, while improving packaging innovation and fulfillment.
DSD Reorganization. In fiscal 2016, we continued our efforts to improve efficiencies in our sales and product offerings. During the second half of fiscal 2016, we began to realign our DSD organization by undertaking initiatives intended to streamline communication and decision making, enhance branch organizational structure, and improve customer focus, including toward a comprehensive training program for all DSD team members to strengthen customer engagement. In fiscal 2016, we executed a regional test of our first advertising and lead generation campaign designed to improve our new customer acquisition rate within our DSD network.
Branch Consolidation and Property Sales. In an effort to streamline our branch operations, in the fourth quarter of fiscal 2016 we sold two Northern California branch properties, with a third Northern California property under contract for sale, and we acquired a new branch facility in Hayward, California.
Introduction of Collaborative Coffee™ and Redesign of Un Momento® Branded Retail Products. In an effort to address what we believe to be unmet consumer needs and improve margin within the retail grocery environment, in fiscal 2016, we launched Collaborative Coffee™, a new brand of ethically sourced, whole bean direct trade coffees into the retail grocery channel. In addition, we completed a packaging redesign and product portfolio optimization of our Un Momento® retail branded product line.
Net Sales
Net sales in fiscal 2016 decreased $1.5 million, or 0.3%, to $544.4 million from $545.9 million in fiscal 2015 primarily due to a decrease in net sales of coffee and tea products, partially offset by an increase in net sales of spice products and other beverages. Net sales in fiscal 2016 included $9.7 million in price decreases to customers utilizing commodity-based pricing arrangements, where the changes in the green coffee commodity costs are passed on to the customer, as compared to $9.7 million in price increases to customers utilizing such arrangements in fiscal 2015.


The change in net sales in fiscal 2016 compared to fiscal 2015 was due to the following:
(In millions)
Year Ended June 30,
 2016 vs. 2015
Effect of change in unit sales$14.4
Effect of pricing and product mix changes(15.9)
Total decrease in net sales$(1.5)
Unit sales increased 3.6% in fiscal 2016 as compared to fiscal 2015, but average unit price decreased by 3.8% resulting in a decrease in net sales of 0.3%. The increase in unit sales was primarily due to a 3.4% increase in unit sales of roast and ground coffee products, which accounted for approximately 61% of our total net sales, while the decrease in average unit price was primarily due to the lower average unit price of roast and ground coffee products primarily driven by the pass-through of lower green coffee commodity purchase costs to our customers. In fiscal 2016, we processed and sold approximately 90.7 million pounds of green coffee as compared to 87.7 million pounds of green coffee processed and sold in fiscal 2015. There were no new product category introductions in fiscal 2016 or 2015 which had a material impact on our net sales.
The following table presents net sales aggregated by product category for the respective periods indicated:
  Year Ended June 30,
  2016 2015
(In thousands) $ % of total $ % of total
Net Sales by Product Category:        
Coffee (Roast & Ground) $332,533
 61% $336,129
 60%
Coffee (Frozen Liquid) 35,933
 7% 37,428
 7%
Tea (Iced & Hot) 25,096
 4% 27,172
 5%
Culinary 54,036
 10% 54,208
 11%
Spice(1) 35,789
 6% 32,336
 6%
Other beverages(2) 57,690
 11% 54,933
 10%
     Net sales by product category 541,077
 99% 542,206
 99%
Fuel surcharge 3,305
 1% 3,676
 1%
     Net sales $544,382
 100% $545,882
 100%
____________
(1) Spice product net sales included $3.2 million in sale of inventory to Harris at cost in fiscal 2016 upon conclusionofficers of the transition services provided by the Company in connection with the sale of Spice Assets.Company.


(2) Includes all beverages

The Indemnification Agreements provide, among other than coffee and tea.

Cost of Goods Sold
Cost of goods sold in fiscal 2016 decreased $12.9 million, or 3.7%, to $335.9 million, or 61.7% of net sales, from $348.8 million, or 63.9% of net sales, in fiscal 2015. The decrease in cost of goods sold as a percentage of net sales in fiscal 2016 was primarily due to lower coffee commodity costs compared to the same period in the prior fiscal year, supply chain efficiencies realized primarily through the consolidation of our former Torrance coffee production volumes into our Houston manufacturing facility, and other supply chain improvements. The average Arabica "C” market price of green coffee decreased 24.8% in fiscal 2016. Inventories decreased at the end of fiscal 2016 compared to fiscal 2015 primarily due to production consolidation and the sale of processed and unprocessed inventories to Harris at cost upon conclusion of the transition services provided by the Company in connection with the sale of Spice Assets. As a result, a beneficial effect of liquidation of LIFO inventory quantities in the amount of $4.2 million was recorded in cost of goods sold in fiscal 2016 reducing cost of goods sold by the same amount. In fiscal 2015 $4.9 million in beneficial effect of liquidation of LIFO inventory quantities was recorded.


Gross Profit
Gross profit in fiscal 2016 increased $11.4 million, or 5.8%, to $208.5 million from $197.0 million in the prior fiscal year and gross margin increased to 38.3% in fiscal 2016 from 36.1% in the prior fiscal year. The increase in gross profit was primarily due to lower coffee commodity costs compared to the same period in the prior fiscal year, supply chain efficiencies realized primarily through the consolidation of our former Torrance coffee production volumes into our Houston manufacturing facility and other supply chain improvements. Gross profit in fiscal 2016 and 2015 included the beneficial effect of the liquidation of LIFO inventory quantities in the amount of $4.2 million and $4.9 million, respectively.
Operating Expenses
In fiscal 2016, operating expenses increased $6.5 million, or 3.4%, to $200.3 million or 36.8% of net sales, from $193.8 million, or 35.5% of net sales, in fiscal 2015, primarily due to higher general and administrative expenses and restructuring and other transition expenses associated with the Corporate Relocation Plan as compared to the prior fiscal year. General and administrative expenses and restructuring and other transition expenses increased $10.8 million and $6.1 million, respectively, in fiscal 2016, as compared to the prior fiscal year, partially offset by a $1.6 million decrease in selling expenses. The increase in general and administrative expenses in fiscal 2016 as compared to fiscal 2015 was primarily due to higher accruals for incentive compensation to eligible employees as compared to a reduction in accrual for incentive compensation to eligible employees in the prior fiscal year, an increase in employee and retiree medical costs, workers' compensation expense and the write-off of a long-term loan receivable that was deemed uncollectible. The increase in general and administrative expenses was partially offset by $5.6 million in net gains from sale of Spice Assets and $2.8 million in net gains from sales of assets, primarily real estate, as compared to $(0.4) million in net losses from sales of assets, primarily vehicles, in fiscal 2015. The decrease in selling expenses in fiscal 2016 as compared to fiscal 2015 was primarily due to lower depreciation and amortization expense and lower vehicle, fuel and freight expenses, partially offset by higher accruals for incentive compensation for eligible employees as compared to a reduction in accrual for incentive compensation to eligible employees in the prior fiscal year.
Income from Operations
Income from operations in fiscal 2016 was $8.2 million as compared to $3.3 million in fiscal 2015 primarily due to higher gross profit, net gains from the sale of Spice Assets and certain real estate assets and lower selling expenses, partially offset by higher restructuring and other transition expenses associated with the Corporate Relocation Plan and general and administrative expenses.
Total Other Income (Expense)
Total other income in fiscal 2016 was $1.7 million compared to total other expense of $(2.2) million in fiscal 2015, primarily due to net gains on derivative instruments and investments of $0.3 million in fiscal 2016 compared to net losses on derivative instruments and investments of $(3.3) million in fiscal 2015. The net gains and net losses on derivative instruments and investments in fiscal 2016 and fiscal 2015, respectively, were primarily due to mark-to-market net gains and net losses on coffee-related derivative instruments not designated as accounting hedges. Net gains on such coffee-related derivative instruments in fiscal 2016 were $0.3 million compared to net losses of $(3.0) million in fiscal 2015. In fiscal 2016 and 2015, we recognized $(0.6) million and $(0.3) million in net losses on coffee-related derivative instruments designated as cash flow hedges due to ineffectiveness.
Income Taxes
In fiscal 2016, we released $80.3 million of the valuation allowance on deferred tax assets, resulting in unreserved deferred tax assets of $90.2 million at June 30, 2016 and a non-cash reduction in income tax expense, or a tax benefit of $80.0 million in fiscal 2016 as compared to income tax expense of $(0.4) million in fiscal 2015. In fiscal 2016, total deferred tax assets were largely unchanged. Deferred tax assets related to our defined benefit pension plans and retiree medical plan increased due to losses recorded in OCI, and net operating loss related to deferred tax assets declined as losses were used to offset current income. In fiscal 2015, deferred tax assets increased primarily due to losses recorded in Other comprehensive income (loss) ("OCI") related to coffee-related derivative instruments, our defined benefit pension plans and retiree medical plan.


Since 2009, a full valuation allowance has been maintained to offset our deferred tax assets. In the fourth quarter of fiscal 2016, after analyzing the available positive and negative evidence, we concluded that it is more likely than not that we will utilize a portion of our tax loss carryforwards. In this analysis, we considered the following items of positive evidence: twelve quarters of our cumulative gain position and our forecasted future earnings; completion of parts of our restructuring plan which significantly reduced costs; and sale of our Torrance facility which is expected to result in a significant gain in the first quarter of fiscal 2017. We also considered the following items of negative evidence: large pension related OCI losses that we recorded in the prior twelve quarters and potential expiration of certain state unused net operating loss carryforwards and credits.
We cannot conclude that certain state net operating loss carryforwards and tax credit carryovers will be utilized before expiration. Accordingly, we will maintain a valuation allowance of $1.6 million to offset these deferred tax assets. We will continue to monitor all available evidence, both positive and negative, in determining whether it is more likely than notthings, that the Company will, realize its remaining deferred tax assets.
The Internal Revenue Service is currently auditing our tax years ended June 30, 2013to the extent permitted by applicable law, indemnify and 2014.
Net Income
Ashold harmless each indemnitee if, by reason of his or her corporate status as a resultdirector, officer, trustee, general partner, managing member, fiduciary, employee or agent of the foregoing factors, net incomeCompany or of any other enterprise which such person is or was $89.9 million,serving at the request of the Company, such indemnitee was, is or $5.41 per diluted common share, in fiscal 2016 as compared to $0.7 million, or $0.04 per diluted common share, in fiscal 2015.

Fiscal Years Ended June 30, 2015 and 2014
Overview
In fiscal 2015, we continued our efforts to improve efficiencies in our sales and product offerings. These efforts included targeted selling efforts in untapped markets, sales and marketing training for all of our RSRs, and the discontinuation over 300 SKUs, excluding the SKUs added from the RLC Acquisition. We also continued to expand our product portfolio by investing resources in what we believeis threatened to be key growth categories, including the launch of our Metropolitan™ single cup coffee, expanded seasonal coffee and specialty beverages, new shelf-stable coffee products, and new hot teas.
Net Sales
Net salesmade, a party to or a participant (as a witness or otherwise) in fiscal 2015 increased $17.5 million,any threatened, pending or 3.3%, to $545.9 million from $528.4 million in fiscal 2014. The increase in net sales in fiscal 2015 included $9.7 million in price increases to customers utilizing commodity-based pricing arrangements, where the changescompleted proceeding, whether formal or informal, whether brought in the green coffee commodity costs are passed on to the customer.
The change in net sales in fiscal 2015 compared to fiscal 2014 was due to the following:
(In millions)
Year Ended June 30,
 2015 vs. 2014
Effect of change in unit sales$(2.0)
Effect of pricing and product mix changes19.5
Total increase in net sales$17.5
Unit sales decreased (0.2)% in fiscal 2015 as compared to fiscal 2014, fully offset by a 3.5% increase in average unit price resulting in an increase in net sales of 3.3%. The decrease in unit sales was primarily due to a (0.7)% decrease in unit sales of roast and ground coffee products, which accounted for approximately 61% of our total net sales, while the increase in average unit price was primarily due to the higher average unit price of roast and ground coffee products primarily driven by the pass-through of higher green coffee commodity purchase costs to our customers. In fiscal 2015, we processed and sold approximately 87.7 million pounds of green coffee as compared to approximately 88.3 million pounds of green coffee processed and sold in fiscal 2014. There were no new product category introductions in fiscal 2015 or 2014 which had a material impact on our net sales.


The following table presents net sales aggregated by product category for the respective periods indicated:
  Year Ended June 30,
  2015 2014
(In thousands) $ % of total $ % of total
Net Sales by Product Category:        
Coffee (Roast & Ground) $336,129
 61% $319,251
 60%
Coffee (Frozen Liquid) 37,428
 7% 37,840
 7%
Tea (Iced & Hot) 27,172
 5% 28,452
 5%
Culinary 54,208
 10% 56,567
 11%
Spice 32,336
 6% 31,876
 6%
Other beverages(1) 54,933
 10% 50,572
 10%
     Net sales by product category 542,206
 99% 524,558
 99%
Fuel surcharge 3,676
 1% 3,822
 1%
     Net sales $545,882
 100% $528,380
 100%
____________
(1) Includes all beverages other than coffee and tea.
Cost of Goods Sold
Cost of goods sold in fiscal 2015 increased $16.4 million, or 4.9%, to $348.8 million, or 63.9% of net sales, from $332.5 million, or 62.9% of net sales in fiscal 2014. The increase in cost of goods sold as a percentage of net sales in fiscal 2015 was primarily due to a 16.2% increase in the average Arabica "C” market price of green coffee. Inventories decreased at the end of fiscal 2015 compared to fiscal 2014 and, therefore, a beneficial effect of liquidation of LIFO inventory quantities in the amount of $4.9 million was recorded in cost of goods sold in fiscal 2015 reducing cost of goods sold by the same amount. No beneficial effect of liquidation of LIFO inventory quantities was recorded in fiscal 2014.
Gross Profit
Gross profit in fiscal 2015 increased $1.1 million, or 0.6%, to $197.0 million from $195.9 million in fiscal 2014, but gross margin decreased to 36.1% in fiscal 2015 from 37.1% in the prior fiscal year. The increase in gross profit was primarily due to the increase in net sales from higher prices of roast and ground coffee, frozen liquid coffee, tea products, spice and other beverages. The decrease in gross margin was primarily due to a 16.9% increase in the average “C” market price of green coffee as compared to the prior fiscal year. Gross profit in fiscal 2015 included the beneficial effectright of the liquidationCompany or otherwise and whether of LIFO inventory quantitiesa civil, criminal, administrative or investigative nature, against all expenses, judgments, fines, penalties and amounts paid in the amount of $4.9 million.
Operating Expenses
In fiscal 2015, operating expenses increased $6.8 million,settlement actually and reasonably incurred by him or 3.6%, to $193.8 million,her or 35.5% of net sales, from $187.0 million,on his or 35.4% of net sales, in fiscal 2014, primarily due to $10.4 million in restructuring and other transition expenses associated with the Corporate Relocation Plan. In fiscal 2015 selling expenses decreased $(3.3) million and general and administrative expenses decreased $(4.6) million as compared to fiscal 2014. The decrease in selling expenses in fiscal 2015 as compared to fiscal 2014 was primarily due to lower depreciation and amortization expense, bonus expense and salaries-related expense offset by an increase in workers' compensation expense. The decrease in general and administrative expenses in fiscal 2015 as compared to fiscal 2014 was primarily due to lower depreciation and amortization expense, bonus expense, consulting expense and the absence of expensesher behalf in connection with such proceeding. In addition, the restatementIndemnification Agreements provide for the payment, advancement or reimbursement of expenses incurred by the indemnitee in connection with any such proceeding to the fullest extent permitted by applicable law. The Indemnification Agreements also provide that, in the event of a Potential Change in Control (as defined in the Indemnification Agreements), the Company will, upon request by the indemnitee, create a trust for the benefit of the indemnitee and fund such trust in an amount sufficient to satisfy expenses reasonably anticipated to be incurred in connection with investigating, preparing for, participating in or defending any proceedings, and any judgments, fines, penalties and amounts paid in settlement in connection with any proceedings. The Indemnification Agreements do not exclude any other rights to indemnification or advancement of expenses to which the indemnitee may be entitled, including any rights arising under the Certificate of Incorporation or By-Laws of the Company, or the General Corporation Law of the State of Delaware. The Company is also obligated to maintain directors’ and officers’ liability insurance coverage, including tail coverage under certain prior period financial statementscircumstances.

Compensation Committee Report

The Compensation Committee has reviewed and discussed the Compensation Discussion and Analysis with management and, based on the review and discussions, recommended to the Board of Directors that the Compensation Discussion and Analysis be included in ourthis Amendment and incorporated by reference in the Company’s Annual Report on Form 10-K for the fiscal year ended June 30, 2013. This decrease in general and administrative expenses was partially offset by an increase in salaries-related expense, employee and retiree medical expense, ESOP compensation expense and workers' compensation expense. Operating expenses in fiscal 2015 also reflected $(0.4) million in net losses from sales of assets, primarily vehicles, as compared to $3.8 million in net gains from sales of assets, primarily real estate, in fiscal 2014.


Income from Operations
Income from operations in fiscal 2015 was $3.3 million compared to $8.9 million in fiscal 2014 primarily due to restructuring and other transition expenses associated with the Corporate Relocation Plan and lower gross profit partially offset by the decrease in selling expenses and general administrative expenses.
Total Other Income (Expense)
Total other expense in fiscal 2015 was $(2.2) million compared to total other income of $3.9 million in fiscal 2014, primarily due to net losses on derivative instruments and investments of $(3.3) million compared to net gains on derivative instruments and investments of $3.1 million in fiscal 2014. The net losses and net gains on derivative instruments and investments in fiscal 2015 and fiscal 2014, respectively, were primarily due to mark-to-market net losses and net gains, respectively, on coffee-related derivative instruments not designated as accounting hedges. Net losses on such coffee-related derivative instruments in fiscal 2015 were $(3.0) million compared to net gains on such coffee-related derivative instruments in fiscal 2014 of $2.7 million. In each of the fiscal years ended June 30, 2015 and 2014, we recognized $(0.3) million in losses on coffee-related derivative instruments designated as cash flow hedges due to ineffectiveness.
Income Taxes
In fiscal 2015, we recorded income tax expense of $0.4 million compared to $0.7 million in fiscal 2014. Income tax expense in fiscal 2015 was primarily attributable to cash taxes paid.
As of June 30, 2015, the Company has generated approximately $0.6 million of excess tax benefits related to stock compensation, the benefit of which will be recorded to additional paid in capital if and when realized.
Net Income
As a result of the foregoing factors, net income was $0.7 million, or $0.04 per diluted common share, in fiscal 2015 compared to $12.1 million, or $0.76 per diluted common share, in fiscal 2014.

Non-GAAP Financial Measures
In addition to net income determined in accordance with U.S. generally accepted accounting principles (“GAAP”), we use the following non-GAAP financial measures in assessing our operating performance:
“Non-GAAP net income” is defined as net income excluding the impact of:
restructuring and other transition expenses;
net gains and losses from sales of assets; and
income tax benefit, including the release of valuation allowance on deferred tax assets.
“Non-GAAP net income per diluted common share” is defined as Non-GAAP net income divided by the weighted-average number of common shares outstanding, inclusive of the dilutive effect of common equivalent shares outstanding during the period.


“Adjusted EBITDA” is defined as net income excluding the impact of:
income taxes;
interest expense;
depreciation and amortization expense;
ESOP and share-based compensation expense;
non-cash impairment losses;
non-cash pension withdrawal expense;
other similar non-cash expenses;
restructuring and other transition expenses; and
net gains and losses from sales of assets.
“Adjusted EBITDA Margin” is defined as Adjusted EBITDA expressed as a percentage of net sales.
Restructuring and other transition expenses are expenses that are directly attributable to the Corporate Relocation Plan, consisting primarily of employee retention and separation benefits, facility-related costs and other related costs such as travel, legal, consulting and other professional services.
We believe these non-GAAP financial measures provide a useful measure of the Company’s operating results, a meaningful comparison with historical results and with the results of other companies, and insight into the Company's ongoing operating performance. Further, management utilizes these measures, in addition to GAAP measures, when evaluating and comparing the Company's operating performance against internal financial forecasts and budgets.
In the fourth quarter of fiscal 2016, we modified the calculation of Non-GAAP net income and Non-GAAP net income per diluted common share to exclude the non-cash income tax benefit from the release of valuation allowance on deferred tax assets. We believe this non-cash income tax benefit is not reflective of our ongoing operating results and that excluding the income tax benefit will help investors with comparability of our results. The historical presentation of the non-GAAP measures was not affected by this modification.
Non-GAAP net income, Non-GAAP net income per diluted common share, Adjusted EBITDA and Adjusted EBITDA Margin, as defined by us, may not be comparable to similarly titled measures reported by other companies. We do not intend for non-GAAP financial measures to be considered in isolation or as a substitute for other measures prepared in accordance with GAAP.
Set forth below is a reconciliation of reported net income to Non-GAAP net income and reported net income per common share-diluted to Non-GAAP net income per diluted common share:


  Year Ended June 30,
(In thousands) 2016 2015 2014
Net income, as reported $89,918
 $652
 $12,132
Restructuring and other transition expenses 16,533
 10,432
 
Net gains from sale of Spice Assets (5,603) 
 
Net (gains) losses from sales of assets (2,802) 394
 (3,814)
Non-cash income tax benefit, including release of valuation allowance on deferred tax assets (80,439) 
 
Non-GAAP net income $17,607
 $11,478
 $8,318
       
Net income per common share—diluted, as reported $5.41
 $0.04
 $0.76
Impact of restructuring and other transition expenses $1.00
 $0.64
 $
Impact of net gains from sale of Spice Assets $(0.34) $
 $
Impact of net (gains) losses from sales of assets $(0.17) $0.03
 $(0.24)
Impact of release of valuation allowance on deferred tax assets $(4.84) $
 $
Non-GAAP net income per diluted common share $1.06
 $0.71
 $0.52

Set forth below is a reconciliation of reported net income to Adjusted EBITDA: 
  Year Ended June 30,
(In thousands) 2016 2015 2014
Net income, as reported $89,918
 $652
 $12,132
Income tax (benefit) expense (79,997) 402
 705
Interest expense 425
 769
 1,258
Depreciation and amortization expense 20,774
 24,179
 27,334
ESOP and share-based compensation expense 4,342
 5,691
 4,692
Restructuring and other transition expenses 16,533
 10,432
 
Net gains from sale of Spice Assets (5,603) 
 
Net (gains) losses from sales of assets (2,802) 394
 (3,814)
Adjusted EBITDA $43,590
 $42,519
 $42,307
Adjusted EBITDA Margin 8.0% 7.8% 8.0%

Liquidity, Capital Resources and Financial Condition
Credit Facility
We maintain a $75.0 million senior secured revolving credit facility (the “Revolving Facility”) with JPMorgan Chase Bank, N.A. and SunTrust Bank (collectively, the “Lenders”), with a sublimit on letters of credit and swingline loans of $30.0 million and $15.0 million respectively. The Revolving Facility includes an accordion feature whereby we may increase the Revolving Commitment by up to an additional $50.0 million, subject to certain conditions. Advances are based on our eligible accounts receivable, eligible inventory, and the value of certain real property and trademarks, less required reserves. The commitment fee ranges from 0.25% to 0.375% per annum based on average revolver usage. Outstanding obligations are collateralized by all of our assets, excluding certain real property not included in the borrowing base, machinery and equipment (other than inventory), and our preferred stock portfolio. Borrowings under the Revolving Facility bear interest based on average historical excess availability levels with a range of PRIME - 0.25% to PRIME + 0.50% or Adjusted LIBO Rate + 1.25% to Adjusted LIBO Rate + 2.00%. We are subject to a variety of affirmative and negative


covenants of types customary in an asset-based lending facility, including financial covenants relating to the maintenance of a fixed charge coverage ratio in certain circumstances, and the right of the Lenders to establish reserve requirements, which may reduce the amount of credit otherwise available to us. We are allowed to pay dividends, provided, among other things, certain excess availability requirements are met, and no event of default exists or has occurred and is continuing as of the date of any such payment and after giving effect thereto. The Revolving Facility expires on March 2, 2020.
At June 30, 2016, we were eligible to borrow up to a total of $58.6 million under the Revolving Facility and had outstanding borrowings of $0.1 million, utilized $11.9 million of the letters of credit sublimit, and had excess availability under the Revolving Facility of $46.6 million. At June 30, 2016, the weighted average interest rate on our outstanding borrowings under the Revolving Facility was 1.64%. At June 30, 2016, we were in compliance with all of the restrictive covenants under the Revolving Facility.
At August 31, 2016, we had estimated outstanding borrowings of $0.2 million, utilized $11.9 million of the letters of credit sublimit, and had excess availability under the Revolving Facility of $46.5 million. At August 31, 2016, the weighted average interest rate on our outstanding borrowings under the Revolving Facility was 1.65%.
Liquidity
We generally finance our operations through cash flows from operations and borrowings under our Revolving Facility described above. At June 30, 2016, we had $21.1 million in cash and cash equivalents and $25.6 million in short-term investments. We believe our Revolving Facility, to the extent available, in addition to our cash flows from operations and other liquid assets, the net proceeds from the sale of the Spice Assets and the proceeds from the sale of our Torrance facility, collectively, will be sufficient to fund our working capital and capital expenditure requirements for the next 12 to 18 months including the expected capital expenditures associated with the Corporate Relocation Plan, the purchase option under the Lease Agreement for the partially constructed New Facility, additional construction costs to complete the New Facility and anticipated capital expenditures for machinery and equipment, furniture and fixtures, and related expenditures.
Changes in Cash Flows
We generate cash from operating activities primarily from cash collections related to the sale of our products. Net cash provided by operating activities was $27.6 million in fiscal 2016 compared to $26.9 million in fiscal 2015 and $52.9 million in fiscal 2014. The higher level of net cash provided by operating activities in fiscal 2016 compared to the prior fiscal year was primarily due to higher net income and a higher level of cash inflows from operating activities. The increase in net income was primarily due to non-cash income tax benefit resulting from the release of valuation allowance on deferred tax assets. The higher level of cash inflows from operating activities was primarily due to higher proceeds from sales of short-term investments, accruals for incentive compensation payments to eligible employees and a decrease in inventory balances, partially offset by higher cash outflows from increases in derivative assets and accounts receivable balances, purchases of short-term investments and payments for restructuring and other transition expenses. Inventories decreased at the end of fiscal 2016 compared to fiscal 2015 primarily due to production consolidation, and the sale of processed and unprocessed inventories to Harris at cost upon conclusion of the transition services provided by the Company in connection with the sale of Spice Assets. At June 30, 2016, we had a net gain position in our margin accounts for coffee-related derivative instruments resulting in the release of restriction of the use of $1.0 million of cash in these accounts, which contributed to higher cash inflows in fiscal 2016. In fiscal 2015, the lower level of net cash provided by operating activities as compared to the prior fiscal year was due to lower net income and a higher level of cash outflows from operating activities. Cash outflows were primarily from payments of accounts payable balances including the payment of expenses associated with the Corporate Relocation Plan, payroll expenses including accrued bonuses and restriction of cash held in margin accounts for coffee-related derivative instruments. Cash outflows were partially offset by cash inflows from a decrease in inventory balances. Inventory balances decreased in fiscal 2015 compared to the prior fiscal year primarily due to the consolidation of coffee production from the Torrance production facility with the Houston and Portland production facilities pursuant to our Corporate Relocation Plan. At June 30, 2015, we had a net loss position in our margin accounts for coffee-related derivative instruments resulting in restriction of the use of $1.0 million of cash in these accounts, which contributed to lower cash inflows in fiscal 2015.
Net cash used in investing activities was $39.5 million in fiscal 2016 as compared to $20.1 million in fiscal 2015 and $20.7 million in fiscal 2014. In fiscal 2016, net cash used in investing activities included $31.1 million for purchases of property, plant and equipment including $4.4 million in machinery and equipment for the New Facility and $19.4 million in


purchases of construction-in-progress assets in connection with the construction of the New Facility as the deemed owner under the lease arrangement, partially offset by $10.9 million in proceeds from sales of assets, primarily spice assets and real estate. In fiscal 2015, net cash used in investing activities included $1.2 million in payments in connection with the RLC Acquisition and $19.2 million for purchases of property, plant and equipment, partially offset by proceeds from sales of assets, primarily vehicles, of $0.3 million. The increase in cash outflows for property, plant and equipment compared to the prior fiscal year was primarily due to the capital expenditures for the New Facility as the deemed owner of the New Facility.
Net cash provided by financing activities in fiscal 2016 was $17.8 million as compared to net cash used in financing activities of $3.6 million and $22.8 million in fiscal 2015 and 2014, respectively. Net cash provided by financing activities in fiscal 2016 included $19.4 million in proceeds from lease financing in connection with the construction of the New Facility as the deemed owner under the lease arrangement and $1.7 million in proceeds from stock option exercises, partially offset by $3.1 million used to pay capital lease obligations, $0.2 million in tax withholding payments related to net share settlement of equity awards and net repayments on our credit facility of $31,000. Net cash used in financing activities in fiscal 2015 included $3.9 million used to pay capital lease obligations, $0.6 million in net repayments on our credit facility, $0.6 million in deferred financing costs for the Revolving Facility and $0.1 million in tax withholding payments related to net share settlement of equity awards, partially offset by $1.5 million in proceeds from stock option exercises. Net repayments on our credit facility in fiscal 2014 were $20.6 million.
Sale of Spice Assets
In order to focus on our core product offerings, in the second quarter of fiscal 2016, we completed the sale of certain assets associated with our manufacture, processing and distribution of raw, processed and blended spices and certain other culinary products to Harris. We received $6.0 million in cash at closing, and we are eligible to receive an earnout amount of up to $5.0 million over a three year period based upon a percentage of certain institutional spice sales by Harris following the closing. The sale of the Spice Assets does not represent a strategic shift for us and is not expected to have a material impact on our results of operations because we will continue to sell a complete portfolio of spice and other culinary products purchased from Harris under a supply agreement to our DSD customers. See Note 5, Sale of Spice Assets, of the Notes to Consolidated Financial Statements included in Part II, Item 8 of this report.
Sale of Torrance Facility
In the fourth quarter of fiscal 2016, we entered into a purchase and sale agreement to sell the Torrance facility. Subsequent to the fiscal year end, the sale of the Torrance facility closed on July 15, 2016 for an aggregate cash sale price of $43.0 million (which sale price was subject to customary adjustments for closing costs and documentary transfer taxes). We have agreed to lease back the Torrance facility on a triple net basis through October 31, 2016 at zero base rent, subject to two one-month extensions at our option at a base rent of $100,000 per month. As of June 30, 2016, the Torrance facility continued to house certain administrative functions and serve as a distribution facility and branch warehouse pending transition of the remaining Torrance operations to our other facilities. See Note 6, Assets Held for Sale, and Note 24, Subsequent Events, of the Notes to Consolidated Financial Statements included in Part II, Item 8 of this report.
Torrance Facility Exit Costs
Based on current assumptions and subject to continued implementation of the Corporate Relocation Plan, we estimate that we will incur approximately $31 million in cash costs in connection with the exit of the Torrance facility consisting of $18 million in employee retention and separation benefits, $5 million in facility-related costs and $8 million in other related costs. Since adoption of the Corporate Relocation Plan in fiscal 2015 through June 30, 2016, we have recognized a total of $25.7 million of the estimated $31 million in aggregate cash costs, including $16.2 million in employee retention and separation benefits, $3.1 million in facility-related costs related to the relocation of our Torrance operations and certain distribution operations and $6.4 million in other related costs recorded in “Restructuring and other transition expenses” in our consolidated statements of operations. The remainder is expected to be recognized in the first half of fiscal 2017. Additionally, we recognized from inception through fiscal 2016 $1.3 million in non-cash depreciation expense associated with the Torrance production facility. We may incur certain other non-cash asset impairment costs and pension-related costs in connection with the Corporate Relocation Plan. See Note 3, Corporate Relocation Plan, of the Notes to Consolidated Financial Statements included in Part II, Item 8 of this report.


New Facility Construction Costs
In the first quarter of fiscal 2016, we entered into the Lease Agreement for the New Facility pursuant to which the New Facility is being constructed by the lessor, at its expense, in accordance with agreed upon specifications and plans. Based on the final budget, which reflects substantial completion of the principal design work for the New Facility, we estimate that the construction costs for the New Facility will be approximately $55 million to $60 million.
In the fourth quarter of fiscal 2016 we exercised the purchase option under the Lease Agreement to acquire the partially constructed New Facility with a targeted closing date in the first quarter of fiscal 2017. The estimated purchase option exercise price for the New Facility is $58.8 million based on the budget for the completed facility. The actual option exercise price for the partially constructed New Facility will depend upon, among other things, the timing of the closing and the actual costs incurred for construction of the New Facility as of the purchase option closing date. See Note 4, New Facility Lease Obligation, and Note 22, Commitments and Contingencies, of the Notes to Consolidated Financial Statements included in Part II, Item 8 of this report.
We recorded an asset related to the New Facility lease obligation included in property, plant and equipment of $28.1 million at June 30, 2016, as the deemed owner of the New Facility, and an offsetting liability of $28.1 million for the lease obligation in "Other long-term liabilities" on our consolidated balance sheet at June 30, 2016. There were no such amounts recorded at June 30, 2015.
Capital Expenditures
For the fiscal years ended June 30, 2016, 2015 and 2014, our capital expenditures were as follows:
    June 30,  
(In thousands) 2016 2015 2014
Coffee brewing equipment $8,375
 $10,709
 $13,550
Vehicles, machinery and equipment 10,254
 6,079
 9,270
Building and facilities 3,354
 1,460
 758
Software, office furniture and equipment 3,165
 946
 1,689
Land 1,458
 
 
Capital expenditures, excluding New Facility $26,606
 $19,194
 $25,267
New Facility:      
Machinery and equipment $4,443
 $22
 $
Total capital expenditures $31,049
 $19,216
 $25,267
We expect to incur approximately $35 million to $39 million in anticipated capital expenditures for machinery and equipment, furniture and fixtures, and related expenditures associated with the New Facility. As of June 30, 2016, we had spent $4.4 million towards the purchase of machinery and equipment for the New Facility. No such capital expenditures were incurred in fiscal 2015. The majority of the capital expenditures associated with machinery and equipment, furniture and fixtures and related expenditures for the New Facility are expected to be incurred in the first half of fiscal 2017.
Our expected capital expenditures for fiscal 2017 unrelated to the New Facility include expenditures to replace normal wear and tear of coffee brewing equipment, vehicles, machinery and equipment and mobile sales solution hardware, and are expected to be consistent with the average capital expenditures for the past three fiscal years.


Working Capital
At June 30, 2016 and 2015, our working capital was composed of the following: 
  June 30,
(In thousands) 2016 2015
Current assets(1) $153,365
 $135,685
Current liabilities(2) 56,837
 64,874
Working capital $96,528
 $70,811
__________
(1) Includes $4.0 million in coffee-related short-term derivative assets and $7.2 million in assets held for sale at June 30, 2016 and $1.0 million in restricted cash at June 30, 2015.
(2) Includes $4.0 million in coffee-related short-term derivative liabilities and $1.4 million in deferred tax liabilities at June 30, 2015.

Contractual Obligations
The following table contains information regarding total contractual obligations as of June 30, 2016, including capital leases: 
  Payment due by period
(In thousands) Total 
Less Than
One Year
 
1-3
Years
 
3-5
Years
 
More Than
5 Years
Contractual obligations:          
Operating lease obligations $11,801
 $4,093
 $5,927
 $1,720
 $61
New Facility purchase option exercise price(1) 58,779
 58,779


Capital lease obligations(2) 2,504
 1,443
 1,005
 56
 
Pension plan obligations 89,950
 8,075
 16,858
 17,918
 47,099
Postretirement benefits other than
    pension plans
 11,957
 1,080
 2,245
 2,386
 6,246
Revolving credit facility 109
 109


Purchase commitments(3) 72,217
 72,217


   Total contractual obligations $247,317
 $145,796
 $26,035
 $22,080
 $53,406
 ______________
(1) In the fourth quarter of fiscal 2016, we exercised the purchase option under the Lease Agreement to acquire the partially constructed New Facility with a targeted closing date in the first quarter of fiscal 2017. The purchase option exercise price shown in the table above is an estimate based on the budget for the completed facility. The actual option exercise price for the partially constructed New Facility will depend upon, among other things, the timing of the closing and the actual costs incurred for construction of the New Facility as of the purchase option closing date. See Note 4, New Facility Lease Obligation, of the Notes to Consolidated Financial Statements included in Part II, Item 8 of this report.
(2) Includes imputed interest of $0.1 million.
(3) Purchase commitments include commitments under coffee purchase contracts for which all delivery terms have been finalized but the related coffee has not been received as of June 30, 2016. Amounts shown in the table above: (a) include all coffee purchase contracts that the Company considers to be from normal purchases; and (b) do not include amounts related to derivative instruments that are recorded at fair value on the Company’s consolidated balance sheets.

As of June 30, 2016, we had committed to purchase green coffee inventory totaling $62.5 million under fixed-price contracts, $3.3 million in equipment for the New Facility and $6.3 million in other inventory under non-cancelable purchase orders.


Off-Balance Sheet Arrangements
We have no off-balance sheet arrangements. 

Critical Accounting Policies and Estimates
Management’s discussion and analysis of financial condition and results of operations is based upon our consolidated financial statements, which have been prepared in accordance with GAAP. Our significant accounting policies are discussed in Note 1, Summary of Significant Accounting Policies, of the Notes to Consolidated Financial Statements, included in Part II, Item 8 of this report. The preparation of these financial statements requires us to make estimates, judgments and assumptions that affect the reported amounts of assets, liabilities, revenues and expenses, and related disclosure of contingent assets and liabilities. On an ongoing basis, we evaluate our estimates, including those related to inventory valuation, including LIFO reserves, valuation of intangible assets, deferred tax assets, liabilities relating to retirement benefits, liabilities resulting from self-insurance, tax liabilities and litigation. We base our estimates, judgments and assumptions on historical experience and other relevant factors that are believed to be reasonable based on information available to us at the time these estimates are made.
While we believe that the historical experience and other factors considered provide a meaningful basis for the accounting policies applied in the preparation of the consolidated financial statements, actual results may differ from these estimates, which could require us to make adjustments to these estimates in future periods.
We believe that the estimates, judgments and assumptions involved in the accounting policies described below require the most subjective judgment and have the greatest potential impact on our financial statements, so we consider these to be our critical accounting policies. Our senior management has reviewed the development and selection of these critical accounting policies and estimates, and their related disclosure in this report, with the Audit Committee of our Board of Directors.
Exposure to Commodity Price Fluctuations and Derivative Instruments
We are exposed to commodity price risk arising from changes in the market price of green coffee. In general, increases in the price of green coffee could cause our cost of goods sold to increase and, if not offset by product price increases, could negatively affect our financial condition and results of operations. As a result, our business model strives to reduce the impact of green coffee price fluctuations on our financial results and to protect and stabilize our margins, principally through customer arrangements and derivative instruments.
Customers generally pay for our products based either on an announced price schedule or under commodity-based pricing arrangements whereby the changes in green coffee commodity costs are passed through to the customer. The pricing schedule is generally subject to adjustment, either on contractual terms or in accordance with periodic product price adjustments, typically monthly, resulting in, at the least, a 30-day lag in our ability to correlate the changes in our prices with fluctuations in the cost of raw materials and other inputs.
In addition to our customer arrangements, we utilize derivative instruments to reduce further the impact of changing green coffee commodity prices. We purchase over-the-counter coffee derivative instruments to enable us to lock in the price of green coffee commodity purchases. These derivative instruments may be entered into at the direction of the customer under commodity-based pricing arrangements to effectively lock in the purchase price of green coffee under such customer arrangements, in certain cases up to 18 months or longer in the future. Notwithstanding this customer direction, pursuant to Accounting Standards Codification ("ASC") 815, “Derivatives and Hedging,” we are considered the owner of these derivative instruments and, therefore, we are required to account for them as such. In the event the customer fails to purchase the products associated with the underlying derivative instruments for which the price has been locked-in on behalf of the customer, we expect that such derivative instruments will be assigned to, and assumed by, the customer in accordance with contractual terms or, in the absence of such terms, in accordance with standard industry custom and practice. In the event the customer fails to assume such derivative instruments, we will remain obligated on the derivative instruments at settlement. We generally settle derivative instruments to coincide with the receipt of the purchased green coffee or apply the derivative instruments to purchase orders effectively fixing the cost of in-bound green coffee purchases. As of June 30, 2016 and 2015, we had 34.0 million and 34.2 million pounds of green coffee covered under coffee-related derivative instruments,


respectively. We do not purchase any derivative instruments to hedge cost fluctuations of any commodities other than green coffee.
The fair value of derivative instruments is based upon broker quotes. We account for certain coffee-related derivative instruments as accounting hedges in order to minimize the volatility created in our quarterly results from utilizing these derivative contracts and to improve comparability between reporting periods. The effective portion of the change in fair value of the derivative is reported in accumulated other comprehensive income (loss) (“AOCI”) on our consolidated balance sheet and subsequently reclassified into cost of goods sold in the period or periods when the hedged transaction affects earnings. At June 30, 2016, approximately 96% of our outstanding coffee-related derivative instruments, representing 32.6 million pounds of forecasted green coffee purchases, were designated as cash flow hedges. At June 30, 2015, approximately 94% of our outstanding coffee-related derivative instruments, representing 32.3 million pounds of forecasted green coffee purchases, were designated as cash flow hedges. The portion of open hedging contracts that are not 100% effective as cash flow hedges and those that are not designated as accounting hedges are marked to period-end market price and unrealized gains or losses based on whether the period-end market price was higher or lower than the price we locked-in are recognized in our financial results.
Our risk management practices reduce but do not eliminate our exposure to changing green coffee prices. While we have limited our exposure to unfavorable green coffee price changes, we have also limited our ability to benefit from favorable price changes. Further, our counterparty may require that we post cash collateral if the fair value of our derivative liabilities exceed the amount of credit granted by such counterparty, thereby reducing our liquidity. At June 30, 2016, because we had a net gain position in our coffee-related derivative margin accounts, none of the cash in these accounts was restricted. At June 30, 2015, we had $1.0 million in restricted cash representing cash held on deposit in margin accounts for coffee-related derivative instruments due to a net loss position in such accounts. Changes in commodity prices and the number of coffee-related derivative instruments held could have a significant impact on cash deposit requirements under our broker and counterparty agreements.
Inventories
Inventories are valued at the lower of cost or market. We account for coffee, tea and culinary products on the last in, first out (“LIFO”) basis, and coffee brewing equipment parts on the first in, first out (“FIFO”) basis. We regularly evaluate these inventories to determine inventory reserves for obsolete and slow-moving inventory. Inventory reserves are based on inventory obsolescence trends, historical experience and application of specific identification. At the end of each quarter, we record the expected effect of the liquidation of LIFO inventory quantities, if any, and record the actual impact at fiscal year-end. An actual valuation of inventory under the LIFO method is made only at the end of each fiscal year based on the inventory levels and costs at that time. If inventory quantities decline at the end of the fiscal year compared to the beginning of the fiscal year, the reduction results in the liquidation of LIFO inventory quantities carried at the cost prevailing in prior years. This LIFO inventory liquidation may result in a decrease or increase in cost of goods sold depending on whether the cost prevailing in prior years was lower or higher, respectively, than the current year cost. As these estimates are subject to many forces beyond management's control, interim results are subject to the final fiscal year-end LIFO inventory valuation.
Impairment of Goodwill and Indefinite-lived Intangible Assets
We account for our goodwill and indefinite-lived intangible assets in accordance with ASC 350, “Intangibles-Goodwill and Other” (“ASC 350”). Goodwill and other indefinite-lived intangible assets are not amortized but instead are reviewed for impairment annually, or more frequently if an event occurs or circumstances change which indicate that an asset might be impaired. We perform a qualitative assessment of goodwill and indefinite-lived intangible assets on our consolidated balance sheets, to determine if there is a more likely than not indication that our goodwill and indefinite-lived intangible assets are impaired as of June 30. If the indicators of impairment are present, we perform a quantitative test to determine the impairment of these assets as of the measurement date.
Testing for impairment of goodwill is a two-step process. The first step requires us to compare the fair value of our reporting unit to the carrying value of the reporting unit, including goodwill. If the fair value of a reporting unit is less than its carrying value, goodwill of the reporting unit is potentially impaired and we then complete step two to measure the impairment loss, if any. The second step requires the calculation of the implied fair value of goodwill, which is the residual fair value remaining after deducting the fair value of all tangible and intangible net assets of the reporting unit from the fair


value of the reporting unit. If the implied fair value of goodwill is less than the carrying amount of goodwill, an impairment loss is recognized equal to the difference.
Indefinite-lived intangible assets are tested for impairment by comparing their fair values to their carrying values. An impairment charge is recorded if the estimated fair value of such assets has decreased below their carrying value.
Other Intangible Assets
Other intangible assets consist of finite-lived intangible assets including acquired non-compete agreements and customer relationships. These are amortized over their estimated useful lives and are tested for impairment by grouping them with other assets at the lowest level for which identifiable cash flows are largely independent of the cash flows of other groups of assets and liabilities. The estimated future cash flows are based upon, among other things, assumptions about expected future operating performance and may differ from actual cash flows. If the sum of the projected undiscounted cash flows (excluding interest) is less than the carrying value of the assets, the assets will be written down to the estimated fair value in the period in which the determination is made. We review the recoverability of our long-lived assets whenever events or changes in circumstances indicate that the carrying amount of such assets may not be recoverable.
Self-Insurance
We use a combination of insurance and self-insurance mechanisms, including the use of captive insurance entities and participation in a reinsurance treaty, to provide for the potential liability of certain risks including workers’ compensation, health care benefits, general liability, product liability, property insurance and director and officers’ liability insurance. Liabilities associated with risks retained by us are not discounted and are estimated by considering historical claims experience, demographics, exposure and severity factors and other actuarial assumptions.
Our self-insurance for workers’ compensation liability includes estimated outstanding losses of unpaid claims and allocated loss adjustment expenses (“ALAE”), case reserves, the development of known claims and incurred but not reported claims. ALAE are the direct expenses for settling specific claims. The amounts reflect per occurrence and annual aggregate limits maintained by the Company. The estimated liability analysis does not include estimating a provision for unallocated loss adjustment expenses. We believe that the amount recorded at June 30, 2016 is adequate to cover all known workers' compensation claims at June 30, 2016. If the actual costs of such claims and related expenses exceed the amount estimated, additional reserves may be required which could have a material negative effect on operating results.
The estimated liability related to our self-insured group medical insurance is recorded on an incurred but not reported basis, within deductible limits, based on actual claims and the average lag time between the date insurance claims are filed and the date those claims are paid. General liability, product liability and commercial auto liability are insured through a captive insurance program. We retain the risk within certain aggregate amounts. Cost of the insurance through the captive program is accrued based on estimates of the aggregate liability claims incurred using certain actuarial assumptions and historical claims experience.
Employee Benefit Plans
We provide benefit plans for most full-time employees, including 401(k), health and other welfare benefit plans and, in certain circumstances, pension benefits. Generally the plans provide benefits based on years of service and/or a combination of years of service and earnings. In addition, we contribute to two multiemployer defined benefit pension plans, one multiemployer defined contribution pension plan and ten multiemployer defined contribution plans other than pension plans that provide medical, vision, dental and disability benefits for active, union-represented employees subject to collective bargaining agreements. In addition, we sponsor a postretirement defined benefit plan that covers qualified non-union retirees and certain qualified union retirees and provides retiree medical coverage and, depending on the age of the retiree, dental and vision coverage. We also provide a postretirement death benefit to certain of our employees and retirees.
We are required to recognize the funded status of a benefit plan in our consolidated balance sheet. We are also required to recognize in OCI certain gains and losses that arise during the period but are deferred under pension accounting rules.


Single Employer Pension Plans
We have a defined benefit pension plan, the Farmer Bros. Co. Pension Plan for Salaried Employees (the “Farmer Bros. Plan”), for our employees hired prior to January 1, 2010 who are not covered under a collective bargaining agreement. We amended the Farmer Bros. Plan, freezing the benefit for all participants effective June  30, 2011. After the plan freeze, participants do not accrue any benefits under the Farmer Bros. Plan, and new hires are not eligible to participate in the Farmer Bros. Plan. As all plan participants became inactive following this pension curtailment, net (gain) loss is now amortized based on the remaining life expectancy of these participants instead of the remaining service period of these participants.
We also have two defined benefit pension plans for certain hourly employees covered under collective bargaining agreements (the “Brewmatic Plan” and the “Hourly Employees’ Plan”).
We obtain actuarial valuations for our single employer defined benefit pension plans. In fiscal 2016 we discounted the pension obligations using a 4.40% discount rate and 7.50% expected long-term rate of return on plan assets. The performance of the stock market and other investments as well as the overall health of the economy can have a material effect on pension investment returns and these assumptions. A change in these assumptions could affect our operating results.
At June 30, 2016, the projected benefit obligation under our single employer defined benefit pension plans was $161.2 million and the fair value of plan assets was $96.6 million. The difference between the projected benefit obligation and the fair value of plan assets is recognized as a decrease in OCI and an increase in pension liability and deferred tax assets. The difference between plan obligations and assets, or the funded status of the plans, significantly affects the net periodic benefit cost and ongoing funding requirements of those plans. Among other factors, changes in interest rates, mortality rates, early retirement rates, mix of plan asset investments, investment returns and the market value of plan assets can affect the level of plan funding, cause volatility in the net periodic benefit cost, increase our future funding requirements and require premium payments to the Pension Benefit Guaranty Corporation. For the fiscal year ended June 30, 2016, we made $1.6 million in contributions to our single employer defined benefit pension plans and recorded pension expense of $1.2 million. We expect to make approximately $2.3 million in contributions to our single employer defined benefit pension plans in fiscal 2017 and accrue pension expense of approximately $1.7 million per year beginning in fiscal 2017. These pension contributions are expected to continue at this level for several years; however a deterioration in the current economic environment would increase the risk that we may be required to make larger contributions in the future.


The following chart quantifies the effect on the projected benefit obligation and the net periodic benefit cost of a change in the discount rate assumption and the impact on the net periodic benefit cost of a change in the assumed rate of return on plan assets under our single employer defined benefit pension plans for fiscal 2017:
($ in thousands)      
Farmer Bros. Plan Discount Rate 3.1% Actual 3.55% 4.1%
Net periodic benefit cost $983
 $1,086
 $1,159
Projected benefit obligation $162,790
 $152,324
 $142,921
       
Farmer Bros. Plan Rate of Return 7.3% Actual 7.75% 8.3%
Net periodic benefit cost $1,529
 $1,086
 $642
       
Brewmatic Plan Discount Rate 3.1% Actual 3.55% 4.1%
Net periodic benefit cost $68
 $71
 $73
Projected benefit obligation $4,856
 $4,575
 $4,327
       
Brewmatic Plan Rate of Return 7.3% Actual 7.75% 8.3%
Net periodic benefit cost $85
 $71
 $56
       
Hourly Employees’ Plan Discount Rate 3.1% Actual 3.55% 4.1%
Net periodic benefit cost $606
 $530
 $462
Projected benefit obligation $4,725
 $4,329
 $3,980
       
Hourly Employees' Plan Rate of Return 7.3% Actual 7.75% 8.3%
Net periodic benefit cost $543
 $530
 $517
Multiemployer Pension Plans
We participate in two multiemployer defined benefit pension plans that are union sponsored and collectively bargained for the benefit of certain employees subject to collective bargaining agreements. We make contributions to these plans generally based on the number of hours worked by the participants in accordance with the provisions of negotiated labor contracts.
The risks of participating in multiemployer pension plans are different from single-employer plans in that: (i) assets contributed to a multiemployer plan by one employer may be used to provide benefits to employees of other participating employers; (ii) if a participating employer stops contributing to the plan, the unfunded obligations of the plan may be borne by the remaining participating employers; and (iii) if we stop participating in the multiemployer plan, we may be required to pay the plan an amount based on the underfunded status of the plan, referred to as a withdrawal liability.
Postretirement Benefits
We sponsor a postretirement defined benefit plan that covers qualified non-union retirees and certain qualified union retirees. The plan provides medical, dental and vision coverage for retirees under age 65 and medical coverage only for retirees age 65 and above. Under this postretirement plan, our contributions toward premiums for retiree medical, dental and vision coverage for participants and dependents are scaled based on length of service, with greater Company contributions for retirees with greater length of service, subject to a maximum monthly Company contribution. Our retiree medical, dental and vision plan is unfunded, and its liability was calculated using an assumed discount rate of 3.7% at June 30, 2016. We project an initial medical trend rate of 9.0% in fiscal 2016, ultimately reducing to 4.5% in 10 years.
We also provide a postretirement death benefit to certain of our employees and retirees, subject, in the case of current employees, to continued employment with the Company until retirement, and certain other conditions related to the manner of employment termination and manner of death. We record the actuarially determined liability for the present value of the postretirement death benefit using a discount rate of 3.8%. We have purchased life insurance policies to fund the


postretirement death benefit wherein we own the policy but the postretirement death benefit is paid to the employee's or retiree's beneficiary. We record an asset for the fair value of the life insurance policies which equates to the cash surrender value of the policies.
Share-based Compensation
We measure all share-based compensation cost at the grant date, based on the fair values of the awards that are ultimately expected to vest, and recognize that cost on a straight line basis in our consolidated statements of operations over the requisite service period. Fair value of restricted stock is the closing price of the Company's common stock on the date of grant. We estimate the fair value of stock option awards on the date of grant using the Black-Scholes valuation model which requires that we make certain assumptions regarding: (i) the expected volatility in the market price of our common stock; (ii) dividend yield; (iii) risk-free interest rate; and (iv) the period of time employees are expected to hold the award prior to exercise (referred to as the expected term).
The Black-Scholes option valuation model was developed for use in estimating the fair value of traded options that have no vesting restrictions and are fully transferable. Because our stock options have characteristics significantly different from those of traded options, and because changes in the subjective input assumptions can materially affect the fair value estimates, in management’s opinion, the existing models may not necessarily provide a reliable single measure of the fair value of our stock options. Although the fair value of stock options is determined using an option valuation model, that value may not be indicative of the fair value observed in a willing buyer/willing seller market transaction.
In addition, we estimate the expected impact of forfeited awards and recognize share-based compensation cost only for those awards ultimately expected to vest. If actual forfeiture rates differ materially from our estimates, share-based compensation expense could differ significantly from the amounts we have recorded in the current period. We will periodically review actual forfeiture experience and revise our estimates, as necessary. We will recognize as compensation cost the cumulative effect of the change in estimated forfeiture rates on current and prior periods in earnings of the period of revision. As a result, if we revise our assumptions and estimates, our share-based compensation expense could change materially in the future. In each of fiscal 2016 and 2015, we used an estimated annual forfeiture rate of 4.8% to calculate share-based compensation expense based on actual forfeiture experience.
We have outstanding share-based awards that have performance-based vesting conditions in addition to time-based vesting. Awards with performance-based vesting conditions require the achievement of certain financial and other performance criteria as a condition to the vesting. We recognize the estimated fair value of performance-based awards, net of estimated forfeitures, as share-based compensation expense over the performance period based upon our determination of whether it is probable that the performance targets will be achieved. At each reporting period, we reassess the probability of achieving the performance criteria and the performance period required to meet those targets. Determining whether the performance criteria will be achieved involves judgment, and the estimate of share-based compensation expense may be revised periodically based on changes in the probability of achieving the performance criteria. Revisions are reflected in the period in which the estimate is changed. If performance goals are not met, no share-based compensation expense is recognized, and, to the extent share-based compensation expense was previously recognized, such share-based compensation expense is reversed.
Income Taxes
Deferred income taxes are determined based on the temporary differences between the financial reporting and tax bases of assets and liabilities using enacted tax rates in effect for the year in which the differences are expected to reverse. Estimating our tax liabilities involves judgments related to uncertainties in the application of complex tax regulations. We make certain estimates and judgments to determine tax expense for financial statement purposes as we evaluate the effect of tax credits, tax benefits and deductions, some of which result from differences in the timing of recognition of revenue or expense for tax and financial statement purposes. Changes to these estimates may result in significant changes to our tax provision in future periods. Each fiscal quarter we re-evaluate our tax provision and reconsider our estimates and assumptions related to specific tax assets and liabilities, making adjustments as circumstances change.


Deferred Tax Asset Valuation Allowance
We evaluate our deferred tax assets quarterly to determine if a valuation allowance is required. We consider whether a valuation allowance should be recorded against deferred tax assets based on the likelihood that the benefits of the deferred tax assets will or will not ultimately be realized in future periods. In making this assessment, significant weight is given to evidence that can be objectively verified, such as recent operating results, and less consideration is given to less objective indicators, such as future income projections. After consideration of positive and negative evidence, including the recent history of income, we concluded that it is more likely than not that we will generate future income sufficient to realize our the majority of our deferred tax assets as of June 30, 2016. Accordingly, we recorded a reduction in our valuation allowance in fiscal 2016 in the amount of $83.2 million.

2023.

Compensation Committee
Item 7A.Quantitative and Qualitative Disclosures About Market Risk
Interest Rate Risk
We are exposed to market value risk arising from changes in interest rates on our securities portfolio. Our portfolio of preferred securities has sometimes included investments in derivative instruments that provide a natural economic hedge of interest rate risk. We review the interest rate sensitivity of these securities and may enter into “short positions” in futures contracts on U.S. Treasury securities or hold put options on such futures contracts to reduce the impact of certain interest rate changes. Specifically, we attempt to manage the risk arising from changes in the general level of interest rates. We do not transact in futures contracts or put options for speculative purposes. The number and type of futures and options contracts entered into depends on, among other items, the specific maturity and issuer redemption provisions for each preferred stock held, the slope of the U.S. Treasury yield curve, the expected volatility of U.S. Treasury yields, and the costs of using futures and/or options.
The following table demonstrates the impact of varying interest rate changes based on our preferred securities holdings and market yield and price relationships at June 30, 2016. This table is predicated on an “instantaneous” change in the general level of interest rates and assumes predictable relationships between the prices of our preferred securities holdings and the yields on U.S. Treasury securities. At June 30, 2016, we had no futures contracts or put options with respect to our preferred securities portfolio designated as interest rate risk hedges.
($ in thousands) 
Market Value of
Preferred
Securities at 
June 30, 2016
 
Change in Market
Value
Interest Rate Changes  
 –150 basis points $26,495
 $904
 –100 basis points $26,310
 $719
 Unchanged $25,591
 $
 +100 basis points $24,644
 $(947)
 +150 basis points $24,184
 $(1,407)
Borrowings under our Revolving Facility bear interest based on average historical excess availability levels with a range of PRIME - 0.25% to PRIME + 0.50% or Adjusted LIBO Rate + 1.25% to Adjusted LIBO Rate + 2.00%.
At June 30, 2016, we had outstanding borrowings of $0.1 million, utilized $11.9 million of the letters of credit sublimit, and had excess availability under the Revolving Facility of $46.6 million. The weighted average interest rate on our outstanding borrowings under the Revolving Facility at June 30, 2016 was 1.64%.
Commodity Price Risk
We are exposed to commodity price risk arising from changes in the market price of green coffee. We value green coffee inventory on the LIFO basis. In the normal course of business we hold a large green coffee inventory and enter into forward commodity purchase agreements with suppliers. We are subject to price risk resulting from the volatility of green


coffee prices. Due to competition and market conditions, volatile price increases cannot always be passed on to our customers.
We purchase over-the-counter coffee derivative instruments to enable us to lock in the price of green coffee commodity purchases. These derivative instruments also may be entered into at the direction of the customer under commodity-based pricing arrangements to effectively lock in the purchase price of green coffee under such customer arrangements, in certain cases up to 18 months or longer in the future. We account for certain coffee-related derivative instruments as accounting hedges in order to minimize the volatility created in our quarterly results from utilizing these derivative contracts and to improve comparability between reporting periods.
When we designate coffee-related derivative instruments as cash flow hedges, we formally document the hedging instruments and hedged items, and measure at each balance sheet date the effectiveness of our hedges. The effective portion of the change in fair value of the derivative is reported in AOCI and subsequently reclassified into cost of goods sold in the period or periods when the hedged transaction affects earnings. For the fiscal year ended June 30, 2016 we reclassified $(13.2) million in net losses into cost of goods sold from AOCI. For the fiscal years ended June 30, 2015 and 2014 we reclassified $4.2 million and $1.2 million, respectively, in net gains into cost of goods sold from AOCI. Any ineffective portion of the derivative's change in fair value is recognized currently in “Other, net.” Gains or losses deferred in AOCI associated with terminated derivative instruments, derivative instruments that cease to be highly effective hedges, derivative instruments for which the forecasted transaction is reasonably possible but no longer probable of occurring, and cash flow hedges that have been otherwise discontinued remain in AOCI until the hedged item affects earnings. If it becomes probable that the forecasted transaction designated as the hedged item in a cash flow hedge will not occur, we recognize any gain or loss deferred in AOCI in “Other, net” at that time. For the fiscal years ended June 30, 2016, 2015 and 2014, we recognized in “Other, net” $(0.6) million, $(0.3) million and $(0.3) million, respectively, in net losses on coffee-related derivative instruments designated as cash flow hedges due to ineffectiveness.
For derivative instruments that are not designated in a hedging relationship, and for which the normal purchases and normal sales exception has not been elected, the changes in fair value are reported in “Other, net.”
For the fiscal years ended June 30, 2016, 2015 and 2014, we recorded in “Other, net” net (losses) gains on coffee-related derivative instruments not designated as accounting hedges in the amounts of $(0.3) million, $(3.0) million and $2.7 million, respectively.
The following table summarizes the potential impact as of June 30, 2016 to net income and AOCI from a hypothetical 10% change in coffee commodity prices. The information provided below relates only to the coffee-related derivative instruments and does not include, when applicable, the corresponding changes in the underlying hedged items:
  Increase (Decrease) to Net Income Increase (Decrease) to AOCI
  10% Increase in Underlying Rate 10% Decrease in Underlying Rate 10% Increase in Underlying Rate 10% Decrease in Underlying Rate
(In thousands) 
Coffee-related derivative instruments(1) $118
 $(118) $4,941
 $(4,941)
__________
(1) The Company's purchase contracts that qualify as normal purchases include green coffee purchase commitments for which the price has been locked in as of June 30, 2016. These contracts are not included in the sensitivity analysis above as the underlying price has been fixed.


Item 8.Financial Statements and Supplementary Data
Report of Independent Registered Public Accounting Firm


To the Board of Directors and Stockholders of
Farmer Bros. Co.
Fort Worth, Texas

We have audited the accompanying consolidated balance sheets of Farmer Bros. Co. and subsidiaries (the "Company") as of June 30, 2016 and 2015 and the related consolidated statements of operations, comprehensive income (loss), stockholders' equity, and cash flows for each of the three years in the period ended June 30, 2016. These consolidated financial statements are the responsibility of the Company's management. Our responsibility is to express an opinion on the consolidated financial statements based on our audits.
We conducted our audits in accordance with the standards of the Public Company Accounting Oversight Board (United States). Those standards require that we plan and perform the audit to obtain reasonable assurance about whether the financial statements are free of material misstatement. An audit includes examining, on a test basis, evidence supporting the amounts and disclosures in the financial statements. An audit also includes assessing the accounting principles used and significant estimates made by management, as well as evaluating the overall financial statement presentation. We believe that our audits provide a reasonable basis for our opinion.
In our opinion, such consolidated financial statements present fairly, in all material respects, the financial position of Farmer Bros. Co. and subsidiaries as of June 30, 2016 and 2015, and the results of their operations and their cash flows for each of the three years in the period ended June 30, 2016, in conformity with accounting principles generally accepted in the United States of America.
We have also audited, in accordance with the standards of the Public Company Accounting Oversight Board (United States), the Company's internal control over financial reporting as of June 30, 2016, based on the criteria established in Internal Control - Integrated Framework (2013) issued by the Committee of Sponsoring Organizations of the Treadway Commission and our report dated September 13, 2016 expressed an unqualified opinion on the Company's internal control over financial reporting.


/s/ DELOITTE & TOUCHE LLP
Dallas, Texas
September 13, 2016


FARMER BROS. CO.
CONSOLIDATED BALANCE SHEETS
(In thousands, except share and per share data)
 June 30, 2016 June 30, 2015
ASSETS   
Current assets:   
Cash and cash equivalents$21,095
 $15,160
Restricted cash
 1,002
Short-term investments25,591
 23,665
Accounts and notes receivable, net of allowance for doubtful accounts of $714 and $643, respectively44,364
 40,161
Inventories46,378
 50,522
Income tax receivable247
 535
Short-term derivative assets3,954
 
Prepaid expenses4,557
 4,640
Assets held for sale7,179
 
Total current assets153,365
 135,685
Property, plant and equipment, net118,416
 90,201
Goodwill and intangible assets, net6,491
 6,691
Other assets9,933
 7,615
Deferred income taxes80,786
 751
Total assets$368,991
 $240,943
LIABILITIES AND STOCKHOLDERS’ EQUITY   
Current liabilities:   
Accounts payable23,919
 27,023
Accrued payroll expenses24,540
 23,005
Short-term borrowings under revolving credit facility109
 78
Short-term obligations under capital leases1,323
 3,249
Short-term derivative liabilities
 3,977
Deferred income taxes
 1,390
Other current liabilities6,946
 6,152
Total current liabilities56,837
 64,874
Accrued pension liabilities68,047
 47,871
Accrued postretirement benefits20,808
 23,471
Accrued workers’ compensation liabilities11,459
 10,964
Other long-term liabilities-capital leases1,036
 2,599
Other long-term liabilities28,210
 225
Deferred income taxes
 928
Total liabilities$186,397
 $150,932
Commitments and contingencies (Note 22)
 
Stockholders’ equity:   
Preferred stock, $1.00 par value, 500,000 shares authorized and none issued
 
Common stock, $1.00 par value, 25,000,000 shares authorized; 16,781,561 and 16,658,148 shares issued and outstanding at June 30, 2016 and 2015, respectively16,782
 16,658
Additional paid-in capital39,096
 38,143
Retained earnings196,782
 106,864
Unearned ESOP shares(6,434) (11,234)
Accumulated other comprehensive loss(63,632) (60,420)
Total stockholders’ equity$182,594
 $90,011
Total liabilities and stockholders’ equity$368,991
 $240,943
The accompanying notes are an integral part of these financial statements.


FARMER BROS. CO.
CONSOLIDATED STATEMENTS OF OPERATIONS
(In thousands, except share and per share data)
 Year Ended June 30,
 2016 2015 2014
Net sales$544,382
 $545,882
 $528,380
Cost of goods sold335,907
 348,846
 332,466
Gross profit208,475
 197,036
 195,914
Selling expenses150,198
 151,753
 155,088
General and administrative expenses41,970
 31,173
 35,724
Restructuring and other transition expenses16,533
 10,432
 
Net gains from sale of Spice Assets(5,603) 
 
Net (gains) losses from sales of assets(2,802) 394
 (3,814)
Operating expenses200,296
 193,752
 186,998
Income from operations8,179
 3,284
 8,916
Other income (expense):     
Dividend income1,115
 1,172
 1,073
Interest income496
 381
 429
Interest expense(425) (769) (1,258)
Other, net556
 (3,014) 3,677
Total other income (expense)1,742
 (2,230) 3,921
Income before taxes9,921
 1,054
 12,837
Income tax (benefit) expense(79,997) 402
 705
Net income$89,918
 $652
 $12,132
Net income per common share—basic$5.45
 $0.04
 $0.76
Net income per common share—diluted$5.41
 $0.04
 $0.76
Weighted average common shares outstanding—basic16,502,523
 16,127,610
 15,909,631
Weighted average common shares outstanding—diluted16,627,402
 16,267,134
 16,014,587

The accompanying notes are an integral part of these financial statements.


FARMER BROS. CO.
CONSOLIDATED STATEMENTS OF COMPREHENSIVE INCOME (LOSS)
(In thousands)
 Year Ended June 30,
 2016 2015 2014
Net income$89,918
 $652
 $12,132
Other comprehensive income (loss), net of tax:     
Unrealized gains (losses) on derivative instruments designated as cash flow hedges, net of taxes185
 (14,295) 18,685
Losses (Gains) on derivative instruments designated as cash flow hedges reclassified to cost of goods sold, net of taxes8,064
 (4,211) (1,161)
Change in the funded status of retiree benefit obligations, net of taxes(11,461) (14,122) (2,802)
Total comprehensive income (loss), net of tax$86,706
 $(31,976) $26,854

The accompanying notes are an integral part of these financial statements.


FARMER BROS. CO.
CONSOLIDATED STATEMENTS OF CASH FLOWS
(In thousands)
 Year Ended June 30,
 2016 2015 2014
Cash flows from operating activities:     
Net income$89,918
 $652
 $12,132
Adjustments to reconcile net income to net cash provided by operating activities:    
Depreciation and amortization20,774
 24,179
 27,334
Provision for (recovery of) doubtful accounts71
 (8) 80
Restructuring and other transition expenses, net of payments(2,697) 6,608
 
Deferred income taxes(80,314) 123
 137
Net (gains) losses from sales of assets(8,405) 394
 (3,814)
ESOP and share-based compensation expense4,342
 5,691
 4,692
Net losses (gains) on derivative instruments and investments12,910
 (950) (4,276)
Change in operating assets and liabilities:     
Restricted cash1,002
 (1,002) 8,084
Purchases of trading securities held for investment(7,255) (3,661) (5,915)
Proceeds from sales of trading securities held for investment5,901
 2,358
 4,290
Accounts and notes receivable(3,476) 2,078
 2,248
Inventories3,608
 20,470
 (14,439)
Income tax receivable288
 (307) 181
Derivative (liabilities) assets, net(10,583) (7,269) 3,932
Prepaid expenses and other assets(111) (1,332) (661)
Accounts payable(3,343) (16,841) 17,526
Accrued payroll expenses and other current liabilities5,829
 (4,606) 2,574
Accrued postretirement benefits(358) (1,507) (1,905)
Other long-term liabilities(473) 1,860
 695
Net cash provided by operating activities$27,628
 $26,930
 $52,895
Cash flows from investing activities:     
Acquisition of business, net of cash acquired$
 $(1,200) $
Purchases of property, plant and equipment(31,050) (19,216) (25,267)
Purchases of construction-in-progress assets under New Facility lease(19,426) 
 
Proceeds from sales of property, plant and equipment10,946
 273
 4,536
Net cash used in investing activities$(39,530) $(20,143) $(20,731)
Cash flows from financing activities:     
Proceeds from revolving credit facility$405
 $63,376
 $44,806
Repayments on revolving credit facility(374) (63,947) (65,454)
Proceeds from New Facility lease financing19,426
 
 
Payments of capital lease obligations(3,147) (3,910) (3,681)
Payment of financing costs(8) (571) 
Proceeds from stock option exercises1,694
 1,548
 1,480
Tax withholding payment - net share settlement of equity awards(159) (116) 
Net cash provided by (used in) financing activities$17,837
 $(3,620) $(22,849)
(continued on next page)


FARMER BROS. CO.
CONSOLIDATED STATEMENTS OF CASH FLOWS
(In thousands)
 Year Ended June 30,
 2016 2015 2014
Net increase in cash and cash equivalents$5,935
 $3,167
 $9,315
Cash and cash equivalents at beginning of year15,160
 11,993
 2,678
Cash and cash equivalents at end of year$21,095
 $15,160
 $11,993
Supplemental disclosure of cash flow information:     
    Cash paid for interest$425
 $769
 $1,258
    Cash paid for income taxes324
 $858
 $361
Supplemental disclosure of non-cash investing activities:     
    Equipment acquired under capital leases$
 $55
 $1,217
        Net change in derivative assets and liabilities
           included in other comprehensive income (loss), net of tax
$8,249
 $(18,506) $17,524
Construction-in-progress assets under New Facility lease$8,684
 $
 $
New Facility lease obligation$8,684
 $
 $
    Non-cash additions to equipment$441
 $51
 $142
Asset held for sale$7,179
 $
 $
    Non-cash portion of earnout recognized$496
 $
 $

The accompanying notes are an integral part of these financial statements.


FARMER BROS. CO.
CONSOLIDATED STATEMENTS OF STOCKHOLDERS’ EQUITY
(In thousands, except share and per share data)
 
Common
Shares
 
Stock
Amount
 
Additional
Paid-in
Capital
 
Retained
Earnings
 
Unearned
ESOP
Shares
 
Accumulated
Other
Comprehensive
Income (Loss)
 Total
Balance at June 30, 201316,454,422
 $16,454
 $34,654
 $94,080
 $(20,836) $(42,514) $81,838
Net income
 
 
 12,132
 
 
 12,132
Unrealized gains on derivative instruments designated as cash flow hedges, net of reclassifications to cost of goods sold


 17,524
 17,524
Change in the funded status of retiree benefit obligations, net of tax of zero


 (2,802) (2,802)
ESOP compensation expense, including reclassifications
 
 (1,475) 
 4,801
 
 3,326
Share-based compensation(4,936) (5) 1,371


 1,366
Stock option exercises112,964
 113
 1,367


 1,480
Balance at June 30, 201416,562,450
 $16,562
 $35,917
 $106,212
 $(16,035) $(27,792) $114,864
Net income
 
 
 652
 
 
 652
Unrealized losses on derivative instruments designated as cash flow hedges, net of reclassifications to cost of goods sold


 (18,506) (18,506)
Change in the funded status of retiree benefit obligations, net of tax of zero


 (14,122) (14,122)
ESOP compensation expense, including reclassifications
 
 (377) 
 4,801
 
 4,424
Share-based compensation4,272
 4
 1,263


 1,267
Stock option exercises95,723
 96
 1,452


 1,548
Shares withheld to cover taxes(4,297) (4) (112) 
 
 
 (116)
Balance at June 30, 201516,658,148
 $16,658
 $38,143
 $106,864
 $(11,234) $(60,420) $90,011
Net income
 
 
 89,918
 
 
 89,918
Unrealized gains on derivative instruments designated as cash flow hedges, net of reclassifications to cost of goods sold, net of tax of $5,238


 8,249
 8,249
Change in the funded status of retiree benefit obligations, net of tax benefit of $7,277


 (11,461) (11,461)
ESOP compensation expense, including reclassifications
 
 (1,413) 
 4,800
 
 3,387
Share-based compensation1,551
 2
 954


 956
Stock option exercises127,039
 127
 1,566


 1,693
Shares withheld to cover taxes(5,177) (5) (154) 
 
 
 (159)
Balance at June 30, 201616,781,561
 $16,782
 $39,096
 $196,782
 $(6,434) $(63,632) $182,594

The accompanying notes are an integral part of these financial statements.


FARMER BROS. CO.
NOTES TO CONSOLIDATED FINANCIAL STATEMENTS


Note 1. Summary of Significant Accounting Policies
Overview
Farmer Bros. Co., a Delaware corporation (including its consolidated subsidiaries unless the context otherwise requires, the “Company,” or “Farmer Bros.”), is a national coffee roaster, wholesaler and distributor of coffee, tea and culinary products. The Company serves a wide variety of customers, from small independent restaurants and foodservice operators to large institutional buyers like restaurant and convenience store chains, hotels, casinos, hospitals, and gourmet coffee houses, as well as grocery chains with private brand and consumer-branded coffee products. The Company’s product categories consist of roast and ground coffee, frozen liquid coffee; flavored and unflavored iced and hot teas; culinary products; spices; and other beverages including cappuccino, cocoa, granitas, and ready-to-drink iced coffee. The Company was founded in 1912, incorporated in California in 1923, and reincorporated in Delaware in 2004. The Company operates in one business segment.
The Company operates production facilities in Portland, Oregon and Houston, Texas. Distribution takes place out of the Portland facility as well as separate distribution centers in Northlake, Illinois; Oklahoma City, Oklahoma; and Moonachie, New Jersey. As of June 30, 2016, the Company’s Torrance facility continued to house certain administrative functions and serve as a distribution facility and branch warehouse pending transition of the Company’s remaining Torrance operations to its other facilities.
The Company’s products reach its customers primarily in two ways: through the Company’s nationwide direct-store-delivery, or DSD, network of 450 delivery routes and 109 branch warehouses as of June 30, 2016, or direct-shipped via common carriers or third-party distributors. The Company operates a large fleet of trucks and other vehicles to distribute and deliver its products, and relies on third-party logistic (“3PL”) service providers for its long-haul distribution. DSD sales are made “off-truck” by the Company to its customers at their places of business.
Principles of Consolidation
The consolidated financial statements include the accounts of the Company and its direct and indirect wholly owned subsidiaries FBC Finance Company, a California corporation, Coffee Bean Holding Co., Inc., a Delaware corporation, the parent company of Coffee Bean International, Inc., an Oregon corporation (“CBI”), and CBI. All inter-company balances and transactions have been eliminated.
Use of Estimates
The preparation of financial statements in accordance with U.S. generally accepted accounting principles (“GAAP”) requires management to make estimates and assumptions that affect the amounts reported in the consolidated financial statements and accompanying notes. The Company reviews its estimates on an ongoing basis using currently available information. Changes in facts and circumstances may result in revised estimates and actual results may differ from those estimates.
Cash Equivalents
The Company considers all highly liquid investments with original maturity dates of 90 days or less to be cash equivalents. Fair values of cash equivalents approximate cost due to the short period of time to maturity.
Investments
The Company’s investments consist of money market instruments, marketable debt, equity and hybrid securities. Investments are held for trading purposes and stated at fair value. The cost of investments sold is determined on the specific identification method. Dividend and interest income are accrued as earned. See Note 8.

Farmer Bros. Co.
Notes to Consolidated Financial Statements (continued)


Fair Value Measurements
The Company groups its assets and liabilities at fair value in three levels, based on the markets in which the assets and liabilities are traded and the reliability of the assumptions used to determine fair value. These levels are:
Level 1—Valuation is based upon quoted prices for identical instruments traded in active markets.
Level 2—Valuation is based upon inputs other than quoted prices included within Level 1 that are observable for the asset or liability, either directly or indirectly (i.e. interest rate and yield curves observable at commonly quoted intervals, default rates, etc.). Observable inputs include quoted prices for similar instruments in active and non- active markets. Level 2 includes those financial instruments that are valued with industry standard valuation models that incorporate inputs that are observable in the marketplace throughout the full term of the instrument, or can otherwise be derived from or supported by observable market data in the marketplace. Level 2 inputs may also include insignificant adjustments to market observable inputs.
Level 3—Valuation is based upon one or more unobservable inputs that are significant in establishing a fair value estimate. These unobservable inputs are used to the extent relevant observable inputs are not available and are developed based on the best information available. These inputs may be used with internally developed methodologies that result in management’s best estimate of fair value.
Securities with quotes that are based on actual trades or actionable bids and offers with a sufficient level of activity on or near the measurement date are classified as Level 1. Securities that are priced using quotes derived from implied values, indicative bids and offers, or a limited number of actual trades, or the same information for securities that are similar in many respects to those being valued, are classified as Level 2. If market information is not available for securities being valued, or materially-comparable securities, then those securities are classified as Level 3. In considering market information, management evaluates changes in liquidity, willingness of a broker to execute at the quoted price, the depth and consistency of prices from pricing services, and the existence of observable trades in the market (see Note 9).
Derivative Instruments
The Company purchases various derivative instruments to create economic hedges of its commodity price risk. These derivative instruments consist primarily of forward and option contracts. The Company reports the fair value of derivative instruments on its consolidated balance sheets in “Short-term derivative assets,” “Other assets,” “Short-term derivative liabilities,” or “Other long-term derivative liabilities.” The Company determines the current and noncurrent classification based on the timing of expected future cash flows of individual trades and reports these amounts on a gross basis. Additionally, the Company reports cash held on deposit in margin accounts for coffee-related derivative instruments on a gross basis on its consolidated balance sheet in “Restricted cash” if restricted from withdrawal due to a net loss position in such margin accounts.
The accounting for the changes in fair value of the Company's derivative instruments can be summarized as follows:
Derivative TreatmentAccounting Method
Normal purchases and normal sales exceptionAccrual accounting
Designated in a qualifying hedging relationshipHedge accounting
All other derivative instrumentsMark-to-market accounting
The Company enters into green coffee purchase commitments at a fixed price or at a price to be fixed (“PTF”). PTF contracts are purchase commitments whereby the quality, quantity, delivery period, price differential to the coffee “C” market price and other negotiated terms are agreed upon, but the date, and therefore the price at which the base “C” market price will be fixed has not yet been established. The coffee “C” market price is fixed at some point after the purchase contract date and before the futures market closes for the delivery month and may be fixed either at the direction of the Company to the vendor, or by the application of a derivative that was separately purchased as a hedge. For both fixed-price and PTF contracts, the Company expects to take delivery of and to utilize the coffee in a reasonable period of time and in the conduct of normal business. Accordingly, these purchase commitments qualify as normal purchases and are not recorded at fair value on the Company's consolidated balance sheets.
The Company follows the guidelines of Accounting Standards Codification (“ASC”) 815, “Derivatives and Hedging” (“ASC 815”), to account for certain coffee-related derivative instruments as accounting hedges in order to minimize the volatility created in the Company's quarterly results from utilizing these derivative contracts and to improve comparability between reporting periods. For a derivative to qualify for designation in a hedging relationship, it must meet specific criteria

Farmer Bros. Co.
Notes to Consolidated Financial Statements (continued)


and the Company must maintain appropriate documentation. The Company establishes hedging relationships pursuant to its risk management policies. The hedging relationships are evaluated at inception and on an ongoing basis to determine whether the hedging relationship is, and is expected to remain, highly effective in achieving offsetting changes in fair value or cash flows attributable to the underlying risk being hedged. The Company also regularly assesses whether the hedged forecasted transaction is probable of occurring. If a derivative ceases to be or is no longer expected to be highly effective, or if the Company believes the likelihood of occurrence of the hedged forecasted transaction is no longer probable, hedge accounting is discontinued for that derivative, and future changes in the fair value of that derivative are recognized in “Other, net.”
For coffee-related derivative instruments designated as cash flow hedges, the effective portion of the change in fair value of the derivative is reported as accumulated other comprehensive income (loss) (“AOCI”) and subsequently reclassified into cost of goods sold in the period or periods when the hedged transaction affects earnings. Any ineffective portion of the derivative instrument's change in fair value is recognized currently in “Other, net. Gains or losses deferred in AOCI associated with terminated derivative instruments, derivative instruments that cease to be highly effective hedges, derivative instruments for which the forecasted transaction is reasonably possible but no longer probable of occurring, and cash flow hedges that have been otherwise discontinued remain in AOCI until the hedged item affects earnings. If it becomes probable that the forecasted transaction designated as the hedged item in a cash flow hedge will not occur, any gain or loss deferred in AOCI is recognized in “Other, net” at that time. For derivative instruments that are not designated in a hedging relationship, and for which the normal purchases and normal sales exception has not been elected, the changes in fair value are reported in “Other, net.”
The following gains and losses on derivative instruments are netted together and reported in “Other, net” in the Company's consolidated statements of operations:
Gains and losses on all derivative instruments that are not designated as cash flow hedges and for which the normal purchases and normal sales exception has not been elected; and
The ineffective portion of unrealized gains and losses on derivative instruments that are designated as cash flow hedges.
The fair value of derivative instruments is based upon broker quotes. At June 30, 2016 and 2015 approximately 96% and 94%, respectively, of the Company's outstanding coffee-related derivative instruments were designated as cash flow hedges (see Note 7).
Concentration of Credit Risk
At June 30, 2016, the financial instruments which potentially expose the Company to concentration of credit risk consist of cash in financial institutions (in excess of federally insured limits), short-term investments, investments in the preferred stocks of other companies, derivative instruments and trade receivables. Cash equivalents and short-term investments are not concentrated by issuer, industry or geographic area. Maturities are generally shorter than 180 days. Investments in the preferred stocks of other companies are limited to high quality issuers and are not concentrated by geographic area or issuer.
The Company does not have any credit-risk related contingent features that would require it to post additional collateral in support of its net derivative liability positions. At June 30, 2016, because the Company had a net gain position in its coffee-related derivative margin accounts, none of the cash in these accounts was restricted. At June 30, 2015, the Company had $1.0 million in restricted cash representing cash held on deposit in margin accounts for coffee-related derivative instruments due to a net loss position in such accounts. Changes in commodity prices and the number of coffee-related derivative instruments held could have a significant impact on cash deposit requirements under the Company's broker and counterparty agreements.
Concentration of credit risk with respect to trade receivables for the Company is limited due to the large number of customers comprising the Company’s customer base and their dispersion across many different geographic areas. The trade receivables are generally short-term and all probable bad debt losses have been appropriately considered in establishing the allowance for doubtful accounts. In fiscal 2016 and 2014, the Company increased the allowance for doubtful accounts by $71,000 and $80,000, respectively. In fiscal 2015, the Company decreased the allowance for doubtful accounts by $8,000.

Farmer Bros. Co.
Notes to Consolidated Financial Statements (continued)


Inventories
Inventories are valued at the lower of cost or market. The Company accounts for coffee, tea and culinary products on a last in, first out (“LIFO”) basis, and coffee brewing equipment parts on a first in, first out (“FIFO”) basis. The Company regularly evaluates these inventories to determine inventory reserves for obsolete and slow-moving inventory. Inventory reserves are based on inventory obsolescence trends, historical experience and application of specific identification.
At the end of each quarter, the Company records the expected effect of the liquidation of LIFO inventory quantities, if any, and records the actual impact at fiscal year-end. An actual valuation of inventory under the LIFO method is made only at the end of each fiscal year based on the inventory levels and costs at that time. If inventory quantities decline at the end of the fiscal year compared to the beginning of the fiscal year, the reduction results in the liquidation of LIFO inventory quantities carried at the cost prevailing in prior years. This LIFO inventory liquidation may result in a decrease or increase in cost of goods sold depending on whether the cost prevailing in prior years was lower or higher, respectively, than the current year cost. See Note 11.
Property, Plant and Equipment
Property, plant and equipment is carried at cost, less accumulated depreciation. Depreciation is computed using the straight-line method. The following useful lives are used:
Buildings and facilities10 to 30 years
Machinery and equipment3 to 5 years
Equipment under capital leasesTerm of lease
Office furniture and equipment5 years
Capitalized software3 years
Leasehold improvements are depreciated on a straight-line basis over the lesser of the estimated useful life of the asset or the remaining lease term. When assets are sold or retired, the asset and related accumulated depreciation are removed from the respective account balances and any gain or loss on disposal is included in operations. Maintenance and repairs are charged to expense, and betterments are capitalized. See Note 12.
Assets to be disposed of by sale are recorded as held for sale at the lower of carrying value or estimated net realizable value. The Company considers properties to be assets held for sale when (1) management commits to a plan to sell the property; (2) it is unlikely that the disposal plan will be significantly modified or discontinued; (3) the property is available for immediate sale in its present condition; (4) actions required to complete the sale of the property have been initiated; (5) sale of the property is probable and the Company expects the completed sale will occur within one year; and (6) the property is actively being marketed for sale at a price that is reasonable given the Company's estimate of current market value. Upon designation of a property as an asset held for sale, the Company records the property’s value at the lower of its carrying value or its estimated fair value less estimated costs to sell and ceases depreciation. See Note 6.
The Company may incur certain other non-cash asset impairment costs in connection with the Corporate Relocation Plan.
Coffee Brewing Equipment and Service
The Company classifies certain expenses related to coffee brewing equipment provided to customers as cost of goods sold. These costs include the cost of the equipment as well as the cost of servicing that equipment (including service employees’ salaries, cost of transportation and the cost of supplies and parts) and are considered directly attributable to the generation of revenues from its customers. The Company capitalizes coffee brewing equipment and depreciates it over an estimated three or five year period, depending on the assessment of the useful life and reports the depreciation expense in cost of goods sold. Accordingly, such costs included in cost of goods sold in the accompanying consolidated financial statements for the years ended June 30, 2016, 2015 and 2014 are $27.0 million, $26.6 million and $25.9 million, respectively. In addition, depreciation expense related to capitalized coffee brewing equipment reported in cost of goods sold in the fiscal years ended June 30, 2016, 2015 and 2014 was $9.8 million, $10.4 million and $10.9 million, respectively. The Company capitalized coffee brewing equipment (included in machinery and equipment) in the amounts of $8.4 million and $10.7 million in fiscal 2016 and 2015, respectively.

Farmer Bros. Co.
Notes to Consolidated Financial Statements (continued)


Leases
Leases are categorized as either operating or capital leases at inception. Operating lease costs are recognized on a straight-line basis over the term of the lease. An asset and a corresponding liability for the capital lease obligation are established for the cost of capital leases. The capital lease obligation is amortized over the life of the lease. For leases such as the New Facility lease, the Company establishes an asset and liability for the estimated construction costs incurred to the extent that it is involved in the construction of structural improvements or takes construction risk prior to the commencement of the lease. A portion of the lease arrangement is allocated to the land for which the Company accrues rent expense during the construction period. The amount of rent expense to be accrued is determined using the fair value of the leased land at construction commencement and the Company’s incremental borrowing rate, and recognized on a straight-line basis. See Note 4.
Income Taxes
Deferred income taxes are determined based on the temporary differences between the financial reporting and tax bases of assets and liabilities using enacted tax rates in effect for the year in which differences are expected to reverse. Estimating the Company’s tax liabilities involves judgments related to uncertainties in the application of complex tax regulations. The Company makes certain estimates and judgments to determine tax expense for financial statement purposes as it evaluates the effect of tax credits, tax benefits and deductions, some of which result from differences in the timing of recognition of revenue or expense for tax and financial statement purposes. Changes to these estimates may result in significant changes to the Company’s tax provision in future periods. Each fiscal quarter the Company re-evaluates its tax provision and reconsiders its estimates and assumptions related to specific tax assets and liabilities, making adjustments as circumstances change.
Deferred Tax Asset Valuation Allowance
The Company evaluates its deferred tax assets quarterly to determine if a valuation allowance is required and considers whether a valuation allowance should be recorded against deferred tax assets based on the likelihood that the benefits of the deferred tax assets will or will not ultimately be realized in future periods. In making this assessment, significant weight is given to evidence that can be objectively verified, such as recent operating results, and less consideration is given to less objective indicators, such as future income projections. After consideration of positive and negative evidence, including the recent history of income, if the Company determines that it is more likely than not that it will generate future income sufficient to realize its deferred tax assets, the Company will record a reduction in the valuation allowance. See Note 20.
Revenue Recognition
The Company recognizes sales revenue when all of the following have occurred: (1) delivery; (2) persuasive evidence of an agreement exists; (3) pricing is fixed or determinable; and (4) collection is reasonably assured. When product sales are made “off-truck” to the Company’s customers at their places of business or products are shipped by third-party delivery "FOB Destination," title passes and revenue is recognized upon delivery. When customers pick up products at the Company's distribution centers, title passes and revenue is recognized upon product pick up.
Net Income Per Common Share
Net income per share (“EPS”) represents net income attributable to common stockholders divided by the weighted-average number of common shares outstanding for the period, excluding unallocated shares held by the Company's Employee Stock Ownership Plan (“ESOP”) (see Note 16). Diluted EPS represents net income attributable to common stockholders divided by the weighted-average number of common shares outstanding, inclusive of the dilutive impact of common equivalent shares outstanding during the period. However, nonvested restricted stock awards (referred to as participating securities) are excluded from the dilutive impact of common equivalent shares outstanding in accordance with authoritative guidance under the two-class method. The nonvested restricted stockholders are entitled to participate in dividends declared on common stock as if the shares were fully vested and hence are deemed to be participating securities. Under the two-class method, net income attributable to nonvested restricted stockholders is excluded from net income attributable to common stockholders for purposes of calculating basic and diluted EPS. Computation of EPS for the years ended June 30, 2016, 2015 and 2014 includes the dilutive effect of 124,879, 139,524 and 104,956 shares, respectively, issuable under stock options with exercise prices below the closing price of the Company's common stock on the last trading day of the applicable period, but excludes the dilutive effect of 30,931, 10,455 and 22,441 shares, respectively, issuable under stock options with exercise prices above the closing price of the Company's common stock on the last trading day of the applicable period because their inclusion would be anti-dilutive. See Note 21.

Farmer Bros. Co.
Notes to Consolidated Financial Statements (continued)


Dividends
The Company’s Board of Directors has omitted the payment of a quarterly dividend since the third quarter of fiscal 2011. The amount, if any, of dividends to be paid in the future will depend upon the Company’s then available cash, anticipated cash needs, overall financial condition, credit agreement restrictions, future prospects for earnings and cash flows, as well as other relevant factors.
Employee Stock Ownership Plan
Compensation cost for the ESOP is based on the fair market value of shares released or deemed to be released to employees in the period in which they are committed. Dividends on allocated shares retain the character of true dividends, but dividends on unallocated shares are considered compensation cost. As a leveraged ESOP with the Company as lender, a contra equity account is established to offset the Company’s note receivable. The contra account will change as compensation expense is recognized (see Note 16). The cost of shares purchased by the ESOP which have not been committed to be released or allocated to participants are shown as a contra-equity account “Unearned ESOP Shares” and are excluded from earnings per share calculations.
Share-based Compensation
On December 5, 2013, the Company’s stockholders approved the Farmer Bros. Co. Amended and Restated 2007 Long-Term Incentive Plan (the “Amended Equity Plan”). The principal change to the Amended Equity Plan was to limit awards under the plan to performance-based stock options and to restricted stock under limited circumstances.
The Company measures all share-based compensation cost at the grant date, based on the fair values of the awards that are ultimately expected to vest, and recognizes that cost as an expense on a straight line-basis in its consolidated statements of operations over the requisite service period. Fair value of restricted stock is the closing price of the Company's common stock on the date of grant. The Company estimates the fair value of option awards using the Black-Scholes option valuation model, which requires management to make certain assumptions for estimating the fair value of stock options at the date of grant. The Black-Scholes option valuation model was developed for use in estimating the fair value of traded options that have no vesting restrictions and are fully transferable. Because the Company’s stock options have characteristics significantly different from those of traded options, and because changes in the subjective input assumptions can materially affect the fair value estimates, in management’s opinion, the existing models may not necessarily provide a reliable single measure of the fair value of the Company’s stock options. Although the fair value of stock options is determined using an option valuation model, that value may not be indicative of the fair value observed in a willing buyer/willing seller market transaction. See Note 17.
Impairment of Goodwill and Indefinite-lived Intangible Assets
The Company accounts for its goodwill and indefinite-lived intangible assets in accordance with ASC 350, “Intangibles-Goodwill and Other” (“ASC 350”). Goodwill and other indefinite-lived intangible assets are not amortized but instead are reviewed for impairment annually, or more frequently if an event occurs or circumstances change which indicate that an asset might be impaired. Pursuant to ASC 350, the Company performs a qualitative assessment of goodwill and indefinite-lived intangible assets on its consolidated balance sheets, to determine if there is a more likely than not indication that its goodwill and indefinite-lived intangible assets are impaired as of June 30. If the indicators of impairment are present, the Company performs a quantitative assessment to determine the impairment of these assets as of the measurement date.
Testing for impairment of goodwill is a two-step process. The first step requires the Company to compare the fair value of its reporting unit to the carrying value of the reporting unit, including goodwill. If the fair value of the reporting unit is less than its carrying value, goodwill of the reporting unit is potentially impaired and the Company then completes step two to measure the impairment loss, if any. The second step requires the calculation of the implied fair value of goodwill, which is the residual fair value remaining after deducting the fair value of all tangible and intangible net assets of the reporting unit from the fair value of the reporting unit. If the implied fair value of goodwill is less than the carrying amount of goodwill, an impairment loss is recognized equal to the difference.
Indefinite-lived intangible assets are tested for impairment by comparing their fair values to their carrying values. An impairment charge is recorded if the estimated fair value of such assets has decreased below their carrying values. Long-lived assets evaluated for impairment are grouped with other assets to the lowest level for which identifiable cash flows are largely independent of the cash flows of other groups of assets and liabilities. The estimated future cash flows are based upon, among other things, assumptions about expected future operating performance and may differ from actual cash flows. If the sum of the

Farmer Bros. Co.
Notes to Consolidated Financial Statements (continued)


projected undiscounted cash flows (excluding interest) is less than the carrying value of the assets, the assets will be written down to the estimated fair value in the period in which the determination is made.
There were no intangible asset or goodwill impairment charges recorded in the fiscal year ended June 30, 2016 or 2015.
Other Intangible Assets
Other intangible assets consist of finite-lived intangible assets including acquired non-compete agreements and customer relationships. These are amortized over their estimated useful lives and are tested for impairment by grouping them with other assets at the lowest level for which identifiable cash flows are largely independent of the cash flows of other groups of assets and liabilities. The estimated future cash flows are based upon, among other things, assumptions about expected future operating performance, and may differ from actual cash flows. If the sum of the projected undiscounted cash flows (excluding interest) is less than the carrying value of the assets, the assets will be written down to the estimated fair value in the period in which the determination is made. The Company reviews the recoverability of its long-lived assets whenever events or changes in circumstances indicate that the carrying amount of such assets may not be recoverable. There were no other intangible asset impairment charges recorded in the fiscal year ended June 30, 2016 and 2015.
Shipping and Handling Costs
Shipping and handling costs incurred through outside carriers are recorded as a component of the Company's selling expenses and were $13.3 million, $8.3 million and $8.4 million, respectively, in the fiscal years ended June 30, 2016, 2015 and 2014. Shipping and handling costs in fiscal 2016 include costs related to the Company's move to 3PL for its long-haul operations.
Collective Bargaining Agreements
Certain Company employees are subject to collective bargaining agreements. The duration of these agreements extend to 2020. At June 30, 2016, approximately 31% of the Company's workforce was covered by such agreements.
Self-Insurance
The Company uses a combination of insurance and self-insurance mechanisms, including the use of captive insurance entities and participation in a reinsurance treaty, to provide for the potential liability of certain risks including workers’ compensation, health care benefits, general liability, product liability, property insurance and director and officers’ liability insurance. Liabilities associated with risks retained by the Company are not discounted and are estimated by considering historical claims experience, demographics, exposure and severity factors and other actuarial assumptions.
The Company's self-insurance for workers’ compensation liability includes estimated outstanding losses of unpaid claims. and allocated loss adjustment expenses (“ALAE”), case reserves, the development of known claims and incurred but not reported claims. ALAE are the direct expenses for settling specific claims. The amounts reflect per occurrence and annual aggregate limits maintained by the Company. The estimated liability analysis does not include estimating a provision for unallocated loss adjustment expenses.
The estimated gross undiscounted workers’ compensation liability relating to such claims was $14.7 million and $13.4 million respectively, and the estimated recovery from reinsurance was $2.4 million and $2.5 million, respectively, as of June 30, 2016 and 2015. The short-term and long-term accrued liabilities for workers’ compensation claims are presented on the Company's consolidated balance sheets in “Other current liabilities” and in “Accrued workers' compensation liabilities,” respectively. The estimated insurance receivable is included in “Other assets” on the Company's consolidated balance sheets.
At June 30, 2016 and 2015, the Company posted a $7.4 million and $7.0 million letter of credit, respectively, as a security deposit with the State of California Department of Industrial Relations Self-Insurance Plans for participation in the alternative security program for California self-insurers for workers’ compensation liability. At June 30, 2016 and 2015, the Company had posted a $4.3 million letter of credit as a security deposit for self-insuring workers’ compensation, general liability and auto insurance coverages outside of California.
The estimated liability related to the Company's self-insured group medical insurance at June 30, 2016 and 2015 was $1.3 million and $1.0 million, respectively, recorded on an incurred but not reported basis, within deductible limits, based on actual claims and the average lag time between the date insurance claims are filed and the date those claims are paid.

Farmer Bros. Co.
Notes to Consolidated Financial Statements (continued)


General liability, product liability and commercial auto liability are insured through a captive insurance program. The Company's liability reserve for such claims was $0.9 million and $0.8 million at June 30, 2016 and 2015, respectively.
The estimated liability related to the Company's self-insured group medical insurance, general liability, product liability and commercial auto liability is included on the Company's consolidated balance sheets in “Other current liabilities.”
Pension Plans
The Company’s pension plans are not admitting new participants, therefore, changes to pension liabilities are primarily due to market fluctuations of investments for existing participants and changes in interest rates. All plans are accounted for using the guidance of ASC 710, "Compensation - General" and ASC 715 "Compensation-Retirement Benefits" and are measured as of the end of the fiscal year.
The Company recognizes the overfunded or underfunded status of a defined benefit pension or postretirement plan as an asset or liability in the accompanying consolidated balance sheets. Changes in the funded status are recognized through AOCI, in the year in which the changes occur. See Note 14.
Business Combinations
The Company accounts for business combinations under the acquisition method of accounting. The purchase price of each business acquired is allocated to the tangible and intangible assets acquired and the liabilities assumed based on information regarding their respective fair values on the date of acquisition. Any excess of the purchase price over the fair value of the separately identifiable assets acquired and the liabilities assumed is allocated to goodwill. Management determines the fair values used in purchase price allocations for intangible assets based on historical data, estimated discounted future cash flows, and expected royalty rates for trademarks and trade names, as well as certain other information. The valuation of assets acquired and liabilities assumed requires a number of judgments and is subject to revision as additional information about the fair value of assets and liabilities becomes available. Additional information, which existed as of the acquisition date but unknown to the Company at that time, may become known during the remainder of the measurement period, a period not to exceed twelve months from the acquisition date. Adjustments in the purchase price allocation may require a recasting of the amounts allocated to goodwill and intangible assets. Acquisition costs are expensed as incurred. The results of operations of businesses acquired are included in the consolidated financial statements from their dates of acquisition. See Note 2.
Sale of Spice Assets
On December 8, 2015, the Company completed the sale of certain assets associated with the Company’s manufacture, processing and distribution of raw, processed and blended spices and certain other culinary products (collectively, the “Spice Assets”) to Harris Spice Company, Inc. (“Harris”). The Company has followed the guidance in ASC 205-20, "Presentation of Financial Statements-Discontinued Operations," as updated by Accounting Standards Update ("ASU") No. 2014-08, "Presentation of Financial Statements (Topic 205) and Property, Plant, and Equipment (Topic 360): Reporting Discontinued Operations and Disclosures of Disposals of Components of an Entity" and has not presented the sale of the Spice Assets as discontinued operations. Gain from the earnout on the sale is recognized when earned and when realization is assured beyond a reasonable doubt. See Note 5.
Recently Adopted Accounting Standards
In March 2016, the Financial Accounting Standards Board (the "FASB") issued ASU No. 2016-05, "Derivatives and Hedging (Topic 815): Effect of Derivative Contract Novations on Existing Hedge Accounting Relationships (a consensus of the FASB Emerging Issues Task Force" ("ASU 2016-05"). ASU 2016-05 clarifies that "a change in the counterparty to a derivative instrument that has been designated as the hedging instrument in an existing hedging relationship would not, in and of itself, be considered a termination of the derivative instrument" or "a change in a critical term of the hedging relationship." As long as all other hedge accounting criteria in ASC 815 are met, a hedging relationship in which the hedging derivative instrument is novated would not be discontinued or require redesignation. This clarification applies to both cash flow and fair value hedging relationships. For public business entities, ASU 2016-05 is effective for financial statements issued for annual periods beginning after December 15, 2016, and interim periods within those annual periods. Early application is permitted including adoption in an interim period. The Company early adopted ASU 2016-05 beginning in April 1, 2016. Adoption of ASU 2016-05 did not have a material effect on the results of operations, financial position or cash flows of the Company.

Farmer Bros. Co.
Notes to Consolidated Financial Statements (continued)


In November 2015, the FASB issued ASU No. 2015-17, "Income Taxes (Topic 740): Balance Sheet Classification of Deferred Taxes" ("ASU 2015-17"), which requires entities to present deferred tax assets ("DTAs") and deferred tax liabilities ("DTLs") as noncurrent in a classified balance sheet. ASU 2015-17 simplifies the current guidance, which requires entities to separately present DTAs and DTLs as current and noncurrent in a classified balance sheet. For public business entities, the amendments in ASU 2015-17 are effective for financial statements issued for annual periods beginning after December 15, 2016, and interim periods within those annual periods. Early application is permitted as of the beginning of an interim or annual reporting period. The Company early adopted ASU 2015-17 beginning in April 1, 2016. Adoption of ASU 2015-17 did not have a material effect on the results of operations, financial position or cash flows of the Company.
In August 2015, the FASB issued ASU No. 2015-15, “Interest-Imputation of Interest (Subtopic 835-30): Presentation and Subsequent Measurement of Debt Issuance Costs Associated with Line-of-Credit Arrangements” (“ASU 2015-15”). ASU 2015-15 incorporates into the ASC an SEC staff announcement that the SEC staff will not object to an entity presenting the cost of securing a revolving line of credit as an asset, regardless of whether a balance is outstanding. The standard, as issued, did not address revolving lines of credit, which may not have outstanding balances. An entity that repeatedly draws on a revolving credit facility and then repays the balance could present the cost as a deferred asset and reclassify all or a portion of it as a direct deduction from the liability whenever a balance is outstanding. However, the SEC staff’s announcement provides a less-cumbersome alternative. Either way, the cost should be amortized over the term of the arrangement. The Company adopted ASU 2015-15 beginning July 1, 2015. Adoption of ASU 2015-15 did not have a material effect on the results of operations, financial position or cash flows of the Company.
New Accounting Pronouncements
In May 2016, the FASB issued ASU No. 2016-12, "Revenue from Contracts with Customers (Topic 606); Identifying Performance Obligations and Licensing" ("ASU 2016-12"), which clarifies guidance related to identifying performance obligations and licensing implementation guidance contained in the new revenue recognition standard. The amendments in ASU 2016-12 affect the guidance in ASU 2014-09, "Revenue From Contracts With Customers (Topic 606) ("ASU 2014-09") which is not yet effective. The effective date and transition requirements for the amendments in ASU 2016-12 are the same as the effective date and transition requirements in ASC 606 (and any other Topic amended by ASU 2014-09). ASU 2015-14, "Revenue From Contracts With Customers (Topic 606): Deferral of the Effective Date," ("ASU 2015-14"). defers the effective date of ASU 2014-09 by one year and, therefore, the deferral results in ASU 2014-09 and its amendment ASU 2016-12 being effective January 1, 2018.
In April 2016, the FASB issued ASU No. 2016-10 "Revenue from Contracts with Customers (Topic 606); Identifying Performance Obligations and Licensing" ("ASU 2016-10"), which clarifies guidance related to identifying performance obligations and licensing implementation guidance contained in the new revenue recognition standard. ASU 2016-10 seeks to pro-actively address areas in which diversity in practice potentially could arise, as well as to reduce the cost and complexity of applying certain aspects of the guidance both at implementation and on an ongoing basis. The effective date and transition requirements for the amendments in ASU 2016-10 are the same as the effective date and transition requirements in ASU 2014-09, which is effective January 1, 2018.
In March 2016, the FASB issued ASU No. 2016-09, "Compensation—Stock Compensation (Topic 718): Improvements to Employee Share-Based Payment Accounting" ("ASU 2016-09"). ASU 2016-09 is being issued as part of the FASB's Simplification Initiative. The areas for simplification in ASU 2016-09 involve several aspects of the accounting for share-based payment transactions, including the income tax consequences, classification of awards as either equity or liabilities, and classification on the statement of cash flows. Some of the areas for simplification apply only to nonpublic entities. For public business entities, the amendments in ASU 2016-09 are effective for annual periods beginning after December 15, 2016, and interim periods within those annual periods. Early adoption is permitted for any entity in any interim or annual period. If an entity early adopts the amendments in an interim period, any adjustments should be reflected as of the beginning of the fiscal year that includes that interim period. An entity that elects early adoption must adopt all of the amendments in the same period. ASU 2016-09 is effective for the Company beginning July 1, 2017. Adoption of ASU 2016-09 is not expected to have a material effect on the results of operations, financial position or cash flows of the Company.
In February 2016, the FASB issued ASU No. 2016-02, "Leases (Topic 842)" ("ASU 2016-02"), which introduces a new lessee model that brings substantially all leases onto the balance sheet. In addition, while the new guidance retains most of the principles of the existing lessor model in GAAP, it aligns many of those principles with ASC 606, "Revenue From Contracts With Customers." For public business entities, ASU 2016-02 is effective for financial statements issued for annual periods beginning after December 15, 2018, and interim periods within those annual periods. Early application is permitted. ASU

Farmer Bros. Co.
Notes to Consolidated Financial Statements (continued)


2016-02 is effective for the Company beginning July 1, 2019. Adoption of ASU 2016-02 is not expected to have a material effect on the results of operations, financial position or cash flows of the Company.
In September 2015, the FASB issued ASU No. 2015-16, “Business Combinations (Topic 805): Simplifying the Accounting for Measurement-Period Adjustments” (“ASU 2015-16”). ASU 2015-16 eliminates the requirement that an acquirer in a business combination account for measurement-period adjustments retrospectively. Instead, an acquirer will recognize a measurement-period adjustment during the period in which it determines the amount of the adjustment, including the effect on earnings of any amounts it would have recorded in previous periods if the accounting had been completed at the acquisition date. The guidance is effective for public business entities for fiscal years, including interim periods within those fiscal years, beginning after December 15, 2015, with early adoption permitted. ASU 2015-16 is effective for the Company beginning July 1, 2016. Adoption of ASU 2015-16 is not expected to have a material effect on the results of operations, financial position or cash flows of the Company.
In July 2015, the FASB issued ASU No. 2015-12, “Plan Accounting: Defined Benefit Pension Plans (Topic 960), Defined Contribution Pension Plans (Topic 962), Health and Welfare Benefit Plans (Topic 965), (Part I) Fully Benefit-Responsive Investment Contracts, (Part II) Plan Investment Disclosures, (Part III) Measurement Date Practical Expedient” ("ASU 2015-12”). ASU 2015-12 eliminates requirements that employee benefit plans measure the fair value of fully benefit-responsive investment contracts ("FBRICs") and provide the related fair value disclosures. As a result, FBRICs are measured, presented and disclosed only at contract value. Also, plans will be required to disaggregate their investments measured using fair value by general type, either on the face of the financial statements or in the notes, and self-directed brokerage accounts are one general type. Plans no longer have to disclose the net appreciation/depreciation in fair value of investments by general type or individual investments equal to or greater than 5% of net assets available for benefits. In addition, a plan with a fiscal year end that does not coincide with the end of a calendar month is allowed to measure its investments and investment-related accounts using the month end closest to its fiscal year end. The new guidance for FBRICs and plan investment disclosures should be applied retrospectively. The measurement date practical expedient should be applied prospectively. The guidance is effective for fiscal years beginning after December 15, 2015, with early adoption permitted. ASU 2015-12 is effective for the Company beginning July 1, 2016. Adoption of ASU 2015-12 is not expected to have a material effect on the results of operations, financial position or cash flows of the Company.
In July 2015, the FASB issued ASU No. 2015-11, “Inventory (Topic 330): Simplifying the Measurement of Inventory” (“ASU 2015-11”). ASU 2015-11 simplifies the subsequent measurement of inventory by requiring inventory to be measured at the lower of cost and net realizable value. Entities will continue to apply their existing impairment models to inventories that are accounted for using last-in first-out or LIFO and the retail inventory method or RIM. Under current guidance, net realizable value is one of several calculations an entity needs to make to measure inventory at the lower of cost or market. ASU 2015-11 is effective for public business entities for fiscal years beginning after December 15, 2016, including interim periods within those fiscal years. Early adoption is permitted, and the guidance must be applied prospectively after the date of adoption. ASU 2015-11 is effective for the Company beginning July 1, 2017. Adoption of ASU 2015-11 is not expected to have a material effect on the results of operations, financial position or cash flows of the Company.
In May 2015, the FASB issued ASU No. 2015-07, “Fair Value Measurement (Topic 820): Disclosures for Investments in Certain Entities That Calculate Net Asset Value per Share (or Its Equivalent)” (“ASU 2015-07”). ASU 2015-07 removes the requirement to categorize investments for which the fair values are measured using the net asset value per share practical expedient within the fair value hierarchy. It also limits certain disclosures to investments for which the entity has elected to measure the fair value using the practical expedient. ASU 2015-07 is effective for fiscal years, and interim periods within those years, beginning after December 15, 2015, with early adoption permitted. ASU 2015-07 is effective for the Company beginning July 1, 2016. The Company is in the process of assessing the impact of the adoption of ASU 2015-07 on its consolidated financial statements.
In May 2014, the FASB issued accounting guidance which requires an entity to recognize the amount of revenue to which it expects to be entitled for the transfer of promised goods or services to customers under ASU No. 2014-09, “Revenue from Contracts with Customers (Topic 606)” (“ASU 2014-09”). ASU 2014-09 will replace most existing revenue recognition guidance in GAAP when it becomes effective. On July 9, 2015, the FASB issued ASU No. 2015-14, "Revenue From Contracts with Customers (Topic 606): Deferral of the Effective Date," which defers the effective date of ASU 2014-09 by one year allowing early adoption as of the original effective date of January 1, 2017. The deferral results in the new accounting standard being effective January 1, 2018. The Company is currently evaluating the impact of ASU 2014-09 on its results of operations, financial position and cash flows.

Farmer Bros. Co.
Notes to Consolidated Financial Statements (continued)


Note 2. Acquisition
On January 12, 2015, the Company acquired substantially all of the assets of Rae’ Launo Corporation (“RLC”) relating to its DSD and in-room distribution business in the Southeastern United States (the “RLC Acquisition”). The purchase price was $1.5 million, consisting of $1.2 million in cash paid at closing and earnout payments of up to $0.1 million that the Company expects to pay each year over a three-year period based on achievement of certain milestones.
The following table summarizes the estimated fair values of the assets acquired at the date of acquisition, based on the final purchase price allocation:
Fair Values of Assets Acquired Estimated Useful Life (years)
(In thousands)   
Property, plant and equipment$338
  
Intangible assets:   
  Non-compete agreement20
 3.0
  Customer relationships870
 4.5
  Goodwill272
  
      Total assets acquired$1,500
  
Definite-lived intangible assets consist of a non-compete agreement and customer relationships. Total net carrying value of definite-lived intangible assets as of June 30, 2016 and 2015 was $0.6 million and $0.8 million, respectively, and accumulated amortization as of June 30, 2016 and 2015 was $0.3 million and $0.1 million, respectively. Estimated aggregate amortization of definite-lived intangible assets, calculated on a straight-line basis and based on estimated fair values is $0.2 million in each of the next three fiscal years commencing with fiscal 2017.

Note 3. Corporate Relocation Plan
On February 5, 2015, the Company announced a plan (the “Corporate Relocation Plan”) to close its Torrance, California facility and relocate its corporate headquarters, product development lab, and manufacturing and distribution operations from Torrance, California to a new facility housing these operations currently under construction in Northlake, Texas (the “New Facility”). Approximately 350 positions were impacted as a result of the Torrance facility closure. The Company’s decision resulted from a comprehensive review of alternatives designed to make the Company more competitive and better positioned to capitalize on growth opportunities.
Based on current assumptions and subject to continued implementation of the Corporate Relocation Plan, the Company estimates that it will incur approximately $31 million in cash costs in connection with the exit of the Torrance facility consisting of $18 million in employee retention and separation benefits, $5 million in facility-related costs and $8 million in other related costs. Expenses related to the Corporate Relocation Plan in fiscal 2016 consisted of $9.7 million in employee retention and separation benefits, $3.7 million in facility-related costs including lease of temporary office space, costs associated with the move of the Company's headquarters and the relocation of certain distribution operations and $3.1 million in other related costs including travel, legal, consulting and other professional services. Facility-related costs also included $1.0 million in non-cash depreciation expense associated with the Torrance production facility resulting from the consolidation of coffee production operations with the Houston and Portland production facilities.
Since adoption of the Corporate Relocation Plan through June 30, 2016, the Company has recognized a total of $25.7 million of the estimated $31 million in aggregate cash costs including $16.2 million in employee retention and separation benefits, $3.1 million in facility-related costs related to the relocation of the Company’s Torrance operations and certain distribution operations and $6.4 million in other related costs. The remainder is expected to be recognized in the first half of fiscal 2017. The Company also recognized from inception through fiscal 2016 $1.3 million in non-cash depreciation expense associated with the Torrance production facility. The Company may incur certain other non-cash asset impairment costs and pension-related costs in connection with the Corporate Relocation Plan.

Farmer Bros. Co.
Notes to Consolidated Financial Statements (continued)


The following table sets forth the activity in liabilities associated with the Corporate Relocation Plan for the fiscal year ended June 30, 2016:
(In thousands)
Balances,
June 30, 2015
 Additions Payments Non-Cash Settled Adjustments 
Balances,
June 30, 2016
Employee-related costs(1)$6,156
 $9,730
 $13,544
 $
 $
 $2,342
Facility-related costs(2)
 3,716
 2,712
 1,004
 
 
Other(3)200
 3,087
 3,087
 
 
 200
   Total(2)$6,356
 $16,533
 $19,343
 $1,004
 $
 $2,542
            
Current portion$6,356
         $2,542
Non-current portion$
         $
   Total$6,356
         $2,542
_______________
(1) Included in “Accrued payroll expenses” on the Company's consolidated balance sheets.
(2) Non-cash settled facility-related costs represent depreciation expense associated with the Torrance production facility resulting from the consolidation of coffee production operations with the Houston and Portland production facilities and included in "Property, plant and equipment, net" on the Company's consolidated balance sheets.
(3) Included in “Accounts payable” on the Company's consolidated balance sheets.

Note 4. New Facility Lease Obligation
On July 17, 2015, the Company entered into a lease agreement, (as amended the “Lease Agreement”), pursuant to which the New Facility is being constructed by the lessor ("Lessor") at its expense, in accordance with agreed upon specifications and plans determined as set forth in the Lease Agreement. Based on the final budget, which reflects substantial completion of the principal design work for the New Facility, the Company estimates that the construction costs for the New Facility will be approximately $55 million to $60 million. The Company recorded an asset related to the New Facility lease obligation included in property, plant and equipment of $28.1 million at June 30, 2016 and an offsetting liability of $28.1 million for the lease obligation in "Other long-term liabilities" on its consolidated balance sheet at June 30, 2016 (see Note 19). Rent expense associated with the portion of the lease allocated to the land in the fiscal year ended June 30, 2016 and 2015 was $0.3 million and $0, respectively. Construction of and relocation to the New Facility is expected to be completed in the third quarter of fiscal 2017.

In conjunction with the Lease Agreement, the Company also entered into a Development Management Agreement (the “DMA”) pursuant to which an affiliate of Stream Realty Partners (“Developer”) has agreed to manage, coordinate, represent, assist and advise the Company on matters concerning the pre-development, development, design, entitlement, infrastructure, site preparation and construction of the New Facility. Pursuant to the DMA, the Company will pay Developer:
a development fee of 3.25% of all development costs;
an oversight fee of 2% of any amounts paid to the Company-contracted parties for any oversight by Developer of Company-contracted work;
an incentive fee, the amount of which will be determined by the parties, if final completion occurs prior to the scheduled completion date; and
an amount equal to $2.6 million as additional fee in respect of development services.
On June 15, 2016, the Company exercised the purchase option under the Lease Agreement to acquire the partially constructed New Facility. The estimated purchase option exercise price for the New Facility is $58.8 million based on the budget for the completed facility. The actual option exercise price for the partially constructed New Facility will depend

Farmer Bros. Co.
Notes to Consolidated Financial Statements (continued)


upon, among other things, the timing of the closing and the actual costs incurred for construction of the New Facility as of the purchase option closing date.
In addition to the costs to complete the construction of the New Facility, the Company estimates that it will incur $35 million to $39 million for machinery and equipment, furniture and fixtures and related expenditures. As of June 30, 2016, the Company had spent $4.4 million toward the purchase of machinery and equipment for the New Facility. No such capital expenditures were incurred in fiscal 2015. The majority of the capital expenditures associated with machinery and equipment, furniture, fixtures and related expenditures for the New Facility are expected to be incurred in the first half of fiscal 2017.
Note  5. Sale of Spice Assets
In order to focus on its core products, on December 8, 2015, the Company completed the sale of the Spice Assets to Harris. Harris acquired substantially all of the Company’s personal property used exclusively in connection with the Spice Assets, including certain equipment; trademarks, tradenames and other intellectual property assets; contract rights under sales and purchase orders and certain other agreements; and a list of certain customers, other than the Company’s DSD customers, and assumed certain liabilities relating to the Spice Assets. The Company received $6.0 million in cash at closing, and is eligible to receive an earnout amount of up to $5.0 million over a three year period based upon a percentage of certain institutional spice sales by Harris following the closing. The Company recognized $0.5 million in earnout during the fiscal year ended June 30, 2016, a portion of which is included in net gains from the sale of Spice Assets.
In connection with the sale of the Spice Assets, the Company and Harris entered into certain other agreements, including (1) a transitional co-packaging supply agreement pursuant to which the Company, as the contractor, provided Harris with certain transition services for a six-month transitional period following the closing of the asset sale, and (2) an exclusive supply agreement pursuant to which Harris will supply to the Company, after the closing of the asset sale, spice and culinary products that were previously manufactured by the Company on negotiated pricing terms. While title to the Spice Assets transferred at closing, certain of the assets purchased by Harris were transferred to Harris' own manufacturing facilities, in phases, during the transitional period. As of June 30, 2016, the Company completed all the agreed upon transitional services to Harris. The sale of the Spice Assets does not represent a strategic shift for the Company and is not expected to have a material impact on the Company's results of operations because the Company will continue to sell a complete portfolio of spice and other culinary products purchased from Harris under the supply agreement to its DSD customers.
Note 6. Assets Held for Sale
At June 30, 2016, the Company had listed for sale its Torrance facility and one of its branch properties in Northern California. The Company actively marketed these properties, entered into purchase and sale agreements with prospective buyers and expected these properties to be sold within one year. Accordingly, the Company designated these properties as assets held for sale and recorded the carrying values of these properties in the aggregate amount of $7.2 million as "Assets held for sale" on the Company's consolidated balance sheet at June 30, 2016. Subsequent to the year end the sale transaction for the Torrance facility was completed (see Note 24).

Note 7. Derivative Instruments
Derivative Instruments Held
Coffee-Related Derivative Instruments
The Company is exposed to commodity price risk associated with its PTF green coffee purchase contracts, which are described further in Note 1. The Company utilizes forward and option contracts to manage exposure to the variability in expected future cash flows from forecasted purchases of green coffee attributable to commodity price risk. Certain of these coffee-related derivative instruments utilized for risk management purposes have been designated as cash flow hedges, while other coffee-related derivative instruments have not been designated as cash flow hedges or do not qualify for hedge accounting despite hedging the Company's future cash flows on an economic basis.

Farmer Bros. Co.
Notes to Consolidated Financial Statements (continued)


The following table summarizes the notional volumes for the coffee-related derivative instruments held by the Company at June 30, 2016 and 2015:
  June 30,
(In thousands) 2016 2015
Derivative instruments designated as cash flow hedges:    
  Long coffee pounds 32,550
 32,288
Derivative instruments not designated as cash flow hedges:    
  Long coffee pounds 1,618
 1,954
  Less: Short coffee pounds (188) 
      Total 33,980
 34,242
Coffee-related derivative instruments designated as cash flow hedges outstanding as of June 30, 2016 will expire within 18 months.

Effect of Derivative Instruments on the Financial Statements
Balance Sheets
Fair values of derivative instruments on the consolidated balance sheets:
  
Derivative Instruments
Designated as Cash Flow Hedges
 Derivative Instruments Not Designated as Accounting Hedges
  June 30, June 30,
(In thousands) 2016(1) 2015(2) 2016(1) 2015(2)
Financial Statement Location:        
Short-term derivative assets:        
Coffee-related derivative instruments $3,771
 $128
 $183
 $25
Long-term derivative assets:        
Coffee-related derivative instruments $2,575
 $136
 $57
 $2
Short-term derivative liabilities:        
Coffee-related derivative instruments $
 $4,128
 $
 $2
Long-term derivative liabilities:        
Coffee-related derivative instruments $
 $163
 $
 $
________________
(1) Included in "Short-term derivative assets" and "Other assets" on the Company's consolidated balance sheet at June 30, 2016.
(2) Included in "Short-term derivative liabilities" and "Other long-term liabilities" on the Company's consolidated balance sheet at June 30, 2015.

Farmer Bros. Co.
Notes to Consolidated Financial Statements (continued)


Statements of Operations
The following table presents pretax net gains and losses for the Company's coffee-related derivative instruments designated as cash flow hedges, as recognized in “AOCI,” “Cost of goods sold” and “Other, net”:
  Year Ended June 30,Financial Statement Classification
(In thousands) 2016 2015 2014 
Net gains (losses) recognized in accumulated other comprehensive income (loss) (effective portion) $303
 $(14,295) $17,524
 AOCI
Net (losses) gains recognized in earnings (effective portion) $(13,184) $4,211
 $1,161
 Costs of goods sold
Net losses recognized in earnings (ineffective portion) $(575) $(325) $(259) Other, net
For the years ended June 30, 2016, 2015 and 2014, there were no gains or losses recognized in earnings as a result of excluding amounts from the assessment of hedge effectiveness or as a result of reclassifications to earnings following the discontinuance of any cash flow hedges.
Gains and losses on derivative instruments not designated as accounting hedges are included in “Other, net” in the Company's consolidated statements of operations and in “Net losses (gains) on derivative instruments and investments” in the Company's consolidated statements of cash flows.
Net gains and losses recorded in “Other, net” are as follows:
  Year Ended June 30,
(In thousands) 2016 2015 2014
Net (losses) gains on coffee-related derivative instruments $(298) $(2,992) $2,655
Net gains (losses) on investments 611
 (270) 464
Net losses on interest rate swap 
 
 (5)
     Net gains (losses) on derivative instruments and investments(1) 313
 (3,262) 3,114
     Other gains, net 243
 248
 563
             Other, net $556
 $(3,014) $3,677
___________
(1) Excludes net (losses) gains on coffee-related derivative instruments designated as cash flow hedges recorded in cost of goods sold in the fiscal years ended June 30, 2016, 2015 and 2014.

Offsetting of Derivative Assets and Liabilities
The Company has agreements in place that allow for the financial right of offset for derivative assets and liabilities at settlement or in the event of default under the agreements. Additionally, the Company maintains accounts with its brokers to facilitate financial derivative transactions in support of its risk management activities. Based on the value of the Company’s positions in these accounts and the associated margin requirements, the Company may be required to deposit cash into these broker accounts.
The following table presents the Company’s net exposure from its offsetting derivative asset and liability positions, as well as cash collateral on deposit with its counterparty as of the reporting dates indicated:
(In thousands)   Gross Amount Reported on Balance Sheet Netting Adjustments Cash Collateral Posted Net Exposure
June 30, 2016 Derivative Assets $6,586
 $
 $
 $6,586
June 30, 2015 Derivative Assets $291
 $(291) $
 $
  Derivative Liabilities $4,292
 $(291) $1,001
 $3,000

Farmer Bros. Co.
Notes to Consolidated Financial Statements (continued)


Cash Flow Hedges
Changes in the fair value of the Company's coffee-related derivative instruments designated as cash flow hedges, to the extent effective, are deferred in AOCI and reclassified into cost of goods sold in the same period or periods in which the hedged forecasted purchases affect earnings, or when it is probable that the hedged forecasted transaction will not occur by the end of the originally specified time period. Based on recorded values at June 30, 2016, $2.0 million of net gains on coffee-related derivative instruments designated as cash flow hedges are expected to be reclassified into cost of goods sold within the next twelve months. These recorded values are based on market prices of the commodities as of June 30, 2016. Due to the volatile nature of commodity prices, actual gains or losses realized within the next twelve months will likely differ from these values.
Note 8. Investments
The following table shows gains and losses on trading securities held for investment by the Company: 
  Year Ended June 30,
(In thousands) 2016 2015 2014
Total gains (losses) recognized from trading securities held for investment $611
 $(270) $464
Less: Realized gains from sales of trading securities held for investment 29
 89
 116
Unrealized gains (losses) from trading securities held for investment $582
 $(359) $348

Note 9. Fair Value Measurements
Assets and liabilities measured and recorded at fair value on a recurring basis were as follows:
(In thousands) Total Level 1 Level 2 Level 3
June 30, 2016        
Preferred stock(1) $25,591
 $21,976
 $3,615
 $
Derivative instruments designated as cash flow hedges:        
Coffee-related derivative assets(2) $6,346
 $
 $6,346
 $
Coffee-related derivative liabilities(2) $
 $
 $
 $
Derivative instruments not designated as accounting hedges:        
Coffee-related derivative assets(2) $240
 $
 $240
 $
Coffee-related derivative liabilities(2) $
 $
 $
 $
         
  Total Level 1 Level 2 Level 3
June 30, 2015        
Preferred stock(1) $23,665
 $19,132
 $4,533
 $
Derivative instruments designated as cash flow hedges:        
Coffee-related derivative assets(2) $264
 $
 $264

$
Coffee-related derivative liabilities(2) $4,290
 $
 $4,290
 $
Derivative instruments not designated as accounting hedges:        
Coffee-related derivative assets(2) $27
 $
 $27
 $
Coffee-related derivative liabilities(2) $2
 $
 $2
 $
         
____________________ 
(1)Included in “Short-term investments” on the Company's consolidated balance sheets.
(2)The Company's coffee derivative instruments are traded over-the-counter and, therefore, classified as Level 2.

During the fiscal year ended June 30, 2016, there was one transfer of preferred stock from Level 1 to Level 2, resulting from a decrease in the quantity and quality of information related to trading activity and broker quotes for that security.The

Farmer Bros. Co.
Notes to Consolidated Financial Statements (continued)


Company's coffee derivative instruments that were previously classified as Level 1 were appropriately reclassified as Level 2 because they are traded over-the-counter.
Note 10. Accounts and Notes Receivable, Net
  June 30,
(In thousands) 2016 2015
Trade receivables $43,113
 $38,783
Other receivables(1) 1,965
 2,021
Allowance for doubtful accounts (714) (643)
    Accounts and notes receivable, net $44,364
 $40,161
__________
(1) At June 30, 2016 and 2015, respectively, the Company had recorded $0.5 million and $0 in "Other receivables" included in "Accounts and notes receivable, net" on its consolidated balance sheets representing earnout receivable from Harris.

Allowance for doubtful accounts:
(In thousands) 
Balance at June 30, 2013$(1,115)
Provision(80)
Reclassification to long-term544
Balance at June 30, 2014$(651)
Recovery8
Balance at June 30, 2015$(643)
Provision(71)
Write-off$
Balance at June 30, 2016$(714)

Note 11. Inventories
  June 30,
(In thousands) 2016 2015
Coffee    
   Processed $12,362
 $13,837
   Unprocessed 13,534
 11,968
         Total $25,896
 $25,805
Tea and culinary products    
   Processed $15,384
 $17,022
   Unprocessed 377
 2,764
         Total $15,761
 $19,786
Coffee brewing equipment parts $4,721
 $4,931
              Total inventories $46,378
 $50,522

In addition to product cost, inventory costs include expenditures such as direct labor and certain supply and overhead expenses incurred in bringing the inventory to its existing condition and location. The “Unprocessed” inventory values as stated in the above table represent the value of raw materials and the “Processed” inventory values represent all other products consisting primarily of finished goods.
Inventories decreased at the end of fiscal 2016 compared to fiscal 2015, primarily due to production consolidation and the sale of processed and unprocessed inventories to Harris at cost upon conclusion of the transition services provided by the

Farmer Bros. Co.
Notes to Consolidated Financial Statements (continued)


Company in connection with the sale of the Spice Assets. Inventories decreased at the end of fiscal 2015 compared to fiscal 2014, primarily due to the consolidation of the Company's Torrance coffee production with its coffee production in Houston and Portland as part of the Corporate Relocation Plan. As a result, the Company recorded in cost of goods sold $4.2 million and $4.9 million in beneficial effect of liquidation of LIFO inventory quantities in the fiscal year ended June 30, 2016 and 2015, respectively, which increased net income for the fiscal years ended June 30, 2016 and 2015 by $4.2 million and $4.9 million, respectively. Inventories increased at the end of fiscal 2014 compared to fiscal 2013 and, therefore, there was no similar benefit to cost of goods sold in fiscal 2014.
Current cost of coffee, tea and culinary product inventories exceeds the LIFO cost by:
  June 30,
(In thousands) 2016 2015
Coffee $14,462
 $25,541
Tea and culinary products 7,139
 8,200
Total $21,601
 $33,741

Note 12. Property, Plant and Equipment
  June 30,
(In thousands) 2016 2015
Buildings and facilities $54,768
 $79,040
Machinery and equipment 182,227
 172,432
Buildings and facilities—New Facility(1) 28,110
 
Equipment under capital leases 11,982
 18,562
Capitalized software 21,545
 19,703
Office furniture and equipment 16,077
 15,005
  $314,709
 $304,742
Accumulated depreciation (206,162) (223,660)
Land 9,869
 9,119
Property, plant and equipment, net(2) $118,416
 $90,201
______________
(1) Asset recorded to offset New Facility lease obligation recorded in "Other long-term liabilities" (see Note 19).
(2) Includes in the years ended June 30, 2016 and 2015, expenditures for items that have not been placed in service in the amounts of $39.3 million and $2.5 million, respectively.

Capital leases consisted mainly of vehicle leases at June 30, 2016 and 2015. Depreciation and amortization expense includes amortization expense for assets recorded under capitalized leases.
The Company capitalized coffee brewing equipment (included in machinery and equipment) in the amounts of $8.4 million and $10.7 million in fiscal 2016 and 2015, respectively. Depreciation expense related to the capitalized coffee brewing equipment reported as cost of goods sold was $9.8 million, $10.4 million and $10.9 million in fiscal 2016, 2015 and 2014, respectively.
The Company may incur certain other non-cash asset impairment costs in connection with the Corporate Relocation Plan.
Maintenance and repairs to property, plant and equipment charged to expense for the years ended June 30, 2016, 2015, and 2014 were $7.7 million, $8.2 million and $8.7 million, respectively.


Farmer Bros. Co.
Notes to Consolidated Financial Statements (continued)


Note 13. Goodwill and Intangible Assets
The following is a summary of changes in the carrying value of goodwill:
(In thousands)
Balance at June 30, 2014 $
Additions—RLC acquisition 272
Balance at June 30, 2015 $272
Additions 
Balance at June 30, 2016 $272
The following is a summary of the Company’s amortized and unamortized intangible assets other than goodwill, along with amortization expense on these intangible assets for the past two fiscal years.
  June 30, 2016 June 30, 2015
(In thousands) 
Gross
Carrying
Amount
 
Accumulated
Amortization
 
Gross
Carrying
Amount
 
Accumulated
Amortization
Amortized intangible assets:        
Customer relationships $10,953
 $(10,373) $10,953
 $(10,179)
Covenant not to compete 20
 (10) 20
 (3)
Total amortized intangible assets $10,973
 $(10,383) $10,973
 $(10,182)
Unamortized intangible assets:        
Tradenames with indefinite lives $3,640
 $
 $3,640
 $
Trademarks with indefinite lives 1,988
 
 1,988
 
Total unamortized intangible assets $5,628
 $
 $5,628
 $
     Total intangible assets $16,601
 $(10,383) $16,601
 $(10,182)

Aggregate amortization expense for the past three fiscal years:
(In thousands):
  
For the fiscal year ended June 30, 2016 $200
For the fiscal year ended June 30, 2015 $99
For the fiscal year ended June 30, 2014 $649
Estimated amortization expense for the next three fiscal years:
(In thousands):  
For the fiscal year ending June 30, 2017 $200
For the fiscal year ending June 30, 2018 $198
For the fiscal year ending June 30, 2019 $193

Remaining weighted average amortization periods for intangible assets with finite lives are as follows:
Customer relationships (years)3.0
Covenant not to compete (years)1.5


Note 14. Employee Benefit Plans
The Company provides benefit plans for most full-time employees, including 401(k), health and other welfare benefit plans and, in certain circumstances, pension benefits. Generally the plans provide benefits based on years of service and/or a

Farmer Bros. Co.
Notes to Consolidated Financial Statements (continued)


combination of years of service and earnings. In addition, the Company contributes to two multiemployer defined benefit pension plans, one multiemployer defined contribution pension plan and ten multiemployer defined contribution plans other than pension plans that provide medical, vision, dental and disability benefits for active, union-represented employees subject to collective bargaining agreements. In addition, the Company sponsors a postretirement defined benefit plan that covers qualified non-union retirees and certain qualified union retirees and provides retiree medical coverage and, depending on the age of the retiree, dental and vision coverage. The Company also provides a postretirement death benefit to certain of its employees and retirees.
The Company is required to recognize the funded status of a benefit plan in its consolidated balance sheets. The Company is also required to recognize in other comprehensive income (loss) (“OCI”) certain gains and losses that arise during the period but are deferred under pension accounting rules.
Single Employer Pension Plans
The Company has a defined benefit pension plan, the Farmer Bros. Co. Pension Plan for Salaried Employees (the “Farmer Bros. Plan”), for Company employees hired prior to January 1, 2010, who are not covered under a collective bargaining agreement. The Company amended the Farmer Bros. Plan, freezing the benefit for all participants effective June 30, 2011. After the plan freeze, participants do not accrue any benefits under the Farmer Bros. Plan, and new hires are not eligible to participate in the Farmer Bros. Plan. As all plan participants became inactive following this pension curtailment, net (gain) loss is now amortized based on the remaining life expectancy of these participants instead of the remaining service period of these participants.
The Company also has two defined benefit pension plans for certain hourly employees covered under collective bargaining agreements (the “Brewmatic Plan” and the “Hourly Employees' Plan”). In fiscal 2015, the Company actuarially determined that no adjustments were required to be made to fiscal 2015 net periodic benefit cost for the defined benefit pension plans as a result of the Company's Corporate Relocation Plan.

Farmer Bros. Co.
Notes to Consolidated Financial Statements (continued)


Obligations and Funded Status
  
Farmer Bros. Plan
June 30,
 
Brewmatic Plan
June 30,
 
Hourly Employees’ Plan
June 30,
($ in thousands) 2016 2015 2016 2015 2016 2015
Change in projected benefit obligation            
Benefit obligation at the beginning of the year $136,962
 $133,136
 $4,064
 $3,991
 $3,145
 $2,619
Service cost 


 389
 386
Interest cost 5,875
 5,393
 172
 160
 137
 108
Actuarial loss 15,999
 4,596
 682
 188
 687
 56
Benefits paid (6,511) (6,163) (344) (275) (29) (24)
Projected benefit obligation at the end of the year $152,325
 $136,962
 $4,574
 $4,064
 $4,329
 $3,145
Change in plan assets            
Fair value of plan assets at the beginning of the year 94,815
 $98,426
 $3,291
 $3,435
 $2,104
 $1,629
Actual return on plan assets 1,556
 1,731
 42
 66
 85
 10
Employer contributions 1,341
 821
 
 65
 287
 489
Benefits paid (6,511) (6,163) (344) (275) (29) (24)
Fair value of plan assets at the end of the year $91,201
 $94,815
 $2,989
 $3,291
 $2,447
 $2,104
Funded status at end of year (underfunded) overfunded (61,124) $(42,147) (1,585) $(773) $(1,882) $(1,041)
Amounts recognized in consolidated balance sheets            
Non-current liabilities (61,124) (42,147) (1,585) (773) (1,882) (1,041)
Total $(61,124) $(42,147) $(1,585) $(773) $(1,882) $(1,041)
Amounts recognized in consolidated statements of operations            
Net loss 70,246
 $50,743
 2,756
 $1,965
 988
 $237
Total accumulated OCI (not adjusted for applicable tax) $70,246
 $50,743
 $2,756
 $1,965
 $988
 $237
Weighted average assumptions used to determine benefit obligations            
Discount rate 3.55% 4.40% 3.55% 4.40% 3.55% 4.40%
Rate of compensation increase N/A
 N/A
 N/A
 N/A
 N/A
 N/A

Farmer Bros. Co.
Notes to Consolidated Financial Statements (continued)


Components of Net Periodic Benefit Cost and
Other Changes Recognized in Other Comprehensive Income (Loss) (OCI)

  
Farmer Bros. Plan
June 30,
 
Brewmatic Plan
June 30,
 
Hourly Employees’ Plan
June 30,
($ in thousands) 2016 2015 2016 2015 2016 2015
Components of net periodic benefit cost            
Service cost $
 $
 $
 $
 $389
 $386
Interest cost 5,875
 5,393
 172
 160
 137
 108
Expected return on plan assets (6,470) (6,938) (219) (234) (149) (119)
Amortization of net loss 1,411
 1,153
 68
 57
 
 
Net periodic benefit cost (credit) $816
 $(392) $21
 $(17) $377
 $375
Other changes recognized in OCI            
Net loss $20,913
 $9,803
 $859
 $356
 $750
 $165
Amortization of net loss (1,411) (1,153) (68) (57) 
 
Total recognized in OCI $19,502
 $8,650
 $791
 $299
 $750
 $165
Total recognized in net periodic benefit cost and OCI $20,318
 $8,258
 $812
 $282
 $1,127
 $540
Weighted-average assumptions used to determine net periodic benefit cost            
Discount rate 4.40% 4.15% 4.40% 4.15% 4.40% 4.15%
Expected long-term return on plan assets 7.50% 7.50% 7.50% 7.50% 7.50% 7.50%
Rate of compensation increase N/A
 N/A
 N/A
 N/A
 N/A
 N/A
Basis Used to Determine Expected Long-term Return on Plan Assets
The expected long-term return on plan assets assumption was developed as a weighted average rate based on the target asset allocation of the plan and the Long-Term Capital Market Assumptions (CMA) 2014. The capital market assumptions were developed with a primary focus on forward-looking valuation models and market indicators. The key fundamental economic inputs for these models are future inflation, economic growth, and interest rate environment. Due to the long-term nature of the pension obligations, the investment horizon for the CMA 2014 is 20 to 30 years. In addition to forward-looking models, historical analysis of market data and trends was reflected, as well as the outlook of recognized economists, organizations and consensus CMA from other credible studies.
Description of Investment Policy
The Company’s investment strategy is to build an efficient, well-diversified portfolio based on a long-term, strategic outlook of the investment markets. The investment markets outlook utilizes both the historical-based and forward-looking return forecasts to establish future return expectations for various asset classes. These return expectations are used to develop a core asset allocation based on the specific needs of each plan. The core asset allocation utilizes investment portfolios of various asset classes and multiple investment managers in order to maximize the plan’s return while providing multiple layers of diversification to help minimize risk.

Farmer Bros. Co.
Notes to Consolidated Financial Statements (continued)


Additional Disclosures
  
Farmer Bros. Plan
June 30,
 
Brewmatic Plan
June 30,
 
Hourly Employees’ Plan
June 30,
($ in thousands) 2016 2015 2016 2015 2016 2015
Comparison of obligations to plan assets            
Projected benefit obligation $152,325
 $136,962
 $4,574
 $4,064
 $4,329
 $3,145
Accumulated benefit obligation $152,325
 $136,962
 $4,574
 $4,064
 $4,329
 $3,145
Fair value of plan assets at measurement date $91,201
 $94,815
 $2,989
 $3,291
 $2,447
 $2,104
Plan assets by category            
Equity securities $58,094
 $47,340
 $1,909
 $1,638
 $1,542
 $1,050
Debt securities 27,586
 37,789
 899
 1,322
 758
 839
Real estate 5,521
 9,686
 181
 331
 147
 215
Total $91,201
 $94,815
 $2,989
 $3,291
 $2,447
 $2,104
Plan assets by category            
Equity securities 64% 50% 64% 50% 63% 50%
Debt securities 30% 40% 30% 40% 31% 40%
Real estate 6% 10% 6% 10% 6% 10%
Total 100.0% 100% 100% 100% 100% 100%
Fair values of plan assets were as follows:
  June 30, 2016
(In thousands) Total Level 1 Level 2 Level 3
Farmer Bros. Plan $91,201
 $
 $91,201
 $
Brewmatic Plan $2,989
 $
 $2,989
 $
Hourly Employees’ Plan $2,447
 $
 $2,447
 $
  June 30, 2015
(In thousands) Total Level 1 Level 2 Level 3
Farmer Bros. Plan $94,815
 $
 $94,815
 $
Brewmatic Plan $3,291
 $
 $3,291
 $
Hourly Employees’ Plan $2,104
 $
 $2,104
 $

As of June 30, 2016, approximately 6% of the assets of each of the Farmer Bros. Plan, the Brewmatic Plan and the Hourly Employees’ Plan were invested in pooled separate accounts which invested mainly in commercial real estate and included mortgage loans which were backed by the associated properties. These underlying real estate investments are able to be redeemed at net asset value per share and therefore, are considered Level 2 assets.
The following is the target asset allocation for the Company's single employer pension plans—Farmer Bros. Plan, Brewmatic Plan and Hourly Employees' Plan—for fiscal 2017:
Fiscal 2017
U.S. large cap equity securities42.8%
U.S. small cap equity securities5.2%
International equity securities16.0%
Debt securities30.0%
Real estate6.0%
Total100.0%


Farmer Bros. Co.
Notes to Consolidated Financial Statements (continued)


Estimated Amounts in OCI Expected To Be Recognized
In fiscal 2017, the Company expects to recognize as a component of net periodic benefit cost $1.1 million for the Farmer Bros. Plan, $71,000 for the Brewmatic Plan, and $0.5 million for the Hourly Employees’ Plan.
Estimated Future Contributions and Refunds
In fiscal 2017, the Company expects to contribute $2.0 million to the Farmer Bros. Plan, $0.1 million to the Brewmatic Plan, and $0.3 million to the Hourly Employees’ Plan. The Company is not aware of any refunds expected from single employer pension plans.
Estimated Future Benefit Payments
The following benefit payments are expected to be paid over the next 10 fiscal years:
(In thousands) Farmer Bros. Plan Brewmatic Plan 
Hourly Employees’
Plan
Year Ending:  
June 30, 2017 $7,310
 $320
 $81
June 30, 2018 $7,520
 $310
 $110
June 30, 2019 $7,760
 $310
 $120
June 30, 2020 $8,040
 $300
 $140
June 30, 2021 $8,250
 $290
 $170
June 30, 2022 to June 30, 2026 $42,770
 $1,340
 $1,170
These amounts are based on current data and assumptions and reflect expected future service, as appropriate.

Multiemployer Pension Plans
The Company participates in two multiemployer defined benefit pension plans that are union sponsored and collectively bargained for the benefit of certain employees subject to collective bargaining agreements, of which the Western Conference of Teamsters Pension Plan (“WCTPP”) is individually significant. The Company makes contributions to these plans generally based on the number of hours worked by the participants in accordance with the provisions of negotiated labor contracts.
The risks of participating in multiemployer pension plans are different from single-employer plans in that: (i) assets contributed to a multiemployer plan by one employer may be used to provide benefits to employees of other participating employers; (ii) if a participating employer stops contributing to the plan, the unfunded obligations of the plan may be borne by the remaining participating employers; and (iii) if the Company stops participating in the multiemployer plan, the Company may be required to pay the plan an amount based on the underfunded status of the plan, referred to as a withdrawal liability.
The Company's participation in WCTPP is outlined in the table below. The Pension Protection Act (“PPA”) Zone Status available in the Company's fiscal year 2016 and fiscal year 2015 is for the plan's year ended December 31, 2015 and December 31, 2014, respectively. The zone status is based on information obtained from WCTPP and is certified by WCTPP's actuary. Among other factors, plans in the green zone are generally more than 80% funded. Based on WCTPP's annual report on Form 5500, WCTPP was 91.7% and 91.9% funded for its plan year beginning January 1, 2015 and 2014, respectively. The “FIP/RP Status Pending/Implemented” column indicates if a funding improvement plan (“FIP”) or a rehabilitation plan (“RP”) is either pending or has been implemented.
Pension Plan
Employer
Identification
Number
Pension
Plan
Number
PPA Zone Status
FIP/RP
Status
Pending/
Implemented
Surcharge
Imposed
Expiration Date
Board of Collective
Bargaining
Agreements
July 1, 2015
July 1,
2014
Directors
 
John D. Robinson, Chair
Western Conference of Teamsters Pension Plan

Allison M. Boersma

David A. Pace

Alfred Poe

91-6145047001GreenGreenNoNoJanuary 31, 2020Waheed Zaman

Farmer Bros. Co.
Notes to Consolidated Financial Statements (continued)


Based upon the most recent information available from the trustees managing WCTPP, the Company's share of the unfunded vested benefit liability for the plan was estimated to be approximately $9.1 million if the withdrawal had occurred in calendar year 2015. These estimates were calculated by the trustees managing WCTPP. Although the Company believes the most recent plan data available from WCTPP was used in computing this 2015 estimate, the actual withdrawal liability amount is subject to change based on, among other things, the plan's investment returns and benefit levels, interest rates, financial difficulty of other participating employers in the plan such as bankruptcy, and continued participation by the Company and other employers in the plan, each of which could impact the ultimate withdrawal liability.
If withdrawal liability were to be triggered, the withdrawal liability assessment can be paid in a lump sum or on a monthly basis. The amount of the monthly payment is determined as follows: Average number of hours reported to the pension plan trust during the three consecutive years with highest number of hours in the 10-year period prior to the withdrawal is multiplied by the highest hourly contribution rate during the 10-year period ending with the plan year in which the withdrawal occurred to determine the amount of withdrawal liability that has to be paid annually. The annual amount is divided by 12 to arrive at the monthly payment due. If monthly payments are elected, interest is assessed on the unpaid balance after 12 months at the rate of 7% per annum.
In fiscal 2012, the Company withdrew from the Local 807 Labor-Management Pension Fund (“Pension Fund”) and recorded a charge of $4.3 million associated with withdrawal from this plan, representing the present value of the estimated withdrawal liability expected to be paid in quarterly installments of $0.1 million over 80 quarters. On November 18, 2014, the Pension Fund sent the Company a notice of assessment of withdrawal liability in the amount of $4.4 million, which the Pension Fund adjusted to $4.9 million on January 5, 2015. The Company is in the process of negotiating a reduced liability amount. The Company has commenced quarterly installment payments to the Pension Fund of $91,000 pending the final settlement of the liability. The total estimated withdrawal liability of $3.8 million and $4.3 million, respectively, is reflected in the Company's consolidated balance sheets at June 30, 2016 and June 30, 2015, with the short-term and long-term portions reflected in current and long-term liabilities, respectively.
The Company may incur certain pension-related costs in connection with the Corporate Relocation Plan. Future collective bargaining negotiations may result in the Company withdrawing from the remaining multiemployer pension plans in which it participates and, if successful, the Company may incur a withdrawal liability, the amount of which could be material to the Company's results of operations and cash flows.
Company contributions to the multiemployer pension plans:
(In thousands) WCTPP(1)(2)(3) All Other Plans(4)
Year Ended:    
June 30, 2016 $2,587
 $39
June 30, 2015 $3,593
 $41
June 30, 2014 $3,153
 $34
____________

(1)Individually significant plan.
(2)
Less than 5% of total contribution to WCTPP based on WCTPP's most recent annual report on Form 5500 for the calendar year ended December 31, 2015.
(3)
The Company guarantees that one hundred seventy-three (173) hours will be contributed upon for all employees who are compensated for all available straight time hours for each calendar month. An additional 6.5% of the basic contribution must be paid for PEER or the Program for Enhanced Early Retirement.
(4)Includes one plan that is not individually significant.
The Company's contribution to multiemployer plans decreased in fiscal 2016 as compared to fiscal 2015 and 2014, as a result of reduction in employees due to the Corporate Relocation Plan. The Company expects to contribute an aggregate of $3.3 million towards multiemployer pension plans in fiscal 2017.

Multiemployer Plans Other Than Pension Plans

Farmer Bros. Co.
Notes to Consolidated Financial Statements (continued)


The Company participates in ten multiemployer defined contribution plans other than pension plans that provide medical, vision, dental and disability benefits for active, union-represented employees subject to collective bargaining agreements. The plans are subject to the provisions of the Employee Retirement Income Security Act of 1974, and provide that participating employers make monthly contributions to the plans in an amount as specified in the collective bargaining agreements. Also, the plans provide that participants make self-payments to the plans, the amounts of which are negotiated through the collective bargaining process. The Company's participation in these plans is governed by collective bargaining agreements which expire on or before January 31, 2020. The Company's aggregate contributions to multiemployer plans other than pension plans in the fiscal years ended June 30, 2016, 2015 and 2014 were $6.3 million, $6.9 million and $6.6 million, respectively. The Company expects to contribute an aggregate of $6.5 million towards multiemployer plans other than pension plans in fiscal 2017.
401(k) Plan
The Company's 401(k) Plan is available to all eligible employees who have worked more than 1,000 hours during a calendar year and were employed at the end of the calendar year. Participants in the 401(k) Plan may choose to contribute a percentage of their annual pay subject to the maximum contribution allowed by the Internal Revenue Service. The Company's matching contribution is discretionary, based on approval by the Company's Board of Directors. For the calendar years 2016, 2015 and 2014, the Company's Board of Directors approved a Company matching contribution of 50% of an employee's annual contribution to the 401(k) Plan, up to 6% of the employee's eligible income. The matching contributions (and any earnings thereon) vest at the rate of 20% for each of the participant's first 5 years of vesting service, so that a participant is fully vested in his or her matching contribution account after 5 years of vesting service, subject to accelerated vesting under certain circumstances in connection with the Corporate Relocation Plan due to the closure of the Company’s Torrance facility or a reduction-in-force at another Company facility designated by the Administrative Committee of the Farmer Bros. Co. Qualified Employee Retirement Plans. A participant is automatically vested in the event of death, disability or attainment of age 65 while employed by the Company. Employees are 100% vested in their contributions. For employees subject to a collective bargaining agreement, the match is only available if so provided in the labor agreement.
The Company recorded matching contributions of $1.6 million, $1.4 million and $1.3 million in operating expenses for the fiscal years ended June 30, 2016, 2015 and 2014, respectively.
Postretirement Benefits
The Company sponsors a postretirement defined benefit plan that covers qualified non-union retirees and certain qualified union retirees (“Retiree Medical Plan”). The plan provides medical, dental and vision coverage for retirees under age 65 and medical coverage only for retirees age 65 and above. Under this postretirement plan, the Company’s contributions toward premiums for retiree medical, dental and vision coverage for participants and dependents are scaled based on length of service, with greater Company contributions for retirees with greater length of service, subject to a maximum monthly Company contribution. The Company's retiree medical, dental and vision plan is unfunded, and its liability was calculated using an assumed discount rate of 3.7% at June 30, 2016. The Company projects an initial medical trend rate of 9.0% in fiscal 2017, ultimately reducing to 4.5% in 10 years.
The Company also provides a postretirement death benefit (“Death Benefit”) to certain of its employees and retirees, subject, in the case of current employees, to continued employment with the Company until retirement and certain other conditions related to the manner of employment termination and manner of death. The Company records the actuarially determined liability for the present value of the postretirement death benefit. The Company has purchased life insurance policies to fund the postretirement death benefit wherein the Company owns the policy but the postretirement death benefit is paid to the employee's or retiree's beneficiary. The Company records an asset for the fair value of the life insurance policies which equates to the cash surrender value of the policies. In fiscal 2016, the Company actuarially determined that no postretirement benefit costs related to the Corporate Relocation Plan were required to be recognized.

Farmer Bros. Co.
Notes to Consolidated Financial Statements (continued)


Retiree Medical Plan and Death Benefit
The following table shows the components of net periodic postretirement benefit cost for the Retiree Medical Plan and Death Benefit for the fiscal years ended June 30, 2016, 2015 and 2014. Net periodic postretirement benefit cost for fiscal 2016 was based on employee census information as of July 1, 2015 and asset information as of June 30, 2016.
  Year Ended June 30,
(In thousands) 2016 2015 2014
Components of Net Periodic Postretirement Benefit Cost (credit):      
Service cost $1,388
 $1,195
 $936
Interest cost 1,194
 943
 810
Amortization of net gains (196) (500) (880)
Amortization of prior service credit (1,757) (1,757) (1,757)
Net periodic postretirement benefit cost (credit) $629
 $(119) $(891)
The difference between the assets and the Accumulated Postretirement Benefit Obligation (APBO) at the adoption of ASC 715-60 was established as a transition (asset) obligation and is amortized over the average expected future service for active employees as measured at the date of adoption. Any plan amendments that retroactively increase benefits create prior service cost. The increase in the APBO due to any plan amendment is established as a base and amortized over the average remaining years of service to the full eligibility date of active participants who are not yet fully eligible for benefits at the plan amendment date. Gains and losses due to experience different than that assumed or from changes in actuarial assumptions are not immediately recognized. The tables below show the remaining bases for the transition (asset) obligation, prior service cost (credit), and the calculation of the amortizable gain or loss.
Amortization Schedule
Transition (Asset) Obligation: The transition (asset) obligations have been fully amortized.
Prior service cost (credit) ($ in thousands): 
Date Established 
Balance at
July 1, 2015
 
Annual
Amortization
  Years Remaining Curtailment 
Balance at
June 30, 2016
January 1, 2008 $(962) $230
  3.2 
 $(732)
July 1, 2012 (13,001) 1,526
  7.5 
 (11,475)
  $(13,963) $1,756
      $(12,207)

  Year Ended June 30, Year Ended June 30,
  Retiree Medical Plan Death Benefit
($ in thousands) 2016 2015 2016 2015
Amortization of Net (Gain) Loss:    
Net (gain) loss as of July 1 $(8,710) $(3,655) $690
 $690
Net (gain) loss subject to amortization (8,710) (3,655) 690
 690
Corridor (10% of greater of APBO or assets) 1,724
 1,723
 (729) (729)
Net (gain) loss in excess of corridor $(6,986) $(1,932) $
 $
Amortization years 10.0
 10.8
 7.7
 8.7

Farmer Bros. Co.
Notes to Consolidated Financial Statements (continued)


 The following tables provide a reconciliation of the benefit obligation and plan assets: 
  Year Ended June 30,
(In thousands) 2016 2015
Change in Benefit Obligation:    
Projected postretirement benefit obligation at beginning of year $24,522
 $20,889
Service cost 1,388
 1,195
Interest cost 1,194
 943
Participant contributions 795
 711
Actuarial losses (4,259) 2,751
Benefits paid (1,773) (1,967)
Projected postretirement benefit obligation at end of year $21,867
 $24,522
  Year Ended June 30,
(In thousands) 2016 2015
Change in Plan Assets:    
Fair value of plan assets at beginning of year $
 $
Employer contributions 978
 1,256
Participant contributions 795
 711
Benefits paid (1,773) (1,967)
Fair value of plan assets at end of year 
 
Projected postretirement benefit obligation at end of year $21,867
 $24,522
Funded status of plan $(21,867) $(24,522)
  June 30,
(In thousands) 2016 2015
Amounts Recognized in the Consolidated Balance Sheets Consist of:    
Non-current assets $
 $
Current liabilities (1,060) (1,051)
Non-current liabilities (20,807) (23,471)
Total $(21,867) $(24,522)
  Year Ended June 30,
(In thousands) 2016 2015
Amounts Recognized in Accumulated OCI Consist of:    
Net gain $(7,027) $(2,965)
Transition obligation (12,207) (13,963)
Total accumulated OCI $(19,234) $(16,928)
  Year Ended June 30,
(In thousands) 2016 2015
Other Changes in Plan Assets and Benefit Obligations Recognized in OCI:    
Unrecognized actuarial loss $(4,259) $2,751
Amortization of net loss 196
 500
Amortization of prior service cost 1,757
 1,757
Total recognized in OCI (2,306) 5,008
Net periodic benefit credit 629
 (119)
Total recognized in net periodic benefit cost and OCI $(1,677) $4,889

Farmer Bros. Co.
Notes to Consolidated Financial Statements (continued)


The estimated net gain and prior service credit that will be amortized from accumulated OCI into net periodic benefit cost in fiscal 2017 are $0.6 million and $1.8 million, respectively.
(In thousands) 
Estimated Future Benefit Payments: 
Year Ending: 
June 30, 2017$1,080
June 30, 2018$1,102
June 30, 2019$1,143
June 30, 2020$1,176
June 30, 2021$1,210
June 30, 2022 to June 30, 2026$6,246
  
Expected Contributions: 
June 30, 2017$1,080
Sensitivity in Fiscal 2017 Results
Assumed health care cost trend rates have a significant effect on the amounts reported for the health care plan. A one percentage point change in assumed health care cost trend rates would have the following effects in fiscal 2017:
  1-Percentage Point
(In thousands) Increase Decrease
Effect on total of service and interest cost components $181
 $(154)
Effect on accumulated postretirement benefit obligation $1,664
 $(1,423)

Note 15. Bank Loan
The Company maintains a $75.0 million senior secured revolving credit facility (“Revolving Facility”) with JPMorgan Chase Bank, N.A. and SunTrust Bank (collectively, the “Lenders”), with a sublimit on letters of credit and swingline loans of $30.0 million and $15.0 million. respectively. The Revolving Facility includes an accordion feature whereby the Company may increase the Revolving Commitment by up to an additional $50.0 million, subject to certain conditions. Advances are based on the Company’s eligible accounts receivable, eligible inventory, and the value of certain real property and trademarks, less required reserves. The commitment fee ranges from 0.25% to 0.375% per annum based on average revolver usage. Outstanding obligations are collateralized by all of the Company’s assets, excluding certain real property not included in the borrowing base, machinery and equipment (other than inventory), and the Company's preferred stock portfolio. Borrowings under the Revolving Facility bear interest based on average historical excess availability levels with a range of PRIME - 0.25% to PRIME + 0.50% or Adjusted LIBO Rate + 1.25% to Adjusted LIBO Rate + 2.00%. The Company is subject to a variety of affirmative and negative covenants of types customary in an asset-based lending facility, including financial covenants relating to the maintenance of a fixed charge coverage ratio in certain circumstances, and the right of the Lenders to establish reserve requirements, which may reduce the amount of credit otherwise available to the Company. The Company is allowed to pay dividends, provided, among other things, certain excess availability requirements are met, and no event of default exists or has occurred and is continuing as of the date of any such payment and after giving effect thereto. The Revolving Facility expires on March 2, 2020.
At June 30, 2016, the Company was eligible to borrow up to a total of $58.6 million under the Revolving Facility and had outstanding borrowings of $0.1 million, utilized $11.9 million of the letters of credit sublimit, and had excess availability under the Revolving Facility of $46.6 million. At June 30, 2016, the weighted average interest rate on the Company's outstanding borrowings under the Revolving Facility was 1.64% and the Company was in compliance with all of the restrictive covenants under the Revolving Facility.

Farmer Bros. Co.
Notes to Consolidated Financial Statements (continued)


Note 16. Employee Stock Ownership Plan
The Company’s ESOP was established in 2000. The plan is a leveraged ESOP in which the Company is the lender. The loans are repaid from the Company’s discretionary plan contributions over the original 15 year term with a variable rate of interest. The annual interest rate was 1.99% at June 30, 2016, which is updated on a quarterly basis.
  As of and for the years ended June 30,
  2016 2015 2014
Loan amount (in thousands) $6,434 $11,234 $16,035
Shares are held by the plan trustee for allocation among participants as the loan is repaid. The unencumbered shares are allocated to participants using a compensation-based formula. Subject to vesting requirements, allocated shares are owned by participants and shares are held by the plan trustee until the participant retires.
Historically, the Company used the dividends, if any, on ESOP shares to pay down the loans, and allocated to the ESOP participants shares equivalent to the fair market value of the dividends they would have received. No dividends were paid in fiscal 2016, 2015 or 2014.
During the fiscal years ended June 30, 2016, 2015 and 2014, the Company charged $3.4 million, $4.4 million and $3.3 million, respectively, to compensation expense related to the ESOP. The decrease in ESOP expense in fiscal 2016 is primarily due to the reduction in the number of shares being allocated to participant accounts as a result of paying down the loan amount. The increase in ESOP expense in fiscal 2015 as compared to fiscal 2014 was due to the increase in the fair market value of the Company's shares which determines the ESOP expense recorded. The difference between cost and fair market value of committed to be released shares, which was $36,000, $1.0 million and $0.3 million for the fiscal years ended June 30, 2016, 2015 and 2014, respectively, is recorded as additional paid-in capital.
  June 30,
  2016 2015
Allocated shares 1,941,934
 1,970,117
Committed to be released shares 169,603
 172,398
Unallocated shares 220,925
 390,528
Total ESOP shares 2,332,462
 2,533,043
     
(In thousands)    
Fair value of ESOP shares $74,779
 $59,527
Note 17. Share-based Compensation
Non-qualified stock options with time-based vesting (“NQOs”)
In fiscal 2016, the Company granted 21,595 shares issuable upon the exercise of NQOs with a weighted average exercise price of $29.48 per share to eligible employees under the Amended Equity Plan which vest ratably over a three-year period.
Following are the weighted average assumptions used in the Black-Scholes valuation model for NQOs granted during the fiscal years ended June 30, 2016, 2015 and 2014
  Year Ended June 30,
  2016 2015 2014
Weighted average fair value of NQOs $12.63
 $10.38
 $9.17
Risk-free interest rate 1.6% 1.5% 1.7%
Dividend yield % % %
Average expected term 5.1 years
 5.1 years
 6 years
Expected stock price volatility 47.1% 47.9% 50.4%
The Company’s assumption regarding expected stock price volatility is based on the historical volatility of the Company’s stock price. The risk-free interest rate is based on U.S. Treasury zero-coupon issues at the date of grant with a remaining term

Farmer Bros. Co.
Notes to Consolidated Financial Statements (continued)


equal to the expected life of the stock options. The average expected term is based on historical weighted time outstanding and the expected weighted time outstanding calculated by assuming the settlement of outstanding awards at the midpoint between the vesting date and the end of the contractual term of the award. Currently, management estimates an annual forfeiture rate of 4.8% based on actual forfeiture experience. Forfeitures are estimated at the time of grant and revised, if necessary, in subsequent periods if actual forfeitures differ from those estimates.
The following table summarizes NQO activity for the three most recent fiscal years:
Outstanding NQOs: 
Number
of NQOs
 
Weighted
Average
Exercise
Price ($)
 
Weighted
Average
Grant Date
Fair Value ($)
 
Weighted
Average
Remaining
Life
(Years)
 
Aggregate
Intrinsic
Value
($ in thousands)
Outstanding at June 30, 2013 557,427
 12.81 5.44 5.1 1,620
Granted 1,927
 18.68 9.17 6.4 
Exercised (112,964) 13.10 5.81  895
Cancelled/Forfeited (33,936) 16.63 6.13  
Outstanding at June 30, 2014 412,454
 12.44 5.30 4.4 3,782
Granted 25,703
 23.91 10.38 6.8 
Exercised (95,723) 16.17 5.86  747
Cancelled/Forfeited (13,134) 11.26 5.00  
Outstanding at June 30, 2015 329,300
 12.30 5.54 3.9 3,700
Granted 21,595
 29.48 12.63 6.4 
Exercised (112,895) 12.35 5.37  1,853
Cancelled/Forfeited (18,371) 13.45 6.17  
Outstanding at June 30, 2016 219,629
 13.87 6.28 3.7 3,995
Vested and exercisable, June 30, 2016 180,298
 11.06 5.13 3.1 3,800
Vested and expected to vest, June 30, 2016 217,160
 13.72 6.22 3.6 3,983
The aggregate intrinsic values outstanding at the end of each fiscal period in the table above represent the total pretax intrinsic value, based on the Company’s closing stock price of $32.06 at June 30, 2016, $23.50 at June 30, 2015 and $21.61 at June 30, 2014, representing the last trading day of the respective fiscal years, which would have been received by NQO holders had all award holders exercised their NQOs that were in-the-money as of those dates. The aggregate intrinsic value of stock option exercises in each fiscal period above represents the difference between the exercise price and the value of the Company’s common stock at the time of exercise. NQOs outstanding that are expected to vest are net of estimated forfeitures.
Total fair value of NQOs vested during fiscal 2016, 2015 and 2014 was $0.3 million, $0.5 million and $0.7 million, respectively. The Company received $1.4 million in proceeds from exercises of vested NQOs in fiscal 2016, and $1.5 million in proceeds from exercises of vested NQOs in each of fiscal 2015 and 2014.

Farmer Bros. Co.
Notes to Consolidated Financial Statements (continued)


The following table summarizes nonvested NQO activity for the three most recent fiscal years:
Nonvested NQOs: 
Number
of
NQOs
 
Weighted
Average
Exercise
Price ($)
 
Weighted
Average
Grant Date
Fair Value ($)
 
Weighted
Average
Remaining
Life (Years)
Outstanding at June 30, 2013 315,661
 10.80 5.12 6.1
Granted 1,927
 18.68 9.17 6.4
Vested (133,957) 11.02 5.21 
Forfeited (15,833) 11.48 5.49 
Outstanding at June 30, 2014 167,798
 10.65 5.06 5.3
Granted 25,703
 23.91 10.38 6.8
Vested (101,172) 9.87 4.72 
Forfeited (12,134) 10.31 4.91 
Outstanding at June 30, 2015 80,195
 15.94 7.21 5.2
Granted 21,595
 29.48 12.63 6.4
Vested (47,418) 14.05 6.44 
Forfeited (15,641) 12.95 6.09 
Outstanding at June 30, 2016 38,731
 27.02 11.63 6.1

As of June 30, 2016 and 2015, there was $0.4 million of unrecognized compensation cost related to NQOs. The unrecognized compensation cost related to NQOs at June 30, 2016 is expected to be recognized over the weighted average period of 2.2 years. Total compensation expense for NQOs was $0.2 million, $0.4 million and $0.6 million in fiscal 2016, 2015 and 2014, respectively.
Non-qualified stock options with performance-based and time-based vesting (PNQs”)
In the fiscal year ended June 30, 2016, the Company granted a total of 143,466 shares with an exercise price of $29.48 per share to eligible employees under the Amended Equity Plan. With the exception of a portion of the award to the Company’s President and Chief Executive Officer as described below, these PNQs vest over a three-year period with one-third of the total number of shares subject to each such PNQ becoming exercisable each year on the anniversary of the grant date, based on the Company’s achievement of modified net income targets for fiscal 2016 ("Fiscal 2016 Target") as approved by the Compensation Committee, subject to the participant’s employment by the Company or service on the Board of Directors of the Company on the applicable vesting date and the acceleration provisions contained in the Amended Equity Plan and the applicable award agreement. But if actual modified net income for fiscal 2016 is less than the Fiscal 2016 Target, then 20% of the total shares issuable under such grant will be forfeited.
On June 3, 2016, the Compensation Committee of the Board of Directors of the Company determined that a portion of the non-qualified stock option granted to Michael H. Keown, the Company's President and Chief Executive Officer, on December 3, 2015 (the “Original Option”) was invalid because such portion caused the total number of option shares granted to Mr. Keown in calendar year 2015 to exceed the limit of 75,000 shares that may be granted to a participant in a single calendar year under the Amended Equity Plan by 22,862 shares. Therefore, the Compensation Committee reduced the total number of shares of common stock issuable under the Original Option by 22,862 shares. The reduction of the 22,862 excess option shares brought the total number of option shares granted to Mr. Keown in calendar 2015 within the limitation of the Amended Equity Plan.
In addition, on June 3, 2016, the Compensation Committee, in accordance with the provisions of the Amended Equity Plan, granted Mr. Keown a non-qualified stock option to purchase 22,862 shares of the Company's common stock (the “New Option”) with an exercise price of $29.48 per share, which was the greater of the exercise price of the Original Option and the closing price of the Company's common stock as reported on the NASDAQ Global Market on June 3, 2016, the date of grant. The New Option is subject to the same terms and conditions of the Original Option including an expiration date of December 3, 2022, and the three-year vesting schedule, except that to comply with the Amended Equity Plan's minimum vesting schedule of one year from the grant date, one-third of shares issuable under the New Option will vest on June 3, 2017, and the remainder of the New Option shares will vest one-third each on the second and third anniversaries of the grant date of the Original Option,

Farmer Bros. Co.
Notes to Consolidated Financial Statements (continued)


based on the Company’s achievement of the same performance goals as the Original Option, subject to Mr. Keown’s continued employment on the applicable vesting date.
In the fiscal year ended June 30, 2015, the Company granted 121,024 shares issuable upon the exercise of PNQs with an exercise price of $23.44 per share to eligible employees under the Amended Equity Plan. These PNQs vest over a three-year period with one-third of the total number of shares subject to each such PNQ becoming exercisable each year on the anniversary of the grant date, based on the Company’s achievement of modified net income targets for fiscal years within the performance period as approved by the Compensation Committee, subject to catch-up vesting of previously unvested shares in a subsequent year within the three year period in which a cumulative modified net income target as approved by the Compensation Committee is achieved, in each case, subject to the participant’s employment by the Company or service on the Board of Directors of the Company on the applicable vesting date and the acceleration provisions contained in the Amended Equity Plan and the applicable award agreement.
In the fiscal year ended June 30, 2014, the Company granted a total of 112,442 shares issuable upon the exercise of PNQs with a weighted average exercise price of $21.27 per share to eligible employees under the Amended Equity Plan. These PNQs vest over a three-year period with one-third of the total number of shares subject to each such PNQ vesting on the first anniversary of the grant date based on the Company’s achievement of a modified net income target for the first fiscal year of the performance period as approved by the Compensation Committee, and the remaining two-thirds of the total number of shares subject to each PNQ vesting on the third anniversary of the grant date based on the Company’s achievement of a cumulative modified net income target for all three years during the performance period as approved by the Compensation Committee, in each case, subject to the participant’s employment by the Company or service on the Board of Directors of the Company on the applicable vesting date. No PNQs were granted prior to fiscal 2014.
Following are the assumptions used in the Black-Scholes valuation model for PNQs granted during the fiscal years ended June 30, 2016, 2015 and 2014:
  Year Ended June 30,
  2016 2015 2014
Weighted average fair value of PNQs $11.38
 $10.16
 $10.49
Risk-free interest rate 1.6% 1.5% 1.8%
Dividend yield 
 % %
Average expected term (years) 4.9
 5.0
 6.0
Expected stock price volatility 42.5% 47.9% 50.5%


Farmer Bros. Co.
Notes to Consolidated Financial Statements (continued)


The following table summarizes PNQ activity for the three most recent fiscal years:
Outstanding PNQs: 
Number
of
PNQs
 
Weighted
Average
Exercise
Price ($)
 
Weighted
Average
Grant Date
Fair Value ($)
 
Weighted
Average
Remaining
Life
(Years)
 
Aggregate
Intrinsic
Value
($ in 
thousands)
Outstanding at June 30, 2013 
    
Granted 112,442
 21.27 10.49 6.5 
Cancelled/Forfeited 
    
Outstanding at June 30, 2014 112,442
 21.27 10.49 6.5 38
Granted 121,024
 23.44 10.16 6.6 
Cancelled/Forfeited (9,399) 21.33 10.52  
Outstanding at June 30, 2015 224,067
 22.44 10.31 6.0 237
Granted 143,466
 29.48 11.38 6.2 
Exercised (14,144) 21.20 10.45 0 107
Cancelled/Forfeited (64,790) 23.20 10.37 0 
Outstanding at June 30, 2016 288,599
 25.83 10.82 5.7 1,798
Vested and exercisable, June 30, 2016 48,132
 22.52 10.31 5.1 459
Vested and expected to vest, June 30, 2016 274,919
 25.75 10.81 5.7 1,736

The aggregate intrinsic values outstanding at the end of each fiscal period in the table above represent the total pretax intrinsic values, based on the Company’s closing stock price of $32.06 at June 30, 2016, $23.50 at June 30, 2015 and $21.61 at June 30, 2014 representing the last trading day of the respective fiscal years, which would have been received by PNQ holders had all award holders exercised their PNQs that were in-the-money as of those dates. The aggregate intrinsic value of stock option exercises in fiscal 2016 represents the difference between the exercise price and the value of the Company’s common stock at the time of exercise. PNQs outstanding that are expected to vest are net of estimated forfeitures.
Total fair value of PNQs vested during the fiscal years ended June 30, 2016 and 2015 was $0.3 million and $0.4 million, respectively. No PNQs vested during the fiscal year ended June 30, 2014. The Company received $0.3 million in proceeds from exercises of vested PNQs in fiscal 2016, and no PNQs were exercised during the fiscal years ended June 30, 2015 or 2014.
As of June 30, 2016, the Company met the performance target for the first year of the fiscal 2014 and 2015 awards and expects that it will achieve the performance targets set forth in the PNQ agreements for the remainder of the fiscal 2014, fiscal 2015 and fiscal 2016 awards.
The following table summarizes nonvested NQO activity for the two most recent fiscal years:
Nonvested PNQs: 
Number
of
PNQs
 
Weighted
Average
Exercise
Price ($)
 
Weighted
Average
Grant Date
Fair Value ($)
 
Weighted
Average
Remaining
Life (Years)
Outstanding at June 30, 2014 112,442
 21.27
 10.49
 6.5
Granted 121,024
 23.44
 10.16
 6.6
Vested (34,959) 21.27
 10.49
 
Forfeited (9,399) 21.33
 10.52
 
Outstanding at June 30, 2015 189,108
 22.66
 10.28
 6.2
Granted 143,466
 29.48
 11.38
 6.2
Vested (27,317) 10.16
 23.44
 
Forfeited (64,790) 23.20
 10.37
 
Outstanding at June 30, 2016 240,467
 26.49
 10.92
 5.9

Farmer Bros. Co.
Notes to Consolidated Financial Statements (continued)


As of June 30, 2016 and 2015, there was $1.9 million and $1.5 million , respectively, of unrecognized compensation cost related to PNQs. The unrecognized compensation cost related to PNQs at June 30, 2016 is expected to be recognized over the weighted average period of 1.5 years. Total compensation expense related to PNQs in fiscal 2016, 2015 and 2014 was $0.5 million, $0.5 million and $0.3 million, respectively.
Restricted Stock
During fiscal 2016, 2015 and 2014 the Company granted a total of 10,170 shares, 13,256 shares and 9,200 shares of restricted stock under the Amended Equity Plan, respectively, with a weighted average grant date fair value of $29.99, $23.64, and $20.48 per share, respectively, to eligible employees and directors. Shares of restricted stock generally vest at the end of three years for eligible employees. Shares of restricted stock generally vest ratably over a period of three years for directors. During the fiscal year ended June 30, 2016, 24,841 shares of restricted stock vested, of which 5,177 shares were withheld to meet the employees’ minimum statutory tax withholding and retired.
The following table summarizes restricted stock activity for the three most recent fiscal years:
Outstanding and Nonvested Restricted Stock Awards: 
Shares
Awarded
 
Weighted
Average
Grant Date
Fair Value
($)
 
Weighted
Average
Remaining
Life
(Years)
 
Aggregate
Intrinsic
Value
($ in thousands)
Outstanding at June 30, 2013 139,360
 9.87
 1.9 1,959
Granted 9,200
 20.48
  188
Exercised/Released (38,212) 11.59
  820
Cancelled/Forfeited (14,136) 9.38
  
Outstanding at June 30, 2014 96,212
 10.27
 1.5 2,079
Granted 13,256
 23.64
  313
Exercised/Released(1) (53,402) 8.43
  1,377
Cancelled/Forfeited (8,984) 8.36
  
Outstanding at June 30, 2015 47,082
 16.48
 1.2 1,106
Granted 10,170
 29.99
  305
Exercised/Released(2) (24,841) 14.08
  747
Cancelled/Forfeited (8,619) 13.06
  
Outstanding at June 30, 2016 23,792
 26.00
 1.8 763
Expected to vest, June 30, 2016 22,253
 25.91
 1.8 713
__________
(1) Includes 4,297 shares that were withheld to meet the employees' minimum statutory tax withholding and retired..
(2) Includes 5,177 shares that were withheld to meet the employees' minimum statutory tax withholding and retired.

The aggregate intrinsic value of shares outstanding at the end of each fiscal period in the table above represent the total pretax intrinsic values, based on the Company’s closing stock price of $32.06 at June 30, 2016, $23.50 at June 30, 2015 and $21.61 at June 30, 2014 , representing the last trading day of the respective fiscal years. Restricted stock that is expected to vest is net of estimated forfeitures.
As of June 30, 2016 and 2015, there was $0.5 million of unrecognized compensation cost related to restricted stock. The unrecognized compensation cost related to restricted stock at June 30, 2016 is expected to be recognized over the weighted average period of 2.0 years. Total compensation expense for restricted stock was $0.2 million, $0.3 million and $0.5 million, for the fiscal years ended June 30, 2016, 2015 and 2014, respectively.


Farmer Bros. Co.
Notes to Consolidated Financial Statements (continued)


Note 18. Other Current Liabilities
Other current liabilities consist of the following:
  June 30,
(In thousands) 2016 2015
Accrued postretirement benefits $1,060
 $1,051
Accrued workers’ compensation liabilities 3,225
 2,382
Short-term pension liabilities 347
 347
Earnout payable—RLC acquisition 100
 100
Other (including net taxes payable) 2,214
 2,272
  Other current liabilities $6,946
 $6,152

Note 19. Other Long-Term Liabilities
Other long-term liabilities include the following:
  June 30,
(In thousands) 2016 2015
New Facility lease obligation(1) $28,110
 $
Earnout payable—RLC acquisition(2) 100
 200
Derivative liabilities, non-current 
 25
Other long-term liabilities $28,210
 $225
___________
(1) Lease obligation associated with construction of the New Facility (see Note 4).
(2) Earnout payable to RLC (see Note 2).

Note 20. Income Taxes

The current and deferred components of the provision for income taxes consist of the following:
  June 30,
(In thousands) 2016 2015 2014
Current:      
Federal $214
 $(30) $293
State 103
 309
 275
Total current income tax expense 317
 279
 568
Deferred:      
Federal (66,648) 106
 99
State (13,666) 17
 38
Total deferred income tax (benefit) expense (80,314) 123
 137
Income tax (benefit) expense $(79,997) $402
 $705
Income tax expense or benefit from continuing operations is generally determined without regard to other categories of earnings, such as discontinued operations and OCI. An exception is provided in ASC 740, “Tax Provisions,” when there is aggregate income from categories other than continuing operations and a loss from continuing operations in the current year. In this case, the income tax benefit allocated to continuing operations is the amount by which the loss from continuing operations reduces the income tax expense recorded with respect to the other categories of earnings, even when a valuation allowance has been established against the deferred tax assets. In instances where a valuation allowance is established against current year losses, income from other sources, including gain from postretirement benefits recorded as a component of OCI, is considered when determining whether sufficient future taxable income exists to realize the deferred tax assets.

Farmer Bros. Co.
Notes to Consolidated Financial Statements (continued)


As a result, for the fiscal years ended June 30, 2016, 2015 and 2014, the Company recorded income tax expense of$2.0 million, $0, and $0, respectively, in OCI related to the gain on postretirement benefits, and recorded a corresponding income tax benefit of $2.0 million, $0, and $0, respectively, in continuing operations.
A reconciliation of income tax (benefit) expense to the federal statutory tax rate is as follows:
  June 30,
(In thousands) 2016 2015 2014
Statutory tax rate 35% 34% 34%
Income tax expense at statutory rate $3,472
 $358
 $4,365
State income tax expense, net of federal tax benefit 557
 260
 749
Dividend income exclusion (140) (54) 
Valuation allowance (83,230) (185) (4,292)
Change in tax rate (1,061) 
 
Retiree life insurance 135
 
 
Change in contingency reserve (net) 
 
 (39)
Other (net) 270
 23
 (78)
Income tax (benefit) expense $(79,997) $402
 $705
The primary components of the temporary differences which give rise to the Company’s net deferred tax liabilities are as follows:
  June 30,
(In thousands) 2016 2015 2014
Deferred tax assets:      
Postretirement benefits $33,273
 $31,100
 $19,800
Accrued liabilities 11,760
 10,091
 6,156
Net operating loss carryforwards 38,196
 41,544
 40,275
Intangible assets 71
 594
 1,126
Other 6,881
 6,794
 7,253
Total deferred tax assets 90,181
 90,123
 74,610
Deferred tax liabilities:      
Unrealized gain on investments (609) (2,242) 
Fixed assets (5,370) (2,647) (1,902)
Other (1,789) (1,943) (1,538)
Total deferred tax liabilities (7,768) (6,832) (3,440)
Valuation allowance (1,627) (84,857) (72,613)
Net deferred tax assets (liabilities) $80,786
 $(1,566) $(1,443)
At June 30, 2016, the Company had approximately $99.7 million in federal and $88.6 million in state net operating loss carryforwards that will begin to expire in the years ending June 30, 2030 and June 30, 2017, respectively. Additionally, at June 30, 2016, the Company had $0.8 million of federal business tax credits that begin to expire in June 30, 2025.
As of June 30, 2016, the Company has generated approximately $1.2 million of excess tax benefits related to stock compensation, the benefit of which will be recorded to additional paid in capital if and when realized.
At June 30, 2016, the Company had total deferred tax assets of $90.2 million and net deferred tax assets before valuation allowance of $82.4 million.
The Company evaluated it deferred tax assets quarterly to determine if a valuation is required. In the fourth quarter of fiscal 2016, the Company considered whether a valuation allowance should be recorded against deferred tax assets based on the likelihood that the benefits of the deferred tax assets would or would not ultimately be realized in future periods. In making

Farmer Bros. Co.
Notes to Consolidated Financial Statements (continued)


such assessment, significant weight was given to evidence that could be objectively verified such as recent operating results and less consideration was given to less objective indicators such as future income projections. After consideration of positive and negative evidence, including the recent history of income, the Company concluded that it is more likely than not that the Company will generate future income sufficient to realize the majority of the Company’s deferred tax assets as of June 30, 2016. Accordingly, the Company has recorded a reduction in its valuation allowance in fiscal 2016 in the amount of $83.2 million.
The Company cannot conclude that certain state net operating loss carry forwards and tax credit carryovers will be utilized before expiration. Accordingly, the Company will maintain a valuation allowance of $1.6 million to offset this deferred tax asset. The valuation allowance decreased $83.2 million and $12.3 million, respectively, in fiscal 2016 and 2015 and increased $9.9 million in fiscal 2014. The Company will continue to monitor all available evidence, both positive and negative, in determining whether it is more likely than not that the Company will realize its remaining deferred tax assets.
A tabular reconciliation of the total amounts (in absolute values) of unrecognized tax benefits is as follows:
  Year Ended June 30,
(In thousands) 2016 2015 2014
Unrecognized tax benefits at beginning of year $
 $
 $3,211
Decreases in tax positions for prior years 
 
 (30)
Settlements 
 
 (3,181)
Unrecognized tax benefits at end of year $
 $
 $
At June 30, 2016 and 2015, the Company has no unrecognized tax benefits.
The Company made a determination in the quarter ended June 30, 2014 that it would not, at that time, pursue certain refund claims requested on its amended tax returns for the fiscal years ended June 30, 2003 through June 30, 2008. The Internal Revenue Service previously denied these refund claims upon audit and maintained that decision upon appeal. The Company released its tax reserve related to these refunds in the fourth quarter of fiscal 2014.
The Company files income tax returns in the U.S. and in various state jurisdictions with varying statutes of limitations. The Company is no longer subject to U.S. income tax examinations for the fiscal years prior to June 30, 2012. The Internal Revenue Service is currently auditing the Company's tax years ended June 30, 2013 and 2014.
The Company’s policy is to recognize interest expense and penalties related to income tax matters as a component of income tax expense. In each of the fiscal years ended June 30, 2016 and 2015, the Company recorded $0 in accrued interest and penalties associated with uncertain tax positions. Additionally, the Company recorded income of $0 related to interest and penalties on uncertain tax positions in the fiscal years ended June 30, 2016, 2015 and 2014, respectively.
Note 21. Net Income Per Common Share
  Year ended June 30,
(In thousands, except share and per share amounts) 2016 2015 2014
Net income attributable to common stockholders—basic $89,812
 $651
 $12,063
Net income attributable to nonvested restricted stockholders 106
 1
 69
Net income $89,918
 $652
 $12,132
       
Weighted average common shares outstanding—basic 16,502,523
 16,127,610
 15,909,631
Effect of dilutive securities:      
Shares issuable under stock options 124,879
 139,524
 104,956
Weighted average common shares outstanding—diluted 16,627,402
 16,267,134
 16,014,587
Net income per common share—basic $5.45
 $0.04
 $0.76
Net income per common share—diluted $5.41
 $0.04
 $0.76


Farmer Bros. Co.
Notes to Consolidated Financial Statements (continued)


Note 22. Commitments and Contingencies
Leases
On July 17, 2015, the Company entered into the Lease Agreement, with lessor pursuant to which the Company leased the New Facility (see Note 4). The Company recorded an asset related to the New Facility lease obligation included in property, plant and equipment of $28.1 million at June 30, 2016 with an offsetting liability of $28.1 million for the lease obligation included in "Other long-term liabilities" on the Company's consolidated balance sheet at June 30, 2016. There were no such amounts recorded at June 30, 2015 (see Note 19). On June 15, 2016, the Company exercised its option to purchase the partially constructed New Facility under the Lease Agreement. The terms of the Company's capital leases vary from 12 months to 84 months with varying expiration dates through 2021.
The Company is also obligated under operating leases for branch warehouses, distribution centers and its production facility in Portland, Oregon. Some operating leases have renewal options that allow the Company, as lessee, to extend the leases. The Company has one operating lease with a term greater than five years that expires in 2018 and has a ten year renewal option, and operating leases for computer hardware with terms that do not exceed three years. Rent expense for the fiscal years ended June 30, 2016, 2015 and 2014 was $4.5 million, $3.8 million and $3.7 million, respectively.
Contractual obligations for future fiscal years are as follows:
  Contractual Obligations
(In thousands) 
Capital Lease
Obligations
 
Operating
 Lease
Obligations
 New Facility Purchase Option Exercise Price(1) 
Pension Plan
Obligations
 
Postretirement
Benefits Other
Than Pension Plans
 Revolving Credit Facility Purchase Commitments (2)
Year Ended June 30,              
2017 $1,443
 $4,093
 $58,779
 $8,075
 $1,080
 $109
 $72,217
2018 $880
 $3,366
 $
 $8,304
 $1,102
 $
 $
2019 $125
 $2,561
 $
 $8,554
 $1,143
 $
 $
2020 $52
 $1,279
 $
 $8,844
 $1,176
 $
 $
2021 $4
 $441
 $
 $9,074
 $1,210
 $
 $
Thereafter $
 $61
 $
 $47,099
 $6,246
 $
 $
    $11,801
 $58,779
 $89,950
 $11,957
 $109
 $72,217
Total minimum lease payments $2,504
            
Less: imputed interest
   (0.82% to 10.7%)
 $(145)            
Present value of future minimum lease payments $2,359
            
Less: current portion $1,323
            
Long-term capital lease obligations $1,036
            
___________
(1) Includes estimated purchase option exercise price pursuant to the Lease Agreement for the partially constructed New Facility. The table above reflects purchase option exercise price based on the budget and after completion of the construction, payable in fiscal year ending June 30, 2017 (see Note 4). The actual purchase option exercise price will be based on actual construction-related costs for the partially constructed facility as of the purchase option closing date.
(2) Purchase commitments include commitments under coffee purchase contracts for which all delivery terms have been finalized but the related coffee has not been received as of June 30, 2016. Amounts shown in the table above: (a) include all coffee purchase contracts that the Company considers to be from normal purchases; and (b) do not include amounts related to derivative instruments that are recorded at fair value on the Company’s consolidated balance sheets.

Farmer Bros. Co.
Notes to Consolidated Financial Statements (continued)


Self-Insurance
At June 30, 2016 and 2015, the Company had posted a $7.4 million and $7.0 million letter of credit, respectively, as a security deposit with the State of California Department of Industrial Relations Self-Insurance Plans for participation in the alternative security program for California self-insurers for workers’ compensation liability. At June 30, 2016 and 2015, the Company had posted a $4.3 million letter of credit as a security deposit for self-insuring workers’ compensation, general liability and auto insurance coverages outside of California.
Non-cancelable Purchase Orders
As of June 30, 2016, the Company had committed to purchase green coffee inventory totaling $62.5 million under fixed-price contracts, equipment for the New Facility totaling $3.3 million and other inventory totaling $6.3 million under non-cancelable purchase orders.
Legal Proceedings
Council for Education and Research on Toxics (“CERT”) v. Brad Berry Company Ltd., et al., Superior Court of the State of California, County of Los Angeles
On August 31, 2012, CERT filed an amendment to a private enforcement action adding a number of companies as defendants, including CBI, which sell coffee in California. The suit alleges that the defendants have failed to issue clear and reasonable warnings in accordance with Proposition 65 that the coffee they produce, distribute and sell contains acrylamide. This lawsuit was filed in Los Angeles Superior Court (the “Court”). CERT has demanded that the alleged violators remove acrylamide from their coffee or provide Proposition 65 warnings on their products and pay $2,500 per day for each and every violation while they are in violation of Proposition 65.
Acrylamide is produced naturally in connection with the heating of many foods, especially starchy foods, and is believed to be caused by the Maillard reaction, though it has also been found in unheated foods such as olives. With respect to coffee, acrylamide is produced when coffee beans are heated during the roasting process-it is the roasting itself that produces the acrylamide. While there has been a significant amount of research concerning proposals for treatments and other processes aimed at reducing acrylamide content of different types of foods, to our knowledge there is currently no known strategy for reducing acrylamide in coffee without negatively impacting the sensorial properties of the product.
The Company has joined a Joint Defense Group and, along with the other co-defendants, has answered the complaint, denying, generally, the allegations of the complaint, including the claimed violation of Proposition 65 and further denying CERT’s right to any relief or damages, including the right to require a warning on products. The Joint Defense Group contends that based on proper scientific analysis and proper application of the standards set forth in Proposition 65, exposures to acrylamide from the coffee products pose no significant risk of cancer and, thus, these exposures are exempt from Proposition 65’s warning requirement.
To date, the pleadings stage of the case has been completed. The Court has phased trial so that the “no significant risk level” defense, the First Amendment defense, and the preemption defense will be tried first. Fact discovery and expert discovery on these “Phase 1” defenses have been completed, and the parties filed trial briefs. Trial commenced on September 8, 2014, and testimony completed on November 4, 2014, for the three Phase 1 defenses.   Following two continuances, the court heard on April 9, 2015 final arguments on the Phase 1 issues. On July 25, 2015, the Court issued its Proposed Statement of Decision with respect to Phase 1 defenses against the defendants, which was confirmed, on September 2, 2015 in the Final Statement of Decision. The Court has stated that all defendants would be included in “Phase 2,” though this remains unresolved, including the extent of the involvement or participation in discovery. Following permission from the Court, on October 14, 2015 the Joint Defense Group filed a writ petition for an interlocutory appeal. In late December 2015, plaintiff’s counsel served letters proposing a new plan to file the anticipated motion for summary adjudication and a new set of discovery on all defendants. On January 14, 2016, the Court of Appeals denied the Joint Defense Group’s writ petition thereby denying the interlocutory appeal. On February 16, 2016, CERT filed a motion for summary adjudication arguing that based upon facts that had been stipulated by defendants, CERT had proven its prima facie case and all that remains is a determination of whether any affirmative defenses are available to defendants. On March 16, 2016, the Court reinstated the stay on discovery for all defendant parties except for the four largest defendants, so the Company is not currently obligated to participate in discovery. Following a hearing on April 20, 2016, the Court granted

Farmer Bros. Co.
Notes to Consolidated Financial Statements (continued)


CERT’s motion for summary adjudication on its prima facie case. Plaintiff filed its motion for summary adjudication of affirmatives defenses on May 16, 2016 and the defendants’ opposition brief was filed on July 22, 2016. Certain discovery responses were scheduled to be due by September 9, 2016. At an August 19, 2016 hearing on Plaintiff’s motion for summary adjudication and defendants’ opposition with respect to the affirmative defenses, the Court denied Plaintiff’s motion, thus the Joint Defense Group will continue to be able to present the affirmative defenses at trial. At this time, the Company is not able to predict the probability of the outcome or estimate of loss, if any, related to this matter. 
Steve Hernandez vs. Farmer Bros. Co., Superior Court of State of California, County of Los Angeles
On July 24, 2015, former Company employee Hernandez filed a putative class action complaint for damages alleging a single cause of action for unfair competition under the California Business & Professions Code. The claim purports to seek disgorgement of profits for alleged violations of various provisions of the California Labor Code relating to: failing to pay overtime, failing to provide meal breaks, failing to pay minimum wage, failing to pay wages timely during employment and upon termination, failing to provide accurate and complete wage statements, and failing to reimburse business-related expenses. Hernandez’s complaint seeks restitution in an unspecified amount and injunctive relief, in addition to attorneys’ fees and expenses. Hernandez alleges that the putative class is all “current and former hourly-paid or non-exempt individuals” for the four (4) years preceding the filing of the complaint through final judgment, and Hernandez also purports to reserve the right to establish sub-classes as appropriate.  On November 12, 2015, a separate putative class representative, Monica Zuno, filed claim under the same class action; the Court has related this case to the Hernandez case. On November 17, 2015, the unified case was assigned to a judge, and this judge ordered the stay on discovery to remain intact until after a decision on the Company’s demurrer action. The plaintiff filed an Opposition to the Demurrer and, in response, on January 5, 2016, the Company filed a reply to this Opposition to the Demurrer. On February 2, 2016, the Court held a hearing on the demurrer and found in the Company’s favor, sustaining the demurrer in its entirety without leave to amend as to the plaintiff Hernandez, and so dismissing Hernandez’s claims and the related putative class. Claims on behalf of the plaintiff Zuno remain at this time, pending the filing of an amended complaint on behalf of this remaining plaintiff and reduced putative class. The Company provided responses to discovery following a lift by the Court of the stay on discovery. The Court has set a case management conference for October 18, 2016 to give Plaintiff’s counsel time to review the discovery documents the Company produced and determine whether Plaintiff intends to proceed with the case as a putative class action or on an individual basis only. At this time, we are not able to predict the probability of the outcome or estimate of loss, if any, related to this matter.
The Company is a party to various other pending legal and administrative proceedings. It is management’s opinion that the outcome of such proceedings will not have a material impact on the Company’s financial position, results of operations, or cash flows.

Note 23. Selected Quarterly Financial Data (Unaudited)
The following tables set forth certain unaudited quarterly information for each of the eight fiscal quarters in the two year period ended June 30, 2016. This quarterly information has been prepared on a consistent basis with the audited consolidated financial statements and, in the opinion of management, includes all adjustments which management believes are necessary for a fair presentation of the information for the periods presented.
The Company's quarterly operating results may fluctuate significantly as a result of a variety of factors, and operating results for any fiscal quarter are not necessarily indicative of results for a full fiscal year or future fiscal quarters.

Farmer Bros. Co.
Notes to Consolidated Financial Statements (continued)


  September 30,
2015
 December 31,
2015
 March 31,
2016
 June 30,
2016
(In thousands, except per share data)        
Net sales $133,445
 $142,307
 $134,468
 $134,162
Gross profit $50,579
 $52,908
 $52,560
 $52,428
(Loss) income from operations $(563) $5,361
 $306
 $3,075
Net (loss) income $(1,074) $5,561
 $1,192
 $84,239
Net (loss) income) per common share—basic $(0.07) $0.34
 $0.07
 $5.09
Net (loss) income per common share—diluted $(0.07) $0.34
 $0.07
 $5.05
  September 30,
2014
 December 31,
2014
 March 31,
2015
 June 30,
2015
(In thousands, except per share data)        
Net sales $135,984
 $144,809
 $132,507
 $132,582
Gross profit $48,121
 $53,142
 $46,569
 $49,204
Income (loss) from operations $2,601
 $3,505
 $(1,405) $(1,417)
Net income (loss) $2,515
 $2,896
 $(2,572) $(2,187)
Net income (loss) per common share—basic $0.16
 $0.18
 $(0.16) $(0.13)
Net income (loss) per common share—diluted $0.16
 $0.18
 $(0.16) $(0.13)
In the fourth quarter of fiscal 2016, the Company concluded that it is more likely than not that the Company will generate future earnings sufficient to realize the majority of the Company’s deferred tax assets as of June 30, 2016. Accordingly, the Company recorded a reduction in its valuation allowance in the fourth quarter of fiscal 2016 in the amount of $83.2 million. See Note 20.

Note 24. Subsequent Events
Completion of the Sale of Assets
On July 15, 2016, the Company completed the sale of certain property, including the Company’s former headquarters, located at 20333 S. Normandie Avenue, Torrance, CA 90502 (the "Torrance Property"), consisting of approximately 665,000 square feet of buildings located on approximately 20.33 acres of land, for an aggregate cash sale price of $43.0 million. The Company received net proceeds of $42.5 million from the sale of the Torrance Property, after customary adjustments for closing costs and documentary transfer taxes.

Asset Purchase Agreement
On September 9, 2016, a newly-formed, wholly-owned subsidiary of the Company, as the Buyer, and China Mist Brands, Inc., dba China Mist Tea Company ("China Mist"), as the Seller, entered into a definitive agreement to purchase substantially all of the assets and certain specified liabilities of China Mist, a provider of flavored iced teas and iced green teas, for an aggregate purchase price of $11.3 million, with $10.8 million to be paid in cash at closing and $0.5 million to be paid as earnout subject to certain conditions. The transaction is expected to close during the second quarter of fiscal 2017.


Item 9.Changes in and Disagreements with Accountants on Accounting and Financial Disclosure
None.
Item 9A.Controls and Procedures
Disclosure Controls and Procedures
Disclosure controls and procedures, as defined in Rules 13a-15(e) and 15d-15(e) promulgated under the Exchange Act, are controls and other procedures that are designed to ensure that information required to be disclosed by us in the reports that we file or submit under the Exchange Act is recorded, processed, summarized and reported, within the time periods specified in the rules and forms of the SEC. Disclosure controls and procedures include, without limitation, controls and procedures designed to ensure that information we are required to disclose in the reports that we file or submit under the Exchange Act is accumulated and communicated to our management, including our Chief Executive Officer and Chief Financial Officer, as appropriate to allow timely decisions regarding required disclosures.
As of June 30, 2016, our management, with the participation of our Chief Executive Officer and Chief Financial Officer, carried out an evaluation of the effectiveness of our disclosure controls and procedures pursuant to Rule 13a-15(e) promulgated under the Exchange Act. Based upon that evaluation, our Chief Executive Officer and Chief Financial Officer concluded that, as of June 30, 2016, our disclosure controls and procedures are effective.
Management's Report on Internal Control Over Financial Reporting
Our management is responsible for establishing and maintaining adequate internal control over financial reporting as such term is defined in Exchange Act Rules 13a-15(f) and 15d-15(f). Internal control over financial reporting refers to the process designed by, or under the supervision of, our Chief Executive Officer and Chief Financial Officer, and effected by our Board of Directors, management and other personnel, to provide reasonable assurance regarding the reliability of financial reporting and the preparation of financial statements for external purposes in accordance with generally accepted accounting principles. Due to its inherent limitations, internal control over financial reporting may not prevent or detect misstatements. Projections of any evaluation of effectiveness to future periods are subject to the risks that controls may become inadequate because of changes in conditions or that the degree of compliance with policies or procedures may deteriorate.
With the participation of the Chief Executive Officer and Chief Financial Officer, our management conducted an evaluation of the effectiveness of our internal control over financial reporting based on the framework and criteria established in the 2013 “Internal Control—Integrated Framework,” issued by the Committee of Sponsoring Organizations of the Treadway Commission. Based upon this evaluation, our Chief Executive Officer and Chief Financial Officer concluded that our internal control over financial reporting was effective as of June 30, 2016.
The effectiveness of our internal control over financial reporting has been audited by Deloitte & Touche LLP, an independent registered public accounting firm, as stated in their report which appears herein.
Changes in Internal Control Over Financial Reporting
There has been no change in our internal control over financial reporting (as defined in Rules 13a-15(f) and 15d-15(f) promulgated under the Exchange Act) during our fiscal quarter ended June 30, 2016, that has materially affected, or is reasonably likely to materially affect, our internal control over financial reporting.


Report of Independent Registered Public Accounting Firm

To the Board of Directors and Stockholders of
Farmer Bros. Co.
Torrance, California

We have audited the internal control over financial reporting of Farmer Bros. Co. and subsidiaries (the "Company") as of June 30, 2016, based on criteria established in Internal Control - Integrated Framework (2013)issued by the Committee of Sponsoring Organizations of the Treadway Commission. The Company's management is responsible for maintaining effective internal control over financial reporting and for its assessment of the effectiveness of internal control over financial reporting, included in the accompanying Management’s Report on Internal Control Over Financial Reporting. Our responsibility is to express an opinion on the Company's internal control over financial reporting based on our audit.
We conducted our audit in accordance with the standards of the Public Company Accounting Oversight Board (United States). Those standards require that we plan and perform the audit to obtain reasonable assurance about whether effective internal control over financial reporting was maintained in all material respects. Our audit included obtaining an understanding of internal control over financial reporting, assessing the risk that a material weakness exists, testing and evaluating the design and operating effectiveness of internal control based on the assessed risk, and performing such other procedures as we considered necessary in the circumstances. We believe that our audit provides a reasonable basis for our opinion.
A company's internal control over financial reporting is a process designed by, or under the supervision of, the company's principal executive and principal financial officers, or persons performing similar functions, and effected by the company's board of directors, management, and other personnel to provide reasonable assurance regarding the reliability of financial reporting and the preparation of financial statements for external purposes in accordance with generally accepted accounting principles. A company's internal control over financial reporting includes those policies and procedures that (1) pertain to the maintenance of records that, in reasonable detail, accurately and fairly reflect the transactions and dispositions of the assets of the company; (2) provide reasonable assurance that transactions are recorded as necessary to permit preparation of financial statements in accordance with generally accepted accounting principles, and that receipts and expenditures of the company are being made only in accordance with authorizations of management and directors of the company; and (3) provide reasonable assurance regarding prevention or timely detection of unauthorized acquisition, use, or disposition of the company's assets that could have a material effect on the financial statements.
Because of the inherent limitations of internal control over financial reporting, including the possibility of collusion or improper management override of controls, material misstatements due to error or fraud may not be prevented or detected on a timely basis. Also, projections of any evaluation of the effectiveness of the internal control over financial reporting to future periods are subject to the risk that the controls may become inadequate because of changes in conditions, or that the degree of compliance with the policies or procedures may deteriorate.
In our opinion, the Company maintained, in all material respects, effective internal control over financial reporting as of June 30, 2016, based on the criteria established in Internal Control - Integrated Framework (2013)issued by the Committee of Sponsoring Organizations of the Treadway Commission.
We have also audited, in accordance with the standards of the Public Company Accounting Oversight Board (United States), the consolidated financial statements as of and for the year ended June 30, 2016 of the Company and our report dated September 13, 2016 expressed an unqualified opinion on those financial statements.

/s/ DELOITTE & TOUCHE LLP
Dallas, Texas
September 13, 2016


Item 9B.Other Information
None.
PART III

Item 10.Directors, Executive Officers and Corporate Governance
The information required by this item will be set forth in the Proxy Statement and is incorporated in this report by reference.
Code of Conduct and Ethics
We maintain a written Code of Conduct and Ethics for all employees, officers and directors, including our principal executive officer, principal financial officer, principal accounting officer or controller, and other persons performing similar functions. To view this Code of Conduct and Ethics free of charge, please visit our website at www.farmerbros.com (This website address is not intended to function as a hyperlink, and the information contained in our website is not intended to be a part of this filing). We intend to satisfy the disclosure requirements under Item 5.05 of Form 8-K regarding an amendment to, or waiver from, a provision of this Code of Conduct and Ethics, if any, by posting such information on our website as set forth above.
Compliance with Section 16(a) of the Exchange Act
To the Company’s knowledge, based solely on a review of the copies of such reports furnished to the Company and written representations that no other reports were required during the fiscal year ended June 30, 2016, its officers, directors and ten percent stockholders complied with all applicable Section 16(a) filing requirements, except that, Michael H. Keown, the Company's President and Chief executive Officer, filed a late Form 4 in December 2015 reporting the sale of vested restricted shares to cover tax withholding requirements and with the exception of those filings listed in the Company's Proxy Statement expected to be dated and filed with the SEC not later than 120 days after the conclusion of the Company's fiscal year ended June 30, 2016.
Item 11.Executive Compensation
The information required by this item will be set forth in the Proxy Statement and is incorporated in this report by reference.


Item ITEM 12.Security Ownership of Certain Beneficial Owners and Management and Related Stockholder Matters
The information required by this item will be set forth in the Proxy Statement and is incorporated in this report by reference.

Securities Authorized for Issuance under Equity Compensation Plan Information

Information aboutPlans

The following table sets forth information as of June 30, 2023 with respect to the shares of Common Stock that may be issued upon the exercise of options and other rights under our existing equity compensation plans atand arrangements in effect as of June 30, 2016 that were either approved or not approved2023. The information includes the number of shares covered by, our stockholders was as follows:

Plan Category 
Number of
Shares to be
Issued Upon
Exercise of
Outstanding
Options
 
Weighted
Average
Exercise
Price of
Outstanding
Options
 
Number of
Shares
Remaining
Available
for Future
Issuance(2)
Equity compensation plans approved by stockholders(1) 508,228 $20.66 151,857
Equity compensation plans not approved by stockholders   
Total 508,228 $20.66 151,857
________________
(1) Includesand the weighted average exercise price of, outstanding options and the number of shares issued under the Amended Equity Plan and its predecessor plan, the Farmer Bros. Co. 2007 Omnibus Plan.
(2) Sharesremaining available for future issuance undergrant, excluding the Amended Equityshares to be issued upon exercise of outstanding options, warrants and rights.

Plan Category Number of Shares to be
Issued Upon Exercise /
Vesting of Outstanding
Options or Rights(2)
  Weighted Average
Exercise Price of
Outstanding Options(3)
  Number of Shares
Remaining Available for
Future Issuance(4)
 
Equity compensation plans approved by stockholders(1)  1,945,285   11.69   1,604,715 
Equity compensation plans not approved by stockholders(5)  220,216   11.69   79,784 
Total  2,165,501       1,684,499 

(1)Includes shares issued under the Amended and Restated 2007 Long-Term Incentive Plan, and its predecessor plan, the Farmer Bros. Co. 2007 Omnibus Incentive Plan (together, the “Prior Plans”) and the 2017 Plan. The 2017 Plan succeeded the Prior Plans. On the Effective Date of the 2017 Plan, the Company ceased granting awards under the Prior Plans; however, awards outstanding under the Prior Plans will remain subject to the terms of the applicable Prior Plan.


(2)Includes shares that may be issued upon the achievement of certain financial and other performance criteria as a condition to vesting in addition to time-based vesting pursuant to PBRSUs granted under the 2017 Plan. The PBRSUs included in the table include the maximum number of shares that may be issued under the awards. Under the terms of the awards, the recipient may earn between 0% and 225% of the target number of PBRSUs depending on the extent to which the Company meets or exceeds the achievement of the applicable financial performance goals.
(3)Does not include outstanding PBRSUs.
(4)The 2017 Plan authorizes the issuance of (i) 3,550,000 shares of Common Stock plus (ii) the number of shares of Common Stock subject to awards under the Prior Plans that are outstanding as of the Effective Date and that expire or are forfeited, cancelled or similarly lapse following the Effective Date. Subject to certain limitations, shares of Common Stock covered by awards granted under the 2017 Plan that are forfeited, expire or lapse, or are repurchased for or paid in cash, may be used again for new grants under the 2017 Plan. Shares of Common Stock granted under the 2017 Plan may be authorized but unissued shares, shares purchased on the open market or treasury shares. In no event will more than 3,550,000 shares of Common Stock be issuable pursuant to the exercise of incentive stock options under the 2017 Plan. The 2017 Plan provides for the grant of stock options (including incentive stock options and non-qualified stock options), stock appreciation rights, restricted stock, restricted stock units, dividend equivalents, performance shares and other stock- or cash-based awards to eligible participants. Non-employee directors of the Company and employees of the Company or any of its subsidiaries are eligible to receive awards under the 2017 Plan. If the Plan Amendment is adopted, the Company’s consultants would also be eligible to receive awards under the 2017 Plan.
(5)Consists of grants made under the Farmer Bros. Co. 2020 Inducement Incentive Award Plan (the “Inducement Award Plan”), which in accordance with Rule 5635(c)(4) of the Nasdaq Listing Rules (“Rule 5635(c)(4)”) permits grants of up to 300,000 shares of Common Stock to newly hired employees who have not previously been a member of the Board, or to an employee who is being rehired following a bona fide period of non-employment by the Company or a subsidiary, as a material inducement to the employee’s entering into employment with the Company or its subsidiary. Subject to certain limitations, shares of Common Stock covered by awards granted under the Inducement Award Plan that are forfeited, expire or lapse, or are repurchased for or paid in cash, may be used again for new grants under the Amended and Restated 2017 Plan. The Inducement Award Plan allows for the grant of non-qualified stock options, stock appreciation rights, restricted stock, restricted stock units, and dividend equivalents.

Security Ownership of Certain Beneficial Owners and Management

The following table sets forth certain information regarding the beneficial ownership of the Company’s voting securities as of October 19, 2022 by (i) each of our current directors, (ii) each of our executive officers required to be listed pursuant to Item 402 of Regulation S-K, (iii) all of our current directors and executive officers as a group, and (iv) each person, or group of affiliated persons, known to us to be the beneficial owner of more than five percent (5%) of our outstanding Common Stock, based on 20,748,269 shares of Common Stock outstanding as of October 19, 2022.

The amounts and percentages of shares beneficially owned are reported on the basis of SEC regulations governing the determination of beneficial ownership of securities. Under SEC rules, a person is deemed to be a “beneficial” owner of a security if that person has or shares voting power or investment power, which includes the power to dispose of or to direct the disposition of such security. A person is also deemed to be a beneficial owner of any securities of which that person has a right to acquire beneficial ownership within 60 days. Securities that can be so acquired are not deemed to be outstanding for purposes of computing any other person’s percentage. Under these rules, more than one person may be awardeddeemed to be a beneficial owner of securities as to which such person has no economic interest.

Except as otherwise indicated in these footnotes, each of the form of performance-based stock options, restricted stock awards, another cash-based awardindividuals or other incentive payable in cash. Shares covered by an award will be counted as used at the time the award is grantedentities listed below has, to a participant. If any award lapses, expires, terminates or is canceled prior to the issuance of shares thereunder or if shares are issued under the Amended Equity Plan to a participantour knowledge, sole voting and are thereafter reacquired by the Company, the shares subject to such awards and the reacquired shares will again be available for issuance under the Amended Equity Plan. In additioninvestment power with respect to the shares that are actually issued to a participant,of Common Stock. Unless otherwise indicated below, the following items will be counted against the total number of shares availableaddress for issuance under the Amended Equity Plan: (i) shares subject to an award that are not delivered to a participant because the awardeach natural person listed below is exercised through a reduction of shares subject to the award (i.e.c/o Farmer Bros. Co., “net exercised”); (ii) shares subject to an award that are not delivered to a participant because such shares are withheld in satisfaction of the withholding of taxes incurred in connection with the exercise of or issuance of shares under certain types of awards; and (iii) shares that are tendered to the Company to pay the exercise price of any option. The following items will not be counted against the total number of shares available for issuance under the Amended Equity Plan: (A) the payment in cash of dividends; and (B) any award that is settled in cash rather than by issuance of stock.

1912 Farmer Brothers Drive, Northlake, Texas 76262.


Name of Beneficial Owner Amount and Nature of Beneficial Ownership  Percent of
Class(1)
 
Non-Employee Directors:        
Allison M. Boersma  45,913   * 
Stacy Loretz-Congdon  45,641   * 
David A. Pace  0   * 
Alfred Poe  33,764   * 
Bradley L. Radoff(2)  405,000   2.0%
John Robinson  14,683   * 
Waheed Zaman  17,613   * 
Named Executive Officers:        
D. Deverl Maserang II(3)  618,472   3.0%
Scott R. Drake(4)  197,320   1.0%
Jared G. Vitemb(5)  42,665   * 
Ruben E. Inofuentes(6)  79,804   * 
Maurice S.J. Moragne(7)  44,983   * 
Amber D. Jefferson(8)  45,886   * 
All directors and executive officers as a group (13 individuals)  1,550,756   7.5%
Greater than 5% Stockholders:        
Mario J. Gabelli, GAMCO Investors, Inc. and Affiliated Parties (9)  1,523,457   7.3%
James C. Pappas, Aron R. English, and Affiliated Parties(10)  2,958,623   14.3%
Farmer Bros. Co. 401(k) Plan(11)  2,487,867   12.0%

* Less than 1%

(1)Percent of class is calculated based on 20,748,269 outstanding shares of Common Stock, plus securities deemed outstanding pursuant to Rule 13d-3(d)(1) under the Exchange Act, as of October 19, 2022 and may differ from the percent of class reported in statements of beneficial ownership filed with the SEC.
(2)Includes 280,000 shares of common stock held directly by Mr. Radoff and 125,000 shares of Common Stock held indirectly by Mr. Radoff through The Radoff Family Foundation. The principal address of The Radoff Family Foundation is 2727 Kirby Drive, Unit 29L, Houston, Texas 77098.
Item 
(3)Includes 223,713 options vested but unexercised as of October 19, 2023, 330,953 shares of Common Stock owned indirectly by Mr. Maserang through the Maserang Living Trust and 9,209 shares of Common Stock held indirectly by Mr. Maserang through the Company’s 401(k), rounded to the nearest whole share. Also includes 35,806 restricted stock units which vested on an accelerated basis on October 1, 2023 in connection with Mr. Maserang’s separation from the Company. Does not include 118,919 unvested restricted stock units which Mr. Maserang forfeited in connection with his separation from the Company on October 1, 2023.
(4)Includes 88,495 options vested but unexercised as of October 19, 2023 and 10,696 shares of Common Stock held indirectly by Mr. Drake through the Company’s 401(k). Does not include 85,599 unvested restricted stock units, which Mr. Drake forfeited in connection with his separation from the Company on September 30, 2023.

(5)Includes 5,859 restricted stock units which will vest within 60 days of October 19, 2023 and 7,572 shares of Common Stock held indirectly by Mr. Vitemb through the Company’s 401(k).
(6)Includes 27,333 options vested but unexercised as of October 19, 2023 and 7,538 shares of Common Stock held indirectly by Mr. Inofuentes through the Company’s 401(k). Does not include 16,911 unvested shares of restricted stock and 32,495 unvested restricted stock units, which Mr. Inofuentes forfeited in connection with his separation from the Company on February 17, 2023.
(7)Includes 19,780 options vested but unexercised as of October 19, 2023 and 8,142 shares of Common Stock held indirectly by Mr. Moragne through the Company’s 401(k). Does not include 20,473 unvested shares of restricted stock and 23,437 unvested restricted stock units, which Mr. Moragne forfeited in connection with his separation from the Company on February 17, 2023.
(8)Includes 5,859 restricted stock units which will vest within 60 days of October 19, 2023 and 7,176 shares of Common Stock held indirectly by Ms. Jefferson through the Company’s 401(k).
(9)Based solely on an amendment to Schedule 13D filed March 31, 2022, according to which (i) Mario J. Gabelli may be deemed to beneficially own 1,523,457 of these shares, (ii) Gabelli Funds, LLC may be deemed to beneficially own 297,167 of these shares, (iii) GAMCO Asset Management, Inc. may be deemed to beneficially own 767,000 of these shares, (iv) Teton Advisors, Inc. may be deemed to beneficially own 459,000 of these shares, (v) and GAMCO Investors, Inc. may be deemed to beneficially own 290 of these shares. The principal address of each of the aforementioned parties is One Corporate Center, Rye, New York 10580.
(10)Based solely on (1) an amendment to Schedule 13D filed October 16, 2023, according to which (i) Aron R. English may be deemed to beneficially own 1,964,536 of these shares, (ii) 22NW Fund, LP, 22NW, LP, 22NW Fund GP, LLC, and 22NW GP, Inc. may each be deemed to beneficially own 1,955,526 of these shares, and (iii) Bryson O. Hirai-Hadley may be deemed to beneficially own 1,261 of these shares, and (2) an amendment to Schedule 13D filed on October 16, 2023, according to which (i) James C. Pappas and JCP Investment Management, LLC may each be deemed to beneficially own 992,826 of these shares, (ii) JCP Investment Partnership, LP, JCP Investment Partners, LP and JCP Investment Holdings, LLC may each be deemed to beneficially own 671,955 of these shares, and (iii) Troy A. Ellis, Emily K. Keeton and David R. Tresko may each be deemed to beneficially own 0 shares. The principal address of each of Aron R. English, 22NW Fund, LP, 22NW, LP, 22NW Fund GP, LLC, 22NW GP, Inc. and Bryson O. Hirai-Hadley is 590 1st Ave. S, Unit C1, Seattle, Washington 98104. The principal address of James C. Pappas, JCP Investment Management, LLC, JCP Investment Partnership, LP, JCP Investment Partners, LP, and JCP Investment Holdings, LLC is 1177 West Loop South, Suite 1320, Houston, Texas 77027. The principal business address of Troy A. Ellis is 14 Camelback Court, Brentwood, Tennessee 37027. The principal business address of Emily K. Keeton is 2701 Westheimer Road, #6D, Houston, Texas 77098. The principal business address of Daniel R. Tresko is 348 East Winchester Street, Murray, Utah 84107.
(11)This information is based on the Company’s records and includes 2,487,867 shares of Common Stock that are held in the 401(k) and allocated to a participant’s account (“allocated shares”) as of October 19, 2023, and includes the 50,333 shares of Common Stock beneficially owned by the executive officers described above. The 401(k) Trustee votes allocated shares as directed by such participant or beneficiary of the 401(k). The present member of the Administrative Committee of the Farmer Bros. Co. Qualified Employee Retirement Plans (the “Management Administrative Committee”), which administers the 401(k), is Ms. Jefferson. Each member of the Management Administrative Committee disclaims beneficial ownership of the securities held by the 401(k) except for those, if any, that have been allocated to the member as a participant in the 401(k). The principal address of the 401(k) is c/o Farmer Bros. Co., 1912 Farmer Brothers Drive, Northlake, Texas 76262.


ITEM 13.Certain Relationships and Related Transactions, and Director Independence
The information required by this item will

Review and Approval of Related Person Transactions

Under the Company’s written Policies and Procedures for the Review, Approval or Ratification of Related Person Transactions, a related person transaction may be consummated or may continue only if the Audit Committee approves or ratifies the transaction in accordance with the guidelines set forth in the Proxy Statementpolicy. The policy applies to:

(i) any person who is, or at any time since the beginning of the Company’s last fiscal year was, a director, nominee for director or executive officer of the Company; (ii) any person who is known to be the beneficial owner of more than 5% of any class of the Company’s voting securities; and (iii) any immediate family member, as defined in the policy, of, or sharing a household with, any of the foregoing persons. For purposes of the policy, a related person transaction includes, but is incorporatednot limited to, any financial transaction, arrangement or relationship or any series of similar transactions, arrangements or relationships, specifically including indebtedness and guarantees of indebtedness and transactions involving employment, consulting or similar arrangements, between the Company and any of the foregoing persons since the beginning of the Company’s last fiscal year, or any currently proposed transaction in this reportwhich the Company was or is to be a participant or a party, in which the amount involved exceeds $120,000, and in which any of the foregoing persons had or will have a direct or indirect material interest.

The Company will maintain a related person master list to assist in identifying related person transactions, which will be distributed by reference.

the Company’s General Counsel to the Company’s executive officers; the function or department managers responsible for purchasing goods or services for the Company and its subsidiaries; the director of accounts payable and the director of accounts receivable for the Company and its subsidiaries; and any other persons whom the Audit Committee, the Chief Compliance Officer or the General Counsel may designate.

Upon referral by the Chief Compliance Officer, General Counsel or Secretary of the Company, any proposed related person transaction will be reviewed by the Audit Committee for approval or disapproval based on the following:

The materiality of the related person’s interest, including the relationship of the related person to the Company, the nature and importance of the interest to the related person, the amount involved in the transaction, whether the transaction has the potential to present a conflict of interest, whether there are business reasons for the Company to enter the transaction, and whether the transaction would impair the independence of any independent director;

Whether the terms of the transaction, in the aggregate, are comparable to those that would have been reached by unrelated parties in an arm’s length transaction;

The availability of alternative transactions, including whether there is another person or entity that could accomplish the same purposes as the transaction and, if alternative transactions are available, there must be a clear and articulable reason for the transaction with the related person;

Whether the transaction is proposed to be undertaken in the ordinary course of the Company’s business, on the same terms that the Company offers generally in transactions with persons who are not related persons; and

Such additional factors as the Audit Committee determines relevant.

Following review, the Audit Committee will approve or ratify in writing any related person transaction determined by the Audit Committee to be in, or not inconsistent with, the best interests of the Company and its stockholders.

The Audit Committee may impose conditions or guidelines on any related person transaction, including, but not limited to: (i) conditions relating to on-going reporting to the Audit Committee and other internal reporting; (ii) limitations on the amount involved in the transaction; (iii) limitations on the duration of the transaction or the Audit Committee’s approval of the transaction; and (iv) other conditions for the protection of the Company and to avoid conferring an improper benefit, or creating the appearance of a conflict of interest. Any member of the Audit Committee who has or whose immediate family member has an interest in the transaction under discussion will abstain from voting on the approval of the related person transaction, but may, if so requested by the Chair of the Audit Committee, participate in some or all of the Audit Committee’s discussions of the related person transaction.


The Audit Committee will direct the Company’s executive officers to disclose all related person transactions approved by the Audit Committee to the extent required under applicable accounting rules, Federal securities laws, SEC rules and regulations, and Nasdaq Listing Rules.

Related Person Transactions

The Company did not have any related person transactions in fiscal 2023.

Director Independence

At least annually and in connection with any individuals being nominated to serve on the Board, the Board reviews the independence of each director or nominee, including pursuant to Rule 5605 of the Nasdaq Listing Rules, and affirmatively determines whether each director or nominee qualifies as independent. This review includes the submission of responses to a thorough questionnaire by each of our directors or director nominees.

The Board believes that stockholder interests are best served by having a number of objective, independent representatives on the Board. For this purpose, a director or nominee will be considered to be “independent” only if the Board affirmatively determines that the director or nominee has no relationship with respect to the Company that would interfere with the exercise of independent judgment in carrying out the responsibilities of a director. Additionally, pursuant to Rule 5605 of the Nasdaq Listing Rules, our Board must determine that an independent director has no material relationship with us other than as a director. The standards specify the criteria by which the independence of our directors will be determined, including strict guidelines for directors and their immediate families with respect to past employment or affiliation with us or our independent registered public accounting firm. The standards also prohibit Audit Committee members from having any direct or indirect financial relationship with us and restrict both commercial and not-for-profit relationships between us and each director. We may not give personal loans or extensions of credit to our directors, and all directors are required to deal at arm’s length with us and our subsidiaries, and to disclose any circumstance that might be perceived as a conflict of interest.

In making its independence determinations, the Board reviewed transactions, relationships, behavior and arrangements between each director and nominee, or any member of his or her immediate family, and us or our subsidiaries based on information provided by the director or nominee, our records and publicly available information. The Board made the following independence determinations (the transactions, relationships and arrangements reviewed by the Board in making such determinations are set forth in the footnotes below):

DirectorStatus
Allison M. BoersmaIndependent
Stacy Loretz-CongdonIndependent(1)
D. Deverl Maserang IINot Independent(2)
Christopher P. MotternIndependent
David A. PaceIndependent
Alfred PoeIndependent
Bradley L. RadoffIndependent
John D. RobinsonIndependent
Waheed ZamanIndependent
Charles MarcyIndependent

(1)CoreMark Holding Company, Inc. (“Core-Mark”) was a customer of the Company in fiscal 2023 and continues to be a customer of the Company in fiscal 2024. Ms. Loretz-Congdon retired from Core-Mark at the end of 2016 after 26 years of service, including as Senior Vice President, Chief Financial Officer and Assistant Secretary from December 2006 to May 2016 and Executive Advisor from May 2016 to December 2016. Ms. Loretz-Congdon also serves as a Director of the Core-Mark Families Foundation, an independent non-profit foundation that provides scholarships to children of Core-Mark employees, since 2015. Ms. Loretz-Congdon owns less than 1% of the outstanding publicly traded stock of Performance Food Group Company which Core-Mark merged with in September 2021. The Board has determined that these relationships do not create a conflict of interest under the Company’s Code of Conduct and Ethics, do not require disclosure under Item 404(a) of Regulation S-K, and do not interfere with Ms. Loretz-Congdon’s exercise of independent judgment in carrying out the responsibilities of a director of the Company.


(2)Mr. Maserang served as the Company’s President and Chief Executive Officer until his termination without cause, effective September 30, 2023.

ITEM 14.Principal Accountant Fees and Services

Audit Committee Report

The informationAudit Committee has reviewed and discussed with management the Company’s audited consolidated financial statements as of and for the fiscal year ended June 30, 2023.

The Audit Committee has discussed with the Company’s independent registered public accounting firm, Grant Thornton LLP (“Grant Thornton”) (Dallas, Texas, PCAOB ID Number 248), the matters required to be discussed by the Statement on Auditing Standards No. 16, “Communications with Audit Committees,” as adopted by the Public Company Accounting Oversight Board.

The Audit Committee has received the written disclosures and the letter from Grant Thornton required by this itemapplicable requirements of the Public Company Accounting Oversight Board regarding Grant Thornton’s communications with the Audit Committee concerning independence, and has discussed with Grant Thornton that firm’s independence.

Based on the reviews and discussions referred to above, the Audit Committee recommended to the Board of Directors that the audited consolidated financial statements referred to above be included in the Company’s 2023 Form 10-K for filing with the SEC.

Audit Committee of the Board of Directors

Allison M. Boersma, Chair

Stacy Loretz-Congdon

Bradley L. Radoff

Waheed Zaman

Change of Independent Public Accounting Firm

As previously reported on the Company’s Current Report on Form 8-K, filed with the SEC on December 22, 2021, on December 16, 2021, the Company, upon the approval of the Audit Committee, dismissed Deloitte & Touche LLP (“Deloitte”) as its independent registered public accounting firm effective as of December 16, 2021, and engaged Grant Thornton as of such date. Deloitte served as the Company’s independent registered public accounting firm since fiscal 2014.

The reports of Deloitte on the audited consolidated financial statements of the Company for fiscal 2021 and fiscal 2020 did not contain an adverse opinion or a disclaimer of opinion and were not qualified or modified as to uncertainty, audit scope, or accounting principles. During the fiscal 2021 and fiscal 2020, and in the subsequent interim period through December 16, 2021, there were (a) no disagreements (as that term is described in Item 304(a)(1)(iv) of Regulation S-K) with Deloitte on any matter of accounting principles or practices, financial statement disclosure, or auditing scope or procedures, which disagreements, if not resolved to the satisfaction of Deloitte, would have caused Deloitte to make reference to the subject matter of the disagreements in its reports on the consolidated financial statements for such years, and (b) no “reportable events” (as defined in Item 304(a)(1)(v) of Regulation S-K).

Pursuant to Item 304(a)(3) of Regulation S-K, the Company provided Deloitte with a copy of the foregoing disclosures and requested that Deloitte furnish the Company with a letter addressed to the SEC stating whether or not it agrees with the statements made herein. A copy of Deloitte’s letter to the SEC, dated December 22, 2021, is filed as Exhibit 16.1 to the Current Report on Form 8-K filed by the Company regarding the foregoing.


Independent Registered Public Accounting Firm Fees

The following table sets forth the aggregate fees billed by Grant Thornton for fiscal 2022 and 2023, respectively, for audit and non-audit services (as well as all “out-of-pocket” costs incurred in connection with these services) and are categorized as Audit Fees, Audit-Related Fees, Tax Fees and All Other Fees. The nature of the services provided in each such category is described following the table. The Audit Committee approved all audit and permissible non-audit services provided by Grant Thornton in accordance with the pre-approval policies and procedures described below.

  Fiscal 2023
Grant
Thornton
  Fiscal 2022
Grant
Thornton
 
Audit fees(1) $783,836  $626,031 
Audit-related fees(2) $0  $0 
Tax fees(3) $0  $0 
All other fees(4) $0  $0 
Total fees $783,836  $626,031 

(1)“Audit Fees” are fees paid for the audit of the Company’s annual consolidated financial statements included in its Form 10-K and review of financial statements included in the Form 10-Q’s, for the audit of the Company’s internal control over financial reporting, and for services that are normally provided by the auditor in connection with statutory and regulatory filings or engagements. Audit fees for fiscal 2022 and fiscal 2023 consisted of fees associated with the audit of the Company’s annual financial statements, the audit of internal control over financial reporting, the review of the Company’s quarterly reports on Form 10-Q, services associated with SEC registration statements, and accounting advisory services in connection with the impact of new accounting standards.
(2)“Audit-Related Fees” represent fees for assurance and related services that are traditionally performed by Grant Thornton. No audit-related fees were paid to Grant Thornton for fiscal 2022 or fiscal 2023.
(3)“Tax Fees” are fees for tax compliance, planning, advice and consultation services, including state tax representation and miscellaneous consulting on federal and state taxation matters. No tax fees were paid to Grant Thornton for fiscal 2022 or fiscal 2023.
(4)No other fees were paid to Grant Thornton for fiscal 2022 or fiscal 2023.

Pre-Approval of Audit and Non-Audit Services

Under the Farmer Bros. Co. Audit and Non-Audit Services Pre-Approval Policy, the Audit Committee must pre-approve all audit and non-audit services provided by the independent auditor. The policy, as described below, sets forth the procedures and conditions for such pre-approval of services to be performed by the independent auditor. The policy utilizes both a framework of general pre-approval for certain specified services and specific pre-approval for all other services. Unless a type of service has received general pre-approval, it will require specific pre-approval by the Audit Committee if it is to be provided by the independent auditor. Any proposed services exceeding pre-approved cost levels or budgeted amounts will also require specific pre-approval by the Audit Committee.

In the first quarter of each year, the Audit Committee is asked to pre-approve the engagement of the independent auditor and the projected fees for audit services for the current fiscal year. The Audit Committee is also asked to provide general pre-approval for certain audit-related services (assurance and related services that are reasonably related to the performance of the auditor’s review of the financial statements or that are traditionally performed by the independent auditor) and tax services (such as tax compliance, tax planning and tax advice) for the current fiscal year consistent with the SEC’s rules on auditor independence. If the Company wishes to engage the independent auditor for additional services that have not been generally pre-approved as described above, then such engagement will be set forth inpresented to the Proxy Statement andAudit Committee for pre-approval at its next regularly scheduled meeting. Pre-approval of any engagement by the Audit Committee is incorporated in this report by reference.

required before the independent auditor may commence any engagement.

In fiscal 2023, there were no fees paid to Grant Thornton under a de minimis exception to the rules that waive pre-approval for certain non-audit services.


PART IV


Item ITEM 15.Exhibits and Financial Statement Schedules

(a)List of Financial Statements and Financial Statement Schedules:

1. Financial Statements included in Part II, Item 8 of this report:
Consolidated Balance Sheets as of June 30, 2016 and 2015
Consolidated Statements of Operations for the Years Ended June 30, 2016, 2015 and 2014
Consolidated Statements of Comprehensive Income (Loss) for the Years Ended June 30, 2016, 2015 and 2014
Consolidated Statements of Cash Flows for the Years Ended June 30, 2016, 2015 and 2014
Consolidated Statements of Stockholders’ Equity for the Years Ended June 30, 2016, 2015 and 2014
Notes to Consolidated Financial Statements
2. Financial Statement Schedules: Financial Statement Schedules are omitted as they are not applicable, or the required information is given in the

The consolidated financial statements and notes thereto.

3. The exhibits to this Annual Report on Form 10-K are listed on the accompanying index to exhibits and are incorporated herein by reference or are filed as part of this report are indexed in the Annual Report on Form 10-K. Each management contracttable of contents of the Original Filing and incorporated by reference to the Original Filing. Financial Statement Schedules have been omitted, since they are either not applicable, not required or compensation plan required to be filed as an exhibitthe information is identified by an asterisk (*).
included elsewhere herein.


(b)Exhibits: See Exhibit Index.

Item 16.Form 10-K Summary


None.


SIGNATURES
Pursuant to the requirements of Section 13 or 15(d) of the Securities Exchange Act of 1934, the registrant has duly caused this report to be signed on its behalf by the undersigned, thereunto duly authorized.
Exhibit
No.
 Description
2.1 
FARMER BROS. CO.
By:/s/Michael H. Keown
Michael H. Keown
President and Chief Executive Officer
(chief executive officer)
September 13, 2016
By:/s/Isaac N. Johnston, Jr.
Isaac N. Johnston, Jr.
Treasurer and Chief Financial Officer
(principal financial and accounting officer)
September 13, 2016
Pursuant to the requirements of the Securities Exchange Act of 1934, this report has been signed below by the following persons on behalf of the registrant and in the capacities and on the dates indicated.
/s/ Randy E. ClarkChairman of the Board and DirectorSeptember 13, 2016
Randy E. Clark
/s/ Guenter W. BergerChairman Emeritus and DirectorSeptember 13, 2016
Guenter W. Berger
/s/ Hamideh AssadiDirectorSeptember 13, 2016
Hamideh Assadi
Director
Jeanne Farmer Grossman
/s/ Michael H. KeownDirectorSeptember 13, 2016
Michael H. Keown
/s/ Charles F. MarcyDirectorSeptember 13, 2016
Charles F. Marcy
/s/ Christopher P. MotternDirectorSeptember 13, 2016
Christopher P. Mottern


EXHIBIT INDEX
2.1Asset Purchase Agreement, dated as of November 16, 2015, byJune 6, 2023, between TreeHouse Foods, Inc. and between Farmer Bros. Co. and Harris Spice Company Inc. (filed as Exhibit 10.110.2 to the Company’s Current Report on Form 8-K filed with the SEC on November 30, 2015July 6, 2023 and incorporated herein by reference).*
   
3.12.2 

3.2Amended and Restated Bylaws (filed as Exhibit 3.2 to the Company’s Quarterly on Form 10-Q filed with the SEC on May 6, 2016 and incorporated herein by reference).
3.3
Certificate of Elimination (filed as Exhibit 3.3 to the Company's Registration Statement on Form 8-A/A filed with the SEC on September 24, 2015 and incorporated herein by reference).

4.1
Specimen Stock Certificate (filed as Exhibit 4.1 to the Company's Registration Statement on Form 8-A/A filed with the SEC on September 24, 2015 and incorporated herein by reference)

4.2
Registration Rights Agreement, dated as of June 16, 2016, among Farmer Bros. Co. and the Investors identified on the signature pages thereto (filed as Exhibit 10.110.3 to the Company’s Current Report on Form 8-K filed with the SEC on June 21, 2016July 6, 2023 and incorporated herein by reference)reference herein).

   
10.13.1 

   
10.23.2 

   
10.34.1 Description of Farmer Bros. Co. Securities Registered Pursuant to Section 12 of the Securities Exchange Act of 1934 (filed as Exhibit 4.1 to the Company’s Annual Report on Form 10-K filed with the SEC on September 12, 2023 and incorporated herein by reference).
10.1Farmer Bros. Co. Pension Plan for Salaried Employees, Farmer Bros. Co. Retirement Plan (filed as Exhibit 10.310.6 to the Company’s Quarterly Report on Form 10-Q for the quarter ended September 30, 20122017 filed with the SEC on November 5, 20127, 2017 and incorporated herein by reference).**
   
10.410.2 Amendment No. 1 to Farmer Bros. Co. Pension Plan for Salaried Employees, Farmer Bros. Co. Retirement Plan effective June 30, 2011 (filed herewith)as Exhibit 10.4 to the Company’s Annual Report on Form 10-K for the fiscal year ended June 30, 2016 filed with the SEC on September 14, 2016 and incorporated herein by reference).**
   
10.510.3 Action of the Administrative Committee of the Farmer Bros. Co. Qualified Employee Retirement Plans amending the Farmer Bros. Co. Retirement Plan, effective as of December 6, 2012 (filed as Exhibit 10.810.10 to the Company's Quarterly Report on Form 10-Q for the quarter ended March 31, 20132018 filed with the SEC on May 6, 20139, 2018 and incorporated herein by reference).**
   
10.610.4 Amendment to the Farmer Bros. Co. 2005 Incentive CompensationRetirement Plan, dated as of December 1, 2018 (filed as Exhibit 10.1010.53 to the Company's Quarterly Report on Form 10-Q for the quarter ended December 31, 20132018 filed with the SEC on February 10, 201411, 2019 and incorporated herein by reference).**
   
10.710.5 Amendment to Farmer Bros. Co. 2005 Incentive Compensation Plan (filed as Exhibit 10.1 to the Company’s Current Report on Form 8-K filed with the SEC on December 10, 2014 and incorporated herein by reference).**
10.8Farmer Bros. Co. Amended and Restated Employee Stock Ownership Plan, as adopted by the Board of Directors on December 9, 2010 and effective as of January 1, 2010 (filed as Exhibit 10.8 to the Company’s Quarterly Report on Form 10-Q for the quarter ended March 31, 2016 filed with the SEC on May 6, 2016 and incorporated herein by reference).**


10.910.6 Action of the Administrative Committee of the Farmer Bros. Co. Qualified Employee Retirement Plans amending the Farmer Bros. Co. Amended and Restated Employee Stock Ownership Plan, effective as of January 1, 2012 (filed as Exhibit 10.710.12 to the Company’sCompany's Annual Report on Form 10-K for the fiscal year ended June 30, 20122017 filed with the SEC on September 7, 201228, 2017 and incorporated herein by reference).*
   
10.1010.7 Action of the Administrative Committee of the Farmer Bros. Co. Qualified Employee Retirement Plans amending the Farmer Bros. Co. Amended and Restated Employee Stock Ownership Plan, effective as of January 1, 2015 (filed as Exhibit 10.10 to the Company’s Quarterly Report on Form 10-Q for the quarter ended September 30, 2015 filed with the SEC on November 9, 2015 and incorporated herein by reference).**
   
10.1110.8 Action of the Administrative Committee of the Farmer Bros. Co. Qualified Employee Retirement Plans amending the Farmer Bros. Co. Amended and Restated Employee Stock Ownership Plan, effective as of January 1, 2015 ((filed(filed as Exhibit 10.11 to the Company’s Quarterly Report on Form 10-Q for the quarter ended September 30, 2015 filed with the SEC on November 9, 2015 and incorporated herein by reference).**


10.12Exhibit
No.
 
ESOP Loan Agreement including ESOP Pledge Agreement and Promissory Note,Description
10.9Amendment dated March 28, 2000, betweenOctober 6, 2016 to Farmer Bros. Co. Amended and Wells Fargo Bank, N.A., Trustee for the Farmer Bros Co.Restated Employee Stock Ownership Plan (filed as Exhibit 10.12 to the Company’s Quarterly Report on Form 10-Q filed with the SEC on May 6, 2016 and incorporated herein by reference).

10.13Amendment No. 1 to ESOP Loan Agreement, dated June 30, 2003, between Farmer Bros. Co. and Wells Fargo Bank, N.A., Trustee for the Farmer Bros Co. Employee Stock Ownership Plan (filed as Exhibit 10.13 to the Company’s Quarterly Report on Form 10-Q filed with the SEC on May 6, 2016 and incorporated herein by reference).
10.14ESOP Loan Agreement No. 2 including ESOP Pledge Agreement and Promissory Note, dated July 21, 2003 between Farmer Bros. Co. and Wells Fargo Bank, N.A., Trustee for the Farmer Bros Co. Employee Stock Ownership Plan (filed as Exhibit 10.14 to the Company’s Quarterly Report on Form 10-Q filed with the SEC on May 6, 2016 and incorporated herein by reference).
10.15Employment Agreement, dated March 9, 2012, by and between Farmer Bros. Co. and Michael H. Keown (filed as Exhibit 10.1 to the Company’s Current Report on Form 8-K filed with the SEC on March 13, 2012October 7, 2016 and incorporated herein by reference).**
   
10.1610.10 Second Amendment to the Farmer Bros. Co. Amended and Restated Employee Stock Ownership Plan, dated as of December 31, 2018 (filed as Exhibit 10.52 to the Company's Quarterly Report on Form 10-Q for the quarter ended December 31, 2018 filed with the SEC on February 11, 2019 and incorporated herein by reference).*
10.11Action of the Administrative Committee of the Farmer Bros. Co. Qualified Employee Retirement Plans amending the Farmer Bros. Co. Amended and Restated Employee Stock Ownership Plan, effective as of January 1, 2017 (filed as Exhibit 10.18 to the Company’s Quarterly Report on Form 10-Q for the quarter ended December 31, 2017 filed with the SEC on February 7, 2018 and incorporated herein by reference).*
10.12Employment Agreement, dated as of April 1, 2013,September 6, 2019, by and between Farmer Bros. Co. and Mark J. Nelson (filed as Exhibit 10.1 to the Company's Current Report on Form 8-K filed with the SEC on April 4, 2013 and incorporated herein by reference).**
10.17Amendment No. 1 to Employment Agreement, dated as of January 1, 2014, by and between Farmer Bros. Co. and Mark J. Nelson (filed as Exhibit 10.2 to the Company's Current Report on Form 8-K filed with the SEC on March 5, 2014 and incorporated herein by reference).**
10.18Amendment No. 2 to Employment Agreement, dated as of November 23, 2015, between Farmer Bros. Co. and Mark J. NelsonDeverl Maserang (filed as Exhibit 10.1 to the Company’s Current Report on Form 8-K filed with the SEC on November 30, 2015September 10, 2019 and incorporated herein by reference).**
   
10.1910.13 Employment Agreement, dated as of December 2, 2014, by and between Farmer Bros. Co. and Barry C. Fischetto (filed as Exhibit 10.1 to the Company's Current Report on Form 8-K filed with the SEC on December 5, 2014 and incorporated herein by reference).**
10.20Employment Agreement, effective as of May 27, 2015, by and between Farmer Bros. Co. and Scott W. Bixby (filed as Exhibit 10.1 to the Company's Current Report on Form 8-K filed with the SEC on May 20, 2015 and incorporated herein by reference).**


10.21
Employment Agreement, effective as of August 6, 2015, by and between Farmer Bros. Co. and Thomas J. Mattei, Jr. (filed as Exhibit 10.20 to the Company’s Annual Report on Form 10-K filed with the SEC on September 14, 2015 and incorporated herein by reference).**

10.22Separation Agreement, dated as of July 16, 2014, by and between Farmer Bros. Co. and Mark A. Harding (filed as Exhibit 10.1 to the Company's Current Report on Form 8-K filed with the SEC on July 17, 2014 and incorporated herein by reference).**
10.23Farmer Bros. Co. 2007 Omnibus Plan, as amended (as approved by the stockholders at the 2012 Annual Meeting of Stockholders on December 6, 2012) (filed as Exhibit 10.110.27 to the Company's CurrentCompany’s Quarterly Report on Form 8-K10-Q for the quarter ended September 30, 2017 filed with the SEC on December 12, 2012November 7, 2017 and incorporated herein by reference).**
   
10.2410.14 Form of Farmer Bros. Co. 2007 Omnibus Plan Stock Option Grant Notice and Stock Option Agreement (filed as Exhibit 10.39 to the Company’s Quarterly Report on Form 10-Q for the quarter ended March 31, 2018 filed with the SEC on May 9, 2018 and incorporated herein by reference).*
10.15Form of Farmer Bros. Co. 2007 Omnibus Plan Restricted Stock Award Grant Notice and Restricted Stock Award Agreement (filed as Exhibit 10.41 to the Company’s Quarterly Report on Form 10-Q for the quarter ended March 31, 2018 filed with the SEC on May 9, 2018 and incorporated herein by reference).*
10.16Farmer Bros. Co. Amended and Restated 2007 Long-Term Incentive Plan (as approved by the stockholders at the 2013 Annual Meeting of Stockholders on December 5, 2013) (filed as Exhibit 10.210.35 to the Company's CurrentQuarterly Report on Form 8-K10-Q for the quarter ended December 31, 2018 filed with the SEC on DecemberFebruary 11, 20132019 and incorporated herein by reference).**
   
10.2510.17 Addendum to Farmer Bros. Co. Amended and Restated 2007 Long-Term Incentive Plan (filed as Exhibit 10.30 to the Company's Quarterly Report on Form 10-Q for the quarter ended December 31, 2014 filed with the SEC on February 9, 2015 and incorporated herein by reference).**
   
10.2610.18 Form of Farmer Bros. Co. Amended and Restated 2007 OmnibusLong-Term Incentive Plan Stock Option Grant Notice and Stock Option Agreement (filed as Exhibit 10.43 to the Company's Quarterly Report on Form 10-Q for the quarter ended December 31, 2018 filed with the SEC on February 11, 2019 and incorporated herein by reference).*
10.19Form of Farmer Bros. Co. Amended and Restated 2007 Long-Term Incentive Plan Restricted Stock Award Grant Notice and Restricted Stock Award Agreement (filed as Exhibit 10.45 to the Company's Quarterly Report on Form 10-Q for the quarter ended December 31, 2018 filed with the SEC on February 11, 2019 and incorporated herein by reference).*
10.20Farmer Bros. Co. 2017 Long-Term Incentive Plan  (filed as Exhibit 10.1 to the Company's Current Report on Form 8-K filed with the SEC on June 26, 2017 and incorporated herein by reference).*
10.21Form of Farmer Bros. Co. 2017 Long-Term Incentive Plan Stock Option Award Agreement (filed as Exhibit 10.1 to the Company’s Current Report on Form 8-K filed with the SEC on December 4, 2017 and incorporated herein by reference).*
10.22Form of Farmer Bros. Co. 2017 Long-Term Incentive Plan Stock Restricted Unit Award Agreement (filed as Exhibit 10.1 to the Company’s Current Report on Form 8-K filed with the SEC on July 22, 2020 and incorporated herein by reference).*

53

Exhibit
No.
Description
10.23Form of Farmer Bros. Co. 2017 Long-Term Incentive Plan Restricted Stock Unit Award Agreement (filed as Exhibit 10.2 to the Company’s Current Report on Form 8-K filed with the SEC on AprilDecember 4, 20132017 and incorporated herein by reference).**
   
10.2710.24 Form of Farmer Bros. Co. 2017 Long-Term Incentive Plan Restricted Stock Ownership Guidelines for DirectorsUnit Award Agreement (filed as Exhibit 10.24 to the Company’s Annual Report on Form 10-K filed with the SEC on September 12, 2023 and Executive Officers (filed herewith)incorporated herein by reference).**
   
10.2810.25 Form of Award Letter (Fiscal 2014) under Farmer Bros. Co. 20052017 Long-Term Incentive Compensation Plan Restricted Stock Grant Agreement (Directors) (filed as Exhibit 10.3 to the Company’s Current Report on Form 8-K filed with the SEC on December 4, 2017 and incorporated herein by reference).*
10.26Form of Farmer Bros. Co. 2017 Long-Term Incentive Plan Restricted Stock Grant Agreement (Employees) (filed as Exhibit 10.4 to the Company’s Current Report on Form 8-K filed with the SEC on December 4, 2017 and incorporated herein by reference).*
10.27Farmer Bros. Co. Amended and Restated 2017 Long-Term Incentive Plan (filed as Exhibit 99.1 to the Company’s Registration Statement on Form S-8 filed with the SEC on December 28, 2021 and incorporated herein by reference).*
10.28Form of Farmer Bros Co. Amended and Restated 2017 Long-Term Incentive Plan Restricted Stock Unit Award Agreement (Directors) (filed as Exhibit 10.3 to the Company’s Quarterly Report on Form 10-Q for the fiscal quarter ended March 31, 2023, filed with the SEC on May 10, 2023 and incorporated by reference herein).*
10.29Form of Farmer Bros. Co. Amended and Restated 2017 Long-Term Incentive Plan Restricted Stock Unit Award Agreement (filed as Exhibit 10.29 to the Company’s Annual Report on Form 10-K filed with the SEC on September 12, 2023 and incorporated herein by reference).*
10.30Form of Farmer Bros. Co. Amended and Restated 2017 Long-Term Incentive Plan Cash-Based Restricted Stock Unit Award Agreement (filed as Exhibit 10.30 to the Company’s Annual Report on Form 10-K filed with the SEC on September 12, 2023 and incorporated herein by reference).*
10.31Farmer Bros. Co. 2020 Inducement Incentive Plan (filed as Exhibit 10.3 to the Company’s Current Report on Form 8-K filed with the SEC on March 16, 2020 and incorporated herein by reference).*
10.32Form of Farmer Bros. Co. 2020 Inducement Incentive Plan Stock Option Award Agreement (filed as Exhibit 10.4 to the Company’s Current Report on Form 8-K filed with the SEC on March 16, 2020 and incorporated herein by reference).*
10.33Form of Farmer Bros. Co. 2020 Inducement Incentive Plan Restricted Stock Unit Agreement (filed as Exhibit 10.1 to the Company’s Current Report on Form 8-K filed with the SEC on July 22, 2020 and incorporated herein by reference).*
10.34Form of Severance Agreement (filed as Exhibit 10.34 to the Company’s Annual Report on Form 10-K filed with the SEC on September 12, 2023 and incorporated herein by reference).*
10.35Form of Amended and Restated Severance Agreement (filed as Exhibit 10.5 to the Company’s Current Report on Form 8-K filed with the SEC on July 6, 2023 and incorporated herein by reference).*
10.36Form of Indemnification Agreement for Directors and Officers of the Company, as adopted on December 8, 2017 (filed as Exhibit 10.32 to the Company’s Annual Report on Form 10-K for the fiscal year ended June 30, 2022, filed with the SEC on September 2, 2022).*
10.37Interest Rate Swap Confirmation, dated as of March 28, 2019, by and between Farmer Bros., Co. and Citibank, N.A. (filed as Exhibit 10.3 to the Company's Current Report on Form 8-K filed with the SEC on March 29, 2019 and incorporated herein by reference).*
10.38Credit Agreement dated as of dated as of April 26, 2021, by and among Farmer Bros. Co., a Delaware corporation, the other loan parties named therein, the lenders named therein and Wells Fargo Bank, N.A., as administrative agent and lender (filed as Exhibit 10.1 to the Company’s Current Report on Form 8-K filed with the SEC on April 27, 2021 and incorporated herein by reference).

54

Exhibit
No.
Description
10.39Consent and Amendment No. 1 to Credit Agreement, dated as of December 20, 2021, by and among Farmer Bros Co., the other loan parties named therein, the lenders named therein and Wells Fargo Bank, N.A., as administrative agent and lender (filed as Exhibit 10.47 to the Company’s Annual Report on Form 10-K filed with the SEC on September 2, 2022).
10.40Increase Joinder and Amendment No. 2 to Credit Agreement, dated as of August 8, 2022, by and among Farmer Bros. Co., the other loan parties named therein, the lenders named therein and Wells Fargo Bank, N.A., as administrative agent and lender (filed as Exhibit 10.1 to the Company's Current Report on Form 8-K filed with the SEC on September 17, 2014August 9, 2022 and incorporated herein by reference).**
   
10.2910.41 

10.30Form of Change in Control Severance Agreement for Executive Officers of the Company (with schedule of executive officers attached) (filed as Exhibit 10.3 to the Company's Current Report on Form 8-K filed with the SEC on September 29, 2015 and incorporated herein by reference).**
10.31Form of Indemnification Agreement for Directors and Officers of the Company, as adopted on December 5, 2013 (with schedule of indemnitees attached) (filed as Exhibit 10.2 to the Company's Current Report on Form 8-K filed with the SEC on September 29, 2015 and incorporated herein by reference).**
10.32Lease Agreement, dated as of July 17, 2015, by and between Farmer Bros. Co. as Tenant, and WF-FB NLTX, LLC as Landlordlender (filed as Exhibit 10.1 to the Company's Current Report on Form 8-K filed with the SEC on July 23, 2015August 31, 2022 and incorporated herein by reference).
   
10.3310.42 FirstConsent and Amendment No. 4 to LeaseCredit Agreement, dated as of December 29, 2015,June 30, 2023, by and betweenamong Farmer Bros. Co., the other loan parties named therein, the lenders named therein and Wells Fargo Bank, N.A., as Tenant,administrative agent and WF-FB NLTX, LLC as Landlordlender (filed as Exhibit 10.3610.1 to the Company’s Quarterly Report on Form 10-Q filed with the SEC on May 6, 2016 and incorporated herein by reference).
10.34Amendment No. 2 to Lease Agreement dated as of March 10, 2016, by and between Farmer Bros. Co. as Tenant, and WF-FB NLTX, LLC as Landlord (filed as Exhibit 10.37 to the Company’s Quarterly Report on Form 10-Q filed with the SEC on May 6, 2016 and incorporated herein by reference).


10.35Development Management Agreement dated as of July 17, 2015, by and between Farmer Bros. Co., as Tenant and Stream Realty Partners-DFW, L.P., as Developer (filed as Exhibit 10.2 to the Company's Current Report on Form 8-K filed with the SEC on July 23, 20156, 2023 and incorporated herein by reference).
   
10.3610.43 First Amendment to Development ManagementGuaranty and Security Agreement dated as of January 1, 2016,April 26, 2021, by and betweenamong Farmer Bros. Co., as Tenanta Delaware corporation, the other grantors named therein, and Stream Realty Partners-DFW, L.P.Wells Fargo Bank, N.A., as Developeradministrative agent (filed as Exhibit 10.3910.2 to the Company’s QuarterlyCurrent Report on Form 10-Q8-K filed with the SEC on May 6, 2016April 27, 2021 and incorporated herein by reference).
   
10.3710.44 

   
10.3810.45 Agreement of PurchaseGuaranty and Sale and Joint Escrow Instructions,Security Agreement dated as of April 11, 2016,26, 2021, by and betweenamong Farmer Bros. Co., a Delaware corporation, the other grantors named therein, and MGG Investment Group LP, as Seller, and Bridge Acquisition, LLC as Buyeradministrative agent (filed as Exhibit 10.4110.4 to the Company’s QuarterlyCurrent Report on Form 10-Q8-K filed with the SEC on May 6, 2016April 27, 2021 and incorporated herein by reference).
   
10.3910.46 

   
14.110.47 Schedule of the ISDA Master Agreement, dated as of April 26, 2021, by and between Farmer Bros. Co. and Wells Fargo Bank, N.A. (filed as Exhibit 10.6 to the Company’s Current Report on Form 8-K filed with the SEC on April 27, 2021 and incorporated herein by reference).
10.48Replacement interest rate swap with Wells Fargo Bank, N.A. pursuant to a new interest rate swap confirmation (filed as Exhibit 10.7 to the Company’s Current Report on Form 8-K filed with the SEC on April 27, 2021 and incorporated herein by reference).
10.49General Release and Separation Agreement, dated March 23, 2023, by and between Farmer Bros. Co. and Ruben Inofuentes (filed as Exhibit 10.1 to the Company’s Current Report on Form 8-K filed with the SEC on March 28, 2023 and incorporated herein by reference).*
10.50General Release and Separation Agreement, dated March 25, 2023, by and between Farmer Bros. Co. and Maurice Moragne (filed as Exhibit 10.2 to the Company’s Current Report on Form 8-K filed with the SEC on March 28, 2023 and incorporated herein by reference).*

55

Exhibit
No.
Description
10.51Cooperation Agreement, dated October 30, 2022, by and among Farmer Bros Co., the entities and persons listed on Exhibit A thereto, and the entities and persons listed on Exhibit B thereto (filed as Exhibit 10.1 to the Company’s Current Report on Form 8-K filed with the SEC on October 31, 2022 and incorporated herein by reference).
14.1Farmer Bros. Co. Code of Conduct and Ethics adopted on August 26, 2010 and updated February 2013 and September 7, 20162017 (filed herewith)as Exhibit 14.1 to the Company's Annual Report on Form 10-K for the fiscal year ended June 30, 2017 filed with the SEC on September 29, 2017 and incorporated herein by reference).
   
21.116.1 Letter of Deloitte & Touche LLP to the SEC dated December 22, 2021, (filed as Exhibit 16.1 to the Company’s Report on Form 8-K filed with the SEC on December 22, 2021 and incorporated herein by reference).
21.1List of all Subsidiaries of Farmer Bros. Co.  (filed herewith)as Exhibit 21.1 to the Company’s Report on Form 10-K filed with the SEC on September 2, 2022 and incorporated herein by reference).
   
23.1 Consent of Deloitte & Touche LLP, Independent Registered Public Accounting Firm (filed herewith)as Exhibit 23.1 to the Company’s Annual Report on Form 10-K filed with the SEC on September 12, 2023 and incorporated herein by reference).
   
31.123.2 Consent of Grant Thornton LLP, Independent Registered Public Accounting Firm (filed as Exhibit 23.2 to the Company’s Annual Report on Form 10-K filed with the SEC on September 12, 2023 and incorporated herein by reference).
31.1Principal Executive Officer Certification Pursuant to Securities Exchange Act Rules 13a-14 and 15d-14 as Adopted Pursuant to Section 302 of the Sarbanes-Oxley Act of 2002 (filed herewith).
  
31.2 Principal Financial and Accounting Officer Certification Pursuant to Securities Exchange Act Rules 13a-14 and 15d-14 as Adopted Pursuant to Section 302 of the Sarbanes-Oxley Act of 2002 (filed herewith).
  
32.1 Principal Executive Officer Certification Pursuant to 18 U.S.C. Section 1350 as Adopted Pursuant to Section 906 of the Sarbanes-Oxley Act of 2002 (furnished herewith).
  
32.2 Principal Financial and Accounting Officer Certification Pursuant to 18 U.S.C. Section 1350 as Adopted Pursuant to Section 906 of the Sarbanes-Oxley Act of 2002 (furnished herewith).
   
10197.1 The following financial statements fromFarmer Bros. Co. Amended and Restated Policy on Executive Compensation in Restatement Situations (filed as Exhibit 97.1 to the Company'sCompany’s Annual Report on Form 10-K forfiled with the fiscal year ended June 30, 2016, formatted in eXtensible Business Reporting Language: (i) Consolidated Balance Sheets, (ii) Consolidated Statements of Operations, (iii) Consolidated Statements of Comprehensive Income (Loss), (iv) Consolidated Statements of Cash Flows, (v) Consolidated Statements of Stockholders' Equity,SEC on September 12, 2023 and (vi) Notes to Consolidated Financial Statements (furnished herewith)incorporated herein by reference).
________________
*101.INSPursuant to Item 601(b)(2) of Regulation S-K,XBRL Instance Document - the schedules and/or exhibits to this agreement have been omitted. The Registrant undertakes to supplementally furnish copies ofinstance document does not appear in the omitted schedules and/or exhibits toInteractive Data File because its XBRL tags are embedded within the Securities and Exchange Commission upon request.Inline XBRL document.
**101.SCHInline XBRL Taxonomy Extension Schema Document.
101.CALInline XBRL Taxonomy Extension Calculation Linkbase Document.
101.DEFInline XBRL Taxonomy Extension Definition Linkbase Document.
101.LABInline XBRL Taxonomy Extension Label Linkbase Document.
101.PREInline XBRL Taxonomy Extension Presentation Linkbase Document .
104Cover Page Interactive Data File - the cover page interactive data file does not appear in the Interactive Data File because its XBRL tags are embedded within the Inline XBRL document.

*Management contract or compensatory plan or arrangement.


SIGNATURES

Pursuant to the requirements of Section 13 or 15(d) of the Securities Exchange Act of 1934, the registrant has duly caused this report to be signed on its behalf by the undersigned, thereunto duly authorized.

FARMER BROS. CO.
By:/s/ John E. Moore III
John E. Moore III
Interim Chief Executive Officer
October 27, 2023

Pursuant to the requirements of the Securities Exchange Act of 1934, this report has been signed below by the following persons on behalf of the registrant and in the capacities and on the dates indicated.

/s/ John E. Moore IIIInterim Chief Executive OfficerOctober 27, 2023
John E. Moore III(principal executive officer)
/s/ Brad BollnerInterim Chief Financial OfficerOctober 27, 2023
Brad Bollner(principal financial officer)
/s/ Matthew CoffmanVice President and ControllerOctober 27, 2023
Matthew Coffman(principal accounting officer)
/s/ David A. PaceInterim Chairman of the BoardOctober 27, 2023
David A. Pace
/s/ Allison M. BoersmaDirectorOctober 27, 2023
Allison M. Boersma
/s/ Stacy Loretz-CongdonDirectorOctober 27, 2023
Stacy Loretz-Congdon
/s/ Alfred PoeDirectorOctober 27, 2023
Alfred Poe
/s/ Bradley L. RadoffDirectorOctober 27, 2023
Bradley L. Radoff
/s/ John D. RobinsonDirectorOctober 27, 2023
John D. Robinson
/s/ Waheed ZamanDirectorOctober 27, 2023
Waheed Zaman


106