UNITED STATES
SECURITIES AND EXCHANGE COMMISSION
WASHINGTON, D.C. 20549
_________
FORM 10-K
_________
ý ANNUAL REPORT PURSUANT TO SECTION 13 OR 15(d)
OF THE SECURITIES EXCHANGE ACT OF 1934
For the fiscal year ended December 31, 20212023
OR
o TRANSITION REPORT PURSUANT TO SECTION 13 OR 15(d)
OF THE SECURITIES EXCHANGE ACT OF 1934
For the transition period from _____ to _____
Commission file number 0-362
FRANKLIN ELECTRIC CO., INC.
(Exact name of registrant as specified in its charter)
| | | | | | | | | | | |
| Indiana | | 35-0827455 |
| (State or other jurisdiction of incorporation or organization) | | (I.R.S. Employer Identification No.) |
| | | |
| 9255 Coverdale Road | | |
| Fort Wayne, | Indiana | | 46809 |
| (Address of principal executive offices) | | (Zip Code) |
(260) 824-2900
(Registrant’s telephone number, including area code)
Securities registered pursuant to Section 12(b) of the Act:
| | | | | | | | | | | | | | | | | |
| Common Stock, $0.10 par value | | FELE | | NASDAQ | Global Select Market |
| (Title of each class) | | (Trading symbol) | | (Name of each exchange on which registered) |
Securities registered pursuant to Section 12(g) of the Act:
None
(Title of each class)
Indicate by check mark if the registrant is a well-known seasoned issuer, as defined in Rule 405 of the Securities Act.
Indicate by check mark if the registrant is not required to file reports pursuant to Section 13 or Section 15(d) of the Act.
Indicate by check mark whether the registrant (1) has filed all reports required to be filed by Section 13 or 15(d) of the Securities Exchange Act of 1934 during the preceding 12 months (or for such shorter period that the registrant was required to file such reports), and (2) has been subject to such filing requirements for the past 90 days.
Indicate by check mark whether the registrant has submitted electronically every Interactive Data File required to be submitted and posted pursuant to Rule 405 of Regulation S-T (Section 232.405 of this chapter) during the preceding 12 months (or for such shorter period that the registrant was required to submit and post such files).
Indicate by check mark whether the registrant is a large accelerated filer, an accelerated filer, a non-accelerated filer, or a smaller reporting company, or an emerging growth company. See the definitions of “large accelerated filer,” “accelerated filer” and “smaller reporting company”company,” and "emerging growth company" in Rule 12b-2 of the Exchange Act.
| | | | | | | | | | | | | | | | | | | | | | | |
| Large Accelerated Filer | ☒ | Accelerated Filer | ☐ | Non-Accelerated Filer | ☐ | Smaller Reporting Company | ☐ |
| | Emerging Growth Company | ☐ | | |
If an emerging growth company, indicate by check mark if the registrant has elected not to use the extended transition period for complying with any new or revised financial accounting standards provided pursuant to Section 13(a) of the Exchange Act. o
Indicate by check mark whether the registrant has filed a report on and attestation to its management’s assessment of the effectiveness of its internal control over financial reporting under Section 404(b) of the Sarbanes-Oxley Act (15 U.S.C. 7262(b)) by the registered public accounting firm that prepared or issued its audit report. ☒
If securities are registered pursuant to Section 12(b) of the Act, indicate by check mark whether the financial statements
of the registrant included in the filing reflect the correction of an error to previously issued financial statements.
o
Indicate by check mark whether any of those error corrections are restatements that required a recovery analysis of incentive-based compensation received by any of the registrant’s executive officers during the relevant recovery period pursuant
to §240.10D-1(b).
o
Indicate by check mark whether the registrant is a shell company (as defined in Rule 12b-2 of the Act).
The aggregate market value of the registrant’s common stock held by non-affiliates of the registrant at June 30, 20212023 (the last business day of the registrant’s most recently completed second quarter) was $3,727,659,914.$4,736,072,725. The stock price used in this computation was the last sales price on that date, as reported by NASDAQ Global Select Market. For purposes of this calculation, the registrant has excluded shares held by executive officers and directors of the registrant, including restricted shares and except for shares owned by the executive officers through the registrant’s 401(k) Plan. Determination of stock ownership by non-affiliates was made solely for the purpose of responding to this requirement and the registrant is not bound by this determination for any other purpose.
Number of shares of common stock outstanding at February 10, 20227, 2024:
46,481,11346,043,849 shares
DOCUMENTS INCORPORATED BY REFERENCE
A portion of the Proxy Statement for the Annual Meeting of Shareholders to be held on May 6, 20223, 2024 (Part III).
FRANKLIN ELECTRIC CO., INC.
TABLE OF CONTENTS
| | | | | | | | | | | |
| | | Page |
| PART I. | | | Number |
| | | |
| Item 1. | | | |
| Item 1A. | | | |
| Item 1B. | | | |
| Item 1C. | | | |
| Item 2. | | | |
| Item 3. | | | |
| Item 4. | | | |
| | | | |
| | | |
| PART II. | | | |
| | | |
| Item 5. | | | |
| Item 7. | | | |
| Item 7A. | | | |
| Item 8. | | | |
| | | |
| Item 9. | | | |
| Item 9A. | | | |
| | | |
| Item 9B. | | | |
| Item 9C. | | | |
| | | | |
| PART III. | | | |
| | | |
| Item 10. | | | |
| Item 11. | | | |
| Item 12. | | | |
| Item 13. | | | |
| Item 14. | | | |
| | | | |
| PART IV. | | | |
| | | |
| Item 15. | | | |
| | | |
| | | |
| | | |
PART I
ITEM 1. BUSINESS
Description of the Business
Franklin Electric Co., Inc. (“Franklin Electric” or the “Company”) is an Indiana corporation founded in 1944 and incorporated in 1946. Named after America’s pioneer electrical engineer, Benjamin Franklin, Franklin Electric manufactured the first water-lubricated submersible motor for water systems and the first submersible motor for fueling systems. With 20212023 revenue of about $1.7approximately $2.1 billion, the Company designs, manufactures and distributes water and fuel pumping systems, composed primarily of submersible motors, pumps, electronic controls, water treatment systems, and related parts and equipment.
The Company’s water pumping systems move fresh and wastewater for the residential, agricultural and other industrial end markets. The Company also sells various groundwater equipment products to well installation contractors, including water pumping systems, through its and third-party distribution branches located in the U.S. With a growing global footprint, the Company has also evolved into a top supplier of submersible fueling systems at gas stations, making pumps, pipes, electronic controls and monitoring devices.
The Company’s products are sold worldwide by its employee sales force and independent manufacturing representatives. The Company offers normal and customary trade terms to its customers, no significant part of which is of an extended nature. Special inventory requirements are not necessary, and customer merchandise return rights do not extend beyond normal warranty provisions.
Franklin Electric’s Key Factors for Success
While maintaining a culture of safety and lean principles, Franklin Electric promisesstrives to deliver quality, availability, service, innovation, and cost in every encounter the Company has with stakeholders, including direct or indirect customers, employees, shareholders, and suppliers. These key factors for success are a roadmap for the Company's growth as a global provider of water and fuel systems, through geographic expansion and product line extensions, leveraging its global platform and competency in system design, all while consistently offering the best value to its customer.
Markets and Applications
The Company’s business consists of three reportable segments based on the principal end market served: Water Systems, Fueling Systems, and Distribution segments.Distribution. The Company includes unallocated corporate expenses in an “Intersegment Eliminations/Other” segment that, together with the Water Systems, Fueling Systems, and Distribution segments, represent the Company. Segment and geographic information appears in Note 15 - Segment and Geographic Information to the consolidated financial statements.
The market for the Company’s products is highly competitive and includes diversified accounts by size and type. The Company’s Water Systems and Fueling Systems products and related equipment are sold to specialty distributors and some original equipment manufacturers (“OEMs”), as well as industrial and petroleum equipment distributors and major oil and utility companies. The Company’s Distribution segment sells products primarily to water well contractors.
Water Systems Segment
Water Systems is a global leader in the production and marketing of water pumping systems and is a technical leader in submersible motors, pumps, drives, electronic controls, water treatment systems, and monitoring devices. The Water Systems segment designs, manufactures and sells motors, pumps, drives, electronic controls, monitoring devices, and related parts and equipment primarily for use in groundwater, water transfer and wastewater.
Water Systems motors, pumps and controls are used principally for pumping clean water and wastewater in a variety of residential, agricultural, municipal and industrial applications. Water Systems also manufactures electronic drives and controls for the motors which control functionality and provide protection from various hazards, such as electrical surges, over-heating and dry wells or dry tanks. In the last three years, the Company acquired First Sales, LLC; Waterite,substantially all of the assets of Action Manufacturing & Supply, Inc.; and all of the ownership interest of Puronics, Inc.; New Aqua, LLC; and B&R Industries, Inc. expanding its portfolio to include water treatment systems and acquired Minetuff Dewatering Pumps Australia Pty Ltd expanding its industrial dewatering product line.
Water Systems products are sold in highly competitive markets. Water Systems contributescontributed about 60 percent of the Company’s total revenue.revenue in 2023. Significant portions of segment revenue come from selling groundwater and surface pumps, motors, and controls for residential and commercial buildings, as well as agricultural sales which are more seasonal and subject to commodity price changes. The Water Systems segment generates approximately 3025 to 3530 percent of its revenue in developing
markets, which often lack municipal water systems. As those countries install water systems and further develop with an expanding middle class or improving quality of living, the Company views those markets as an
opportunity. The Company has had 6 to 9 percent compounded annual sales growth in developing regions in recent years. Water Systems competes in each of its targeted markets based on product design, quality, of products and services, performance, availability and price. The Company’s principal competitors in the specialty water products industry are Grundfos Management A/S, Pentair, Inc. and Xylem, Inc.
20212023 Water Systems research and development expenditures were primarily related to the following activities:
•Electronic variable frequency drives and controls for Pump and HVAC applications, including the development of SubDrive Connect and Cerus X-Driveenhancements to include supportIOT capability for HES (High Efficiency Systems) motorour drive and protection products and making our key platforms solar pumping capable
•Development of integrated electronic pressure boosting systems for residential and commercial applications
•Development of new standard electric skid pump package designs including the new "SmartPrime" variable frequency drive skid packages for mining and municipal dewatering markets
•Greywater pumping equipment, including making FPS Non-Clog products explosion proof capable, the development of a 1HP Grinder pump, and development of 60Hz electrical submersible pumps withfrom the recent acquisition of Minetuff and expansion of Non-Clog and grinder pumps for the Americas market
•Submersible and surface pumps for residential, commercial, municipal, and agricultural applications including the development of a standard global 4” pump family, development of new Submersible Turbine products,cast stainless submersible turbine line, and upgrading the performance of our recently acquired lineshaftthe line shaft turbine product offerings
•Submersible motor technology and motor protection, including the development of 4 pole motor designs for 8” and 10” diameters and 4” Oil-filled motorsoffering
•Water Treatmenttreatment products focused on component performance improvements and IOT enabled sensing systems
Fueling Systems Segment
Fueling Systems is a global leader in the production and marketing of fuel pumping systems, fuel containment systems and monitoring and control systems. The Fueling Systems segment designs, manufactures and sells pumps, motors, pipe, sumps, fittings, vapor recovery components, electronic controls, monitoring devices and related parts and equipment primarily for use in fueling system applications.
Fueling Systems offers a complete array of components between the tank and the dispenser, including submersible pumps, motors, station hardware, piping, sumps, vapor recovery, corrosion control systems and electronic controls.controls and monitoring. The Fueling Systems segment growth has been sustained by a commitment to protecting human health and the environment while delivering the lowest total cost of ownership. Fueling Systems takes steps to ensure its products are installed and maintained properly through robust global certification tools for their third-party contractors. The segment serves other energy markets such as power reliability systems and includes intelligent electronic devices that are designed for online monitoring for the power utility, hydroelectric, rail, and telecommunication and data center infrastructure.
Fueling Systems products are sold in highly competitive markets. Rising vehicle use is leading to more investment in fueling stations which, in turn, leads to increased demand for the Company’s Fueling Systems products. The Company believes there is growth opportunity in developing markets. Fueling Systems competes in each of its targeted markets based on product design, quality, of products and services, performance, availability and value.price. The Company’s principal competitors in the petroleum equipment industry are Vontier Corporation, formerly a part of Fortive Corporation, and Dover Corporation.
20212023 Fueling Systems research and development expenditures were primarily related to the following activities:
•Developed and launched new Celltron Advantage DigitalOn-Prem, server software to collect data from battery handheld testermonitoring, battery testers, and distribution monitoring, tailored to the U.S. railroad market
•Developed OM3 TripCoil transformer monitoring instrument
•Developed and launched new Desiccant Sensor forEVO-Edge, a carwash fluids monitoring desiccant bags in corrosive environmentssystem
•Developed and launched new low level float to measure very small amounts of water in Diesel tanksHybrid Battery Control Unit (HBCU), with wireless (WiFi) connectivity
•Developed new Vapor Flow Meter for Chinese Vapor Recovery Monitoring regulationCVM fuel dispensing and monitoring control system
•Developed UNITE, server software to collect data from Battery Monitoring and Battery Testers
•Developed Press-Fit Connector for Cabletight electrical conduit
•Continued developing Distribution Transformer Monitor
•Updated Vapor Recovery equipment to meet safety and performance for Turkey Vapor Recovery regulationEV-Controls NexPhase 600 & 800, electric vehicle charger switchgear
Distribution Segment
The Distribution Segmentsegment is operated as a collection of wholly owned leading groundwater distributors known as the Headwater Companies. Headwater Companies deliver quality products and leading brands to the industry, providing contractors with the availabilityproducts and serviceservices they demand to meet their application challenges. The Distribution segment operates within the U.S. professional groundwater market. Highlights of the Distribution Segment geographic growth through acquisitions in the last three years are as follows:
•2019 - Acquired Milan Supply Company, a professional groundwater distributor operating in the mid-west
•2020 - Acquired Gicon Pumps & Equipment, Inc., a professional groundwater distributor operating in the south
•2021 - Acquired Blake Group Holdings, Inc., a professional groundwater distributor operating in the northeast
Information Regarding All Reportable Segments
Research and Development
The Company incurred research and development expenseexpenses as follows:
| | | | | | | | | | | | | | | | | |
| (In millions) | 2021 | | 2020 | | 2019 |
| Research and development expense | $ | 17.3 | | | $ | 21.7 | | | $ | 20.8 | |
| | | | | | | | | | | | | | | | | |
| (In millions) | 2023 | | 2022 | | 2021 |
| Research and development expenses | $ | 17.7 | | | $ | 16.7 | | | $ | 17.3 | |
Expenses incurred were for activities related to the development of new products, improvement of existing products and manufacturing methods and other applied research and development.
The Company owns a number of patents, trademarks, and licenses. In the aggregate, these patents are of material importance to the operation of the business; however, the Company believes that its operations are not dependent on any single patent or group of patents.
Raw Materials
The principal raw materials used in the manufacture of the Company’s products are coil and bar steel, stainless steel, copper wire and aluminum ingot. Major components are electric motors, capacitors,electrical components, motor protectors, forgings, gray iron castings, plastic resins and bearings. Most of these raw materials are available from multiple sources in the United StatesU.S. and world markets. Generally, the Company believes that adequate alternative sources are available for the majority of its key raw material and purchased component needs; however, the Company is dependent on a single or limited number of suppliers for certain materials or components. The Company believes that availability of fuel and energy is adequate to satisfy current and projected overall operations unless interrupted by government direction, allocation or other disruption.
Major Customers
No single customer accounted for over 10 percent of net sales in 2021, 2020,2023, 2022, or 2019.2021. No single customer accounted for over 10 percent of gross accounts receivable in 20212023 and 2020.2022.
Backlog
The dollar amount of backlog by segment was as follows:
| | (In millions) | (In millions) | February 10, 2022 | | February 11, 2021 | (In millions) | February 7, 2024 | | February 6, 2023 |
| Water Systems | Water Systems | $ | 205.9 | | | $ | 69.2 | |
| Fueling Systems | Fueling Systems | 58.4 | | | 17.4 | |
| Distribution | Distribution | 22.1 | | | 11.9 | |
| Consolidated | Consolidated | $ | 286.4 | | | $ | 98.5 | |
The backlog is composed of written orders at prices adjustable on a price-at-the-time-of-shipment basis for products, primarily standard catalog items. All backlog orders are expected to be filled in fiscal year 2022.2024. The Company’s sales in the first quarter are generally less than its sales in other quarters due to less water well drilling and overall product sales during the winter months in the Northern hemisphere. Beyond that, there is no seasonal pattern to the backlog and the backlog has not proven to be a significant indicator of future sales.
Environmental Matters
The Company believes that it is in compliance with all applicable federal, state and local laws concerning the discharge of material into the environment, or otherwise relating to the protection of the environment. The Company has not experienced any material costs in connection with environmental compliance, and does not believe that such compliance will have any material effect upon the financial position, results of operations, cash flows or competitive position of the Company.
Human Capital Resources
As of December 31, 2021,2023, the Company had approximately 6,400 employees. The Company is committed to providing safe work environments for ourits employees, prioritizing wellness, health and safety best practices and requiring ethical compliance with established policies. Further information regarding ourits human capital details and initiatives can be found in the 20212023 Franklin Electric Sustainability Report available for download on the Company's website.
Available Information
The Company is a U.S. public reporting company under the Exchange Act and files reports, proxy statements and other information with the SEC, which can be accessed from the SEC's home page on the Internet at www.sec.gov. The Company’s website address is www.franklin-electric.com. The Company makes available free of charge on or through its website its annual
report on Form 10-K, quarterly reports on Form 10-Q, current reports on Form 8-K, and all amendments to those reports, as soon as reasonably practicable after such material is electronically filed with or furnished to the Securities and Exchange Commission. Additionally, the Company’s website includes the Company’s corporate governance guidelines, its Board committee charters, Lead Independent Director charter, and the Company’s code of business conduct and ethics. Information contained on the Company’s website is not part of this annual report on Form 10-K.
ITEM 1A. RISK FACTORS
The following describes the principal risks affecting the Company and its business. Additional risks and uncertainties, not presently known to the Company, could negatively impact the Company’s results of operations or financial condition in the future.
Risks Related to the Industry
Reduced housing starts adversely affect demand for the Company’s products, thereby reducing revenues and earnings. Demand for certain Company products is affected by housing starts. Variation in housing starts due to economic volatility both within the United States and globally could adversely impact gross margins and operating results.
The Company’s results may be adversely affected by global macroeconomic supply and demand conditions related to the energy and mining industries. The energy and mining industries are users of the Company’s products, including the coal, iron ore, gold, copper, oil, and natural gas industries. Decisions to purchase the Company’s products are dependent upon the performance of the industries in which our customers operate. If demand or output in these industries increases, the demand for our products will generally increase. Likewise, if demand or output in these industries declines, the demand for our products will generally decrease. The energy and mining industries’ demand and output are impacted by the prices of commodities in these industries which are frequently volatile and change in response to general economic conditions, economic growth, commodity inventories, and any disruptions in production or distribution. Changes in these conditions could adversely impact sales, gross margin, and operating results.
Volatility in the prices and availability of raw materials, components, finished goods and other commodities could adversely affect operations. The Company purchases most of the raw materials for its products on the open market and relies on third parties for the sourcing of certain finished goods. Accordingly, the cost of its products may be affected by changes in the market price and its ability to successfully obtain raw materials, sourced components, or finished goods. The Company and its suppliers also use natural gas and electricity in manufacturing products both of which have historically been volatile. The Company does not generally engage in commodity hedging for raw materials and energy. Significant increases in the prices or disruptions in the supply chain of commodities, sourced components, finished goods, energy or other commodities could cause product prices to increase, which may reduce demand for products or make the Company more susceptible to competition. Furthermore, in the event the Company is unable to pass along increases in operating costs to its customers, margins and profitability may be adversely affected.
The growth of municipal water systems and increased government restrictions on groundwater pumping could reduce demand for private water wells and the Company’s products, thereby reducing revenues and earnings. Demand for certain Company products is affected by rural communities shifting from private and individual water well systems to city or municipal water systems. Many economic and other factors outside the Company’s control, including governmental regulations on water quality, and tax credits and incentives, could adversely impact the demand for private and individual water wells. A decline in private and individual water well systems in the United States or other economies in the international markets the Company serves could reduce demand for the Company’s products and adversely impact sales, gross margins, and operating results.
Demand for Fueling Systems products is impacted by environmental legislation which may cause significant fluctuations in costs and revenues. Environmental legislation related to air quality and fuel containment may create demand for certain Fueling Systems products which must be supplied in a relatively short time frame to meet the governmental mandate. During periods of increased demand, the Company’s revenues and profitability could increase significantly, although the Company can also be at risk of not having capacity to meet demand or cost overruns due to inefficiencies during ramp up to the higher production levels. After the Company’s customers have met the compliance requirements, the Company’s revenues and profitability may decrease significantly as the demand for certain products declines substantially. The risk of not reducing production costs in relation to the decreased demand and reduced revenues could have a material adverse impact on gross margins and the Company’s results of operations.
Changes in tax legislation regarding the Company’s U.S. or foreign earnings could materially affect future results. Since the Company operates in different countries and is subject to taxation in different jurisdictions, the Company’s future effective tax
rates could be impacted by changes in such countries’ tax laws or their interpretations. Both domestic and international tax laws are subject to change as a result of changes in fiscal policy, legislation, evolution of regulation and court rulings. The application of these tax laws and related regulations is subject to legal and factual interpretation, judgment, and uncertainty. The Company cannot predict whether any proposed changes in tax laws will be enacted into law or what, if any, changes may be made to any such proposals prior to their being enacted into law. If the tax laws change in a manner that increases the Company’s tax obligation, it could have a material adverse impact on the Company’s results of operations and financial condition.
On December 15, 2022, the European Union (EU) Member States formally adopted the EU’s Pillar Two Directive, which generally provides for a minimum effective tax rate of 15%, as established by the Organization for Economic Co-operation and Development (OECD) Pillar Two Framework. The EU effective dates are January 1, 2024, and January 1, 2025, for different aspects of the directive. A significant number of other countries are expected to also implement similar legislation with varying effective dates in the future. The Company does not expect Pillar 2 to have a material impact on its income tax liability, provision for income taxes, or effective tax rate.
Risks Related to the Business
The Company is exposed to political, economic and other risks that arise from operating a multinational business. The Company has significant operations outside the United States, including Europe, South Africa, Brazil, Mexico, India, China, Turkey, Canada and Argentina. Further, the Company obtains raw materials and finished goods from foreign suppliers. Accordingly, the Company’s business is subject to political, economic, and other risks that are inherent in operating a multinational business. These risks include, but are not limited to, the following:
•Difficulty in enforcing agreements and collecting receivables through foreign legal systems
•Trade protection measures and import or export licensing requirements
•Inability to obtain raw materials and finished goods in a timely manner from foreign suppliers
•Imposition of tariffs, exchange controls or other restrictions
•Difficulty in staffing and managing widespread operations and the application of foreign labor regulations
•Compliance with foreign laws and regulations
•Changes in general economic and political conditions in countries where the Company operates
Additionally, the Company’s operations outside the United States could be negatively impacted by changes in treaties, agreements, policies, and laws implemented by the United States. If the Company does not anticipate and effectively manage these risks, these factors may have a material adverse impact on its international operations or on the business as a whole.
The Company has significant investments in foreign entities and has significant sales and purchases in foreign denominated currencies creating exposure to foreign currency exchange rate fluctuations. The Company has significant investments outside the United States, including Europe, South Africa, Brazil, Mexico, India, China, Turkey, Canada and Argentina. Further, the Company has sales and makes purchases of raw materials and finished goods in foreign denominated currencies. Accordingly, the Company has exposure to fluctuations in foreign currency exchange rates relative to the U.S. dollar. Foreign currency exchange rate risk is partially mitigated through several means: maintenance of local production facilities in the markets served, invoicing of customers in the same currency as the source of the products, prompt settlement of intercompany balances, limited use of foreign currency denominated debt, and application of derivative instruments when appropriate. To the extent that these mitigating strategies are not successful, foreign currency rate fluctuations can have a material adverse impact on the Company’s international operations or on the business as a whole.
In the second quarter of 2022, the Company concluded that Turkey represents a hyperinflationary economy as its three-year cumulative inflation rate exceeded 100 percent. As a result, the Company started remeasuring the financial statements for the Company’s Turkish operations in accordance with the highly inflationary accounting rules in the Financial Accounting Standards Board ("FASB") Accounting Standards Codification ("ASC") 830 "Foreign Currency Matters" as of the beginning of the second quarter of 2022. As a result, all gains and losses resulting from the remeasurement of the financial results of operations and other transactional foreign exchange gains and losses are reflected in earnings, which have resulted in volatility within the Company’s earnings, rather than as a component of the Company’s comprehensive income within shareholders’ equity. The Company also remeasures its financial statements for its Argentina operations in accordance with the highly inflationary accounting rules. Turkey and Argentina becoming hyperinflationary economies has had a material adverse effect on the Company’s consolidated results of operations and further inflation may have additional adverse effects on the Company's consolidated financial position, results of operations, or cash flows in future periods.
The Company’s acquisition strategy entails expense, integration risks, and other risks that could affect the Company’s earnings and financial condition. One of the Company’s continuing strategies is to increase revenues and expand market share
through acquisitions that will provide complementary Water and Fueling Systems products, add to the Company’s global reach, or both. The Company spends significant time and effort expanding existing businesses through identifying, pursuing, completing, and integrating acquisitions, which generate expense whether or not the acquisitions are actually completed. Competition for acquisition candidates may limit the number of opportunities and may result in higher acquisition prices. There is uncertainty related to successfully acquiring, integrating and profitably managing additional businesses without substantial costs, delays or other problems. There can also be no assurance that acquired companies will achieve revenues, profitability or cash flows that justify the investment. Failure to manage or mitigate these risks could adversely affect the Company’s results of operations and financial condition.
The Company’s products are sold in highly competitive markets, by numerous competitors whose actions could negatively impact sales volume, pricing and profitability. The Company is a global leader in the production and marketing of groundwater and fuel pumping systems. End user demand, distribution relationships, industry consolidation, new product capabilities of the Company’s competitors or new competitors, and many other factors contribute to a highly competitive environment. Additionally, some of the Company’s competitors have substantially greater financial resources than the Company. The Company believes that consistency of product quality, timeliness of delivery, service, and continued product innovation, as well as price, are principal factors considered by customers in selecting suppliers. Competitive factors previously described may lead to declines in sales or in the prices of the Company’s products which could have an adverse impact on its results of operations and financial condition.
The Company’s products are sold to numerous distribution outlets based on market performance. The Company may, from time to time, change distribution outlets in certain markets based on market share and growth. These changes could adversely impact sales and operating results.
Transferring operations of the Company to lower cost regions may not result in the intended cost benefits. The Company is continuing its rationalization of manufacturing capacity between all existing manufacturing facilities and the manufacturing complexes in lower cost regions. To implement this strategy, the Company must complete the transfer of assets and intellectual property between operations. Each of these transfers involves the risk of disruption to the Company’s manufacturing capability, supply chain, and, ultimately, to the Company’s ability to service customers and generate revenues and profits and may include significant severance amounts.
Delays in introducing new products or the inability to achieve or maintain market acceptance with existing or new products may cause the Company’s revenues to decrease. The industries to which the Company belongs are characterized by intense competition, changes in end-user requirements, and evolving product offerings and introductions. The Company believes future success will depend, in part, on the ability to anticipate and adapt to these factors and offer, on a timely basis, products that meet customer demands. Failure to successfully develop new and innovative products or to enhance existing products could result in the loss of existing customers to competitors or the inability to attract new business, either of which may adversely affect the Company’s revenues.
Certain Company products are subject to regulation and government performance requirements in addition to the warranties provided by the Company. The Company’s product lines have expanded significantly and certain products are subject to government regulations and standards for manufacture, assembly, and performance in addition to the warranties provided by the Company. The Company’s failure to meet all such standards or perform in accordance with warranties could result in significant warranty or repair costs, lost sales and profits, damage to the Company’s reputation, fines or penalties from governmental organizations, and increased litigation exposure. Changes to these regulations or standards may require the Company to modify its business objectives and incur additional costs to comply. Any liabilities or penalties actually incurred could have a material adverse effect on the Company’s earnings and operating results.
The Company has significant goodwill and intangible assets and future impairment of the value of these assets may adversely affect the Company's operating results and financial condition. The Company’s total assets reflectinclude substantial intangible assets, primarily goodwill. Goodwill results from the Company’s acquisitions, representing the excess of the purchase price paid over the fair value of the net assets acquired. Goodwill and indefinite-lived intangible assets are tested annually for impairment during the fourth quarter or as warranted by triggering events. If future operating performance at one or more of the Company’s operating segments were to decline significantly below current levels, the Company could incur a non-cash impairment charge to operating earnings for an impairment. Any future determination requiring theearnings. The recognition of an impairment of a significant portion of the Company’s goodwill or intangible assets could have a material adverse impact on the Company’s results of operations and financial condition.
The Company’s business may be adversely affected by the seasonality of sales and weather conditions. The Company experiences seasonal demand in a number of markets within the Water Systems segment. End-user demand in primary markets
follows warm weather trends and is at seasonal highs from April to August in the Northern Hemisphere. Demand for residential and agricultural water systems are also affected by weather-related disasters including heavy flooding and drought. Changes in these patterns could reduce demand for the Company’s products and adversely impact sales, gross margins, and operating results.
The Company depends on certain key suppliers, and any loss of those suppliers or their failure to meet commitments may adversely affect the Company's business and results of operations. The Company is dependent on a single or limited number of suppliers for some materials or components required in the manufacture of its products. If any of those suppliers fail to meet their commitments to the Company in terms of delivery or quality, the Company may experience supply shortages that could result in its inability to meet customer requirements, or could otherwise experience an interruption in operations that could negatively impact the Company’s business and results of operations.
The Company’s operations are dependent on information technology infrastructure and failures could significantly affect its business. The Company depends on information technology infrastructure in order to achieve business objectives. If the Company experiences a problem that impairs this infrastructure, such as a computer virus, a problem with the functioning of an important IT application, or an intentional disruption of IT systems by a third party, the resulting disruptions could impede the Company's ability to record or process orders, manufacture and ship products in a timely manner, or otherwise carry on business in the ordinary course. Any such events could cause the loss of customers or revenue and could cause significant expense to be incurred to eliminate these problems and address related security concerns. The Company is also subject to
certain U.S. and international data protection and cybersecurity regulations. Complying with these laws may subject the Company to additional costs or require changes to the Company’s business practices. Any inability to adequately address privacy and security concerns or comply with applicable privacy and data security laws, rules and regulations could expose the Company to potentially significant liabilities.
Additional Risks to the Company. The Company is subject to various risks in the normal course of business as well as catastrophic events including severe weather events, earthquakes, fires, acts of war, terrorism, civil unrest, epidemics and pandemics and other unexpected events. Exhibit 99.1 sets forth risks and other factors that may affect future results, including those identified above, and is incorporated herein by reference.
ITEM 1B. UNRESOLVED STAFF COMMENTS
None.
ITEM 1C. CYBERSECURITY
Data and information systems are a key part of how the Company delivers value to its customers, employees and stakeholders, and the Company’s cybersecurity program is committed to protecting its customers, employees, partners, infrastructure and systems. The Company’s cybersecurity program and approach is overseen by its Board of Directors, in coordination with the Audit Committee, and Senior Leadership, along with its Senior Director of Global Information Technology Operations and Infrastructure who has expertise around global cybersecurity matters. The Board of Directors receives annual reports from Senior Leadership on the Company’s cybersecurity risks. In addition, Senior Leadership updates the Board of Directors, as necessary, regarding any significant cybersecurity incidents. The Board of Directors and Senior Leadership review the strategy, tools, metrics and latest trends affecting cybersecurity and utilizes the National Institute of Standards and Technology (NIST) Cybersecurity Framework as the foundation for its cybersecurity strategy and approach. Third parties are engaged to assess the Company’s cybersecurity posture and adherence to the NIST Cybersecurity Framework, and the Company evaluates cybersecurity risks as part of its annual risk assessment process. Cybersecurity risk mitigation strategies and initiatives are developed based on these assessments. Any incident assessed as potentially being or potentially becoming material is immediately escalated for further assessment, and then reported to designated members of Senior Leadership.
A key area for the Cybersecurity Program is employee cybersecurity education. The Company’s employees play a key role in cybersecurity and receive mandatory cybersecurity training, phishing attack simulations, educational events, and news bulletins. The Company’s data protection and privacy program is designed to adhere to and adapt to global privacy and data protection laws.
The Company’s business strategy, results of operations and financial condition have not been materially affected and are not reasonably likely to be affected by risks from cybersecurity threats, including as a result of previously identified cybersecurity incidents, but it cannot provide assurance that they will not be materially affected in the future by such risks or any future material incidents. For more information on the Company’s information technology related risks, see Item 1A Risk Factors of this Annual Report on Form 10-K.
ITEM 2. PROPERTIES
Franklin Electric serves customers worldwide with over 225220 manufacturing and distribution facilities located in over 20 countries. The Global Headquarters is located in Fort Wayne, Indiana, United States and houses sales, marketing and administrative offices along with a state of the artstate-of-the-art research and engineering facility. Besides the owned corporate facility, the Company considers the following to be principal properties:
| | | | | | | | |
| Location / Segment | Purpose | Own/Lease |
| Santa Catarina, Brazil / Water & Fueling | Manufacturing/Distribution/Sales | Own |
| Sao Paulo, Brazil / Water & Fueling | Manufacturing/Distribution/Sales | Own |
| Jiangsu Province, China / Water & Fueling | Manufacturing | Own |
| | |
| Brno, Czech Republic / Water | Manufacturing | Own |
| Vicenza, Italy / Water | Manufacturing | Own |
| Nuevo Leon, Mexico / Water & Fueling | Manufacturing | Own |
| Edenvale, South Africa / Water | Manufacturing | Own |
| Izmir, Turkey / Water & Fueling | Manufacturing/Distribution/Sales/R&D | Own |
| Indiana, United States / Water | Manufacturing/Distribution/Sales | Lease |
| Montana, United States / Distribution | Distribution | Own |
| North Carolina, United States / Distribution | Distribution | Own |
| Oklahoma, United States / Water | Manufacturing | Own |
| Oregon, United States / Water | Manufacturing/Distribution/Sales/R&D | Lease |
| Wisconsin, United States / Fueling | Manufacturing/Distribution/Sales/R&D | Own |
The Company also owns and leases other smaller facilities which serve as manufacturing locations and distribution warehouses. The Company does not consider these facilities to be principal to the business or operations. In the Company’s opinion, its facilities are suitable for their intended use, adequate for the Company’s business needs, all currently utilized and in good condition.
ITEM 3. LEGAL PROCEEDINGS
The Company is defending various claims and legal actions which have arisen in the ordinary course of business. For a description of the Company's material legal proceedings, refer to Note 16 - Commitments and Contingencies, in the Notes to Consolidated Financial Statements included in Part II, Item 8, "Financial Statements and Supplementary Data," of this Annual Report on Form 10-K, which is incorporated into this Item 3 by reference. In the opinion of management, based on current knowledge of the facts and after discussion with counsel, other claims and legal actions can be defended or resolved without a material effect on the Company’s financial position, results of operations, and net cash flows.
ITEM 4. MINE SAFETY DISCLOSURES
INFORMATION ABOUT OUR EXECUTIVE OFFICERS
Current executive officers of the Company, their ages, current position, and business experience during at least the past five years as of December 31, 2021,2023, are as follows:
| | | | | | | | | | | |
Name |
Age |
Position Held | Period Holding Position |
| Gregg C. Sengstack | 6365 | Chairperson of the Board and Chief Executive Officer | 2015 - present |
| | | |
| | | |
| Jeffery L. Taylor | 5557 | Vice President, Chief Financial Officer | 2021 - present |
| | Chief Financial Officer, Blue Bird Corporation | 2020 - 2021 |
| | Senior Vice President and Chief Financial Officer, Wabash National Corporation | 2014 - 2020 |
| Brent L. Spikes | 52 | Vice President, Global Manufacturing | 2022 - present |
| | Vice President, Global Water Engineering | 2020 - 2022 |
| | Vice President, Manufacturing & Manufacturing Engineering | 2019 - 2020 |
| | Director, Manufacturing & Manufacturing Engineering | 2018 - 2019 |
| | Director, Advanced Manufacturing | 2014 - 2018 |
| DeLancey W. Davis | 5658 | Vice President and President, Headwater Companies | 2017 - present |
| | Vice President and President, North America Water SystemsGreg M. Levine | 2012 - 2017 |
Donald P. Kenney | 6150 | Vice President and President, Global Water | 20192023 - present |
| | President and CEO, Motion Control and Drives, Nidec Corporation | 2020-2023 |
| | President, Motion Control, Nidec Corporation | 2016-2020 |
| Jay J. Walsh | 54 | Vice President and President, North America WaterFueling Systems | 2019 - present |
| | President, Fueling Systems | 2017 - 2019 |
| | Vice President and President, Energy Systems | 2014 - 2017 |
| | | |
| | | |
| Jonathan M. Grandon | 4648 | Vice President, Chief Administrative Officer, General Counsel and Corporate Secretary | 2016 - present |
| | | |
Vice President, Integration - Zimmer BiometKenneth Keene | 2015 - 2016 |
Jay J. Walsh | 52 | Vice President and President, Fueling Systems | 2019 - present |
| | President, Fueling Systems | 2017 - 2019 |
| | Executive Vice President, Fueling Systems | 2013 - 2017 |
| | | |
| | | |
| | | |
Dr. Paul N. Chhabra | 4860 | Vice President, Global Product Supply | 2022 - present |
| | Vice President, EMEA Manufacturing | 2021 - 2022 |
| | Vice President, Global Sourcing | 2018 - present2021 |
| | Vice President, Global Supply ChainSales - Applied MaterialsUS | 20152014 - 2018 |
| | | |
| | | |
| | | |
All executive officers are elected annually by the Board of Directors at the Board meeting held in conjunction with the annual meeting of shareholders. All executive officers hold office until their successors are duly elected or until their death, resignation or removal by the Board.
PART II
ITEM 5. MARKET FOR REGISTRANT’S COMMON EQUITY, RELATED STOCKHOLDER MATTERS, AND ISSUER PURCHASES OF EQUITY SECURITIES
The number of shareholders of record as of February 10, 20227, 2024 was 639.591. The Company’s stock is traded on the NASDAQ Global Select Market under the symbol FELE. Broadridge Corporate Issuer Solutions, Inc. 1155 Long Island Avenue, Edgewood, New York, 11717 serves as the registrar, record keeper and stock transfer agent.
Dividends paid per common share as quoted by the NASDAQ Global Select Market for 20212023 and 20202022 were as follows: | | Dividends per Share | Dividends per Share | Dividends per Share |
| | | 2021 | | 2020 | | 2023 | | 2022 |
| 1st Quarter | 1st Quarter | $ | .1750 | | | $ | .1550 | |
| 2nd Quarter | 2nd Quarter | .1750 | | | .1550 | |
| 3rd Quarter | 3rd Quarter | .1750 | | | .1550 | |
| 4th Quarter | 4th Quarter | .1750 | | | .1550 | |
The Company has increased dividend payments on an annual basis for 2931 consecutive years. The payment of dividends in the future will be determined by the Board of Directors and will depend on business conditions, earnings, and other factors.
Issuer Purchases of Equity Securities
In April 2007, the Company’s Board of Directors unanimously approved a plan to increase the number of shares remaining for repurchase from 628,692 to 2,300,000 shares. There is no expiration date for this plan. On August 3, 2015, the Company’s Board of Directors approved a plan to increase the number of shares remaining for repurchase by an additional 3,000,000 shares. The authorization was in addition to the 535,107 shares that remained available for repurchase as of July 31, 2015.In February 2023, the Company’s Board of Directors approved a plan to increase the number of shares remaining for repurchase by an additional 1,000,000 shares. The authorization was in addition to the 215,872 shares that remained available for repurchase as of February 16, 2023. The Company repurchased 959144,137 shares for approximately $0.1$12.6 million under this plan during the fourth quarter of 2021.2023. The maximum number of shares that may still be purchased under this plan as of December 31, 20212023 is 741,314.916,655.
| | | | | | | | | | | | | | |
| Period | Total Number of Shares Repurchased | Average Price Paid per Share | Total Number of Shares Purchased as Part of Publicly Announced Plan | Maximum Number of Shares that may yet to be Repurchased |
| October 1 - October 31 | 959 | $ | 79.86 | | 959 | 741,314 | |
| November 1 - November 30 | — | $ | — | | — | 741,314 | |
| December 1 - December 31 | — | $ | — | | — | 741,314 | |
| Total | 959 | $ | 79.86 | | 959 | 741,314 | |
| | | | | | | | | | | | | | |
| Period | Total Number of Shares Repurchased | Average Price Paid per Share | Total Number of Shares Purchased as Part of Publicly Announced Plan | Maximum Number of Shares that may yet to be Repurchased |
| October 1 - October 31 | 80,000 | $ | 85.55 | | 80,000 | 980,792 | |
| November 1 - November 30 | 56,718 | $ | 88.42 | | 56,718 | 924,074 | |
| December 1 - December 31 | 7,419 | $ | 93.85 | | 7,419 | 916,655 | |
| Total | 144,137 | $ | 87.11 | | 144,137 | 916,655 | |
Stock Performance Graph
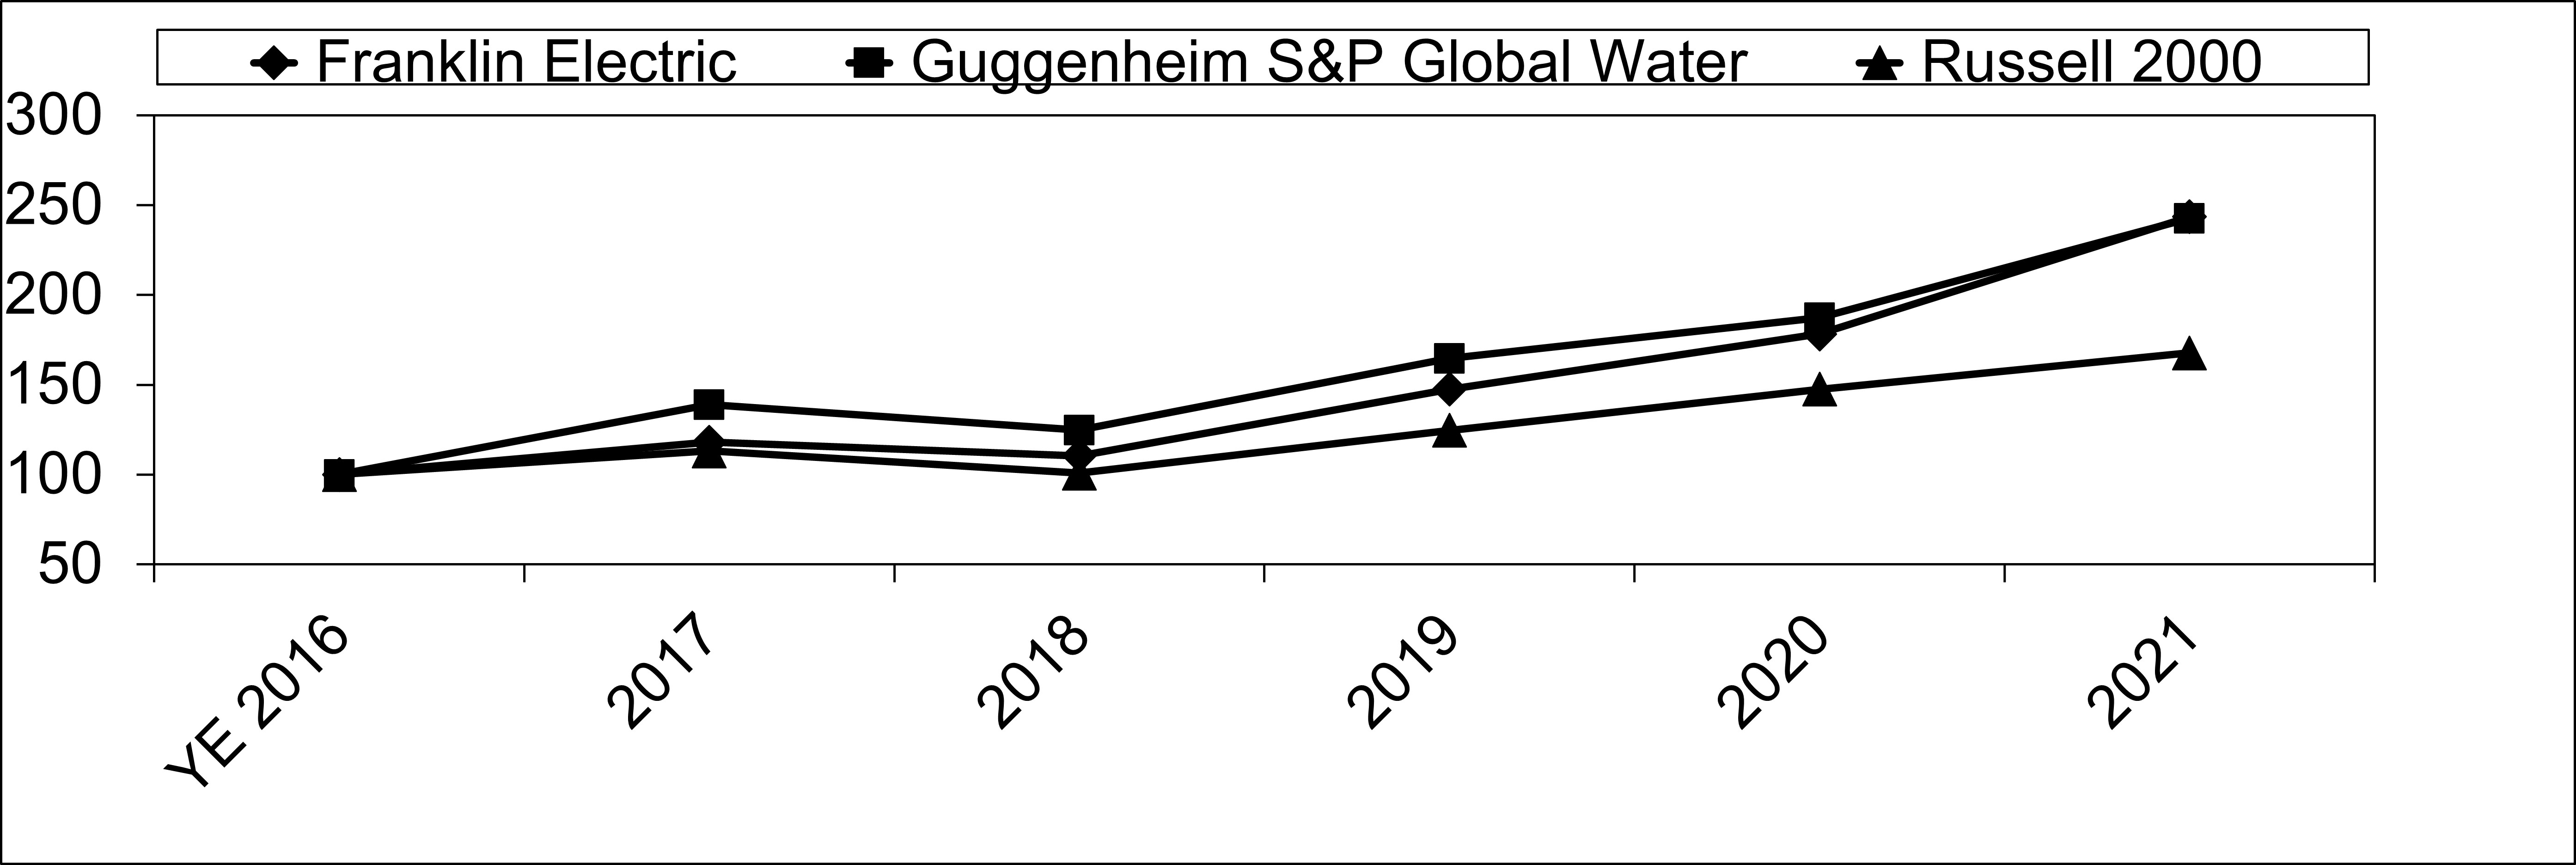
The following graph compares the Company’s cumulative total shareholder return (Common Stock price appreciation plus dividends, on a reinvested basis) over the last five fiscal years with the Guggenheim S&P Global Water Index and the Russell 2000 Index.
Hypothetical $100 invested on December 31, 20162018 (fiscal year-end 2016)2018) in Franklin Electric common stock (FELE), Guggenheim S&P Global Water Index, and Russell 2000 Index, assuming reinvestment of dividends:
| | | | | | | | | | | | | | | | | | | | | | | | | | | | | | | | | | | | | | |
| | YE 2016 | | 2017 | | 2018 | | 2019 | | 2020 | | 2021 |
| FELE | | $ | 100 | | | $ | 118 | | | $ | 110 | | | $ | 148 | | | $ | 178 | | | $ | 244 | |
| Guggenheim S&P Global Water | | 100 | | | 139 | | | 125 | | | 165 | | | 187 | | | 243 | |
| Russell 2000 | | 100 | | | 113 | | | 101 | | | 125 | | | 147 | | | 168 | |
| | | | | | | | | | | | | | | | | | | | | | | | | | | | | | | | | | | | | | |
| | YE 2018 | | 2019 | | 2020 | | 2021 | | 2022 | | 2023 |
| FELE | | $ | 100 | | | $ | 134 | | | $ | 161 | | | $ | 221 | | | $ | 188 | | | $ | 202 | |
| Guggenheim S&P Global Water | | 100 | | | 132 | | | 150 | | | 195 | | | 152 | | | 176 | |
| Russell 2000 | | 100 | | | 124 | | | 146 | | | 166 | | | 132 | | | 155 | |
ITEM 7. MANAGEMENT’S DISCUSSION AND ANALYSIS OF FINANCIAL CONDITION AND RESULTS OF OPERATIONS
Discussion of the year-over-year comparison of changes in the Company's financial condition and results of operation as of and for the fiscal years ended December 31, 20202022 and December 31, 20192021 can be found in Part II, Item 7. "Management’s Discussion and Analysis of Financial Condition and Results of Operations" of our Annual Report on Form 10-K for the fiscal year ended December 31, 2020.2022.
20212023 vs. 20202022
OVERVIEW
SalesNet sales in 2021 were up from2023 increased 1 percent compared to the prior year. The sales increase in 2023 was ledprimarily due to price realization, partially offset by increases from volume, price, and acquisitions. Thethe negative impact of foreign currency translation decreased sales by less than 1 percent.and lower volumes. The Company's consolidated gross profit was $576.1$697.0 million for 2021,2023, an increase of $143.0$5.6 million or about 33 percent from 2020. The gross profit as a percent of net sales was changed at 34.7 percent in 2021 and 2020. For 2021, dilutedthe prior year. Diluted earnings per share were $3.25, upwas $4.11 for 2023, an increase of $0.14 or 4 percent from 2020 diluted earnings per share of $2.14.the prior year.
RESULTS OF OPERATIONS
Net Sales
| | | | | | | | | | | | | | | | | |
| Net Sales |
| (In millions) | 2023 | | 2022 | | 2023 v 2022 |
| Water Systems | $ | 1,203.7 | | | $ | 1,157.5 | | | $ | 46.2 | |
| Fueling Systems | 296.5 | | | 334.1 | | | (37.6) | |
| Distribution | 673.3 | | | 668.1 | | | 5.2 | |
| Eliminations/Other | (108.4) | | | (116.0) | | | 7.6 | |
| Consolidated | $ | 2,065.1 | | | $ | 2,043.7 | | | $ | 21.4 | |
Net sales in 2021 were $1,661.9 million, an increase of $414.6 million or about 33 percent compared to 2020 sales of $1,247.3 million. The incremental impact of sales from acquired businesses was $149.8 million. Sales revenue decreased by $2.3 million or less thanincreased 1 percent in 20212023 compared to the prior year. Foreign currency unfavorably impacted net sales by 3 percentage points during 2023, principally due to foreign currency translation. The sales change in 2021, excluding acquisitionsthe strengthening of the U.S. Dollar relative to the Turkish Lira and foreign currency translation, was an increase of about 21 percent. Revenue growth was from volume and price across all three segments.
| | | | | | | | | | | | | | | | | |
| Net Sales |
| (In millions) | 2021 | | 2020 | | 2021 v 2020 |
| Water Systems | $ | 963.6 | | | $ | 734.7 | | | $ | 228.9 | |
| Fueling Systems | 289.1 | | | 245.1 | | | 44.0 | |
| Distribution | 497.6 | | | 328.4 | | | 169.2 | |
| Eliminations/Other | (88.4) | | | (60.9) | | | (27.5) | |
| Consolidated | $ | 1,661.9 | | | $ | 1,247.3 | | | $ | 414.6 | |
Net Sales-Water Systems
Water Systems sales were $963.6 millionincreased 4 percent in 2021, an increase of $228.9 million or about 31 percent versus 2020. The incremental impact of sales from acquired businesses was $96.7 million. Foreign currency translation changes decreased sales $4.5 million, or about 1 percent,2023, as compared to the prior year. This sales in 2020. The Water Systems sales change in 2021, excluding acquisitions and foreign currency translation, was an increase of $136.7 million or about 19 percent. Revenue growth was primarily due to price realization. Partially offsetting the increase, sales decreased 5 percent in 2023 due to the negative impact from volume and price driven by broad-based demand in all regions and product categories.foreign exchange rates, as compared to prior year.
Water Systems sales in the U.S. and Canada increased by about 414 percent in 2023, as compared to 2020. The incremental impact of sales from acquired businesses was $94.3 million.the prior year. Sales revenue increased by $4.0 million or aboutdecreased less than 1 percent in 20212023 due to the negative impact from foreign currency translation.exchange rates, as compared to prior year. In 2021,2023, sales of large dewatering equipment increased by about 4763 percent, due to higher sales in rental channels and in oil production end markets. Sales of groundwater pumping equipment increased by 21decreased 10 percent versus 2020. Salesand sales of all other surface pumping equipment increased by about 9 percent.decreased 1 percent compared to 2022.
Water Systems sales in markets outside the U.S. and Canada increased by about 203 percent in 2023, as compared to 2020. The incremental impact of sales from acquired businesses was $2.4 million.the prior year. Sales revenue decreased by $8.5 million or about 211 percent in 20212023 due to the negative impact from foreign currency translation. Sales change in 2021,exchange rates, as compared to prior year. In 2023 excluding acquisitions andthe impact of foreign currency translation, was an increase of about 21 percent. Sales growth wassales increases in all geographic markets;EMEA and Latin America EMENA andmore than offset sales declines in the Asia Pacific markets.
Net Sales-Fueling Systems
Fueling Systems sales were $289.1 milliondecreased 11 percent in 2021, an increase of $44.0 million or about 18 percent from 2020. Foreign currency translation changes increased sales $2.2 million or about 1 percent2023, as compared to the prior year. This sales in 2020. The Fueling Systems sales change in 2021, excluding foreign currency translation,decline was an increase of $41.8 million or about 17 percent. Revenue growth was from volumeprimarily due to lower volumes driven by customer inventory destocking as well as higher interest rates, labor constraints, and price driven primarily by the U.S. and Canada regions.permitting delays causing some new station build plans to move into 2024.
Fueling Systems sales in the U.S. and Canada increased by about 25decreased 9 percent during 2021.in 2023, as compared to the prior year. The growthdecrease was broad base across most product linesprimarily in dispensing and due to higher demand from filling stations.piping equipment. Outside the U.S. and Canada, Fueling Systems revenues outsidesales decreased 19 percent in 2023, as compared to the U.Sprior year, due primarily to the divestiture of the above ground storage tank business in 2022 and Canada increased by about 2 percent, driven by higher sales in India, Latin America and most regions in Asia Pacific, partially offset by lower sales in China. China sales were about $12 million in 2021 compared to 2020 Fueling Systems China sales of about $18 million.
Net Sales-Distribution
Distribution sales were $497.6 million in 2021, versus 2020 sales of $328.4 million or about 52 percent from 2020. The incremental impact of sales from acquired businesses was $53.1 million. Distribution segment organic sales increased $116.1 million or about 35 percent compared to 2020. Revenue growth was from volume and price driven by broad-based demand in all regions and product categories.
Cost of Sales
Cost of sales as a percent of net sales for 2021 and 2020 was 65.3 percent for both years. Correspondingly, the gross profit margin was 34.7 percent, respectively. The Company's consolidated gross profit was $576.1 million for 2021, up $143.0 million from the gross profit of $433.1 million in 2020. The increase in gross profit and gross profit margin was primarily driven by price realization, favorable product and geographic sales mix shifts and cost management which were enough to offset inflation.
Selling, General and Administrative (“SG&A”)
Selling, general, and administrative expenses were $386.3 million in 2021 and increased by $86.2 million or 29 percent overall compared to $300.1 million last year. SG&A expenses from acquired businesses were $37.0 million, and excluding the acquired entities, the Company’s SG&A expenses in 2021 were $349.3 million, an increase of 16 percent from the prior year. SG&A expenses were higher versus the prior year due to higher variable performance-based compensation expenses and increased spending to support sales growth.
Restructuring Expenses
Restructuring expenses for 2021 were $0.6 million. Restructuring expenses were $0.5 million in the Water segment and $0.1 million in Distribution segments. Restructuring expenses in Water segment were primarily from Water Treatment realignment activities, and branch closings and consolidations in the Distribution segment. Restructuring expenses for 2020 were $2.5 million. Restructuring expenses were $2.3 million in the Water segment and $0.1 million in each of the Fueling and Distribution segments. Restructuring expenses were primarily from continued miscellaneous manufacturing realignment activities and branch closings and consolidations in the Distribution segment.
Operating Income
Operating income was $189.2 million in 2021, up $58.7 million or 45 percent from $130.5 million in 2020.
| | | | | | | | | | | | | | | | | | | | |
| | Operating income (loss) |
| (In millions) | | 2021 | | 2020 | | 2021 v 2020 |
| Water Systems | | $ | 139.1 | | | $ | 114.4 | | | $ | 24.7 | |
| Fueling Systems | | 79.5 | | | 63.4 | | | 16.1 | |
| Distribution | | 35.9 | | | 11.5 | | | 24.4 | |
| Eliminations/Other | | (65.3) | | | (58.8) | | | (6.5) | |
| Consolidated | | $ | 189.2 | | | $ | 130.5 | | | $ | 58.7 | |
Operating Income-Water Systems
Water Systems operating income was $139.1 million in 2021 compared to $114.4 million in 2020, an increase of 22 percent. The operating income margin was 14.4 percent compared to the 2020 operating income margin of 15.6 percent. Operating income increased in Water Systems primarily due to higher sales volumes. Operating income margin decreased in Water Systems due to the dilution from Water Treatment at lower margins, higher inflation, and selling, general, and administrative costs not entirely offset by price realization.
Operating Income-Fueling Systems
Fueling Systems operating income was $79.5 million in 2021 compared to $63.4 million in 2020. The operating income margin was 27.5 percent compared to 25.9 percent of net sales in 2020. Operating income increased in Fueling Systems primarily due to higher sales volumes. The increase in margin was primarily due to leverage on higher sales volumes, favorable product, and geographic sales mix shifts.
Net Sales-Distribution
Distribution sales increased 1 percentage point in 2023, as compared to the prior year. The Distribution segment sales increase was primarily due to higher volumes, partially offset by lower commodity-driven pricing.
Gross Profit and Expense Ratios
| | | | | | | | | | | | | | | | | | | | | | | |
| Fiscal Year |
| (In Millions) | 2023 | | % of Net Sales | | 2022 | | % of Net Sales |
| Gross Profit | $ | 697.0 | | | 33.8 | % | | $ | 691.4 | | | 33.8 | % |
| Selling, General and Administrative Expense | 433.5 | | | 21.0 | % | | 432.1 | | | 21.1 | % |
Gross Profit
The gross profit margin ratio was 33.8 percent in 2023 and 2022. The gross profit margin was favorably impacted in 2023 by price realization, product mix and lower freight costs in Water Systems and Fueling, partially offset by margin compression from unfavorable pricing of commodity-based products sold through the Distribution business.
Selling, General and Administrative (“SG&A”)
SG&A expenses were $433.5 million in 2023 compared to $432.1 million in 2022. SG&A expenses increased by less than 1 percent in 2023 primarily due to higher compensation costs, partially offset by lower advertising and marketing expenses. The SG&A expenses ratio was 21.0 percent and 21.1 percent in 2023 and 2022, respectively.
Restructuring Expenses
Restructuring expenses were $1.1 million and $2.2 million in 2023 and 2022, respectively. Restructuring expenses were primarily from continued miscellaneous manufacturing realignment activities, branch closings and consolidations.
Operating Income
Operating income increased 2 percent in 2023, as compared to the prior year.
| | | | | | | | | | | | | | | | | | | | |
| | Operating income (loss) |
| (In millions) | | 2023 | | 2022 | | 2023 v 2022 |
| Water Systems | | $ | 196.6 | | | $ | 172.3 | | | $ | 24.3 | |
| Fueling Systems | | 92.7 | | | 96.8 | | | (4.1) | |
| Distribution | | 34.3 | | | 54.5 | | | (20.2) | |
| Eliminations/Other | | (61.2) | | | (66.4) | | | 5.2 | |
| Consolidated | | $ | 262.4 | | | $ | 257.2 | | | $ | 5.2 | |
Operating Income-Water Systems
Water Systems operating income increased $24.3 million in 2023, as compared to the prior-year period, primarily due to price realization and cost management, including lower freight costs. The 2023 operating income margin was 16.3 percent compared to 2022 operating income margin of 14.9 percent of net sales. Operating income margin increased in Water Systems primarily due to price realization and operating leverage on higher sales.
Operating Income-Fueling Systems
Fueling Systems operating income decreased $4.1 million in 2023, as compared to the prior-year period. Operating income decreased in Fueling Systems primarily due to lower sales volumes, partially offset by a favorable product and geographic mix of net sales and disciplined cost management. The 2023 operating income margin was 31.3 percent compared to 29.0 percent of net sales in 2022. Operating income margin increased in Fueling Systems primarily due to price realization, a favorable product and geographic sales mix shift and disciplined cost management.
Operating Income-Distribution
Distribution operating income was $35.9decreased $20.2 million in 20212023, as compared to the prior-year period. The 2023 operating income margin was 5.1 percent compared to 8.2 percent of net sales in 2022. Operating income and operating income margin was 7.2 percent. Distribution operating income was $11.5 million in 2020 and operating income margin was 3.5 percent. Operating income increased in Distribution due to higher sales volumes. The increase in operating income margin wasdecreased primarily due to revenue growth and operating leverage.unfavorable pricing of commodity-based products sold through the business.
Operating Income-Eliminations/Other
Operating income-Eliminations/Otherincome-eliminations/other is composed primarily of inter-segmentintersegment sales and profit eliminations and unallocated general and administrative expenses. The inter-segmentintersegment profit elimination impact in 2021 on operating income2023 compared to 2022 was $0a favorable $6.2 million. The inter-segmentintersegment elimination of operating income effectively defers the operating income on sales from Water Systems to Distribution in the consolidated financial results until such time as the transferred product is sold from the Distribution segment to its third-partyend third party customer. Unallocated generalGeneral and administrative expenses were higher by $6.5increased $1.0 million, or about 11 percentcompared to last year, primarily due to higher variable performance-based compensation expenses.the prior year.
Interest Expense
Interest expense for 2021was $11.8 million in 2023 and 2020$11.5 million in 2022, respectively. The increase in 2023 was $5.2 million and $4.6 million, respectively, and increased primarily as a result ofdriven by higher debt levels.interest rates, partially offset by lower average borrowings in 2023.
Other Income or Expense
Other income or expense(expense), net was a gainbenefit of $8.0 million and a loss of $0.8$3.7 million in 20212023 and 2020, respectively. Otheran expense of $3.2 million in 2022. The favorable benefit in 2023 was due to higher interest income or expense in 2021 includedas a bargain purchase gainresult of $6.5 millionfavorable interest rates and a gain of $2.5 millionlower benefit costs related to a settlement of an indirect tax dispute.the Company’s employee benefit plans.
Foreign Exchange
Foreign currency–basedcurrency-based transactions produced a loss for 2021an expense of $2.3$12.1 million in 2023 and $7.2 million in 2022, respectively. The expense in 2023 was primarily due to changes intransaction losses associated with the value of the ArgentinianTurkish Lira, Argentine and Mexican Peso relative to the U.S. dollar. Foreign currency–based transactions produced a loss for 2020 of $1.4 million,The expense in 2022 was primarily due to changestransaction losses associated with the Argentine Peso and Turkish Lira. The Company reports the results of its subsidiaries in Argentina and Turkey using highly inflationary accounting, which requires that the valuefunctional currency of the Argentinian Peso relativeentity be changed to the U.S. dollar.reporting currency of its parent.
Income Taxes
The provision for income taxes in 20212023 and 2020 was $34.82022 were $47.5 million and $22.5$46.4 million, respectively. The effective tax rate for both 2021 and 20202023 was about 1820 percent and before the impact of discrete events was about 21 percent. The effective tax rate for 2022 both before and after the impact of discrete events was lower thanabout 20 percent. The effective tax rate differs from the U.S. statutory rate of 21 percent primarily due to the recognition of the U.S. deduction for Foreign Derived Intangible Income, andforeign-derived intangible income (FDII) provisions, foreign earnings taxed at rates below the U.S. statutory rate, certain incentives, and discrete events. Discrete events in 2021 include increased excess tax benefits from share-based compensation compared to 2020. Discrete events in 2020 include a benefit related to a realized foreign currency translation loss on the settlement of an intercompany loan.
Beginning in 2022, the Tax Cuts and Jobs Act of 2017 ("TCJA") eliminates the option to deduct research and development expenditures currently and requires taxpayers to amortize them over five years pursuant to IRC Section 174. Although Congress is considering legislation that would defer the amortization requirement to later years, we have no assurance that the provision will be repealed or otherwise modified. If the requirement is not modified, it will reduce our cash flows beginning in 2022partially offset by an amount that is not significant.state taxes.
Net Income
Net income for 20212023 was $155.0$194.7 million compared to 20202022 net income of $101.2$188.8 million. Net income attributable to Franklin Electric Co., Inc. for 20212023 was $153.9$193.3 million, or $3.25$4.11 per diluted share, compared to 20202022 net income attributable to Franklin Electric Co., Inc. of $100.5$187.3 million, or $2.14$3.97 per diluted share.
CAPITAL RESOURCES AND LIQUIDITY
Sources of Liquidity
The Company's primary sources of liquidity are cash on hand, cash flows from operations, revolving credit agreements, and long-term debt funds available. The Company believes its capital resources and liquidity position at December 31, 20212023 is adequate to meet projected needs for the foreseeable future. The Company expects that ongoing requirements for operations, capital expenditures, pension obligations, dividends, share repurchases, and debt service will be adequately funded from cash on hand, operations, and existing credit agreements.
As of December 31, 2021,2023, the Company had a $250.0$350.0 million revolving credit facility. The facility is scheduled to mature on May 13, 2026. As of December 31, 2021,2023, the Company had $149.3$335.4 million borrowing capacity under the Credit Agreement as $4.1$3.6 million in letters of commercial and standby letters of credit were outstanding and undrawn and $96.6$11.0 million in revolver borrowings were drawn and outstanding, which were primarily used for funding recent acquisitions.working capital requirements.
In addition, the Company maintains an uncommitted and unsecured private shelf agreement with NYL Investors LLC, an affiliate of New York Life, and each of the undersigned holders of Notes (the "New York Life Agreement") with a remaining borrowing capacity of $125.0 million as of December 31, 2021.2023. The New York Life Agreement matures on July 30, 2024. The Company also has other long-term debt borrowings outstanding as of December 31, 2021.2023. See Note 10 - Debt for additional specifics regarding these obligations and future maturities.
At December 31, 2021,2023, the Company had $37.4$69.6 million of cash and cash equivalents held in foreign jurisdictions, which the Company intends to use to fund foreign operations. There is currently no need to repatriate these funds in order to meet domestic funding obligations or scheduled cash distributions.
Cash Flows
The following table summarizes significant sources and uses of cash and cash equivalents:
| | (in thousands) | 2021 | | 2020 | | 2019 |
| (in millions) | | (in millions) | 2023 | | 2022 |
| Cash flows from operating activities | Cash flows from operating activities | $ | 129.8 | | | $ | 211.9 | | | $ | 177.7 | |
| Cash flows from investing activities | Cash flows from investing activities | $ | (264.8) | | | $ | (78.8) | | | $ | (41.8) | |
| Cash flows from financing activities | Cash flows from financing activities | $ | 50.9 | | | $ | (66.6) | | | $ | (126.7) | |
| Impact of exchange rates on cash and cash equivalents | Impact of exchange rates on cash and cash equivalents | $ | (6.1) | | | $ | (0.1) | | | $ | (4.0) | |
| Change in cash and cash equivalents | Change in cash and cash equivalents | $ | (90.2) | | | $ | 66.4 | | | $ | 5.2 | |
Cash Flows from Operating Activities
20212023 vs 20202022
Net cash provided by operating activities was $129.8$315.7 million for 20212023 compared to $211.9$101.7 million for 2020.2022. The decreaseincrease in cash provided by operating activities was primarily due to increasedactions the Company took to improve working capital requirements in supportincluding inventory reductions as its supply chain resiliency and lead times improved during the back half of higher revenues.the year.
Cash Flows from Investing Activities
20212023 vs. 20202022
Net cash used in investing activities was $264.8$74.3 million in 20212023 compared to $78.8$43.1 million in 2020.2022. The increase was primarily attributable to increased acquisition activity in 2021.2023.
Cash Flows from Financing Activities
20212023 vs. 20202022
Net cash providedused by financing activities was $50.9$192.2 million in 20212023 compared to $66.6$48.5 million usedin 2022. The change in financing activities in 2020. The increase in cash provided by financing activitiesflow was primarily attributable to increased debt proceeds and issuance of common stock, primarily through stock option exercises, offset by increased dividend payments and common stock repurchases.net borrowings under the Company's revolving credit facility in 2022 compared to net repayments in 2023.
AGGREGATE CONTRACTUAL OBLIGATIONS
The majority of the Company’s contractual obligations to third parties relate to debt obligations. In addition, the Company has certain contractual obligations for future lease payments and purchase obligations. The payment schedule for these contractual obligations is as follows:
| | (In millions) | (In millions) | | | | | | | More than | (In millions) | | | | | | | | | More than |
| | | Total | | 2022 | | 2023-2024 | | 2025-2026 | | 5 years | | Total | | 2024 | | 2025-2026 | | 2027-2028 | | 5 years |
| Debt | Debt | $ | 188.7 | | | $ | 98.0 | | | $ | 2.7 | | | $ | 77.9 | | | $ | 10.1 | |
| Debt interest | Debt interest | 18.5 | | | 5.0 | | | 7.8 | | | 4.4 | | | 1.3 | |
| | Operating leases | Operating leases | 52.4 | | | 16.4 | | | 20.6 | | | 9.2 | | | 6.2 | |
| Operating leases | |
| Operating leases | |
| Purchase obligations | Purchase obligations | 13.2 | | | 13.2 | | | — | | | — | | | — | |
| Income Taxes-U.S. Tax Cuts and Jobs Act transition tax | Income Taxes-U.S. Tax Cuts and Jobs Act transition tax | $ | 13.1 | | | $ | 1.5 | | | $ | 6.8 | | | $ | 4.8 | | | $ | — | |
| | | $ | 285.9 | | | $ | 134.1 | | | $ | 37.9 | | | $ | 96.3 | | | $ | 17.6 | |
Interest payments on debt obligations are calculated for future periods using interest rates in effect at the end of 2023. Certain of these projected interest payments may differ in the future based on interest rates or other factors or events. The projected interest payments only pertain to obligations and agreements outstanding at December 31, 2023.
The Company has pension and other post-retirement benefit obligations not included in the table above which will result in estimated future payments of approximately $0.9$0.8 million in 2022. 2024. In addition, due to the timing of funding in future periods being uncertain and dependent on future movements in interest rates, investment returns, changes in laws and regulations and other variables, the table above excludes the non-current liability of $29.5 million for cash outflows related to the Company's pension plans.
The Company also has unrecognized tax benefits, none of which are included in the table above. The unrecognized tax benefits of approximately $0.9$0.8 million have been recorded as liabilities and the Company is uncertain as to if or when such amounts may be settled. Related to the unrecognized tax benefits, the Company has also recorded a liability for potential penalties and interest of $0.1 million.
ACCOUNTING PRONOUNCEMENTS
For information regarding recent accounting pronouncements, refer to Note 2 - Accounting Pronouncements, in the Notes to Consolidated Financial Statements in the sections entitled ""Adoption of New Accounting Standards" and "Accounting Standards Issued But Not Yet Adopted", included in Part II, Item 8, "Financial Statements and Supplementary Data" of this Annual Report on Form 10-K.
CRITICAL ACCOUNTING ESTIMATES
Management’s discussion and analysis of its financial condition and results of operations are based upon the Company’s consolidated financial statements, which have been prepared in accordance with accounting principles generally accepted in the United States of America. The preparation of these financial statements requires management to make estimates and judgments that affect the reported amounts of assets, liabilities, revenues and expenses, and the related disclosure of contingent assets and liabilities. Management evaluates estimates on an ongoing basis. Estimates are based on historical experience and on other assumptions that are believed to be reasonable under the circumstances, the results of which form the basis for making judgments about the carrying value of assets and liabilities that are not readily apparent from other sources. Actual results may differ from these estimates under different assumptions or conditions. There were no material changes to estimates or methodologies used to develop those estimates in 2021.2023. The Company’s critical accounting estimates are identified below:
Inventory Valuation
The Company uses certain estimates and judgments to value inventory. Inventory is recorded at the lower of cost or market.net realizable value. The Company reviews its inventories for excess or obsolete products or components. Based on an analysis of historical usage, management’s evaluation of estimated future demand, market conditions, and alternative uses for possible excess or obsolete parts, carrying values are adjusted. The carrying value is reduced regularly to reflect the age and current anticipated product demand. If actual demand differs from the estimates, additional reductions would be necessary in the period such determination is made. Excess and obsolete inventory is periodically disposed of through sale to third parties, scrapping, or other means.
Business Combinations and Valuation of Acquired Intangible Assets
The Company follows the guidance under FASB Accounting Standards Codification (“ASC”)ASC Topic 805, Business Combinations. The acquisition purchase price is allocated to the assets acquired and liabilities assumed based upon their respective fair values. The Company utilizes management estimates and may use an independent third-party valuation firm to assist in determining the fair values of assets acquired, including intangible assets, and liabilities assumed. The primaryidentifiable intangible assets acquired typically include customer relationships and trade names. IntangibleIdentifiable intangible assets are initially valued using a methodology commensurate with the intended use of the asset. The fair value of customer relationships is measured using the multi-period excess earnings method ("MPEEM"). The fair value of trade names is measured using a relief-from-royalty ("RFR") approach, which assumes the value of the trade name is the discounted amount of cash flows that would be paid to third parties had the Company not owned the trade name and instead licensed the trade name from another company. Higher royalty rates are assigned to premium brands within the marketplace based on name recognition and profitability, while other brands receive lower royalty rates. The basis for future sales projections for both the RFR and MPEEM are based on internal revenue forecasts which the Company believes represents reasonable market participant assumptions. The future cash flows are discounted using an applicable discount rate as well as any potential risk premium to reflect the inherent risk of holding a standalone intangible asset. The key uncertainties in the RFR and MPEEM calculations, as applicable, are the selection of an appropriate royalty rate, assumptions used in developing estimates of future cash flows, including revenue growth and expense forecasts, assumed customer attrition rates, as well as the perceived risk associated with those forecasts in determining the discount rate and risk premium. There is inherent uncertainty in forecasted future cash flows and therefore, actual results may differ and could result in subsequent impairment charges of acquired intangibles and/or goodwill.
Indefinite-Lived Intangible Asset and Goodwill Impairment Evaluation
According to FASB ASC Topic 350, Intangibles - Goodwill and Other, intangible assets with indefinite lives must be tested for impairment at least annually or more frequently as warranted by triggering events that indicate potential impairment. The Company uses a variety of methodologies in conducting impairment assessments including income and market approaches. For indefinite-lived assets apart from goodwill, primarily trade names for the Company, if the fair value is less than the carrying amount, an impairment charge is recognized in an amount equal to that excess. The Company has not made any material changes to the method of evaluating impairments during the last three years.
In compliance with FASB ASC Topic 350, goodwill is not amortized. Goodwill is tested at the reporting unit level for impairment annually or more frequently as warranted by triggering events that indicate potential impairment. Reporting units are operating segments or one level below, known as components, which can be aggregated for testing purposes. The Company’s goodwill is allocated to the Global Water Systems, Fueling Systems and Distribution reporting units. As the Company’s business model evolves, management will continue to evaluate its reporting units and review the aggregation criteria.
In assessing the recoverability of goodwill, the Company determines the fair value of its reporting units by utilizing a combination of both the market value and income approaches. The market value approach compares the reporting units’ current and projected financial results to entities of similar size and industry to determine the market value of the reporting unit. The income approach utilizes assumptions regarding estimated future cash flows and other factors to determine the fair value of the respective assets. These cash flows consider factors regarding expected future operating income and historical trends, as well as the effects of demand and competition. The Company may beis required to record an impairment if these assumptions and estimates change whereby the fair value of the reporting units is below their associated carrying values. Goodwill included on the balance sheet as of the fiscal year ended 2021December 31, 2023 was $329.6$342.4 million.
During the fourth quarter of 2021,2023, the Company completed its annual impairment test of goodwill and indefinite-lived trade names and determined the fair value of all intangibles were substantially in excess of the respective carrying values. Significant judgment is required to determine if an indication of impairment has taken place. Factors to be considered include the following: adverse changes in operating results, decline in strategic business plans, significantly lower future cash flows, and sustainable declines in market data such as market capitalization. A 10 percent decrease in the estimated fair value estimates used in the impairment testof any of these intangible assets would not have changed this determination. The sensitivity analysis required the use of numerous subjective assumptions, which, if actual experience varies, could result in material differences in the requirements for impairment charges. Further, an extended downturn in the economy may impact certain components of the operating segments more significantly and could result in changes to the aggregation assumptions andan impairment determination.
Income Taxes
Under the requirements of FASB ASC Topic 740, Income Taxes, the Company records deferred tax assets and liabilities for the future tax consequences attributable to differences between financial statement carrying amounts of existing assets and liabilities and their respective tax bases. Deferred tax assets and liabilities are measured using enacted tax rates expected to apply to taxable income in the years in which those temporary differences are expected to be recovered or settled. The Company analyzes the deferred tax assets and liabilities for their future realization based on the estimated existence of sufficient taxable income. This analysis considers the following sources of taxable income: prior year taxable income, future reversals of existing taxable temporary differences, future taxable income exclusive of reversing temporary differences and tax planning strategies that would generate taxable income in the relevant period. If sufficient taxable income is not projected then the Company will record a valuation allowance against the relevant deferred tax assets.
The Company’s operations involve dealing with uncertainties and judgments in the application of complex tax regulations in multiple jurisdictions. These jurisdictions have different tax rates, and the Company determines the allocation of income to each of these jurisdictions based upon various estimates and assumptions. In the normal course of business, the Company will undergo tax audits by various tax jurisdictions. Such audits often require an extended period of time to complete and may result in income tax adjustments if changes to the allocation are required between jurisdictions with different tax rates. The final taxes paid are dependent upon many factors, including negotiations with taxing authorities in the various jurisdictions and resolution of disputes arising from federal, state, and international tax audits. Although the Company has recorded all income tax uncertainties in accordance with FASB ASC Topic 740, these accruals represent estimates that are subject to the inherent uncertainties associated with the tax audit process, and therefore include uncertainties.process. Management judgment is required in determining the Company’s provision for income taxes, deferred tax assets and liabilities, which, if actual experience varies, could result in material adjustments to tax expense and/or deferred tax assets and liabilities.
Pension and Employee Benefit Obligations
The Company consults with its actuaries to assist with the calculation of discount rates used in its pension and post retirement plans. The discount rates used to determine domestic pension and post-retirement plan liabilities are calculated using a full yield curve approach. Market conditions have caused the weighted-average discount rate to move from 2.315.15 percent last year to 2.684.90 percent this year for the domestic pension plans and from 2.125.08 percent last year to 2.574.88 percent this year for the postretirement health and life insurance plan. A change in the discount rate selected by the Company of 25 basis points would result in a change of about $0.1 million to employee benefit expense and a change of about $4.3$2.4 million of liability.
The Company consults with actuaries and investment advisors in making its determination of the expected long-term rate of return on plan assets. Using input from these consultations such as long-term investment sector expected returns, the correlations and standard deviations thereof, and the plan asset allocation, the Company has assumedwill use an expected long-term rate of return on plan assets of 4.506.20 percent as of the fiscal year ended 2021.in measuring net periodic cost for 2024. Market conditions have caused the expected long-term rate ofor return to increase from 4.005.70 percent as of the fiscal year ended 2020.used in measuring net periodic cost for 2023. A change in the long-term rate of return selected by the Company of 25 basis points would result in a change of about $0.4$0.3 million of employee benefit expense.
FACTORS THAT MAY AFFECT FUTURE RESULTS
This annual report on Form 10-K contains certain forward-looking information, such as statements about the Company’s financial goals, acquisition strategies, financial expectations including anticipated revenue or expense levels, business prospects, market positioning, product development, manufacturing re-alignment, capital expenditures, tax benefits and expenses, and the effect of contingencies or changes in accounting policies. Forward-looking statements are typically identified by words or phrases such as “believe,” “expect,” “anticipate,” “intend,” “estimate,” “may increase,” “may fluctuate,” “plan,” “goal,” “target,” “strategy,” and similar expressions or future or conditional verbs such as “may,” “will,” “should,” “would,” and “could.” While the Company believes that the assumptions underlying such forward-looking statements are reasonable based on present conditions, forward-looking statements made by the Company involve risks and uncertainties and are not guarantees of future performance. Actual results may differ materially from those forward-looking statements as a result of various factors, including general economic and currency conditions, various conditions specific to the Company’s business and industry, new housing starts, weather conditions, epidemics and pandemics, market demand, competitive factors, changes in distribution channels, supply constraints, effect of price increases, raw material costs, technology factors, integration of acquisitions, litigation, government and regulatory actions, the Company’s accounting policies, and other risks, all as described in Item 1A and Exhibit 99.1 of this Form 10-K. Any forward-looking statements included in this Form 10-K are based upon information presently available. The Company does not assume any obligation to update any forward-looking information, except as required by law.
ITEM 7A. QUANTITATIVE AND QUALITATIVE DISCLOSURES ABOUT MARKET RISK
The Company is subject to market risk associated with changes in foreign currency exchange rates, interest rates, and commodity prices. These exposures are actively monitored by management. Exposure to foreign exchange rate risk is due to certain costs, revenue and borrowings being denominated in currencies other than one of the Company’s subsidiaries functional currency. Similarly, the Company is exposed to market risk as the result of changes in interest rates which may affect the cost of financing.
Foreign Currency Exchange Rate Risk
Foreign currency exchange rate risk is mitigated through several means including maintenance of local production facilities in the markets served, invoicing of customers in the currency which the Company is billed for production inputs, prompt settlement of third party and intercompany balances, limited use of foreign currency denominated debt, maintaining minimal foreign currency denominated cash balances, and application of derivative instruments when appropriate. Based on the 20212023 mix of foreign currencies, the Company estimates that a hypothetical strengthening of the US Dollar by about 2 percent would have reduced the Company’s 20212023 sales by aboutless than 1 percent.
Interest Rate Risk
The results of operations are exposed to changes in interest rates primarily with respect to borrowings under the Company’s revolving credit agreement (the “Credit Agreement”). Borrowings in USD under the Credit Agreement may be made either at (i) a EurocurrencySecured Overnight Financing Rate (SOFR) TermBenchmark plus an applicable margin or (ii) an alternative base rate based on LIBORas defined in the Credit Agreement. Borrowings in EUR under the Credit Agreement may be made either at (i) a Euro Interbank Offer Rate (EURIBOR) Term Benchmark plus an applicable margin or (ii) an alternative base rate as defined in the Credit Agreement. The Company had $96.6$11.0 million borrowings at year-end 20212023 under the Credit Agreement. The Company estimates that a hypothetical increase of 100 basis points in interest rates would have increased interest expense by $0.5$0.7 million during 2021.2023. The Company also has exposure to changes in interest rates in the form of the fair value of outstanding fixed rate debt fluctuating in response to changing interest rates.
One-week and two-month USD LIBOR tenors, were phased out by the Intercontinental Exchange Benchmark Administration effective December 31, 2021. All other US LIBOR tenors are scheduled to cease after June 30, 2023. The United States, using the analysis performed by the ARRC (Alternative Reference Rates Committee), elected the Secured Overnight Financing Rate (“SOFR”) as a broad measure of the cost of borrowing cash overnight collateralized by U.S. Treasury Securities. The New York Fed commenced publishing the SOFR rate daily beginning April 3, 2018. The Company continues to use active USD LIBOR tenors where applicable and will continue assessing SOFR for future draws on the Credit Agreement.
Commodity Price Exposures
Portions of the Company’s business are exposed to volatility in the prices of certain commodities, such as copper, steel and aluminum, among others. The primary exposure to this volatility resides with the use of these materials in purchased component parts. The Company generally maintainmaintains long-term fixed price contracts on raw materials and component parts; however, the Company is prone to exposure as these contracts expire. Based on the 20212023 use of commodities, the Company estimates that a hypothetical 10 percent adverse movement in prices for raw metal commodities would result in about aless than 1 percent decrease of gross margin as a percent of net sales.
ITEM 8. FINANCIAL STATEMENTS AND SUPPLEMENTARY DATA
FRANKLIN ELECTRIC CO., INC. AND CONSOLIDATED SUBSIDIARIES
CONSOLIDATED STATEMENTS OF INCOME
| | (In thousands, except per share amounts) | (In thousands, except per share amounts) | 2021 | | 2020 | | 2019 | (In thousands, except per share amounts) | 2023 | | 2022 | | 2021 |
| | Net sales | |
| Net sales | |
| Net sales | Net sales | $ | 1,661,865 | | | $ | 1,247,331 | | | $ | 1,314,578 | |
| Cost of sales | Cost of sales | 1,085,776 | | | 814,192 | | | 886,475 | |
| Gross profit | Gross profit | 576,089 | | | 433,139 | | | 428,103 | |
| Selling, general, and administrative expenses | Selling, general, and administrative expenses | 386,275 | | | 300,122 | | | 298,451 | |
| Restructuring expense | Restructuring expense | 621 | | | 2,506 | | | 2,519 | |
| Operating income | Operating income | 189,193 | | | 130,511 | | | 127,133 | |
| Interest expense | Interest expense | (5,196) | | | (4,627) | | | (8,245) | |
| Other income/(expense), net | Other income/(expense), net | 7,978 | | | (795) | | | (412) | |
| Foreign exchange income/(expense) | (2,269) | | | (1,392) | | | (1,641) | |
| Foreign exchange expense | |
| Income before income taxes | Income before income taxes | 189,706 | | | 123,697 | | | 116,835 | |
| Income tax expense | Income tax expense | 34,731 | | | 22,540 | | | 20,836 | |
| Net income | Net income | $ | 154,975 | | | $ | 101,157 | | | $ | 95,999 | |
| Less: Net loss/(income) attributable to noncontrolling interests | (1,115) | | | (697) | | | (516) | |
| Less: Net income attributable to noncontrolling interests | |
| Net income attributable to Franklin Electric Co., Inc. | Net income attributable to Franklin Electric Co., Inc. | $ | 153,860 | | | $ | 100,460 | | | $ | 95,483 | |
| Income per share: | | | | | |
| Earnings per share: | |
| Basic | |
| Basic | |
| Basic | Basic | $ | 3.29 | | | $ | 2.16 | | | $ | 2.04 | |
| Diluted | Diluted | $ | 3.25 | | | $ | 2.14 | | | $ | 2.03 | |
See Notes to Consolidated Financial Statements.
FRANKLIN ELECTRIC CO., INC. AND CONSOLIDATED SUBSIDIARIES
CONSOLIDATED STATEMENTS OF COMPREHENSIVE INCOME
| | (In thousands) | (In thousands) | 2021 | | 2020 | | 2019 | (In thousands) | 2023 | | 2022 | | 2021 |
| | Net income | Net income | $ | 154,975 | | | $ | 101,157 | | | $ | 95,999 | |
| Net income | |
| Net income | |
| Other comprehensive income/(loss), before tax: | Other comprehensive income/(loss), before tax: | |
| Foreign currency translation adjustments | |
| Foreign currency translation adjustments | |
| Foreign currency translation adjustments | Foreign currency translation adjustments | (27,534) | | | (11,868) | | | (5,659) | |
| Employee benefit plan activity: | Employee benefit plan activity: | |
| | Net gain/(loss) arising during period | Net gain/(loss) arising during period | 288 | | | (7,398) | | | (5,006) | |
| | Net gain/(loss) arising during period | |
| | Net gain/(loss) arising during period | |
| Amortization arising during period | Amortization arising during period | 4,760 | | | 3,709 | | | 2,913 | |
| Other comprehensive income/(loss) | Other comprehensive income/(loss) | (22,486) | | | (15,557) | | | (7,752) | |
| Income tax benefit/(expense) related to items of other comprehensive loss | (1,458) | | | 1,112 | | | 589 | |
| Income tax benefit/(expense) related to items of other comprehensive income/(loss) | |
| Other comprehensive income/(loss), net of tax | Other comprehensive income/(loss), net of tax | (23,944) | | | (14,445) | | | (7,163) | |
| Comprehensive income | Comprehensive income | 131,031 | | | 86,712 | | | 88,836 | |
| Less: Comprehensive income/(loss) attributable to noncontrolling interests | 981 | | | 813 | | | 544 | |
| Less: Comprehensive loss/(income) attributable to noncontrolling interests | |
| Comprehensive income attributable to Franklin Electric Co., Inc. | Comprehensive income attributable to Franklin Electric Co., Inc. | $ | 130,050 | | | $ | 85,899 | | | $ | 88,292 | |
See Notes to Consolidated Financial Statements.
FRANKLIN ELECTRIC CO., INC. AND CONSOLIDATED SUBSIDIARIES
CONSOLIDATED BALANCE SHEETS | | | | | | | | | | | |
| (In thousands, except per share amounts) | 2021 | | 2020 |
| ASSETS | | | |
| Current assets: | | | |
| Cash and cash equivalents | $ | 40,536 | | | $ | 130,787 | |
| Receivables, less allowances of $3,975 and $3,999, respectively | 196,173 | | | 159,827 | |
| Inventories: | | | |
| Raw material | 166,918 | | | 87,226 | |
| Work-in-process | 24,725 | | | 20,565 | |
| Finished goods | 258,332 | | | 193,141 | |
| Total inventories | 449,975 | | | 300,932 | |
| Other current assets | 37,963 | | | 27,708 | |
| Total current assets | 724,647 | | | 619,254 | |
| Property, plant, and equipment, at cost: | | | |
| Land and buildings | 154,544 | | | 152,323 | |
| Machinery and equipment | 296,078 | | | 287,840 | |
| Furniture and fixtures | 44,324 | | | 47,890 | |
| Other | 40,231 | | | 33,193 | |
| Property, plant, and equipment, gross | 535,177 | | | 521,246 | |
| Less: Allowance for depreciation | (324,523) | | | (312,225) | |
| Property, plant, and equipment, net | 210,654 | | | 209,021 | |
| Right-of-Use Asset, net | 48,379 | | | 31,954 | |
| | | |
| Deferred income taxes | 7,675 | | | 8,824 | |
| Intangible assets, net | 249,691 | | | 133,782 | |
| Goodwill | 329,630 | | | 266,737 | |
| Other assets | 4,489 | | | 2,735 | |
| Total assets | $ | 1,575,165 | | | $ | 1,272,307 | |
| LIABILITIES AND EQUITY | | | |
| Current liabilities: | | | |
| Accounts payable | $ | 164,758 | | | $ | 95,903 | |
| Accrued expenses and other current liabilities | 115,408 | | | 89,048 | |
| Current lease liability | 15,320 | | | 11,090 | |
| Income taxes | 2,547 | | | 5,112 | |
| Current maturities of long-term debt and short-term borrowings | 97,981 | | | 2,551 | |
| Total current liabilities | 396,014 | | | 203,704 | |
| Long-term debt | 90,535 | | | 91,966 | |
| Long-term lease liability | 32,937 | | | 20,866 | |
| Income taxes payable non-current | 11,610 | | | 11,965 | |
| Deferred income taxes | 28,162 | | | 25,671 | |
| Employee benefit plans | 40,696 | | | 44,443 | |
| Other long-term liabilities | 26,568 | | | 23,988 | |
| Commitments and contingencies (see Note 16) | — | | | — | |
| Redeemable noncontrolling interest | (19) | | | (245) | |
| Shareholders’ equity: | | | |
| Common stock (65,000 shares authorized, $0.10 par value) outstanding (46,483 and 46,222, respectively) | 4,648 | | | 4,622 | |
| Additional capital | 310,617 | | | 283,420 | |
| Retained earnings | 859,817 | | | 764,562 | |
| Accumulated other comprehensive loss | (228,581) | | | (204,771) | |
| Total shareholders’ equity | 946,501 | | | 847,833 | |
| Noncontrolling interest | 2,161 | | | 2,116 | |
| Total equity | 948,662 | | | 849,949 | |
| Total liabilities and equity | $ | 1,575,165 | | | $ | 1,272,307 | |
See Notes to Consolidated Financial Statements.
FRANKLIN ELECTRIC CO., INC. AND CONSOLIDATED SUBSIDIARIES
CONSOLIDATED STATEMENTS OF CASH FLOWSBALANCE SHEETS | | | | | | | | | | | | | | | | | |
| (In thousands) | 2021 | | 2020 | | 2019 |
| Cash flows from operating activities: | | | | | |
| Net income | $ | 154,975 | | | $ | 101,157 | | | $ | 95,999 | |
| Adjustments to reconcile net income to net cash flows from operating activities: | | | | | |
| Depreciation and amortization | 44,572 | | | 36,488 | | | 36,977 | |
| Non-cash lease expense | 13,808 | | | 11,699 | | | 11,699 | |
| Share-based compensation | 11,731 | | | 10,066 | | | 8,957 | |
| | | | | |
| Deferred income taxes | 126 | | | (4,268) | | | (2,566) | |
| (Gain)/Loss on disposals of plant and equipment | (269) | | | 1,241 | | | 891 | |
| | | | | |
| Gain from bargain purchase of business | (6,482) | | | — | | | — | |
| Foreign exchange (income)/expense | 2,269 | | | 1,392 | | | 1,641 | |
| | | | | |
| Changes in assets and liabilities, net of acquisitions: | | | | | |
| Receivables | (31,925) | | | 22,053 | | | 1,076 | |
| Inventory | (123,076) | | | 13,144 | | | 17,228 | |
| Accounts payable and accrued expenses | 89,038 | | | 20,519 | | | 6,770 | |
| Operating leases | (13,808) | | | (11,698) | | | (11,698) | |
| Income taxes | (2,241) | | | 2,507 | | | 6,449 | |
| | | | | |
| Employee benefit plans | 1,245 | | | 604 | | | (1,443) | |
| Other, net | (10,200) | | | 6,950 | | | 5,696 | |
| Net cash flows from operating activities | 129,763 | | | 211,854 | | | 177,676 | |
| Cash flows from investing activities: | | | | | |
| Additions to property, plant, and equipment | (30,116) | | | (22,856) | | | (21,855) | |
| Proceeds from sale of property, plant, and equipment | 979 | | | 34 | | | 866 | |
| Cash paid for acquisitions, net of cash acquired | (235,701) | | | (55,915) | | | (20,827) | |
| | | | | |
| | | | | |
| Other, net | 33 | | | (74) | | | 10 | |
| Net cash flows from investing activities | (264,805) | | | (78,811) | | | (41,806) | |
| Cash flows from financing activities: | | | | | |
| Proceeds from issuance of debt | 321,299 | | | 117,758 | | | 264,389 | |
| Repayment of debt | (226,583) | | | (138,831) | | | (355,332) | |
| Proceeds from issuance of common stock | 15,524 | | | 3,721 | | | 3,194 | |
| | | | | |
| Purchases of common stock | (25,949) | | | (19,553) | | | (10,741) | |
| Dividends paid | (33,398) | | | (29,675) | | | (27,671) | |
| Purchase of redeemable noncontrolling shares | — | | | — | | | (487) | |
| | | | | |
| Net cash flows from financing activities | 50,893 | | | (66,580) | | | (126,648) | |
| Effect of exchange rate changes on cash | (6,102) | | | (81) | | | (3,990) | |
| Net change in cash and equivalents | (90,251) | | | 66,382 | | | 5,232 | |
| Cash and equivalents at beginning of period | 130,787 | | | 64,405 | | | 59,173 | |
| | | | | |
| Cash and equivalents at end of period | $ | 40,536 | | | $ | 130,787 | | | $ | 64,405 | |
| | | | | |
| | | | | |
| | | | | |
| Cash paid for income taxes, net of refunds | $ | 37,387 | | | $ | 23,869 | | | $ | 16,949 | |
| Cash paid for interest | $ | 5,192 | | | $ | 4,695 | | | $ | 8,388 | |
| | | | | |
| Non-cash items: | | | | | |
| Additions to property, plant, and equipment, not yet paid | $ | 1,454 | | | $ | 1,059 | | | $ | 1,509 | |
| Right-of-Use Assets obtained in exchange for new operating lease liabilities | $ | 19,627 | | | $ | 15,421 | | | $ | 4,922 | |
| Payable to sellers of acquired entities | $ | 4,000 | | | $ | — | | | $ | 845 | |
| | | | | | | | | | | |
| (In thousands, except per share amounts) | 2023 | | 2022 |
| ASSETS | | | |
| Current assets: | | | |
| Cash and cash equivalents | $ | 84,963 | | | $ | 45,790 | |
| Receivables, less allowances of $3,594 and $4,211, respectively | 222,418 | | | 230,404 | |
| Inventories: | | | |
| Raw material | 176,706 | | | 196,876 | |
| Work-in-process | 26,880 | | | 30,276 | |
| Finished goods | 305,110 | | | 317,828 | |
| Total inventories | 508,696 | | | 544,980 | |
| Other current assets | 37,718 | | | 36,916 | |
| Total current assets | 853,795 | | | 858,090 | |
| Property, plant, and equipment, at cost: | | | |
| Land and buildings | 167,028 | | | 159,253 | |
| Machinery and equipment | 316,227 | | | 297,496 | |
| Furniture and fixtures | 56,997 | | | 50,264 | |
| Other | 59,747 | | | 50,249 | |
| Property, plant, and equipment, gross | 599,999 | | | 557,262 | |
| Less: Allowance for depreciation | (370,260) | | | (342,108) | |
| Property, plant, and equipment, net | 229,739 | | | 215,154 | |
| Lease right-of-use assets, net | 57,014 | | | 48,948 | |
| | | |
| Deferred income taxes | 8,758 | | | 6,778 | |
| Intangible assets, net | 230,027 | | | 231,275 | |
| Goodwill | 342,404 | | | 328,046 | |
| Other assets | 6,385 | | | 5,910 | |
| Total assets | $ | 1,728,122 | | | $ | 1,694,201 | |
| LIABILITIES AND EQUITY | | | |
| Current liabilities: | | | |
| Accounts payable | $ | 152,419 | | | $ | 139,266 | |
| Accrued expenses and other current liabilities | 100,249 | | | 120,555 | |
| Current lease liability | 17,316 | | | 15,959 | |
| Income taxes | 4,700 | | | 3,233 | |
| Current maturities of long-term debt and short-term borrowings | 12,355 | | | 126,756 | |
| Total current liabilities | 287,039 | | | 405,769 | |
| Long-term debt | 88,056 | | | 89,271 | |
| Long-term lease liability | 38,549 | | | 32,858 | |
| Income taxes payable non-current | 4,837 | | | 8,707 | |
| Deferred income taxes | 29,461 | | | 29,744 | |
| Employee benefit plans | 35,973 | | | 31,889 | |
| Other long-term liabilities | 33,914 | | | 25,209 | |
| Commitments and contingencies (see Note 16) | | | |
| Redeemable noncontrolling interest | 1,145 | | | 620 | |
| Shareholders’ equity: | | | |
| Common stock (65,000 shares authorized, $0.10 par value) outstanding (46,067 and 46,193, respectively) | 4,607 | | | 4,619 | |
| Additional paid-in capital | 344,717 | | | 325,426 | |
| Retained earnings | 1,078,512 | | | 969,261 | |
| Accumulated other comprehensive loss | (221,114) | | | (231,448) | |
| Total shareholders’ equity | 1,206,722 | | | 1,067,858 | |
| Noncontrolling interest | 2,426 | | | 2,276 | |
| Total equity | 1,209,148 | | | 1,070,134 | |
| Total liabilities and equity | $ | 1,728,122 | | | $ | 1,694,201 | |
See Notes to Consolidated Financial Statements.
FRANKLIN ELECTRIC CO., INC. AND CONSOLIDATED SUBSIDIARIES
CONSOLIDATED STATEMENTS OF CASH FLOWS | | | | | | | | | | | | | | | | | |
| (In thousands) | 2023 | | 2022 | | 2021 |
| Cash flows from operating activities: | | | | | |
| Net income | $ | 194,734 | | | $ | 188,811 | | | $ | 154,975 | |
| Adjustments to reconcile net income to net cash flows from operating activities: | | | | | |
| Depreciation and amortization | 52,260 | | | 50,374 | | | 44,572 | |
| Non-cash lease expense | 18,852 | | | 17,406 | | | 13,808 | |
| Share-based compensation | 10,133 | | | 10,973 | | | 11,731 | |
| | | | | |
| Deferred income taxes | (1,609) | | | (1,230) | | | 126 | |
| (Gain)/Loss on disposals of plant and equipment | (256) | | | 1,285 | | | (269) | |
| | | | | |
| Gain from bargain purchase of business | — | | | — | | | (6,482) | |
| Foreign exchange expense | 12,124 | | | 7,236 | | | 2,269 | |
| | | | | |
| Changes in assets and liabilities, net of acquisitions: | | | | | |
| Receivables | 19,150 | | | (44,800) | | | (31,925) | |
| Inventory | 48,176 | | | (101,080) | | | (123,076) | |
| Accounts payable and accrued expenses | (23,085) | | | (12,283) | | | 89,038 | |
| Operating leases | (18,874) | | | (17,406) | | | (13,808) | |
| Income taxes | (1,524) | | | (679) | | | (2,241) | |
| Income taxes-U.S. Tax Cuts and Jobs Act | (2,902) | | | (355) | | | — | |
| Employee benefit plans | 1,458 | | | 3,488 | | | 1,245 | |
| Other, net | 7,073 | | | (66) | | | (10,200) | |
| Net cash flows from operating activities | 315,710 | | | 101,674 | | | 129,763 | |
| Cash flows from investing activities: | | | | | |
| Additions to property, plant, and equipment | (41,415) | | | (41,903) | | | (30,116) | |
| Proceeds from sale of property, plant, and equipment | 1,494 | | | 6 | | | 979 | |
| Cash paid for acquisitions, net of cash acquired | (34,831) | | | (1,186) | | | (235,701) | |
| | | | | |
| | | | | |
| Other, net | 463 | | | 9 | | | 33 | |
| Net cash flows from investing activities | (74,289) | | | (43,074) | | | (264,805) | |
| Cash flows from financing activities: | | | | | |
| Proceeds from issuance of debt | 443,217 | | | 477,558 | | | 321,299 | |
| Repayments of debt | (558,746) | | | (448,622) | | | (226,583) | |
| Proceeds from issuance of common stock | 9,193 | | | 3,859 | | | 15,524 | |
| | | | | |
| Purchases of common stock | (43,332) | | | (40,490) | | | (25,949) | |
| Dividends paid | (41,723) | | | (36,991) | | | (33,398) | |
| | | | | |
| Deferred payments for acquisitions | (802) | | | (3,786) | | | — | |
| Net cash flows from financing activities | (192,193) | | | (48,472) | | | 50,893 | |
| Effect of exchange rate changes on cash and cash equivalents | (10,055) | | | (4,874) | | | (6,102) | |
| Net change in cash and cash equivalents | 39,173 | | | 5,254 | | | (90,251) | |
| Cash and cash equivalents at beginning of period | 45,790 | | | 40,536 | | | 130,787 | |
| | | | | |
| Cash and cash equivalents at end of period | $ | 84,963 | | | $ | 45,790 | | | $ | 40,536 | |
| | | | | |
| | | | | |
| | | | | |
| Cash paid for income taxes, net of refunds | $ | 55,120 | | | $ | 48,335 | | | $ | 37,387 | |
| Cash paid for interest | $ | 12,115 | | | $ | 11,209 | | | $ | 5,192 | |
| | | | | |
| Non-cash items: | | | | | |
| Additions to property, plant, and equipment, not yet paid | $ | 2,229 | | | $ | 628 | | | $ | 1,454 | |
| Lease right-of-use assets obtained in exchange for new operating lease liabilities | $ | 25,899 | | | $ | 17,599 | | | $ | 19,627 | |
| Payable to sellers of acquired entities | $ | 7,027 | | | $ | 354 | | | $ | 4,000 | |
| Payable for share repurchases | $ | — | | | $ | 1,083 | | | $ | — | |
| Non-cash investment to acquire property in lieu of cash payment for products provided | $ | 419 | | | $ | — | | | $ | — | |
| Accrued dividends payable to noncontrolling interests | $ | 821 | | | $ | — | | | $ | — | |
See Notes to Consolidated Financial Statements.
FRANKLIN ELECTRIC CO., INC. AND CONSOLIDATED SUBSIDIARIES
CONSOLIDATED STATEMENTS OF EQUITY | | Total Shareholders’ Equity | |
| (In thousands) | |
| (In thousands) | |
| (In thousands) | | Common Shares
Outstanding | | Common Stock | | Additional Paid-in Capital | | Retained Earnings | | Accumulated Other Comprehensive Income/(Loss) | | Noncontrolling
Interest | | Redeemable Noncontrolling Interest |
| Balance as of year-end 2020 | |
| Net Income | |
| Currency translation adjustment | |
| Pension and other post retirement plans, net of tax expense $1,458 | |
| | | Total Shareholders’ Equity | |
| (In thousands) | Common Shares
Outstanding | | Common Stock | | Additional Capital | | Retained Earnings | | Accumulated Other Comprehensive Income/(Loss) | | Noncontrolling
Interest | | Redeemable Noncontrolling Interest |
| Balance as of year end 2018 | 46,326 | | | $ | 4,632 | | | $ | 257,535 | | | $ | 654,724 | | | $ | (183,019) | | | $ | 1,955 | | | $ | 518 | |
| Net Income | | 95,483 | | | 842 | | | (326) | |
| Currency translation adjustment | | (5,687) | | | (31) | | | 59 | |
| Minimum pension liability adjustment, net of tax benefit $589 | | (1,504) | | |
| | Dividends on common stock ($0.70/share) | |
| | Purchase of redeemable non-controlling shares | | (487) | |
| Dividends on common stock ($0.5800/share) | | (27,029) | | |
| Noncontrolling Dividend | | (642) | | |
| Dividends on common stock ($0.70/share) | |
| | Dividends on common stock ($0.70/share) | |
| Dividend to noncontrolling interest | |
| Common stock issued | Common stock issued | 152 | | | 15 | | | 3,179 | | |
| Share based compensation | Share based compensation | 146 | | | 15 | | | 8,942 | | |
| Common stock repurchased | Common stock repurchased | (233) | | | (23) | | | (10,718) | | |
| Balance as of year end 2019 | 46,391 | | | $ | 4,639 | | | $ | 269,656 | | | $ | 712,460 | | | $ | (190,210) | | | $ | 2,124 | | | $ | (236) | |
| Balance as of year-end 2021 | |
| Net Income | Net Income | | 100,460 | | | 718 | | | (21) | |
| Currency translation adjustment | Currency translation adjustment | | (11,984) | | | 104 | | | 12 | |
| Minimum pension liability adjustment, net of tax benefit $1,112 | | (2,577) | | |
| Pension and other post retirement plans, net of tax expense $3,647 | |
| | Purchase of redeemable non-controlling shares | | — | |
| Dividends on common stock ($0.6200/share) | | (28,845) | | |
| Noncontrolling Dividend | | (830) | | |
| | Dividends on common stock ($0.78/share) | |
| | Dividends on common stock ($0.78/share) | |
| | Dividends on common stock ($0.78/share) | |
| Dividend to noncontrolling interest | |
| Common stock issued | Common stock issued | 121 | | | 12 | | | 3,709 | | |
| Share based compensation | Share based compensation | 112 | | | 11 | | | 10,055 | | |
| Common stock repurchased | Common stock repurchased | (402) | | | (40) | | | (19,513) | | |
| Balance as of year end 2020 | 46,222 | | | $ | 4,622 | | | $ | 283,420 | | | $ | 764,562 | | | $ | (204,771) | | | $ | 2,116 | | | $ | (245) | |
| Balance as of year-end 2022 | |
| Net Income | Net Income | | 153,860 | | | 899 | | | 216 | |
| Currency translation adjustment | Currency translation adjustment | | (27,400) | | | (144) | | | 10 | |
| Minimum pension liability adjustment, net of tax expense $1,458 | | 3,590 | | |
| Pension and other post retirement plans, net of tax benefit $643 | |
| | Purchase of redeemable non-controlling shares | | — | |
| Dividends on common stock ($0.7000/share) | | (32,688) | | |
| Noncontrolling Dividend | | (710) | | |
| | Dividends on common stock ($0.90/share) | |
| | Dividends on common stock ($0.90/share) | |
| | Dividends on common stock ($0.90/share) | |
| Dividend to noncontrolling interest | |
| Common stock issued | Common stock issued | 440 | | | 44 | | | 15,480 | | |
| Share based compensation | Share based compensation | 140 | | | 14 | | | 11,717 | | |
| Common stock repurchased | Common stock repurchased | (319) | | | (32) | | | (25,917) | | |
| Balance as of year end 2021 | 46,483 | | | $ | 4,648 | | | $ | 310,617 | | | $ | 859,817 | | | $ | (228,581) | | | $ | 2,161 | | | $ | (19) | |
| Balance as of year-end 2023 | |
See Notes to Consolidated Financial Statements.
FRANKLIN ELECTRIC CO., INC. AND CONSOLIDATED SUBSIDIARIES
INDEX TO NOTES TO CONSOLIDATED FINANCIAL STATEMENTS
| | | | | | | | |
| Page Number |
| | |
| Note 1. | | |
| Note 2. | | |
| Note 3. | | |
| Note 4. | | |
| Note 5. | | |
| Note 6. | | |
| Note 7. | | |
| Note 8. | | |
| Note 9. | | |
| Note 10. | | |
| Note 11. | | |
| Note 12. | | |
| Note 13. | | |
| Note 14. | | |
| Note 15. | | |
| Note 16. | | |
NOTES TO CONSOLIDATED FINANCIAL STATEMENTS
1. SUMMARY OF SIGNIFICANT ACCOUNTING POLICIES
Company--“Franklin Electric” or the “Company” shall refer to Franklin Electric Co., Inc. and its consolidated subsidiaries.
Fiscal Year--The financial statements and accompanying notes are as of and for the years ended December 31, 2021,2023, December 31, 2020,2022, and December 31, 2019,2021, and referred to as 2021, 2020,2023, 2022, and 2019,2021, respectively.
Principles of Consolidation--The consolidated financial statements include the accounts of Franklin Electric Co., Inc. and its consolidated subsidiaries. All intercompany transactions have been eliminated.
Business Combinations--The Company allocates the purchase price of its acquisitions to the assets acquired, liabilities assumed, and noncontrolling interests based upon their respective fair values at the acquisition date. The Company utilizes management estimates and may use inputs from an independent third-party valuation firm to assist in determining these fair values. The excess of the acquisition price over estimated fair values of the net assets acquired is recorded as goodwill. Goodwill is adjusted for any changes to acquisition date fair value amounts made within the measurement period. Anyperiod, which may be up to one year from the acquisition date. If the preliminary, estimated fair values of the net assets acquired are in excess of the acquisition price, that represents a bargain purchase gain, and is recordedthe Company records this amount in "Accrued expenses and other current liabilities" line on the consolidated balance sheet until theit completes its determination of fair values is completed.for the net assets acquired. Once thethat fair value determination is completed, the bargain purchase gain is recognized on the consolidated statements of income in the "Other income/(expense), net" line.. Acquisition-related transaction costs are recognized separately from the business combination and expensed as incurred.
Revenue Recognition--Revenue is recognized when promised goods or services are transferred to customers in an amount that reflects the consideration to which the entity expects to be entitled to in exchange for those goods or services. The promise in a contract to transfer goods or services to a customer represents a performance obligation. The Company typically sells its products to customers by purchase order and does not have any additional performance obligations included in contracts to customers other than the shipment of the products.customers. Shipping and handling activities are considered to be fulfillment activities and are not considered to be a separate performance obligation. Therefore, the Company allocates the transaction price based on a single performance obligation. The Company typically ships products FOBFree on Board (FOB) shipping point at which point control of the products passes to the customers. The Company considers the performance obligation satisfied and recognizes revenue at a point in time, the time of shipment. The Company applies a practical expedient to expense as incurred costs to obtain a contract with a customer when the amortization period would have been one year or less as well as applies the financing component practical expedient when the duration of the financing is one year or less.
The Company’s products may include routine assurance-type warranties which do not qualify as separate performance obligations. In the event that significant post-shipment obligations were to exist for the Company’s products, revenue recognition would be deferred until the performance obligations were satisfied.
The Company records net sales revenues after discounts at the time of sale based on specific discount programs in effect, related historical data, and experience.
Shipping and Handling Costs--Shipping and handling costs are considered activities required to fulfill the Company’s promise to transfer goods, and do not qualify as a separate performance obligation. Shipping and handling costs are recorded as a component of cost of sales.
Research and Development Expense--The Company’s research and development activities are charged to expense in the period incurred. The Company incurred expenses of approximately $17.7 million in 2023, $16.7 million in 2022, and $17.3 million in 2021 $21.7 million in 2020, and $20.8 million in 2019 related to research and development.
Cash and Cash Equivalents--The Company considers cash on hand, demand deposits, and highly liquid investments with an original maturity date of three months or less to be cash and cash equivalents.
Fair Value of Financial Instruments--Financial Accounting Standards Board (“FASB”) Accounting Standards Codification (“ASC”) Topic 820, Fair Value Measurements and Disclosures, provides guidance for defining, measuring, and disclosing fair value within an established framework and hierarchy. Fair--Fair value is defined as the exchange price that would be received for an asset or paid to transfer a liability (an exit price) in the principal or most advantageous market for the asset or liability in an orderly transaction between market participants on the measurement date. The standard established a fair value hierarchy which requires an entity to maximize the use of observable inputs and to minimize the use of unobservable inputs when measuring fair value. The three levels of inputs that may be used to measure fair value within the hierarchy are as follows:
Level 1 – Quoted prices for identical assets and liabilities in active markets;
Level 2 – Quoted prices for similar assets and liabilities in active markets, quoted prices for identical or similar assets and liabilities in markets that are not active, and model-derived valuations in which all significant inputs and significant value drivers are observable in active markets; and
Level 3 – Valuations derived from valuation techniques in which one or more significant inputs or significant value drivers are unobservable.
Accounts Receivable, Earned Discounts, and Allowance for Uncollectible Accounts--Accounts receivable are stated at estimated net realizable value. Accounts receivable are comprised of balances due from customers, net of earned discounts and estimated allowances for uncollectible accounts. Earned discounts are based on specific customer agreement terms. In determining allowances for uncollectible accounts, historical collection experience, current trends and reasonable, supportable future forecasts, aging of accounts receivable, and periodic credit evaluations of customers’ financial condition are reviewed.
Inventories--Inventories are stated at the lower of cost or market.net realizable value. The majority of the cost of domestic and foreign inventories is determined using the FIFOfirst in, first out (FIFO) method with a portion of inventory costs determined using the average cost method. The Company reviews its inventories for excess or obsolete products or components based on an analysis of historical usage and management’s evaluation of estimated future demand, market conditions, and alternative uses for possible excess or obsolete parts.
Property, Plant, and Equipment--Property, plant, and equipment are stated at historical cost. The Company capitalizes certain computer software and software development costs incurred in connection with developing or obtaining computer software for internal use, which are included in property, plant, and equipment. Depreciation of property, plant and equipment is calculated on a straight line basis over the following estimated useful lives:
| | | | | |
| Land improvement and buildings | 10 - 40 years |
| Machinery and equipment | 5 - 10 years |
| Software | 3 - 7 years |
| Furniture and fixtures | 3 - 7 years |
Maintenance, repairs, and renewals of a minor nature are expensed as incurred. Betterments and major renewals which extend the useful lives or add to the productive capacity of buildings, improvements, and equipment are capitalized. The Company reviews its property, plant, and equipment for impairment at the asset group level whenever events or changes in circumstances indicate that the carrying amount of such assets may not be recoverable. If an indicator is present, the Company compares carrying values to undiscounted future cash flows; if the undiscounted future cash flows are less than the carrying value, an impairment would be recognized for the difference between the fair value and the carrying value.
The Company’s depreciation expense was $35.1 million, $33.1 million, and $30.2 million $27.1 million,in 2023, 2022, and $27.6 million in 2021, 2020, and 2019, respectively.
Leases--The Company determines if an arrangement is a lease, or contains a lease, at the inception of the arrangement and determines whether it is an operating or financing lease. Operating and financing leases result in the Company recording a right-of-use ("ROU") asset, current lease liability, and long term lease liability on its balance sheet. The Company has elected to not present leases with an initial term of 12 months or less on the balance sheet. The ROU assets and liabilities are initially recognized based on the present value of lease payments over the lease term. Initial direct costs and lease incentives are generally not material when measuring the ROU asset present value. Lease expense for operating lease payments is recognized on a straight-line basis over the lease term.
In determining the present value, the Company utilizes interest rates from lease agreements unless the lease agreement does not provide a readily determinable rate. In these instances, the Company utilizes its incremental borrowing rate based on the Company’s borrowing information available at inception. A portion of the Company’s leases include renewal options. The Company excludes these renewal options in the expected lease term unless the Company is reasonably certain that the option will be exercised. In addition, the Company has elected not to separate non-lease components from lease components.
Goodwill and Other Intangible Assets--Goodwill is tested at the reporting unit level, which the Company has determined to be the Global Water Systems, Fueling Systems, and Distribution units.
level. In assessing the recoverability of goodwill, the Company determines the fair value of its reporting units by utilizing a combination of both the income and market valuation approaches. The income approach estimates fair value based upon future revenue, expenses, and cash flows discounted to present value. The market valuation approach estimates fair value using market multipliers of various financial measures compared to a set of comparable public companies. The fair value calculated for each reporting unit is considered a Level 3 measurement within the fair value hierarchy. An indication of impairment exists if the carrying value of the reporting unit is higher than its fair value, as determined by the above approach.value. The Company will test goodwill for impairment more frequently if warranted by triggering events that indicate potential impairment. The Company completed its annual goodwill impairment test during the fourth quarter, using balances as of October 1.
The Company also tests indefinite livedindefinite-lived intangible assets, primarily trade names, for impairment on an annual basis during the fourth quarter of each year, using balances as of October 1, or more frequently as warranted by triggering events that indicate potential impairment. In assessing the recoverability of the trade names, the Company determines the fair value using an income approach. The income approach estimates fair value based upon future revenue and estimated royalty rates.rates, discounted to present value. The fair value calculated for indefinite livedindefinite-lived intangible assets is considered a Level 3 measurement within the fair value hierarchy. An indication of impairment exists if the carrying value of the trade names is higher than the fair value. Thevalue, and the Company would record an impairment charge for the difference.
Amortization is recorded and calculated for definite liveddefinite-lived intangible assets on a basis that reflects cash flows over the estimated useful lives. The weighted average number of yearsestimated useful lives over which each intangible class is amortized is as follows:
| | | | | |
| Customer relationships | 13 - 20 years |
| Patents | 17 years |
| |
| Technology | 15 years |
| Trade names | 5 - 20 years |
| Other | 5 - 8 years |
Definite livedDefinite-lived intangible assets are evaluated for impairment whenever a triggering event, including a significant change in the use of the asset or unexpected change in financial condition, occurs that indicates the carrying value may be impaired. The Company tests for impairment at the asset group level by comparing the carrying value of an asset group that includes the applicable definite lived intangible asset(s) to that asset to thegroup's undiscounted future cash flows. An indication of impairment exists if the carrying value of the definite liveddefinite-lived intangible assetassets is higher than the fair value. Thevalue, and the Company would record an impairment charge for the difference.
Warranty Obligations--The Company provides warranties on most of its products. The warranty terms vary but are generally 2 years to 5 years from the date of manufacture or 1 year to 5 years from the date of installation. Provisions for estimated expenses related to product warranty are made at the time products are sold or when specific warranty issues are identified. These estimates are established using historical information about the nature, frequency, and average cost of warranty claims. The Company actively studies trends of warranty claims and takes actions to improve product quality and minimize warranty claims. The Company believes that the warranty reserve is appropriate; however, actual claims incurred could differ from the original estimates, requiring adjustments to the reserve.
Income Taxes--Income taxes are accounted for in accordance with FASB ASC Topic 740, Income Taxes. Under this guidance, deferred--Deferred tax assets and liabilities are determined based on the difference between the financial statement and tax basis of assets and liabilities and net operating loss and credit carry forwards using enacted tax rates in effect for the year in which the differences are expected to reverse. Valuation allowances are established when necessary to reduce deferred tax assets to the amounts expected to be realized. The Company records a liability for uncertain tax positions by establishing a more likely than not recognition threshold and measurement attribute for recognition and measurement of a tax position taken or expected to be taken in a tax return.
Defined Benefit Plans--The Company makes its determination for pension, post retirement, and post employment benefit plans liabilities based on management estimates and consultation with actuaries. The Company incorporates estimates and assumptions of future plan service costs, future interest costs on projected benefit obligations, rates of compensation increases, employee turnover rates, anticipated mortality rates, expected investment returns on plan assets, asset allocation assumptions of plan assets, and other factors.
Earnings Per Common Share--Basic and diluted earnings per share are computed and disclosed in accordance with FASB ASC Topic 260, Earnings Per Share. The--The Company utilizes the two-class method to compute earnings available to common shareholders. Under the two-class method, earnings are adjusted by accretion amounts to redeemable noncontrolling interests recorded at redemption value. The adjustments represent dividend distributions, in substance, to the noncontrolling interest
holder as the holders have contractual rights to receive an amount upon redemption other than the fair value of the applicable shares. As a result, earnings are adjusted to reflect this in substance distribution that is different from other common shareholders. In addition, the Company allocates net earnings to each class of common stock and participating security as if all of the net earnings for the period had been distributed. The Company’s participating securities consist of share-based payment awards that contain a non-forfeitable right to receive dividends and therefore are considered to participate in undistributed earnings with common shareholders. Basic earnings per common share excludes dilution and is calculated by dividing net earnings allocated to common shares by the weighted-average number of common shares outstanding for the period. Diluted earnings per common share is calculated by dividing net earnings allocable to common shares by the weighted-average number of common shares outstanding for the period, as adjusted for the potential dilutive effect of non-participating share-based awards.awards and non-employee deferred shares.
Translation of Foreign Currency Financial Statements--All assets and liabilities of foreign subsidiaries in a functional currency other than the U.S. dollar are translated at year end exchange rates with the exception of the non-monetary assets and liabilities in countries with highly inflationary economies, which are translated at historicalyear-end exchange rates. All revenue and expense accounts are translated at average rates in effect during the respective period with the exception of expenses related to the non-monetary assets and liabilities, which are translated at historical exchange rates. Adjustments for translating longer term foreign currency assets and liabilities in U.S. dollars are included as a component of other comprehensive income except for hyperinflation accounting adjustments.period. Transaction gains and losses that arise from shorter term exchange rate fluctuations and hyperinflationhighly inflationary accounting adjustments are included in the “Foreign exchange income/(expense)” lineexpense” within the Company’s consolidated statements of income, as incurred.
In the second quarter of 2022, the Company concluded that Turkey represents a highly inflationary economy as its three-year cumulative inflation rate exceeded 100 percent. As a result, the Company started remeasuring the financial statements for the Company’s Turkish operations in accordance with the highly inflationary accounting rules in FASB ASC 830, Foreign Currency Matters, as of April 1, 2022. As a result, all gains and losses resulting from the remeasurement of the financial results of operations and other transactional foreign exchange gains and losses are reflected in earnings rather than as a component of the Company’s comprehensive income within shareholders’ equity. Additionally, the Company’s operations in Argentina have also been accounted for using the highly inflationary accounting rules since the date they were acquired in 2018.
Significant Estimates--The preparation of financial statements in conformity with accounting principles generally accepted in the United States requires management to make significant estimates and assumptions that affect the reported amounts of assets and liabilities and disclosure of contingent assets and liabilities at the date of the financial statements and the reported amounts of expenses during the reporting periods. Significant estimates and assumptions by management affect inventory valuation, warranty, trade names and goodwill, income taxes, and pension and employee benefit obligations.
Although the Company regularly assesses these estimates, actual results could materially differ. The Company bases its estimates on historical experience and various other assumptions that it believes to be reasonable under the circumstances.
2. ACCOUNTING PRONOUNCEMENTS
Adoption of New Accounting Standards
In AugustOctober 2021, the Financial Accounting Standards Board ("FASB") issued Accounting Standards Update ("ASU") 2021-06, Presentation of Financial Statements (Topic 205), Financial Services—Depository and Lending (Topic 942), and Financial Services— Investment Companies (Topic 946): Amendments to SEC Paragraphs Pursuant to SEC Final Rule Releases No. 33-10786, Amendments to Financial Disclosures about Acquired and Disposed Businesses, and No. 33-10835, Update of Statistical Disclosures for Bank and Savings and Loan Registrants. This update amends certain SEC disclosure guidance that is included in the accounting standards codification to reflect the SEC’s recent issuance of rules intended to modernize and streamline disclosure requirements, including updates to business acquisition and disposition significance tests used, the significance thresholds for proforma statement disclosures, the number of preceding years of financial statements required for disclosure as well as other provisions in the SEC releases. The Company adopted the SEC’s guidance on January 1, 2021, the effective date of the release, relating to the amendments to financial disclosures about acquired and disposed businesses, and it did not have a material impact on the Company's consolidated financial position, results of operations, or cash flows.
In March 2020, the FASB issued ASU 2020-04, Facilitation of the Effects of Reference Rate Reform on Financial Reporting, which provides optional expedients and exceptions for applying U.S. generally accepted accounting principles to contracts, hedging relationships, and other transactions affected by the discontinuation of the London Interbank Offered Rate ("LIBOR") and other reference rates which are expected to be discontinued due to reference rate reform. ASU 2020-04 is effective on a prospective basis between March 12, 2020 and December 31, 2022. The Company adopted the standard effective January 1, 2021, and it did not have a material impact on the Company's consolidated financial position, results of operations, or cash flows.
In December 2019, the FASB issued ASU 2019-12, Income Taxes (Topic 740): Simplifying the Accounting for Income Taxes, which is expected to reduce cost and complexity related to accounting for income taxes. ASU 2019-12 eliminates the need for the Company to analyze whether certain exceptions apply and improves financial statement preparers' application of income tax-related guidance. ASU 2019-12 is effective for interim and annual periods beginning after December 15, 2020 with early adoption permitted. Amendments related to franchise taxes that are partially based on income should be applied on either a retrospective or modified retrospective basis. All other amendments should be applied on a prospective basis. The Company
adopted the standard effective January 1, 2021, and it did not have a material impact on the Company's consolidated financial position, results of operations, or cash flows.
Accounting Standards Issued But Not Yet Adopted
In August 2020, the FASB issued ASU 2020-06, Debt – Debt with Conversion and Other Options (Subtopic 470-20) and Derivatives and Hedging – Contracts in Entity’s Own Equity (Subtopic 815-40): Accounting for Convertible Instruments and Contracts in an Entity’s Own Equity. ASU 2020-06 reduces the number of accounting models for various convertible instruments and reduces form-over-substance-based accounting conclusions for the derivatives scope exception for contracts in an entity’s own equity. The FASB also updated Earnings Per Share (“EPS”) guidance under Topic 260 by requiring an entity to consider the potential effect of share settlement in the diluted EPS calculation for instruments that may be settled in cash or shares as well as other amendments. ASU 2020-06 is effective for interim and annual periods beginning after December 15, 2021 with early adoption permitted but no earlier than fiscal years beginning after December 15, 2020. The guidance should be adopted at the beginning of a fiscal year. ASU 2020-06 should be applied on either a retrospective or modified retrospective basis. The Company is planning to adopt on January 1, 2022, but does not expect the ASU to have a material impact on the Company's consolidated financial position, results of operations, or cash flows.
In October 2021, the FASB issued ASU 2021-08, Business Combinations (Topic 805): Accounting for Contract Assets and Contract Liabilities from Contracts with Customers. ASU 2021-08 requires entities to recognize and measure contracts on the acquisition date in accordance with ASC 606, Revenue from Contracts with Customers, as if it had originated the contracts. This will improve comparability after the business combination by providing consistent recognition and measurement guidance for revenue contracts with customers acquired in a business combination and revenue contracts with customers not acquired in a business combination. ASU 2021-08 is effective for interim and annual periods beginning after December 15, 2022 with early adoption permitted. ASU 2021-08 should be applied on a prospective basis to business combinations that occur after the effective date. The Company adopted this ASU on January 1, 2023, and it did not have a material impact on the Company's consolidated financial position, results of operations, or cash flows.
In September 2022, the FASB issued ASU 2022-04, Liabilities - Supplier Finance Programs (Subtopic 405-50): Disclosure of Supplier Finance Program Obligations. ASU 2022-04 creates the obligation for a company that uses a supplier finance program to purchase goods or services to disclose qualitative and quantitative information about its supplier finance program(s). This will allow financial statement users to better consider the effect of the program(s) on the entity's working capital, liquidity and cash flow over time. ASU 2022-04 is effective for fiscal years beginning after December 15, 2022, including interim periods within those fiscal years, except for the amendment on rollforward information, which is effective for fiscal years beginning after December 15, 2023 with early adoption permitted. ASU 2022-04 should be applied retrospectively to each period in which a balance sheet is presented except for the amendment on rollforward information, which should be applied prospectively. The Company adopted this ASU on January 1, 2023, and it did not have a material impact on the Company's consolidated financial position, results of operations, or cash flows, as the Company has no amounts outstanding under its current supplier finance program.
Accounting Standards Issued But Not Yet Adopted
In November 2023, the FASB issued ASU 2023-07, Segment Reporting (Topic 280): Improvements to Reportable Segment Disclosures. ASU 2023-07 is intended to improve reportable segment disclosure requirements, primarily through additional and more detailed information about a reportable segment's expenses. ASU 2023-07 is effective for fiscal years beginning after
December 15, 2023, and interim periods within fiscal years beginning after December 15, 2024, with early adoption permitted. The guidance is to be applied retrospectively to all prior periods presented in the financial statements. The Company is still determining the date of adoption for this ASU, but does not anticipate the adoption to have a material impact on the Company's consolidated financial position, resultsdisclosures.
In December 2023, the FASB issued ASU 2023-09, Income Taxes (Topic 740): Improvements to Income Tax Disclosures. ASU 2023-09 is intended to enhance the transparency and decision usefulness of income tax disclosures. This amendment modifies the rules on income tax disclosures to require entities to disclose (1) specific categories in the rate reconciliation and additional information for reconciling items that meet a quantitative threshold, (2) the amount of income taxes paid (net of refunds received) (disaggregated by federal, state, and foreign taxes) as well as individual jurisdictions in which income taxes paid is equal to or greater than 5 percent of total income taxes paid net of refunds, (3) the income or loss from continuing operations before income tax expense or cash flows.benefit (disaggregated between domestic and foreign) and (4) income tax expense or benefit from continuing operations (disaggregated by federal, state and foreign). ASU 2023-09 is effective for annual periods beginning after December 15, 2024, with early adoption permitted. ASU 2023-09 should be applied on a prospective basis, while retrospective application is permitted. The Company is still determining the date of adoption for this ASU, but does not anticipate the adoption to have a material impact on the Company's financial disclosures.
3. ACQUISITIONS
2023
During the fourth quarter ended December 31, 2023, the Company acquired substantially all of the assets of Aqua Systems of Fort Myers, a water treatment systems distributor. In another separate transaction, the Company acquired substantially all of the assets of Action Manufacturing and Supply, Inc., a water treatment equipment provider located in southwest Florida. The Company also acquired, in a separate transaction, substantially all of the assets of LCA Pump, LLC, which operates Water Works Pump, a Missouri based professional groundwater distributor. The combined, all-cash purchase price for the acquisitions in the fourth quarter of 2023, was $34.9 million, including contingent consideration with an estimated fair value of $3.0 million, after purchase price adjustments based on the level of working capital acquired. The fair value of the assets acquired and liabilities assumed for all acquisitions is preliminary as of December 31, 2023.
During the first quarter ended March 31, 2023, the Company acquired substantially all of the assets of Phil-Good Products, Inc. ("Phil-Good"). Phil-Good is an injection molded plastics component manufacturer. In another separate transaction in the first quarter of 2023, the Company acquired 100 percent of the ownership interests of Hydropompe S.r.l. ("Hydropompe"). Hydropompe is a pump manufacturer with a focus in dewatering and sewage products. The combined, all-cash purchase price for both acquisitions in the first quarter of 2023 was $8.7 million after purchase price adjustments based on the level of working capital acquired. The fair value of the assets acquired and liabilities assumed for both acquisitions is preliminary as of December 31, 2023.
The Company has not presented separate results of operations of the acquired companies since the closing of the acquisitions or combined pro forma financial information of the Company and the acquired interests since the beginning of 2022, as the results of operations for all acquisitions in 2023 are immaterial.
2022
During the fourth quarter ended December 31, 2022, the Company acquired 100 percent of the ownership interests of Casper Well Products ("Casper") for a purchase price of $2.0 million after working capital adjustments. Casper conducts the sale and distribution of pumps, drilling equipment, tanks, pipe, accessories and other equipment used in drilling water wells and distribution of water-related products. The fair value of the assets acquired and liabilities assumed is final as of December 31, 2023. In addition, the Company has not presented separate results of operations of the acquired company since the closing of the acquisition or combined pro forma financial information of the Company and the acquired interest since the beginning of 2021, as the results of operations for this acquisition are immaterial.
2021
During the fourth quarter ended December 31, 2021, the Company acquired 100 percent of the ownership interests of B&R Industries, Inc. ("B&R"), a water treatment equipment provider located in Mesa, Arizona, for a cash purchase price of $16.2$16.3 million after purchase price adjustments based on the level of working capital acquired. B&R will be included as part of the Water Systems segment of the Company. The Company also acquired, in a separate transaction, 100 percent of the ownership interests of Blake Group Holdings, Inc. ("Blake"), a professional groundwater distributor operating in the northeast United States for a cash purchase price of $28.6$28.5 million after purchase price adjustments based on the level of working capital acquired. Blake will beis included as part of the Distribution segment of the Company. The fair value of the assets acquired and liabilities assumed for both acquisitions is preliminarywere considered final as of December 31, 2021.2022.
During the third quarter ended September 30, 2021, the Company acquired 100 percent of the ownership interests of Minetuff Dewatering Pumps Australia Pty Ltd ("Minetuff") for a cash purchase price of $13.7 million after purchase price adjustments based on the level of working capital acquired. Minetuff manufactures and sells submersible pumps, spare parts, and accessories to the mining industry and will expandexpands the Company’s existing product offerings and channel access in the Water Systems segment. The fair value of the assets acquired and liabilities assumed for the acquisition is preliminarywere considered final as of December 31, 2021.September 30, 2022.
During the second quarter ended June 30, 2021, the Company acquired, in separate transactions, 100 percent of the ownership interests of Puronics, Inc. and its wholly owned subsidiaries ("Puronics"), headquartered in Livermore, California, and 100 percent of the ownership interests of New Aqua, LLC ("New Aqua") and its wholly owned subsidiaries, headquartered in Indianapolis, Indiana. Both Puronics and New Aqua are water treatment equipment providers and are included as a part of the Water Systems segment of the Company. In a separate transaction during the second quarter ended June 30, 2021, the Company acquired all of the assets of Power Integrity Services, LLC, a North Carolina-based company, which is included in the Fueling Systems segment of the Company.
In another separate transaction during the second quarter ended June 30, 2021, the Company acquired all of the assets of Atlantic Turbine Pump, LLC, a Georgia-based company, which is included in the Distribution segment of the Company. As of December 31, 2021, theThe Company has recorded estimated fair values that exceedexceeded the acquisition price by $0.4 million, representing a bargain purchase gain due to favorable market conditions that was recorded within the "Other income/(expense), net" line in the consolidated statements of income for the year ended December 31, 2021.
The combined, all-cash purchase price for all acquisitions in the second quarter of 2021 was $185.5 million after purchase price adjustments based on the level of working capital acquired. The fair value of the assets acquired and liabilities assumed for all acquisitions are preliminarywere considered final as of December 31, 2021.June 30, 2022.
The identifiable intangible assets recognized in the separate transactions in 2021 were $131.9$132.1 million and consist primarily of customer relationships and trade names from New Aqua of $93.7$93.2 million. The intangible assets will beare being amortized using the straight-line method over 12 - 20 years.
The goodwill of $65.9$66.0 million resulting from the acquisitions in 2021 consists primarily of expanded geographical presence and product channel expansion. Goodwill deductible for tax purposes is $62.1$62.7 million from the acquisitions in 2021. Goodwill was recorded in the Water Systems, Fueling Systems, and Distribution segments (see Note 6 - Goodwill and Other Intangible Assets).
The preliminaryfinal purchase price assigned to the major identifiable assets acquired and liabilities assumed for all acquisitions in 2021 on an aggregated basis is as follows:
| | | | | | | | |
| (In millions) | | |
| Assets: | | |
| Inventory | | $ | 34.7034.3 | |
| Intangible assets | | 131.9132.1 |
| Goodwill | | 65.966.0 |
| Other assets | | 38.539.0 |
| Total assets | | 271.0271.4 |
| Liabilities | | 26.627.0 |
| Less: Bargain purchase gain | | 0.4 |
| Total consideration paid | | $ | 244.0 | |
For all acquisitions in 2021, aggregated annual revenue for the full year 2020 was $191.3 million, which would be incremental to the Company's revenue had the acquisitions occurred on the first day of 2020. Since acquisition in 2021, aggregate revenue was $72.5 million.million for the year ended December 31, 2021. The Company has not presented separate results of operations since closing or combined pro forma financial information of the Company and the acquired interest since the beginning of 2020, as the results of operations for all acquisitions is immaterial to the Company's consolidated financials.
2020
During the fourth quarter ended December 31, 2020, the Company acquired 100 percent of the ownership interests of Gicon Pumps & Equipment, Inc., a professional groundwater distributor operating seven locations in the state of Texas for a purchase price of $28.1 million after working capital adjustments. The fair value of the assets acquired and liabilities assumed exceeded the purchase price by $6.1 million, representing a bargain purchase gain. This gain was attributable to favorable market conditions and is recorded within the "Other income/(expense), net" line in the consolidated statements of income for the year ended December 31, 2021. In a separate transaction during the fourth quarter ended December 31, 2020, the Company acquired 100 percent of the ownership interests in Waterite Inc. and its affiliate Waterite America Inc., headquartered in Winnipeg, Manitoba, Canada, for a purchase price of $21.9 million after working capital adjustments. The fair value of the assets acquired and liabilities assumed for both acquisitions were considered final as of December 31, 2021. In addition, the Company has not presented separate results of operations since closing or combined pro forma financial information of the Company and the acquired interest since the beginning of 2020, as the results of operations for both acquisitions is immaterial to the Company's consolidated financials.
During the first quarter ended March 31, 2020, the Company acquired all of the assets of a company that manufactures line shaft turbines and other adjacent product lines for a purchase price of $5.9 million after working capital adjustments. The fair value of the assets acquired and liabilities assumed were considered final as of March 31, 2021. In addition, the Company has not presented separate results of operations since closing or combined pro forma financial information of the Company and the acquired interest since the beginning of 2020, as the results of operations for this acquisition is immaterial.
The identifiable intangible assets recognized in the separate transactions in 2020 were $14.9 million, and consist primarily of customer relationships, which will be amortized utilizing the straight-line method over 15 years.
The goodwill of $10.2 million resulting from the separate acquisitions in 2020 consists primarily of the benefits of complementary product offerings and expanded geographical presence. Goodwill was recorded in the Water segment (see Note 6 - Goodwill and Other Intangible Assets), and only a portion ($1.4 million) is expected to be deductible for tax purposes.
2019
During the third quarter ended September 30, 2019, the Company acquired 100 percent of the ownership interests of First Sales, LLC, an Indiana manufacturer of water treatment and filtration equipment for the residential and commercial markets, which are sold through some of the same channels as other Company products in the Water Systems segment, for a purchase price of approximately $15.5 million after working capital adjustments. Goodwill resulting from the acquisition consists primarily of complementary product offerings. The Company has not presented separate results of operations since closing or combined pro forma financial information of the Company and the acquired interest since the beginning of 2019, as the results of operations for this acquisition is immaterial to the Company's consolidated financials. The fair value of the assets acquired and liabilities assumed were considered final as of September 30, 2020.
During the second quarter ended June 30, 2019, the Company acquired the remaining interest in Pluga Pumps and Motors Private Limited, India, increasing the Company's ownership to 100 percent. The redemption of this interest was immaterial.
During the first quarter ended March 31, 2019, the Company acquired 100 percent of the ownership interests of Mt. Pleasant, Michigan-based Milan Supply Company ("Milan Supply"), for a purchase price of approximately $6.1 million after working capital adjustments. Milan Supply is a professional groundwater distributor operating six locations in the State of Michigan. Milan Supply is part of the Company’s Distribution Segment, which is a collection of professional groundwater equipment distributors. The Company has not presented separate results of operations since closing or combined pro forma financial information of the Company and the acquired interest since the beginning of 2019, as the results of operations for this acquisition is immaterial to the Company's consolidated financials. The fair value of the assets acquired and the liabilities assumed for the acquisition were considered final as of March 31, 2020.
Transaction costs for all acquisition relatedacquisition-related activity were expensed as incurred under the guidance of FASB ASC Topic 805, Business Combinations. Transaction costs are included in selling,the "Selling, general, and administrative expense inexpenses" line of the Company’s consolidated statements of income and were $0.9$0.3 million, $0.0$0.2 million, and $0.2$0.9 million for the years ended 2021, 2020,December 31, 2023, 2022, and 2019,2021, respectively.
4. FAIR VALUE MEASUREMENTS
As of December 31, 20212023 and December 31, 2020,2022, the assets and liabilities measured at fair value on a recurring basis were as set forth in the table below:
|
(In millions) |
(In millions) | | December 31, 2021 | | Quoted Prices in Active Markets for Identical Assets (Level 1) | | Significant Other Observable Inputs (Level 2) | | Significant Unobservable Inputs (Level 3) |
(In millions) | | December 31, 2023 | | Quoted Prices in Active Markets for Identical Assets (Level 1) | | Significant Other Observable Inputs (Level 2) | | Significant Unobservable Inputs (Level 3) |
| Assets: | |
| Cash equivalents | |
| Cash equivalents | |
| Cash equivalents | Cash equivalents | | $ | 5.3 | | | $ | 5.3 | | | $ | — | | | $ | — | |
| Share swap transaction | Share swap transaction | | $ | 0.6 | | | $ | 0.6 | | | $ | — | | | $ | — | |
| | Total assets | |
| Total assets | |
| Total assets | |
| | December 31, 2020 | | Quoted Prices in Active Markets for Identical Assets (Level 1) | | Significant Other Observable Inputs (Level 2) | | Significant Unobservable Inputs (Level 3) |
| Liabilities: | |
| Liabilities: | |
| Liabilities: | |
| | Contingent payments related to acquisition | |
| | Contingent payments related to acquisition | |
| | Contingent payments related to acquisition | |
| Total liabilities | |
| | | December 31, 2022 | |
| | December 31, 2022 | |
| | December 31, 2022 | | | Quoted Prices in Active Markets for Identical Assets (Level 1) | | Significant Other Observable Inputs (Level 2) | | Significant Unobservable Inputs (Level 3) |
| Assets: | |
| Cash equivalents | Cash equivalents | | $ | 20.2 | | | $ | 20.2 | | | $ | — | | | $ | — | |
| Cash equivalents | |
| Cash equivalents | |
| | Total assets | |
| | Total assets | |
| | Total assets | |
| | Liabilities: | |
| Liabilities: | |
| Liabilities: | |
| Share swap transaction | |
| Share swap transaction | |
| Share swap transaction | |
| | Total liabilities | |
| Total liabilities | |
| Total liabilities | |
The Company’s Level 1 cash equivalents assets are generally comprised of foreign bank guaranteed certificates of deposit and short term deposits. The share swap transaction is recorded within the "Accounts Payable" and "Receivables" lines of the consolidated balance sheets and is further described in Note 5 - Financial Instruments.
The Company has no assets measured on a recurring basis classified as Level 2 or Level 3 excluding the recurring fair value measurements in the Company's pension and other retirement plans as discussed in Note 7 - Employee Benefit Plans.
The Company's Level 3 category includes contingent consideration related to acquisitions, which valuation inputs are unobservable and significant to the fair value measurement. Projections and estimated probabilities are used to estimate future contingent earn-out payments, which are discounted back to present value to compute contingent earn-out liabilities. The following table provides a roll-forward of the contingent consideration liability, which is included in other long-term liabilities in the consolidated balance sheets:
| | | | | |
| (In millions) | 2023 |
| Fair value at beginning of period | $ | — | |
| Additions | $ | 3.0 | |
| Change in fair value recognized in earnings | $ | — | |
| Payments | $ | — | |
| Fair value at end of period | $ | 3.0 | |
Total debt, including current maturities, have carrying amounts of $188.5$100.5 million as of December 31, 2023 and $216.1 million at December 31, 2021 and $94.6 million at December 31, 2020.2022. The estimated fair value of all debt was $196.1$98.6 million and $107.3$213.2 million atas of December 31, 20212023 and December 31, 2020,2022, respectively. In the absence of quoted prices in active markets, considerable judgment is required in developing estimates of fair value. Estimates are not necessarily indicative of the amounts the Company could realize in a current market transaction. In determining the fair value of its debt, the Company uses estimates based on rates currently
available to the Company for debt with similar terms and remaining maturities. Accordingly, the fair value of debt is classified as Level 2 within the valuation hierarchy.
5. FINANCIAL INSTRUMENTS
The Company’s non-employee directors' deferred compensation stock program is subject to variable plan accounting and, accordingly, is adjusted for changes in the Company’s stock price at the end of each reporting period. The Company has entered into share swap transaction agreements (“the swap”) to mitigate the Company’s exposure to these fluctuations in the Company’s stock price. The swap has not been designated as a hedge for accounting purposes and is cancellable with 30 days written notice by either party. As of December 31, 2021,2023 and December 31, 2022, the swap hashad a notional value based on 210,000 shares.240,000 shares and 225,000 shares, respectively. For the years ended December 31, 2021,2023, December 31, 2020,2022, and December 31, 2019,2021, the swap resulted in gainsa gain of $2.5 million, a loss of $3.4 million, and a gain of $6.2 million, $3.2 million,respectively. Gains and $3.4 million, respectively. Gainslosses resulting from the swap were primarily offset by gains and losses on the fair value of the deferred compensation stock liability. All gains or losses and expenses related to the deferred compensation stock liability and the swap are recorded in the Company’s consolidated statements of income within the “Selling, general, and administrative expenses” line.
The Company is exposed to foreign currency exchange rate risk arising from transactions in the normal course of business including making sales and purchases of raw materials and finished goods in foreign denominated currencies with third party customers and suppliers as well as to wholly owned subsidiaries of the Company. To reduce its exposure to foreign currency exchange rate volatility, the Company enters into various forward currency contracts to offset these fluctuations. The Company uses forward currency contracts only in an attempt to limit underlying exposure from foreign currency exchange rate fluctuations and to minimize earnings volatility associated with foreign currency exchange rate fluctuations and has not elected to use hedge accounting. Decisions on whether to use such derivative instruments are primarily based on the amount of exposure to the currency involved and an assessment of the near-term market value for each currency. As of December 31, 2023, the Company had no foreign currency contracts outstanding. As of December 31, 2022, the Company had a notional amount of $10.3 million in forward currency contracts outstanding and the related fair value of those contracts was not material. For the years ended December 31, 2023 and December 31, 2022, the forward currency contracts resulted in gains of $1.6 million and $1.2 million, respectively. This is recorded in the Company's consolidated statements of income within the "Foreign exchange expense" line.
6. GOODWILL AND OTHER INTANGIBLE ASSETS
The carrying amounts of the Company’s intangible assets are as follows:
| | (In millions) | (In millions) | | 2021 | | 2020 | (In millions) | | 2023 | | 2022 |
| Gross Carrying Amount | | Accumulated Amortization | | Gross Carrying Amount | | Accumulated Amortization |
| | Gross Carrying Amount | | | | Gross Carrying Amount | | Accumulated Amortization | | Gross Carrying Amount | | Accumulated Amortization |
| Amortizing intangibles: | Amortizing intangibles: | | | | | | | | | Amortizing intangibles: | | |
| Customer relationships | Customer relationships | | 255.1 | | | (88.8) | | | 165.1 | | | (78.5) | |
| Patents | Patents | | $ | 7.3 | | | $ | (7.3) | | | $ | 7.5 | | | $ | (7.3) | |
| | Technology | |
| Technology | |
| Technology | Technology | | 7.5 | | | (7.3) | | | 7.5 | | | (7.2) | |
| Trade names | Trade names | | 42.1 | | | (1.5) | | | 3.4 | | | (0.2) | |
| Other | Other | | 2.8 | | | (2.7) | | | 2.9 | | | (2.8) | |
| Total | Total | | $ | 314.8 | | | $ | (107.6) | | | $ | 186.4 | | | $ | (96.0) | |
| Unamortizing intangibles: | Unamortizing intangibles: | | | | | | | | |
| Trade names | Trade names | | 42.5 | | | — | | | 43.4 | | | — | |
| Trade names | |
| Trade names | |
| Total intangibles | Total intangibles | | $ | 357.3 | | | $ | (107.6) | | | $ | 229.8 | | | $ | (96.0) | |
Amortization expense related to intangible assets for fiscalthe years ended December 31, 2023, 2022, and 2021, 2020, and 2019, was $14.4$17.1 million, $9.4$17.2 million, and $9.4$14.4 million, respectively.
Amortization expense for each of the five succeeding years is projected as follows:
| | | | | | | | | | | | | | | | | | | | | | | | | | | | | | | | |
| (In millions) | | 2022 | | 2023 | | 2024 | | 2025 | | 2026 |
| | $ | 17.0 | | | $ | 17.0 | | | $ | 16.9 | | | $ | 16.1 | | | $ | 15.1 | |
| | | | | | | | | | | | | | | | | | | | | | | | | | | | | | | | |
| (In millions) | | 2024 | | 2025 | | 2026 | | 2027 | | 2028 |
| | $ | 18.5 | | | $ | 17.7 | | | $ | 16.7 | | | $ | 15.3 | | | $ | 14.7 | |
The change in the carrying amount of goodwill by reportable segment for 20212023 and 2020,2022, is as follows:
| | | | | | | | | | | | | | | | | | | | | | | | | | |
| (In millions) | | Water Systems | | Fueling Systems | | Distribution | | Consolidated |
| Balance as of December 31, 2019 | | $ | 151.0 | | | $ | 67.6 | | | $ | 37.5 | | | $ | 256.1 | |
| Acquisitions | | 10.3 | | | — | | | — | | | 10.3 | |
| | | | | | | | |
| Foreign currency translation | | 0.2 | | | 0.1 | | | — | | | 0.3 | |
| Balance as of December 31, 2020 | | $ | 161.5 | | | $ | 67.7 | | | $ | 37.5 | | | $ | 266.7 | |
| | | | | | | | |
| Acquisitions | | 55.4 | | | 3.0 | | | 7.5 | | | 65.9 | |
| Adjustments to prior year acquisitions | | (0.1) | | | — | | | — | | | (0.1) | |
| Foreign currency translation | | (2.9) | | | — | | | — | | | (2.9) | |
| Balance as of December 31, 2021 | | $ | 213.9 | | | $ | 70.7 | | | 45.0 | | | $ | 329.6 | |
| | | | | | | | | | | | | | | | | | | | | | | | | | |
| (In millions) | | Water Systems | | Fueling Systems | | Distribution | | Consolidated |
| Balance as of December 31, 2021 | | $ | 213.9 | | | $ | 70.7 | | | $ | 45.0 | | | $ | 329.6 | |
| Acquisitions | | — | | | — | | | 1.2 | | | 1.2 | |
| Adjustments to prior year acquisitions | | 0.5 | | | — | | | (0.4) | | | 0.1 | |
| Foreign currency translation | | (2.5) | | | (0.4) | | | — | | | (2.9) | |
| Balance as of December 31, 2022 | | $ | 211.9 | | | $ | 70.3 | | | $ | 45.8 | | | $ | 328.0 | |
| | | | | | | | |
| Acquisitions | | 8.0 | | | — | | | 4.8 | | | 12.8 | |
| Adjustments to prior year acquisitions | | 0.1 | | | — | | | — | | | 0.1 | |
| Foreign currency translation | | 1.4 | | | 0.1 | | | — | | | 1.5 | |
| Balance as of December 31, 2023 | | $ | 221.4 | | | $ | 70.4 | | | 50.6 | | | $ | 342.4 | |
7. EMPLOYEE BENEFIT PLANS
Defined Benefit Plans - As of December 31, 2021,2023, the Company maintained 2two domestic pension plans and 3three German pension plans. The Company used a December 31, 20212023 measurement date for these plans. One of the Company’s domestic pension plans covers one active management employee, while the other domestic plan covers all eligible employees. Both domestic plans were frozen as of December 31, 2011. The 2two domestic and 3three German plans collectively comprise the ‘Pension Benefits’ disclosure caption.
Other Benefits - The Company’s other post-retirement benefit plan provides health and life insurance to domestic employees hired prior to 1992. The Company effectively capped its cost for those benefits through plan amendments made in 1992, freezing Company contributions for insurance benefits at 1991 levels for current and future beneficiaries with actuarially reduced benefits for employees who retire before age 65. The disclosures surrounding this plan are reflected in the “Other Benefits” caption.
The following table sets forth aggregated information related to the Company’s pension benefits and other postretirement benefits, including changes in the benefit obligations, changes in plan assets, funded status, amounts recognized in the balance sheet, amounts recognized in accumulated other comprehensive income, and actuarial assumptions that the Company considered in its determination of benefit obligations and plan costs. Benefit obligation balances presented below reflect the projected benefit obligation (PBO) for the Company’s pension plans, and accumulated postretirement benefit obligations (APBO) for the Company’s other benefit plans.
| | (In millions) | (In millions) | | Pension Benefits | | Other Benefits | (In millions) | | Pension Benefits | | Other Benefits |
| | | | 2021 | | 2020 | | 2021 | | 2020 | | | 2023 | | 2022 | | 2023 | | 2022 |
| Accumulated benefit obligation, end of year | Accumulated benefit obligation, end of year | | $ | 171.6 | | | $ | 185.4 | | | $ | 7.7 | | | $ | 8.5 | |
| | Change in benefit obligation: | | | | | | | | |
| Change in projected benefit obligation: | |
| Change in projected benefit obligation: | |
| Change in projected benefit obligation: | | | |
| Benefit obligation, beginning of year | Benefit obligation, beginning of year | | $ | 188.9 | | | $ | 180.9 | | | $ | 8.5 | | | $ | 8.3 | |
| Service cost | Service cost | | 0.7 | | | 0.7 | | | — | | | — | |
| Interest cost | Interest cost | | 2.7 | | | 4.3 | | | 0.1 | | | 0.2 | |
| Actuarial (gain)/loss | Actuarial (gain)/loss | | (4.3) | | | 12.8 | | | (0.1) | | | 0.8 | |
| Settlements paid | Settlements paid | | — | | | (0.6) | | | — | | | — | |
| Benefits paid | Benefits paid | | (10.9) | | | (11.4) | | | (0.8) | | | (0.8) | |
| Foreign currency exchange | Foreign currency exchange | | (1.9) | | | 2.2 | | | — | | | — | |
| Benefit obligation, end of year | Benefit obligation, end of year | | $ | 175.2 | | | $ | 188.9 | | | $ | 7.7 | | | $ | 8.5 | |
| | Change in plan assets: | Change in plan assets: | | | | | | | | |
| Change in plan assets: | |
| Change in plan assets: | | | |
| Fair value of assets, beginning of year | Fair value of assets, beginning of year | | $ | 153.3 | | | $ | 151.2 | | | $ | — | | | $ | — | |
| Actual return on plan assets | Actual return on plan assets | | 1.3 | | | 13.0 | | | — | | | — | |
| Company contributions | Company contributions | | 0.5 | | | 0.5 | | | 0.8 | | | 0.8 | |
| Settlements paid | Settlements paid | | — | | | (0.4) | | | — | | | — | |
| Benefits paid | Benefits paid | | (10.9) | | | (11.4) | | | (0.8) | | | (0.8) | |
| Foreign currency exchange | Foreign currency exchange | | (0.3) | | | 0.4 | | | — | | | — | |
| Plan assets, end of year | Plan assets, end of year | | $ | 143.9 | | | $ | 153.3 | | | $ | — | | | $ | — | |
| | Funded status | Funded status | | $ | (31.3) | | | $ | (35.6) | | | $ | (7.7) | | | $ | (8.5) | |
| Funded status | |
| Funded status | |
| | Amounts recognized in balance sheet: | |
| Amounts recognized in balance sheet: | |
| Amounts recognized in balance sheet: | Amounts recognized in balance sheet: | | | | | | | | | | |
| Non current assets | Non current assets | | $ | 1.6 | | | $ | — | | | $ | — | | | $ | — | |
| Current liabilities | Current liabilities | | (0.5) | | | (0.5) | | | (0.7) | | | (0.8) | |
| Non current liabilities | Non current liabilities | | (32.4) | | | (35.1) | | | (7.0) | | | (7.7) | |
| Net liability, end of year | Net liability, end of year | | $ | (31.3) | | | $ | (35.6) | | | $ | (7.7) | | | $ | (8.5) | |
| | Amount recognized in accumulated other comprehensive income/(loss): | Amount recognized in accumulated other comprehensive income/(loss): | | | | | | | | |
| Amount recognized in accumulated other comprehensive income/(loss): | |
| Amount recognized in accumulated other comprehensive income/(loss): | | | |
| Prior service cost | Prior service cost | | $ | — | | | $ | — | | | $ | — | | | $ | — | |
| Net actuarial loss | Net actuarial loss | | 47.8 | | | 50.9 | | | 0.6 | | | 0.9 | |
| Settlement | Settlement | | 0.6 | | | 0.8 | | | — | | | — | |
| Total recognized in accumulated other comprehensive income/(loss) | Total recognized in accumulated other comprehensive income/(loss) | | $ | 48.4 | | | $ | 51.7 | | | $ | 0.6 | | | $ | 0.9 | |
As of December 31, 2021,2023, the pension benefits' aggregate accumulated benefit obligation and benefit obligation in excess of plan assets was $33.9$33.3 million and $37.5 million. The$34.4 million, respectively and as of December 31, 2022, was $27.9 million and $29.8 million, respectively. As of December 31, 2023 and December 31, 2022, the aggregate fair value of plan assets related to the accumulated benefit obligation and benefit obligation was $4.6 million.$4.4 million and $4.4 million, respectively.
The following table sets forth other changes in plan assets and benefit obligation recognized in other comprehensive income for 20212023 and 2020:2022:
| | (In millions) | (In millions) | | Pension Benefits | | Other Benefits | (In millions) | | Pension Benefits | | Other Benefits |
| | | | 2021 | | 2020 | | 2021 | | 2020 | | | 2023 | | 2022 | | 2023 | | 2022 |
| Net actuarial (gain)/loss | Net actuarial (gain)/loss | | $ | (0.1) | | | $ | 6.6 | | | $ | (0.2) | | | $ | 0.8 | |
| | Amortization of: | Amortization of: | | | | | | | | |
| Net actuarial gain | | (3.7) | | | (3.1) | | | (0.2) | | | (0.1) | |
| Amortization of: | |
| Amortization of: | | | |
| Net actuarial loss | |
| Prior service credit | Prior service credit | | — | | | — | | | — | | | — | |
| Settlement recognition | Settlement recognition | | (0.6) | | | (0.8) | | | — | | | — | |
| | Deferred tax asset | Deferred tax asset | | 1.4 | | | (0.9) | | | 0.1 | | | (0.1) | |
| Deferred tax asset | |
| Deferred tax asset | |
| Foreign currency exchange | Foreign currency exchange | | (0.3) | | | 0.2 | | | — | | | — | |
| Total recognized in other comprehensive income | Total recognized in other comprehensive income | | $ | (3.3) | | | $ | 2.0 | | | $ | (0.3) | | | $ | 0.6 | |
The decreased discount rate is the largest contributor to the net actuarial losses affecting the benefit obligation for the defined benefit pension plans.
Weighted-average assumptions used to determine domestic benefit obligations:
| | | | | Pension Benefits | | Other Benefits | | | Pension Benefits | | Other Benefits |
| | | | 2021 | | 2020 | | 2021 | | 2020 | | | 2023 | | 2022 | | 2023 | | 2022 |
| Discount rate | Discount rate | | 2.68 | % | | 2.31 | % | | 2.57 | % | | 2.12 | % | Discount rate | | 4.90 | % | | 5.15 | % | | 4.88 | % | | 5.08 | % |
| Rate of increase in future compensation | Rate of increase in future compensation | | — | % | * | — | % | * | 2.00 - 9.00% (Graded) | | 2.00 - 9.00% (Graded) | Rate of increase in future compensation | | — | % | * | — | % | * | 2.00 - 9.00% (Graded) | | 2.00 - 9.00% (Graded) |
*No rate of increases in future compensation were used in the assumptions for 20212023 and 2020,2022, as the cash balance component of the domestic Pension Plan was frozen and the other domestic Pension Plan components do not base benefits on compensation. The weighted-average interest crediting rate of the cash balance component of the domestic Pension Plan was 4.5%4.5 percent for 2021, 2020,2023, 2022, and 20192021 and is based on the approximate 30-year Treasury rate as of November of the prior year with a minimum of 4.5%.4.5 percent.
Assumptions used to determine domestic periodic benefit cost:
| | | | | Pension Benefits | | Other Benefits | | | Pension Benefits | | Other Benefits |
| | | | 2021 | | 2020 | | 2019 | | 2021 | | 2020 | | 2019 | | | 2023 | | 2022 | | 2021 | | 2023 | | 2022 | | 2021 |
| Discount rate | Discount rate | | 2.41 | % | | 3.17 | % | | 4.31 | % | | 2.12 | % | | 2.99 | % | | 4.18 | % | Discount rate | | 5.14 | % | | 2.79 | % | | 2.41 | % | | 5.08 | % | | 2.57 | % | | 2.12 | % |
| Rate of increase in future compensation | Rate of increase in future compensation | | — | % | * | — | % | * | — | % | * | 2.00 - 9.00% (Graded) | | 2.00 - 9.00% (Graded) | | 3.00 - 8.00% (Graded) | Rate of increase in future compensation | | — | % | * | — | % | * | — | % | * | 2.00 - 9.00% (Graded) | | 2.00 - 9.00% (Graded) |
| Expected long-term rate of return on plan assets | Expected long-term rate of return on plan assets | | 4.00 | % | | 4.90 | % | | 5.75 | % | | — | % | | — | % | | — | % | Expected long-term rate of return on plan assets | | 5.70 | % | | 4.50 | % | | 4.00 | % | | — | % | | — | % | | — | % |
*No rate of increases in future compensation were used in the assumptions for 2021, 2020,2023, 2022, and 2019,2021, as the cash balance component of the domestic Pension Plan was frozen and the other domestic Pension Plan components do not base benefits on compensation..compensation.
For the fiscal yearyears ended December 31, 2021,2023 and December 31, 2022, the Company used the PRI-2012 aggregate mortality table, and then projected forward from 2012 using Scale MP-2020MP-2021 released by the Society of Actuaries during 2020 to estimate future mortality rates based upon current data. For the fiscal year ended December 31, 2020, the Company used the PRI-2012 aggregate mortality table, and then projected forward from 2012 using Scale MP-2019 released by the Society of Actuaries during 20192021 to estimate future mortality rates based upon current data.
The following table sets forth the aggregated net periodic benefit cost for all defined benefit plans for 2021, 2020,2023, 2022, and 2019:2021:
| | | | | | | | | | | | | | | | | | | | | | | | | | | | | | | | | | | |
| (In millions) | Pension Benefits | | Other Benefits |
| | 2021 | | 2020 | | 2019 | | 2021 | | 2020 | | 2019 |
| Service cost | $ | 0.7 | | | $ | 0.7 | | | $ | 0.7 | | | $ | — | | | $ | — | | | $ | — | |
| Interest cost | 2.7 | | | 4.3 | | | 5.8 | | | 0.1 | | | 0.2 | | | 0.3 | |
| Expected return on assets | (5.5) | | | (6.8) | | | (8.1) | | | — | | | — | | | — | |
| Amortization of: | | | | | | | | | | | |
| Transition obligation | — | | | — | | | — | | | — | | | — | | | — | |
| Settlement cost | — | | | — | | | — | | | — | | | — | | | — | |
| Prior service cost | — | | | — | | | — | | | — | | | — | | | — | |
| Actuarial loss | 4.3 | | | 3.7 | | | 2.6 | | | 0.2 | | | 0.1 | | | 0.1 | |
| Settlement cost | — | | | — | | | — | | | — | | | — | | | — | |
| Net periodic benefit cost | $ | 2.2 | | | $ | 1.9 | | | $ | 1.0 | | | $ | 0.3 | | | $ | 0.3 | | | $ | 0.4 | |
| | | | | | | | | | | |
The largest contributor to the net actuarial losses affecting the benefit obligation for the defined benefit pension plans is due to a decrease in the discount rate. | | | | | | | | | | | | | | | | | | | | | | | | | | | | | | | | | | | |
| (In millions) | Pension Benefits | | Other Benefits |
| | 2023 | | 2022 | | 2021 | | 2023 | | 2022 | | 2021 |
| Service cost | $ | 0.6 | | | $ | 0.7 | | | $ | 0.7 | | | $ | — | | | $ | — | | | $ | — | |
| Interest cost | 6.4 | | | 3.3 | | | 2.7 | | | 0.3 | | | 0.1 | | | 0.1 | |
| Expected return on assets | (7.2) | | | (6.1) | | | (5.5) | | | — | | | — | | | — | |
| Amortization of: | | | | | | | | | | | |
| Transition obligation | — | | | — | | | — | | | — | | | — | | | — | |
| Settlement cost | — | | | — | | | — | | | — | | | — | | | — | |
| Prior service cost | — | | | — | | | — | | | — | | | — | | | — | |
| Actuarial loss | 2.1 | | | 5.6 | | | 4.3 | | | — | | | 0.1 | | | 0.2 | |
| Settlement cost | — | | | — | | | — | | | — | | | — | | | — | |
| Net periodic benefit cost | $ | 1.9 | | | $ | 3.5 | | | $ | 2.2 | | | $ | 0.3 | | | $ | 0.2 | | | $ | 0.3 | |
| | | | | | | | | | | |
The Company consults with a third party investment manager for the assets of the funded domestic defined benefit plan. The plan assets are currently invested primarily in pooled funds, where each fund in turn is composed of mutual funds that have at least daily net asset valuations. Thus, the Company’s funded domestic defined benefit plan assets are invested in a “fund of funds” approach.
The Company’s Board has delegated oversight and guidance to an appointed Employee Benefits Committee. The Committee has the tasks of reviewing plan performance and asset allocation, ensuring plan compliance with applicable laws, establishing plan policies, procedures, and controls, monitoring expenses, and other related activities.
The plan’s investment policies and strategies focus on the ability to fund benefit obligations as they come due. Considerations include the plan’s current funded level, plan design, benefit payment assumptions, funding regulations, impact of potentially volatile business results on the Company’s ability to make certain levels of contributions, and interest rate and asset return volatility among other considerations. The Company currently attempts to maintain plan funded status at approximately 80 percent or greater pursuant to the Pension Protection Act of 2007. Given the plan’s current funded status, the Company’s cash on hand, cash historically generated from business operations, and cash available under committed credit facilities, the Company sees ample liquidity to achieve this goal.
Risk management and continuous monitoring requirements are met through monthly investment portfolio reports, quarterly Employee Benefits Committee meetings, annual valuations, asset/liability studies, and the annual assumption process focusing primarily on the return on asset assumption and the discount rate assumption. As of December 31, 20212023 and December 31, 2020,2022, funds were invested in equity, fixed income, and other investments as follows:
| | Target Percentage | | Plan Asset Allocation at Year-End |
| | Target Percentage | | | | Target Percentage | | Plan Asset Allocation at Year-End |
| Asset Category | Asset Category | | at Year-End 2021 | | 2021 | | 2020 | Asset Category | | at Year-End 2023 | | 2023 | | 2022 |
| Equity securities | Equity securities | | 18 | % | | 18 | % | | 17 | % | Equity securities | | 16 | % | | 16 | % | | 18 | % |
| Fixed income securities | Fixed income securities | | 78 | % | | 78 | % | | 79 | % | Fixed income securities | | 79 | % | | 79 | % | | 78 | % |
| Other | Other | | 4 | % | | 4 | % | | 4 | % | Other | | 5 | % | | 5 | % | | 4 | % |
| Total | Total | | 100 | % | | 100 | % | | 100 | % | Total | | 100 | % | | 100 | % | | 100 | % |
The Company does not see any particular concentration of risk within the plans, nor any plan assets that pose difficulties for fair value assessment. The Company currently has no allocation to potentially illiquid or potentially difficult to value assets such as hedge funds, venture capital, private equity, and real estate.
The Company works with actuaries and consultants in making its determination of the asset rate of return assumption and also the discount rate assumption.
Asset class assumptions are set using a combination of empirical and forward-looking analysis for long-term rate of return on plan assets. A variety of models are applied for filtering historical data and isolating the fundamental characteristics of asset classes. These models provide empirical return estimates for each asset class, which are then reviewed and combined with a qualitative assessment of long-term relationships between asset classes before a return estimate is finalized. This provides an
additional means for correcting for the effect of unrealistic or unsustainable short-term valuations or trends, opting instead for return levels and behavior that are more likely to prevail over long periods. With that, the Company has assumed an expected long-term rate of return on plan assets of 4.506.20 percent for the 20222024 net periodic benefit cost, up from 4.005.70 percent in the prior year. This increase in the assumed long-term rate of return is primarily due to higher expected returns on the plan's fixed income assets.
The Company uses the Aon Hewitt AA Above Median curve to determine the discount rate. All cash flow obligations under the plan are matched to bonds in the Aon Hewitt universe of liquid, high-quality, non-callable / non-putablenon-puttable corporate bonds with outliers removed. From that matching exercise, a discount rate is determined.
The Company’s German pension plans are funded by insurance contract policies whereby the insurance company guarantees a fixed minimum return. Due to tax legislation, individual pension benefits can only be financed using direct insurance policies up to certain maximums. These maximum amounts in respect of each member are paid into such an arrangement on a yearly basis.
The Company designated all equity and most domestic fixed income plan assets as Level 1, as they are mutual funds with prices that are readily available. The U.S. Treasury securities and German plan assets are designated as Level 2 inputs. The fair value of the German plan assets are measured by the reserve that is supervised by the German Federal Financial Supervisory Authority. The U.S. Treasury securities are administered by the United States government.
The fair values of the Company’s pension plan assets for 20212023 and 20202022 by asset category are as follows:
| | (In millions) | (In millions) | | 2021 | | Quoted Prices in Active Markets for Identical Assets
(Level 1) | | Significant Other Observable Inputs
(Level 2) | | Significant Unobservable
Inputs
(Level 3) | (In millions) | | 2023 | | Quoted Prices in Active Markets for Identical Assets
(Level 1) | | Significant Other Observable Inputs
(Level 2) | | Significant Unobservable
Inputs
(Level 3) |
| Equity | Equity | | | | | | | | |
| International equity mutual funds | International equity mutual funds | | $ | 26.7 | | | $ | 26.7 | | | $ | — | | | $ | — | |
| International equity mutual funds | |
| International equity mutual funds | |
| Fixed income | Fixed income | |
| U.S. treasury and government agency securities | |
| U.S. treasury and government agency securities | |
| U.S. treasury and government agency securities | U.S. treasury and government agency securities | | 18.4 | | | — | | | 18.4 | | | — | |
| Fixed income mutual funds | Fixed income mutual funds | | 93.4 | | | 93.4 | | | — | | | — | |
| Other | Other | |
| Insurance contracts | Insurance contracts | | 4.7 | | | — | | | 4.7 | | | — | |
| Insurance contracts | |
| Insurance contracts | |
| Cash and equivalents | Cash and equivalents | | 0.7 | | | 0.7 | | | — | | | — | |
| Total | Total | | $ | 143.9 | | | $ | 120.8 | | | $ | 23.1 | | | $ | — | |
| | (In millions) | (In millions) | | 2020 | | Quoted Prices in Active Markets for Identical Assets
(Level 1) | | Significant Other Observable Inputs
(Level 2) | | Significant Unobservable
Inputs
(Level 3) | (In millions) | | 2022 | | Quoted Prices in Active Markets for Identical Assets
(Level 1) | | Significant Other Observable Inputs
(Level 2) | | Significant Unobservable
Inputs
(Level 3) |
| Equity | Equity | | | | | | | | |
| International equity mutual funds | International equity mutual funds | | $ | 26.1 | | | $ | 26.1 | | | $ | — | | | $ | — | |
| International equity mutual funds | |
| International equity mutual funds | |
| Fixed income | Fixed income | |
| U.S. treasury and government agency securities | |
| U.S. treasury and government agency securities | |
| U.S. treasury and government agency securities | U.S. treasury and government agency securities | | 16.8 | | | — | | | 16.8 | | | — | |
| Fixed income mutual funds | Fixed income mutual funds | | 104.8 | | | 104.8 | | | — | | | — | |
| Other | Other | |
| Insurance contracts | Insurance contracts | | 4.8 | | | — | | | 4.8 | | | — | |
| Insurance contracts | |
| Insurance contracts | |
| Cash and equivalents | Cash and equivalents | | 0.8 | | | 0.8 | | | — | | | — | |
| Total | Total | | $ | 153.3 | | | $ | 131.7 | | | $ | 21.6 | | | $ | — | |
The Company estimates total contributions to the plans of about $0.9$0.8 million in 2022.2024.
The following benefit payments, which reflect expected future service, as appropriate, are expected to be paid in accordance with the following schedule:
| | (In millions) | (In millions) | | Pension Benefits | | Other Benefits | (In millions) | | Pension Benefits | | Other Benefits |
| 2022 | | $ | 10.8 | | | $ | 0.7 | |
| 2023 | | $ | 10.4 | | | $ | 0.7 | |
| 2024 | 2024 | | $ | 17.5 | | | $ | 0.7 | |
| 2025 | 2025 | | $ | 13.5 | | | $ | 0.6 | |
| 2026 | 2026 | | $ | 9.8 | | | $ | 0.6 | |
| Years 2027 through 2031 | | $ | 46.0 | | | $ | 2.5 | |
| 2027 | |
| 2028 | |
| Years 2029 through 2033 | |
Defined Contribution Plans - The Company maintained two defined contribution plans during 2021, 2020,2023, 2022, and 2019.2021. The Company’s cash contributions are allocated to participant’s accounts based on investment elections.
The following table sets forth Company contributions to the defined contribution plans:
| | (In millions) | (In millions) | | 2021 | | 2020 | | 2019 | (In millions) | | 2023 | | 2022 | | 2021 |
| Company contributions to the plans | Company contributions to the plans | | $ | 8.9 | | | $ | 7.3 | | | $ | 7.4 | |
8. ACCRUED EXPENSES AND OTHER CURRENT LIABILITIES
Accrued expenses and other current liabilities consist of: | | (In millions) | (In millions) | | 2021 | | 2020 | (In millions) | | 2023 | | 2022 |
| Salaries, wages, and commissions | Salaries, wages, and commissions | | $ | 62.3 | | | $ | 36.4 | |
| Product warranty costs | Product warranty costs | | 10.5 | | | 9.7 | |
| Insurance | Insurance | | 2.3 | | | 2.4 | |
| Employee benefits | Employee benefits | | 11.9 | | | 9.8 | |
| Other | Other | | 28.4 | | | 30.7 | |
| | | | $ | 115.4 | | | $ | 89.0 | |
9. INCOME TAXES
Income before income taxes consisted of the following:
| | (In millions) | (In millions) | | 2021 | | 2020 | | 2019 | (In millions) | | 2023 | | 2022 | | 2021 |
| Domestic | Domestic | | $ | 113.1 | | | $ | 74.1 | | | $ | 55.5 | |
| Foreign | Foreign | | 76.6 | | | 49.6 | | | 61.3 | |
| $ | 189.7 | | | $ | 123.7 | | | $ | 116.8 | |
| | $ | |
The income tax provision/(benefit) from continuing operations consisted of the following:
| | (In millions) | (In millions) | | 2021 | | 2020 | | 2019 | (In millions) | | 2023 | | 2022 | | 2021 |
| Current: | Current: | | | | | | | Current: | | |
| Federal | Federal | | $ | 15.9 | | | $ | 11.9 | | | $ | 6.9 | |
| Foreign | Foreign | | 15.7 | | | 12.3 | | | 15.1 | |
| State | State | | 3.0 | | | 2.6 | | | 1.4 | |
| Total current | Total current | | 34.6 | | | 26.8 | | | 23.4 | |
| Deferred: | Deferred: | | | | | | | Deferred: | | |
| Federal | Federal | | (0.7) | | | (0.2) | | | (0.6) | |
| Foreign | Foreign | | (0.1) | | | (4.0) | | | (2.5) | |
| State | State | | 0.9 | | | (0.1) | | | 0.5 | |
| Total deferred | Total deferred | | $ | 0.1 | | | $ | (4.3) | | | $ | (2.6) | |
| | | | $ | 34.7 | | | $ | 22.5 | | | $ | 20.8 | |
A reconciliation of the tax provision for continuing operations at the U.S. statutory rate to the effective income tax expense rate as reported is as follows:
| | | | | 2021 | | 2020 | | 2019 | | | 2023 | | 2022 | | 2021 |
| U.S. Federal statutory rate | U.S. Federal statutory rate | | 21.0 | % | | 21.0 | % | | 21.0 | % | U.S. Federal statutory rate | | 21.0 | % | | 21.0 | % | | 21.0 | % |
| State income taxes, net of federal benefit | State income taxes, net of federal benefit | | 1.7 | | | 1.5 | | | 1.1 | |
| Foreign operations | Foreign operations | | 0.2 | | | 0.3 | | | (1.0) | |
| R&D tax credits | R&D tax credits | | (0.5) | | | (0.7) | | | (0.8) | |
| Uncertain tax position adjustments | Uncertain tax position adjustments | | 0.2 | | | 0.1 | | | (0.6) | |
| | Valuation allowance on state and foreign deferred tax | Valuation allowance on state and foreign deferred tax | | (0.6) | | | 1.7 | | | 0.4 | |
| Valuation allowance on state and foreign deferred tax | |
| Valuation allowance on state and foreign deferred tax | |
| | Share-based compensation | Share-based compensation | | (2.3) | | | (0.8) | | | (0.8) | |
| Realized foreign currency loss | | — | | | (4.0) | | | (0.4) | |
| Share-based compensation | |
| Share-based compensation | |
| | Other items | |
| Other items | |
| Other items | Other items | | (0.6) | | | 0.7 | | | 0.3 | |
| | Foreign Derived Intangible Income | Foreign Derived Intangible Income | | (1.9) | | | (2.6) | | | (2.0) | |
| | Foreign Derived Intangible Income | |
| | Foreign Derived Intangible Income | |
| Nondeductible officers compensation | Nondeductible officers compensation | | 1.1 | | | 1.0 | | | 0.6 | |
| Effective tax rate | Effective tax rate | | 18.3 | % | | 18.2 | % | | 17.8 | % | Effective tax rate | | 19.6 | % | | 19.7 | % | | 18.3 | % |
The effective tax rate continues to be lower than the statutory rate of 21 percent primarily due to the recognition of the U.S. foreign-derived intangible income (FDII) provisions, foreign earnings taxed at rates below the U.S. statutory rate, certain incentives, and discrete events.events partially offset by state taxes.
The Company recorded discrete excess tax benefits from share-based compensation of $5$3.2 million in the twelve-month periodyear ended December 31, 2021 pursuant to ASU 2016-09. ASU 2016-09 can add variability to the Company’s provision for income taxes, mainly due to the timing of stock option exercises, vesting of restricted stock, and the stock price.
During the twelve-month period ended December 31, 2020, the Company realized a foreign currency translation loss on the second quarter settlement of a discrete intercompany loan that was long-term-investment in nature resulting in a tax benefit of $5.0 million. The Company also recorded net $0.9 million of expense for valuation allowances on deferred tax assets in foreign jurisdictions to recognize only the portion of the deferred tax assets that are more likely than not to be realized.2023.
Significant components of the Company’s deferred tax assets and liabilities were as follows:
| | (In millions) | (In millions) | | 2021 | | 2020 | (In millions) | | 2023 | | 2022 |
| Deferred tax assets: | Deferred tax assets: | | | | | Deferred tax assets: | | |
| Accrued expenses and reserves | Accrued expenses and reserves | | $ | 13.5 | | | $ | 13.0 | |
| Compensation and employee benefits | Compensation and employee benefits | | 19.2 | | | 19.8 | |
| Net operating losses, tax credit carryforwards, and other | Net operating losses, tax credit carryforwards, and other | | 17.0 | | | 20.7 | |
| Lease liability | Lease liability | | 12.2 | | | 8.0 | |
| Research and development expenditures | |
| Valuation allowance on state and foreign deferred tax | Valuation allowance on state and foreign deferred tax | | (6.5) | | | (8.3) | |
| Other items | |
| Total deferred tax assets | Total deferred tax assets | | 55.4 | | | 53.2 | |
| Deferred tax liabilities: | Deferred tax liabilities: | | | | | Deferred tax liabilities: | | |
| Accelerated depreciation on fixed assets | Accelerated depreciation on fixed assets | | 12.0 | | | 12.1 | |
| Amortization of intangibles | Amortization of intangibles | | 51.2 | | | 49.4 | |
| Right-of-use asset, net | | 12.2 | | | 8.0 | |
| Lease right-of-use asset, net | |
| Other items | Other items | | 0.5 | | | 0.5 | |
| Total deferred tax liabilities | Total deferred tax liabilities | | 75.9 | | | 70.0 | |
| Net deferred tax liabilities | Net deferred tax liabilities | | $ | (20.5) | | | $ | (16.8) | |
The Company assesses the available positive and negative evidence to estimate whether sufficient future taxable income will be generated to permit use of the existing deferred tax assets. A significant piece of objective negative evidence evaluated was the cumulative loss for certain state and foreign income tax purposes incurred over the 3-year period ended December 31, 2021.2023. Such objective evidence limits the ability to consider other subjective evidence, such as ourthe Company's projections for future growth.
On the basis of this evaluation, as of December 31, 2021,2023, a valuation allowance of $6.5$4.1 million has been recorded to recognize only the portion of the deferred tax assets that are more likely than not to be realized. The Company has foreign income tax net operating loss (“NOL”) and credit carryforwards of $11.0$8.6 million and state income tax NOL and credit carryforwards of $6.0$4.6 million, which will expire on various dates as follows:
| | | | | |
(In millions) | |
2022-2024 | $ | 1.2 | |
2025-2029 | 3.5 | |
2030-2034 | 1.3 | |
2035-2039 | 0.8 | |
Unlimited | 10.2 | |
| $ | 17.0 | |
| | | | | |
| (In millions) | |
| 2024 | $ | 0.5 | |
| 2025-2029 | 3.7 | |
| 2030-2034 | 0.3 | |
| 2035-2039 | 0.7 | |
| Unlimited | 8.0 | |
| $ | 13.2 | |
The Company believes that it is more likely than not that the benefit from certain foreign NOL carryforwards as well as certain state credit carryforwards will not be realized. In recognition of this risk, the Company has provided a valuation allowance of $4.8$2.7 million on the deferred tax assets related to these foreign NOL carryforwards and a valuation allowance of $1.7$1.4 million on the deferred tax assets related to these state credit carryforwards.
As of December 31, 2021,2023, the Company has estimated accumulated undistributed earnings generated by ourthe Company's foreign subsidiaries of approximately $415.8$315.8 million. Any taxes due with respect to such earnings or the excess of the amount for financial reporting over the tax basis of ourits foreign investments would generally be limited to foreign and state taxes. The Company intends, however, to indefinitely reinvest these earnings and expects future U.S. cash generation to be sufficient to meet future U.S. cash needs. The Company, therefore, has not recorded a deferred tax liability of $6.4approximately $6.1 million.
As of the beginning of fiscal year 2021,2023, the Company had gross unrecognized tax benefits of $0.6$0.9 million, excluding accrued interest and penalties. The unrecognized tax benefits increaseddecreased due to statute expirations, which were offset by uncertain tax positions identified in the current year based on evaluations made during 2021.2023. The Company had gross unrecognized tax benefits, excluding accrued interest and penalties, of $0.9$0.8 million as of December 31, 2021.2023.
A reconciliation of the beginning and ending amount of gross unrecognized tax benefits for 2021, 2020,2023, 2022, and 20192021 (excluding interest and penalties) is as follows:
| | (In millions) | (In millions) | | 2021 | | 2020 | | 2019 | (In millions) | | 2023 | | 2022 | | 2021 |
| Beginning balance | Beginning balance | | $ | 0.6 | | | $ | 0.4 | | | $ | 1.1 | |
| Additions for tax positions of the current year | Additions for tax positions of the current year | | 0.3 | | | 0.6 | | | — | |
| Additions for tax positions of prior years | Additions for tax positions of prior years | | — | | | — | | | — | |
| Reductions for tax positions of prior years | Reductions for tax positions of prior years | | — | | | — | | | (0.4) | |
| Statute expirations | Statute expirations | | — | | | (0.4) | | | (0.3) | |
| Settlements | Settlements | | — | | | — | | | — | |
| Ending balance | Ending balance | | $ | 0.9 | | | $ | 0.6 | | | $ | 0.4 | |
If recognized, each annual effective tax rate would be affected by the net unrecognized tax benefits of $0.8 million, $0.9 million, $0.6 million, and $0.4$0.9 million as of year-end 2021, 2020,2023, 2022, and 2019,2021, respectively.
The Company recognizes interest and penalties related to unrecognized tax benefits as a component of income tax expense. The Company has accrued interest and penalties as of December 31, 2021,2023, December 31, 2020,2022, and December 31, 20192021 of approximately $0.1 million, less than $0.1$0.2 million, and $0.1 million, respectively.
The Company is subject to taxation in the United States and various state and foreign jurisdictions. With few exceptions, as of December 31, 2021,2023, the Company is no longer subject to U.S. federal income tax examinations by tax authorities for years before 20182020 and is no longer subject to foreign or state income tax examinations by tax authorities for years before 2016.2018.
It is reasonably possible that the amounts of unrecognized tax benefits could change in the next twelve months as a result of an audit or due to the expiration of a statute of limitation. Based on the current audits in process and pending statute expirations, the payment of taxes as a result would notcould be significant.up to $0.4 million.
10. DEBT
Debt consisted of the following: | | (In millions) | (In millions) | | 2021 | | 2020 | (In millions) | | 2023 | | 2022 |
| New York Life Agreement | New York Life Agreement | | $ | 75.0 | | | $ | 75.0 | |
| Credit Agreement | Credit Agreement | | 96.6 | | | — | |
| | Tax increment financing debt | Tax increment financing debt | | 16.5 | | | 17.6 | |
| Financing leases | | — | | | 0.1 | |
| Tax increment financing debt | |
| Tax increment financing debt | |
| | Foreign subsidiary debt | Foreign subsidiary debt | | 0.5 | | | 1.8 | |
| Other | | 0.1 | | | 0.2 | |
| Foreign subsidiary debt | |
| Foreign subsidiary debt | |
| | Less: unamortized debt issuance costs | |
| Less: unamortized debt issuance costs | |
| Less: unamortized debt issuance costs | Less: unamortized debt issuance costs | | (0.2) | | | (0.1) | |
| | | | 188.5 | | | 94.6 | |
| Less current maturities | Less current maturities | | (98.0) | | | (2.6) | |
| Long-term debt | Long-term debt | | $ | 90.5 | | | $ | 92.0 | |
Debt outstanding at December 31, 2021,2023, excluding unamortized debt issuance costs, matures as follows:
| | (In millions) | (In millions) | | Total | | 2022 | | 2023 | | 2024 | | 2025 | | 2026 | | Thereafter | (In millions) | | Total | | 2024 | | 2025 | | 2026 | | 2027 | | 2028 | | Thereafter |
| Debt | Debt | | $ | 188.7 | | | $ | 98.0 | | | $ | 1.3 | | | $ | 1.4 | | | $ | 76.4 | | | $ | 1.5 | | | $ | 10.1 | |
|
New York Life Agreement
On May 27, 2015, the Company entered into an uncommitted and unsecured private shelf agreement with NYL Investors LLC, an affiliate of New York Life, and each of the undersigned holders of Notes (the “New York Life Agreement”) for $150.0 million maximum aggregate principal borrowing capacity. On October 28, 2016, the Company entered into the First Amendment to the Note Purchase and Private Shelf Agreement. The Amendment was intended to make the covenants within the New York Life Agreement consistent with the covenants that were modified in the Third Amended and Restated Credit Agreement (the “Credit Agreement”). On September 26, 2018, the Company entered into the Second Amendment to the Note Purchase and Private Shelf Agreement which increased the aggregate borrowing capacity to $200.0 million and authorized the issuance of $75.0 million of fixed rate senior noted due September 26, 2025. These senior notes bear an interest rate of 4.04 percent with interest-only payments due semi-annually. The proceeds from the issuance of the notes were used to pay off existing variable rate indebtedness with New York Life. On July 30, 2021, the New York Life agreement was renewed and expires on July 30, 2024. As of December 31, 2021,2023, there was $125.0 million of remaining borrowing capacity under the New York Life Agreement.
Project Bonds
On December 31, 2012, the Company, Allen County, Indiana and certain institutional investors entered into a Bond Purchase and Loan Agreement. Under the agreement, Allen County, Indiana issued a series of Project Bonds entitled “Taxable Economic Development Bonds, Series 2012 (Franklin Electric Co., Inc. Project).” The aggregate principal amount of the Project Bonds that were issued, authenticated, and are now outstanding thereunder was limited to $25.0 million. The Company then borrowed the proceeds under the Project Bonds through the issuance of Project Notes to finance the cost of acquisition, construction, installation and equipping of the new Global Corporate Headquarters and Engineering Center. These Project Notes (“Tax increment financing debt”) bear interest at 3.6 percent per annum. Interest and principal balance of the Project Notes are due and payable by the Company directly to the institutional investors in aggregate semi-annual installments commencing on July 10, 2013, and concluding on January 10, 2033. The use of the proceeds from the Project Notes was limited to assist the financing of the new Global Corporate Headquarters and Engineering Center. On May 5, 2015, the Company entered into Amendment No. 1 to the Bond Purchase and Loan Agreement. This amendment provided for debt repayment guarantees from certain Company subsidiaries and waived certain non-financial covenants related to subsidiary guarantees.
Prudential Agreement
On April 9, 2007, the Company entered into the Amended and Restated Note Purchase and Private Shelf Agreement (the “Prudential Agreement”) in the amount of $175.0 million. Under the Prudential Agreement, the Company issued notes in an aggregate principal amount of $110.0 million on April 30, 2007 (the “B-1 Notes”) and $40.0 million on September 7, 2007 (the “B-2 Notes”). The B-1 Notes and B-2 Notes bear a coupon of 5.79 percent and had, at issuance, an average life of 10 years with a final maturity in 2019. On July 22, 2010, the Company entered into Amendment No. 3 to the Prudential Agreement to increase its borrowing capacity by $25.0 million. On December 14, 2011, the Company entered into Amendment No. 4 to the
Second Amended and Restated Note Purchase and Private Shelf Agreement to redefine the debt to EBITDA ratio covenant in order to be equivalent to that under the Agreement. On December 31, 2012, the Company and Prudential Insurance Company of America entered into an amendment to the Second Amended and Restated Note Purchase and Private Shelf Agreement to
extend the effective date to December 31, 2015. On May 5, 2015, the Company entered into Amendment No. 6 to the Second Amended and Restated Note Purchase and Private Shelf Agreement. This amendment provided for debt repayment guarantees from certain Company subsidiaries and waived certain non-financial covenants related to subsidiary guarantees. On May 28, 2015, the Company entered into a Third Amended and Restated Note Purchase and Private Shelf Agreement with Prudential to increase the total borrowing capacity from $200.0 million to $250.0 million. On October 28, 2016, the Company entered into Amendment No. 1 to the Third Amended and Restated Note Purchase and Private Shelf Agreement. This amendment was intended to make the covenants within the Prudential Agreement consistent with the covenants that were modified in the Credit Agreement (below). On July 30, 2021, the Company entered into the Fourth Amended and Restated Note Purchase and Private Shelf Agreement, which reduced the borrowing capacity to $150.0 million and expires on July 30, 2024. As of December 31, 2021,2023, the Company has $150.0 million borrowing capacity available under the Prudential Agreement.
Credit Agreement
On May 13, 2021, the Company entered into the Fourth Amended and Restated Credit Agreement (the “Credit Agreement”). The Credit Agreement extended the maturity date of the Company’s previous credit agreement to May 13, 2026, and decreased the commitment amount from $300.0 million to $250.0 million. On May 11, 2022, the Company entered into Amendment No. 1 that increased the commitment amount from $250.0 million to $350.0 million. The Credit Agreement provides that the Borrowers may request an increase in the aggregate commitments by up to $125.0 million (not to exceed a total commitment of $375.0$475.0 million) subject to the conditions contained therein. All of the Company’s present and future material domestic subsidiaries unconditionally guaranty all of the Borrowers’ obligations under and in connection with the Credit Agreement. Additionally, the Company unconditionally guaranties all of the obligations of Franklin Electric B.V. under the Credit Agreement. Under the Credit Agreement, the Borrowers are required to pay certain fees, including a facility fee of 0.100%0.100 percent to 0.275%0.275 percent (depending on the Company’s leverage ratio) of the aggregate commitment, payable quarterly in arrears. BorrowingsUSD loans may be made either at (i) a Eurocurrency rate based on LIBORSecured Overnight Financing Rate (SOFR) TermBenchmark, with a zero percent floor, plus an applicable margin of 0.85%0.950 percent to 1.88%1.975 percent (depending on the Company's leverage ratio) or (ii) an alternative base rate as defined in the Credit Agreement. EUR loans may be made in Euro Interbank Offer Rate (EURIBOR) Term Benchmark, with a zero percent floor, plus an applicable margin of 0.850 percent to 1.875 percent (depending on the Company’s leverage ratio) or (ii) an alternative base rate as defined in the Credit Agreement.
As of December 31, 2021,2023, the Company had $96.6$11.0 million outstanding borrowings $4.1with a weighted-average interest rate of 6.3 percent, $3.6 million in letters of credit outstanding, and $149.3$335.4 million of available capacity under the Credit Agreement. As of December 31, 2020,2022, the Company had no$122.8 million outstanding borrowings $4.1with a weighted average interest rate of 5.0 percent, $4.0 million in letters of credit outstanding, and $295.9$223.2 million of available capacity under the Credit Agreement.
The Company also has lines of credit for certain subsidiaries with various expiration dates. The aggregate maximum borrowing capacity of these overdraft lines of credits is $20.7$17.9 million. As of December 31, 2021,2023, there were no outstanding borrowings and $20.7$17.9 million of available capacity under these lines of credit. As of December 31, 2022, there were $22.0 million overdraft lines of credit with $2.7 million outstanding borrowings and $19.3 million of available capacity under these lines of credit.
Covenants
The Company’s credit agreements contain customary financial covenants. The Company’s most significant agreements and restrictive covenants are in the New York Life Agreement, the Project Bonds, the Prudential Agreement, and the Credit Agreement; each containing both affirmative and negative covenants. The affirmative covenants relate to financial statements, notices of material events, conduct of business, inspection of property, maintenance of insurance, compliance with laws and most favored lender obligations. The negative covenants include limitations on loans, advances and investments, and the granting of liens by the Company or its subsidiaries, as well as prohibitions on certain consolidations, mergers, sales and transfers of assets. The covenants also include financial requirements including a maximum leverage ratio of 3.50 to 1.00 and a minimum interest coverage ratio of 3.00 to 1.00. Cross default is applicable with the Credit Agreement, the Prudential Agreement, the Project Bonds, and the New York Life Agreement, but only if the Company is defaulting on an obligation exceeding $10.0 million. The Company was in compliance with all financial covenants as of December 31, 2021.2023.
11. SHAREHOLDERS’ EQUITY
Authorized Shares
The Company has the authority to issue 65,000,000, $.10 par value common shares.
The Company also has the authority to issue 100,000 preference shares with no par value and 5,000,000 preferred shares with no par value. No preference or preferred shares have been issued.
Share Repurchases
During 2021, 2020,2023, 2022, and 2019,2021, pursuant to a stock repurchase program authorized by the Company’s Board of Directors, the Company repurchased and retired the following amounts and number of shares:
| | (In millions, except share amounts) | (In millions, except share amounts) | | 2021 | | 2020 | | 2019 | (In millions, except share amounts) | | 2023 | | 2022 | | 2021 |
| Repurchases | Repurchases | | $ | 15.3 | | | $ | 15.2 | | | $ | 6.6 | |
| Shares | Shares | | 192,509 | | | 322,147 | | | 150,778 | |
The Company retired shares in the amount of 101,690, 63,133, and 126,332 79,663,in 2023, 2022, and 82,601 in 2021, 2020, and 2019, respectively, that were received from employees as payment for the exercise price of their stock options and taxes owed upon the exercise of their stock options and release of their restricted awards. The Company also retired shares in the amount of 0, 16,839, and 2,511, 22,438,in 2023, 2022, and 5,345, in 2021, 2020, and 2019, respectively, that had been previously granted as stock awards to employees but were forfeited upon not meeting the required restriction criteria or termination.
12. ACCUMULATED OTHER COMPREHENSIVE INCOME/(LOSS)
Changes in accumulated other comprehensive income/(loss), net of tax, by component are summarized below: | | (In millions) | (In millions) | Foreign Currency Translation Adjustments | | Pension and Post-Retirement Plan Benefit Adjustments (2) | | Total | (In millions) | Foreign Currency Translation Adjustments | | Pension and Post-Retirement Plan Benefit Adjustments | | Total |
| Balance, December 31, 2018 | $ | (134.5) | | | $ | (48.5) | | | $ | (183.0) | |
| Other comprehensive income/(loss) before reclassifications | (5.7) | | | — | | | (5.7) | |
Amounts reclassified from accumulated other comprehensive income/(loss) (1) | — | | | (1.5) | | | (1.5) | |
| Net other comprehensive income/(loss) | (5.7) | | | (1.5) | | | (7.2) | |
| Balance, December 31, 2019 | $ | (140.2) | | | $ | (50.0) | | | $ | (190.2) | |
| Other comprehensive income/(loss) before reclassifications | (12.0) | | | — | | | (12.0) | |
Amounts reclassified from accumulated other comprehensive income/(loss) (1) | — | | | (2.6) | | | (2.6) | |
| Net other comprehensive income/(loss) | (12.0) | | | (2.6) | | | (14.6) | |
| Balance, December 31, 2020 | Balance, December 31, 2020 | $ | (152.2) | | | $ | (52.6) | | | $ | (204.8) | |
| Other comprehensive income/(loss) before reclassifications | Other comprehensive income/(loss) before reclassifications | (27.4) | | | — | | | (27.4) | |
Amounts reclassified from accumulated other comprehensive income/(loss) (1) | — | | | 3.6 | | | 3.6 | |
Amounts reclassified from accumulated other comprehensive income/(loss) (1)(2) | |
| Net other comprehensive income/(loss) | Net other comprehensive income/(loss) | (27.4) | | | 3.6 | | | (23.8) | |
| Balance, December 31, 2021 | Balance, December 31, 2021 | $ | (179.6) | | | $ | (49.0) | | | $ | (228.6) | |
Other comprehensive income/(loss) before reclassifications(1) | |
Amounts reclassified from accumulated other comprehensive income/(loss) (2)(3) | |
| Net other comprehensive income/(loss) | |
| Balance, December 31, 2022 | |
Other comprehensive income/(loss) before reclassifications(1) | |
Amounts reclassified from accumulated other comprehensive income/(loss) (2)(3) | |
| Net other comprehensive income/(loss) | |
| Balance, December 31, 2023 | |
(1) Net of tax (benefit)/expense of $(1.1) million and $1.8 million for 2023 and 2022, respectively.
(2) This accumulated other comprehensive income/(loss) component is included in the computation of net periodic pension cost (refer to Note 7 - Employee Benefit Plans for additional details) and is included in the “Selling, general, and administrative expenses”“Other income/(expense), net” line of the Company’s consolidated statements of income.
(2)(3) Net of tax (benefit)/expense of $0.5 million, $1.8 million and $1.5 million $(1.1) millionfor 2023, 2022, and $(0.6) million for 2021, 2020, and 2019, respectively.
Amounts related to noncontrolling interests were not material.
13. EARNINGS PER SHARE
The Company calculates basic and diluted earnings per common share using the two-class method. Under the two-class method, net earnings are allocated to each class of common stock and participating security as if all of the net earnings for the period had been distributed. The Company’s participating securities consist of share-based payment awards that contain a non-forfeitable right to receive dividends and therefore are considered to participate in undistributed earnings with common shareholders.
Basic earnings per common share excludes dilution and is calculated by dividing net earnings allocable to common shares by the weighted-average number of common shares outstanding for the period. Diluted earnings per common share is calculated by
dividing net earnings allocated to common shares by the weighted-average number of common shares outstanding for the period, as adjusted for the potential dilutive effect of non-participating share-based awards.
The following table sets forth the computation of basic and diluted earnings per share:
| | (In millions, except per share amounts) | (In millions, except per share amounts) | | 2021 | | 2020 | | 2019 | (In millions, except per share amounts) | | 2023 | | 2022 | | 2021 |
| Numerator: | Numerator: | | | | | | | Numerator: | | |
| Net income attributable to Franklin Electric Co., Inc. | Net income attributable to Franklin Electric Co., Inc. | | $ | 153.9 | | | $ | 100.5 | | | $ | 95.5 | |
| Less: Earnings allocated to participating securities | Less: Earnings allocated to participating securities | | 0.9 | | | 0.7 | | | 0.7 | |
| Net income available to common shareholders | Net income available to common shareholders | | $ | 153.0 | | | $ | 99.8 | | | $ | 94.8 | |
| Denominator: | Denominator: | | | | | | |
| Basic weighted average common shares outstanding | Basic weighted average common shares outstanding | | 46.4 | | | 46.2 | | | 46.4 | |
| Basic weighted average common shares outstanding | |
| Basic weighted average common shares outstanding | |
| Effect of dilutive securities: | Effect of dilutive securities: | |
| Non-participating employee stock options and performance awards | | 0.6 | | | 0.5 | | | 0.4 | |
| Non-participating employee stock options, performance awards, and deferred shares to non-employee directors | |
| Non-participating employee stock options, performance awards, and deferred shares to non-employee directors | |
| Non-participating employee stock options, performance awards, and deferred shares to non-employee directors | |
| Diluted weighted average common shares outstanding | Diluted weighted average common shares outstanding | | 47.0 | | | 46.7 | | | 46.8 | |
| Basic earnings per share | Basic earnings per share | | $ | 3.29 | | | $ | 2.16 | | | $ | 2.04 | |
| Diluted earnings per share | Diluted earnings per share | | $ | 3.25 | | | $ | 2.14 | | | $ | 2.03 | |
There were 0.1 million 0.2 million, and 0.2 million stock options outstanding as of 2021, 2020,2023, 2022, and 2019,2021, respectively, that were excluded from the computation of diluted earnings per share, as their inclusion would be anti-dilutive.
14. SHARE-BASED COMPENSATION
In 2023, the Company amended The Franklin Electric Co., Inc. 2017 Stock Plan, (the “2017which is called The Franklin Electric Co., Inc. Amended and Restated 2017 Stock Plan”Plan ("the 2017 Amended and Restated Stock Plan") and increased the number of shares available under the Plan by 900,000 to 2,300,000. The 2017 Amended and Restated Stock Plan is a stock-based compensation plan that provides for discretionary grants of stock options, stock awards, stock unit awards, and stock appreciation rights (“SARs”) to key employees and non-employee directors. The number of shares that may be issued under the Plan is 1,400,000. Stock options and SARs reduce the number of available shares by 1one share for each share subject to the option or SAR, and stock awards and stock unit awards settled in shares reduce the number of available shares by 1.5 shares for every one share delivered.
The Company also maintains the Franklin Electric Co., Inc. 2012 Stock Plan (the “2012 Stock Plan”), which is a share-based compensation plan that provides for discretionary grants of stock options, stock awards and stock unit awards to key employees and non-employee directors.
The 2012 Stock Plan authorized 2,400,000 shares for issuance as follows:
| | | | | | | | |
| 2012 Stock Plan | | Authorized Shares |
| Stock Options | | 1,680,000 |
| Stock/Stock Unit Awards | | 720,000 |
The Company also maintains the Amended and Restated Franklin Electric Co., Inc. Stock Plan (the “2009 Stock Plan”) which, as amended in 2009, provided for discretionary grants of stockNo additional options and stock awards. The 2009 Stock Plan authorized 4,400,000 shares for issuance as follows:
| | | | | |
2009 Stock Plan | Authorized Shares |
Stock Options | 3,200,000 |
Stock Awards | 1,200,000 |
All options in the 2009 Stock Plan have been awarded and no additional awards are granted out of the 2012 Stock Plan. However, there are still unvested awards and unexercised options under this plan.
The Company currently issues new shares from its common stock balance to satisfy option exercises and the settlement of stock awards and stock unit awards made under the outstanding stock plans.
The Company recognizes share-based compensation expense only for the portion of shares that it expects to vest. As such, an estimated forfeiture rate is applied to calculate the share-based compensation expense, which is based on historical forfeiture data. The total share-based compensation expense recognized in 2023, 2022, and 2021 2020,was $10.1 million, $11.0 million, and 2019 was $11.7 million, $10.1respectively. The tax benefit recognized in 2023, 2022, and 2021 was $5.6 million, $4.7 million, and $8.9$7.8 million. Included in the benefit in 2023, 2022, and 2021 were excess tax benefits on share-based compensation of $3.2 million, $2.1 million, and $5.0 million, respectively.
Stock Options:
Under the above plans, the exercise price of each option equals the market price of the Company’s common stock on the date of grant, and the options expire 10 years after the date of the grant. Options granted to employees in 2019 and after vest at 33 percent a year and become fully vested and fully exercisable after 3 years. Options granted prior to 2019 vest at 25 percent a year and become fully vested and fully exercisable after 4 years. Vesting is accelerated upon retirement, death or disability. Subject to the terms of the plans, in general, the aggregate option exercise price and any applicable tax withholding may be satisfied in cash or its equivalent, by the plan participant’s delivery of shares of the Company’s common stock having a fair market value at the time of exercise equal to the aggregate option exercise price and/or the applicable tax withholding or by having shares otherwise subject to the award withheld by the Company or via cashless exercise through a broker-dealer.
The fair value of each option award is estimated on the date of grant using the Black-Scholes option valuation model with a single approach and amortized using a straight-line attribution method over the option’s vesting period. Options granted to retirement eligible employees are immediately expensed. The Company uses historical data to estimate the expected volatility of its stock, the weighted average expected life, the period of time options granted are expected to be outstanding, and its dividend yield. The risk-free rates for periods within the contractual life of the option are based on the U.S. Treasury yield curve in effect at the time of the grant.
The table below provides the weighted average grant-date fair values and key assumptions used for the Black-Scholes model to determine the fair value of options granted during 2021, 2020,2023, 2022, and 2019:2021:
| | | | | 2021 | | 2020 | | 2019 | | | 2023 | | 2022 | | 2021 |
| Risk-free interest rate | Risk-free interest rate | | 0.66 | % | | 1.39 | % | | 2.53 | % | Risk-free interest rate | | 4.02 | % | | 1.87 | % | | 0.66 | % |
| Dividend yield | Dividend yield | | 0.96 | % | | 1.04 | % | | 1.05 | % | Dividend yield | | 0.95 | % | | 0.93 | % | | 0.96 | % |
| | Volatility factor | Volatility factor | | 34.98 | % | | 29.45 | % | | 29.38 | % |
| Volatility factor | |
| Volatility factor | | | 33.81 | % | | 33.88 | % | | 34.98 | % |
| | Expected term | Expected term | | 5.5 years | | 5.5 years | | 5.5 years |
| Expected term | |
| Expected term | | | 6.0 years | | 5.5 years |
| Weighted average grant-date fair value of options | Weighted average grant-date fair value of options | | $ | 21.70 | | | $ | 15.63 | | | $ | 15.61 | |
A summary of the Company’s outstanding stock option activity and related information is as follows:
| | (Shares in thousands) | (Shares in thousands) | | Shares | | Weighted-Average Exercise Price | | Weighted-Average Remaining Contractual Term | | Aggregate
Intrinsic Value (000’s) | (Shares in thousands) | | Shares | | Weighted-Average Exercise Price | | Weighted-Average Remaining Contractual Term | | Aggregate
Intrinsic Value (000’s) |
Stock Options |
Stock Options | |
| | Outstanding at beginning of 2021 | | 1,331 | | | $ | 41.90 | | | | | |
| Outstanding at beginning of 2023 | |
| | Outstanding at beginning of 2023 | |
| | Outstanding at beginning of 2023 | | | 1,040 | | | $ | 52.91 | | | |
| Granted | Granted | | 152 | | | 73.14 | | | | | | Granted | | 77 | | | 94.87 | | 94.87 | | | | | |
| Exercised | Exercised | | (440) | | | 35.33 | | | | | | Exercised | | (216) | | | 42.54 | | 42.54 | | | | | |
| Forfeited | Forfeited | | — | | | — | | | | | | Forfeited | | (1) | | | 84.78 | | 84.78 | | | | | |
| | Outstanding at end of 2021 | | 1,043 | | | $ | 49.21 | | | 5.87 years | | $ | 47,323 | |
| Expired | |
| Outstanding at end of 2023 | |
| Outstanding at end of 2023 | |
| Outstanding at end of 2023 | |
| Expected to vest after applying forfeiture rate | Expected to vest after applying forfeiture rate | | 1,042 | | | $ | 49.17 | | | 5.87 years | | $ | 47,277 | |
| Vested and exercisable at end of period | Vested and exercisable at end of period | | 707 | | | $ | 43.22 | | | 4.80 years | | $ | 36,306 | |
| | (In millions) | (In millions) | | 2021 | | 2020 | | 2019 | (In millions) | | 2023 | | 2022 | | 2021 |
| Intrinsic value of options exercised | Intrinsic value of options exercised | | $ | 20.7 | | | $ | 3.3 | | | $ | 4.6 | |
| Cash received from the exercise of options | Cash received from the exercise of options | | 15.5 | | | 3.7 | | | 3.2 | |
| Fair value of shares vested | Fair value of shares vested | | 3.9 | | | 2.9 | | | 2.6 | |
| Tax benefit of options exercised | Tax benefit of options exercised | | 5.1 | | | 0.8 | | | 1.1 | |
As of December 31, 2021,2023, there was $0.9 million of total unrecognized compensation cost related to non-vested stock options granted under the stock plans. That cost is expected to be recognized over a weighted-average period of 1.28 years.
Stock/Stock Unit Awards:
Under the 2009 Stock Plan, non-employee directors and employees may be granted stock awards. Under the 2012 Stock Plan and the 2017 Stock Plan, non-employee directors and employees may be granted stock awards and stock units.
Stock awards to non-employee directors are generally fully vested when made. Stock/stock unit awards to employees cliff vest over 3 or 4 years (subject to accelerated vesting of a pro rata portion in the case of retirement, death or disability) and may be contingent on the attainment of certain performance goals. Dividends are paid to the recipient prior to vesting, except that dividends on
performance-based stock awards under the 2012 Stock Plan and the 2017 Stock Plan will be paid only to the extent the performance goals are met.
Stock/stock unit awards granted to retirement eligible employees are expensed over the vesting period. Compensation cost for the performance stock/stock unit awards is accrued based on the probable outcome of specified performance conditions.
A summary of the Company’s restricted stock/stock unit award activity and related information is as follows:
| | (Shares in thousands) | (Shares in thousands) | | (Shares in thousands) | |
Shares | | Weighted-Average Grant-
Date Fair Value |
| Restricted Stock/Stock Unit Awards | Restricted Stock/Stock Unit Awards | |
Shares | | Weighted-Average Grant-
Date Fair Value |
| | Non-vested at beginning of 2021 | | 403 | | | $ | 49.34 | |
| Non-vested at beginning of 2023 | |
| | Non-vested at beginning of 2023 | |
| | Non-vested at beginning of 2023 | |
| Awarded | Awarded | | 104 | | | 74.23 | |
| Vested | Vested | | (138) | | | 44.39 | |
| Forfeited | Forfeited | | (21) | | | 58.27 | |
| Non-vested at end of 2021 | | 348 | | | $ | 58.20 | |
| Non-vested at end of 2023 | |
The weighted-average grant date fair value of restricted stock/stock unit awards granted in 2023, 2022, and 2021, 2020,is $87.31, $81.16, and 2019, is $74.23, $59.28,respectively. The fair value of restricted stock/stock unit awards that vested in 2023, 2022, and $51.47,2021, was $8.0 million, $9.1 million, and $6.1 million, respectively.
As of December 31, 2021,2023, there was $7.8$8.7 million of total unrecognized compensation cost related to non-vested stock/stock unit awards granted under the stock plans. That cost is expected to be recognized over a weighted-average period of 0.961.32 years.
15. SEGMENT AND GEOGRAPHIC INFORMATION
The Company’s business consists of the Water Systems, Distribution, and Fueling Systems reportable segments, based on the principal end market served. The Company includes unallocated corporate expenses and intercompany eliminations in an “Intersegment Eliminations/Other” segment that together with the Water Systems, Distribution, and Fueling Systems segments, represent the Company.
The Water Systems segment designs, manufactures and sells motors, pumps, electronic controls, water treatment systems and related parts and equipment primarily for use in submersible water or other fluid system applications. The Fueling Systems segment designs, manufactures and sells pumps, electronic controls and related parts and equipment primarily for use in submersible fueling system applications. The Fueling Systems segment integrates and sells motors and electronic controls produced by the Water Systems segment. The Company reports these product transfers between Water and Fueling as inventory transfers since a significant number of the Company's manufacturing facilities are shared across segments for scale and efficiency purposes. The Distribution segment sells to and provides presale support and specifications to the installing contractors. The Distribution segment sells products produced by the Water Systems segment. The Company reports intersegment transfers from Water Systems to Distribution as intersegment revenue at market prices to properly reflect the commercial arrangement of vendor to customer that exists between the Water SystemSystems and Distribution segments.
Segment operating income is a key financial performance measure. Operating income by segment is based on net sales less identifiable operating expenses and allocations and includes profits recorded on sales to other segments of the Company.
The accounting policies of the Company’s reportable segments are the same as those described in Note 1 - Summary of Significant Accounting Policies. Performance is evaluated based on the sales and operating income of the segments and a variety of ratios to measure performance. These results are not necessarily indicative of the results of operations that would have occurred had each segment been an independent, stand-alone entity during the periods presented.
Financial information by reportable business segment is included in the following summary:
| | | | | | | | | | | | | | | | | |
| Net Sales |
| (In millions) | 2021 | | 2020 | | 2019 |
| Water Systems | | | | | |
| External sales | | | | | |
| United States & Canada | $ | 460.8 | | | $ | 327.6 | | | $ | 367.6 | |
| Latin America | 139.5 | | | 118.5 | | | 124.2 | |
| Europe, Middle East & Africa | 189.8 | | | 156.8 | | | 155.6 | |
| Asia Pacific | 85.1 | | | 70.9 | | | 81.8 | |
| Intersegment sales | | | | | |
| United States & Canada | 88.4 | | | 60.9 | | | 52.3 | |
| Total sales | 963.6 | | | 734.7 | | | 781.5 | |
| Distribution | | | | | |
| External sales | | | | | |
| United States & Canada | 497.6 | | | 328.4 | | | 291.8 | |
| Intersegment sales | — | | | — | | | — | |
| Total sales | 497.6 | | | 328.4 | | | 291.8 | |
| Fueling Systems | | | | | |
| External sales | | | | | |
| United States & Canada | 198.5 | | | 158.2 | | | 173.5 | |
| All other | 90.6 | | | 86.9 | | | 120.1 | |
| Intersegment sales | — | | | — | | | — | |
| Total Sales | 289.1 | | | 245.1 | | | 293.6 | |
| | | | | |
| Intersegment Eliminations/Other | (88.4) | | | (60.9) | | | (52.3) | |
| Consolidated | $ | 1,661.9 | | | $ | 1,247.3 | | | $ | 1,314.6 | |
| | | | | |
| Operating income (loss) |
| 2021 | | 2020 | | 2019 |
| Water Systems | $ | 139.1 | | | $ | 114.4 | | | $ | 103.0 | |
| Distribution | 35.9 | | | 11.5 | | | 3.6 | |
| Fueling Systems | 79.5 | | | 63.4 | | | 75.8 | |
| Intersegment Eliminations/Other | (65.3) | | | (58.8) | | | (55.3) | |
| Consolidated | $ | 189.2 | | | $ | 130.5 | | | $ | 127.1 | |
| | | | | | | | | | | | | | | | | | | | | | | | | | | | | | | | | | | |
| | Total assets | | Depreciation |
| 2021 | | 2020 | | 2019 | | 2021 | | 2020 | | 2019 |
| Water Systems | $ | 894.4 | | | $ | 645.9 | | | $ | 658.3 | | | $ | 19.8 | | | $ | 18.7 | | | $ | 19.0 | |
| Distribution | 363.0 | | | 249.0 | | | 180.2 | | | 4.4 | | | 2.6 | | | 2.8 | |
| Fueling Systems | 273.6 | | | 268.9 | | | 283.8 | | | 2.2 | | | 2.1 | | | 2.1 | |
| Other | 44.2 | | | 108.5 | | | 72.4 | | | 3.8 | | | 3.7 | | | 3.7 | |
| Consolidated | $ | 1,575.2 | | | $ | 1,272.3 | | | $ | 1,194.7 | | | $ | 30.2 | | | $ | 27.1 | | | $ | 27.6 | |
| | | | | | | | | | | |
| | Amortization | | Capital expenditures |
| 2021 | | 2020 | | 2019 | | 2021 | | 2020 | | 2019 |
| Water Systems | $ | 11.9 | | | $ | 6.9 | | | $ | 6.9 | | | $ | 19.4 | | | $ | 16.9 | | | $ | 15.1 | |
| Distribution | 0.7 | | | 0.6 | | | 0.5 | | | 6.5 | | | 3.5 | | | 3.9 | |
| Fueling Systems | 1.8 | | | 1.8 | | | 1.9 | | | 3.0 | | | 2.0 | | | 1.9 | |
| Other | — | | | 0.1 | | | 0.1 | | | 1.2 | | | 0.5 | | | 1.2 | |
| Consolidated | $ | 14.4 | | | $ | 9.4 | | | $ | 9.4 | | | $ | 30.1 | | | $ | 22.9 | | | $ | 22.1 | |
| | | | | | | | | | | | | | | | | |
| Net Sales |
| (In millions) | 2023 | | 2022 | | 2021 |
| Water Systems | | | | | |
| External sales | | | | | |
| United States & Canada | $ | 636.0 | | | $ | 596.9 | | | $ | 460.8 | |
| Latin America | 174.2 | | | 159.3 | | | 139.5 | |
| Europe, Middle East & Africa | 198.3 | | | 192.8 | | | 189.8 | |
| Asia Pacific | 86.8 | | | 92.5 | | | 85.1 | |
| Intersegment sales | | | | | |
| United States & Canada | 108.4 | | | 116.0 | | | 88.4 | |
| Total sales | 1,203.7 | | | 1,157.5 | | | 963.6 | |
| Distribution | | | | | |
| External sales | | | | | |
| United States & Canada | 673.3 | | | 668.1 | | | 497.6 | |
| Intersegment sales | — | | | — | | | — | |
| Total sales | 673.3 | | | 668.1 | | | 497.6 | |
| Fueling Systems | | | | | |
| External sales | | | | | |
| United States & Canada | 220.9 | | | 242.6 | | | 198.5 | |
| All other | 75.6 | | | 91.5 | | | 90.6 | |
| Intersegment sales | — | | | — | | | — | |
| Total Sales | 296.5 | | | 334.1 | | | 289.1 | |
| | | | | |
| Intersegment Eliminations/Other | (108.4) | | | (116.0) | | | (88.4) | |
| Consolidated | $ | 2,065.1 | | | $ | 2,043.7 | | | $ | 1,661.9 | |
| | | | | |
| Operating income (loss) |
| 2023 | | 2022 | | 2021 |
| Water Systems | $ | 196.6 | | | $ | 172.3 | | | $ | 139.1 | |
| Distribution | 34.3 | | | 54.5 | | | 35.9 | |
| Fueling Systems | 92.7 | | | 96.8 | | | 79.5 | |
| Intersegment Eliminations/Other | (61.2) | | | (66.4) | | | (65.3) | |
| Consolidated | $ | 262.4 | | | $ | 257.2 | | | $ | 189.2 | |
| | | | | | | | | | | | | | | | | | | | | | | | | | | | | | | | | | | |
| | Total assets | | Depreciation |
| 2023 | | 2022 | | 2021 | | 2023 | | 2022 | | 2021 |
| Water Systems | $ | 1,044.4 | | | $ | 1,017.5 | | | $ | 894.4 | | | $ | 22.1 | | | $ | 20.4 | | | $ | 19.8 | |
| Distribution | 365.6 | | | 360.4 | | | 363.0 | | | 6.8 | | | 6.1 | | | 4.4 | |
| Fueling Systems | 256.4 | | | 269.1 | | | 273.6 | | | 2.6 | | | 2.5 | | | 2.2 | |
| Other | 61.7 | | | 47.2 | | | 44.2 | | | 3.6 | | | 4.1 | | | 3.8 | |
| Consolidated | $ | 1,728.1 | | | $ | 1,694.2 | | | $ | 1,575.2 | | | $ | 35.1 | | | $ | 33.1 | | | $ | 30.2 | |
| | | | | | | | | | | |
| | Amortization | | Capital expenditures |
| 2023 | | 2022 | | 2021 | | 2023 | | 2022 | | 2021 |
| Water Systems | $ | 14.7 | | | $ | 14.7 | | | $ | 11.9 | | | $ | 28.6 | | | $ | 23.4 | | | $ | 19.4 | |
| Distribution | 0.8 | | | 0.8 | | | 0.7 | | | 9.3 | | | 13.4 | | | 6.5 | |
| Fueling Systems | 1.6 | | | 1.7 | | | 1.8 | | | 3.0 | | | 2.7 | | | 3.0 | |
| Other | — | | | — | | | — | | | 2.3 | | | 1.6 | | | 1.2 | |
| Consolidated | $ | 17.1 | | | $ | 17.2 | | | $ | 14.4 | | | $ | 43.2 | | | $ | 41.1 | | | $ | 30.1 | |
Cash and property, plant and equipment are the major asset groups in “Other” of total assets for the fiscal years ended December 31, 2021,2023, December 31, 20202022 and December 31, 2019.2021.
Financial information by geographic region is as follows:
| | | | Net sales | | Long-lived assets | | Net sales | | Long-lived assets |
| (In millions) | (In millions) | 2021 | | 2020 | | 2019 | | 2021 | | 2020 | | 2019 | (In millions) | 2023 | | 2022 | | 2021 | | 2023 | | 2022 | | 2021 |
| United States | United States | $ | 1,075.7 | | | $ | 760.6 | | | $ | 776.6 | | | $ | 604.5 | | | $ | 405.9 | | | $ | 394.7 | |
| Foreign | Foreign | 586.2 | | | 486.7 | | | 538.0 | | | 238.4 | | | 238.3 | | | 223.4 | |
| Consolidated | Consolidated | $ | 1,661.9 | | | $ | 1,247.3 | | | $ | 1,314.6 | | | $ | 842.9 | | | $ | 644.2 | | | $ | 618.1 | |
Net sales are attributed to geographic regions based upon the ship to location of the customer. Long-lived assets are attributed to geographic regions based upon the country of domicile.
The Company offers a large array of products and systems to multiple markets and customers. Product sales information is tracked regionally and products are categorized differently between regions based on local needs and reporting requirements. However, net sales by segment are representative of the Company’s sales by major product category. The Company sells its products through various distribution channels including wholesale and retail distributors, specialty distributors, industrial and petroleum equipment distributors, as well as major oil and utility companies and original equipment manufacturers.
No single customer accounted for more than 10 percent of the Company’s consolidatednet sales in 2021, 2020,2023, 2022, or 2019.2021. No single customer accounted for more than 10 percent of the Company’s gross accounts receivable in 20212023 or 2020.2022.
16. COMMITMENTS AND CONTINGENCIES
In 2011, the Company became aware of a review of alleged issues with certain underground piping connections installed in filling stations in France owned by the French Subsidiary of Exxon Mobile, Esso S.A.F. A French court ordered that a designated, subject-matter expert review 103 filling stations to determine what, if any, damages are present and the cause of those damages. The Company has participated in this investigation since 2011, along with several other third parties including equipment installers, engineering design firms who designed and provided specifications for the stations, and contract manufacturers of some of the installed equipment. TheIn May 2022, the subject-matter expert has issued their preliminaryits final report, which indicates that total damages incurred by Esso amounted to approximately 129.5 million euro.Euro. It is the Company’s position that its products were not the cause of any alleged damage. The Company has retained experts to demonstrate that its products did not cause the damage, and in January 2021, submitted its response to the expert’s preliminaryexpert's final report for each station. The expert's response to the Company's report is due to the Court in June 2022.February 2023. The Company cannot predict the ultimate outcome of this matter. Any exposure related to this matter is neither probable nor reasonably estimable at this time. If payments result from a resolution of this matter, depending on the amount, they could have a material effect on the Company’s financial position, results of operations, or cash flows.
The Company is defending other various claims and legal actions which have arisen in the ordinary course of business. In the opinion of management, based on current knowledge of the facts and after discussion with counsel, these claims and legal
actions can be defended or resolved without a material effect on the Company’s financial position, results of operations, and net cash flows.
At December 31, 2021,2023, the Company had $13.2$11.1 million of commitments primarily for capital expenditures and the purchase of raw materials to be used in production.
At December 31, 2023, the Company has a contingent consideration liability with an estimated fair value of $3.0 million that could result in a payment up to $5.0 million if a future profitability milestone is achieved.
The changes in the carrying amount of the warranty accrual, as recorded in the “Accrued expenses and other current liabilities” line of the Company’s consolidated balance sheets for 20212023 and 2020,2022, are as follows:
| | (In millions) | (In millions) | | 2021 | | 2020 | (In millions) | | 2023 | | 2022 |
| Beginning balance | Beginning balance | | $ | 9.7 | | | $ | 9.1 | |
| Accruals related to product warranties | Accruals related to product warranties | | 9.7 | | | 9.4 | |
| Additions related to acquisitions | Additions related to acquisitions | | 0.1 | | | 0.6 | |
| Reductions for payments made | Reductions for payments made | | (9.0) | | | (9.4) | |
| Ending balance | Ending balance | | $ | 10.5 | | | $ | 9.7 | |
The Company maintains certain warehouses, distribution centers, office space, and equipment operating leases. The Company also has lease agreements that are classified as financing. However, these financing leases are immaterial to the Company.
The components of the Company's operating lease portfolio as of 2021, 2020,2023, 2022, and 20192021 are as follows:
| | Lease Cost (In millions): | Lease Cost (In millions): | | 2021 | | 2020 | | 2019 | Lease Cost (In millions): | | 2023 | | 2022 | | 2021 |
| Operating lease cost | Operating lease cost | | $ | 13.6 | | | $ | 11.4 | | | $ | 11.7 | |
| Short-term lease cost | Short-term lease cost | | 0.6 | | | 0.4 | | | 0.5 | |
| | Other Information: | Other Information: | |
| Other Information: | |
| Other Information: | |
| Weighted-average remaining lease term | |
| Weighted-average remaining lease term | |
| Weighted-average remaining lease term | Weighted-average remaining lease term | | 4.2 years | | 3.9 years | |
| Weighted-average discount rate | Weighted-average discount rate | | 3.9 | % | | 3.7 | % | |
| Weighted-average discount rate | |
| Weighted-average discount rate | |
As of December 31, 2021, theThe Company has entered into lease agreements with aggregate future minimum payments of approximately $1.1$2.2 million of additional ROU assets related to lease that have not yet commenced but create future lease obligations.as of December 31, 2023.
The future minimum rental payments for non-cancellable operating leases as of December 31, 2021,2023, are as follows:
| | (In millions) | (In millions) | Total | | 2022 | | 2023 | | 2024 | | 2025 | | 2026 | | Thereafter | (In millions) | Total | | 2024 | | 2025 | | 2026 | | 2027 | | 2028 | | Thereafter |
| Undiscounted future minimum rental payments | Undiscounted future minimum rental payments | $ | 52.4 | | | $ | 16.4 | | | $ | 12.3 | | | $ | 8.3 | | | $ | 5.3 | | | $ | 3.9 | | | $ | 6.2 | |
| Less: Imputed Interest | Less: Imputed Interest | 4.1 | | |
| Present value of lease liabilities | Present value of lease liabilities | $ | 48.3 | | |
| Present value of lease liabilities | |
| Present value of lease liabilities | |
REPORT OF INDEPENDENT REGISTERED PUBLIC ACCOUNTING FIRM
To the Shareholdersshareholders and the Board of Directors of Franklin Electric Co., Inc.
Fort Wayne, Indiana
Opinion on the Financial Statements
We have audited the accompanying consolidated balance sheets of Franklin Electric Co., Inc. and subsidiaries (the "Company") as of December 31, 20212023 and 2020,2022, the related consolidated statements of income, comprehensive income, equity, and cash flows, for each of the three years in the period ended December 31, 2021,2023, and the related notes and the schedule listed in the Index at Item 15 (collectively referred to as the "financial statements"). In our opinion, the financial statements present fairly, in all material respects, the financial position of the Company as of December 31, 20212023 and 2020,2022, and the results of its operations and its cash flows for each of the three years in the period ended December 31, 2021,2023, in conformity with accounting principles generally accepted in the United States of America.
We have also audited, in accordance with the standards of the Public Company Accounting Oversight Board (United States) (PCAOB), the Company's internal control over financial reporting as of December 31, 2021,2023, based on criteria established in in Internal Control — Integrated Framework (2013) issued by the Committee of Sponsoring Organizations of the Treadway Commission and our report dated February 25, 2022,23, 2024, expressed an unqualified opinion on the Company's internal control over financial reporting.
Basis for Opinion
These financial statements are the responsibility of the Company's management. Our responsibility is to express an opinion on the Company's financial statements based on our audits. We are a public accounting firm registered with the PCAOB and are required to be independent with respect to the Company in accordance with the U.S. federal securities laws and the applicable rules and regulations of the Securities and Exchange Commission and the PCAOB.
We conducted our audits in accordance with the standards of the PCAOB. Those standards require that we plan and perform the audit to obtain reasonable assurance about whether the financial statements are free of material misstatement, whether due to error or fraud. Our audits included performing procedures to assess the risks of material misstatement of the financial statements, whether due to error or fraud, and performing procedures that respond to those risks. Such procedures included examining, on a test basis, evidence regarding the amounts and disclosures in the financial statements. Our audits also included evaluating the accounting principles used and significant estimates made by management, as well as evaluating the overall presentation of the financial statements. We believe that our audits provide a reasonable basis for our opinion.
Critical Audit Matter
The critical audit matter communicated below is a matter arising from the current-period audit of the financial statements that was communicated or required to be communicated to the audit committee and that (1) relates to accounts or disclosures that are material to the financial statements and (2) involved our especially challenging, subjective, or complex judgments. The communication of critical audit matters does not alter in any way our opinion on the financial statements, taken as a whole, and we are not, by communicating the critical audit matter below, providing a separate opinion on the critical audit matter or on the accounts or disclosures to which it relates.
New Aqua— Intangible AssetsIncome Taxes – Uncertain Tax Positions — Refer to Notes 1 3 and 69 to the financial statements
Critical Audit Matter Description
As describedThe Company’s operations involve dealing with uncertainties and judgments in Note 1, 3,the application of complex tax regulations in multiple jurisdictions. The Company records a liability for uncertain tax positions by establishing a more likely than not recognition threshold and 6measurement attribute for recognition and measurement of a tax position taken or expected to be taken in a tax return. Accruals for income tax uncertainties represent estimates that are subject to the consolidated financial statements, the Company completed multiple acquisitions for total cash consideration of $244.0 million in the year ended December 31, 2021. The Company allocated the purchase price of its acquisitions to the assets acquired, liabilities assumed, and noncontrolling interests based upon their respective fair values at acquisition date utilizing management estimates and inputs from an independent third-party valuation firm to assist in determining these fair values. The purchase price allocation resulted in identifiable intangible asset of $131.9 million of which $93.7 million related to the customer relationships and trade names acquired in connectioninherent uncertainties associated with the acquisition of New Aqua, LLC (“New Aqua”). Management estimated the fair value of the New Aqua trade names using the relief of royalty method and the fair value of the New Aqua customer relationships using the multi-period excess earnings discounted cash flow method. The fair value determination of these intangibles required management to make significant estimates and assumptions related to business and valuation assumptions, including revenue growth rates, profit margins, discount rates, attrition rates, and royalty rates.tax audit process.
We identified management’s estimateBecause of the fair valuenumerous taxing jurisdictions in which the Company files its tax returns and the complexity of acquired New Aqua trade namestax laws and customer relationships as a critical audit matter becauseregulations, auditing uncertain tax positions and the determination of whether the significant judgments made by management to estimate the respective fair values. This requiredmore likely than not threshold was met requires a high degree of auditor judgment and an increased extent of effort, including the need to involveinvolvement of our fair value specialists, when performing audit procedures to evaluate the reasonableness of management’s projected future cash flows and the selection of valuation assumptions.income tax specialists.
How the Critical Audit Matter Was Addressed in the Audit
Our audit procedures related to the business and valuation assumptions to estimate the fair value for these intangible assetsunrecognized tax benefits included the following, among others:
•We tested the effectiveness of controls over management’s determination of the fair values of acquired trade names and customer relationships,income taxes, including those over the projected future cash flows and selection of revenue growth rates, profit margins, discount rates, attrition rates, and royalty rates.identifying uncertain tax positions.
•We assessed the reasonableness of management’s selection of revenue growth rates and profit margins by comparing the projections to historical results, internal communications to management, and certain industry and market trends.
•Withevaluated, with the assistance of our fair valuetax specialists, we evaluated the reasonablenessa selection of the valuation methodsCompany’s uncertain tax positions and assumptions,the Company’s application of the more likely than not principle by performing the following:
•Obtaining management memoranda, including their third-party specialist memoranda, regarding the discount rates, attrition rates,analysis of uncertain tax positions and royalty rates, by:identifying the key judgments and evaluating whether the analysis was consistent with our interpretation of the relevant laws and regulations.
•Evaluating the matters raised by tax authorities in former and ongoing tax examinations and considering the implications of these matters on open tax years.
•Assessing the appropriatenesschanges and interpretation of the valuation methodology used to determine the valuation assumptions.applicable tax law.
•Testing the source information underlying the determination of the valuation assumptions and testing the mathematical accuracy of the calculations.
•Developing a range of independent estimates of the valuation assumptions and comparing the valuation assumptions selected by management to the range of independent estimates.
/s/DELOITTE & TOUCHE LLP
Deloitte & Touche LLP
Chicago, Illinois
February 25, 202223, 2024
We have served as the Company’s auditor since 1988.
ITEM 9. CHANGES IN AND DISAGREEMENTS WITH ACCOUNTANTS ON ACCOUNTING AND FINANCIAL DISCLOSURE
None.
ITEM 9A. CONTROLS AND PROCEDURES
As of the end of the period covered by this report (the “Evaluation Date”), the Company carried out an evaluation, under the supervision and with the participation of the Company’s management, including the Company’s Chief Executive Officer and the Company’s Chief Financial Officer, of the effectiveness of the design and operation of the Company’s disclosure controls and procedures pursuant to Exchange Act Rules 13a-15. Based upon that evaluation, the Company’s Chief Executive Officer and the Company’s Chief Financial Officer concluded that, as of the Evaluation Date, the Company’s disclosure controls and procedures were effective.
There have been no changes in the Company’s internal control over financial reporting identified in connection with the evaluation required by Rules 13a-15 under the Exchange Act during the last fiscal quarter that have materially affected, or are reasonably likely to materially affect the Company’s internal control over financial reporting.
MANAGEMENT’S REPORT ON INTERNAL CONTROL OVER FINANCIAL REPORTING
Management is responsible for establishing and maintaining an adequate system of internal control over financial reporting of the Company. This system is designed to provide reasonable assurance regarding the reliability of financial reporting and the preparation of financial statements for external purposes in accordance with accounting principles generally accepted in the United States of America.
The Company’s internal control over financial reporting includes those policies and procedures that (i) pertain to the maintenance of records that, in reasonable detail, accurately and fairly reflect the transactions and dispositions of the assets of the Company; (ii) provide reasonable assurance that transactions are recorded as necessary to permit preparation of financial statements in accordance with generally accepted accounting principles, and that receipts and expenditures of the Company are being made only in accordance with authorizations of management and directors of the Company; (iii) provide reasonable assurance regarding prevention or timely detection of unauthorized acquisition, use, or disposition of the Company’s assets that could have a material effect on the financial statements.
Because of its inherent limitations, internal control over financial reporting can provide only reasonable assurance with respect to financial statement preparation and may not prevent or detect misstatements. Further, because of changes in conditions, effectiveness of internal controls over financial reporting may vary over time.
Management conducted an evaluation of the effectiveness of the system of internal control over financial reporting based on the framework in the Internal Control - Integrated Framework (2013) issued by the Committee of Sponsoring Organizations of the Treadway Commission. Management excluded Puronics, Inc.; New Aqua, LLC; Minetuff Dewatering Pumps Australia Pty Ltd; B&R Industries, Inc.; and Blake Group Holdings, Inc.Hydropompe S.r.l. as well as the asset acquisitions of Power Integrity Services, LLCPhil-Good Products, Inc., Aqua Systems of Fort Myers, Action Manufacturing and Atlantic TurbineSupply, Inc, and LCA Pump, LLC (Note 3 - Acquisitions) from its assessment of internal controls over financial reporting as these acquisitionsthe acquisition occurred in 2021.2023. This exclusion is in accordance with the general guidance from the Staff of the Securities and Exchange Commission that an assessment of a recently acquired business may be omitted from the scope of management’s assessment of internal control over financial reporting for one year following the acquisition. The net sales and total assets of the current year acquisitions represented was approximately 4.4less than 1 percent and 17.72.6 percent of the consolidated financial statement amounts as of and for the year ended December 31, 2021.2023. Based on its evaluation, management concluded that the Company’s system of internal control over financial reporting was effective as of December 31, 2021.2023.
Our independent registered public accounting firm has issued an audit report on the effectiveness of the Company’s internal control over financial reporting as of December 31, 2021.2023. This report appears on page 5455.
REPORT OF INDEPENDENT REGISTERED PUBLIC ACCOUNTING FIRM
To the Shareholdersshareholders and the Board of Directors of Franklin Electric Co., Inc.
Fort Wayne, Indiana
Opinion on Internal Control over Financial Reporting
We have audited the internal control over financial reporting of Franklin Electric Co., Inc. and subsidiaries (the “Company”) as of December 31, 2021,2023, based on criteria established in Internal Control — Integrated Framework (2013) issued by the Committee of Sponsoring Organizations of the Treadway Commission (COSO). In our opinion, the Company maintained, in all material respects, effective internal control over financial reporting as of December 31, 2021,2023, based on criteria established in Internal Control — Integrated Framework (2013) issued by COSO.
We have also audited, in accordance with the standards of the Public Company Accounting Oversight Board (United States) (PCAOB), the consolidated financial statements as of and for the year ended December 31, 2021,2023, of the Company and our report dated February 25, 2022,23, 2024, expressed an unqualified opinion on those financial statements.
As described in Management’s Report on Internal Control over Financial Reporting, management excluded Puronics, Inc., New Aqua, LLC, Minetuff Dewatering Pumps Australia Pty Ltd., B&R Industries, Inc., and Blake Group Holdings, Inc.from its assessment the internal control over financial reporting at Hydropompe S.r.l. as well as the asset acquisitions of Power Integrity Services, LLCPhil-Good Products, Inc., Aqua Systems of Fort Myers, Action Manufacturing and Atlantic TurbineSupply, Inc, and LCA Pump, LLC, from its assessmentwhich were acquired in 2023. These acquired businesses constitute less than 1% and 2.6% of internal control over financial reporting as these acquisitions occurred in the twelve months ended December 31, 2021. The combined net sales and total assets, of these acquisitions represented approximately 4.4 percent and 17.7 percent, respectively, of the consolidated financial statement amountsstatements of the Company as of and for the year ended December 31, 2021.2023. Accordingly, our audit did not include the internal control over financial reporting at these acquired companies.businesses.
Basis for Opinion
The Company’s management is responsible for maintaining effective internal control over financial reporting and for its assessment of the effectiveness of internal control over financial reporting, included in the accompanying Management'sManagement’s Report on Internal Control over Financial Reporting. Our responsibility is to express an opinion on the Company’s internal control over financial reporting based on our audit. We are a public accounting firm registered with the PCAOB and are required to be independent with respect to the Company in accordance with the U.S. federal securities laws and the applicable rules and regulations of the Securities and Exchange Commission and the PCAOB.
We conducted our audit in accordance with the standards of the PCAOB. Those standards require that we plan and perform the audit to obtain reasonable assurance about whether effective internal control over financial reporting was maintained in all material respects. Our audit included obtaining an understanding of internal control over financial reporting, assessing the risk that a material weakness exists, testing and evaluating the design and operating effectiveness of internal control based on the assessed risk, and performing such other procedures as we considered necessary in the circumstances. We believe that our audit provides a reasonable basis for our opinion.
Definition and Limitations of Internal Control over Financial Reporting
A company’s internal control over financial reporting is a process designed to provide reasonable assurance regarding the reliability of financial reporting and the preparation of financial statements for external purposes in accordance with generally accepted accounting principles. A company’s internal control over financial reporting includes those policies and procedures that (1) pertain to the maintenance of records that, in reasonable detail, accurately and fairly reflect the transactions and dispositions of the assets of the company; (2) provide reasonable assurance that transactions are recorded as necessary to permit preparation of financial statements in accordance with generally accepted accounting principles, and that receipts and expenditures of the company are being made only in accordance with authorizations of management and directors of the company; and (3) provide reasonable assurance regarding prevention or timely detection of unauthorized acquisition, use, or disposition of the company’s assets that could have a material effect on the financial statements.
Because of its inherent limitations, internal control over financial reporting may not prevent or detect misstatements. Also, projections of any evaluation of effectiveness to future periods are subject to the risk that controls may become inadequate because of changes in conditions, or that the degree of compliance with the policies or procedures may deteriorate.
/s/ DELOITTE & TOUCHE LLP
Deloitte & Touche LLP
Chicago, Illinois
February 25, 202223, 2024
ITEM 9B. OTHER INFORMATION
None.None of the Company’s directors or officers adopted, modified, or terminated a Rule 10b5-1 trading arrangement or a non-Rule 10b5-1 trading arrangement during the Company’s fiscal quarter ended December 31, 2023.
ITEM 9C. DISCLOSURE REGARDING FOREIGN JURISDICTIONS THAT PREVENT INSPECTIONS
Not applicable.
PART III
ITEM 10. DIRECTORS, EXECUTIVE OFFICERS AND CORPORATE GOVERNANCE
The information concerning directors and director nominees required by this Item 10 is set forth in the Company’s Proxy Statement for the Annual Meeting of Shareholders to be held on May 6, 2022,3, 2024, under the headings of “PROPOSAL 1: ELECTION OF DIRECTORS” and “INFORMATION CONCERNING NOMINEES AND CONTINUING DIRECTORS,” and is incorporated herein by reference.
The information concerning executive officers required by this Item 10 is contained in Part I of this Form 10-K under the heading of “INFORMATION ABOUT OUR EXECUTIVE OFFICERS,” and is incorporated herein by reference.
The information concerning Regulation S-K, Item 405 disclosures of delinquent Form 3, 4, or 5 filers required by this Item 10 is set forth in the Company’s Proxy Statement for the Annual Meeting of Shareholders to be held on May 6, 2022,3, 2024, under the heading of “DELINQUENT SECTION 16(a) REPORTS” and is incorporated herein by reference.
The information concerning the procedures for shareholders to recommend nominees to the Company’s board of directors, the Audit Committee of the board of directors, and the Company’s code of conduct and ethics required by this Item 10 is set forth in the Company’s Proxy Statement for the Annual Meeting of Shareholders to be held on May 6, 20223, 2024 under the heading “INFORMATION ABOUT THE BOARD AND ITS COMMITTEES,” and is incorporated herein by reference.
ITEM 11. EXECUTIVE COMPENSATION
The information required by Item 11 is set forth in the Company’s Proxy Statement for the Annual Meeting of Shareholders to be held on May 6, 2022,3, 2024, under the headings of “INFORMATION ABOUT THE BOARD AND ITS COMMITTEES,” “MANAGEMENT ORGANIZATION AND COMPENSATION COMMITTEE REPORT,” “COMPENSATION, DISCUSSION AND ANALYSIS,” “SUMMARY COMPENSATION TABLE,” “GRANT OF PLAN BASED AWARDS TABLE,” “OUTSTANDING EQUITY AWARDS AT FISCAL YEAR-END TABLE,” “OPTION EXERCISES AND STOCK VESTED TABLE,” “PAY VERSUS PERFORMANCE TABLE,” “PENSION BENEFITS TABLE,” “NON-QUALIFIED DEFERRED COMPENSATION,” “POTENTIAL PAYMENTS UPON TERMINATION OR CHANGE IN CONTROL OF THE COMPANY,” and “DIRECTOR COMPENSATION,” and is incorporated herein by reference.
ITEM 12. SECURITY OWNERSHIP OF CERTAIN BENEFICIAL OWNERS AND MANAGEMENT AND RELATED STOCKHOLDER MATTERS
The information required by Item 12 is set forth in the Company’s Proxy Statement for the Annual Meeting of Shareholders to be held on May 6, 2022,3, 2024, under the headings of “SECURITY OWNERSHIP OF CERTAIN BENEFICIAL OWNERS,” “SECURITY OWNERSHIP OF MANAGEMENT” and “SECURITIES AUTHORIZED FOR ISSUANCE UNDER EQUITY COMPENSATION PLANS,” and is incorporated herein by reference.
ITEM 13. CERTAIN RELATIONSHIPS AND RELATED TRANSACTIONS, AND DIRECTOR INDEPENDENCE
The information required by Item 13 is set forth in the Company’s Proxy Statement for the Annual Meeting of Shareholders to be held on May 6, 2022,3, 2024, under the heading “INFORMATION ABOUT THE BOARD AND ITS COMMITTEES,” and is incorporated herein by reference.
ITEM 14. PRINCIPAL ACCOUNTANT FEES AND SERVICES
The information required by Item 14 is set forth in the Company’s Proxy Statement for the Annual Meeting of Shareholders to be held on May 6, 2022,3, 2024, under the heading “PROPOSAL 2: RATIFICATION OF THE APPOINTMENT OF DELOITTE & TOUCHE LLP AS THE COMPANY’S INDEPENDENT REGISTERED PUBLIC ACCOUNTING FIRM FOR THE 20222024 FISCAL YEAR,” and is incorporated herein by reference.
PART IV
ITEM 15. EXHIBITS AND FINANCIAL STATEMENTS SCHEDULES | | | | | | | | |
| Documents filed as part of this report: | Form 10-K Annual Report
(page) |
| 1. Financial Statements - Franklin Electric Co., Inc. | |
| |
| |
| |
| |
| |
|
|
| 2. Financial Statement Schedule - Franklin Electric Co., Inc. | |
| |
| Schedules other than those listed above are omitted for the reason that they are not required or are not applicable, or the required information is disclosed elsewhere in the financial statements and related notes. | |
| 3. Exhibits | |
| Number | Description |
| 3.1 | | |
| 3.2 | | |
| 4.1 | | |
| 10.1 | | |
10.2 | | |
10.3 | | |
| 10.2 | | |
| 10.3 | | |
| 10.4 | | |
| 10.5 | | |
| 10.6 | | |
| 10.7 | | |
| 10.8 | |
|
| 10.9 | | |
| 10.10 | | |
| 10.11 | | |
10.12 | | |
| | | | | | | | |
Number10.12 | | Description
10.13 | | |
10.14 | | |
| | | | | |
10.15 Number | Description |
| 10.13 | | |
10.1610.14 | | |
10.17 | | |
10.1810.15 | | |
| 10.16 | | |
| 10.17 | | |
| 10.18 | | |
| 10.19 | | |
10.1910.20 | | |
| 10.21 | | |
10.2010.22 | | |
10.2110.23 | | |
10.2210.24 | | |
10.2310.25 | | |
10.2410.26 | | |
10.2510.27 | | |
10.2610.28 | | |
10.2710.29 | | |
10.2810.30 | | |
10.2910.31 | | |
10.3010.32 | |
|
10.3110.33 | | |
10.3210.34 | | |
10.3310.35 | | Fourth Amended and Restated Credit Agreement, dated May 13, 2021, by and among Franklin Electric Co., Inc., Franklin Electric B.V., JPMorgan Chase Bank, N.A., as Administrative Agent, Bank of America, N.A., as Syndication Agent, and the lenders identified therein (incorporated by reference to Exhibit 10.1 of the Company's Form 8-K filed on May 13, 2021) |
| | | | | |
| Number | Description |
| 10.36 | | Amendment No. 1 dated May 11, 2022 to the Fourth Amended and Restated Credit Agreement, dated May 13, 2021, by and among Franklin Electric Co., Inc., Franklin Electric B.V., JPMorgan Chase Bank, N.A., as Administrative Agent, Bank of America, N.A., as Syndication Agent, and the lenders identified therein (incorporated by reference to Exhibit 10.1 of the Company's Form 8-K filed on May 11, 2022) |
10.3410.37 | | |
10.3510.38 | | |
| | | | | | | | |
Number10.39 | | Description
10.36 | | |
10.37 | | |
18.1 | | |
| 21 | | |
| 23.1 | | |
| 31.1 | | |
| 31.2 | | |
| 32.1 | | |
| 32.2 | | |
| 97 | | |
| 99.1 | | |
| 101 | | The following financial information from Franklin Electric Co., Inc.'s Annual Report on Form 10-K for the year ended December 31, 2021,2023, formatted in Inline eXtensible Business Reporting Language (Inline XBRL): (i) Consolidated Statements of Income for the years ended December 31, 2021, 2020,2023, 2022, and 20192021 (ii) Consolidated Statements of Comprehensive Income/(Loss) for the years ended December 31, 2021, 2020,2023, 2022, and 2019,2021, (iii) Consolidated Balance Sheets as of December 31, 20212023 and 2020,2022, (iv) Consolidated Statement of Cash Flows for the years ended December 31, 2021, 2020,2023, 2022, and 2019,2021, (v) Consolidated Statements of Equity for the years ended December 31, 2021, 2020,2023, 2022, and 2019,2021, and (vi) Notes to Condensed Consolidated Financial Statements (filed herewith) |
| 104 | | Cover Page Interactive Data File (formatted as Inline XBRL and contained in Exhibit 101) |
| |
* Management Contract, Compensatory Plan or Arrangement
FRANKLIN ELECTRIC CO., INC. AND CONSOLIDATED SUBSIDIARIES
SCHEDULE II - VALUATION AND QUALIFYING ACCOUNTS
| | (In millions) | (In millions) | | Balance at Beginning of Period | | Additions Charged to Costs and Expenses | | Deductions (a) | |
Other (b) | | Balance at End of Period | (In millions) | | Balance at Beginning of Period | | Charged to Costs and Expenses | | Deductions (a) | |
Other (b) | | Balance at End of Period |
| 2021 | | | | | | | | | | |
| 2023 | |
| Allowance for doubtful accounts | |
| Allowance for doubtful accounts | |
| Allowance for doubtful accounts | Allowance for doubtful accounts | | $ | 4.0 | | | $ | (0.3) | | | $ | 0.1 | | | $ | 0.4 | | | $ | 4.0 | |
| Allowance for deferred taxes | Allowance for deferred taxes | | 8.3 | | | 0.6 | | | 2.4 | | | — | | | 6.5 | |
| | 2020 | |
| 2022 | |
| 2022 | |
| 2022 | |
| Allowance for doubtful accounts | |
| Allowance for doubtful accounts | |
| Allowance for doubtful accounts | Allowance for doubtful accounts | | $ | 3.7 | | | $ | 0.2 | | | $ | 1.0 | | | $ | 1.1 | | | $ | 4.0 | |
| Allowance for deferred taxes | Allowance for deferred taxes | | 6.4 | | | 1.9 | | | — | | | — | | | 8.3 | |
| 2019 | |
| 2021 | |
| Allowance for doubtful accounts | |
| Allowance for doubtful accounts | |
| Allowance for doubtful accounts | Allowance for doubtful accounts | | $ | 4.4 | | | $ | 0.1 | | | $ | 0.9 | | | $ | 0.1 | | | $ | 3.7 | |
| Allowance for deferred taxes | Allowance for deferred taxes | | 6.8 | | | — | | | 0.4 | | | — | | | 6.4 | |
(a) Charges for which allowances were created.
(b) Primarily related to acquisitions
SIGNATURES
Pursuant to the requirements of Section 13 or 15(d) of the Securities Exchange Act of 1934, the registrant has duly caused this report to be signed on its behalf by the undersigned thereunto duly authorized.
| | | | | | | | | | | |
| | | FRANKLIN ELECTRIC CO., INC. |
| | | Registrant |
| | | |
Date: February 25, 202223, 2024 | | By | /s/ Gregg C. Sengstack |
| | | Gregg C. Sengstack, Chairperson and Chief Executive Officer |
Pursuant to the requirements of the Securities Exchange Act of 1934, this report has been signed below by the following persons on behalf of the registrant and in the capacities indicated on February 25, 2022.23, 2024.
| | | | | | | | |
| By | /s/ Gregg C. Sengstack |
| | Gregg C. Sengstack |
| | Chairperson and Chief Executive Officer |
| | (Principal Executive Officer) |
| | |
| | /s/ Jeffery L. Taylor |
| | Jeffery L. Taylor |
| | Vice President and Chief Financial Officer |
| | (Principal Financial and Accounting Officer) |
| | |
| | /s/ Victor Grizzle |
| | Victor Grizzle |
| | Director |
| | |
| | /s/ Alok Maskara |
| | Alok Maskara |
| | Director |
| | |
| | /s/ Renee J. Peterson |
| | Renee J. Peterson |
| | Director |
| | |
| | /s/ Jennifer L. Sherman |
| | Jennifer L. Sherman |
| | Director |
| | |
| | /s/ Thomas R. VerHage |
| | Thomas R. VerHage |
| | Director |
| | |
| | /s/ Chris Villavarayan |
| | Chris Villavarayan |
| | Director |
| | |
| | /s/ David M. Wathen |
| | David M. Wathen |
| | Director |
| | |