| TABLE OF CONTENTS |
FORWARD-LOOKING STATEMENTS. Our public communications and SEC filings may contain statements related to future, not past, events. These forward-looking statements often address our expected future business and financial performance and financial condition, and often contain words such as "expect," "anticipate," "intend," "plan," "believe," "seek," "see," "will," "would," "estimate," "forecast," "target," "preliminary," or "range." Forward-looking statements by their nature address matters that are, to different degrees, uncertain, such as statements about planned and potential transactions, including our plan to pursue a spin-off of our portfolio of energy businesses that are planned to be combined as GE Vernova; the impacts of the COVID-19 pandemicmacroeconomic and market conditions and volatility on our business operations, financial results and financial position and on the global supply chain and world economy; our expected financial performance, including cash flows, revenues, organic growth, margins, earnings and earnings per share; macroeconomic and market conditions and volatility; planned and potential business or asset dispositions; our de-leveraging plans, including leverage ratios and targets, the timing and nature of actions to reduce indebtedness and our credit ratings and outlooks; GE's and GE Capital'sour funding and liquidity; our businesses’ cost structures and plans to reduce costs; restructuring, goodwill impairment or other financial charges; or tax rates.
For us, particular areas where risks or uncertainties that could cause our actual results to be materially different than those expressed in our forward-looking statements include:
•the continuing severity, magnitude and duration of the COVID-19 pandemic, including impacts of the pandemic, of businesses’ and governments’ responses to the pandemic and of individual factors such as aviation passenger confidence on our operations and personnel, and on commercial activity and demand across our and our customers’ businesses, and on global supply chains;
•the extentour success in executing planned and potential transactions, including our plan to which the COVID-19 pandemicpursue a spin-off of GE Vernova and related impacts will continue to adversely impact our business operations, financial performance, results of operations, financial position, the pricessales or other dispositions of our securitiesremaining equity interest in GE HealthCare, the timing for such transactions, the ability to satisfy any applicable pre-conditions, and the achievement of our strategic objectives;expected proceeds, consideration and benefits to GE;
•changes in macroeconomic and market conditions and market volatility, (including developments and volatility arising from the COVID-19 pandemic), including risk of recession, inflation, supply chain constraints or disruptions, interest rates, the value of securities and other financial assets (including our equity ownership positioninterest in Baker Hughes)GE HealthCare), oil, natural gas and other commodity prices and exchange rates, and the impact of such changes and volatility on our business operations, financial positionresults and businesses;
•our de-leveraging and capital allocation plans, including with respect to actions to reduce our indebtedness, the timing and amount of GE dividends, organic investments, and other priorities;
•further downgrades of our current short- and long-term credit ratings or ratings outlooks, or changes in rating application or methodology, and the related impact on our liquidity, funding profile, costs and competitivefinancial position;
•GE’s liquidity and the amount and timing of our GE Industrial cash flows and earnings, which may be impacted by customer, supplier, competitive, contractual and other dynamics and conditions;
•GE Capital's capital and liquidity needs, including in connection with GE Capital’s run-off insurance operations and discontinued operations, the amount and timing of required capital contributions to the insurance operations and any strategic actions that we may pursue; the impact of conditions in the financial and credit markets on GE Capital's ability to sell financial assets; the availability and cost of funding; and GE Capital's exposure to particular counterparties and markets, including through GECAS to the aviation sector and adverse impacts related to COVID-19;
•our success in executing and completing asset dispositions or other transactions, including our plan to exit our equity ownership position in Baker Hughes, the timing of closing for such transactions and the expected proceeds and benefits to GE;
•global economic trends, competition and geopolitical risks, including changesimpacts from the ongoing conflict between Russia and Ukraine and the related sanctions and other measures and risks related to conflict in the rates of investmentMiddle East, demand or economic growth in key markets we serve,supply shocks from events such as a major terrorist attack, natural disasters or actual or threatened public health pandemics or other emergencies, or an escalation of sanctions, tariffs or other trade tensions between the U.S. and China or other countries, and related impacts on our businesses' global supply chains and strategies;
•market developments or customer actions that may affect levels of demand and the financial performance of the major industries and customers we serve, such as secular, cyclical and competitive pressures in our Power business, pricing and other pressures in the renewable energy market, levels of demand for air travel and other dynamics related tocommercial aviation sector dynamics; pricing, cost, volume and the COVID-19 pandemic,timing of investment by customers or industry participants and other factors in renewable energy markets; conditions in key geographic marketsmarkets; technology developments; and other shifts in the competitive landscape for our products and services;
•our capital allocation plans, including the timing and amount of dividends, share repurchases, acquisitions, organic investments, and other priorities;
•downgrades of our current short- and long-term credit ratings or ratings outlooks, or changes in rating application or methodology, and the related impact on our funding profile, costs, liquidity and competitive position;
•the amount and timing of our cash flows and earnings, which may be impacted by macroeconomic, customer, supplier, competitive, contractual and other dynamics and conditions;
•capital or liquidity needs associated with our run-off insurance operations and mortgage portfolio in Poland (Bank BPH), the amount and timing of any required future capital contributions and any strategic options that we may consider;
•operational execution and improvements by our businesses, including the operations and execution ofsuccess at our Power and Renewable Energy businesses,business in improving product quality and fleet availability, executing on our product and project cost estimates and delivery schedule projections and other aspects of operational performance, as well as the performance of our Aviation business;GE Aerospace amidst market growth and ramping newer product platforms;
•changes in law, regulation or policy that may affect our businesses, such as trade policy and tariffs, regulation and incentives related to climate change (including the impact of the Inflation Reduction Act and other policies), and the effects of tax law changes;
•our decisions about investments in research and development, and new products, services and platforms, and our ability to launch new products in a cost-effective manner;
•our ability to increase margins through implementation of operational changes, restructuring and other cost reduction measures;
•the impact of regulation and regulatory, investigative and legal proceedings and legal compliance risks, including the impact of shareholder and related lawsuits, Alstom, Bank BPH and other investigative and legal proceedings;
•the impact of actual or potential quality issues or failures of our products or third-party products with which our products are integrated, and related costs and reputational effects;
•the impact of potentialrelated to information technology, cybersecurity or data security breaches at GE or third parties; and
•the other factors that are described in the "Risk Factors" section in this formAnnual Report on Form 10-K report.for the year ended December 31, 2023, as such descriptions may be updated or amended in any future reports we file with the SEC.
These or other uncertainties may cause our actual future results to be materially different than those expressed in our forward-looking statements. We do not undertake to update our forward-looking statements. This document includes certain forward-looking projected financial information that is based on current estimates and forecasts. Actual results could differ materially.
ABOUT GENERAL ELECTRIC.General Electric Company (General Electric, GE or the Company) is a high-tech industrial company that today operates worldwide through its four industrial segments, Power,three segments: Aerospace, Renewable Energy, Aviation and Healthcare,Power. Our products include commercial and its financialmilitary aircraft engines and systems; wind and other renewable energy generation equipment and grid solutions; and gas, steam, nuclear and other power generation equipment. We have significant global installed bases of equipment across these sectors, and services segment, Capital.to support these products are also an important part of our business alongside new equipment sales.
We previously announced a strategic plan to form three industry-leading, global, investment-grade public companies from (i) our Aerospace business, which we plan to refer to as GE Aerospace, (ii) our portfolio of energy businesses, including our Renewable Energy and Power businesses, which we plan to combine and refer to as GE Vernova, and (iii) our former HealthCare business. For purposes of this report, we refer to our reporting segments as Aerospace, Renewable Energy and Power. The composition of these reporting segments is unchanged. On January 3, 2023, we completed the separation of the HealthCare business from GE through the spin-off of GE HealthCare Technologies Inc. (GE HealthCare). See Notes 2 and 3 for further information. The historical results of GE HealthCare and certain assets and liabilities included in the Segment Operations section within Management’s Discussion and Analysis of Financial Condition (MD&A) for segment business descriptions and product and service offerings. See the Consolidated Results section within MD&A and Results of Operations and Note 2 to thespin-off are now reported in GE's consolidated financial statements as discontinued operations. Additionally, on January 1, 2023, we adopted Accounting Standards Update No. 2018-12, Financial Services – Insurance (Topic 944): Targeted Improvements to the Accounting for Long-Duration Contracts. See Note 12 for further information.
Over our more than 130-year history, GE’s innovation and technology have improved quality of life around the world by adapting and innovating solutions to pressing global challenges, including our businesses' focuses today on the future of flight and the energy transition. At GE Aerospace, with a differentiated product and technology portfolio across the commercial and military sectors, we are well positioned to serve customers in expanding and upgrading their fleets amidst the demand ramp for engines and services with recovery from the COVID-19 pandemic. At the same time, we are working to develop next generation engine programs that will allow a smarter and more efficient future of flight, including efforts to support increased use of sustainable aviation fuel with our engines’ capabilities and developing new engine architectures such as open fan, hybrid electric and hydrogen technologies. The GE Vernova businesses are positioned to lead the energy transition, helping the energy sector solve for sustainability, reliability and affordability. These businesses are at the center of a dynamic and growing market, as the world faces a significant increase in electricity demand in the coming decades along with the need to electrify and decarbonize. With a range of power generation technologies spanning gas power, onshore and offshore wind and others, as well as power grid automation and hardware, these businesses offer solutions for customers to reduce emissions, meet the growth in electricity demand and make energy more accessible globally, secure and resilient.
We believe our businesses’ strategies and focus on these significant global challenges are well aligned with broader goals of sustainable development, and we approach sustainability with GE’s commitment to innovation as a central element. Sustainability priorities are embedded in our policies, leadership engagement, operating mechanisms, commitments, and, ultimately, our products. In addition to working to develop technologies that will help build a more sustainable world, we advance GE’s sustainability priorities through our own commitments to our people, communities and planet. More information regardingthat may be of interest to a variety of stakeholders about GE’s sustainability approach, priorities and performance, including about safety, greenhouse gas emission reductions for our recent business portfolio actions. Results of segments reclassified to discontinuedown operations have been recastand for all periods presented.our products, environmental stewardship, diversity and inclusion (as also discussed further below), supply chain and human rights and other matters, can be found in our Sustainability Report.
We serve customers in over 170160 countries. Manufacturing and service operations are carried out at 8259 manufacturing plants located in 2824 states in the United States and Puerto Rico and at 149102 manufacturing plants located in 3425 other countries.
In all of our global business activities, we encounter aggressive and able competition. In many instances, the competitive climateenvironment is characterized by changing technology that requires continuing research and development. With respect to manufacturing operations, we continue to make improvements through deployment of lean initiatives and we believe that, in general, we are one of the leading firms in most of the major industries in which we participate. The businesses in which GE Capital engages are subject to competition from various types of financial institutions.
As a diverse global company, we are affected by economic and market developments around the world, economies,supply chain disruptions, instability in certain regions, commodity prices, foreign currency volatility and policies regarding trade and imports. See the Segment Operations section within MD&A for further information. Other factors impacting our business include:
•long product development cycles for many of our products, are long andwith product quality and efficiency areoften being critical to success,success;
•the importance of research and development expenditures are important to our business,expenditures;
•regulatory standards that apply to many of our products are subject to a number of regulatory standardsproducts; and
•changing end markets, including shifts in energy sources and demand related to cost, decarbonization efforts and other factors, as well as the impact of technology changes.
The strength and talent of our workforce are critical to the success of our businesses, and we continually strive to attract, develop and retain personnel commensurate with the needs of our businesses in their operating environments. The Company’s human capital management priorities are designed to support the execution of our business strategy and improve organizational effectiveness. Our focus on organizational performance and talent remains front and center through the ongoing execution of our strategic plan to separate GE Aerospace and GE Vernova into independent companies. We will continue to monitor various factors across our human capital priorities, including as a part of our business operating reviews during the year and with oversight by our Board of Directors and the Board’s Management Development and Compensation Committee. The following are our human capital priorities:
•Protecting the health and safety of our workforce: GE is committed to establishing and maintaining effective health and safety standards and protocols across our businesses, making continuous process improvements, and providing ongoing education. As our businesses prepare for standalone readiness, they have benefited from the expertise and guidance of GE’s Safety Promotion Office, leveraging lean as a critical tool to prevent injuries and incidents and driving safety as a core operational attribute for the businesses. For the past three years, our annual bonus program for executives has included a modifier based on the Company’s safety performance.
•Sustaining a Company culture based in leadership behaviors of humility, transparency and focus, with a commitment to unyielding integrity: GE’s organizational culture supports talent attraction, engagement and retention and promotes ways of working that are strongly connected to our goals. In early 2023, we conducted an annual enterprise-wide culture survey. While survey results varied among our businesses, a Company-wide view of trends in responses confirmed our employees’ view of GE’s solid foundations in safety, compliance, and employee development. Our performance management system, “People, Performance, and Growth,” directly links individual performance outcomes to incentive compensation. Supporting our culture of integrity, The Spirit & The Letter, GE’s employee code of conduct, sets forth the Company’s integrity and compliance standards.
•Developing and managing our talent to best support our organizational goals: GE’s approach to talent management aims to ensure strong individual and company performance; our employee training and development offerings are designed to support these goals. As a key pillar of our talent strategy, GE’s senior management leads an annual organization and talent review for each business to support a strong leadership pipeline and succession planning process. To support our lean culture transformation, in 2023 our leadership development programs continued to elevate high potential talent. Developed in partnership with our existing leaders, our leadership development programs are premised upon a rigorous learning process tied directly to outcomes, with a focus on hands-on, experiential learning and building a lean mindset.
•Promoting inclusion and diversity across the enterprise: At GE, we are committed to building a more diverse workforce and a more inclusive workplace by focusing on transparency, accountability and community. We believe in the value of each person’s unique identity, background and experiences, and are committed to fostering an inclusive culture in which all employees feel empowered to do their best work because they feel accepted, respected and that they belong. We have also had a long-standing commitment to fair and competitive pay practices. On average, in our most recent reporting men and women performing similar work were paid within 1% of each other in each GE business.
Additionally, in 2021, we began publishing diversity reporting to transparently share our diversity data and hold ourselves accountable for continuous improvement. To support our inclusion and diversity efforts, we have Chief Diversity Officers at our businesses. Additionally, we have several Employee Resource Groups which have added value to our colleagues and businesses by helping to engage and develop diverse talent for nearly 30 years. These groups accelerate development through mentoring, learning, networking, organizing outreach and service activities; they address challenges that are important to their members and the Company; and they support our goals to build a diverse talent pipeline.
At December 31, 2023, General Electric Company and consolidated affiliates employed approximately 125,000 people, of whom approximately 44,000 were employed in the United States.
At December 31, 2023, GE had approximately 4,880 union-represented manufacturing and service employees in the United States. The majority are covered by collective bargaining agreements that expire in 2025. GE’s relationship with employee-representative organizations outside the U.S. takes many forms, including in Europe where GE engages employees’ representatives’ bodies such as works councils (at both European level and locally) and trade unions in accordance with local law.
We are subject to numerous U.S. federal, state and foreign laws and regulations covering a wide variety of subject matters related to our products, services and business operations, including requirements regarding the protection of human health and safety and the environment. Relevant laws and regulations can apply to our business directly and indirectly, such as through the effect that laws and regulations applicable to our customers may have in influencing the products and services they purchase from us. Like other industrial manufacturing companies that operate in the sectors we serve, which are high-tech, increasingly digitally connected and global, we face significant scrutiny from both U.S. and foreign governmental authorities with respect to our compliance with laws and regulations. Many of the sales across our businesses are also made to U.S. or foreign governments, regulated entities such as public utilities, state-owned companies or other public sector customers, and these types of sales often entail additional compliance obligations. For further information about government regulation applicable to our businesses, see the Segment Operations section within MD&A, Risk Factors and Note 24.
We own, or hold licenses to use, numerous patents. New patents are continuously being obtained through our research and development activities as existing patents expire.activities. Patented inventions are used both within the Company and are licensed to others. GE is a trademark and service mark of General Electric Company.
Because of the diversity of our products and services, as well as the wide geographic dispersion of our production facilities, we use numerous sources for the wide variety of raw materials needed for our operations. We have not been adversely affected by our inability to obtain raw materials.
The strength and talent of our workforce are critical to the success of our businesses, and we continually strive to attract, develop and retain personnel commensurate with the needs of our businesses in their operating environments. The Company’s human capital management priorities are designed to support the execution of our business strategy and improve organizational effectiveness. We monitor various factors across our priorities, including as a part of our business operating reviews during the year. The priorities focus on:
•Protecting the health and safety of our workforce: GE is committed to establishing and maintaining effective health and safety standards and protocols across our businesses, ensuring continuous process improvement and providing ongoing education.
•Sustaining a Company culture based in leadership behaviors of humility, transparency and focus with a commitment to unyielding integrity: GE’s organizational culture supports talent attraction, engagement and retention and ensures our ways of working are strongly connected to our goals.
•Developing and managing our talent to best support our organizational goals: GE’s approach to talent management aims to ensure strong individual and company performance; our development offerings are designed to support these goals.
•Promoting inclusion and diversity across the enterprise: GE is committed to fostering an inclusive culture, where everyone feels empowered to do their best work.
At year-end 2020, General Electric Company and consolidated affiliates employed approximately 174,000 people, of whom approximately 56,000 were employed in the United States. Our Power, Renewable Energy, Aviation, Healthcare, and Capital segments employed approximately 34,000, 40,000, 40,000, 47,000 and 2,000 people, respectively. In addition, Corporate employed approximately 10,000 employees. Compared to the year-end 2019 figure of 205,000, the number of those employed at year-end 2020 decreased primarily as a result of restructuring, including actions at GE businesses to manage risk and proactively mitigate the financial impact from COVID-19 and efforts to reduce Corporate costs, and business exits.
In the United States, GE has approximately 5,990 union-represented manufacturing and service employees, the majority of whom are covered by four-year collective bargaining agreements ratified in August 2019. GE’s relationship with employee-representative organizations outside the U.S. takes many forms, including in Europe where GE engages employees’ representatives’ bodies such as works councils and trade unions in accordance with local law.
General Electric’s address is 1 River Road, Schenectady, NY 12345-6999; we also maintain executive offices at 5 Necco Street,One Financial Center, Suite 3700, Boston, MA 02210. GE’s Internet address at www.ge.com, Investor Relations website at www.ge.com/investor-relations and our corporate blog at www.gereports.com, as well as GE’s Facebook page, Twitter accountsLinkedIn and other social media accounts, including @GE_Reports, contain a significant amount of information about GE, including financial and other information for investors. GE encourages investors to visit these websites from time to time, as information is updated and new information is posted. Additional information on non-financial matters, including our Sustainability Report, environmental and social matters, our integrity policies and our Diversity Annual Report,diversity reporting, is available at www.ge.com/sustainability and www.ge.com/about-us/diversity. Website referencesAll of such additional information referenced in this report are(including the information contained in, or available through, other reports and websites) is provided as a convenience and dois not constitute, and should not be viewed as, incorporationincorporated by reference of the information contained on, or available through, the websites.herein. Therefore, such information should not be considered part of this report.
Our annual reportAnnual Report on Form 10-K, quarterly reports on Form 10-Q, current reports on Form 8-K, and amendments to those reports are available, without charge, on our website, www.ge.com/investor-relations/events-reports, as soon as reasonably practicable after they are filed electronically with the U.S. Securities and Exchange Commission (SEC). Copies are also available, without charge, from GE Corporate Investor Communications. Reports filed with the SEC may be viewed at www.sec.gov.
MANAGEMENT’S DISCUSSION AND ANALYSIS OF FINANCIAL CONDITION AND RESULTS OF OPERATIONS (MD&A). The consolidated financial statements of General Electric Company combine the industrial manufacturing and services businesses of GE Industrial with the financial services businesses of GE Capital and are prepared in conformity with U.S. generally accepted accounting principles (GAAP). Unless otherwise noted, tables are presented in U.S. dollars in millions. Certain columns and rows within tables may not add due to the use of rounded numbers. Percentages presented in this report are calculated from the underlying numbers in millions.
Discussions throughout this MD&A are based on continuing operations unless otherwise noted. Results for the years ended December 31, 20202023 versus 20192022 are discussed within this report. Refer to the portions of our Annual Report on2022 Form 10-K forfiled as Exhibit 99(a) with the year ended December 31, 2019Form 8-K on April 25, 2023 for discussions of results for the years ended December 31, 20192022 versus 2018.2021. The MD&A should be read in conjunction with the Financial Statements and Notes to the consolidated financial statements. For purposes of the financial statement display of sales and costs of sales in our consolidated Statement of Earnings (Loss), “goods” is required by SEC regulations to include all sales of tangible products, and "services" must include all other sales, including other services activities. In our MD&A section of this report, we refer to sales under product services agreements and sales of both goods (such as spare parts and equipment upgrades) and related services (such as monitoring, maintenance and repairs) as sales of “services,” which is an important part of our operations.
Effective December 31, 2020, in order to enhance our financial statement presentation, we voluntarily made the following reporting changes for all periods presented:
•changed our presentation of GE Industrial restructuring program costs. Previously these costs were recorded within Corporate Items and Eliminations. Now these costs are recorded within segment profit, except for significant, higher-cost programs that continue to be recorded within Corporate Items and Eliminations. This change better aligns restructuring expense with cash spend at the segments, driving accountability in both managing costs and benefits;
•changed the presentation of our Statement of Financial Position to reflect the classification of assets and liabilities into current and non-current and revised the definition of operating working capital in our Statement of Cash Flows, to drive increased transparency to operational drivers for near- and long-term cash needs and enhanced linkage to free cash flows metrics;
•began presenting research and development (R&D) expenses separately as part of costs and expenses in our consolidated Statement of Earnings (Loss) to provide increased transparency to R&D spend and trends as part of GE's total investment in innovation. These costs were previously reported in costs of goods and services sold; and
•ceased reporting GE Capital as an equity method investment within the GE Industrial column. This change simplified reporting for GE Industrial and has no impact on the GE Capital or Consolidated columns. Consistent with our historical practice, all commercial transactions between GE Industrial and GE Capital continue to be reported on arms-length terms and are eliminated upon consolidation.
We believe investors will gain a better understanding of our company if they understand how we measure and talk about our results. Because of the diversity in our businesses, we present our financial statements in a three-column format, which allows investors to see our industrial operations separately from our financial services operations. We believe that this provides useful information to investors. When used in this report, unless otherwise indicated by the context, we use these terms to mean the following:
•Consolidated – the adding together of GE Industrial and GE Capital, giving effect to the elimination of transactions between the two. We present consolidated results in the left-side column of our consolidated Statements of Earnings (Loss), Financial Position and Cash Flows.
•GE Industrial – the adding together of all industrial affiliates, giving effect to the elimination of transactions among such affiliates. Any intercompany profits resulting from transactions between GE Industrial and GE Capital are eliminated at the GE Industrial level. We present the results of GE Industrial in the center column of our consolidated Statements of Earnings (Loss), Financial Position and Cash Flows.
•GE Capital – the adding together of all affiliates of GE Capital giving effect to the elimination of transactions among such affiliates. We present the results of GE Capital in the right-side column of our consolidated Statements of Earnings (Loss), Financial Position and Cash Flows.
In the accompanying analysis of financial information, we sometimes use information derived from consolidated financial data but not presented in our financial statements prepared in accordance with GAAP. Certain of these data are considered “non-GAAP financial measures” under SEC rules. See the Non-GAAP Financial Measures section for the reasons we use these non-GAAP financial measures and the reconciliations to their most directly comparable GAAP financial measures.
CONSOLIDATED RESULTS
2020 SIGNIFICANT DEVELOPMENTS.Coronavirus Disease 2019 (COVID-19) Pandemic. The COVID-19 pandemic has impacted global economies, resulting in workforce and travel restrictions, supply chain and production disruptions and reduced demand and spending across many sectors. Since the latter part of the first quarter of 2020, these factors have had a material adverse impact on our operations and financial performance, as well as on the operations and financial performance of many of the customers and suppliers in industries that we serve. This section provides a brief overview of how we have been responding to current and potential impacts related to COVID-19 on GE’s operations and financial condition and results, with additional details provided throughout the MD&A and other relevant sections of this report.
During 2020, we adopted operational and governance rhythms across the Company, and with our Board of Directors, to coordinate and oversee actions related to the COVID-19 pandemic, including an internal task force to protect the health and safety of our employees globally and maintain business continuity; the assessment of financial and operating impacts, financial planning and mitigating cost, cash, and other actions in response; funding and liquidity management and related treasury actions; enterprise risk management and other functional activities across our global commercial, supply chain, human resources, controllership, government affairs, and other organizations. In particular, we took a series of actions to enhance and extend our liquidity at both GE and GE Capital (as described under "Liability Management and Deleveraging Actions" below), and we continue to evaluate market conditions as they evolve and take precautionary measures to strengthen our financial position. We ended the year with $36.6 billion of consolidated cash, cash equivalents and restricted cash, in addition to our available credit lines of $20.2 billion. See the Capital Resources and Liquidity section for further information.
While factors related directly and indirectly to the COVID-19 pandemic have been impacting operations and financial performance at varying levels across all our businesses, the most significant impact to date has been at our Aviation segment and our GE Capital Aviation Services (GECAS) aircraft leasing business within our Capital segment. The pandemic has had and continues to have a material adverse effect on the global airline industry, resulting in reduced flight schedules worldwide, an increased number of idle aircraft, lower utilization, workforce reductions and declining financial performance within the airline industry. This has decreased demand for higher margin service revenues within our Aviation segment directly impacting our profitability and cash flows during 2020. Our Healthcare segment experienced increased demand for certain types of products and services, including ventilators, monitoring solutions, x-ray, anesthesia and point-of-care ultrasound product lines, partially offset by decreased demand in other parts of the business as patients have postponed certain procedures and hospitals have deferred spending. Our other businesses were also adversely impacted by market developments, including delays or cancellations of new projects, new orders and related down payments. In addition, workplace, travel and supply chain disruptions have caused delays of deliveries and the achievement of other billing milestones directly impacting our profitability and cash flows for the year ended December 31, 2020. We anticipate many of these impacts related to demand, profitability and cash flows will continue in future periods depending on the severity and duration of the pandemic. For additional details about impacts related to Aviation and GECAS, Healthcare and our other businesses, refer to the respective segment sections within MD&A.
Each of GE's businesses and Corporate are taking cost and cash actions to manage risk and proactively mitigate the financial impact from COVID-19, as supply and demand dynamics continue to shift. In 2020, we executed more than $2 billion in operational cost reduction and more than $3 billion in cash preservation actions across the company, including more than $1 billion in operational cost reduction and more than $2 billion in cash preservation actions at Aviation, to right-size its cost structure and preserve its ability to serve customers.
The ultimate impact of the COVID-19 pandemic on our operations and financial performance, and on those of customers and suppliers in industries that we serve, depends on many factors that are not within our control, including the severity and duration of the pandemic; governmental, business and individuals’ actions in response to the pandemic; and the development, availability and public acceptance of effective treatments or vaccines. See the Risk Factors section for further information about related risks and uncertainties.
BioPharmaCONSOLIDATED RESULTS. On March 31, 2020, we completed the sale of our BioPharma business within our Healthcare segment to Danaher Corporation for consideration of $21.1 billion, and recognized a pre-tax gain of $12.4 billion. See the Segment Operations - Healthcare section and Note 2 for further information.
Asset Impairments. In the third quarter of 2020, we recognized non-cash pre-tax impairment charges of $0.4 billion related to property, plant and equipment and intangible assets at our Steam business within our Power segment due to our recent announcement to exit the new build coal power market. We will continue to monitor the operating results and cash flow forecasts for the remaining business. In the second quarter of 2020, we recognized a non-cash pre-tax impairment charge of $0.9 billion related to goodwill at our Additive reporting unit within our Aviation segment. The Steam and Additive charges were recorded within earnings from continuing operations at Corporate. In the second quarter of 2020, we recognized a non-cash pre-tax impairment charge of $0.8 billion related to goodwill in our GECAS reporting unit within our Capital segment. In the year ended December 31, 2020, we recognized non-cash pre-tax impairments of $0.5 billion on our GECAS leasing portfolio. See Segment Operations - Capital and Notes 7 and 8 for further information.
Liability Management and Deleveraging Actions. We reduced our consolidated borrowings by $15.8 billion in 2020, driven primarily by debt tenders at GE Industrial and GE Capital of $4.2 billion and $11.9 billion, respectively, GE Capital maturities of $10.5 billion, and repayment of GE Industrial commercial paper of $3.0 billion, partially offset by new debt issuances at GE Industrial and GE Capital of $7.5 billion and $6.0 billion, respectively. GE Industrial net debt* ended at $32.3 billion at December 31, 2020, down $15.5 billion from December 31, 2019, primarily driven by lower debt, a higher cash balance, and pension pre-funding of $2.5 billion in the fourth quarter of 2020. See the Borrowings section of Capital Resources and Liquidity and Note 11 for further information.
*Non-GAAP Financial Measure
SEC Settlement. As previously reported on December 9, 2020, GE reached a settlement with the SEC that concluded and resolved the SEC's investigation of GE in its entirety. Under the settlement, among other terms, GE paid a civil penalty of $0.2 billion in December 2020, of which $0.1 billion was recorded at Corporate and $0.1 billion was recorded at GE Capital. See Note 23 for further information.
SUMMARY OF 20202023 RESULTS. ConsolidatedTotal revenues were $79.6$68.0 billion, down $15.6up $9.9 billion (16%) for the year, primarily driven by decreased GE industrial revenues of $14.6 billionincreases at all segments and decreased GE Capital revenues of $1.5 billion. GE Industrial organic revenues* were $73.2 billion, down $10.9 billion (13%) driven by our Aviation and Power segments, partially offset by our Healthcare and Renewable Energy segments.Corporate.
Continuing earnings (loss) per share was $0.59.$7.98. Excluding the results from our run-off Insurance operations, non-operating benefit costs, gains (losses) on purchases and sales of business dispositions, non-operating benefit costs, unrealizedinterests, gains (losses) on investments, goodwill impairments,equity securities, restructuring costs, separation costs and otherRussia and Ukraine charges, Steam asset impairments, debt extinguishment costs, the SEC settlement, and U.S. tax reform, Adjusted earnings per share* was $0.01.
$2.81. For the year ended December 31, 2020, GE Industrial2023, profit margin was 15.0% and profit was $7.3up $11.0 billion, primarily due to an increase in gains on retained and sold ownership interests of $5.7 billion, an increase in segment profit margins were 10.0%, up $5.5of $2.4 billion, driven byan increase in non-operating benefit income of $1.2 billion, the gain onnonrecurrence of the Steam asset sale impairment of our BioPharma business$0.8 billion, the nonrecurrence of $12.4debt extinguishment costs of $0.5 billion, lowera decrease in interest and other financial charges of $0.8$0.3 billion, decreased goodwill impairmentsa decrease in Adjusted total corporate operating costs* of $0.6$0.1 billion, decreased non-operating benefit costa decrease in restructuring costs of $0.4$0.1 billion and lower charges for significant, higher-cost restructuring programs of $0.2 billion, partially offset by decreases at our industrial segments, an increase in Insurance profit of $2.8 billion in losses on our investment in Baker Hughes, impairment charges of $0.4 billion related to property, plant and equipment and intangible assets at our Steam business, and the SEC settlement charges. Adjusted GE Industrial organic profit* decreased $4.7 billion, primarily as a result of the impacts of COVID-19, particularly at our Aviation segment,$0.1 billion. These increases were partially offset by an increase in separation costs of $0.3 billion. Adjusted organic profit* increased $2.6 billion, driven primarily by increases at Healthcare.all segments and lower Adjusted total corporate operating costs*.
GE Industrial cashCash flows from (used for) operating activities (CFOA) of continuing operations were $(1.3)$5.6 billion and $4.6$4.0 billion for the years ended December 31, 20202023 and 2019,2022, respectively. GE Industrial CFOA decreasedincreased primarily due to loweran increase in net income largely as a result(after adjusting for depreciation of COVID-19 impacts,property, plant, and equipment, amortization of intangible assets, non-cash (gains) losses related to our retained and sold ownership interests in GE Pension Plan contributionsHealthCare, AerCap and Baker Hughes and the nonrecurrence of $2.5 billion in 2020 and highernon-operating debt extinguishment costs). Free cash paid for taxes, partially offset by lower cash used for operating working capital. GE Industrial free cash flowsflows* (FCF)* were $0.6$5.2 billion and $2.3$3.1 billion for the years ended December 31, 20202023 and 2019,2022, respectively. GE Industrial FCF* decreasedincreased primarily due to lower net income,the same reasons as noted for CFOA above, after adjusting for an increase in separation cash expenditures, which are excluded from FCF*, partially offset by loweran increase in cash used for operating working capital and a decrease in additions to property, plant and equipment and internal-use software. See the Capital Resources and Liquidity - Statement of Cash Flows section for further information.
Orders are contractual commitments with customers to provide specified goods or services for an agreed upon price. Backlog isRemaining performance obligation (RPO) includes unfilled customer orders for products and product services (expectedequipment, excluding any purchase order that provides the customer with the ability to cancel or terminate without incurring a substantive penalty. Services RPO includes the estimated life of contract sales for product services).
| | | | | | | | | | | |
| GE INDUSTRIAL ORDERS | 2020 | 2019 | 2018 |
| Equipment | $ | 36,841 | | $ | 44,951 | | $ | 49,276 | |
| Services | 35,137 | | 45,303 | | 45,523 | |
| Total orders(a) | $ | 71,979 | | $ | 90,254 | | $ | 94,799 | |
(a) Orders included $1,136 million, $3,643 million and $3,210 million related to BioPharmalong-term service agreements which remain unsatisfied at the end of the reporting period, the estimated amount of unsatisfied performance obligations for time and material agreements, material services agreements, spare parts under purchase order, multi-year maintenance programs and other services agreements, excluding any order that provides the years ended December 31, 2020, 2019 and 2018, respectively.
For the year ended December 31, 2020, orders decreased $18.3 billion (20%) on a reported basis and decreased $14.8 billion (17%) organically, with decreases at Aviation, primarily driven by declines in both commercial equipment and service orders due to COVID-19 and the 737 MAX grounding; at Power primarily driven by a decrease in equipment orders; and at Renewable Energy primarily due to a decrease in services orders; partially offset by an increase at Healthcare. Equipment orders were down $5.0 billion (12%) organically and services orders were down $9.8 billion (22%) organically. Excluding BioPharma, orders decreased $15.0 billion (17%) organically.
| | | | | | | | | | | |
| GE INDUSTRIAL BACKLOG | 2020 | 2019 | 2018 |
| Equipment | $ | 73,286 | | $ | 78,968 | | $ | 77,126 | |
| Services | 313,234 | | 325,605 | | 273,499 | |
| Total backlog(a) | $ | 386,520 | | $ | 404,572 | | $ | 350,625 | |
(a) Backlog as of December 31, 2020 excludes the BioPharma business due to its disposition in the first quarter of 2020. Backlog as of December 31, 2019 and 2018 included $1,247 million and $905 million, respectively, related to BioPharma.
As of December 31, 2020, backlog decreased $18.1 billion (4%) from the prior year primarily driven by Aviation due to a reduction in our Commercial Services backlog and cancellations of commercial equipment orders. The reduction in Commercial Services reflects lower anticipated engine utilization, the cancellation of equipment unit orders, customer fleet restructuring and contract modifications. Power decreased due to sales outpacing new orders; Healthcare decreased with the disposition of the BioPharma business of $1.2 billion; and Renewable Energy increased dueability to new orders outpacing sales. Excluding the BioPharma disposition, backlog decreased $16.8 billion (4%) from December 31, 2019.cancel or terminate without incurring a substantive penalty. See Note 25 for further information.
*Non-GAAP Financial Measure
Remaining performance obligation (RPO), a defined term under GAAP, is backlog excluding any purchase order that provides the customer with the ability to cancel or terminate without incurring a substantive penalty, even if the likelihood of cancellation is remote based on historical experience. We plan to continue reporting backlog as we believe that it is a useful metric for investors, given its relevance to total orders. See Note 25 for further information.
| | | | | | | | | | | |
| December 31, 2020 | Equipment | Services | Total |
| Backlog | $ | 73,286 | | $ | 313,234 | | $ | 386,520 | |
| Adjustments | (27,294) | | (128,626) | | (155,921) | |
| Remaining performance obligation | $ | 45,991 | | $ | 184,608 | | $ | 230,600 | |
| | | | | | | | | | | | |
| RPO | December 31, 2023 | December 31, 2022 | December 31, 2021 | |
| | | | |
| Equipment | $ | 54,675 | | $ | 44,198 | | $ | 40,834 | | |
| Services | 212,558 | | 194,198 | | 185,786 | | |
| Total RPO | $ | 267,233 | | $ | 238,396 | | $ | 226,620 | | |
Adjustments to reported backlog of $155.9 billion asAs of December 31, 2020 are largely2023, RPO increased $28.8 billion (12%) from December 31, 2022, primarily at Aerospace, from increases in both equipment and services; at Renewable Energy, from new orders at Grid and Onshore Wind; and at Power, driven by adjustments of $146.3 billionincreases in our Aviation segment: (1) backlog includes engine contracts for which we have received purchase orders that are cancelable; (2) ourGas Power services backlog includes contracts that are cancelable without substantive penalty, primarily time and materials contracts; (3) backlog includes engines contracted under long-term service agreements, even if the engines have not yet been put into service. These adjustments to reported backlog to the extent realized are generally expected to be satisfied beyond one year.equipment and Power Conversion equipment.
| | | | | | | | | | | |
| 2020 | 2019 | 2018 |
| Consolidated revenues | $ | 79,619 | | $ | 95,214 | | $ | 97,012 | |
| | | |
| Equipment | 37,620 | | 43,080 | | 43,679 | |
| Services | 35,480 | | 44,639 | | 45,359 | |
| | | |
| | | |
| GE Industrial revenues | $ | 73,100 | | $ | 87,719 | | $ | 89,038 | |
| GE Capital revenues | $ | 7,245 | | $ | 8,741 | | $ | 9,551 | |
| | | | | | | | | | | | | | |
| | | | |
| REVENUES | | | | 2023 | 2022 | 2021 |
| Equipment revenues | | | | $ | 26,793 | | $ | 22,334 | | $ | 25,096 | |
| Services revenues | | | | 37,772 | | 32,808 | | 28,272 | |
| Insurance revenues | | | | 3,389 | | 2,957 | | 3,101 | |
| Total revenues | | | | $ | 67,954 | | $ | 58,100 | | $ | 56,469 | |
For the year ended December 31, 2020, consolidated2023, total revenues decreased $15.6 billion (16%), primarily driven by decreased Industrial revenues of $14.6 billion and decreased GE Capital revenues of $1.5 billion.
GE Industrial revenues decreased $14.6increased $9.9 billion (17%), with decreases in services and equipment. The decrease in services was. Equipment revenues increased, primarily at Aviation, driven by lower commercial spare part shipments, decreased shop visits and the cumulative impact of changes in billing and cost assumptions in our long-term service agreements; and at Power,Renewable Energy, due to declines in transactional part sales and upgradeshigher equipment revenue at Gas Power. The decrease in equipment was primarilyOffshore Wind associated with the Haliade-X ramp up, as well as at Aviation,Grid; at Aerospace, due to feweran increase in commercial install and spare engine unit shipments; and at Healthcare,Power, due to the disposition of the BioPharma business;increases at Gas Power and Power Conversion. Services revenues increased, primarily at Aerospace, due to increased commercial spare part shipments, internal shop visit volume and higher prices; and at Power, due to growth in Gas Power, Steam and Power Conversion; partially offset by increasesa decrease at Renewable Energy, primarily from Onshore Wind with more wind turbine shipments than in the prior year, and Offshore Wind; and at Gas Power, due to an increasea decrease in Heavy-Duty gas turbine unit shipments. This decrease includedrepower revenue.
Excluding the change in Insurance revenues, the net effects of acquisitions and dispositions of $3.6 billion and the effects of a strongerweaker U.S. dollar, of $0.3 billion. Excluding the effects of acquisitions, dispositions and foreign currency, GE Industrial organic revenues* decreased $10.9 billion (13%), with a decrease in services revenues of $8.8 billion (20%) and a decrease in equipment revenues of $2.1 billion (5%). GE Industrial organic revenues* decreased at Aviation and Power, partially offset by increases at Healthcare and Renewable Energy. Excluding the BioPharma disposition, GE Industrial organic revenues* decreased $10.9 billion (13%).
GE Capital revenues decreased $1.5increased $9.2 billion (17%), as a result of volume declineswith equipment revenues up $4.3 billion (19%) and lower gains. These volume declines were primarilyservices revenues up $4.8 billion (15%). Organic revenues* increased at GECAS related to lower interest income attributable to the sale of PK AirFinanceAerospace, Renewable Energy and lower rental revenue on our aircraft leasing portfolio, and at Working Capital Solutions (WCS) related to lower purchases of GE Industrial customer receivables and the run-off of the GE Capital supply chain finance program (See GE Industrial Working Capital Transactions within MD&A for further information).Power.
| | (Per-share amounts in dollars and diluted) | 2020 | 2019 | 2018 |
| EARNINGS (LOSS) AND EARNINGS (LOSS) PER SHARE | |
| EARNINGS (LOSS) AND EARNINGS (LOSS) PER SHARE | |
| EARNINGS (LOSS) AND EARNINGS (LOSS) PER SHARE | |
| (Per-share in dollars and diluted) | |
| (Per-share in dollars and diluted) | |
| (Per-share in dollars and diluted) | | | | | 2023 | 2022 | 2021 |
| Continuing earnings (loss) attributable to GE common shareholders | Continuing earnings (loss) attributable to GE common shareholders | $ | 5,355 | | $ | (44) | | $ | (21,438) | |
| Continuing earnings (loss) per share | Continuing earnings (loss) per share | $ | 0.59 | | $ | (0.01) | | $ | (2.47) | |
For the year ended December 31, 20202023,consolidated continuing earnings increased $5.4$9.9 billion, primarily due to increased GE Industrialan increase in gains on retained and sold ownership interests of $5.7 billion, an increase in segment profit of $5.5$2.4 billion, an increase in non-operating benefit income of $1.2 billion, the nonrecurrence of the Steam asset sale impairment of $0.8 billion, the nonrecurrence of debt extinguishment costs of $0.5 billion, a decrease in interest and other financial charges of $0.3 billion, a decrease in Adjusted Corporate operating costs* of $0.1 billion, a decrease in restructuring costs of $0.1 billion and decreased provision for GE Industrial income taxesan increase in Insurance profit of $0.9 billion,$0.1 billion. These increases were partially offset by an increase in GE Capital lossesprovision for income taxes of $1.2 billion.
GE Industrial profit increased $5.5 billion driven primarily by the gain on the sale of our BioPharma business of $12.4 billion, lower interest and other financial charges of $0.8 billion, decreased goodwill impairments of $0.6 billion, decreased non-operating benefit cost of $0.4$1.1 billion and lower charges for significant, higher-cost restructuring programsan increase in separation costs of $0.2 billion; partially offset by decreases at our industrial segments,$0.3 billion. Adjusted earnings* were $3.1 billion, an increase of $2.8 billion in losses on our investment in Baker Hughes, impairment charges of $0.4 billion related to property, plant and equipment and intangible assets at our Steam business, and the SEC settlement charges. GE Industrial profit$2.2 billion. Profit margin was 10.0%15.0%, an increase from (1.4)%. Adjusted profit* was $5.7 billion, an increase of $2.6 billion organically*, due to increases at Aerospace, Renewable Energy and Power. Adjusted profit margin* was 8.8%, an increase of 790310 basis points primarily due to the same net increases as described above. Adjusted GE Industrial profit* was $2.5 billion, a decrease of 65% organically*, primarily due to a decrease at our Aviation segment, partially offset by an increase at Healthcare and a decrease in Adjusted corporate operating costs*. Adjusted GE industrial profit margin* was 3.4%, a decrease of 520 basis points organically*, primarily due to the same net decreases as described above. At Aviation, the primary drivers were lower volume on commercial spare part and commercial spare engine shipments, decreased shop visits and net unfavorable changes of $1.1 billion to the estimated profitability in its long-term service agreements. At Healthcare, the primary drivers were cost reductions and increased demand for Healthcare Systems (HCS) products used directly in response to COVID-19, partially offset by decreases in Pharmaceutical Diagnostics (PDx) volume.
*Non-GAAP Financial Measure
GE Capital continuing losses increased $1.2 billion primarily dueWe continue to experience inflation pressure in our supply chain, as well as delays in sourcing key materials needed for our products and skilled labor shortages. This has delayed our ability to convert RPO to revenue and negatively impacted our profit margins. While we expect the impact of inflation to continue to be challenging, we have taken and continue to take actions to limit this pressure, including lean initiatives to drive cost productivity, partnering with our suppliers and adjusting the pricing of our products and services. Also, because we operate in many countries around the world, we are subject to complex global geopolitical forces. Due to an impairmentexpansion of goodwillU.S. sanctions related to the ongoing Russia and Ukraine conflict, we recorded a charge of $0.8$0.2 billion (pre-tax), volume declines, higher mark-to-market effectsin the year ended December 31, 2023, primarily related to our Power segment, and other impairments, including $0.5 billion (pre-tax) on the GECAS fixed-wing aircraft portfolio as a result of COVID-19 and related market impacts, lower gains, debt tender costs, the SEC settlement charge and the nonrecurrence of a 2019 tax reform enactment adjustment. These increased losses were partially offset by the nonrecurrence of a $1.0 billion pre-tax charge identified through the completion of our 2019 annual insurance premium deficiency review, higher tax benefits including the tax benefit relatedremaining net asset exposure to the BioPharma sale and lower excess interest cost. Gains were $0.4 billion and $0.7 billion in 2020 and 2019, respectively.
AVIATION AND GECAS 737 MAX. Aviation develops, produces, and sells LEAP aircraft engines to Boeing, Airbus and COMAC through CFM International (CFM), a company jointly owned by GE and Safran Aircraft Engines, a subsidiary of the Safran Group of France. The LEAP-1B engineRussia is the exclusive engine for the Boeing 737 MAX. In March 2019, global regulatory authorities ordered a temporary fleet grounding of the Boeing 737 MAX. In May 2020, Boeing resumed production of the 737 MAX. In November 2020, the U.S. Federal Aviation Administration (FAA) lifted the grounding notice for the 737 MAX and Boeing commenced aircraft deliveries to customers in compliance with FAA regulatory requirements in December 2020. A number of other global regulators since the FAA's action have also lifted the orders that suspended 737 MAX operations for airlines under their jurisdictions. Aviation commercial equipment backlog as of December 31, 2020 includes approximately 9,600 LEAP engines, including the impact of approximately 1,500 LEAP-1B unit order cancellations in 2020. See the Segment Operations - Aviation section for further information. During 2020, CFM and Boeing reached an agreement to align production rates for 2020 and secure payment terms for engines delivered in 2019 and 2020. In 2020, Aviation received payments, net of progress collections, of $0.5 billion for engines delivered in 2019. A final payment of $0.2 billion, net of progress collections, is expected to be received in the first quarter of 2021 for engines delivered in 2019. CFM and Boeing continue to work closely to ensure a successful reentry into service, with a strong commitment to safety while navigating industry disruption.
During 2020, GECAS agreed with Boeing to restructure its 737 MAX orderbook including previously canceled positions, resulting in 77 orders now remaining. As of December 31, 2020, GECAS owned 29 of these aircraft, 26 of which are contracted for lease to airlines that remain obligated to make contractual rental payments. In addition, GECAS has made pre-delivery payments to Boeing related to 77 of these aircraft on order and has made financing commitments to acquire a further 16 aircraft under purchase and leaseback contracts with airlines.
As of December 31, 2020, we have approximately $1.7 billion of net assets ($3.2 billion of assets and $1.5 billion of liabilities) related to the 737 MAX program that primarily comprised Aviation accounts receivable offset by progress collections and GECAS pre-delivery payments and owned aircraft subject to lease. No impairment charges were incurred related to the 737 MAX aircraft and related balances, as we continue to believe these assets are recoverable over their contractual or useful lives. We continue to monitor 737 MAX return to service and return to delivery developments with our airline customers, lessees and Boeing.
LEAP continues to be a strong engine program for us, and we delivered 815 LEAP engines for Boeing and Airbus platforms in the year.not material.
SEGMENT OPERATIONS. Segment revenues include sales of productsequipment and services by the segment. Industrial segmentour segments. Segment profit is determined based on performance measures used by our Chief Operating Decision Maker (CODM), who is our Chief Executive Officer (CEO), to assess the performance of each business in a given period. In connection with that assessment, the CEO may exclude matters, such as charges for impairments, significant, higher-cost restructuring programs, costs associated with separation activities, manufacturing footprint rationalization and other similar expenses, acquisition costs and other related charges, certain gains and losses from acquisitions or dispositions and certain litigation settlements. See the Corporate Items and Eliminations section for additionalfurther information about costs excluded from segment profit.
Segment profit excludes results reported as discontinued operations and the portion of earnings or loss attributable to noncontrolling interests of consolidated subsidiaries, and as such only includes the portion of earnings or loss attributable to our share of the consolidated earnings or loss of consolidated subsidiaries.
Interest and other financial charges, income taxes and non-operating benefit costs are excluded in determining segment profit for the industrial segments. Interest and other financial charges, income taxes, non-operating benefit costs and GE Capital preferred stock dividends are included in determining segment profit (which we sometimes refer to as net earnings) for the Capital segment. Other income is included in segment profit for the industrial segments.
Certain corporate costs, such asincluding those related to shared services, employee benefits, and information technology, are allocated to our segments based on usage. A portion of the remaining corporate costs is allocated based on each segment’susage or their relative net cost of operations.
| | | | | | | | | | | | | | | | | | |
| | | | |
| SUMMARY OF REPORTABLE SEGMENTS | | | | | | 2023 | 2022 | | | 2021 |
| Aerospace | | | | | | $ | 31,770 | | $ | 26,050 | | | | $ | 21,310 | |
| Renewable Energy | | | | | | 15,050 | | 12,977 | | | | 15,697 | |
| Power | | | | | | 17,731 | | 16,262 | | | | 16,903 | |
| Total segment revenues | | | | | | 64,551 | | 55,289 | | | | 53,910 | |
| Corporate | | | | | | 3,403 | | 2,812 | | | | 2,559 | |
| Total revenues | | | | | | $ | 67,954 | | $ | 58,100 | | | | $ | 56,469 | |
| | | | | | | | | | |
| Aerospace | | | | | | $ | 6,115 | | $ | 4,775 | | | | $ | 2,882 | |
| Renewable Energy | | | | | | (1,437) | | (2,240) | | | | (795) | |
| Power | | | | | | 1,449 | | 1,217 | | | | 726 | |
| Total segment profit (loss) | | | | | | 6,126 | | 3,751 | | | | 2,812 | |
| Corporate(a) | | | | | | 3,785 | | (2,875) | | | | 1,158 | |
| Interest and other financial charges | | | | | | (1,073) | | (1,423) | | | | (1,727) | |
| Debt extinguishment costs | | | | | | — | | (465) | | | | (6,524) | |
| Non-operating benefit income (cost) | | | | | | 1,585 | | 409 | | | | (1,136) | |
| | | | | | | | | | |
| Benefit (provision) for income taxes | | | | | | (1,357) | | (210) | | | | 595 | |
| Preferred stock dividends | | | | | | (295) | | (289) | | | | (237) | |
| Earnings (loss) from continuing operations attributable to GE common shareholders | | | | | | 8,772 | | (1,100) | | | | (5,058) | |
| | | | | | | | | | |
| | | | | | | | | | |
| Earnings (loss) from discontinued operations attributable to GE common shareholders | | | | | | 414 | | 1,151 | | | | (1,515) | |
| Net earnings (loss) attributable to GE common shareholders | | | | | | $ | 9,186 | | $ | 51 | | | | $ | (6,573) | |
(a) Includes interest and other financial charges of $45 million, $54 million and $63 million; and benefit for income taxes of $195 million, $213 million and $162 million related to Energy Financial Services (EFS) within Corporate for the years ended December 31, 2023, 2022, and 2021 respectively.
GE AEROSPACE. Aerospace designs and produces commercial and defense aircraft engines, integrated engine components, electric power and mechanical aircraft systems. We also provide aftermarket services to support our products.
Commercial Engines and Services – manufactures jet engines for commercial airframes. Aerospace engines power aircraft in all categories: narrowbody, widebody and regional, which includes engines sold by CFM International, a 50-50 non-consolidated company with Safran Aircraft Engines, a subsidiary of Safran Group of France, and Engine Alliance, a 50-50 non-consolidated company with Raytheon Technologies Corporation via their Pratt & Whitney segment. This includes engines and components for business aviation and aeroderivative applications as well. Commercial provides maintenance, component repair and overhaul services (MRO), including sales of spare parts.
Defense – manufactures jet engines for defense airframes. Our defense engines power a wide variety of defense aircraft including fighters, bombers, tankers, helicopters and surveillance aircraft, as well as marine applications. We provide maintenance, component repair and overhaul services, including sales of spare parts.
Systems & Other – provides avionics systems, aviation electric power systems, turboprop engines, engine gear and transmission components and services for commercial and defense businesses. Additionally, we provide a wide variety of products and services including additive machines, additive materials (including metal powders), and additive engineering services.
Competition & Regulation. The global businesses for aircraft jet engines, maintenance, component repair and overhaul services (including spare part sales) are highly competitive. Both domestic and international sales are important to the growth and success of the business. Product development cycles are long and product quality and efficiency are critical to success. Research and development expenditures are important in this business, as are focused intellectual property strategies and protection of key aircraft engine design, manufacture, repair and product upgrade technologies. In addition, we are subject to market and regulatory dynamics related to decarbonization which will require a combination of technological innovation in the fuel efficiency of engines, expanding the use of sustainable aviation fuels and the development of electric flight and hydrogen-based aviation technologies. Aircraft engine and systems orders tend to follow civil air travel demand and defense procurement cycles.
Our products, services and activities are subject to a number of global regulators such as the U.S. Federal Aviation Administration (FAA), European Union Aviation Safety Agency (EASA), Civil Aviation Administration of China (CAAC) and other regulatory bodies.
Significant Trends & Developments. Our results in 2023 reflect robust demand for commercial air travel and continued strength in services, which represents over 70% of Aerospace’s revenue this year. A key underlying driver of our commercial engine and services business is global commercial departures, which grew high-teens during 2023 compared to 2022. The air traffic growth trends vary by region given economic conditions, airline competition and government regulations. Consistent with industry projections, we estimate departures growth to decelerate to mid-single digits in 2024. We are in frequent dialogue with our airline, airframe, and maintenance, repair and overhaul customers about the outlook for commercial air travel, new aircraft production, fleet retirements, and after-market services, including shop visit and spare parts demand.
As it relates to the defense environment, we continue to forecast strong demand creating future growth opportunities for our Defense business. The U.S. Department of Defense and foreign governments have continued flight operations and have allocated budgets to upgrade and modernize their existing fleets, including support for next generation large-combat engine architecture such as Aerospace’s XA100 program. In October 2023, Aerospace achieved a significant milestone with the U.S. Army's acceptance of the first two T901 flight test engines that will power the Future Attack Reconnaissance Aircraft prototypes.
We increased our Commercial engine sales this year compared to prior year, however, Defense engine sales decreased compared to prior year. Global material availability, supplier delivery performance and skilled labor shortages continue to cause disruptions for our suppliers and for us, and have impacted our production and delivery. We continue to partner with our customers on future production rates. Aerospace is proactively managing the impact of inflationary pressure by deploying lean initiatives to drive cost productivity, partnering with our suppliers and adjusting the pricing of our products and services. We expect the impact of inflation will continue, and we are taking actions to mitigate the impact.
Total engineering, comprising company, customer and partner-funded and nonrecurring engineering costs, increased compared to the prior year. We remain committed to investing in developing and maturing technologies that enable a more sustainable future of flight.
Notably, CFM’s Revolutionary Innovation for Sustainable Engines (RISE) program represents our single largest efficiency step change, aiming to reduce fuel consumption and CO2 emissions by at least 20% compared to today’s most efficient engines. In December 2023, NASA selected Aerospace for phase two of the Hybrid Thermally Efficient Core program, which will significantly enhance fuel efficiency and reduce emissions for the next-generation of commercial aircraft engines.
We continue to take actions to serve our customers as demand in the global airline industry increases. Aerospace has a deep history of innovation and technology leadership. Our commercial and defense engine installed base, including units produced by joint ventures, of approximately 70,000 units, with approximately 12,600 units under long-term service agreements, supports recurring, profitable services growth for the future. We believe these strong fundamentals position Aerospace to generate long-term profitable growth and higher cash flow over time.
| | | | | | | | | | | | | | |
| | | |
| Sales in units, except where noted | | | | 2023 | 2022 | 2021 |
| Commercial Engines(a) | | | | 2,075 | | 1,663 | | 1,487 | |
| LEAP Engines(b) | | | | 1,570 | | 1,136 | | 845 | |
| Defense Engines | | | | 556 | | 632 | | 553 | |
| Spare Parts Rate(c) | | | | $ | 36.1 | | $ | 26.9 | | $ | 17.8 | |
(a) Commercial Engines now includes Business Aviation and Aeroderivative units for all periods presented. (b) LEAP engines are subsets of commercial engines. (c) Commercial externally shipped spare parts and spare parts used in time and material shop visits in millions of dollars per day. |
| | | | | | | | | | | |
| RPO | December 31, 2023 | December 31, 2022 | December 31, 2021 |
| Equipment | $ | 16,247 | | $ | 13,748 | | $ | 11,139 | |
| Services | 137,611 | | 121,511 | | 114,133 | |
| Total RPO | $ | 153,858 | | $ | 135,260 | | $ | 125,272 | |
RPO as of December 31, 2023 increased $18.6 billion (14%) from December 31, 2022, due to increases in both equipment and services. Equipment increased primarily due to an increase in both Commercial and Defense equipment orders since December 31, 2022. Services increased primarily due to contract modifications and as a result of engines contracted under long-term service agreements that have now been put into service.
| | | | | | | | | | | | | | | | | | | | | | | | | |
| | | |
| SEGMENT REVENUES AND PROFIT | | | | | | 2023 | | 2022 | | 2021 | |
| Commercial Engines and Services | | | | | | $ | 23,684 | | | $ | 18,665 | | | $ | 14,360 | | |
| Defense | | | | | | 4,714 | | | 4,410 | | | 4,136 | | |
| Systems & Other | | | | | | 3,372 | | | 2,975 | | | 2,814 | | |
| Total segment revenues | | | | | | $ | 31,770 | | | $ | 26,050 | | | $ | 21,310 | | |
| | | | | | | | | | | |
| Equipment | | | | | | $ | 9,319 | | | $ | 7,842 | | | $ | 7,531 | | |
| Services | | | | | | 22,451 | | | 18,207 | | | 13,780 | | |
| Total segment revenues | | | | | | $ | 31,770 | | | $ | 26,050 | | | $ | 21,310 | | |
| | | | | | | | | | | |
| Segment profit | | | | | | $ | 6,115 | | | $ | 4,775 | | | $ | 2,882 | | |
| Segment profit margin | | | | | | 19.2 | | % | 18.3 | | % | 13.5 | | % |
*Non-GAAP Financial Measure
| | | | | | | | | | | |
| SUMMARY OF REPORTABLE SEGMENTS | 2020 | 2019 | 2018 |
| Power | $ | 17,589 | | $ | 18,625 | | $ | 22,150 | |
| Renewable Energy | 15,666 | | 15,337 | | 14,288 | |
| Aviation | 22,042 | | 32,875 | | 30,566 | |
| Healthcare | 18,009 | | 19,942 | | 19,784 | |
| | | |
| Capital | 7,245 | | 8,741 | | 9,551 | |
| Total segment revenues | 80,551 | | 95,519 | | 96,339 | |
| Corporate items and eliminations | (932) | | (305) | | 673 | |
| Consolidated revenues | $ | 79,619 | | $ | 95,214 | | $ | 97,012 | |
| | | |
| Power | $ | 274 | | $ | 291 | | $ | (1,105) | |
| Renewable Energy | (715) | | (791) | | 140 | |
| Aviation | 1,229 | | 6,812 | | 6,454 | |
| Healthcare | 3,060 | | 3,737 | | 3,522 | |
| | | |
| Capital | (1,710) | | (530) | | (489) | |
| Total segment profit | 2,138 | | 9,519 | | 8,521 | |
| Corporate items and eliminations | 8,239 | | (1,825) | | (2,201) | |
| GE Industrial goodwill impairments | (877) | | (1,486) | | (22,136) | |
| GE Industrial interest and other financial charges | (1,333) | | (2,115) | | (2,415) | |
| GE Industrial non-operating benefit costs | (2,424) | | (2,828) | | (2,740) | |
| GE Industrial benefit (provision) for income taxes | (388) | | (1,309) | | (467) | |
| Earnings (loss) from continuing operations attributable to GE common shareholders | 5,355 | | (44) | | (21,438) | |
| Earnings (loss) from discontinued operations, net of taxes | (125) | | (5,335) | | (1,363) | |
| Less net earnings (loss) attributable to noncontrolling interests, discontinued operations | — | | 60 | | 1 | |
| Earnings (loss) from discontinued operations, net of taxes and noncontrolling interests | (125) | | (5,395) | | (1,364) | |
| Consolidated net earnings (loss) attributable to GE common shareholders | $ | 5,230 | | $ | (5,439) | | $ | (22,802) | |
Revenues increased $5.7 billion (22%) organically*. Commercial Services revenues increased, primarily due to increased commercial spare part shipments, higher internal shop visit volume, heavier work scopes and higher prices. Commercial Engines revenue increased, from 412 more commercial install and spare engine unit shipments, including 434 more LEAP units compared to the prior year. Defense revenues increased, primarily due to product mix and growth in development contract revenue, partially offset by 76 fewer engine shipments than the prior year.
Profit increased $1.2 billion (25%) organically*, primarily due to benefits from increased commercial spare part shipments, higher internal shop visit volume, heavier work scopes and higher prices. These increases in profit were partially offset by additional growth investment, inflation in our supply chain and product mix.
RENEWABLE ENERGY – will be part of GE Vernova. We benefit from one of the broadest portfolios in the industry that uniquely positions us to lead the energy transition while building on advanced technologies that grow renewable energy generation, lower the cost of electricity and modernize the grid. Our portfolio of business units includes onshore and offshore wind, blade manufacturing, grid solutions, hydro, battery storage, hybrid renewables and digital services offerings.
POWER.Onshore Wind – delivers wind turbines, technology and services for the onshore wind power industry by focusing on work-horse products in select locations, while continuing to innovate the technology to create wind turbines suitable for various markets and environmental conditions. Wind Services assist customers in improving cost, capacity and performance of their assets over the lifetime of their fleets, utilizing digital infrastructure to monitor, predict and optimize wind farm energy performance. Our Onshore Wind business supports a turbine installed base of over 55,000 units, of which slightly fewer than half are under service agreements.
Grid Solutions Equipment and Services (Grid) – enables power utilities and industries worldwide to effectively manage electricity from the point of generation to consumption, helping the reliability, efficiency and resiliency of the grid. Service offerings include a comprehensive portfolio of equipment, hardware, protection and control, automation and digital services. Grid is also addressing the challenges of the energy transition by safely and reliably connecting intermittent renewable energy generation to transmission networks.
Hydro, Offshore Wind and Hybrid Solutions – Hydro provides a portfolio of solutions and services for hydropower generation for both large hydropower plants and small hydropower solutions. Offshore Wind provides wind power technologies and wind farm development. Hybrid Solutions provides integration of renewable energies that drive stability to the grid and integrates storage and renewable energy generation sources.
Competition & Regulation. While many factors, including government incentives, specific market rules, and permitting regulations and challenges affect how renewable energy can deliver outcomes for customers in a given region, renewable energy has become competitive with fossil fuels in terms of levelized cost of electricity. We continue to invest in improving the durability of our wind turbine products, fleet availability and project execution. We have an increased focus on project selectivity and reducing the number of product variants. Additionally, we continue to explore ways to further improve the efficiency and flexibility of our hydropower technology with new innovative turbine designs and digital solutions. The power grid, which was designed historically for one-way flow of electricity from centralized plants, must be augmented to accommodate two-way flows from a highly distributed network of generation and storage solutions. As industry models continue to evolve, our digital strategy and investments in technical innovation will position us to add value for customers looking for clean, renewable energy.
Significant Trends & Developments. During the year ended December 31, 2023, the segment experienced higher orders and revenue from increased demand at Grid, Onshore Wind projects in the U.S. and higher revenue at Offshore Wind. Grid Solutions signed a significant agreement to supply its two-gigawatt HVDC systems to connect wind farms in the North Sea to the Netherlands and Germany. The Inflation Reduction Act of 2022 (IRA) introduced new and extended existing tax incentives for at least 10 years. It has resolved recent U.S. policy uncertainty that resulted in project delays and deferral of customer investments in Onshore Wind and increased near- and longer-term demand in the U.S. for onshore and offshore wind projects. Included in our RPO of $42.8 billion at December 31, 2023 are service agreements on approximately 24,000 of our onshore wind turbines, from an installed base of over 55,000 units. New product introductions, such as our 3 MW, 5 MW and 6 MW Onshore units, and our 12-14 MW Haliade-X Offshore units, account for more than half of our RPO in Onshore and Offshore Wind. As of December 31, 2023, the first 13 MW Haliade-X units have achieved first power. Finally, our Grid business is positioned to support grid expansion and modernization needs.
At Onshore Wind, we continue to focus on improving our overall quality and fleet availability. We are reducing product variants and deploying repairs and other corrective measures across the fleet. Concurrently, we intend to operate in fewer geographies and focus on those markets that align better with our products and manufacturing footprint. We are realizing the favorable impact of the IRA through a reduction in product costs as qualifying turbines manufactured in the U.S. in 2023 are delivered. More than two-thirds of Onshore Wind’s equipment RPO is associated with U.S. projects where we expect to receive additional IRA benefits as incremental qualifying turbines are delivered. Finally, we are continuing our restructuring program to reduce our operating costs and are seeing the benefits both operationally and financially.
The Offshore Wind industry, where we expect global growth through the coming decades, currently faces challenges as companies attempt to increase output and reduce cost. In our Offshore Wind business, we continue to experience pressure related to our product and project cost estimates. Although we are deploying countermeasures to combat these pressures and are committed to driving productivity and cost improvement for our new larger turbines, changes in execution timelines or other adverse developments likely could have an adverse effect on our cash collection timelines and contract profitability, and could result in further losses beyond the amounts that we currently estimate.
*Non-GAAP Financial Measure
Our Grid Solutions business is positioned to support grid expansion and modernization needs globally. We secured a position in the rapidly growing offshore interconnection market with new products and technology supporting a 2 GW High Voltage Direct Current (HVDC) solution standard and are developing new technology, such as Grid-forming Static Synchronous Compensators and eco-friendly SF6-free switchgears, that solves for a denser, more resilient, stable and efficient electric grid; a grid with lower future greenhouse gas emissions. We also benefited from higher growth in orders from other transmission and grid automation related products within our Grid Solutions business.
| | | | | | | | | | | | | | |
| | | | |
| | | | |
| Sales in units, except where noted | | | | 2023 | 2022 | 2021 |
| Wind Turbines | | | | 2,225 | | 2,190 | | 3,590 | |
| Wind Turbine Gigawatts | | | | 8.5 | | 7.5 | | 11.7 | |
| | | | | | |
| | | | | | |
| Repower units | | | | 179 | | 580 | | 561 | |
| | | | | | |
| | | | | | |
| | | | | | | | | | | |
| RPO | December 31, 2023 | December 31, 2022 | December 31, 2021 |
| Equipment | $ | 27,703 | | $ | 20,142 | | $ | 18,639 | |
| Services | 15,082 | | 14,799 | | 14,652 | |
| Total RPO | $ | 42,785 | | $ | 34,941 | | $ | 33,291 | |
RPO as of December 31, 2023 increased $7.8 billion (22%) from December 31, 2022 primarily from several new HVDC projects at Grid and increases at Onshore Wind driven by a large order in the U.S., partially offset by a decrease in the Onshore Wind international market as revenues recognized outpaced new orders as we decrease the number of geographies we operate in, and a decrease at Offshore Wind where revenues outpaced new orders, as well as an order received during the second quarter and cancelled during the fourth quarter. RPO as of December 31, 2022 increased $1.6 billion (5%) from December 31, 2021 primarily from new orders at Grid and Hydro exceeding sales, partially offset by the approximately $1.3 billion impact from a stronger U.S. dollar and revenue exceeding new orders at Offshore Wind.
| | | | | | | | | | | | | | | | | | | | | | | | | |
| | | | | | |
| SEGMENT REVENUES AND PROFIT | | | | | | 2023 | | 2022 | | 2021 | |
| | | | | | | | | | | |
| | | | | | | | | | | |
| | | | | | | | | | | |
| | | | | | | | | | | |
| Onshore Wind | | | | | | $ | 8,369 | | | $ | 8,373 | | | $ | 11,026 | | |
| Grid Solutions equipment and services | | | | | | 3,851 | | | 3,086 | | | 3,207 | | |
| | | | | | | | | | | |
| Hydro, Offshore Wind and Hybrid Solutions | | | | | | 2,830 | | | 1,518 | | | 1,464 | | |
| Total segment revenues | | | | | | $ | 15,050 | | | $ | 12,977 | | | $ | 15,697 | | |
| | | | | | | | | | | |
| Equipment | | | | | | $ | 12,625 | | | $ | 10,191 | | | $ | 13,224 | | |
| Services | | | | | | 2,425 | | | 2,785 | | | 2,473 | | |
| Total segment revenues | | | | | | $ | 15,050 | | | $ | 12,977 | | | $ | 15,697 | | |
| | | | | | | | | | | |
| Segment profit (loss) | | | | | | $ | (1,437) | | | $ | (2,240) | | | $ | (795) | | |
| Segment profit margin | | | | | | (9.5) | | % | (17.3) | | % | (5.1) | | % |
For the year ended December 31, 2023, segment revenues were up $2.1 billion (16%) and segment losses were down $0.8 billion (36%).
Revenues increased $2.1 billion (17%) organically*, primarily from higher equipment revenue at Offshore Wind associated with the Haliade-X ramp up, increases at Grid in equipment and services and increases at Onshore Wind equipment in North America. These increases were partially offset by a decrease in repower revenue driven by a reduction in volume.
Segment losses decreased $1.0 billion (45%) organically*, primarily attributable to the improved performance at Onshore Wind through improved pricing and the impact of cost reduction activities, the nonrecurrence of prior year warranty and related charges of $0.5 billion and benefits arising from the IRA on product cost of $0.2 billion. Additionally, Grid profit increased due to higher revenue, improved pricing and the impact of cost reduction activities. These benefits were partially offset by higher losses at Offshore Wind associated with Haliade-X ramp up where project losses increased by $0.4 billion.
POWER – will be part of GE Vernova. Power serves power generation, industrial, government and other customers worldwide with products and services related to energy production. Our products and technologies harness resources such as oil,natural gas, fossil, oil, diesel nuclear and waternuclear to produce electric power and include gas and steam turbines, full balance of plant, upgrade and service solutions, as well as data-leveraging software. We have organized the businesses within our Power segment into Gas Power and Power Portfolio.
Gas Power– – offers a wide spectrum of heavy-duty and aeroderivative gas turbines for utilities, independent power producers and numerous industrial applications, ranging from small, mobile power to utility scale power plants. Gas Power also delivers maintenance service and upgradeservice solutions across total plant assets and over their operational lifecycle.
Steam Power Portfolio – – offers steama broad portfolio of technologies and services predominately for nuclear and fossil power technology for fossil and nuclear applications including boilers, generators, steam turbines and Air Quality Control Systems (AQCS)plants to help efficiently producecustomers deliver reliable power as they transition to a lower carbon future.
Power Conversion, Nuclear and provide performance over the life of a power plant. Power Portfolio alsoother - applies the science and systems of power conversion to provide motors, generators, automation and control equipment and drives for energy intensive industries such as marine, oil and gas, mining, rail, metals and test systems and water. Itsystems. Through joint ventures with Hitachi, it also offers advanced reactor technologiesprovides nuclear technology solutions including reactors, fuels and support services for boiling water reactors through joint ventures with Hitachi for nuclear fleets.including reactor design, reactor fuel and support services, and the design and development of small modular reactors.
*Non-GAAP Financial Measure
Competition & Regulation. Regulation. Worldwide competition for power generation products and services is intense. Demand for power generation is global, and as a result, is sensitive to the economic and political environments of each country in which we do business. Our products and services sold to end customers are often subject to many regulatory requirements and performance standards under different federal, state, foreign and energy industry standards. In addition, we are subject to market and other dynamics related to decarbonization, where it will remain important to lower greenhouse gas emissions for decades to come, which will likely depend in part on technologies that are not yet deployed or widely adopted today but may become more important over time (such as hydrogen-based power generation, carbon capture and sequestration technologies or small modular reactors or other advanced nuclear power).
Significant Trends & Developments. DevelopmentsWe continue to execute for our customers through COVID-19, prioritizing safety first and foremost. From an operations perspective, we are working within our supply chain and with our suppliers to catch up on parts and project scope that were delayed as a result of COVID-19. Despite difficult travel and customer site restrictions, we continue to service our customers' installed base and have completed roughly 90% of all planned outages in. During the year. From a market perspective, both gas-based electricity generation andyear ended December 31, 2023, GE gas turbine utilization has remained stable. Our abilitywas up low single digits, with strength in the U.S. partially offset by lower utilization in Europe due to close transactions, particularly services parts & upgrades, has been impacted by constrained customer budgetsnuclear and accesshydro recoveries as well as renewables growth. Global electricity demand was down low single digits for the year due to milder temperatures in the U.S. and the continued effects of energy saving policies in Europe. As we continue to work in emerging markets, there could be uncertainty in the timing of deal closures due to financing dueand other complexities. Power has proactively managed the impact of inflationary pressure by deploying lean initiatives to oil pricesdrive cost productivity, partnering with our suppliers and economic slowdown, especially in Gas Power. adjusting the pricing of our products and services. Given the long-cycle nature of the business, we expect the impact of inflation will continue to be challenging and we will continue to take actions to manage.
Although there may be market challenges infactors related to the near term,energy transition, such as greater renewable energy penetration and the adoption of climate change-related policies continue to evolve, we expect the gas power market to remain stable over the next decade with gas power generation continuing to grow low single digits. We believe gas power will play a critical role in the energy transition by providing a critical foundation of dispatchable, flexible power and our view ofsystem inertia from which the market has not materially changed, albeit timing on new orders is harder to forecast.
Power continues to right size its business to better align with market demand and drive its businesses with an operational rigor and discipline that is focused on its customers’ lifecycle experience. In Gas Power, we continue to size the business for a 25-30 GW market, although acknowledge that the size any given yearenergy transition can vary.build upon. We remain focused on our underwriting discipline and risk management to ensure we are securing deals that meet our financial hurdles, andwhere we have a high confidence to deliverin delivering for our customers.
Looking ahead, we anticipateIn the power market to continue to be impacted by overcapacity in the industry, continued price pressure from competition on servicing the installed base, and the uncertain timing of deal closures due to financing and the complexities of working in emerging markets. Market factors related to the energy transition such as greater renewable energy penetration and the adoption of climate change-related policies continue to impact long-term demand, to differing degrees across markets globally. As such, we announced in the thirdfirst quarter of 20202022, we signed a non-binding memorandum of understanding for GE Steam Power to sell a part of its nuclear activities to Électricité de France S.A. (EDF), which resulted in a reclassification of that business to held for sale. In the fourth quarter of 2022, we will be exitingsigned a binding agreement to sell a portion of our Steam business to EDF. We are working with EDF to complete the new build coal power market, while continuingsale as soon as possible, subject to regulatory approvals and other closing conditions. In the second quarter of 2023, our Gas Power business acquired Nexus Controls, a business specializing in aftermarket control system upgrades and controls field services that is expected to strengthen our quality, service, and delivery of our customers' installed base.assets.
We continue to invest in new product development, such as our HA-Turbines,development. In Nuclear, we have signed an agreement with a customer for the deployment of small modular nuclear reactor technology, the first commercial contract in North America, with the potential to enable reductions in nuclear power plant costs and upgrades as these are criticalcycle times. In Gas Power, we continue to our customers andinvest for the long-term, strategy of the business. In 2020, we supplied the first purpose-built hydrogen-burning power plant in the U.S.including multiple decarbonization pathways that will provide customers with Gas Power's 7HA.02 turbine.cleaner, more reliable power. Our fundamentals remain strong with approximately $80$71.7 billion in backlogRPO and a gas turbine installed base greater thanof approximately 7,000 units includingand approximately 1,8001,700 units under long-term service agreements.agreements with an average remaining contract life of 10 years. This includes 22 HA-Turbines in RPO and 92 HA-Turbines in the installed base with over two million operating hours.
| | | Orders | | Sales |
| (In units) | 2020 | 2019 | | 2020 | 2019 |
| | Sales in units | |
| | Sales in units | |
| | Sales in units | | | | | 2023 | 2022 | | 2021 |
| GE Gas Turbines | GE Gas Turbines | 68 | | 74 | | | 71 | | 53 | |
| Heavy-Duty Gas Turbines(a) | Heavy-Duty Gas Turbines(a) | 57 | | 63 | | | 51 | | 38 | |
| HA-Turbines(b) | HA-Turbines(b) | 20 | | 18 | | | 21 | | 11 | |
| Aeroderivatives(a) | Aeroderivatives(a) | 11 | | 11 | | | 20 | | 15 | |
| GE Gas Turbine Gigawatts(c) | 15.0 | | 13.6 | | |
(a) Heavy-Duty Gas Turbines and Aeroderivatives are subsets of GE Gas Turbines. (b) HA-Turbines are a subset of Heavy-Duty Gas Turbines. (c) Gigawatts reported associated with financial orders in the periods presented. | | (a) Heavy-Duty Gas Turbines and Aeroderivatives are subsets of GE Gas Turbines.
(b) HA-Turbines are a subset of Heavy-Duty Gas Turbines. | |
(a) Heavy-Duty Gas Turbines and Aeroderivatives are subsets of GE Gas Turbines.
(b) HA-Turbines are a subset of Heavy-Duty Gas Turbines. | |
(a) Heavy-Duty Gas Turbines and Aeroderivatives are subsets of GE Gas Turbines.
(b) HA-Turbines are a subset of Heavy-Duty Gas Turbines. | |
| | 2020 | | 2019 | | 2018 | |
| RPO | | RPO | December 31, 2023 | December 31, 2022 | December 31, 2021 |
| Equipment | Equipment | $ | 17,127 | | | $ | 17,661 | | | $ | 18,763 | | |
| Services | Services | 62,448 | | | 67,640 | | | 66,230 | | |
| Total backlog | $ | 79,575 | | | $ | 85,302 | | | $ | 84,993 | | |
| | Equipment | $ | 4,597 | | | $ | 5,215 | | | $ | 9,319 | | |
| Services | 11,390 | | | 11,684 | | | 13,326 | | |
| Total orders | $ | 15,986 | | | $ | 16,899 | | | $ | 22,645 | | |
| Total RPO | |
| | | | | | | | | | | | | | | | | | | | |
| | | | | | |
| Gas Power | $ | 12,655 | | | $ | 13,122 | | | $ | 13,296 | | |
| Power Portfolio | 4,935 | | | 5,503 | | | 8,853 | | |
| Total segment revenues | $ | 17,589 | | | $ | 18,625 | | | $ | 22,150 | | |
| | | | | | | | | | | | | | | | | | | | |
| | | | | | |
| | | | | | |
| Equipment | $ | 6,707 | | | $ | 6,247 | | | $ | 8,077 | | |
| Services | 10,883 | | | 12,378 | | | 14,073 | | |
| Total segment revenues(a) | $ | 17,589 | | | $ | 18,625 | | | $ | 22,150 | | |
| | | | | | |
| Segment profit (loss)(b)(c) | $ | 274 | | | $ | 291 | | | $ | (1,105) | | |
| Segment profit margin | 1.6 | | % | 1.6 | | % | (5.0) | | % |
(a) Power segment revenues represent 24% and 22%RPO as of total industrial revenues and total segment revenues, respectively, for the year ended December 31, 2020.
(b) Power segment profit represents 4% of total industrial profit for the year ended2023 increased $2.7 billion (4%) from December 31, 2020.2022, primarily driven by increases in Gas Power services, Gas Power equipment and Power Conversion equipment, partially offset by decreases due to the impact of expanded sanctions on Gas Power contractual services in Russia.
(c) Included restructuring charges of $16 million, $94 million and $297 million for the years ended December 31, 2020, 2019 and 2018, respectively, that were previously reported within the Corporate segment and were reclassified into the Power segment results in the fourth quarter of 2020 for all periods presented. For a summary of all restructuring charges by segment, see the Other Consolidated Information section. | | | | | | | | | | | | | | | | | | | | | | | | | |
| | | | | |
| SEGMENT REVENUES AND PROFIT | | | | | | 2023 | | 2022 | | 2021 | |
| | | | | | | | | | | |
| | | | | | | | | | | |
| | | | | | | | | | | |
| | | | | | | | | | | |
| Gas Power | | | | | | $ | 13,289 | | | $ | 12,072 | | | $ | 12,080 | | |
| Steam Power | | | | | | 2,505 | | | 2,643 | | | 3,241 | | |
| Power Conversion, Nuclear and other | | | | | | 1,936 | | | 1,547 | | | 1,582 | | |
| Total segment revenues | | | | | | $ | 17,731 | | | $ | 16,262 | | | $ | 16,903 | | |
| | | | | | | | | | | |
| Equipment | | | | | | $ | 5,396 | | | $ | 4,737 | | | $ | 5,035 | | |
| Services | | | | | | 12,335 | | | 11,526 | | | 11,868 | | |
| Total segment revenues | | | | | | $ | 17,731 | | | $ | 16,262 | | | $ | 16,903 | | |
| | | | | | | | | | | |
| Segment profit (loss) | | | | | | $ | 1,449 | | | $ | 1,217 | | | $ | 726 | | |
| Segment profit margin | | | | | | 8.2 | | % | 7.5 | | % | 4.3 | | % |
For the year ended December 31, 2020, segment orders were down $0.9 billion (5%), segment revenues were down $1.0 billion (6%) and segment profit was down 6%.
Backlog as of December 31, 2020 decreased $5.7 billion (7%) from December 31, 2019, primarily driven by sales outpacing new orders.
Orders decreased $0.8 billion (4%) organically, primarily due to decreases in Gas Power Heavy-Duty Gas Turbine unit and services orders and Steam equipment orders.
Revenues decreased $0.9 billion (5%) organically*, primarily due to decreases in Gas Power services revenues, primarily related to decreases in transactional part sales and upgrades, partially offset by increases in Gas Power equipment revenues related to 13 more Heavy-Duty gas turbine unit shipments. Steam equipment and service revenues also decreased.
Profit decreased 7% organically* due to lower revenues, charges of approximately $0.3 billion related to an under-performing JV in China, charges related to contracts, a charge for a specific customer credit event at Gas Power, and a quality reserve at Power Portfolio on the legacy product line that we have since exited in Power Conversion, partially offset by continued efforts to right size the business across Gas Power and Power Portfolio.
*Non-GAAP Financial Measure
RENEWABLE ENERGY. Renewable Energy includes one of the broadest portfolios in the industry to provide end-to-end solutions for our customers demanding reliable and affordable renewable energy by combining onshore and offshore wind, blades, hydro, storage, solar and grid solutions, as well as hybrid renewables and digital services offerings. We have installed more than 400 gigawatts of clean renewable energy equipment and equipped more than 90 percent of utilities with our grid solutions in developed and emerging markets.
Onshore Wind –delivers technology and services for the onshore wind power industry by providing smart, modular turbines that are uniquely situated for a variety of wind environments. Wind services help customers improve cost, capacity and performance of their assets over the lifetime of the fleet, utilizing digital infrastructure to monitor, predict and optimize wind farm energy performance. Our Onshore Wind business supports a turbine installed base of approximately 50,000 units. For reporting purposes, Onshore Wind includes the operations of our blade manufacturer, LM Wind.
Grid Solutions Equipment and Services (Grid) – equips power utilities and industries worldwide to bring power reliably and efficiently from the point of generation to end power consumers. Grid offers a comprehensive portfolio of equipment, hardware, protection and control, automation and digital services. Grid is also equipped to address the challenges of the energy transition by safely and reliably connecting intermittent renewable energy generation to transmission networks.
Hydro Solutions – represents more than 25 percent of the total installed hydropower capacity worldwide through a portfolio of solutions and services for hydropower generation, including the design, management, construction, installation, maintenance and operation of both large hydropower plants and small hydropower solutions, as well as offering a comprehensive asset management program to hydropower plant operators.
Offshore Wind–leads the industry in offshore wind power technologies and offshore wind farm development with the Haliade-X, the world's most powerful offshore wind turbine installed today.
Hybrid Solutions – provides reliable, affordable and dispatchable integration of renewable energies that drive vital stability to the grid and includes unique applications to integrate storage and renewable energy generation sources, such as wind, hydropower and solar.
Competition & Regulation. While many factors, including government incentives and specific market rules, affect how renewable energy can deliver outcomes for customers in a given region, renewable energy is increasingly able to compete with fossil fuels in terms of levelized cost of electricity. However, continued competitive pressure from other wind and hydro turbine manufacturers as well as from other energy sources, such as solar photovoltaic, reinforced by a general move to electricity auction mechanisms, has driven price pressure and the need for innovation.
We continue to invest in generating wind turbine product improvements, including larger rotors, taller towers and higher nameplate ratings that continue to drive down the cost of wind energy, and in exploring new ways to further improve the efficiency and flexibility of our hydropower technology with new innovative turbine designs and digital solutions. As industry models continue to evolve, our digital strategy and investments in technical innovation will position us to add value for customers looking for clean, renewable energy.
Significant Trends & Developments. Renewable energy is in a rapid transition period and competes in the marketplace against existing and new conventional energy sources. Wind energy is currently the second-largest contributor to renewable capacity growth with hydropower projected to remain the largest renewable electricity source through 2023.
We continue to observe growth across the global onshore wind market together with a positive impact on deliveries and installations in the U.S. from the Production Tax Credit (PTC) cycle and customer preference shifting to larger, more efficient units to drive down costs and compete with other power generation options. Despite the competitive nature of the market, onshore wind order pricing has stabilized globally. Several energy-related tax credit extensions were passed into law in December 2020 further extending the phase-down of U.S. PTCs. Under the current legislation, onshore wind projects that begin construction in 2021 will also qualify for a 60% PTC. We expect high levels of production observed in 2020 to continue for 2021 deliveries at Onshore Wind and are closely monitoring our execution during this period.
Additionally, offshore wind projects that begin construction before 2026 are eligible to elect either the PTC or the Investment Tax Credit (ITC), with the ITC extended by five years at the full rate. We have received full certification for our Haliade-X 12- and 13MW prototypes and during the fourth quarter of 2020 reported orders within Offshore Wind for the supply of 95 Haliade-X 13MW units for the first phase of the Dogger Bank Wind Farm in the U.K.
New product introductions remain important to our onshore and offshore customers who are demonstrating the willingness to adopt the new technology of larger turbines that decrease the levelized cost of energy. During 2020, we delivered our first Onshore 5MW Cypress units and have reported more than 600 of these units in backlog. We have observed significant market demand for our Offshore Haliade-X units and based on existing customer commitments, expect to report additional orders and backlog for the next two phases of Dogger Bank and for offshore projects in the U.S. upon obtaining final notification to proceed. We are preparing for large scale production of Haliade-X in response to this market demand.
The grid market remains challenging as we continue to experience pricing pressure in the High Voltage Direct Current (HVDC) and High Voltage (HV) product lines. The hydropower industry continues to maximize value and grid flexibility with refurbishments, repower and pumped storage projects to support both wind and solar expansion. The Grid and Hydro businesses are executing their turnaround plans and we are expecting improved operating results in 2021.
Despite the COVID-19 pandemic, we have continued to deliver for our customers, while taking all necessary precautions for our employees, and returned our manufacturing locations and long-term project sites to pre-COVID-19 capacity levels and operations. While we do not believe the long-term outlook for renewable energy products and services has materially changed, we are monitoring the impact of the pandemic on the renewable energy industry, including electricity consumption forecasts and customer capital expenditure levels, supply chain, availability of financing and our ability to execute on equipment and long-term projects, including the impact of possible customer related delays. In response to volume declines in certain of our businesses, we implemented additional cost reduction measures, restructuring and cash preservation actions.
| | | | | | | | | | | | | | | | | |
| Orders | | Sales |
Onshore and Offshore (In units) | 2020 | 2019 | | 2020 | 2019 |
| Wind Turbines | 3,602 | | 4,325 | | | 3,744 | | 3,424 | |
| Wind Turbine Gigawatts | 12.7 | | 12.8 | | | 10.8 | | 9.5 | |
| Repower units | 504 | | 1,269 | | | 1,022 | | 1,057 | |
| | | | | | | | | | | | | | | | | | | | |
| 2020 | | 2019 | | 2018 | |
| Equipment | $ | 17,470 | | | $ | 16,297 | | | $ | 14,385 | | |
| Services | 12,531 | | | 11,233 | | | 9,285 | | |
| Total backlog | $ | 30,001 | | | $ | 27,530 | | | $ | 23,670 | | |
| | | | | | |
| Equipment | $ | 14,109 | | | $ | 13,964 | | | $ | 11,763 | | |
| Services | 2,218 | | | 2,920 | | | 3,520 | | |
| Total orders | $ | 16,328 | | | $ | 16,884 | | | $ | 15,283 | | |
| | | | | | | | | | | | | | | | | | | | |
| Onshore Wind | $ | 10,881 | | | $ | 10,421 | | | $ | 8,220 | | |
| Grid Solutions equipment and services | 3,585 | | | 4,016 | | | 4,579 | | |
| Hydro, Offshore Wind and Hybrid Solutions | 1,200 | | | 900 | | | 1,489 | | |
| Total segment revenues | $ | 15,666 | | | $ | 15,337 | | | $ | 14,288 | | |
| | | | | | | | | | | | | | | | | | | | |
| | | | | | |
| Equipment | $ | 12,859 | | | $ | 12,267 | | | $ | 11,419 | | |
| Services | 2,807 | | | 3,069 | | | 2,870 | | |
| Total segment revenues(a) | $ | 15,666 | | | $ | 15,337 | | | $ | 14,288 | | |
| Segment profit (loss)(b)(c) | $ | (715) | | | $ | (791) | | | $ | 140 | | |
| Segment profit margin | (4.6) | | % | (5.2) | | % | 1.0 | | % |
(a)Renewable Energy segment revenues represent 21% and 19% of total industrial revenues and total segment revenues, respectively, for the year ended December 31, 2020.
(b)Renewable Energy segment profit represents (10)% of total industrial profit for the year ended December 31, 2020.
(c)Included restructuring charges of $200 million, $125 million and $152 million for the years ended December 31, 2020, 2019 and 2018, respectively, that were previously reported within the Corporate segment and were reclassified into the Renewable Energy segment results in the fourth quarter of 2020 for all periods presented. For a summary of all restructuring charges by segment, see the Other Consolidated Information section.
For the year ended December 31, 2020, segment orders were down $0.6 billion (3%),2023, segment revenues were up $0.3$1.5 billion (2%(9%) and segment profit was up $0.1$0.2 billion (10%(19%).
Backlog as of December 31, 2020 increased $2.5 billion (9%) from December 31, 2019, primarily from Offshore Wind due to our first Haliade-X order from Dogger Bank Wind Farm, new Cypress platform orders mainly in Onshore Wind Europe and an increase in Hydro. These increases were partially offset by sales exceeding new orders at Grid, primarily as a result of increased commercial selectivity in certain product lines.
Orders decreased $0.4 billion (3%) organically, primarily due to lower Onshore Wind turbine and repower unit orders in North America compared to the prior year due to the PTC phase down and lower orders at Grid. These decreases were partially offset by increased orders at Offshore Wind of Haliade-X, other regions of Onshore Wind, LM Wind, Hybrid Solutions and Hydro.
Revenues increased $0.6$1.2 billion (4%) organically*, primarily from Onshore Wind with 300 more wind turbine shipments on a unit basis, and 13% more on a megawatt basis, and at Offshore Wind and Hybrid Solutions compared to the prior year. These increases were partially offset by lower Grid revenues, primarily attributable to lower volumes in the Power Transformer product line, and lower Hydro revenues.
Profit increased $0.1 billion (6%) organically*, as the impact of higher sales volume at Onshore Wind, the favorable impact of cost reduction measures and improved project execution exceeded higher restructuring costs and the nonrecurrence of a $0.1 billion non-cash gain from the termination of two Offshore Wind contracts in 2019.
*Non-GAAP Financial Measure
AVIATION. Aviation designs and produces commercial and military aircraft engines, integrated engine components, electric power and mechanical aircraft systems. We also provide aftermarket services to support our products.
Commercial – manufactures jet engines for commercial airframes. Our commercial engines power aircraft in all categories: regional, narrowbody and widebody. We also produce and market engines and aftermarket services through joint ventures with Safran Group of France and Raytheon Technologies Corporation via their Pratt & Whitney segment. Commercial provides maintenance, component repair and overhaul services (MRO), including sales of replacement parts.
Military – manufactures jet engines for military airframes. Our military engines power a wide variety of military aircraft including fighters, bombers, tankers, helicopters and surveillance aircraft, as well as marine applications. We provide maintenance, component repair and overhaul services, including sales of replacement parts.
Systems& Other – provides engines, components, systems and services for commercial and military segments. This includes engines and components for business, general aviation and aeroderivative segments, along with avionics systems, aviation electric power systems and gear and transmission components. Additionally, we provide a wide variety of products and services including additive machines from Concept Laser and Arcam EBM, additive materials (including metal powders from AP&C), and additive engineering services through our consultancy brand AddWorksTM.
Competition & Regulation. The global businesses for aircraft jet engines, maintenance, component repair and overhaul services (including parts sales) are highly competitive. Both domestic and international markets are important to the growth and success of the business. Product development cycles are long and product quality and efficiency are critical to success. Research and development expenditures are important in this business, as are focused intellectual property strategies and protection of key aircraft engine design, manufacture, repair and product upgrade technologies. Aircraft engine and systems orders tend to follow civil air travel and demand and military procurement cycles.
Our product, services and activities are subject to a number of global regulators such as the U.S. Federal Aviation Administration (FAA), European Union Aviation Safety Agency (EASA), Civil Aviation Administration of China (CAAC) and other regulatory bodies.
Significant Trends & Developments. The global COVID-19 pandemic continues to have a material adverse effect on the global airline industry. A key underlying driver of Aviation’s commercial engine and services businesses is global commercial air traffic, which in turn is driven by economic activity and consumer and business propensity to travel. Since the beginning of the pandemic in the first quarter of 2020, we have seen varied levels of recovery in global markets. Government travel restrictions, public health advisories, individuals' propensity to travel and continued cases of the virus have all impacted the level of air travel. Due to the global airline industry contraction, Aviation’s airline and airframe customers are taking measures to address reduced demand, which, in turn, continue to materially impact Aviation’s business operations and financial performance. As a result, our long-term service agreement billings decreased approximately 19% from the prior year, partially mitigated by customer billings for contract terminations, modifications and annual contractual minimum engine flight hours. Aviation is closely monitoring government actions and economic and industry forecasts, although such forecasts continue to evolve and reflect the uncertainty about the severity and duration of the decline in commercial air traffic. Aviation regularly tracks global departures, which as of December 31, 2020, were approximately 40% below the pre-COVID-19 baseline. More broadly, we are in frequent dialogue with our airline and airframe customers about the outlook for commercial air travel, new aircraft production, and after-market services. Given the current trend, we expect domestic travel routes primarily served by narrowbody aircraft to recover before long-haul, international travel routes which are primarily served by widebody aircraft. We continue to expect the engine aftermarket recovery to lag departure trends across regions and fleets, which would result in long-term service agreement billings and cash to recover prior to associated revenues and profits. Consistent with industry projections, Aviation continues to estimate the duration of the market recovery to be prolonged over multiple years dependent on containing the spread of the virus, effective inoculation programs and government collaboration to encourage travel, particularly around quarantine requirements.
Aviation has taken several business actions to respond to the current adverse environment, including a reduction of approximately 25% of its total global workforce. For the year ended December 31, 2020, Aviation realized more than $1 billion in operational cost reduction and $2 billion in cash preservation actions, including a headcount reduction of over 11,000 employees. Aviation expects to realize cost and cash savings in 2021 as a result of the actions taken in 2020 and further initiatives in 2021. The business is actively monitoring the pace of demand recovery to ensure the business is appropriately sized for the future. In addition, we continue to partner with our airline and leasing customers and are working closely with our airframe partners to align production rates for 2021 and beyond.
Aviation’s operational and financial performance is impacted by commercial air traffic, shop visit and spare part demand, fleet retirements, and demand for new aircraft. We monitor and forecast each of these factors as part of Aviation’s long-term planning process, which may result in additional business restructuring actions. Given the uncertainty related to the severity and length of the global COVID-19 pandemic and the impact on these factors across the aviation sector and specific customers, Aviation could be required to record charges, impairments, or other adverse financial impacts in future periods if actual results differ significantly from Aviation's current estimates.
As it relates to the military environment, Aviation continues to forecast strong military demand creating future growth opportunities for our Military business as the U.S. Department of Defense and foreign governments have continued flight operations, and have allocated budgets to upgrade and modernize their existing fleets. During 2020, Aviation experienced supply chain execution challenges which resulted in fewer engine and spare part shipments than the prior year. The business is actively addressing these matters to enable future growth in Military.
Total engineering, comprised of company, customer and partner-funded and nonrecurring engineering costs, decreased compared to prior year in line with the changes in the commercial environment. For the year ended December 31, 2020, company-funded research and development spend decreased compared to 2019, and we expect the reduction to continue in line with the actions outlined above. However, customer and partner-funded engineering efforts, primarily in our Military business, increased compared to the prior year. In September 2020, Aviation announced it received certification from the FAA for the GE9X engine, the world’s largest and most powerful commercial aircraft engine.
Aviation is taking actions to protect its ability to serve its customers now and as the global airline industry recovers. While its near-term focus remains on navigating the COVID-19 pandemic, Aviation’s deep history of innovation and technology leadership, commercial engine installed base of approximately 37,700 units, military engine installed base of approximately 26,500 units, with approximately 12,500 units under long-term service agreements, and $260 billion backlog represents strong long-term fundamentals. Aviation is taking actions to protect and strengthen its business and seeks to emerge from this crisis stronger and drive long-term cash and profitable growth over time.
| | | | | | | | | | | | | | | | | |
| Orders | | Sales |
| (In units, except where noted) | 2020 | 2019 | | 2020 | 2019 |
| Commercial Engines | 678 | | 2,390 | | | 1,487 | | 2,863 | |
| LEAP Engines(a) | 351 | | 1,568 | | | 815 | | 1,736 | |
| Military Engines | 1,023 | | 801 | | | 683 | | 717 | |
| Spares Rate(b) | | | | $ | 18.0 | | $ | 31.0 | |
(a) LEAP engines are a subset of Commercial Engines
(b) Commercial externally shipped spares and spares used in time & material shop visits in millions of dollars per day. |
| | | | | | | | | | | | | | | | | | | | |
| 2020 | | 2019 | | 2018 | |
| Equipment | $ | 34,486 | | | $ | 39,131 | | | $ | 37,831 | | |
| Services | 225,927 | | | 234,114 | | | 185,696 | | |
| Total backlog | $ | 260,412 | | | $ | 273,245 | | | $ | 223,527 | | |
| | | | | | |
| Equipment | $ | 8,119 | | | $ | 14,459 | | | $ | 15,268 | | |
| Services | 13,471 | | | 22,280 | | | 20,248 | | |
| Total orders | $ | 21,590 | | | $ | 36,738 | | | $ | 35,517 | | |
| | | | | | | | | | | | | | | | | | | | |
| Commercial Engines & Services | $ | 13,017 | | | $ | 24,217 | | | $ | 22,724 | | |
| Military | 4,572 | | | 4,389 | | | 4,103 | | |
| Systems & Other | 4,453 | | | 4,269 | | | 3,740 | | |
| Total segment revenues | $ | 22,042 | | | $ | 32,875 | | | $ | 30,566 | | |
| | | | | | | | | | | | | | | | | | | | |
| | | | | | |
| Equipment | $ | 8,582 | | | $ | 12,737 | | | $ | 11,499 | | |
| Services | 13,460 | | | 20,138 | | | 19,067 | | |
| Total segment revenues(a) | $ | 22,042 | | | $ | 32,875 | | | $ | 30,566 | | |
| Segment profit (loss)(b)(c) | $ | 1,229 | | | $ | 6,812 | | | $ | 6,454 | | |
| Segment profit margin | 5.6 | | % | 20.7 | | % | 21.1 | | % |
(a)Aviation segment revenues represent 30% and 27% of total industrial revenues and total segment revenues, respectively, for the year ended December 31, 2020.
(b)Aviation segment profit represents 17% of total industrial profit for the year ended December 31, 2020.
(c)Included restructuring charges of $26 million, $8 million and $12 million for the years ended December 31, 2020, 2019 and 2018, respectively, that were previously reported within the Corporate segment and were reclassified into the Aviation segment results in the fourth quarter of 2020 for all periods presented. For a summary of all restructuring charges by segment, see the Other Consolidated Information section.
For the year ended December 31, 2020, segment orders were down $15.1 billion (41%), segment revenues were down $10.8 billion (33%) and segment profit was down $5.6 billion (82%).
Backlog as of December 31, 2020 decreased $12.8 billion (5%) from December 31, 2019, primarily due to a reduction in our Commercial Services backlog and cancellations of commercial equipment orders, which included approximately 1,500 LEAP 1-B unit order cancellations and 22 GE9x unit order cancellations. The reduction to Commercial Services backlog reflects estimates of lower engine utilization, the partial cancellation of long-term service agreements related to the equipment unit order cancellations, and anticipated customer fleet restructuring and contract modifications. Backlog adjustments could be necessary in future periods for additional cancellations of new commercial engine orders, fleet retirements, or changes to customer aircraft utilization and operating behavior.
Orders decreased $14.8 billion (41%) organically, primarily driven by lower commercial equipment and service orders as airline customers have slowed or deferred new engine orders, as well as delayed maintenance and repair operations while existing fleets have lower utilization or been grounded. Military orders increased 21% compared to the prior year primarily driven by equipment and new development orders.
Revenues decreased $10.5 billion (32%) organically*. Equipment revenues decreased, primarily due to 1,376 fewer commercial install and spare engine unit shipments, including 921 fewer LEAP units and 228 fewer CFM56 units versus the prior year, in part due to the 737 MAX grounding and production slowdown. Commercial Services revenues decreased, primarily due to lower commercial spare part shipments, decreased shop visits and the cumulative impact of changes in billing and cost assumptions in our long-term service agreements. Military revenues increased primarily due to increased revenues on development contracts and engine shipment mix, partially offset by fewer engine and spare part shipments due to supply chain execution challenges.
Profit decreased $5.6 billion (82%(7%) organically*, primarily due to lower volumean increase in Gas Power equipment from higher price and scope on commercial spare partHeavy-Duty Gas Turbines and commercial spare engine shipments,scope on Aeroderivatives, increases in Gas Power and decreased shop visitsSteam services and increases in our service agreements. During the year ended December 31, 2020, Aviation recorded expenses of $0.5 billionPower Conversion services and equipment, partially offset by a reduction in Steam Power equipment due to lower production volumes and initiated restructuring actions given decreases in demandthe ongoing exit of new build coal.
Profit increased $0.1 billion (10%) organically* primarily related to commercial engines. Aviation also recorded pre-tax charges totaling $0.2 billion due to expected future losses related primarily to customer credit risk given the current environment. In addition, Aviation recorded net unfavorable changes of $1.1 billion to the estimated profitabilityan increase in its long-term service agreements. This decrease includes a $0.6 billion pre-tax charge to reflect the cumulative COVID-19 pandemic-related impacts of changes to billingGas Power services volume, price and cost assumptions for certain long-term service agreements, reflecting lower engine utilization, anticipated customer fleet restructuring and contract modifications as a result of current and forecasted market conditions. Additional adjustments could occur in future periods and could be material for certain long-term service agreements if actual customer operating behavior differs significantly from Aviation's current estimates.productivity offsetting inflation.
HEALTHCARE. Healthcare provides essential healthcare technologies to developed and emerging markets and has expertise in medical imaging, digital solutions, patient monitoring and diagnostics, drug discovery and performance improvement solutions that are the building blocks of precision health. Products and services are sold worldwide primarily to hospitals and medical facilities.
Healthcare Systems – develops, manufactures, markets and services a broad suite of products and solutions used in the diagnosis, treatment and monitoring of patients that is encompassed in imaging, ultrasound, life care solutions and enterprise software and solutions. Imaging includes magnetic resonance, computed tomography, molecular imaging, x-ray systems and complementary software and services, for use in general diagnostics, women’s health and image-guided therapies. Ultrasound includes high-frequency soundwave systems, and complementary software and services, for use in diagnostics tailored to a wide range of clinical settings. Life Care Solutions (LCS) includes clinical monitoring and acute care systems, and complementary software and services, for use in intensive care, anesthesia delivery, diagnostic cardiology and perinatal care. Enterprise Digital Solutions (EDS) includes enterprise digital, artificial intelligence applications, consulting and Command Center offerings designed to improve efficiency in healthcare delivery and expand global access to advanced health care.
Pharmaceutical Diagnostics – researches, manufactures and markets innovative imaging agents used during medical scanning procedures to highlight organs, tissue and functions inside the human body, to aid physicians in the early detection, diagnosis and management of disease through advanced in-vivo diagnostics. These products include both contrast imaging and molecular imaging agents.
BioPharma – This business was sold on March 31, 2020. It delivered products, services and manufacturing solutions for drug discovery, biopharmaceutical production, and cellular and gene therapy technologies, so that scientists can discover new ways to predict, diagnose and treat disease.
Competition & Regulation. Healthcare competes with a variety of U.S. and non-U.S. manufacturers and services providers. Customers require products and services that allow them to provide better access to healthcare, improve the affordability of care and improve the quality of patient outcomes. Key factors affecting competition include technological innovations, productivity solutions, competitive pricing and the ability to provide lifecycle services. New technologies and solutions could make our products and services obsolete unless we continue to develop new and improved offerings. Our products are subject to regulation by numerous government agencies, as well as laws and regulations that apply to various reimbursement schemes or other government funded healthcare programs.
Significant Trends & Developments. During the first half of 2020, there was an increase in demand for certain of our products that are highly correlated in response to the COVID-19 pandemic, including ventilators, monitoring solutions, x-ray, anesthesia and point-of-care ultrasound product lines. However, we also saw reduction in demand and delays in procurement in other products and services that were not critical to the response efforts or where procedures could be postponed (magnetic resonance, contrast agents and nuclear tracers). We have experienced some moderation in COVID-19 related demand in the second half of 2020 and have experienced some recovery in overall hospital spending, though this varies by market. The pandemic is still driving uncertainty in our markets globally, as well as additional supply chain and logistics costs, and we expect this to continue. We expect capital expenditures, particularly in private markets, to remain under pressure from revenue declines and cautious spending related to COVID-19 impacts. In response to continuing near-term volatility and cost pressures, we have driven structural cost reduction and cash optimization actions that began in the first quarter of 2020.
*Non-GAAP Financial Measure
The global healthcare market has continued to expand, driven by macro trends relating to growing and aging populations, increasing chronic and lifestyle-related diseases, accelerating demand for healthcare in emerging markets, and increasing use of diagnostic imaging. Technological innovation that makes it possible to address an increasing number of diseases, conditions and patients in a more cost-effective manner has also driven growth across each of our global markets.
The Healthcare Systems (HCS) equipment market over the long term continues to expand at low single-digit rates or better, while demand continues for services on new equipment as well as on our existing installed base. However, there is short-term variation driven by market-specific political, environmental and economic cycles. There has been some moderation in tariffs in both U.S. and China, however, this is subject to changes in U.S.-China trade regulations. Long-term growth in emerging markets is driven by trends of expanding demand and access to healthcare. Developed markets are expected to remain steady in the near term driven by macro trends in the healthcare industry.
The Pharmaceutical Diagnostics (PDx) business is well positioned in the contrast agent and nuclear tracer markets. This market is expected to grow over the long-term, driven by continued diagnostic imaging procedure growth and increasing contrast and tracer-enhanced biomarkers of these same procedures, as these products help to increase the precision of the diagnostic information provided to clinicians. After we experienced reduced demand in the first half of 2020, we saw an increase in the second half of 2020 for PDx products as procedure volume increased.
We continue focusing on creating new products and digital solutions as well as expanding uses of existing offerings that are tailored to the different needs of our global customers. GE Healthcare recently introduced the Voluson™ SWIFT, an industry-first Sono-automation tool, which leverages artificial intelligence to automatically identify fetal anatomy, enhancing workflow by more than 70%. In addition, we launched the next version of Mural Virtual Care Solution, which provides clinical decision support with a view of patients' status across a care area, hospital or system. We also completed the acquisition of Prismatic Sensors AB, which specializes in photon counting Computed Tomography (CT).
| | | | | | | | | | | | | | | | | | | | |
| 2020 | | 2019 | | 2018 | |
| Equipment | $ | 5,538 | | | $ | 6,978 | | | $ | 6,254 | | |
| Services | 11,562 | | | 11,480 | | | 11,155 | | |
| Total backlog | $ | 17,100 | | | $ | 18,458 | | | $ | 17,409 | | |
| | | | | | |
| Equipment | $ | 10,811 | | | $ | 12,959 | | | $ | 12,574 | | |
| Services | 7,835 | | | 8,213 | | | 8,323 | | |
| Total orders | $ | 18,645 | | | $ | 21,172 | | | $ | 20,897 | | |
| | | | | | | | | | | | | | | | | | | | |
| Healthcare Systems | $ | 15,387 | | | $ | 14,648 | | | $ | 14,886 | | |
| Pharmaceutical Diagnostics | 1,792 | | | 2,005 | | | 1,888 | | |
| BioPharma | 830 | | | 3,289 | | | 3,010 | | |
| Total segment revenues | $ | 18,009 | | | $ | 19,942 | | | $ | 19,784 | | |
| | | | | | | | | | | | | | | | | | | | |
| | | | | | |
| Equipment | $ | 9,992 | | | $ | 11,585 | | | $ | 11,422 | | |
| Services | 8,017 | | | 8,357 | | | 8,363 | | |
| Total segment revenues(a) | $ | 18,009 | | | $ | 19,942 | | | $ | 19,784 | | |
| Segment profit (loss)(b)(c) | $ | 3,060 | | | $ | 3,737 | | | $ | 3,522 | | |
| Segment profit margin | 17.0 | | % | 18.7 | | % | 17.8 | | % |
(a)Healthcare segment revenues represent 25% and 22% of total industrial revenues and total segment revenues, respectively, for the year ended December 31, 2020.
(b)Healthcare segment profit represents 42% of total industrial profit for the year ended December 31, 2020.
(c)Included restructuring charges of $134 million, $159 million and $176 million for the years ended December 31, 2020, 2019 and 2018, respectively, that were previously reported within the Corporate segment and were reclassified into the Healthcare segment results in the fourth quarter of 2020 for all periods presented. For a summary of all restructuring charges by segment, see the Other Consolidated Information section.
For the year ended December 31, 2020, segment orders were down $2.5 billion (12%), segment revenues were down $1.9 billion (10%) and segment profit was down $0.7 billion (18%).
Backlog as of December 31, 2020 decreased $1.4 billion (7%) from December 31, 2019, primarily due to the BioPharma disposition. Excluding Biopharma, backlog decreased $0.1 billion.
Orders increased $0.3 billion (1%) organically, due to increases in demand for COVID-19 related products, including a $0.3 billion order from the U.S. Department of Health and Human Services to deliver 50,000 ventilators in partnership with Ford, partially offset by PDx. Excluding BioPharma, orders were up $0.1 billion organically.
Revenues increased $0.7 billion (4%) organically*, driven by increased demand in HCS products used directly in response to COVID-19, partially offset by reduced volume in PDx from a decrease in non-essential routine procedures. Excluding BioPharma, revenues increased $0.6 billion (4%) organically*.
Profit increased $0.5 billion (17%) organically*, primarily due to cost reductions and increased demand for HCS products used directly in response to COVID-19, partially offset by decreases in PDx volume. Excluding BioPharma, profits increased $0.4 billion (17%) organically*.
*Non-GAAP Financial Measure
CAPITAL. Capital is the financial services division of GE focused on customers and markets aligned with GE’s industrial businesses across developed and emerging markets. We provide financial products and services around the globe that build on GE’s industry specific expertise in aviation, power, renewables and other activities to capitalize on market-specific opportunities. While there are customer benefits and knowledge sharing advantages linking GE’s industrial and capital businesses, the financial and operational relationships are maintained with arms-length terms as though the businesses were independent.
GE Capital Aviation Services (GECAS)CORPORATE. – an aviation lessor and financier with over 50 years of experience. GECAS provides a wide range of assets including narrow- or widebody aircraft, regional jets, turboprops, freighters, engines, helicopters, financing and materials. GECAS offers a broad array of financing products and services on these assets including operating leases, sale-leasebacks, asset trading and servicing, and airframe parts management. GECAS owns, services or has on order more than 1,600 aircraft and serves approximately 205 customers in 73 countries from a network of 15 offices around the world.
Energy Financial Services (EFS)– a global energy investor that provides financial solutions and underwriting capabilities for Power and Renewable Energy to meet rising demand and sustainability imperatives.
Working Capital Solutions (WCS) – provides working capital services primarily by purchasing GE Industrial customer receivables.
Insurance –Refer to the Other Items - Insurance section for a detailed business description.
Competition & Regulation. The businesses in which we engage are highly competitive and are subject to competition from various types of financial institutions including banks, investors, such as sovereign wealth funds, hedge funds and private equity investors, leasing companies, finance companies associated with manufacturers and insurance and reinsurance companies. For our GECAS operations, competition is based on lease rate financing terms, aircraft delivery dates, condition and availability, as well as available capital demand for financing. For our EFS operations, competition is primarily based on deal structure and terms. As we compete globally, EFS’ success is sensitive to project execution and merchant electricity prices, as well as the economic and political environment of each country in which we do business.
The businesses in which we engage are subject to a variety of U.S. federal and state laws and regulations. Our insurance operations are regulated by the insurance departments in the states in which they are domiciled or licensed, with the Kansas Insurance Department (KID) being our primary state regulator.
Significant Trends & Developments. We continue to evaluate strategic options to accelerate the further reduction in the size of GE Capital, some of which could result in material financial charges depending on the timing, negotiated terms and conditions of any ultimate arrangements.
At GE Capital, the primary effect of the COVID-19 pandemic pertains to its GECAS business. The pandemic has led to worldwide reduction of flight schedules and it is difficult to predict its longer-term impact. Additionally, the related market volatility resulted in higher credit spreads on the investment securities held by our run-off insurance business, which resulted in marks and impairments taken in the first quarter, which, starting in the second quarter more than recovered in 2020.
As of December 31, 2020, GECAS owned 917 fixed-wing aircraft, of which 27 with a book value of $0.6 billion were available to lease to customers (aircraft on the ground). We test recoverability of each fixed-wing aircraft in our operating lease portfolio at least annually. Additionally, we perform quarterly evaluations in circumstances such as when assets are re-leased or current lease terms have changed.
Given the environment, we accelerated our review in the second quarter to focus on leases with higher risk of repossession based on our assessment of customer credit risk default and any unplaced leased assets rolling-off over the next 12 months, which represented approximately 20% of our fixed-wing aircraft operating lease portfolio. In addition, we performed our detailed annual portfolio review in the third quarter of 2020, which incorporated third-party appraisal data, updates to all cash flow assumptions as well as evolving market and customer dynamics that we are monitoring. These analyses resulted in pre-tax impairments of $0.5 billion in 2020, primarily on our fixed-wing aircraft operating lease portfolio. Pre-tax impairments were $0.1 billion in 2019. The increase in pre-tax impairments was driven by declining cash flow projections of the future collectability of rents on aircraft and engines currently under contract related to market impacts resulting from the pandemic. Continued deterioration in cash flow projections, including current rents, downtime, release rates and residual assumptions could result in future impairments in the operating lease portfolio.
Based on the resulting pressure on its airline customers, GECAS continues to work with customers on restructuring requests as they arise. As a result of these requests, we have executed agreements with customers to reschedule certain lease payments. As of December 31, 2020, we have a contractually deferred balance of $0.4 billion. In addition, we have invoiced $0.3 billion under these agreements and collected about 84%. We expect to continue to receive requests for rent deferrals and/or lease restructures from our global airline customers as a result of COVID-19 and related market impacts. An extended disruption of regional or international travel could result in an increase in these types of requests in future periods, which could result in an increase to the trade receivable balance. As GECAS evaluates future lease restructures, there is a risk of lease modifications that could have a material adverse effect on GECAS operations, financial position and cash flows.
In October 2020, Pacific Investment Management Company (PIMCO), one of the world’s premier fixed income investment managers, and GECAS announced they had reached a preliminary agreement to develop an aviation leasing venture to support up to $3 billion in aircraft asset financings. PIMCO and GECAS have executed certain of the definitive agreements and obtained relevant regulatory clearances for the venture.
We annually perform premium deficiency testing in the aggregate across our run-off insurance portfolio in the third quarter. As a result of the testing, we identified no premium deficiency. See the Other Items section and Note 12 for further information.
GE Capital received $2 billion of additional capital contributions from GE in the fourth quarter of 2020. See the Capital Resources and Liquidity section for further information.
As previously mentioned, GE reached a settlement with the SEC and paid a civil penalty of $0.2 billion in December 2020, of which $0.1 billion was recorded and paid at GE Capital. See Note 23 for further information.
| | | | | | | | |
| December 31, 2020 | December 31, 2019 |
| GECAS | $ | 35,863 | | $ | 37,979 | |
| EFS | 2,385 | | 1,823 | |
| WCS(a) | 5,884 | | 9,014 | |
| Insurance | 50,824 | | 46,266 | |
| Other continuing operations(a)(b) | 18,569 | | 22,463 | |
| Total segment assets | $ | 113,526 | | $ | 117,546 | |
| | | | | | | | |
GE Capital debt to equity ratio | 3.4:1 | 3.9:1 |
(a) In the first quarter of 2020, the remaining Industrial Finance assets of $268 million were transferred to Other continuing operations.
(b) Included cash, cash equivalents and restricted cash of $13,245 million as of December 31, 2020 and $17,618 million as of December 31, 2019.
| | | | | | | | | | | |
| 2020 | 2019 | 2018 |
| GECAS | $ | 3,947 | | $ | 4,895 | | $ | 4,944 | |
| EFS | 74 | | 145 | | 144 | |
| WCS | 334 | | 829 | | 1,451 | |
| Insurance | 2,946 | | 2,904 | | 2,941 | |
| Other continuing operations | (55) | | (31) | | 71 | |
| Total segment revenues(a) | $ | 7,245 | | $ | 8,741 | | $ | 9,551 | |
| | | |
| GECAS | $ | (786) | | $ | 1,029 | | $ | 1,225 | |
| EFS | 52 | | 121 | | 85 | |
| WCS | 66 | | 234 | | 305 | |
| Insurance | 189 | | (611) | | (157) | |
| Other continuing operations(b) | (1,232) | | (1,303) | | (1,947) | |
| Total segment profit (loss) | $ | (1,710) | | $ | (530) | | $ | (489) | |
(a) Capital segment revenues represent 9% of total segment revenues for the year ended December 31, 2020.
(b) Other continuing operations primarily comprised excess interest costs from debt previously allocated to assets that have been sold as part of the GE Capital Exit Plan, preferred stock dividend costs and interest costs not allocated to GE Capital businesses, which are driven by GE Capital’s interest allocation process. Interest costs are allocated to GE Capital businesses based on the tenor of their assets using the market rate at the time of origination, which differs from the asset profile when the debt was originated. As a result, actual interest expense is higher than interest expense allocated to the remaining GE Capital businesses. All preferred stock dividend costs have become a GE Industrial obligation in January 2021. See Note 16 for further information. In addition, we anticipate unallocated interest costs to gradually decline as debt matures and/or is refinanced.
For the year ended December 31, 2020, segment revenues decreased $1.5 billion (17%) and segment losses were up $1.2 billion.
Capital revenues decreased $1.5 billion (17%), as a result of volume declines and lower gains. These volume declines were primarily at GECAS related to lower interest income attributable to the sale of PK AirFinance and lower rental revenue on our aircraft leasing portfolio, and at WCS related to lower purchases of GE Industrial customer receivables and the run-off of the GE Capital supply chain finance program (See GE Industrial Working Capital Transactions for further information). Capital losses increased $1.2 billion, primarily due to an impairment of goodwill of $0.8 billion (pre-tax), volume declines, higher mark-to-market effects and other impairments, including $0.5 billion (pre-tax) on the GECAS fixed-wing aircraft portfolio as a result of COVID-19 and related market impacts, lower gains, debt tender costs, the SEC settlement charge and the nonrecurrence of a 2019 tax reform enactment adjustment. These increased losses were partially offset by the nonrecurrence of a $1.0 billion pre-tax charge identified through the completion of our 2019 annual insurance premium deficiency review, higher tax benefits including the tax benefit related to the BioPharma sale and lower excess interest cost. Gains were $0.4 billion and $0.7 billion in 2020 and 2019, respectively, which primarily related to sales of certain GECAS aircraft and engines resulting in gains of $0.2 billion and $0.4 billion in 2020 and 2019, respectively, and the sale of equity method investments resulting in gains of $0.1 billion and $0.2 billion in 2020 and 2019, respectively, at EFS.
CORPORATE ITEMS AND ELIMINATIONS. Corporate Items and Eliminations is a caption used in the Segment Operations – Summary of Reportable Segments table to reconcile the aggregated results of our segments to the consolidated results of the Company. The Corporate Items and Eliminations amounts related to revenues and earnings include the results of disposed businesses, certain amounts not included in industrial operating segment results because they are excluded from measurement of their operating performance for internal and external purposes and the elimination of intersegment activities. In addition, the Corporate Items and Eliminations amounts related to earnings include certain costs of our principal retirement plans, significant, higher-cost restructuring programs, separation costs, and other costs reported in Corporate.
Corporate items and eliminations includes the results of our Lighting segment, through its disposition in the second quarter of 2020, and GE Digital business, for all periods presented.
| | | | | | | | | | | |
| 2020 | 2019 | 2018 |
| Revenues | | | |
| Corporate revenues | $ | 1,313 | | $ | 1,791 | | $ | 2,783 | |
| Eliminations and other | (2,245) | | (2,096) | | (2,110) | |
| Total Corporate Items and Eliminations | $ | (932) | | $ | (305) | | $ | 673 | |
| | | |
| Operating profit (cost) | | | |
| Gains (losses) on disposals and held for sale businesses | $ | 12,472 | | $ | 4 | | $ | 1,370 | |
| Restructuring and other charges | (680) | | (886) | | (2,056) | |
| Steam asset impairments(a) (Notes 7 and 8) | (363) | | — | | — | |
| SEC settlement charge(b) | (100) | | — | | — | |
| Unrealized gains (losses) | (1,911) | | 793 | | — | |
| Goodwill impairments(c) (Note 8) | (728) | | (1,486) | | (22,136) | |
| Adjusted total corporate operating costs (Non-GAAP) | (1,328) | | (1,736) | | (1,514) | |
| Total Corporate Items and Eliminations (GAAP) | $ | 7,362 | | $ | (3,311) | | $ | (24,337) | |
| Less: gains (losses), impairments and restructuring & other | 8,689 | | (1,575) | | (22,822) | |
| Adjusted total corporate operating costs (Non-GAAP) | $ | (1,328) | | $ | (1,736) | | $ | (1,514) | |
| | | | | | | | | | | |
| | | |
| | | |
| | | |
| | | |
| Functions & operations | $ | (1,028) | | $ | (1,295) | | $ | (1,622) | |
| Environmental, health & safety (EHS) and other items | (104) | | (258) | | 169 | |
| Eliminations | (195) | | (184) | | (61) | |
| Adjusted total corporate operating costs (Non-GAAP) | $ | (1,328) | | $ | (1,736) | | $ | (1,514) | |
(a) Included non-cash pre-tax impairment charges of $429 million, net of $65 million attributable to noncontrolling interests for the Steam business within our Power segment in 2020.
(b) GE reached a settlement with the SEC and paid a civil penalty of $200 million in December 2020,majority of which $100 million was recordedwill be part of GE Vernova, and paid at Corporate and $100 million was recorded and paid at GE Capital.
(c) Included non-cash pre-tax impairment charge of $877 million, net of $149 million attributable to noncontrolling interestsour remaining financial services business, including our run-off Insurance operations (see Note 12 for the Additive reporting unit within our Aviation segment in 2020.further information).
| | | | | | | | | | | | | | |
| | | |
| REVENUES AND OPERATING PROFIT (COST) | | | | 2023 | 2022 | 2021 |
| GE Digital revenues | | | | $ | 958 | | $ | 882 | | $ | 945 | |
| Insurance revenues (Note 12) | | | | 3,389 | | 2,957 | | 3,101 | |
| Eliminations and other | | | | (944) | | (1,028) | | (1,487) | |
| Total Corporate revenues | | | | $ | 3,403 | | $ | 2,812 | | $ | 2,559 | |
| | | | | | |
| Gains (losses) on retained and sold ownership interests (Note 19) | | | | $ | 5,778 | | $ | 47 | | $ | 1,649 | |
| Gains (losses) on other equity securities | | | | (5) | | 29 | | 272 | |
| Gains (losses) on purchases and sales of business interests | | | | (9) | | 45 | | (56) | |
| Restructuring and other charges (Note 20) | | | | (679) | | (806) | | (380) | |
| Separation costs (Note 20) | | | | (978) | | (715) | | — | |
| Steam asset sale impairment (Notes 6 and 7) | | | | — | | (824) | | — | |
| Russia and Ukraine charges | | | | (190) | | (263) | | — | |
| | | | | | |
| Insurance profit (loss) (Note 12) | | | | 332 | | 205 | | 798 | |
| Adjusted total Corporate operating costs (Non-GAAP) | | | | (464) | | (593) | | (1,124) | |
| Total Corporate operating profit (cost) (GAAP) | | | | $ | 3,785 | | $ | (2,875) | | $ | 1,158 | |
| Less: gains (losses), impairments, Insurance, and restructuring & other | | | | 4,249 | | (2,283) | | 2,282 | |
| Adjusted total Corporate operating costs (Non-GAAP) | | | | $ | (464) | | $ | (593) | | $ | (1,124) | |
| | | | | | |
| Functions & operations | | | | $ | (503) | | $ | (539) | | $ | (802) | |
| Environmental, health and safety (EHS) and other items | | | | (28) | | (94) | | (302) | |
| Eliminations | | | | 67 | | 41 | | (20) | |
| Adjusted total Corporate operating costs (Non-GAAP) | | | | $ | (464) | | $ | (593) | | $ | (1,124) | |
Adjusted total corporate operating costs* excludes gains (losses) on disposalspurchases and held for sale businesses,sales of business interests, significant,higher-cost restructuring programs, unrealizedseparation costs, gains (losses) on equity securities, impairments, Russia and goodwill impairments.Ukraine charges and our run-off Insurance operations profit. We believe that adjusting corporate costs to exclude the effects of items that are not closely associated with ongoing corporate operations provides management and investors with a meaningful measure that increases the period-to-period comparability of our ongoing corporate costs.
For the year ended December 31, 20202023, , revenues decreasedincreased by $0.6 billion primarily as a result of a $0.5 billion decrease in revenues due to the sale ofhigher revenue in our Currentrun-off Insurance operations, higher revenue in our Digital business and Lighting businesses in April 2019 and June 2020, respectively, and $0.1lower intersegment eliminations. Corporate operating profit increased by $6.7 billion due to $5.7 billion of higher inter-segment eliminations. Corporate costs decreased by $10.7 billion due to $12.5 billion of higher net gains on retained and sold ownership interests, primarily driven by $12.4 billion of gains from the sale of our BioPharma business in 2020. Corporate costs also decreased by $0.8 billion due to $1.5 billion of goodwill impairment charges related to our Renewable Energy segment in 2019 as compared to $0.7 billion of net goodwill impairment charges related to our Aviation segment in 2020. In addition, Corporate costs decreased by $0.2 billion due to lower restructuringAerCap and other charges in 2020, primarily at Corporate and Power,GE HealthCare investments, partially offset by higher restructuring at Aviation. These decreases were partially offset by $2.7 billionthe nonrecurrence of higher net unrealized losses, primarily related to a $1.8 billion mark-to-market lossprior year gains on our Baker Hughes shares and a $0.1 billion impairment on our Ventures portfolio in 2020,investment. Corporate operating profit also increased as compared tothe result of the nonrecurrence of a $0.8 billion mark-to-market gain on our Baker Hughes shares in 2019. Corporate recognized $0.4 billion of non-cash impairment chargescharge related to property, plant and equipment and intangible assets atas a result of the reclassification of a portion of our Steam Power business withinto held for sale in the first quarter of 2022 (see Notes 6 and 7). Corporate operating profit also increased due to $0.1 billion of lower charges from contracts and recoverability of assets in connection with the conflict between Russia and Ukraine and resulting sanctions, primarily related to our Aerospace and Power segment in 2020.businesses. In addition, Corporate costsoperating profit increased byas the result of $0.1 billion due to the settlement of the SEC investigationlower restructuring and other charges and $0.1 billion of higher operating profit in 2020.our run-off Insurance operations. These increases were partially offset by $0.3 billion of higher separation costs.
Adjusted total corporate operating costs* decreased by $0.4$0.1 billion in 2020 primarily as the result of $0.3 billion of cost reductions withindriven by favorability from higher bank interest, improved performance in our Digital business and functionsEFS, and $0.2 billion of lower costs primarily associated with existing EHS matters. Overall, eliminations were relatively flat due to higher intercompany elimination activity from project financing investments associated with wind energy projectsa reduction in our Renewable Energy segment and higher GE industrial inter-segment eliminations,core functional costs. These decreases were partially offset by lower spare engine sales from our Aviation segment to our GECAS business.higher EHS costs.
*Non-GAAP Financial Measure
GE 20202023 FORM 10-K20 13
OTHER CONSOLIDATED INFORMATION
COSTSRESTRUCTURING AND GAINS NOT INCLUDED IN SEGMENT RESULTS. SEPARATION COSTS.As discussed in the Segment Operations section, certain amounts are not included in industrial segment results because they Significant, higher-cost restructuring programs are excluded from measurement of theirsegment operating performance for internal and external purposes; those excluded amounts are reported in Restructuring and other charges for Corporate. In addition, we incur costs associated with separation activities, which are also excluded from measurement of segment operating performance for internal and external purposes. These amounts relate primarily to significant, higher-costSee Note 20 for further information on restructuring programs, goodwill impairment charges and gains/(losses) on acquisition and disposition activities.separation costs. | | | | | | | | | | | | | | | | | | | | | | | | | | | | | | | | | | | |
| Costs | | Gains (Losses) |
| 2020 | | 2019 | | 2018 | | 2020 | | 2019 | | 2018 |
| Power | $ | 583 | | | $ | 307 | | | $ | 20,178 | | | $ | 49 | | | $ | (2) | | | $ | 988 | |
| Renewable Energy | 13 | | | 1,537 | | | 3,114 | | | — | | | — | | | — | |
| Aviation | 1,099 | | | — | | | 7 | | | 14 | | | — | | | (116) | |
| Healthcare | 3 | | | 43 | | | 58 | | | 12,364 | | | (1) | | | 785 | |
| Total industrial segments | $ | 1,698 | | | $ | 1,888 | | | $ | 23,357 | | | $ | 12,427 | | | $ | (4) | | | $ | 1,657 | |
| Corporate Items and Eliminations | 173 | | | 486 | | | 857 | | | (1,866) | | | 801 | | | (288) | |
| Total GE Industrial | $ | 1,871 | | | $ | 2,374 | | | $ | 24,214 | | | $ | 10,561 | | | $ | 797 | | | $ | 1,370 | |
INTEREST AND OTHER CONSOLIDATED INFORMATION
RESTRUCTURING.FINANCIAL CHARGES Restructuring actions are essential to our cost improvement efforts for both existing operations and those acquired. Restructuring and other charges relate primarily to workforce reductions, facility exit costs associated with the consolidation of sales, service and manufacturing facilities, the integration of acquisitions, and certain other asset write-downs such as those associated with product line exits. We also recognize an obligation for severance benefits that vest or accumulate with service. We continue to closely monitor the economic environment and expect to undertake further restructuring actions to more closely align our cost structure with earnings goals. This table is inclusive of all restructuring charges in our segments.
| | | | | | | | | | | |
| 2020 | 2019 | 2018 |
| Workforce reductions | $ | 856 | | $ | 823 | | $ | 989 | |
| Plant closures & associated costs and other asset write-downs | 332 | | 349 | | 1,449 | |
| Acquisition/disposition net charges | 66 | | 180 | | 612 | |
| Other | — | | (9) | | — | |
| Total restructuring and other charges | $ | 1,254 | | $ | 1,343 | | $ | 3,050 | |
| | | | | | | | | | | |
| | | |
| | | |
| Cost of product/services | $ | 570 | | $ | 386 | | $ | 1,092 | |
| Selling, general and administrative expenses | 697 | | 993 | | 1,838 | |
| Other income | (13) | | (36) | | $ | 120 | |
| Total restructuring and other charges | $ | 1,254 | | $ | 1,343 | | $ | 3,050 | |
| | | | | | | | | | | |
| 2020 | 2019 | 2018 |
| Power | $ | 236 | | $ | 402 | | $ | 1,301 | |
| Renewable Energy | 213 | | 176 | | 301 | |
| Aviation | 397 | | 8 | | 18 | |
| Healthcare | 137 | | 201 | | 222 | |
| Corporate | 245 | | 529 | | 1,110 | |
| GE Industrial restructuring and other charges | $ | 1,229 | | $ | 1,315 | | $ | 2,952 | |
| Capital | 25 | | 28 | | 98 | |
| Total restructuring and other charges by business | $ | 1,254 | | $ | 1,343 | | $ | 3,050 | |
| Restructuring and other charges cash expenditures | $ | 1,175 | | $ | 1,209 | | $ | 1,480 | |
Liabilities associated with restructuring activities were approximately $1.3$1.1 billion, $1.7$1.5 billion and $2.6$1.8 billion including actuarial determined post-employment severance benefits of $0.7 billion, $1.0 billion, and $1.6 billion as offor the years ended December 31, 2020, 2019,2023, 2022 and 2018,2021, respectively.
| | | | | | | | | | | |
| INTEREST AND OTHER FINANCIAL CHARGES | 2020 | 2019 | 2018 |
| GE Industrial | $ | 1,333 | | $ | 2,115 | | $ | 2,415 | |
| GE Capital | 2,186 | | 2,532 | | 2,982 | |
| | | |
The decrease was primarily due to lower average borrowings balances, partially offset by a lower allocation of interest expense to discontinued operations. Inclusive of interest expense in GE Industrialdiscontinued operations, total interest and other financial charges were $1.1 billion, $1.7 billion and $2.5 billion for the yearyears ended December 31, 2020 was driven primarily by lower interest on borrowings due to repayments of intercompany loans from GE Capital2023, 2022 and lower losses related to the completion of tender offers to purchase GE Industrial senior notes (including fees and other costs associated with the tenders), and lower expenses on sales of GE Industrial current receivables mainly driven by lower sales of receivables and lower benchmark interest rates.2021, respectively. The primary components of GE Industrial interest and other financial charges are interest on short- and long-term borrowings and financing costs on sales of receivables. Total GE Industrial interest and other financial charges of $0.9 billion and $1.3 billionborrowings.
DEBT EXTINGUISHMENT COSTS were recorded at Corporate andzero, $0.5 billion and $0.8$6.5 billion were recorded by GE Industrial segments for the years ended December 31, 20202023, 2022 and 2019, respectively.
The decrease in GE Capital interest and other financial charges for the year ended December 31, 20202021, respectively. No debt tender was primarily due to lower average borrowings balances due to maturities and a decrease in average interest rates due to changes in market rates, partially offset by higher net interest on assumed debt resulting from a decrease in intercompany loans to GE Industrial which bear the right of offset (see the Borrowings section of Capital Resources and Liquidity for an explanation of assumed debt and right-of-offset loans), and the $0.2 billion loss resulting from the completion of tender offers to purchase GE Capital senior notes (including fees and other costs associated with the tenders). GE Capital average borrowings were $55.8 billion, $61.8 billion and $78.7 billion in 2020, 2019 and 2018, respectively. The GE Capital average composite effective interest rate (including interest allocated to discontinued operations) was 4.0%, 4.2% and 3.9% in 2020, 2019 and 2018, respectively.executed during 2023.
POSTRETIREMENT BENEFIT PLANS. Refer to Note 13 for information about our pension and retiree benefit plans.
INCOME TAXES | | CONSOLIDATED | 2020 | 2019 | 2018 |
| INCOME TAXES | | INCOME TAXES | 2023 | 2022 | 2021 |
| Effective tax rate (ETR) | Effective tax rate (ETR) | (9.1) | % | 63.2 | % | (0.4) | % | Effective tax rate (ETR) | 11.4 | % | 0.4 | % | 13.3 | % |
| Provision (benefit) for income taxes | Provision (benefit) for income taxes | $ | (474) | | $ | 726 | | $ | 93 | |
| Cash income taxes paid(a) | Cash income taxes paid(a) | 1,291 | | 2,228 | | 1,868 | |
(a) Included taxes paid related to discontinued operations.
For the year ended December 31, 20202023,the consolidated income tax benefitrate was $0.5 billion.11.4% compared to 0.4% for the year ended December 31, 2022. The change in tax fromrate for 2023 reflects a tax provision in 2019 toon pre-tax income while the tax rate for 2022 reflects a tax benefit on a pre-tax loss.
The provision (benefit) for 2020income taxes was $1.2 billion and an insignificant benefit for the years ended December 31, 2023 and 2022, respectively. The increase in tax was primarily due to the decreasetax effect of the increase in pre-tax income ($1.1 billion) excluding the gain from the sale ofgains and losses on our BioPharma businessretained and non-deductible goodwill impairment chargessold ownership interests and a decrease in valuation allowancesfavorable audit resolutions ($0.1 billion). There was an insignificant tax on non-U.S. deferredthe net gains in GE HealthCare, AerCap and Baker Hughes equity in both periods because of tax-free disposition of GE HealthCare shares and because of available capital losses.
For the year ended December 31, 2023, the adjusted income tax assets partially offset byrate* was 24.5% compared to 25.4% for the year ended December 31, 2022. The adjusted provision (benefit) for income taxes* was $1.1 billion in 2023 and $0.4 billion in 2022. The increase in tax was primarily due to the tax effect of the increase in tax expense associated with the disposition of the BioPharma business in 2020 compared to the amount recognized on preparatory steps for the planned disposition in 2019adjusted earnings before taxes* and a decrease in favorable audit resolutions.
The rate of tax on non-U.S. operations is increased because we have losses in foreign jurisdictions where it is not likely that such losses can be utilized and therefore no tax benefit fromis provided for those losses. Non-U.S. losses also limit our ability to claim U.S. foreign tax credits on certain operations, further increasing the completionrate of tax on non-U.S. operations. In addition, as part of the Internal Revenue Service (IRS) audits.Tax Cuts and Jobs Act of 2017 (U.S. tax reform), the U.S. enacted a minimum tax on foreign earnings (global intangible low taxed income). We have tangible assets outside the U.S. and pay significant foreign taxes which substantially reduce the U.S. liability on these earnings. Overall, these factors increase the rate of tax on our non-U.S. operations.
Absent additional taxes enacted as partthe effect of U.S. tax reform and non-U.S. losses without a tax benefit our consolidatedand additional U.S. tax on global income, non-U.S. operations generally produce a tax provision is generally reduced because of the benefits of lower-taxed global operationsbenefit as certain non-U.S. income is subject to local country tax rates that are below the U.S. statutory tax rate.
The rate of tax on our profitable non-U.S. earnings is below the U.S. statutory tax rate because we have significant business operations subject to tax in countries where the tax on that income is lower than the U.S. statutory rate and because GE funds certain non-U.S. operations through foreign companies that are subject to low foreign taxes. Most of these earnings have been reinvested in active non-U.S. business operations and as of December 31, 2020, we have not decided to repatriate these earnings to the U.S.operations. Given U.S. tax reform, substantially all of our net prior unrepatriated earnings were subject to U.S. tax and accordingly we generally expect to have the ability to repatriate available non-U.S. cash without additional U.S. federal tax cost and any foreign withholding taxes on a repatriation to the U.S. would potentially be partially offset by a U.S. foreign tax credit. We reassess reinvestment of earnings on an ongoing basis. In 2023 and 2022, in connection with the execution of the Company’s plans to prepare for the spin-offs of GE Vernova and GE HealthCare, we incurred an insignificant amount and $0.1 billion of tax, respectively, due to repatriation of previously reinvested earnings.
A substantial portion of the benefit for lower-taxed non-U.S. earnings related to business operations subject to tax in countries where the tax on that income is lower than the U.S. statutory rate is derived from our GECAS aircraft leasing operations located in Ireland where the earnings are taxed at 12.5%, our Power operations located in Switzerland where the earnings are taxed at between 9% and 18.6% and our AviationAerospace operations located in Singapore where the earnings are primarily taxed at a rate of 8%8.5% and 8.0% in prior periods and our Power operations located in Switzerland where the earnings are taxed at a rate between 16.3% and 18.6%.
The rate of tax on non-U.S. operations is increased, however, because we also incur losses in foreign jurisdictions where it is not likely that the losses can be utilized and no tax benefit is provided for those losses and valuation allowances against loss carryforwards are provided when it is no longer likely that the losses can be utilized. In addition, as part of U.S. tax reform, the U.S. has enacted a tax on “base eroding” payments from the U.S. We are continuing to undertake restructuring actions to mitigate the impact from this provision. The U.S. has also enacted a minimum tax on foreign earnings (global intangible low tax income). Because we have tangible assets outside the U.S. and pay significant foreign taxes, we generally do not expect a significant increase in tax liability from this new U.S. minimum tax. Overall, these newly enacted provisions increase the rate of tax on our non-U.S. operations.
| | | | | | | | | | | |
| BENEFIT/(EXPENSE) FROM GLOBAL OPERATIONS | 2020 | 2019 | 2018 |
| Benefit/(expense) of foreign tax rate difference on non-U.S. earnings | $ | 90 | | $ | 27 | | $ | (292) | |
| Benefit of audit resolutions | 129 | | 86 | | 225 | |
| BioPharma disposition and preparatory restructuring | 1,447 | | (633) | | — | |
| Other | (186) | | (526) | | (973) | |
| Total benefit/(expense) | $ | 1,480 | | $ | (1,046) | | $ | (1,040) | |
The amounts reported above exclude the impact of U.S. tax reform which is reported as a separate line in the reconciliation of the U.S. federal statutory income tax rate to the actual tax rate in Note 15.
*Non-GAAP Financial Measure
GE 20202023 FORM 10-K22 14
| | | | | | | | | | | |
| (BENEFIT)/EXPENSE FROM GLOBAL OPERATIONS | 2023 | 2022 | 2021 |
| Foreign tax rate difference on non-U.S. earnings | $ | (127) | | $ | (95) | | $ | 130 | |
| Audit resolutions | (29) | | (26) | | (83) | |
| Non-U.S. losses without tax benefit and other | 618 | | 421 | | 107 | |
| Total (benefit)/expense | $ | 462 | | $ | 300 | | $ | 154 | |
For the year ended December 31, 20202023,, the change from anincrease in expense from global operations in 2019 to a benefit from global operations in 2020 reflects the lower rate of tax on the disposition of the BioPharma business in 2020 compared to an amount of tax recognized2022 reflects higher U.S. taxes on preparatory steps for the planned dispositionglobal activities slightly offset by higher income in 2019 and a decrease in valuation allowances on non-U.S. deferred tax assets.lower taxed jurisdictions.
A more detailed analysis of differences between the U.S. federal statutory rate and the consolidated effective rate, as well as other information about our income tax provisions, is provided in the Critical Accounting Estimates section and Note 15. The nature of business activities and associated income taxes differ for GE Industrial and for GE Capital; therefore, a separate analysis of each is presented in the paragraphs that follow.
| | | | | | | | | | | |
| GE INDUSTRIAL EFFECTIVE TAX RATE | 2020 | 2019 | 2018 |
| GE Industrial ETR | 5.3 | % | 72.7 | % | (2.3) | % |
| GE Industrial provision for income taxes | $ | 388 | | $ | 1,309 | | $ | 467 | |
For the year ended December 31, 2020, the GE Industrial provision for income taxes decreased primarily due to the decrease in pre-tax income excluding the gain from the sale of our BioPharma business and non-deductible goodwill impairment charges and a decrease in valuation allowances on non-U.S. deferred tax assets partially offset by the increase in tax expense associated with the disposition of the BioPharma business in 2020 compared to the amount recognized on preparatory steps for the planned disposition in 2019 and a decrease in benefit from the completion of the IRS audits.
| | | | | | | | | | | |
| GE CAPITAL EFFECTIVE TAX RATE | 2020 | 2019 | 2018 |
| GE Capital ETR | 41.1 | % | 89.3 | % | 99.7 | % |
| GE Capital provision (benefit) for income taxes | $ | (862) | | $ | (582) | | $ | (374) | |
For the year ended December 31, 2020, the GE Capital tax benefit increased primarily due to the decrease in pre-tax income excluding non-deductible goodwill impairment charges and due to larger benefits on global operations including a tax benefit associated with the disposition of the BioPharma business in 2020.
RESEARCH AND DEVELOPMENT. We conduct research and development (R&D) activities to continually enhance our existing products and services, develop new products and services to meet our customers’ changing needs and requirements, and address new market opportunities. In addition to funding R&D internally, we also receive funding externally from our customers and partners, which contributes to the overall R&D for the company.
| | GE funded | Customer and Partner funded(b) | Total R&D |
| 2020 | 2019 | 2018 | 2020 | 2019 | 2018 | 2020 | 2019 | 2018 |
| GE funded | | | GE funded | Customer and Partner funded(b) | Total R&D |
| 2023 | | | 2023 | 2022 | 2021 | 2023 | 2022 | 2021 | 2023 | 2022 | 2021 |
| Aerospace | |
| Renewable Energy | |
| Power | Power | $ | 317 | | $ | 314 | | $ | 409 | | $ | 13 | | $ | 13 | | $ | 5 | | $ | 330 | | $ | 327 | | $ | 414 | |
| Renewable Energy | 466 | | 522 | | 413 | | 19 | | 9 | | 11 | | 485 | | 531 | | 424 | |
| Aviation | 707 | | 906 | | 950 | | 1,090 | | 911 | | 564 | | 1,797 | | 1,817 | | 1,514 | |
| Healthcare | 845 | | 994 | | 968 | | 27 | | 25 | | 23 | | 872 | | 1,019 | | 991 | |
| Corporate(a) | Corporate(a) | 231 | | 382 | | 675 | | 106 | | 89 | | 48 | | 336 | | 471 | | 722 | |
| Total | Total | $ | 2,565 | | $ | 3,118 | | $ | 3,415 | | $ | 1,255 | | $ | 1,046 | | $ | 650 | | $ | 3,820 | | $ | 4,164 | | $ | 4,065 | |
(a) Includes Global Research Center and Digital business.
(b) Customer funded is principally U.S. Government funded in our AviationAerospace segment.
DISCONTINUED OPERATIONS.OPERATIONS Discontinued operations primarily include certain businesses incomprise our former GE Capital segment (ourHealthCare business, our mortgage portfolio in Poland (Bank BPH), our GE Capital Aviation Services (GECAS) business, and other trailing assets and liabilities associated with prior dispositions. Results of operations, financial position and cash flows for these businesses are reported as discontinued operations for all periods presented and the sale of our GE Capital businesses) and our Baker Hughes and Transportation segments.notes to the financial statements have been adjusted on a retrospective basis. See NotesNote 2 and 23 for further financial information regarding our businesses in discontinued operations.
The mortgage portfolio in Poland (Bank BPH) comprises floating-rate residential mortgages, 87% of which are indexed to or denominated in foreign currencies (primarily Swiss francs). At December 31, 2020, the total portfolio had a carrying value of $2.4 billion with a 1.61% 90-day delinquency rate and an average loan to value ratio of approximately 63.0%. The portfolio is recorded at the lower of cost or fair value, less cost to sell, and included a $0.3 billion impairment, which reflected market yields as well as estimates with respect to ongoing litigation in Poland related to foreign currency-denominated mortgages and other factors. See Note 23 for additional information about this litigation and the potential for further adverse developments to result in further losses related to these loans in future reporting periods.
CAPITAL RESOURCES AND LIQUIDITY
FINANCIAL POLICY. POLICY. We intend to maintain a disciplined financial policy including maintaining a high cash balance. We are targetingwith a sustainable investment-grade long-term credit rating inrating. In the Single-A range, achieving a GE Industrial net debt*-to-EBITDA ratiofourth quarter of less than 2.5x and a dividend in line with our peers over time, as well as maintaining a less than 4-to-1 debt-to-equity ratio for GE Capital. In addition to net debt*-to-EBITDA, we also evaluate other leverage measures, including gross debt-to-EBITDA, and we will ultimately size our deleveraging actions across a range of measures to ensure we are operating2021, the Company based on a strong balance sheet. We intendannounced plans to continue to decrease our GE Industrial leverage over time as we navigate this periodform three industry-leading, global, investment-grade companies, each of uncertainty, although we now expect to achieve our GE Industrial leverage target over time.which will determine their own financial policies, including capital allocation, dividend, mergers and acquisitions and share buyback decisions.
LIQUIDITY POLICY. We maintain a strong focus on liquidity and define our liquidity risk tolerance based on sources and uses to maintain a sufficient liquidity position to meet our business needs and financial obligations under both normal and stressed conditions. We intend to maintain a high level of cash and maximize flexibility as we navigate the current environment. At both GE Industrial and GE Capital, we manage our liquidity to provide access to sufficient funding to meet our business needs and financial obligations, as well as capital allocation and growth objectives, throughout business cycles.
GE Industrial has continued to enhance its cash management operations, targeting increased linear cash flow, lower factoring, and reducing restricted cash. As a result, we reduced our intra-quarter borrowings by $3.6 billion in 2020 and reduced our GE Industrial cash needs to below approximately $13 billion on a go-forward basis. However, we will continue holding elevated cash levels through this period of uncertainty.
At GE Capital, we continue to hold cash levels to cover at least 12 months of long-term debt maturities.
We believe that our consolidated liquidity and availability under our revolving credit facilities will be sufficient to meet our liquidity needs.
CONSOLIDATED LIQUIDITY. Following is a summaryOur primary sources of liquidity consist of cash and cash equivalents, free cash flows* from our operating businesses, cash generated from asset sales and dispositions, and short-term borrowing facilities, including revolving credit facilities. Cash generation can be subject to variability based on many factors, including seasonality, receipt of down payments on large equipment orders, timing of billings on long-term contracts, timing of Aerospace-related customer allowances, market conditions and our ability to execute dispositions. Total cash, cash equivalents and restricted cash was $17.0 billion at December 31, 2020.2023, of which $2.8 billion was held in the U.S. and $14.2 billion was held outside the U.S.
| | | | | | | | | | | | | | |
| December 31, 2020 | | | December 31, 2020 |
| GE Industrial | $ | 23,209 | | | U.S. | $ | 18,934 | |
| GE Capital | 13,421 | | | Non-U.S. | 17,696 | |
| Consolidated | $ | 36,630 | | | Consolidated | $ | 36,630 | |
Cash held in non-U.S. entities has generally been reinvested in active foreign business operations; however, substantially all of our unrepatriated earnings were subject to U.S. federal tax and, if there is a change in reinvestment, we would expect to be able to repatriate available cash (excluding amounts held in countries with currency controls) without additional federal tax cost. Any foreign withholding tax on a repatriation to the U.S. would potentiallymay be at least partially offset by a U.S. foreign tax credit. With regards to the separation of GE HealthCare in January 2023 and the planned separation of GE Aerospace and GE Vernova into independent companies, the planning for and execution of the separations has impacted and is expected to continue to impact indefinite reinvestment. The impact of such changes will be recorded when there is a specific change in ability and intent to reinvest earnings.
GE INDUSTRIAL LIQUIDITY. GE Industrial's primary sources of liquidity consist of cash and cash equivalents, free cash flows from our operating businesses, monetization of receivables, and short-term borrowing facilities, including revolving credit facilities. Cash, generation can be subject to variability based on many factors, including seasonality, receipt of down payments on large equipment orders, timing of billings on long-term contracts, market conditions and our ability to execute dispositions. Additionally, as previously reported, we launched a program in the third quarter of 2020 to fully monetize our Baker Hughes position over approximately three years. Consistent with the program’s design, we received initial proceeds of approximately $0.4 billion in the fourth quarter of 2020 and $0.7 billion in January 2021. See Note 26 for further information.
GE Industrial cash, cash equivalents and restricted cash totaled $23.2 billion at December 31, 2020, including $2.22023 included $1.7 billion of cash held in countries with currency control restrictions (including a total of $0.1 billion in Russia and Ukraine) and $0.4 billion of restricted use cash. Cash held in countries with currency controls represents amounts held in countries that may restrict the transfer of funds to the U.S. or limit our ability to transfer funds to the U.S. without incurring substantial costs. Restricted use cash represents amounts that are not available to fund operations, and primarily comprised funds restricted in connection with certain ongoing litigation matters.
In the fourth quarter of 2020, GE Industrial took actions to continue to solidify its financial position through a $2.5 billion pre-funding to the GE Pension Plan as well as the repayment of $1.5 billion of intercompany loans to GE Capital. Based on our current assumptions, we do not anticipate further contributions to the GE Pension Plan through 2023.
As previously communicated, GE Industrial provided a capital contribution to GE Capital in the fourth quarter of 2020 of $2.0 billion, in line with the first quarter 2020 insurance statutory funding. In 2021, GE Industrial expects to provide an additional contribution to GE Capital in line with the existing insurance statutory funding requirement of approximately $2.0 billion. Further 2021 capital contributions will depend on GE Capital’s performance, including GECAS operations and the Insurance statutory asset adequacy testing results, in light of the uncertain environment. Going forward, we anticipate GE Capital’s liquidity and capital needs will be met through a combination of GE Capital liquidity, GE Capital asset sales, GE Capital future earnings and capital contributions Excluded from GE Industrial.
GE CAPITAL LIQUIDITY. GE Capital’s primary sources of liquidity consist of cash and cash equivalents, cash generated from asset sales and cash flows from our businesses, as well as GE Industrial repayments of intercompany loans and capital contributions from GE Industrial. We expect to maintain a sufficient liquidity position to fund our insurance obligations and debt maturities. See the Segment Operations - Capital section for further information regarding allocation of GE Capital interest expense to the GE Capital businesses.
*Non-GAAP Financial Measure
GE Capital cash, cash equivalents and restricted cash totaled $13.4 billion at December 31, 2020, excluding $0.5was $0.8 billion of cash in insurance entities,our run-off Insurance operations, which was classified as All other assets onin the GE Capital Statement of Financial Position.
*Non-GAAP Financial Measure
In 2023, we received proceeds of $6.6 billion and completed monetization of our AerCap shares. During the first quarter of 2023, we received proceeds of $0.2 billion and completed monetization of our Baker Hughes position. As part of the spin-off of GE HealthCare completed in the first quarter of 2023, we retained an approximately 19.9% stake of GE HealthCare common stock. During the second quarter of 2023, we received total proceeds of $2.2 billion from the disposition of 28.8 million shares of GE HealthCare. We intend to exit our remaining stake in GE HealthCare over time, in an orderly manner. See Note 10Notes 3 and 19 for further information about classification of cash in insurance entities.information.
GE CapitalFollowing approval of a statutory permitted accounting practice in 2018 by our primary insurance regulator, the Kansas Insurance Department (KID), we provided a total of $13.2 billion of capital contributions to itsour insurance subsidiaries, of $2.0 billion, $1.9 billion and $3.5including $1.8 billion in the
first quartersquarter of 2020, 2019 and 2018, respectively, and expects2023. We expect to provide furtherthe final capital contributionscontribution of approximately $7 billion through 2024, including approximately $2.0up to $1.8 billion in the first quarter of 2021,2024, pending completion of our December 31, 20202023 statutory reporting process, which includes asset adequacy testing. These contributions are subjectprocess. See Note 12 for further information.
On March 6, 2022, the Board of Directors authorized the repurchase of up to ongoing monitoring by KID, and the total amount to be contributed could increase or decrease, or the timing could be accelerated, based upon the results$3 billion of reserve adequacy testing or a decision by KID to modify the schedule of contributions set forth in January 2018. We will continue to monitor the interest rate environment, including the impact of reinvestment rates and our investment portfolio performance, and other factors in determining the related effect oncommon stock. In connection with this authorization, we repurchased 10.6 million shares for $1.1 billion during 2023. Additionally, during 2023, we redeemed our expected future capital contributions. See the Critical Accounting Estimates section for discussion of the sensitivity of interest rate changes to our insurance liabilities. GE is required to maintain specified capital levels at these insurance subsidiaries under capital maintenance agreements. Going forward, we anticipate funding any capital needs for insurance through a combinationoutstanding shares of GE Capital liquidity, GE Capital asset sales, GE Capital future earnings and capital contributions from GE Industrial.preferred stock for $5.8 billion.
BORROWINGS. Consolidated total borrowings were $75.1$21.0 billion and $90.9$24.1 billion at December 31, 20202023 and December 31, 2019,2022, respectively, a decrease of $15.8 billion ($16.3 billion excluding intercompany eliminations). See the following table for a summary of GE Industrial and GE Capital borrowings.
| | | | | | | | | | | | | | | | | | | | |
| GE Industrial | December 31, 2020 | December 31, 2019 | | GE Capital | December 31, 2020 | December 31, 2019 |
| Commercial paper | $ | — | | $ | 3,008 | | | Senior and subordinated notes | $ | 30,987 | | $ | 36,501 | |
| GE Industrial senior notes | 18,994 | | 15,488 | | | Senior and subordinated notes assumed by
GE Industrial | 22,390 | | 31,368 | |
Intercompany loans from
GE Capital | 3,177 | | 12,226 | | | Intercompany loans to
GE Industrial | (3,177) | | (12,226) | |
| Other GE Industrial borrowings | 1,352 | | 2,195 | | | Other GE Capital borrowings | 1,944 | | 3,358 | |
| Total GE Industrial | | | | Total GE Capital | | |
| adjusted borrowings(a) | $ | 23,523 | | $ | 32,917 | | | adjusted borrowings(a)(b) | $ | 52,144 | | $ | 59,001 | |
(a) Consolidated total borrowings of $75,067 million and $90,882 million at December 31, 2020 and December 31, 2019, respectively, are net of intercompany eliminations of $600 million and $1,036 million, respectively, of other GE Industrial borrowings from GE Capital, primarily related to timing of cash settlements associated with GE Industrial receivables monetization programs.
(b) Included $5,687 million and $4,234 million at December 31, 2020 and December 31, 2019, respectively, of fair value adjustments for debt in fair value hedge relationships. See Note 21 for further information.
$3.1 billion. The reduction in GE Industrial adjusted borrowings at December 31, 2020 compared to December 31, 2019, was driven primarily by $9.0$3.4 billion (including $1.5 billion in the fourth quarter of 2020) ofnet maturities and repayments of intercompany loans from GE Capital, debt repurchases of $4.2 billion, lower commercial paper of $3.0 billion, and net repayments and maturities of other debt of $1.1 billion, partially offset by issuances of new long-term debt of $7.5 billion and $0.6 billion related to changes in foreign exchange rates.
GE Industrial net debt* was $32.3 billion and $47.9 billion at December 31, 2020 and December 31, 2019, respectively. The reduction was driven primarily by $9.0 billion of repayments of intercompany loans from GE Capital, an increase in the net cash deduction of $4.2 billion due to a higher cash balance, the repurchase of $4.2 billion of debt, a reduction in after-tax pension and principal retiree benefit plan liabilities of $1.8 billion, a reduction in commercial paper of $3.0 billion, and net repayments and maturities of other debt of $1.1 billion, partially offset by new issuances of new long-term debt of $7.5 billion and $0.6 billion related to changes in foreign exchange rates.
The reduction in GE Capital adjusted borrowings at December 31, 2020 compared to December 31, 2019, was driven primarily by debt repurchases of $11.9 billion (including $2.2 billion in the fourth quarter of 2020), long-term debt maturities and other repayments of $10.7 billion (including $2.8 billion in the fourth quarter of 2020), and lower non-recourse borrowings of $0.8 billion, partially offset by GE Industrial repayments of intercompany loans of $9.0 billion (which has the effect of increasing GE Capital borrowings), issuances of new long-term debt of $6.0 billion, $1.4 billion of fair value adjustments for debt in fair value hedge relationships, and $0.5 billion related to changes in foreign exchange rates.
Liability Management Actions. In 2020, we took a series of actions to enhance and extend our liquidity at both GE Industrial and GE Capital, issuing a total of $13.5 billion of longer-dated debt and reducing near-term maturities by $10.5 billion in the second quarter, with the remaining $3 billion to be leverage neutral in GE Capital by the end of 2021. Following are details of these and other actions.debt.
In the second quarter of 2020, GE Industrial issued a total of $7.5 billion of senior notes, and used the proceeds to complete a tender offer to purchase $4.2 billion of GE senior notes, to reduce commercial paper and other debt by $1.8 billion, and to repay $1.5 billion of intercompany loans from GE Capital. The total of these transactions was leverage neutral for GE Industrial within the second quarter.
*Non-GAAP Financial Measure
In the second quarter of 2020, GE Capital issued a total of $6.0 billion of senior notes and used the proceeds to complete a tender offer to purchase a total of $9.8 billion of debt. In the fourth quarter of 2020, GE Capital completed a tender offer to purchase a total of $2.2 billion of debt with maturities from 2021 through 2023 using the $1.5 billion of proceeds from the GE Industrial repayment of intercompany loans as well as existing cash.
The following table provides a reconciliation of total short- and long-term borrowings as reported on the respective GE Industrial and GE Capital Statements of Financial Position to borrowings adjusted for assumed debt and intercompany loans:
| | | | | | | | | | | |
| December 31, 2020 | GE Industrial | GE Capital | Consolidated |
| Total short- and long-term borrowings | $ | 42,736 | | $ | 32,931 | | $ | 75,067 | |
| Debt assumed by GE Industrial from GE Capital | (22,390) | | 22,390 | | — | |
| Intercompany loans with right of offset | 3,177 | | (3,177) | | — | |
| Total intercompany payable (receivable) between GE Industrial and GE Capital | (19,213) | | 19,213 | | — | |
| Total borrowings adjusted for assumed debt and intercompany loans | $ | 23,523 | | $ | 52,144 | | $ | 75,067 | |
In 2015, senior unsecured notes and commercial paper were assumed by GE Industrial upon its merger with GE Capital. Under the conditions of the 2015 assumed debt agreement, GE Capital agreed to continue making required principal and interest payments on behalf of GE Industrial, resulting in the establishment of an intercompany receivable and payable between GE Industrial and GE Capital. In addition, GE Capital has periodically made intercompany loans to GE Industrial with maturity terms that mirror the assumed debt. As these loans qualify for right-of-offset presentation, they reduce the assumed debt intercompany receivable and payable between GE Industrial and GE Capital, as noted in the table above.
The remaining intercompany loans from GE Capital to GE Industrial bear the right of offset against amounts owed by GE Capital to GE Industrial under the assumed debt agreement and can be prepaid by GE Industrial at any time, in whole or in part, without premium or penalty. These loans are priced at market terms andWe have a collective weighted average interest rate of 3.7% and term of approximately 15.2 years at December 31, 2020.
GE Industrial has in place committed revolving credit lines. The following table providesfacilities totaling $13.5 billion at December 31, 2023, comprising a summary of committed and available credit lines.
| | | | | | | | |
| GE INDUSTRIAL COMMITTED AND AVAILABLE REVOLVING CREDIT FACILITIES | December 31, 2020 | December 31, 2019 |
| Unused back-up revolving syndicated credit facility | $ | 15,000 | | $ | 20,000 | |
| Unused revolving syndicated credit facility | — | | 14,772 | |
| Bilateral revolving credit facilities | 5,238 | | 7,225 | |
| Total committed revolving credit facilities | $ | 20,238 | | $ | 41,997 | |
| Less offset provisions | — | | 6,700 | |
| Total net available revolving credit facilities | $ | 20,238 | | $ | 35,297 | |
Under the terms of an agreement between GE Capital and GE Industrial, GE Capital has the right to compel GE Industrial to borrow under the $15.0$10.0 billion unused back-up revolving syndicated credit facility. Under this agreement, GE Industrial would transfer the proceeds to GE Capital as intercompany loans, which would be subject to the same termsfacility and conditions as those between GE Industrial and the lending banks. GE Capital has not exercised this right.
The following table provides a summarytotal of the activity in the primary external sources$3.5 billion of short-term borrowings for GE Industrial in the fourth quarters of 2020 and 2019. GE Industrial uses its bilateral revolving credit facilities from time to time to meet its short-term liquidity needs.
| | | | | | | | | | | | | | |
| |
| GE Industrial Commercial Paper | Bilateral Revolving Credit Facilities | Total |
| | | | |
| 2020 | Average borrowings during the fourth quarter | $ | — | | $ | 473 | | $ | 473 | |
| Maximum borrowings outstanding during the fourth quarter | — | | 1,150 | | 1,150 | |
| Ending balance at December 31 | — | | — | | — | |
| 2019 | Average borrowings during the fourth quarter | $ | 2,994 | | $ | 1,272 | | $ | 4,265 | |
| Maximum borrowings outstanding during the fourth quarter | 3,231 | | 1,500 | | 4,731 | |
| Ending balance at December 31 | 3,018 | | — | | 3,018 | |
In the third quarter of 2020, we reduced our ending commercial paper balance to zero. Total average and maximum borrowings in the table above are calculated based on the daily outstanding balance of the sum of commercial paper and revolving credit facilities.
CREDIT RATINGS AND CONDITIONS. We have relied, and may continue to rely, on the short- and long-term debt capital markets to fund, among other things, a significant portion of our operations. The cost and availability of debt financing is influenced by our credit ratings. Moody’s Investors Service (Moody’s), Standard and Poor’s Global Ratings (S&P), and Fitch Ratings (Fitch) currently issue separate ratings on GE Industrial and GE Capitalour short- and long-term debt. TheOur credit ratings of GE Industrial and GE Capital as of the date of this filing are set forth in the table below.following table.
| | | | | | | | | | | | | | |
| | Moody's | S&P | Fitch |
GE Industrial | Outlook | NegativeStable | NegativeStable | Stable |
| Short term | P-2 | A-2 | F3F2 |
| Long term | Baa1 | BBB+ | BBB |
| | | | |
GE Capital | Outlook | Negative | Negative | Stable |
| Short term | P-2 | A-2 | F3 |
| Long term | Baa1 | BBB+ | BBB |
We are disclosing our credit ratings and any current quarter updates to these ratings to enhance understanding of our sources of liquidity and the effects of our ratings on our costs of funds and access to liquidity. Our ratings may be subject to a revision or withdrawal at any time by the assigning rating organization, and each rating should be evaluated independently of any other rating. In connection with the planned spin-off of GE Vernova, rating agencies are reviewing ratings for both GE Vernova and GE Aerospace. For a description of some of the potential consequences of a reduction in our credit ratings, see the Financial Risks section of Risk Factors in this report.Factors.
Substantially all of the Company's debt agreements in place at December 31, 20202023 do not contain material credit rating covenants. GE’sOur unused back-up revolving syndicated credit facility and certain of our bilateral revolving credit facilities contain a customary net debt-to-EBITDA financial covenant, which GEwe satisfied at December 31, 2020.2023.
The Company may from time to time enter into agreements that contain minimum ratings requirements. The following table provides a summary of the maximum estimated potential liquidity impact in the event of further downgrades with regards to the most significant contractual creditbelow each stated ratings conditions of the Company.level.
| | | | | | |
| Triggers Below | At December 31, 20202023 |
| BBB+/A-2/P-2 | $ | 709— | |
| BBB/A-3/P-3 | 76895 | |
| BBB- | BBB-1,094 | |
| BB+ and below | 1,432581 | |
The amounts in the table above represent the incremental estimated liquidity impact that could occur if we were to fall below each given ratings level.
Our most significant contractual ratings requirements are related to ordinary course commercial activities, our receivables sales programs, and our derivatives portfolio.activities. The timing within the quarter of the potential liquidity impact of these areas may differ, as can the remedies to resolving any potential breaches of required ratings levels.
FOREIGN EXCHANGE AND INTEREST RATE RISKSRISK. . As a result of our global operations, we generate and incur a significant portion of our revenues and expenses in currencies other than the U.S. dollar. Such principal currencies include the euro, the Chinese renminbi, the British pound sterling and the Indian rupee, among others. The effects of foreign currency fluctuations on earnings excluding the earnings impact of the underlying hedged item, was less than $0.1were $0.2 billion, $0.1 billion and $0.30.1 billion for the years ended December 31, 2020, 20192023 and 2018,2022 and 2021, respectively. This analysis excludes any offsetting effect fromSee Note 22 for further information about our risk exposures, our use of derivatives, and the forecasted future transactions that are economically hedged.effects of this activity on our financial statements.
Exchange rate and interest rate risks are managed with a variety of techniques, including selective use of derivatives. We apply policies to manage each of these risks, including prohibitions on speculative activities. Following is an analysis of the potential effects of changes in interest rates and currency exchange rates.
It is our policy to minimize exposure to interest rate changes with regards to our borrowings and their impact to interest and other financial charges. We fund our financial investments using a combination of debt and hedging instruments so that the interest rates of our borrowings match the expected interest rate profile on our assets. It is our policy to minimize currency exposures and to conduct operations either within functional currencies or using the protection of hedge strategies. To test the effectiveness of our hedging actions, forassess exposure to interest rate risk, we assumed that, on January 1, 2021, interest rates increased byapply a +/- 100 basis points change in interest rates and the increase remainedkeep that in place for the next 12 months and formonths. To assess exposure to currency risk of assets and liabilities denominated in other than their functional currencies, we evaluated the effect of a 10% shift in exchange rates against the U.S. dollar.dollar (USD). The analyses indicated that our 20202023 consolidated net earnings would decline by less than $0.1 and $0.2 billion for interest rate risk and approximately $0.1 billion for foreign exchange risk.risk, respectively.
GE 20202023 FORM 10-K27 16
LIBOR REFORM. In connection with the potential transition away from the use of the London interbank offered rate (LIBOR) as an interest rate benchmark, on November 30, 2020, the ICE Benchmark Administration Limited (IBA) announced a consultation on its intention to cease theThe publication of the one-week and two-monthmost commonly used USD LIBOR settings immediately following the LIBOR publication on December 31, 2021, and the remaining USD LIBOR settings immediately following the LIBOR publicationrepresentative rates ceased on June 30, 2023. This followed an announcement on November 18, 2020, that IBA would consult on its intention to ceaseWe evaluated the publication of all GBP, EUR, CHF and JPY LIBOR settings immediately following the LIBOR publication on December 31, 2021.
The Company’s most significant exposures to LIBOR relate to preferred stock issued by GE Industrial and certain floating-rate debt securities issued by GE Capital, for which contractual fallback language exists. Additionally, with respect to our derivatives portfolio, we are managing the transition from LIBOR based on industry-wide LIBOR reform efforts, including the recently released LIBOR protocols issued by the International Swaps and Derivatives Association. None of these exposures are benchmarked to one-week or two-month USD LIBOR.
We are in the process of managing the transition and any financial impact will be accounted for underin accordance with Accounting Standards Update (ASU) 2020-04, Reference Rate Reform (Topic 848): Facilitation of the Effects of Reference Rate Reform on Financial Reporting, which we adopted in and the fourth quarter of 2020. See Note 1 for further information.overall impact to our financial statements is immaterial.
STATEMENT OF CASH FLOWS. We manage the cash flow performance of our industrial and financial services businesses separately, in order to enable us and our investors to evaluate the cash from operating activities of our industrial businesses separately from the cash flows of our financial services business.
Transactions between GE Industrial and GE Capital are reported in the respective columns of our statement of cash flows, but are eliminated in deriving our consolidated statement of cash flows. Intercompany loans from GE Capital to GE Industrial are reflected as cash from (used for) financing activities at GE Industrial and cash from (used for) investing activities at GE Capital. Capital contributions from GE Industrial to GE Capital are reflected as cash used for investing activities at GE Industrial and cash from financing activities at GE Capital. See the GE Industrial working capital transactions section and Notes 4 and 24 for further information regarding certain transactions affecting our consolidated Statement of Cash Flows.
The following provides information on our cash flows in 2020 compared with 2019. Refer to our Annual Report on Form 10-K for the year ended December 31, 2019 for information regarding cash flows in 2019 compared with 2018.
GE INDUSTRIAL CASH FLOWS FROM CONTINUING OPERATIONS. The most significant source of cash in GE Industrial CFOA is customer-related activities, the largest of which is collecting cash resulting from productequipment or services sales. The most significant operating use of cash is to pay our suppliers, employees, tax authorities, contribute to post retirement plans and pay others for a wide range of material, services and taxes.
postretirement plans. GE Industrial measures itself on a GE Industrial free cash flows* basis. This metric includes GE Industrial CFOA plus investments in property, plant and equipment and additions to internal-use software; this metric excludes any dividends received from GE Capital and any cash received from dispositions of property, plant and equipment. We believe that investors may also find it useful to compare GE's Industrial free cash flows* performance without the effects of cash usedflows for taxes related to business sales, operating activities related to our run-off Insurance operations, separation cash expenditures and contributions toCorporate restructuring cash expenditures (associated with the GE Pension Plan.separation-related program announced in October 2022). We believe that this measure will better allowsallow management and investors to evaluate the capacity of our industrial operations to generate free cash flows.flows*.
| | | | | | | | | | | | | | | | | | | | | | | | | | | | | | | | | | | | | | |
| 2020 CFOA (GAAP) AND FREE CASH FLOWS (FCF) BY SEGMENT (NON-GAAP) | | | |
| | Power | | Renewable Energy | | Aviation | | Healthcare | | Corporate & Eliminations | | GE Industrial |
| CFOA (GAAP) | | $ | 285 | | | $ | (328) | | | $ | 763 | | | $ | 3,143 | | | $ | (5,117) | | | $ | (1,254) | |
| Add: gross additions to property, plant and equipment | | (245) | | | (302) | | | (737) | | | (256) | | | (40) | | | (1,579) | |
| Add: gross additions to internal-use software | | (25) | | | (11) | | | (61) | | | (24) | | | (23) | | | (143) | |
| Less: GE Pension Plan funding | | — | | | — | | | — | | | — | | | (2,500) | | | (2,500) | |
| Less: taxes related to business sales | | — | | | — | | | — | | | — | | | (1,082) | | | (1,082) | |
| Free cash flows (Non-GAAP) | | $ | 15 | | | $ | (641) | | | $ | (34) | | | $ | 2,863 | | | $ | (1,598) | | | $ | 606 | |
| | | | | | | | | | | | | | | | | | | | | | | | | | | | | | | | | | | | |
| CFOA (GAAP) AND FREE CASH FLOWS (FCF) BY SEGMENT (NON-GAAP) | | | | | |
| For the year ended December 31, 2023 | | Aerospace | | Renewable Energy | | Power | | | | Corporate | | Total |
| CFOA (GAAP) | | $ | 6,494 | | | $ | (1,064) | | | $ | 2,400 | | | | | $ | (2,261) | | | $ | 5,570 | |
| Less: Insurance CFOA | | — | | | — | | | — | | | | | 191 | | | 191 | |
| CFOA excl. Insurance (Non-GAAP) | | $ | 6,494 | | | $ | (1,064) | | | $ | 2,400 | | | | | $ | (2,452) | | | $ | 5,378 | |
| Add: gross additions to property, plant and equipment and internal use software | | (830) | | | (392) | | | (351) | | | | | (24) | | | (1,595) | |
| | | | | | | | | | | | |
| | | | | | | | | | | | |
| | | | | | | | | | | | |
| Less: separation cash expenditures | | — | | | — | | | — | | | | | (1,060) | | | (1,060) | |
| Less: Corporate restructuring cash expenditures | | — | | | — | | | — | | | | | (177) | | | (177) | |
| Less: taxes related to business sales | | — | | | — | | | — | | | | | (130) | | | (130) | |
| Free cash flows (Non-GAAP)(a) | | $ | 5,664 | | | $ | (1,455) | | | $ | 2,049 | | | | | $ | (1,108) | | | $ | 5,150 | |
| | | | | | | | | | | | |
| | | | | | | | | | | | |
| | | | | | | | | | | | |
| | | | | | | | | | | | |
(a) Renewable Energy segment free cash flows included $215 million of benefits arising from the IRA and $252 million due to the deferral of tax payments associated with certain customer down payments, both of which were offset at Corporate and had no consolidated impact. The deferred tax amount expected to be paid to Corporate by Renewable Energy prior to the GE Vernova spin-off. Additionally, during the fourth quarter of 2023, Renewable Energy, Power and Corporate made prepayments of $473 million, $185 million and $76 million, respectively, related to supply chain finance programs. See Note 11 for further information.
| | | | | | | | | | | | | | | | | | | | | | | | | | | | | | | | | | | | |
| For the year ended December 31, 2022 | | | | | | | | | | | | |
| CFOA (GAAP) | | $ | 5,514 | | | $ | (1,759) | | | $ | 2,078 | | | | | $ | (1,790) | | | $ | 4,043 | |
| Less: Insurance CFOA | | — | | | — | | | — | | | | | 136 | | | 136 | |
| CFOA excl. Insurance (Non-GAAP) | | $ | 5,514 | | | $ | (1,759) | | | $ | 2,078 | | | | | $ | (1,926) | | | $ | 3,907 | |
| Add: gross additions to property, plant and equipment and internal use software | | (624) | | | (281) | | | (228) | | | | | (41) | | | (1,174) | |
| Less: separation cash expenditures | | — | | | — | | | — | | | | | (158) | | | (158) | |
| Less: Corporate restructuring cash expenditures | | — | | | — | | | — | | | | | (38) | | | (38) | |
| Less: taxes related to business sales | | — | | | — | | | — | | | | | (129) | | | (129) | |
| | | | | | | | | | | | |
| Free cash flows (Non-GAAP) | | $ | 4,890 | | | $ | (2,040) | | | $ | 1,850 | | | | | $ | (1,642) | | | $ | 3,059 | |
| | | | | | | | | |
| Years ended December 31 | 2023 | 2022 |
| Increase (decrease) in employee benefit liabilities | $ | 823 | | $ | 424 | |
| Increase (decrease) in Aerospace-related customer allowance accruals | (203) | | 47 | |
| Increase (decrease) in product warranty liabilities | 93 | | 230 | |
| Net restructuring and other charges/(cash expenditures) | 52 | | 169 | |
| Other | (48) | | 128 | |
| All other operating activities | $ | 717 | | $ | 998 | |
*Non-GAAP Financial Measure
GE 20202023 FORM 10-K28 17
| | | | | | | | | | | | | | | | | | | | | | | | | | | | | | | | | | | | | | |
| 2019 CFOA (GAAP) AND FCF BY SEGMENT (NON-GAAP) | | | |
| | Power | | Renewable Energy | | Aviation | | Healthcare | | Corporate & Eliminations | | GE Industrial |
| CFOA (GAAP) | | $ | (1,200) | | | $ | (512) | | | $ | 5,552 | | | $ | 3,024 | | | $ | (2,250) | | | $ | 4,614 | |
| Add: gross additions to property, plant and equipment | | (277) | | | (455) | | | (1,031) | | | (395) | | | (59) | | | (2,216) | |
| Add: gross additions to internal-use software | | (46) | | | (14) | | | (107) | | | (79) | | | (28) | | | (274) | |
| Less: GE Pension Plan funding | | — | | | — | | | — | | | — | | | — | | | — | |
| Less: taxes related to business sales | | — | | | — | | | — | | | — | | | (198) | | | (198) | |
| Free cash flows (Non-GAAP) | | $ | (1,523) | | | $ | (980) | | | $ | 4,415 | | | $ | 2,550 | | | $ | (2,139) | | | $ | 2,322 | |
| | | | | | | | | | | | | | | | | | | | | | | | | | | | | | | | | | | | | | |
| 2018 CFOA (GAAP) AND FCF BY SEGMENT (NON-GAAP) | | | |
| | Power | | Renewable Energy | | Aviation | | Healthcare | | Corporate & Eliminations | | GE Industrial |
| CFOA (GAAP) | | $ | (1,849) | | | $ | 406 | | | $ | 5,373 | | | $ | 3,485 | | | $ | (6,714) | | | $ | 701 | |
| Add: gross additions to property, plant and equipment | | (358) | | | (297) | | | (1,070) | | | (378) | | | (131) | | | (2,234) | |
| Add: gross additions to internal-use software | | (66) | | | (11) | | | (73) | | | (90) | | | (67) | | | (306) | |
| Less: GE Pension Plan funding | | — | | | — | | | — | | | — | | | (6,000) | | | (6,000) | |
| Less: taxes related to business sales | | — | | | — | | | — | | | — | | | (180) | | | (180) | |
| Free cash flows (Non-GAAP) | | $ | (2,273) | | | $ | 98 | | | $ | 4,230 | | | $ | 3,018 | | | $ | (731) | | | $ | 4,341 | |
GE IndustrialThe cash used for operating activities was $1.3impacts from changes in working capital compared to prior year were as follows: current receivables of $1.9 billion, in 2020, an increase of $5.9 billion compared with 2019, primarily due to: a general decrease in net income (after adjusting for the gain on the sale of BioPharma and non-cash losses related to our interest in Baker Hughes), primarily due to COVID-19 impacts in our Aviation segment; GE Pension Plan contributions (which are excluded from GE Industrial free cash flows*) of $2.5 billion;driven by higher collections partially offset by a decrease in cash used for operating working capital of $2.0 billion; lower provisions for income taxes of $0.9 billion; and an increase in cash paid for income taxes of $0.5 billion. Increases in Aviation-related customer allowance accruals (which is a component of All other operating activities) of $0.5 billion were $0.2 billion higher compared with 2019.
We utilized the provision of the Coronavirus Aid, Relief, and Economic Security Act (CARES Act) which allows employers to defer the payment of Social Security taxes and, as a result, we deferred $0.3 billion as of December 31, 2020.
The decrease in cash used for working capital was due to: a decrease in cash used for current receivables of $3.3 billion, which was primarily driven by lower volume, partially offset by a higher decrease in sales of receivables; an increase in cash generated byvolume; inventories, including deferred inventory, of $2.5$0.4 billion, which was primarily driven by lower material purchases,higher liquidations partially offset by lower liquidations; and changes inhigher material purchases; current contract assets of $0.7$(0.4) billion, primarily due to adriven by higher revenue recognition on our long-term equipment contracts and other service agreements, partially offset by higher billings on our long-term service agreements and lower net unfavorable changefavorable changes in estimated profitability of $1.1 billion at Aviation (see Note 9). These decreases in cash used for working capital were partially offset by: an increase in cash used forprofitability; accounts payable and equipment project accrualspayables of $2.9$(2.5) billion, which was primarily as a result of lower volume in 2020 anddriven by higher disbursements, related to purchasesincluding prepayments of materials in prior periods;supply chain finance programs at Renewable Energy, Power and lowerCorporate, partially offset by higher volume; and progress collections and current deferred income of $1.7$0.6 billion, which included a partialdriven by higher collections, including down payments on equipment orders at Renewable Energy in the fourth quarter of 2023, partially offset due to early payments received at our Aviation Military equipment business of $0.7 billion in 2020 as part of the U.S. Department of Defense's efforts to support vendors in its supply chain during the pandemic.by higher liquidations.
GE Industrial cashCash from investing activities was $17.7$6.9 billion in 2020, an increase2023, a decrease of $13.7$4.0 billion compared with 2019,to 2022, primarily due to: lower cash received related to net proceeds from the salesettlements between our continuing operations and businesses in discontinued operations of our BioPharma business of $20.3 billion; lower capital contributions from GE Industrial$7.1 billion, which primarily related to GE Capital of $2.0 billion;HealthCare in connection with the spin-off in 2023 partially offset by the nonrecurrence of a capital contribution to Bank BPH in 2022 (both components of All other investing activities); the acquisition of Nexus Controls in our Power business of $0.3 billion in 2023; partially offset by an increase in proceeds of $4.3 billion from the spin-off of our Transportation business of $6.2 billion (including the saledisposition of our retained ownership interests in Wabtec);GE HealthCare, AerCap and lower proceeds from sales of our stake in Baker Hughes of $2.6 billion (including the sale of a portion of our retained ownership interests in 2020).Hughes. Cash used for additions to property, plant and equipment and internal-use software, which is a componentare components of GE Industrial free cash flows*, was $1.7$1.6 billion and $1.2 billion in 2020, down $0.8 billion compared with 2019.2023 and 2022, respectively.
GE Industrial cashCash used for financing activities was $10.9$10.6 billion in 2020, an increase2023, a decrease of $3.3$3.1 billion compared with 2019,to 2022, primarily due to: higher repaymentsthe nonrecurrence of intercompany loans from GE Capital of $7.5 billion; a reduction in commercial paper of $3.0 billion; reductions of other debt of $0.8 billion; partially offset by new principal issuances ofcash paid to repurchase long-term debt of $7.5$6.9 billion in the second quarter of 2020 and lower repurchases of long-term debt of $0.6 billion.
GE INDUSTRIAL CASH FLOWS FROM DISCONTINUED OPERATIONS. GE Industrialincluding cash used for investing activities in 2019 was primarily due to the deconsolidation of Baker Hughes cash as a result of the reduction in our ownership interest in the segment in the third quarter of 2019. GE Industrial cash used for financing activities in 2019 primarily reflects payments of Baker Hughes dividends to noncontrolling interests.
*Non-GAAP Financial Measure
GE CAPITAL CASH FLOWS FROM CONTINUING OPERATIONS. GE Capital cash from operating activities was $3.5 billion in 2020, an increase of $1.6 billion compared with 2019, primarily due to: cash collateral received which is a standard market practice to minimize derivative counterparty exposures, and settlements received on derivative contracts (components of All other operating activities) of $1.9 billion in 2020, an increase of $0.6 billion compared with 2019 as well as a general increase in cash generated from earnings (loss) from continuing operations. These are partially offset by an increase in trade receivables due to short-term extensions of payment terms to customers of $0.3 billion driven primarily by COVID-19 and other market related effects.
GE Capital cash from investing activities was $8.2 billion in 2020, a decrease of $1.2 billion compared with 2019, primarily due to: lower proceeds from business dispositions of $3.9 billion; lower net collections of financing receivables of $3.2 billion; a decrease in cash related to our current receivables and supply chain finance programs with GE Industrialdebt extinguishment costs, excluding a non-cash debt basis adjustment of $1.9$(0.8) billion; higher net purchases of equity investments of $1.5 billion and a decrease of GECAS sales deposits of $1.1 billion primarily driven by COVID-19 and other market related effects; partially offset by repayments of GE Capital intercompany loans (a component of All other investing activities) by GE Industrial of $9.0 billion in 2020, an increase of $7.5 billion compared with 2019; an increase in cash received related to net settlements between our continuing operations (primarily our Corporate function) and businesses in discontinued operations of $2.2 billion and a decrease in net purchases of investment securities of $0.3 billion.
GE Capital cash used for financing activities was $16.7 billion in 2020, an increase of $9.7 billion compared with 2019, primarily due to: higher net repayments of borrowings of $8.5 billion and a lower capital contribution from GE Industrial to GE Capital of $2.0 billion; partially offset by lower cash settlements on derivatives hedging foreign currency debt of $1.1$0.1 billion in 2023 compared to net cash paid of $0.6 billion in 2022 (a component of All other financing activities); lower net debt maturities of $0.5 billion; nonrecurrence of the settlement of Concept Laser GmbH's interest in an Aerospace
technology joint venture of $0.2 billion (a component of All other financing activities); partially offset by higher cash paid for redemption of GE preferred stock of $5.7 billion.
CASH FLOWS FROM DISCONTINUED OPERATIONS
Cash used for operating activities of discontinued operations was $(0.4) billion in 2023, a decrease of $2.3 billion compared with 2022, primarily driven by decrease in net income, higher disbursements related to purchases of materials in prior periods and higher
separation costs related to our former GE HealthCare business partially offset by tax receipts from our trailing operations.
Cash used for investing activities of discontinued operations was $3.0 billion in 2023, a decrease of $5.7 billion compared with 2022, primarily driven by lower net settlements between our discontinued operations and businesses in continuing operations of $7.1 billion partially offset by the deconsolidation of GE HealthCare cash and equivalents of $1.8 billion.
Cash from financing activities of discontinued operations was $2.0 billion in 2023, a decrease of $6.1 billion compared with 2022, primarily driven by lower long-term debt issuances at GE INDUSTRIAL WORKING CAPITAL TRANSACTIONS. SalesHealthCare in connection with the spin-off of Receivables. In order to manage short-term liquidity and credit exposure, GE Industrial may sell current customer receivables to GE Capital and third parties. These transactions are made on arms- length terms and any discount related to time value of money is recognized within the respective GE Industrial business in the period these receivables were sold to GE Capital or third parties. See Note 4 for further information.$6.3 billion.
Supply Chain Finance Programs. GE Industrial facilitates voluntary supply chain finance programs with third parties, which provide participating GE Industrial suppliers the opportunity to sell their GE Industrial receivables to third parties at the sole discretion of both the suppliers and the third parties.
At December 31, 2020 and 2019, included in GE Industrial's accounts payable is $2.9 billion and $2.4 billion, respectively, of supplier invoices that are subject to the third-party programs. Total GE Industrial supplier invoices paid through these third-party programs were $4.9 billion and $1.4 billion for the years ended December 31, 2020 and 2019, respectively.
Previously, GE Capital operated a supply chain finance program for suppliers to GE Industrial's businesses. The remaining GE Industrial liability associated with the funded participation in the GE Capital program is presented as accounts payable and amounted to $0.1 billion and $2.1 billion at December 31, 2020 and 2019, respectively. Cash flows associated with the decrease in this liability are reflected as cash used for operating activities at GE Industrial and cash from investing activities at GE Capital, and are eliminated in our consolidated statement of cash flows.
INTERCOMPANY TRANSACTIONS BETWEEN GE INDUSTRIAL AND GE CAPITAL. Transactions between related companies are made on arms-length terms and are reported in the GE Industrial and GE Capital columns of our financial statements, which we believe provide useful supplemental information to our consolidated financial statements. Consistent with our historical practice, all commercial transactions between GE Industrial and GE Capital continue to be reported on arms-length terms and are eliminated upon consolidation. See Note 24 for further information.
GE Capital Finance Transactions. During the years ended December 31, 2020 and 2019, GE Capital acquired from third parties 20 aircraft with a list price totaling $1.7 billion and 51 aircraft with a list price totaling $6.4 billion, respectively, that will be leased to others and are powered by engines manufactured by GE Aviation and affiliates. GE Capital also made payments to GE Aviation and affiliates related to spare engines and engine parts of $0.2 billion and $0.7 billion, which included $0.1 billion and $0.6 billion to CFM International, during the years ended December 31, 2020 and 2019, respectively. Additionally, GE Capital had $2.1 billion and $2.0 billion of net book value of engines, originally manufactured by GE Aviation and affiliates and subsequently leased back to GE Aviation and affiliates at December 31, 2020 and 2019, respectively.
Also, during the years ended December 31, 2020 and 2019, GE Industrial recognized equipment revenues of $2.3 billion and $1.6 billion, respectively, from customers within our Power and Renewable Energy segments in which GE Capital has been an investee or is committed to be an investee in the underlying projects. At December 31, 2020 and 2019, GE Capital had funded related investments of $1.3 billion and $0.6 billion, respectively.
For certain of these investments, in order to meet its underwriting criteria, GE Capital may obtain a direct guarantee from GE Industrial related to the performance of the third party. GE Industrial guarantees include direct performance or payment guarantees, return on investment guarantees and asset value guarantees. As of December 31, 2020, GE Industrial had outstanding guarantees to GE Capital on $0.9 billion of funded exposure and $0.1 billion of unfunded commitments, which included guarantees issued by industrial businesses. The recorded contingent liability for these guarantees was insignificant as of December 31, 2020 and is based on individual transaction level defaults, losses and/or returns.
CRITICAL ACCOUNTING ESTIMATES. Accounting estimates and assumptions discussed in this section are those that we consider to be the most critical to an understanding of our financial statements because they involve significant judgments and uncertainties. Actual results in these areas could differ from management's estimates. See Note 1 for further information on our most significant accounting policies.
REVENUE RECOGNITION ON LONG-TERM SERVICES AGREEMENTS. We have long-term service agreements with our customers predominately within our Power and AviationAerospace segments that require us to maintain the customers’ assets over the contract terms, which generally range from 5 to 25 years. However, contract modifications that extend or revise contracts are not uncommon. We recognize revenue as we perform under the arrangements using the percentage of completion method which is based on our costs incurred to date relative to our estimate of total expected costs. This requires us to make estimates of customer payments expected to be received over the contract term as well as the costs to perform required maintenance services.
Customers generally pay us based on the utilization of the asset (per hour of usage for example) or upon the occurrence of a major event within the contract such as an overhaul.overhaul or major outage. As a result, a significant estimate in determining expected revenues of a contract is estimating how customers will utilize their assets over the term of the agreement. The estimate of utilization, which can change over the contract life, impacts both the amount of customer payments we expect to receive and our estimate of future contract costs. Customers’ asset utilization will influence the timing and extent of overhauls and other service events over the life of the contract. We generally use a combination of both historical utilization trends as well as forward-looking information such as market conditions and potential asset retirements in developing our revenue estimates.
To develop our cost estimates, we consider the timing and extent of future maintenance and overhaul events, including the amount and cost of labor, spare parts and other resources required to perform the services. In developing our cost estimates, we utilize a combination of our historical cost experience and expected cost improvements. Cost improvements are only included in future cost estimates after savings have been observed in actual results or proven effective through an extensive regulatory or engineering approval process.
*Non-GAAP Financial Measure
We routinely review estimates under long-term service agreements and regularly revise them to adjust for changes in outlook. These revisions are based on objectively verifiable information that is available at the time of the review. Contract modifications that change the rights and obligations, as well as the nature, timing and extent of future cash flows, are evaluated for potential price concessions, contract asset impairments and significant financing to determine if adjustments of earnings are required before effectively accounting for a modified contract as a new contract.
We regularly assess expected billings adjustments and customer credit risk inherent in the carrying amounts of receivables and contract assets, including the risk that contractual penalties may not be sufficient to offset our accumulated investment in the event of customer termination. We gain insight into future utilization and cost trends, as well as credit risk, through our knowledge of the installed base of equipment and fleet management strategies through close interaction with our customers that comes with supplying critical services and parts over extended periods. Revisions may affect a long-term services agreement’s total estimated profitability resulting in an adjustment of earnings.
On December 31, 2020,2023, our net long-term service agreements balance of $1.3$(2.1) billion represents approximately 0.7%(1.0)% of our total estimated life of contract billings of $188.4$215.3 billion. Our contracts (on average) are approximately 20.9%19.5% complete based on costs incurred to date and our estimate of future costs. Revisions to our estimates of future billings or costs that increase or decrease total estimated contract profitability by one percentage point would increase or decrease the long-term service agreements balance by $0.4 billion. Cash billingsBillings collected on these contracts were $8.9$13.2 billion and $11.5$11.7 billion during the years ended December 31, 20202023 and 2019,2022, respectively.
See Notes 1 and 98 for further information.
IMPAIRMENT OF GOODWILL AND OTHER IDENTIFIED INTANGIBLE ASSETS. We perform ourGoodwill is subject to annual, goodwillor more frequent, if necessary, impairment testing intesting. In the fourth quarter. In assessingimpairment test, the possibility that a reporting unit’s fair value has been reduced below its carrying amount due to the occurrence of eventsis estimated utilizing a discounted cash flow approach utilizing cash flow forecasts, including strategic and annual operating plans, adjusted for terminal value assumptions, or circumstances between annual impairment testing dates, we consider all available evidence, including (i) the results of our impairment testing from the most recent testing date (in particular, the magnitude of the excess of fair value over carrying value observed), (ii) downward revisions to internal forecasts or decreases in market multiples (and the magnitude thereof), if any, and (iii) declines in market capitalization below book value (and the magnitude and duration of those declines), if any.
We determine fair value for each of the reporting units using thea market approach, when available and appropriate, or the income approach, or a combination of both. We assess the valuation methodology based upon the relevance and availability of the data at the time we perform the valuation. If multiple valuation methodologies are used, the results are weighted appropriately.
Valuations using the market approach are derived from metrics of publicly traded companies or historically completed transactions of comparable businesses. The selection of comparable businesses is based on the markets in which the reporting units operate giving consideration to risk profiles, size, geography, and diversity of products and services. A market approach is limited to reporting units for which there are publicly traded companies that have the characteristics similar to our businesses.
Under the income approach, fair value is determined based on the present value of estimated future cash flows, discounted at an appropriate risk-adjusted rate. We use our internal forecasts to estimate future cash flows and include an estimate of long-term future growth rates based on our most recent views of the long-term outlook for each business. We derive our discount rates using a capital asset pricing model and analyzing published rates for industries relevant to our reporting units to estimate the cost of equity financing. We use discount rates that are commensurate with the risks and uncertainty inherent in the respective businesses and in our internally developed forecasts. Discount rates used in our annual reporting unit valuations ranged from 10.5% to 22.5%.
Estimating the fair value of reporting units requires the use of significant judgments that are based on a number of factors including actual operating results, internal forecasts,utilizing market observable pricing multiples of similar businesses and comparable transactions, possible control premiums, determiningor both. These impairment tests involve the appropriate discount rateuse of accounting estimates and long-term growth rate assumptions, and changes to those assumptions could materially impact our financial condition or operating performance if multiple approaches are being used, determiningactual results differ from such estimates and assumptions. To address this uncertainty, we perform sensitivity analyses on key estimates and assumptions. Once the appropriate weighting applied to each approach. Itfair value is reasonably possible thatdetermined, if the judgments and estimates described above could change in future periods.carrying amount exceeds the fair value, it is impaired.
We review identified intangible assets with defined useful lives and subject to amortization for impairment whenever events or changes in circumstances indicate that the related carrying amounts may not be recoverable. Determining whether an impairment loss has occurred requires the use of our internal forecast to estimate future cash flows and the useful life over which these cash flows will occur. To determine fair value, we use our internal cash flow estimates discounted at an appropriate discount rate.
See Notes 1 and 87 for further information.
INSURANCE AND INVESTMENT CONTRACTS. Refer to the Other Items - Insurance section for further discussion of the accounting estimates and assumptions in our insurance reserves and their sensitivity to change. Also seeSee Notes 1 and 12 for further information.
PENSION ASSUMPTIONS. Refer to Note 13 for our accounting estimates and assumptions related to our postretirement benefit plans.
INCOME TAXES. Our annual tax rate is based on our income, statutory tax rates and tax planning opportunities available to us in the various jurisdictions in which we operate. Tax laws are complex and subject to different interpretations by the taxpayer and respective governmental taxing authorities. Significant judgment is required in determining our tax expense and in evaluating our tax positions, including evaluating uncertainties. We review our tax positions quarterly and adjust the balances as new information becomes available. Our income tax rate is significantly affected by the tax rate on our global operations. In addition to local country tax laws and regulations, this rate can depend on the extent earnings are indefinitely reinvested outside the U.S. Historically U.S. taxes were due upon repatriation of foreign earnings. Due to the enactment of U.S. tax reform in 2017, repatriations of available cash from foreign earnings are expected to be free of U.S. federal income tax but may incur withholding, with a potential U.S. tax credit offset, or state taxes. Indefinite reinvestment is determined by management’s judgment about and intentions concerning the future operations of the Company. Most of these earnings have been reinvested in active non-U.S. business operations. At December 31, 2020, we have not changed our indefiniteWe reassess reinvestment decision as a result of tax reform but will reassess thisearnings on an ongoing basis. In 2023 and 2022, in connection with the execution of the Company's plans to prepare for the spin-off of GE Vernova and GE HealthCare, we incurred an insignificant amount and $0.1 billion of tax, respectively, due to repatriation of previously reinvested earnings.
We evaluate the recoverability of deferred income tax assets by assessing the adequacy of future expected taxable income from all sources, including reversal of taxable temporary differences, forecasted operating earnings and available tax planning strategies, which heavily rely on estimates. We use our historical experience and our short- and long-range business forecasts to provide insight. Further, our global and diversified business portfolio gives us the opportunity to employ various prudent and feasible tax planning strategies to facilitate the recoverability of future deductions. Amounts recorded for deferred tax assets related to non-U.S. net operating losses, net of valuation allowances, were $2.1$1.0 billion and $2.2$1.3 billion at December 31, 20202023 and 2019,2022, respectively. Of this, $0.1 billionan insignificant amount at December 31, 2023 and $0.2$0.4 billion at December 31, 2020 and 2019, respectively,2022, were associated with losses reported in discontinued operations, primarily related to our GE HealthCare and legacy financial services businesses, and $0.2 billion was related to held for sale assets at December 31, 2019.
businesses. See Other Consolidated Information – Income Taxes section and Notes 1 and 15 for further information.
LOSS CONTINGENCIES. Loss contingencies are uncertain and unresolved mattersexisting conditions, situations or circumstances involving uncertainty as to possible loss that arise in the ordinary course of business and result fromwill ultimately be resolved when future events occur or actions by others that have the potentialfail to result in a future loss.occur. Such contingencies include, but are not limited to, environmental obligations, litigation, regulatory investigations and proceedings, product quality and losses resulting from other events and developments. When a loss is considered probable and reasonably estimable, we record a liability in the amount of our best estimate for the ultimate loss. When there appears to be a range of possible costs with equal likelihood, liabilities are based on the low-end of such range. However, the likelihood of a loss with respect to a particular contingency is often difficult to predict and determining a meaningful estimate of the loss or a range of loss may not be practicable based on the information available and the potential effect of future events and negotiations with or decisions by third parties that will determine the ultimate resolution of the contingency. Moreover, it is not uncommon for such matters to be resolved over many years, during which time relevant developments and new information must be continuously evaluated to determine both the likelihood of potential loss and whether it is possible to reasonably estimate a range of possible loss. Disclosure is provided for material loss contingencies when a loss is probable but a reasonable estimate cannot be made, and when it is reasonably possible that a loss will be incurred or the amount of a loss will exceed the recorded provision. We regularly review contingencies to determine whether the likelihood of loss has changed and to assess whether a reasonable estimate of the loss or range of loss can be made. See Note 2324 for further information.
OTHER ITEMS
INSURANCE. The run-off insurance operations of North American Life and Health (NALH) primarily include Employers Reassurance Corporation (ERAC) and Union Fidelity Life Insurance Company (UFLIC). ERAC was formerly part of Employers Reinsurance Corporation (ERC) until the sale of ERC to Swiss Re in 2006. UFLIC was formerly part of Genworth Financial Inc. (Genworth) but was retained by GE after Genworth’s initial public offering in 2004.
ERAC primarily assumesassumed long-term care insurance and life insurance from numerous cedents under various types of reinsurance
treaties and stopped accepting new policies after 2008. UFLIC primarily assumesassumed long-term care insurance, structured settlement
annuities with and without life contingencies and variable annuities from Genworth Financial Inc. (Genworth) and has been closed to new business since 2004.
The vast majority of NALH’s reinsurance exposures are long-duration arrangements that still involve substantial levels of premium
collections and benefit payments even though ERAC and UFLIC have not entered into new reinsurance treaties in about a decade. These long-duration arrangements involve a number of direct writers and contain a range of risk transfer provisions and other contractual elements. In many instances, these arrangements do not transfer to us 100 percent of the risk embodied in the encompassed underlying policies issued by the direct writers. Furthermore, we cede insurance risk to third-party reinsurers for a portion of our insurance contracts, primarily on long-term care insurance policies.
Our run-off insurance liabilitiesOn January 1, 2023, we adopted ASU No. 2018-12, Financial Services – Insurance (Topic 944): Targeted Improvements to the Accounting for Long-Duration Contracts (ASU 2018-12). See Capital Resources and annuity benefits primarily comprise a liabilityLiquidity and Notes 1, 3 and 12 for future policy benefits for those insurance contract claims not yet incurred and claim reserves for claims that have been incurred or are estimatedfurther information related to have been incurred but not yet reported. The insurance liabilities and annuity benefits amounted to $42.2 billion and $39.8 billion and primarily relate to individual long-term care insurance reserves of $21.3 billion and $21.0 billion and structured settlement annuities and life insurance reserves of $10.7 billion and $11.1 billion, at December 31, 2020 and 2019, respectively. The increase in insurance liabilities and annuity benefits of $2.4 billion from December 31, 2019 to December 31, 2020 is primarily due to an adjustment of $2.5 billion resulting from an increase in unrealized gains on investment securities that would result in a premium deficiency should those gains be realized.
In addition to NALH, Electric Insurance Company (EIC) is a property and casualty insurance company primarily providing insurance to GE and its employees with net claim reserves of $0.3 billion at both December 31, 2020 and 2019.
We regularly monitor emerging experience in our run-off insurance operations and industry developments to identify trends that may help us refine our reserve assumptions. We believe recent elevated mortality across our portfolio and lower long-term care insurance claims are short term in nature and attributable to COVID-19. However, the effects of COVID-19, including the timing and success of vaccinations, remain uncertain and may result in variability in levels of future mortality and long-term care insurance claims activity, including changes in policyholder behavior (e.g., policyholder willingness to enter long-term care facilities or seek care at home), among others.
These monitoring activities also allow us to evaluate opportunities to reduce our insurance risk profile and improve the results of our run-off insurance operations. Such opportunities may include the pursuit of future premium rate increases and benefit reductions on long-term care insurance contracts in accordance with our reinsurance contracts with our ceding companies; recapture and reinsurance transactions to reduce risk where economically justified; investment strategies to improve asset and liability matching and enhance investment portfolio yields; and managing our expense levels.
Key Portfolio Characteristics
Long-term care insurance contracts. The long-term care insurance contracts we reinsure provide coverage at varying levels of benefits to policyholders and may include attributes (e.g., lifetime benefit periods, inflation protection options, and joint life policies) that could result in claimants being on claim for longer periods or at higher daily claim costs, or alternatively limiting the premium paying period, compared to contracts with a lower level of benefits. For example, policyholders with a lifetime benefit period could receive coverage up to the specified daily maximum as long as the policyholder is claim eligible and receives care for covered services; inflation protection options increase the daily maximums to protect the policyholder from the rising cost of care with some options providing automatic annual increases of 3% to 5% or policyholder elected inflation-indexed increases for increased premium; joint life policies provide coverage for two lives which permit either life under a single contract to receive benefits at the same time or separately; and premium payment options may limit the period over which the policyholder pays premiums while still receiving coverage after premium payments cease, which may limit the impact of our benefit from future premium rate increases.
The ERAC long-term care insurance portfolio comprises more than two-thirds of our total long-term care insurance reserves and is assumed from approximately 30 ceding companies through various types of reinsurance and retrocession contracts having complex terms and conditions. Compared to the overall long-term care insurance block, it has a lower average attained age with a larger number of policies (and covered lives, as over one-third of the policies are joint life policies), with lifetime benefit periods and/or with inflation protection options which may result in a higher potential for future claims.
The UFLIC long-term care insurance block comprises the remainder of our total long-term care insurance reserves and is more mature with policies that are more uniform, as it is assumed from a single ceding company, Genworth, and has fewer policies with lifetime benefit periods, no joint life policies and slightly more policies with inflation protection options.
As further described within the Premium Deficiency Testing section below, we reconstructed our future claim cost projections in 2017 utilizing trends observed in our emerging experience for older claimant ages and later duration policies. Also described within that section are key assumption changes in 2020.
Presented in the table below are GAAP and statutory reserve balances and key attributes of our long-term care insurance portfolio.
| | December 31, 2020 | ERAC | UFLIC | Total |
| Gross GAAP future policy benefit reserves and claim reserves | $ | 15,757 | | $ | 5,570 | | $ | 21,327 | |
| Gross statutory future policy benefit reserves and claim reserves(a) | 24,081 | | 6,843 | | 30,924 | |
| December 31, 2023 | | December 31, 2023 | ERAC | UFLIC | Total |
| GAAP: Ending balance of reserves at locked-in rate | |
| Gross statutory reserves(a) | |
| Number of policies in force | Number of policies in force | 190,000 | | 62,000 | | 252,000 | |
| Number of covered lives in force | Number of covered lives in force | 254,000 | | 62,000 | | 316,000 | |
| Average policyholder attained age | Average policyholder attained age | 76 | | 83 | | 78 | |
| Gross GAAP future policy benefit reserve per policy (in actual dollars) | $ | 70,600 | | $ | 56,900 | | $ | 67,200 | |
| Gross GAAP future policy benefit reserve per covered life (in actual dollars) | 52,800 | | 56,900 | | 53,600 | |
| Gross statutory future policy benefit reserve per policy (in actual dollars)(a) | 113,800 | | 77,000 | | 104,700 | |
| Gross statutory future policy benefit reserve per covered life (in actual dollars)(a) | 85,100 | | 77,000 | | 83,500 | |
| GAAP: Ending balance of reserves at locked-in rate per policy (in actual dollars) | |
| GAAP: Ending balance of reserves at locked-in rate per covered life (in actual dollars) | |
| Statutory: Gross reserves per policy (in actual dollars)(a) | |
| Statutory: Gross reserves per covered life (in actual dollars)(a) | |
| Percentage of policies with: | Percentage of policies with: | |
| Lifetime benefit period | |
| Lifetime benefit period | |
| Lifetime benefit period | Lifetime benefit period | 69 | % | 34 | % | 61 | % | 69 | % | 31 | % | 61 | % |
| Inflation protection option | Inflation protection option | 81 | % | 91 | % | 84 | % | Inflation protection option | 75 | % | 81 | % | 76 | % |
| Joint lives | Joint lives | 34 | % | — | % | 25 | % | Joint lives | 33 | % | — | % | 25 | % |
| Percentage of policies that are premium paying | Percentage of policies that are premium paying | 72 | % | 80 | % | 74 | % | Percentage of policies that are premium paying | 67 | % | 74 | % | 68 | % |
| Policies on claim | Policies on claim | 11,000 | | 8,800 | | 19,800 | |
(a) Statutory balances reflect recognitionPending completion of the estimated remainingour December 31, 2023 statutory increase in reserves of approximately $5.5 billion through 2023 under the permitted accounting practice discussed further below and in Note 12.reporting process.
Structured settlement annuities and life insurance contracts. annuities.We reinsure approximately 29,10024,600 structured settlement annuities with an average attained age of 53.56. These structured settlement annuities were primarily underwritten on impaired lives (i.e., shorter-than-average life expectancies) at origination and have projected payments extending decades into the future. Our primary risks associated with these contracts include mortality (i.e., life expectancy or longevity), mortality improvement (i.e., assumed rate that mortality is expected to reduce over time), which may extend the duration of payments on life contingent contracts beyond our estimates, and reinvestment risk (i.e., a low interest rate environment may reduce our ability to achieve our targeted investment margins)environment). Unlike long-term care insurance, structured settlement annuities offer no ability to require additional premiums or reduce benefits.
Life Insurance contracts.Our life reinsurance business typically covers the mortality risk associated with various types of life insurance policies that we reinsure from approximately 150 ceding company relationships where we pay a benefit based on the death of a covered life. As ofAt December 31, 2020,2023, across our U.S. and Canadian life insurance blocks,portfolio, we reinsure approximately $80$50 billion of net amount at risk (i.e., difference between the death benefit and any accrued cash value) from approximately 21.2 million policies with an average attained age of 59.62. In 2020,2023, our incurred claims were approximately $0.6$0.5 billion with an average individual claim of approximately $50,000.$51,000. The largest product types covered are 20-yearproducts primarily include permanent life insurance and 20- and 30-year level term insurance. We anticipate a significant portion of the 20- and 30-year level term policies, which represent approximately 35%9% and 40% of the net amount atof risk, and a significant portion are anticipated to lapse (i.e., the length of time a policy will remain in force) over the next 3 yearsthrough 2024 and 2034 as the policies reach the end of their 20-year20- and 30-year level premium period.
Investment portfolio and other adjustments. Our insurance liabilities and annuity benefits are primarily supported by investment securities of $42.0 billion and $38.0 billion and commercial mortgage loans of $1.8 billion and $1.9 billion at December 31, 2020 and 2019, respectively. Additionally, we expect to purchase approximately $7 billion of new assets through 2024 in conjunction with expected capital contributions from GE Capital to our insurance subsidiaries, of which approximately $2.0 billion is expected to be contributed in the first quarter of 2021, pending completion of our December 31, 2020 statutory reporting process, which includes asset adequacy testing. Our investment securities are classified as available-for-sale and comprise mainly investment-grade debt securities. The portfolio includes $8.2 billion of net unrealized gains that are recorded within Other comprehensive income, net of applicable taxes and other adjustments as of December 31, 2020.
In calculating our future policy benefit reserves, we are required to consider the impact of net unrealized gains and losses on our available-for-sale investment securities supporting our insurance contracts as if those unrealized amounts were realized. To the extent that the realization of gains would result in a premium deficiency, an adjustment is recorded to increase future policy benefit reserves with an after-tax offset to Other comprehensive income. At December 31, 2020, the entire $8.2 billion balance of net unrealized gains on our investment securities required a related increase to future policy benefit reserves. This adjustment increased from $5.7 billion in 2019 to $8.2 billion in 2020 primarily from higher unrealized gains within the investment security portfolio supporting our insurance contracts as a result of decreased market yields. See Note 3 for further information about our investment securities.
We manage the investments in our run-off insurance operations under strict investment guidelines, including limitations on asset class concentration, single issuer exposures, asset-liability duration variances, and other factors to meet credit quality, yield, liquidity and diversification requirements associated with servicing our insurance liabilities under reasonable circumstances. This process includes consideration of various asset allocation strategies and incorporates information from several external investment advisors to improve our investment yield subject to maintaining our ability to satisfy insurance liabilities when due, as well as considering our risk-based capital requirements, regulatory constraints, and tolerance for surplus volatility. With the expected capital contributions from GE Capital through 2024, we intend to add new asset classes to further diversify our portfolio, including private equity, senior secured loans and infrastructure debt, among others. Asset allocation planning is a dynamic process that considers changes in market conditions, risk appetite, liquidity needs and other factors which are reviewed on a periodic basis by our investment team. Investing in these assets exposes us to both credit risk (i.e., debtor’s ability to make timely payments of principal and interest) and interest rate risk (i.e., market price, cash flow variability, and reinvestment risk due to changes in market interest rates). We regularly review investment securities for impairment using both quantitative and qualitative criteria.
Our run-off insurance operations have approximately $0.8 billion of assets held by states or other regulatory bodies in statutorily required deposit accounts, and approximately $32.2 billion of assets held in trust accounts associated with reinsurance contracts and reinsurance security trust agreements in place between either ERAC or UFLIC as the reinsuring entity and a number of ceding insurers. Assets in these trusts are held by an independent trustee for the benefit of the ceding insurer, and are subject to various investment guidelines as set forth in the respective reinsurance contacts and trust agreements. Some of these trust agreements may allow a ceding company to withdraw trust assets from the trust and hold these assets on its balance sheet, in an account under its control for the benefit of ERAC or UFLIC which might allow the ceding company to exercise investment control over such assets.
Critical Accounting Estimates. Our insurance reserves include the following key accounting estimates and assumptions described below.
Future policy benefit reserves. Future policy benefit reserves represent the present value of future policy benefits to be paid to or on behalf of policyholders and related expenses less the present value of future grossnet premiums and are estimated based on actuarial assumptions including, but not limitedsuch as mortality, morbidity, terminations, and expenses. The liability is measured for each group of contracts (i.e., cohorts) using current cash flow assumptions.
We regularly monitor emerging experience in our run-off insurance operations and industry developments to morbidity (i.e., frequency and severity of claim, including claim termination rates and benefit utilization rates); morbidity improvement (i.e., assumed rate of improvement in morbidityidentify trends that may help us refine our reserve assumptions. We review at least annually in the future); mortality (i.e., life expectancy or longevity); mortality improvement (i.e., assumedthird quarter, future policy benefit reserves cash flow assumptions, except related claim expenses which remain locked-in, and if the review concludes that the assumptions need to be updated, future policy benefit reserves are adjusted retroactively based on the revised net premium ratio using actual historical experience, updated cash flow assumptions, and the locked-in discount rate that mortality is expected to reduce over time); policyholder persistency or lapses (i.e.,with the lengtheffect of time a policy will remainthose changes recognized in force); anticipated premium increases or benefit reductions associated with future in-force rate actions, including actions that are: (a) approved and not yet implemented, (b) filed but not yet approved, and (c) estimated on future filings through 2028,current period earnings. Our annual review procedures include updating certain experience studies since our last completed review, independent actuarial analysis (principally on long-term care insurance policies;exposures) and interest rates. Assumptions are locked-in throughout the remaining life of a contract unless a premium deficiency develops.
Claim reserves. Claim reserves are established when a claim is incurred and represents our best estimate of the present value of the ultimate obligations for future claim payments and claim adjustment expenses. Key inputs include actual known facts about the claim, such as the benefits available and cause of disability of the claimant, as well as assumptions derived from our actual historical experience and expected future changes in experience factors. Claim reserves are evaluated periodically for potential changes in loss estimates with the support of qualified actuaries, and any changes are recorded in earnings in the period in which they are determined.
Reinsurance recoverables. We cede insurance risk to third-party reinsurers for a portion of our insurance contracts, primarily on long-term care insurance policies, and record receivables for estimated recoveries as we are not relieved from our primary obligation to policyholders or cedents. These receivables are estimated in a manner consistent with the future policy benefit reserves and claim reserves. Reserves ceded to reinsurers, net of allowance, were $2.6 billion and $2.4 billion at December 31, 2020 and 2019, respectively, and are included in the caption Other GE Capital receivables in our consolidated Statement of Financial Position.
Premium Deficiency Testing. We annually perform premium deficiency testing in the third quarter in the aggregate across our run-off insurance portfolio. The premium deficiency testing assesses the adequacy of future policy benefit reserves, net of unamortized capitalized acquisition costs, using current assumptions without provision for adverse deviation. A comprehensive review of premium deficiencyindustry benchmarks. The review of experience and assumptions is a comprehensive and complex process andthat depends on a number of factors, many of which are interdependent and require evaluation individually and in the aggregate across all insurance products. The vast majority of our run-off insurance operations consists of reinsurance from multiple ceding insurance entities pursuant to treaties having complex terms and conditions. Premium deficiency testingThe review relies on claim and policy information provided by these ceding entities and considers the reinsurance treaties and underlying policies. In order to utilize that information for purposes of completing experience studies covering all key assumptions, we perform detailed procedures to conform and validate the data received from the ceding entities. Our long-term care insurance businessportfolio includes coverage where credible claim experience for higher attained ages is still emerging, and to the extent future experience deviates from current expectations, new projections of claim costs extending over the expected life of the policies may be required. Significant uncertainties exist in making projections for these long-term care insurance contracts, which requires that we consider a wide range of possible outcomes.
The primary cash flow assumptions used in the premium deficiency testsannual review include:
Morbidity. Morbidity assumptions used in estimating future policy benefit reserves are based on estimates of expected incidences of disability among policyholders and the costs associated with these policyholders asserting claims under their contracts, and these estimates account for any expected future morbidity improvement. For long-term care insurance exposures, estimating expected future costs includes assessments of incidence (probability of a claim), utilization (amount of available benefits expected to be incurred) and continuance (how long the claim will last). Priorlast, including claim terminations due to 2017, premium deficiency assumptions considered the risk of anti-selection by including issue age adjustments to morbidity based on an actuarial assumption that long-term care policies issued to younger individuals would exhibit lower expected incidences and claim costs than those issued to older policyholders. Recent claim experience and the development of reconstructed claim cost curves indicated issue age differences had minimal impact on claim cost projections, and, accordingly, beginning in 2017, issue age adjustments were eliminated in developing morbidity assumptions. Higher morbidity increases, while lower morbidity decreases, the present value of expected future benefit payments.death or recovery).
Rate of Change in Morbidity. Our annual premium deficiency testingreview incorporates our best estimates of projected future changes in the morbidity rates reflected in our base claim cost curves.incidence rates. These estimates draw upon a number of inputs, some of which are subjective, and all of which are interpreted and applied in the exercise of professional actuarial judgment in the context of the characteristics specific to our portfolios. This exercise of actuarial judgment considers factors such as the work performed by internal and external independent actuarial experts engaged to advise us in our annual testing,review, the observed actual experience in our portfolios measured against our base projections,assumptions, industry developments, and other trends, including advances in the state of medical care and health-carehealthcare technology development. With respect to industry developments, we take into account that there are differences between and among industry peers in portfolio characteristics (such as demographic features of the insured populations), the aggregate effect of morbidity improvement or deterioration as applied to base claim cost projections, the extent to which such base cost projections reflect the most current experience, and the accepted diversity of practice in actuarial professional judgment. We assess the potential for any change in morbidity with reference to our existing base claim cost projections, reconstructed in 2017. Projected improvement or deterioration in morbidity can have a material impact on our future claim cost projections, both on a stand-alone basis and also by virtue of influencing other variables such as discount rate and premium rate increases.
MortalityTerminations. Terminations include active life mortality and lapse. Mortality assumptions used in estimating future policy benefit reserves are based on published mortality tables as adjusted for the results of our experience studies and estimates of expected future mortality improvement. For life insurance products, higher mortality increasesLapse refers to the present valuerate at which the underlying policies are cancelled due to non-payment of expected future benefit payments, while for annuity and long-term care insurance contracts, higher mortality decreases the present value of expected future benefit payments.
Discount rate. Interestpremiums by a policyholder. Lapse rate assumptions used in estimating the present value of future policy benefit reserves are based on expected investment yields, netthe results of related investment expensesour experience studies and expected defaults. In estimating future investment yields, we consider the actual yields on our current investment securities held by our run-off insurance operations and the future rates at which we expect to reinvest any proceeds from investment security maturities, net of other operating cash flows, and the projected future capital contributions into our run-off insurance operations. Lower future investment yields result in a lower discount rate and a higher present value of future policy benefit reserves.reflect actuarial judgment.
Future long-term care premium rate increases. Long-termSubstantially all long-term care insurance policies that are currently premium paying allow the issuing insurance entity to increase premiums, or alternatively allow the policyholder the option to decrease benefits, with approval by state regulators, should actual experience emerge worse than what was projected when such policies were initially underwritten. As a reinsurer, we rely upon the primary insurers that issued the underlying policies to file proposed premium rate increases on those policies with the relevant state insurance regulators. While we have no direct ability to seek or to institute such premium rate increases, we often collaborate with the primary insurers in accordance with reinsurance contractual terms to file proposed premium rate increases. The amount of times that rate increases have occurred varies by ceding company. We consider recent experience of rate increase filings made by our ceding companies along with state insurance regulatory processes and precedents in establishing our current expectations. Higher future premium rate increases lower the present value of future policy benefit reserves and lower future premium rate increases increase the present value of future policy benefit reserves.
Terminations. Terminations refers to the rate at which the underlying policies are cancelled due to either mortality, lapse (non-payment of premiums by a policyholder), or, in the case of long-term care insurance, benefit exhaustion. Termination rate assumptions used in estimating the present value of future policy benefit reserves are based on the results of our experience studies and reflect actuarial judgment. Lower termination rates increase, while higher termination rates decrease, the present value of expected future benefit payments.
In 2017, based on elevated claim experience for a portion of our long-term care insurance contracts, we initiated a comprehensive review of all premium deficiency testing assumptions across all insurance products, resulting in a reconstruction of our future claim cost projections for long-term care insurance products. While our long-term care insurance claim experience has shown some emerging modest favorable experience, it remains largely in-line with those reconstructed projections. However, the extent of actual experience since 2017 to date is limited in the context of a long-tailed, multi-decade portfolio.
GE 20202023 FORM 10-K36 21
2020 Premium Deficiency Testing. We completed our annual premium deficiency testing in the aggregate across our run-off insurance portfolio in the third quarter of 2020. These procedures included updating experience studies since our last test completed in the third quarter of 2019, independent actuarial analysis and review of industry benchmarks. As we experienced a premium deficiency in 2019, our 2020 premium deficiency testing started with a zero margin and, accordingly, any net adverse development would result in a future premium deficiency. Using our most recent future policy benefit reserve assumptions, including changes to our assumptions related to morbidity, future premium rate increases and discount rate, the 2020 premium deficiency testing results indicated there was a positive margin of less than 2% of the recorded future policy benefit reserves, excluding Other adjustments, at September 30, 2020. As a result, the assumptions updated in connection with the premium deficiency recognized in 2019 remain locked-in and will remain so unless another premium deficiency occurs in the future.
The increaseIncluded in the premium deficiency testing margin from our 2019 testing was primarily attributable to modestly favorable emerging morbidity experienceInsurance losses, annuity benefits and other costs in our long-term care insurance portfolio, primarily atStatement of Earnings (Loss) for the older attained ages, inyears ended December 31, 2023 and 2022, are unfavorable and favorable pre-tax adjustments of $(155) million and $404 million, respectively, from updating the period sincenet premium ratio (i.e., the 2017 reconstructionpercentage of ourprojected gross premiums required to cover expected policy benefits and related expenses) after updating for actual historical experience each quarter and updating of future claim cost projections ($0.4 billion) and higher projected future premium rate increase approvals ($0.2 billion), partially offset by a decline in the overall discount rate to a weighted average rate of 5.70% compared to 5.74% in 2019 ($0.2 billion). This decline in the discount rate from 2019 to 2020 reflects a lower expected reinvestment rate, due to lower benchmark interest rates in the U.S, increasing to a lower expected long-term average investment yield over a longer period and slightly lower actual yields on our investment security portfolio, partially offset by increased allocations to higher yielding asset classes introduced with our 2018 strategic initiatives, which included a modest decline in expected yield compared to 2019cash flow assumptions.
As noted above, while our observed long-term care insurance claim experience has shown some emerging modest favorable experience in the period since the 2017 reconstruction of our future claim cost projections, it remains largely in-lineSensitivities. The following table provides sensitivities with those reconstructed projections. Based on the application of professional actuarial judgmentrespect to the factors discussed above, we have made no substantial change to our assumptions concerning morbidity improvement, mortality, mortality improvement, or terminations in 2020.
As with all assumptions underlying our premium deficiency testing, we will continue to monitor these factors, which may result in future changes in our assumptions.
Since our premium deficiency testing performed in 2019, we have implemented approximately $0.3 billion of previously approved long-term care insurance premium rate increase actions and expect higher projected future premium rate increase approvals of approximately $0.2 billion. Our 2020 premium deficiency test includes approximately $1.9 billion of anticipated future premium increases or benefit reductions associated with future in-force rate actions. This represents a decrease of $0.1 billion from our 2019 premium deficiency test to account for actions that are: (a) approved and not yet implemented, (b) filed but not yet approved, and (c) estimated on future filings through 2028 and includes the effects of the lower discount rate mentioned above and longer anticipated timing to achieve certain premium rate approvals.
As a result of exposure period cut-off dates to permit experience to develop and lags in ceding company data reporting from our ceding companies, the impact of COVID-19 is not reflected in the experience studies data used in our 2020 premium deficiency testing. However, we assessed certain scenarios to understand potential impacts associated with COVID-19 and, due to the insignificance and short-term naturechanges of such uncertain future impacts, including the natural offsets from mortality in the aggregate across our run-off insurance products, concluded adjustments to our primarykey cash flow assumptions used in the premium deficiency testing were not warranted.
When results of the premium deficiency testing indicate overall reserves are sufficient, we are also required to assess whether additional future policy benefit reserves are required to be accrued over time in the future. Such an accrual would be required if profits are projected in earlier future periods followed by losses projected in later future years (i.e., profits followed by losses). When this pattern of profits followed by losses is projected, we would be required to accrue a liability in the expected profitable years by the amount necessary to offset projected losses in later future years. We noted our projections as of third quarter 2020 indicate the present value of projected earnings in each future year to be positive, and therefore, no further adjustments tounderlying our future policy benefit reserves were requiredusing the locked-in discount rate assumption and have been estimated across the entire product line rather than at this time.
GAAP Reserve Sensitivities. The resultsan individual cohort level. As our insurance operations are in run-off, the locked-in discount rate is used for the computation of our premium deficiency testing are sensitive to the assumptions described above. Considering the results of the 2020 premium deficiency test which resulted in a small margin, any future net adverse changes in our assumptions may reduce the margin or result in a premium deficiency requiring an increase tointerest accretion on future policy benefit reserves. For example, adverse changes in key assumptions related to our future policy benefits reserves, holding all other assumptions constant, would have the following effects on the projected present value of future cash flows as presented in the table below. Any future net favorable changes to these assumptions could result in a lower projected present value of future cash flows and additional margin in our premium deficiency test and higher income over the remaining duration of the portfolio, including higher investment income. The assumptions within our future policy benefit reserves are subject to significant uncertainties, including those inherent in the complex nature of our reinsurance treaties. Many of our assumptions, which are based on our credible experience, are interdependent and require evaluation individually and in the aggregate across all insurance products. Small changes in the amounts used in the sensitivities or the use of different factors could result in materially different outcomes from those reflected below. In addition, the effects of changes to cash flow assumptions underlying our future policy benefit reserves may be partially or wholly reflected in the period in which the assumptions are changed and/or over future periods and may vary across cohorts.
| | | | | | | | | | | | | | |
| 2019 assumption | 2020 assumption | Hypothetical change in 2020 assumption | Estimated increase to projected present value of future cash flows (pre-tax) |
| Long-term care insurance morbidity improvement | 1.25% per year over 12 to 20 years | 1.25% per year over 12 to 20 years | 25 basis point reduction
No morbidity improvement | $600
$3,400 |
| Long-term care insurance morbidity | Based on company experience | Based on company experience | 5% increase in dollar amount of paid claims | $1,000 |
| Long-term care insurance mortality improvement | 0.5% per year for 10 years with annual improvement graded to 0% over next 10 years | 0.5% per year for 10 years with annual improvement graded to 0% over next 10 years | 1.0% per year for 10 years with annual improvement graded to 0% over next 10 years | $400 |
| Total terminations: | | | | |
| Long-term care insurance mortality | Based on company experience | Based on company experience | Any change in termination assumptions that reduce total terminations by 10% | $1,100 |
| Long-term care insurance lapse rate | Varies by block, attained age and benefit period; average 0.5 - 1.15% | Varies by block, attained age and benefit period; average 0.5 - 1.15% |
| Long-term care insurance benefit exhaustion | Based on company experience | Based on company experience |
| Long-term care insurance future premium rate increases | Varies by block based on filing experience | Varies by block based on filing experience | 25% adverse change in premium rate increase success rate | $500 |
| Discount rate: | | | | |
| Overall discount rate | 5.74% | 5.70% | 25 basis point reduction | $900 |
| Reinvestment rate | 3.05%; grading to a long-term average investment yield of 5.9% | 2.70%; grading to a long-term average investment yield of 5.8% | 25 basis point reduction; grading to a long-term average investment yield of 5.8% | Less than $100 |
| Structured settlement annuity mortality | Based on company experience | Based on company experience | 5% decrease in mortality | $100 |
| Life insurance mortality | Based on company experience | Based on company experience | 5% increase in mortality | $300 |
| | | | | | | | |
| Assumption | Hypothetical change in 2023 assumption | Estimated adverse impact to projected present value of future cash flows (In millions, pre-tax) |
| Morbidity: | | |
| Long-term care insurance incidence rates | 5% increase in incidence rates | $600 |
| Long-term care insurance claim continuance | 5% reduction in disabled life deaths | $1,200 |
| Long-term care insurance utilization | 5% increase in utilization | $1,100 |
| Long-term care insurance morbidity improvement | 25 basis point reduction by age with 0% floor
No morbidity improvement | $300 $1,300 |
| Active life terminations: | | |
| Long-term care insurance mortality | 5% reduction in mortality | $300 |
| Long-term care insurance future premium rate increases | 25% adverse change in success rate on premium rate increase actions not yet approved | $200 |
| Life insurance mortality | 5% increase in mortality | $300 |
| Structured settlement annuity mortality | Impaired life mortality grades to standard ten years earlier | $300 |
Statutory Considerations.
While higher assumed inflation, holding all other assumptions constant, would result in unfavorable impacts to the projected present value of future cash flows in the table above, it would be expected to be mitigated by more long-term care insurance policies reaching contractual daily or monthly benefit caps and by increased investment income from higher portfolio yields.
Our run-off insurance subsidiaries are required to prepare statutory financial statements in accordance with statutory accounting practices. Statutory accounting practices not GAAP, determine the required statutory capital levels of our insurance legal entities.
Statutory accounting practices are set forth by the National Association of Insurance Commissioners (NAIC) as well as state laws, regulation and general administrative rules and can differ in certain respects from GAAP. Under statutory accounting practices, base formulaic reserve assumptions typically do not change unless approved by our primary regulator, KID. In addition to base reserves, statutory accounting practices require additional actuarial reserves (AAR) be established based on results of asset adequacy testing reflecting moderately adverse conditions (i.e., assumptions include a provision for adverse deviation (PAD) rather than current assumptions without a PAD as required for premium deficiency testing under GAAP). As aGAAP and would result our statutory asset adequacy testing assumptions reflect less long-term care insurance morbidity improvement and for shorter durations, restrictions on future long-term care insurance premium rate increases, no life insurance mortality improvement and a lower discount rate, among other differences. As a result,in several of the sensitivities described in the table above would bebeing less impactful on our statutory reserves.
The adverse impact onSee Capital Resources and Liquidity and Notes 1, 3 and 12 for further information related to our statutory AAR arising from our revised assumptions in 2017, including the collectability of reinsurance recoverables, is expected to require GE Capital to contribute approximately $14.5 billion additional capital, to its run-off insurance operationsoperations.
PARENT COMPANY CREDIT SUPPORT. To support GE Vernova in 2018-2024.selling products and services globally, GE often enters into contracts on behalf of GE Vernova or issues parent company guarantees or trade finance instruments supporting the performance of what currently are subsidiary legal entities transacting directly with customers, in addition to providing similar credit support for non-customer related activities of GE Vernova (collectively, “GE credit support”). In preparation for the spin-off, we are working to seek novation or assignment of GE credit support, the majority of which relates to parent company guarantees, associated with GE Vernova legal entities from GE to GE Vernova. For statutory accounting purposes, KID approved our request forGE credit support that remains outstanding at the spin-off, GE Vernova will be obligated to use reasonable best efforts to terminate or replace, and obtain a permitted accounting practicefull release of GE’s obligations and liabilities under, all such credit support. Beginning in 2025, GE Vernova will pay a quarterly fee to recognizeGE based on amounts related to the 2017 AAR increase over a seven-year period. GE Capital provided capital contributions to its insurance subsidiaries of $2.0 billion, $1.9 billioncredit support. GE Vernova will face other contractual restrictions and $3.5 billion in the first quarter of 2020, 2019 and 2018, respectively.requirements while GE Capital expects to provide further capital contributions of approximately $7 billion through 2024 (of which approximately $2.0 billion is expectedcontinues to be contributed inobligated under such credit support on behalf of GE Vernova. While GE will remain obligated under the first quarter of 2021, pending completion of our December 31, 2020 statutory reporting process, which includes asset adequacy testing), subjectcontract or instrument, GE Vernova will be obligated to ongoing monitoring by KID.indemnify GE is a party to capital maintenance agreements with ERAC and UFLIC under whichfor credit support related payments that GE is required to maintain their minimum statutory capital levels at 300% of their year-end Authorized Control Level risk-based capital requirements as defined from time to time by the NAIC.
Upon separation, we expect GE Vernova RPO and other obligations that relate to GE credit support to be approximately $65 billion, of which approximately $33 billion and $32 billion relate to our Power and Renewable Energy segments, respectively, and approximately $20 billion of the total relates to long-term and other service agreements. Of the Power and Renewable Energy amounts, $15 billion for both segments, respectively, are expected to contractually mature within five years. GE’s maximum aggregate exposure under the GE credit support cannot be reasonably estimated given the breadth of the portfolio across each of the GE Vernova businesses. The underlying obligations are predominantly customer contracts that GE Vernova performs in the course of its business. We have no known instances historically where payments or performance from GE were required under parent company guarantees relating to GE Vernova customer contracts. The fair value of GE Vernova’s obligation to indemnify GE post spin-off is not expected to be significant primarily due to the low probability of loss.
GE 20202023 FORM 10-K38 22
If our future policy benefit reserves established under GAAP are realized over the estimated remaining life of our run-off insurance obligations, we would expect the $14.5 billion of capital contributed to the run-off insurance operations over the 2018 to 2024 period to be considered statutory capital surplus at the end of the estimated remaining life with no additional charge to GAAP earnings. However, should the more conservative statutory assumptions be realized, we would be required to record the difference between GAAP assumptions and statutory assumptions as a charge to GAAP earnings in the future periods.
See Other Items - New Accounting Standards and Notes 1 and 12 for further information.
NEW ACCOUNTING STANDARDS.The In November of 2023, the Financial Accounting Standards Board (FASB) issued ASU No. 2018-12,2023-07, Financial Services - InsuranceSegment Reporting (Topic 944)280): Targeted Improvements to the AccountingReportable Segment Disclosures. The amendments are intended to increase reportable segment disclosure requirements primarily through enhanced disclosures about significant segment expenses. The ASU is effective on a retrospective basis for Long-Duration Contracts with an effective date for periodsfiscal years beginning after December 31, 2021, with an election to adopt early. On November 5, 2020,15, 2023, and interim periods within fiscal years beginning after December 15, 2024. We are currently evaluating the impact of this guidance on the disclosures within our consolidated financial statements.
In December 2023, the FASB issued ASU 2020-11,No. 2023-09, Financial Services - InsuranceIncome Taxes (Topic 944)740): Improvements to Income Tax Disclosures: Effective Date. The amendments require disclosure of specific categories in the rate reconciliation and Early Application which defers theprovide additional information for reconciling items that meet a quantitative threshold and further disaggregation of income taxes paid for individually significant jurisdictions. The ASU is effective date for all insurance entities by one year and allows thefiscal years beginning after December 15, 2024, with early application transition date to be either the beginning of the prior period or the earliest prior period presented.adoption permitted. We are currently evaluating the effect ofimpact that this guidance will have on the standard ondisclosures within our consolidated financial statements and anticipate that its adoption will significantly change the accounting for measurements of our long-duration insurance liabilities. The ASU requires cash flow assumptions used in the measurement of various insurance liabilities to be reviewed at least annually and updated if actual experience or other evidence indicates previous assumptions need to be revised with any required changes recorded in earnings. Under the current accounting guidance, the discount rate is based on expected investment yields, while under the ASU the discount rate will be equivalent to the upper-medium grade (i.e., single A) fixed-income instrument yield reflecting the duration characteristics of the liability and is required to be updated in each reporting period with changes recorded in other comprehensive income. In measuring the insurance liabilities under the new standard, contracts shall not be grouped together from different issue years. These changes result in the elimination of premium deficiency testing and shadow adjustments. While we continue to evaluate the effect of the standard on our ongoing financial reporting, we anticipate that the adoption of the ASU will materially affect our financial statements. As the ASU is only applicable to the measurements of our long-duration insurance liabilities under GAAP, it will not affect the accounting for our insurance reserves or the levels of capital and surplus under statutory accounting practices.
NON-GAAP FINANCIAL MEASURES. We believe that presenting non-GAAP financial measures provides management and investors useful measures to evaluate performance and trends of the total company and its businesses. This includes adjustments in recent periods to GAAP financial measures to increase period-to-period comparability following actions to strengthen our overall financial position and how we manage our business.
In addition, management recognizes that certain non-GAAP terms may be interpreted differently by other companies under different circumstances. In various sections of this report we have made reference to the following non-GAAP financial measures in describing our (1) revenues, specifically GE Industrial organic revenues by segment; BioPharma organic revenues, GE Industrial organic revenues,revenues; and GE Industrial equipment and services organic revenues and (2) profit, specifically GE Industrial organic profit and profit margin by segment; BioPharma organicAdjusted profit and profit margin,margin; Adjusted GE Industrial profit and profit margin (excluding certain items); Adjusted GE Industrial organic profit and profit margin; Adjusted earnings (loss); Adjusted income tax rate; and Adjusted earnings (loss) per share (EPS), and (3) debt balances, specifically GE Industrial net debt.. The reasons we use these non-GAAP financial measures and the reconciliations to their most directly comparable GAAP financial measures follow.
| | | | | | | | | | | | | | | | | | | | | | | | | | | | | | | | | | | |
| GE INDUSTRIAL ORGANIC REVENUES, PROFIT (LOSS) AND PROFIT MARGIN BY SEGMENT (NON-GAAP) |
| Revenues | | Segment profit (loss) | | Profit margin |
| 2020 | 2019 | V% | | 2020 | 2019 | V% | | 2020 | 2019 | V pts |
| Power (GAAP) | $ | 17,589 | | $ | 18,625 | | (6) | % | | $ | 274 | | $ | 291 | | (6) | % | | 1.6 | % | 1.6 | % | —pts |
| Less: acquisitions | 19 | | 19 | | | | (3) | | (2) | | | | | | |
| Less: business dispositions | 15 | | 104 | | | | 2 | | 7 | | | | | | |
| Less: foreign currency effect | (64) | | — | | | | 10 | | — | | | | | | |
| Power organic (Non-GAAP) | $ | 17,619 | | $ | 18,502 | | (5) | % | | $ | 266 | | $ | 287 | | (7) | % | | 1.5 | % | 1.6 | % | (0.1)pts |
| Renewable Energy (GAAP) | $ | 15,666 | | $ | 15,337 | | 2 | % | | $ | (715) | | $ | (791) | | 10 | % | | (4.6) | % | (5.2) | % | 0.6pts |
| Less: acquisitions | — | | — | | | | — | | — | | | | | | |
| Less: business dispositions | 8 | | 94 | | | | — | | (11) | | | | | | |
| Less: foreign currency effect | (167) | | — | | | | 16 | | — | | | | | | |
Renewable Energy
organic (Non-GAAP) | $ | 15,824 | | $ | 15,243 | | 4 | % | | $ | (731) | | $ | (781) | | 6 | % | | (4.6) | % | (5.1) | % | 0.5pts |
| Aviation (GAAP) | $ | 22,042 | | $ | 32,875 | | (33) | % | | $ | 1,229 | | $ | 6,812 | | (82) | % | | 5.6 | % | 20.7 | % | (15.1)pts |
| Less: acquisitions | — | | — | | | | — | | — | | | | | | |
| Less: business dispositions | 13 | | 369 | | | | (2) | | (2) | | | | | | |
| Less: foreign currency effect | (3) | | — | | | | (5) | | — | | | | | | |
| Aviation organic (Non-GAAP) | $ | 22,032 | | $ | 32,506 | | (32) | % | | $ | 1,237 | | $ | 6,814 | | (82) | % | | 5.6 | % | 21.0 | % | (15.4)pts |
| Healthcare (GAAP) | $ | 18,009 | | $ | 19,942 | | (10) | % | | $ | 3,060 | | $ | 3,737 | | (18) | % | | 17.0 | % | 18.7 | % | (1.7)pts |
| Less: acquisitions | 55 | | 21 | | | | (13) | | (4) | | | | | | |
| Less: business dispositions | 21 | | 2,603 | | | | (2) | | 1,111 | | | | | | |
| Less: foreign currency effect | (46) | | — | | | | (6) | | — | | | | | | |
| Healthcare organic (Non-GAAP) | $ | 17,979 | | $ | 17,318 | | 4 | % | | $ | 3,081 | | $ | 2,630 | | 17 | % | | 17.1 | % | 15.2 | % | 1.9pts |
| Less: BioPharma organic (Non-GAAP) | 839 | | 762 | | | | 380 | | 311 | | | | | | |
| Healthcare excluding BioPharma organic (Non-GAAP) | $ | 17,140 | | $ | 16,557 | | 4 | % | | $ | 2,701 | | $ | 2,319 | | 16 | % | | 15.8 | % | 14.0 | % | 1.8pts |
| | | | | | | | | | | |
|
|
| We believe these measures provide management and investors with a more complete understanding of underlying operating results and trends of established, ongoing operations by excluding the effect of acquisitions, dispositions and foreign currency, as these activities can obscure underlying trends. We also believe presenting organic revenues* and organic profit* separately for our industrial businesses provides management and investors with useful information about the trends of our industrial businesses and enables a more direct comparison to other non-financial companies. |
|
| | | | | | | | | | | | | | | | | | | | | | | | | | | | | | | | | | | |
| BIOPHARMA ORGANIC REVENUES, PROFIT (LOSS) AND PROFIT MARGIN (NON-GAAP) |
| Revenues | | Segment profit (loss) | | Profit margin |
| 2020 | 2019 | V% | | 2020 | 2019 | V% | | 2020 | 2019 | V pts |
| BioPharma (GAAP) | $ | 830 | | $ | 3,289 | | (75) | % | | $ | 382 | | $ | 1,472 | | (74) | % | | 46.0 | % | 44.8 | % | 1.2 | pts |
| Less: acquisitions | — | | — | | | | — | | — | | | | | | |
| Less: business dispositions | — | | 2,527 | | | | — | | 1,161 | | | | | | |
| Less: foreign currency effect | $ | (9) | | — | | | | $ | 2 | | — | | | | | | |
| BioPharma organic (Non-GAAP) | $ | 839 | | $ | 762 | | 10 | % | | $ | 380 | | $ | 311 | | 22 | % | | 45.3 | % | 40.8 | % | 4.5 | pts |
| | | | | | | | | | | |
| GE INDUSTRIAL ORGANIC REVENUES (NON-GAAP) | 2020 | 2019 | V% |
| GE Industrial total revenues (GAAP) | $ | 73,100 | | $ | 87,719 | | (17) | % |
| Adjustments: | | | |
| Less: acquisitions | 138 | | 37 | | |
| Less: business dispositions(a) | 58 | | 3,631 | | |
| Less: foreign currency effect(b) | (276) | | — | | |
| GE Industrial organic revenues (Non-GAAP) | $ | 73,180 | | $ | 84,051 | | (13) | % |
| | | |
| | | |
| | | |
| | | |
| | | |
| | | |
| | | |
| | | |
| | | |
| (a) Dispositions impact in 2019 primarily related to our BioPharma business within our Healthcare segment, with revenues of $2,527 million, Lighting with revenues of $299 million, and Hamble Aerostructures within our Aviation segment, with revenues of $203 million. |
| (b) Primarily the Brazilian real, euro and Indian rupee. |
|
|
| We believe these measures provide management and investors with a more complete understanding of underlying operating results and trends of established, ongoing operations by excluding the effect of acquisitions, dispositions and foreign currency, as these activities can obscure underlying trends. |
| | | | | | | | | | | | | | | | | | | | | | | | | | | | | | | | | | | | | | | | | | | | | | | | | | |
| ORGANIC REVENUES, PROFIT (LOSS) AND PROFIT MARGIN BY SEGMENT (NON-GAAP) |
| Revenues | | Segment profit (loss) | | Profit margin |
| 2023 | | 2022 | | V% | | 2023 | | 2022 | | V% | | 2023 | | 2022 | V pts |
| Aerospace (GAAP) | $ | 31,770 | | | $ | 26,050 | | | 22 | % | | $ | 6,115 | | | $ | 4,775 | | | 28 | % | | 19.2 | % | | 18.3 | % | 0.9pts |
| | | | | | | | | | | | | | | | |
| | | | | | | | | | | | | | | | |
| Less: acquisitions and business dispositions | — | | | — | | | | | — | | | — | | | | | | | | |
| Less: foreign currency effect | 15 | | | (18) | | | | | 78 | | | (38) | | | | | | | | |
| Aerospace organic (Non-GAAP) | $ | 31,755 | | | $ | 26,067 | | | 22 | % | | $ | 6,037 | | | $ | 4,813 | | | 25 | % | | 19.0 | % | | 18.5 | % | 0.5pts |
| | | | | | | | | | | | | | | | |
| Renewable Energy (GAAP) | $ | 15,050 | | | $ | 12,977 | | | 16 | % | | $ | (1,437) | | | $ | (2,240) | | | 36 | % | | (9.5) | % | | (17.3) | % | 7.8pts |
| | | | | | | | | | | | | | | | |
| | | | | | | | | | | | | | | | |
| Less: acquisitions and business dispositions | — | | | — | | | | | — | | | — | | | | | | | | |
| Less: foreign currency effect | (6) | | | 57 | | | | | (200) | | | 5 | | | | | | | | |
| Renewable Energy organic (Non-GAAP) | $ | 15,056 | | | $ | 12,920 | | | 17 | % | | $ | (1,237) | | | $ | (2,245) | | | 45 | % | | (8.2) | % | | (17.4) | % | 9.2pts |
| | | | | | | | | | | | | | | | |
| Power (GAAP) | $ | 17,731 | | | $ | 16,262 | | | 9 | % | | $ | 1,449 | | | $ | 1,217 | | | 19 | % | | 8.2 | % | | 7.5 | % | 0.7pts |
| | | | | | | | | | | | | | | | |
| | | | | | | | | | | | | | | | |
| Less: acquisitions and business dispositions | 152 | | | — | | | | | 21 | | | — | | | | | | | | |
| Less: foreign currency effect | 65 | | | (48) | | | | | (74) | | | (152) | | | | | | | | |
| Power organic (Non-GAAP) | $ | 17,514 | | | $ | 16,310 | | | 7 | % | | $ | 1,503 | | | $ | 1,369 | | | 10 | % | | 8.6 | % | | 8.4 | % | 0.2pts |
| We believe these measures provide management and investors with a more complete understanding of underlying operating results and trends of established, ongoing operations by excluding the effect of acquisitions, dispositions and foreign currency, which includes translational and transactional impacts, as these activities can obscure underlying trends. |
| | | | | | | | | | | | | | | | | | | |
| | | | | | | |
| ORGANIC REVENUES (NON-GAAP) | | | | | 2023 | 2022 | V% | | | | |
| Total revenues (GAAP) | | | | | $ | 67,954 | | $ | 58,100 | | 17 | % | | | | |
| Less: Insurance revenues (Note 12) | | | | | 3,389 | | 2,957 | | | | | | |
| Adjusted revenues (Non-GAAP) | | | | | $ | 64,565 | | $ | 55,143 | | 17 | % | | | | |
| | | | | | | | | | | |
| | | | | | | | | | | |
| Less: acquisitions and business dispositions | | | | | 155 | | 1 | | | | | | |
| Less: foreign currency effect(a) | | | | | 74 | | (8) | | | | | | |
| Organic revenues (Non-GAAP) | | | | | $ | 64,336 | | $ | 55,150 | | 17 | % | | | | |
| | | | | | | | | | | |
| (a) Foreign currency impact was primarily driven by U.S. dollar depreciation against the euro, Brazilian real and Mexican peso for the year ended December 31, 2023. |
| We believe these measures provide management and investors with a more complete understanding of underlying operating results and trends of established, ongoing operations by excluding the effect of revenues from our run-off Insurance operations, acquisitions, dispositions and foreign currency, which includes translational and transactional impacts, as these activities can obscure underlying trends. |
| | | | | | | | | | | | | | | | | | | |
| | | | | |
| EQUIPMENT AND SERVICES ORGANIC REVENUES (NON-GAAP) | | | | | 2023 | 2022 | V% | | | | |
| Total equipment revenues (GAAP) | | | | | $ | 26,793 | | $ | 22,334 | | 20 | % | | | | |
| | | | | | | | | | | |
| | | | | | | | | | | |
| Less: acquisitions and business dispositions | | | | | 64 | | — | | | | | | |
| Less: foreign currency effect | | | | | 62 | | 7 | | | | | | |
| Equipment organic revenues (Non-GAAP) | | | | | $ | 26,667 | | $ | 22,327 | | 19 | % | | | | |
| | | | | | | | | | | |
| Total services revenues (GAAP) | | | | | $ | 37,772 | | $ | 32,808 | | 15 | % | | | | |
| | | | | | | | | | | |
| | | | | | | | | | | |
| Less: acquisitions and business dispositions | | | | | 91 | | 1 | | | | | | |
| Less: foreign currency effect | | | | | 12 | | (15) | | | | | | |
| Services organic revenues (Non-GAAP) | | | | | $ | 37,669 | | $ | 32,823 | | 15 | % | | | | |
| We believe these measures provide management and investors with a more complete understanding of underlying operating results and trends of established, ongoing operations by excluding the effect of acquisitions, dispositions and foreign currency, which includes translational and transactional impacts, as these activities can obscure underlying trends. |
| | | | | | | | | | | | | | |
| | | | |
| ADJUSTED PROFIT AND PROFIT MARGIN (NON-GAAP) | | | | | 2023 | 2022 | | |
| Total revenues (GAAP) | | | | | $ | 67,954 | $ | 58,100 | | |
| Less: Insurance revenues (Note 12) | | | | | 3,389 | 2,957 | | |
| Adjusted revenues (Non-GAAP) | | | | | $ | 64,565 | $ | 55,143 | | |
| | | | | | | | |
| Total costs and expenses (GAAP) | | | | | $ | 64,891 | $ | 60,071 | | |
| Less: Insurance cost and expenses (Note 12) | | | | | 3,057 | 2,753 | | |
| Less: interest and other financial charges(a) | | | | | 1,073 | 1,423 | | |
| Less: non-operating benefit cost (income) | | | | | (1,585) | (409) | | |
| Less: restructuring & other(a) | | | | | 679 | 836 | | |
| Less: debt extinguishment costs(a) | | | | | — | 465 | | |
| Less: separation costs(a) | | | | | 978 | 715 | | |
| Less: Steam asset sale impairment(a) | | | | | — | 824 | | |
| Less: Russia and Ukraine charges(a) | | | | | 190 | 263 | | |
| | | | | | | | |
| | | | | | | | |
| Add: noncontrolling interests | | | | | (38) | 16 | | |
| Add: EFS benefit from taxes | | | | | (195) | (213) | | |
| Adjusted costs (Non-GAAP) | | | | | $ | 60,268 | $ | 53,004 | | |
| | | | | | | | |
| Other income (loss) (GAAP) | | | | | $ | 7,129 | $ | 1,172 | | |
| Less: gains (losses) on retained and sold ownership interests and other equity securities(a) | | | | | 5,773 | 76 | | |
| Less: restructuring & other(a) | | | | | — | 31 | | |
| Less: gains (losses) on purchases and sales of business interests(a) | | | | | (9) | 45 | | |
| | | | | | | | |
| Adjusted other income (loss) (Non-GAAP) | | | | | $ | 1,365 | $ | 1,020 | | |
| | | | | | | | |
| Profit (loss) (GAAP) | | | | | $ | 10,191 | $ | (799) | | |
| Profit (loss) margin (GAAP) | | | | | 15.0% | (1.4)% | | |
| | | | | | | | |
| Adjusted profit (loss) (Non-GAAP) | | | | | $ | 5,662 | $ | 3,159 | | |
| Adjusted profit (loss) margin (Non-GAAP) | | | | | 8.8% | 5.7% | | |
| | | | | | | | |
| (a) See the Corporate and Other Consolidated Information sections for further information. | |
| We believe that adjusting profit to exclude the effects of items that are not closely associated with ongoing operations provides management and investors with a meaningful measure that increases the period-to-period comparability. Gains (losses) and restructuring and other items are impacted by the timing and magnitude of gains associated with dispositions, and the timing and magnitude of costs associated with restructuring and other activities. |
| | | | | | | | | | | | | | | | | | | |
| | | | | | | |
| ADJUSTED ORGANIC PROFIT (NON-GAAP) | | | | | 2023 | 2022 | V% | | | | |
| Adjusted profit (loss) (Non-GAAP) | | | | | $ | 5,662 | | $ | 3,159 | | 79 | % | | | | |
| | | | | | | | | | | |
| | | | | | | | | | | |
| Less: acquisitions and business dispositions | | | | | 12 | | (5) | | | | | | |
| Less: foreign currency effect(a) | | | | | (294) | | (189) | | | | | | |
| Adjusted organic profit (loss) (Non-GAAP) | | | | | $ | 5,944 | | $ | 3,353 | | 77 | % | | | | |
| | | | | | | | | | | |
| Adjusted profit (loss) margin (Non-GAAP) | | | | | 8.8 | % | 5.7 | % | 3.1 | pts | | | | |
| Adjusted organic profit (loss) margin (Non-GAAP) | | | | | 9.2 | % | 6.1 | % | 3.1 | pts | | | | |
| | | | | | | | | | | |
| (a) Included foreign currency positive effect on revenues of $74 million and negative effect on operating costs and other income (loss) of $368 million for the year ended December 31, 2023. |
| We believe these measures provide management and investors with a more complete understanding of underlying operating results and trends of established, ongoing operations by excluding the effect of acquisitions, dispositions and foreign currency, which includes translational and transactional impacts, as these activities can obscure underlying trends. |
| | | | | | | | | | | | | | | | | | | | | |
| | | | | |
| ADJUSTED EARNINGS (LOSS) AND ADJUSTED INCOME TAX RATE (NON-GAAP) | | | | 2023 | 2022 | |
| (Per-share amounts in dollars) | | | | | | Earnings | EPS | Earnings | EPS | | |
| Earnings (loss) from continuing operations (GAAP) (Note 18) | | | | | | $ | 8,769 | $ | 7.98 | $ | (1,097) | $ | (1.00) | | |
| Insurance earnings (loss) (pre-tax) | | | | | | 334 | 0.30 | 210 | 0.19 | | |
| Tax effect on Insurance earnings (loss) | | | | | | (74) | (0.07) | (52) | (0.05) | | |
| Less: Insurance earnings (loss) (net of tax) (Note 12) | | | | | | 260 | 0.24 | 159 | 0.15 | | |
| Earnings (loss) excluding Insurance (Non-GAAP) | | | | | | $ | 8,509 | $ | 7.74 | $ | (1,255) | $ | (1.15) | | |
| Non-operating benefit (cost) income (pre-tax) (GAAP) | | | | | | 1,585 | 1.44 | 409 | 0.37 | | |
| Tax effect on non-operating benefit (cost) income | | | | | | (333) | (0.30) | (86) | (0.08) | | |
| Less: Non-operating benefit (cost) income (net of tax) | | | | | | 1,252 | 1.14 | 323 | 0.30 | | |
| Gains (losses) on purchases and sales of business interests (pre-tax)(a) | | | | | | (9) | (0.01) | 45 | 0.04 | | |
| Tax effect on gains (losses) on purchases and sales of business interests | | | | | | (24) | (0.02) | 57 | 0.05 | | |
| Less: Gains (losses) on purchases and sales of business interests (net of tax) | | | | | | (32) | (0.03) | 102 | 0.09 | | |
| Gains (losses) on retained and sold ownership interests and other equity securities (pre-tax)(a) | | | | | | 5,773 | 5.25 | 76 | 0.07 | | |
| Tax effect on gains (losses) on retained and sold ownership interests and other equity securities(b)(c) | | | | | | 1 | — | (17) | (0.02) | | |
| Less: Gains (losses) on retained and sold ownership interests and other equity securities (net of tax) | | | | | | 5,774 | 5.26 | 58 | 0.05 | | |
| Restructuring & other (pre-tax)(a) | | | | | | (679) | (0.62) | (806) | (0.74) | | |
| Tax effect on restructuring & other | | | | | | 143 | 0.13 | 176 | 0.16 | | |
| Less: Restructuring & other (net of tax) | | | | | | (536) | (0.49) | (630) | (0.58) | | |
| Debt extinguishment costs (pre-tax)(a) | | | | | | — | — | (465) | (0.42) | | |
| Tax effect on debt extinguishment costs | | | | | | — | — | 68 | 0.06 | | |
| Less: Debt extinguishment costs (net of tax) | | | | | | — | — | (397) | (0.36) | | |
| Separation costs (pre-tax)(a) | | | | | | (978) | (0.89) | (715) | (0.65) | | |
| Tax effect on separation costs | | | | | | 197 | 0.18 | 23 | 0.02 | | |
| Less: Separation costs (net of tax) | | | | | | (781) | (0.71) | (692) | (0.63) | | |
| Steam asset sale impairment (pre-tax)(a) | | | | | | — | — | (824) | (0.75) | | |
| Tax effect on Steam asset sale impairment | | | | | | — | — | 84 | 0.08 | | |
| Less: Steam asset sale impairment (net of tax) | | | | | | — | — | (740) | (0.68) | | |
| Russia and Ukraine charges (pre-tax)(a) | | | | | | (190) | (0.17) | (263) | (0.24) | | |
| Tax effect on Russia and Ukraine charges | | | | | | (5) | — | 15 | 0.01 | | |
| Less: Russia and Ukraine charges (net of tax) | | | | | | (195) | (0.18) | (248) | (0.23) | | |
| | | | | | | | | | | |
| | | | | | | | | | | |
| | | | | | | | | | | |
| | | | | | | | | | | |
| | | | | | | | | | | |
| | | | | | | | | | | |
| Less: Excise tax and accretion of preferred share redemption | | | | | | (58) | (0.05) | 4 | — | | |
| Less: U.S. and foreign tax law change enactment | | | | | | — | — | 126 | 0.11 | | |
| | | | | | | | | | | |
| | | | | | | | | | | |
| | | | | | | | | | | |
| Adjusted earnings (loss) (Non-GAAP) | | | | | | $ | 3,085 | $ | 2.81 | $ | 839 | $ | 0.77 | | |
| | | | | | | | | | | |
| Earnings (loss) from continuing operations before taxes (GAAP) | | | | | | $ | 10,191 | | | $ | (799) | | | |
| Less: Total adjustments above (pre-tax) | | | | | | 5,836 | | | (2,332) | | | |
| Adjusted earnings before taxes (Non-GAAP) | | | | | | $ | 4,355 | | | $ | 1,534 | | | |
| | | | | | | | | | | |
| Provision (benefit) for income taxes (GAAP) | | | | | | $ | 1,162 | | $ | (3) | | | |
| Less: Tax effect on adjustments above | | | | | | 95 | | (393) | | | |
| Adjusted provision (benefit) for income taxes (Non-GAAP) | | | | | | $ | 1,067 | | $ | 389 | | | |
| | | | | | | | | | | |
| Income tax rate (GAAP) | | | | | | 11.4% | | 0.4% | | | |
| Adjusted income tax rate (Non-GAAP) | | | | | | 24.5% | | 25.4% | | | |
| | | | | | | | | | | |
| (a) See the Corporate and Other Consolidated Information sections for further information. |
| (b) Includes tax benefits available to offset the tax on gains (losses) on equity securities. |
| (c) Includes related tax valuation allowances. |
| | | | | | | | | | | |
| Earnings per share amounts are computed independently. As a result, the sum of per-share amounts may not equal the total. |
| The service cost for our pension and other benefit plans are included in Adjusted earnings*, which represents the ongoing cost of providing pension benefits to our employees. The components of non-operating benefit costs are mainly driven by capital allocation decisions and market performance. We believe the retained cost in Adjusted earnings* and the Adjusted tax rate* provides management and investors a useful measure to evaluate the performance of the total company and increases period-to-period comparability. We also use Adjusted EPS* as a performance metric at the company level for our annual executive incentive plan for 2023. |
*Non-GAAP Financial Measure
GE 20202023 FORM 10-K40 25
| | | | | | | | | | | |
| GE INDUSTRIAL EQUIPMENT ORGANIC REVENUES (NON-GAAP) | 2020 | 2019 | V% |
| GE Industrial total equipment revenues (GAAP) | $ | 37,620 | | $ | 43,080 | | (13) | % |
| Adjustments: | | | |
| Less: acquisitions | 13 | | 14 | | |
| Less: business dispositions | 19 | | 3,193 | | |
| Less: foreign currency effect | (174) | | — | | |
| GE Industrial equipment organic revenues (Non-GAAP) | $ | 37,761 | | $ | 39,873 | | (5) | % |
| | | |
| | | |
| | | |
| | | |
| | | |
| | | |
| | | |
| | | |
| | | | | | | | | | | |
| GE INDUSTRIAL SERVICES ORGANIC REVENUES (NON-GAAP) | 2020 | 2019 | V% |
| GE Industrial total services revenues (GAAP) | $ | 35,480 | | $ | 44,639 | | (21) | % |
| Adjustments: | | | |
| Less: acquisitions | 125 | | 23 | | |
| Less: business dispositions | 39 | | 438 | | |
| Less: foreign currency effect | (102) | | — | | |
| GE Industrial services organic revenues (Non-GAAP) | $ | 35,419 | | $ | 44,178 | | (20) | % |
| | | |
| | | |
| | | |
| | | |
| | | |
| | | |
| | | |
| | | |
| | | |
| We believe this measure provides management and investors with a more complete understanding of underlying operating results and trends of established, ongoing operations by excluding the effect of acquisitions, dispositions and foreign currency, as these activities can obscure underlying trends. |
| | | | | | | | | |
| ADJUSTED GE INDUSTRIAL PROFIT AND PROFIT MARGIN | 2020 | 2019 | |
| GE Industrial total revenues (GAAP) | $ | 73,100 | | $ | 87,719 | | |
| | | |
| GE Industrial total costs and expenses (GAAP) | 77,252 | | 88,118 | | |
| Less: GE Industrial interest and other financial charges | 1,333 | | 2,115 | | |
| Less: non-operating benefit costs | 2,424 | | 2,828 | | |
| Less: restructuring & other(a) | 693 | | 922 | | |
| Less: Steam asset impairments(a) | 363 | | — | | |
| Less: SEC settlement charge(a) | 100 | | — | | |
| Less: goodwill impairments(a) | 728 | | 1,486 | | |
| Add: noncontrolling interests | (161) | | 6 | | |
| Adjusted GE Industrial costs (Non-GAAP) | 71,450 | | 80,773 | | |
| | | |
| GE Industrial other income (GAAP) | 11,444 | | 2,200 | | |
| Less: unrealized gains (losses)(a) | (1,911) | | 793 | | |
| Less: restructuring & other(a) | 13 | | 36 | | |
| Less: gains (losses) and impairments for disposed or held for sale businesses(a) | 12,472 | | 4 | | |
| Adjusted GE Industrial other income (Non-GAAP) | 871 | | 1,367 | | |
| | | |
| GE Industrial profit (GAAP) | $ | 7,291 | | $ | 1,801 | | |
| GE Industrial profit margin (GAAP) | 10.0 | % | 2.1 | % | |
| | | |
| Adjusted GE Industrial profit (Non-GAAP) | $ | 2,520 | | $ | 8,313 | | |
| Adjusted GE Industrial profit margin (Non-GAAP) | 3.4 | % | 9.5 | % | |
| | | |
| (a) See the Corporate Items and Eliminations section for further information. |
| We believe GE Industrial profit and profit margins adjusted for the items included in the above reconciliation are meaningful measures because they increase the comparability of period-to-period results. |
| | | | | | | | | | | |
| ADJUSTED GE INDUSTRIAL ORGANIC PROFIT (NON-GAAP) | 2020 | 2019 | V% |
| Adjusted GE Industrial profit (Non-GAAP) | $ | 2,520 | | $ | 8,313 | | (70) | % |
| Adjustments: | | | |
| Less: acquisitions | (4) | | 6 | | |
| Less: business dispositions | (3) | | 1,064 | | |
| Less: foreign currency effect | 22 | | — | | |
| Adjusted GE Industrial organic profit (Non-GAAP) | $ | 2,505 | | $ | 7,244 | | (65) | % |
| | | |
| Adjusted GE Industrial profit margin (Non-GAAP) | 3.4 | % | 9.5 | % | (6.1) | pts |
| Adjusted GE Industrial organic profit margin (Non-GAAP) | 3.4 | % | 8.6 | % | (5.2) | pts |
| | | |
| | | |
| | | |
| | | |
| | | |
| | | |
| | | |
| | | |
| | | |
| | | |
| | | |
| | | |
| We believe this measure provides management and investors with a more complete understanding of underlying operating results and trends of established, ongoing operations by excluding the effect of acquisitions, dispositions and foreign currency, as these activities can obscure underlying trends. |
| | | | | | | | | | | | | | | | |
| ADJUSTED EARNINGS (LOSS) AND ADJUSTED EPS | 2020 | 2019 | |
(NON-GAAP) (Per-share amounts in dollars) | Earnings | EPS | Earnings | EPS | | |
Consolidated earnings (loss) from continuing operations
attributable to GE common shareholders (GAAP)(a) | $ | 5,342 | | $ | 0.61 | | $ | (45) | | $ | (0.01) | | | |
| Add: Accretion of redeemable noncontrolling interests (RNCI) | (151) | | (0.02) | | — | | — | | | |
Less: GE Capital earnings (loss) from continuing operations
attributable to GE common shareholders (GAAP) | (1,710) | | (0.20) | | (530) | | (0.06) | | | |
| GE Industrial earnings (loss) (Non-GAAP) | 6,901 | | 0.79 | | 485 | | 0.06 | | | |
| Non-operating benefits costs (pre-tax) (GAAP) | (2,424) | | (0.28) | | (2,828) | | (0.32) | | | |
| Tax effect on non-operating benefit costs | 509 | | 0.06 | | 594 | | 0.07 | | | |
| Less: non-operating benefit costs (net of tax) | (1,915) | | (0.22) | | (2,234) | | (0.26) | | | |
| Gains (losses) and impairments for disposed or held for sale businesses (pre-tax)(b) | 12,472 | | 1.42 | | 4 | | — | | | |
| Tax effect on gains (losses) and impairments for disposed or held for sale businesses | (1,080) | | (0.12) | | 34 | | — | | | |
| Less: gains (losses) and impairments for disposed or held for sale businesses (net of tax) | 11,392 | | 1.30 | | 39 | | — | | | |
| Restructuring & other (pre-tax)(b) | (680) | | (0.08) | | (886) | | (0.10) | | | |
| Tax effect on restructuring & other | 151 | | 0.02 | | 187 | | 0.02 | | | |
| Less: restructuring & other (net of tax) | (529) | | (0.06) | | (699) | | (0.08) | | | |
| Less: SEC settlement charge (pre-tax and net of tax) | (100) | | (0.01) | | — | | — | | | |
| Steam asset impairments (pre-tax)(b) | (363) | | (0.04) | | — | | — | | | |
| Tax effect on Steam asset impairments | 37 | | — | | — | | — | | | |
| Less: Steam asset impairments (net of tax) | (326) | | (0.04) | | — | | — | | | |
| Goodwill impairments (pre-tax)(b) | (728) | | (0.08) | | (1,486) | | (0.17) | | | |
| Tax effect on goodwill impairments | (23) | | — | | (55) | | (0.01) | | | |
| Less: goodwill impairments (net of tax) | (751) | | (0.09) | | (1,541) | | (0.18) | | | |
| Unrealized gains (losses) (pre-tax)(b) | (1,911) | | (0.22) | | 793 | | 0.09 | | | |
| Tax effect on unrealized gains (losses) | 460 | | 0.05 | | (114) | | (0.01) | | | |
| Less: unrealized gains (losses) (net of tax) | (1,451) | | (0.17) | | 679 | | 0.08 | | | |
| Debt extinguishment costs (pre-tax) | (63) | | (0.01) | | (255) | | (0.03) | | | |
| Tax effect on debt extinguishment costs | 13 | | — | | 53 | | 0.01 | | | |
| Less: Debt extinguishment costs (net of tax) | (50) | | (0.01) | | (201) | | (0.02) | | | |
| BioPharma deal expense (pre-tax) | — | | — | | — | | — | | | |
| Tax on BioPharma deal expense | — | | — | | (647) | | (0.07) | | | |
| Less: BioPharma deal expense (net of tax) | — | | — | | (647) | | (0.07) | | | |
| Accretion of RNCI (pre-tax) | (151) | | (0.02) | | — | | — | | | |
| Tax effect on accretion of RNCI | — | | — | | — | | — | | | |
| Less: Accretion of RNCI (net of tax) | (151) | | (0.02) | | — | | — | | | |
| Less: GE Industrial U.S. tax reform enactment adjustment | (51) | | (0.01) | | (101) | | (0.01) | | | |
| Adjusted GE Industrial earnings (loss) (Non-GAAP) | $ | 833 | | $ | 0.10 | | $ | 5,191 | | $ | 0.59 | | | |
| | | | | | |
GE Capital earnings (loss) from continuing operations attributable
to GE common shareholders (GAAP) | (1,710) | | (0.20) | | (530) | | (0.06) | | | |
| Insurance premium deficiency test charge (pre-tax) | — | | — | | (972) | | (0.11) | | | |
| Tax effect on insurance premium deficiency test charge | — | | — | | 204 | | 0.02 | | | |
| Less: Insurance premium deficiency test charge (net of tax) | — | | — | | (768) | | (0.09) | | | |
| Goodwill impairments (pre-tax) | (839) | | (0.10) | | — | | — | | | |
| Tax effect on goodwill impairments | 3 | | — | | — | | — | | | |
| Less: goodwill impairments (net of tax) | (836) | | (0.10) | | — | | — | | | |
| Less: SEC settlement charge (pre-tax and net of tax) | (100) | | (0.01) | | — | | — | | | |
| Debt extinguishment costs (pre-tax) | (238) | | (0.03) | | — | | — | | | |
| Tax effect on debt extinguishment costs | 44 | | — | | — | | — | | | |
| Less: debt extinguishment costs (net of tax) | (194) | | (0.02) | | — | | — | | | |
| Less: GE Capital U.S. tax reform enactment adjustment | 2 | | — | | 99 | | 0.01 | | | |
| Less: GE Capital tax benefit related to BioPharma sale | 143 | | 0.02 | | — | | — | | | |
| Adjusted GE Capital earnings (loss) (Non-GAAP) | $ | (724) | | $ | (0.08) | | $ | 139 | | $ | 0.02 | | | |
| | | | | | |
| Adjusted GE Industrial earnings (loss) (Non-GAAP) | $ | 833 | | $ | 0.10 | | $ | 5,191 | | $ | 0.59 | | | |
| Add: Adjusted GE Capital earnings (loss) (Non-GAAP) | (724) | | (0.08) | | 139 | | 0.02 | | | |
| Adjusted earnings (loss) (Non-GAAP) | $ | 109 | | $ | 0.01 | | $ | 5,330 | | $ | 0.61 | | | |
| (a) Earnings for per-share calculation includes allocation of participating securities pursuant to the two-class method. See Note 18 for further information. Earnings-per-share amounts are computed independently. As a result, the sum of per-share amounts may not equal the total. |
| (b) See the Corporate Items and Eliminations section for further information. | | |
| | | | | | | | | | | | | | | | |
The service cost for our pension and other benefit plans are included in adjusted earnings*, which represents the ongoing cost of providing pension benefits to our employees. The components of non-operating benefit costs are mainly driven by capital allocation decisions and market performance. We believe the retained costs in Adjusted earnings* and Adjusted EPS* provides management and investors a useful measure to evaluate the performance of the total company and increases period-to-period comparability. We also use Adjusted EPS* as a performance metric at the company level for our annual executive incentive plan for 2020. We believe presenting Adjusted Industrial earnings* and Adjusted Industrial EPS* separately for our financial services businesses also provides management and investors with useful information about the relative size of our industrial and financial services businesses in relation to the total company. |
| | | | | | |
| | | | | | | | |
| GE INDUSTRIAL NET DEBT (NON-GAAP) | December 31, 2020 | December 31, 2019 |
| Total GE Industrial short- and long-term borrowings (GAAP) | $ | 42,736 | | $ | 52,059 | |
| Less: GE Capital short- and long-term debt assumed by GE Industrial | 22,390 | | 31,368 | |
| Add: intercompany loans from GE Capital | 3,177 | | 12,226 | |
| Total adjusted GE Industrial borrowings | $ | 23,523 | | $ | 32,917 | |
| Pension and principal retiree benefit plan liabilities (pre-tax)(a) | 25,492 | | 27,773 | |
| Less: taxes at 21% | 5,353 | | 5,832 | |
| Pension and principal retiree benefit plan liabilities (net of tax) | $ | 20,139 | | $ | 21,941 | |
| GE Industrial operating lease liabilities | 3,133 | | 3,369 | |
| GE Industrial preferred stock | 5,918 | | 5,738 | |
| Less: 50% of GE Industrial preferred stock | 2,959 | | 2,869 | |
| 50% of preferred stock | $ | 2,959 | | $ | 2,869 | |
| Deduction for total GE Industrial cash, cash equivalents and restricted cash | (23,209) | | (17,613) | |
| Less: 25% of GE Industrial cash, cash equivalents and restricted cash | (5,802) | | (4,403) | |
| Deduction for 75% of GE Industrial cash, cash equivalents and restricted cash | $ | (17,407) | | $ | (13,210) | |
| Total GE Industrial net debt (Non-GAAP) | $ | 32,347 | | $ | 47,886 | |
| | |
(a) Represents the sum of the net deficit of principal pension, other pension, and principal retiree benefit plans as disclosed in Note 13. |
| In this document we use GE Industrial net debt*, which is calculated based on rating agency methodologies. We are including the calculation of GE industrial net debt* to provide investors more clarity regarding how the credit rating agencies measure GE Industrial leverage. |
OTHER FINANCIAL DATA
| | |
| FIVE-YEAR PERFORMANCE GRAPH |
|
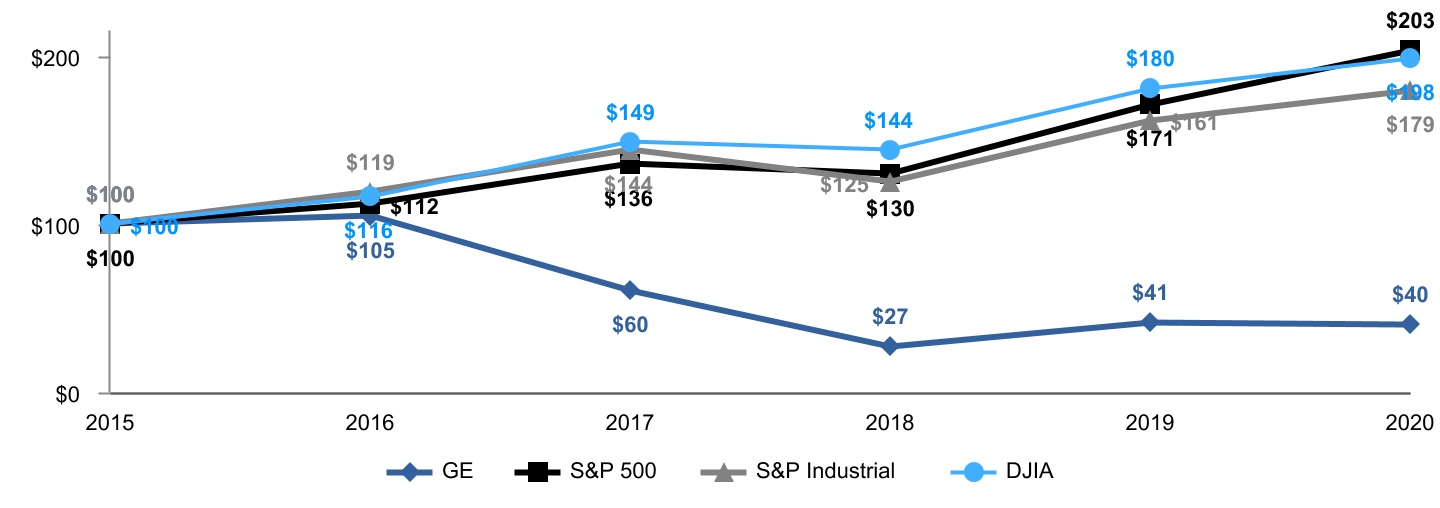

The annual changes for the five-year period shown in the above graph are based on the assumption that $100 had been invested in General Electric common stock, the Standard & Poor’s 500 Stock Index (S&P 500), and the Standard & Poor’s 500 Industrials Stock Index (S&P Industrial) and the Dow Jones Industrial Average (DJIA) on December 31, 2015,2018, and that all quarterly dividends were reinvested. The cumulative dollar returns shown on the graph represent the value that such investments would have had on December 31 for each year indicated. In 2020, we began measuring GE’s relative performance against the S&P Industrial index for performance share unit awards. In previous years we have provided the DJIA, and it is includedThe historical data in the above graph for comparison purposes only.chart has been adjusted to reflect the impact of the spin-off of GE HealthCare completed in the first quarter of 2023.
With respect to “Market Information,” in the United States, General Electric common stock is listed on the New York Stock Exchange under the ticker symbol "GE" (its principal market). General Electric common stock is also listed on the London Stock Exchange, Euronext Paris and the SIX Swiss Exchange and the Frankfurt Stock Exchange.
As of January 31, 2021,15, 2024, there were approximately 365,000260,000 shareholder accounts of record.
*Non-GAAP Financial Measure
PURCHASES OF EQUITY SECURITIES BY THE ISSUER AND AFFILIATED PURCHASERS. GE did not repurchase any equity securitiesOn March 6, 2022, the Board of Directors authorized up to $3 billion of common share repurchases. We repurchased 2,168 thousand shares for $253 million during the three months ended December 31, 2020.2023 under this authorization.
| | | | | | | | | | | | | | |
| 2023 (Shares in thousands) | Total number of shares purchased | Average price paid per share | Total number of shares purchased as part of our share repurchase authorization | Approximate dollar value of shares that may yet be purchased under our share repurchase authorization |
| | | | |
| | | | |
| | | | |
| October | 766 | | $ | 110.30 | | 766 | | |
| November | 1,160 | | 116.69 | | 838 | | |
| December | 563 | | 124.66 | | 563 | | |
| Total | 2,489 | | $ | 116.53 | | 2,168 | | $ | 938 | |
CYBERSECURITY. The description in this section reflects GE’s approach as of December 31, 2023; we anticipate that, following the planned spin-off of our GE Vernova businesses, each of GE Aerospace and GE Vernova will continue to evolve their cybersecurity risk management, strategies and governance to meet their respective needs as standalone companies.
CYBERSECURITY RISK MANAGEMENT AND STRATEGY. GE has developed and implemented a cybersecurity framework intended to assess, identify and manage risks from threats to the security of our information, systems, products and network using a risk-based approach. The framework is informed in part by the National Institute of Standards and Technology (NIST) Cybersecurity Framework and International Organization for Standardization 27001 (ISO 27001) Framework, although this does not imply that we meet all technical standards, specifications or requirements under the NIST or ISO 27001.
Our key cybersecurity processes include the following:
•Risk-based controls for information systems and information on GE’s networks: We seek to maintain an information technology infrastructure that implements physical, administrative and technical controls that are calibrated based on risk and designed to protect the confidentiality, integrity and availability of our information systems and information stored on GE’s networks, including customer information, personal information, intellectual property and proprietary information.
•Cybersecurity incident response plan and testing: We have a cybersecurity incident response plan and dedicated teams to respond to cybersecurity incidents. When a cybersecurity incident occurs or we identify a vulnerability, we have cross-functional teams that are responsible for leading the initial assessment of priority and severity, and external experts may also be engaged as appropriate. GE’s cybersecurity teams assist in responding to incidents depending on severity levels and seek to improve our cybersecurity incident management plan through periodic tabletops or simulations at the enterprise and business levels.
•Training: We provide security awareness training to help our employees understand their information protection and cybersecurity responsibilities at GE. We also provide additional role-based training to some employees based on customer requirements, regulatory obligations and industry risks.
•Supplier risk assessments: We have implemented a third-party risk management process that includes expectations regarding information and cybersecurity. That process, among other things, provides for GE to perform cybersecurity assessments on certain suppliers based on an assessment of their risk profile and a related rating process. GE also seeks contractual commitments from key suppliers to appropriately secure and maintain their information technology systems and protect GE information that is processed on their systems.
•Third-party assessments of GE: We have third-party cybersecurity companies engaged to periodically assess GE’s cybersecurity posture, to assist in identifying and remediating risks from cybersecurity threats.
We also consider cybersecurity, along with other top risks for GE, within our enterprise risk management framework. The enterprise risk management framework includes internal reporting at the business and enterprise levels, with consideration of key risk indicators, trends and countermeasures for cybersecurity and other types of significant risks. In the last fiscal year, we have not identified risks from known cybersecurity threats, including as a result of any prior cybersecurity incidents, that have materially affected us, including our operations, business strategy, results of operations, cash flow or financial condition. We face certain ongoing risks from cybersecurity threats—including heightened threats in connection with the separation of GE HealthCare in January 2023 and the planned separation of GE Aerospace and GE Vernova into independent companies—that, if realized, are reasonably likely to materially affect us, including our operations, business strategy, results of operations, or financial condition. Refer to the Risk Factors section (Cybersecurity - Increased cybersecurity requirements, vulnerabilities, threats and more sophisticated and targeted computer crime, as well as cybersecurity failures, pose risk to our systems, networks, products, solutions, services and data..) for additional information about these risks.
CYBERSECURITY GOVERNANCE. The Audit Committee of the GE Board of Directors is responsible for board-level oversight of cybersecurity risk, and the Audit Committee reports back to the full Board about this and other areas within its responsibility. As part of its oversight role, the Audit Committee receives reporting about GE’s practices, programs, notable threats or incidents and other developments related to cybersecurity throughout the year, including through periodic updates from GE’s Global Chief Information Security Officer (CISO) and other internal digital technology and cybersecurity leaders on cyber threats and our cybersecurity risk management strategy. The Audit Committee also receives information about cybersecurity risks as part of GE’s enterprise risk management framework and reporting.
GE’s Global CISO reports to GE’s Global Chief Information Officer and leads the Company’s overall cybersecurity function. The Global CISO has over 20 years of experience in managing and leading IT or cybersecurity teams and participates in various cyber security organizations. The Global CISO collaborates with business unit CISOs to identify and analyze cybersecurity risks to GE; consider industry trends; implement controls, as appropriate and feasible, to mitigate these risks; and enable business leaders to make risk-based business decisions that implicate cybersecurity considerations. The Global CISO meets with senior leadership to review and discuss GE’s cybersecurity program, including emerging cyber risks, threats and industry trends. The Global CISO also supervises efforts to prevent, detect, mitigate, and remediate cybersecurity risks and incidents through various means, including by collaborating with internal security personnel and business stakeholders, and incorporating threat intelligence and other information obtained from governmental, public or private sources to inform our cybersecurity technologies and processes.
RISK FACTORS. The following discussion of the material factors, events and uncertainties that may make an investment in the Company speculative or risky contains "forward-looking statements," as discussed in the Forward-Looking Statements section. These risk factors may be important to understanding any statement in this Form 10-K report or elsewhere. The risks described below should not be considered a complete list of potential risks that we face, and additional risks not currently known to us or that we currently consider immaterial may also negatively impact us. The following information should be read in conjunction with the MD&A section and the consolidated financial statements and related notes. The risks we describe in this Form 10-K report or in our other SEC filings could, in ways we may not be able to accurately predict, recognize or control, have a material adverse effect on our business, reputation, financial position, results of operations, cash flows and stock price, and they could cause our future results to be materially different than we presently anticipate.
STRATEGIC RISKS.Strategic risk relates to the Company's future business plans and strategies, including the risks associated with: our planned separation of GE Aerospace and GE Vernova into independent companies; the global macro-environment;macro-environment and conditions in our sectors; the global energy transition; competitive threats,threats; the demand for our products and services and the success of our
investments in technology and innovation; our portfolio of businesses and capital allocation decisions; dispositions, acquisitions, joint ventures and restructuring activity; intellectual property; and other risks.
Strategic plan - We may encounter challenges to executing our plan to separate GE Aerospace and GE Vernova into independent companies, or to completing the plan within the timeframes we anticipate, and we may not realize some or all of the expected benefits of the separations. In November 2021, we announced our plan to form three independent public companies from our (i) Aerospace business, (ii) HealthCare business and (iii) portfolio of energy businesses, including our Renewable Energy and Power businesses, which we plan to combine and refer to as GE Vernova, to better position those businesses to deliver long-term growth and create value for customers, investors, and employees. The GE HealthCare business separation in January 2023 was, and the planned GE Vernova business separation is expected to be, effected through spin-offs by GE that are intended to be tax-free for the Company and its shareholders for U.S. federal income tax purposes and with all three resulting companies having investment-grade credit ratings. The GE Vernova separation transaction will be subject to the satisfaction of a number of customary conditions, including, among others, final approvals by GE’s Board of Directors, receipt of tax rulings in certain jurisdictions and/or tax opinions from external counsel, the filing with the SEC and effectiveness of a Form 10 registration statement, and establishment of the capital structures and credit ratings for both GE Vernova and the remainder of GE following the spin-off. A failure to satisfy required conditions, or disruptions in market conditions, could delay the completion of the GE Vernova separation transaction for a significant period of time or prevent it from occurring at all. Additionally, the GE Vernova separation transaction is complex in nature, and business, market or other developments or changes may affect our ability to complete the separation transaction as currently expected, within the anticipated timeframe or at all. These or other developments could cause us not to realize some or all of the expected benefits, or to realize them on a different timeline than expected. If we are unable to complete the GE Vernova separation, we will have incurred costs without realizing the benefits of such transaction. In addition, the terms and conditions of the required regulatory authorizations and consents that are granted, if any, may impose requirements, limitations or costs, or place restrictions on the conduct of GE Vernova or GE Aerospace as independent companies. In addition, although we intend for the GE Vernova separation transaction to be tax-free to the Company and its shareholders for U.S. federal income tax purposes, we expect to incur non-U.S. cash taxes on the preparatory restructuring and may also incur non-cash tax expense including potential impairments of deferred tax assets. Moreover, there can be no assurance that the GE Vernova spin-off will qualify as tax-free for U.S. purposes for the Company or its shareholders. If either of the separation transactions were ultimately determined to be taxable, we would incur a significant tax liability, while the distributions to the Company’s shareholders would become taxable and the new independent companies might incur income tax liabilities as well. Furthermore, there can be no assurance that each separate company will be successful as a standalone public company.
COVID-19 -Whether or not the GE Vernova separation transaction is completed, our businesses may face material challenges in connection with executing this plan, including the diversion of management’s attention from ongoing business concerns and impact on the businesses of the Company; appropriately allocating assets and liabilities among GE Aerospace and GE Vernova; maintaining employee morale and retaining and attracting key management and other employees; retaining existing or attracting new business and operational relationships, including with customers, suppliers, employees and other counterparties; assigning customer contracts, guaranties and other contracts and instruments to each of the businesses, and obtaining releases from the counterparties to those contracts or beneficiaries of those instruments as required; providing financial or credit support for new business; assigning intellectual property to each of the businesses; establishing transition service agreements and standalone readiness for key functions; and potential negative reactions from investors or the financial community. In particular, to support the GE Vernova businesses in selling products and services globally, GE often enters into contracts on behalf of GE Vernova or issues parent company guarantees or trade finance instruments supporting the performance of what currently are subsidiary legal entities transacting directly with customers, in addition to providing similar credit support for some non-customer-related activities of GE Vernova (collectively, GE credit support). For GE credit support that is not novated to GE Vernova with a release of GE, the failure of GE Vernova (or of a subsequent acquiror of all or a portion of GE Vernova's business) to perform under any relevant contract following the spin-off could result in claims for damages or other relief against GE. The global COVID-19 pandemic has hadtotal amount of GE Vernova business that the GE credit support relates to is significant, and is expected toGE will likely continue to have a material adverse impact on our operations and financial performance, as well asexposure that is based on the operations and financialcontinued performance of manythe relevant contracts for some years following completion of the customersspin-off. See the Other Items - Parent Company Credit Support section within MD&A for additional information. In addition, GE for the past several years has been undertaking various restructuring and suppliers in industries that we serve. Our operationsbusiness transformation actions (including workforce reductions, global facility consolidations and financial performance have been negatively impacted by the COVID-19 pandemic that has caused, and is expected to continue to cause, the global slowdown of economic activity (including the decrease in demand for a broad variety of goods and services), disruptions in global supply chains and significant volatility and disruption of financial markets. Across all of our businesses, we have experienced and expect to continue to experience operational challenges from the need to protect employee health and safety, site shutdowns, workplace disruptions and restrictions on the movement of people, raw materials and goods, both at our own facilities and at those of our customers and suppliers. We also have experienced, and expect to continue experiencing, lower demand and volume for products and services (particularly at GE Aviation, as described below, and also for portions of GE Healthcare’s business), customer requests for potential payment deferrals or other contract modifications, supply chain under-liquidation, delays of deliveriescost reduction initiatives and the achievement of other billing milestones, delays or cancellations of new projects and related down paymentsGE HealthCare separation) that have entailed changes across our organizational structure, senior leadership, culture, functional alignment, outsourcing and other factors related directly and indirectly to the COVID-19 pandemic that adversely impact our businesses.
In particular, the interruption of regional and international air travel from COVID-19 is having a material adverse effect on our airline and airframer customers, the viability of their businesses and their demand for our services and products. In this context, we have observed a significant increaseareas. These pose risks in the numberform of requests for payment deferrals, contract modifications, aircraft lease restructuringspersonnel capacity constraints and similar actions across the aviation sector, which mayinstitutional knowledge loss that could lead to missed performance or financial targets, loss of key personnel and harm to our reputation, and these risks are heightened with the additional charges, impairments and other adverse financial impacts, or to customer disputes, at GE Aviation and GE Capital Aviation Services. Disruption of the aviation industry, which could continue for an uncertain period of time, is particularly significant for GE, as we have depended on the strength of our Aviation business as we have been working to improve the operations and execution of other GE businesses and strengthen the company’s balance sheet. As a result, disruption of the aviation industry, which could continue for an uncertain period of time, is particularly significant for GE.
The ultimate impact of the COVID-19 pandemic on our operations and financial performance depends on many factors that are not within our control, including, but not limited, to: the severity and duration of the pandemic, including the impact of coronavirus mutations and resurgences; governmental, business and individuals’interdependent actions that have been and continue to be taken in response to the pandemic (including restrictions on travel and transport and workforce pressures); the impact of the pandemic and actions taken in response on global and regional economies, travel, and economic activity; the development, availability and public acceptance of effective treatments or vaccines; the availability of federal, state, local or non-U.S. funding programs; general economic uncertainty in key global markets and financial market volatility; global economic conditions and levels of economic growth; and the pace and extent of recovery when the COVID-19 pandemic subsides. A number of accounting estimates that we make have been and will continue to be affected byneeded to complete the COVID-19 pandemic and uncertainties related to these and other factors, and our accounting estimates and assumptions may change over time in response to COVID-19 (see Note 1). As the COVID-19 pandemic continues to adversely affect our operating and financial results, it may also have the effectplanned separation of heightening many of the other risk factors described below.GE Vernova.
GE 20202023 FORM 10-K44 28
may also sell the common stock of any of the new independent companies that do not match their investment strategies, which may cause a decline in the market price of such common stock.
Global macro-environment - Our financial performance and growth isare subject to risks related to global economic, political and geopolitical risks.developments or other disruptions to the economy or our business sectors. We operate in virtually every part of the world, serve customers in over 170160 countries and received 56%57% of our revenues for 20202023 from outside the United States. Our operations and the execution of our business plans and strategies are subject to the effects of global economic trends, geopolitical risks and demand or supply shocks from events that could includesuch as war or international conflict, a major terrorist attack, natural disasters or actual or threatened public health emergencies (such as COVID-19). Theypandemics or other emergencies. Our operations and performance are also affected by local and regional economic environments, supply chain constraints and policies in the U.S. and other markets that we serve, including factors such as inflationary pressures in many markets, increased interest rates from recent historic lows, economic growth rates, the availability of skilled labor, monetary policy, inflation, economic growth, recession,exchange rates and currency volatility, commodity prices currency volatility, currency controls or other limitations on the ability to expatriate cash,and sovereign debt levels and actual or anticipated defaults on sovereign debt.levels. For example, changes in localinflationary pressures have caused and may continue to cause many of our material and labor costs to increase, which adversely affects our profitability and cash flows, particularly when we are unable to increase customer contract values or pricing to offset those pressures. Deterioration of economic conditions or outlooks, such as lower rates of investment, orlower economic growth, recession or fears of recession in the U.S., China, Europe or other key markets, may adversely affect the demand for or profitability of our products and services, outside the U.S., and the impact from developments outside the U.S. on the Company couldour business performance can be significant given the extent of our activities outsideglobal activities. Increased geopolitical tensions and outbreaks of armed conflict can also adversely impact our businesses, both directly or by adversely affecting economic activity globally or in particular regions or countries. For example, Russia’s invasion of Ukraine in early 2022 and related political and economic consequences, such as sanctions and other measures imposed by the United States. PoliticalEuropean Union, the U.S. and other countries and organizations in response, have caused and may continue to cause disruption and instability in global markets, supply chains and industries that negatively impact our businesses, financial condition and results of operations and pose reputational risks. More recently, there is risk of wider conflict in the Middle East that could have significant adverse impacts on the region and business activity in addition to the humanitarian and other consequences of the current conflict. In addition, political changes and trends such as populism, protectionism, economic nationalism and sentiment toward multinational companies, and resultingas well as tariffs, export controls, restrictions on outbound investment or other trade barriers, sanctions, technical or local content regulations, currency controls, or changes to tax or other laws and policies, have been and may continue to be disruptive and costly to our businesses, and thesebusinesses. These can interfere with our global operating model, supply chain, production costs, customer relationships and competitive position. Further escalation of any specific trade tensions, such as thoseincluding intensified decoupling between the U.S. and China, or in global trade conflict more broadly could be harmful to global economic growth and related decreases in confidence or investment activity in the global markets would adversely affectto our business performance.in or with China or other countries. We also do business in many emerging market jurisdictions where economic, political and legal risks are heightened.heightened and the operating environments are complex.
Industry dynamics and outlooks –Energy transition - The strategic priorities and financial performance of many of our businesses are subject to major trendsmarket and other dynamics related to efforts to reduce greenhouse gas emissions, which can pose risks in our industries, such as decarbonization and digitization, and we may not appropriately plan for or adapt quickly enoughaddition to dynamics that in some cases can take many years to play out. opportunities.Our long-term operating results and competitive position depend substantially upon our ability to continually develop, introduce, and market new and innovative technology, products, services and platforms, to modify existing products and services, to customize products and services, to maintain long-term customer relationships and to increase our productivity over time as we perform on long-term service agreements. A failure to appropriately plan for future customer demand and industry trends may adversely affect our delivery of products, services and outcomes in line with our projected financial performance or cost estimates, and ultimately may result in excess costs, build-up of inventory that becomes obsolete, lower profit margins and an erosion Given the nature of our competitive position. In some cases, major disruptive dynamics can arise quickly in our industries, such as the impact of the COVID-19 pandemic on air travelbusinesses and the outlook for a return to flight at pre-pandemic levels, as described above. In other cases,industries we serve, we must anticipate and respond to market, technological, regulatory and technologicalother changes driven by broader trends such as decarbonizationrelated to greenhouse gas emission reduction efforts in response to climate change or increased digitization in healthcare or other industries we serve or growth in industrial automation, thatand energy security. These changes present both risks and opportunities for our businesses.businesses, many of which provide products and services to customers in sectors like power generation and commercial aviation that have historically been carbon intensive and we expect will remain important to efforts globally to lower greenhouse gas emissions for decades to come. For example, the significant decreases in recent years in the levelized cost of energy for renewable sources of power generation (such as wind and solar), along with ongoing changes in government, investor, customer and consumer policies, commitments, preferences and considerations related to climate change, in some cases have adversely affected, and are expected tomay continue to affect, the demand for and the competitiveness of products and services related to fossil fuel-based power generation, including sales of new gas turbines and the utilization and servicing needs for existing gas power plants.plants that are unmitigated with capabilities such as hydrogen or carbon capture. Continued shifts toward greater penetration by renewables in both new capacity additions and the proportionate share of power generation, particularly depending on the pace and timeframe for such shifts across different markets globally, could have a material adverse effect on the performance of our Power business and our consolidated results. While the currently anticipated market growth and power generation share for renewable energy over time is expected to be favorable for our wind businesses there tooover time, we face uncertainties related to the future anticipated levels and timeframes of government subsidies and credits (including the impact of the Inflation Reduction Act and other policies), significant price competition among wind equipment manufacturers, dynamics between onshore and offshore wind power, potential further consolidation in the wind industry, and competition with solar power-based and other sources of renewable energy such as solar. In addition,and the pace at which power grids are modernized to maintain reliability with higher levels of renewables penetration. The achievement of deep decarbonization goals for the power sector over the coming decades is likely to depend in part on technologies that are not yet deployed or widely adopted today but that may become more important over time (such as grid-scale batteries or other storage solutions, hydrogen-based power generation, carbon capture and sequestration technologies, small modular or other advanced nuclear power),power and grid-scale batteries or other storage solutions). Successfully navigating these changes will require significant investments in power grids and other infrastructure, research and development and new technology and products, both by GE and third parties. Similar dynamics exist in the aviation sector, where greenhouse gas emission reduction over time will require a combination of continued technological innovation in the fuel efficiency of engines, expanded use of sustainable aviation fuels and the further development of hybrid-electric and electric flight and hydrogen-based aviation technologies. For example, the risk of insufficient availability of low carbon fuels (such as sustainable aviation fuels or hydrogen) may compromise the pace and degree of emission reduction within the aviation sector. Our success in advancing greenhouse gas emission reduction objectives across our businesses will depend in part on the actions of governments, regulators and other market participants to invest in infrastructure, create appropriate market incentives and to otherwise support the development of new technologies. The process of developing new high-technology products and enhancing existing products to mitigate climate change is often complex, costly and uncertain, and we may pursue strategies or make investments that do not prove to be commercially successful in the time frames expected or at all.
A failure by GE or other industry participants to invest successfully in these technological developments, or to adequately position our businesses to benefit from the growth in adoption of these technologies. These trendsnew technologies, could adversely affect our competitive position, business, ability to attract and retain talent, results of operations, cash flows and financial condition. In addition, we face increasing scrutiny and expectations from many customers, governments, regulators, investors, banks, project financiers and other stakeholders regarding the roles that the private sector and individual companies play in decarbonization, which can result in additional costs and pose reputational or other risks for companies like GE that serve carbon intensive industries or relative to progress that we make over time in reducing emissions from our operations or products and achieving our publicly announced ambitions. We anticipate that we will continue to need to make investments in new technologies and capabilities and devote additional management and other resources in response to the foregoing, and we may not realize the anticipated benefits of those investments and actions. Trends related to the global energy transition and decarbonization includingwill affect the relative competitiveness of different types of product and service offerings within and across our energy businesses as well as for GE Aviation, will continue to be impacted in waysand our Aerospace business. Important factors that are uncertain by factors such ascould impact our businesses include the pace of technological developments and related cost considerations, the levels of economic growth in different markets around the world and the adoption and pace of implementation of climate change-related policies (such as carbon taxes, cap and trade regimes, increased efficiency standards, greenhouse gas emission reduction targets or commitments, incentives or mandates for particular types of energy or policies that impact the availability of financing for certain types of projects) at the national and sub-national levels or by customers, investors or other private actors.
Competitive environment - We are dependent on the maintenance of existing product lines and service relationships, market acceptance of new product and service introductions, and technology and innovation leadership for revenue and earnings growth. The markets in which we operate are highly competitive in terms of pricing, product and service quality, product development and introduction time, customer service, financing terms, andthe ability to respond to shifts in market demand and competitors are increasingly offeringthe ability to attract and retain skilled talent. Our long-term operating results and competitive position also depend substantially upon our ability to continually develop, introduce, and market new and innovative technology, products, services and platforms, to develop digital solutions for our installed base. own operations and our customers, to modify existing products and services, to customize products and services, to maintain long-term customer relationships and to increase our productivity over time as we perform on long-term service agreements. We often enter into long-term service agreements in both our Aerospace and Power businesses in connection with significant contracts for the sale of equipment. In connection with these agreements, we must accurately estimate our costs associated with delivering the products, product durability and reliability, and the provision of services over time in order to be profitable and generate acceptable returns on our investments. A failure to appropriately estimate or plan for or execute our business plans may adversely affect our delivery of products, services and outcomes in line with our projected financial performance or cost estimates, and ultimately may result in excess costs, build-up of inventory that becomes obsolete, lower profit margins and an erosion of our competitive position. In addition, at our Renewable Energy business, the rapid pace of innovation among onshore and offshore wind turbine manufacturers in recent years has led to short product cycles, early market introductions and faster time to market, all of which have led and may continue to lead to quality and execution issues, higher costs and other challenges to achieving profitability for new products. Such risks are especially acute in the nascent offshore wind industry, with higher ramp-up costs and the potential for new product introductions to result in losses both in the short- and long-run. If we are not able to identify and implement initiatives that control and reduce costs and increase
operating efficiency, or if the cost savings initiatives we have implemented to date do not generate expected cost savings, our financial results could be adversely affected.
Our businesses are also subject to technological change and require usadvances, such as growth in industrial automation and increased digitization of the operations, infrastructure and solutions that customers demand across all the industries we serve. In addition, our use of emerging and evolving technologies such as artificial intelligence and machine learning, which we expect to continually attractincrease over time, presents business, reputational, legal and retain skilled talent.compliance risks related to data sourcing, design flaws, integration issues, security threats, privacy protections and the ability to develop sufficient protection measures. The introduction of innovative and disruptive technologies in the markets in which we operate also poses risks in the form of new competitors (including new entrants from outside our traditional industries, such as competitors from digital technology companies), market consolidation, substitutions of existing products, services or solutions, niche players, new business models and competitors that are faster to market with new or more cost-effective products or services. BecauseExisting and new competitors frequently offer services for our installed base, and if the customers that purchase our equipment and products select our competitors’ services or if we otherwise fail to maintain or renew service relationships, this can erode the revenues and profitability of our businesses. In addition, the research and development cycle involved in bringing products in our businesses to market is often lengthy, it is inherently difficult to predict the economic conditions andor competitive dynamics that will exist when any new product is complete, and our investments, to the extent they result in bringing a product to market, may generate weaker returns than we anticipated at the outset. Our capacity to invest in research and development efforts to pursue advancement in a wide range of technologies, products and services also depends on the financial resources that we have available for such investment relative to other capital allocation priorities,priorities. Under-investment in research and development, or investment in technologies that prove to be less competitive in the extent there may be under-investment thatfuture (at the expense of alternative investment opportunities not pursued), could lead to loss of sales of our products and services in the future, particularly insince many of our long-cycle businesses.businesses have long product development cycles. The amounts that we do invest in research and development divert resources from other potential investments in our businesses, and our efforts may not lead to the development of new technologies or products on a timely basis or meet the needs of our customers as fully as competitive offerings.
Restructuring & retention - We have been undertaking extensive cost reduction and restructuring efforts; these efforts may have adverse effects on our operations, employee retention, results and reputation and may not achieve the expected benefits. We continue undertaking restructuring actions that include workforce reductions, global facility consolidations and other cost reduction initiatives. These actions have been a central component of our ongoing efforts to improve operational and financial performance, and we have also taken additional actions or accelerated the pace of actions to mitigate the adverse financial effects of COVID-19 on our businesses. The extent of change across our organizational structure, senior leadership, culture, functional alignment, outsourcing and other areas poses risks in the form of personnel capacity constraints and institutional knowledge loss that could lead to missed performance or financial targets, loss of key personnel and harm to our reputation. The risk of capacity constraints is also heightened with the number of interdependent and transformational business portfolio and internal actions that we have been undertaking during a period of significant restructuring and cost reduction across the Company. Moreover, if we do not successfully manage our restructuring and other transformational activities, the anticipated operational improvements, efficiencies and other benefits might be delayed or not realized, and our operations and business could be disrupted. Risks associated with these actions include unforeseen delays in implementation of workforce reductions, additional unexpected costs, adverse effects on employee morale, loss of key employees or other retention issues, inability to attract and hire talented professionals or the failure to meet operational targets due to the loss of employees or work stoppages, any of which may impair our ability to achieve anticipated cost reductions or may otherwise harm our business or reputation and have an adverse effect on our competitive position or financial performance.
Business portfolio - Our success depends on achieving our strategic and financial objectives, including through dispositions, acquisitions, integrations, dispositions and joint ventures. With respect to acquisitions and business integrations, dispositions, separations and joint ventures, we may not achieve expected returns or other benefits on a timely basis or at all as a result of changes in strategy, integration challenges or other factors. Over the past several years we have also been pursuing a variety of dispositions, including the ongoing monetization of our remaining equity ownership position in Baker Hughes. The proceeds from those dispositions have been an important source of cash flow for the Companyand as part of our strategic and financial planning. Whendiscussed above we seek to sell certain businesses, equity interests or assets, we may encounter difficulties in finding buyers or in market conditions that could delay or prevent the accomplishment of our objectives, and declinesare in the valuesmidst of executing our plan to separate GE Aerospace and GE Vernova into independent companies. In January 2023, we spun off our HealthCare business as GE HealthCare, and GE currently holds a 13.5% equity interest in GE HealthCare. Declines in the value of equity interests (such as our remaining interest in Baker Hughes)GE HealthCare) or other assets that we sell can diminish the cash proceeds that we realize.realize, and our ability and timing to sell can depend on market conditions and the liquidity of the relevant asset. We may dispose of businesses or assets at a price or on terms that are less favorable than we had anticipated, or with purchase price adjustments or the exclusion of assets or liabilities that must be divested, managed or run off separately. We can also be subject to limitations in the form of regulatory or governmental approvals that may prevent certain prospective counterparties from completing transactions with us or delay us from executing transactions on our preferred timeline, or arising from our debt or other contractual obligations that limit our ability to complete certain transactions. Moreover, dispositions have the effect of reducing the Company’s cash flow and earnings capacity, resulting in a less diversified portfolio of businesses and increasing our dependency on remaining businesses for our financial results from ongoing operations. Dispositions or other business separations also often involve continued financial involvement in the divested business, such as through continuing equity ownership, retained assets or liabilities, transition services agreements, commercial agreements, guarantees, indemnities or other current or contingent financial obligations or liabilities. Under these arrangements, performance by the divested businesses or other conditions outside our control could materially affect our future financial results. With respect to acquisitions, joint ventures and business integrations, we may not achieve expected returns and other benefits on a timely basisEvaluating or at all as a result of changes in strategy or separation/integration challenges related to personnel, IT systems or other factors. Executingexecuting on all types of potential or planned portfolio transactions can divert senior management time and resources from other pursuits. In addition, in connection with acquisitions over time, we have recorded significant goodwill and other intangible assets on our balance sheet, and if we are not able to realize the value of these assets, we may be required to incur charges relating to the impairment of these assets. We also participate in a number of joint ventures with other companies or government enterprises in various markets around the world, including joint ventures where we have a lesser degree of control over the business operations, which may expose us to additional operational, financial, reputational, legal or compliance risks.
Intellectual property - Our intellectual property portfolio may not prevent competitors from independently developing products and services similar to or duplicative to ours, and the value of our intellectual property may be negatively impacted by external dependencies.Our patents and other intellectual property may not prevent competitors from independently developing or selling products and services similar to or duplicative of ours, and there can be no assurance that the resources invested by us to protect our intellectual property will be sufficient or that our intellectual property portfolio will adequately deter misappropriation or improper use of our technology.technology, particularly in certain markets outside the U.S. where intellectual property laws and related enforcement mechanisms may not be as well-developed. Trademark licenses of the GE brand in connection with dispositions, including in connection with the separation of GE HealthCare in January 2023 and the planned separation of GE Aerospace and GE Vernova into independent companies, may negatively impact the overall value of the brand in the future. We also face competition in some countries where we have not invested in an intellectual property portfolio. If we are not able to protect our intellectual property, the value of our brand and other intangible assets may be diminished, and our business may be adversely affected. We also face attempts, both internally from insider threats and externally from cyber-attacks, to gain unauthorized access to our IT systems or products for the purpose of improperly acquiring our trade secrets or confidential business information. In addition, we have observed an increase in the use of social engineering tactics by bad actors attempting to obtain confidential business information or credentials to access systems with our intellectual property. The theft or unauthorized use or publication of our trade secrets and other confidential business information as a result of such an incidentincidents could adversely affect our competitive position and the value of our investment in research and development. In addition, we are subject to the enforcement of patents or other intellectual property by third parties, including aggressive and opportunistic enforcement claims by non-practicing entities. Regardless of the merit of such claims, responding to infringement claims can be expensive and time-consuming. If GE ishas in the past, and may in the future be, found to infringe any third-party rights, wewhich could be requiredrequire us to pay substantial damages or we could be enjoinedenjoin us from offering some of our products and services. The value of, or our ability to use, our intellectual property may also be negatively impacted by dependencies on third parties, such as our ability to obtain or renew on reasonable terms licenses that we need in the future, or our ability to secure or retain ownership or rights to use data in certain software analytics or services offerings.
OPERATIONAL RISKS.Operational risk relates to risks arising from systems, processes, people and external events that affect the operation of our businesses. It includes risks related to product and service lifecyclelife cycle and execution; product safety and performance; information management and data protection and security, including cybersecurity; and supply chain and business disruption.
Operational execution - Operational challenges could have a material adverse effect on our business, reputation, financial position, results of operations and cash flows. The Company’sGE’s financial results depend on the successful execution of our businesses’ operating plans across all steps of the product and service lifecycle.life cycle. We continue workingseek to improve the operations and execution of our businesses on an ongoing basis, and our ability to effectmake the desired improvements will be a significantis an important factor in determining theour profitability and overall financial performance of the Companyperformance. We also face operational risks in connection with launching or ramping newer product platforms, such as a whole. For example, new product introductions remain important to onshore and offshore wind customers, and in that environment the Renewable Energy business will need to continue to prioritize product quality, delivery and other aspects of its operational execution as new technology of larger turbines is introduced, including the Haliade-X offshore wind turbine.turbine platform or new onshore wind turbine models at Renewable Energy, or the LEAP or GE9X engines at Aerospace. Particularly with newer product platforms and technologies, our businesses seek to reduce the costs of these products over time with experience, and risks related to our supply chain, the availability of skilled labor, product quality, timely delivery or other aspects of operational execution can adversely affect our ability to meet customers' expectations, profits and cash flows. Many of our customer contracts are complex and contain provisions that could cause us to incur penalties, be liable for liquidated damages and incur unanticipated expenses with respect to the timely delivery, functionality, deployment, operation, durability, and availability of our products, solutions and services. Operational failures at any of our businesses that result in quality problems or potential product, environmental, health or safety risks, could have a material adverse effect on our business, reputation, financial position, cash flows and results of operations.
In addition, a portion of our business, particularly within our Power and Renewable Energy businesses involvesare often involved in large projects where we take on, or are members of a consortium responsible for, the full scope of engineering, procurement, construction or other services. These types of projects oftenthat pose unique risks related to their location, scale, complexity, duration and pricing or payment structure. At times, these businesses sell products through or with engineering, procurement and production firms, where we can be either a sub-supplier or a consortium partner. The scope of supply can range from products alone to extended plant scope, including plant-level guarantees. Delivering on large projects with multiple parties and subcontractors involved, particularly outside of mature markets in the U.S. and Europe, is highly complex with risks related to the safety and security of workers, impacts on local communities, corruption, breach or theft of intellectual property and other factors. Performance issues or schedule delays can arise due to inadequate technical expertise, unanticipated project modifications, developments at project sites, environmental, health and safety issues, execution by or coordination with suppliers, subcontractors or consortium partners, financial difficulties of our customers or significant partners or compliance with government regulations, and these can lead to cost overruns, contractual penalties, liquidated damages and other adverse consequences. Where GE is a member of a consortium, we are typically subject to claims based on joint and several liability, and claims can extend to aspects of the project or costs that are not directly related or limited to GE’s scope of work or over which GE does not have control. Operational, quality or other issues at large projects, or across our projects portfolio more broadly, can adversely affect GE’s business, reputation, cash flows or results of operations.
Product safety and quality - Our products and services are highly sophisticated and specialized, and a major failure or similar eventquality issue affecting our products or third-party products with which our products are integrated can adversely affect our business, reputation, financial position, results of operations and cash flows.flows. We produce highly sophisticated products and provide specialized services for both our own and third-party products that incorporate or use complex or leading-edge technology, including both hardware and software. Many of our products and services involve complex industrial machinery or infrastructure projects, such as commercial jet engines, gas turbines, onshore and offshore wind turbines or nuclear power generation, and accordingly the adverse impact of product quality issues can be significant. Actual or perceived design, production, performance or other quality issues related to new product introductions or existing product lines can result in direct warranty, maintenance and other costs, including costs associated with project delays. For example, in the third quarter of 2022, we booked a provision due to changes in estimates for existing warranties for the deployment of repairs and other corrective measures to improve overall quality and fleet availability relating to our Onshore Wind business. Quality issues can also result in reputational harm to our businesses, with a potential loss of attractiveness of our products, solutions and services to new and existing customers. A widespread fleet issue could result in revenue loss while the associated product is suspended from operation. This risk is pronounced, for example, in connection with the introduction of new technology in the main components of offshore wind turbines due to the challenges of servicing and performing maintenance on offshore wind turbines and the difficulties associated with scaling up production of new components. In addition, a catastrophic product failure or similar event could be significant. In particular, actual or perceived design or production issues related to new product introductions or relatively new product lines can result in significant reputational harm to our businesses, in addition to direct warranty, maintenance and other costs that may arise. A significant product issue resulting in injuries or death, widespread outages, a fleet grounding or similar systemic consequences could have a material adverse effect on our business, reputation, financial position, cash flows and results of operations. WeEven when there have not been a particularly significant or widespread product failures in the field, many of our products and services must function under demanding operating conditions and meet exacting and evolving certification, performance, reliability and durability standards that we, our customers or regulators adopt. Developing and maintaining products that meet or exceed these can be costly and technologically challenging, and may also involve extensive coordination of suppliers and highly skilled labor from thousands of workers; a failure to deliver products and services that meet these standards could have significant adverse financial, competitive or reputational effects. Technical, mechanical and other failures occur from time to time, whether as a result of manufacturing or design defect, operational process or production issue attributable to us, our customers, suppliers, third party integrators or others.
In some circumstances we have also incurred and in the future we may continue to incur increased costs, delayed payments or lost equipment or services revenue in connection with a significant issue with a third party’s product with which our products are integrated, or if parts or other components that we incorporate in our products have defects or other quality issues. For example, the LEAP-1B engine thata prolonged aircraft grounding, certification or production delays or other adverse developments with aircraft powered by our Aviation business develops, produces and sells through CFM is the exclusive engine for the Boeing 737 MAX, which was subjectengines can pose risk to a global fleet grounding for nearly two years until November 2020 following two fatal crashes that were unrelated to the LEAP engine. The pace and success of the 737 MAX’s safe return to service and the corresponding LEAP engine production rates will have material significance to the results and outlook of our AviationAerospace business. There can be no assurance that the operational processes around sourcing, product design, manufacture, performance and servicing that we or our customers or other third parties have designed to meet rigorous quality standards will be sufficient to prevent us or our customers or other third parties from experiencing operational process or product failures and other problems, including through manufacturing or design defects, process or other failures of contractors or third-party suppliers, cyber-attackscyber-
attacks or other intentional acts, software vulnerabilities or malicious software, that could result in potential product, safety, quality, regulatory or environmental risks.
Cybersecurity - Increased cybersecurity requirements, vulnerabilities, threats and more sophisticated and targeted computer crime, as well as cybersecurity failures, pose a risk to our systems, networks, products, solutions, services and data. Increased global cybersecurity requirements, vulnerabilities, threats, computer viruses and more sophisticated and targeted cyber-related attacks such as ransomware, as well as cybersecurity failures resulting from human error andor technological errors, pose a risk to the security of GE's and its customers', partners', suppliers' and third-party service providers' infrastructure, products, systems and networks and the confidentiality, availability and integrity of GE's and its customers' data. As thedata, as well as associated financial and reputational risks. The perpetrators of such attacks become more capable (includinginclude sophisticated state ormalicious actors including states and state-affiliated actors), and asactors targeting critical infrastructure is increasingly becoming digitized, theinfrastructure. The risks in this area continue to grow.grow, and cyberattacks are expected to accelerate on a global basis in frequency and impact as threat actors increasingly use artificial intelligence and other techniques to circumvent security controls, evade detection and remove forensic evidence. As a result, we may be unable to promptly or effectively detect, investigate, remediate or recover from cybersecurity attacks, which may result in material harm to our systems, information or business.
We have experienced, and expect to continue to experience, cyberattacks of varying degrees of sophistication and other cybersecurity incidents. Bad actors have attempted and we expect will continue to attempt to use our separation of GE HealthCare in January 2023 and the planned separation of GE Aerospace and GE Vernova into independent companies as an opportunity to launch attacks or increase their number of attacks against GE’s networks and systems, as well as attempt to use social engineering tactics or phishing emails to induce our employees to reveal sensitive information or install malware. A significant cyber-related attack against us, a key third-party system or a network that we use, or in one of our industries evensuch as an attack on power grids, power plants or commercial aircraft (even if such an attack does not involve GE products, services or systems,systems), could pose broader disruptions and adversely affect our business. For example,The large number of suppliers that we have observed an increase in third-party breaches at suppliers, service providerswork with requires significant effort for the initial and software providers, and our efforts to mitigate adverse effects on GE if this trend continues may be less successful inongoing verification of the future.effective implementation of cybersecurity requirements by suppliers. The increasing degree of interconnectedness between GE and its partners, suppliers and customers also poses a risk to the security of GE’s network as well as the larger ecosystem in which GE operates. There can be no assurance that our attempts to mitigate cybersecurity risks by employing a number of measures, including employee training, monitoring and testing, performing security reviews and requiring business partners with connections to the GE network to appropriately secure their information technology systems, and maintenance of protective systems and contingency plans, will be sufficientOur risk mitigation efforts may fail to prevent, detect and limit the impact of cyber-related attacks, and we remain vulnerable to known orand unknown cybersecurity threats. In addition to existing risks, the
The continued adoption of new technologies in the future mayby our businesses and our suppliers also increaseincreases our exposure to cybersecurity breaches and failures. While we have developed secure development lifecycle design practices to secure our software designs and connected products, anthreats. An unknown vulnerability or compromise could potentially impact the security of GE’sin our or a third-party product (for example, open source software) may expose our systems, networks, software or connected products to malicious actors and lead to the misuse or unintended use of our products, loss of GE intellectual property, misappropriation of sensitive, confidential or personal data, safety risks or unavailability of equipment. We also have access to sensitive, classified, confidential or personal data or information in certain of our businesses that is subject to privacy and security laws, regulations or customer-imposed controls. Despite our use of reasonable and appropriate controls to protect our systems and sensitive, confidential or personal data or information, we have vulnerabilityWe are vulnerable to security breaches, theft, misplaced, lost or corrupted data, programming errors and misconfigurations, employee errors (including as a result of social engineering/phishing) and/or malfeasance (including misappropriation by insiders or departing employees) that could potentially lead to material compromising ofmay compromise sensitive, classified, confidential or personal data or information, improper use of our systems, software solutions or networks, unauthorized access, use, disclosure, modification or destruction of or denial of access to information, defective products, production downtimes and operational disruptions. DataIn addition, our suppliers may be the victim of a cyber-related incident that could compromise our intellectual property, personal data or other confidential information, or result in production downtimes and operational disruptions that could cause us to breach our commitments to customers. An unknown security vulnerability or malicious software in a product used by a supplier to deliver a service or embedded in a supplier’s product that is later integrated into a GE product could lead to a vulnerability in the security of GE’s product or, if used internally in the GE network environment, to a compromise of the GE network, which may lead to the loss of information or operational disruptions. Cybersecurity-related and data privacy and protection laws and regulatory regimes are evolving, can vary significantly by country and present increasing compliance challenges, whichand we from time to time receive, and in the future will likely receive, regulatory inquiries about specific incidents or aspects of our cybersecurity framework; these dynamics increase our costs, affect our competitiveness and can expose us to substantial fines or other penalties.penalties and reputational risks. In addition, a significant cyber-related attack couldcybersecurity incidents can result in other negative consequences, regardless of whether the direct effects of an incident are significant, including damage to our reputation or competitiveness, restoration and remediation costs, increased digital infrastructure or increased protectionrelated costs that are not covered by insurance, and costs or fines arising from litigation or regulatory action.investigations or actions. While we carry cyber insurance, we cannot be certain that our coverage will be adequate for liabilities actually incurred, that insurance will continue to be available to us on economically reasonable terms, or at all, or that any insurer will not deny coverage as to any future claim.
Supply chain - Significant raw material or other component shortages, supplier capacity constraints, supplier or customer production disruptions, supplier quality and sourcing issues or price increases canhave increased, and may continue to increase, our operating costs and can adversely impact the competitive positions of our products.Our reliance on third-party suppliers, contract manufacturers and service providers, and commodity markets to secure raw materials, parts, components and sub-systems used in our products exposes us to volatility in the prices and availability of these materials, parts, components, systems and services. As our supply chains are complex and extend into many different countries and regions around the world, we are also subject to global economic and geopolitical dynamics and risks associated with exporting components manufactured in particular countries for incorporation into finished products completed in other countries. We operate in a supply-constrained environment and are facing, and may continue to face, supply-chain shortages, inflationary pressures, shortages of skilled labor, transportation and logistics challenges and manufacturing disruptions that impact our revenues, profitability and timeliness in fulfilling customer orders. We anticipate supply chain pressures across our businesses will continue to challenge and adversely affect our operations and financial performance for some period of time. For example, successfully executing the significant production and delivery ramp-up efforts at our Aerospace business from both strong demand for newer engine platforms such as the LEAP and the aviation sector’s recovery from the COVID-19 pandemic, depends in part on our suppliers having access to the materials and skilled labor they require and making timely deliveries to
us, as well as meeting the required quality and performance standards for commercial aviation. In addition, some of our suppliers or their sub-suppliers are limited- or sole-source suppliers, and our ability to meet our obligations to customers depends on the performance, product quality and stability of such suppliers. We also have internal dependencies on certain key GE manufacturing or other facilities. Disruptions in deliveries, from a key GE facility or from our third-party suppliers, contract manufacturers or outsourced or other service providers, capacity constraints, production disruptions up- or down-stream, price increases, or decreased availability of raw materials or commodities, including as a result of war, natural disaster,disasters (including the effects of climate change such as sea level rise, drought, flooding, wildfires and more intense weather events), actual or threatened public health pandemics or emergencies or other business continuity events, adversely affect our operations and, depending on the length and severity of the disruption, can limit our ability to meet our commitments to customers or significantly impact our operating profit or cash flows. Quality, capability, compliance and sourcing issues experienced by third-party providers can also adversely affect our costs, margin rates and the quality and effectiveness of our products and services and result in liability and reputational harm; theharm. The harm to us could be significant if, for example, a quality issue at a supplier or with components that we integrate into our products results in a widespread quality issue across one of our product lines or our fleet.installed base of equipment. In addition, while we require our suppliers may experience cyber-related attacks, as described above, which could negatively impact their ability to implementmeet their delivery obligations to us and maintain reasonable and appropriate controls to protect information we provide to them, they may be the victim of a cyber-related attack that could lead to the compromise of the Company’s intellectual property, personal data or other confidential information, or to production downtimes and operational disruptions that couldin turn have an adverse effect on our ability to meet our commitments to customers. An unknown security vulnerability or malicious software embedded in a supplier’s product that is later integrated into a GE product could lead to a vulnerability in the security of GE’s product or if used internally in the GE network environment to a compromise of the GE network, which could potentially lead to the loss of information or operational disruptions.
FINANCIAL RISKS.Financial risk relates to our ability to meet financial goals and obligations and mitigate exposure to broad market risks, including credit risk; funding and liquidity risks, such as risk related to our credit ratings and our availability and cost of funding; credit risk; and volatility in foreign currency exchange rates, interest rates and commodity prices. Liquidity risk refers to the potential inability to meet contractual or contingent financial obligations (whether on- or off-balance sheet) as they arise, and could potentially impact our financial condition or overall safety and soundness. Credit risk is the risk of financial loss arising from a customer or counterparty failure to meet its contractual obligations, and we face credit risk arising from both our industrial businesses and from GE Capital.our remaining financial services operations. Liquidity risk refers to the potential inability to meet contractual or contingent financial obligations (whether on- or off-balance sheet) as they arise, and could potentially impact our financial condition, cash flow or overall safety and soundness.
Leverage & borrowingsCustomers and counterparties - Our indebtedness levels could limit the flexibility of our businesses, and we could face further constraints as a result of failing to decrease our leverage over time, further downgrades of our credit ratings or adverse market conditions. Our ability to decrease our leverage as planned is dependent primarily on cash flows from operations, as well as proceeds from dispositions. Continuing to de-lever and service our debt will require a significant amount of cash, and if we are unable to generate cash flows in accordance with our plans we may be required to adopt one or more alternatives such as increasing borrowing under credit lines, further reducing or delaying investments or capital expenditures, selling other businesses or assets, refinancing debt or raising additional equity capital. In addition, we have significant pension and run-off insurance liabilities that are sensitive to numerous factors and assumptions that we use in our pension liability, GAAP insurance reserve and statutory insurance calculations. For example, the impact of low or declining market interest rates on the discount rates that we use to calculate these long-term liabilities (holding other variables constant) can adversely affect our earnings and cash flows, as well as the pace of progress toward our leverage goals for GE and for GE Capital. Lower than expected cash generation by our businesses or disposition proceeds over time could also adversely affect our progress toward our leverage goals. Our indebtedness could put us at a competitive disadvantage compared to competitors with lower debt levels that may have greater financial flexibility to secure additional funding for their operations, pursue strategic acquisitions, finance long-term projects or take other actions. Continuing to have substantial indebtedness could also increase our vulnerability to general economic conditions, such as slowing economic growth or recession. It could also increase our vulnerability to adverse industry-specific conditions or to increases in the capital or liquidity needs at the GE or GE Capital levels, and it could limit our flexibility in planning for, or reacting to, changes in the economy and the industries in which we compete. In addition, our existing levels of indebtedness may impair our ability to obtain additional debt financing on favorable terms in the future, particularly if coupled with further downgrades of our credit ratings or a deterioration of capital markets conditions more generally. External conditions in the financial and credit markets, such as the increased economic uncertainty and reduced economic activity resulting from the COVID-19 pandemic, may limit the availability of funding at particular times or increase the cost of funding, which could adversely affect our business, financial position and results of operations.
Liquidity - Failure to meet our cash flow targets, or additional credit downgrades, could adversely affect our liquidity, funding costs and related margins. We rely primarily on cash from operations, as well as proceeds from business and asset dispositions and access to the short- and long-term debt markets, to fund our operations, maintain a contingency buffer of liquidity and meet our financial obligations and capital allocation priorities. If we do not meet our cash flow objectives, through both improved cash performance in our businesses or successful execution of business and asset dispositions, our financial condition could be adversely affected. Our access to the debt markets depends, in part, on our credit ratings. As previously reported, in April 2020, Moody's and S&P changed their credit rating outlooks for GE and GE Capital from Stable to Negative, and Fitch lowered its credit ratings for GE and GE Capital. There can be no assurance that we will not face additional credit downgrades as a result of factors such as our continued progress in decreasing our leverage, the performance of our businesses, the failure to execute on dispositions or changes in rating application or methodology for GE or GE Capital. Future downgrades could further adversely affect our cost of funds and related margins, liquidity, competitive position and access to capital markets, and a significant downgrade could have an adverse commercial impact on our industrial businesses. In addition, swap, forward and option contracts are executed under standard master agreements that typically contain mutual downgrade provisions that provide the ability of the counterparty to require termination if the credit ratings of the applicable GE entity were to fall below specified ratings levels agreed upon with the counterparty. For additional discussion about our current credit ratings and related considerations, refer to the Capital Resources and Liquidity - Credit Ratings and Conditions section within MD&A.
GE Capital - A smaller GE Capital continues to have exposure to insurance, credit, legal and other risks and, in the event of future adverse developments, may not be able to meet its business and financial objectives without further actions at GE Capital or additional capital contributions by GE compared to current plans. To fund the statutory capital contributions that it expects to make to its insurance subsidiaries over the next several years, as well as to meet its debt maturities and other obligations, GE Capital expects to rely on its existing liquidity, cash generated from asset sales and cash flows from its businesses, as well as GE repayments of intercompany loans and capital contributions from GE. However, as GE Capital’s excess liquidity from past disposition proceeds runs off, and as its future earnings are reduced as a result of business and asset sales, there is a risk that future adverse developments could cause liquidity or funding stress for GE Capital. For example, it is possible that future requirements for capital contributions to the insurance subsidiaries will be greater than currently estimated or could be accelerated by regulators. Our annual testing of insurance reserves is subject to a variety of assumptions, including assumptions about the discount rate (which is sensitive to changes in market interest rates), morbidity, mortality and future long-term care premium increases. Any future adverse changes to these assumptions (to the extent not offset by any favorable changes to these assumptions) could result in an increase to future policy benefit reserves and, potentially, to the amount of capital we are required to contribute to the insurance subsidiaries (as discussed in the Other Items - Insurance section within MD&A). We also anticipate that the new insurance accounting standard scheduled to be effective after 2022 (as discussed in the Other Items - New Accounting Standards section within MD&A) will significantly change the accounting for measurements of our long-duration insurance liabilities under GAAP and that the adoption of the accounting standard will materially affect our financial statements. In addition, we continue to evaluate strategic options to accelerate the further reduction in the size of GE Capital. Some of these options could have a material financial charge or other adverse effects depending on the timing, negotiated terms and conditions of any ultimate arrangements. It is also possible that contingent liabilities and loss estimates from GE Capital’s continuing or discontinued operations, such as those related to Bank BPH (see Note 23) will need to be recognized or increase in the future and will become payable. If GE Capital's credit ratings are downgraded because of inadequate increases in its capital levels over time, changes in rating application or methodology for GE Capital or other factors, GE Capital may also face increased interest costs and limitations on its ability to access external funding in the future. There can be no assurance that future liabilities, losses or impairments to the carrying value of financial assets would not materially and adversely affect GE Capital's business, financial position, results of operations and capacity to provide financing to support orders from GE's industrial businesses, or that factors causing sufficiently severe stress at GE Capital would not require GE to make larger than expected capital contributions to GE Capital in the future.
Customers & counterparties – Global economic, industry-specific or other developments that weaken the financial condition or soundness of significant customers, governments financial institutions or other parties we deal with can adversely affect our business, results of operations and cash flows.The business and operating results of our industrial businesses have been, and will continue to be, affected by worldwide economic conditions, including conditions in the air transportation, power generation, renewable energy healthcare and other industries we serve. Existing or potential customers may delay or cancel plans to purchase our products and services, including large infrastructure projects, and may not be able to fulfill their obligations to us in a timely fashion or at all as a result of business deterioration, cash flow shortages or difficulty obtaining financing for particular projects or due to macroeconomic conditions, geopolitical disruptions, changes in law or other challenges affecting the strength of the global economy. The airline industry, for example, is highly cyclical, and sustained economic growth and political stability in both developed and emerging markets are principal factors underlying long-term air traffic growth; the level of demandcurrent macroeconomic and geopolitical environment and the potential for air travel is correlatedrecession pose risks to the strengthrate of the U.S. and international economies.that growth. Aviation industrysector activity is also particularly influenced by the actions of a small group of large original equipment manufacturers, as well as large airlines in various geographies,geographies. We have significant business with, and our credit exposure to, some of our largest aviation customers is significant. As described above,and accordingly our Aerospace business performance can be adversely affected by challenges that individual customers or the current extendedindustry faces related to factors such as competition, the need for cost reduction, financial stability and soundness, and the availability of aircraft leasing and financing alternatives, the satisfaction of certification or other regulatory requirements for aircraft in various jurisdictions, the retirement of older aircraft and other dynamics affecting the original equipment and aftermarket service markets, or by a significant disruption of regional and international air travel fromsuch as what occurred during the COVID-19 pandemic has had and is expected to continue to have a material adverse effect on our airframer and airline customers.pandemic. A potential future disruption in connection with a terrorist incident, cyberattack, actual or threatened public health pandemic or emergency or recessionary economic environment that results in the loss of business and leisure traffic could also adversely affect these customers, their ability to fulfill their obligations to us in a timely fashion or at all, demand for our products and services and the viability of a customer’s business. Secular, cyclical or other pressures facing(See also Risk Factors - Commercial aviation sector.) In our Power and Renewable Energy businesses, our customers across our energy businesses,also face a variety of challenges, including in connection with decarbonization, industry consolidation, and competition and shifts in the availability of financing for certain types of power projects or technologies (such as prohibitions on financing for fossil fuel-based projects or technologies); these dynamics can also have a significant impact on the operating results and outlooks for our businesses operating in those industries. GE Capital also has exposure to many different industriesbusinesses. In addition, our customers include numerous governmental entities within and counterparties,outside the U.S., including customers that are sovereign governments or located in emerging markets,the U.S. federal government and routinely executes transactions with counterparties in the financial services industry, including brokersstate and dealers, commercial banks, investment banks, insurance companies and other institutional clients. Many of these transactions expose GE Capital and its subsidiaries to credit and other risks in the event of insolvency or other default of its counterparty or client. For example, a portion of GE Capital’s run-off insurance operations’ assets that are held in trust accounts associated with UFLIC reinsurance contracts and reinsurance security trust agreements are currently held in trusts for the benefit of insurance company subsidiaries of Genworth, which in January 2021 announced that it would focus on a contingency plan to meet its near-term liabilities amidst uncertainty around the completion of its planned merger with China Oceanwide. Solvency or other concerns about Genworth or its insurance company subsidiaries may cause those subsidiaries or their regulators to take or attempt to take actions that could adversely affect UFLIC, including control over assets in the relevant trusts.local entities. We also at times face greater challenges collecting on receivables with customers that are sovereign governments or located in emerging markets. If there is significant deterioration in the global economy, in our industries, in financial markets or with particular significant counterparties, our results of operations, financial position and cash flows could be materially adversely affected.
Run-off insurance and banking operations - We continue to have exposure to our run-off insurance operations and Bank BPH mortgage portfolio in Poland. While in recent years we have greatly reduced the scope of GE’s former financial services operations, we continue to retain significant exposure to legacy insurance and other financial services operations that will run off over a long period of time and, in the event of future adverse developments, could cause funding or liquidity stress. For example, it is possible that results of our statutory testing of insurance reserves in future years will require capital contributions to our insurance subsidiaries, even after we make the expected capital contribution in the first quarter of 2024 that will complete the contributions in connection with the statutory permitted practice approved in 2018 by the KID. Our statutory testing of insurance reserves is subject to a variety of assumptions, including assumptions about the discount rate (which is sensitive to changes in market interest rates), morbidity, mortality and future long-term care premium increases. Future adverse changes to these assumptions (to the extent not offset by any favorable changes to these assumptions) could result in an increase to future policy benefit reserves and, potentially, to the amount of capital we are required to contribute to our insurance subsidiaries (as discussed in the Other Items - Insurance section within MD&A). In addition, we have exposure to various financial counterparties that pose credit and other risks in the event of insolvency or other default. For example, a portion of our run-off insurance operations’ assets are held in trust accounts associated with reinsurance contracts. For our UFLIC subsidiary, such trust assets are currently held in trusts for the benefit of insurance company subsidiaries of Genworth, which has stated
in the past that it will not bolster the capital position of its insurance subsidiaries. Solvency or other concerns about Genworth or its insurance company subsidiaries may cause those subsidiaries or their regulators to take or attempt to take actions that could adversely affect UFLIC, including control over assets in the relevant trusts. It is also possible that additional contingent liabilities and loss estimates for Bank BPH, in connection with the ongoing litigation in Poland related to its portfolio of residential mortgage loans denominated in or indexed to foreign currencies (see Note 24), will need to be recognized (or loss estimates may increase in the future) and will become payable. Though we may consider strategic options to accelerate the further reduction in the size of these remaining financial services operations, such options may not be viable or attractive because of the associated cash payments, financial charges or other adverse effects. There can be no assurance that future liabilities, losses or impairments to the carrying value of assets within our financial services operations would not materially and adversely affect GE’s business, financial position, cash flows, results of operations or capacity to provide financing to support orders at the businesses.
Borrowings & liquidity – We may face risks related to our debt levels, particularly in severely adverse market conditions, and future credit downgrades could adversely affect our liquidity, funding costs and related margins. We have significantly reduced our debt levels over the past several years through liability management actions, and we intend to maintain a sustainable investment-grade long-term credit rating. Existing debt may adversely impact our ability to obtain new debt financing on favorable terms in the future, particularly if coupled with downgrades of our credit ratings or a deterioration of capital markets conditions more generally. There can be no assurance that we will not face future credit rating downgrades as a result of factors such as the performance of our businesses, reduced diversification of GE’s businesses following the planned separation into three independent companies or changes in rating application or methodology, and future downgrades could adversely affect our cost of funds, liquidity and competitive position. Further, our swap, forward and option contracts are executed under standard master agreements that typically contain mutual downgrade provisions that provide the ability of the counterparty to require termination if the credit ratings of the applicable GE entity were to fall below specified ratings levels. In addition, if we are unable to generate cash flows in accordance with our plans or face unforeseen needs for capital, we may adopt changes to our capital allocation plans (such as plans related to the timing or amounts of investments or capital expenditures, share repurchases or dividends) or take other actions. For additional discussion about our credit ratings and related considerations, refer to the Capital Resources and Liquidity section within MD&A.
Postretirement benefit plans - Increases in pension, healthcare and life insurance benefits obligations and costs can adversely affect our earnings, cash flows and further progress toward our leverage goalsgoals. . Our results of operations, cash flow and financial condition may be positively or negatively affected by the amount of income or expense we record for our defined benefit pension plans. GAAP requires that we calculate income or expense for the plans using actuarial valuations, which reflect assumptions about financial markets, interest rates and other economic conditions such as the discount rate and the expected long-term rate of return on plan assets. We are also required to make an annual measurement of plan assets and liabilities, which may result in a significant reduction or increase to equity. The factors that impact our pension calculations are subject to changes in key economic indicators, and future decreases in the discount rate or low returns on plan assets can increase our funding obligations and adversely impact our financial results. In addition, although GAAP expense and pension funding contributions are not directly related, key economic factors that affect GAAP expense, such as sustained market volatility, would also likely affect the amount of cash we would be required to contribute to pension plans under ERISA. FailureSuch factors could also result in a failure to achieve expected returns on plan assets driven by various factors, which could include a continued environment of low interest rates or sustained market volatility, could also result in an increase to the amount of cash we would be required to contribute to pension plans.assets. In addition, there may be upward pressure on the cost of providing healthcare benefits to current and future retirees, and life insurance benefits to eligible retirees. There can be no assurance that the measures we have taken to control increases in these costs, or that the assignment of assets and liabilities with respect to certain U.S. and non-U.S. benefit plans in connection with GE’s separation into three independent companies, will succeed in limiting cost increases, and continued upward pressure could reduce our profitability. For a discussion regarding how our financial statements have been and can be affected by our pension and healthcare benefit obligations, see Note 13.
LEGAL &AND COMPLIANCE RISKS.Legal and compliance risk relates to risks arising from the government and regulatory environment, and action and from legal proceedings and compliance with integrity policies and procedures, including thosematters relating to financial reporting and environmental,the environment, health and safety matters.safety. Government and regulatory risk includes the risk that the government or regulatory actions will impose additional cost on us or require us to make adverse changes to our business models or practices.
Regulatory - We are subject to a wide variety of laws, regulations and government policies that require ongoing compliance efforts and may change in significant ways.Our businesses are subject to regulation under a wide variety of U.S. federal and state and non-U.S. laws, regulations and policies.policies that require ongoing compliance efforts. There can be no assurance that laws, regulations and policies will not be changed or interpreted or enforced in ways that will require us to modify our business models and objectives or affect our returns on investments by restricting existing activities and products, subjecting them to escalating costs or prohibiting them outright. In particular, recent trends globally toward increased protectionism, import and export controls, andrequired licenses or authorizations to engage in business dealings with certain countries or entities, the use of tariffs, restrictions on outbound investment and other trade barriers can result in actions by governments around the world that have been and may continue to be disruptive and costly to our businesses, and can interfere with our global operating model and weaken our competitive position. In addition, changes in environmental and climate change laws, regulations or policies (including carbon pricing, emission standards or sustainable finance, among others) affecting the power or aviation sectors could lead to additional costs or compliance requirements, a need for additional investment in product designs, require carbon offset investments or otherwise negatively impact our businesses or competitive position. Other legislative and regulatory areas of significance for our businesses that U.S. and non-U.S. governments have focused and continue to focus on include cybersecurity, data privacy and sovereignty, improper payments,artificial intelligence, anti-corruption, competition law, public procurement law, compliance with complex trade controls and economic sanctions climate change and greenhouse gas emissions,laws, technical regulations or local content requirements that could result in market access criteria that our products cannot or do not meet, foreign exchange intervention in response to currency volatility and currency controls that could restrict the movement of liquidity from particular jurisdictions. Potential further changes to tax laws, including changes to taxation of global income, may have an effect on GE's, GE Capital's or other regulatedour subsidiaries' structure, operations, sales, liquidity, cash flows, capital requirements, effective tax rate and performance. For example, legislative or regulatory measures by
U.S. federal, states or non-U.S. governments, or rules, interpretations or audits under the new or existing tax laws such as global minimum taxes or other changes to the treatment of global income could increase our cash tax costs orand effective tax rate. In addition, efforts by public and private sectors to control healthcare costs may lead to lower reimbursements and increased utilization controls related to the use of our products by healthcare providers. Regulation or government scrutiny may impact the requirements for marketing our products and slow our ability to introduce new products, resulting in an adverse impact on our business. Furthermore, we have been, and expectmake sales to continue, participating in U.S. and internationalnon-U.S. governments and other public sector customers, and we participate in various governmental financing programs, whichthat require us to comply with strict governmental regulations. As a U.S. government contractor, we are also subject to risks relating to U.S. government audits and investigations that in the past have led, and in the future may lead to, fines, damages or other penalties. Inability to comply with theseapplicable regulations could adversely affect our status with government customers or our ability to participate in these projects, and could have collateral consequences such as suspension or debarment. Debarment,Suspension or debarment, depending on the entity involved and length of time, can limit our ability to bid for new U.S. government contracts or business with other government-related customers, or to participate in other projects involving multilateral development banks, and this could adversely affect our results of operations, financial position and cash flows.
Legal proceedings - We are subject to a variety of legal proceedings, disputes, investigations and legal compliance risks, including trailingcontingent liabilities from businesses that we dispose ofhave exited or that are inactive.We are subject to a variety of legal proceedings, commercial disputes, legal compliance risks and environmental, health and safety compliance risks in virtually every part of the world. We, our representatives and the industries in which we operate are subject to continuing scrutiny by regulators, other governmental authorities and private sector entities or individuals in the U.S., the European Union, China and other jurisdictions, which have led or may, in certain circumstances, lead to enforcement actions, adverse changes to our business practices, fines and penalties, required remedial actions such as contaminated site clean-up or other environmental claims, or the assertion of private litigation claims and damages that could be material. For example, followingsince our acquisition of Alstom's Thermal, Renewables and Grid businesses in 2015, we are subject to legacy legal proceedings and legal compliance risks that relate to claimed anti-competitive conduct or improper paymentscorruption by Alstom in the pre-acquisition period, and payments for settlements, judgments, penalties or other liabilities in connection with those matters have resulted and will in the future result in cash outflows. In addition, while in December 2020 we entered into a settlement to conclude thea previously disclosed SEC investigation of GE, we remain subject to a range of shareholder lawsuits related to the Company's financial performance, accounting and disclosure practices and related legacy matters. We have observed that these proceedings related to claims about past financial performance and reporting pose particular reputational risks for the Company that can cause new allegations about past or current misconduct, even if unfounded, to have a more significant impact on our reputation and how we are viewed by investors, customers and others than they otherwise would. We have established reserves for legal matters when and as appropriate; however, theThe estimation of legal reserves or possible losses involves significant judgment and may not reflect the full range of uncertainties and unpredictable outcomes inherent in litigation and investigations, and the actual losses arising from particular matters may exceed our current estimates and adversely affect our results of operations. There can be no assurance that theThe risk management and compliance programs we have adopted willand related actions that we take may not fully mitigate legal and compliance risks that we face, particularly in light of the global and diverse nature of our operations and the current enforcement environment.environments in many jurisdictions. For example, when we investigate potential noncompliance under U.S. and non-U.S. law involving GE employees or third parties we work with, in some circumstances we make self-disclosures about our findings to the relevant authorities who may pursue or decline to pursue enforcement proceedings against us in connection with those matters. We are also subject to material trailing legal liabilities from businesses that we dispose ofhave exited or that are inactive. We also expect that additional legal proceedings and other contingencies will arise from time to time. Moreover, we sell products and services in growth markets where claims arising from alleged violations of law, product failures or other incidents involving our products and services are adjudicated within legal systems that are less developed and less reliable than those of the U.S. or other more developed markets, and this can create additional uncertainty about the outcome of proceedings before courts or other governmental bodies in suchthose markets. See Note 2324 for further information about legal proceedings and other loss contingencies.
LEGAL PROCEEDINGS.Refer to Legal Matters and Environmental, Health and Safety Matters in Note 2324 to the consolidated financial statements for information relating to legal proceedings.
GE 20202023 FORM 10-K51 36
MANAGEMENT AND AUDITOR’S REPORTS
MANAGEMENT’S DISCUSSION OF FINANCIAL RESPONSIBILITY. Management is responsible for the preparation of the consolidated financial statements and related information that are presented in this report. The consolidated financial statements, which include amounts based on management’s estimates and judgments, have been prepared in conformity with U.S generally accepted accounting principles.
The Company designs and maintains accounting and internal control systems to provide reasonable assurance that assets are safeguarded against loss from unauthorized use or disposition, and that the financial records are reliable for preparing consolidated financial statements and maintaining accountability for assets. These systems are enhanced by policies and procedures, an organizational structure providing division of responsibilities, careful selection and training of qualified personnel, and a program of internal audits.
The Company engaged KPMGDeloitte & Touche LLP, an independent registered public accounting firm, to audit and render an opinion on the consolidated financial statements and internal control over financial reporting in accordance with the standards of the Public Company Accounting Oversight Board (PCAOB). In June 2020, we announced that the Audit Committee selected Deloitte and Touche LLP as the Company’s independent registered public accounting firm for the Company’s fiscal year ending December 31, 2021.
The Board of Directors, through its Audit Committee, which consists entirely of independent directors, meets periodically with management, internal auditors, and our independent registered public accounting firm to ensure that each is meeting its responsibilities and to discuss matters concerning internal controls and financial reporting. KPMGDeloitte & Touche LLP and the internal auditors each have full and free access to the Audit Committee.
MANAGEMENT’S ANNUAL REPORT ON INTERNAL CONTROL OVER FINANCIAL REPORTING. Management is responsible for establishing and maintaining adequate internal control over financial reporting for the Company. With our participation, an evaluation of the effectiveness of our internal control over financial reporting was conducted as of December 31, 2020,2023, based on the framework and criteria established in Internal Control – Integrated Framework (2013) issued by the Committee of Sponsoring Organizations of the Treadway Commission.
Based on this evaluation, our management has concluded that our internal control over financial reporting was effective as of December 31, 2020.2023.
Our independent registered public accounting firm has issued an audit report on our internal control over financial reporting. Their report follows.
| | | | | | | | |
| /s/ H. Lawrence Culp, Jr. | | /s/ Carolina Dybeck HappeRahul Ghai |
H. Lawrence Culp, Jr.
| | Carolina Dybeck HappeRahul Ghai |
| Chairman and Chief Executive Officer | | Chief Financial Officer |
February 12, 20212, 2024 | | |
DISCLOSURE CONTROLS. Under the direction of our Chief Executive Officer and Chief Financial Officer, we evaluated our disclosure controls and procedures and internal control over financial reporting and concluded that our disclosure controls and procedures were effective as of December 31, 2020.2023. There have been no changes in the Company’s internal control over financial reporting during the quarter ended December 31, 2020,2023, that have materially affected, or are reasonably likely to materially affect, its internal control over financial reporting.
GE 20202023 FORM 10-K52 37
REPORT OF INDEPENDENT REGISTERED PUBLIC ACCOUNTING FIRM
To the shareholders and the Board of Directors and Shareholders
of General Electric Company:Company
OpinionsOpinion on the Consolidated Financial Statements and Internal Control Over Financial Reporting
We have audited the accompanying consolidated statements of financial position of General Electric Company and consolidated affiliatessubsidiaries (the Company)"Company") as of December 31, 20202023, and 2019,2022, the related consolidated statements of earnings (loss), comprehensive income (loss), changes in shareholders’ equity, and cash flows for each of the three years in the three-year period ended December 31, 2020,2023, and the related notes (collectively referred to as the consolidated financial statements)“financial statements”). We also have audited the Company’s internal control over financial reporting as of December 31, 2020, based on criteria established in Internal Control – Integrated Framework (2013) issued by the Committee of Sponsoring Organizations of the Treadway Commission.
In our opinion, the consolidated financial statements referred to above present fairly, in all material respects, the financial position of the Company as of December 31, 20202023, and 2019,2022, and the results of its operations and its cash flows for each of the three years in the three-year period ended December 31, 2020,2023, in conformity with U.S.accounting principles generally accepted accounting principles. Also in our opinion, the United States of America.
We have also audited, in accordance with the standards of the Public Company maintained, in all material respects, effectiveAccounting Oversight Board (United States) (PCAOB), the Company's internal control over financial reporting as of December 31, 20202023, based on criteria established in Internal Control –— Integrated Framework (2013) issued by the Committee of Sponsoring Organizations of the Treadway Commission.
Basis for Opinions
The Company’s management is responsible for these consolidated financial statements, for maintaining effectiveCommission and our report dated February 2, 2024, expressed an unqualified opinion on the Company's internal control over financial reporting, andreporting.
Basis for its assessmentOpinion
These financial statements are the responsibility of the effectiveness of internal control over financial reporting, included in the accompanying Management’s Annual Report on Internal Control over Financial Reporting.Company's management. Our responsibility is to express an opinion on the Company’s consolidatedCompany's financial statements and an opinion on the Company’s internal control over financial reporting based on our audits.audit. We are a public accounting firm registered with the Public Company Accounting Oversight Board (United States) (PCAOB)PCAOB and are required to be independent with respect to the Company in accordance with the U.S. federal securities laws and the applicable rules and regulations of the Securities and Exchange Commission and the PCAOB.
We conducted our auditsaudit in accordance with the standards of the PCAOB. Those standards require that we plan and perform the auditsaudit to obtain reasonable assurance about whether the consolidated financial statements are free of material misstatement, whether due to error or fraud, and whether effective internal control over financial reporting was maintained in all material respects.
fraud. Our audits of the consolidated financial statementsaudit included performing procedures to assess the risks of material misstatement of the consolidated financial statements, whether due to error or fraud, and performing procedures that respond to those risks. Such procedures included examining, on a test basis, evidence regarding the amounts and disclosures in the consolidated financial statements. Our auditsaudit also included evaluating the accounting principles used and significant estimates made by management, as well as evaluating the overall presentation of the consolidated financial statements. Our audit of internal control over financial reporting included obtaining an understanding of internal control over financial reporting, assessing the risk that a material weakness exists, and testing and evaluating the design and operating effectiveness of internal control based on the assessed risk. Our audits also included performing such other procedures as we considered necessary in the circumstances. We believe that our audits provideaudit provides a reasonable basis for our opinions.opinion.
Definition and Limitations of Internal Control Over Financial Reporting
A company’s internal control over financial reporting is a process designed to provide reasonable assurance regarding the reliability of financial reporting and the preparation of financial statements for external purposes in accordance with generally accepted accounting principles. A company’s internal control over financial reporting includes those policies and procedures that (1) pertain to the maintenance of records that, in reasonable detail, accurately and fairly reflect the transactions and dispositions of the assets of the company; (2) provide reasonable assurance that transactions are recorded as necessary to permit preparation of financial statements in accordance with generally accepted accounting principles, and that receipts and expenditures of the company are being made only in accordance with authorizations of management and directors of the company; and (3) provide reasonable assurance regarding prevention or timely detection of unauthorized acquisition, use, or disposition of the company’s assets that could have a material effect on the financial statements.
Because of its inherent limitations, internal control over financial reporting may not prevent or detect misstatements. Also, projections of any evaluation of effectiveness to future periods are subject to the risk that controls may become inadequate because of changes in conditions, or that the degree of compliance with the policies or procedures may deteriorate.
Accompanying Supplemental Information
The accompanying consolidating information appearing on pages 57, 59, and 61 (the supplemental information) has been subjected to audit procedures performed in conjunction with the audit of the Company’s consolidated financial statements. The supplemental information is the responsibility of the Company’s management. Our audit procedures included determining whether the supplemental information reconciles to the consolidated financial statements or the underlying accounting and other records, as applicable, and performing procedures to test the completeness and accuracy of the information presented in the supplemental information. In our opinion, the supplemental information is fairly stated, in all material respects, in relation to the consolidated financial statements as a whole.
Critical Audit Matters
The critical audit matters communicated below are matters arising from the current periodcurrent-period audit of the consolidated financial statements that were communicated or required to be communicated to the audit committee and that:that (1) relate to accounts or disclosures that are material to the consolidated financial statements and (2) involved our especially challenging, subjective, or complex judgments. The communication of critical audit matters does not alter in any way our opinion on the consolidated financial statements, taken as a whole, and we are not, by communicating the critical audit matters below, providing separate opinions on the critical audit matters or on the accounts or disclosures to which they relate.
EvaluationSales of revenueservices - Revenue recognition on certain Power long-term service agreements
As discussed in Note - Refer to Notes 1 and 8 to the consolidated financial statements the
Critical Audit Matter Description
The Company enters into long-term service agreements with some ofcustomers within its customers. Certain long-term servicePower segment. These agreements require the Company to provide preventative and routine maintenance services, that may include levels of assurance regarding asset performanceoutage services, and uptime throughout the contract period.stand-by “warranty-type” services, which generally range from 5 to 25 years. Revenue for such long-term servicethese agreements is recognized using the percentage of completion method, based on costs incurred relative to total expected costs.
We identifiedestimated costs over the evaluationcontract term. As part of the revenue recognition on certain long-term service agreements as a critical audit matter because ofprocess, the complex auditor judgment required in evaluating some of the long-termCompany estimates in such arrangements. Such estimates include the amount ofboth customer payments that are expected to be received over the contract term, which are generally based on a combination of both historical customer utilization of the covered assets as well as forward-looking information such as market conditions. In addition, these estimates include the total costs expected to be incurred to perform required maintenance services over the contract term and include estimates of expected cost improvements when such cost improvements are supported by actual results or have been proven effective. Further, contract modifications that extend or revise contract terms are not uncommon and require judgment in evaluating the related revisions of the long-term estimates.
The following are the primary procedures we performed to address this critical audit matter. We evaluated the design and tested the operating effectiveness of certain internal controls over the Company’s revenue recognition process for long-term service agreements, including controls related to estimating customer payments and costs expected to be incurred to perform required maintenance services over the contract term. Key assumptions within those estimates that require significant judgment from management include: (a) how the customer will utilize the assets covered over the contract term, (b) the expected timing and extent of future maintenance and outage services, (c) the future cost of materials, labor, and other resources, and (d) forward looking information concerning market conditions.
Given the complexity involved with evaluating the key estimates, which includes significant judgment necessary to estimate future costs, auditing management’s assumptions within the key estimates required a high degree of auditor judgment and extensive audit effort, including the involvement of professionals with specialized skills and industry knowledge.
How the Critical Audit Matter Was Addressed in the Audit
Our auditing procedures over the key estimates and assumptions described above related to the amount and timing of revenue recognition of the long-term service agreements, within the Power segment, included the following, among others:
•We tested the effectiveness of controls over the revenue recognition process for the long-term service agreements, including controls over management’s key estimates.
•We evaluated management’s risk assessment process through observation of key meetings and processes, including inspection of documentation, addressing contract status and current market conditions.
•We evaluated the appropriateness and consistency of management’s methods and key assumptions to develop cost estimates, including expected timing and extent of future maintenance and outage services as well as the future cost of materials, labor and other resources, all of which impact contract margin.
•We tested management’s utilization assumptions for timing and extent of future maintenance and overhaul services projected for the contract term by comparing current estimates to historical information and forward-looking market conditions.
•We tested management’s process for estimating the timing and amount of costs associated with maintenance, outage, and other major events throughout the contract term, including comparing estimates to historical cost experience, performing a retrospective review, performing analytical procedures, and utilizing specialists to evaluate engineering studies used by the Company to estimate the useful life of capital parts of certain installed equipment.
Sales of services - Revenue recognition on certain Aerospace long-term service agreements - Refer to Notes 1 and 8 to the financial statements
Critical Audit Matter Description
The Company enters into long-term service agreements with certain customers. These agreements require the Company to provide maintenance services for customer assets over the contract term, which generally range from 10 to 25 years. Revenue for these agreements is recognized using the percentage of completion method, based on costs incurred relative to total estimated costs over the contract term. As part of the revenue recognition process, the Company estimates both customer payments by comparing the estimated customer utilization of the covered assets to historical utilization and industry utilization data, specifically considering the information provided by the Company’s airline customers about the current outlook in response to the COVID-19 pandemic for commercial air travel and after-market services within the Aviation segment, where available. We evaluated the estimated coststhat are expected to be incurredreceived and costs to perform required maintenance services over the contract term by:
•comparing estimatedterm. Key assumptions within those estimates that require significant judgment from management include: (a) how the customer will utilize the assets covered over the contract term; (b) the expected timing and extent of future overhaul services; (c) the future cost of materials, labor, and part costs to historical laborother resources; and parts costs,
•comparing the estimated useful life, which is referred to as part life, of certain component parts to historical data and regulatory limits on part life, where applicable,
•inspecting evidence underlying the inclusion of cost improvements in estimated costs, including regulatory and engineering approvals and actual reductions in production costs to date, and
•ascertaining if major overhauls of covered assets are included in the cost estimates on a basis consistent with the estimated customer utilization of the assets that is used in estimating customer payments.(d) forward looking information concerning market conditions.
In addition, weGiven the complexity involved valuationwith evaluating the key estimates, which includes significant judgment necessary to estimate future costs, auditing these assumptions required a high degree of auditor judgment and extensive audit effort, including the involvement of professionals with specialized skills and knowledge, who assistedindustry knowledge.
How the Critical Audit Matter Was Addressed in testing certainthe Audit
Our auditing procedures over the key estimates described above related to the amount and timing of revenue recognition of the long-term service agreements included the following, among others:
•We tested the effectiveness of controls over the revenue recognition process for the long-term service agreements, including controls over management’s key estimates.
•We evaluated management’s risk assessment process through observation of key meetings and processes, including inspection of documentation, addressing contract status and current market conditions including the timely incorporation of changes that affect total estimated costs to complete the contract.
•We evaluated the appropriateness and consistency of management’s methods and key assumptions applied in recognizing revenue and developing cost estimates.
•We tested management’s utilization assumptions for the assets covered over the contract term, which impact the estimated timing and extent of future maintenance and overhaul services by comparing current estimates to historical information and forward-looking market conditions.
•We tested management’s process for estimating the timing and amount of costs associated with overhaul and other maintenance events throughout the contract term, including assessingcomparing estimates to historical cost experience, performing a retrospective review, performing analytical procedures, and utilizing specialists to evaluate statistical models used by the Company to estimate the partuseful life of certain component partscomponents of the covered assets.installed engines.
Evaluation of premium deficiency testingFuture Policy Benefits - refer to assess the adequacy of future policy benefit reserves
As discussed in Note 12 to the consolidated financial statements the Company performs premium deficiency testing to assess the adequacy of
Critical Audit Matter Description
The liability for future policy benefit reserves. This testingbenefits as of December 31, 2023 is performedmeasured under ASU 2018-12 “Targeted Improvements to the Accounting for Long Duration Contracts” (LDTI) based on an annual basis, or whenever events and changes in circumstances indicate that a premium deficiency event may have occurred. current assumptions applied to the underlying policy cash flows. The liability for future policy benefits includes $26,832 million for long term care policies.
Significant uncertainties exist in testingevaluating future cash flow projections, in the premium deficiency testing for these insurance contracts, including consideration of a wide range of possible outcomes of future events over the life of the underlyinginsurance contracts that can extend for long periods of time.
We identifiedKey assumptions impacting the evaluation of premium deficiency testing to assess the adequacy of future policy benefit reserves as a critical audit matter. Specifically, the evaluation of the following key assumptionscash flow projections used in the premium deficiency testing requiredmeasurement of such liabilities that are sensitive and are more subjective auditorrequiring significant judgment by management are rate of changes in morbidity and specialized skills and knowledge: long-term care morbidity improvement and mortality improvement, discount rates, andfuture long-term care premium rate increases.
The following areGiven the primary procedures we performed to address this critical audit matter. We evaluatedsignificant judgments required by management, auditing the design and tested the operating effectiveness of certain internal controls over the Company’s premium deficiency testing process, including controls to develop the key assumptions described above. In addition, we involved actuarial professionals with specialized skills and knowledge, who assisted in:
•assessing the Company’s key assumptions and results by evaluating the relevance, reliability, and consistency of the assumptions with each other, the underlying data, relevant historical data, and industry data,
•assessing the summary experience data and the corresponding actuarial assumptionsliability for conformity with generally accepted actuarial principles,
•performing recalculations to assess that the key assumptions were reflected in the cash flow projections, and
•comparing the current year and prior year cash flow projections to analyze the impact of the updated key assumptions on the gross premium valuation used to assess the adequacy of the future policy benefit reserves.benefits required a high degree of auditor judgment and an increased extent of effort, including the involvement of actuarial specialists.
How the Critical Audit Matter Was Addressed in the Audit
Our audit procedures, including those performed by our actuarial specialists, included the following, among others:
We tested the effectiveness of controls related to the determination of the liability for future policy benefits.
•We evaluated projectedjudgments applied by management in setting key assumptions by considering actual experience, sensitivity analysis and relevant industry data, when available. We performed retrospective reviews of future long-term premium rate increases by comparing the proposed, attained, denied, and approvedcare premium rate increases to underlying source documentation. We also compared the current year premium rate increase projection to actual historical rate increase experience.evaluate for management bias.
Evaluation•We tested the underlying data for completeness and accuracy, including historical cash flows that served as a basis for the actuarial estimates.
•We performed policy level testing to assess that management’s intended assumptions were used and the model accurately calculated the cash flow projections.
•We validated the levels of aggregation of the carrying value of goodwill in the Additive and GECAS reporting units
As discussed in Note 8 to the consolidated financial statements, the Company performs a goodwill impairment test on an annual basis or whenever events or changes in circumstances indicate that the carrying value of a reporting unit might exceed its fair value. The discount rate applied to projected cash flows and the selection of publicly traded companies are important elements usedliability calculations determined by the Company were in determiningaccordance with their policy and performed recalculations on a sample basis to validate the fair value of each reporting unit and the amount of related goodwill impairment losses. In the second quarter of 2020, the Company performed an interim goodwill impairment test in response to the decline in current market conditions as a result of the COVID-19 pandemic. The goodwill allocated to the Additive reporting unit and the goodwill allocated to the GE Capital Aviation Services (GECAS) reporting unit were determined to be impaired, and impairment losses of $877 million and $839 million were recorded, respectively.
We identified the evaluationappropriateness of the discount rate applied to projected cash flowsassumptions used in the assessment of the carrying value of goodwill for the Additive reporting unit, and the evaluation of publicly traded companies used in the assessment of the carrying value of goodwill for the GECAS reporting unit, for which such assumptions are used by the Company in the determination of related goodwill impairment losses, as a critical audit matter. Specifically, the evaluation of these assumptions requiredtested the application of subjective auditor judgment because changes to these assumptions may have a substantial impact on the determination of fair value of each reporting unit. We performed sensitivity analyses to determine the significance of the assumptionsnet premium ratio used to determinemeasure the fair value of the Additive and GECAS reporting units, individually and in the aggregate, which required a higher degree of auditor judgment.
The following are the primary procedures we performed to address this critical audit matter. We evaluated the design and tested the operating effectiveness of certain internal controls over the Company’s goodwill impairment process, including controls over the Company’s selection of the discount rate, and the relevance of the publicly traded companies selected by the Company’s specialists. In our evaluation of the Additive reporting unit fair value, we evaluated the Company’s assessment of the value of the reporting unit under the discounted cash flow method. We involved valuation professionals with specialized skills and knowledge, who assisted in evaluating the reasonableness of the discount rate applied to projected cash flows selected by management by comparing the discount rate selected by management against a discount rate that was independently developed using publicly available market dataliability for comparable entities. In our evaluation of the GECAS reporting unit fair value, we involved valuation professionals with specialized skills and knowledge, who assisted in evaluating the Company’s assessment of the value of the reporting unit under the market approach. We evaluated the reasonableness of the market approach utilized and we evaluated the relevance of the publicly traded companies utilized by:
•comparing the publicly traded companies selected in management’s analysis over the GECAS reporting unit to similar companies in the aircraft leasing industry, and
•comparing management’s determination of the fair value of the GECAS reporting unit to a range of fair values that was independently developed.future policy benefits.
Evaluation of the effects of particular tax positions
As discussed in Note 15 to the consolidated financial statements, the Company’s annual tax rate is based on the Company’s income, statutory tax rates, and the effects of tax positions taken in the various jurisdictions in which the Company operates. Tax laws are complex and subject to different interpretations by taxpayers and respective government taxing authorities.
We identified the evaluation of the effects of particular tax positions as a critical audit matter. Complex auditor judgment was involved in evaluating the Company’s interpretation of applicable tax laws and regulations for these tax positions, including the evaluation of income tax uncertainties related to the tax positions.
The following are the primary procedures we performed to address this critical audit matter. We evaluated the design and tested the operating effectiveness of certain internal controls over the Company’s income tax process for particular tax positions, including controls related to the Company’s interpretation of applicable tax laws and regulations and the evaluation of income tax uncertainties. We inspected relevant documentation related to particular tax positions, including correspondence between the Company and taxing authorities. In addition, we involved tax professionals with specialized skills and knowledge, who assisted in:
•evaluating the Company’s interpretation and application of relevant tax laws and regulations related to the tax positions, including income tax uncertainties, and
•assessing the Company’s computation of the effects of the tax positions.
| | |
| /s/ DELOITTE & TOUCHE LLP |
|
| Boston, Massachusetts |
/s/ KPMG LLPFebruary 2, 2024 |
KPMG LLP
We have served as the Company's auditor since 1909.2020. |
REPORT OF INDEPENDENT REGISTERED PUBLIC ACCOUNTING FIRM
To the shareholders and the Board of Directors of General Electric Company
Opinion on Internal Control over Financial Reporting
We have audited the internal control over financial reporting of General Electric Company and subsidiaries (the “Company”) as of December 31, 2023, based on criteria established in Internal Control — Integrated Framework (2013) issued by the Committee of Sponsoring Organizations of the Treadway Commission (COSO). In our opinion, the Company maintained, in all material respects, effective internal control over financial reporting as of December 31, 2023, based on criteria established in Internal Control — Integrated Framework (2013) issued by COSO.
We have also audited, in accordance with the standards of the Public Company Accounting Oversight Board (United States) (PCAOB), the consolidated financial statements as of and for the year ended December 31, 2023, of the Company and our report dated February 2, 2024, expressed an unqualified opinion on those financial statements.
Basis for Opinion
The Company’s management is responsible for maintaining effective internal control over financial reporting and for its assessment of the effectiveness of internal control over financial reporting, included in the accompanying Management’s Annual Report on Internal Control over Financial Reporting. Our responsibility is to express an opinion on the Company’s internal control over financial reporting based on our audit. We are a public accounting firm registered with the PCAOB and are required to be independent with respect to the Company in accordance with the U.S. federal securities laws and the applicable rules and regulations of the Securities and Exchange Commission and the PCAOB.
We conducted our audit in accordance with the standards of the PCAOB. Those standards require that we plan and perform the audit to obtain reasonable assurance about whether effective internal control over financial reporting was maintained in all material respects. Our audit included obtaining an understanding of internal control over financial reporting, assessing the risk that a material weakness exists, testing and evaluating the design and operating effectiveness of internal control based on the assessed risk, and performing such other procedures as we considered necessary in the circumstances. We believe that our audit provides a reasonable basis for our opinion.
Definition and Limitations of Internal Control over Financial Reporting
A company’s internal control over financial reporting is a process designed to provide reasonable assurance regarding the reliability of financial reporting and the preparation of financial statements for external purposes in accordance with generally accepted accounting principles. A company’s internal control over financial reporting includes those policies and procedures that (1) pertain to the maintenance of records that, in reasonable detail, accurately and fairly reflect the transactions and dispositions of the assets of the company; (2) provide reasonable assurance that transactions are recorded as necessary to permit preparation of financial statements in accordance with generally accepted accounting principles, and that receipts and expenditures of the company are being made only in accordance with authorizations of management and directors of the company; and (3) provide reasonable assurance regarding prevention or timely detection of unauthorized acquisition, use, or disposition of the company’s assets that could have a material effect on the financial statements.
Because of its inherent limitations, internal control over financial reporting may not prevent or detect misstatements. Also, projections of any evaluation of effectiveness to future periods are subject to the risk that controls may become inadequate because of changes in conditions, or that the degree of compliance with the policies or procedures may deteriorate.
| | |
| /s/ DELOITTE & TOUCHE LLP |
|
| Boston, Massachusetts |
February 12, 20212, 2024 |
| | | | | | | | | | | |
| STATEMENT OF EARNINGS (LOSS) | Consolidated |
| For the years ended December 31 (In millions; per-share amounts in dollars) | 2020 | 2019 | 2018 |
| Sales of goods | $ | 49,464 | | $ | 58,949 | | $ | 60,148 | |
| Sales of services | 23,558 | | 28,538 | | 28,792 | |
| GE Capital revenues from services | 6,597 | | 7,728 | | 8,072 | |
| Total revenues (Note 25) | 79,619 | | 95,214 | | 97,012 | |
| | | |
| Cost of goods sold | 42,041 | | 45,902 | | 47,570 | |
| Cost of services sold | 18,380 | | 21,009 | | 21,833 | |
| Selling, general and administrative expenses | 12,621 | | 13,949 | | 14,643 | |
| Research and development | 2,565 | | 3,118 | | 3,415 | |
| Interest and other financial charges | 3,273 | | 4,227 | | 4,766 | |
| Insurance losses and annuity benefits (Note 12) | 2,397 | | 3,294 | | 2,790 | |
| Goodwill impairments (Note 8) | 1,717 | | 1,486 | | 22,136 | |
| Non-operating benefit costs | 2,433 | | 2,844 | | 2,753 | |
| Other costs and expenses | 384 | | 458 | | 414 | |
| Total costs and expenses | 85,809 | | 96,287 | | 120,320 | |
| | | |
| Other income (Note 19) | 11,387 | | 2,222 | | 2,321 | |
| | | |
Earnings (loss) from continuing operations before income taxes | 5,197 | | 1,149 | | (20,987) | |
| Benefit (provision) for income taxes (Note 15) | 474 | | (726) | | (93) | |
| Earnings (loss) from continuing operations | 5,672 | | 423 | | (21,080) | |
Earnings (loss) from discontinued operations, net of taxes (Note 2) | (125) | | (5,335) | | (1,363) | |
| Net earnings (loss) | 5,546 | | (4,912) | | (22,443) | |
Less net earnings (loss) attributable to noncontrolling interests | (158) | | 66 | | (89) | |
| Net earnings (loss) attributable to the Company | 5,704 | | (4,979) | | (22,355) | |
| Preferred stock dividends | (474) | | (460) | | (447) | |
Net earnings (loss) attributable to GE common shareholders | $ | 5,230 | | $ | (5,439) | | $ | (22,802) | |
| | | |
| Amounts attributable to GE common shareholders | | | |
| Earnings (loss) from continuing operations | $ | 5,672 | | $ | 423 | | $ | (21,080) | |
Less net earnings (loss) attributable to noncontrolling interests, continuing operations | (158) | | 7 | | (90) | |
Earnings (loss) from continuing operations attributable to the Company | 5,829 | | 416 | | (20,991) | |
| Preferred stock dividends | (474) | | (460) | | (447) | |
Earnings (loss) from continuing operations attributable to GE common shareholders | 5,355 | | (44) | | (21,438) | |
Earnings (loss) from discontinued operations, net of taxes | (125) | | (5,335) | | (1,363) | |
Less net earnings (loss) attributable to noncontrolling interests, discontinued operations | 0 | | 60 | | 1 | |
Net earnings (loss) attributable to GE common shareholders | $ | 5,230 | | $ | (5,439) | | $ | (22,802) | |
| | | |
| Per-share amounts (Note 18) | | | |
| Earnings (loss) from continuing operations | | | |
| Diluted earnings (loss) per share | $ | 0.59 | | $ | (0.01) | | $ | (2.47) | |
| Basic earnings (loss) per share | $ | 0.59 | | $ | (0.01) | | $ | (2.47) | |
| | | |
| Net earnings (loss) | | | |
| Diluted earnings (loss) per share | $ | 0.58 | | $ | (0.62) | | $ | (2.62) | |
| Basic earnings (loss) per share | $ | 0.58 | | $ | (0.62) | | $ | (2.62) | |
| | | |
| Dividends declared per common share | $ | 0.04 | | $ | 0.04 | | $ | 0.37 | |
| | | | | | | | | | | | | | | | | | | | | | | |
| STATEMENT OF EARNINGS (LOSS) (CONTINUED) | GE Industrial | | GE Capital |
| For the years ended December 31 (In millions) | 2020 | 2019 | 2018 | | 2020 | 2019 | 2018 |
| Sales of goods | $ | 49,443 | | $ | 59,138 | | $ | 60,147 | | | $ | 57 | | $ | 79 | | $ | 121 | |
| Sales of services | 23,656 | | 28,581 | | 28,891 | | | 0 | | 0 | | 0 | |
| GE Capital revenues from services | 0 | | 0 | | 0 | | | 7,188 | | 8,662 | | 9,430 | |
| Total revenues (Note 25) | 73,100 | | 87,719 | | 89,038 | | | 7,245 | | 8,741 | | 9,551 | |
| | | | | | | |
| Cost of goods sold | 42,030 | | 46,115 | | 47,591 | | | 48 | | 61 | | 95 | |
| Cost of services sold | 15,951 | | 19,051 | | 19,869 | | | 2,527 | | 2,019 | | 2,089 | |
| Selling, general and administrative expenses | 12,073 | | 13,404 | | 13,851 | | | 823 | | 931 | | 1,341 | |
| Research and development | 2,565 | | 3,118 | | 3,415 | | | 0 | | 0 | | 0 | |
| Interest and other financial charges | 1,333 | | 2,115 | | 2,415 | | | 2,186 | | 2,532 | | 2,982 | |
| Insurance losses and annuity benefits (Note 12) | 0 | | 0 | | 0 | | | 2,438 | | 3,353 | | 2,849 | |
| Goodwill impairments (Note 8) | 877 | | 1,486 | | 22,136 | | | 839 | | 0 | | 0 | |
| Non-operating benefit costs | 2,424 | | 2,828 | | 2,740 | | | 9 | | 16 | | 12 | |
| Other costs and expenses | 0 | | 0 | | (51) | | | 469 | | 480 | | 558 | |
| Total costs and expenses | 77,252 | | 88,118 | | 111,967 | | | 9,339 | | 9,392 | | 9,926 | |
| | | | | | | |
| Other income (Note 19) | 11,444 | | 2,200 | | 2,317 | | | 0 | | 0 | | 0 | |
| | | | | | | |
Earnings (loss) from continuing operations before income taxes | 7,291 | | 1,801 | | (20,612) | | | (2,095) | | (652) | | (375) | |
| Benefit (provision) for income taxes (Note 15) | (388) | | (1,309) | | (467) | | | 862 | | 582 | | 374 | |
| Earnings (loss) from continuing operations | 6,904 | | 492 | | (21,079) | | | (1,232) | | (69) | | (1) | |
Earnings (loss) from discontinued operations, net of taxes (Note 2) | (35) | | (5,527) | | 307 | | | (90) | | 192 | | (1,670) | |
| Net earnings (loss) | 6,868 | | (5,035) | | (20,772) | | | (1,322) | | 123 | | (1,672) | |
Less net earnings (loss) attributable to noncontrolling interests | (161) | | 66 | | (129) | | | 3 | | 1 | | 40 | |
| Net earnings (loss) attributable to the Company | 7,029 | | (5,101) | | (20,643) | | | (1,325) | | 122 | | (1,712) | |
| Preferred stock dividends | 0 | | 0 | | 0 | | | (474) | | (460) | | (447) | |
| Net earnings (loss) attributable to GE common shareholders | $ | 7,029 | | $ | (5,101) | | $ | (20,643) | | | $ | (1,800) | | $ | (338) | | $ | (2,159) | |
| | | | | | | |
| Amounts attributable to GE common shareholders: | | | | | | | |
| Earnings (loss) from continuing operations | $ | 6,904 | | $ | 492 | | $ | (21,079) | | | $ | (1,232) | | $ | (69) | | $ | (1) | |
Less net earnings (loss) attributable to noncontrolling interests, continuing operations | (161) | | 6 | | (130) | | | 3 | | 1 | | 40 | |
Earnings (loss) from continuing operations attributable to the Company | 7,065 | | 486 | | (20,949) | | | (1,235) | | (70) | | (42) | |
| Preferred stock dividends | 0 | | 0 | | 0 | | | (474) | | (460) | | (447) | |
Earnings (loss) from continuing operations attributable to GE common shareholders | 7,065 | | 486 | | (20,949) | | | (1,710) | | (530) | | (489) | |
Earnings (loss) from discontinued operations, net of taxes | (35) | | (5,527) | | 307 | | | (90) | | 192 | | (1,670) | |
Less net earnings (loss) attributable to noncontrolling interests, discontinued operations | 0 | | 60 | | 1 | | | 0 | | 0 | | 0 | |
Net earnings (loss) attributable to GE common shareholders | $ | 7,029 | | $ | (5,101) | | $ | (20,643) | | | $ | (1,800) | | $ | (338) | | $ | (2,159) | |
GE 20202023 FORM 10-K57 40
| | | | | | | | |
| STATEMENT OF FINANCIAL POSITION | Consolidated |
| December 31 (In millions, except share amounts) | 2020 | 2019 |
| Cash, cash equivalents and restricted cash(a) | $ | 36,630 | | $ | 35,811 | |
| Investment securities (Note 3) | 7,319 | | 9,888 | |
| Current receivables (Note 4) | 16,691 | | 16,568 | |
| Financing receivables – net (Note 5) | 1,265 | | 1,077 | |
| Inventories, including deferred inventory costs (Note 6) | 15,890 | | 17,215 | |
| Other GE Capital receivables | 3,331 | | 2,635 | |
| Receivable from GE Capital | 0 | | 0 | |
| Current contract assets (Note 9) | 5,764 | | 7,390 | |
| All other current assets (Note 10) | 1,522 | | 3,362 | |
| Assets of businesses held for sale (Note 2) | 0 | | 9,149 | |
| Current assets | 88,412 | | 103,096 | |
| | |
| Investment securities (Note 3) | 42,549 | | 38,632 | |
| Financing receivables – net (Note 5) | 1,771 | | 2,057 | |
| Other GE Capital receivables | 4,661 | | 4,509 | |
| Property, plant and equipment – net (Note 7) | 44,662 | | 45,879 | |
| Receivable from GE Capital | 0 | | 0 | |
| Goodwill (Note 8) | 25,524 | | 26,734 | |
| Other intangible assets – net (Note 8) | 9,774 | | 10,653 | |
| Contract and other deferred assets (Note 9) | 5,888 | | 5,737 | |
| All other assets (Note 10) | 14,597 | | 13,882 | |
| Deferred income taxes (Note 15) | 12,081 | | 9,889 | |
| Assets of discontinued operations (Note 2) | 3,532 | | 4,109 | |
| Total assets | $ | 253,452 | | $ | 265,177 | |
| | |
| Short-term borrowings (Note 11) | $ | 4,778 | | $ | 23,641 | |
| Short-term borrowings assumed by GE (Note 11) | 0 | | 0 | |
| Accounts payable and equipment project accruals | 16,476 | | 17,357 | |
| Progress collections and deferred income (Note 9) | 18,215 | | 18,389 | |
| All other current liabilities (Note 14) | 16,600 | | 17,821 | |
| Liabilities of businesses held for sale (Note 2) | 0 | | 1,658 | |
| Current liabilities | 56,069 | | 78,865 | |
| | |
| Deferred income (Note 9) | 1,801 | | 1,555 | |
| Long-term borrowings (Note 11) | 70,288 | | 67,241 | |
| Long-term borrowings assumed by GE (Note 11) | 0 | | 0 | |
| Insurance liabilities and annuity benefits (Note 12) | 42,191 | | 39,826 | |
| Non-current compensation and benefits | 29,752 | | 31,687 | |
| All other liabilities (Note 14) | 16,077 | | 15,938 | |
| Liabilities of discontinued operations (Note 2) | 200 | | 203 | |
| Total liabilities | 216,378 | | 235,316 | |
| | |
Preferred stock (5,939,875 shares outstanding at both December 31, 2020 and December 31, 2019) | 6 | | 6 | |
Common stock (8,765,493,000 and 8,738,434,000 shares outstanding at December 31, 2020 and December 31, 2019, respectively) | 702 | | 702 | |
| Accumulated other comprehensive income (loss) – net attributable to GE | (9,749) | | (11,732) | |
| Other capital | 34,307 | | 34,405 | |
| Retained earnings | 92,247 | | 87,732 | |
| Less common stock held in treasury | (81,961) | | (82,797) | |
| Total GE shareholders’ equity | 35,552 | | 28,316 | |
| Noncontrolling interests (Note 16) | 1,522 | | 1,545 | |
| Total equity | 37,073 | | 29,861 | |
| Total liabilities and equity | $ | 253,452 | | $ | 265,177 | |
| | | | | | | | | | | |
| STATEMENT OF EARNINGS (LOSS) | | | |
| For the years ended December 31 (In millions; per-share amounts in dollars) | 2023 | 2022 | 2021 |
| | |
| | | |
| Sales of equipment | $ | 26,793 | | $ | 22,334 | | $ | 25,096 | |
| Sales of services | 37,772 | | 32,808 | | 28,272 | |
| Insurance revenues (Note 12) | 3,389 | | 2,957 | | 3,101 | |
| | | |
| Total revenues | 67,954 | | 58,100 | | 56,469 | |
| | | |
| Cost of equipment sold | 27,683 | | 23,743 | | 25,161 | |
| Cost of services sold | 22,709 | | 20,529 | | 18,217 | |
| Selling, general and administrative expenses | 9,195 | | 9,173 | | 8,177 | |
| Separation costs (Note 20) | 978 | | 715 | | — | |
| Research and development | 1,907 | | 1,786 | | 1,682 | |
| Interest and other financial charges | 1,118 | | 1,477 | | 1,790 | |
| Debt extinguishment costs | — | | 465 | | 6,524 | |
| Insurance losses, annuity benefits and other costs (Note 12) | 2,886 | | 2,592 | | 2,174 | |
| | | |
| Non-operating benefit cost (income) | (1,585) | | (409) | | 1,136 | |
| | | |
| Total costs and expenses | 64,891 | | 60,071 | | 64,861 | |
| | | |
| Other income (loss) (Note 19) | 7,129 | | 1,172 | | 2,696 | |
| | | |
| Earnings (loss) from continuing operations before income taxes | 10,191 | | (799) | | (5,695) | |
| Benefit (provision) for income taxes (Note 15) | (1,162) | | 3 | | 757 | |
| Earnings (loss) from continuing operations | 9,029 | | (795) | | (4,939) | |
| Earnings (loss) from discontinued operations, net of taxes (Note 2) | 414 | | 1,202 | | (1,469) | |
| Net earnings (loss) | 9,443 | | 407 | | (6,408) | |
| Less net earnings (loss) attributable to noncontrolling interests | (37) | | 67 | | (71) | |
| Net earnings (loss) attributable to the Company | 9,481 | | 339 | | (6,337) | |
| Preferred stock dividends and other | (295) | | (289) | | (237) | |
| Net earnings (loss) attributable to GE common shareholders | $ | 9,186 | | $ | 51 | | $ | (6,573) | |
| | | |
| Amounts attributable to GE common shareholders | | | |
| Earnings (loss) from continuing operations | $ | 9,029 | | $ | (795) | | $ | (4,939) | |
| Less net earnings (loss) attributable to noncontrolling interests, | | | |
| continuing operations | (38) | | 16 | | (117) | |
| Earnings (loss) from continuing operations attributable to the Company | 9,067 | | (811) | | (4,821) | |
| Preferred stock dividends and other | (295) | | (289) | | (237) | |
| Earnings (loss) from continuing operations attributable | | | |
| to GE common shareholders | 8,772 | | (1,100) | | (5,058) | |
| | | |
| | | |
| | | |
| Earnings (loss) from discontinued operations attributable | | | |
| to GE common shareholders | 414 | | 1,151 | | (1,515) | |
| Net earnings (loss) attributable to GE common shareholders | $ | 9,186 | | $ | 51 | | $ | (6,573) | |
| | | |
| Earnings (loss) per share from continuing operations (Note 18) | | | |
| Diluted earnings (loss) per share | $ | 7.98 | | $ | (1.00) | | $ | (4.62) | |
| Basic earnings (loss) per share | $ | 8.06 | | $ | (1.00) | | $ | (4.62) | |
| | | |
| Net earnings (loss) per share (Note 18) | | | |
| Diluted earnings (loss) per share | $ | 8.36 | | $ | 0.05 | | $ | (6.00) | |
| Basic earnings (loss) per share | $ | 8.44 | | $ | 0.05 | | $ | (6.00) | |
| | | | | | | | |
| STATEMENT OF FINANCIAL POSITION | |
| December 31 (In millions) | 2023 | 2022 |
| | |
| | |
| Cash, cash equivalents and restricted cash | $ | 16,967 | | $ | 15,810 | |
| Investment securities (Note 3) | 5,706 | | 7,609 | |
| Current receivables (Note 4) | 15,466 | | 14,831 | |
| | |
| Inventories, including deferred inventory costs (Note 5) | 16,528 | | 14,891 | |
| | |
| | |
| Current contract assets (Note 8) | 1,500 | | 2,467 | |
| All other current assets (Note 9) | 1,647 | | 1,400 | |
| Assets of businesses held for sale (Note 2) | 1,985 | | 1,374 | |
| Current assets | 59,799 | | 58,384 | |
| | |
| Investment securities (Note 3) | 38,000 | | 36,027 | |
| | |
| | |
| Property, plant and equipment – net (Note 6) | 12,494 | | 12,192 | |
| | |
| Goodwill (Note 7) | 13,385 | | 12,999 | |
| Other intangible assets – net (Note 7) | 5,695 | | 6,105 | |
| Contract and other deferred assets (Note 8) | 5,406 | | 5,776 | |
| All other assets (Note 9) | 15,997 | | 15,477 | |
| Deferred income taxes (Note 15) | 10,575 | | 10,001 | |
| Assets of discontinued operations (Note 2) | 1,695 | | 31,890 | |
| Total assets | $ | 163,045 | | $ | 188,851 | |
| | |
| Short-term borrowings (Note 10) | $ | 1,253 | | $ | 3,739 | |
| | |
| Accounts payable and equipment project payables (Note 11) | 15,408 | | 15,399 | |
| Progress collections and deferred income (Note 8) | 19,677 | | 16,216 | |
| All other current liabilities (Note 14) | 12,712 | | 12,130 | |
| Liabilities of businesses held for sale (Note 2) | 1,826 | | 1,944 | |
| Current liabilities | 50,876 | | 49,428 | |
| | |
| Deferred income (Note 8) | 1,339 | | 1,409 | |
| Long-term borrowings (Note 10) | 19,711 | | 20,320 | |
| | |
| Insurance liabilities and annuity benefits (Note 12) | 39,624 | | 36,845 | |
| Non-current compensation and benefits (Note 13) | 11,214 | | 10,400 | |
| All other liabilities (Note 14) | 10,508 | | 11,063 | |
| Liabilities of discontinued operations (Note 2) | 1,193 | | 24,474 | |
| Total liabilities | 134,466 | | 153,938 | |
| | |
| Preferred stock (Note 16) | — | | 6 | |
| Common stock (Note 16) | 15 | | 15 | |
| Accumulated other comprehensive income (loss) – net attributable to GE (Note 16) | (6,150) | | (2,272) | |
| Other capital | 26,962 | | 34,173 | |
| Retained earnings | 86,527 | | 82,983 | |
| Less common stock held in treasury | (79,976) | | (81,209) | |
| Total GE shareholders’ equity | 27,378 | | 33,696 | |
| Noncontrolling interests | 1,202 | | 1,216 | |
| Total equity | 28,579 | | 34,912 | |
| Total liabilities and equity | $ | 163,045 | | $ | 188,851 | |
| | | | | | | | | | | |
| | | |
| STATEMENT OF CASH FLOWS | | |
| For the years ended December 31 (In millions) | 2023 | 2022 | 2021 |
| | | |
| Net earnings (loss) | $ | 9,443 | | $ | 407 | | $ | (6,408) | |
| | | |
| | | |
| (Earnings) loss from discontinued operations activities | (414) | | (1,202) | | 1,469 | |
| Adjustments to reconcile net earnings (loss) to cash from (used for) operating activities: | | | |
| Depreciation and amortization of property, plant and equipment | 1,473 | | 1,564 | | 1,622 | |
| Amortization of intangible assets (Note 7) | 606 | | 1,338 | | 738 | |
| | | |
| | | |
| (Gains) losses on purchases and sales of business interests (Note 19) | (104) | | (60) | | 52 | |
| (Gains) losses on retained and sold ownership interests and other equity securities | (5,842) | | 113 | | (1,632) | |
| Debt extinguishment costs | — | | 465 | | 6,524 | |
| Principal pension plans cost (Note 13) | (1,108) | | 376 | | 1,766 | |
| Principal pension plans employer contributions | (212) | | (204) | | (205) | |
| Other postretirement benefit plans (net) | (644) | | (755) | | (900) | |
| Provision (benefit) for income taxes | 1,162 | | (3) | | (757) | |
| Cash recovered (paid) during the year for income taxes | (1,148) | | (430) | | (373) | |
| Changes in operating working capital: | | | |
| Decrease (increase) in current receivables | (833) | | (2,719) | | 524 | |
| Decrease (increase) in inventories, including deferred inventory costs | (1,524) | | (1,925) | | (306) | |
| Decrease (increase) in current contract assets | 1,283 | | 1,652 | | 1,007 | |
| Increase (decrease) in accounts payable and equipment project payables | (221) | | 2,236 | | (390) | |
| Increase (decrease) in progress collections and current deferred income | 2,933 | | 2,348 | | (1,113) | |
| Financial services derivatives net collateral/settlement | 3 | | (154) | | (1,143) | |
| All other operating activities | 717 | | 998 | | (1,326) | |
| Cash from (used for) operating activities – continuing operations | 5,570 | | 4,043 | | (850) | |
| Cash from (used for) operating activities – discontinued operations | (391) | | 1,873 | | 4,332 | |
| Cash from (used for) operating activities | 5,179 | | 5,916 | | 3,481 | |
| | | |
| Additions to property, plant and equipment and internal-use software | (1,595) | | (1,174) | | (1,113) | |
| Dispositions of property, plant and equipment | 89 | | 206 | | 151 | |
| | | |
| Proceeds from sale of discontinued operations | — | | — | | 22,356 | |
| Proceeds from principal business dispositions | — | | 15 | | — | |
| Net cash from (payments for) principal businesses purchased | (365) | | (30) | | (69) | |
| Dispositions of retained ownership interests | 9,004 | | 4,717 | | 4,145 | |
| Net (purchases) dispositions of insurance investment securities | (986) | | (876) | | (1,290) | |
| All other investing activities | 791 | | 8,033 | | 1,641 | |
| Cash from (used for) investing activities – continuing operations | 6,938 | | 10,891 | | 25,822 | |
| Cash from (used for) investing activities – discontinued operations | (2,960) | | (8,621) | | (4,443) | |
| Cash from (used for) investing activities | 3,977 | | 2,270 | | 21,379 | |
| | | |
| Net increase (decrease) in borrowings (maturities of 90 days or less) | (55) | | 56 | | (704) | |
| Newly issued debt (maturities longer than 90 days) | 11 | | 16 | | 359 | |
| Repayments and other debt reductions (maturities longer than 90 days) | (3,360) | | (11,202) | | (36,510) | |
| Dividends paid to shareholders | (589) | | (639) | | (575) | |
| Cash received (paid) for debt extinguishment costs | — | | 338 | | (7,196) | |
| Redemption of GE preferred stock | (5,795) | | (144) | | — | |
| Purchases of GE common stock for treasury | (1,233) | | (1,048) | | (107) | |
| All other financing activities | 410 | | (1,065) | | (523) | |
| Cash from (used for) financing activities – continuing operations | (10,612) | | (13,688) | | (45,256) | |
| Cash from (used for) financing activities – discontinued operations | 2,000 | | 8,102 | | (140) | |
| Cash from (used for) financing activities | (8,613) | | (5,585) | | (45,397) | |
| Effect of currency exchange rate changes on cash, cash equivalents and restricted cash | 120 | | (369) | | (213) | |
| Increase (decrease) in cash, cash equivalents and restricted cash | $ | 664 | | $ | 2,232 | | $ | (20,750) | |
| Cash, cash equivalents and restricted cash at beginning of year | $ | 19,092 | | $ | 16,859 | | $ | 37,608 | |
| Cash, cash equivalents and restricted cash at December 31 | 19,755 | | 19,092 | | 16,859 | |
| Less cash, cash equivalents and restricted cash of discontinued operations at December 31 | 1,396 | | 2,627 | | 1,332 | |
| Cash, cash equivalents and restricted cash of continuing operations at December 31 | $ | 18,360 | | $ | 16,464 | | $ | 15,527 | |
| Supplemental disclosure of cash flows information | | | |
| Cash paid during the year for interest | $ | (1,067) | | $ | (1,561) | | $ | (2,536) | |
| | | |
| | | |
| | | |
| | | |
| | | | | | | | | | | | | | |
| | | | | | |
| STATEMENT OF COMPREHENSIVE INCOME (LOSS) | | | | | |
| For the years ended December 31 (In millions) | | | | 2023 | 2022 | 2021 |
| | | | | | |
| Net earnings (loss) | | | | $ | 9,443 | | $ | 407 | | $ | (6,408) | |
| Less: net earnings (loss) attributable to noncontrolling interests | | | | (37) | | 67 | | (71) | |
| Net earnings (loss) attributable to the Company | | | | $ | 9,481 | | $ | 339 | | $ | (6,337) | |
| | | | | | |
| Currency translation adjustments | | | | 2,274 | | (1,326) | | (172) | |
| Benefit plans | | | | (4,747) | | 2,889 | | 9,044 | |
| Investment securities and cash flow hedges | | | | 968 | | (7,099) | | (1,299) | |
| Long-duration insurance contracts(a) | | | | (2,371) | | 8,126 | | 2,599 | |
| | | | | | |
| Less: other comprehensive income (loss) attributable to noncontrolling interests | | | | 2 | | 1 | | 5 | |
| Other comprehensive income (loss) attributable to the Company | | | | $ | (3,878) | | $ | 2,589 | | $ | 10,166 | |
| | | | | | |
| Comprehensive income (loss) | | | | $ | 5,567 | | $ | 2,996 | | $ | 3,764 | |
| Less: comprehensive income (loss) attributable to noncontrolling interests | | | | (35) | | 68 | | (66) | |
| Comprehensive income (loss) attributable to the Company | | | | $ | 5,602 | | $ | 2,928 | | $ | 3,830 | |
| | | | | | |
| | | | | | |
| | | | | | |
(a) Excluded $455 millionRepresents the net after-tax change in future policy benefit reserves and $583 million at December 31, 2020 and 2019, respectively, in GE Capital insurance entities, which is subject to regulatory restrictions. This balance is included in All other assets.related reinsurance recoverables from updating the discount rate. See Note 1012 for further information.
| | | | | | | | | | | | | | |
| | |
| STATEMENT OF CHANGES IN SHAREHOLDERS' EQUITY | | | | | |
| For the years ended December 31 (In millions) | | | | 2023 | 2022 | 2021 |
| | | | | | |
| Preferred stock issued(a) | | | | $ | — | | $ | 6 | | $ | 6 | |
| Common stock issued | | | | $ | 15 | | $ | 15 | | $ | 15 | |
| | | | | | |
| Beginning balance | | | | (2,272) | | (4,860) | | (9,749) | |
| Currency translation adjustments | | | | 2,270 | | (1,324) | | (174) | |
| Benefit plans | | | | (4,745) | | 2,886 | | 9,041 | |
| Investment securities and cash flow hedges | | | | 968 | | (7,099) | | (1,299) | |
| Long-duration insurance contracts | | | | (2,371) | | 8,126 | | 2,599 | |
| Adoption of new accounting standards | | | | — | | — | | (5,278) | |
| Accumulated other comprehensive income (loss) | | | | $ | (6,150) | | $ | (2,272) | | $ | (4,860) | |
| Beginning balance | | | | 34,173 | | 34,691 | | 34,307 | |
| Gains (losses) on treasury stock dispositions | | | | (1,845) | | (741) | | (740) | |
| Stock-based compensation | | | | 355 | | 362 | | 429 | |
| Other changes(a) | | | | (5,721) | | (139) | | 696 | |
| Other capital | | | | $ | 26,962 | | $ | 34,173 | | $ | 34,691 | |
| Beginning balance | | | | 82,983 | | 83,286 | | 92,247 | |
| Net earnings (loss) attributable to the Company | | | | 9,481 | | 339 | | (6,337) | |
| Dividends and other transactions with shareholders(b) | | | | (5,937) | | (642) | | (617) | |
| Adoption of new accounting standards | | | | — | | — | | (2,007) | |
| Retained earnings | | | | $ | 86,527 | | $ | 82,983 | | $ | 83,286 | |
| Beginning balance | | | | (81,209) | | (81,093) | | (81,961) | |
| Purchases | | | | (1,244) | | (1,048) | | (107) | |
| Dispositions | | | | 2,477 | | 931 | | 974 | |
| Common stock held in treasury | | | | $ | (79,976) | | $ | (81,209) | | $ | (81,093) | |
| GE shareholders' equity balance | | | | 27,378 | | 33,696 | | 32,044 | |
| Noncontrolling interests balance | | | | 1,202 | | 1,216 | | 1,302 | |
| Total equity balance at December 31 | | | | $ | 28,579 | | $ | 34,912 | | $ | 33,346 | |
(a) Included decreases of $5,795 million and $144 million, substantially all in Other capital related to our redemption of GE 2020 FORM 10-K 58
preferred stock in the years ended December 31, 2023 and 2022, respectively. Included a $687 million increase in all Other capital related to the change in par value of issued common stock from $0.06 to $0.01 in the year ended December 31, 2021. | | | | | | | | | | | | | | | | | |
| STATEMENT OF FINANCIAL POSITION (CONTINUED) | GE Industrial | | GE Capital |
| December 31 (In millions, except share amounts) | 2020 | 2019 | | 2020 | 2019 |
| Cash, cash equivalents and restricted cash | $ | 23,209 | | $ | 17,613 | | | $ | 13,421 | | $ | 18,198 | |
| Investment securities (Note 3) | 7,319 | | 9,888 | | | 0 | | 0 | |
| Current receivables (Note 4) | 13,442 | | 13,682 | | | 0 | | 0 | |
| Financing receivables – net (Note 5) | 0 | | 0 | | | 5,110 | | 4,922 | |
| Inventories, including deferred inventory costs (Note 6) | 15,890 | | 17,215 | | | 0 | | 0 | |
| Other GE Capital receivables | 0 | | 0 | | | 5,069 | | 6,881 | |
| Receivable from GE Capital | 2,432 | | 2,104 | | | 0 | | 0 | |
| Current contract assets (Note 9) | 5,764 | | 7,390 | | | 0 | | 0 | |
| All other current assets (Note 10) | 835 | | 852 | | | 1,021 | | 2,936 | |
| Assets of businesses held for sale (Note 2) | 0 | | 8,626 | | | 0 | | 241 | |
| Current assets | 68,892 | | 77,371 | | | 24,621 | | 33,177 | |
| | | | | |
| Investment securities (Note 3) | 36 | | 120 | | | 42,515 | | 38,514 | |
| Financing receivables – net (Note 5) | 0 | | 0 | | | 1,771 | | 2,057 | |
| Other GE Capital receivables | 0 | | 0 | | | 5,076 | | 4,886 | |
| Property, plant and equipment – net (Note 7) | 16,433 | | 17,447 | | | 29,600 | | 29,886 | |
| Receivable from GE Capital | 16,780 | | 17,038 | | | 0 | | 0 | |
| Goodwill (Note 8) | 25,524 | | 25,895 | | | 0 | | 839 | |
| Other intangible assets – net (Note 8) | 9,632 | | 10,461 | | | 143 | | 192 | |
| Contract and other deferred assets (Note 9) | 5,921 | | 5,769 | | | 0 | | 0 | |
| All other assets (Note 10) | 7,948 | | 7,748 | | | 7,068 | | 6,294 | |
| Deferred income taxes (Note 15) | 9,350 | | 8,189 | | | 2,731 | | 1,700 | |
| Assets of discontinued operations (Note 2) | 144 | | 202 | | | 3,388 | | 3,907 | |
| Total assets | $ | 160,658 | | $ | 170,238 | | | $ | 116,914 | | $ | 121,454 | |
| | | | | |
| Short-term borrowings (Note 11) | $ | 918 | | $ | 5,606 | | | $ | 2,028 | | $ | 13,598 | |
| Short-term borrowings assumed by GE (Note 11) | 2,432 | | 5,473 | | | 2,432 | | 2,104 | |
| Accounts payable and equipment project accruals | 16,380 | | 19,134 | | | 947 | | 886 | |
| Progress collections and deferred income (Note 9) | 18,371 | | 18,575 | | | 0 | | 0 | |
| All other current liabilities (Note 14) | 14,131 | | 15,251 | | | 3,890 | | 4,052 | |
| Liabilities of businesses held for sale (Note 2) | 0 | | 1,620 | | | 0 | | 52 | |
| Current liabilities | 52,232 | | 65,660 | | | 9,297 | | 20,691 | |
| | | | | |
| Deferred income (Note 9) | 1,801 | | 1,555 | | | 0 | | 0 | |
| Long-term borrowings (Note 11) | 19,428 | | 15,085 | | | 30,902 | | 26,261 | |
| Long-term borrowings assumed by GE (Note 11) | 19,957 | | 25,895 | | | 16,780 | | 17,038 | |
| Insurance liabilities and annuity benefits (Note 12) | 0 | | 0 | | | 42,565 | | 40,232 | |
| Non-current compensation and benefits | 29,291 | | 31,208 | | | 453 | | 472 | |
| All other liabilities (Note 14) | 16,440 | | 16,306 | | | 1,151 | | 1,226 | |
| Liabilities of discontinued operations (Note 2) | 139 | | 106 | | | 61 | | 97 | |
| Total liabilities | 139,289 | | 155,815 | | | 101,210 | | 106,016 | |
| | | | | |
Preferred stock (5,939,875 shares outstanding at both December 31, 2020 and December 31, 2019) | 6 | | 6 | | | 6 | | 6 | |
Common stock (8,765,493,000 and 8,738,434,000 shares outstanding at December 31, 2020 and December 31, 2019, respectively) | 702 | | 702 | | | 0 | | 0 | |
| Accumulated other comprehensive income (loss) – net attributable to GE | (8,945) | | (10,881) | | | (804) | | (852) | |
| Other capital | 15,294 | | 17,398 | | | 19,007 | | 17,001 | |
| Retained earnings | 94,910 | | 88,589 | | | (2,663) | | (857) | |
| Less common stock held in treasury | (81,961) | | (82,797) | | | 0 | | 0 | |
| Total GE shareholders’ equity | 20,006 | | 13,017 | | | 15,545 | | 15,299 | |
| Noncontrolling interests (Note 16) | 1,363 | | 1,406 | | | 159 | | 139 | |
| Total equity | 21,369 | | 14,423 | | | 15,704 | | 15,438 | |
| Total liabilities and equity | $ | 160,658 | | $ | 170,238 | | | $ | 116,914 | | $ | 121,454 | |
GE 20202023 FORM 10-K59 44
| | | | | | | | | | | |
| STATEMENT OF CASH FLOWS | Consolidated |
| For the years ended December 31 (In millions) | 2020 | 2019 | 2018 |
| Net earnings (loss) | $ | 5,546 | | $ | (4,912) | | $ | (22,443) | |
| (Earnings) loss from discontinued operations | 125 | | 5,335 | | 1,363 | |
Adjustments to reconcile net earnings (loss) to cash provided from
operating activities: | | | |
| Depreciation and amortization of property, plant and equipment (Note 7) | 4,636 | | 4,026 | | 4,419 | |
| Amortization of intangible assets (Note 8) | 1,382 | | 1,569 | | 2,163 | |
| Goodwill impairments (Note 8) | 1,717 | | 1,486 | | 22,136 | |
| (Gains) losses on purchases and sales of business interests (Note 19) | (12,526) | | (53) | | (1,522) | |
| (Gains) losses on equity securities (Note 19) | 2,105 | | (693) | | (166) | |
| Principal pension plans cost (Note 13) | 3,559 | | 3,878 | | 4,226 | |
| Principal pension plans employer contributions (Note 13) | (2,806) | | (298) | | (6,283) | |
| Other postretirement benefit plans (net) (Note 13) | (893) | | (1,228) | | (1,033) | |
| Provision (benefit) for income taxes (Note 15) | (474) | | 726 | | 93 | |
| Cash recovered (paid) during the year for income taxes (Note 15) | (1,441) | | (1,950) | | (1,404) | |
| Changes in operating working capital: | | | |
| Decrease (increase) in current receivables | (1,319) | | (2,851) | | (358) | |
| Decrease (increase) in inventories, including deferred inventory costs | 1,105 | | (1,581) | | (573) | |
| Decrease (increase) in current contract assets | 1,631 | | 891 | | 751 | |
Increase (decrease) in accounts payable and
equipment project accruals | (575) | | 2,674 | | 666 | |
Increase (decrease) in progress collections and
current deferred income | (216) | | 1,531 | | (563) | |
| All other operating activities | 2,040 | | 1,869 | | 1,739 | |
| Cash from (used for) operating activities – continuing operations | 3,597 | | 10,419 | | 3,210 | |
| Cash from (used for) operating activities – discontinued operations | 0 | | (1,647) | | 1,768 | |
| Cash from (used for) operating activities | 3,597 | | 8,772 | | 4,978 | |
| Additions to property, plant and equipment | (3,252) | | (5,813) | | (6,627) | |
| Dispositions of property, plant and equipment | 1,644 | | 3,718 | | 4,093 | |
| Additions to internal-use software | (151) | | (282) | | (320) | |
| Net decrease (increase) in GE Capital financing receivables | (20) | | 1,117 | | 1,796 | |
| Proceeds from sale of discontinued operations | 0 | | 5,864 | | 29 | |
| Proceeds from principal business dispositions | 20,596 | | 4,683 | | 8,425 | |
| Net cash from (payments for) principal businesses purchased | (85) | | (68) | | (1) | |
| Capital contribution from GE Industrial to GE Capital | 0 | | 0 | | 0 | |
| Sales of retained ownership interests | 417 | | 3,383 | | 0 | |
| Net (purchases) dispositions of GE Capital investment securities (Note 3) | (1,352) | | (1,616) | | 2,534 | |
| All other investing activities | (1,019) | | (301) | | 8,995 | |
| Cash from (used for) investing activities – continuing operations | 16,778 | | 10,684 | | 18,925 | |
| Cash from (used for) investing activities – discontinued operations | (136) | | (1,745) | | (645) | |
| Cash from (used for) investing activities | 16,642 | | 8,939 | | 18,280 | |
| Net increase (decrease) in borrowings (maturities of 90 days or less) | (4,168) | | 280 | | (4,343) | |
| Newly issued debt (maturities longer than 90 days) | 15,028 | | 2,185 | | 3,120 | |
| Repayments and other reductions (maturities longer than 90 days) | (29,876) | | (16,567) | | (20,319) | |
| Capital contribution from GE Industrial to GE Capital | 0 | | 0 | | 0 | |
| Dividends paid to shareholders | (648) | | (649) | | (4,474) | |
| All other financing activities | (188) | | (1,013) | | (1,328) | |
| Cash from (used for) financing activities – continuing operations | (19,853) | | (15,764) | | (27,345) | |
| Cash from (used for) financing activities – discontinued operations | 1 | | (368) | | (4,462) | |
| Cash from (used for) financing activities | (19,852) | | (16,133) | | (31,806) | |
Effect of currency exchange rate changes on cash, cash equivalents
and restricted cash | 145 | | (50) | | (628) | |
| Increase (decrease) in cash, cash equivalents and restricted cash | 531 | | 1,529 | | (9,176) | |
| Cash, cash equivalents and restricted cash at beginning of year | 37,077 | | 35,548 | | 44,724 | |
| Cash, cash equivalents and restricted cash at end of year | 37,608 | | 37,077 | | 35,548 | |
Less cash, cash equivalents and restricted cash of
discontinued operations at end of year | 524 | | 638 | | 4,424 | |
Cash, cash equivalents and restricted cash of continuing operations
at end of year | $ | 37,085 | | $ | 36,439 | | $ | 31,124 | |
| Supplemental disclosure of cash flows information | | | |
| Cash paid during the year for interest | $ | (2,976) | | $ | (4,101) | | $ | (4,508) | |
| | | |
| | | | | | | | | | | | | | | | | | | | | | | |
| STATEMENT OF CASH FLOWS (CONTINUED) | GE Industrial | | GE Capital |
| For the years ended December 31 (In millions) | 2020 | 2019 | 2018 | | 2020 | 2019 | 2018 |
| Net earnings (loss) | $ | 6,868 | | $ | (5,035) | | $ | (20,772) | | | $ | (1,322) | | $ | 123 | | $ | (1,672) | |
| (Earnings) loss from discontinued operations | 35 | | 5,527 | | (307) | | | 90 | | (192) | | 1,670 | |
Adjustments to reconcile net earnings (loss) to cash provided from
operating activities: | | | | | | | |
| Depreciation and amortization of property, plant and equipment (Note 7) | 2,130 | | 2,001 | | 2,290 | | | 2,534 | | 2,026 | | 2,110 | |
| Amortization of intangible assets (Note 8) | 1,325 | | 1,512 | | 2,109 | | | 57 | | 57 | | 53 | |
| Goodwill impairments (Note 8) | 877 | | 1,486 | | 22,136 | | | 839 | | 0 | | 0 | |
| (Gains) losses on purchases and sales of business interests (Note 19) | (12,468) | | (3) | | (1,234) | | | (58) | | (50) | | (288) | |
| (Gains) losses on equity securities (Note 19) | 2,080 | | (688) | | (185) | | | 25 | | (6) | | 21 | |
| Principal pension plans cost (Note 13) | 3,559 | | 3,878 | | 4,226 | | | 0 | | 0 | | 0 | |
| Principal pension plans employer contributions (Note 13) | (2,806) | | (298) | | (6,283) | | | 0 | | 0 | | 0 | |
| Other postretirement benefit plans (net) (Note 13) | (846) | | (1,213) | | (1,015) | | | (47) | | (15) | | (18) | |
| Provision (benefit) for income taxes (Note 15) | 388 | | 1,309 | | 467 | | | (862) | | (582) | | (374) | |
| Cash recovered (paid) during the year for income taxes (Note 15) | (2,447) | | (1,904) | | (1,343) | | | 1,007 | | (46) | | (61) | |
| Changes in operating working capital: | | | | | | | |
| Decrease (increase) in current receivables | (558) | | (3,904) | | (966) | | | 0 | | 0 | | 0 | |
| Decrease (increase) in inventories, including deferred inventory costs | 1,188 | | (1,349) | | (581) | | | 0 | | 0 | | 0 | |
| Decrease (increase) in current contract assets | 1,631 | | 891 | | 751 | | | 0 | | 0 | | 0 | |
Increase (decrease) in accounts payable and
equipment project accruals | (2,556) | | 381 | | 716 | | | (29) | | (44) | | 2 | |
Increase (decrease) in progress collections and
current deferred income | (247) | | 1,476 | | (424) | | | 0 | | 0 | | 0 | |
| All other operating activities | 591 | | 548 | | 1,117 | | | 1,261 | | 610 | | 138 | |
| Cash from (used for) operating activities – continuing operations | (1,254) | | 4,614 | | 701 | | | 3,495 | | 1,881 | | 1,582 | |
| Cash from (used for) operating activities – discontinued operations | 32 | | (49) | | 2,051 | | | (32) | | (1,917) | | (415) | |
| Cash from (used for) operating activities | (1,223) | | 4,565 | | 2,752 | | | 3,463 | | (35) | | 1,166 | |
| Additions to property, plant and equipment | (1,579) | | (2,216) | | (2,234) | | | (1,765) | | (3,830) | | (4,569) | |
| Dispositions of property, plant and equipment | 202 | | 371 | | 271 | | | 1,450 | | 3,348 | | 3,853 | |
| Additions to internal-use software | (143) | | (274) | | (306) | | | (7) | | (8) | | (14) | |
| Net decrease (increase) in GE Capital financing receivables (Note 5) | 0 | | 0 | | 0 | | | 199 | | 3,389 | | 9,986 | |
| Proceeds from sale of discontinued operations | 0 | | 5,864 | | 0 | | | 0 | | 0 | | 29 | |
| Proceeds from principal business dispositions | 20,394 | | 1,083 | | 6,047 | | | 34 | | 3,938 | | 2,011 | |
| Net cash from (payments for) principal businesses purchased | (85) | | (447) | | (1) | | | 0 | | 0 | | 0 | |
| Capital contribution from GE Industrial to GE Capital | (2,000) | | (4,000) | | 0 | | | 0 | | 0 | | 0 | |
| Sales of retained ownership interests | 417 | | 3,383 | | 0 | | | 0 | | 0 | | 0 | |
| Net (purchases) dispositions of GE Capital investment securities (Note 3) | 0 | | 0 | | 0 | | | (1,352) | | (1,616) | | 2,534 | |
| All other investing activities | 523 | | 292 | | (640) | | | 9,673 | | 4,233 | | (2,052) | |
| Cash from (used for) investing activities – continuing operations | 17,729 | | 4,056 | | 3,138 | | | 8,231 | | 9,453 | | 11,777 | |
| Cash from (used for) investing activities – discontinued operations | (36) | | (3,449) | | (698) | | | (100) | | 2,023 | | 186 | |
| Cash from (used for) investing activities | 17,693 | | 607 | | 2,439 | | | 8,131 | | 11,476 | | 11,964 | |
| Net increase (decrease) in borrowings (maturities of 90 days or less) | (4,234) | | (595) | | (987) | | | (525) | | (256) | | (4,308) | |
| Newly issued debt (maturities longer than 90 days) | 7,462 | | 31 | | 6,570 | | | 7,566 | | 2,154 | | 3,045 | |
| Repayments and other reductions (maturities longer than 90 days) | (13,673) | | (6,458) | | (1,023) | | | (25,252) | | (11,632) | | (19,836) | |
| Capital contribution from GE Industrial to GE Capital | 0 | | 0 | | 0 | | | 2,000 | | 4,000 | | 0 | |
| Dividends paid to shareholders | (354) | | (352) | | (4,179) | | | (469) | | (455) | | (371) | |
| All other financing activities | (141) | | (283) | | 1,090 | | | (58) | | (819) | | (2,408) | |
| Cash from (used for) financing activities – continuing operations | (10,941) | | (7,658) | | 1,470 | | | (16,738) | | (7,007) | | (23,878) | |
| Cash from (used for) financing activities – discontinued operations | 1 | | (368) | | (4,462) | | | 0 | | (1) | | 0 | |
| Cash from (used for) financing activities | (10,940) | | (8,026) | | (2,992) | | | (16,738) | | (7,008) | | (23,878) | |
Effect of currency exchange rate changes on cash, cash equivalents
and restricted cash | 61 | | (56) | | (494) | | | 84 | | 6 | | (134) | |
| Increase (decrease) in cash, cash equivalents and restricted cash | 5,591 | | (2,911) | | 1,706 | | | (5,060) | | 4,439 | | (10,882) | |
| Cash, cash equivalents and restricted cash at beginning of year | 17,617 | | 20,528 | | 18,822 | | | 19,460 | | 15,020 | | 25,902 | |
| Cash, cash equivalents and restricted cash at end of year | 23,209 | | 17,617 | | 20,528 | | | 14,400 | | 19,460 | | 15,020 | |
Less cash, cash equivalents and restricted cash of
discontinued operations at end of year | 0 | | 4 | | 3,896 | | | 524 | | 633 | | 528 | |
Cash, cash equivalents and restricted cash of continuing operations
at end of year | $ | 23,209 | | $ | 17,613 | | $ | 16,632 | | | $ | 13,876 | | $ | 18,826 | | $ | 14,492 | |
| Supplemental disclosure of cash flows information | | | | | | | |
| Cash paid during the year for interest | $ | (1,276) | | $ | (1,975) | | $ | (2,201) | | | $ | (1,957) | | $ | (2,632) | | $ | (2,883) | |
| | | | | | | | | | | |
| CONSOLIDATED STATEMENT OF COMPREHENSIVE INCOME (LOSS) | | | |
| For the years ended December 31 (In millions) | 2020 | 2019 | 2018 |
| Net earnings (loss) | $ | 5,546 | | $ | (4,912) | | $ | (22,443) | |
| Less net earnings (loss) attributable to noncontrolling interests | (158) | | 66 | | (89) | |
| Net earnings (loss) attributable to the Company | $ | 5,704 | | $ | (4,979) | | $ | (22,355) | |
| | | |
| Investment securities | $ | (1) | | $ | 100 | | $ | 64 | |
| Currency translation adjustments | 435 | | 1,275 | | (1,664) | |
| Cash flow hedges | (77) | | 36 | | (51) | |
| Benefit plans | 1,632 | | 1,229 | | 1,416 | |
| Other comprehensive income (loss) | 1,989 | | 2,641 | | (235) | |
| Less other comprehensive income (loss) attributable to noncontrolling interests | 6 | | (40) | | (225) | |
| Other comprehensive income (loss) attributable to the Company | $ | 1,984 | | $ | 2,681 | | $ | (10) | |
| | | |
| Comprehensive income (loss) | $ | 7,536 | | $ | (2,272) | | $ | (22,678) | |
| Less comprehensive income (loss) attributable to noncontrolling interests | (152) | | 26 | | (314) | |
| Comprehensive income (loss) attributable to the Company | $ | 7,688 | | $ | (2,297) | | $ | (22,364) | |
| | | | | | | | | | | |
| CONSOLIDATED STATEMENT OF CHANGES IN SHAREHOLDERS' EQUITY |
| For the years ended December 31 (In millions) | 2020 | 2019 | 2018 |
| Preferred stock issued | $ | 6 | | $ | 6 | | $ | 6 | |
| Common stock issued | $ | 702 | | $ | 702 | | $ | 702 | |
| | | |
| Beginning balance | (11,732) | | (14,414) | | (14,404) | |
| Investment securities | (1) | | 100 | | 63 | |
| Currency translation adjustments | 433 | | 1,315 | | (1,472) | |
| Cash flow hedges | (77) | | 35 | | (49) | |
| Benefit plans | 1,628 | | 1,231 | | 1,448 | |
| Accumulated other comprehensive income (loss) ending balance | $ | (9,749) | | $ | (11,732) | | $ | (14,414) | |
| Beginning balance | 34,405 | | 35,504 | | 37,384 | |
| Gains (losses) on treasury stock dispositions | (703) | | (925) | | (759) | |
| Stock-based compensation | 429 | | 475 | | 413 | |
| Other changes | 176 | | (649) | | (1,534) | |
| Other capital ending balance | $ | 34,307 | | $ | 34,405 | | $ | 35,504 | |
| Beginning balance | 87,732 | | 93,109 | | 117,245 | |
| Net earnings (loss) attributable to the Company | 5,704 | | (4,979) | | (22,355) | |
| Dividends and other transactions with shareholders | (1,014) | | (766) | | (4,042) | |
| Changes in accounting (Note 1) | (175) | | 368 | | 2,261 | |
| Retained earnings ending balance | $ | 92,247 | | $ | 87,732 | | $ | 93,109 | |
| Beginning balance | (82,797) | | (83,925) | | (84,902) | |
| Purchases | (28) | | (57) | | (268) | |
| Dispositions | 864 | | 1,186 | | 1,244 | |
| Common stock held in treasury ending balance | $ | (81,961) | | $ | (82,797) | | $ | (83,925) | |
| GE shareholders' equity balance | 35,552 | | 28,316 | | 30,981 | |
| Noncontrolling interests balance (Note 16) | 1,522 | | 1,545 | | 20,500 | |
| Total equity balance at December 31(a) | $ | 37,073 | | $ | 29,861 | | $ | 51,481 | |
(a)Total equity balance decreased by $(14,408) million from December 31, 2018, primarily due to reduction of noncontrolling interest balance of $(19,239) million attributable to Baker Hughes Class A shareholders at December 31, 2018, after-tax loss of $(8,238) million in discontinued operations due to deconsolidation of Baker Hughes in 2019, and after-tax net realized and unrealized loss on our remaining interest in Baker Hughes of $(936) million in 2019 and 2020, partially offset by after-tax gain of $11,213 million due to the sale of our BioPharma business within our Healthcare segment, and after-tax gain of $2,508 million in discontinued operations due to spin-off and subsequent merger of our Transportation business with Wabtec in 2019.
NOTE 1. BASIS OF PRESENTATION AND SUMMARY OF SIGNIFICANT ACCOUNTING POLICIES
FINANCIAL STATEMENT PRESENTATION. We present our financial statements in a three-column format, which allows investors to see our industrial operations separately from our financial services operations. We believe that this provides useful supplemental information to our consolidated financial statements. To the extent that we have transactions between GE Industrial and GE Capital, these transactions are made on arms- length terms, are reported in the respective columns of our financial statements and are eliminated in consolidation. See Note 24 for further information.
Effective December 31, 2020, in order to enhance our financial statement presentation, we voluntarily made the following reporting changes for all periods presented:
•changed our presentation of GE Industrial restructuring program costs. Previously these costs were recorded within Corporate Items and Eliminations. Now these costs are recorded within segment profit, except for significant, higher-cost programs that continue to be recorded within Corporate Items and Eliminations;
•changed the presentation of our Statement of Financial Position to reflect the classification of assets and liabilities into current and non-current and revised the definition of operating working capital in our Statement of Cash Flows. For the classification of certain current assets and liabilities, we use the duration of our operating cycle, which may be longer than one year;
•began presenting research and development expenses separately as part of costs and expenses in our consolidated Statement of Earnings (Loss). These costs were previously reported in costs of goods and services sold; and
•ceased reporting GE Capital as an equity method investment within the GE Industrial column. This change has no impact on the GE Capital or Consolidated columns. Consistent with our historical practice, all commercial transactions between GE Industrial and GE Capital continue to be reported on arms-length terms and are eliminated upon consolidation.
Our financial statements are prepared in conformity with U.S. generally accepted accounting principles (GAAP), which requires us to make estimates based on assumptions about current, and for some estimates, future, economic and market conditions which affect reported amounts and related disclosures in our financial statements. Although our current estimates contemplate current and expected future conditions, as applicable, it is reasonably possible that actual conditions could differ from our expectations, which could materially affect our results of operations, financial position and financial position. In particular, a number of estimates have been and will continue to be affected by the ongoing Coronavirus Disease 2019 (COVID-19) pandemic. The severity, magnitude and duration, as well as the economic consequences of the COVID-19 pandemic, are uncertain, rapidly changing and difficult to predict. As a result, our accounting estimates and assumptions may change over time in response to COVID-19.cash flows. Such changes could result in future impairments of goodwill, intangibles, long-lived assets and investment securities, revisions to estimated profitability on long-term product service agreements, incremental credit losses on receivables and debt securities, a decreasechange in the carrying amount of our tax assets and liabilities, or an increasea change in our insurance liabilities and pension obligations as of the time of a relevant measurement event.
In preparing our Statement of Cash Flows, we make certain adjustments to reflect cash flows that cannot otherwise be calculated by changes in our Statement of Financial Position. These adjustments may include, but are not limited to, the effects of currency exchange, acquisitions and dispositions of businesses, businesses classified as held for sale, the timing of settlements to suppliers for property, plant and equipment, non-cash gains/losses and other balance sheet reclassifications.
We have reclassified certain prior-year amounts to conform to the current-year’s presentation. Unless otherwise noted, tables are presented in U.S. dollars in millions. Certain columns and rows may not add due to the use of rounded numbers. Percentages presented are calculated from the underlying numbers in millions. Earnings per share amounts are computed independently for earnings from continuing operations, earnings from discontinued operations and net earnings. As a result, the sum of per-share amounts may not equal the total. Unless otherwise indicated, information in these notes to consolidated financial statements relates to continuing operations. Certain of our operations have been presented as discontinued. We present businesses whose disposal represents a strategic shift that has, or will have, a major effect on our operations and financial results as discontinued operations when the components meet the criteria for held for sale, are sold, or spun-off. See Note 2 for further information.
On January 3, 2023, General Electric Company (the Company or GE) completed the previously announced separation (the Separation) of its HealthCare business, into a separate, independent publicly traded company. The historical results of GE HealthCare and certain assets and liabilities included in the spin-off are now reported in GE's consolidated financial statements as discontinued operations. See Note 2 for further information.
CONSOLIDATION. Our financial statements consolidate all of our affiliates, entities where we have a controlling financial interest, most often because we hold a majority voting interest, or where we are required to apply the variable interest entity (VIE) model
because we have a variable interest in an entity and are the power to directprimary beneficiary of the most economically significant activities of entities.entity. We reevaluate whether we have a controlling financial interest in all entities when our rights and interests change.
REVENUES FROM THE SALE OF EQUIPMENT. Performance Obligations Satisfied Over Time. We recognize revenue on agreements for the sale of customized goods including power generation and aerospace equipment and long-term construction projects and military development contracts on an over-time basis as we customize the customer's equipment during the manufacturing or integration process and obtain right to payment for work performed.
We recognize revenue as we perform under the arrangements using the percentage of completion method, which is based on our costs incurred to date relative to our estimate of total expected costs. Our estimate of costs to be incurred to fulfill our promise to a customer is based on our history of manufacturing or constructing similar assets for customers and is updated routinely to reflect changes in quantity or pricing of the inputs. We provide for potential losses on these agreements when it is probable that we will incur the loss.
Some of our contracts require us to make payments to customers related to failure to deliver our equipment on-time or meeting certain performance specifications, which is factored into our estimate of variable consideration using the expected value method and taking into consideration performance relative to our contractual obligations, specified liquidated damages rates, if applicable, and history of paying liquidated damages to the customer or similar customers.
During 2023, primarily as a result of changes in product and project cost estimates, we recorded additional project losses for certain Haliade-X contracts of $379 million. Further changes in our execution timelines or other adverse developments could result in further losses beyond the amounts that we currently estimate.
Our billing terms for these over-time contracts are generally based on achieving specified milestones. The differences between the timing of our revenue recognized (based on costs incurred) and customer billings (based on contractual terms) results in changes to our contract asset or contract liability positions. See Note 98 for further information.
Performance Obligations Satisfied at a Point in Time.We recognize revenue on agreements for non-customized equipment including commercial aircraft engines healthcare equipment and other goods we manufacture on a standardized basis for sale to the market at the point in time that the customer obtains control of the good,product, which is generally no earlier than when the customer has physical possession of the product.possession. We use proof of delivery for certain large equipment with more complex logistics, whereas the delivery of other equipment is estimated based on historical averages of in-transit periods (i.e., time between shipment and delivery).
Where arrangements include customer acceptance provisions based on seller or customer-specified objective criteria, we recognize revenue when we have concluded that the customer has control of the goodsequipment and that acceptance is likely to occur. We do not provide for anticipated losses on point-in-time transactions prior to transferring control of the equipment to the customer.
Our billing terms for these point-in-time equipment contracts generally coincide with delivery to the customer; however, within certain businesses, we receive progress collections from customers for large equipment purchases, to generally reserve production slots. Progress collections are not considered a significant financing component as they are intended to protect from the other party failing to adequately complete some or all of its obligations under the contract.
For certain commercial engine programs, we make payments to airlines related to future aircraft deliveries by airframers (“aircraft allowances”). We record aircraft allowances as a reduction in revenue when control of the engine is transferred to our airframer customer.
Some of our contracts require us to make payments to customers related to failure to deliver our equipment on-time or meeting certain performance specifications, which is factored into our estimate of variable consideration using the expected value method and taking into consideration performance relative to our contractual obligations, specified liquidated damages rates, if applicable, and history of paying liquidated damages to the customer or similar customers.
REVENUES FROM THE SALE OF SERVICES. Consistent with our Management’s Discussion and Analysis of Financial Condition and Results of Operations (MD&A) discussion and the way we manage our businesses, we refer to sales under service agreements, which includes both goods (such as spare parts and equipment upgrades) and related services (such as monitoring, maintenance and repairs) as sales of “services,” which is an important part of our operations. We sometimes offer our customers financing discounts for the purchase of certain GE Industrial productsequipment when sold in contemplation of long-term service agreements. These sales are accounted for as financing arrangements when payments for the productsequipment are collected through higher usage-based fees from servicing the equipment. See Note 98 for further information.
Performance Obligations Satisfied Over Time. We enter into long-term service agreements with our customers primarily within our AviationAerospace and Power segments. These agreements require us to provide preventative maintenance, overhauls, and standby "warranty-type" services that include certain levels of assurance regarding asset performance and uptime throughout the contract periods, which generally range from 5 to 25 years. We account for items that are integral to the maintenance of the equipment as part of our performance obligation, unless the customer has a substantive right to make a separate purchasing decision (e.g., equipment upgrade).
We recognize revenue as we perform under the arrangements using the percentage of completion method which is based on our costs incurred to date relative to our estimate of total expected costs. Throughout the life of a contract, this measure of progress captures the nature, timing and extent of our underlying performance activities as our stand-ready services often fluctuate between routine inspections and maintenance, unscheduled service events and major overhauls at pre-determinedpredetermined usage intervals. We provide for potential losses on these agreements when it is probable that we will incur the loss.
Our billing terms for these arrangements are generally based on the utilization of the asset (e.g., per hour of usage) or upon the occurrence of a major maintenance event within the contract, such as an overhaul. The differences between the timing of our revenue recognized (based on costs incurred) and customer billings (based on contractual terms) results in changes to our contract asset or contract liability positions. See Note 98 for further information.
We also enter into long-term services agreements in our Healthcare and Renewable Energy segments.segment. Revenues are recognized for these arrangements on a straight-line basis consistent with the nature, timing and extent of our services, which primarily relate to routine maintenance and as needed productequipment repairs. We generally invoice periodically as services are provided.
Performance Obligations Satisfied at a Point in Time. We sell certain tangible products, largely spare parts, through our services businesses. We recognize revenues and bill our customers at the point in time that the customer obtains control of the good, which is generally at the point in time we deliver the spare part to the customer.
COLLABORATIVE ARRANGEMENTS. Our AviationAerospace business enters into collaborative arrangements and joint ventures with manufacturers and suppliers of components used to build and maintain certain engines. Under these arrangements, GE and its collaborative partners share in the risks and rewards of these programs through various revenue, cost and profit sharing payment structures. GE recognizes revenue and costs for these arrangements based on the scope of work GE is responsible for transferring to its customers. GE’s payments to participants are primarily recorded as either cost of services sold ($1,2213,781 million, $1,939$2,890 million and $1,809$2,116 million for the years ended December 31, 2020, 20192023, 2022, and 2018,2021, respectively) or as cost of goodsequipment sold ($2,279663 million, $2,974$658 million and $3,097$751 million for the years ended December 31, 2020, 20192023, 2022 and 2018,2021, respectively). Our most significant collaborative arrangement is with Safran Aircraft engines,Engines, a subsidiary of Safran Group of France, which sells LEAP and CFM56 engines through CFM International, a jointly owned non-consolidated company. GE makes substantial sales of parts and services to CFM International based on arms-length terms.
GE CAPITAL REVENUES FROM SERVICES.
2023 FORM 10-KWe recognize operating lease income on a straight-line basis over the terms of underlying leases, and we use the interest method to recognize income on loans and finance leases. We stop accruing interest on loans at the earlier of the time at which collection of an account becomes doubtful or the account becomes 90 days past due. Estimated unguaranteed residual values for finance leases are based upon management's best estimates of the value of the leased asset at the end of the lease term. We use various sources of data in determining these estimates, including information obtained from third parties, which is adjusted for the attributes of the specific asset under lease. Guarantees of residual values by unrelated third parties are included within minimum lease payments. 46
GE 2020 FORM 10-K GOVERNMENT INCENTIVES64
For traditional long-duration insurance contracts, we report premiums as revenue when due. Premiums received on non-traditional long-duration insurance contracts. We receive grants, incentives and refundable tax credits from various federal, state, local, and foreign governments in exchange for compliance with certain conditions relating to our activities in a specific jurisdiction which encourage investment, contracts,job creation and retention, and environmental objectives including annuities without significant mortality risk, are not reported as revenues but rather as deposit liabilities.clean energy production and emissions reductions. We recognize revenues for chargesgovernment incentives as a reduction to the related expense or asset when there is reasonable assurance that the Company will comply with the conditions of the incentive, the incentive is received or is probable of receipt, and assessments on these contracts, mostly for mortality, contract initiation, administrationthe amount is determinable. Government grants resulted in reductions of $170 million and surrender. Amounts credited$158 million to policyholder accounts are chargedresearch and development expense in 2023 and 2022, respectively. As a result of the Advanced Manufacturing Credits provided by the Inflation Reduction Act which went into effect in 2023, our Renewable Energy businesses also recognized a $234 million reduction to expense.cost of equipment sold in 2023.
CASH, CASH EQUIVALENTS AND RESTRICTED CASH. Debt securities and money market instruments with original maturities of three months or less are included in cash, cash equivalents and restricted cash unless classified as available-for-sale investment securities. Restricted cash primarily comprised collateral for receivables sold and funds restricted in connection with certain ongoing litigation matters and amounted to $411$447 million and $589$734 million at December 31, 20202023 and December 31, 2019,2022, respectively.
INVESTMENT SECURITIES. We report investments in available-for-sale debt securities and certain equity securities at fair value. Unrealized gains and losses on available-for-sale debt securities are recorded to other comprehensive income, net of applicable taxes and adjustments related to our insurance liabilities.taxes. Unrealized gains and losses on equity securities with readily determinable fair values are recorded to earnings.
Although we generally do not have the intent to sell any specific debt securities in the ordinary course of managing our portfolio, we may sell debt securities prior to their maturities for a variety of reasons, including diversification, credit quality, yield and liquidity requirements and the funding of claims and obligations to policyholders.
We regularly review investment securities for impairment. For debt securities, if we do not intend to sell the security or it is not more likely than not that we will be required to sell the security before recovery of our amortized cost, we evaluate qualitative criteria, such as the financial health of and specific prospects for the issuer, to determine whether we do not expect to recover the amortized cost basis of the security. We also evaluate quantitative criteria including determining whether there has been an adverse change in expected future cash flows. If we do not expect to recover the entire amortized cost basis of the security, we consider the security to contain an expected credit loss, and we record the difference between the security’s amortized cost basis and its recoverable amount in earnings as an allowance for credit loss and the difference between the security’s recoverable amount and fair value in other comprehensive income. If we intend to sell the security or it is more likely than not we will be required to sell the security before recovery of its amortized cost basis, the security is considered impaired, and we recognize the entire difference between the security’s amortized cost basis and its fair value in earnings. See Note 3 for further information.
CURRENT RECEIVABLES. Amounts due from customers arising from the sales of productsequipment and services are recorded at the outstanding amount, less allowance for losses. We regularly monitor the recoverability of our receivables. See Note 4 for further information.
ALLOWANCE FOR CREDIT LOSSES. When we record customer receivables, contract assets and financing receivables arising from revenue transactions, as well as commercial mortgage loans and reinsurance recoverables in GE Capital’sour run-off insurance operations, financial guarantees and certain commitments, we record an allowance for credit losses for the current expected credit losses (CECL) inherent in the asset over its expected life. The allowance for credit losses is a valuation account deducted from the amortized cost basis of the assets to present their net carrying value at the amount expected to be collected. Each period, the allowance for credit losses is adjusted through earnings to reflect expected credit losses over the remaining lives of the assets. We evaluate debt securities with unrealized losses to determine whether any of the losses arise from concerns about the issuer’s credit or the underlying collateral and record an allowance for credit losses, if required.
We estimate expected credit losses based on relevant information about past events, including historical experience, current conditions, and reasonable and supportable forecasts that affect the collectability of the reported amount. When measuring expected credit losses, we pool assets with similar country risk and credit risk characteristics. Changes in the relevant information may significantly affect the estimates of expected credit losses.
FINANCING RECEIVABLES. Our financing receivables portfolio consists of a variety of loans and leases, including both larger-balance, non-homogeneous loans and leases and smaller-balance homogeneous loans and leases. We routinely evaluate our entire portfolio for potential specific credit or collection issues that might indicate an impairment. See Note 5 for further information.
INVENTORIES. All inventories are stated at lower of cost or realizable values. Cost of inventories is primarily determined on a first-in, first-out (FIFO) basis. See Note 65 for further information.
PROPERTY, PLANT AND EQUIPMENT. The cost of GE Industrial property, plant and equipment is generally depreciated on a straight-line basis over its estimated economic life. The cost of GE Capital equipment leased to others on operating leases is depreciated on a straight-line basis to estimated residual value over the lease term or over the estimated economic life of the equipment. See Note 76 for further information.
GE 2020 FORM 10-KLEASE ACCOUNTING FOR LESSEE ARRANGEMENTS. 65
LEASE ACCOUNTING. Lessee Arrangements.At lease commencement, we record a lease liability and corresponding right-of-use (ROU) asset. Options to extend the lease are included as part of the ROU lease asset and liability when it is reasonably certain the Company will exercise the option. We have elected to include lease and non-lease components in determining our lease liability for all leased assets except our vehicle leases. Non-lease components are generally services that the lessor performs for the Company associated with the leased asset. The present value of our lease liability is determined using our incremental collateralized borrowing rate at lease inception. For leases with an initial term of 12 months or less, an ROU asset and lease liability is not recognized and lease expense is recognized on a straight-line basis over the lease term. We test ROU assets whenever events or changes in circumstance indicate that the asset may be impaired.
Lessor Arrangements. 2023 FORM 10-KEquipment leased to others under operating leases are included in Property, plant and equipment, and leases classified as finance leases are included in Financing receivables on our Statement of Financial Position. See Notes 5 and 7 for further information. 47
GOODWILL AND OTHER INTANGIBLE ASSETS. We test goodwill at least annually for impairment at the reporting unit level. We recognize an impairment charge if the carrying amount of a reporting unit exceeds its fair value. When a portion of a reporting unit is disposed, goodwill is allocated to the gain or loss on disposition based on the relative fair values of the business or businesses disposed and the portion of the reporting unit that will be retained.
For otherDefinite-lived intangible assets thatasset costs are not deemed indefinite-lived, cost is generally amortized on a straight-line basis over the asset’s estimated economic life, except for individually significant customer-related intangible assets that are amortized in relation to total related sales. Amortizable intangible assets are reviewed for impairment whenever events or changes in circumstances indicate that the related carrying amounts may not be recoverable. In these circumstances, they are tested for impairment based on undiscounted cash flows and, if impaired, written down to estimated fair value based on either discounted cash flows or appraised values. See Note 87 for further information.
DERIVATIVES AND HEDGING. We use derivatives to manage a variety of risks, including risks related to interest rates, foreign exchange, certain equity investments and commodity prices. Accounting for derivatives as hedges requires that, at inception and over the term of the arrangement, the hedged item and related derivative meet the requirements for hedge accounting. In evaluating whether a particular relationship qualifies for hedge accounting, we test effectiveness at inception and each reporting period thereafter by determining whether changes in the fair value of the derivative offset, within a specified range, changes in the fair value of the hedged item. If fair value changes fail this test, we discontinue applying hedge accounting to that relationship prospectively. Fair values of both the derivative instrument and the hedged item are calculated using internal valuation models incorporating market-based assumptions, subject to third-party confirmation, as applicable. See Note 2122 for further information.
DEFERRED INCOME TAXES. Deferred income tax balances reflect the effects of temporary differences between the carrying amounts of assets and liabilities and their tax bases,basis, as well as from net operating loss and tax credit carryforwards, and are stated at enacted tax rates expected to be in effect when those taxes are paid or recovered. Deferred income tax assets represent amounts available to reduce income taxes payable on taxable income in future years. We evaluate the recoverability of these future tax deductions and credits by assessing the adequacy of future expected taxable income from all sources, including reversal of taxable temporary differences, forecasted operating earnings and available tax planning strategies. To the extent we consider it more likely than not that a deferred tax asset will not be recovered, a valuation allowance is established. Deferred taxes, as needed, are provided for our investment in affiliates and associated companies when we plan to remit those earnings. See Note 15 for further information.
INSURANCE LIABILITIES AND ANNUITY BENEFITS. INSURANCE.Our run-off insurance operations include providing insurance and reinsurance for life and health risks and providing certain annuity products. Primary product types include long-term care, structured settlement annuities, life and disability insurance contracts and investment contracts. Insurance contracts are contracts with significant mortality and/or morbidity risks, while investment contracts are contracts without such risks. Insurance revenues are comprised primarily of premiums and investment income. For traditional long-duration insurance contracts, we report premiums as revenue when due. Premiums received on non-traditional long-duration insurance contracts and investment contracts, including annuities without significant mortality risk, are not reported as revenues but rather as deposit liabilities. We recognize revenues for charges and assessments on these contracts, mostly for mortality, administration and surrender. Interest credited to policyholder accounts is charged to expense.
Liabilities for traditional long-duration insurance contracts include both future policy benefit reserves and claims reserves. Future policy benefit reserves represent the present value of future policy benefits to be paid to or on behalf of policyholders and related expenses less the present value of future gross premiumsnet premiums. The liability is measured for each group of contracts (i.e., cohorts) using current cash flow assumptions. As a run-off insurance operation consisting substantially all of reinsurance, contracts are grouped into cohorts by legal entity and product type, based on actuarial assumptions. the date the reinsurance contract was consummated. Future policy benefit reserves are adjusted each period as a result of updating lifetime net premium ratios for differences between actual and expected experience with the retroactive effect of those variances recognized in current period earnings. We review at least annually in the third quarter, future policy benefit reserves cash flow assumptions, except related claim expenses which remain locked-in, and if the review concludes that the assumptions need to be updated, future policy benefit reserves are adjusted retroactively based on the revised net premium ratio using actual historical experience, updated cash flow assumptions, and the locked-in discount rate with the effect of those changes recognized in current period earnings.
As our insurance operations are in run-off, the locked-in discount rate is used for the computation of interest accretion on future policy benefit reserves recognized in earnings. However, cash flows used to estimate future policy benefit reserves are also discounted using an upper-medium grade (i.e., low credit risk) fixed-income instrument yield reflecting the duration characteristics of the liabilities and is updated each reporting period with changes recorded in AOCI. As a result, changes in the current discount rate at each reporting period are recognized as an adjustment to AOCI and not earnings each period, whereas changes relating to cash flow assumptions are recognized in the Statement of Earnings (Loss).
Liabilities for investment contracts equal the account value, that is, the amount that accrues to the benefit of the contract or policyholder including credited interest and assessments through the financial statement date.
Claim reserves are established when a claim is incurred or is estimated to have been incurred and represent our best estimate of the present value of the ultimate obligations for future claim payments and claim adjustments expenses.
To the extent that unrealized gains on specific investment securities supporting our insurance contracts would result in a premium deficiency, should those gains be realized, an increase in future policy benefit reserves is recorded, with an offsetting after-tax reduction to net unrealized gains recorded in other comprehensive income.
Reinsurance recoverables are recorded when we cede insurance risk to third parties but are not relieved from our primary obligation to policyholders and cedents. When losses on ceded risks give rise to claims for recovery, we establish allowances for probable losses on such receivables from reinsurers as required. See Note 12 for further information.
POSTRETIREMENT BENEFIT PLANS. We sponsor a number of pension and retiree health and life insurance benefit plans that we present in three categories, principal pension plans, other pension plans and principal retiree benefit plans. We use a December 31 measurement date for these plans. On our consolidated Statement of Financial Position, we measure our plan assets at fair value and the obligations at the present value of the estimated payments to plan participants. Participants earn benefits based on their service and pay. Those estimated future payment amounts are determined based on assumptions. Differences between our actual results and what we assumed are recorded in a separate component of equity each period. These differences are amortized into earnings over the remaining average future service of active employees or the expected life of inactive participants, as applicable, who participate in the plan. See Note 13 for further information.
LOSS CONTINGENCIES. Loss contingencies are uncertain and unresolved mattersexisting conditions, situations or circumstances involving uncertainty as to possible loss that arise in the ordinary course of business and result fromwill ultimately be resolved when future events occur or actions by others that have the potentialfail to result in a future loss.occur. Such contingencies include, but are not limited to environmental obligations, litigation, regulatory investigations and proceedings, product quality and losses resulting from other events and developments. When a loss is considered probable and reasonably estimable, we record a liability in the amount of our best estimate for the ultimate loss. When there appears to be a range of possible costs with equal likelihood, liabilities are based on the low-end of such range. Disclosure is provided for material loss contingencies when a loss is probable but a reasonable estimate cannot be made, and when it is reasonably possible that a loss will be incurred or the amount of a loss will exceed the recorded provision. We regularly review contingencies to determine whether the likelihood of loss has changed and to assess whether a reasonable estimate of the loss or range of loss can be made. See Note 2324 for further information.
SUPPLY CHAIN FINANCE PROGRAMS. We evaluate supply chain finance programs to ensure where we use a third-party intermediary to settle our trade payables, their involvement does not change the nature, existence, amount, or timing of our trade payables and does not provide the Company with any direct economic benefit. If any characteristics of the trade payables change or we receive a direct economic benefit, we reclassify the trade payables as borrowings.
FAIR VALUE MEASUREMENTS. The following sections describe the valuation methodologies we use to measure financial and non-financial instruments accounted for at fair value including certain assets within our pension plans and retiree benefit plans. Observable inputs reflect market data obtained from independent sources, while unobservable inputs reflect our market assumptions. These inputs establish a fair value hierarchy:
Level 1 – Quoted prices for identical instruments in active markets.
markets; Level 2 – Quoted prices for similar instruments in active markets; quoted prices for identical or similar instruments in markets that are not active; and model-derived valuations whose inputs are observable or whose significant value drivers are observable.
observable; and Level 3 – Significant inputs to the valuation model are unobservable.
RECURRING FAIR VALUE MEASUREMENTS. For financial assets and liabilities measured at fair value on a recurring basis, primarily investment securities and derivatives, fair value is the price we would receive to sell an asset or pay to transfer a liability in an orderly transaction with a market participant at the measurement date. In the absence of active markets for the identical assets or liabilities, such measurements involve developing assumptions based on market observable data and, in the absence of such data, internal information that is consistent with what market participants would use in a hypothetical transaction that occurs at the measurement date. See Note 2021 for further information.
Debt Securities. When available, we use quoted market prices to determine the fair value of debt securities which are included in Level 1. For our remaining debt securities, we obtain pricing information from an independent pricing vendor. The inputs and assumptions to the pricing vendor’s models are derived from market observable sources including benchmark yields, reported trades, broker/dealer quotes, issuer spreads, benchmark securities, bids, offers and other market-related data. These investments are included in Level 2. Our pricing vendors may also provide us with valuations that are based on significant unobservable inputs, and in those circumstances, we classify the investment securities in Level 3.
Annually, we conduct reviews of our primary pricing vendor to validate that the inputs used in that vendor’s pricing process are deemed to be market observable as defined in the standard. We believe that the prices received from our pricing vendor are representative of prices that would be received to sell the assets at the measurement date (exit prices) and are classified appropriately in the hierarchy.
We use non-binding broker quotes and other third-party pricing services as our primary basis for valuation when there is limited, or no, relevant market activity for a specific instrument or for other instruments that share similar characteristics. Debt securities priced in this manner are included in Level 3.
Equity securities with readily determinable fair values. These publicly traded equity securities are valued using quoted prices and are included in Level 1.
Derivatives. The majority of our derivatives are valued using internal models. The models maximize the use of market observable inputs including interest rate curves and both forward and spot prices for currencies and commodities. Derivative assets and liabilities included in Level 2 primarily represent interest rate swaps, cross-currency swaps and foreign currency and commodity forward and option contracts. Derivative assets and liabilities included in Level 3 primarily represent equity derivatives and interest rate products that contain embedded optionality or prepayment features.
Investments in private equity, real estate and collective funds held within our pension plans. TheseMost investments are generally valued using the net asset value (NAV) per share as a practical expedient for fair value provided certain criteria are met. The NAVs are determined based on the fair values of the underlying investments in the funds. Investments that are measured at fair value using the NAV practical expedient are not required to be classified in the fair value hierarchy. Investments classified within Level 3 primarily relate to real estate and private equities which are valued using unobservable inputs, primarily by discounting expected future cash flows, using comparative market multiples, third-party pricing sources, or a combination of these approaches as appropriate. See Note 13 for further information.
NONRECURRING FAIR VALUE MEASUREMENTS. Certain assets are measured at fair value on a nonrecurring basis. These assets may include loans and long-lived assets reduced to fair value upon classification as held for sale, impaired loans based on the fair value of the underlying collateral, impaired equity securities without readily determinable fair value, equity method investments and long-lived assets, and remeasured retained investments in formerly consolidated subsidiaries upon a change in control that results in the deconsolidation of that subsidiary and retention of a noncontrolling stake in the entity. Assets written down to fair value when impaired and retained investments are not subsequently adjusted to fair value unless further impairment occurs.
Equity investments without readily determinable fair value and Associated companies. Equity investments without readily determinable fair value and associated companies are valued using market observable data such as transaction prices when available. When market observable data is unavailable, investments are valued using either a discounted cash flow model, comparative market multiples, third-party pricing sources or a combination of these approaches as appropriate. These investments are generally included in Level 3.
Long-lived Assets. Fair values of long-lived assets including aircraft, are primarily derived internally and are based on observed sales transactions for similar assets.assets or discounted cash flow estimates. In other instances for which we do not have comparable observed sales transaction data, collateral values are developed internally and corroborated by external appraisal information. Adjustments to third-party valuations may be performed in circumstances where market comparables are not specific to the attributes of the specific collateral or appraisal information may not be reflective of current market conditions due to the passage of time and the occurrence of market events since receipt of the information.
ACCOUNTING CHANGES. On January 1, 2020, we adopted ASU No. 2016-13, Financial Instruments - Credit Losses. ASU 2016-13 requires us to prospectively record an allowance for credit losses for the current expected credit losses inherent in the asset over its expected life, replacing the incurred loss model that recognized losses only when they became probable and estimable. We recorded a $221 million increase in our allowance for credit losses and a $175 million decrease to retained earnings, net of tax, reflecting the cumulative effect on retained earnings.
On January 1, 2020 we adopted ASU 2017-04, Intangibles - Goodwill and Other (Topic 350): Simplifying the Test for Goodwill Impairment. The ASU eliminates Step 2 of the goodwill impairment test and the qualitative assessment for any reporting unit with a zero or negative carrying amount. The ASU also requires an entity to disclose the amount of goodwill allocated to each reporting unit with a zero or negative carrying amount. The adoption did not have an impact on our financial statements.
In March 2020, the Financial Accounting Standards Board issued ASU 2020-04, Reference Rate Reform (Topic 848): Facilitation of the Effects of Reference Rate Reform on Financial Reporting. On October 1, 2020, we adopted the new standard, which provides optional expedients and exceptions for applying generally accepted accounting principles to contracts, hedging relationships, and other transactions affected by reference rate reform if certain criteria are met. We will apply the accounting relief as relevant contract and hedge accounting relationship modifications are made during the reference rate reform transition period. We do not expect the standard to have a material impact on our consolidated financial statements.
NOTE 2. BUSINESSES HELD FOR SALE AND DISCONTINUED OPERATIONS
ASSETS AND LIABILITIES OF BUSINESSES HELD FOR SALE.OPERATIONS. On March 31, 2020,In the fourth quarter of 2022, we completed the salesigned a binding agreement to sell a portion of our BioPharmaSteam business within our HealthcarePower segment for total consideration of$21,112 million (after certainto Électricité de France S.A. (EDF). We are working capital adjustments). The consideration consisted of $20,695 millionwith EDF to complete the sale as soon as possible, subject to regulatory approvals and other closing conditions. Closing the transaction is expected to result in cash and $417 million of pension liabilities that were assumed by Danaher. In addition, we incurred $185 million of cash payments directly associated with the transaction. As a result, we recognized a pre-tax gain of $12,362 million ($11,213 million after-tax) in our consolidated Statement of Earnings (Loss).significant gain.
In the fourth quarter of 2022, we classified our captive industrial insurance subsidiary, Electric Insurance Company, domiciled in Massachusetts, with assets of $541 million and liabilities of $378 million as of December 31, 2023, into held for sale. In the third quarter of 2023, we signed a binding agreement to sell this business and expect to complete the sale, subject to regulatory approvals and other customary closing conditions, in the first half of 2020,2024. In connection with the expected sale, for the year ended December 31, 2023, we sold allrecorded a loss of $109 million in Other income (loss) in our remaining businesses classified as held for sale, including the remaining Lighting business within Corporate and the remaining PK AirFinance business within our Capital segment.Statement of Earnings (Loss).
| | | | | | | | |
| ASSETS AND LIABILITIES OF BUSINESSES HELD FOR SALE | December 31, 2023 | December 31, 2022 |
| | |
| Cash and cash equivalents | $ | 609 | | $ | 35 | |
| Current receivables, inventories and contract assets | 551 | | 495 | |
| Non-current captive insurance investment securities | 570 | | 554 | |
| Property, plant and equipment and intangible assets - net | 254 | | 232 | |
| Valuation allowance on disposal group classified as held for sale | (124) | | (17) | |
| All other assets | 125 | | 76 | |
| Assets of businesses held for sale | $ | 1,985 | | $ | 1,374 | |
| | |
| Progress collections and deferred income | $ | 1,001 | | $ | 1,127 | |
| Insurance liabilities and annuity benefits | 376 | | 358 | |
| Accounts payable, equipment project payables and other current liabilities | 392 | | 371 | |
| All other liabilities | 57 | | 87 | |
| Liabilities of businesses held for sale | $ | 1,826 | | $ | 1,944 | |
DISCONTINUED OPERATIONS.OPERATIONS Discontinued operations primarily include certain businesses incomprise our former GE Capital segment (ourHealthCare business, our mortgage portfolio in Poland (Bank BPH), our GE Capital Aviation Services (GECAS) business, and other trailing assets and liabilities associated with the sale of our GE Capital businesses) and our Baker Hughes and Transportation segments.prior dispositions. Results of operations, financial position and cash flows for these businesses are reported as discontinued operations for all periods presented.presented and the notes to the financial statements have been adjusted on a retrospective basis.
GE HealthCare. On January 3, 2023, we completed the previously announced separation of our HealthCare business (the Separation), into a separate, independent, publicly traded company, GE HealthCare Technologies Inc. (GE HealthCare). The Separation was structured as a tax-free spin-off, and was achieved through GE's pro-rata distribution of approximately 80.1% of the outstanding shares of GE HealthCare to holders of GE common stock. In September 2019, we reduced our ownership interestconnection with the Separation, the historical results of GE HealthCare and certain assets and liabilities included in Baker Hughes from 50.2% to 36.8%. As a result, we deconsolidated our Baker Hughes segment and reclassified its results tothe Separation are reported in GE's consolidated financial statements as discontinued operations for all periods presented and recognized a loss of $8,715 million ($8,238 million after-tax).operations.
We have continuing involvement with Baker Hughes (BKR)GE HealthCare primarily through a transition services agreement, through which GE and GE HealthCare continue to provide certain services to each other for a period of time following the Separation, and a trademark licensing agreement. For the year ended December 31, 2023, we collected net cash of $842 million related to these activities.
Bank BPH. As previously reported, Bank BPH, along with other Polish banks, has been subject to ongoing litigation in Poland related to its portfolio of floating rate residential mortgage loans, with cases brought by individual borrowers seeking relief related to their foreign currency indexed or denominated mortgage loans in various courts throughout Poland. As previously reported, GE and Bank BPH approved the adoption of a settlement program and recorded a charge of $1,014 million in the quarter ended June 30, 2023. The estimate of total losses for borrower litigation at Bank BPH was $2,669 million and $1,359 million as of December 31, 2023 and 2022, respectively. In order to maintain appropriate regulatory capital levels, during the year ended December 31, 2023, we made previously reported non-cash capital contributions in the form of intercompany loan forgiveness of $1,797 million; no incremental cash contributions from GE were required in 2023. During the year ended December 31, 2022, we made cash capital contributions of $530 million. For further information about factors that are relevant to the estimate of total losses for borrower litigation at Bank BPH, see Note 24. Future changes or adverse developments could increase our remaining interest,estimate of total losses and potentially require future cash contributions to Bank BPH.
The Bank BPH financing receivable portfolio is recorded at the lower of cost or fair value, less cost to sell, which reflects market yields and estimates with respect to ongoing purchasesborrower litigation. Earnings (loss) from discontinued operations included $1,189 million, $720 million and $509 million in pre-tax charges for the years ended December 31, 2023, 2022 and 2021, respectively, primarily related to the ongoing borrower litigation. At December 31, 2023, the total portfolio had a carrying value of zero, net of a valuation allowance.
GECAS/AerCap. We have continuing involvement with AerCap, primarily through a note receivable, ongoing sales or leases of products and services, and transition services that we provide to BKR, as well as an aeroderivative joint venture (JV) we formed with BKR in the fourth quarterAerCap. We paid net cash of 2019.$203 million to AerCap related to this activity.
| | | | | | | | | | | | | | |
RESULTS OF DISCONTINUED OPERATIONS For the year ended December 31, 2023 | GE HealthCare | GECAS | Bank BPH & Other | Total |
| Total revenues | $ | — | | $ | — | | $ | — | | $ | — | |
| Cost of equipment and services sold | — | | — | | — | | — | |
| Other income, costs and expenses | (50) | | — | | (1,252) | | (1,301) | |
| | | | |
| Earnings (loss) of discontinued operations before income taxes | (50) | | — | | (1,252) | | (1,301) | |
| Benefit (provision) for income taxes | 1,706 | | — | | 4 | | 1,710 | |
| Earnings (loss) of discontinued operations, net of taxes | 1,656 | | — | | (1,248) | | 409 | |
| | | | |
| Gain (loss) on disposal before income taxes | — | | — | | 6 | | 6 | |
| Benefit (provision) for income taxes | — | | — | | — | | — | |
| Gain (loss) on disposal, net of taxes | — | | — | | 6 | | 6 | |
| | | | |
| Earnings (loss) from discontinued operations, net of taxes | $ | 1,656 | | $ | — | | $ | (1,242) | | $ | 414 | |
| | | | | | | | | | | | | | |
| For the year ended December 31, 2022 | | | | |
| Total revenues | $ | 18,457 | | $ | — | | $ | — | | $ | 18,457 | |
| Cost of equipment and services sold | (11,265) | | — | | — | | (11,265) | |
| Other income, costs and expenses | (4,842) | | — | | (808) | | (5,651) | |
| | | | |
| Earnings (loss) of discontinued operations before income taxes | 2,350 | | — | | (808) | | 1,541 | |
| Benefit (provision) for income taxes | (521) | | — | | (32) | | (553) | |
| Earnings (loss) of discontinued operations, net of taxes | 1,829 | | — | | (841) | | 988 | |
| | | | |
| Gain (loss) on disposal before income taxes | 6 | | (18) | | 75 | | 64 | |
| Benefit (provision) for income taxes | 11 | | 139 | | — | | 150 | |
| Gain (loss) on disposal, net of taxes | 17 | | 121 | | 75 | | 213 | |
| | | | |
| Earnings (loss) from discontinued operations, net of taxes | $ | 1,846 | | $ | 121 | | $ | (765) | | $ | 1,202 | |
| | | | | | | | | | | | | | |
| For the year ended December 31, 2021 | | | | |
| Total revenues | $ | 17,717 | | $ | — | | $ | — | | $ | 17,717 | |
| Cost of equipment and services sold | (10,520) | | (398) | | — | | (10,918) | |
| Other income, costs and expenses | (4,965) | | 1,992 | | (599) | | (3,572) | |
| | | | |
| Earnings (loss) of discontinued operations before income taxes | 2,233 | | 1,594 | | (599) | | 3,227 | |
| Benefit (provision) for income taxes | (521) | | (258) | | (77) | | (856) | |
| Earnings (loss) of discontinued operations, net of taxes | 1,711 | | 1,336 | | (676) | | 2,371 | |
| | | | |
| Gain (loss) on disposal before income taxes | 12 | | (3,312) | | 65 | | (3,234) | |
| Benefit (provision) for income taxes | 2 | | (570) | | (38) | | (606) | |
| Gain (loss) on disposal, net of taxes | 14 | | (3,882) | | 27 | | (3,841) | |
| | | | |
| Earnings (loss) from discontinued operations, net of taxes | $ | 1,726 | | $ | (2,546) | | $ | (649) | | $ | (1,469) | |
The JV is jointly controlled by GE and BKR and is consolidated by GE due to the significance of our investment in BKR. Our Aviation segment sells products and services to the JV. In turn, the JV sells products and services primarily to BKR and our Power segment.
Transactions between the JV and GE businesses are eliminated in consolidation. During 2020, we had sales of $563 million to BKRtax benefit for products and services from the JV, and we collected cash of $603 million from Baker Hughes. If our investment in BKR is reduced to below 20%, we would no longer have significant influence in BKR and, as a result, we would not consolidate the JV. A potential deconsolidation of the JV is not expected to have a material impact on GE Industrial free cash flows.
For the year ended December 31, 2020, we had sales of $839 million2023 for GE HealthCare relates to retroactive 2023 IRS guidance concerning foreign tax credits and purchases of $216 million with BKR for productsaccounting method changes and services outsidecompletion of the JV. We collected2022 U.S. federal tax return as well as net cash of $855 milliontax benefit resulting from BKR related to sales, purchases and transition services. In addition, we received $204 million of repayments onpreparatory steps for the promissory note receivable from BKR and dividends of $267 million on our investment.spin-off.
In February 2019, we completed the spin-off and subsequent merger of our Transportation business with Wabtec. As a result, we recorded a gain of $3,471 million ($2,508 million after-tax) in discontinued operations.
| | | | | | | | | | | | | | | | | | | | | | | | | | | | | |
RESULTS OF DISCONTINUED OPERATIONS For the year ended December 31, 2020 | Baker Hughes | | Transportation and Other | | | | GE Capital | | Total | | | |
| Sales of goods and services | $ | 0 | | | $ | 0 | | | | | | $ | 0 | | | $ | 0 | | | | |
| GE Capital revenues and other income (loss) | 0 | | | 0 | | | | | | 55 | | | 55 | | | | |
| Cost of goods and services sold | 0 | | | 0 | | | | | | 0 | | | 0 | | | | |
| Other income, costs and expenses | 2 | | | 0 | | | | | | (252) | | | (249) | | | | |
| | | — | | | | | | | | | | | |
| Earnings (loss) of discontinued operations before income taxes | 2 | | | 0 | | | | | | (197) | | | (195) | | | | |
| Benefit (provision) for income taxes | (13) | | | 9 | | | | | | 105 | | | 101 | | | | |
| Earnings (loss) of discontinued operations, net of taxes(a) | (10) | | | 9 | | | | | | (92) | | | (93) | | | | |
| | | | | | | | | | | | | |
| Gain (loss) on disposal before income taxes | (23) | | | (12) | | | | | | 3 | | | (31) | | | | |
| Benefit (provision) for income taxes | 0 | | | 0 | | | | | | (1) | | | (1) | | | | |
| Gain (loss) on disposal, net of taxes | (23) | | | (12) | | | | | | 2 | | | (32) | | | | |
| | | | | | | | | | | | | |
| Earnings (loss) from discontinued operations, net of taxes | $ | (33) | | | $ | (3) | | | | | | $ | (90) | | | $ | (125) | | | | |
| | | | | | | | | | | | | | | | | | | | | | | |
| For the year ended December 31, 2019 | | | | | | | |
| Sales of goods and services | $ | 16,047 | | | $ | 550 | | | $ | 0 | | | $ | 16,598 | |
| GE Capital revenues and other income (loss) | 0 | | | 0 | | | 33 | | | 33 | |
| Cost of goods and services sold | (13,317) | | | (478) | | | 0 | | | (13,795) | |
| Other income, costs and expenses | (2,390) | | | (19) | | | (240) | | | (2,650) | |
| | | | | | | |
| Earnings (loss) of discontinued operations before income taxes | 340 | | | 53 | | | (207) | | | 186 | |
| Benefit (provision) for income taxes | (176) | | | (15) | | | 344 | | | 153 | |
| Earnings (loss) of discontinued operations, net of taxes(a) | 165 | | | 39 | | | 136 | | | 339 | |
| | | | | | | |
| Gain (loss) on disposal before income taxes | (8,715) | | | 3,471 | | | 61 | | | (5,183) | |
| Benefit (provision) for income taxes | 477 | | | (963) | | | (5) | | | (491) | |
| Gain (loss) on disposal, net of taxes | (8,238) | | | 2,508 | | | 56 | | | (5,675) | |
| | | | | | | |
| Earnings (loss) from discontinued operations, net of taxes | $ | (8,074) | | | $ | 2,547 | | | $ | 192 | | | $ | (5,335) | |
| | | | | | | | | | | | | | | | | | | | | | | | | | | | | |
| For the year ended December 31, 2018 | | | | | | | | | | | | |
| Sales of goods and services | $ | 22,859 | | | $ | 3,898 | | | | | | $ | 0 | | | $ | 26,757 | | | | |
| GE Capital revenues and other income (loss) | 0 | | | 0 | | | | | | (1,347) | | | (1,347) | | | | |
| Cost of goods and services sold | (19,198) | | | (2,809) | | | | | | 0 | | | (22,007) | | | | |
| Other income, costs and expenses | (3,346) | | | (607) | | | | | | (407) | | | (4,360) | | | | |
| | | | | | | | | | | | | |
| Earnings (loss) of discontinued operations before income taxes | 315 | | | 482 | | | | | | (1,755) | | | (958) | | | | |
| Benefit (provision) for income taxes | (347) | | | (143) | | | | | | 82 | | | (408) | | | | |
| Earnings (loss) of discontinued operations, net of taxes(a) | (33) | | | 339 | | | | | | (1,673) | | | (1,366) | | | | |
| | | | | | | | | | | | | |
| Gain (loss) on disposal before income taxes | 0 | | | 0 | | | | | | 4 | | | 4 | | | | |
| Benefit (provision) for income taxes | 0 | | | 0 | | | | | | (1) | | | (1) | | | | |
| Gain (loss) on disposal, net of taxes | 0 | | | 0 | | | | | | 3 | | | 3 | | | | |
| | | | | | | | | | | | | |
| Earnings (loss) from discontinued operations, net of taxes | $ | (33) | | | $ | 339 | | | | | | $ | (1,670) | | | $ | (1,363) | | | | |
(a) Earnings (loss) of discontinued operations attributable to the Company after income taxes was $(94) million, $279 million and $(1,367) million for the years ended December 31, 2020, 2019 and 2018, respectively.
GE 20202023 FORM 10-K69 51
| | December 31 | 2020 | 2019 |
| ASSETS AND LIABILITIES OF DISCONTINUED OPERATIONS | | ASSETS AND LIABILITIES OF DISCONTINUED OPERATIONS | December 31, 2023 | December 31, 2022 |
| Cash, cash equivalents and restricted cash | Cash, cash equivalents and restricted cash | $ | 524 | | $ | 638 | |
| Investment securities | 0 | | 202 | |
| Current receivables | Current receivables | 61 | | 81 | |
| | Financing receivables held for sale (Polish mortgage portfolio) | 2,437 | | 2,485 | |
| Inventories, including deferred inventory costs | |
| Goodwill | |
| Other intangible assets - net | |
| Contract and other deferred assets | |
| Financing receivables held for sale (Polish mortgage portfolio)(a) | |
| Property, plant and equipment - net | Property, plant and equipment - net | 109 | | 123 | |
| | All other assets | |
| Deferred income taxes | Deferred income taxes | 199 | | 264 | |
| All other assets | 202 | | 317 | |
Assets of discontinued operations(a) | Assets of discontinued operations(a) | $ | 3,532 | | $ | 4,109 | |
| | Accounts payable & Progress collections and deferred income | $ | 20 | | $ | 40 | |
| All other liabilities | 180 | | 163 | |
| Liabilities of discontinued operations(a)(b) | $ | 200 | | $ | 203 | |
| Accounts payable and equipment project payables | |
| Accounts payable and equipment project payables | |
| Accounts payable and equipment project payables | |
| Progress collections and deferred income | |
| Long-term borrowings | |
| Non-current compensation and benefits | |
| All other liabilities(a) | |
| Liabilities of discontinued operations | |
(a) Assets and liabilities of discontinued operations included $3,388Included $1,963 million and $61$848 million of valuation allowances against Financing receivables held for sale, of which $1,712 million and $611 million related to GE Capitalestimated borrower litigation losses, and $957 million and $748 million in All other liabilities, related to estimated borrower litigation losses for Bank BPH’s foreign currency-denominated mortgage portfolio, as of December 31, 2020.
(b) Included within All other liabilities of discontinued operations at December 31, 20202023 and December 31, 2019 are intercompany tax receivables in the amount of $7042022, respectively. Accordingly, total estimated losses related to borrower litigation were $2,669 million and $839$1,359 million respectively, primarily related to the financial services businesses that were partas of December 31, 2023 and December 31, 2022, respectively. As a result of the GE Capital Exit Plan, which are eliminated upon consolidation.settlement program, the valuation allowance completely offsets the financing receivables balance as of December 31, 2023.
NOTE 3. INVESTMENT SECURITIESSECURITIES.
All of our debt securities are classified as available-for-sale and substantially all are investment-grade supporting obligations to annuitants and policyholders in our run-off insurance operations. ChangesWe manage the investments in their fair value are recorded in Other comprehensive income. Equity securitiesour run-off insurance operations under strict investment guidelines, including limitations on asset class concentration, single issuer exposures, asset-liability duration variances, and other factors to meet credit quality, yield, liquidity and diversification requirements associated with readily determinable fair values are also included within this captionservicing our insurance liabilities under reasonable circumstances. This process includes consideration of various asset allocation strategies and incorporates information from several external investment advisors to improve our investment yield subject to maintaining our ability to satisfy insurance liabilities when due, as well as considering our risk-based capital requirements, regulatory constraints, and tolerance for surplus volatility. Asset allocation planning is a dynamic process that considers changes in their fair valuemarket conditions, risk appetite, liquidity needs and other factors, which are recordedreviewed on a periodic basis by our investment team. Our investment in Other income within continuing operations. WhereGE HealthCare comprised 61.6 million shares (approximately 13.5% ownership interest) at December 31, 2023. We sold our remaining equity shares in AerCap and Baker Hughes during the fourth and first quarters of 2023, respectively. Our senior note from AerCap, for which we adopthave adopted the fair value option for our investmentand matures in an associated company, our investment inthe fourth quarter of 2025, is still outstanding as of December 31, 2023. Our GE HealthCare and any advances toAerCap investments are recorded as Equity securities with readily determinable fair values. We classify investment securities as current or non-current based on our intent regarding the usage of proceeds from those investments.values (RDFV). Investment securities held within insurance entities are classified as non-current as they support the long-duration insurance liabilities.
| | 2020 | | 2019 |
| December 31 | Amortized
cost | Gross
unrealized
gains | Gross
unrealized
losses | Estimated
fair value | | Amortized
cost | Gross
unrealized
gains | Gross
unrealized
losses | Estimated
fair value |
| December 31, 2023 | | | December 31, 2023 | | December 31, 2022 |
| Amortized
cost | | | Amortized
cost | Gross
unrealized
gains | Gross
unrealized
losses | Estimated
fair value | | Amortized
cost | Gross
unrealized
gains | Gross
unrealized
losses | Estimated
fair value |
| Equity (GE HealthCare) | |
| Equity and note (AerCap) | |
| Equity (Baker Hughes) | Equity (Baker Hughes) | $ | 7,319 | | $ | — | | $ | — | | $ | 7,319 | | | $ | 9,888 | | $ | — | | $ | — | | $ | 9,888 | |
| Current investment securities | Current investment securities | $ | 7,319 | | $ | — | | $ | — | | $ | 7,319 | | | $ | 9,888 | | $ | — | | $ | — | | $ | 9,888 | |
| Debt | Debt | |
| U.S. corporate | |
| U.S. corporate | |
| U.S. corporate | U.S. corporate | $ | 23,604 | | $ | 6,651 | | $ | (26) | | $ | 30,230 | | | $ | 23,037 | | $ | 4,636 | | $ | (11) | | $ | 27,661 | |
| Non-U.S. corporate | Non-U.S. corporate | 2,283 | | 458 | | (1) | | 2,740 | | | 2,161 | | 260 | | (1) | | 2,420 | |
| State and municipal | State and municipal | 3,387 | | 878 | | (9) | | 4,256 | | | 3,086 | | 598 | | (15) | | 3,669 | |
| Mortgage and asset-backed | Mortgage and asset-backed | 3,652 | | 171 | | (71) | | 3,752 | | | 3,117 | | 116 | | (4) | | 3,229 | |
| Government and agencies | Government and agencies | 1,169 | | 184 | | 0 | | 1,353 | | | 1,391 | | 126 | | 0 | | 1,516 | |
| Other equity | Other equity | 218 | | — | | — | | 218 | | | 136 | — | | — | | 136 |
| Non-current investment securities | Non-current investment securities | $ | 34,313 | | $ | 8,342 | | $ | (106) | | $ | 42,549 | | | $ | 32,928 | | $ | 5,736 | | $ | (31) | | $ | 38,632 | |
| Total | $ | 41,632 | | $ | 8,342 | | $ | (106) | | $ | 49,868 | | | $ | 42,816 | | $ | 5,736 | | $ | (31) | | $ | 48,521 | |
|
The amortized cost of debt securities as of December 31, 2020 excludes accrued interest of $414$466 million and $457 million at December 31, 2023 and December 31, 2022, respectively, which is reported in Other GE Capital receivables.All other current assets.
The estimated fair valuesvalue of investment securities at December 31, 2023 increased since December 31, 2019,2022, primarily due to a decreasethe classification of our remaining equity interest in GE HealthCare within investment securities, the mark-to-market effect on our equity interest in GE HealthCare, new investments at Insurance and lower market yields, and new investments in our insurance business, partially offset by the mark-to-market effects on our remaining interest in BKR.AerCap, GE HealthCare and Baker Hughes share sales.
Total estimated fair value of debt securities in an unrealized loss position were $1,765$18,730 million and $999$21,482 million, of which $165$17,146 million and $274$3,275 million had gross unrealized losses of $(20)$(2,370) million and $(20)$(835) million and had been in a loss position for 12 months or more at December 31, 20202023 and 2019,December 31, 2022, respectively. GrossAt December 31, 2023, the majority of our U.S. and Non-U.S. corporate securities' gross unrealized losses of $(106) million at December 31, 2020 included $(26) million related to U.S. corporate securities, primarilywere in the energy industry,consumer, electric, technology and $(70)insurance industries. In addition, gross unrealized losses on our Mortgage and asset-backed securities included $(203) million related to commercial mortgage-backed securities (CMBS). Substantially all collateralized by pools of commercial mortgage loans on real estate, and $(82) million related to asset-backed securities. The majority of our CMBS and asset-backed securities in an unrealized loss position have received investment-grade credit ratings from the major rating agenciesagencies. For our securities in an unrealized loss position, the losses are not indicative of credit losses, we currently do not intend to sell the investments, and are collateralized by poolsit is not more likely than not that we will be required to sell the investments before recovery of commercial mortgage loans on real estate.their amortized cost basis.
Net unrealized gains (losses) for equity securities with readily determinable fair values were $(1,670) million, $800 million and an insignificant amount for the years ended December 31, 2020, 2019 and 2018, respectively. | | | | | | | | | | | | | | |
| | | | |
| For the years ended December 31 | | | | 2023 | 2022 | 2021 |
| Net unrealized gains (losses) for equity securities with RDFV | | | | $ | 6,413 | | $ | (40) | | $ | 1,660 | |
| Proceeds from debt/equity securities sales and early redemptions | | | | 12,712 | | 7,267 | | 6,665 | |
| Gross realized gains on debt securities | | | | 52 | | 34 | | 69 | |
| Gross realized losses and impairments on debt securities | | | | (66) | | (42) | | (11) | |
Proceeds from debt and equity securities sales, early redemptions by issuers and principal payments on the BKR promissory note totaled $5,060 million, $7,967 million and $3,222 million for the years ended December 31, 2020, 2019, and 2018, respectively. Gross realized gains on investment securities were $177 million, $115 million and $249 million, and gross realized losses and impairments were $(364) million, $(203) million and $(41) million for the years ended December 31, 2020, 2019 and 2018, respectively.
GE Capital cashCash flows associated with purchases, dispositions and maturities of insurance investment securities are as follows:
| | | | | | | | |
| For the years ended December 31 | 2020 | 2019 |
| Purchases of investment securities | $ | (6,031) | | $ | (6,205) | |
| Dispositions and maturities of investment securities | 4,679 | | 4,589 | |
| Net (purchases) dispositions of GE Capital investment securities | $ | (1,352) | | $ | (1,616) | |
| | | | | | | | |
| For the years ended December 31 | 2023 | 2022 |
| Purchases of investment securities | $ | (5,163) | | $ | (4,046) | |
| Dispositions and maturities of investment securities | 4,176 | | 3,170 | |
| Net (purchases) dispositions of insurance investment securities | $ | (986) | | $ | (876) | |
Contractual maturities of our debt securities (excluding mortgage and asset-backed securities) at December 31, 20202023 are as follows: | | | | | | | | |
| Amortized
cost | Estimated
fair value |
| Due | | |
| Within one year | $ | 494 | | $ | 501 | |
| After one year through five years | 2,781 | | 3,070 | |
| After five years through ten years | 6,390 | | 7,687 | |
| After ten years | 20,778 | | 27,321 | |
| | | | | | | | |
| Amortized cost | Estimated fair value |
| Within one year | $ | 618 | | $ | 609 | |
| After one year through five years | 5,004 | | 5,049 | |
| After five years through ten years | 5,131 | | 5,234 | |
| After ten years | 23,311 | | 22,205 | |
We expect actual maturities to differ from contractual maturities because borrowers have the right to call or prepay certain obligations.
In addition to the equity securities described above, we hold $285held $1,012 million and $517$614 million of equity securities without readily determinable fair valueRDFV, including $939 million and $548 million at Insurance, as of December 31, 20202023 and December 31, 2019,2022, respectively, that are classified within non-current All other assets in our consolidated Statement of Financial Position. Fair value adjustments, including impairments, recorded in earnings were $(161)$69 million for the year ended December 31, 20202023 and insignificant amounts for boththe years ended December 31, 20192022 and 2018.2021. These are primarily limited partnership investments in private equity, infrastructure and real estate funds that are measured at net asset value per share (or equivalent) as a practical expedient to estimated fair value and are excluded from the fair value hierarchy.
Our run-off insurance operations have approximately $800 million of assets held by states or other regulatory bodies in statutorily required deposit accounts, and approximately $31,800 million of assets held in trust accounts associated with reinsurance contracts and reinsurance security trust agreements in place between either Employers Reassurance Corporation (ERAC) or Union Fidelity Life Insurance Company (UFLIC) as the reinsuring entity and a number of ceding insurers. Assets in these trusts are held by an independent trustee for the benefit of the ceding insurer, and are subject to various investment guidelines as set forth in the respective reinsurance contracts and trust agreements. Some of these trust agreements may allow a ceding company to withdraw trust assets from the trust and hold these assets on its balance sheet, in an account under its control for the benefit of ERAC or UFLIC which might allow the ceding company to exercise investment control over such assets.
NOTE 4. CURRENT AND LONG-TERM RECEIVABLES
| | | | | | | | | | | | | | | | | |
| Consolidated | | GE Industrial |
| December 31 | 2020 | 2019 | | 2020 | 2019 |
| Power | $ | 3,995 | | $ | 4,689 | | | $ | 2,656 | | $ | 3,289 | |
| Renewable Energy | 2,401 | | 2,306 | | | 1,903 | | 1,749 | |
| Aviation(a) | 4,417 | | 3,249 | | | 3,490 | | 2,867 | |
| Healthcare | 2,336 | | 2,105 | | | 1,498 | | 1,379 | |
| Corporate | 310 | | 246 | | | 293 | | 223 | |
| Customer receivables | 13,459 | | 12,594 | | | 9,841 | | 9,507 | |
| Sundry receivables(b)(c) | 4,395 | | 4,848 | | | 4,763 | | 5,047 | |
| Allowance for losses(d) | (1,164) | | (874) | | | (1,161) | | (872) | |
| Total current receivables | $ | 16,691 | | $ | 16,568 | | | $ | 13,442 | | $ | 13,682 | |
| | | | | | | | |
| CURRENT RECEIVABLES | |
| December 31 | 2023 | 2022 |
| | |
| | |
| | |
| | |
| | |
| | |
| Customer receivables | $ | 12,349 | | $ | 11,803 | |
| Revenue sharing program receivables(a) | 1,252 | | 1,326 | |
| Non-income based tax receivables | 1,140 | | 1,146 | |
| Supplier advances | 891 | | 691 | |
| Receivables from disposed businesses | 121 | | 115 | |
| Other sundry receivables | 360 | | 518 | |
| | |
| Allowance for credit losses | (647) | | (768) | |
| Total current receivables | $ | 15,466 | | $ | 14,831 | |
(a) Includes Aviation receivables from CFM due to 737 MAX temporary fleet grounding of $448 million and $1,397 million as of December 31, 2020 and 2019, respectively. During 2020, CFM and Boeing reached an agreement to secure payment terms for engines delivered in 2019 and 2020, net of progress collections. Based on the agreement, the receivable is expected to be collected from Boeing through the first quarter of 2021.
(b) Includes supplier advances, revenueRevenue sharing programsprogram receivables in our Aviation business, other non-income based tax receivables, primarily value-added tax related to our operations in various countries outside of the U.S., receivables from disposed businesses, including receivables for transactional agreements and certain intercompany balances that eliminate upon consolidation. Revenue sharing programs receivables in AviationAerospace are amounts due from third parties who participate in engine programs by developing and supplying certain engine components through the life of the program. The participants share in program revenues, receive a share of customer progress payments and share costs related to discounts and warranties.
(c) Consolidated current receivables include deferred purchase price which represents our retained risk with respect to current customer receivables sold to third parties through one of the receivable facilities. The balance of the deferred purchase price held by GE Capital at December 31, 2020 and 2019, was $413 million and $421 million, respectively.
(d) GE Industrial allowance for credit losses primarily increased due to net provisions of $274 million, offset by write-offs and foreign currency impact. | | | | | | | | | | | |
| ALLOWANCE FOR CREDIT LOSSES | 2023 | 2022 | 2021 |
| Balance as of January 1 | $ | 768 | | $ | 967 | | $ | 1,055 | |
| New provisions, net of (releases) | 32 | | (14) | | 136 | |
| Write-offs, net | (161) | | (87) | | (198) | |
| Foreign exchange and other | 8 | | (98) | | (26) | |
| Balance as of December 31 | $ | 647 | | $ | 768 | | $ | 967 | |
| | | | | | | | |
| December 31 | 2023 | 2022 |
| Aerospace | $ | 8,010 | | $ | 7,784 | |
| Renewable Energy | 2,907 | | 2,415 | |
| Power | 4,232 | | 4,229 | |
| Corporate | 318 | | 404 | |
| Total current receivables | $ | 15,466 | | $ | 14,831 | |
Sales of GE Industrialcustomer receivables. From time to time, the Company sells current customer receivables. When GE Industrial sellsor long-term receivables to third parties in response to customer-sponsored requests or programs, to facilitate sales, or for risk mitigation purposes. The Company sold current customer receivables to GE Capital or third parties it acceleratesand subsequently collected $2,110 million and $2,052 million in the receipt ofyear ended December 31, 2023 and 2022, respectively, related primarily to our participation in customer-sponsored supply chain finance programs. Within these programs, primarily in Renewable Energy and Aerospace, the Company has no continuing involvement, fees associated with the transferred receivables are covered by the customer and cash that would have otherwise been collected from customers. In any given period,is received at the amount of cash received fromoriginal invoice due date. Included in the sales of customer receivables compared to the cash GE Industrial would have otherwise collected had those customer receivables not been sold represents the cash generated or used in the period relating to this activity. GE Industrial sales of customer receivables to GE Capital or third parties are made on arms-length terms and any discount related to time value of money is recognized by GE Industrial when the customer receivables are sold. In our Statement of Cash Flows, receivables purchased and retained by GE Capital are reflected as cash from operating activities at GE Industrial, primarily as cash used for investing activities at GE Capital and are eliminated in consolidation. Collections on receivables purchased by GE Capital are reflected primarily as cash from investing activities at GE Capital and are reclassified to cash from operating activities in consolidation. As of December 31, 2020 and 2019, GE Industrial sold approximately 40% and 51%, respectively, of its gross customer receivables to GE Capital or third parties. Any difference between the carrying value of receivables sold and total cash collected is recognized as financing costs by GE Industrial in Interest and other financial charges in our consolidated Statement of Earnings (Loss). Costs of $264 million and $515 million were recognized during the yearsyear ended December 31, 2020 and 2019, respectively. The decrease2023, was $82 million in costs from prior year was driven by lower sales of receivables as well as lower benchmark interest rates. Activity related to customer receivables sold by GE Industrial is as follows:our Gas Power business, primarily for risk mitigation purposes.
| | | | | | | | | | | | | | | | | | | | | | | |
| GE Capital | | Third Parties | | GE Capital | | Third Parties |
| 2020 | | 2019 |
| Balance at January 1 | $ | 3,087 | | | $ | 6,757 | | | $ | 4,386 | | | $ | 7,880 | |
| GE Industrial sales to GE Capital | 32,869 | | | — | | | 40,988 | | | — | |
| GE Industrial sales to third parties | — | | | 863 | | | — | | | 5,286 | |
| GE Capital sales to third parties | (18,654) | | | 18,654 | | | (28,073) | | | 28,073 | |
| Collections and other | (14,004) | | | (23,283) | | | (14,621) | | | (34,482) | |
| Reclassification from long-term customer receivables | 321 | | | 0 | | | 407 | | | 0 | |
| Balance at December 31 | $ | 3,618 | | (a) | $ | 2,992 | | | $ | 3,087 | | (a) | $ | 6,757 | |
| | | | | | | | | | | |
| LONG-TERM RECEIVABLES | | | |
| | | | | |
| December 31 | 2023 | 2022 | | | |
| Long-term customer receivables(a) | $ | 479 | | $ | 457 | | | | |
| Supplier advances | 274 | | 266 | | | | |
| Non-income based tax receivables | 174 | | 213 | | | | |
| | | | | |
| Sundry receivables | 373 | | 483 | | | | |
| | | | | |
| Allowance for credit losses | (171) | | (183) | | | | |
| Total long-term receivables | $ | 1,129 | | $ | 1,236 | | | | |
(a) At December 31, 2020 and 2019, $505The Company sold $83 million and $539 million, respectively, of the current receivables purchased and retained by GE Capital, had been sold by GE Industrial to GE Capital with recourse (i.e., GE Industrial retains all or some risk of default). The effect on GE Industrial cash flows from operating activities (CFOA) of claims by GE Capital on receivables sold with recourse was insignificant for the years ended December 31, 2020 and 2019.
| | | | | | | | | | | | | | | | | |
| LONG-TERM RECEIVABLES | Consolidated | | GE Industrial |
| December 31 | 2020 | 2019 | | 2020 | 2019 |
| Long-term customer receivables(a) | $ | 585 | | $ | 906 | | | $ | 474 | | $ | 506 | |
| Long-term sundry receivables(b) | 1,748 | | 1,705 | | | 2,097 | | 2,035 | |
| Allowance for losses | (142) | | (128) | | | (142) | | (128) | |
| Total long-term receivables | $ | 2,191 | | $ | 2,483 | | | $ | 2,430 | | $ | 2,413 | |
(a) As of December 31, 2020 and 2019, GE Capital held $111 million and $400 million, respectively, of GE Industrial long-term customer receivables, of which $98 million and $312 million had been purchased with recourse (i.e., GE Industrial retains all or some risk of default). GE Industrial sold an insignificant amount of long-term customer receivables duringto third parties for the yearsyear ended December 31, 2020 and 2019.
(b) Includes supplier advances, revenue sharing programs receivables, other non-income based tax receivables and certain intercompany balances that eliminate upon consolidation.
UNCONSOLIDATED RECEIVABLES FACILITIES. GE Capital has 2 revolving receivables facilities, under which customer receivables purchased from GE Industrial are sold to third parties. In the first facility, which has a program size of $2,000 million, upon the sale of receivables, we receive proceeds of cash and deferred purchase price and the Company’s remaining2022, primarily in our Gas Power business for risk with respect to the sold receivables is limited to the balance of the deferred purchase price. The program size of the first facility at December 31, 2019 was $3,100 million. Under the second facility, upon the sale of receivables, we receive the proceeds of cash only and therefore the Company has no remaining risk with respect to the sold receivables. In December 2020, GE Capital did not renew the second facility. The program size of the second facility at December 31, 2019 was $1,200 million.
Activity related to these facilities is included in GE Capital sales to third parties line in the sales of GE Industrial current customer receivables table above and is as follows:
| | | | | | | | | | | |
| For the years ended December 31 | 2020 | | 2019 |
| Customer receivables sold to receivables facilities | $ | 13,591 | | | $ | 21,695 | |
| Total cash purchase price for customer receivables | 13,031 | | | 21,202 | |
| Cash collections re-invested to purchase customer receivables | 11,567 | | | 18,012 | |
| | | |
| Non-cash increases to deferred purchase price | $ | 481 | | | $ | 257 | |
| Cash payments received on deferred purchase price | 489 | | | 303 | |
Cash payments received on deferred purchase price are reflected as cash from investing activities in both the GE Capital and consolidated columns within our Statement of Cash Flows.
CONSOLIDATED SECURITIZATION ENTITIES. GE Capital consolidates 3 variable interest entities (VIEs) that purchased customer receivables and long-term customer receivables from GE Industrial. At December 31, 2020 and 2019, these VIEs held current customer receivables of $1,489 million and $2,080 million and long-term customer receivables of $93 million and $375 million, respectively. At December 31, 2020 and 2019, the outstanding debt under their respective debt facilities was $892 million and $1,655 million, respectively. mitigation purposes.
NOTE 5. FINANCING RECEIVABLES AND ALLOWANCES
| | | | | | | | | | | | | | | | | |
| Consolidated | | GE Capital |
| December 31 | 2020 | 2019 | | 2020 | 2019 |
| Loans, net of deferred income | $ | 1,300 | | $ | 1,098 | | | $ | 5,124 | | $ | 4,927 | |
| Allowance for losses | (36) | | (21) | | | (13) | | (5) | |
| Current financing receivables - net | 1,265 | | 1,077 | | | 5,110 | | 4,922 | |
| Investment in financing leases, net of deferred income | 1,805 | | 2,070 | | | 1,805 | | 2,070 | |
| Allowance for losses | (34) | | (12) | | | (34) | | (12) | |
| Non-current financing receivables - net | 1,771 | | 2,057 | | | 1,771 | | 2,057 | |
| Total financing receivables – net | $ | 3,036 | | $ | 3,134 | | | $ | 6,882 | | $ | 6,979 | |
Cash flows associated with GE Capital financing receivables are as follows:
| | | | | | | | |
| For the years ended December 31 | 2020 | 2019 |
| Increase in loans to customers | $ | (15,155) | | $ | (15,022) | |
| Principal collections from customers - loans | 15,311 | | 18,083 | |
| Sales of financing receivables and other | 42 | | 328 | |
| Net decrease (increase) in GE Capital financing receivables | $ | 199 | | $ | 3,389 | |
Consolidated finance lease income was $144 million, $173 million and $275 million for the years ended December 31, 2020, 2019 and 2018, respectively. | | | | | | | | | | | | | | | | | | | | | | | | | | |
| NET INVESTMENT IN FINANCING LEASES | Total financing leases | | Direct financing and sales type leases(a) | | Leveraged leases |
| December 31 | 2020 | 2019 | | 2020 | 2019 | | 2020 | 2019 |
| Total minimum lease payments receivable | $ | 1,202 | | $ | 1,628 | | | $ | 654 | | 799 | | | $ | 548 | | $ | 829 | |
| Less principal and interest on third-party non-recourse debt | (83) | | (216) | | | — | | — | | | (83) | | (216) | |
| Net minimum lease payments receivable | 1,119 | | 1,412 | | | 654 | | 799 | | | 465 | | 613 | |
| Less deferred income | (133) | | (178) | | | (99) | | (139) | | | (34) | | (39) | |
| Discounted lease receivable | 986 | | 1,234 | | | 556 | | 660 | | | 431 | | 574 | |
| Estimated unguaranteed residual value of leased assets, net of deferred income | 819 | | 835 | | | 472 | | 412 | | | 347 | | 423 | |
| Investment in financing leases, net of deferred income(b) | $ | 1,805 | | $ | 2,070 | | | $ | 1,028 | | $ | 1,072 | | | $ | 777 | | $ | 997 | |
(a) Included $506 million of investment in sales type leases at both December 31, 2020 and 2019.
(b) See Note 15 for deferred tax amounts related to financing leases.
| | | | | | | | | | | | | | | | | | | | | | | |
| CONTRACTUAL MATURITIES, DUE IN | 2021 | 2022 | 2023 | 2024 | 2025 | Thereafter | Total |
| Total loans | $ | 4,199 | | $ | 261 | | $ | 142 | | $ | 134 | | $ | 318 | | $ | 68 | | $ | 5,124 | |
| Net minimum lease payments receivable | 294 | | 200 | | 281 | | 193 | | 68 | | 83 | | 1,119 | |
We expect actual maturities to differ from contractual maturities, primarily as a result of prepayments.
We manage our GE Capital financing receivables portfolio using delinquency and nonaccrual data as key performance indicators. At December 31, 2020, 5.7%, 5.0% and 5.3% of financing receivables were over 30 days past due, over 90 days past due and on nonaccrual, respectively, with the vast majority of nonaccrual financing receivables secured by collateral. At December 31, 2019, 4.2%, 2.9% and 6.1% of financing receivables were over 30 days past due, over 90 days past due and on nonaccrual, respectively.
GE Capital financing receivables that comprise receivables purchased from GE Industrial are reclassified to either Current receivables or All other assets in the consolidated Statement of Financial Position. To the extent these receivables are purchased with full or limited recourse, they are excluded from the delinquency and nonaccrual data above. See Note 4 for further information.
NOTE 6. INVENTORIES, INCLUDING DEFERRED INVENTORY COSTS
| | December 31 | December 31 | 2020 | 2019 | December 31 | 2023 | 2022 |
| Raw materials and work in process | Raw materials and work in process | $ | 7,937 | | $ | 8,771 | |
| Finished goods | Finished goods | 5,654 | | 5,333 | |
| Deferred inventory costs(a) | Deferred inventory costs(a) | 2,299 | | 3,111 | |
| Inventories, including deferred inventory costs | Inventories, including deferred inventory costs | $ | 15,890 | | $ | 17,215 | |
(a) Represents cost deferral for shipped goods (such as components for wind turbine assemblies within our Renewable Energy segment) and labor and overhead costs on time and material service contracts (primarily originating in Power and Aviation)Aerospace) and other costs for which the criteria for revenue recognition has not yet been met. This was previously recorded in Contract and other deferred assets.
NOTE 7.6. PROPERTY, PLANT AND EQUIPMENT AND OPERATING LEASES
| | | | | | | | | | | | | | | | | | | | |
| Depreciable lives | Original Cost | | Net Carrying Value |
| December 31 | (in years) | 2020 | 2019 | | 2020 | 2019 |
| Land and improvements | 8 | $ | 599 | | $ | 608 | | | $ | 589 | | $ | 596 | |
| Buildings, structures and related equipment | 8 - 40 | 8,210 | | 7,824 | | | 3,828 | | 3,875 | |
| Machinery and equipment | 4 - 20 | 20,915 | | 20,082 | | | 7,869 | | 8,360 | |
| Leasehold costs and manufacturing plant under construction | 1 - 10 | 2,028 | | 2,165 | | | 1,350 | | 1,539 | |
| ROU operating lease assets | | | | | 2,798 | | 3,077 | |
| GE Industrial | | $ | 31,751 | | $ | 30,680 | | | $ | 16,433 | | $ | 17,447 | |
| | | | | | |
| Land and improvements, buildings, structures and related equipment | 1 - 40 | $ | 144 | | $ | 149 | | | $ | 23 | | $ | 29 | |
| Equipment leased to others (ELTO)(a) | | | | | | |
| Aircraft | 15 - 20 | 34,372 | | 35,507 | | | 20,931 | | 21,414 | |
| Engines | 15 - 20 | 4,957 | | 4,113 | | | 3,540 | | 3,283 | |
| Helicopters | 15 - 20 | 5,750 | | 5,474 | | | 4,724 | | 4,709 | |
| All other | 15 - 35 | 235 | | 237 | | | 194 | | 214 | |
| ROU operating lease assets | | | | | 189 | | 237 | |
| GE Capital | | $ | 45,458 | | $ | 45,480 | | | $ | 29,600 | | $ | 29,886 | |
| | | | | | |
| Eliminations | | (1,282) | | (1,279) | | | (1,372) | | (1,453) | |
| Property, plant and equipment - net | | $ | 75,927 | | $ | 74,880 | | | $ | 44,662 | | $ | 45,879 | |
(a) Included $1,475 million and $1,539 million of original cost of assets leased to GE Industrial with accumulated amortization of $(306) million and $(251) million at December 31, 2020 and 2019, respectively.
Consolidated depreciation and amortization related to property, plant and equipment was $4,636 million, $4,026 million and $4,419 million for the years ended December 31, 2020, 2019 and 2018, respectively. Amortization of GE Capital ELTO was $2,527 million, $2,019 million and $2,089 million for the years ended December 31, 2020, 2019 and 2018, respectively. | | | | | | | | | | | | | | | | | | | | |
| Depreciable lives | Original Cost | | Net Carrying Value |
| December 31 | (in years) | 2023 | 2022 | | 2023 | 2022 |
| Land and improvements | 8 | $ | 482 | | $ | 472 | | | $ | 469 | | $ | 461 | |
| Buildings, structures and related equipment | 8 - 40 | 6,340 | | 6,024 | | | 2,852 | | 2,703 | |
| Machinery and equipment | 4 - 20 | 19,003 | | 18,577 | | | 6,280 | | 6,163 | |
| Leasehold costs and manufacturing plant under construction | 1 - 10 | 1,507 | | 1,568 | | | 1,053 | | 1,012 | |
| ROU operating lease assets | | | | | 1,840 | | 1,854 | |
| Property, plant and equipment - net | | $ | 27,332 | | $ | 26,641 | | | $ | 12,494 | | $ | 12,192 | |
In the thirdfirst quarter of 2020,2022, we signed a non-binding memorandum of understanding for GE Steam Power to sell a portion of its business to EDF, which resulted in a reclassification of that business to held for sale. As a result, we recognized a non-cash pre-tax impairment charge of $316$59 million related to property, plant and equipment at our remaining Steam business within our Power segment due to our recent announcement to exit the new build coal power market. We determined the fair value of these assets using an income approach.segment. This charge was recorded by Corporate in Selling, general, and administrative expenses in our consolidated Statement of Earnings (Loss).
During 2020, our GE Capital Aviation Services (GECAS) business recognized pre-tax impairments of $542 million, primarily on its fixed-wing aircraft operating lease portfolio. Pre-tax impairments were $74 million for 2019. We determined the fair values of these assets using primarily the income approach. These charges are included in costs of services sold within the Statement of Earnings (Loss) and within our Capital segment.
Noncancellable future rentals due from customers for equipment on operating leases at December 31, 2020, are as follows:
| | | | | | | | | | | | | | | | | | | | | | | |
| 2021 | 2022 | 2023 | 2024 | 2025 | Thereafter | Total |
| $ | 2,833 | | $ | 2,451 | | $ | 2,072 | | $ | 1,970 | | $ | 1,658 | | $ | 5,316 | | $ | 16,300 | |
Income on our operating lease portfolio, primarily from our GECAS business, was $3,342 million, $3,804 million, and $4,075 million for the years ended December 31, 2020, 2019, and 2018, respectively, and comprises fixed lease income of $2,834 million, $3,045 million and $3,243 million and variable lease income of $508 million, $759 million and $832 million, respectively.
Operating Lease Liabilities. Our consolidated operating lease liabilities, included within in All other liabilities in our Statement of Financial Position, were $2,973was $1,973 million and $3,162$2,089 million, as of December 31, 20202023 and 2019, respectively, which included GE Industrial operating lease liabilities of $3,133 million and $3,369 million,2022, respectively. Substantially all of our operating leases have remaining lease terms of 1114 years or less, some of which may include options to extend.
| | OPERATING LEASE EXPENSE | OPERATING LEASE EXPENSE | 2020 | 2019 | 2018 | OPERATING LEASE EXPENSE | 2023 | 2022 | 2021 |
| Long-term (fixed) | Long-term (fixed) | $ | 745 | | $ | 834 | | $ | 966 | |
| Long-term (variable) | Long-term (variable) | 118 | | 136 | | 177 | |
| Short-term | Short-term | 209 | | 206 | | 133 | |
| Total operating lease expense | Total operating lease expense | $ | 1,072 | | $ | 1,176 | | $ | 1,276 | |
| | MATURITY OF LEASE LIABILITIES | MATURITY OF LEASE LIABILITIES | 2021 | 2022 | 2023 | 2024 | 2025 | Thereafter | Total | MATURITY OF LEASE LIABILITIES | 2024 | 2025 | 2026 | 2027 | 2028 | Thereafter | Total |
| Undiscounted lease payments | Undiscounted lease payments | $ | 727 | | $ | 648 | | $ | 549 | | $ | 437 | | $ | 267 | | $ | 805 | | $ | 3,433 | |
| Less: imputed interest | Less: imputed interest | | (460) | |
| Total lease liability as of December 31, 2020 | | $ | 2,973 | |
| Total lease liability as of December 31, 2023 | |
| | | | | | | | |
| SUPPLEMENTAL INFORMATION RELATED TO OPERATING LEASES | 2020 | 2019 |
| Operating cash flows used for operating leases | $ | 766 | | $ | 888 | |
| Right-of-use assets obtained in exchange for new lease liabilities | $ | 600 | | $ | 746 | |
| Weighted-average remaining lease term | 6.6 years | 6.9 years |
| Weighted-average discount rate | 4.5 | % | 4.9 | % |
| | | | | | | | | | | |
| SUPPLEMENTAL INFORMATION RELATED TO OPERATING LEASES | 2023 | 2022 | 2021 |
| Operating cash flows used for operating leases | $ | 659 | | $ | 682 | | $ | 719 | |
| Right-of-use assets obtained in exchange for new lease liabilities | 553 | | 447 | | 513 | |
| Weighted-average remaining lease term | 7.1 years | 5.7 years | 7.5 years |
| Weighted-average discount rate | 4.4 | % | 3.4 | % | 4.2 | % |
NOTE 8.7. GOODWILL AND OTHER INTANGIBLE ASSETS
| CHANGES IN GOODWILL BALANCES | | CHANGES IN GOODWILL BALANCES | |
| CHANGES IN GOODWILL BALANCES | |
| | 2019 | 2020 |
| Balance at
December 31, 2018 | Dispositions | Impairments | Currency exchange and other | Balance at
December 31, 2019 | Acquisitions | Impairments | Currency exchange and other | Balance at
December 31, 2020 |
| Balance at December 31, 2021 | |
| Balance at December 31, 2021 | |
| Balance at December 31, 2021 | | Dispositions | | Currency exchange and other | | Balance at December 31, 2022 | Acquisitions | | Currency exchange and other | Balance at December 31, 2023 |
| Aerospace | |
| Renewable Energy | |
| Power | Power | $ | 139 | | $ | 0 | | $ | 0 | | $ | 6 | | $ | 145 | | $ | 0 | | $ | 0 | | $ | 0 | | $ | 146 | |
| Renewable Energy | 4,730 | | 0 | | (1,486) | | 46 | | 3,290 | | 0 | | 0 | | 111 | | 3,401 | |
| Aviation | 9,839 | | 0 | | 0 | | 20 | | 9,859 | | 0 | | (877) | | 266 | | 9,247 | |
| Healthcare | 17,226 | | (5,558) | | 0 | | 60 | | 11,728 | | 89 | | 0 | | 37 | | 11,855 | |
| Capital | 904 | | (39) | | 0 | | (26) | | 839 | | 0 | | (839) | | 0 | | 0 | |
| Corporate(a) | Corporate(a) | 1,136 | | 0 | | 0 | | (262) | | 873 | | 0 | | 0 | | 2 | | 876 | |
| Total | Total | $ | 33,974 | | $ | (5,597) | | $ | (1,486) | | $ | (156) | | $ | 26,734 | | $ | 90 | | $ | (1,717) | | $ | 417 | | $ | 25,524 | |
(a) Corporate balance at December 31, 20202023 and 2019 is2022 comprises our Digital business.
In the fourth quarter of 2020,2023, we performed our annual impairment test. Based on the results of this test, the fair values of each of our reporting units exceeded their carrying values.
We continue to monitor the operating results and cash flow forecasts ofvalues, however, we identified one reporting unit, our Additive reporting unit in our AviationAerospace segment, asfor which the fair value of this reporting unit was not significantlysubstantially in excess of its carrying value. At December 31, 2020,2023, our Additive reporting unit had goodwill of $243$247 million.
In the second quarter of 2020 we performed an interim impairment test at our Additive reporting unit within our Aviation segment and GECAS reporting unit within our Capital segment, both of which incorporated a combination of income and market valuation approaches. The results of the analysis indicated that carrying values of both reporting units were in excess of their respective fair values. Therefore, we recorded non-cash impairment losses of $877 million and $839 million for the Additive and GECAS reporting units, respectively, in the caption Goodwill impairments in our consolidated Statement of Earnings (Loss). All of the goodwill in Additive was the result of the Arcam AB and Concept Laser GmBH acquisitions in 2016. Of the $839 million of goodwill for GECAS, $729 million arose from the acquisition of Milestone Aviation, our helicopter leasing business, in 2015. After the impairment charges, there was no goodwill remaining in our GECAS reporting unit.
In 2019, goodwill decreased by $7,240 million, primarily as a result of transferring goodwill in our BioPharma business within our Healthcare segment to held for sale in the amount of $5,548 million, and recognizing a total non-cash goodwill impairment loss in our Grid Solutions equipment and services and Hydro reporting units in our Renewable Energy segment of $744 million and $742 million, respectively. After the impairment charges, the Grid Solutions equipment and services and Hydro reporting units have no remaining goodwill.
Determining the fair value of reporting units requires the use of estimates and significant judgments that are based on a number of factors including actual operating results. It is reasonably possible that the judgments and estimates described above could change in future periods.
GE 20202023 FORM 10-K75 55
| | 2020 | | 2019 |
| | 2023 | | | | 2023 | | 2022 |
INTANGIBLE ASSETS SUBJECT TO AMORTIZATION December 31 | INTANGIBLE ASSETS SUBJECT TO AMORTIZATION December 31 | Useful lives
(in years) | Gross carrying
amount | Accumulated
amortization | Net | | Gross carrying
amount | Accumulated
amortization | Net | INTANGIBLE ASSETS SUBJECT TO AMORTIZATION December 31 | Useful lives
(in years) | Gross carrying
amount | Accumulated
amortization | Net | | Gross carrying
amount | Accumulated
amortization | Net |
| Customer-related(a) | Customer-related(a) | 3 - 30 | $ | 6,862 | | $ | (3,432) | | $ | 3,430 | | | $ | 6,770 | | $ | (3,070) | | $ | 3,701 | |
| Patents and technology | Patents and technology | 2 - 25 | 8,191 | | (4,135) | | 4,056 | | | 8,180 | | (3,730) | | 4,450 | |
| Capitalized software | Capitalized software | 3 - 10 | 5,826 | | (3,840) | | 1,986 | | | 5,822 | | (3,651) | | 2,171 | |
| Trademarks & other | Trademarks & other | 3 - 50 | 778 | | (477) | | 301 | | | 737 | | (406) | | 332 | |
| Total | Total | | $ | 21,657 | | $ | (11,883) | | $ | 9,774 | | | $ | 21,510 | | $ | (10,857) | | $ | 10,653 | |
(a) Balance includes payments made to our customers, primarily within our AviationAerospace business.
| | | | | | | | |
| December 31 | 2023 | 2022 |
| Aerospace | $ | 4,518 | | $ | 4,748 | |
| Renewable Energy | 149 | | 183 | |
| Power | 858 | | 958 | |
| Corporate | 169 | | 216 | |
| Total other intangible assets, net | $ | 5,695 | | $ | 6,105 | |
Intangible assets decreased $410 million in 2020,2023, primarily as a result of amortization.amortization, partially offset by the acquisition of capitalized software and customer-related intangibles mainly at Aerospace and Power of $191 million. Consolidated amortization expense was $1,382$606 million, $1,569$1,338 million and $2,163$738 million for the years ended December 31, 2020, 20192023, 2022 and 2018, respectively. Included within amortization expense for the years ended December 31, 2020, 2019 and 2018 were non-cash pre-tax impairment charges of $113 million, $103 million, and $428 million2021, respectively.
In the thirdfirst quarter of 2020,2022, we signed a non-binding memorandum of understanding for GE Steam Power to sell a portion of its business to EDF, which resulted in a reclassification of that business to held for sale. As a result, we recognized a non-cash pre-tax impairment charge of $113$765 million related to intangible assets at our remaining Steam business within our Power segment due to our recent announcement to exit the new build coal power market.segment. We determined the fair value of these intangible assets using an income approach. This charge was recorded by Corporate in Selling, general, and administrative expenses in our consolidated Statement of Earnings (Loss).
Estimated consolidated annual pre-tax amortization for intangible assets over the next five calendar years are as follows:
| | | | | | | | | | | | | | | | | |
| ESTIMATED 5 YEAR CONSOLIDATED AMORTIZATION | 2021 | 2022 | 2023 | 2024 | 2025 |
| Estimated annual pre-tax amortization | $ | 1,162 | | $ | 1,085 | | $ | 992 | | $ | 889 | | $ | 817 | |
| | | | | | | | | | | | | | | | | |
| ESTIMATED 5 YEAR CONSOLIDATED AMORTIZATION | 2024 | 2025 | 2026 | 2027 | 2028 |
| Estimated annual pre-tax amortization | $ | 597 | | $ | 559 | | $ | 534 | | $ | 495 | | $ | 483 | |
During 2020,2023, we recorded additions to intangible assets subject to amortization of $420$236 million with a weighted-average amortizable period of 5.99.6 years, including capitalized software of $360$122 million, with a weighted-average amortizable period of 5.26.6 years.
NOTE 9.8. CONTRACT AND OTHER DEFERRED ASSETS & PROGRESS COLLECTIONS AND DEFERRED INCOME
Contract and other deferred assets decreased $1,474$1,337 million in 2020.the year ended December 31, 2023 primarily due to a decrease in long-term service agreements, partially offset by the timing of revenue recognition ahead of billing milestones on long-term equipment contracts. Our long-term service agreements decreased primarily due to billings of $9,571$13,165 million, partially offset by revenues recognized of $11,312 million and a net unfavorablefavorable change in estimated profitability of $229$90 million at Power and $1,100$74 million at Aviation, offset by revenues recognized of $8,971 million. The decrease in long-term service agreements included a $587 million pre-tax charge, at Aviation, to reflect the cumulative COVID-19 pandemic-related impacts of changes to billing and cost assumptions for certain long-term service agreements, reflecting lower engine utilization, anticipated customer fleet restructuring and contract modifications. Additional adjustments could occur in future periods and could be material for certain long-term service agreements if actual customer operating behavior differs significantly from Aviation's current estimates.Aerospace.
| | | | | | | | | | | | | | | | | | | | |
| December 31, 2020 | Power | Aviation | Renewable Energy | Healthcare | Other | Total |
| Revenues in excess of billings | $ | 5,282 | | $ | 3,072 | | $ | 0 | | $ | 0 | | $ | 0 | | $ | 8,354 | |
| Billings in excess of revenues | (1,640) | | (5,375) | | 0 | | 0 | | 0 | | (7,015) | |
| Long-term service agreements | $ | 3,642 | | $ | (2,304) | | $ | 0 | | $ | 0 | | $ | 0 | | $ | 1,338 | |
| Short-term and other service agreements | 129 | | 282 | | 106 | | 173 | | 29 | | 719 | |
| Equipment contract revenues | 2,015 | | 59 | | 1,127 | | 306 | | 201 | | 3,707 | |
| Current contract assets | $ | 5,786 | | $ | (1,963) | | $ | 1,233 | | $ | 479 | | $ | 229 | | $ | 5,764 | |
| | | | | | |
| Nonrecurring engineering costs(a) | 16 | | 2,409 | | 34 | | 31 | | 0 | | 2,490 | |
| Customer advances and other(b) | 822 | | 2,481 | | 0 | | 128 | | (32) | | 3,398 | |
| Non-current contract and other deferred assets | $ | 838 | | $ | 4,889 | | $ | 34 | | $ | 159 | | $ | (32) | | $ | 5,888 | |
| Total contract and other deferred assets | $ | 6,623 | | $ | 2,927 | | $ | 1,268 | | $ | 638 | | $ | 197 | | $ | 11,653 | |
| | | | | | | | | | | | | | | | | |
| December 31, 2023 | Aerospace | Renewable Energy | Power | Corporate | Total |
| Revenues in excess of billings | $ | 2,377 | | $ | — | | $ | 5,205 | | $ | — | | $ | 7,582 | |
| Billings in excess of revenues | (7,902) | | — | | (1,810) | | — | | (9,712) | |
| Long-term service agreements | $ | (5,525) | | $ | — | | $ | 3,395 | | $ | — | | $ | (2,130) | |
| | | | | |
| | | | | |
| Equipment and other service agreements | 494 | | 1,374 | | 1,499 | | 263 | | 3,630 | |
| Current contract assets | $ | (5,030) | | $ | 1,374 | | $ | 4,894 | | $ | 263 | | $ | 1,500 | |
| | | | | |
| Nonrecurring engineering costs(a) | 2,444 | | 18 | | 1 | | — | | 2,463 | |
| Customer advances and other(b) | 2,342 | | — | | 601 | | — | | 2,943 | |
| Non-current contract and other deferred assets | $ | 4,785 | | $ | 18 | | $ | 603 | | $ | — | | $ | 5,406 | |
| Total contract and other deferred assets | $ | (245) | | $ | 1,392 | | $ | 5,497 | | $ | 263 | | $ | 6,907 | |
GE 20202023 FORM 10-K76 56
| | December 31, 2019 | Power | Aviation | Renewable Energy | Healthcare | Other | Total |
| December 31, 2022 | | December 31, 2022 | Aerospace | Renewable Energy | Power | Corporate | Total |
| Revenues in excess of billings | Revenues in excess of billings | $ | 5,342 | | $ | 4,480 | | $ | 0 | | $ | 0 | | $ | 0 | | $ | 9,822 | |
| Billings in excess of revenues | Billings in excess of revenues | (1,561) | | (4,914) | | 0 | | 0 | | 0 | | (6,476) | |
| Long-term service agreements | Long-term service agreements | $ | 3,781 | | $ | (435) | | $ | 0 | | $ | 0 | | $ | 0 | | $ | 3,346 | |
| Short-term and other service agreements | 190 | | 316 | | 43 | | 169 | | 0 | | 717 | |
| Equipment contract revenues | 1,599 | | 82 | | 1,217 | | 324 | | 106 | | 3,327 | |
| | Equipment and other service agreements | |
| | Equipment and other service agreements | |
| | Equipment and other service agreements | |
| Current contract assets | Current contract assets | $ | 5,569 | | $ | (37) | | $ | 1,260 | | $ | 492 | | $ | 106 | | $ | 7,390 | |
| | Nonrecurring engineering costs(a) | |
| Nonrecurring engineering costs(a) | |
| Nonrecurring engineering costs(a) | Nonrecurring engineering costs(a) | $ | 44 | | $ | 2,257 | | $ | 47 | | $ | 35 | | $ | 8 | | $ | 2,391 | |
| Customer advances and other(b) | Customer advances and other(b) | 909 | | 2,313 | | 0 | | 156 | | (32) | | 3,346 | |
| Non-current contract and other deferred assets | Non-current contract and other deferred assets | $ | 953 | | $ | 4,570 | | $ | 47 | | $ | 190 | | $ | (24) | | $ | 5,737 | |
| Total contract and other deferred assets | Total contract and other deferred assets | $ | 6,522 | | $ | 4,533 | | $ | 1,307 | | $ | 683 | | $ | 82 | | $ | 13,127 | |
(a)Included costs incurred prior to production (such as requisition engineering) for equipment production contracts, primarily within our AviationAerospace segment, which are allocatedamortized ratably toover each unit produced.
(b)Included amounts due from customers at AviationAerospace for the sales of engines, spare parts and services, and at Power, for the sale of services upgrades, which we collect through incremental fixed or usage-based fees from servicing the equipment under long-term service agreements. We have reclassified certain prior-year amounts from the long-term service agreements and equipment contract revenues line items in the table above to conform with the current year’s presentation.
PROGRESS COLLECTIONS & DEFERRED INCOME. Progress collections represent cash received from customers under ordinary commercial payment terms in advance of delivery. Progress collections on equipment contracts primarily comprise milestone payments received from customers prior to the manufacture and delivery of customized equipment orders. Other progress collections primarily comprise down payments from customers to reserve production slots for standardized inventory orders such as advance payments from customers when they place orders for wind turbines and blades within our Renewable Energy segment and payments from airframers and airlines for install and spare engines, respectively, within our Aviation segment.
Progress collections and deferred income increased $72$3,392 million in 2020 primarily due to the timing of new collections received in excess of revenue recognition primarily at Renewable Energy Healthcare and Aviation. These increases were partially offset by revenue recognized in excess of new collections at Power. Our Aviation Military equipment business received new collections of $708 million in the second quarter 2020 as part of the U.S. Department of Defense's efforts to support vendors in its supply chain during the pandemic.
Revenues recognized for contracts included in a liability position at the beginning of the year were $12,314$13,967 million and $11,020$12,345 million for the years ended December 31, 20202023 and 2019,2022, respectively.
| | | | | | | | | | | | | | | | | | | | |
December 31, 2020 | Power | Aviation | Renewable Energy | Healthcare | Other | Total |
| Progress collections on equipment contracts | $ | 4,918 | | $ | 214 | | $ | 1,229 | | $ | 0 | | $ | 0 | | $ | 6,362 | |
| Other progress collections | 458 | | 4,623 | | 4,604 | | 414 | | (4) | | 10,096 | |
| Total progress collections | $ | 5,376 | | $ | 4,837 | | $ | 5,834 | | $ | 414 | | $ | (4) | | $ | 16,458 | |
| Current deferred income | 17 | | 132 | | 194 | | 1,309 | | 105 | | 1,757 | |
| Progress collections and deferred income | $ | 5,393 | | $ | 4,969 | | $ | 6,028 | | $ | 1,724 | | $ | 102 | | $ | 18,215 | |
| Non-current deferred income | 116 | | 898 | | 214 | | 564 | | 10 | | 1,801 | |
| Total progress collections and deferred income | $ | 5,509 | | $ | 5,867 | | $ | 6,241 | | $ | 2,288 | | $ | 112 | | $ | 20,016 | |
| | | | | | | | | | | | | | | | | | | | |
December 31, 2019 | | | | | | |
| Progress collections on equipment contracts | $ | 5,857 | | $ | 115 | | $ | 1,268 | | $ | 0 | | $ | 0 | | $ | 7,240 | |
| Other progress collections | 413 | | 4,748 | | 4,193 | | 305 | | 2 | | 9,662 | |
| Total progress collections | $ | 6,270 | | $ | 4,863 | | $ | 5,461 | | $ | 305 | | $ | 2 | | $ | 16,902 | |
| Current deferred income | 18 | | 90 | | 140 | | 1,180 | | 59 | | 1,487 | |
| Progress collections and deferred income | $ | 6,288 | | $ | 4,953 | | $ | 5,602 | | $ | 1,485 | | $ | 61 | | $ | 18,389 | |
| Non-current deferred income | 31 | | 874 | | 144 | | 467 | | 39 | | 1,555 | |
| Total progress collections and deferred income | $ | 6,319 | | $ | 5,827 | | $ | 5,745 | | $ | 1,952 | | $ | 100 | | $ | 19,944 | |
| | | | | | | | | | | | | | | | | |
| December 31, 2023 | Aerospace | Renewable Energy | Power | Corporate | Total |
| | | | | |
| | | | | |
| Progress collections | $ | 6,198 | | $ | 6,886 | | $ | 5,898 | | $ | 124 | | $ | 19,106 | |
| Current deferred income | 201 | | 239 | | 20 | | 112 | | 571 | |
| Progress collections and deferred income | $ | 6,399 | | $ | 7,125 | | $ | 5,918 | | $ | 236 | | $ | 19,677 | |
| Non-current deferred income | 1,150 | | 122 | | 48 | | 20 | | 1,339 | |
| Total Progress collections and deferred income | $ | 7,549 | | $ | 7,247 | | $ | 5,965 | | $ | 256 | | $ | 21,017 | |
| | | | | | | | | | | | | | | | | |
| December 31, 2022 | | | | | |
| | | | | |
| | | | | |
| Progress collections | $ | 5,814 | | $ | 5,195 | | $ | 4,514 | | $ | 131 | | $ | 15,655 | |
| Current deferred income | 233 | | 208 | | 13 | | 107 | | 562 | |
| Progress collections and deferred income | $ | 6,047 | | $ | 5,404 | | $ | 4,527 | | $ | 238 | | $ | 16,216 | |
| Non-current deferred income | 1,110 | | 183 | | 104 | | 12 | | 1,409 | |
| Total Progress collections and deferred income | $ | 7,157 | | $ | 5,586 | | $ | 4,632 | | $ | 250 | | $ | 17,625 | |
GE 2020 FORM 10-K 77
NOTE 10.9. ALL OTHER ASSETS
| | | | | | | | |
| December 31 | 2020 | 2019 |
| Prepaid taxes and deferred charges | $ | 368 | | $ | 610 | |
| Derivative instruments (Note 21) | 440 | | 211 | |
| Other | 27 | | 31 | |
| GE Industrial All other current assets | $ | 835 | | $ | 852 | |
| | |
| Assets held for sale | $ | 871 | | $ | 2,294 | |
| Derivative instruments (Note 21) | 42 | | 529 | |
| Other | 108 | | 113 | |
| GE Capital All other current assets | $ | 1,021 | | $ | 2,936 | |
| Eliminations | (334) | | (426) | |
| Consolidated All other current assets | $ | 1,522 | | $ | 3,362 | |
| | |
| Equity method and other investments | $ | 3,827 | | $ | 4,015 | |
| Long-term receivables (Note 4) | 2,430 | | 2,413 | |
| Prepaid taxes and deferred charges | 817 | | 870 | |
| Other | 874 | | 449 | |
| GE Industrial All other non-current assets | $ | 7,948 | | $ | 7,748 | |
| | |
| Equity method and other investments | $ | 3,199 | | $ | 2,227 | |
| GECAS pre-delivery payments (Note 23) | 2,871 | | 2,934 | |
| Insurance cash and cash equivalents(a) | 455 | | 583 | |
| Other | 543 | | 551 | |
| GE Capital All other non-current assets | $ | 7,068 | | $ | 6,294 | |
| Eliminations | (419) | | (160) | |
| Consolidated All other non-current assets | $ | 14,597 | | $ | 13,882 | |
| Total All other assets | $ | 16,119 | | $ | 17,244 | |
| | | | | | | | |
| December 31 | 2023 | 2022 |
| Derivative instruments (Note 22) | $ | 437 | | $ | 454 | |
| | |
| Prepaid taxes and deferred charges | 248 | | 313 | |
| | |
| Accrued interest and investment income | 466 | | 457 | |
| Other | 495 | | 176 | |
| All other current assets | $ | 1,647 | | $ | 1,400 | |
| | |
| Equity method investments (Note 26) | 7,931 | | 7,633 | |
| | |
| Long-term receivables (Note 4) | 1,129 | | 1,236 | |
| Prepaid taxes and deferred charges | 608 | | 583 | |
| Insurance receivables(a) | 2,364 | | 2,438 | |
| Insurance investments without readily determinable fair value (Note 3) | 939 | | 548 | |
| Insurance cash and cash equivalents(b) | 784 | | 619 | |
| Pension surplus | 1,468 | | 1,793 | |
| Other | 774 | | 627 | |
| All other non-current assets | $ | 15,997 | | $ | 15,477 | |
| Total All other assets | $ | 17,643 | | $ | 16,876 | |
(a) Included commercial mortgage loans related to our run-off insurance operations. See Note 12.
(b) Cash and cash equivalents in GE Capitalour insurance entities isare subject to regulatory restrictions and used for operations of those entities. Therefore, the balance is included in All other assets.
Equity method investments. Unconsolidated entities over which we have significant influence are accounted for as equity method investments and presented on a one-line basis in All other assets on our consolidated Statement of Financial Position. Equity method income includes our share of the results of unconsolidated entities, gains (loss) from sales and impairments of investments, which is included in Other income for GE Industrial and in Revenues from services for GE Capital in our consolidated Statement of Earnings (Loss). See Note 1 for further information.
| | | | | | | | | | | | | | | | | | | | |
| Equity method investment balance | | Equity method income (loss) |
| December 31 | 2020 | 2019 | | 2020 | 2019 | 2018 |
| Power | $ | 576 | | $ | 565 | | | $ | 43 | | $ | (4) | | $ | (20) | |
| Renewable Energy | 724 | | 630 | | | 13 | | (2) | | (1) | |
| Aviation | 2,032 | | 2,073 | | | (41) | | 204 | | 126 | |
| Healthcare | 251 | | 245 | | | 7 | | 19 | | 16 | |
| Capital(a) | 3,110 | | 2,159 | | | 77 | | 217 | | (254) | |
| Corporate items and eliminations | 31 | | 28 | | | 5 | | (11) | | (99) | |
| Total consolidated | $ | 6,724 | | $ | 5,700 | | | $ | 104 | | $ | 423 | | $ | (233) | |
(a) Equity method investments in GE Capital increased $951 million driven primarily by an increase in renewable energy tax equity investments at Energy Financial Services (EFS) and an increase in investments in our run-off insurance operations.
GE 20202023 FORM 10-K78 57
NOTE 11. BORROWINGS
| | | | | | | | | | | | | | | | | |
| December 31 | | 2020 | | 2019 | |
| | Amount | Average Rate | Amount | Average Rate |
| Commercial paper | | $ | 0 | | 0 | % | $ | 3,008 | | 1.62 | % |
| Current portion of long-term borrowings | | 36 | | 5.03 | | 766 | | 0.36 | |
| Current portion of long-term borrowings assumed by GE Industrial | | 2,432 | | 3.49 | | 5,473 | | 3.71 | |
| Other | | 882 | | | 1,832 | | |
| Total GE Industrial short-term borrowings | | $ | 3,350 | | | $ | 11,079 | | |
| | | | | |
| | | | | |
| Current portion of long-term borrowings | | $ | 853 | | 1.72 | % | $ | 11,226 | | 3.01 | % |
| Intercompany payable to GE Industrial | | 2,432 | | | 2,104 | | |
Non-recourse borrowings of consolidated securitization entities | | 892 | | 0.81 | | 1,569 | | 1.26 | |
| Other | | 283 | | | 804 | | |
| Total GE Capital short-term borrowings | | $ | 4,461 | | | $ | 15,702 | | |
| | | | | |
| Eliminations | | (3,033) | | | (3,140) | | |
| Total short-term borrowings | | $ | 4,778 | | | $ | 23,641 | | |
| | | | | |
| Maturities | Amount | Average Rate | Amount | Average Rate |
| Senior notes | 2022-2050 | $ | 18,994 | | 2.90 | % | $ | 14,762 | | 2.11 | % |
| Senior notes assumed by GE Industrial | 2022-2055 | 18,178 | | 3.25 | | 23,024 | | 4.17 | |
| Subordinated notes assumed by GE Industrial | 2035-2037 | 1,779 | | 3.28 | | 2,871 | | 3.68 | |
| | | | | |
| Other | | 435 | | | 324 | | |
| Total GE Industrial long-term borrowings | | $ | 39,386 | | | $ | 40,980 | | |
| | | | | |
| Senior notes | 2022-2042 | $ | 30,132 | | 3.41 | % | $ | 25,371 | | 3.66 | % |
| Subordinated notes | | 189 | | | 178 | | |
| Intercompany payable to GE Industrial | | 16,780 | | | 17,038 | | |
Non-recourse borrowings of consolidated securitization entities | | 0 | | 0 | 86 | | 2.82 | |
| Other | | 582 | | | 626 | | |
| Total GE Capital long-term borrowings | | $ | 47,683 | | | $ | 43,299 | | |
| | | | | |
| Eliminations | | (16,780) | | | (17,038) | | |
| Total long-term borrowings | | $ | 70,288 | | | $ | 67,241 | | |
| Total borrowings | | $ | 75,067 | | | $ | 90,882 | | |
At December 31, 2020, the outstanding GE Capital borrowings that had been assumed by GE Industrial as part of the GE Capital Exit Plan was $22,390 million ($2,432 million short term and $19,957 million long term), for which GE Industrial has an offsetting receivable from GE Capital of $19,213 million. The difference of $3,177 million (0 in short-term borrowings and $3,177 million in long-term borrowings) represents the amount of borrowings GE Capital had funded with available cash to GE Industrial via intercompany loans in lieu of GE Industrial issuing borrowings externally. GE Industrial repaid a total of $9,049 million of intercompany loans from GE Capital in 2020.
At December 31, 2020, total GE Industrial borrowings of $23,523 million comprised GE Industrial-issued borrowings of $20,346 million and intercompany loans from GE Capital to GE Industrial of $3,177 million as described above.
GE Industrial has provided a full and unconditional guarantee on the payment of the principal and interest on all tradable senior and subordinated outstanding long-term debt securities issued or guaranteed by GE Capital. This Guarantee applied to $28,503 million and $34,683 million of GE Capital debt at December 31, 2020 and December 31, 2019, respectively.
In the second quarter of 2020, GE Industrial issued a total of $7,500 million in aggregate principal amount of senior unsecured debt, comprising $1,000 million of 3.450% Notes due 2027, $1,250 million of 3.625% Notes due 2030, $1,500 million of 4.250% Notes due 2040, and $3,750 million of 4.350% Notes due 2050, and used these proceeds in addition to a portion of the proceeds from the BioPharma sale to repay a total of $7,500 million of intercompany loans to GE Capital and to complete a tender offer to purchase $4,237 million in aggregate principal amount of certain GE Industrial unsecured debt, comprising $2,046 million of 2.700% Notes due 2022, €934 million ($1,011 million equivalent) of 0.375% Notes due 2022, €425 million ($460 million equivalent) of 1.250% Notes due 2023, €376 million ($407 million equivalent) of floating-rate Notes due 2020, and $312 million of 3.375% Notes due 2024. The total cash consideration paid for these purchases was $4,282 million and the total carrying amount of the purchased notes was $4,228 million, resulting in a loss of $63 million (including $9 million of fees and other costs associated with the tender) which was recorded in Interest and other financial charges in the GE Industrial Statement of Earnings (Loss). In addition to the purchase price, GE Industrial paid any accrued and unpaid interest on the purchased notes through the date of purchase.
In the second quarter of 2020, GE Capital issued a total of $6,000 million in aggregate principal amount of senior unsecured debt with maturities ranging from 2025 to 2032, and used these proceeds in addition to the proceeds received from repayments of intercompany loans from GE Industrial to complete tender offers to purchase a total of $9,787 million in aggregate principal amount of certain senior unsecured debt. The total cash consideration paid for these purchases was $9,950 million and the total carrying amount of the purchased notes was $9,827 million, resulting in a total loss of $143 million (including $20 million of fees and other costs associated with the tender) which was recorded in Interest and other financial charges in the GE Capital Statement of Earnings (Loss). In addition to the purchase price, GE Capital paid any accrued and unpaid interest on the purchased notes through the date of purchase.NOTE 10. BORROWINGS
In the fourth quarter of 2020, GE Capital completed a tender offer to purchase a total of $2,157 million in aggregate principal amount of certain senior unsecured debt. The total cash consideration paid for these purchases was $2,255 million and the carrying amount of the purchased notes was $2,166 million, resulting in a total loss of $95 million (including $6 million of fees and other costs associated with the tender) which was recorded in Interest and other financial charges in the GE Capital Statement of Earnings (Loss). In addition to the purchase price, GE Capital paid any accrued and unpaid interest on the purchased notes through the date of purchase.
See Notes 4 and 22 for further information about non-recourse borrowings of consolidated securitization entities. See Note 21 for further information about borrowings and associated interest rate swaps. | | | | | | | | | | | | | | | | | |
| | | | | |
| December 31 | | 2023 | | 2022 | |
| | Amount | Average Rate | Amount | Average Rate |
| Current portion of long-term borrowings | | | | | |
| Senior notes | | 1,044 | | 2.42 | % | $ | 3,525 | | 1.30 | % |
| Subordinated notes and other | | 107 | | 6.73 | | 100 | | 6.71 | % |
| Other short- term borrowings | | 103 | | | 115 | | |
| Total short-term borrowings | | $ | 1,253 | | | $ | 3,739 | | |
| | | | | |
| Maturities | Amount | Average Rate | Amount | Average Rate |
| Senior notes | 2025-2055 | $ | 17,509 | | 3.99 | % | $ | 18,079 | | 3.96 | % |
| Subordinated notes | 2035-2037 | 1,383 | | 4.43 | | 1,340 | | 4.72 | % |
| Other | | 819 | | | 901 | | |
| Total long-term borrowings | | $ | 19,711 | | | $ | 20,320 | | |
| Total borrowings | | $ | 20,965 | | | $ | 24,059 | | |
Long-term debt maturities over the next five years follow.as follows.
| | | | | | | | | | | | | | | | | | | | |
| 2021 | | 2022 | 2023 | 2024 | 2025 |
| GE Industrial excluding assumed debt | $ | 36 | | | $ | 2,016 | | $ | 977 | | $ | 477 | | $ | 2,440 | |
| GE Capital debt assumed by GE Industrial | 2,432 | | | 1,483 | | 1,977 | | 918 | | 237 | |
| GE Capital other debt | 853 | | (a) | 1,469 | | 1,771 | | 142 | | 3,477 | |
| | | | | | | | | | | | | | | | | | | | | | | | | | |
| 2024 | | 2025 | 2026 | 2027 | 2028 | Thereafter | Total |
| Long term debt maturities | $1,151 | (a) | $1,827 | $1,334 | $1,580 | $478 | $14,493 | $20,862 |
(a)Fixed and floating rate notes of $340$343 million contain put options with exercise dates in 2021,2024, which have final maturity beyond 2025.2035.
The total interest payments on consolidated borrowings are estimated to be $2,326$823 million, $2,210$774 million, $2,072$706 million, $2,006$653 million and $1,932$628 million for 2021,2024, 2025, 2026, 2027 and 2028, respectively.
NOTE 11. ACCOUNTS PAYABLE AND EQUIPMENT PROJECT PAYABLES
| | | | | | | | |
| December 31 | 2023 | 2022 |
| Trade payables | $ | 10,678 | | $ | 10,033 | |
| Supply chain finance programs(a) | 3,133 | | 3,689 | |
| Equipment project payables(b) | 1,193 | | 1,236 | |
| Non-income based tax payables | 403 | | 441 | |
| Accounts payable and equipment project payables | $ | 15,408 | | $ | 15,399 | |
(a) During the fourth quarter of 2023, Renewable Energy, Power and Corporate made prepayments of $473 million, $185 million and $76 million, respectively, related to supply chain finance programs.
(b) Primarily related to projects at Power and Renewable Energy.
We facilitate voluntary supply chain finance programs with third parties, which provide participating suppliers the opportunity to sell their GE receivables to third parties at the sole discretion of both the suppliers and the third parties. Total supplier invoices paid through these third-party programs were $8,552 million and $6,990 million for the year ended December 31, 2023 and 2022, 2023, 2024 and 2025, respectively.
NOTE 12. INSURANCE LIABILITIES AND ANNUITY BENEFITS.On January 1, 2023, we adopted Accounting Standards Update No. 2018-12, Financial Services – Insurance (Topic 944): Targeted Improvements to the Accounting for Long-Duration Contracts. The new guidance for measuring the liability for future policy benefits and related reinsurance recoverable asset was adopted on a modified retrospective basis such that those balances were adjusted to conform to the new guidance at the January 1, 2021 transition date. Refer to the revised portions of our 2022 Form 10-K filed as Exhibit 99(a) with the Form 8-K on April 25, 2023 for more information.
Insurance liabilities and annuity benefits comprise substantially all obligations to annuitants and insureds in our run-off insurance operations.
| | | | | | | | | | | | | | | | | |
| December 31, 2020 | Long-term care insurance contracts | Structured settlement annuities & life insurance contracts | Other
contracts | Other adjustments(a) | Total |
| Future policy benefit reserves | $ | 16,934 | | $ | 9,207 | | $ | 181 | | $ | 8,160 | | $ | 34,482 | |
| Claim reserves(b) | 4,393 | | 275 | | 1,068 | | — | | 5,736 | |
| Investment contracts | 0 | | 1,034 | | 1,016 | | — | | 2,049 | |
| Unearned premiums and other | 19 | | 189 | | 89 | | — | | 298 | |
| 21,346 | | 10,705 | | 2,354 | | 8,160 | | 42,565 | |
| Eliminations | — | | — | | (374) | | — | | (374) | |
| Total | $ | 21,346 | | $ | 10,705 | | $ | 1,980 | | $ | 8,160 | | $ | 42,191 | |
| | | | | | | | | | | | | | | | | |
| December 31, 2019 | | | | | |
| Future policy benefit reserves | $ | 16,755 | | $ | 9,511 | | $ | 183 | | $ | 5,655 | | $ | 32,104 | |
| Claim reserves(b) | 4,238 | | 252 | | 1,125 | | — | | 5,615 | |
| Investment contracts | 0 | | 1,136 | | 1,055 | | — | | 2,191 | |
| Unearned premiums and other | 30 | | 196 | | 96 | | — | | 322 | |
| 21,023 | | 11,095 | | 2,459 | | 5,655 | | 40,232 | |
| Eliminations | — | | — | | (406) | | — | | (406) | |
| Total | $ | 21,023 | | $ | 11,095 | | $ | 2,053 | | $ | 5,655 | | $ | 39,826 | |
(a)To Our insurance operations (net of eliminations) generated revenues of $3,389 million, $2,957 million and $3,101 million, profit was $332 million, $205 million and $798 million and net earnings was $260 million, $159 million and $627 million for the extent that unrealized gains on specificyears ended December 31, 2023, 2022 and 2021, respectively. These operations were primarily supported by investment securities supporting our insurance contracts would result in a premium deficiency should those gains be realized, an increase in future policy benefit reserves is recorded, with an after-tax reduction of net unrealized gains recognized through Other comprehensive income in our consolidated Statement of Earnings (Loss).
(b)Other contracts included claim reserves of $316$37,592 million and $342$35,503 million, related to short-duration contracts at Electric Insurance Company, netlimited partnerships of eliminations,$3,300 million and $2,506 million, and a diversified commercial mortgage loan portfolio substantially all collateralized by first liens on U.S. commercial real estate properties of $1,947 million and $1,975 million (net of allowance for credit losses of $48 million and $27 million), at December 31, 20202023 and 2019,2022, respectively.
The increase As of December 31, 2023, the commercial mortgage loan portfolio had one delinquent loan, no non-accrual loans and about one-third of the portfolio was held in the office sector which had a weighted average loan-to-value ratio of 68%, debt service coverage of 1.6, and no scheduled maturities through 2025. A summary of our insurance liabilities and annuity benefits of $2,365 million from December 31, 2019 to December 31, 2020 is primarily due to an adjustment of $2,505 million resulting from an increase in unrealized gains on investment securities that would result in a premium deficiency should those gains be realized.presented below:
| | | | | | | | | | | | | | | | | |
| December 31, 2023 | Long-term care | Structured settlement annuities | Life | Other contracts | Total |
| Future policy benefit reserves | $ | 26,832 | | $ | 9,357 | | $ | 1,117 | | $ | 382 | | $ | 37,689 | |
| Investment contracts | — | | 793 | | — | | 742 | | 1,535 | |
| Other | — | | — | | 116 | 285 | | 400 | |
| | | | | |
| | | | | |
| Total | $ | 26,832 | | $ | 10,150 | | $ | 1,233 | | $ | 1,409 | | $ | 39,624 | |
| | | | | | | | | | | | | | | | | |
| December 31, 2022 | | | | | |
| Future policy benefit reserves | $ | 24,256 | | $ | 8,860 | | $ | 1,040 | | $ | 437 | | $ | 34,593 | |
| Investment contracts | — | | 860 | | — | | 848 | | 1,708 | |
| Other | — | | — | | 178 | | 365 | | 544 | |
| | | | | |
| | | | | |
| Total | $ | 24,256 | | $ | 9,720 | | $ | 1,218 | | $ | 1,651 | | $ | 36,845 | |
The following tables summarize balances of and changes in future policy benefits reserves.
GE 2020 FORM 10-K 80
| | | | | | | | | | | | | | | | | | | | | | | | | | | |
| 2023 | 2022 |
| Present value of expected net premiums | Long-term care | Structured settlement annuities | Life | | | | Long-term care | Structured settlement annuities | Life | | |
| Balance, beginning of year | $ | 4,059 | | $ | — | | $ | 4,828 | | | | | $ | 5,652 | | $ | — | | $ | 6,622 | | | |
| Beginning balance at locked-in discount rate | 3,958 | | — | | 5,210 | | | | | 4,451 | | — | | 5,443 | | | |
| Effect of changes in cash flow assumptions | (4) | | — | | (77) | | | | | (9) | | — | | 91 | | | |
| Effect of actual variances from expected experience | (22) | | — | | (300) | | | | | (289) | | — | | 6 | | | |
| Adjusted beginning of year balance | 3,932 | | — | | 4,833 | | | | | 4,152 | | — | | 5,540 | | | |
| Interest accrual | 207 | | — | | 192 | | | | | 223 | | — | | 203 | | | |
| Net premiums collected | (394) | | — | | (315) | | | | | (417) | | — | | (357) | | | |
| Effect of foreign currency | — | | — | | 64 | | | | | — | | — | | (176) | | | |
| Ending balance at locked-in discount rate | 3,745 | | — | | 4,773 | | | | | 3,958 | | — | | 5,210 | | | |
| Effect of changes in discount rate assumptions | 318 | | — | | 30 | | | | | 101 | | — | | (381) | | | |
| Balance, end of period | $ | 4,063 | | $ | — | | $ | 4,803 | | | | | $ | 4,059 | | $ | — | | $ | 4,828 | | | |
| | | | | | | | | | | |
| Present value of expected future policy benefits | | | | | | | | | | | |
| Balance, beginning of year | $ | 28,316 | | $ | 8,860 | | $ | 5,868 | | | | | $ | 40,296 | | $ | 12,328 | | $ | 7,923 | | | |
| Beginning balance at locked-in discount rate | 27,026 | | 8,790 | | 6,247 | | | | | 27,465 | | 9,024 | | 6,560 | | | |
| Effect of changes in cash flow assumptions | (45) | | (16) | | 49 | | | | | (413) | | (23) | | 120 | | | |
| Effect of actual variances from expected experience | (13) | | 19 | | (241) | | | | | (320) | | (10) | | 40 | | | |
| Adjusted beginning of year balance | 26,968 | | 8,793 | | 6,055 | | | | | 26,732 | | 8,990 | | 6,720 | | | |
| Interest accrual | 1,454 | | 454 | | 232 | | | | | 1,446 | | 471 | | 243 | | | |
| Benefit payments | (1,278) | | (687) | | (508) | | | | | (1,152) | | (671) | | (531) | | | |
| Effect of foreign currency | — | | — | | 67 | | | | | — | | — | | (185) | | | |
| Ending balance at locked-in discount rate | 27,144 | | 8,561 | | 5,847 | | | | | 27,026 | | 8,790 | | 6,247 | | | |
| Effect of changes in discount rate assumptions | 3,752 | | 797 | | 74 | | | | | 1,290 | | 70 | | (380) | | | |
| Balance, end of period | $ | 30,895 | | $ | 9,357 | | $ | 5,921 | | | | | $ | 28,316 | | $ | 8,860 | | $ | 5,868 | | | |
| Net future policy benefit reserves | $ | 26,832 | | $ | 9,357 | | $ | 1,117 | | | | | $ | 24,256 | | $ | 8,860 | | $ | 1,040 | | | |
| Less: Reinsurance recoverables, net of allowance for credit losses | (166) | | — | | (33) | | | | | (171) | | — | | (67) | | | |
| Net future policy benefit reserves, after reinsurance recoverables | $ | 26,666 | | $ | 9,357 | | $ | 1,084 | | | | | $ | 24,085 | | $ | 8,860 | | $ | 973 | | | |
Claim reserve activity included incurred claims
The Statement of $1,801 million, $1,873 million and $2,106 million, of which $(1) million, $(36) million and $(46) million related to the recognition of adjustments to prior year claim reserves arising from our periodic reserve evaluation inEarnings (Loss) for the years ended December 31, 2020, 20192023 and 2018, respectively. Paid claims were $1,728 million, $1,6262022 included gross premiums or assessments of $869 million and $1,937$935 million inand interest accretion of $1,741 million and $1,735 million, respectively. For the years ended December 31, 2020, 20192023 and 2018,2022, gross premiums or assessments were substantially all related to long-term care of $496 million and $490 million and life of $363 million and $415 million, while interest accretion was substantially all related to long-term care of $1,247 million and $1,224 million and structured settlement annuities of $454 million and $471 million, respectively.
The following table provides the amount of undiscounted and discounted expected future gross premiums and expected future benefits and expenses for nonparticipating traditional contracts.
| | | | | | | | | | | | | | | | | | | | | | | | |
| | 2023 | | 2022 | | |
| | Undiscounted | Discounted(a) | | Undiscounted | Discounted(a) | | | | |
| | | | | | | | | | |
| Long-term care: | Gross premiums | $ | 7,379 | | $ | 4,895 | | | $ | 7,985 | | $ | 4,918 | | | | | |
| Benefit payments | 63,126 | | 30,895 | | | 65,217 | | 28,316 | | | | | |
| | | | | | | | | | |
| | | | | | | | | | |
| Structured settlement annuities: | Benefit payments | 19,291 | | 9,357 | | | 19,936 | | 8,860 | | | | | |
| | | | | | | | | | |
| Life: | Gross premiums | 12,388 | | 5,800 | | | 13,754 | | 5,916 | | | | | |
| Benefit payments | 11,202 | | 5,921 | | | 12,020 | | 5,868 | | | | | |
| | | | | | | | | | |
| | | | | | | | | | |
| | | | | | | | | | |
| | | | | | | | | | |
| | | | | | | | | | |
(a) Determined using the current discount rate as of December 31, 2023 and 2022.
The following table provides the weighted-average durations of and weighted-average interest rates for the liability for future policy benefits.
| | | | | | | | | | | | | | | | | | | | | | | | | | | | | |
| 2023 | | 2022 | | |
| Long-term care | Structured settlement annuities | Life | | Long-term care | Structured settlement annuities | Life | | | | | | |
| Duration (years)(a) | 12.8 | 11.3 | 5.3 | | 13.0 | 10.7 | 5.0 | | | | | | |
| Interest accretion rate | 5.5% | 5.4% | 5.0% | | 5.5% | 5.4% | 4.9% | | | | | | |
| Current discount rate | 4.9% | 4.8% | 4.7% | | 5.6% | 5.5% | 5.4% | | | | | | |
| | | | | | | | | | | | | |
| | | | | | | | | | | | | |
| | | | | | | | | | | | | |
| | | | | | | | | | | | | |
(a) Determined using the current discount rate as of December 31, 2023 and 2022.
Our 2023 annual review of future policy benefit reserves cash flow assumptions resulted in an immaterial charge to net earnings, indicating claims experience continues to develop consistently with our models. Our 2022 annual review resulted in changes to our assumptions principally related to higher near-term mortality related to COVID-19.
Included in Insurance losses, annuity benefits and other costs in our Statement of Earnings (Loss) for the years ended December 31, 2023 and 2022 are unfavorable and favorable pre-tax adjustments of $(155) million and $404 million, respectively, from updating the net premium ratio (i.e., the percentage of projected gross premiums required to cover expected policy benefits and related expenses) after updating for actual historical experience each quarter and updating of future cash flow assumptions. Included in these amounts for the years ended December 31, 2023 and 2022, are unfavorable adjustments of $335 million and $190 million, respectively, due to insufficient gross premiums (i.e., net premium ratio exceeded 100%), related to certain cohorts in our long-term care and life insurance portfolios. These adjustments are primarily attributable to increases in the net premium ratio as a result of updating future cash flow assumptions on cohorts where the beginning of the period net premium ratio exceeded 100%.
At December 31, 2023 and 2022, policyholders account balances totaled $1,725 million and $1,964 million, respectively. As our insurance operations are in run-off, changes in policyholder account balances for the years ended December 31, 2023 and 2022 are primarily attributed to surrenders, withdrawals, and benefit payments of $489 million and $441 million, partially offset by net additions from separate accounts and interest credited of $245 million and $271 million, respectively. Interest on policyholder account balances is generally credited at minimum guaranteed rates, primarily between 3.0% and 6.0% at both December 31, 2023 and 2022.
Reinsurance recoveries are recorded as a reduction of insuranceInsurance losses, and annuity benefits and other costs in our consolidated Statement of Earnings (Loss) and amounted to $350$108 million, $362$321 million and $324$351 million for the years ended December 31, 2020, 20192023, 2022 and 2018,2021, respectively.
Reinsurance recoverables, net of allowances of $1,510 million and $1,355 million,insignificant amounts, are included in non-current Other GE Capital receivablesAll other assets in our consolidated Statement of Financial Position, and amounted to $2,552$213 million and $2,416$255 million at December 31, 20202023 and 2019,2022, respectively. The vast majority of our remaining net reinsurance recoverables are secured by assets held in a trust for which we are the beneficiary.
2020 Premium Deficiency Testing. We completed our annual premium deficiency testing in the aggregate across our run-off insurance portfolio in the third quarter of 2020. The results of our testing indicated there was a positive margin of less than 2% of the recorded future policy benefit reserves, excluding Other adjustments, at September 30, 2020. As a result, the assumptions updated in connection with the premium deficiency recognized in 2019 remain locked-in and will remain so unless another premium deficiency occurs in the future.
We also noted our projections as of third quarter 2020 indicate the present value of projected earnings in each future year to be positive, and therefore, no further adjustments to our future policy benefit reserves were required at this time.
Considering the results of the 2020 premium deficiency test which resulted in a small margin, any future net adverse changes in our assumptions may reduce the margin or result in a premium deficiency requiring an increase to future policy benefit reserves. Any future net favorable changes to these assumptions could result in a lower projected present value of future cash flows and additional margin in our premium deficiency test and higher income over the remaining duration of the portfolio, including higher investment income.
Statutory accounting practices, not GAAP, determine the required statutory capital levels of our insurance legal entities and, therefore, may affect the amount or timing of capital contributions that may be required from GE Capital to its insurance legal entities. Statutory accounting practices are set forth by the National Association of Insurance Commissioners (NAIC) as well as state laws, regulation and general administrative rules and differ in certain respects from GAAP. The 2020 premium deficiencyWe annually perform statutory asset adequacy testing, described above was performed onthe results of which may affect the amount or timing of capital contributions from GE to the insurance legal entities.
Following approval of a GAAP basis. The adverse impact onstatutory permitted accounting practice in 2018 by our statutory additional actuarial reserves (AAR) arising from our revised assumptions in 2017, including the collectability of reinsurance recoverables, is expected to require GE Capital to contribute approximately $14,500 million additional capital to its run-off insurance operations in 2018-2024. For statutory accounting purposes,primary regulator, the Kansas Insurance Department (KID) approved our request for, we provided a permitted accounting practice to recognize the 2017 AAR increase over a seven-year period. GE Capital providedtotal of $13,215 million of capital contributions to itsour run-off insurance subsidiaries, of $2,000including $1,815 million $1,900 million and $3,500 million in the first quarters of 2020, 2019 and 2018, respectively. GE Capital expects to provide further capital contributions of approximately $7,000 million through 2024 (of which approximately $2,000 million is expected to be contributed in the first quarter of 20212023. In accordance with the terms of the 2018 statutory permitted accounting practice, we expect to provide the final capital contribution of up to $1,820 million in the first quarter of 2024, pending completion of our December 31, 20202023 statutory reporting process, which includes asset adequacy testing),testing, subject to ongoing monitoring by KID. GE is a party to capital maintenance agreements with its run-off insurance subsidiaries under which GE is required to maintain their statutory capital levels at 300% of their year-end Authorized Control Level risk-based capital requirements as defined from time to time by the NAIC.
See Notes 1, 3 and 9 for further information related to our run-off insurance operations.
GE 20202023 FORM 10-K81 60
NOTE 13. POSTRETIREMENT BENEFIT PLANS
PENSION BENEFITS AND RETIREE HEALTH AND LIFE BENEFITS. We sponsor a number of pension and retiree health and life insurance benefit plans that we present in 3three categories, principal pension plans, other pension plans and principal retiree benefit plans. Smaller pension plans with pension assets or obligations less thanthat have not reached $50 million and other retiree benefit plans are not presented. We useEffective January 1, 2023, certain postretirement benefit plans and liabilites were legally split or allocated between GE HealthCare, GE Energy and GE Aerospace. GE Aerospace and GE Energy plans and liabilities remain with GE until the planned GE Vernova spin-off. In connection with the Separation, net postretirement benefit plan liabilities of approximately $4.2 billion, including a December 31 measurement dateportion of the principal pension plans, other pension plans and the principal retiree benefit plans, and other compensation and benefits obligations of approximately $0.7 billion, were transferred to GE HealthCare and are now reported in discontinued operations. See Note 2 for these plans.further information. Assumptions used in calculations, estimates of future benefits payments and funding, and other forward looking statements are for continuing operations unless otherwise noted.
| | | | | | | | | | | | | | |
| DESCRIPTION OF OUR PLANS | | | |
| Plan Category | Participants | Funding | OtherComments |
| Principal Pension Plans | GE Energy Pension Plan and GE Aerospace Pension Plan | Covers U.S. participants. ~176,500participants ~115,400 retirees and beneficiaries, ~93,000~47,500 vested former employees and ~26,500~15,700 active employees.employees | Our funding policy is to contribute amounts sufficient to meet minimum funding requirements under employee benefit and tax laws. We may decide to contribute additional amounts beyond this level. | This plan has been closedClosed to new participants since 2012. Benefits for ~20,000 employees with salaried benefits were frozen effective January 1, 2021, and thereafter these employees will receive increased company contributions in the company sponsored defined contribution plan in lieu of participation in a defined benefit plan (announced 10/October 2019). |
| GE Energy Supplementary Pension Plan and GE Aerospace Supplementary Pension Plan | Provides supplementary benefits to higher-level, longer-service U.S. employees | This plan is unfunded.Unfunded. We pay benefits on a pay-as-you-go basis from company cash. | The annuity benefit has been closed to new participants since 2011 and has been replaced by an installment benefit.benefit (which was closed to new executives after 2020). Benefits for ~700 employees who became executives before 2011 were frozen effective January 1, 2021, and thereafter these employees will accrue the installment benefit offered to new executives since 2011.benefit. |
Other Pension PlansPlans(a) | 4434 U.S. and non-U.S. pension plans with pension assets or obligations greater thanthat have reached $50 million | Covers ~56,500~42,600 retirees and beneficiaries, ~49,500~28,300 vested former employees and ~20,000~7,700 active employees | Our funding policy is to contribute amounts sufficient to meet minimum funding requirements under employee benefit and tax laws in each country. We may decide to contribute additional amounts beyond this level. We pay benefits for some plans from company cash. | In certain countries, benefit accruals have ceased and/or have been closed to new hires as of various dates. |
Principal Retiree Benefit Plans | Provides health and life insurance benefits to certain eligible participants | Covers U.S participants. ~170,000U.S. participants ~89,300 retirees and dependents and ~15,000 active employees | We fund retiree health benefitsbenefit plans on a pay-as-you-go basis and the retiree lifebenefit insurance trust at our discretion. | Participants share in the cost of the healthcare benefits. |
(a) Plans for GE Energy, including Power and Renewable Energy (will be part of GE Vernova) and GE Aerospace that reach $50 million are not removed from the presentation unless part of a disposition or plan termination.
| | | | | | | | | | | | | | | | | | | | | | | | | | |
| FUNDING STATUS BY PLAN TYPE | Benefit Obligation | | Fair Value of Assets | | Deficit/(Surplus) |
| 2020 | 2019 | | 2020 | 2019 | | 2020 | 2019 |
| Principal Pension Plans: | | | | | | | | |
| GE Pension Plan (subject to regulatory funding) | $ | 68,945 | | $ | 65,065 | | | $ | 58,843 | | $ | 52,633 | | | $ | 10,102 | | $ | 12,432 | |
| GE Supplementary Pension Plan (not subject to regulatory funding) | 7,353 | | 6,691 | | | 0 | | 0 | | | 7,353 | | 6,691 | |
| | 76,298 | | 71,756 | | | 58,843 | | 52,633 | | | 17,455 | | 19,123 | |
| Other Pension Plans: | | | | | | | | |
| Subject to regulatory funding | 21,793 | | 19,907 | | | 21,283 | | 18,906 | | | 510 | | 1,001 | |
| Not subject to regulatory funding | 2,865 | | 3,014 | | | 223 | | 236 | | | 2,642 | | 2,778 | |
| Principal retiree benefit plans (not subject to regulatory funding) | 5,019 | | 5,160 | | | 134 | | 289 | | | 4,885 | | 4,871 | |
| | | | | | | | |
| Total plans subject to regulatory funding | 90,738 | | 84,972 | | | 80,126 | | 71,539 | | | 10,612 | | 13,433 | |
| Total plans not subject to regulatory funding | 15,237 | | 14,865 | | | 357 | | 525 | | | 14,880 | | 14,340 | |
| Total plans | $ | 105,975 | | $ | 99,837 | | | $ | 80,483 | | $ | 72,064 | | | $ | 25,492 | | $ | 27,773 | |
| | | | | | | | | | | | | | | | | | | | | | | | | | |
| FUNDING STATUS BY PLAN TYPE | Benefit Obligation | | Fair Value of Assets | | Deficit/(Surplus) |
| 2023 | 2022 | | 2023 | 2022 | | 2023 | 2022 |
| Principal Pension Plans: | | | | | | | | |
| GE Pension Plan (subject to regulatory funding) | $ | — | | $ | 48,134 | | | $ | — | | $ | 44,993 | | | $ | — | | $ | 3,141 | |
| GE Supplementary Pension Plan (not subject to regulatory funding) | — | | 5,457 | | | — | | — | | | — | | 5,457 | |
| GE Energy Pension Plan and GE Aerospace Pension Plan (subject to regulatory funding) | 32,676 | | — | | | 29,744 | | — | | | 2,932 | | — | |
| GE Energy Supplementary Pension Plan and GE Aerospace Supplementary Pension Plan (not subject to regulatory funding) | 3,541 | | — | | | — | | — | | | 3,541 | | — | |
| 36,217 | | 53,591 | | | 29,744 | | 44,993 | | | 6,473 | | 8,598 | |
| Other Pension Plans: | | | | | | | | |
| Subject to regulatory funding | 9,174 | | 12,078 | | | 10,601 | | 14,512 | | | (1,427) | | (2,434) | |
| Not subject to regulatory funding | 1,203 | | 1,838 | | | 163 | | 151 | | | 1,040 | | 1,687 | |
| Principal retiree benefit (not subject to regulatory funding) | 2,055 | | 3,304 | | | 8 | | 10 | | | 2,047 | | 3,294 | |
| | | | | | | | |
| Total plans subject to regulatory funding | 41,850 | | 60,212 | | | 40,345 | | 59,505 | | | 1,505 | | 707 | |
| Total plans not subject to regulatory funding | 6,799 | | 10,599 | | | 171 | | 161 | | | 6,628 | | 10,438 | |
| Total plans | 48,649 | | 70,811 | | | 40,516 | | 59,666 | | | 8,133 | | 11,145 | |
| Less: discontinued operations | — | | 23,513 | | | — | | 19,291 | | | — | | 4,222 | |
| Total plans - continuing operations | $ | 48,649 | | $ | 47,298 | | | $ | 40,516 | | $ | 40,375 | | | $ | 8,133 | | $ | 6,923 | |
Effective January 1, 2023, certain postretirement benefit plans and liabilities were legally split or allocated. The HealthCare plans were transferred to GE HealthCare in connection with the Separation. The GE Aerospace and GE Energy plans remain with GE until the planned GE Vernova spin-off. Below is the funding status of the plans at December 31, 2023.
| | | | | | | | | | | | | | | | | |
| FUNDING STATUS BY PLAN TYPE at December 31, 2023 | Benefit Obligation | | Fair Value of Assets | | Deficit/(Surplus) |
| | | | | |
| | | | | |
| | | | | |
| | | | | |
| | | | | |
| | | | | |
| | | | | |
| Power and Renewable Energy: | | | | | |
| GE Energy Pension Plan | $ | 10,239 | | | $ | 9,491 | | | $ | 748 | |
| GE Energy Supplementary Pension Plan | 541 | | | — | | | 541 | |
| Other pension plans | 6,712 | | | 6,851 | | | (139) | |
| Principal retiree benefit plans | 766 | | | — | | | 766 | |
| 18,258 | | | 16,342 | | | 1,916 | |
| Aerospace: | | | | | |
| GE Aerospace Pension Plan | 22,437 | | | 20,253 | | | 2,184 | |
| GE Aerospace Supplementary Pension Plan | 3,000 | | | — | | | 3,000 | |
| Other pension plans | 3,665 | | | 3,913 | | | (248) | |
| Principal retiree benefit plans | 1,289 | | | 8 | | | 1,281 | |
| 30,391 | | | 24,174 | | | 6,217 | |
| Total plans | $ | 48,649 | | | $ | 40,516 | | | $ | 8,133 | |
FUNDING. The Employee Retirement Income Security Act (ERISA) determines minimum pension funding requirements in the U.S. In December 2020, weNo contributions were required or made a discretionary contribution of $2,500 million tofor the GE Energy Pension Plan or GE Aerospace Pension Plan during 2023 and based on our current assumptions, we do not anticipate having to make additional required contributions toin the plan through 2023. We made a contribution to the GE Pension Plan in 2018 which was sufficient to satisfy our minimum ERISA funding requirements for 2019 and 2020.
near future. On an ERISA basis, our preliminary estimate is that the GE Energy Pension Plan and GE Aerospace Pension Plan was approximately 94%87% and 93% funded, at January 1, 2021 and 2020 respectively. The ERISA funded status is higher than the GAAP funded status (85%for GE Energy Pension Plan and 81% funded for 2020GE Aerospace Pension Plan is 93% and 2019 respectively) primarily because the ERISA prescribed interest rate for determining liabilities is calculated using a long-term average interest rate. As a result, the ERISA interest rate is higher than the year-end GAAP discount rate. The higher ERISA interest rate lowers pension liabilities for ERISA funding purposes.90%, respectively.
We expect to pay approximately $325$235 million for benefit payments in total under our GE Energy Supplementary Pension Plan and GE Aerospace Supplementary Pension Plan and administrative expenses of our remaining principal pension plans and expect to contribute approximately $460$100 million to other remaining pension plans in 2021.2024. We fund retiree health benefitsbenefit plans on a pay-as-you-go basis and the retiree lifebenefit insurance trust at our discretion. We expect to contribute approximately $335$210 million in 20212024 to fund such benefits.
ACTIONS. Pension benefits for United Kingdom (UK) participants have been frozen effective January 1, 2022. In addition, pension benefits for Canadian participants have been frozen effective December 2020, we transferred obligations of $1,706 million from the GE Pension Plan, representing the benefits of approximately 70,000 of GE’s retirees and beneficiaries, to a third-party insurance company by irrevocably committing to purchase group annuity contracts. The transaction was funded directly by the assets of the plan and is31, 2023. These transactions were reflected as a settlement.curtailment loss in 2021 upon announcement.
In 2019, we offered approximately 100,000 former U.S. employees with a vested benefit in the GE Pension Plan a limited-time option to take a lump sum distribution in lieu of future monthly payments. In December 2019, lump sum distributions of $2,657 million were made from the assets of the plan and this event is reflected as a settlement.
| | | COST OF OUR BENEFITS PLANS | |
| COST OF OUR BENEFITS PLANS | |
| COST OF OUR BENEFITS PLANS | COST OF OUR BENEFITS PLANS | 2020 | | 2019 | | 2018 | 2023 | | 2022 | | 2021 |
| AND ASSUMPTIONS | AND ASSUMPTIONS | Principal pension | Other pension | Principal retiree benefit | | Principal pension | Other pension | Principal retiree benefit | | Principal pension | Other pension | Principal retiree benefit | AND ASSUMPTIONS | Principal pension | Other pension | Principal retiree benefit | | Principal pension | Other pension | Principal retiree benefit | | Principal pension | Other pension | Principal retiree benefit |
| Components of expense (income) | Components of expense (income) | |
| Service cost - operating | Service cost - operating | $ | 657 | | $ | 243 | | $ | 59 | | | $ | 654 | | $ | 246 | | $ | 58 | | | $ | 888 | | $ | 323 | | $ | 63 | |
| Service cost - operating | |
| Service cost - operating | |
| Interest cost | Interest cost | 2,350 | | 422 | | 150 | | | 2,780 | | 542 | | 202 | | | 2,658 | | 548 | | 196 | |
| Expected return on plan assets | Expected return on plan assets | (2,993) | | (1,082) | | (11) | | | (3,428) | | (1,144) | | (21) | | | (3,248) | | (1,285) | | (29) | |
| Amortization of net actuarial loss (gain) | 3,399 | | 434 | | (82) | | | 3,439 | | 319 | | (118) | | | 3,785 | | 312 | | (79) | |
| Amortization of net loss (gain) | |
| Amortization of prior service cost (credit) | Amortization of prior service cost (credit) | 146 | | 1 | | (234) | | | 135 | | 3 | | (232) | | | 143 | | (9) | | (230) | |
| Curtailment / settlement loss (gain)(a) | 0 | | 12 | | 0 | | | 349 | | 13 | | (38) | | | 34 | | 1 | | 0 | |
| Curtailment / settlement loss (gain) | |
| Non-operating | Non-operating | $ | 2,902 | | $ | (213) | | $ | (177) | | | $ | 3,275 | | $ | (267) | | $ | (207) | | | $ | 3,372 | | $ | (433) | | $ | (142) | |
| Net periodic expense (income) | Net periodic expense (income) | $ | 3,559 | | $ | 30 | | $ | (118) | | | $ | 3,929 | | $ | (21) | | $ | (149) | | | $ | 4,260 | | $ | (110) | | $ | (79) | |
| Weighted-average assumptions used to determine benefit obligations | |
| Less: discontinued operations | |
| Continuing operations - net periodic expense (income) | |
| Weighted-average benefit obligations assumptions | |
| Discount rate | |
| Discount rate | |
| Discount rate | Discount rate | 2.61 | % | 1.44 | % | 2.15 | % | | 3.36 | % | 1.97 | % | 3.05 | % | | 4.34 | % | 2.75 | % | 4.12 | % | 5.18 | % | 3.93 | % | 5.09 | % | | 5.53 | % | 4.59 | % | 5.43 | % | | 2.94 | % | 1.93 | % | 2.64 | % |
| Compensation increases | Compensation increases | 2.95 | | 3.06 | | 2.82 | | | 2.95 | | 3.16 | | 3.75 | | | 3.60 | | 3.16 | | 3.60 | |
Initial healthcare trend rate(b)(a) | Initial healthcare trend rate(b)(a) | N/A | 5.90 | | | N/A | 5.90 | | | N/A | 6.00 | |
| Weighted-average assumptions used to determine benefit cost | |
| Discount rate(c) | 3.36 | | 1.97 | | 3.05 | | | 4.07 | | 2.75 | | 4.12 | | | 3.64 | | 2.41 | | 3.43 | |
| Weighted-average benefit cost assumptions | |
| Discount rate | |
| Discount rate | |
| Discount rate | |
| Expected rate of return on plan assets | Expected rate of return on plan assets | 6.25 | | 5.69 | | 7.00 | | | 6.75 | | 6.76 | | 7.00 | | | 6.75 | | 6.75 | | 7.00 | |
(a) For 2019, the principal pension amount is a curtailment loss driven by freezing the GE Pension Plan benefits for certain participants.
(b) For 2020,2023, ultimately declining to 5% for 2030 and thereafter.
(c) Weighted average 2019 discount rate for principal pension was 4.07%. Discount rate was 4.34% for January 1, 2019 through September 30, 2019 and then changed to 3.24% for the remainder of 2019 due to the remeasurement of the plans for the U.S. pension changes announced in October 2019.
We expect 2021 netNet periodic benefit costs for principal pension, other pension and principal retiree benefit plansincome in 2024 is estimated to be about $2,400$1,235 million, which is a decrease of approximately $1,100$135 million in income from 2020.2023 from continuing operations. The decrease is primarily due to the freezingimpact of benefits for certain participants under the GE Pension Plandiscount rates and lower interest costs driven by the lower discount rate. The 2020 year-end discount rate increases the amortization of net actuarial loss, but this increase isinvestment performance offset by less amortization of net actuarial loss related to past years.interest cost.
The components of net periodic benefit costs, other than the service cost component, are included in Non-operating benefit costscost (income) in our consolidated Statement of Earnings (Loss).
GE 20202023 FORM 10-K83 63
| PLAN FUNDED STATUS AND AMOUNTS RECORDED IN ACCUMULATED OTHER COMPREHENSIVE INCOME (LOSS) | | PLAN FUNDED STATUS AND AMOUNTS RECORDED IN ACCUMULATED OTHER COMPREHENSIVE LOSS (INCOME) | | PLAN FUNDED STATUS AND AMOUNTS RECORDED IN ACCUMULATED OTHER COMPREHENSIVE LOSS (INCOME) |
| 2023 | |
| Principal pension | |
| Principal pension | |
| Principal pension | |
| Change in benefit obligations | |
| Change in benefit obligations | |
| Change in benefit obligations | |
| Balance at January 1 | |
| Balance at January 1 | |
| Balance at January 1 | |
| Service cost | |
| Service cost | |
| Service cost | |
| Interest cost | |
| Interest cost | |
| Interest cost | |
| Participant contributions | |
| Participant contributions | |
| Participant contributions | |
| Plan amendments | |
| Plan amendments | |
| Plan amendments | |
| Actuarial loss (gain) - net | |
| Actuarial loss (gain) - net | |
| Actuarial loss (gain) - net | | 1,081 | | (a) | 526 | | (a) | (5) | | | (17,281) | | (a) | (6,282) | | (a) | (778) | | (a) |
| Benefits paid | | Benefits paid | (2,503) | | | (618) | | | (254) | | | (3,731) | | | (920) | | | (438) | | |
| | 2020 | | 2019 | |
| | Principal pension | | Other pension | | Principal retiree benefit | | Principal pension | | Other pension | | Principal retiree benefit | |
| Change in benefit obligations | |
| Balance at January 1 | $ | 71,756 | | | $ | 22,921 | | | $ | 5,160 | | | $ | 68,500 | | | $ | 21,091 | | | $ | 5,153 | | |
| Service cost | 657 | | | 243 | | | 59 | | | 654 | | | 246 | | | 58 | | |
| Interest cost | 2,350 | | | 422 | | | 150 | | | 2,780 | | | 542 | | | 202 | | |
| Participant contributions | 69 | | | 28 | | | 63 | | | 77 | | | 29 | | | 61 | | |
| Plan amendments | 0 | | | 27 | | | (7) | | | (42) | | (c) | (17) | | | (23) | | |
| Actuarial loss (gain) - net | 7,057 | | (a) | 1,927 | | (a) | 85 | | (a) | 7,073 | | (d) | 2,422 | | (a) | 275 | | (a) |
| Benefits paid | (3,885) | | | (1,062) | | | (491) | | | (3,788) | | | (1,043) | | | (533) | | |
| Curtailments | 0 | | | (69) | | | 0 | | | (838) | | | (32) | | | (33) | | |
| Settlements | (1,706) | | (b) | 0 | | | 0 | | | (2,657) | | (e) | 0 | | | 0 | | |
| Dispositions/ acquisitions / other - net | 0 | | | (335) | | | 0 | | | (3) | | | (1,030) | | | 0 | | |
| Dispositions/acquisitions/other - net | |
| | Dispositions/acquisitions/other - net | |
| | Dispositions/acquisitions/other - net | | (17,997) | | | (4,387) | | | (1,149) | | | — | | | — | | | 11 | | |
| Exchange rate adjustments | Exchange rate adjustments | 0 | | | 556 | | | 0 | | | 0 | | | 713 | | | 0 | | | Exchange rate adjustments | — | | | 462 | | 462 | | | — | | — | | | — | | — | | | (1,641) | | (1,641) | | | — | | — | | | |
| Balance at December 31 | Balance at December 31 | $ | 76,298 | | (f) | $ | 24,658 | | | $ | 5,019 | | (g) | $ | 71,756 | | (f) | $ | 22,921 | | | $ | 5,160 | | (g) | Balance at December 31 | $ | 36,217 | | (b) | (b) | $ | 10,377 | | | $ | | $ | 2,055 | | (c) | (c) | $ | 53,591 | | (b) | (b) | $ | 13,916 | | | $ | | $ | 3,304 | | (c) | (c) |
| Change in plan assets | Change in plan assets | |
| Balance at January 1 | Balance at January 1 | 52,633 | | | 19,142 | | | 289 | | | 50,009 | | | 17,537 | | | 362 | | |
| Balance at January 1 | |
| Balance at January 1 | |
| Actual gain (loss) on plan assets | |
| Actual gain (loss) on plan assets | |
| Actual gain (loss) on plan assets | Actual gain (loss) on plan assets | 8,926 | | | 2,542 | | | (22) | | | 8,694 | | | 2,229 | | | 57 | | |
| Employer contributions | Employer contributions | 2,806 | | | 509 | | | 295 | | | 298 | | | 716 | | | 342 | | |
| Employer contributions | |
| Employer contributions | |
| Participant contributions | |
| Participant contributions | |
| Participant contributions | Participant contributions | 69 | | | 28 | | | 63 | | | 77 | | | 29 | | | 61 | | |
| Benefits paid | Benefits paid | (3,885) | | | (1,062) | | | (491) | | | (3,788) | | | (1,043) | | | (533) | | |
| Settlements | (1,706) | | (b) | 0 | | | 0 | | | (2,657) | | (e) | 0 | | | 0 | | |
| Dispositions/ acquisitions / other - net | 0 | | | (59) | | | 0 | | | 0 | | | (1,030) | | | 0 | | |
| Benefits paid | |
| Benefits paid | |
| | Dispositions/acquisitions/other - net | |
| | Dispositions/acquisitions/other - net | |
| | Dispositions/acquisitions/other - net | |
| Exchange rate adjustments | |
| Exchange rate adjustments | |
| Exchange rate adjustments | Exchange rate adjustments | 0 | | | 406 | | | 0 | | | 0 | | | 704 | | | 0 | | |
| Balance at December 31 | Balance at December 31 | $ | 58,843 | | | $ | 21,506 | | | $ | 134 | | | $ | 52,633 | | | $ | 19,142 | | | $ | 289 | | |
| Funded status - deficit | $ | 17,455 | | | $ | 3,152 | | | $ | 4,885 | | | $ | 19,123 | | | $ | 3,779 | | | $ | 4,871 | | |
| Amounts recorded in the consolidated Statement of Financial Position | |
| Balance at December 31 | |
| Balance at December 31 | |
| Funded status - surplus (deficit) | |
| Funded status - surplus (deficit) | |
| Funded status - surplus (deficit) | |
Amounts recorded in
Statement of Financial Position | |
Amounts recorded in
Statement of Financial Position | |
Amounts recorded in
Statement of Financial Position | |
| Continuing operations: | |
| Continuing operations: | |
| Continuing operations: | |
| Non-current assets - other | |
| Non-current assets - other | |
| Non-current assets - other | Non-current assets - other | 0 | | | 845 | | | 0 | | | 0 | | | 475 | | | 0 | | |
| Current liabilities - other | Current liabilities - other | (315) | | | (106) | | | (330) | | | (296) | | | (123) | | | (355) | | |
| Non-current liabilities - compensation and benefits | (17,140) | | | (3,891) | | | (4,555) | | | (18,827) | | | (4,131) | | | (4,516) | | |
| Current liabilities - other | |
| Current liabilities - other | |
| Non-current liabilities - compensation and benefits(d) | |
| Non-current liabilities - compensation and benefits(d) | |
| Non-current liabilities - compensation and benefits(d) | |
| Discontinued operations: | |
| Discontinued operations: | |
| Discontinued operations: | |
| Non-current assets | |
| Non-current assets | |
| Non-current assets | |
| | Current and non-current liabilities | |
| | Current and non-current liabilities | |
| | Current and non-current liabilities | |
| Net amount recorded | Net amount recorded | $ | (17,455) | | | $ | (3,152) | | | $ | (4,885) | | | $ | (19,123) | | | $ | (3,779) | | | $ | (4,871) | | |
| Amounts recorded in Accumulated other comprehensive income (loss) | |
| Net amount recorded | |
| Net amount recorded | |
| Amounts recorded in Accumulated other comprehensive loss (income) | |
| Amounts recorded in Accumulated other comprehensive loss (income) | |
| Amounts recorded in Accumulated other comprehensive loss (income) | |
| Prior service cost (credit) | Prior service cost (credit) | (80) | | | 19 | | | (2,148) | | | 67 | | | (16) | | | (2,376) | | |
| Actuarial loss (gain) | 5,687 | | | 4,582 | | | (633) | | | 7,961 | | | 4,665 | | | (833) | | |
| Total recorded in Accumulated other comprehensive income (loss) | $ | 5,607 | | | $ | 4,601 | | | $ | (2,781) | | | $ | 8,028 | | | $ | 4,649 | | | $ | (3,209) | | |
| Prior service cost (credit) | |
| Prior service cost (credit) | |
| Net loss (gain) | |
| Net loss (gain) | |
| Net loss (gain) | |
| Total recorded in Accumulated other comprehensive loss (income) | |
| Total recorded in Accumulated other comprehensive loss (income) | |
| Total recorded in Accumulated other comprehensive loss (income) | |
(a)Principally associated withPrimarily due to impact of discount rate changes.rates.
(b)Irrevocable commitment to purchase group annuity contracts from a third-party insurance company in December 2020.
(c)GE Supplementary Pension Plan amendment for the U.S. pension changes announced in October 2019 offset by other plan amendments adopted in 2019.
(d)Principally associated with discount rate changes offset by impact of the one-time lump sum payments under the GE Pension Plan.
(e)Payments made to former employees from the GE Pension Plan assets for the one-time lump sum payments.
(f)The benefit obligation for the GE Energy Supplementary Pension Plan and GE Aerospace Supplementary Pension Plan, which is anare unfunded plan,plans, was $7,353 million and $6,691$3,541 million at year-end 2020December 31, 2023 and 2019, respectively.the GE Supplementary Pension Plan was $5,457 million at December 31, 2022.
(g)(c)The benefit obligation for retiree health plans from continuing operations was $3,094 million and $3,306$1,208 million at December 31, 20202023. The benefit obligation for retiree health plans was $1,991 million at December 31, 2022.
(d)Includes $37 million and 2019,$35 million of liabilities held for sale related to our Steam business as disclosed in Note 2 as of December 31, 2023 and 2022, respectively.
ASSUMPTIONS USED IN CALCULATIONS. Our defined benefit pension plans are accounted for on an actuarial basis, which requires the selection of various assumptions, including a discount rate, a compensation assumption, an expected return on assets, mortality rates of participants and expectation of mortality improvement.
Projected benefit obligations are measured as the present value of expected benefit payments. We discount those cash payments using a discount rate. We determine the discount rate using the weighted-average yields on high-quality fixed-income securities with maturities that correspond to the payment of benefits. Lower discount rates increase present values and generally increase subsequent-year pension expense; higher discount rates decrease present values and generally reduce subsequent-year pension expense.
GE 20202023 FORM 10-K84 64
The compensation assumption is used to estimate the annual rate at which pay of plan participants will grow. If the rate of growth assumed increases, the size of the pension obligations will increase, as will the amount recorded in Accumulated other comprehensive income (loss) (AOCI)AOCI in our consolidated Statement of Financial Position and amortized into earnings in subsequent periods.
The expected return on plan assets is the estimated long-term rate of return that will be earned on the investments used to fund the benefit obligations. To determine the expected long-term rate of return on pension plan assets, we consider our asset allocation, as well as historical and expected returns on various categories of plan assets. In developing future long-term return expectations for our principal benefit plans’ assets, we formulate views on the future economic environment, both in the U.S. and abroad. We evaluate general market trends and historical relationships among a number of key variables that impact asset class returns such as expected earnings growth, inflation, valuations, yields and spreads, using both internal and external sources. We also take into account expected volatility by asset class and diversification across classes to determine expected overall portfolio results given our asset allocation. Based on our analysis, we have assumed a 6.25%7.00% long-term expected return on ourthe GE Energy Pension Plan and GE Aerospace Pension Plan assets for cost recognition in 2020, as compared to 6.75%2023 and 6.00% for the GE Pension Plan in 20192022. For 2024 cost recognition, based on GE Energy Pension Plan and 2018.
The Society of Actuaries issued new mortality improvement tables in 2020 and new mortality base and improvement tables in 2019. We updated mortality assumptions in the U.S. accordingly. These changes in assumptions decreased theGE Aerospace Pension Plan assets at December 31, 2020 and 2019 U.S. pension and retiree benefit plans' obligations by $180 million and $529 million, respectively.2023, we have assumed a 7.00% long-term expected return.
The healthcare trend assumptions primarily apply to our pre-65 retiree medical plans. OurMost participants in our post-65 retiree plan hashave a fixed subsidy and therefore isare not subject to healthcare inflation.
We evaluate these critical assumptions at least annually on a plan and country-specific basis. We periodically evaluate other assumptions involving demographics factors such as retirement age and turnover, and update them to reflect our actual experience and expectations for the future. Actual results in any given year will often differ from actuarial assumptions because of economic and other factors. Differences between our actual results and what we assumed are recorded in Accumulated other comprehensive incomeAOCI each period. These differences are amortized into earnings over the remaining average future service of active participating employees or the expected life of inactive participants, as applicable. For the principal pension plans, gains and losses are amortized using a straight-line method with a separate layer for each year’s gains and losses. For most other pension plans and principal retiree benefit plans, gains and losses are amortized using a straight-line or a corridor amortization method.
SENSITIVITIES TO KEY ASSUMPTIONS. Fluctuations in discount rates can significantly impact pension cost and obligations. AWe would expect that a 25 basis point decrease in discount rate would increase our principal pension plan cost infor the following year by about $220approximately $85 million and would also expect an increase in the principal pension plan projected benefit obligation at year-end by about $2,400approximately $905 million. The deficit sensitivity to the discount rate iswould be lower than the projected benefit obligation sensitivity as a result of the liability hedging program incorporated in the plan's asset allocation. A 50 basis point decrease in the expected return on assets would increase principal pension plan cost in the following year by about $250approximately $165 million.
THE COMPOSITION OF OUR PLAN ASSETS. The fair value of our pension plans' investments is presented below. The inputs and valuation techniques used to measure the fair value of these assets are described in Note 1 and have been applied consistently.
| | | | | | | | | | | | | | | | | | | | | | | |
| 2020 | | 2019 |
| Principal pension | | Other pension | | Principal pension | | Other pension |
| Global equities | $ | 5,552 | | | $ | 3,674 | | | $ | 6,826 | | | $ | 3,484 | |
| Debt securities | | | | | | | |
| Fixed income and cash investment funds | 6,831 | | | 10,003 | | | 4,398 | | | 8,089 | |
| U.S. corporate(a) | 8,512 | | | 410 | | | 8,025 | | | 365 | |
| Other debt securities(b) | 5,505 | | | 440 | | | 6,076 | | | 424 | |
| Real estate | 2,274 | | | 81 | | | 2,309 | | | 140 | |
| Private equities and other investments | 490 | | | 499 | | | 23 | | | 452 | |
| Total | 29,164 | | | 15,107 | | | 27,657 | | | 12,954 | |
| Plan assets measured at net asset value | | | | | | | |
| Global equities | 16,259 | | | 1,415 | | | 14,616 | | | 1,450 | |
| Debt securities | 5,445 | | | 1,268 | | | 3,744 | | | 914 | |
| Real estate | 1,324 | | | 1,978 | | | 1,167 | | | 1,930 | |
| Private equities and other investments | 6,651 | | | 1,738 | | | 5,449 | | | 1,894 | |
| Total plan assets at fair value | $ | 58,843 | | | $ | 21,506 | | | $ | 52,633 | | | $ | 19,142 | |
| | | | | | | | | | | | | | | | | | | | | | | |
| December 31 | 2023 | | 2022 |
| Principal pension | | Other pension | | Principal pension | | Other pension |
| Global equities | $ | 1,985 | | | $ | 1,152 | | | $ | 3,918 | | | $ | 1,097 | |
| Debt securities | | | | | | | |
| Fixed income and cash investment funds | 1,764 | | | 4,188 | | | 4,918 | | | 6,506 | |
| U.S. corporate(a) | 6,599 | | | 145 | | | 8,715 | | | 382 | |
| Other debt securities(b) | 6,064 | | | 218 | | | 7,853 | | | 443 | |
| Real estate | 775 | | | 18 | | | 1,486 | | | 53 | |
| Private equities and other investments | 600 | | | 259 | | | 1,245 | | | 364 | |
| Total | 17,787 | | | 5,980 | | | 28,135 | | | 8,845 | |
| Plan assets measured at net asset value | | | | | | | |
| Global equities | $ | 3,169 | | | $ | 612 | | | $ | 3,285 | | | $ | 1,029 | |
| Debt securities | 1,907 | | | 2,224 | | | 3,469 | | | 1,024 | |
| Real estate | 1,067 | | | 1,074 | | | 1,624 | | | 1,976 | |
| Private equities and other investments | 5,814 | | | 874 | | | 8,480 | | | 1,789 | |
| Total plan assets at fair value | 29,744 | | | 10,764 | | | 44,993 | | | 14,663 | |
| Less: discontinued operations | — | | | — | | | 14,860 | | | 4,431 | |
| Total plan assets - continuing operations | $ | 29,744 | | | $ | 10,764 | | | $ | 30,133 | | | $ | 10,232 | |
(a)Primarily represented investment-grade bonds of U.S. issuers from diverse industries.
(b)Primarily represented investments in residential and commercial mortgage-backed securities, non-U.S. corporate and government bonds and U.S. government, federal agency, state and municipal debt.
GE
Plan assets that were measured at fair value using NAV as a practical expedient were excluded from the fair value hierarchy. Principal Pension PlanPlans' investments with a fair value of $2,721$1,203 million and $2,838$2,255 million at December 31, 20202023 and 2019,2022, respectively, were classified within Level 3 and primarily relate to private equities and real estate. The remaining investments were substantially all considered Level 1 and 2. Investments with a fair value of $4,034 million and $6,759 million at December 31, 2023 and 2022, respectively, were classified within Level 1 and primarily relate to global equities and cash. Investments with a fair value of $12,703 million and $18,606 million at December 31, 2023 and 2022, respectively, were classified within Level 2 and primarily relate to debt securities. Other pension plans investments with a fair value of $97$26 million and $105$81 million at December 31, 20202023 and 2019,2022, respectively, were classified within Level 3.3 and primarily relate to private equities and real estate. The remaining investments were substantially all considered Level 1 and 2. Investments with a fair value of $786 million and $841 million at December 31, 2023 and 2022, respectively, were classified within Level 1 and primarily relate to global equities and cash. Investments with a fair value of $4,913 million and $7,580 million at December 31, 2023 and 2022, respectively, were classified within Level 2 and primarily relate to debt securities. Principal retiree benefit plan investments withhave a fair value of $134$8 million and $289$10 million at December 31, 20202023 and 2019, respectively, comprised equity and debt securities which are considered Level 1 and 2.2022, respectively. There were no Level 3 principal retiree benefit plan investments held in 20202023 and 2019. Plan assets that were measured at fair value using NAV as practical expedient were excluded from the fair value hierarchy.2022.
| | ASSET ALLOCATION OF PENSION PLANS | ASSET ALLOCATION OF PENSION PLANS | 2020 Target allocation | | 2020 Actual allocation | ASSET ALLOCATION OF PENSION PLANS | 2023 Target allocation | | 2023 Actual allocation |
| Principal Pension | | Other Pension (weighted average) | | | Principal Pension | | Other Pension (weighted average) | |
| Principal Pension | |
| Global equities | |
| Global equities | |
| Global equities | Global equities | 30.0 - 47.0 | % | | 22 | | % | | 37 | | % | | 25 | | % | 10.0 - 30.0 | % | | 16 | | % | % | | 17 | | % | % | | 17 | | % | % |
| Debt securities (including cash equivalents) | Debt securities (including cash equivalents) | 21.0 - 65.0 | | 52 | | | 45 | | | 56 | | |
| Real estate | Real estate | 3.5 - 13.5 | | 9 | | | 6 | | | 10 | | |
| Real estate | |
| Real estate | |
| Private equities & other investments | Private equities & other investments | 6.0 - 16.0 | | 17 | | | 12 | | | 9 | | |
| Private equities & other investments | |
| Private equities & other investments | |
Plan fiduciaries of the GE Pension Plan set investment policies and strategies for the GE Pension Trustprincipal pension plans and oversee itstheir investment allocation, which includes selecting investment managers and setting long-term strategic targets. The plan fiduciaries' primary strategic investment objectives are balancing investment risk and return and monitoring the plan’s liquidity position in order to meet the plan's near-term benefit payment and other cash needs. The plan has incorporated de-risking objectives and liability hedging programs as part of its long-term investment strategy. The planstrategy and utilizes a combination of long datedlong-dated corporate bonds, treasuries, strips and derivatives to implement its investment strategies as well as for hedging asset and liability risks. Target allocation percentages are established at an asset class level by plan fiduciaries. Target allocation ranges are guidelines, not limitations, and occasionally plan fiduciaries will approve allocations above or below a target range.
GE securities represented 0.6%0.5% and 0.7% of the GEPrincipal Pension TrustPlans' assets at December 31, 20202023 and 2019. The2022, respectively.
| | | | | | | | | | | | | | |
| ANNUALIZED RETURNS(a) | 1 year | 5 years | 10 years | 25 years |
| GE Aerospace Pension Plan | 6.5 | % | 5.2 | % | 4.6 | % | 5.3 | % |
| GE Energy Pension Plan | 6.6 | % | 5.2 | % | 4.6 | % | 5.3 | % |
(a) Prior to 2023, the annualized returns represent the GE Pension Plan has a broadly diversified portfolioPlan's returns.
| | | | | | | | | | | | | | | | | |
| EXPECTED FUTURE BENEFIT PAYMENTS OF OUR BENEFIT PLANS(a) | Principal pension | | Other pension | | Principal retiree benefit |
| 2024 | $ | 2,570 | | | $ | 570 | | | $ | 220 | |
| 2025 | 2,590 | | | 560 | | | 210 | |
| 2026 | 2,605 | | | 560 | | | 205 | |
| 2027 | 2,615 | | | 580 | | | 200 | |
| 2028 | 2,615 | | | 590 | | | 195 | |
| 2029-2033 | 12,885 | | | 3,065 | | | 845 | |
(a) As of investments in equities, fixed income, private equities and real estate; these investments are both U.S. and non-U.S. in nature. Asthe measurement date of December 31, 2020, no sector concentration of assets exceeded 15% of total GE Pension Plan assets.
| | | | | | | | | | | | | | |
| ANNUALIZED RETURNS | 1 year | 5 years | 10 years | 25 years |
| GE Pension Plan | 17.6 | % | 9.7 | % | 8.0 | % | 8.0 | % |
| | | | | | | | | | | | | | | | | |
| EXPECTED FUTURE BENEFIT PAYMENTS OF OUR BENEFIT PLANS | Principal pension | | Other pension | | Principal retiree benefit |
| 2021 | $ | 3,725 | | | $ | 945 | | | $ | 460 | |
| 2022 | 3,785 | | | 945 | | | 440 | |
| 2023 | 3,820 | | | 955 | | | 420 | |
| 2024 | 3,845 | | | 970 | | | 395 | |
| 2025 | 3,865 | | | 995 | | | 380 | |
| 2026 - 2030 | 19,410 | | | 5,185 | | | 1,615 | |
DEFINED CONTRIBUTION PLAN.AND DEFERRED COMPENSATION PLANS. We have a defined contribution plan for eligible U.S. employees that provides employer contributions. Defined contribution costscontributions which were $318$342 million, $355$444 million and $410$418 million for the years ended December 31, 2020, 2019,2023, 2022, and 2018,2021, respectively. Employer contributions for continuing operations were $342 million, $322 million, and $299 million for the years ended December 31, 2023, 2022, and 2021, respectively. We also have deferred incentive compensation plans and deferred salary plans for eligible employees. Liabilities associated with these plans were $916 million and $913 million as of December 31, 2023 and December 31, 2022, respectively. Expenses associated with these plans from continuing operations was $63 million, $46 million, and $43 million for the years ended December 2023, 2022, and 2021, respectively.
| | COST OF POSTRETIREMENT BENEFIT PLANS AND CHANGES IN OTHER COMPREHENSIVE INCOME | COST OF POSTRETIREMENT BENEFIT PLANS AND CHANGES IN OTHER COMPREHENSIVE INCOME | |
| For the years ended December 31 | For the years ended December 31 | 2020 | | 2019 | | 2018 |
| For the years ended December 31 | |
| For the years ended December 31 | | 2023 | | 2022 | | 2021 |
| (Pre-tax) | (Pre-tax) | Principal pension | Other pension | Principal retiree benefit | | Principal pension | Other pension | Principal retiree benefit | | Principal pension | Other pension | Principal retiree benefit | (Pre-tax) | Principal pension | Other pension | Principal retiree benefit | | Principal pension | Other pension | Principal retiree benefit | | Principal pension | Other pension | Principal retiree benefit |
| Cost (income) of postretirement benefit plans | Cost (income) of postretirement benefit plans | $ | 3,559 | | $ | 30 | | $ | (118) | | | $ | 3,929 | | $ | (21) | | $ | (149) | | | $ | 4,260 | | $ | (110) | | $ | (79) | |
| Changes in other comprehensive income | |
| Changes in other comprehensive loss (income) | |
| Prior service cost (credit) - current year | Prior service cost (credit) - current year | 0 | | 27 | | (7) | | | (42) | | (17) | | (23) | | | 0 | | 82 | | 0 | |
| Actuarial loss (gain) - current year | 1,124 | | 529 | | 119 | | | 971 | | 1,592 | | 240 | | | (111) | | 464 | | (543) | |
| Prior service cost (credit) - current year | |
| Prior service cost (credit) - current year | |
| Net loss (gain) - current year(a) | |
| Reclassifications out of AOCI | Reclassifications out of AOCI | |
| Curtailment / settlement gain (loss) | 0 | | (3) | | 0 | | | (353) | | (12) | | 4 | | | (45) | | (2) | | 0 | |
| Dispositions | 0 | | (166) | | 0 | | | 0 | | (340) | | 0 | | | 0 | | 0 | | 0 | |
| Amortization of net actuarial gain (loss) | (3,399) | | (434) | | 82 | | | (3,439) | | (319) | | 118 | | | (3,785) | | (312) | | 79 | |
| Curtailment/settlement gain (loss) | |
| Curtailment/settlement gain (loss) | |
| Curtailment/settlement gain (loss) | |
| Dispositions/acquisitions/other - net | |
| Amortization of net gain (loss) | |
| Amortization of prior service credit (cost) | Amortization of prior service credit (cost) | (146) | | (1) | | 234 | | | (135) | | (3) | | 232 | | | (143) | | 9 | | 230 | |
| Total changes in other comprehensive income | (2,421) | | (48) | | 428 | | | (2,998) | | 901 | | 571 | | | (4,084) | | 241 | | (234) | |
| Cost of postretirement benefit plans and changes in other comprehensive income | $ | 1,138 | | $ | (18) | | $ | 310 | | | $ | 931 | | $ | 880 | | $ | 422 | | | $ | 176 | | $ | 131 | | $ | (313) | |
| Total changes in other comprehensive loss (income) | |
| Cost (income) of postretirement benefit plans and changes in other comprehensive loss (income) | |
(a) Primarily due to impact of discount rates and investment performance.
NOTE 14. CURRENT AND ALL OTHER LIABILITIES
| | | | | | | | |
| December 31 | 2020 | 2019 |
| | |
| | |
| | |
| | |
| | |
| Sales allowances, equipment projects and other commercial liabilities | $ | 5,123 | | $ | 4,277 | |
| Product warranties (Note 23) | 1,197 | | 1,371 | |
| Employee compensation and benefit liabilities | 4,763 | | 5,114 | |
| Taxes payable | 413 | | 429 | |
| Environmental, health and safety liabilities (Note 23) | 359 | | 330 | |
| Due to GE Capital | 984 | | 1,080 | |
| Derivative instruments (Note 21) | 250 | | 171 | |
| Other | 1,044 | | 2,479 | |
| GE Industrial All other current liabilities | 14,131 | | 15,251 | |
| Aircraft maintenance reserve, sales deposits and other commercial liabilities | 1,465 | | 2,336 | |
| Interest payable | 1,064 | | 1,189 | |
| | |
| Derivative instruments (Note 21) | 117 | | 31 | |
| Other | 1,244 | | 495 | |
| GE Capital All other current liabilities | 3,890 | | 4,052 | |
| Eliminations | (1,422) | | (1,483) | |
| Consolidated All other current liabilities | $ | 16,600 | | $ | 17,821 | |
| | |
| Sales allowances, equipment projects and other commercial liabilities | 3,917 | | 3,923 | |
| Product warranties (Note 23) | 857 | | 793 | |
| Operating lease liabilities (Note 7) | 3,133 | | 3,369 | |
| Uncertain and other income taxes and related liabilities | 3,652 | | 3,410 | |
| Alstom legacy legal matters (Note 23) | 858 | | 875 | |
| Environmental, health and safety liabilities (Note 23) | 2,210 | | 2,154 | |
| Redeemable noncontrolling interests (Note 16) | 487 | | 439 | |
| Other | 1,326 | | 1,342 | |
| GE Industrial All other non-current liabilities | 16,440 | | 16,306 | |
| | |
| Other commercial liabilities | 455 | | 573 | |
| Operating lease liabilities (Note 7) | 221 | | 238 | |
| Uncertain and other income taxes and related liabilities | 475 | | 415 | |
| | |
| GE Capital All other non-current liabilities | 1,151 | | 1,226 | |
| Eliminations | (1,514) | | (1,593) | |
| Consolidated All other non-current liabilities | $ | 16,077 | | $ | 15,938 | |
| Total | $ | 32,677 | | $ | 33,759 | |
| | | | | | | | |
| | |
| December 31 | 2023 | 2022 |
| Sales discounts and allowances(a) | $ | 3,746 | | $ | 3,950 | |
| Equipment projects and other commercial liabilities | 2,019 | | 1,422 | |
| Product warranties (Note 24) | 910 | | 1,075 | |
| Employee compensation and benefit liabilities | 4,001 | | 3,339 | |
| Interest payable | 323 | | 352 | |
| Taxes payable | 654 | | 578 | |
| Environmental, health and safety liabilities (Note 24) | 188 | | 248 | |
| Derivative instruments (Note 22) | 161 | | 420 | |
| Other | 711 | | 746 | |
| | |
| | |
| | |
| | |
| | |
| | |
| All other current liabilities | $ | 12,712 | | $ | 12,130 | |
| | |
| Equipment projects and other commercial liabilities | $ | 1,802 | | $ | 2,192 | |
| Product warranties (Note 24) | 1,143 | | 885 | |
| Operating lease liabilities (Note 6) | 1,973 | | 2,089 | |
| Uncertain and other income taxes and related liabilities | 2,182 | | 2,459 | |
| Alstom legacy legal matters (Note 24) | 393 | | 455 | |
| Environmental, health and safety liabilities (Note 24) | 2,278 | | 2,166 | |
| | |
| | |
| Other | 737 | | 816 | |
| | |
| | |
| | |
| | |
| | |
| | |
| | |
| | |
| All other non-current liabilities | $ | 10,508 | | $ | 11,063 | |
| Total All other liabilities | $ | 23,221 | | $ | 23,193 | |
We have reclassified certain prior-year(a) Primarily comprise amounts including equipment project costs accruals of $1,432 million from GE Industrial All other current liabilitiespayable to Accounts payableairlines based on future aircraft deliveries by airframers and equipment project accruals to conform with the current year’s presentation.discounts on spare parts and repair sales at our Aerospace segment.
NOTE 15. INCOME TAXES.TAXES. GE Industrial and GE Capital filefiles a consolidated U.S. federal income tax return. Thisreturn that enables GE Industrial and GE CapitalGE's businesses to use tax deductions and credits of one member of the group to reduce the tax that otherwise would have been payable by another member of the group. The effective tax rate reflects the benefit of these tax reductions in the consolidated return. GE Industrial makes cashCash payments are made to GE CapitalGE's businesses for tax reductions and GE Capital paysfrom GE's businesses for tax increases at the time GE Industrial’s tax payments are due..
Our businesses are subject to regulation under a wide variety of U.S. federal, state and foreign tax laws, regulations and policies. Changes to these laws or regulations may affect our tax liability, return on investments and business operations. On August 16, 2022, the U.S. enacted the Inflation Reduction Act that includes a new alternative minimum tax based upon financial statement income (book minimum tax), an excise tax on stock buybacks and tax incentives for energy and climate initiatives, among other provisions. The new book minimum tax is expected to slow but not eliminate the favorable tax impact of our deferred tax assets, resulting in higher cash tax in some years that would generate future tax credits. The impact of the book minimum tax will depend on our facts in each year and guidance from the U.S. Department of the Treasury. Separately, there are tax incentives in the legislation that benefit our pre-tax income without increasing tax expense.
| | | | | | | | | | | |
| (BENEFIT) PROVISION FOR INCOME TAXES | 2020 | 2019 | 2018 |
| Current tax expense (benefit) | $ | 2,123 | | $ | 2,551 | | $ | 1,743 | |
| Deferred tax expense (benefit) from temporary differences | (1,735) | | (1,242) | | (1,276) | |
| Total GE Industrial | 388 | | 1,309 | | 467 | |
| Current tax expense (benefit) | 329 | | (720) | | 596 | |
| Deferred tax expense (benefit) from temporary differences | (1,191) | | 138 | | (970) | |
| Total GE Capital | (862) | | (582) | | (374) | |
| Current tax expense (benefit) | 2,452 | | 1,831 | | 2,339 | |
| Deferred tax expense (benefit) from temporary differences | (2,926) | | (1,104) | | (2,245) | |
| Total consolidated | $ | (474) | | $ | 726 | | $ | 93 | |
GE 20202023 FORM 10-K87 67
| | | | | | | | | | | |
| CONSOLIDATED EARNINGS (LOSS) FROM CONTINUING OPERATIONS BEFORE INCOME TAXES | 2020 | 2019 | 2018 |
| U.S. earnings (loss) | $ | (5,325) | | $ | 506 | | $ | (9,861) | |
| Non-U.S. earnings (loss) | 10,522 | | 643 | | (11,126) | |
| Total | $ | 5,197 | | $ | 1,149 | | $ | (20,987) | |
| | | | | | | | | | | |
| CONSOLIDATED (BENEFIT) PROVISION FOR INCOME TAXES | 2020 | 2019 | 2018 |
| U.S. Federal | | | |
| Current | $ | 939 | | $ | 146 | | $ | 1,019 | |
| Deferred | (2,032) | | (1,266) | | (3,144) | |
| Non - U.S. | | | |
| Current | 1,331 | | 2,008 | | 1,132 | |
| Deferred | (793) | | 106 | | 1,197 | |
| Other | 80 | | (267) | | (111) | |
| Total | $ | (474) | | $ | 726 | | $ | 93 | |
| | | | | | | | | | | |
| INCOME TAXES PAID (RECOVERED) | 2020 | 2019 | 2018 |
| GE Industrial | $ | 2,399 | | $ | 2,183 | | $ | 1,803 | |
| GE Capital | (1,108) | | 45 | | 65 | |
| Total(a) | $ | 1,291 | | $ | 2,228 | | $ | 1,868 | |
(a) Includes tax | | | | | | | | | | | |
| EARNINGS (LOSS) FROM CONTINUING OPERATIONS BEFORE INCOME TAXES | 2023 | 2022 | 2021 |
| U.S. earnings (loss) | $ | 7,037 | | $ | (908) | | $ | (3,596) | |
| Non-U.S. earnings (loss) | 3,154 | | 109 | | (2,099) | |
| Total | $ | 10,191 | | $ | (799) | | $ | (5,695) | |
| | | | | | | | | | | |
| PROVISION (BENEFIT) FOR INCOME TAXES | 2023 | 2022 | 2021 |
| Current | | | |
| U.S. Federal | $ | (423) | | $ | (311) | | $ | (1,475) | |
| Non-U.S. | 823 | | 733 | | 655 | |
| U.S. State | 140 | | (52) | | (145) | |
| Deferred | | | |
| U.S. Federal | 49 | | (617) | | (366) | |
| Non-U.S. | 591 | | 352 | | 610 | |
| U.S. State | (17) | | (108) | | (36) | |
| Total | $ | 1,162 | | $ | (3) | | $ | (757) | |
Income taxes paid were $994 million, $1,128 million and $1,330 million for the years ended December 31, 2023, 2022 and 2021, respectively, including payments reported in discontinued operations.
| | RECONCILIATION OF U.S. FEDERAL STATUTORY INCOME TAX RATE TO ACTUAL INCOME TAX RATE | RECONCILIATION OF U.S. FEDERAL STATUTORY INCOME TAX RATE TO ACTUAL INCOME TAX RATE | Consolidated | | GE Industrial | | GE Capital | RECONCILIATION OF U.S. FEDERAL STATUTORY INCOME TAX RATE TO ACTUAL INCOME TAX RATE | 2023 | 2022 | 2021 |
| 2020 | 2019 | 2018 | | 2020 | 2019 | 2018 | | 2020 | 2019 | 2018 | Amount | Rate | Amount | Rate | Amount | Rate |
| U.S. federal statutory income tax rate | U.S. federal statutory income tax rate | 21.0 | % | 21.0 | % | 21.0 | % | | 21.0 | % | 21.0 | % | 21.0 | % | | 21.0 | % | 21.0 | % | 21.0 | % | U.S. federal statutory income tax rate | $ | 2,140 | | 21.0 | 21.0 | % | $ | (168) | | 21.0 | 21.0 | % | $ | (1,196) | | 21.0 | 21.0 | % |
| Tax on global activities including exports(a) | Tax on global activities including exports(a) | (28.5) | | 91.0 | | (5.0) | | | (16.3) | | 61.0 | | (5.1) | | | 13.8 | | 8.1 | | 3.2 | |
| U.S. business credits(b) | (3.3) | | (22.5) | | 2.6 | | | (1.0) | | (6.4) | | 0.4 | | | 4.7 | | 21.9 | | 120.0 | |
| Goodwill impairments | 6.9 | | 26.0 | | (21.5) | | | 2.5 | | 16.6 | | (21.9) | | | (8.3) | | 0 | | 0 | |
| Tax Cuts and Jobs Act enactment | 0.9 | | 0.2 | | (0.2) | | | 0.7 | | 5.6 | | 0.5 | | | 0.1 | | 15.2 | | (36.5) | |
| U.S. general business credits(b) | |
| Debt tender and related valuation allowances | |
| Deductible stock and restructuring losses | |
| | Retained and sold ownership interests | |
| Retained and sold ownership interests | |
| Retained and sold ownership interests | |
All other – net(e)(d) | All other – net(e)(d) | (6.1) | | (52.5) | | 2.7 | | | (1.6) | | (25.1) | | 2.8 | | | 9.8 | | 23.1 | | (8.0) | |
| (30.1) | | 42.2 | | (21.4) | | | (15.7) | | 51.7 | | (23.3) | | | 20.1 | | 68.3 | | 78.7 | |
| (978) | |
| Actual income tax rate | Actual income tax rate | (9.1) | % | 63.2 | % | (0.4) | % | | 5.3 | % | 72.7 | % | (2.3) | % | | 41.1 | % | 89.3 | % | 99.7 | % | Actual income tax rate | $ | 1,162 | | 11.4 | 11.4 | % | $ | (3) | | 0.4 | 0.4 | % | $ | (757) | | 13.3 | 13.3 | % |
(a)For the year ended December 31, 2020, included (27.8)%, (18.5)%2023, 2022, and 4.6% in consolidated, GE Industrial and GE Capital,2021, respectively, the expense/(benefit) related to the sale of our Biopharma business. For the year ended December 31, 2019, included 55.1%negotiated tax rate in Singapore was $(136) million, $(112) million and 35.1% in consolidated and GE Industrial, respectively related to the sale of our BioPharma business.$(83) million.
(b)U.S. general business credits, primarilyPrimarily the credit for energy produced from renewable sources and the credit for research performed in the U.S.
(c)For the year ended December 31, 2020,2023 and 2022, included (2.7)%, (0.9)%$9 million and 3.6% in consolidated, GE Industrial and GE Capital, respectively$134 million for the resolution of the IRS audit of our consolidated U.S.separation income tax returns for 2014-2015. Forcosts of which $38 million and $66 million was due to the year ended December 31, 2019, included (32.9)%, (19.7)% and 3.5% in consolidated, GE Industrial and GE Capital, respectively for the resolutionrepatriation of the IRS audit of our consolidated U.S. income tax returns for 2012-2013.previously reinvested earnings.
(d)For the year ended December 31, 2020, included (3.9)%, (2.1)% and 2.2% in consolidated, GE Industrial and GE Capital, respectively, related to deductible stock losses. For the year ended December 31, 2019, included (12.5)% and (8.0)% in consolidated and GE Industrial, respectively, related to the disposition of the Digital ServiceMax business. For the year ended December 31, 2018, included 2.8% and 2.8% in consolidated and GE Industrial, respectively, related to deductible stock losses.
(e)Included for each period, the expense or benefit for OtherU.S. state taxes reported above in the consolidated (benefit) provision for income taxes, net of 21.0% federal effect.
U.S. TAX REFORM. On December 22, 2017, the U.S. enacted legislation commonly known as the Tax Cuts and Jobs Act (U.S. tax reform) that lowered the statutory tax rate on U.S. earnings to 21%, taxes historic foreign earnings at a reduced rate of tax, establishes a territorial tax system and enacts new taxes associated with global operations.
The impact of enactment of U.S. tax reform was recorded in 2017 on a provisional basis as the legislation provided for additional guidance to be issued by the U.S. Department of the Treasury on several provisions including the computation of the transition tax. This amount was adjusted in both 2018 and 2019 based on guidance issued during each of these years. Additional guidance may be issued after 2020 and any resulting effects will be recorded in the quarter of issuance. Additionally, as part of U.S. tax reform, the U.S. has enacted a minimum tax on foreign earnings (global intangible low tax income). We have not made an accrual for the deferred tax aspects of this provision.
For the year ended December 31, 2018, we finalized our provisional estimate of the enactment of U.S. tax reform and recorded an additional tax expense of $41 million. For the year ended December 31, 2019, we recorded an additional tax expense of $2 million based on the issuance in January 2019 of final regulations on the transition tax on historic foreign earnings. The cash impact of the transition tax on historic foreign earnings was largely offset by accelerated use of deductions and tax credits and was substantially incurred with the filing of the 2017 tax return with no amount subject to the deferred payment provision provided under law. For the year ended December 31, 2020, we recorded an additional tax expense of $49 million to reflect the impact of voluntary adjustments we provided the government reflecting finalization of amounts reported on the 2017 tax return. There could be further adjustment to the transition tax as a result of the current audit of the 2017 and 2018 tax years.
UNRECOGNIZED TAX POSITIONS. Annually, we file over 3,6002,300 income tax returns in almost 300over 270 global taxing jurisdictions. We are under examination or engaged in tax litigation in many of these jurisdictions. The IRS is currently auditing our consolidated U.S. income tax returns for 2016-2018.
In December 2020,September 2021, GE resolved its dispute with the IRS completed the audit of our consolidated U.S. income tax returns for 2014-2015. The Company recognized a continuing operations benefit of $140 million plus an additional net interest benefit of $96 million. In addition, GE Capital recorded a benefit in discontinued operations of $130 million of tax benefits and $25 million of net interest benefits. In June 2019, the IRS completed the audit of our consolidated U.S. income tax returns for 2012-2013. The Company recognized a continuing operations tax benefit of $378 million plus an additional net interest benefit of $107 million. GE Capital recorded an additional non-cash benefit in discontinued operations of $332 million of tax benefits and $46 million of net interest benefits. See Note 2 for further information. The United Kingdom tax authorities disallowedauthority, HM Revenue & Customs (HMRC) in connection with interest deductions claimed by GE Capital for the years 2004-2015 that could result in2004-2015. As previously disclosed, HMRC had proposed to disallow interest deductions with a potential impact of approximately $1.1 billion,$1,100 million, which includesincluded a possible assessment of tax and reduction of deferred tax assets, not including interest and penalties. We are contesting the disallowance. We comply with all applicable tax laws and judicial doctrinesAs part of the United Kingdomsettlement, GE and believeHMRC agreed that a portion of the entire benefit is more likely than notinterest deductions claimed were disallowed, with no fault or blame attributed to be sustained oneither party. The resolution concluded the dispute in its technical merits. We believe that there areentirety without interest or penalties. The adjustments result in no other jurisdictions incurrent tax payment to HMRC, but a deferred tax charge of $112 million as part of discontinued operations as a result of a reduction of available tax attributes, which the outcome of unresolved issues or claims is likely to be material to our results of operations, financial position or cash flows. We further believe that we have made adequate provision for all incomehad previously been recorded as deferred tax uncertainties.assets.
The balance of unrecognized tax benefits, the amount of related interest and penalties we have provided and what we believe to be the range of reasonably possible changes in the next 12 months (excluding the expected decrease to the GE balance due to the announced plan to spin-off GE Vernova and for 2022 and 2021 the impact of the spin-off of GE HealthCare) were:
| | | | | | | | | | | |
UNRECOGNIZED TAX BENEFITS December 31 | 2020 | 2019 | 2018 |
| Unrecognized tax benefits | $ | 4,191 | | $ | 4,169 | | $ | 5,563 | |
| Portion that, if recognized, would reduce tax expense and effective tax rate(a) | 2,986 | | 2,701 | | 4,265 | |
| Accrued interest on unrecognized tax benefits | 628 | | 722 | | 934 | |
| Accrued penalties on unrecognized tax benefits | 179 | | 195 | | 182 | |
Reasonably possible reduction to the balance of unrecognized tax benefits in succeeding 12 months | 0-350 | 0-700 | 0-1,300 |
| Portion that, if recognized, would reduce tax expense and effective tax rate(a) | 0-250 | 0-650 | 0-1,200 |
| | | | | | | | | | | |
| UNRECOGNIZED TAX BENEFITS | 2023 | 2022 | 2021 |
| Unrecognized tax benefits | $ | 3,399 | | $ | 3,951 | | $ | 4,224 | |
| Portion that, if recognized, would reduce tax expense and effective tax rate(a) | 2,708 | | 3,072 | | 3,351 | |
| Accrued interest on unrecognized tax benefits | 635 | | 614 | | 597 | |
| Accrued penalties on unrecognized tax benefits | 111 | | 111 | | 146 | |
Reasonably possible reduction to the balance of unrecognized tax benefits in succeeding 12 months | 0-100 | 0-650 | 0-250 |
| Portion that, if recognized, would reduce tax expense and effective tax rate(a) | 0-100 | 0-600 | 0-200 |
(a) Some portion of such reduction may be reported as discontinued operations.
| | | | | | | | | | | |
| UNRECOGNIZED TAX BENEFITS RECONCILIATION | 2020 | 2019 | 2018 |
| Balance at January 1 | $ | 4,169 | | $ | 5,563 | | $ | 5,449 | |
| Additions for tax positions of the current year | 836 | | 403 | | 300 | |
| Additions for tax positions of prior years | 326 | | 500 | | 945 | |
| Reductions for tax positions of prior years(a) | (863) | | (1,927) | | (905) | |
| Settlements with tax authorities | (127) | | (155) | | (64) | |
| Expiration of the statute of limitations | (151) | | (214) | | (162) | |
| Balance at December 31 | $ | 4,191 | | $ | 4,169 | | $ | 5,563 | |
| | | | | | | | | | | |
| UNRECOGNIZED TAX BENEFITS RECONCILIATION | 2023 | 2022 | 2021 |
| Balance at January 1 | $ | 3,951 | | $ | 4,224 | | $ | 4,191 | |
| Additions for tax positions of the current year | 109 | | 62 | | 396 | |
| Additions for tax positions of prior years | 156 | | 120 | | 327 | |
| Reductions for tax positions of prior years(a) | (710) | | (393) | | (585) | |
| Settlements with tax authorities | (56) | | (8) | | (33) | |
| Expiration of the statute of limitations | (51) | | (54) | | (71) | |
| Balance at December 31 | $ | 3,399 | | $ | 3,951 | | $ | 4,224 | |
(a)For 2019,2023, reductions included $710$577 million related to the completionspin-off of the 2012-2013 IRS audit and $442 million related to the deconsolidation of Baker Hughes.GE HealthCare.
We classify interest on tax deficiencies as interest expense; we classify income tax penalties as provision for income taxes. For the years ended December 31, 2020, 20192023, 2022 and 2018, $(30)2021, $28 million, $(93)$36 million and $127$17 million of interest expense (income), respectively, and $(13)$7 million, $20$(26) million and $(7)$(29) million of tax expense (income) related to penalties, respectively, were recognized in our consolidated Statement of Earnings (Loss).
DEFERRED INCOME TAXES. As part of the Tax Cuts and Jobs Act of 2017 (U.S. tax reform), the U.S. has enacted a minimum tax on foreign earnings (global intangible low taxed income). We have not made an accrual for the deferred tax aspects of this provision. We also have not provided deferred taxes on cumulative net earnings of non-U.S. affiliates and associated companies of approximately $42$7 billion that have been reinvested indefinitely. Given U.S. tax reform, substantially all of our prior unrepatriated net earnings were subject to U.S. tax and accordingly we expect to have the ability to repatriate available non-U.S. cash without additional federal tax cost, and any foreign withholding tax on a repatriation to the U.S. would potentiallymay be at least partially offset by a U.S. foreign tax credit. However, because mostMost of these earnings have been reinvested in active non-U.S. business operations as of December 31, 2020, we have not decided to repatriate these earnings to the U.S. Itand it is not practicable to determine the income tax liability that would be payable if such earnings were not reinvested indefinitely. We reassess reinvestment of earnings on an ongoing basis. In 2023 and 2022, in connection with the execution of the Company’s plans to prepare for the spin-off of GE Vernova and GE HealthCare, we incurred $38 million and $66 million of tax, respectively, due to repatriation of previously reinvested earnings.
The total deferred tax asset as of December 31, 2023 and December 31, 2022 includes $858 million and $435 million, respectively, related to the required capitalization of research costs for U.S. tax purposes effective January 1, 2022. Included in discontinued operations as of December 31, 2022 is a deferred tax asset of $279 million related to GE HealthCare, which became a deferred asset of the separate company upon spin-off in the first quarter of 2023. In the event capitalization of research costs is adjusted through retroactive legislation effective for 2022, GE will record a tax provision benefit related to GE HealthCare research costs as a result of the benefit in a consolidated GE tax return without payment under the Tax Matters Agreement.
The following table presents our net deferred tax assets and net deferred tax liabilities attributable to different tax jurisdictions or different tax paying components.
| | | | | | | | |
DEFERRED INCOME TAXES December 31 | 2023 | 2022 |
| Total assets | $ | 11,128 | | $ | 10,626 | |
| Total liabilities | (553) | | (625) | |
| Net deferred income tax asset (liability) | $ | 10,575 | | $ | 10,001 | |
GE 20202023 FORM 10-K89 69
| | | | | | | | |
DEFERRED INCOME TAXES December 31 | 2020 | 2019 |
| GE Industrial | $ | 10,069 | | $ | 8,888 | |
| GE Capital | 3,610 | | 2,500 | |
| Total assets | 13,679 | | 11,388 | |
| GE Industrial | (719) | | (699) | |
| GE Capital | (879) | | (800) | |
| Total liabilities | (1,598) | | (1,499) | |
| Net deferred income tax asset (liability) | $ | 12,081 | | $ | 9,889 | |
| | | | | | | | |
COMPONENTS OF THE NET DEFERRED INCOME TAX ASSET (LIABILITY) December 31 | 2020 | 2019 |
| Principal pension plans | $ | 3,666 | | $ | 4,016 | |
| Provision for expenses | 2,258 | | 1,990 | |
| Other compensation and benefits | 1,968 | | 2,206 | |
| Principal retiree benefit plans | 1,026 | | 1,023 | |
| Capitalized expenditures | 993 | | 860 | |
| Non-U.S. loss carryforwards(a) | 814 | | 602 | |
| Intangible assets | 486 | | 1,315 | |
| Baker Hughes investment | (973) | | (1,256) | |
| Depreciation | (676) | | (823) | |
| Contract assets | (460) | | (1,232) | |
| Other – net(b) | 248 | | (512) | |
| GE Industrial | 9,350 | | 8,189 | |
| Insurance company loss reserves | 1,684 | | 1,715 | |
| Non-U.S. loss carryforwards(a) | 1,194 | | 1,274 | |
| Capitalized expenditures | 799 | | 742 | |
| Operating leases | (1,900) | | (2,218) | |
| Financing leases | (393) | | (477) | |
| Other – net(b) | 1,347 | | 664 | |
| GE Capital | 2,731 | | 1,700 | |
| Net deferred income tax asset (liability) | $ | 12,081 | | $ | 9,889 | |
| | | | | | | | |
COMPONENTS OF THE NET DEFERRED INCOME TAX ASSET (LIABILITY) December 31 | 2023 | 2022 |
| Deferred tax assets | | |
| Insurance company loss reserves | $ | 3,185 | | $ | 2,492 | |
| Progress collections, contract assets and deferred items | 2,753 | | 2,365 | |
| Accrued expenses and reserves | 2,197 | | 2,215 | |
| Deferred expenses | 1,317 | | 1,438 | |
| Other compensation and benefits | 1,143 | | 1,173 | |
| Principal pension plans | 1,359 | | 1,146 | |
| Non-U.S. loss carryforwards(a) | 972 | | 939 | |
| | |
| Other(b) | 843 | | 1,000 | |
| Total deferred tax assets | $ | 13,769 | | $ | 12,768 | |
| Deferred tax liabilities | | |
| Depreciation | $ | (702) | | $ | (613) | |
| Global investments, partnerships, join ventures and non-consolidated entities | (1,389) | | (1,440) | |
| Other | (1,103) | | (714) | |
| Total deferred tax liabilities | (3,194) | | (2,767) | |
| Net deferred income tax asset (liability) | $ | 10,575 | | $ | 10,001 | |
(a)Net of valuation allowances of $5,934$6,932 million and $4,801$6,369 million for GE Industrial and $265 million and $201 million for GE Capital as of December 31, 20202023 and 2019,2022, respectively. Of the net deferred tax asset as of December 31, 20202023 of $2,008$972 million, $19$73 million relates to net operating loss carryforwards that expire in various years ending from December 31, 20212024 through December 31, 2023; $1122026; $327 million relates to net operating losses that expire in various years ending from December 31, 20242027 through December 31, 20402043; and $1,957$572 million relates to net operating loss carryforwards that may be carried forward indefinitely.
(b) Included valuation allowances related to assets other than non-U.S. loss carryforwards of $898$1,937 million and $1,897$3,264 million for GE Industrial and $221 million and $248 million for GE Capital as of December 31, 20202023 and 2019,2022, respectively. These primarily relate to excess capital loss carryforwards and excess U.S. foreign tax credits. The decrease in valuation allowance from December 31, 2022 to December 31, 2023 reflects utilization of losses against 2023 net capital gains of $1,413 million including gains reported in discontinued operations. The valuation allowance as of December 31, 2022 increased during the year primarily because it includes $1,327 million of valuation allowance against a deferred tax asset for deductible stock and restructuring losses for the year ended December 31, 2022 which was not likely to be utilized.
NOTE 16. SHAREHOLDERS’ EQUITY
| | | | | | | | | | | |
| ACCUMULATED OTHER COMPREHENSIVE INCOME (LOSS) | 2020 | 2019 | 2018 |
| Beginning balance | $ | 61 | | $ | (39) | | $ | (102) | |
| Other comprehensive income (loss) (OCI) before reclassifications – net of deferred taxes of $10, $32 and $41(a) | 55 | | 141 | | 87 | |
| Reclassifications from OCI – net of deferred taxes of $(14), $(11) and $(6) | (56) | | (42) | | (23) | |
| Other comprehensive income (loss) | (1) | | 100 | | 64 | |
| Less OCI attributable to noncontrolling interests | 0 | | 0 | | 0 | |
| Investment securities ending balance | $ | 60 | | $ | 61 | | $ | (39) | |
| | | |
| Beginning balance | $ | (4,818) | | $ | (6,134) | | $ | (4,661) | |
| OCI before reclassifications – net of deferred taxes of $(25), $(98) and $29 | (255) | | 41 | | (2,076) | |
| Reclassifications from OCI – net of deferred taxes of $0, $(9) and $89(b)(c) | 691 | | 1,234 | | 412 | |
| Other comprehensive income (loss) | 435 | | 1,275 | | (1,664) | |
| Less OCI attributable to noncontrolling interests | 2 | | (40) | | (192) | |
| Currency translation adjustments ending balance | $ | (4,386) | | $ | (4,818) | | $ | (6,134) | |
| | | |
| Beginning balance | $ | 49 | | $ | 13 | | $ | 62 | |
| OCI before reclassifications – net of deferred taxes of $11, $6 and $(26) | (94) | | (21) | | (149) | |
| Reclassifications from OCI – net of deferred taxes of $(11), $2 and $4(b) | 17 | | 58 | | 98 | |
| Other comprehensive income (loss) | (77) | | 37 | | (51) | |
| Less OCI attributable to noncontrolling interests | 0 | | 2 | | (2) | |
| Cash flow hedges ending balance | $ | (28) | | $ | 49 | | $ | 13 | |
| | | |
| Beginning balance | $ | (7,024) | | $ | (8,254) | | $ | (9,702) | |
| OCI before reclassifications – net of deferred taxes of $(283), $(418) and $115 | (1,256) | | (2,097) | | 71 | |
| Reclassifications from OCI – net of deferred taxes of $805, $915 and $2,610 (b)(c) | 2,888 | | 3,325 | | 1,345 | |
| Other comprehensive income (loss) | 1,632 | | 1,228 | | 1,416 | |
| Less OCI attributable to noncontrolling interests | 4 | | (2) | | (32) | |
| Benefit plans ending balance | $ | (5,395) | | $ | (7,024) | | $ | (8,254) | |
| | | |
| Accumulated other comprehensive income (loss) at December 31 | $ | (9,749) | | $ | (11,732) | | $ | (14,414) | |
| | | | | | | | | | | | | | |
| | | | |
| | | | | | |
ACCUMULATED OTHER COMPREHENSIVE INCOME (LOSS) (Dividends per share in dollars) | | | | 2023 | 2022 | 2021 |
| | | | | | |
| | | | | | |
| | | | | | |
| | | | | | |
| | | | | | |
| | | | | | |
| Beginning balance | | | | $ | (5,893) | | $ | (4,569) | | $ | (4,395) | |
| AOCI before reclasses – net of taxes of $74, $144 and $(90) | | | | 12 | | (1,326) | | (101) | |
| Reclasses from AOCI – net of taxes of $(626), $0 and $87(a) | | | | 2,262 | | — | | (71) | |
| AOCI | | | | 2,274 | | (1,326) | | (172) | |
| Less AOCI attributable to noncontrolling interests | | | | 4 | | (2) | | 2 | |
| Currency translation adjustments AOCI | | | | $ | (3,623) | | $ | (5,893) | | $ | (4,569) | |
| | | | | | |
| Beginning balance | | | | $ | 6,531 | | $ | 3,646 | | $ | (5,395) | |
| AOCI before reclasses – net of taxes of $(497), $597 and $1,643 | | | | (1,874) | | 2,117 | | 6,225 | |
| Reclasses from AOCI – net of taxes of $(778), $216 and $793(a) | | | | (2,873) | | 772 | | 2,819 | |
| AOCI | | | | (4,747) | | 2,889 | | 9,044 | |
| Less AOCI attributable to noncontrolling interests | | | | (2) | | 3 | | 3 | |
| Benefit plans AOCI | | | | $ | 1,786 | | $ | 6,531 | | $ | 3,646 | |
| | | | | | |
| Beginning balance | | | | $ | (1,927) | | $ | 5,172 | | $ | 6,471 | |
| AOCI before reclasses – net of taxes of $248, $(1,861) and $(386) | | | | 1,046 | | (7,135) | | (1,343) | |
| Reclasses from AOCI – net of taxes of $(7), $(20) and $23(a) | | | | (78) | | 36 | | 44 | |
| AOCI | | | | 968 | | (7,099) | | (1,299) | |
| | | | | | |
| Investment securities and cash flow hedges AOCI | | | | $ | (959) | | $ | (1,927) | | $ | 5,172 | |
| | | | | | |
| Beginning balance | | | | $ | (983) | | $ | (9,109) | | $ | (11,708) | |
| AOCI before reclasses – net of taxes of $(630), $2,160 and $691 | | | | (2,371) | | 8,126 | | 2,599 | |
| | | | | | |
| AOCI | | | | (2,371) | | 8,126 | | 2,599 | |
| Long-duration insurance contracts AOCI | | | | $ | (3,354) | | $ | (983) | | $ | (9,109) | |
| | | | | | |
| AOCI at December 31 | | | | $ | (6,150) | | $ | (2,272) | | $ | (4,860) | |
| | | | | | |
| Dividends declared per common share | | | | $ | 0.32 | | $ | 0.32 | | $ | 0.32 | |
(a) Included adjustments of $(1,979) million, $(2,693) million and $1,825 million in 2020, 2019 and 2018, respectively, related to insurance liabilities and annuity benefits in our run-off insurance operations to reflect the effects that would have been recognized had the related unrealized investment security gains been realized. See Note 12 for further information.
(b) The total reclassification from AOCI included $836$195 million, including currency translation of $688$2,234 million and benefit plans of $(2,030) million, net of taxes, in 2020,first quarter of 2023 related to the salespin-off of our BioPharma business within our Healthcare segment.
(c) Currency translation and benefit plan gains and losses included $1,343 million, including currency translation of $1,066 million, net of taxes, in 2019 earnings (loss) from discontinued operations related to deconsolidation of Baker Hughes.GE HealthCare.
Preferred stock. On September 15, 2023 we issued $5,694redeemed the remaining outstanding shares of GE preferred stock. We redeemed $5,795 million and $144 million of GE Series D preferred stock in addition to $245 million of existing GE Series A, B and C preferred stock, which are also outstanding. The total carrying value of GE Industrial preferred stock atthe years ended December 31, 2020 was $5,918 million2023 and will increase to $5,940 million by the respective call dates through periodic accretion.2022, respectively. Dividends on GE Industrial preferred stock are payable semi-annually in June and December and accretion is recorded on a quarterly basis. Dividends on GE Industrial preferred stock totaled $474$237 million, including cash dividends of $295$236 million, $460$289 million, including cash dividends of $295$284 million, and $447$237 million, including cash dividends of $295$220 million, for the years ended December 31, 2020, 20192023, 2022 and 2018,2021, respectively. On January 21, 2021, the GE Series D preferred stock became callable and its dividends converted from 5% fixed rate to 3-month LIBOR plus 3.33%. As of the filing date of this Form 10-K for the year ended December 31, 2020, the GE Series D preferred stock has not been called.
In conjunction with the 2016 exchange of GE Capital preferred stock into GE preferred stock, GE Capital issued preferred stock to GE Industrial for which the amount and terms mirrored the GE Industrial external preferredCommon stock. In 2018, GE Capital and GE Industrial exchanged the existing Series D preferred stock issued to GE Industrial for new Series D preferred stock, which is mandatorily convertible into GE Capital common stock on January 21, 2021. In the first quarter of 2021, GE Capital and GE Industrial also agreed to retire the Series A, B and C GE Capital preferred stock effective on the Series D conversion date of January 21, 2021. As a result of these actions, effective January 21, 2021, there is no remaining preferred stock between GE Industrial and GE Capital, and accordingly GE Capital will no longer pay preferred dividends to GE Industrial and all preferred stock dividend costs have become a GE Industrial obligation effective January 21, 2021. The exchange of GE Capital Series D preferred stock has no impact on the GE Series D preferred stock, which remains callable for $5,694 million effective on January 21, 2021 or thereafter on dividend payment dates. Similarly, there were no changes to the GE Series A, B or C preferred stock, which become callable at various dates in 2022 and 2023.
GE has 50 million authorized shares of preferred stock ($1.00 par value), of which 5,939,875 shares are outstanding as of December 31, 2020, 2019 and 2018. GE's authorized common stock consists of 13,2001,650 million shares having a par value of $0.06$0.01 each, with 11,6941,462 million shares issued. To facilitate settlement of employee compensation programs, weCommon stock shares outstanding were 1,088,415,995 and 1,089,107,878 at December 31, 2023 and 2022, respectively. We repurchased shares of11.0 million, 13.6 million and 0.5 million and 1.1 million,shares, for a total of $15.3$1,135 million, $1,000 million and $9.6$36 million for the years ended December 31, 20202023, 2022 and 2019,2021, respectively.
Noncontrolling interests in equity of consolidated affiliates amounted to $1,522 million and $1,545 million at December 31, 2020 and 2019, respectively. Net earnings (loss) attributable to noncontrolling interests were $(33) million, $33 million and $203 million in 2020, 2019 and 2018, respectively. Dividends attributable to noncontrolling interests were $(16) million, $(331) million and $(362) million in 2020, 2019 and 2018, respectively.
Redeemable noncontrolling interests presented in All other liabilities in our consolidated Statement of Financial Position include common shares issued by our affiliates that are redeemable at the option of the holder of those interests and amounted to $487 million and $439 million as of December 31, 2020 and 2019, respectively. Net earnings (loss) attributable to redeemable noncontrolling interests was $(125) million, $33 million and $(291) million for the years ended December 31, 2020, 2019 and 2018, respectively.
NOTE 17. SHARE-BASED COMPENSATION. We grant stock options, restricted stock units and performance share units to employees under the 2007 and 2022 Long-Term Incentive Plan.Plans. Grants made under all plans must be approved by the Management Development and Compensation Committee of GE’s Board of Directors, which is composed entirely of independent directors. We record compensation expense for awards expected to vest over the vesting period. We estimate forfeitures based on experience and adjust expense to reflect actual forfeitures. When options are exercised, and restricted stock units vest, and performance share awards are earned, we issue shares from treasury stock.
Stock options provide employees the opportunity to purchase GE shares in the future at the market price of our stock on the date the award is granted (the strike price). The options become exercisable over the vesting period, (typically typically three or five years) years, and expire 10 years from the grant date if not exercised. Restricted stock units (RSU) provide an employee with the right to receive sharesone share of GE stock when the restrictions lapse over the vesting period. Upon vesting, each RSU is converted into one share of GE common stock on a 1-for-one basis.for each unit. Performance share units (PSU) and performance shares provide an employee with the right to receive shares of GE stock based upon achievement of certain performance or market metrics. Upon vesting, (if applicable), each PSU earned is converted into shares of GE common stock on a one-for-one basis.stock. We value stock options using a Black-Scholes option pricing model, RSUs using market price on grant date, and PSUs and performance shares using both market price on grant date and a Monte Carlo simulation as needed based on performance metrics.
| | | | | | | | | | | | | | |
| WEIGHTED AVERAGE GRANT DATE FAIR VALUE | | 2020 | 2019 | 2018 |
| Stock options | | $ | 3.58 | | $ | 3.48 | | $ | 3.00 | |
| RSUs | | 7.91 | | 10.12 | | 13.96 | |
| PSUs/Performance shares | | 7.91 | | 10.73 | | 4.80 |
| | | | | | | | | | | | | | |
| WEIGHTED AVERAGE GRANT DATE FAIR VALUE | | 2023 | 2022 | 2021 |
| Stock options | | $ | 36.10 | | $ | 34.03 | | $ | 40.64 | |
| RSUs | | 89.60 | | 87.68 | | 104.98 | |
| PSUs/Performance shares | | 89.44 | | 95.40 | | 108.51 | |
Key assumptions used in the Black-Scholes valuation for stock options include: risk free rates of 1.0%4.2%, 2.5%1.6%, and 2.8%1.1%, dividend yields of 0.4%, 0.4%, and 2.3%0.3%, expected volatility of 36%, 33%37%, and 32%40%, expected lives of 6.16.8 years, 6.06.8 years, and 5.96.2 years, and strike prices of $10.56, $10.00,$88.15, $92.33, and $12.13$105.12 for 2020, 2019,2023, 2022, and 2018,2021, respectively.
| | | | | | | | | | | | | | | | | | | | | | | | | | | | | |
| STOCK-BASED COMPENSATION ACTIVITY | Stock options | | RSUs |
| Shares (in millions) | Weighted average exercise price | Weighted average contractual term (in years) | Intrinsic value (in millions) | | Shares (in millions) | Weighted average grant date fair value | Weighted average contractual term (in years) | Intrinsic value (in millions) |
| Outstanding at January 1, 2020 | 458 | | $ | 18.66 | | | | | 28 | | $ | 13.29 | | | |
| Granted | 36 | | 10.56 | | | | | 46 | | 7.91 | | | |
| Exercised | (1) | | 7.48 | | | | | (10) | | 14.44 | | | |
| Forfeited | (15) | | 11.12 | | | | | (4) | | 11.80 | | | |
| Expired | (78) | | 19.14 | | | | | N/A | N/A | | |
| Outstanding at December 31, 2020 | 400 | | $ | 18.16 | | 4.5 | $ | 156 | | | 60 | | $ | 9.04 | | 2.1 | $ | 653 | |
| Exercisable at December 31, 2020 | 305 | | $ | 20.28 | | 3.3 | $ | 62 | | | N/A | N/A | N/A | N/A |
| Expected to vest | 90 | | $ | 11.50 | | 8.2 | $ | 87 | | | 49 | | $ | 9.41 | | 1.9 | $ | 533 | |
| | | | | | | | | | | | | | | | | | | | | | | | | | | | | |
| STOCK-BASED COMPENSATION ACTIVITY | Stock options | | RSUs |
| Shares (in thousands) | Weighted average exercise price | Weighted average contractual term (in years) | Intrinsic value (in millions) | | Shares (in thousands) | Weighted average grant date fair value | Weighted average contractual term (in years) | Intrinsic value (in millions) |
| Outstanding at January 1, 2023 | 31,023 | | $ | 142.68 | | | | | 9,687 | | $ | 79.82 | | | |
| Spin-off adjustment(a) | 3,704 | | N/A | | | | (784) | | N/A | | |
| Granted | 358 | | 88.15 | | | | | 3,203 | | 89.60 | | | |
| Exercised | (7,275) | | 77.64 | | | | | (3,480) | | 67.96 | | | |
| Forfeited | (21) | | 64.46 | | | | | (523) | | 69.73 | | | |
| Expired | (5,216) | | 152.04 | | | | | N/A | N/A | | |
| Outstanding at December 31, 2023 | 22,573 | | $ | 122.35 | | 3.0 | $ | 544 | | | 8,103 | | $ | 76.52 | | 1.1 | $ | 1,034 | |
| Exercisable at December 31, 2023 | 21,389 | | $ | 124.83 | | 2.8 | $ | 484 | | | N/A | N/A | N/A | N/A |
| Expected to vest | 1,098 | | $ | 77.50 | | 7.7 | $ | 55 | | | 7,313 | | $ | 76.09 | | 1.0 | $ | 933 | |
(a) The spin-off adjustment represents the net of shares converted into new GE awards and shares converted and transferred to GE HealthCare Technologies Inc. as a result of the January 3, 2023 separation of GE HealthCare.
Total outstanding target PSUs and performance shares at December 31, 20202023 were 21 million2,315 thousand shares with a weighted average fair value of $8.62.$68.58. The intrinsic value and weighted average contractual term of target PSUs and performance shares outstanding were $232$295 million and 3.01.3 years, respectively.
| | | | | | | | | | | |
| 2020 | 2019 | 2018 |
| Compensation expense (after-tax)(a)(b) | $ | 353 | | $ | 400 | | $ | 336 | |
| Cash received from stock options exercised | 6 | | 69 | | 24 | |
| Intrinsic value of stock options exercised and RSUs vested | 81 | | 154 | | 83 | |
| | | | | | | | | | | |
| 2023 | 2022 | 2021 |
| Compensation expense (after-tax)(a) | $ | 299 | | $ | 251 | | $ | 305 | |
| Cash received from stock options exercised | 565 | | 62 | | 93 | |
| Intrinsic value of stock options exercised and RSU/PSUs vested | 561 | | 170 | | 217 | |
(a)Unrecognized compensation cost related to unvested equity awards as of December 31, 20202023 was $543$318 million, which will be amortized over a weighted average period of 1.3 years.
(b)1.0 year. Income tax benefit recognized in earnings was $10$61 million, $20$12 million and $40 millionan insignificant amount in 2020, 2019,2023, 2022, and 2018,2021, respectively.
NOTE 18. EARNINGS PER SHARE INFORMATION
| | | | | | | | | | | | | | | | | | | | | | | | | | |
| (Earnings for per-share calculation; | 2020 | | 2019 | | 2018 |
| per-share amounts in dollars) | Diluted | Basic | | Diluted | Basic | | Diluted | Basic |
| Earnings (loss) from continuing operations | $ | 5,817 | | $ | 5,817 | | | $ | 416 | | $ | 416 | | | $ | (20,997) | | $ | (20,997) | |
| Preferred stock dividends | (474) | | (474) | | | (460) | | (460) | | | (447) | | (447) | |
Accretion of redeemable noncontrolling interests,
net of tax(a) | (151) | | (151) | | | 0 | | 0 | | | 0 | | 0 | |
Earnings (loss) from continuing operations attributable to
common shareholders | $ | 5,191 | | $ | 5,191 | | | $ | (45) | | $ | (45) | | | $ | (21,445) | | $ | (21,445) | |
| Earnings (loss) from discontinued operations | (125) | | (125) | | | (5,396) | | (5,396) | | | (1,372) | | (1,372) | |
Net earnings (loss) attributable to GE common
shareholders | 5,066 | | 5,066 | | | (5,440) | | (5,440) | | | (22,809) | | (22,809) | |
| | | | | | | | |
| Shares of GE common stock outstanding | 8,753 | | 8,753 | | | 8,724 | | 8,724 | | | 8,691 | | 8,691 | |
Employee compensation-related shares (including stock options) and warrants(a) | 9 | | 0 | | | 0 | | 0 | | | 0 | | 0 | |
| Total average equivalent shares | 8,761 | | 8,753 | | | 8,724 | | 8,724 | | | 8,691 | | 8,691 | |
| | | | | | | | |
| Earnings (loss) per share from continuing operations | $ | 0.59 | | $ | 0.59 | | | $ | (0.01) | | $ | (0.01) | | | $ | (2.47) | | $ | (2.47) | |
| Earnings (loss) per share from discontinued operations | (0.01) | | (0.01) | | | (0.62) | | (0.62) | | | (0.16) | | (0.16) | |
| Net earnings (loss) per share | 0.58 | | 0.58 | | | (0.62) | | (0.62) | | | (2.62) | | (2.62) | |
| | | | | | | | |
| Potentially dilutive securities(b) | 444 | | | | 450 | | | | 420 | | |
| | | | | | | | | | | | | | | | | | | | | | | | | | |
| 2023 | | 2022 | | 2021 |
| (Earnings for per-share calculation, shares in millions, per-share amounts in dollars) | Diluted | Basic | | Diluted | Basic | | Diluted | Basic |
| | | | | |
| | | | | | | | |
| Earnings (loss) from continuing operations | $ | 9,063 | | $ | 9,066 | | | $ | (811) | | $ | (811) | | | $ | (4,822) | | $ | (4,822) | |
| Preferred stock dividends and other and accretion of preferred share repurchase(a) | (295) | | (295) | | | (286) | | (286) | | | (246) | | (246) | |
| Earnings (loss) from continuing operations attributable to common shareholders | 8,769 | | 8,772 | | | (1,097) | | (1,097) | | | (5,067) | | (5,067) | |
| Earnings (loss) from discontinued operations | 414 | | 414 | | | 1,151 | | 1,151 | | | (1,516) | | (1,516) | |
| Net earnings (loss) attributable to GE common shareholders | 9,182 | | 9,186 | | | 54 | | 54 | | | (6,583) | | (6,583) | |
| | | | | | | | |
| Shares of GE common stock outstanding | 1,089 | | 1,089 | | | 1,096 | | 1,096 | | | 1,098 | | 1,098 | |
| Employee compensation-related shares (including stock options) | 10 | | — | | | — | | — | | | — | | — | |
| Total average equivalent shares | 1,099 | | 1,089 | | | 1,096 | | 1,096 | | | 1,098 | | 1,098 | |
| | | | | | | | |
| Earnings (loss) from continuing operations | $ | 7.98 | | $ | 8.06 | | | $ | (1.00) | | $ | (1.00) | | | $ | (4.62) | | $ | (4.62) | |
| Earnings (loss) from discontinued operations | 0.38 | | 0.38 | | | 1.05 | | 1.05 | | | (1.38) | | (1.38) | |
| Net earnings (loss) per share | 8.36 | | 8.44 | | | 0.05 | | 0.05 | | | (6.00) | | (6.00) | |
| | | | | | | | |
| Potentially dilutive securities(b) | 26 | | | | 45 | | | | 41 | | |
(a) Represents accretion adjustment of redeemable noncontrolling interests in our Additive business within our Aviation segment.For the year ended December 31, 2023, included $(58) million related to excise tax on preferred share redemptions.
(b) Outstanding stock awards not included in the computation of diluted earnings (loss) per share because their effect was antidilutive.
Our unvested restricted stock unit awards that contain non-forfeitable rights to dividends or dividend equivalents are considered participating securities and, therefore, are included in the computation of earnings per share pursuant to the two-class method. For the year ended December 31, 2020,2023, application of this treatment had an insignificant effect. For the years ended December 31, 20192022 and 2018,2021, as a result of excess dividends in respect to the current period earnings,loss from continuing operations, losses were not allocated to the participating securities.
NOTE 19. OTHER INCOME (LOSS)
| | | | | | | | | | | |
| 2020 | 2019 | 2018 |
| Purchases and sales of business interests(a) | $ | 12,468 | | $ | 3 | | $ | 1,234 | |
| Licensing and royalty income | 161 | | 256 | | 218 | |
| Equity method income | 27 | | 206 | | 21 | |
| Net interest and investment income(b) | (1,546) | | 1,220 | | 562 | |
| Other items | 334 | | 515 | | 282 | |
| GE Industrial | 11,444 | | 2,200 | | 2,317 | |
| Eliminations | (57) | | 22 | | 4 | |
| Total | $ | 11,387 | | $ | 2,222 | | $ | 2,321 | |
| | | | | | | | | | | | | | |
| | | | |
| | | | 2023 | 2022 | 2021 |
| | | | | | |
| | | | | | |
| | | | | | |
| Investment in GE HealthCare realized and unrealized gain (loss) | | | | $ | 5,639 | | $ | — | | $ | — | |
| Investment in and note with AerCap realized and unrealized gain (loss) | | | | 129 | | (865) | | 711 | |
| Investment in Baker Hughes realized and unrealized gain (loss) | | | | 10 | | 912 | | 938 | |
| Gains (losses) on retained and sold ownership interests | | | | $ | 5,778 | | $ | 47 | | $ | 1,649 | |
| | | | | | |
| Other net interest and investment income (loss)(a) | | | | 739 | | 474 | | 585 | |
| Licensing and royalty income | | | | 244 | | 185 | | 175 | |
| Equity method income | | | | 237 | | 220 | | (123) | |
| Purchases and sales of business interests(b) | | | | 104 | | 60 | | (52) | |
| Other items | | | | 28 | | 185 | | 462 | |
| Total other income (loss) | | | | $ | 7,129 | | $ | 1,172 | | $ | 2,696 | |
(a)Included a pre-tax gain of $12,362 million on the sale of BioPharma in 2020. Included a pre-tax gain of $224 million on the sale of ServiceMax partially offset by charges to the valuation allowance on businesses classified as held for sale of $245 million in 2019. Included pre-tax gains of $737 million on the sale of Distributed Power, $681 million on the sale of Value-Based Care and $267 million on the sale of Industrial Solutions, partially offset by charges to the valuation allowance on businesses classified as held for sale of $554 million in 2018. See Note 2 for further information.
(b)Included a realized and unrealized pre-tax loss of $2,037 million and unrealized pre-tax gain of $793 million related to our interest in Baker Hughes in 2020 and 2019, respectively. Included interest income associated with customer advances of $146$156 million, $143$162 million and $136$167 million in 2020, 20192023, 2022 and 2018,2021, respectively. See Notes 3, 9Note 8 for further information.
(b) Included a pre-tax loss of $170 million related to the sale of our boiler manufacturing business in China in our Power segment in 2021.
Our investment in GE HealthCare comprises 61.6 million shares (approximately 13.5% ownership interest) at December 31, 2023. During the year ended December 31, 2023, we received total proceeds of $2,192 million from the disposition of GE HealthCare shares. During the year ended December 31, 2023, we received total proceeds of $6,587 million from the sale of our remaining AerCap shares, leaving an AerCap senior note as our only remaining position. During the first quarter of 2023, we received proceeds of $216 million from the sale of Baker Hughes shares and 26.have now fully monetized our position.
NOTE 20. RESTRUCTURING CHARGES AND SEPARATION COSTS
RESTRUCTURING AND OTHER CHARGES. This table is inclusive of all restructuring charges in our segments and at Corporate, and the charges are shown below for the business where they originated. Separately, in our reported segment results, significant, higher-cost restructuring programs are excluded from measurement of segment operating performance for internal and external purposes; those excluded amounts are reported in Restructuring and other charges for Corporate.
| | | | | | | | | | | | | | |
| | | | |
| RESTRUCTURING AND OTHER CHARGES | | | | 2023 | 2022 | 2021 |
| Workforce reductions | | | | $ | 392 | | $ | 281 | | $ | 568 | |
| Plant closures & associated costs and other asset write-downs | | | | 258 | | 533 | | 117 | |
| Acquisition/disposition net charges and other | | | | 56 | | 30 | | (21) | |
| Total restructuring and other charges | | | | $ | 706 | | $ | 845 | | $ | 664 | |
| | | | | | |
| Cost of equipment/services | | | | $ | 157 | | $ | 206 | | $ | 348 | |
| Selling, general and administrative expenses | | | | 549 | | 669 | | 390 | |
| Other (income) loss | | | | — | | (31) | | (75) | |
| Total restructuring and other charges | | | | $ | 706 | | $ | 845 | | $ | 664 | |
| | | | | | |
| Aerospace | | | | $ | 13 | | $ | 20 | | $ | 70 | |
| Renewable Energy | | | | 296 | | 177 | | 204 | |
| Power | | | | 107 | | 155 | | 369 | |
| Corporate | | | | 290 | | 494 | | 20 | |
| Total restructuring and other charges(a) | | | | $ | 706 | | $ | 845 | | $ | 664 | |
| Restructuring and other charges cash expenditures(b) | | | | $ | 508 | | $ | 415 | | $ | 683 | |
(a) Includes $303 million, $366 million and $114 million primarily in non-cash impairment, accelerated depreciation and other charges for the years ended December 31, 2023, 2022 and 2021, respectively, not reflected in the liability table below.
(b) Primarily for employee severance payments, contract and lease terminations.
An analysis of changes in the liability for restructuring follows:
| | | | | | | | | | | | | | |
| | | | |
| | | | 2023 | 2022 | 2021 |
| Balance at beginning of period | | | | $ | 977 | | $ | 825 | | $ | 1,065 | |
| Additions | | | | 403 | | 479 | | 550 | |
| Payments | | | | (351) | | (310) | | (570) | |
| Remeasurement | | | | (42) | | 15 | | (169) | |
| Effect of foreign currency and other | | | | (69) | | (32) | | (51) | |
| Balance at December 31(a) | | | | $ | 918 | | $ | 977 | | $ | 825 | |
(a) Includes actuarial determined post-employment severance benefits reserve of $324 million, $348 million and $321 million as of December 31, 2023, 2022 and 2021, respectively.
In 2023 and 2022, restructuring primarily included exit activities related to the restructuring programs announced in 2022, reflecting lower Corporate shared-service and footprint needs as a result of the GE HealthCare spin-off, and exit activities across our businesses planned to be part of GE Vernova, primarily reflecting the selectivity strategy to operate in fewer markets and to simplify and standardize product variants at Renewable Energy. This plan was expanded during the third quarter of 2023 to include the consolidation of the global footprint and related resources at our Power business to better serve our customers.
In 2021, restructuring primarily included exit activities at our Power business related to our new coal build wind-down actions, which included the exit of certain product lines, closing certain manufacturing and office facilities and other workforce reduction programs.
SEPARATION COSTS. In November 2021, the company announced its plan to form three industry-leading, global public companies focused on the growth sectors of aviation, healthcare, and energy. As a result of this plan, we have incurred and expect to continue to incur separation, transition, and operational costs, which will depend on specifics of the transactions.
For the year ended December 31, 2023, we incurred pre-tax separation expense of $978 million and paid $1,059 million in cash, primarily related to employee costs, professional fees, costs to establish certain stand-alone functions and information technology systems, and other transformation and transaction costs to transition to stand-alone public companies. These costs are presented as separation costs in our consolidated Statement of Earnings (Loss). In addition, we recognized $197 million of net tax benefit, primarily associated with planned legal entity separation and tax on changes to indefinite reinvestment of foreign earnings.
GE 20202023 FORM 10-K93 73
For the year ended December 31, 2022, we incurred pre-tax separation costs of $715 million, and paid $158 million in cash, and recognized $16 million of net tax benefit, related to separation activities.
As discussed in Note 2, GE completed the separation of its HealthCare business into a separate, independent publicly traded company, GE HealthCare Technologies Inc. As a result, pre-tax separation costs specifically identifiable to GE HealthCare are now reflected in discontinued operations. We incurred $22 million and $258 million in pre-tax costs, recognized $5 million and $54 million of tax benefit and spent $182 million and $103 million in cash related to GE HealthCare for the year ended December 31, 2023 and 2022, respectively.
NOTE 20.21. FAIR VALUE MEASUREMENTS
Our assets and liabilities measured at fair value on a recurring basis include debt securities mainly supporting obligations to annuitants and policyholders in our run-off insurance operations, our remaining equity interestinterests in Baker HughesGE HealthCare and AerCap and derivatives.
| | ASSETS AND LIABILITIES MEASURED AT FAIR VALUE ON A RECURRING BASIS | ASSETS AND LIABILITIES MEASURED AT FAIR VALUE ON A RECURRING BASIS | |
| Level 1 | Level 2 | Level 3(a) | Netting
adjustment(d) | Net balance(b) |
| Level 1 | |
| Level 1 | |
| Level 1 | | Level 2 | Level 3(a) | Netting
adjustment(d) | Net balance(b) |
| December 31 | December 31 | 2020 | 2019 | 2020 | 2019 | 2020 | 2019 | 2020 | 2019 | 2020 | 2019 | December 31 | 2023 | 2022 | 2023 | 2022 | 2023 | 2022 | 2023 | 2022 | 2023 | 2022 |
| Investment securities | Investment securities | $ | 7,319 | | $ | 9,704 | | $ | 36,684 | | $ | 33,606 | | $ | 5,866 | | $ | 5,210 | | $ | — | | $ | — | | $ | 49,868 | | $ | 48,521 | |
| Derivatives | Derivatives | 0 | | 0 | | 3,057 | | 2,561 | | 8 | | 11 | | (2,582) | | (1,832) | | 483 | | 740 | |
| Total assets | Total assets | $ | 7,319 | | $ | 9,704 | | $ | 39,741 | | $ | 36,167 | | $ | 5,874 | | $ | 5,221 | | $ | (2,582) | | $ | (1,832) | | $ | 50,352 | | $ | 49,261 | |
| | Derivatives | Derivatives | $ | 0 | | $ | 0 | | $ | 1,112 | | $ | 834 | | $ | 7 | | $ | 19 | | $ | (752) | | $ | (651) | | $ | 367 | | $ | 202 | |
| Derivatives | |
| Derivatives | |
| Other(c) | Other(c) | 0 | | 0 | | 780 | | 807 | | 0 | | 0 | | — | | — | | 780 | | 807 | |
| Total liabilities | Total liabilities | $ | 0 | | $ | 0 | | $ | 1,892 | | $ | 1,641 | | $ | 7 | | $ | 19 | | $ | (752) | | $ | (651) | | $ | 1,147 | | $ | 1,009 | |
(a)Included debt securities classified within Level 3 of $4,185$3,873 million of U.S. corporate and $976debt securities, $1,491 million of Mortgage and asset-backed debt securities, and the $944 million AerCap note at December 31, 2020, and $3,9772023. Included $3,548 million of U.S. corporate and $330debt securities, $1,386 million of GovernmentMortgage and agenciesasset-backed debt securities, and the $900 million AerCap note at December 31, 2019.2022.
(b)Included investment securities in our run-off Insurance operations of $37,592 million and $35,503 million as of December 31, 2023 and 2022, respectively, which are Level 2 and 3. See Notes 3 and 2122 for further information on the composition of our investment securities and derivative portfolios.
(c)Primarily represents the liabilities associated with certain of our deferred incentive compensation plans.
(d)The netting of derivative receivables and payables is permitted when a legally enforceable master netting agreement exists. Amounts include fair value adjustments related to our own and counterparty non-performance risk.
LEVEL 3 INSTRUMENTS. The majority of our Level 3 balances comprised debt securities classified as available-for-sale with changes in fair value recorded in Other comprehensive income.
| | Balance at
January 1 | Net realized/unrealized gains(losses)(a) | Purchases(b) | Sales & Settlements | Transfers
into
Level 3 | Transfers
out of
Level 3 | Balance at
December 31 |
| 2020 | |
| Balance at
January 1 | | | Balance at
January 1 | Net realized/unrealized gains(losses)(a) | Purchases(b) | Sales & Settlements | Transfers
into
Level 3 | Transfers
out of
Level 3 | Balance at
December 31 |
| 2023 | |
| Investment securities | |
| Investment securities | |
| Investment securities | Investment securities | $ | 5,210 | | $ | 357 | | $ | 1,301 | | $ | (958) | | $ | 2 | | $ | (45) | | $ | 5,866 | |
| | 2019 | |
| 2022 | |
| | 2022 | |
| | 2022 | |
| Investment securities | |
| Investment securities | |
| Investment securities | Investment securities | $ | 4,013 | | $ | 399 | | $ | 2,159 | | $ | (1,308) | | $ | 0 | | $ | (53) | | $ | 5,210 | |
|
(a)Primarily included net unrealized gains (losses) of $323$134 million and $404$(994) million in Other comprehensive income for the years ended December 31, 20202023 and 2019,2022, respectively.
(b)Included $745$379 million of U.S. corporate debt securities and $177 million of Mortgage and asset-backed securities for the year ended December 31, 2020, and $975 million of U.S. corporate debt securities for the year ended December 31, 2019.2023. Included $508 million of U.S. corporate debt securities and $302 million of Mortgage and asset-backed debt securities for the year ended December 31, 2022.
Substantially allThe majority of these Level 3 securities are fair valued using non-binding broker quotes or other third-party sources that utilize a number of different unobservable inputs not subject to meaningful aggregation.
NOTE 21.22. FINANCIAL INSTRUMENTSINSTRUMENTS.
The following table provides information about assets and liabilities not carried at fair value and excludes finance leases, equity securities without readily determinable fair value and non-financial assets and liabilities. Substantially all of these assets are considered to be Level 3 and the vast majority of our liabilities’ fair value are considered Level 2.
| | | | | | | | | | | | | | | | | |
| December 31, 2020 | | December 31, 2019 |
| Carrying
amount
(net) | Estimated
fair value | | Carrying
amount
(net) | Estimated
fair value |
| Assets | | | | | |
| Loans and other receivables | $ | 3,842 | | $ | 3,970 | | | $ | 4,113 | | $ | 4,208 | |
| | | | | |
| Liabilities | | | | | |
| Borrowings (Note 11) | $ | 75,067 | | $ | 86,171 | | | $ | 90,882 | | $ | 97,754 | |
| Investment contracts (Note 12) | 2,049 | | 2,547 | | | 2,191 | | 2,588 | |
The higher fair value in relation to carrying value for borrowings at December 31, 2020 compared to December 31, 2019 was driven
primarily by a decline in market interest rates. Unlike the carrying amount, the estimated fair value of borrowings included $898 million and $1,106 million of accrued interest at December 31, 2020 and 2019, respectively. | | | | | | | | | | | | | | | | | | | | |
| | December 31, 2023 | | December 31, 2022 |
| Carrying
amount
(net) | Estimated
fair value | | Carrying
amount
(net) | Estimated
fair value |
| Assets | Loans and other receivables | $ | 2,438 | | $ | 2,379 | | | $ | 2,557 | | $ | 2,418 | |
| | | | | | |
| Liabilities | Borrowings (Note 10) | $ | 20,965 | | $ | 20,689 | | | $ | 24,059 | | $ | 22,849 | |
| Investment contracts (Note 12) | 1,535 | | 1,616 | | | 1,708 | | 1,758 | |
Assets and liabilities that are reflected in the accompanying financial statements at fair value are not included in the above disclosures; such items include cash and equivalents, investment securities and derivative financial instruments.
DERIVATIVES AND HEDGING. Our policy requires that derivatives are used solely for managing risks and not for speculative purposes. Total gross notional was $95,874 million ($45,672 million in GE CapitalWe use derivatives to manage currency risks related to foreign exchange, and $50,202 million in GE Industrial) and $98,018 million ($55,704 million in GE Capital and $42,314 million in GE Industrial) at December 31, 2020 and 2019, respectively. GE Capital notional relates primarily to managing interest rate and currency risk between financial assets and liabilities, and GE Industrial notional relates primarily to managing currency risks related to foreign exchange, certain equity investments and commodity prices.
GE Industrial and GE CapitalWe use cash flow hedges primarily to reduce or eliminate the effects of foreign exchange rate changes. In addition, GE Capital useschanges, net investment hedges to
hedge investments in foreign operations as well as fair value hedges to hedge the effects of interest rate and currency changes on debt
it has issued as well as net investment hedges to hedge investments in foreign operations. Both GE Industrial and GE Capitalissued. We also use derivatives not designated as hedges from an accounting standpoint (and therefore we do not apply hedge
accounting to the relationship) but otherwise serve the same economic purpose as other hedging arrangements. We use economic
hedges when we have exposures to currency exchange risk for which we are unable to meet the requirements for hedge accounting or
when changes in the carrying amount of the hedged item are already recorded in earnings in the same period as the derivative making
hedge accounting unnecessary. Even though the derivative is an effective economic hedge, there may be a net effect on earnings in
each period due to differences in the timing of earnings recognition between the derivative and the hedged item.
| | | | | | | | | | | | | | | | | | | | | | | |
| FAIR VALUE OF DERIVATIVES | December 31, 2020 | | December 31, 2019 |
| Gross Notional | All other assets | All other liabilities | | Gross Notional | All other assets | All other liabilities |
| Interest rate contracts | $ | 20,500 | | $ | 1,912 | | $ | 7 | | | $ | 23,918 | | $ | 1,636 | | $ | 11 | |
| Currency exchange contracts | 7,512 | | 165 | | 128 | | | 7,044 | | 99 | | 46 | |
| | | | | | | |
| Derivatives accounted for as hedges | $ | 28,011 | | $ | 2,077 | | $ | 135 | | | $ | 30,961 | | $ | 1,734 | | $ | 57 | |
| | | | | | | |
| Interest rate contracts | $ | 448 | | $ | 6 | | $ | 1 | | | $ | 3,185 | | $ | 18 | | $ | 12 | |
| Currency exchange contracts | 65,379 | | 764 | | 913 | | | 62,165 | | 697 | | 744 | |
| Other contracts | 2,036 | | 218 | | 71 | | | 1,706 | | 123 | | 40 | |
| Derivatives not accounted for as hedges | $ | 67,863 | | $ | 988 | | $ | 983 | | | $ | 67,056 | | $ | 838 | | $ | 796 | |
| | | | | | | |
| Gross derivatives | $ | 95,874 | | $ | 3,065 | | $ | 1,118 | | | $ | 98,018 | | $ | 2,572 | | $ | 853 | |
| | | | | | | |
| Netting and credit adjustments | | $ | (647) | | $ | (647) | | | | $ | (546) | | $ | (546) | |
| Cash collateral adjustments | | (1,935) | | (104) | | | | (1,286) | | (105) | |
| Net derivatives recognized in Statement of Financial Position | | $ | 483 | | $ | 367 | | | | $ | 740 | | $ | 202 | |
| | | | | | | |
| Net accrued interest | | $ | 0 | | $ | 0 | | | | $ | 182 | | $ | 1 | |
| Securities held as collateral | | (2) | | 0 | | | | (469) | | 0 | |
| Net amount | | $ | 480 | | $ | 367 | | | | $ | 452 | | $ | 203 | |
It is standard market practice to post or receive cash collateral with our derivative counterparties in order to minimize counterparty exposure. Included in GE Capital cash, cash equivalents and restricted cash was total net cash collateral received on derivatives of $3,289 million (comprising $4,203 million received and $914 million posted) at December 31, 2020, and $1,584 million (comprising $2,294 million received and $710 million posted) at December 31, 2019. Of these amounts, $1,968 million and $695 million at December 31, 2020 and December 31, 2019, respectively, were received on interest rate derivatives traded through clearing houses, which are recorded as a reduction of derivative assets.
Also included in total net cash collateral received are amounts presented as cash collateral adjustments in the table above, amounts related to accrued interest on interest rate derivatives presented as a reduction of Net accrued interest of $292 million and $207 million at December 31, 2020 and December 31, 2019, respectively, and excess net cash collateral posted of $802 million (comprising $3 million received and $805 million posted) at December 31, 2020, and $499 million (comprising $104 million received and $603 million posted) at December 31, 2019, which are excluded from cash collateral adjustments in the table above.
Securities held as collateral excluded excess collateral received of 0 and $27 million at December 31, 2020 and December 31, 2019, respectively. In the third quarter of 2020, one of our counterparties converted its collateral from securities to cash, which is in line with our other derivative counterparties.
Fair value of derivatives in our consolidated Statement of Financial Position excludes accrued interest. | | | | | | | | | | | | | | | | | | | | | | | |
| FAIR VALUE OF DERIVATIVES | December 31, 2023 | | December 31, 2022 |
| Gross Notional | All other current assets | All other current liabilities | | Gross Notional | All other current assets | All other current liabilities |
| Qualifying currency exchange contracts | $ | 6,648 | | $ | 156 | | $ | 91 | | | $ | 5,112 | | $ | 132 | | $ | 146 | |
| Non-qualifying currency exchange contracts and other | 50,563 | | 794 | | 580 | | | 52,786 | | 1,143 | | 1,095 | |
| Gross derivatives | $ | 57,211 | | $ | 950 | | $ | 671 | | | $ | 57,898 | | $ | 1,275 | | $ | 1,241 | |
| Netting and credit adjustments | | $ | (512) | | $ | (510) | | | | $ | (821) | | $ | (820) | |
| Net derivatives in statement of financial position | | $ | 437 | | $ | 161 | | | | $ | 454 | | $ | 420 | |
| | | | | | | |
| | | | | | | |
| | | | | | | |
| | | | | | | |
FAIR VALUE HEDGES.We use derivatives to hedge the effects As of interest rate and currency exchange rate changes on our borrowings. At December 31, 2020,2023, all fair value hedges were terminated. Gains (losses) associated with the terminated hedging relationships will continue to amortize into interest expense until the hedged borrowings mature. The cumulative amount of hedging adjustments of $5,687$1,162 million (including $2,248 million(all on discontinued hedging relationships) was included in the carrying amount of the previously hedged liability of $29,374$9,253 million. At December 31, 2019,2022, the cumulative amount of hedging adjustments of $4,234$1,240 million (including $2,458 million(all on discontinued hedging relationships) was included in the carrying amount of the previously hedged liability of $42,759$9,933 million. The cumulative amount of hedging adjustments was primarily recorded in long-term borrowings.borrowings.
| | | | | | | | | | | | | | |
| CASH FLOW HEDGES AND NET INVESTMENT HEDGES | | | | | | |
| | | Gain (loss) recognized in AOCI for the year ended December 31 |
| | | | 2023 | 2022 | 2021 |
| Cash flow hedges(a) | | | | $ | 83 | | $ | (242) | | $ | (140) | |
| Net investment hedges(b) | | | | (153) | | 341 | | 487 | |
CASH FLOW HEDGES. We use cash flow hedging primarily(a) Primarily related to reduce or eliminate the effectscurrency exchange contracts.
(b) The carrying value of foreign exchange rate changes on purchase and sale contracts in our industrial businesses and to convert foreign currency debt that we have issued in our financial services business back to our functional currency. designated as net investment hedges was $4,726 million and $3,329 million as of December 31, 2023 and 2022, respectively. The total reclassified from AOCI into earnings was zero, zero and $(87) million for the years ended December 31, 2023, 2022 and 2021, respectively.
Changes in the fair value of cash flow hedges are recorded in AOCI and recorded in earnings in the period in which the hedged transaction occurs. The gain (loss) recognized in AOCI was $(61) million, $25 million and $(154) million for the years ended December 31, 2020, 2019 and 2018, respectively. The gain (loss) reclassified from AOCI to earnings was $(7) million, $(60) million and $(102) million for the years ended December 31, 2020, 2019 and 2018, respectively. These amounts were primarily related to currency exchange and interest rate contracts.
The total amount in AOCI related to cash flow hedges of forecasted transactions was a $16$2 million gain atloss as of December 31, 2020.2023. We expect to reclassify $32$6 million of loss to earnings in the next 12 months contemporaneously with the earnings effects of the related forecasted transactions. For all periods presented we recognized an immaterial amount related to hedged forecasted transactions and firm commitments that did not occur by the endAs of the originally specified period. At December 31, 2020, 2019 and 2018,2023, the maximum term of derivative instruments that hedge forecasted transactions was 14 years, 13 years and 14 years, respectively.
NET INVESTMENT HEDGES. We invest in foreign operations that conduct their financial services activities in currencies other than the U.S. dollar. We hedge the currency risk associated with those investments primarily using non-derivative instruments such as debt denominated in a foreign currency and short-term currency exchange contracts under which we receive U.S. dollars and pay foreign currency. For these hedges, the portion of the fair value changes of the derivatives or debt instruments that relates to changes in spot currency exchange rates is recorded in a separate component of AOCI. The portion of the fair value changes of the derivatives related to differences between spot and forward rates is recorded in earnings each period. The amounts recorded in AOCI affect earnings if the hedged investment is sold, substantially liquidated, or control is lost.
The total gain (loss) recognized in AOCI on hedging instruments for the years ended December 31, 2020, 2019 and 2018 was $(675) million, $120 million and $646 million, respectively, comprising $(41) million, $(36) million and $162 million on currency exchange contracts and $(633) million, $156 million and $484 million on foreign currency debt, respectively. For all periods presented we recognized an immaterial amount excluded from assessment and recognized in earnings.
The carrying value of foreign currency debt designated as net investment hedges was $8,348 million, $9,190 million and $12,458 million at December 31, 2020, 2019 and 2018 respectively. The total reclassified from AOCI into earnings was 0, $7 million and $(1) million for the years ended December 31, 2020, 2019 and 2018, respectively.
EFFECTS OF DERIVATIVES ON EARNINGS. All derivatives are marked to fair value on our Statement of Financial Position, whether they are designated in a hedging relationship for accounting purposes or are used as economic hedges. For derivatives not designated as hedging instruments, substantially all of the gain or loss recognized in earnings is offset by either the current period change in value of underlying exposures which is recorded in earnings in the current period or a future period when the recording of the exposures occurs.approximately 12 years.
The table below presents the effecteffects of hedges and resulting gains (losses) of our derivative financial instruments in the consolidated Statement of Earnings (Loss):
| | | | | | | | | | | | | | | | | | | | | | | | | | | | | | | | | | | |
| 2020 | | 2019 |
| Revenues | Cost of sales | Interest Expense | SG&A | Other Income | | Revenues | Cost of sales | Interest Expense | SG&A | Other Income |
Total amounts presented in
the consolidated Statement
of Earnings (Loss) | $ | 79,619 | | $ | 60,421 | | $ | 3,273 | | $ | 12,621 | | $ | 11,387 | | | $ | 95,214 | | $ | 66,911 | | $ | 4,227 | | $ | 13,949 | | $ | 2,222 | |
| | | | | | | | | | | |
Total effect of cash flow hedges | $ | 88 | | $ | (56) | | $ | (40) | | $ | 1 | | $ | 0 | | | $ | 5 | | $ | (24) | | $ | (37) | | $ | (3) | | $ | 0 | |
| | | | | | | | | | | |
| Hedged items | | | $ | (1,775) | | | | | | | $ | (1,276) | | | |
Derivatives designated as hedging instruments | | | 1,743 | | | | | | | 1,229 | | | |
Total effect of fair value hedges | | | $ | (31) | | | | | | | $ | (48) | | | |
| | | | | | | | | | | |
| Interest rate contracts | $ | (35) | | $ | 0 | | $ | (11) | | $ | 0 | | $ | 8 | | | $ | (24) | | $ | 0 | | $ | (50) | | $ | 0 | | $ | (6) | |
| Currency exchange contracts | (328) | | 16 | | 0 | | 129 | | 19 | | | 180 | | (35) | | 0 | | (6) | | (59) | |
| Other | 0 | | 0 | | 0 | | 86 | | (46) | | | (2) | | 0 | | 195 | | 0 | | 7 | |
Total effect of derivatives not designated as hedges | $ | (362) | | $ | 16 | | $ | (11) | | $ | 215 | | $ | (19) | | | $ | 154 | | $ | (35) | | $ | 145 | | $ | (6) | | $ | (58) | |
| | | | | | | | | | | | | | | | | | | | | | | | | | | | | | | | |
| 2023 | | 2022 |
| Revenues | Interest Expense | SG&A(b) | Other Income(a) | | Revenues | Debt
extinguishment
costs | Interest Expense | SG&A(b) | Other Income(a) |
| $ | 67,954 | | $ | 1,118 | | $ | 9,195 | | $ | 57,521 | | | $ | 58,100 | | $ | 465 | | $ | 1,477 | | $ | 9,173 | | $ | 45,444 | |
| Cash flow hedges | $ | (1) | | $ | (10) | | $ | 1 | | $ | 39 | | | $ | (23) | | | $ | (20) | | $ | (2) | | $ | (100) | |
| Fair value hedges | | $ | — | | | | | | | $ | (16) | | | |
| Non-hedging derivatives | $ | — | | $ | — | | $ | 130 | | $ | (167) | | | $ | 7 | | $ | 159 | | $ | (4) | | $ | (269) | | $ | (485) | |
The gain(a) Amounts are inclusive of cost of sales and other income (loss) excluded for cash flow hedges was $25 million and $(1) million for the years ended December 31, 2020 and 2019, respectively. This amount is recognized primarily in Revenues in our consolidated Statement of Earnings (Loss).
GE 20202023 FORM 10-K96 75
COUNTERPARTY CREDIT RISK.We manage the risk that counterparties will default and not make payments to us according to the terms of our agreements on an individual counterparty basis. Where we have agreed to netting of derivative exposures with a counterparty, we net our exposures with that counterparty and apply the value of collateral posted to us to determine the exposure. We actively monitor these net exposures against defined limits and take appropriate actions in response, including requiring additional collateral. Our exposures to counterparties (including accrued interest), net of collateral we held, was $388were $374 million and $368$306 million at December 31, 20202023 and 2019,December 31, 2022, respectively. Counterparties' exposures to our derivative liability (including accrued interest), net of collateral posted by us, was $304were $120 million and $159$365 million at December 31, 20202023 and 2019,December 31, 2022, respectively.
NOTE 22.23. VARIABLE INTEREST ENTITIES. In addition to the 3 VIEs detailed in Note 4, in our consolidated Statement of Financial Position, we have additional consolidated VIEs with assets of $1,888$117 million and $1,740$401 million and liabilities of $812$203 million and $943$206 million inclusive of intercompany eliminations, at December 31, 20202023 and 2019, respectively.December 31, 2022, respectively, in consolidated Variable Interest Entities (VIEs). These entities were created to help our customers facilitate or finance the purchase of GE equipment and services and have no features that could expose us to losses that would significantly exceed the difference between the consolidated assets and liabilities. Substantially all the assets of our consolidated VIEs at December 31, 2020 can only be used to settle the liabilities of those VIEs.
Our investments in unconsolidated VIEs were $3,378$6,657 million and $1,937$5,917 million at December 31, 20202023 and 2019,December 31, 2022, respectively. TheseOf these investments, are primarily owned by GE Capital businesses of which $1,141$1,272 million and $621$1,481 million were owned by EFS and comprised ofEnergy Financial Services (EFS), comprising equity method investments, primarily renewable energy tax equity investments, at December 31, 20202023 and 2019,December 31, 2022, respectively. In addition, $1,833$5,151 million and $896$4,219 million were owned by our run-off insurance operations, primarily comprising investment securities,equity method investments at December 31, 20202023 and 2019,December 31, 2022, respectively. The increase in investments in unconsolidated VIEs in our run-off insurance operations reflects implementation of our revised reinvestment plan which incorporates the introduction of strategic initiatives to invest in higher-yielding asset classes. Our maximum exposure to loss in respect of unconsolidated VIEs is increased by our commitments to make additional investments in these entities described in Note 23.24.
NOTE 23.24. COMMITMENTS, GUARANTEES, PRODUCT WARRANTIES AND OTHER LOSS CONTINGENCIES
COMMITMENTS.The GECAS business within our Capital segment has placed multiple-year orders with various Boeing, Airbus and other aircraft manufacturers with list prices approximating $26,760 million, excluding pre-delivery payments made in advance (including 279 new aircraft with delivery dates of 25% in 2021, 14% in 2022 and 61% in 2023 through 2026) and secondary orders with airlines for used aircraft of approximately $1,985 million (including 43 used aircraft with delivery dates of 72% in 2021, 21% in 2022 and 7% in 2023) at December 31, 2020. When we purchase aircraft, it is at a contractual price, which is usually less than the aircraft manufacturer’s list price. As of December 31, 2020, we have made $2,871 million of pre-delivery payments to aircraft manufacturers.
During 2020, GECAS agreed with Boeing to restructure its 737 MAX orderbook including previously canceled positions, resulting in 77 orders now remaining.
GE Capital We had total investment commitments of $1,957$3,809 million and unfunded lending commitments, primarily at EFS, of $651 million at December 31, 2020.2023. The investment commitments primarily comprise project financing investments in thermal and wind energy projects of $684 million and investments by our run-off insurance operations in investment securities and other assets of $1,249$3,662 million and included within these commitments are obligations to make additional investments in unconsolidated VIEs of $549 million and $1,047 million, respectively.$3,545 million. See Note 2223 for further information.
As of December 31, 2020,2023, in our AviationAerospace segment, we have committed to provide financing assistance of $1,935$2,676 million of future customer acquisitions of aircraft equipped with our engines.
GUARANTEES. Credit support. At December 31, 2020, we were committed under the following guarantee arrangements:
Credit Support. At December 31, 2020, weWe have provided $1,525$916 million of credit support on behalf of certain customers or associated companies, predominantly joint ventures and partnerships, using arrangements such as standby letters of credit and performance guarantees. The liability for such credit support was $46$21 million.
Indemnification Agreementsagreements – Continuing OperationsOperations. . At December 31, 2020,GE has obligations under the Tax Matters Agreement to indemnify GE HealthCare for certain tax costs and other indemnifications of $41 million, which are fully reserved. In addition, we have $1,455$289 million of other indemnification commitments, including representations and warranties in sales of businesses orbusiness assets, for which we recorded a liability of $142$70 million.
Indemnification Agreements –agreements - Discontinued Operations.Operations At December 31, 2020,. Following the Separation of GE HealthCare on January 3, 2023, GE has remaining performance and bank guarantees on behalf of its former HealthCare business, with a maximum aggregate exposure of $44 million. GE also has obligations under the Transition Services Agreement and Tax Matters Agreement to indemnify GE HealthCare for certain technology and tax costs of $81 million, which are fully reserved. In addition, we have provided specific indemnities to other buyers of GE Capital’s assets of our business that, in the aggregate, represent a maximum potential claim of $630$721 million with the related reserves of $104$71 million.
PRODUCT WARRANTIES.We provide for estimated product warranty expenses when we sell the related products. Because warranty estimates are forecasts that are based on the best available information, mostly historical claims experience, claims costs may differ from amounts provided. An analysis of changes in the liability for product warranties follows.
| | 2020 | 2019 | 2018 |
| 2023 | | | 2023 | 2022 | 2021 |
| Balance at January 1 | Balance at January 1 | $ | 2,165 | | $ | 2,192 | | $ | 2,103 | |
| Current-year provisions | 788 | | 713 | | 945 | |
| Current-year provisions(a) | |
| Expenditures | Expenditures | (913) | | (715) | | (788) | |
| Other changes | Other changes | 14 | | (26) | | (69) | |
| Balance at December 31 | Balance at December 31 | $ | 2,054 | | $ | 2,165 | | $ | 2,192 | |
a) The increase in current and prior-year provisions is primarily related to Renewable Energy which, in 2022, was substantially all due to changes in estimates on pre-existing warranties and related to the deployment of repairs and other corrective measures.
GE 2020 FORM 10-K
97
LEGAL MATTERS.In the normal course of our business, we are involved from time to time in various arbitrations, class actions, commercial litigation, investigations and other legal, regulatory or governmental actions, including the significant matters described below that could have a material impact on our results of operations. In many proceedings, including the specific matters described below, it is inherently difficult to determine whether any loss is probable or even reasonably possible or to estimate the size or range of the possible loss, and accruals for legal matters are not recorded until a loss for a particular matter is considered probable and reasonably estimable. Given the nature of legal matters and the complexities involved, it is often difficult to predict and determine a meaningful estimate of loss or range of loss until we know, among other factors, the particular claims involved, the likelihood of success of our defenses to those claims, the damages or other relief sought, how discovery or other procedural considerations will affect the outcome, the settlement posture of other parties and other factors that may have a material effect on the outcome. For these matters, unless otherwise specified, we do not believe it is possible to provide a meaningful estimate of loss at this time. Moreover, it is not uncommon for legal matters to be resolved over many years, during which time relevant developments and new information must be continuously evaluated.
Alstom legacy legal matters. On November 2,In 2015, we acquired the Thermal,Steam Power, Renewables and Grid businesses from Alstom. PriorAlstom, which prior to theour acquisition the seller waswere the subject of 2 significant cases involving anti-competitive activities and improper payments: (1) in January 2007, Alstom was fined €65payments. We had reserves of $393 million by the European Commission for participating in a gas insulated switchgear cartel that operated from 1988 to 2004 (that fine was later reduced to €59 million), and (2) in$455 million at December 2014, Alstom pled guilty in the United States to multiple violations of the Foreign Corrupt Practices Act31, 2023 and paid a criminal penalty of $772 million. As part of GE’s accounting for the acquisition, we established a reserve amounting to $858 million2022, respectively, for legal and compliance matters related to the legacy business practices that were the subject of these and related cases in various jurisdictions, including the previously reported legal proceedingsjurisdictions. Allegations in Slovenia that are described below. The reserve balance was $858 million and $875 million at December 31, 2020 and December 31, 2019, respectively.
Regardless of jurisdiction, the allegationsthese cases relate to claimed anti-competitive conduct or improper payments in the pre-acquisition period as the source of legal violations and/or damages. Given the significant litigation and compliance activity related to these matters and our ongoing efforts to resolve them, it is difficult to assess whether the disbursements will ultimately be consistent with the reserve established. The estimation of this reserve involved significant judgment and may not reflect the full range of uncertainties and unpredictable outcomes inherent in litigation and investigations of this nature, and at this time we are unable to develop a meaningful estimate of the range of reasonably possible additional losses beyond the amount of this reserve. Damages sought may include disgorgement of profits on the underlying business transactions, fines and/or penalties, interest, or other forms of resolution. Factors that can affect the ultimate amount of losses associated with these and related matters include the way cooperation is assessed and valued, prosecutorial discretion in the determination of damages, formulas for determining disgorgement, fines andor penalties, the duration and amount of legal and investigative resources applied, political and social influences within each jurisdiction, and tax consequences of any settlements or previous deductions, among other considerations. Actual losses arising from claims in these and related matters could exceed the amount provided.
In connection with alleged improper payments by Alstom relating to contracts won in 2006 and 2008 for work on a state-owned power plant in Šoštanj, Slovenia, the power plant owner in January 2017 filed an arbitration claim for damages of approximately $430 million before the International Chamber of Commerce Court of Arbitration in Vienna, Austria. In February 2017, a government investigation in Slovenia of the same underlying conduct proceeded to an investigative phase overseen by a judge of the Celje District Court. In September 2020, the relevant Alstom legacy entity was served with an indictment, which we had anticipated as we are working with the parties to resolve these matters.
Shareholder and related lawsuits. Since November 2017, several putative shareholder class actions under the federal securities laws have beenwere filed against GE and certain affiliated individuals and consolidated into a single action currently pending in the U.S. District Court for the Southern District of New York (the Hachem case, also referred to as the Sjunde AP-Fonden case). In October 2019, the lead plaintiff filed a fifth amended consolidated class actionThe complaint naming asagainst defendants GE and current and former GE executive officers. It allegesofficers alleged violations of Sections 10(b) and 20(a) and Rule 10b-5 of the Securities Exchange Act of 1934 related to insurance reserves and accounting for long-term service agreements and seeks damages on behalf of shareholders who acquired GE stock between February 27, 2013 and January 23, 2018. GE filed a motion to dismiss in December 2019. In January 2021, the court granted defendants’the motion to dismiss as to the majority of the claims. Specifically, the court dismissed all claims related to insurance reserves, as well as all claims related to accounting for long-term service agreements, with the exception of certain claims about historic disclosures related to factoring in the Power business that survive as to GE and its former CFO Jeffrey S. Bornstein. All other individual defendants have been dismissed from the case. In addition,April 2022, the court granted the plaintiffs' motion for class certification for shareholders who acquired stock between February 26, 2016 and January 23, 2018. In September 2022, GE filed a motion for summary judgment on the plaintiffs' remaining claims. In September 2023, the court denied the plaintiffs’ requestGE’s motion for summary judgment, except as to amend their complaint again.claims arising from disclosures made between November 2017 and January 2018.
Since February 2018, multiple shareholder derivative lawsuits have also beenwere filed against current and former GE executive officers and members of GE’s Board of Directors and GE (as nominal defendant). NaN shareholder derivative lawsuits are currently pending: the Bennett case, which was filed in Massachusetts state court; the Cuker, Lindsey, Priest and Tola cases, which were filed in New York state court; and the Burden case, which was filed in the U.S. District Court for the Southern District of New York. These lawsuits have alleged violations of securities laws, breaches of fiduciary duties, unjust enrichment, waste of corporate assets, abuse of control and gross mismanagement, although the specific matters underlying the allegations in the lawsuits have varied. Two shareholder derivative lawsuits are currently pending: the Lindsey and Priest/Tola cases, which were filed in New York state court. The allegations in the Bennett, Lindsey, Priest, Tola and Burdenthese two cases relate to substantially the same facts as those underlying the securities class action described above, and the allegations in the Cuker case relate to alleged corruption in China.Sjunde AP-Fonden case. The plaintiffs seek unspecified damages and improvements in GE’s corporate governance and internal procedures. The Bennett case has been stayed pending final resolution of another shareholder derivative lawsuit (the Gammel case) that was previously dismissed. In August 2019, the Cuker plaintiffs filed an amended complaint, and GE in September 2019 filed a motion to dismiss the amended complaint. The Lindsey case has been stayed by agreement of the parties.
In June 2018, a lawsuit (the Bezio case) was filed in New York state court derivatively on behalf of participants in GE’s 401(k) plan (the GE Retirement Savings Plan (RSP)),parties, and alternatively as a class action on behalf of shareholders who acquired GE stock between February 26, 2013 and January 24, 2018, alleging violations of Section 11 of the Securities Act of 1933 based on alleged misstatements and omissions related to insurance reserves and performance of GE’s business segments in a GE RSP registration statement and documents incorporated therein by reference. In November 2018, the plaintiffs filed an amended derivative complaint naming as defendants GE, former GE executive officers and Fidelity Management Trust Company, as trustee for the GE RSP. In January 2019, GE filed a motion to dismiss andthe Priest/Tola complaint in November 2019, the court dismissed the remaining claims and the plaintiffs filed a notice of appeal. In December 2019, the plaintiffs filed a second amended derivative complaint, and in January 2020, GE filed a motion to dismiss. In December 2020, the court granted GE's motion to dismiss and dismissed the second amended complaint with prejudice.March 2021.
In July 2018, a putative class action (the Mahar case) was filed in New York state court naming as defendants GE, former GE executive officers, a former member of GE’s Board of Directors and KPMG. It alleged violations of Sections 11, 12 and 15 of the Securities Act of 1933 based on alleged misstatements related to insurance reserves and performance of GE’s business segments in GE Stock Direct Plan registration statements and documents incorporated therein by reference and seeks damages on behalf of shareholders who acquired GE stock between July 20, 2015 and July 19, 2018 through the GE Stock Direct Plan. In February 2019, this case was dismissed. In March 2019, plaintiffs filed an amended derivative complaint naming the same defendants. In April 2019, GE filed a motion to dismiss the amended complaint.dismiss. In October 2019, the court denied GE's motion to dismiss and stayed the case pending the outcome of the HachemSjunde AP-Fonden case. In November 2019, the plaintiffs moved to re-argue to challenge the stay, and GE cross-moved to re-argue the denial of the motion to dismiss and filed a notice of appeal. The court denied both motions for re-argument, and in November 2020, the Appellate Division First Department affirmed the court's denial of GE's motion to dismiss. In January 2021, GE filed a motion for leave to appeal to the New York Court of Appeals.
In October 2018, a putative class action (the Houston case)Appeals, and that motion was fileddenied in New York state court naming as defendants GE, certain GE subsidiaries and current and former GE executive officers and employees. It alleges violations of Sections 11, 12 and 15 of the Securities Act of 1933 and seeks damages on behalf of purchasers of senior notes issued in 2016 and rescission of transactions involving those notes. This case has been stayed pending resolution of the motion to dismiss the Hachem case.
In December 2018, a putative class action (the Varga case) was filed in the U.S. District Court for the Northern District of New York naming GE and a former GE executive officer as defendants in connection with the oversight of the GE RSP. It alleges that the defendants breached fiduciary duties under the Employee Retirement Income Security Act of 1974 (ERISA) by failing to advise GE RSP participants that GE Capital insurance subsidiaries were allegedly under-reserved and continued to retain a GE stock fund as an investment option in the GE RSP. The plaintiffs seek unspecified damages on behalf of a class of GE RSP participants and beneficiaries from January 1, 2010 through January 19, 2018 or later. In April 2019, GE filed a motion to dismiss. In March 2020, the court granted GE’s motion to dismiss the case, and in February 2021, the Second Circuit in the plaintiffs' appeal affirmed the lower court's dismissal.
In February 2019, 2 putative class actions (the Birnbaum case and the Sheet Metal Workers Local 17 Trust Funds case) were filed in the U.S. District Court for the Southern District of New York naming as defendants GE and current and former GE executive officers. In April 2019, the court issued an order consolidating these two actions. In June 2019, the lead plaintiff filed an amended consolidated complaint. It alleges violations of Section 10(b) and 20(a) of the Securities Exchange Act of 1934 based on alleged misstatements regarding GE's H-class turbines and goodwill related to GE's Power business. The lawsuit seeks damages on behalf of shareholders who acquired GE stock between December 4, 2017 and December 6, 2018. In August 2019, the lead plaintiff filed a second amended complaint. In September 2019, GE filed a motion to dismiss the second amended complaint. In May 2020, the court granted GE's motion to dismiss the case, and in February 2021, the Second Circuit in the plaintiffs' appeal affirmed the lower court's dismissal.
In February 2019, a securities action (the Touchstone case) was filed in the U.S. District Court for the Southern District of New York naming as defendants GE and current and former GE executive officers. It alleges violations of Sections 10(b) and 20(a) of the Securities Exchange Act of 1934 and Section 1707.43 of the Ohio Securities Act and common law fraud based on alleged misstatements regarding insurance reserves, GE Power’s revenue recognition practices related to long term service agreements, GE’s acquisition of Alstom, and the goodwill recognized in connection with that transaction. The lawsuit seeks damages on behalf of 6 institutional investors who purchased GE common stock between August 1, 2014 and October 30, 2018 and rescission of those purchases. This case has been stayed pending resolution of the motion to dismiss the Hachem case.2021.
As previously reported by Baker Hughes, in March 2019, 2 derivative lawsuits were filed in the Delaware Court of Chancery naming as defendants GE, directors of Baker Hughes (including former members of GE’s Board of Directors and current and former GE executive officers) and Baker Hughes (as nominal defendant), and the court issued an order consolidating these two actions (the Schippnick case). The complaint as amended in May 2019 alleges, among other things, that GE and the Baker Hughes directors breached their fiduciary duties and that GE was unjustly enriched by entering into transactions and agreements related to GE's sales of approximately 12% of its ownership interest in Baker Hughes in November 2018. The complaint seeks declaratory relief, disgorgement of profits, an award of damages, pre- and post-judgment interest and attorneys’ fees and costs. In May 2019, the plaintiffs voluntarily dismissed their claims against the directors who were members of the Baker Hughes Conflicts Committee and a former Baker Hughes director. In October 2019, the Court denied the remaining defendants’ motions to dismiss, except with respect to the unjust enrichment claim against GE, which has been dismissed. In November 2019, the defendants filed their answer to the complaint, and a special litigation committee of the Baker Hughes Board of Directors moved for an order staying all proceedings in this action pending completion of the committee's investigation of the allegations and claims asserted in the complaint. In October 2020, the special litigation committee filed a report with the Court recommending that the derivative action be terminated.
In August 2019, a putative class action (the Tri-State case) was filed in the Delaware Court of Chancery naming as defendants GE and the former Board of Directors of Baker Hughes Incorporated (BHI). It alleges fraud, aiding and abetting breaches of fiduciary duty, and aiding and abetting breaches of duty of disclosure by GE based on allegations regarding financial statements that GE provided the former BHI board, management and shareholders in connection with BHI’s merger with GE’s Oil and Gas Business in July 2017. The plaintiff seeks damages on behalf of BHI shareholders during the period between October 7, 2016 and July 5, 2017. In October 2019, the City of Providence filed a complaint containing allegations substantially similar to those in the Tri-State complaint. The cases were consolidated in November 2019, and in December 2019, the plaintiffs filed an amended consolidated complaint which is similar to the prior complaints but does not include fraud claims against GE. In February 2020, GE and the other defendants filed a motion to dismiss the amended consolidated complaint. In October 2020, the court dismissed all claims asserted against GE, allowing only the claim against the former BHI CEO to move forward.
SEC investigation. As previously reported in a Form 8-K filing on December 9, 2020, GE reached a settlement with the SEC in connection with the SEC investigation that we had previously disclosed. Consistent with common SEC practice, GE neither admits nor denies the findings in the administrative order that the SEC issued in connection with the settlement. Under the terms of the settlement, GE in December 2020 paid a civil penalty of $200 million and consented to an order requiring it to cease and desist from violations of specified provisions of the federal securities laws and rules promulgated thereunder. In addition, GE agreed to cooperation obligations and to report during a one-year period to the SEC about compliance related to its Power business and GE Capital’s run-off insurance operations.
The SEC's order contains findings related to disclosures with respect to GE’s Power business during the 2015–2017 time period and disclosures and internal controls with respect to GE Capital’s run-off insurance operations during the third quarter of 2015 through the first quarter of 2017. The settlement concluded and resolved the SEC investigation of GE in its entirety.
The SEC’s order makes no allegation that prior period financial statements were misstated. This settlement did not require corrections or restatements of GE’s previously reported financial statements, and GE stands behind its financial reporting.
GE cooperated with the SEC over the course of its investigation. As noted in the order, GE has taken a number of steps since the time periods covered by the investigation to enhance its investor disclosures regarding power and insurance trends and risks, as well as enhancing internal controls on its insurance premium deficiency testing (also known as loss recognition testing) process and adding disclosure controls and procedures concerning its insurance liabilities.
Other GE Retirement Savings Plan class actions.actions NaN. In 2017, four putative class action lawsuits have beenwere filed regarding the oversight of the GE RSP, and those class actions have beenwere consolidated into a single action in the U.S. District Court for the District of Massachusetts. The consolidated complaint namesnamed as defendants GE, GE Asset Management, current and former GE and GE Asset Management executive officers and employees who served on fiduciary bodies responsible for aspects of the GE RSP during the class period. Like similar lawsuits that have beenwere brought against other companies in recent years, this action allegesalleged that the defendants breached their fiduciary duties under ERISAthe Employee Retirement Income Security Act (ERISA) in their oversight of the GE RSP, principally by retaining 5five proprietary funds that plaintiffs allegealleged were underperforming as investment options for plan participants and by charging higher management fees than some alternative funds. The plaintiffs seeksought unspecified damages on behalf of a class of GE RSP participants and beneficiaries from September 26, 2011 through the date of any judgment. In August and December 2018, the court issued orders dismissing 1one count of the complaint and denying GE's motion to dismiss the remaining counts. We believe we have defenses toIn September 2022, both GE and the claims and are responding accordingly.plaintiffs filed motions for summary judgment on the remaining claims. In September 2023, GE executed a class action settlement with plaintiffs in the amount of $61 million, which the court preliminarily approved in October 2023 with a hearing on final approval scheduled for March 2024. Net of insurance contributions, this had an immaterial financial impact that GE recognized in its results for the quarter ended September 30, 2023.
Bank BPH. BPH. As previously reported, GE Capital’s subsidiary Bank BPH, along with other Polish banks, has been subject to ongoing litigation in Poland related to its portfolio of floating rate residential mortgage loans, with cases brought by individual borrowers seeking relief related to their foreign currency-denominatedcurrency indexed or denominated mortgage loans in various courts throughout Poland. At December 31, 2020, approximately 87%For a number of the Bank BPH portfolio is indexed to or denominated in foreign currencies (primarily Swiss francs), and the total portfolio had a carrying value of $2,437 million. We continue to observeyears, GE has observed an increase in the total number of lawsuits being brought against Bank BPH and other banks in Poland by current and former borrowers, and we expect this is likely to continue in future reporting periods. As previously reported, GE and Bank BPH approved the adoption of a settlement program and recorded an additional charge of $1,014 million in the quarter ended June 30, 2023. The estimate of total losses for borrower litigation at Bank BPH as of December 31, 2023 was $2,669 million.
WeThe estimate potentialof total losses for borrower litigation at Bank BPH as of December 31, 2023 accounts for the costs of payments to borrowers who we estimate will participate in connection with borrower litigation cases that are pending by recording legal reserves,the settlement program, as well as estimates for the results of litigation with other borrowers, which in connection with potential future cases or other adverse developments as part of our ongoing valuationeither case can exceed the value of the Bank BPH portfolio, whichcurrent loan balance. This estimate represents our best estimate of the total losses we record atexpect to incur over time. However, there are a number of factors that could affect the lowerestimate in the future, including: potentially significant judicial decisions or binding resolutions by the European Court of costJustice (ECJ) or fair value, lessthe Polish Supreme Court, including a ruling by the ECJ in June 2023 that could significantly increase the cost to sell. At December 31, 2020,banks of loans invalidated by Polish courts and encourage more borrower lawsuits; the total amountimpact of any such estimated losses was $315 million. We have updated our assumptions underlying this amountdecisions or resolutions on how Polish courts will interpret and apply the law in particular cases; the receptivity of borrowers over time in response to the trends we have previously reported of there being an increase inBank BPH’s settlement program; the number of lawsuits filed, more findingsactive and inactive borrowers who sue Bank BPH; the ability of liability and more severe remedies being ordered against Polish banks, including Bank BPH. We also expect these trends to continue in future reporting periods, although Bank BPH isto recover from borrowers the original principal amount of loans invalidated by Polish courts; and the impact of potential future legislation in Poland relating to foreign currency indexed or denominated mortgage loans. While we are unable at this time to develop a meaningful estimate of reasonably possible losses associated with active and inactive Bank BPH mortgage loans beyond the amountsamount currently recorded. These estimates involve significant judgment, including assumptions about the number of borrowers that will file lawsuits, whether liability will be established in lawsuits and the nature of the remedy that a court will order if liability is established, as well as the following factors: uncertainty related to how Polish courts will interpret and apply prior judicial decisions; the pendency of potentially significant judicial decisions that we anticipate will be issued in the first half of 2021, including a decision by the European Court of Justice (ECJ) on the case involving a Bank BPH mortgage loan that was referred to the ECJ in January 2020 and one or more binding resolutions from the Polish Supreme Court; uncertainty related to a proposal by the Chairman of the Polish Financial Supervisory Authority in December 2020 that banks voluntarily offer borrowers an opportunity to convert their foreign currency-denominated mortgage loans to Polish zlotys using an exchange rate applicable at the date of loan origination, and about the approaches that other Polish banks will adopt in response to this proposal; and uncertainty arising from a decision of the Polish Office of Competition and Consumer Protection (UOKiK) in December 2020 which found that certain foreign exchange clauses that appear in certain of Bank BPH’s mortgage loan agreements are unfair contractual terms under Polish law. Future adverse developmentsrecorded, future changes related to any of these factors,the foregoing or in Bank BPH’s settlement approach, or other factorsadverse developments such as potential regulatoryactions by regulators, legislators or legislative relief across the Polish banking industry,other governmental authorities (including consumer protection regulators), could have a material adverse effect onincrease our estimate of total losses and potentially require future cash contributions to Bank BPH and the carrying value of its mortgage loan portfolio and could result in significant losses beyond the amount that we currently estimate.BPH. See Note 2 for further information.
ENVIRONMENTAL, HEALTH AND SAFETY MATTERS. MATTERS.Our operations, like operations of other companies engaged in similar businesses, involve the use, disposal and cleanup of substances regulated under environmental protection laws and nuclear decommissioning regulations. We record reserves for obligations for ongoing and future environmental remediation activities, such as the Housatonic River cleanup described below, and for additional liabilities we expect to incur in connection with previously remediated sites, such as natural resource damages for the Hudson River where GE completed dredging in 2019. Additionally, like many other industrial companies, we and our subsidiaries are defendants in various lawsuits related to alleged worker exposure by workers and others to asbestos or other hazardous materials. Liabilities for environmental remediation, nuclear decommissioning and worker exposure claims exclude possible insurance recoveries. It is reasonably possible that our exposure will exceed amounts accrued. However, due to uncertainties about the status of laws, regulations, technology and information related to individual sites and lawsuits, such amounts are not reasonably estimable. Total reserves related to environmental remediation, nuclear decommissioning and worker exposure claims were $2,569$2,465 million and $2,484$2,415 million at December 31, 20202023 and 2019,2022, respectively.
As previously reported, inIn 2000, GE and the Environmental Protection Agency (EPA) entered into a consent decree relating to PCB cleanup of the Housatonic River in Massachusetts. Following the EPA’s release in September 2015 of an intended final remediation decision, GE and the EPA engaged in mediation and the first step of the dispute resolution process contemplated by the consent decree. In October 2016, the EPA issued its final decision pursuant to the consent decree, which GE and several other interested parties appealed to the EPA’s Environmental Appeals Board (EAB). The EAB issued its decision in January 2018, affirming parts of the EPA’s decision and granting relief to GE on certain significant elements of its challenge. The EAB remanded the decision back to the EPA to address those elements and reissue a revised final remedy, and the EPA convened a mediation process with GE and interested stakeholders. In February 2020, the EPA announced an agreement between the EPA and many of the mediation stakeholders, including GE, concerning a revised Housatonic River remedy. BasedIn March 2021, two local environmental advocacy groups filed a joint petition to the EAB challenging portions of the revised permit; in February 2022, the EAB denied the petition, and the permit became effective in March 2022. In May 2022, the two environmental advocacy groups petitioned the U.S. Court of Appeals for the First Circuit to review the EPA’s final permit. The Court's denial of this petition in July 2023 was not appealed, concluding these proceedings on the mediated resolution, the EPA solicited public comment on a draft permit in July 2020 and issued the final revised permit effective January 4, 2021.EPA’s remedy. As of December 31, 2020,2023, and based on its assessment of current facts and circumstances, and its defenses, GE believes that it has recorded adequate reserves to cover future obligations associated with the proposedEPA's final remedy.
Expenditures for site remediation, nuclear decommissioning and worker exposure claims amounted to approximately $247$260 million, $236$220 million and $214$181 million for the years ended December 31, 2020, 20192023, 2022 and 2018,2021, respectively. We presently expect that such expenditures will be approximately $350 million and $240$200 million in 2021both 2024 and 2022, respectively.
NOTE 24. INTERCOMPANY TRANSACTIONS
Presented below is a walk of intercompany eliminations from the combined GE Industrial and GE Capital totals to the consolidated cash flows for continuing operations. | | | | | | | | | | | |
| 2020 | 2019 | 2018 |
| Combined GE Industrial and GE Capital cash from (used for) operating activities | $ | 2,240 | | $ | 6,495 | | $ | 2,282 | |
| GE Industrial current receivables sold to GE Capital(a) | (597) | | 1,081 | | 5 | |
| GE Industrial long-term receivables sold to GE Capital(b) | 312 | | 468 | | 1,079 | |
| Supply chain finance programs(c) | 2,002 | | 2,289 | | (18) | |
| | | |
| Other reclassifications and eliminations | (360) | | 86 | | (138) | |
| Consolidated cash from (used for) operating activities | $ | 3,597 | | $ | 10,419 | | $ | 3,210 | |
| | | |
| Combined GE Industrial and GE Capital cash from (used for) investing activities | $ | 25,960 | | $ | 13,509 | | $ | 14,915 | |
| GE Industrial current receivables sold to GE Capital | 496 | | (1,677) | | (839) | |
| GE Industrial long-term receivables sold to GE Capital(b) | (312) | | (468) | | (1,079) | |
| Supply chain finance programs(c) | (2,002) | | (2,289) | | 18 | |
| GE Capital loans to GE Industrial | 0 | | 0 | | 6,479 | |
| Repayment of GE Capital loans by GE Industrial | (9,049) | | (1,523) | | 0 | |
| Capital contribution from GE Industrial to GE Capital | 2,000 | | 4,000 | | 0 | |
| Other reclassifications and eliminations | (315) | | (868) | | (570) | |
| Consolidated cash from (used for) investing activities | $ | 16,778 | | $ | 10,684 | | $ | 18,925 | |
| | | |
| Combined GE Industrial and GE Capital cash from (used for) financing activities | $ | (27,678) | | $ | (14,665) | | $ | (22,408) | |
| GE Industrial current receivables sold to GE Capital | 102 | | 596 | | 835 | |
| | | |
| | | |
| GE Capital loans to GE Industrial | 0 | | 0 | | (6,479) | |
| Repayment of GE Capital loans by GE Industrial | 9,049 | | 1,523 | | 0 | |
| Capital contribution from GE Industrial to GE Capital | (2,000) | | (4,000) | | 0 | |
| Other reclassifications and eliminations | 675 | | 782 | | 706 | |
| Consolidated cash from (used for) financing activities | $ | (19,853) | | $ | (15,764) | | $ | (27,345) | |
(a) Included the elimination of $14,677 million, $14,716 million and $20,675 million payments to GE Industrial for current receivables purchased and retained by GE Capital and the related reclassification to CFOA of $14,079 million, $15,797 million and $20,680 million due to GE Capital collections and other activity in our consolidated Statement of Cash Flows for the years ended December 31, 2020, 2019 and 2018, respectively.
(b) Primarily included the reclassification of long-term receivables purchased and retained by GE Capital to current receivables.
(c) Represents the elimination of net payments from GE Industrial to GE Capital related to the funded participation in a supply chain finance program with GE Capital. The reduction of the GE Industrial liability associated with this program is primarily as a result of GE Capital's sale of the program platform to MUFG Union Bank, N.A. (MUFG) in 2019.2025.
NOTE 25. OPERATING SEGMENTS
BASIS FOR PRESENTATION. Our operating businesses are organized based on the nature of markets and customers. Segment accounting policies are the same as described and referenced in Note 1. Segment results for our financial services businesses reflect the discrete tax effect of transactions.
A description of our operating segments as of December 31, 20202023 can be found in the Segment OperationOperations section within MD&A.
| | | | | | | | | | | | | | | | | | | | | | | | | | | | | | | | | | | |
| REVENUES | Total revenues(a) | | Intersegment revenues(b)(c) | | External revenues |
| Years ended December 31 | 2020 | 2019 | 2018 | | 2020 | 2019 | 2018 | | 2020 | 2019 | 2018 |
| Power | $ | 17,589 | | $ | 18,625 | | $ | 22,150 | | | $ | 352 | | $ | 357 | | $ | 152 | | | $ | 17,237 | | $ | 18,267 | | $ | 21,997 | |
| Renewable Energy | 15,666 | | 15,337 | | 14,288 | | | 142 | | 139 | | 186 | | | 15,523 | | 15,198 | | 14,102 | |
| Aviation | 22,042 | | 32,875 | | 30,566 | | | 1,445 | | 758 | | 375 | | | 20,597 | | 32,117 | | 30,191 | |
| Healthcare | 18,009 | | 19,942 | | 19,784 | | | 1 | | 0 | | 0 | | | 18,008 | | 19,942 | | 19,784 | |
| Capital | 7,245 | | 8,741 | | 9,551 | | | 566 | | 971 | | 1,384 | | | 6,679 | | 7,770 | | 8,167 | |
Corporate items and eliminations | (932) | | (305) | | 673 | | | (2,507) | | (2,225) | | (2,097) | | | 1,575 | | 1,920 | | 2,770 | |
| Total | $ | 79,619 | | $ | 95,214 | | $ | 97,012 | | | $ | — | | $ | — | | $ | — | | | $ | 79,619 | | $ | 95,214 | | $ | 97,012 | |
(a)Revenues of GE Industrial businesses include income from sales of goods and services to customers.
(b)Sales from one component to another generally are priced at equivalent commercial selling prices.
(c)The increase in intersegment revenues in 2020 at Aviation is primarily driven by higher sales to the Aeroderivative joint venture between our Power segment and Baker Hughes, partially offset by lower spare sales to our GECAS business.
The equipment and services revenues classification in the table below is consistent with our segment MD&A presentation.
| | | | | | | | | | | | | | | | | | | | | | | | | | | | | | | | | | | |
| REVENUES | Total revenues | | Intersegment revenues | | External revenues |
| Years ended December 31 | 2023 | 2022 | 2021 | | 2023 | 2022 | 2021 | | 2023 | 2022 | 2021 |
| Aerospace | $ | 31,770 | | $ | 26,050 | | $ | 21,310 | | | $ | 708 | | $ | 660 | | $ | 1,036 | | | $ | 31,062 | | $ | 25,390 | | $ | 20,274 | |
| | | | | | | | | | | |
| Renewable Energy | 15,050 | | 12,977 | | 15,697 | | | 76 | | 80 | | 138 | | | 14,974 | | 12,896 | | 15,559 | |
| Power | 17,731 | | 16,262 | | 16,903 | | | 180 | | 267 | | 345 | | | 17,551 | | 15,995 | | 16,558 | |
| Corporate | 3,403 | | 2,812 | | 2,559 | | | (965) | | (1,008) | | (1,519) | | | 4,367 | | 3,819 | | 4,078 | |
| Total | $ | 67,954 | | $ | 58,100 | | $ | 56,469 | | | $ | — | | $ | — | | $ | — | | | $ | 67,954 | | $ | 58,100 | | $ | 56,469 | |
GE 20202023 FORM 10-K102 78
| | | | | | | | | | | | | | | | | | | | | | | | | | | | | | | | | | | |
| Years ended December 31 |
| 2020 | | 2019 | | 2018 |
| Equipment | Services | Total | | Equipment | Services | Total | | Equipment | Services | Total |
| Power | $ | 6,707 | | $ | 10,883 | | $ | 17,589 | | | $ | 6,247 | | $ | 12,378 | | $ | 18,625 | | | $ | 8,077 | | $ | 14,073 | | $ | 22,150 | |
| Renewable Energy | 12,859 | | 2,807 | | 15,666 | | | 12,267 | | 3,069 | | 15,337 | | | 11,419 | | 2,870 | | 14,288 | |
| Aviation | 8,582 | | 13,460 | | 22,042 | | | 12,737 | | 20,138 | | 32,875 | | | 11,499 | | 19,067 | | 30,566 | |
| Healthcare | 9,992 | | 8,017 | | 18,009 | | | 11,585 | | 8,357 | | 19,942 | | | 11,422 | | 8,363 | | 19,784 | |
| Corporate items and industrial eliminations | (520) | | 314 | | (206) | | | 243 | | 697 | | 940 | | | 1,263 | | 987 | | 2,250 | |
| Total GE Industrial revenues | $ | 37,620 | | $ | 35,480 | | $ | 73,100 | | | $ | 43,080 | | $ | 44,639 | | $ | 87,719 | | | $ | 43,679 | | $ | 45,359 | | $ | 89,038 | |
| | | | | | | | | | | | | | | | | |
| SEGMENT REVENUES | Years ended December 31 |
| 2020 | | 2019 | | 2018 |
| Gas Power | $ | 12,655 | | | $ | 13,122 | | | $ | 13,296 | |
| Power Portfolio | 4,935 | | | 5,503 | | | 8,853 | |
| Power | $ | 17,589 | | | $ | 18,625 | | | $ | 22,150 | |
| | | | | |
| Onshore Wind | $ | 10,881 | | | $ | 10,421 | | | $ | 8,220 | |
| Grid Solutions equipment and services | 3,585 | | | 4,016 | | | 4,579 | |
| Hydro, Offshore Wind and Hybrid Solutions | 1,200 | | | 900 | | | 1,489 | |
| Renewable Energy | $ | 15,666 | | | $ | 15,337 | | | $ | 14,288 | |
| | | | | |
| Commercial Engines & Services | $ | 13,017 | | | $ | 24,217 | | | $ | 22,724 | |
| Military | 4,572 | | | 4,389 | | | 4,103 | |
| Systems & Other | 4,453 | | | 4,269 | | | 3,740 | |
| Aviation | $ | 22,042 | | | $ | 32,875 | | | $ | 30,566 | |
| | | | | |
| Healthcare Systems | $ | 15,387 | | | $ | 14,648 | | | $ | 14,886 | |
| Pharmaceutical Diagnostics | 1,792 | | | 2,005 | | | 1,888 | |
| BioPharma | 830 | | | 3,289 | | | 3,010 | |
| Healthcare | $ | 18,009 | | | $ | 19,942 | | | $ | 19,784 | |
| | | | | |
| Corporate items and industrial eliminations | $ | (206) | | | $ | 940 | | | $ | 2,250 | |
| Total GE Industrial revenues | 73,100 | | | 87,719 | | | 89,038 | |
| Capital(a) | $ | 7,245 | | | $ | 8,741 | | | $ | 9,551 | |
| GE Capital-GE Industrial eliminations | (726) | | | (1,245) | | | (1,577) | |
| Consolidated revenues | $ | 79,619 | | | $ | 95,214 | | | $ | 97,012 | |
(a) Substantially all of our revenues at GE Capital are outside of the scope of ASC 606. | | | | | | | | | | | | | | | | | | | | | | | | | | | | | | | | | | | |
| Years ended December 31 |
| 2023 | | 2022 | | 2021 |
| Equipment | Services | Total | | Equipment | Services | Total | | Equipment | Services | Total |
| Aerospace | $ | 9,319 | | $ | 22,451 | | $ | 31,770 | | | $ | 7,842 | | $ | 18,207 | | $ | 26,050 | | | $ | 7,531 | | $ | 13,780 | | $ | 21,310 | |
| | | | | | | | | | | |
| Renewable Energy | 12,625 | | 2,425 | | 15,050 | | | 10,191 | | 2,785 | | 12,977 | | | 13,224 | | 2,473 | | 15,697 | |
| Power | 5,396 | | 12,335 | | 17,731 | | | 4,737 | | 11,526 | | 16,262 | | | 5,035 | | 11,868 | | 16,903 | |
| Total segment revenues | $ | 27,340 | | $ | 37,211 | | $ | 64,551 | | | $ | 22,770 | | $ | 32,518 | | $ | 55,289 | | | $ | 25,789 | | $ | 28,121 | | $ | 53,910 | |
Revenues are classified according to the region to which productsequipment and services are sold. For purposes of this analysis, the U.S. is presented separately from the remainder of the Americas.
| | | | | | | | | | | | | | | | | | | | | | | |
| Year ended December 31, 2020 | Power | Renewable Energy | Aviation | Healthcare | Capital | Corporate items and eliminations | Total |
| U.S. | $ | 6,186 | | $ | 7,846 | | $ | 11,239 | | $ | 7,611 | | $ | 3,550 | | $ | (1,117) | $ | 35,314 | |
| Non-U.S. | | | | | | | |
| Europe | 2,895 | | 3,047 | | 4,288 | | 3,952 | | 1,395 | | 155 | 15,733 | |
| Asia | 3,961 | | 2,640 | | 3,920 | | 4,719 | | 997 | | (20) | 16,216 | |
| Americas | 1,483 | | 819 | | 882 | | 879 | | 639 | | (2) | 4,701 | |
| Middle East and Africa | 3,064 | | 1,314 | | 1,713 | | 848 | | 664 | | 52 | 7,655 | |
| Total Non-U.S. | $ | 11,403 | | $ | 7,820 | | $ | 10,803 | | $ | 10,398 | | $ | 3,695 | | $ | 185 | $ | 44,305 | |
| Total geographic revenues | $ | 17,589 | | $ | 15,666 | | $ | 22,042 | | $ | 18,009 | | $ | 7,245 | | $ | (932) | $ | 79,619 | |
| Non-U.S. revenues as a % of consolidated revenues | 65 | % | 50 | % | 49 | % | 58 | % | 51 | % | | 56 | % |
| | | | | | | | | | | | | | | | | | | | | | | |
| Year ended December 31, 2019 | Power | Renewable Energy | Aviation | Healthcare | Capital | Corporate items and eliminations | Total |
| U.S. | $ | 5,992 | | $ | 7,413 | | $ | 13,384 | | $ | 8,526 | | $ | 4,149 | | $ | (93) | $ | 39,372 | |
| Non-U.S. | | | | | | | |
| Europe | 3,140 | | 2,925 | | 7,452 | | 4,132 | | 1,577 | | (135) | 19,092 | |
| Asia | 4,018 | | 2,737 | | 6,641 | | 5,436 | | 1,454 | | (130) | 20,156 | |
| Americas | 1,915 | | 1,064 | | 1,593 | | 1,056 | | 742 | | (33) | 6,336 | |
| Middle East and Africa | 3,560 | | 1,198 | | 3,805 | | 792 | | 819 | | 86 | 10,259 | |
| Total Non-U.S. | $ | 12,633 | | $ | 7,924 | | $ | 19,491 | | $ | 11,416 | | $ | 4,592 | | $ | (212) | $ | 55,843 | |
| Total geographic revenues | $ | 18,625 | | $ | 15,337 | | $ | 32,875 | | $ | 19,942 | | $ | 8,741 | | $ | (305) | $ | 95,214 | |
| Non-U.S. revenues as a % of consolidated revenues | 68 | % | 52 | % | 59 | % | 57 | % | 53 | % | | 59 | % |
| | Year ended December 31, 2018 | |
| Years ended December 31 | |
| Years ended December 31 | |
| Years ended December 31 | | 2023 | | 2022 | | 2021 |
| Aerospace | | | Aerospace | | Renewable Energy | Power | | Corporate | Total | | Total |
| U.S. | U.S. | $ | 7,456 | | $ | 4,912 | | $ | 12,529 | | $ | 8,574 | | $ | 5,282 | | $ | 1,124 | $ | 39,876 | |
| Non-U.S. | Non-U.S. | | | |
| Europe | Europe | 4,538 | | 3,212 | | 7,027 | | 4,164 | | 1,383 | | (496) | 19,828 | |
| Asia | 4,072 | | 2,933 | | 5,787 | | 5,219 | | 1,368 | | (79) | 19,300 | |
| Europe | |
| Europe | |
| China region | |
| Asia (excluding China region) | |
| Americas | Americas | 2,546 | | 2,179 | | 1,459 | | 988 | | 632 | | 87 | 7,892 | |
| Middle East and Africa | Middle East and Africa | 3,538 | | 1,052 | | 3,764 | | 839 | | 886 | | 37 | 10,117 | |
| Total Non-U.S. | Total Non-U.S. | $ | 14,694 | | $ | 9,376 | | $ | 18,037 | | $ | 11,210 | | $ | 4,269 | | $ | (451) | $ | 57,136 | |
| Total geographic revenues | Total geographic revenues | $ | 22,150 | | $ | 14,288 | | $ | 30,566 | | $ | 19,784 | | $ | 9,551 | | $ | 673 | $ | 97,012 | |
| Non-U.S. revenues as a % of consolidated revenues | 66 | % | 66 | % | 59 | % | 57 | % | 45 | % | | 59 | % |
| Non-U.S. revenues as a % of total | | Non-U.S. revenues as a % of total | 58 | % | | 58 | % | 66 | % | | | 57 | % | | 57 | % | | 55 | % |
REMAINING PERFORMANCE OBLIGATION. As of December 31, 2020,2023, the aggregate amount of the contracted revenues allocated to our unsatisfied (or partially unsatisfied) performance obligations was $230,600$267,233 million. We expect to recognize revenue as we satisfy our remaining performance obligations as follows: 1) equipment-related remaining performance obligation of $45,991$54,675 million of which 58%44%, 80%68% and 98%92% is expected to be recognized within 1, 2 and 5 years, respectively, and the remaining thereafter; and 2) services-related remaining performance obligations of $184,608$212,558 million of which 14%12%, 45%42%, 65%66% and 81%82% is expected to be recognized within 1, 5, 10 and 15 years, respectively, and the remaining thereafter. Contract modifications could affect both the timing to complete as well as the amount to be received as we fulfill the related remaining performance obligations.
Total sales of goodsequipment and services to agencies of the U.S. Government were 7%, 5% and 5%8% of GE Industrialtotal revenues for the years ended December 31, 2020, 20192023, 2022 and 2018, respectively.2021. Within our AviationAerospace segment, defense-related sales were 6%, 5%7% and 4%7% of GE Industrialtotal revenues for the years ended December 31, 2020, 20192023, 2022 and 2018,2021, respectively.
| | | | | | | | | | | |
PROFIT AND EARNINGS For the years ended December 31 | 2020 | 2019 | 2018 |
| Power | $ | 274 | | $ | 291 | | $ | (1,105) | |
| Renewable Energy | (715) | | (791) | | 140 | |
| Aviation | 1,229 | | 6,812 | | 6,454 | |
| Healthcare | 3,060 | | 3,737 | | 3,522 | |
| | | |
| Capital | (1,710) | | (530) | | (489) | |
| Total segment profit | 2,138 | | 9,519 | | 8,521 | |
| Corporate items and eliminations | 8,239 | | (1,825) | | (2,201) | |
| GE Industrial goodwill impairments | (877) | | (1,486) | | (22,136) | |
| GE Industrial interest and other financial charges | (1,333) | | (2,115) | | (2,415) | |
| GE Industrial non-operating benefit costs | (2,424) | | (2,828) | | (2,740) | |
| GE Industrial provision for income taxes | (388) | | (1,309) | | (467) | |
| Earnings (loss) from continuing operations attributable to GE common shareholders | 5,355 | | (44) | | (21,438) | |
| Earnings (loss) from discontinued operations, net of taxes | (125) | | (5,335) | | (1,363) | |
| Less net earnings (loss) attributable to noncontrolling interests, discontinued operations | 0 | | 60 | | 1 | |
| Earnings (loss) from discontinued operations, net of taxes and noncontrolling interests | (125) | | (5,395) | | (1,364) | |
| Consolidated net earnings (loss) attributable to GE common shareholders | $ | 5,230 | | $ | (5,439) | | $ | (22,802) | |
| | | | | | | | | | | |
PROFIT AND EARNINGS For the years ended December 31 | 2023 | 2022 | 2021 |
| Aerospace | $ | 6,115 | | $ | 4,775 | | $ | 2,882 | |
| | | |
| Renewable Energy | (1,437) | | (2,240) | | (795) | |
| Power | 1,449 | | 1,217 | | 726 | |
| | | |
| Total segment profit (loss) | 6,126 | | 3,751 | | 2,812 | |
| Corporate(a) | 3,785 | | (2,875) | | 1,158 | |
| Interest and other financial charges | (1,073) | | (1,423) | | (1,727) | |
| Debt extinguishment costs | — | | (465) | | (6,524) | |
| Non-operating benefit income (cost) | 1,585 | | 409 | | (1,136) | |
| | | |
| Benefit (provision) for income taxes | (1,357) | | (210) | | 595 | |
| Preferred stock dividends | (295) | | (289) | | (237) | |
| Earnings (loss) from continuing operations attributable to GE common shareholders | 8,772 | | (1,100) | | (5,058) | |
| | | |
| | | |
| Earnings (loss) from discontinued operations attributable to GE common shareholders | 414 | | 1,151 | | (1,515) | |
| Net earnings (loss) attributable to GE common shareholders | $ | 9,186 | | $ | 51 | | $ | (6,573) | |
(a) Includes interest and other financial charges of $45 million, $54 million and $63 million and benefit for income taxes of $195 million, $213 million and $162 million related to EFS within Corporate for the years ended December 31, 2023, 2022, and 2021, respectively.
GE 20202023 FORM 10-K104 79
| | | | | | | | | | | | | | | | | | | | | | | |
| Interest and other financial charges | | Benefit (provision) for income taxes |
| For the years ended December 31 | 2020 | 2019 | 2018 | | 2020 | 2019 | 2018 |
| Capital | $ | 2,186 | | $ | 2,532 | | $ | 2,982 | | | $ | 862 | | $ | 582 | | $ | 374 | |
| Corporate items and eliminations(a) | 1,087 | | 1,695 | | 1,784 | | | (388) | | (1,309) | | (467) | |
| Total | $ | 3,273 | | $ | 4,227 | | $ | 4,766 | | | $ | 474 | | $ | (726) | | $ | (93) | |
(a)Included amounts for Power, Renewable Energy, Aviation and Healthcare, for which our measure of segment profit excludes interest and other financial charges and income taxes.
| | | | | | | | | | | | | | | | | | | | | | | | | | | | | | | | | | | |
| Assets | | Property, plant and
equipment additions(a) | | Depreciation and amortization(b) |
| At December 31 | | For the years ended December 31 | | For the years ended December 31 |
| 2020 | 2019 | 2018 | | 2020 | 2019 | 2018 | | 2020 | 2019 | 2018 |
| Power | $ | 24,453 | | $ | 26,731 | | $ | 27,389 | | | $ | 245 | | $ | 277 | | $ | 358 | | | $ | 749 | | $ | 880 | | $ | 1,307 | |
| Renewable Energy | 15,927 | | 15,935 | | 16,400 | | | 302 | | 455 | | 303 | | | 413 | | 425 | | 474 | |
| Aviation | 38,634 | | 41,083 | | 37,488 | | | 737 | | 1,031 | | 1,070 | | | 1,142 | | 1,150 | | 1,042 | |
| Healthcare | 22,229 | | 30,503 | | 28,037 | | | 256 | | 395 | | 378 | | | 628 | | 702 | | 832 | |
| Capital(c) | 113,526 | | 117,546 | | 119,329 | | | 1,765 | | 3,830 | | 4,569 | | | 2,590 | | 2,083 | | 2,163 | |
Corporate items and eliminations(d) | 35,151 | | 29,269 | | 18,043 | | | (51) | | (175) | | (46) | | | 494 | | 355 | | 763 | |
| Total continuing | $ | 249,920 | | $ | 261,068 | | $ | 246,686 | | | $ | 3,252 | | $ | 5,813 | | $ | 6,632 | | | $ | 6,018 | | $ | 5,595 | | $ | 6,582 | |
(a)Additions to property, plant and equipment include amounts relating to principal businesses purchased.
(b)Included amortization expense related to intangible assets.
(c)Included Capital deferred income taxes that are presented as assets for purposes of our balance sheet presentation.
(d)Included GE Industrial deferred income taxes that are presented as assets for purposes of our balance sheet presentation. | | | | | | | | | | | | | | | | | | | | | | | | | | | | | | | | | | | |
| Assets | | Property, plant and
equipment additions | | Depreciation and amortization |
| At December 31 | | For the years ended December 31 | | For the years ended December 31 |
| 2023 | 2022 | 2021 | | 2023 | 2022 | 2021 | | 2023 | 2022 | 2021 |
| Aerospace | $ | 39,985 | | $ | 39,243 | | $ | 38,298 | | | $ | 734 | | $ | 543 | | $ | 445 | | | $ | 1,089 | | $ | 1,037 | | $ | 1,074 | |
| | | | | | | | | | | |
| Renewable Energy | 15,936 | | 15,719 | | 14,804 | | | 389 | | 275 | | 349 | | | 388 | | 412 | | 432 | |
| Power | 23,255 | | 22,173 | | 23,569 | | | 348 | | 210 | | 189 | | | 478 | | 506 | | 692 | |
| Corporate | 82,175 | | 79,826 | | 97,301 | | | 22 | | 34 | | 25 | | | 125 | | 948 | | 160 | |
| Total continuing | $ | 161,351 | | $ | 156,961 | | $ | 173,972 | | | $ | 1,494 | | $ | 1,061 | | $ | 1,007 | | | $ | 2,080 | | $ | 2,903 | | $ | 2,359 | |
We classify certain assets that cannot meaningfully be associated with specific geographic areas as “Other Global” for this purpose.
| | | | | | | | |
| December 31 | 2020 | 2019 |
| U.S. | $ | 148,963 | | $ | 143,534 | |
| Non-U.S. | | |
| Europe | 58,301 | | 70,565 | |
| Asia | 20,630 | | 22,089 | |
| Americas | 10,795 | | 13,435 | |
| Other Global | 11,230 | | 11,445 | |
| Total Non-U.S. | $ | 100,956 | | $ | 117,534 | |
| Total assets (Continuing Operations) | $ | 249,920 | | $ | 261,068 | |
| | | | | | | | |
| December 31 | 2023 | 2022 |
| U.S. | $ | 105,676 | | $ | 112,371 | |
| Non-U.S. | | |
| Europe | 38,899 | | 26,875 | |
| Asia | 7,988 | | 8,054 | |
| Americas | 5,875 | | 5,796 | |
| Other Global | 2,912 | | 3,866 | |
| Total Non-U.S. | $ | 55,674 | | $ | 44,590 | |
| Total assets (continuing operations) | $ | 161,351 | | $ | 156,961 | |
The decreaseincrease in continuing assets in 20202023 was primarily driven by lower volume andhigher cash from net income, the impactretention of COVID-19, higher net repayment of borrowings, and funding of the GE Pension Plan. The sale of our BioPharma business caused a decreasean ownership interest in assets in different regions, but was more thanGEHC, partially offset by the proceeds from the sale in the U.S.
cash paid for share redemptions and repurchases and depreciation and amortization on property, plant and equipment and intangible assets. Property, plant and equipment – net associated with operations based in the United States were $13,010 million and $13,447 million at December 31, 2020 and 2019, respectively. Property, plant and equipment – net associated with operations based outside the United States were $31,651 millionwas approximately 4% and $32,432 million at3% and 3% and 4% of total continuing assets as of December 31, 20202023 and 2019,2022, respectively.
NOTE 26. BAKER HUGHES SUMMARIZED FINANCIAL INFORMATION.INFORMATION.We account for
As of September 14, 2023, our investment in AerCap ownership reduced below 20%, and as a result, we no longer have significant influence in AerCap. On November 16, 2023, we sold our remaining equity interest in Baker Hughes (comprising 349.4 million shares with 33.8% ownershipAerCap and a promissoryonly the note receivable as of December 31, 2020) at fair value.remains outstanding. The fair value of our interest in Baker HughesAerCap, including the note, was $944 million and $7,403 million, which is included within Investment securities on our Statement of Financial Position at December 31, 20202023 and 2019, was $7,319 million and $9,888 million,2022, respectively. We recognized a realized pre-tax and after-tax gain of $129 million based on several transactions during the year with share prices in the range of $55.75 to $65.89, an unrealized pre-tax loss of $2,037$865 million ($1,5621,052 million after-tax) based on a share price of $20.85$58.32 and aan unrealized pre-tax unrealizedand after-tax gain of $793$711 million ($626 million after-tax) based on a share price of $25.63$65.42 related to our interest in AerCap for the years ended December 31, 20202023, 2022, and 2019,2021, respectively. The 2020 loss included a $54 million pre-tax derivative loss associated with the forward sale of Baker Hughes shares pursuant to our previously announced program to monetize our Baker Hughes position. In October 2020, we completed a forward sale of 28 million shares and received proceeds of $417 million. In January 2021, we completed a forward sale of 38 million shares and received proceeds of $735 million. See Notes 2, 3 and 319 for further information. Given AerCap summarized financial information is not available as of the date of this filing, the summarized financial information presented below is reported on a one quarter lag.
Summarized | | | | | | | | |
| For the years ended December 31 | 2023(a) | 2022(b) |
| Revenues | $ | 7,511 | | $ | 6,627 | |
| Net income (loss) | 2,539 | | (1,128) | |
| Net income (loss) attributable to the entity | 2,525 | | (1,132) | |
(a) We reported summarized financial information ending September 30, 2023 instead of Baker Hughes is as follows.September 14, 2023 (date investment reduced below 20%).
| | | | | | | | |
| For the years ended December 31 | 2020 | 2019(a) |
| Revenues | $ | 20,705 | | $ | 7,751 | |
| Gross Profit | 3,199 | | 1,558 | |
| Net income (loss) | (15,761) | | 120 | |
| Net income (loss) attributable to the entity | (9,940) | | 60 | |
| | | | | | | | |
| As of December 31 | 2023(a) | 2022(b) |
| Flight equipment held for operating leases, net | $ | — | | $ | 54,611 | |
| Other | — | | 15,200 | |
| Total assets | $ | — | | $ | 69,811 | |
| $ | — | | |
| Debt | $ | — | | $ | 47,350 | |
| Other | — | | 6,817 | |
| Total liabilities | $ | — | | $ | 54,167 | |
| Noncontrolling interests | $ | — | | $ | 77 | |
(a) As of September 14, 2023 (date investment reduced below 20%). As a result, we no longer have significant influence.
(b) Financial information is from September 16, 2019 (date of deconsolidation) to December 31, 2019.30, 2022.
| | | | | | | | |
| As of December 31 | 2020 | 2019 |
| Current | $ | 16,455 | | $ | 15,222 | |
| Noncurrent | 21,552 | | 38,147 | |
| Total assets | $ | 38,007 | | $ | 53,369 | |
| | |
| Current | $ | 10,227 | | $ | 10,014 | |
| Noncurrent | 9,538 | | 8,857 | |
| Total liabilities | $ | 19,765 | | $ | 18,871 | |
| Noncontrolling interests | $ | 5,349 | | $ | 12,570 | |
Baker HughesAerCap is a SEC registrant with separate filing requirements, and itstheir respective financial information can be obtained from www.sec.gov or www.bakerhughes.com.www.sec.gov.
GE 20202023 FORM 10-K106 80
Equity method investments. Unconsolidated entities over which we have significant influence are accounted for as equity method investments and presented on a one-line basis in All other assets on our Statement of Financial Position. Equity method income includes our share of the results of unconsolidated entities, gains (loss) from sales and impairments of investments, which is included in Other income and in Insurance revenues in our Statement of Earnings (Loss). See Notes 1, 9 and 19 for further information.
| | | | | | | | | | | | | | | | | | | | |
| Equity method investment balance (Note 9) | | Equity method income (loss) |
| December 31 | 2023 | 2022 | | 2023 | 2022 | 2021 |
| Aerospace | $ | 1,958 | | $ | 1,931 | | | $ | 295 | | $ | 149 | | $ | 58 | |
| Renewable Energy | 808 | | 752 | | | 74 | | 32 | | 39 | |
| Power | 1,029 | | 960 | | | 78 | | 89 | | 23 | |
| Corporate(a) | 4,136 | | 3,991 | | | (34) | | 103 | | 68 | |
| Total consolidated | $ | 7,931 | | $ | 7,633 | | | $ | 413 | | $ | 373 | | $ | 188 | |
(a) Equity method investments within Corporate include investments held by EFS of $1,718 million and $1,975 million and held by our run-off insurance operations of $2,383 million and $1,980 million as of December 31, 2023 and 2022, respectively.
Summarized financial information of these equity method investments, exclusive of AerCap, is as follows.
| | | | | | | | | | | |
| For the years ended December 31 | 2023 | 2022 | 2021 |
| Revenues | $ | 43,463 | | $ | 33,891 | | $ | 27,210 | |
| Gross Profit | 2,791 | | 2,579 | | 2,060 | |
| Net income (loss) | 2,847 | | 2,068 | | 2,020 | |
| Net income (loss) attributable to the entity | 2,802 | | 2,035 | | 2,000 | |
| | | |
| | | | | | | | | |
| As of December 31 | 2023 | 2022 | |
| Current assets | $ | 29,167 | | $ | 26,659 | | |
| Total assets | $ | 68,313 | | $ | 61,105 | | |
| Current liabilities | $ | 23,484 | | $ | 21,918 | | |
| Total liabilities | $ | 33,573 | | $ | 31,947 | | |
| Noncontrolling interests | $ | 552 | | $ | 399 | | |
NOTE 27. QUARTERLY INFORMATION (UNAUDITED)
| | | | | | | | | | | | | | | | | | | | | | | | | | | | | | | | | | | |
| First quarter | | Second quarter | | Third quarter | | Fourth quarter |
| (Per-share amounts in dollars) | 2023 | 2022 | | 2023 | 2022 | | 2023 | 2022 | | 2023 | 2022 |
| Total revenues | $ | 14,486 | | $ | 12,675 | | | $ | 16,699 | | $ | 14,127 | | | $ | 17,346 | | $ | 14,470 | | | $ | 19,423 | | $ | 16,828 | |
| Sales of equipment and services | 13,695 | | 11,910 | | | 15,852 | | 13,361 | | | 16,504 | | 13,826 | | | 18,514 | | 16,045 | |
| Cost of equipment and services sold | 10,729 | | 9,774 | | | 12,362 | | 10,525 | | | 12,905 | | 11,534 | | | 14,396 | | 12,440 | |
| Earnings (loss) from continuing operations | 6,221 | | (1,209) | | | 1,058 | | (1,127) | | | 161 | | (245) | | | 1,589 | | 1,786 | |
| Earnings (loss) from discontinued operations | 1,257 | | 101 | | | (1,019) | | 264 | | | 173 | | 409 | | | 3 | | 427 | |
| Net earnings (loss) | 7,478 | | (1,108) | | | 39 | | (863) | | | 335 | | 165 | | | 1,591 | | 2,213 | |
Less net earnings (loss) attributable to noncontrolling interests | (27) | | 28 | | | 4 | | 19 | | | (14) | | 4 | | | — | | 16 | |
| Net earnings (loss) attributable to the Company | $ | 7,506 | | $ | (1,136) | | | $ | 35 | | $ | (882) | | | $ | 348 | | $ | 161 | | | $ | 1,591 | | $ | 2,197 | |
Per-share amounts – earnings (loss) from continuing operations | | | | | | | | | | | |
| Diluted earnings (loss) per share | $ | 5.56 | | $ | (1.16) | | | $ | 0.91 | | $ | (1.09) | | | $ | 0.08 | | $ | (0.29) | | | $ | 1.44 | | $ | 1.53 | |
| Basic earnings (loss) per share | 5.60 | | (1.16) | | | 0.91 | | (1.09) | | | 0.08 | | (0.29) | | | 1.46 | | 1.55 | |
Per-share amounts – earnings (loss) from discontinued operations | | | | | | | | | | | |
| Diluted earnings (loss) per share | 1.15 | | 0.08 | | | (0.93) | | 0.23 | | | 0.16 | | 0.37 | | | — | | 0.37 | |
| Basic earnings (loss) per share | 1.15 | | 0.08 | | | (0.94) | | 0.23 | | | 0.16 | | 0.37 | | | — | | 0.37 | |
| Per-share amounts – net earnings (loss) | | | | | | | | | | | |
| Diluted earnings (loss) per share | 6.71 | | (1.08) | | | (0.02) | | (0.86) | | | 0.23 | | 0.08 | | | 1.45 | | 1.90 | |
| Basic earnings (loss) per share | 6.76 | | (1.08) | | | (0.02) | | (0.86) | | | 0.24 | | 0.08 | | | 1.46 | | 1.93 | |
| Dividends declared | 0.08 | | 0.08 | | | 0.08 | | 0.08 | | | 0.08 | | 0.08 | | | 0.08 | | 0.08 | |
Earnings-per-share amounts are computed independently each quarter for earnings (loss) from continuing operations, earnings (loss) from discontinued operations and net earnings (loss). As a result, the sum of each quarter’s per-share amount may not equal the total per-share amount for the respective year; and the sum of per-share amounts from continuing operations and discontinued operations may not equal the total per-share amounts for net earnings (loss) for the respective quarters.
DIRECTORS, EXECUTIVE OFFICERS AND CORPORATE GOVERNANCE
Information about our Executive Officers (As of February 1, 2021)2, 2024)
| | | | | | | | | | | | | | | | | | | | |
| | | | | | Date assumed |
| | | | | | Executive |
| Name | | Position | | Age | | Officer Position |
| | | | | | |
| H. Lawrence Culp, Jr. | | Chairman of the Board & Chief Executive Officer, GE; | | 5760 | | October 2018 |
| | Carolina Dybeck HappeCEO, GE Aerospace | | | | |
| Rahul Ghai | | Senior Vice President & Chief Financial Officer, GE | | 4852 | | September 2023 |
| | | | | | |
| L. Kevin Cox | | March 2020Senior Vice President, Chief Human Resources Officer, GE | | 60 | | February 2019 |
| | | | | | |
| Michael J. Holston | | Senior Vice President, General Counsel & Secretary, GE | | 5861 | | April 2018 |
| David L. Joyce | | Vice Chairman of General Electric Company | | 64 | | September 2016
L. Kevin CoxRussell Stokes | | Senior Vice President, Chief Human Resources OfficerGE; | | 5752 | | February 2019 |
Kieran P. Murphy | | Senior Vice President of General Electric Company; | | 57 | | September 2018 |
| | President & CEO, Commercial Engines and Services, GE HealthcareAerospace | | | | |
Jérôme X. Pécresse | | Senior Vice President of General Electric Company; | | 53 | | September 2018 |
| | President & CEO, GE Renewable Energy | | | | |
John Slattery | | Senior Vice President of General Electric Company; | | 52 | | September 2020 |
| | President & CEO, GE Aviation | | | | |
Russell Stokes | | Senior Vice President of General Electric Company; | | 49 | | September 2018 |
| | President & CEO, GE Aviation Services, and Chairman, GE Power Portfolio | | | | |
| Scott L. Strazik | | Senior Vice President, of General Electric Company;GE; | | 4245 | | January 2019 |
| | President & CEO, GE Gas PowerVernova; | | | | |
| Thomas S. Timko | | Vice President, Controller & Chief Accounting Officer, GE | | 5255 | | September 2018 |
All Executive Officers are elected by the Board of Directors for an initial term that continues until the Board meeting immediately preceding the next annual statutory meeting of shareholders, and thereafter are elected for one-year terms or until their successors have been elected. AllOther than Mr. Ghai, the Executive Officers have been executives of General Electric Company for the lastat least five years except for Messrs. Culp, Cox, Holston, Slattery and Timko, and Ms. Dybeck Happe.years.
Prior to joining GE in April 2018 as an independent directorAugust 2022, Mr. Ghai was Executive Vice President and being elected to the position of Chairman and CEO in October 2018, Mr. Culp served as CEO at Danaher Corp. (2001-2014); as a senior advisor at Danaher Corp. (2014-2016); as a senior lecturer at Harvard Business School (2015-2018); and as a senior adviser at Bain Capital Private Equity, LP (2017-2018).
Prior to joining GE in February 2019, Mr. Cox had been Chief Human Resources Officer at American Express since 2005.
Prior to joining GE in March 2020, Ms. Dybeck Happe had been Chief Financial Officer of A.P. Moller - Maersk A/SOtis Worldwide Corporation, an elevator and escalator manufacturing, installation and service company, since 2019 after serving2019. Prior to that, he served as Senior Vice President and Chief Financial Officer of Assa Abloy AB since 2012Harris Corporation, a technology company and defense contractor, from 2016 until 2018.
Prior to joining GE in April 2018, Mr. Holston had been general counsel at Merck since 2015, after joining the drugmaker as chief ethics and compliance officer in 2012.
Prior to Joining GE in July 2020, Mr. Slattery had been President and Chief Executive Officer of Commercial Aviation for Embraer, S.A. since 2016 after serving as the Chief Commercial Officer for Embraer Commercial Aviation since 2012.
Prior to joining GE in September 2018, Mr. Timko was Vice President, Controller and Chief Accounting Officer at General Motors since 2013.2019.
The remaining information called for by this item is incorporated by reference to “Election of Directors,”Directors”, “Other Governance Policies & Practices”, “Board Committees”, and “Board Operations” in our definitive proxy statement for our 20212024 Annual Meeting of Shareholders to be held May 4, 2021,7, 2024, which will be filed within 120 days of the end of our fiscal year ended December 31, 20202023 (the 20212024 Proxy Statement).
EXHIBITS AND FINANCIAL STATEMENT SCHEDULES
(a)1. Financial Statements
Included in the “Financial Statements and Supplementary Data” section of this report:
Management’s Annual Report on Internal Control Over Financial Reporting
ReportReports of Independent Registered Public Accounting Firm
Statement of Earnings (Loss) for the years ended December 31, 2020, 20192023, 2022 and 20182021
Statement of Financial Position at December 31, 20202023 and 20192022
Statement of Cash Flows for the years ended December 31, 2020, 20192023, 2022 and 20182021
Statement of Comprehensive Income (Loss) for the years ended December 31, 2020, 20192023, 2022 and 20182021
Statement of Changes in Shareholders' Equity for the years ended December 31, 2020, 20192023, 2022 and 20182021
Notes to consolidated financial statements
Management’s Discussion and Analysis of Financial Condition and Results of Operations - Summary of Operating Segments
(a)2. Financial Statement Schedules
The schedules listed in Reg. 210.5-04 have been omitted because they are not applicable or the required information is shown in the consolidated financial statements or notes thereto.
(a)3. Exhibit Index
| | | | | | | | | | | |
Exhibit
Number | | Description |
2(a) | | Transaction2 Separation and Distribution Agreement, dated November 7, 2022 by and Plan of Merger dated as of October 30, 2016 amongbetween General Electric Baker Hughes Incorporated, Bear Mergersub,Company and GE HealthCare Technologies Inc. and Bear Newco, Inc.(f/k/a GE Healthcare Holding LLC), as amended. (Incorporated by reference to Exhibit 2.1 to GE’s Current Report on Form 8-K, dated November 3, 2016January 4, 2023 (Commission file numberno, 001-00035)). |
| 2(b) | | | | |
Amendment to Transaction Agreement and Plan of Merger dated March 27, 2017 between General Electric Company, Baker Hughes Incorporated, Bear Newco, Inc., Bear MergerSub, Inc., BHI Newco, Inc., and Bear MergerSub 2, Inc. (Incorporated by reference to Bear Newco, Inc.'s Registration Statement on Form S-4, pages A-II-I through G-16, filed pursuant to Rule 424(b)(3) on May 30, 2017 (Commission file number 333-216991)). |
| 3(i) | | The Restated Certificate of Incorporation of General Electric Company (Incorporated(Incorporated by reference to Exhibit 3(i) to GE’s Annual Report on Form 10-K for the fiscal year ended December 31, 20132013)), as amended by the Certificate of Amendment, dated December 2, 2015 (Incorporated(Incorporated by reference to Exhibit 3.1 to GE’s Current Report on Form 8-K, dated December 3, 20152015)), as further amended by the Certificate of Amendment, dated January 19, 2016 (Incorporated(Incorporated by reference to Exhibit 3.1 to GE’s Current Report on Form 8-K, dated January 20, 20162016)), as further amended by the Certificate of Change of General Electric Company (Incorporated(Incorporated by reference to Exhibit 3(1) to GE’s Current Report on Form 8-K, dated September 1, 20162016), as further amended by the Certificate of Amendment, dated May 13, 2019 (Incorporated by reference to Exhibit 3.1 to GE’s Current Report on Form 8-K, dated May 13, 2019), and as further amended by the Certificate of Change of General Electric Company (Incorporated by reference to Exhibit 3.1 to GE’s Current Report on Form 8-K, dated December 9, 2019), as further amended by the Certificate of Amendment, dated July 30, 2021 (Incorporated by reference to Exhibit 3.1 to GE's Current Report on Form 8-K, dated July 30, 2021), as further amended by the Certificate of Change of General Electric Company, dated May 15, 2023 (Incorporated by reference to Exhibit 3.1 to GE's Current Report on Form 8-K, dated May 17, 2023) (in each case, under Commission file number 001-00035). |
3(ii) | | |
4(a) | | |
4(b) | | |
4(c) | | |
4(d) | | |
4(e) | | |
4(f) | | |
4(g) | | |
4(h) | | |
GE 2020 FORM 10-K4(i) 108
| | | (f) | | | | | | | (g) | | | | (h) | | | | (i) | | | | (j) | | | | (k) | | | | (l) | | | | (m) | | | | (n) | | | | (o) | | | | (p) | | | | | | | | | | | | | | (r) | | | | | | | | | | (s) | | | | | | | | | | (t) | | | | (u) | | | | (v) | | | | | | (w) | |
GE 2020 FORM 10-K 109 |
| | | | | | | | | | | | | | (y) | | | | (z) | | | | (aa) | | | | | | (bb) | | | | | | (cc) | | | | (dd) | | | | (ee) | | | | | | (ff) | | | | (gg) | | | | | | (hh) | (uu) Three-YearAmended and Restated Credit Agreement, dated as of April 17, 2020,May 27, 2021, among General Electric Company, as the Borrower,borrower, JPMorgan Chase Bank, N.A., as Administrative Agent, and the lenders party thereto (Incorporated by reference to Exhibit 10.110 to GE'sGE’s Current Report on Form 8-K, dated April 20, 2020May 27, 2021 (Commission file number 001-00035)). | | (11) | (vv) First Amendment to Amended and Restated Credit Agreement, dated as of May 27, 2021, among General Electric Company, as the borrower, JPMorgan Chase Bank, N.A., as Administrative Agent, and the lenders party thereto, dated June 9, 2023.* | | | | | | | (22) | | | (23) | | | | | | | | | 31(b) | | | | | | | | Undertaking for Inclusion in Registration Statements on Form S-8 of General Electric Company (Incorporated by referenceClawback Policy Pursuant to Exhibit 99(b) to General Electric Annual Report on Form 10-K (Commission file number 001-00035) forRule 10D-1 under the fiscal year ended December 31, 1992). | 99(b) | | | | | |
| | | | | | (101) | | The following materials from General Electric Company's Annual Report on Form 10-K for the year ended December 31, 2020,2023, formatted as Inline XBRL (eXtensible Business Reporting Language); (i) Statement of Earnings (Loss) for the years ended December 31, 2020, 20192023, 2022 and 2018,2021, (ii) Statement of Financial Position at December 31, 20202023 and 2019,2022, (iii) Statement of Cash Flows for the years ended December 31, 2020, 20192023, 2022 and 2018,2021, (iv) Statement of Comprehensive Income (Loss) for the years ended December 31, 2020, 20192023, 2022 and 2018,2021, (v) Statement of Changes in Shareholders' Equity for the years ended December 31, 2020, 20192023, 2022 and 2018,2021, and (vi) the Notes to Consolidated Financial Statements.* | (104) | Cover Page Interactive Data File (formatted as Inline XBRL and contained in Exhibit 101). | * | Filed electronically herewith.herewith | ** | Information required to be presented in Exhibit 11 is provided in Note 18 to the consolidated financial statements in this Form 10-K Report in accordance with the provisions of Financial Accounting Standards Board Accounting Standards Codification 260, Earnings Per Share. |
FORM 10-K CROSS REFERENCE INDEX
| | | | | | | | | | | | | | | Item NumberFORM 10-K CROSS REFERENCE INDEX | | Page(s) | | Part I | | | | | | Item 1. | | Business | | 4, 10-18, 103-1044-6, 7-13, 78-80 | | | | | | | Item 1A. | | Risk Factors | | 44-5127-36 | | | | | | | Item 1B. | | Unresolved Staff Comments | | Not applicable | | | | | | | Item 1C. | | Cybersecurity | | 26-27 | | | | | | | Item 2. | | Properties | | 4 | | | | | | | Item 3. | | Legal Proceedings | | 98-10136 | | | | | | | Item 4. | | Mine Safety Disclosures | | Not applicable | | Part II | | | | | | Item 5. | | Market for Registrant’s Common Equity, Related Stockholder Matters and Issuer Purchases of Equity Securities | | 4426 | | | | | | | Item 6. | | Selected Financial Data[Reserved] | | Not applicable | | | | | | | Item 7. | | Management’s Discussion and Analysis of Financial Condition and Results of Operations | | 5-436-25 | | | | | | | Item 7A. | | Quantitative and Qualitative Disclosures About Market Risk | | 27, 94-9716, 74-76 | | | | | | | Item 8. | | Financial Statements and Supplementary Data | | 56-10641-81 | | | | | | | Item 9. | | Changes in and Disagreements With Accountants on Accounting and Financial Disclosure | | Not applicable | | | | | | | Item 9A. | | Controls and Procedures | | 5237 | | | | | | | Item 9B. | | Other Information | | Not applicable | | | | | | | Item 9C. | | Disclosure Regarding Foreign Jurisdictions that Prevent Inspections | | Not applicable | | Part III | | | | | | Item 10. | | Directors, Executive Officers and Corporate Governance | | 10782, (a) | | | | | | | Item 11. | | Executive Compensation | | (a)(b) | | | | | | | Item 12. | | Security Ownership of Certain Beneficial Owners and Management and Related Stockholder Matters | | (b), 92(c) | | | | | | | Item 13. | | Certain Relationships and Related Transactions, and Director Independence | | (c)(d) | | | | | | | Item 14. | | Principal Accountant Fees and Services | | (d)(e) | | Part IV | | | | | | Item 15. | | Exhibits and Financial Statement Schedules | | 108-11082-86 | | | | | | | Item 16. | | Form 10-K Summary | | Not applicable | | | | | | | Signatures | | | 11287 |
(a)Incorporated by reference to “Compensation”"Governance" in the 20212023 Proxy Statement. (b)Incorporated by reference to “Stock Ownership Information”"Compensation Discussion & Analysis", “Other Executive Compensation Policies & Practices” and "Management Development & Compensation Committee Report" in the 20212023 Proxy Statement. (c)Incorporated by reference to “Stock Ownership Information” and "Equity Compensation Plan Information" in the 2023 Proxy Statement. (d)Incorporated by reference to “Related Person Transactions” and “How We Assess Director Independence” in the 20212023 Proxy Statement. (d)(e)Incorporated by reference to “Independent Auditor Information”Auditor” in the 20212023 Proxy Statement.Statement for Deloitte & Touche LLP (PCAOB ID No. 34).
GE 20202023 FORM 10-K111 86
SIGNATURES
Pursuant to the requirements of Section 13 or 15(d) of the Securities Exchange Act of 1934, the registrant has duly caused this annual report on Form 10-K for the fiscal year ended December 31, 2020,2023, to be signed on its behalf by the undersigned, and in the capacities indicated, thereunto duly authorized in the City of Boston and Commonwealth of Massachusetts on the 122thnd day of February 2021.2024.
General Electric Company
(Registrant) | | | | | | | By | /s/ Thomas S. TimkoRahul Ghai | | Thomas S. TimkoRahul Ghai
Senior Vice President and Chief AccountingFinancial Officer and Controller (Principal AccountingFinancial Officer) |
Pursuant to the requirements of the Securities Exchange Act of 1934, this report has been signed below by the following persons on behalf of the registrant and in the capacities and on the dates indicated. | | | | | | | | | | | | | | | | | | | Signer | | Title | | Date | | | | | | | | /s/ Carolina Dybeck HappeRahul Ghai | | Principal Financial Officer | | February 12, 20212, 2024 | | Carolina Dybeck HappeRahul Ghai
Senior Vice President and
Chief Financial Officer | | | | | | | | | | | | /s/ Thomas S. Timko | | Principal Accounting Officer | | February 12, 20212, 2024 | | Thomas S. Timko
Vice President, Chief Accounting Officer and Controller
| | | | | | | | | | | | /s/ H. Lawrence Culp, Jr. | | Principal Executive Officer | | February 12, 20212, 2024 | | H. Lawrence Culp, Jr.*
Chairman of the Board of Directors
| | | | | | | | | | | | Stephen Angel* | | Director | | | | Sébastien M. Bazin* | | Director | | | | Ashton B. CarterMargaret Billson* | | Director | | | | Francisco D'Souza*Thomas Enders* | | Director | | | | Edward P. Garden* | | Director | | | | Isabella Goren* | | Director | | | | Thomas W. Horton* | | Director | | | | Risa Lavizzo-Mourey* | | Director | | | | Catherine A. Lesjak* | | Director | | | | Darren W. McDew* | | Director | | | | Paula Rosput Reynolds* | | Director | | | | Leslie F. Seidman*Jessica Uhl* | | Director | | | | | James S. Tisch* | | Director | | | | | | | | | | | | | | | A majority of the Board of Directors | | | | | | | | | | | | | | | | | | *By | /s/ Christoph A. PereiraBrandon Smith | | | | | | Christoph A. PereiraBrandon Smith
Attorney-in-fact | | | | | | February 12, 20212, 2024 | | | | |
GE 20202023 FORM 10-K112 87
| |
