UNITED STATES
SECURITIES AND EXCHANGE COMMISSION
Washington, D.C. 20549
ANNUAL REPORT PURSUANT TO SECTION 13 OR 15(d) OF THE
SECURITIES EXCHANGE ACT OF 1934
For the Fiscal Year Ended March 31, 2013
|
| | |
| | |
| Form 10-K |
| ANNUAL REPORT PURSUANT TO SECTION 13 OR 15(d) OF THE |
| SECURITIES EXCHANGE ACT OF 1934 |
| For the Fiscal Year Ended March 29, 2015 |
| Commission File No. 0-7647 |
| | |
HAWKINS, INC.
(Exact Name of Registrant as specifiedSpecified in its Charter)
|
| | |
| | | |
| MINNESOTA | | 41-0771293 |
| (State of Incorporation) | | (I.R.S. Employer Identification No.) |
2381 Rosegate, Roseville, Minnesota | | 55113 |
| (Address of Principal Executive Offices) | | (Zip Code) |
(612) 331-6910
(Registrant’s Telephone Number, Including Area Code)
|
| | | | |
| | | | | |
| Securities registered pursuant to Section 12(b) of the Act: | | COMMON STOCK, PAR VALUE $.05 PER SHARE |
| Name of exchange on which registered: | | NASDAQ Global Market |
| Securities registered pursuant to Section 12(g) of the Act: | | NONE |
| | | | | |
Indicate by check mark if the registrant is a well-known seasoned issuer, as defined in Rule 405 of the Securities Act. Yes ¨ No þ
Indicate by check mark if the registrant is not required to file reports pursuant to Section 13 or Section 15(d) of the Act. Yes ¨ No þ
Indicate by check mark whether the Registrant (1) has filed all reports required to be filed by Section 13 or 15(d) of the Securities Exchange Act of 1934 during the preceding twelve months (or for such shorter period that the Registrant was required to file such reports) and (2) has been subject to such filing requirements for the past 90 days. Yes þ No ¨
Indicate by check mark whether the registrant has submitted electronically and posted on its corporate Web site, if any, every Interactive Data File required to be submitted and posted pursuant to Rule 405 of Regulation S-T during the preceding 12 months (or for such shorter period that the registrantRegistrant was required to submit and post such files). Yes þ No ¨
Indicate by check mark if disclosure of delinquent filers pursuant to Item 405 of Regulation S-K is not contained herein, and will not be contained, to the best of the Registrant’s knowledge, in definitive proxy or information statements incorporated by reference in Part III of this Form 10-K or any amendment to this Form 10-K. þ¨
Indicate by check mark whether the registrant is a large accelerated filer, an accelerated filer, a non-accelerated filer, or a smaller reporting company. See the definitions of “large accelerated filer,” “accelerated filer” and “smaller reporting company” in Rule 12b-2 of the Exchange Act. (Check one):
|
| | | | | | | | | | |
| Large accelerated filer | ¨ | | Non-accelerated filer | ¨ | | Accelerated filer | þ | | Smaller reporting company | o |
Indicate by check mark whether the registrant is a shell company (as defined in Rule 12b-2 of the Exchange Act). Yes ¨ No þ
The aggregate market value of voting stock held by non-affiliates of the Registrant on September 30, 201228, 2014 (the last business day of the Registrant’s most recently completed second fiscal quarter) was approximately $383.4$335.8 million based upon the closing sale price for the Registrant’s common stock on that date as reported by The NASDAQ Stock Market, excluding all shares held by officers and directors of the Registrant and by the Trustees of the Registrant’s Employee Stock Ownership Plan and Trust.
As of May 24, 201322, 2015, the Registrant had 10,557,64210,615,623 shares of common stock outstanding.
DOCUMENTS INCORPORATED BY REFERENCE
Portions of our Proxy Statement for the annual meeting of shareholders to be held August 1, 2013,July 30, 2015, are incorporated by reference in Part III.
FORWARD-LOOKING STATEMENTS
The information presented in this Annual Report on Form 10-K contains forward-looking statements within the meaning of Section 21E of the Securities Exchange Act of 1934, as amended (the “Exchange Act”). These forward-looking statements have been made pursuant to the provisions of the Private Securities Litigation Reform Act of 1995. These statements are not historical facts, but rather are based on our current expectations, estimates and projections, and our beliefs and assumptions. We intend words such as “anticipate,” “expect,” “intend,” “plan,” “believe,” “seek,” “estimate,” “will” and similar expressions to identify forward-looking statements. These statements are not guarantees of future performance and are subject to certain risks, uncertainties and other factors, some of which are beyond our control and are difficult to predict. These factors could cause actual results to differ materially from those expressed or forecasted in the forward-looking statements. These risks and uncertainties are described in the risk factors and elsewhere in this Annual Report on Form 10-K. We caution you not to place undue reliance on these forward-looking statements, which reflect our management'smanagement’s view only as of the date of this Annual Report on Form 10-K. We are not obligated to update these statements or publicly release the result of any revisions to them to reflect events or circumstances after the date of this Annual Report on Form 10-K or to reflect the occurrence of unanticipated events.
As used in this Annual Report on Form 10-K, except where otherwise stated or indicated by the context, “Hawkins,” “we,” “us,” “the Company,” “our,” or “the Registrant” means Hawkins, Inc. References to “fiscal 2016” mean our fiscal year ending April 3, 2016, “fiscal 2015” means our fiscal year ended March 29, 2015, “fiscal 2014” means our fiscal year ending March 30, 2014 and “fiscal 2013” means our fiscal year ended March 31, 2013, “fiscal 2012” means our fiscal year ended April 1, 2012, and “fiscal 2011” means our fiscal year ended April 3, 2011.2013.
Hawkins, Inc.
Annual Report on Form 10-K
For the Fiscal Year Ended March 31, 201329, 2015
|
| | |
| | | |
| | | Page |
| PART I | |
| ITEM 1. | | |
| ITEM 1A. | | |
| ITEM 1B. | | |
| ITEM 2. | | |
| ITEM 3. | | |
| ITEM 4. | | |
| PART II | |
| ITEM 5. | | |
| ITEM 6. | | |
| ITEM 7. | | |
| ITEM 7A. | | |
| ITEM 8. | | |
| ITEM 9. | | |
| ITEM 9A. | | |
| ITEM 9B. | | |
| PART III | |
| ITEM 10. | | |
| ITEM 11. | | |
| ITEM 12. | | |
| ITEM 13. | | |
| ITEM 14. | | |
| PART IV | |
| ITEM 15. | | |
PART I
ITEM 1. BUSINESS
Hawkins, Inc. distributes, bulk chemicalsblends and blends, manufactures and distributes specialty chemicals for our customers in a wide variety of industries. We began our operations primarily as a distributor of bulk chemicals with a strong customer focus. Over the years, we have maintained our strong customer focus and have expanded our business by increasing our sales of value-added specialty chemical products, including repackaging,manufacturing, blending and manufacturingrepackaging certain products. In recent years, we have expanded the sales of our higher-margin blended and manufactured products. We believe that we create value for our customers through superb service and support, quality products, personalized applications and our trustworthy, creative employees.
We currently conduct our business in two segments: Industrial and Water Treatment. Financial information regarding these segments is reported in our Financial Statements and Notes to Financial Statements. See Items 7 and 8 of this Annual Report on Form 10-K.
Industrial Segment. Our Industrial Group operates this segment of our business, which specializes in providing industrial chemicals, products and services to industries such as agriculture, energy, electronics, food, chemical processing, pulpelectronics, energy, food, pharmaceutical, plating and paper, pharmaceutical, medical device and plating.power generation. The group'sgroup’s principal products are acids, alkalis and industrial and food-grade salts.
The Industrial Group:
Receives, stores and distributes various chemicals in bulk quantities, including liquid caustic soda, sulfuric acid, hydrochloric acid, phosphoric acid, potassium hydroxide and aqua ammonia;
| |
• | Manufactures sodium hypochlorite (bleach), agricultural products and certain food-grade products, including our patented Cheese-Phos® liquid phosphate,Manufactures sodium hypochlorite (bleach), agricultural products and certain food-grade products, including liquid phosphates, lactates and other blended products; |
Repackages water treatment chemicals for our Water Treatment Group and bulk industrial chemicals to sell in smaller quantities to our customers;
Performs custom blending of certain chemicals for customers according to customer formulas; and
Performs contract and private label packaging for household chemicals.bleach packaging.
The group'sgroup’s sales are concentrated primarily in Illinois, Iowa, Minnesota, Missouri, North Dakota, South Dakota, Tennessee and Wisconsin while the group'sgroup’s food-grade products are sold nationally. The Industrial Group relies on a specially trained sales staff that works directly with customers on their specific needs. The group conducts its business primarily through distribution centers and terminal operations.
During fiscal 2012, we purchased a 28-acre parcel of land in Rosemount, Minnesota and began construction of a new facility on the site. The facility became operational in late fiscal 2013. The site provides capacity for future business growth and lessens our dependence on our flood-prone sites on the Mississippi River. While we have transferred some blending and manufacturing activity to the Rosemount site, we do not intend to close any sites that we currently operate as a result of this transfer of activity.
In fiscal 2011, we completed the acquisition of substantially all of the assets of Vertex Chemical Corporation (“Vertex”), a manufacturer of sodium hypochlorite in the central Midwest. In addition to the manufacture of sodium hypochlorite bleaches, Vertex distributes and provides terminal services for bulk liquid inorganic chemicals, and contract and private label packaging for household chemicals. Its corporate headquarters are located in St. Louis, Missouri, with manufacturing sites in Dupo, Illinois, Camanche, Iowa, and Memphis, Tennessee. In connection with the acquisition we paid the sellers $27.2 million and assumed certain liabilities of Vertex. Vertex's business is part of our Industrial Group.
Water Treatment Segment. Our Water Treatment Group operates this segment of our business, which specializes in providing chemicals, equipment and solutions for potable water, municipal and industrial wastewater, industrial process water and non-residential swimming pool water. The group has the resources and flexibility to treat systems ranging in size from a single small well to a multi-million-gallon-per-day facility.
The group utilizes delivery routes operated by our employees who typically serve as route driver, salesperson and highly-trainedtrained technician to deliver our products and diagnose our customers'customers’ water treatment needs. We believe that the high level of service provided by these individuals allows us to serve as the trusted water treatment expert for many of the municipalities and other customers that
we serve. We also believe that we are able to obtain a competitive cost position on many of the chemicals sold by the Water Treatment Group due to the volumes of these chemicals purchased by our Industrial Group.
The group operates out of warehouses in 1928 cities supplying products and services to customers primarily in Arkansas,Florida, Illinois, Indiana, Iowa, Kansas, Michigan,Kentucky, Minnesota, Missouri, Montana, Nebraska, North Dakota, Ohio, Oklahoma, South Dakota, Tennessee, Wisconsin and Wyoming. We openedentered the Florida market in fiscal 2015 through our acquisition of substantially all the assets of The Dumont Company, Inc. (“Dumont”), with seven operating locations. We added one new warehousebranch in each of fiscal 2013 and fiscal 2014 and will be adding one in early fiscal 2012, two in fiscal 2011, and2016. We expect to continue to invest in existing and new branches to expand the group'sgroup’s geographic coverage. Our Water Treatment Group has historically experienced higher sales during April to September, primarily due to a seasonal increase in chemicals used by municipal water treatment facilities.
Discontinued Operations. In fiscal 2009, we entered into two agreements whereby we agreed to sell our inventory and enter into a marketing relationship regarding the business of our Pharmaceutical segment, which provided pharmaceutical chemicals to retail pharmacies and small-scale pharmaceutical manufacturers. We have no continuing obligations to fulfill under the agreements. The results of the Pharmaceutical segment have been reported as discontinued operations in our consolidated financial statements for all periods presented in this Annual Report on Form 10-K.
Raw Materials. We have numerous suppliers, including many of the major chemical producers in the United States. We typically have written distributorship agreements or supply contracts with our suppliers that are periodically renewed. We believe that most of the products we purchase can be obtained from alternative sources should existing relationships be terminated. We are dependent
upon the availability of our raw materials. While we believe that we have adequate sources of supply for our raw material and product requirements, we cannot be sure that supplies will be consistently available in the future. In the event that certain raw materials become generally unavailable, suppliers may extend lead times or limit or cut off the supply of materials to us. As a result, we may not be able to supply or manufacture products for our customers. While we believe we have adequate sources of supply for our raw material and product requirements, we cannot be sure that supplies will be consistently available in the future.
Intellectual Property. Our intellectual property portfolio is of economic importance to our business. When appropriate, we have pursued, and we will continue to pursue, patents covering our products. We also have obtained certain trademarks for our products to distinguish them from our competitors'competitors’ products. The patent for our Cheese-Phos® liquid phosphate product, which is manufactured by our Industrial group, will expire in November 2013. We regard much of the formulae, information and processes that we generate and use in the conduct of our business as proprietary and protectable under applicable copyright, patent, trademark, trade secret and unfair competition laws.
Customer Concentration. In fiscal 2013,2015, none of our customers accounted for 10%10.0% or more of our total sales. Sales to our largest customer represented 7.3%, 7.1% and 6.2%6.1% of our total sales in fiscal 2013, 20122015, 6.9% of our total sales in fiscal 2014 and 2011, respectively.7.4% of our total sales in fiscal 2013. Aggregate sales to our five largest customers, all of which are in our Industrial segment, represented 21.8%, 24.8% and 24.1%18.0% of our total sales in fiscal 2013, 20122015, 20.8% of our total sales in fiscal 2014 and 2011, respectively.21.8% of our total sales in fiscal 2013. No other customer represented more than 2%2.0% of our total sales in fiscal 2013.2015. The loss of any of our largest customers, or a substantial portion of their business, could have a material adverse effect on our results of operations.
Competition. We operate in a competitive industry and compete with many producers, distributors and sales agents offering chemicals equivalent to substantially all of the products we handle.offer. Many of our competitors are larger than we are and may have greater financial resources, although no one competitor is dominant in our industry. We compete by offering quality products at competitive prices coupled with outstanding customer service. Because of our long-standing relationships with many of our suppliers, we are often able to leverage those relationships to obtain products when supplies are scarce or to obtain competitive pricing.
Geographic Information. Substantially all of our revenues are generated by sales to customers within, and long-lived assets are located in, the United States, with only approximately 0.5%States. Approximately 0.7% of our total revenues were from sales to customers outside of the U.S. in fiscal 2015 and 0.5% of our revenues were from sales to customers outside of the U.S. in both fiscal 2014 and fiscal 2013.
Working Capital. Due to the nature of our operations, which includes purchases of large quantities of bulk chemicals, the timing of purchases can result in significant changes in working capital and the resulting operating cash flow. Historically, our cash requirements for working capital increase during the period from April through November as caustic soda inventory levels increase as the majority of barges are received during this period. Additionally, due to seasonality of the Water Treatment business, our accounts receivable balance is generally higher during the period of April through September.
Employees. We had 354419 employees as of March 31, 2013,29, 2015, including 5251 covered by collective bargaining agreements.
About Us. Hawkins, Inc. was founded in 1938 and incorporated in Minnesota in 1955. We became a publicly-traded company in 1972. Our principal executive offices are located at 2381 Rosegate, Roseville, Minnesota.
Available Information. We have made available, free of charge, through our Internet website (http://www.hawkinsinc.com), our Annual Reports on Form 10-K, Quarterly Reports on Form 10-Q, Current Reports on Form 8-K, and, if applicable, amendments to those reports, as soon as reasonably practicable after we electronically file these materials with, or furnish them to, the Securities and Exchange Commission. Reports of beneficial ownership filed by our directors and executive officers pursuant to Section 16(a) of the Exchange Act are also available on our website. We are not including the information contained on our website as part of, or incorporating it by reference into, this Annual Report on Form 10-K.
ITEM 1A. RISK FACTORS
You should consider carefully the following risks when reading the information, including the financial information, contained in this Annual Report on Form 10-K.
We operate in a highly competitive environment and face significant competition andprice pressure.
We operate in a highly competitive industry and compete with producers, manufacturers, distributors and sales agents offering chemicals equivalent to substantially all of the products we offer. Competition is based on several key criteria, including product price, product performance, product quality, product availability and security of supply, breadth of product offerings, geographic reach, responsiveness of product development in cooperation with customers, technical expertise and customer service. Many of our competitors are larger than we are and may have greater financial resources, more product offerings and a greater geographic reach. As a result, these competitors may be able to offer a broader array of products to a larger geographic area and may be better able than us to withstand changes in conditions within our industry, changes in the prices and availability of raw materials, changes in general economic conditions and be able to introduce innovative products that reduce demand for or the profit of our products. Additionally, competitors’ pricing decisions could compel us to decrease our prices, which could adversely affect our margins and profitability. Our ability to maintain or increase our profitability is dependent upon our ability to offset competitive decreases in the prices and margins of our products by improving production efficiency, investing in infrastructure to reduce freight costs, identifying and selling higher margin chemical products, providing higher levels of technical expertise and customer service, and improving existing products through innovation and research and development. If we are unable to maintain our profitability or competitive position, we could lose market share to our competitors and experience reduced profitability.
Fluctuations in the prices and availability of commodity chemicals,our chemical raw materials, which aremay be cyclical in nature, could have a material adverse effect on our operations and the margins we receive on sales of our products.
Periodically, weWe experience significantregular and rapidrecurring fluctuations in the commodity pricing of our raw materials. Those fluctuations can be significant and occur rapidly. The cyclicality of commodity chemical markets, such as caustic soda, primarily results from changes in the balance between supply and demand and the level of general economic activity. We cannot predict whether the markets for our commodity chemicalschemical raw materials will favorably impact our operations or whether we will experience a negativenegatively impact due to oversupply and the resulting compression of margins we can realize.
Our principal raw materials are generally purchased under supply contracts. The prices we pay under these contracts generally lag the market prices of the underlying raw material and the cost of inventory we have on hand generally will lag the current market pricing of such inventory. The pricing within our supply contracts generally adjusts quarterly or monthly. While we attempt to maintain competitive pricing and stable margin dollars, the variabilitypotential variance in our cost of inventory from the current market pricing can cause significant volatility in our margins realized. In periods of rapidly increasing market prices, theour inventory cost position will tend to be favorable, to us, possibly by material amounts, which may positively impact our margins. Conversely, in periods of rapidly decreasing market prices, theour inventory cost position will tend to be unfavorable, to us, possibly by material amounts, which may negatively impact our margins. We do not engage in futures or other derivatives contracts to hedge against fluctuations in future prices. We may enter into sales contracts where the selling prices for our products are fixed for a period of time, exposing us to volatility in raw materials prices that we acquire on a spot market or short-term contractual basis. We attempt to pass commodity pricing changes to our customers, but we may be unable to or be delayed in doing so. Our inability to pass through price increases or any limitation or delay in our passing through price increases could adversely affect our profit margins.
We are also dependent upon the availability of our raw materials. In the event that raw materials are in short supply or unavailable, raw material suppliers may extend lead times or limit or cut off supplies. As a result, we may not be able to supply or manufacture products for some or all of our customers. Constraints on the supply or delivery of critical raw materials could disrupt our operations and adversely affect the performance of our business.
We operate in a highly competitive environment and face significant competition andprice pressure.
We operate in a highly competitive industry and compete with producers, manufacturers, distributors and sales agents offering chemicals equivalent to substantially all of the products we handle. Competition is based on several key criteria, including product price, product performance, product quality, product availability and security of supply, responsiveness of product development in cooperation with customers, and customer service. Many of our competitors are larger than we are and may have greater financial resources. As a result, these competitors may be better able than us to withstand changes in conditions within our industry, changes in the prices and availability of raw materials, changes in general economic conditions and be able to introduce innovative products that reduce demand for or the profit of our products. Additionally, competitors' pricing decisions could compel us to decrease our prices, which could adversely affect our margins and profitability. Our ability to maintain or increase our profitability is dependent upon our ability to offset competitive decreases in the prices and margins of our products by improving production efficiency and volume, identifying and selling higher margin chemical products and improving existing products through innovation and research and development. If we are unable to maintain our profitability or competitive position, we could lose market share to our competitors and experience reduced profitability.
Demand for our products is affected by general economic conditions and by the cyclical nature of many of the industries we serve, which could cause significant fluctuations in our sales volumes and results.
Demand for our products is affected by general economic conditions. A decline in general economic or business conditions in the industries served by our customers could have a material adverse effect on our business. Although we sell to areas traditionally considered non-cyclical, such as water treatment and food products, many of our customers are in businesses that are cyclical in nature, such as the industrial manufacturing, surface finishing and energy industries which include the ethanol and agriculture industries. Downturns in these industries could adversely affect our sales and our financial results by affecting demand for and pricing of our products.
Changes in our customers' productscustomers’ needs or failure of our products to meet customers'customers’ quality specifications could adversely affect our sales and profitability.
Our chemicals are used for a broad range of applications by our customers. Changes in our customers' productscustomers’ product needs or processes may enable our customers to reduce or eliminate consumption of the chemicals that we provide. Customers may also find alternative materials or processes that no longer require our products. Consequently, it is important that we develop new products to replace the sales of products that mature and decline in use.
Our products provide important performance attributes to our customers'customers’ products. If our products fail to meet the customers'customers’ specifications, perform in a manner consistent with quality specifications or have a shorter useful life than required, a customer could seek replacement of the product or damages for costs incurred as a result of the product failure. A successful claim or series of claims against us could have a material adverse effect on our financial condition and results of operations and could result in a loss of one or more customers.
Our business is subject to hazards common to chemical businesses, any of which could interrupt our production and adversely affect our results of operations.
Our business is subject to hazards common to chemical manufacturing, storage, handling and transportation, including explosions, fires, severe weather, natural disasters, mechanical failure, unscheduled downtime, transportation interruptions, traffic accidents involving our delivery vehicles, chemical spills, discharges or releases of toxic or hazardous substances or gases and other risks. These hazards could cause personal injury and loss of life, severe damage to or destruction of property and equipment, and environmental contamination. In addition, the occurrence of material operating problems at any of our facilities due to any of these hazards may diminishmake it impossible for us to make sales to our ability to meet our output goalscustomers and may result in a negative public or political reaction. Many of our facilities are bordered bynear significant residential populations which increaseincreases the risk of negative public or political reaction should an environmental issue occur and could lead to adverse zoning or other regulatory actions that could limit our ability to operate our business in those locations. Accordingly, these hazards and their consequences could have a material adverse effect on our operations as a whole, including our results of operations and cash flows, both during and after the period of operational difficulties.
We are highly dependent upon transportation infrastructure to ship and receive our products and delays in these shipments could adversely affect our results of operations.
Although we maintain a number of owned trucks and trailers, we rely heavily upon transportation provided by third parties (including common carriers, barge companies and rail companies) to deliver products to us and to our customers. Our access to third-party transportation is not guaranteed, and we may be unable to transport our products in a timely manner, or at all, in certain circumstances, or at economically attractive rates. Disruptions in transportation are increasingly common, are often out of our control, and can happen suddenly and without warning. Rail limitations, such as limitations in rail capacity, availability of railcars and adverse weather conditions have disrupted or delayed rail shipments in the past and we expect they will continue into the future. Barge shipments are delayed or impossible under certain circumstances, including during times of high or low water levels and when waterways are frozen. Truck transportation has been negatively impacted by a number of factors, including limited availability of qualified drivers and equipment, and limitations on drivers’ hours of service, and we expect these conditions will continue into the future. Our failure to ship or receive products in a timely and efficient manner could have a material adverse effect on our financial condition and results of operations.
Environmental, health and safety, transportation and storage laws and regulations cause us to incur substantial costs and may subject us to future liabilities.liabilities and risks.
We are subject to numerous federal, state and local environmental, health and safety laws and regulations in the jurisdictions in which we operate, including those governing the discharge of pollutants into the air and water, and the management, storage, transportation and disposal of hazardous substanceschemicals and wastes.wastes; product regulation; air water and soil contamination; and the investigation and cleanup of any spills or releases that may result from our management, handling, storage, sale, or transportation of chemicals and other products. The nature of our business exposes us to risks of liability under these laws and regulations due to the production, storage, use, transportation and sale of materials that can cause contamination or personal injury if released into the environment.regulations. Ongoing compliance with such laws and regulations is an important consideration for us and we invest substantial capital and incur significant operating costs in our compliance efforts. Governmental regulation has become increasingly strictIn addition, societal concerns regarding the safety of chemicals in recent years. We expect thiscommerce and their potential impact on the environment have resulted in a growing trend towards increasing levels of product safety and environmental protection regulations. These concerns have led to, continue and anticipate that compliance willcould continue to require increased capital expendituresresult in, more stringent regulatory intervention by governmental authorities. In addition, these concerns could influence public perceptions, impact the commercial viability of the products we sell and operating costs.increase the costs to comply with increasingly complex regulations, which could have a negative impact on our business, financial condition and results of operations.
In addition, we operate a fleet of more than 100 vehicles, primarily in our Water Treatment Group, which are highly regulated, including by the U.S. Department of Transportation (“DOT”). The DOT governs transportation matters including authorization to engage in motor carrier service, including the necessary permits to conduct our business, equipment operation, and safety. We are audited periodically by the DOT to ensure that we are in compliance with various safety, hours-of-service, and other rules and regulations. If we were found to be out of compliance, the DOT could severely restrict or otherwise impact our operations, which could have a material adverse effect on our operations as a whole, including our results of operations and cash flows.
If we violate environmental, health and safetyapplicable laws or regulations, in addition to being required to correct such violations, we could be held liable in administrative, civil or criminal proceedings for substantial fines and other sanctions that could disrupt, limit or limithalt our operations.operations, which could have a material adverse effect on our operations as a whole, including our results of operations and cash flows. Liabilities associated with the investigation and cleanup of releases of hazardous substances, as well as personal injury, property damages or natural resource damages arising out of such releases of hazardous substances, may be imposed in many situations without regard to violations of laws or regulations or other fault, and may also be imposed jointly and severally (so that a responsible party may be held liable for more than its share of the losses involved, or even the entire loss). Such liabilities can be difficult to identify and the extent of any such liabilities can be difficult to predict. We use, and in the past have used, hazardous substances at many of our facilities, and have generated, and continue to generate, hazardous wastes at a number of our facilities. We have in the past been, and may in the future be, subject to claims relating to exposure to hazardous materials and the associated liabilities may be material.
Our business exposes us to potential product liability claims and recalls, which could adversely affect our financial condition and performance.
The repackaging, blending, mixing and distribution of chemical products by us, including products used in food or food ingredients or with medical, pharmaceutical or nutritional supplement applications, involve an inherent risk of exposure to product liability claims, product recalls, product seizures and related adverse publicity, including, without limitation, claims for exposure to our products, spills or escape of our products, personal injuries, food-related claims and property damage or environmental claims. A product liability claim, judgment or recall against our customers could also result in substantial and unexpected expenditures for us, affect consumer confidence in our products and divert management’s attention from other responsibilities. Although we maintain product liability insurance, there can be no assurance that the type or level of coverage is adequate or that we will be able to continue to maintain our existing insurance or obtain comparable insurance at a reasonable cost, if at all. A product recall or a partially or completely uninsured judgment against us could have a material adverse effect on our business, financial condition and results of operations.
Our business, particularly that of our Water Treatment Group and our agricultural product sales, is subject to seasonality and weather conditions, which could adversely affect our results of operations.
Our Water Treatment Group has historically experienced higher sales during April to September, primarily due to a seasonal increase in chemicals used by municipal water treatment facilities. Our agricultural product sales are also seasonal, primarily corresponding with the planting and harvesting seasons. Demand in both of these areas is also affected by weather conditions, as either higher or lower than normal precipitation or temperatures may affect water usage and the timing and the amount of consumption of our products. We cannot assure you that seasonality or fluctuating weather conditions will not have a material adverse effect on our results of operations.
The insurance that we maintain may not fully cover all potential exposures.
We maintain property, business interruption and casualty insurance, but such insurance may not cover all risks associated with the hazards of our business and is subject to limitations, including deductibles and limits on the liabilities covered. We may incur losses beyond the limits or outside the coverage of our insurance policies, including liabilities for environmental remediation. In addition, from time to time, various types of insurance for companies in the specialty chemical industry have not been available on commercially acceptable terms or, in some cases, have not been available at all. In the future, we may not be able to obtain coverage at current levels, and our premiums may increase significantly on coverage that we maintain.
If we are unable to retain key personnel or attract new skilled personnel, it could have an adverse impact on our business.
Because of the specialized and technical nature of our business, our future performance is dependent on the continued service of, and on our ability to attract and retain, qualified management, scientific, technical and support personnel. The unanticipated departure of key members of our management team could have an adverse impact on our business.
We may not be able to successfully consummate future acquisitions or integrate acquisitions into our business, which could result in unanticipated expenses and losses.
As part of our business growth strategy, we have acquired businesses and may pursue acquisitions in the future. Our ability to pursue this strategy will be limited by our ability to identify appropriate acquisition candidates and our financial resources, including available cash and borrowing capacity. The expense incurred in consummating acquisitions, the time it takes to integrate an acquisition or our failure to integrate businesses successfully could result in unanticipated expenses and losses. Furthermore, we may not be able to realize the anticipated benefits from acquisitions.
The process of integrating acquired operations into our existing operations may result in unforeseen operating difficulties and may require significant financial resources that would otherwise be available for the ongoing development or expansion of existing operations. The risks associated with the integration of acquisitions include potential disruption of our ongoing business and distraction of management, unforeseen claims, liabilities, adjustments, charges and write-offs, difficulty in conforming the acquired business'business’ standards, processes, procedures and controls with our operations, and challenges arising from the increased scope, geographic diversity and complexity of the expanded operations.
Our business is subject to risks stemming from natural disasters or other extraordinary events outside of our control, which could interrupt our production and adversely affect our results of operations.
Natural disasters have the potential of interrupting our operations and damaging our properties, which could adversely affect our business. Since 1963, flooding of the Mississippi River has required the Company'sCompany’s terminal operations to be temporarily shifted out of its buildings seven times, including three times since the spring of 2010. We can give no assurance that flooding or other natural disasters will not recur or that there will not be material damage or interruption to our operations in the future from such disasters.
Chemical-related assets may be at greater risk of future terrorist attacks than other possible targets in the United States. Federal law imposes site security requirements, specifically on chemical facilities, which have increased our overhead expenses. Federal regulations have also been adopted to increase the security of the transportation of hazardous chemicals in the United States. We ship and receive materials that are classified as hazardous and we believe we have met these requirements, but additional federal and local regulations that limit the distribution of hazardous materials are being considered. Bans on movement of hazardous materials through certain cities could adversely affect the efficiency of our logistical operations. Broader restrictions on hazardous material movements could lead to additional investment and could change where and what products we provide.
The occurrence of extraordinary events, including future terrorist attacks and the outbreak or escalation of hostilities, cannot be predicted, but their occurrence can be expected to negatively affect the economy in general, and specifically the markets for our products. The resulting damage from a direct attack on our assets, or assets used by us, could include loss of life and property damage. In addition, available insurance coverage may not be sufficient to cover all of the damage incurred or, if available, may be prohibitively expensive.
We may not be able to renew our leases of land where four of our operations facilities reside.
We lease the land where our three main terminals are located and where aanother significant manufacturing plant is located. We do not have guaranteed lease renewal options and may not be able to renew our leases in the future. Our current lease renewal periods extend out to 2018 (two(2 leases), 2023 (one lease) and 2029 (one lease). We are currently in negotiations to extend the two leases expiring in 2018 for a period of 15-20 years. The failure to secure extended lease terms on any one of
these facilities may have a material adverse impact on our business, as they are where a significant portion of our chemicals are manufactured and where the majority of our bulk chemicals are stored. While we can make no assurances, based on historical experience and anticipated future needs, we intend to extend these leases and believe that we will be able to renew our leases as the renewal periods expire. If we are unable to renew three of our leases (two relate to terminals and one to manufacturing) any property remaining on the land becomes the property of the lessor, and the lessor has the option to either maintain the property or remove the property at our expense. These asset retirement obligations andThe fourth lease provides that we turn any property remaining on the land over to the lessor for them to maintain or remove at their expense. The cost to relocate our operations could have a material adverse effect on our results of operations and financial condition.
ITEM 1B. UNRESOLVED STAFF COMMENTS
None.
ITEM 2. PROPERTIES
Our corporate office is located in Roseville, MN,Minnesota, where we lease approximately 40,000 square feet under a subleaselease with an initial term through December 31, 2021. We own our principal manufacturing, warehousing, and distribution location in Minneapolis, Minnesota, which consists of approximately 11 acres of land, with six buildings containing a total of 177,000 square feet of office and warehouse space primarily used by our Industrial Group. We have installed sprinkler systems in substantially all of our warehouse facilities for fire protection. We believe that we carry customary levels of insurance covering the replacement of damaged property.
In addition to the facilities described previously, our other facilities are described below. We believe that these facilities, together with those described above, are adequate and suitable for the purposes they serve. Unless noted, each facility is owned by us and is primarily used as office and warehouse.
|
| | | | | |
| | | | | |
| | Group | Location | | Approx. Square Feet | |
| | Industrial | St. Paul, MN(1)Camanche, IA | | 32,00095,000 |
| | Centralia, IL(1) | | 77,000 |
| | Dupo, IL(2) | | 64,000 |
| | | Minneapolis, MN(2)MN(3) | | 29,000 | 9,000 |
| | | Centralia, IL(3)St. Paul, MN(4) | | 77,000 | |
| | Camanche, IA(4) | | 95,000 | |
| | St Louis, MO(4) | | 6,000 | |
| | Dupo, IL(4) | | 64,000 | 32,000 |
| | | Rosemount, MN(5) | | 63,000 |
| | | St Louis, MO | | 6,000 |
| | Water Treatment | Ft. Smith, AR(6) | | 17,000 |
| | Apopka, FL(6) | | 32,100 |
| | Big Pine Key, FL(6) | | 4,200 |
| | Hollywood, FL(6) | | 5,400 |
| | LaBelle, FL(6) | | 8,200 |
| | Monticello, FL(6) | | 5,000 |
| | Starke, FL(6) | | 4,000 |
| | Webster, FL(6) | | 6,500 |
| | Eldridge, IA | | 6,000 |
| | Slater, IA | | 12,000 |
| | Centralia, IL | | 39,000 |
| | Havana, IL | | 16,000 |
| | Peotone, IL(6) | | 18,000 |
| | Muncie, IN | | 12,000 |
| | Garnett, KS | | 18,000 |
| | Frankfort, KY(7) | | 20,000 |
| | Columbia, MO(6) | | 14,000 |
| | Billings, MT | | 9,000 |
| | Fargo, ND | | 20,000 |
| | | Washburn, ND | | 14,000 |
| | Lincoln, NE(6) | | 16,000 |
| | Tulsa, OK | | 7,300 |
| | Sioux Falls, SD | | 27,000 |
| | Rapid City, SD | | 9,000 |
| | | Fond du Lac, WI | | 24,000 | |
| | Washburn, ND | | 14,000 | |
| | Billings, MT | | 9,000 | |
| | Sioux Falls, SD | | 27,000 | |
| | Rapid City, SD | | 9,000 | |
| | Peotone, IL(6) | | 18,000 | |
| | | Superior, WI | | 17,000 | |
| | Slater, IA | | 12,000 | |
| | Lincoln, NE(6) | | 16,000 | |
| | Eldridge, IA | | 6,000 | |
| | Columbia, MO(6) | | 14,000 | |
| | Garnett, KS | | 18,000 | |
| | Ft. Smith, AR(6) | | 17,000 | |
| | Muncie, IN | | 12,000 | |
| | Centralia, IL | | 39,000 | |
| | Havana, IL | | 16,000 | |
| | Industrial and Water Treatment | St. Paul, MN(7)MN(8) | | 59,000 | |
| | | Memphis, TN(4)TN | | 41,000 | |
| |
| (1) | This facility includes 10 acres of land located in Centralia, Illinois owned by the Company. The facility includes manufacturing capacity and primarily serves our food-grade products and agriculture businesses. |
| |
| (2) | The land for this manufacturing and packaging facility is leased from a third party, with the lease expiring in May 2023. |
| |
| (3) | This facility is leased from a third party and is warehouse space. |
| |
| (4) | Our terminal operations, located at two sites on opposite sides of the Mississippi River, are made up of three buildings, outside storage tanks for the storage of liquid bulk chemicals, including caustic soda, as well as numerous smaller tanks for storing and mixing chemicals. The land is leased from the Port Authority of the City of St. Paul, Minnesota. The applicable leases run until December 2013, at which time we have an optionthrough 2018. We are in negotiations to renew theextend these leases for an additional five-yeara period on the same terms and conditions subject to renegotiation of rent. |
| |
(2) | This facility is leased from a third party to serve our bulk pharmaceutical customers. |
| |
(3) | This facility includes 10 acres of land located in Centralia, Illinois owned by the company. The facility became operational in July 2009, includes manufacturing capacity and primarily serves our food-grade products business. Prior to fiscal 2011 this facility was shared with the Water Treatment Group. |
| |
(4) | The acquisition of Vertex in fiscal 2011 included an office building located in St Louis, Missouri and manufacturing and warehouse facilities located in Memphis, Tennessee; Camanche, Iowa; and Dupo, Illinois. All of the facilities and land are owned by the company with the exception of the land in Dupo, Illinois, which is leased from a third party. The lease runs through May, 2023. The facility in Memphis is shared between the Industrial and Water Treatment Groups.15-20 years. |
| |
| (5) | This facility includes 28 acres of land owned by the company.Company. This manufacturing facility was constructed by us and became operational in late fiscal 2013.has outside storage tanks for the storage of bulk chemicals, as well as numerous smaller tanks for storing and mixing chemicals. |
| |
| (6) | This facility is leased from a third party.party and is warehouse space. |
| |
| (7) | This facility was purchased in fiscal 2015 and will begin operations in early fiscal 2016. |
| |
| (8) | Our Red Rock facility, which consists of a 59,000 square-foot building located on approximately 10 acres of land, has outside storage capacity for liquid bulk chemicals, as well as numerous smaller tanks for storing and mixing chemicals. The land is leased from the Port Authority of the City of St. Paul, Minnesota and the lease runs until 2029. |
ITEM 3. LEGAL PROCEEDINGS
As previously reported in our quarterly report on Form 10-Q forThere are no material pending legal proceedings, other than ordinary routine litigation incidental to the first quarter of fiscal 2013, on June 15, 2012, we entered into a settlement agreement with ICL Performance Products LP (“ICL”), a chemical supplier to us, pursuantbusiness, to which we mutually resolved the previously disclosed litigation and all disputes among us. The settlement agreement provided for a cash payment by us to ICL and provided that both parties enter into new contracts for the supply by ICLor any of certain chemicals to us. Our obligations under the settlement agreement resulted in a $3.2 million charge to pre-tax income recorded in cost of sales (approximately $2.0 million after tax) during the first quarter of fiscal 2013.
Weour subsidiaries are a party from time to time in other legal proceedings arising in the ordinary courseor of which any of our business. To date, other litigation has not had a material effect on us.property is the subject.
ITEM 4. MINE SAFETY DISCLOSURES
Not applicable.
PART II
| |
ITEM 5. | MARKET FOR THE COMPANY’S COMMON EQUITY, RELATED SHAREHOLDER MATTERS, AND ISSUER PURCHASES OF EQUITY SECURITIES |
|
| | | | | | | | |
| Quarterly Stock Data | | High | | Low |
| Fiscal 2013 | | | | |
4th Quarter | | $ | 40.96 |
| | $ | 37.25 |
|
3rd Quarter | | 42.04 |
| | 36.18 |
|
2nd Quarter | | 42.29 |
| | 35.77 |
|
1st Quarter | | 38.53 |
| | 31.06 |
|
| Fiscal 2012 | | | | |
4th Quarter | | $ | 42.93 |
| | $ | 34.36 |
|
3rd Quarter | | 40.89 |
| | 29.05 |
|
2nd Quarter | | 38.66 |
| | 30.14 |
|
1st Quarter | | 47.48 |
| | 33.30 |
|
|
| | | | | | | | |
| Cash Dividends | | Declared | | Paid |
| Fiscal 2014 | | | | |
1st Quarter | | — |
| | $ | 0.34 |
|
| Fiscal 2013 | | | | |
4th Quarter | | $ | 0.34 |
| | — |
|
3rd Quarter | | — |
| | $ | 0.34 |
|
2nd Quarter | | $ | 0.34 |
| | — |
|
1st Quarter | | — |
| | $ | 0.32 |
|
| Fiscal 2012 | | | | |
4th Quarter | | $ | 0.32 |
| | — |
|
3rd Quarter | | — |
| | $ | 0.32 |
|
2nd Quarter | | $ | 0.32 |
| | — |
|
1st Quarter | | — |
| | $ | 0.30 |
|
|
| | | | | | | | | |
| | Quarterly Stock Data | | High | | Low |
| | Fiscal 2015 | | | | |
| | 4th Quarter | | $ | 44.30 |
| | $ | 36.93 |
|
| | 3rd Quarter | | 45.13 |
| | 33.22 |
|
| | 2nd Quarter | | 38.00 |
| | 34.00 |
|
| | 1st Quarter | | 37.75 |
| | 32.98 |
|
| | Fiscal 2014 | | | | |
| | 4th Quarter | | $ | 37.29 |
| | $ | 33.25 |
|
| | 3rd Quarter | | 38.21 |
| | 35.29 |
|
| | 2nd Quarter | | 44.00 |
| | 36.50 |
|
| | 1st Quarter | | 41.00 |
| | 35.92 |
|
|
| | | | | | | | | |
| | Cash Dividends | | Declared | | Paid |
| | Fiscal 2016 | | | | |
| | 1st Quarter | | — |
| | $ | 0.38 |
|
| | Fiscal 2015 | | | | |
| | 4th Quarter | | $ | 0.38 |
| | — |
|
| | 3rd Quarter | | — |
| | $ | 0.38 |
|
| | 2nd Quarter | | $ | 0.38 |
| | — |
|
| | 1st Quarter | | — |
| | $ | 0.36 |
|
| | Fiscal 2014 | | | | |
| | 4th Quarter | | $ | 0.36 |
| | — |
|
| | 3rd Quarter | | — |
| | $ | 0.36 |
|
| | 2nd Quarter | | $ | 0.36 |
| | — |
|
| | 1st Quarter | | — |
| | $ | 0.34 |
|
Our common shares are traded on The NASDAQ Global Market under the symbol “HWKN.” The price information represents closing salesales prices as reported by The NASDAQ Global Market. As of March 31, 2013,May 22, 2015, shares of our common stock were held by approximately 488464 shareholders of record.
We first started paying cash dividends in 1985 and have continued to do so since. Future dividend levels will be dependent upon our consolidated results of operations, financial position, cash flows and other factors, and will be evaluatedare subject to approval by our Board of Directors.
We did not sellOn May 29, 2014, our Board of Directors authorized a share repurchase program of up to 300,000 shares of our outstanding common stock. The shares may be repurchased on the open market or repurchase any sharesin privately negotiated transactions subject to applicable securities laws and regulations. The following table sets forth information concerning purchases of our common stock duringfor the fourth quarter of fiscal 2013.
ended March 29, 2015:
|
| | | | | | | | |
| Period | Total Number of Shares Purchased | Average Price Paid Per Share | Total Number of Shares Purchased as Part of a Publicly Announced Plan or Program | Maximum Number of Shares that May Yet be Purchased under Plans or Programs |
| 12/29/2014-1/25/2015 | — |
| — |
| — |
| 259,980 |
|
| 1/26/2015-2/22/2015 | — |
| — |
| — |
| 259,980 |
|
| 2/23/2015-03/29/2015 | 19,582 |
| 37.76 |
| 19,582 |
| 240,398 |
|
| Total | 19,582 |
| — |
| 19,582 |
| |
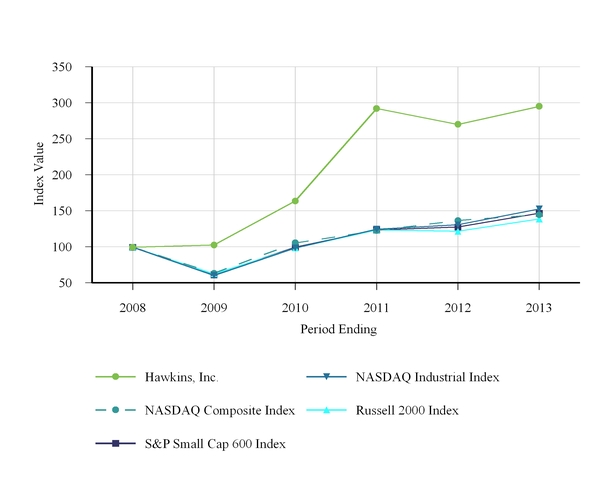
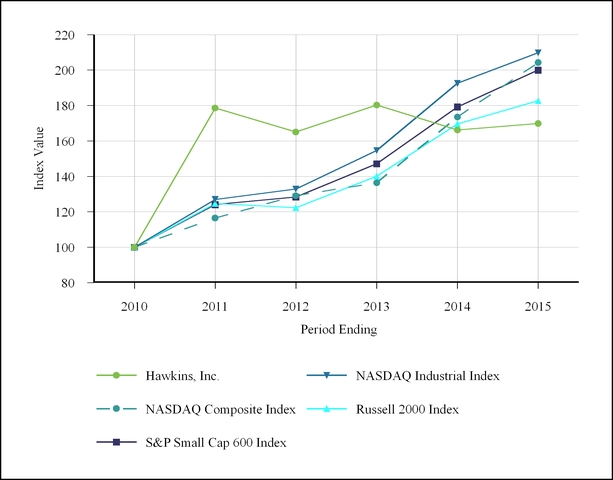
The following graph compares the cumulative total shareholder return on our common shares with the cumulative total returns of the NASDAQ Industrial Index, the NASDAQ Composite Index, the Russell 2000 Index and the Standard & Poor'sPoor’s (“S&P”) Small Cap 600 Index for our last five completed fiscal years. The graph assumes the investment of $100 in our stock, the NASDAQ Industrial Index, the NASDAQ Composite Index, the Russell 2000 Index and the S&P Small Cap 600 Index on March 30, 2008,2010, and reinvestment of all dividends.
ITEM 6. SELECTED FINANCIAL DATA
Selected financial data for the CompanyCompany’s continuing operations is presented in the table below and should be read in conjunction with Management’s Discussion and Analysis of Financial Condition and Results of Operations included in Item 7 and the Company’s consolidated financial statements and notes thereto included in Item 8 herein. Total assets shown below are for the Company’s total operations.
| | | | | | | Fiscal Years | | Fiscal Years |
| | | 2013 | | 2012 | | 2011 | | 2010 | | 2009 | | | 2015 | | 2014 | | 2013 | | 2012 | | 2011 | |
| | | (In thousands, except per share data) | | (In thousands, except per share data) |
| Sales from continuing operations | | $ | 350,387 |
| | $ | 343,834 |
| | $ | 297,641 |
| | $ | 257,099 |
| | $ | 284,356 |
| | |
| Gross profit from continuing operations | | 56,936 |
| | 65,868 |
| | 61,902 |
| | 64,445 |
| | 62,420 |
| | |
| Sales | | | $ | 364,023 |
| | $ | 348,263 |
| | $ | 350,387 |
| | $ | 343,834 |
| | $ | 297,641 |
| |
| Gross profit | | | 65,791 |
| | 61,600 |
| | 56,936 |
| | 65,868 |
| | 61,902 |
| |
| Income from continuing operations | | 17,108 |
| | 21,628 |
| | 20,314 |
| | 23,738 |
| | 23,424 |
| | | 19,214 |
| | 18,094 |
| | 17,108 |
| | 21,628 |
| | 20,314 |
| |
| Basic earnings per common share from continuing operations | | 1.64 |
| | 2.09 |
| | 1.98 |
| | 2.32 |
| | 2.29 |
| | |
| Diluted earnings per common share from continuing operations | | 1.62 |
| | 2.08 |
| | 1.96 |
| | 2.31 |
| | 2.29 |
| | |
| Basic earnings per common share | | | 1.82 |
| | 1.72 |
| | 1.64 |
| | 2.09 |
| | 1.98 |
| |
| Diluted earnings per common share | | | 1.81 |
| | 1.71 |
| | 1.62 |
| | 2.08 |
| | 1.96 |
| |
| Cash dividends declared per common share | | 0.68 |
| | 0.64 |
| | 0.70 |
| | 0.66 |
| | 0.52 |
| | | 0.76 |
| | 0.72 |
| | 0.68 |
| | 0.64 |
| | 0.70 |
| |
| Cash dividends paid per common share | | 0.66 |
| | 0.62 |
| | 0.68 |
| | 0.64 |
| | 0.50 |
| | | 0.74 |
| | 0.70 |
| | 0.66 |
| | 0.62 |
| | 0.68 |
| |
| Total assets | | $ | 222,148 |
| | $ | 204,081 |
| | $ | 185,005 |
| | $ | 160,293 |
| | $ | 136,290 |
| | | $ | 248,462 |
| | $ | 237,193 |
| | $ | 222,148 |
| | $ | 204,081 |
| | $ | 185,005 |
| |
We acquired substantially all the assets of The Dumont Company, Inc. in the third quarter of fiscal 2015, and we acquired substantially all the assets of Vertex Chemical Corporation in late fiscal 2011. The results of these operations since the acquisition dates are included in our consolidated results of operations.
| |
ITEM 7. | MANAGEMENT’S DISCUSSION AND ANALYSIS OF FINANCIAL CONDITION AND RESULTS OF OPERATIONS |
ITEM 7. MANAGEMENT’S DISCUSSION AND ANALYSIS OF FINANCIAL CONDITION AND RESULTS OF OPERATIONS
The following is a discussion and analysis of our financial condition and results of operations for fiscal 2013, 20122015, 2014 and 2011.2013. This discussion should be read in conjunction with the Financial Statements and Notes to Financial Statements included in Item 8 of this Annual Report on Form 10-K.
Overview
We derive substantially all of our revenues from the sale of bulk and specialty chemicals to our customers in a wide variety of industries. We began our operations primarily as a distributor of bulk chemicals with a strong customer focus. Over the years, we have maintained the strong customer focus and have expanded our business by increasing our sales of value-added specialty chemical products, including repackaging,manufacturing, blending and manufacturingrepackaging certain products. In recent years, we have expanded the sales of our higher-margin blended and manufactured products.
Recent Acquisitions and Business Expansion
On October 20, 2014, we acquired substantially all of the assets of The Dumont Company, Inc. (“Dumont”) under the terms of an asset purchase agreement with Dumont and its shareholders. We paid $10.1 million in cash including a working capital adjustment, using available cash on hand to fund the acquisition. Dumont was a water treatment chemical distribution company with revenues of approximately $14.0 million in calendar year 2013. Through this acquisition we added seven operating locations across Florida serving municipal water and wastewater treatment, private utilities, commercial swimming pools, irrigation water treatment and food processing chemical markets. The results of operations since the acquisition date are included in our Water Treatment Segment.
In the third quarter of fiscal 2014, we acquired substantially all the assets of Advance Chemical Solutions, Inc. (“ACS”). We paid $2.4 million in cash at closing, and have continuedpaid an additional $0.4 million of a potential $0.5 million earnout. We may be obligated to investpay the remainder of the earnout over the next two years based on the achievement of certain financial performance targets. ACS had revenues of approximately $4.0 million for the 12 months ended September 30, 2013. The results of its operations since the acquisition date are included in growing our business. Water Treatment segment.
During fiscal 2012,2013, we purchased a 28-acre parcel of land in Rosemount, Minnesota and begancompleted construction of a new facility on the site. This Industrial manufacturing facility became operational in late fiscal 2013.Rosemount, Minnesota. The site provides capacity for future business growth and lessens our dependence on our flood-prone sites on the Mississippi River. While we have transferred some blending and manufacturing activity to the Rosemount site, we do not intend to close any sites we currently operate as a result of this transfer of activity. In fiscal 2013, we We
incurred incremental costs related to operate this new facility during fiscal 2014 as compared to fiscal 2013 of approximately $1.3$1.7 million, which have been recorded in cost of sales in our Industrial segment.
Through the acquisitions described above, we opened seven new branches for our Water Treatment Group in fiscal 2015 and anticipate additional incremental costs of approximately $1.2 million to operate this facility for the entire yearone in fiscal 2014. We are opening one new branch in early fiscal 2016 and opened one in fiscal 2013. We expect to continue to invest in existing and new branches to expand our Water Treatment Group’s geographic coverage. The cost of any one of these expansion branches is not expected to be material. In addition, in fiscal 2015 and continuing into fiscal 2016, we have proactively added route sales and other support personnel to Water Treatment Group branch offices within our existing geographic coverage area. While these additions will add costs in the near term, we expect these investments to better position us for future growth.
Share Repurchase Program
In April 2013,the first quarter of fiscal 2015, our Board of Directors authorized a share repurchase program of up to 300,000 shares of our outstanding common stock. The shares may be repurchased on the open market or in privately negotiated transactions subject to applicable securities laws and regulations. The primary objective of the share repurchase program is to offset the impact of dilution from issuances relating to employee and director equity grants and our employee stock purchase program. During fiscal 2015 we repurchased 59,602 shares of common stock with an aggregate purchase price of $2.2 million.
Other Events
In fiscal 2014, we moved into a new corporate headquarters located in Roseville, Minnesota. The move was necessary because we had outgrown our former corporate headquarters that had been our home for over 60 years. As a result of this move, we expectincurred incremental costs during fiscal 2014 as compared to incur incremental costsfiscal 2013 of approximately $1.0 million, to leaserecorded in selling, general and operate this facility starting inadministrative expenses and allocated among both our Water Treatment and Industrial segments.
In fiscal 2014.
We2013, we recorded a pre-tax charge of $7.2$7.2 million in our Industrial segment (approximately $4.5$4.5 million after tax, or $0.43$0.43 per share, fully diluted) in the third quarter of fiscal 2013.diluted share). This charge represented the discounted value of our estimated withdrawal payment obligation from the Central States, Southeast and Southwest Areas Pension Fund (“CSS” or “the plan”), a collectively bargained multiemployer pension plan. Our participationThe withdrawal liability will be paid over 20 years and our payments began in the plan was pursuant to two collective bargaining agreements that were modified during the fourththird quarter of fiscal 2013 to discontinue our participation in CSS. As a replacement for CSS, we have agreed to provide defined-contribution retirement benefits to our union employees that are similar to those benefits currently offered to our non-union employees. We estimate the aggregate cash payments to be made to total approximately $9.3 million, or $467,000 per year beginning some time in fiscal 2014 and continuing annually for twenty years. We have accrued the discounted value of that payment obligation in the “Pension withdrawal” line item on the consolidated statements of income for fiscal 2013.
The ultimate amount of the withdrawal liability assessed by CSS could be impacted by a number of factors, including, among other things, a mass withdrawal (generally a withdrawal of substantially all contributing employers), the number of work weeks reported to CSS by us, the hourly contribution rate paid by us, the continued participation of other employers in CSS, financial difficulty of other participating employers in the plan (including bankruptcy), investment returns, benefit levels, and interest rates. Any assessment in excess of our accrual could impact our future results of operations and financial condition.2014.
In fiscal 2013, we entered into a settlement agreement with ICL Performance Products LP (“ICL”), a chemical supplier to us, pursuant to which we mutually resolved the previously disclosed litigation and all disputes amongbetween us. The settlement agreement provided for a cash payment by us to ICLthe supplier and provided that both parties enter into new contracts for the supply by ICLthe supplier of certain chemicals to us. Our obligations under the settlement agreement resulted in a $3.2$3.2 million charge to pre-tax income recorded in cost of sales (approximately $2.0 million after tax or $0.19 per share, fully diluted) in the first quarter of fiscal 2013. Of the total charge, $2.1 million was paid in fiscal 2013.
We anticipate that in fiscal 2014 we will be vacating our leased facility currently used to produce our bulk pharmaceutical products. We will transfer production of certain of these products to our other Industrial production facilities and discontinue production of the remaining product lines. As a result, we recorded a pre-tax charge of approximately $0.4 million in our Industrial segment (approximately $0.2$2.0 million after tax) related to accelerated depreciation on leasehold improvements and manufacturing equipment related to this facility in the fourth quarter of fiscal 2013. We expect to incur pre-tax charges of $0.8 to $1.0 million during the first half of fiscal 2014 related to additional depreciation expense and other costs associated with exiting this facility.tax, or $0.19 per fully diluted share).
In fiscal 2011, we completed the acquisition of substantially all of the assets of Vertex for approximately $27.2 million. In addition to the manufacture of sodium hypochlorite bleaches, Vertex distributes and provides terminal services for bulk liquid inorganic chemicals, and contract and private label packaging for household chemicals. We believe the acquisition strengthens our market position in the Midwest. Operating results of Vertex are included in our consolidated results of operations from the date of acquisition in this Annual Report on Form 10-K as part of our Industrial segment. See Note 2 to the Consolidated Financial Statements for further information.
We opened one new branch for our Water Treatment Group in fiscal 2013, one in fiscal 2012, and two in fiscal 2011, and expect to continue to invest in existing and new branches to expand our Water Treatment Group's geographic coverage. The cost of these branch expansions is not expected to be material. In addition, we have selectively added route sales personnel to certain existing Water Treatment Group branch offices to spur growth within our existing geographic coverage area.Overview
OurAn overview of our financial performance in fiscal 20132015 was highlighted by:is provided below:
Sales from continuing operations of $350.4364.0 million, a 1.9%4.5% increase from fiscal 20122014;
Gross profit from continuing operations of $56.965.8 million, or 16.2%18.1% of sales, an increase of $8.94.2 milliondecrease in gross profit dollars from fiscal 20122014, which was negatively impacted by non-recurring charges of $7.2 million related to our withdrawal from a multiemployer pension plan and $3.2 million related to a litigation settlement;;
Net cash provided by operating activities of $35.520.7 million; and
Cash and cash equivalents and investments available for sale of $49.950.4 million as of the end of fiscal 20132015.
We seek to maintain relatively constant gross profit dollars per unit sold on each of our products as the cost of our raw materials increase or decrease.decrease, subject to competitive pricing pressures that may negatively impact our gross profit dollars per unit sold. Since we expect that we will continue to experience fluctuations in our raw material costs and resulting prices in the future, we believe that gross profit dollars is the best measure of our profitability from the sale of our products. If we maintain relatively stableproducts, as opposed to gross profit dollars on eachas a percentage of our products, our reported gross profit percentage will decrease when the cost of the product increases and will increase when the cost of the product decreases.sales.
We use the last in, first out (“LIFO”) method of valuing the vast majority of our inventory, which causes the most recent product costs to be recognized in our income statement. The valuation of LIFO inventory for interim periods is based on our estimates of fiscal year-end inventory levels and costs. The LIFO inventory valuation method and the resulting cost of sales are consistent with our business practices of pricing to current bulk chemical raw material prices. Our LIFO reserve decreasedincreased by $0.4 million in fiscal 20132015 primarily due to reduced volumes of certain bulk productsan increase in inventory at year-end,volumes on hand, resulting in an increasea decrease to our reported gross profit for the year. In fiscal 2012,
2014, our LIFO reserve increaseddecreased by $1.61.9 million due to the higher volumes and the mix of bulk chemicals in inventory at the end of the year. This increase in the reserve reduced, increasing our reported gross profit for that year. The reduction in the LIFO reserve in fiscal 2012.2014 was primarily due to lower volumes of inventory on hand at year-end, driven by cold and wintry weather that resulted in rail car and barge shipment delays during the fourth quarter of fiscal 2014.
We disclose the sales of our bulk commodity products as a percentage of total sales dollars. Our definition of bulk commodity products includes products that we do not modify in any way, but receive, store, and ship from our facilities, or direct ship to our customers in large quantities. We review our sales reporting on a periodic basis to ensure we are including all products that meet this definition. The disclosures in this document referring to sales of bulk commodity products have been updated for all periods presented based on the most recent review.
Results of Operations
The following table sets forth certain items from our statement of income as a percentage of sales from period to period:
| | | | | Fiscal 2013 | | Fiscal 2012 | | Fiscal 2011 | | Fiscal 2015 | | Fiscal 2014 | | Fiscal 2013 |
| Sales | | 100.0 | % | | 100.0 | % | | 100.0 | % | | 100.0 | % | | 100.0 | % | | 100.0 | % |
| Cost of sales | | (81.7 | )% | | (80.8 | )% | | (79.2 | )% | | (81.9 | )% | | (82.3 | )% | | (81.7 | )% |
| Pension withdrawal | | (2.1 | )% | | — | % | | — | % | | — | % | | — | % | | (2.1 | )% |
| Gross profit | | 16.2 | % | | 19.2 | % | | 20.8 | % | | 18.1 | % | | 17.7 | % | | 16.2 | % |
| Selling, general and administrative expenses | | (9.0 | )% | | (9.0 | )% | | (10.1 | )% | | (9.7 | )% | | (9.6 | )% | | (9.0 | )% |
| Operating income | | 7.2 | % | | 10.2 | % | | 10.7 | % | | 8.4 | % | | 8.1 | % | | 7.2 | % |
| Investment income | | 0.1 | % | | 0.1 | % | | 0.1 | % | |
| Interest (expense) income, net | | | — | % | | — | % | | 0.1 | % |
| Income from continuing operations before income taxes | | 7.3 | % | | 10.3 | % | | 10.8 | % | | 8.4 | % | | 8.1 | % | | 7.3 | % |
| Provision for income taxes | | (2.4 | )% | | (4.0 | )% | | (4.0 | )% | |
| Income tax provision | | | (3.1 | )% | | (2.9 | )% | | (2.4 | )% |
| Income from continuing operations | | 4.9 | % | | 6.3 | % | | 6.8 | % | | 5.3 | % | | 5.2 | % | | 4.9 | % |
| Income from discontinued operations, net of tax | | — | % | | 0.3 | % | | — | % | | — | % | | — | % | | — | % |
| Net income | | 4.9 | % | | 6.6 | % | | 6.8 | % | | 5.3 | % | | 5.2 | % | | 4.9 | % |
Fiscal 20132015 Compared to Fiscal 20122014
Sales
Sales increased$6.6 $15.8 million,, or 1.9%4.5%, to $350.4$364.0 million for fiscal 2013,2015, as compared to sales of $343.8$348.3 million for fiscal 2012. The increase in sales was primarily due to increased sales in our Water Treatment segment driven by favorable weather conditions during the first half of fiscal 2013 and volume growth of lower-priced bulk products in both of our segments, partially offset by lower sales of other products in our Industrial segment.2014. Sales of bulk chemicals, including caustic soda,commodity products were approximately 24%22% of sales compared to approximatelyin fiscal 2015 and 23% in the previous year.fiscal 2014.
Industrial Segment. Industrial segment sales decreased$2.9increased $4.2 million,, or 1.2%1.7%, to $248.6$249.1 million for fiscal 2015. Volumes increased year-over-year; however, lower raw material prices and competitive pricing pressures in certain product lines resulted in lower per-unit selling prices.
Water Treatment Segment.2013 Water Treatment segment sales increased $11.6 million, or 11.2%, to $115.0 million for fiscal 2015. Our recently acquired Florida and Oklahoma locations accounted for $7.9 million of the total increase. In addition, growth in our newer branches and increased sales of specialty chemicals were partially offset by the impact of lower raw material prices.
Gross Profit
Gross profit was $65.8 million, or 18.1% of sales, for fiscal 2015, as compared to $61.6 million, or 17.7% of sales, for fiscal 2014. The LIFO method of valuing inventory decreased gross profit by $0.4 million for fiscal 2015, while it increased gross profit by $1.9 million for fiscal 2014.
Industrial Segment.. While overall Gross profit for the Industrial segment was $33.6 million, or 13.5% of sales, for fiscal 2015, an increase of $1.6 million from $32.0 million, or 13.1% of sales, for fiscal 2014. The increase in gross profit dollars was driven by higher sales volumes in fiscal 2015 as compared to fiscal 2014, partially offset by lower per-unit margins due to continued competitive pricing pressures in certain product lines. Gross profit for fiscal 2015 as compared to fiscal 2014 was favorably impacted by $0.3 million, as costs incurred in fiscal 2014 to exit a leased facility were partially offset by accelerated depreciation on assets incurred in fiscal
2015 in connection with a construction project. The LIFO method of valuing inventory decreased gross profit in our industrial segment by $0.3 million in fiscal 2015, while it increased gross profit by $1.6 million in fiscal 2014.
Water Treatment Segment. Gross profit for the Water Treatment segment increased $2.6 million to $32.2 million, or 28.0% of sales, for fiscal 2015, as compared to $29.6 million, or 28.6% of sales, for fiscal 2014. The increase in gross profit dollars was a result of higher sales volumes across most of our branches, in particular the addition of our recently acquired Florida and Oklahoma locations, along with increased sales of specialty chemicals. Gross profit as a percentage of sales decreased primarily due to the addition of and growth in our newer branches that have lower per-branch revenues, and the costs to operate these branches represent a higher percentage of their sales than many of our existing branches. The LIFO method of valuing inventory decreased gross profit by $0.1 million in fiscal 2015, while it increased gross profit by $0.3 million in fiscal 2014.
Selling, General and Administrative Expenses
Selling, general and administrative expenses were $35.4 million, or 9.7% of sales, for fiscal 2015, as compared to $33.5 million, or 9.6% of sales, for fiscal 2014. The expenses increased in our Water Treatment segment, with $1.6 million of the increase due to our recently acquired Florida and Oklahoma locations, and the remainder of the increase driven by the addition of sales personnel in existing locations.
Operating Income
Operating income was $30.4 million, or 8.4% of sales, for fiscal 2015, as compared to $28.1 million, or 8.1% of sales, for fiscal 2014. Operating income for the Industrial segment increased by $1.6 million as a result of the gross profit increases discussed above. Operating income for the Water Treatment segment increased $0.8 million, as increased selling, general and administrative expenses partially offset increases in gross profit as discussed above.
Interest Income (Expense), Net
Interest income on cash and investments of $0.2 million was offset by interest expense related to our pension withdrawal liability of $0.2 million during both fiscal 2015 and fiscal 2014.
Income Tax Provision
Our effective income tax rate was 36.9% for fiscal 2015 compared to 35.5% for fiscal 2014. Our effective tax rate for fiscal 2014 was reduced by a non-recurring state tax benefit of $0.4 million. The effective tax rate is generally impacted by projected levels of taxable income, permanent items, and state taxes.
Fiscal 2014 Compared to Fiscal 2013
Sales decreased $2.1 million, or 0.6%, to $348.3 million for fiscal 2014, as compared to sales of $350.4 million for fiscal 2013. Sales of bulk commodity products were approximately 23% of sales in fiscal 2014 and 24% in fiscal 2013.
Industrial Segment. Industrial segment sales decreased $3.7 million, or 1.5%, to $244.9 million for fiscal 2014. Overall volumes increased slightly year-over-year, with the increase driven by higher volumes of bulk commodity products sold, which generally carry lower per-unit selling prices and margins. In addition, competitive pricing pressurepressures resulted in lower overall per-unit selling prices.
Water Treatment Segment. Water Treatment segment sales increased$9.4 $1.5 million,, or 10.2%1.5%, to $101.8$103.4 million for fiscal 2013. The increase2014. Sales volumes in this segment were largely unchanged as compared to the prior year. Sales growth in our newer branches, including the recently acquired Oklahoma location, together with increased sales was primarily due to volume growth resulting from favorableof certain specialty chemical products and equipment, more than offset the negative impact of unfavorable weather conditions induring the first halfmajority of fiscal 2013the spring and additionalsummer months and reduced sales volumes of bulk commodity products.
Gross Profit
Gross profit was $56.9$61.6 million,, or 16.2%17.7% of sales, for fiscal 2013,2014, as compared to $65.9$56.9 million,, or 19.2%16.2% of sales, for fiscal 2012. Fiscal 20132013. The prior year’s gross profit was negativelyadversely impacted by the $7.2$7.2 million CSS pension withdrawal charge and the $3.2$3.2 million charge resulting from the litigation settlement, both of which were recorded in our Industrial segment. Together, these charges together constituted 3.0% of sales for the fiscal year. Additionally, gross profit was negatively impacted by $1.3 million of incremental costs related to the new Rosemount facility, and $0.4 million of accelerated depreciation charges related to a facility we intend to vacate in fiscal 2014.2013. The LIFO method of valuing inventory increased gross profit by $0.4$1.9 million for fiscal 2014 and $0.4 million for fiscal 2013, primarily due to reduced volumeslower levels of certain bulkinventory of many of our products in inventory at year end. In the prior year, LIFO reduced gross profit by $1.6 million due to higher volumes and the mix of bulk chemicals in inventory at the end of the year.year-end.
Industrial Segment. Gross profit for the Industrial segment was $28.9$32.0 million,, or 11.6%13.1% of sales, for fiscal 2013,2014, as compared to $40.4$28.9 million,, or 16.0%11.6% of sales, for fiscal 2012. Fiscal 20132013. The prior year’s gross profit for this segment was negatively impacted by the $7.2$7.2 million CSS pension withdrawal charge and the $3.2$3.2 million charge resulting from the litigation settlement, which charges together constituted 4.2% of Industrial segment sales for the fiscal year. Gross profit for this segmentfiscal 2014 was adversely impacted by $1.7 million in incremental costs to operate our new Rosemount manufacturing facility as compared to fiscal 2013, and a $0.4 million year-over-year difference in costs incurred to exit the leased facility used to serve our bulk pharmaceutical customers. Despite slightly higher overall sales volumes, gross profit was also negatively impacted by heightened competitive pricing pressure, resulting in overallpressures and higher volumes of lower per-unit margins, $1.3 million in incremental costs for the new Rosemount facility, and by $0.4 million of accelerated depreciation charges relatedmargin products sold as compared to the facility we intend to vacate as noted
above.prior year. The LIFO method of valuing inventory increased gross profit by $0.4$1.6 million in fiscal 20132014 and reducedincreased gross profit by $1.5$0.4 million in fiscal 2012.2013.
Water Treatment Segment. Gross profit for the Water Treatment segment was $28.1$29.6 million,, or 27.6%28.6% of sales, for fiscal 2013,2014, as compared to $25.5$28.1 million,, or 27.6% of sales, for fiscal 2012. The increase in2013. Growth at our newer branches, including the recently acquired Oklahoma location, along with a favorable product mix shift to specialty chemical products from bulk commodities, more than offset the impact to gross profit dollars was primarily due to increased volumes resulting from favorableof unfavorable weather conditions during the first half of the year, partially offset by a shift in product mix to increased sales of lower-margin bulk products.spring and summer months. The LIFO method of valuing inventory increased gross profit by $0.3 million in fiscal 2014 and had no significanta nominal impact on gross profit in fiscal 2013 and negatively impacted gross profit by $0.1 million in fiscal 2012.2013.
Selling, General and Administrative Expenses
Selling, general and administrative expenses were $31.6$33.5 million,, or 9.0%9.6% of sales, for fiscal 2013,2014, as compared to $30.8$31.6 million,, or 8.9%9.0% of sales, for fiscal 2012.2013. The increase in expenses was primarily duedriven by incremental costs of $1.0 million related to higher selling costs due toour new headquarters facility, as well as additional sales staff, partially offset by lower administration costs.and infrastructure support staffing costs in the Water Treatment segment, including our recently acquired Oklahoma location.
Operating Income
Operating income was $25.3$28.1 million,, or 7.2%8.1% of sales, for fiscal 2013,2014, as compared to $35.1$25.3 million, or 10.2%7.2% of sales, for fiscal 2012. An $11.6 million decrease in operating income for the Industrial segment was partially offset by a $1.8 million increase in operating income for the Water Treatment segment.2013. Operating income for the Industrial segment was negatively impactedincreased by $3.3 million as a result of the $7.2 million CSS pension withdrawal charge and the $3.2 million litigation settlement agreement, heightened competitive pricing pressure,charge recorded in the additionprior year, largely offset by the reductions in gross profit in fiscal 2014 as discussed above. Operating income for the Water Treatment segment decreased $0.5 million primarily as a result of a new production facilityhigher selling, general and the accelerated depreciationadministrative expenses, more than offsetting increases in gross profit as discussed above.
Interest Income (Expense), Net
Interest income on cash and investments of $0.2 million was offset by interest expense related to the anticipated exitour pension withdrawal liability of a leased facility. The LIFO method$0.2 million during fiscal 2014. Interest income of valuing inventory increased our operating income in$0.1 million for fiscal 2013 but reduced our operatingconsisted primarily of interest income in fiscal 2012.on cash and investments.
Investment Income Tax Provision
Investment income was $0.1 million for both fiscal 2013 and 2012.
Provision for Income Taxes
Our effective income tax rate was 32.7%35.5% for fiscal 20132014 compared to 38.6%32.7% for fiscal 2012.2013. Our effective tax rate for fiscal 2014 was reduced by a non-recurring state tax benefit of $0.4 million. During fiscal 2013, we amended previously filed U.S. Federal tax returns resulting in an increase of $0.8 million in the benefits related to the domestic manufacturing deduction and investment tax credits, which positively impactedreduced our tax rate for thethat year. The effective tax rate is generally impacted by projected levels of taxable income, permanent items, and state taxes.
Fiscal 2012 Compared to Fiscal 2011
Sales
Sales increased $46.2 million, or 15.5%, to $343.8 million for fiscal 2012, as compared to sales of $297.6 million for fiscal 2011. Vertex, which we acquired during the fourth quarter of 2011, contributed $32.9 million of the increase in sales for fiscal 2012. We also experienced increased sales as a result of higher selling prices due to increased commodity chemical prices. Sales of bulk chemicals, including caustic soda, were approximately 23% of sales compared to approximately 20% in the previous year. The increase in the bulk chemical sales percentage for fiscal 2012 was primarily attributable to a full year of Vertex sales volumes compared to a partial year in fiscal 2011.
Industrial Segment. Industrial segment sales increased $42.7 million, or 20.5%, to $251.4 million for fiscal 2012. Vertex contributed $32.9 million of the increase in sales for fiscal 2012. We experienced higher selling prices due to increased commodity chemical prices.
Water Treatment Segment. Water Treatment segment sales increased $3.5 million, or 3.9%, to $92.4 million for fiscal 2012. The sales increase was primarily attributable to increased sales volumes related to manufactured and specialty chemical products and higher bulk chemical selling prices due to increased commodity chemical prices for those products.
Gross Profit
Gross profit was $65.9 million, or 19.2% of sales, for fiscal 2012, as compared to $61.9 million, or 20.8% of sales, for fiscal 2011. The LIFO method of valuing inventory negatively impacted gross profit by $1.6 million for fiscal 2012 primarily due to volumes and mix of commodity chemicals in inventory at the end of the year. In the prior year, LIFO negatively impacted gross
profit by $3.9 million due to rising raw material costs and higher inventory volumes on hand at year-end maintained to meet customer requirements during an anticipated flood.
Industrial Segment. Gross profit for the Industrial segment was $40.4 million, or 16.1% of sales, for fiscal 2012, as compared to $36.9 million, or 17.7% of sales, for fiscal 2011. The increase in gross profit dollars resulted from the addition of the Vertex business to this segment, partially offset by lower selling prices due to competitive pricing pressures and lower volumes. The LIFO method of valuing inventory negatively impacted gross profit in this segment by $1.5 million in fiscal 2012 and $2.9 million in fiscal 2011.
Water Treatment Segment. Gross profit for the Water Treatment segment was $25.5 million, or 27.6% of sales, for fiscal 2012, as compared to $25.0 million, or 28.1% of sales, for fiscal 2011. The increase in gross profit dollars was primarily due to increased sales volumes in the latter half of the fiscal 2012 more than offsetting lower volumes resulting from unfavorable weather conditions during the first half of the year and lower selling prices due to competitive pricing pressures. The LIFO method of valuing inventory negatively impacted gross profit in this segment by $0.1 million in fiscal 2012 and $1.1 million in fiscal 2011.
Selling, General and Administrative Expenses
Selling, general and administrative expenses were $30.8 million, or 9.0% of sales, for fiscal 2012, as compared to $29.9 million, or 10.1% of sales, for fiscal 2011. The increase was primarily due to the addition of expenses related to the Vertex business, which we acquired in the fourth quarter of fiscal 2011, partially offset by one-time costs we incurred in fiscal 2011 but did not experience in fiscal 2012. Fiscal 2011 included approximately $1.0 million in expense as a result of the death of John Hawkins, our former Chief Executive Officer, through payments due under his retention bonus agreement and the accelerated vesting of his previously granted performance-based restricted stock units and stock options, as well as approximately $0.7 million in Vertex acquisition costs.
Operating Income
Operating income was $35.1 million, or 10.2% of sales, for fiscal 2012, as compared to $32.0 million, or 10.7% of sales, for fiscal 2011. A $3.4 million increase in operating income for the Industrial segment resulted primarily from the addition of the Vertex business, partially offset by a $0.3 million decrease in operating income for the Water Treatment segment. Both segments were negatively impacted by the LIFO method of valuing inventory in fiscal 2012 and fiscal 2011.
Investment Income
Investment income was $0.1 million for fiscal 2012 and $0.3 million in fiscal 2011. The decrease in investment income was primarily due to lower cash and investment balances.
Provision for Income Taxes
Our effective income tax rate was 38.6% for fiscal 2012 compared to 37.1% for fiscal 2011. The higher effective tax rate for fiscal 2012 was primarily due to decreased permanent tax benefits and somewhat higher effective state tax rates.
Liquidity and Capital Resources
Cash provided by operating activities in fiscal 20132015 was $35.520.7 million compared to $33.734.6 million in fiscal 20122014 and $28.535.5 million in fiscal 20112013. CashThe decrease in cash provided by operating activities increased in fiscal 2013 by $1.8 million despite lower net income recorded,was primarily due to the $7.2 million non-cash charge to earnings related to our withdrawal from the multiemployer pension plan. In addition, changes in working capital balances provided $2.1 million in cash in fiscal 2013timing of inventory purchases, with increased inventory levels on hand at March 29, 2015 as compared to cash usedMarch 30, 2014. Our inventory levels on hand at the end of $1.9 million for working capitalfiscal 2014 were unusually low, driven by cold and wintry weather that resulted in rail car and barge shipment delays during the fourth quarter of fiscal 2012. The change in working capital balances in fiscal 2013 was primarily due to a decrease in trade receivables as well as a reduction in income tax receivable balances due to lower estimated income tax payments made.2014. Due to the nature of our operations, which includes purchases of large quantities of bulk chemicals, the timing of purchases can result in significant changes in working capital and the resulting operating cash flow. Historically, our cash requirements for working capital increase during the period from April through November as caustic soda inventory levels increase as the majority of barges are received during this period. Additionally, due to seasonality of the Water Treatment business, our accounts receivable balance is generally higher during the period of April through September.
Cash used in investing activities was $26.4 million in fiscal 2015 compared to $23.1 million in fiscal 2014 and $30.4 million in fiscal 2013. Capital expenditures were $14.6 million in fiscal 2015, $12.3 million in fiscal 2014 and $26.7 million in fiscal 2013. Capital expenditures in fiscal 2015 included $5.5 million related to business expansion, inventory storage, and process improvement projects and $5.9 million related to facility improvements, replacement equipment, new and replacement containers and water treatment trucks. We are projecting an increased level of capital spending in fiscal 2016 as compared with fiscal 2015 as we invest in business growth and infrastructure related projects including site development and rail work at one of our terminal facilities. Total capital spending in fiscal 2016 is currently projected to be approximately $33.0 million. We also used $10.1 million of cash for the Dumont acquisition in fiscal 2015 and $2.4 million of cash for the ACS acquisition in fiscal 2014, with nominal cash expended for acquisitions in fiscal 2013.
Cash used in financing activities was $9.1 million in fiscal 2015 compared to $6.7 million in fiscal 2014 and $4.9 million in fiscal 2013 compared to $3.7 million in fiscal 2012 and $6.9 million in fiscal 2011. The increase in cash used in financing activities in fiscal 20132015 was primarily due to lower proceeds from the exercise of employee stock options and an increase in dividends paid during the fiscal year.
Cash and investments available-for-sale of $49.9driven by $2.2 million at March 31,2013increased by $4.0 million as compared with April 1,2012, primarily due to cash generated from operations, proceeds from the exercise of employee stock options and proceeds from the issuance of new shares of common stock through the Company's employee stock purchase plan, partially offset by capital expenditures and dividend payments. Investments available-for-sale as of March 31,2013 and April 1,2012 consisted of certificates of deposit with maturities ranging from three months to two years.
Capital expendituresrepurchases during fiscal 2015. Dividend payments were $26.7$7.9 million in fiscal 2013, $20.12015, $7.4 million in fiscal 2012 and $12.4 million in fiscal 2011. Significant capital expenditures in fiscal 2013 consisted of approximately $19 million related to business expansion and process improvement projects including our new Industrial facility and Water Treatment expansion, $2.6 million for regulatory and safety improvements, $1.4 million related to our new corporate headquarters and $3.7 million for other facility improvements, truck and vehicle replacement, and returnable containers. Total capital spending in fiscal 2014 is currently projected to be approximately $18 million. We expect cash balances and our cash flows from operations will be sufficient to fund our cash requirements$6.9 million in fiscal 2014.
2013. During the second quarter of fiscal 2013,2015, our Board of Directors increased our semi-annual cash dividend by 6.3%5.6% to $0.34$0.38 per share, from $0.32$0.36 per share. We have paid cash dividends continuously since 1985. Future dividend levels will be dependent upon our results of operations, financial position, cash flows and other factors, and will be evaluatedare subject to approval by our Board of Directors.
Cash and investments available-for-sale was $50.4 million at March 29, 2015, a decrease of $12.8 million as compared with March 30, 2014, primarily due to the cash outflows associated with the Dumont acquisition, dividend payments, capital expenditures, and the share repurchase program described above exceeding the cash flows generated from operations during fiscal 2015. Investments available-for-sale as of March 29, 2015 and March 30, 2014 consisted of certificates of deposit and municipal bonds with maturities ranging from three months to three years. We expect cash balances and our cash flows from operations will be sufficient to fund our cash requirements in fiscal 2016.
As part of our business growth strategy, we have acquired businesses and may pursue acquisitions or other strategic relationships in the future that we believe will complement or expand our existing businesses or increase our customer base. We expect our cash balances and cash flows from operations will be sufficient to fund our cash requirements including acquisitions or other strategic relationships for the foreseeable future. We periodically evaluate opportunities to borrow funds or sell additional equity or debt securities for strategic reasons or to further strengthen our financial position.
Off-Balance Sheet Arrangements
We do not have any off-balance sheet arrangements.
Contractual Obligations and Commercial Commitments
The following table provides aggregate information about our contractual payment obligations and the periods in which payments are due:
| | | | | Payments Due by Period | | Payments Due by Period |
| Contractual Obligation | | 2014 | | 2015 | | 2016 | | 2017 | | 2018 | | More than 5 Years | | Total | | 2016 | | 2017 | | 2018 | | 2019 | | 2020 | | More than 5 Years | | Total |
| | | (In thousands) | | (In thousands) |
| Operating lease obligations | | $ | 1,142 |
| | $ | 1,196 |
| | $ | 1,108 |
| | $ | 1,020 |
| | $ | 958 |
| | $ | 4,947 |
| | $ | 10,371 |
| | $ | 2,139 |
| | $ | 1,916 |
| | $ | 1,740 |
| | $ | 1,555 |
| | $ | 1,388 |
| | $ | 4,198 |
| | $ | 12,936 |
|
| Pension withdrawal liability (1) | | $ | 195 |
| | $ | 467 |
| | $ | 467 |
| | $ | 467 |
| | $ | 467 |
| | $ | 7,280 |
| | $ | 9,343 |
| | $ | 467 |
| | $ | 467 |
| | $ | 467 |
| | $ | 467 |
| | $ | 467 |
| | $ | 6,307 |
| | $ | 8,642 |
|
(1) The amounts shown in the table above assume our payments made to CSS as a result of our withdrawal from the multiemployer pension plan begin in November 2014. Such payments will continue annually for 20 years.
| |
| (1) | The amounts shown in the table above relate to our withdrawal from the CSS multiemployer pension plan. Payments on this obligation began in fiscal 2014 and will continue through 2034. |
Critical Accounting Policies
In preparing the financial statements, we follow U.S. generally accepted accounting principles (“GAAP”). The preparation of these financial statements requires us to make estimates and judgments that affect the reported amounts of assets, liabilities, sales and expenses, and related disclosure of contingent assets and liabilities. We re-evaluate our estimates on an on-going basis. Our estimates are based on historical experience and on various other assumptions that are believed to be reasonable under the circumstances. Actual results may differ from these estimates under different assumptions and conditions. We consider the following policies to involve the most judgment in the preparation of our financial statements.
Revenue Recognition - We recognize revenue when there is evidence that the customer has agreed to purchase the product, the price and terms of the sale are fixed, the product has shipped and title has passed to our customer, performance has occurred, and collection of the receivable is reasonably assured.
LIFO Reserve - Inventories are primarily valued at the lower of cost or market with cost being determined using the LIFO method. We may incur significant fluctuations in our LIFO reserve and, as a result, gross margins, due primarily to changes in the volumeslevel of inventory on hand and the per-unit cost of a single, large-volume component of our inventory. The price of this inventory component fluctuates depending on the balance between supply and demand. Management reviews the LIFO reserve on a quarterly basis.
Inventories not valued used the LIFO method are valued at the lower of cost or market with cost being determined using the FIFO method.
Goodwill and Infinite-life Intangible Assets - Goodwill represents the excess of the cost of acquired businesses over the fair value of identifiable tangible net assets and identifiable intangible assets purchased. Goodwill is tested at least annually for impairment, and is tested for impairment more frequently if events or changes in circumstances indicate that the asset might be impaired. The impairment testAs of January 1, 2015, the company performed an analysis of qualitative factors to determine whether it is performed using a two-step process. In the first step,more likely than not that the fair value of thea reporting unit is compared with theless than its carrying amount of the reporting unit, including goodwill. If the estimated fair valueas a basis for determining whether it is less than the carrying amount of the reporting unit, an indication thatnecessary to perform a two-step goodwill impairment exists andtest. Based on management’s analysis of qualitative factors, we determined that it was not necessary to perform a second step must be completed in order to determine the amount of thetwo-step goodwill impairment if any, which should be recorded. In the second step, an impairment loss would be recognizedtest for any excess of the carrying amount of theeither reporting unit's goodwill over the implied fair value of that goodwill. The implied fair value of goodwill is determined by allocating the fair value of the reporting unit in a manner similar to a purchase price allocation. The fair value of the reporting unit is determined using a discounted cash flow analysis. Projecting discounted future cash flows requires us to make significant estimates regarding future revenues and expenses, projected capital expenditures, changes in working capital and the appropriate discount rate. The projections also take into account several factors including current and estimated economic trends and outlook, costs of raw materials, consideration of our market capitalization in comparison to the estimated fair values of our reporting units determined using discounted cash flow analyses and other factors which are beyond our control.unit.
Recently Issued Accounting Pronouncements
See Item 8, “Note 1 - Nature of Business and Significant Accounting Policies” of the Notes to Consolidated Financial Statements for information regarding recently adopted accounting standards or accounting standards to be adopted in the future.
ITEM 7A. QUANTITATIVE AND QUALITATIVE DISCLOSURE ABOUT MARKET RISK
We are subject to the risk inherent in the cyclical nature of commodity chemical prices. However, we do not currently purchase forward contracts or otherwise engage in hedging activities with respect to the purchase of commodity chemicals. We attempt to pass changes in material pricesthe cost of our materials on to our customers; however, there are no assurances that we will be able to pass on the increases in the future.
ITEM 8. FINANCIAL STATEMENTS AND SUPPLEMENTARY DATA
Report of Independent Registered Public Accounting Firm
The Board of Directors and ShareholdersStockholders of Hawkins, Inc.:
We have audited the accompanying consolidated balance sheets of Hawkins, Inc. and subsidiaries (the Company) as of March 31, 201329, 2015 and April 1, 2012,March 30, 2014, and the related consolidated statements of income, comprehensive income, shareholders'shareholders’ equity, and cash flows for each of the years in the three-year period ended March 31, 2013.29, 2015. In connection with our audits of the consolidated financial statements, we also have audited the financial statement schedule for each of the years in the three-year period ended March 31, 2013,29, 2015, listed in schedule II of this Form 10-K. We also have audited the Company'sCompany’s internal control over financial reporting as of March 31, 2013,29, 2015, based on criteria established in Internal Control - Integrated Framework (1992) issued by the Committee of Sponsoring Organizations of the Treadway Commission (COSO). The Company'sCompany’s management is responsible for these consolidated financial statements, for maintaining effective internal control over financial reporting, and for its assessment of the effectiveness of internal control over financial reporting, included in the accompanying Management'sManagement’s Report on Internal Control Over Financial Reporting. Our responsibility is to express an opinion on these consolidated financial statements and financial statement schedule and an opinion on the Company'sCompany’s internal control over financial reporting based on our audits.
We conducted our audits in accordance with the standards of the Public Company Accounting Oversight Board (United States). Those standards require that we plan and perform the audits to obtain reasonable assurance about whether the financial statements are free of material misstatement and whether effective internal control over financial reporting was maintained in all material respects. Our audits of the consolidated financial statements included examining, on a test basis, evidence supporting the amounts and disclosures in the financial statements, assessing the accounting principles used and significant estimates made by management, and evaluating the overall financial statement presentation. Our audit of internal control over financial reporting included obtaining an understanding of internal control over financial reporting, assessing the risk that a material weakness exists, and testing and evaluating the design and operating effectiveness of internal control based on the assessed risk. Our audits also included performing such other procedures as we considered necessary in the circumstances. We believe that our audits provide a reasonable basis for our opinions.
A company'scompany’s internal control over financial reporting is a process designed to provide reasonable assurance regarding the reliability of financial reporting and the preparation of financial statements for external purposes in accordance with generally accepted accounting principles. A company'scompany’s internal control over financial reporting includes those policies and procedures that (1) pertain to the maintenance of records that, in reasonable detail, accurately and fairly reflect the transactions and dispositions of the assets of the company; (2) provide reasonable assurance that transactions are recorded as necessary to permit preparation of financial statements in accordance with generally accepted accounting principles, and that receipts and expenditures of the company are being made only in accordance with authorizations of management and directors of the company; and (3) provide reasonable assurance regarding prevention or timely detection of unauthorized acquisition, use, or disposition of the company'scompany’s assets that could have a material effect on the financial statements.
Because of its inherent limitations, internal control over financial reporting may not prevent or detect misstatements. Also, projections of any evaluation of effectiveness to future periods are subject to the risk that controls may become inadequate because of changes in conditions, or that the degree of compliance with the policies or procedures may deteriorate.
In our opinion, the consolidated financial statements referred to above present fairly, in all material respects, the financial position of Hawkins, Inc. and subsidiaries as of March 31, 201329, 2015 and April 1, 2012,March 30, 2014, and the results of their operations and their cash flows for each of the years in the three-year period ended March 31, 2013,29, 2015, in conformity with U.S. generally accepted accounting principles. Also, in our opinion, the financial statement schedule referred to above, when considered in relation to the basic consolidated financial statements taken as a whole, presents fairly, in all material respects, the information set forth therein. Furthermore,Also in our opinion, the CompanyHawkins, Inc. and subsidiaries maintained, in all material respects, effective internal control over financial reporting as of March 31, 2013,29, 2015, based on criteria established in Internal Control - Integrated Framework (1992)issued by the Committee of Sponsoring Organizations of the Treadway Commission.
Our report dated May 28, 2015 on internal control over financial reporting as of March 29, 2015, contains an explanatory paragraph that states management excluded from its assessment of the effectiveness of internal control over financial reporting as of March 29, 2015, Dumont Company, Inc.’s internal control over financial reporting that comprise total assets of 4.3% and 1.6% of total revenues included in the consolidated financial statements of Hawkins, Inc. and subsidiaries as of and for the year ended March 29, 2015. Our audit of internal control over financial reporting of Hawkins, Inc. also excluded an evaluation of the internal control over financial reporting of Dumont Company, Inc.
/s/ KPMG LLP
Minneapolis, Minnesota
May 30, 2013
28, 2015
HAWKINS, INC.
CONSOLIDATED BALANCE SHEETS
(In thousands, except share and per-share data)
| | | | | March 31, 2013 | | April 1, 2012 | | March 29, 2015 | | March 30, 2014 |
| ASSETS | | | | | | | | |
| CURRENT ASSETS: | | | | | | | | |
| Cash and cash equivalents | | $ | 28,715 |
| | $ | 28,566 |
| | $ | 18,639 |
| | $ | 33,486 |
|
| Investments available-for-sale | | 15,625 |
| | 12,210 |
| | 14,485 |
| | 13,843 |
|
| Trade receivables — less allowance for doubtful accounts: | | | | | |
| $469 for 2013 and $460 for 2012 | | 35,920 |
| | 38,069 |
| |
| Trade receivables, less allowance for doubtful accounts of $445 for 2015 and $477 for 2014 | | | 40,355 |
| | 37,946 |
|
| Inventories | | 28,208 |
| | 27,633 |
| | 37,028 |
| | 26,192 |
|
| Income taxes receivable | | — |
| | 2,447 |
| | 732 |
| | — |
|
| Prepaid expenses and other current assets | | 2,613 |
| | 1,930 |
| | 3,101 |
| | 3,160 |
|
| Total current assets | | 111,081 |
| | 110,855 |
| | 114,340 |
| | 114,627 |
|
| PROPERTY, PLANT, AND EQUIPMENT: | | | | | | | | |
| Land | | 8,038 |
| | 7,931 |
| | 8,038 |
| | 8,038 |
|
| Buildings and improvements | | 68,268 |
| | 55,066 |
| | 73,095 |
| | 68,801 |
|
| Machinery and equipment | | 50,389 |
| | 39,432 |
| | 60,077 |
| | 53,089 |
|
| Transportation equipment | | 16,156 |
| | 14,842 |
| | 19,596 |
| | 17,764 |
|
| Office furniture and equipment including computer systems | | 10,204 |
| | 10,027 |
| | 11,966 |
| | 11,183 |
|
| | | 153,055 |
| | 127,298 |
| | 172,772 |
| | 158,875 |
|
| Less accumulated depreciation and amortization | | 62,081 |
| | 54,033 |
| |
| Less accumulated depreciation | | | 79,042 |
| | 68,406 |
|
| Net property, plant, and equipment | | 90,974 |
| | 73,265 |
| | 93,730 |
| | 90,469 |
|
| OTHER ASSETS: | | | | | | | | |
| Goodwill | | 6,495 |
| | 6,495 |
| | 11,750 |
| | 7,392 |
|
| Intangible assets — less accumulated amortization: | | | | | |
| $2,398 for 2013 and $1,790 for 2012 | | 7,678 |
| | 8,186 |
| |
| Intangible assets, less accumulated amortization of $3,933 for 2015 and $3,069 for 2014 | | | 11,154 |
| | 8,509 |
|
| Long-term investments | | 5,597 |
| | 5,139 |
| | 17,249 |
| | 15,852 |
|
| Other | | 323 |
| | 141 |
| | 239 |
| | 344 |
|
| Total other assets | | 20,093 |
| | 19,961 |
| | 40,392 |
| | 32,097 |
|
| Total assets | | $ | 222,148 |
| | $ | 204,081 |
| | $ | 248,462 |
| | $ | 237,193 |
|
| LIABILITIES AND SHAREHOLDERS’ EQUITY | | | | | | | | |
| CURRENT LIABILITIES: | | | | | | | | |
| Accounts payable — trade | | $ | 18,516 |
| | $ | 18,623 |
| | $ | 20,083 |
| | $ | 18,306 |
|
| Dividends payable | | 3,592 |
| | 3,337 |
| | 4,038 |
| | 3,823 |
|
| Accrued payroll and employee benefits | | 5,391 |
| | 8,481 |
| | 6,122 |
| | 5,555 |
|
| Deferred income taxes | | 2,554 |
| | 3,170 |
| | 2,698 |
| | 2,900 |
|
| Income tax payable | | 1,446 |
| | — |
| | — |
| | 1,444 |
|
| Other current liabilities | | 3,626 |
| | 2,678 |
| | 3,402 |
| | 3,801 |
|
| Total current liabilities | | 35,125 |
| | 36,289 |
| | 36,343 |
| | 35,829 |
|
| PENSION WITHDRAWAL LIABILITY | | 7,136 |
| | — |
| | 6,589 |
| | 6,887 |
|
| OTHER LONG-TERM LIABILITIES | | 1,653 |
| | 763 |
| | 1,588 |
| | 1,878 |
|
| DEFERRED INCOME TAXES | | 8,062 |
| | 10,422 |
| | 9,978 |
| | 10,186 |
|
| Total liabilities | | 51,976 |
| | 47,474 |
| | 54,498 |
| | 54,780 |
|
| COMMITMENTS AND CONTINGENCIES | |
|
| |
|
| | — |
| | — |
|
| SHAREHOLDERS’ EQUITY: | | | | | | | | |
| Common stock; authorized: 30,000,000 shares of $0.05 par value; 10,495,427 and 10,430,874 shares issued and outstanding for 2013 and 2012, respectively | | 525 |
| | 522 |
| |
| Common stock; authorized: 30,000,000 shares of $0.05 par value; 10,564,949 and 10,562,400 shares issued and outstanding for 2015 and 2014, respectively | | | 528 |
| | 528 |
|
| Additional paid-in capital | | 48,779 |
| | 45,169 |
| | 50,901 |
| | 50,502 |
|
| Retained earnings | | 120,974 |
| | 111,039 |
| | 142,567 |
| | 131,427 |
|
| Accumulated other comprehensive loss | | (106 | ) | | (123 | ) | | (32 | ) | | (44 | ) |
| Total shareholders’ equity | | 170,172 |
| | 156,607 |
| | 193,964 |
| | 182,413 |
|
| Total liabilities and shareholders' equity | | $ | 222,148 |
| | $ | 204,081 |
| |
| Total liabilities and shareholders’ equity | | | $ | 248,462 |
| | $ | 237,193 |
|
See accompanying notes to consolidated financial statements.
HAWKINS, INC.
CONSOLIDATED STATEMENTS OF INCOME
(In thousands, except share and per-share data)
| | | | Fiscal Year Ended | | Fiscal Year Ended |
| | | March 31, 2013 | | April 1, 2012 | | April 3, 2011 | | March 29, 2015 | | March 30, 2014 | | March 31, 2013 |
| Sales | | $ | 350,387 |
| | $ | 343,834 |
| | $ | 297,641 |
| | $ | 364,023 |
| | $ | 348,263 |
| | $ | 350,387 |
|
| Cost of sales | | (286,241 | ) | | (277,966 | ) | | (235,739 | ) | | (298,232 | ) | | (286,663 | ) | | (286,241 | ) |
| Pension withdrawal | | (7,210 | ) | | — |
| | — |
| | — |
| | — |
| | (7,210 | ) |
| Gross profit | | 56,936 |
| | 65,868 |
| | 61,902 |
| | 65,791 |
| | 61,600 |
| | 56,936 |
|
| Selling, general and administrative expenses | | (31,606 | ) | | (30,759 | ) | | (29,940 | ) | | (35,375 | ) | | (33,510 | ) | | (31,606 | ) |
| Operating income | | 25,330 |
| | 35,109 |
| | 31,962 |
| | 30,416 |
| | 28,090 |
| | 25,330 |
|
| Investment income, net | | 84 |
| | 145 |
| | 333 |
| |
| Interest income (expense), net | | | 38 |
| | (29 | ) | | 84 |
|
| Income from continuing operations before income taxes | | 25,414 |
| | 35,254 |
| | 32,295 |
| | 30,454 |
| | 28,061 |
| | 25,414 |
|
| Provision for income taxes | | (8,306 | ) | | (13,626 | ) | | (11,981 | ) | |
| Income tax provision | | | (11,240 | ) | | (9,967 | ) | | (8,306 | ) |
| Income from continuing operations | | 17,108 |
| | 21,628 |
| | 20,314 |
| | 19,214 |
| | 18,094 |
| | 17,108 |
|
| Income from discontinued operations, net of tax | | 18 |
| | 1,057 |
| | — |
| | — |
| | — |
| | 18 |
|
| Net income | | $ | 17,126 |
| | $ | 22,685 |
| | $ | 20,314 |
| | $ | 19,214 |
| | $ | 18,094 |
| | $ | 17,126 |
|
| Weighted average number of shares outstanding-basic | | 10,464,820 |
| | 10,339,391 |
| | 10,260,135 |
| | 10,568,582 |
| | 10,544,467 |
| | 10,464,820 |
|
| Weighted average number of shares outstanding-diluted | | 10,541,142 |
| | 10,408,573 |
| | 10,352,633 |
| | 10,633,554 |
| | 10,599,755 |
| | 10,541,142 |
|
| Basic earnings per share: | | | | | | | | | | | | |
| Earnings per share from continuing operations | | $ | 1.64 |
| | $ | 2.09 |
| | $ | 1.98 |
| | $ | 1.82 |
| | $ | 1.72 |
| | $ | 1.64 |
|
| Earnings per share from discontinued operations | | — |
| | 0.10 |
| | — |
| | — |
| | — |
| | — |
|
| Basic earnings per share | | $ | 1.64 |
| | $ | 2.19 |
| | $ | 1.98 |
| | $ | 1.82 |
| | $ | 1.72 |
| | $ | 1.64 |
|
| Diluted earnings per share: | | | | | | | | | | | | |
| Earnings per share from continuing operations | | $ | 1.62 |
| | $ | 2.08 |
| | $ | 1.96 |
| | $ | 1.81 |
| | $ | 1.71 |
| | $ | 1.62 |
|
| Earnings per share from discontinued operations | | — |
| | 0.10 |
| | — |
| | — |
| | — |
| | — |
|
| Diluted earnings per share | | $ | 1.62 |
| | $ | 2.18 |
| | $ | 1.96 |
| | $ | 1.81 |
| | $ | 1.71 |
| | $ | 1.62 |
|
| Cash dividends declared per common share | | $ | 0.68 |
| | $ | 0.64 |
| | $ | 0.70 |
| | $ | 0.76 |
| | $ | 0.72 |
| | $ | 0.68 |
|
See accompanying notes to consolidated financial statements.
HAWKINS, INC.
CONSOLIDATED STATEMENTS OF COMPREHENSIVE INCOME
(In thousands, except share data)
| | | | Fiscal Year Ended | |
| (In thousands) | | (In thousands) | | | | |
| | March 31, 2013 | | April 1, 2012 | | April 3, 2011 | March 29, 2015 |
| | March 30, 2014 |
| | March 31, 2013 |
|
| | | | | | | | | | | |
| Net income | $ | 17,126 |
| | $ | 22,685 |
| | $ | 20,314 |
| $ | 19,214 |
| | $ | 18,094 |
| | $ | 17,126 |
|
| Other comprehensive income (loss), net of tax: | | | | | | | | | | |
| Unrealized gain (loss) on available-for-sale investments | 12 |
| | (4 | ) | | (63 | ) | 11 |
| | (47 | ) | | 12 |
|
| Unrealized gain (loss) on post-retirement liability | 5 |
| | 26 |
| | (119 | ) | |
| Total other comprehensive income (loss) | 17 |
| | 22 |
| | (182 | ) | |
| Unrealized gain on post-retirement liability | | 1 |
| | 109 |
| | 5 |
|
| Total other comprehensive income | | 12 |
| | 62 |
| | 17 |
|
| Total comprehensive income | $ | 17,143 |
| | $ | 22,707 |
| | $ | 20,132 |
| $ | 19,226 |
| | $ | 18,156 |
| | $ | 17,143 |
|
See accompanying notes to consolidated financial statements.
HAWKINS, INC.
CONSOLIDATED STATEMENTS OF SHAREHOLDERS’ EQUITY
(In thousands, except share data)
|
| | | | | | | | | | | | | | | | | | | | | | | |
| | | Common Stock | | Additional Paid-in Capital | | Retained Earnings | | Accumulated Other Comprehensive Income (Loss) | | Total Shareholders’ Equity |
| Shares | | Amount | |
| BALANCE — April 1, 2012 | | 10,430,874 |
| | $ | 522 |
| | $ | 45,169 |
| | $ | 111,039 |
| | $ | (123 | ) | | $ | 156,607 |
|
| Cash dividends | | | | | | | | (7,191 | ) | | | | (7,191 | ) |
| Stock compensation expense | | | | | | 1,630 |
| | | | | | 1,630 |
|
| Tax benefit on share-based compensation plans | | | | | | 510 |
| | | | | | 510 |
|
| Vesting of restricted stock | | 6,120 |
| |
|
| | (1 | ) | | | | | | (1 | ) |
| Shares surrendered for payroll taxes | |
|
| |
|
| |
|
| | | | | | — |
|
| Stock options exercised | | 27,999 |
| | 1 |
| | 514 |
| | | | | | 515 |
|
| ESPP shares issued | | 30,434 |
| | 2 |
| | 957 |
| | | | | | 959 |
|
| Other comprehensive income, net of tax | | | | | | | | | | 17 |
| | 17 |
|
| Net income | | | | | | | | 17,126 |
| | | | 17,126 |
|
| BALANCE — March 31, 2013 | | 10,495,427 |
| | $ | 525 |
| | $ | 48,779 |
| | $ | 120,974 |
| | $ | (106 | ) | | $ | 170,172 |
|
| Cash dividends declared | | | | | | | | (7,641 | ) | | | | (7,641 | ) |
| Share-based compensation expense | | | | | | 1,322 |
| | | | | | 1,322 |
|
| Tax benefit on share-based compensation plans | | | | | | (214 | ) | | | | | | (214 | ) |
| Vesting of restricted stock | | 41,906 |
| | 2 |
| | (2 | ) | | | | | | — |
|
| Shares surrendered for payroll taxes | | (12,480 | ) | | (1 | ) | | (484 | ) | | | | | | (485 | ) |
| Stock options exercised | | 9,333 |
| | 1 |
| | 185 |
| | | | | | 186 |
|
| ESPP shares issued | | 28,214 |
| | 1 |
| | 916 |
| | | | | | 917 |
|
| Other comprehensive income, net of tax | | | | | | | | | | 62 |
| | 62 |
|
| Net income | | | | | | | | 18,094 |
| | | | 18,094 |
|
| BALANCE — March 30, 2014 | | 10,562,400 |
| | $ | 528 |
| | $ | 50,502 |
| | $ | 131,427 |
| | $ | (44 | ) | | $ | 182,413 |
|
| | | | | | | | | | | | | |
| Cash dividends declared | | | | | | | | (8,074 | ) | | | | (8,074 | ) |
| Share-based compensation expense | | | | | | 1,631 |
| | | | | | 1,631 |
|
| Tax benefit on share-based compensation plans | | | | | | 92 |
| | | | | | 92 |
|
| Vesting of restricted stock | | 29,355 |
| | 1 |
| | (1 | ) | | | | | | — |
|
| Shares surrendered for payroll taxes | | (7,920 | ) | |
|
| | (295 | ) | | | | | | (295 | ) |
| Stock options exercised | | 9,333 |
| |
|
| | 186 |
| | | | | | 186 |
|
| ESPP shares Issued | | 31,383 |
| | 2 |
| | 986 |
| | | | | | 988 |
|
| Shares repurchased | | (59,602 | ) | | (3 | ) | | (2,200 | ) | | | | | | (2,203 | ) |
| Other comprehensive income, net of tax | | | | | | | | | | 12 |
| | 12 |
|
| Net income | | | | | | | | 19,214 |
| | | | 19,214 |
|
| BALANCE — March 29, 2015 | | 10,564,949 |
| | $ | 528 |
| | $ | 50,901 |
| | $ | 142,567 |
| | $ | (32 | ) | | $ | 193,964 |
|
See accompanying notes to consolidated financial statements.
HAWKINS, INC.
CONSOLIDATED STATEMENTS OF CASH FLOWS
(In thousands)
|
| | | | | | | | | | | | |
| | Fiscal Year Ended |
| | | March 29, 2015 | | March 30, 2014 | | March 31, 2013 |
| CASH FLOWS FROM OPERATING ACTIVITIES: | | | | | | |
| Net income | | $ | 19,214 |
| | $ | 18,094 |
| | $ | 17,126 |
|
| Reconciliation to cash flows: | | | | | | |
| Depreciation and amortization | | 13,015 |
| | 12,605 |
| | 10,248 |
|
| Deferred income taxes | | (418 | ) | | 2,150 |
| | (2,985 | ) |
| Pension withdrawal | | — |
| | — |
| | 7,210 |
|
| Share-based compensation expense | | 1,631 |
| | 1,322 |
| | 1,621 |
|
| Loss from property disposals | | 45 |
| | 111 |
| | 153 |
|
| Changes in operating accounts (using) providing cash, net of effects of acquisition: | | | | | | |
| Trade receivables | | (1,051 | ) | | (1,698 | ) | | 2,149 |
|
| Inventories | | (9,977 | ) | | 2,122 |
| | (573 | ) |
| Accounts payable | | 563 |
| | 335 |
| | (1,185 | ) |
| Accrued liabilities | | (506 | ) | | 141 |
| | (1,319 | ) |
| Income taxes | | (2,177 | ) | | (2 | ) | | 3,893 |
|
| Other | | 325 |
| | (568 | ) | | (864 | ) |
| Net cash provided by operating activities | | 20,664 |
| | 34,612 |
| | 35,474 |
|
| CASH FLOWS FROM INVESTING ACTIVITIES: | | | | | | |
| Additions to property, plant, and equipment | | (14,552 | ) | | (12,261 | ) | | (26,660 | ) |
| Purchases of investments | | (15,303 | ) | | (25,161 | ) | | (18,755 | ) |
| Sale and maturities of investments | | 13,280 |
| | 16,612 |
| | 14,900 |
|
| Proceeds from property disposals | | 223 |
| | 115 |
| | 233 |
|
| Acquisitions | | (10,068 | ) | | (2,416 | ) | | (100 | ) |
| Net cash used in investing activities | | (26,420 | ) | | (23,111 | ) | | (30,382 | ) |
| CASH FLOWS FROM FINANCING ACTIVITIES: | | | | | | |
| Cash dividends paid | | (7,859 | ) | | (7,410 | ) | | (6,936 | ) |
| New shares issued | | 988 |
| | 917 |
| | 968 |
|
| Stock options exercised | | 186 |
| | 186 |
| | 515 |
|
| Excess tax benefit from share-based compensation | | 92 |
| | 62 |
| | 510 |
|
| Shares surrendered for payroll taxes | | (295 | ) | | (485 | ) | | — |
|
| Shares repurchased | | (2,203 | ) | | — |
| | — |
|
| Net cash used in financing activities | | (9,091 | ) | | (6,730 | ) | | (4,943 | ) |
| NET (DECREASE) INCREASE IN CASH AND CASH EQUIVALENTS | | (14,847 | ) | | 4,771 |
| | 149 |
|
| CASH AND CASH EQUIVALENTS- | | | | | | |
| Beginning of year | | 33,486 |
| | 28,715 |
| | 28,566 |
|
| CASH AND CASH EQUIVALENTS- | | | | | | |
| End of year | | $ | 18,639 |
| | $ | 33,486 |
| | $ | 28,715 |
|
| SUPPLEMENTAL DISCLOSURES OF CASH FLOW INFORMATION- | | | | | | |
| Cash paid during the year for income taxes | | $ | 13,801 |
| | $ | 7,757 |
| | $ | 6,900 |
|
| Noncash investing activities- | | | | | | |
| Capital expenditures in accounts payable | | $ | 1,126 |
| | $ | 699 |
| | $ | 1,401 |
|
See accompanying notes to consolidated financial statements.
HAWKINS, INC.
CONSOLIDATED STATEMENTS OF SHAREHOLDERS' EQUITY
(In thousands, except share data)
|
| | | | | | | | | | | | | | | | | | | | | | | |
| | | Common Stock | | Additional Paid-in Capital | | Retained Earnings | | Accumulated Other Comprehensive Income (Loss) | | Total Shareholders’ Equity |
| Shares | | Amount | |
| BALANCE — March 28, 2010 | | 10,253,458 |
| | $ | 513 |
| | $ | 39,027 |
| | $ | 81,921 |
| | $ | 37 |
| | $ | 121,498 |
|
| Cash dividends declared | | | | | | | | (7,222 | ) | | | | (7,222 | ) |
| Share-based compensation expense | | | | | | 1,952 |
| | | | | | 1,952 |
|
| Tax benefit on share-based compensation plans | | | | | | 281 |
| | | | | | 281 |
|
| Vesting of restricted stock | | 58,653 |
| | 3 |
| | (3 | ) | | | | | | — |
|
| Shares surrendered for payroll taxes | | (4,934 | ) | | (1 | ) | | (197 | ) | | | | | | (198 | ) |
| Other comprehensive income, net of tax | | | | | | | | | | (182 | ) | | (182 | ) |
| Net income | | | | | | | | 20,314 |
| | | | 20,314 |
|
| BALANCE — April 3, 2011 | | 10,307,177 |
| | $ | 515 |
| | $ | 41,060 |
| | $ | 95,013 |
| | $ | (145 | ) | | $ | 136,443 |
|
| Cash dividends declared | | | | | | | | (6,659 | ) | | | | (6,659 | ) |
| Share-based compensation expense | | | | | | 1,350 |
| | | | | | 1,350 |
|
| Tax benefit on share-based compensation plans | | | | | | 698 |
| | | | | | 698 |
|
| Vesting of restricted stock | | 18,663 |
| | 1 |
| | (1 | ) | |
| | | | — |
|
| Shares surrendered for payroll taxes | | (3,980 | ) | | — |
| | (150 | ) | | | | | | (150 | ) |
| Stock Options Exercised | | 85,332 |
| | 5 |
| | 1,461 |
| | | | | | 1,466 |
|
| ESPP Shares Issued | | 23,682 |
| | 1 |
| | 751 |
| | | | | | 752 |
|
| Other comprehensive income, net of tax | | | | | | | | | | 22 |
| | 22 |
|
| Net income | | | | | | | | 22,685 |
| | | | 22,685 |
|
| BALANCE — April 1, 2012 | | 10,430,874 |
| | $ | 522 |
| | $ | 45,169 |
| | $ | 111,039 |
| | $ | (123 | ) | | $ | 156,607 |
|
| Cash dividends declared | |
| |
| |
| | (7,191 | ) | |
| | (7,191 | ) |
| Share-based compensation expense | |
| |
| | 1,630 |
| |
| |
| | 1,630 |
|
| Tax benefit on share-based compensation plans | |
| |
| | 510 |
| |
| |
| | 510 |
|
| Vesting of restricted stock | | 6,120 |
| | — |
| | (1 | ) | |
| |
| | (1 | ) |
| Stock Options Exercised | | 27,999 |
| | 1 |
| | 514 |
| |
| |
| | 515 |
|
| ESPP Shares Issued | | 30,434 |
| | 2 |
| | 957 |
| |
| |
| | 959 |
|
| Other comprehensive income, net of tax | |
| |
| |
| |
| | 17 | | 17 |
|
| Net income | |
| |
| |
| | 17,126 |
| |
| | 17,126 |
|
| BALANCE — March 31, 2013 | | 10,495,427 |
| | $ | 525 |
| | $ | 48,779 |
| | $ | 120,974 |
| | $ | (106 | ) | | $ | 170,172 |
|
See accompanying notes to consolidated financial statements.
HAWKINS, INC.
CONSOLIDATED STATEMENTS OF CASH FLOWS
(In thousands)
|
| | | | | | | | | | | | |
| | Fiscal Year Ended |
| | | March 31, 2013 | | April 1, 2012 | | April 3, 2011 |
| CASH FLOWS FROM OPERATING ACTIVITIES: | | | | | | |
| Net income | | $ | 17,126 |
| | $ | 22,685 |
| | $ | 20,314 |
|
| Reconciliation to cash flows: | | | | | | |
| Depreciation and amortization | | 10,248 |
| | 8,458 |
| | 7,148 |
|
| Deferred income taxes | | (2,985 | ) | | 3,082 |
| | (600 | ) |
| Pension withdrawal | | 7,210 |
| | — |
| | — |
|
| Share-based compensation expense | | 1,621 |
| | 1,350 |
| | 1,952 |
|
| Loss from property disposals | | 153 |
| | 2 |
| | 127 |
|
| Changes in operating accounts (using) providing cash, net of effects of acquisition: | | | | | | |
| Trade receivables | | 2,149 |
| | (2,407 | ) | | (5,929 | ) |
| Inventories | | (573 | ) | | 1,319 |
| | (3,141 | ) |
| Accounts payable | | (1,185 | ) | | (1,846 | ) | | 5,356 |
|
| Accrued liabilities | | (1,319 | ) | | 343 |
| | 158 |
|
| Income taxes | | 3,893 |
| | (251 | ) | | 2,529 |
|
| Other | | (864 | ) | | 947 |
| | 619 |
|
| Net cash provided by operating activities | | 35,474 |
| | 33,682 |
| | 28,533 |
|
| CASH FLOWS FROM INVESTING ACTIVITIES: | | | | | | |
| Additions to property, plant, and equipment | | (26,660 | ) | | (20,057 | ) | | (12,421 | ) |
| Purchases of investments | | (18,755 | ) | | (14,165 | ) | | (14,210 | ) |
| Sale and maturities of investments | | 14,900 |
| | 15,270 |
| | 30,545 |
|
| Proceeds from property disposals | | 233 |
| | 255 |
| | 143 |
|
| Acquisitions | | (100 | ) | | (1,709 | ) | | (25,500 | ) |
| Net cash used in investing activities | | (30,382 | ) | | (20,406 | ) | | (21,443 | ) |
| CASH FLOWS FROM FINANCING ACTIVITIES: | | | | | | |
| Cash dividends paid | | (6,936 | ) | | (6,417 | ) | | (7,005 | ) |
| New shares issued | | 968 |
| | 752 |
| | — |
|
| Stock options exercised | | 515 |
| | 1,466 |
| | — |
|
| Excess tax benefit from share-based compensation | | 510 |
| | 699 |
| | 281 |
|
| Shares surrendered for payroll taxes | | — |
| | (150 | ) | | (198 | ) |
| Net cash used in financing activities | | (4,943 | ) | | (3,650 | ) | | (6,922 | ) |
| NET INCREASE IN CASH AND CASH EQUIVALENTS | | 149 |
| | 9,626 |
| | 168 |
|
| CASH AND CASH EQUIVALENTS- | | | | | | |
| Beginning of period | | 28,566 |
| | 18,940 |
| | 18,772 |
|
| CASH AND CASH EQUIVALENTS- | | | | | | |
| End of period | | $ | 28,715 |
| | $ | 28,566 |
| | $ | 18,940 |
|
| SUPPLEMENTAL DISCLOSURES OF CASH FLOW INFORMATION- | | | | | | |
| Cash paid during the year for income taxes | | $ | 6,900 |
| | $ | 10,788 |
| | $ | 9,771 |
|
| Noncash investing activities- | | | | | | |
| Acquisition purchase price in accounts payable | | $ | — |
| | $ | — |
| | $ | 1,709 |
|
| Capital expenditures in accounts payable | | $ | 1,401 |
| | $ | 279 |
| | $ | 1,450 |
|
See accompanying notes to consolidated financial statements.
HAWKINS, INC.
NOTES TO CONSOLIDATED FINANCIAL STATEMENTS
Note 1 — Nature of Business and Significant Accounting Policies
Nature of Business - We have two reportable segments: Industrial and Water Treatment. The Industrial Group operates our Industrial segment and specializes in providing industrial chemicals, products and services to industries such as agriculture, energy, electronics, food, chemical processing, pulpelectronics, energy, food, pharmaceutical, plating and paper, pharmaceutical, medical device and plating.power generation. The group also manufactures and sells certain food-grade products, including our patented Cheese Phos®liquid phosphate,phosphates, lactates and other blended products. The Water Treatment Group operates our Water Treatment segment and specializes in providing chemicals, equipment and solutions for potable water, municipal and industrial wastewater, industrial process water and non-residential swimming pool water. The group has the resources and flexibility to treat systems ranging in size from a single small well to a multi-million-gallon-per-day facility.
Fiscal Year - Our fiscal year is a 52/53-week year ending on the Sunday closest to March 31. Our fiscal years ended March 31, 201329, 2015 (“fiscal 2013”2015”) and April 1, 2012 (“fiscal 2012”) were 52-week years. The fiscal year ended April 3, 2011 (“fiscal 2011”) was a 53-week year. The fiscal year ending on, March 30, 2014 (“fiscal 2014”), and March 31, 2013 (“fiscal 2013”) were 52 weeks. The fiscal year ending April 3, 2016 (“fiscal 2016”) will be a 52-week year.53 weeks.
Principles of Consolidation - The consolidated financial statements include the accounts of Hawkins, Inc. and its wholly-owned subsidiaries. All intercompany transactions and accounts have been eliminated.
Estimates - The preparation of financial statements in conformity with U.S. generally accepted accounting principles (“GAAP”) requires management to make estimates and assumptions that affect the reported amounts of assets and liabilities and disclosure of contingent assets and liabilities at the date of the financial statements and the reported amounts of revenues and expenses during the reported period. Actual results could differ from those estimates.
Revenue Recognition - We recognize revenue when there is evidence that the customer has agreed to purchase the product, the price and terms of the sale are fixed, the product has shipped and title has passed to our customer, performance has occurred, and collection of the receivable is reasonably assured.
Shipping and Handling - All shipping and handling amounts billed to customers are included in revenues. Costs incurred related to the shipping and the handling of products are included in cost of sales.
Fair Value Measurements - The financial assets and liabilities that are re-measured and reported at fair value for each reporting period include marketable securities.securities, as well as contingent consideration payable related to the acquisition of Advance Chemical Solutions, Inc. (“ACS”). There are no fair value measurements with respect to nonfinancial assets or liabilities that are recognized or disclosed at fair value in our consolidated financial statements on a recurring basis.
Assets and liabilities measured at fair value are classified using the following hierarchy, which is based upon the transparency of inputs to the valuation as of the measurement date:
Level 1: Valuation is based on observable inputs such as quoted market prices (unadjusted) for identical assets or liabilities in active markets.
Level 2: Valuation is based on inputs such as quoted market prices for similar assets or liabilities in active markets or other inputs that are observable for the asset or liability, either directly or indirectly, for substantially the full term of the financial instrument.
Level 3: Valuation is based upon other unobservable inputs that are significant to the fair value measurement.
In making fair value measurements, observable market data must be used when available. When inputs used to measure fair value fall within different levels of the hierarchy, the level within which the fair value measurement is categorized is based on the lowest level input that is significant to the fair value measurement.
Cash Equivalents - Cash equivalents include all liquid debt instruments (primarily cash funds and money market accounts and certificates of deposit)accounts) purchased with an original maturity of three months or less. The balances maintained at financial institutions may, at times, exceed federally insured limits.
HAWKINS, INC.
NOTES TO CONSOLIDATED FINANCIAL STATEMENTS — (Continued)
Investments - Available-for-sale securities consist of certificates of deposit (“CD’s”) and municipal bonds and are valued at current market value, with the resulting unrealized gains and losses excluded from earnings and reported, net of tax, as a separate component of shareholders'shareholders’ equity until realized. Any impairment loss to reduce an investment'sinvestment’s carrying amount to its fair market value is recognized in income when a decline in the fair market value of an individual security below its cost or carrying value is determined to be other than temporary.
Trade Receivables and Concentrations of Credit Risk - Financial instruments, which potentially subject us to a concentration of credit risk, principally consist of trade receivables. We sell our principal products to a large number of customers in many different industries. There are no concentrations of credit risk with a single customer from a particular service or geographic area that would significantly impact us in the near term. To reduce credit risk, we routinely assess the financial strength of our customers. We record an allowance for doubtful accounts to reduce our receivables to an amount we estimate is collectible from our customers. Estimates used in determining the allowance for doubtful accounts are based on historical collection experience, current trends, aging of accounts receivable and periodic evaluations of our customers'customers’ financial condition. We invest our excess cash balances at times in certificates of depositCD’s, municipal bonds and a money market accountaccounts at two separate financial institutions where the cash balances may exceed federally insured limits. The institutions are two of the largest commercial banking institutions in the country and both have maintained a AAstrong credit rating.ratings.
Inventories - Inventories, consisting primarily of finished goods, are primarily valued at the lower of cost or net realizable value, with cost beingfor the vast majority of our inventory determined using the last-in, first-out (“LIFO”) method. The amount of inventory valued using the first-in, first-out (“FIFO”) method represents approximately 14%8% of the total FIFO inventory balance at March 31, 2013.29, 2015.
Property, Plant and Equipment - Property is stated at cost and depreciated or amortized over the lives of the assets, using the straight-line method. Estimated lives are: 10 to 40 years for buildings and improvements; 3 to 20 years for machinery and equipment; 3 to 10 years for transportation equipment; and 3 to 10 years for office furniture and equipment including computer systems. Leasehold improvements are depreciated over the lesser of their estimated useful lives or the remaining lease term.
Significant improvements that add to productive capacity or extend the lives of properties are capitalized. Costs for repairs and maintenance are charged to expense as incurred. When property is retired or otherwise disposed of, the cost and related accumulated depreciation or amortization are removed from the accounts and any related gains or losses are included in income.
We review the recoverability of long-lived assets to be held and used, such as property, plant and equipment, when events or changes in circumstances occur that indicate the carrying value of the asset group may not be recoverable, such as prolonged industry downturn or significant reductions in projected future cash flows. The assessment of possible impairment is based on our ability to recover the carrying value of the asset group from the expected future pre-tax cash flows (undiscounted) of the related operations. If these cash flows are less than the carrying value of such asset group, an impairment loss would be measured by the amount the carrying value exceeds the fair value of the long-lived asset group. The measurement of impairment requires us to estimate future cash flows and the fair value of long-lived assets. No material long-lived assets were determined to be impaired during fiscal 2013, 2012years 2015, 2014 or 2011.2013.
Goodwill and Identifiable Intangible Assets - Goodwill represents the excess of the cost of acquired businesses over the fair value of identifiable tangible net assets and identifiable intangible assets purchased. Goodwill is tested at least annually for impairment, and is tested for impairment more frequently if events or changes in circumstances indicate that the asset might be impaired. The impairment testAs of January 1, 2015, the company performed an analysis of qualitative factors to determine whether it is performed using a two-step process. In the first step,more likely than not that the fair value of thea reporting unit is compared with theless than its carrying amount of the reporting unit, including goodwill. If the estimated fair valueas a basis for determining whether it is less than the carrying amount of the reporting unit, an indication thatnecessary to perform a two-step goodwill impairment exists andtest. Based on management’s analysis of qualitative factors, we determined that it was not necessary to perform a second step must be completed in order to determine the amount of thetwo-step goodwill impairment if any, which should be recorded. In the second step, an impairment loss would be recognizedtest for any excess of the carrying amount of theeither reporting unit's goodwill over the implied fair value of that goodwill. The implied fair value of goodwill is determined by allocating the fair value of the reporting unit in a manner similar to a purchase price allocation. The fair value of the reporting unit is determined using a discounted cash flow analysis. Projecting discounted future cash flows requires us to make significant estimates regarding future revenues and expenses, projected capital expenditures, changes in working capital and the appropriate discount rate. The projections also take into account several factors including current and estimated economic trends and outlook, costs of raw materials, consideration of our market capitalization in comparison to the estimated fair values of our reporting units determined using discounted cash flow analyses and other factors which are beyond our control.unit.
HAWKINS, INC.
NOTES TO CONSOLIDATED FINANCIAL STATEMENTS — (Continued)
Our primary identifiable intangible assets include customer lists, trade secrets, non-compete agreements, trademarks, and trade names acquired in previous business acquisitions. Identifiable intangiblesintangible assets with finite lives are amortized and thosewhereas identifiable intangiblesintangible assets with indefinite lives are not amortized. The values assigned to the intangible assets with finite lives are being amortized on average over approximately 1413 years. Identifiable intangible assets that are subject to amortization are evaluated for impairment whenever events or changes in circumstances indicate that the carrying amount may not be recoverable. Identifiable intangible assets not subject to amortization are tested for impairment annually or more frequently if events warrant. The impairment test consists of a comparisonqualitative assessment to determine whether it is more likely than not that the asset is impaired. Based on management’s analysis of the fair value of the intangible asset with its carrying amount.qualitative factors, we determined that it was not necessary to perform a quantitative impairment test for fiscal 2015.
HAWKINS, INC.
NOTES TO CONSOLIDATED FINANCIAL STATEMENTS — (Continued)
We completed step one of our annual goodwill impairment evaluation, along with an impairment test of infinite-life intangible assets, during the fourth quarter of fiscal 2013 and determined that our reporting units' fair value substantially exceeded their carrying value. Accordingly, step two of the impairment analysis was not required.
Impairment testsassessments were also completed in the fourth quarters of fiscal 20122014 and 2011,2013, which resulted in no impairment charges for either of these fiscal years.
Income Taxes - In the preparation of our consolidated financial statements, the calculation of income taxes by management is based upon the estimated effective rate applicable to operating results for the full fiscal year. This includes estimating the current tax liability as well as assessing differences resulting from different treatment of items for tax and book accounting purposes. These differencesDifferences that are temporary in nature result in deferred tax assets and liabilities, which are recorded on the balance sheet. Thesesheet, while differences that are permanent in nature impact the income tax expense recorded on the income statement and impact the effective tax rate for the fiscal year. The deferred tax assets and liabilities are analyzed regularly and management assesses the likelihood that deferred tax assets will be recovered from future taxable income. We record any interest and penalties related to income taxes as income tax expense in the statements of income.
The effect of income tax positions are recognized only if those positions are more likely than not of being sustained. Changes in recognition or measurement are made as facts and circumstances change.
Stock-Based Compensation - We account for stock-based compensation on a fair value basis. The estimated grant date fair value of each stock-based award is recognized in expense over the requisite service period (generally the vesting period). The estimated fair value of each option is calculated using the Black-Scholes option-pricing model. Non-vested share awards are recorded as compensation expense over the requisite service periods based on the market value on the date of grant.
Earnings Per Share - Basic earnings per share (“EPS”) are computed by dividing net income by the weighted-average number of common shares outstanding. Diluted EPS are computed by dividing net income by the weighted-average number of common shares outstanding including the incremental shares assumed to be issued upon the exercise of stock options and the incremental shares assumed to be issued as performance units and restricted stock. Basic and diluted EPS were calculated using the following:
| | | | | March 31, 2013 | | April 1, 2012 | | April 3, 2011 | | March 29, 2015 | | March 30, 2014 | | March 31, 2013 |
| Weighted average common shares outstanding — basic | | 10,464,820 |
| | 10,339,391 |
| | 10,260,135 |
| | 10,568,582 |
| | 10,544,467 |
| | 10,464,820 |
|
| Dilutive impact of stock options, performance units, and restricted stock | | 76,322 |
| | 69,182 |
| | 92,498 |
| |
| Dilutive impact of stock performance units, restricted stock, and stock options | | | 64,972 |
| | 55,288 |
| | 76,322 |
|
| Weighted average common shares outstanding — diluted | | 10,541,142 |
| | 10,408,573 |
| | 10,352,633 |
| | 10,633,554 |
| | 10,599,755 |
| | 10,541,142 |
|
There were no shares or stock options excluded from the calculation of weighted average common shares for diluted EPS for fiscal 2013, 20122015, 2014 or 2011.2013.
Derivative Instruments and Hedging Activities - We do not have any freestanding or embedded derivatives and it is our practice to not enter into contracts that contain them.
Recently AdoptedIssued Accounting Pronouncements -
In May 2014, the Financial Accounting Standards Board issued new accounting requirements for recognition of revenue from contracts with customers. The requirements of the new standard will be effective for annual reporting periods beginning after December 15, 2016 (our fiscal year ending April 1, 2018), and interim periods within those annual periods. We are currently evaluating the impact of this accounting pronouncement.
Note 2 — Business Combinations
Comprehensive Income - Acquisition of The Dumont Company, Inc.In June 2011, the FASB amended its accounting guidance to increase the prominence of items reported in other comprehensive income (OCI). The guidance requires the presentation: On October 20, 2014, we acquired substantially all of the componentsassets of net income,The Dumont Company, Inc. (“Dumont”) under the componentsterms of OCIan asset purchase agreement with Dumont and total comprehensive income eitherits shareholders. We paid $10.1 million in cash including a single continuous statementworking capital adjustment in the third quarter of comprehensive income orfiscal 2015, using available cash on hand to fund the acquisition. Dumont was a water treatment chemical distribution company with revenues of approximately $14.0 million in two separate but consecutive statements.calendar year 2013. Through this acquisition we added seven operating locations across Florida. The guidance was effective for us beginningresults of operations since the acquisition date, and the assets, including the goodwill associated with this acquisition, are included in our fiscal 2013 financial statements. We have elected presentation of two separate but consecutive statements.Water Treatment segment. Costs associated with this transaction were not material to our company and were expensed as incurred.
The acquisition has been accounted for under the acquisition method of accounting, under which the total purchase price is allocated to the net tangible and intangible assets of Dumont acquired in connection with the acquisition based on their estimated fair values.
HAWKINS, INC.
NOTES TO CONSOLIDATED FINANCIAL STATEMENTS — (Continued)
We estimated the fair values of the assets acquired and liabilities assumed using a discounted cash flow analysis (income approach). The following table summarizes the preliminary allocation of the purchase price to the fair values assigned to the assets acquired and liabilities assumed at the date of the Dumont acquisition:
|
| | | |
| (In thousands) | Amount |
| Accounts receivable | $ | 1,358 |
|
| Inventory | 859 |
|
| Other assets | 159 |
|
| Property, plant, and equipment | 702 |
|
| Intangible assets | 3,509 |
|
| Current liabilities | (877 | ) |
| Net assets acquired | 5,710 |
|
| Goodwill | 4,358 |
|
| Total purchase price | $ | 10,068 |
|
Intangibles - Goodwill and Other - In September 2011, the FASB issued amended guidance onThe goodwill impairment testing to allow companies the alternative to first assess qualitative factors to determine whether it is necessary to perform the two-step quantitative goodwill impairment test. If,recognized as a result of this acquisition is primarily attributable to strategic and synergistic benefits, as well as the qualitative assessment, an entity determines that itassembled workforce. Such goodwill is more-likely-than-not thatexpected to be deductible for tax purposes.
The preliminary allocation of the fair valuepurchase price to the assets acquired and liabilities assumed resulted in the recognition of a reporting unit is less than its carrying amount, the quantitative impairment test is required. Otherwise, no further testing is required. The amendment was effective for us beginning in fiscal 2013.following intangible assets:
Note 2 — Business Combinations |
| | | | |
| (In thousands) | Amount | Life (in years) |
| Customer relationships | $ | 2,810 |
| 20 |
| Trade name | 699 |
| 4 |
| | $ | 3,509 |
| |
In fiscal 2011,Acquisition of Advance Chemical Solutions, Inc.: On October 1, 2013, we acquired substantially all of the assets of Vertex Chemical Corporation, Novel Wash Co. Inc. and R.H.A. Corporation, (collectively, “Vertex”).ACS. We paid $2.4 million in cash of $25.5 million at closing, and assumedhave paid an additional $0.4 million of a potential $0.5 million earnout in fiscal 2015. We may be obligated to pay the remainder of the earnout over the next two years based on the achievement of certain liabilitiesfinancial performance targets.
The ACS acquisition was accounted for under the acquisition method of Vertex. Theaccounting, under which the total estimated purchase price was revisedis allocated to $27.2the net tangible and intangible assets acquired based on their estimated fair values. We estimated the fair values of the assets acquired and liabilities assumed to be $2.8 million to reflect using a final working capital adjustmentdiscounted cash flow analysis (income approach). ACS had revenues of $1.7approximately $4.0 million, which was paid in early fiscal 2012. In connection with for the 12 months ended September 30, 2013. The results of its operations since the acquisition we incurred acquisition related costs during fiscal 2011 of $0.7 million, which were recorded as selling, generaldate, and administrative expensesthe assets, are included in the Consolidated Statements of Income.our Water Treatment segment.
HAWKINS, INC.
NOTES TO CONSOLIDATED FINANCIAL STATEMENTS — (Continued)
Note 3 — Cash and Cash Equivalents and Investments
The following table presents information about our financial assets and liabilities that are measured at fair value on a recurring basis as of March 31, 201329, 2015 and April 1, 2012,March 30, 2014, and indicates the fair value hierarchy of the valuation techniques utilized to determine such fair value.
| | | Description | | March 31, 2013 | | Level 1 | | Level 2 | | Level 3 | | March 29, 2015 | | Level 1 | | Level 2 | | Level 3 |
| (In thousands) | | |
| Assets: | | | | | | | | | | | | | | | | |
| Cash | | $ | 28,715 |
| | $ | 28,715 |
| | $ | — |
| | $ | — |
| |
| Cash and cash equivalents | | | $ | 18,639 |
| | $ | 18,639 |
| | $ | — |
| | $ | — |
|
| Certificates of deposit | | 21,222 |
| | — |
| | 21,222 |
| | — |
| | 29,136 |
| | — |
| | 29,136 |
| | — |
|
| Money market securities | | — |
| | — |
| | — |
| | — |
| |
| Municipal Bonds | | | 2,598 |
| | — |
| | 2,598 |
| | — |
|
| | | | | | | | | | | | | | | | | |
| Description | | April 1, 2012 | | Level 1 | | Level 2 | | Level 3 | | March 30, 2014 | | Level 1 | | Level 2 | | Level 3 |
| (In thousands) | | |
| Assets: | | | | | | | | | | | | | | | | |
| Cash | | $ | 28,006 |
| | $ | 28,006 |
| | $ | — |
| | $ | — |
| |
| Cash and cash equivalents | | | $ | 33,486 |
| | $ | 33,486 |
| | $ | — |
| | $ | — |
|
| Certificates of deposit | | 17,349 |
| | — |
| | 17,349 |
| | — |
| | 24,437 |
| | — |
| | 24,437 |
| | — |
|
| Money market securities | | 560 |
| | 560 |
| | — |
| | — |
| |
| Municipal Bonds | | | 5,258 |
| | — |
| | 5,258 |
| | — |
|
Our financial assets that are measured at fair value on a recurring basis are certificates of deposit (“CD's”),CD’s and municipal bonds, with maturities ranging from three months to twothree years, which fall within valuation technique Level 2. The CD'sCD’s and municipal bonds are classified as investments in current assets and noncurrent assets on the Consolidated Balance Sheets.condensed consolidated balance sheets. As of March 31, 2013,29, 2015, the CD's haveCD’s and municipal bonds had a fair value of $15.614.5 million in current assets and $5.617.2 million in noncurrent assets.
The carrying value of cash and cash equivalents accounts approximates fair value, as maturities are three months or less. We did not have any financial liability instruments subject to recurring fair value measurements as of March 31, 2013 and April 1, 2012.
The contractual maturities of available-for-sale securities at March 31, 201329, 2015 and April 1, 2012March 30, 2014 are shown in the table below:
| | | | March 31, 2013 | | April 1, 2012 | March 29, 2015 | | March 30, 2014 |
| (In thousands) | | Amortized Cost | | Fair Value | | Unrealized Gain/(loss) | | Amortized Cost | | Fair Value | | Unrealized Gain/(loss) | | Amortized Cost | | Fair Value | | Unrealized Gain/(loss) | | Amortized Cost | | Fair Value | | Unrealized Gain/(loss) |
| Within one year | | $ | 15,615 |
| | $ | 15,625 |
| | $ | 10 |
| | $ | 12,205 |
| | $ | 12,210 |
| | $ | 5 |
| | $ | 14,491 |
| | $ | 14,485 |
| | $ | (6 | ) | | $ | 13,864 |
| | $ | 13,843 |
| | $ | (21 | ) |
| Between one and two years | | 5,590 |
| | 5,597 |
| | 7 |
| | 5,145 |
| | 5,139 |
| | (6 | ) | |
| Between one and three years | | | 17,285 |
| | 17,249 |
| | (36 | ) | | 15,890 |
| | 15,852 |
| | (38 | ) |
| Total available-for-sale securities | | $ | 21,205 |
| | $ | 21,222 |
| | $ | 17 |
| | $ | 17,350 |
| | $ | 17,349 |
| | $ | (1 | ) | | $ | 31,776 |
| | $ | 31,734 |
| | $ | (42 | ) | | $ | 29,754 |
| | $ | 29,695 |
| | $ | (59 | ) |
Realized gains and losses were not material for fiscal 2013, 20122015, 2014 and 2011.
2013.
HAWKINS, INC.
NOTES TO CONSOLIDATED FINANCIAL STATEMENTS — (Continued)
Note 4 — Inventories
Inventories at March 31, 201329, 2015 and April 1, 2012March 30, 2014 consisted of the following:
| | | | | 2013 | | 2012 | | 2015 | | 2014 |
| (In thousands) | | | | | | | | |
| Inventory (FIFO basis) | | $ | 35,281 |
| | $ | 35,072 |
| | $ | 42,567 |
| | $ | 31,344 |
|
| LIFO reserve | | (7,073 | ) | | (7,439 | ) | | (5,539 | ) | | (5,152 | ) |
| Net inventory | | $ | 28,208 |
| | $ | 27,633 |
| | $ | 37,028 |
| | $ | 26,192 |
|
The FIFO value of inventories accounted for under the LIFO method was $30.339.0 million at March 31, 201329, 2015 and $30.628.5 million at April 1, 2012.March 30, 2014. The remainder of the inventory was valued and accounted for under the FIFO method.
We decreasedincreased the LIFO reserve by $0.4 million in fiscal 20132015 due primarily to decreased volumeshigher levels of certain bulk chemicals in inventory at the end of the year. Inyear, and decreased the reserve $1.9 million in fiscal 2012 we increased the LIFO reserve by $1.6 million2014 due primarily to higher volumes and the mixlower levels of bulk chemicals in inventory at the end of thethat year.
HAWKINS, INC.
NOTES TO CONSOLIDATED FINANCIAL STATEMENTS — (Continued)
Note 5 — Goodwill and Other Identifiable Intangible Assets
The changes in the carrying amount of goodwill were as follows:
|
| | | |
| (In thousands) | Amount |
| Balance as of April 3, 2011 | $ | 6,231 |
|
| Fiscal 2012 adjustment | 264 |
|
| | |
| Balance as of April 1, 2012 | 6,495 |
|
| Fiscal 2013 adjustment | — |
|
| | |
| Balance as of March 31, 2013 | $ | 6,495 |
|
| | |
|
| | | |
| (In thousands) | Amount |
| Balance as of March 31, 2013 | $ | 6,495 |
|
| ACS Acquisition | 897 |
|
| Balance as of March 30, 2014 | 7,392 |
|
| Dumont Acquisition | 4,358 |
|
| Balance as of March 29, 2015 | $ | 11,750 |
|
| | |
All of our goodwill relates to our Industrial operating segment. The increaseincreases in goodwill during fiscal 2012 relates to the finalization of the determination of the fair value of inventory acquiredshown above have been recorded as part of the acquisition of Vertex.our Water Treatment segment.
AThe following is a summary of our intangible assets as of March 31, 201329, 2015 and April 1, 2012 were as follows:March 30, 2014:
| | | | | 2013 | | 2012 | | 2015 | | 2014 |
| | | Gross Amount | | Accumulated Amortization | | Net | | Gross Amount | | Accumulated Amortization | | Net | | Gross Amount | | Accumulated Amortization | | Net | | Gross Amount | | Accumulated Amortization | | Net |
| (In thousands) | | | | | | | | | | | | | | | | | | | | | | | | |
| Finite-life intangible assets: | | | | | | | | | | | | | | | | | | | | | | | | |
| Customer relationships | | $ | 5,508 |
| | $ | (981 | ) | | $ | 4,527 |
| | $ | 5,508 |
| | $ | (706 | ) | | $ | 4,802 |
| | $ | 9,723 |
| | $ | (1,697 | ) | | $ | 8,026 |
| | $ | 6,913 |
| | $ | (1,292 | ) | | $ | 5,621 |
|
| Trademark | | 1,240 |
| | (274 | ) | | 966 |
| | 1,240 |
| | (150 | ) | | 1,090 |
| |
| Trademarks and trade names | | | 2,034 |
| | (667 | ) | | 1,367 |
| | 1,335 |
| | (421 | ) | | 914 |
|
| Trade secrets | | 962 |
| | (640 | ) | | 322 |
| | 862 |
| | (521 | ) | | 341 |
| | 962 |
| | (896 | ) | | 66 |
| | 962 |
| | (768 | ) | | 194 |
|
| Carrier relationships | | 800 |
| | (177 | ) | | 623 |
| | 800 |
| | (96 | ) | | 704 |
| | 800 |
| | (337 | ) | | 463 |
| | 800 |
| | (257 | ) | | 543 |
|
| Other finite-life intangible assets | | 339 |
| | (326 | ) | | 13 |
| | 339 |
| | (317 | ) | | 22 |
| | 341 |
| | (336 | ) | | 5 |
| | 341 |
| | (331 | ) | | 10 |
|
| Total finite-life intangible assets | | 8,849 |
| | (2,398 | ) | | 6,451 |
| | 8,749 |
| | (1,790 | ) | | 6,959 |
| | 13,860 |
| | (3,933 | ) | | 9,927 |
| | 10,351 |
| | (3,069 | ) | | 7,282 |
|
| Indefinite-life intangible assets | | 1,227 |
| | — |
| | 1,227 |
| | 1,227 |
| | — |
| | 1,227 |
| | 1,227 |
| | — |
| | 1,227 |
| | 1,227 |
| | — |
| | 1,227 |
|
| Total intangible assets, net | | $ | 10,076 |
| | $ | (2,398 | ) | | $ | 7,678 |
| | $ | 9,976 |
| | $ | (1,790 | ) | | $ | 8,186 |
| | $ | 15,087 |
| | $ | (3,933 | ) | | $ | 11,154 |
| | $ | 11,578 |
| | $ | (3,069 | ) | | $ | 8,509 |
|
Intangible asset amortization expense was $0.60.9 million during fiscal 2013,2015, $0.7 million during fiscal 2014, and $0.6 million during fiscal 2012, and $0.3 million during fiscal 2011.2013.
The estimated future amortization expense for identifiable intangible assets during the next five years is as follows:
| | | (In thousands) | | 2014 | | 2015 | | 2016 | | 2017 | | 2018 | | 2016 | | 2017 | | 2018 | | 2019 | | 2020 |
| Estimated amortization expense | | $ | 612 |
| | $ | 612 |
| | $ | 522 |
| | $ | 499 |
| | $ | 487 |
| | $ | 932 |
| | $ | 885 |
| | $ | 873 |
| | $ | 791 |
| | $ | 690 |
|
HAWKINS, INC.
NOTES TO CONSOLIDATED FINANCIAL STATEMENTS — (Continued)
Note 6 — Accumulated Other Comprehensive Income (Loss)
Components of accumulated other comprehensive income (loss) on our balance sheet, net of tax, were as follows:
| | | (In thousands) | | 2013 | | 2012 | | 2015 | | 2014 |
| Unrealized gain (loss) on: | | | | | | | | |
| Available-for-sale investments | | $ | 11 |
| | $ | (1 | ) | | $ | (25 | ) | | $ | (36 | ) |
| Post-retirement plan liability adjustments | | (117 | ) | | (122 | ) | | (7 | ) | | (8 | ) |
| Accumulated other comprehensive loss | | $ | (106 | ) | | $ | (123 | ) | | $ | (32 | ) | | $ | (44 | ) |
Note 7 — Share-Based Compensation
Stock Option Awards. Our Board of Directors has approved a long-term incentive equity compensation arrangement for our executive officers. This long-term incentive arrangement provides for the grant of nonqualified stock options that vest at the end of a three-year period and expire no later than 10 years after the grant date. We used the Black-Scholes valuation model to estimate the fair value of options granted under this arrangement. No stock options were granted during fiscal 2013, 2012 or 2011.
The following table represents the stock option activity for fiscal 2013:
|
| | | | | | | | | | | | | | | | | | | | | | |
| | | Total Outstanding | | Exercisable |
| (In thousands, except share data) | | Shares | | Weighted- Average Exercise Price | | Aggregate Intrinsic Value | | Shares | | Weighted- Average Exercise Price | | Aggregate Intrinsic Value |
| Outstanding at beginning of year | | 46,665 |
| | $ | 19.01 |
| | $ | 1,547 |
| | 9,333 |
| | $ | 15.43 |
| | $ | 320 |
|
| Granted | | — |
| | — |
| | | | — |
| | — |
| | |
| Vested | | — |
| | — |
| | | | 37,332 |
| | 19.90 |
| | |
| Exercised | | (27,999 | ) | | 18.41 |
| | | | (27,999 | ) | | 18.41 |
| | |
| Forfeited or expired | | — |
| | — |
| | | | — |
| | — |
| | |
| Outstanding at end of year | | 18,666 |
| | $ | 19.90 |
| | $ | 665 |
| | 18,666 |
| | $ | 19.90 |
| | $ | 665 |
|
The weighted average remaining life of all outstanding and exercisable options is 6.2 years.
No expense was recorded in fiscal 2013 related to the value of stock options. Expense related to the value of stock options was $0.1 million and $0.2 million for fiscal years 2012 and 2011, respectively, substantially all of which was recorded in SG&A expense in the Consolidated Statements of Income. The total fair value of options vested during fiscal 2013 was $0.2 million compared to $0.1 million during fiscal 2012 and$0.2 million during fiscal 2011. There was no unrecognized compensation expense related to outstanding stock options as of March 31, 2013.
Performance-Based Restricted Stock Units. Our Board of Directors has approved a performance-based equity compensation arrangement for our executive officers. This performance-based arrangement provides for the grant of performance-based restricted stock units that represent a possible future issuance of restricted shares of our common stock based on our pre-tax income target for the applicable fiscal year. The actual number of restricted shares to be issued to each executive officer will be determined when our final financial information becomes available after the applicable fiscal year and will be between zero shares and 47,22250,874 shares
HAWKINS, INC.
NOTES TO CONSOLIDATED FINANCIAL STATEMENTS — (Continued)
in the aggregate for fiscal 2013.2015. The restricted shares issued will fully vest two years after the last day of the fiscal year on which the performance is based. We are recording the compensation expense for the outstanding performance share units and then-converted restricted stock over the life of the awards.
HAWKINS, INC.
NOTES TO CONSOLIDATED FINANCIAL STATEMENTS — (Continued)
The following table represents the restricted stock activity for fiscal 2013:2015:
| | | | | Shares | | Weighted- Average Grant Date Fair Value | | Shares | | Weighted- Average Grant Date Fair Value |
| Outstanding at beginning of year | | 33,321 |
| | $ | 35.39 |
| | 52,104 |
| | $ | 36.99 |
|
| Granted | | 29,923 |
| | 33.01 |
| | 24,932 |
| | 34.45 |
|
| Vested | | — |
| | — |
| | (23,300 | ) | | 33.01 |
|
| Forfeited or expired | | — |
| | — |
| | (156 | ) | | 33.01 |
|
| Outstanding at end of year | | 63,244 |
| | $ | 34.26 |
| | 53,580 |
| | $ | 37.55 |
|
The weighted averagedaverage grant date fair value of restricted shares grantedissued in fiscal 2013, 20122015, 2014 and 20112013 was $33.0134.45, $35.3940.25, and $25.8133.01, respectively. We recorded compensation expense on performance-based restricted stock of approximately $1.1 million, for fiscal 2015, $0.8 million for fiscal 2014 and $1.61.1 million for fiscal 2013, 2012 and 2011, respectively, substantially all of which was recorded in selling, general and administrative ("(“SG&A"&A”) expense in the Consolidated Statements of Income. The total fair value of performance-based restricted stock units vested in fiscal 20132015 was zero$0.8 million compared to $0.3$1.3 million in fiscal 2012.2014 and zero in fiscal 2013.
Until the performance-based restricted stock units result in the issuance of restricted stock, the amount of expense recorded each period is dependent upon our estimate of the number of shares that will ultimately be issued and our then current common stock price. Upon issuance of restricted stock, we record compensation expense over the remaining vesting period using the award date closing price. Unrecognized compensation expense related to non-vested restricted stock and non-vested restricted share units as of March 31, 201329, 2015 was $1.21.0 million and is expected to be recognized over a weighted average period of 1.01.1 years years..
The benefits of tax deductions in excess of recognized compensation costs (excess tax benefits)from share-based compensation are recorded as a change in additional paid-in capital rather than a deduction of taxes paid. The amount of excess tax benefit (expense) recognized and recorded in additional paid-in capital resulting from share-based compensation cost was $0.1 million in fiscal 2015, $(0.2) million in fiscal 2014 and $0.5 million in fiscal 2013, $0.7 million in fiscal 2012 and $0.3 million in 2011.2013.
Restricted Stock Awards. As part of their retainer, the Board of Directors receivesnon-employee directors receive restricted stock for their Board services. The restricted stock awards are expensed over the requisite vesting period, which begins on the date of issuance and ends on the date of the next Annual Meeting of Shareholders, based on the market value on the date of grant. The following table represents the Board'sBoard’s restricted stock activity for fiscal 2013:2015:
| | | | | Shares | | Weighted- Average Grant Date Fair Value | | Shares | | Weighted- Average Grant Date Fair Value |
| Outstanding at beginning of period | | 6,120 |
| | $ | 34.31 |
| | 6,055 |
| | $ | 40.42 |
|
| Granted | | 5,724 |
| | 36.65 |
| | 7,077 |
| | 34.61 |
|
| Vested | | (6,120 | ) | | 34.31 |
| | (6,055 | ) | | 40.42 |
|
| Forfeited or expired | | — |
| | — |
| | — |
| | — |
|
| Outstanding at end of period | | 5,724 |
| | $ | 36.65 |
| | 7,077 |
| | $ | 34.61 |
|
Annual expense related to the value of restricted stock was $0.2 million for each of fiscal 2013, 20122015, 2014 and 2011,2013, all of which was recorded in SG&A expense in the Consolidated Statements of Income. Unrecognized compensation expense related to non-vested restricted stock awards as of March 31, 201329, 2015 was $0.1 million and is expected to be recognized over a weighted average period of 0.3 years.
Stock Option Awards. Our Board of Directors (the “Board”) previously approved a long-term incentive equity compensation arrangement for our executive officers that provided for the grant of non-qualified stock options that vested at the end of a three-year period, although no stock options have been granted under this arrangement since the fiscal year ended March 28, 2010.
HAWKINS, INC.
NOTES TO CONSOLIDATED FINANCIAL STATEMENTS — (Continued)
During fiscal 2015, 9,333 options were exercised with an exercise price of $19.90. As of March 29, 2015 we had no stock options outstanding. No expense was recorded in fiscal 2015, 2014 or 2013 related to the value of stock options.
Note 8 — Share Repurchase Program
On May 29, 2014, our Board authorized a share repurchase program of up to 300,000 shares of our outstanding common shares. Under the program, we are authorized to repurchase shares for cash on the open market or in privately negotiated transactions subject to applicable securities laws and regulations. Upon repurchase of the shares, we reduce our common stock for the par value of the shares with the excess applied against additional paid-in capital. During fiscal 2015 we repurchased 59,602 shares of common stock with an aggregate purchase price of $2.2 million.
Note 9 — Profit Sharing, Employee Stock Ownership, Employee Stock Purchase and Pension Plans
Company sponsored plans. Substantially all of our non-bargaining unit employees are eligible to participate in a company sponsored profit sharing plan. It is our policy to fund all costs accrued. Contributions are made at our discretion subject to a maximum amount allowed under the Internal Revenue Code. Beginning in fiscal 2013, theThe profit sharing plan contribution level for each employee will dependdepends upon date of hire, with those employees hired after April 1, 2012 eligible to receive a contribution that is 50% of the contribution made for employees hired on or before April 1, 2012. Our contribution to the profit sharing plan for fiscal 2015, fiscal 2014 and fiscal 2013 was 5% of each employee'semployee’s eligible compensation for employees hired on or before April 1, 2012. In addition to the changes indiscretionary employer contribution described above, the profit sharing plan for fiscal 2013, we introducedincludes a 401(k) plan that will allowallows employees to contribute pre-tax earnings up to the maximum amount allowed under the Internal Revenue Code, with an employer match of up to 5% of the employee’s eligible compensation. Our contribution to the profit sharing plan was 15% of each employee's eligible compensation in each of fiscal years 2012 and 2011.
We have an employee stock ownership plan (“ESOP”) covering substantially all of our non-bargaining unit employees. Contributions are made at our discretion subject to a maximum amount allowed under the Internal Revenue Code. Beginning in fiscal 2013, theThe ESOP contribution level for each employee will dependdepends upon date of hire, with those employees hired after April 1, 2012 eligible to receive a contribution that is 50% of the contribution made for employees hired on or before April 1, 2012. Our contribution to the ESOP for fiscal 2015, fiscal 2014 and fiscal 2013 was 5% of each employee'semployee’s eligible compensation for employees hired on or before April 1, 2012. Our contribution to the ESOP was 5% of each employee’s eligible compensation in each of the fiscal years 2012 and 2011.
We have an employee stock purchase plan (“ESPP”) covering substantially all of our employees. The ESPP allows employees to purchase newly-issued shares of the Company’s common stock at a discount from market,market. The number of new shares issued under the plan was 31,383 in fiscal 2015, 28,214 in fiscal 2014 and 30,434 in fiscal 2013.
In March 2013, concurrent with no employeeour withdrawal from a multiemployer pension plan described below, we established a retirement plan and ESOP for our collective bargaining unit employees. Each of these plans is subject to a maximum amount allowed under the Internal Revenue Code. The retirement plan provides for a contribution match from the Company. Prior to fiscal 2012, this plan had a monthly employer match of 75%5% of each employee’s eligible wages annually for employees who were eligible to enter the plan on March 1, 2013 and a contribution upof 2.5% of each employee’s eligible wages annually for employees who entered the plan subsequent to a maximum of $375 per month, withMarch 1, 2013. Additionally, the ESPP shares of the Company purchased on the open market.
In fiscal 2012, Vertex employees participated inretirement plan includes a 401(k) plan that includedwill allow employees to contribute pre-tax earnings up to the maximum amount allowed under the Internal Revenue Code, with an employer match of up to 3%5% of the employee’s eligible compensationcompensation. The ESOP provides for contributions of 5% of each employee’s eligible wages annually for employees who were eligible to enter the plan on March 1, 2013, and a discretionary Company contribution. The total company contribution of 2.5% of each employee’s eligible wages annually for employees who enter the plan subsequent to this plan was $0.2 million. Beginning in fiscal 2013, Vertex employees are included within the Company’s retirement plans outlined above.March 1, 2013.
The following represents the contribution expense for the company sponsored profit sharing, ESOP, ESPP and 401(k) plans for fiscal 2013, 20122015, 2014 and 2011:2013:
| | | Benefit Plan | | 2013 | | 2012 | | 2011 | | 2015 | | 2014 | | 2013 |
| (In thousands) | | | |
| | | | | | | | |
| Non-bargaining unit employee plans: | | | | | | | |
| Profit sharing | | $ | 1,204 |
| | $ | 2,616 |
| | $ | 2,675 |
| | $ | 1,266 |
| | $ | 1,231 |
| | $ | 1,204 |
|
| 401(K) matching contributions | | 1,206 |
| | — |
| | — |
| | 1,216 |
| | 980 |
| | 1,206 |
|
| ESOP | | 1,203 |
| | 802 |
| | 815 |
| | 1,266 |
| | 1,231 |
| | 1,203 |
|
| ESPP | | 289 |
| | 262 |
| | 648 |
| |
| Vertex plan | | — |
| | 175 |
| | — |
| |
| Bargaining unit employee plans | | | 450 |
| | 500 |
| | — |
|
| ESPP - all employees | | | 253 |
| | 257 |
| | 289 |
|
| Total contribution expense | | $ | 3,902 |
| | $ | 3,855 |
| | $ | 4,138 |
| | $ | 4,451 |
| | $ | 4,199 |
| | $ | 3,902 |
|
HAWKINS, INC.
NOTES TO CONSOLIDATED FINANCIAL STATEMENTS — (Continued)
Multiemployer pension plan. In the fourth quarter of fiscal 2013, we concluded negotiations with two collective bargaining units to discontinue our participation in the Central States, Southeast and Southwest Areas Pension Fund (“CSS” or “the plan”), a collectively bargained multiemployer pension plan.Our participation in the plan, was pursuant to two collective bargaining agreements that each expired on February 28, 2013. Our contributions to the plan were determined in accordance with the provisions of the collective bargaining agreements and were based on a fixed payment per employee for each week worked. In accordance with accounting guidance, we have recorded the required cash contributions to the CSS as an expense in the period incurred.
The risks of participating in a multiemployer pension plan are different from the risks of participating in a single-employer plan in the following respects: (1) assets contributed to a multiemployer fund by each employer are comingled with the assets contributed by other employers and are used to finance the benefits to employees of all participating employers; (2) to the extent that the assets of the fund are insufficient to meet the fund's obligations to all of the employees whose accrued benefits are vested, the plan accrues an “unfunded vested liability”; (3) if a participating employer withdraws from the fund (for example, stops contributing to the plan), the fund is required by law to charge a proportional share of the unfunded vested liability to the withdrawing employer. This is referred to as a withdrawal liability. As a result of the extent to which CSS is underfunded, CSS is considered to be in “critical status” as defined by the Pension Protection Act of 2006. Based upon the most recent information available from the trustees of CSS, our withdrawal liability (that is, our share of the plan's unfunded vested benefit liability) was estimated to be
HAWKINS, INC.
NOTES TO CONSOLIDATED FINANCIAL STATEMENTS — (Continued)
approximately $10.0 million if the withdrawal had occurred in calendar year 2012, an increase from an estimate of approximately $7.9 million if the withdrawal had occurred in calendar year 2011.
Accounting guidance for multiemployer pension plans provides that a withdrawal liability should be recorded if circumstances that give rise to an obligation become probable and estimable. In fiscal 2013, we discontinued our participation in CSS and as a result we recorded a pre-tax charge of $7.2 million (approximately ($4.5 million after tax, or $0.43 per share, fully diluted)diluted share). This charge represents the discounted value of our estimated withdrawal payment obligation and has beenwas recorded as a charge to cost of sales in our Industrial segment.segment in fiscal 2013.
Payment of our share of the unfunded vested benefit liability maywill be made over 20 years and is subject to a cap. At the end of the 20-year period we wouldwill have no further liability, even if our share of the unfunded vested benefit liability hadhas not yet been paid in full. The annual payment amount is determined based on (1) the average number of work hours reported to the pension plan trust during the 3 consecutive years with the highest number of contribution work weeks in the 10-year period prior to the withdrawal, multiplied by (2) the highest hourly contribution rate during the 10-year period. We estimate the aggregate cash payments to be made to total approximately $9.3 million, or $467,000 per year beginning some time in fiscal 2014. We have accrued the discounted value of that payment obligationyear. Our payments began in the “Pension withdrawal” line item on the Consolidated Statementthird quarter of Income for the fiscal year ended March 31, 2013.2014.
We made contributions to CSS of approximately $0.4 million in each of fiscal 2013 2012 and 2011. Effective March 1, 2013, we established defined-contribution retirement benefitsprior to discontinuing our union employees that are similarparticipation in the plan. No contributions were made to those benefits currently offered to our non-union employees. Contributions to this planCSS for fiscal 2013 were nominal.2014 or fiscal 2015.
Note 910 — Commitments and Contingencies
Leases — We have various operating leases for primarily buildings and land on which some of our operations are located.located as well as trucks utilized for deliveries in certain branches. Future minimum lease payments due under operating leases with an initial term of one year or more at March 31, 201329, 2015 are as follows:
| | | (In thousands) | | 2014 | | 2015 | | 2016 | | 2017 | | 2018 | | Thereafter | | 2016 | | 2017 | | 2018 | | 2019 | | 2020 | | Thereafter |
| Minimum lease payment | | $ | 1,142 |
| | $ | 1,196 |
| | $ | 1,108 |
| | $ | 1,020 |
| | $ | 958 |
| | $ | 4,947 |
| | $ | 2,139 |
| | $ | 1,916 |
| | $ | 1,740 |
| | $ | 1,555 |
| | $ | 1,388 |
| | $ | 4,198 |
|
Total rental expense for the fiscal years 2013, 20122015, 2014 and 20112013 was as follows:
| | | | | 2013 | | 2012 | | 2011 | | 2015 | | 2014 | | 2013 |
| (In thousands) | | | | | | | | | | | | |
| Minimum rentals | | $ | 818 |
| | $ | 617 |
| | $ | 552 |
| | $ | 1,665 |
| | $ | 1,223 |
| | $ | 818 |
|
| Contingent rentals | | 110 |
| | 102 |
| | 114 |
| | 103 |
| | 110 |
| | 110 |
|
| Total rental expense | | $ | 928 |
| | $ | 719 |
| | $ | 666 |
| | $ | 1,768 |
| | $ | 1,333 |
| | $ | 928 |
|
Litigation - As of March 30, 2014 there were no material pending legal proceedings, other than ordinary routine litigation incidental to the business, to which we or any of our subsidiaries are a party or of which any of our property is the subject. Legal fees associated with such matters are expensed as incurred.
In the first quarter of fiscal 2013, we entered into a settlement agreement with ICL Performance Products LP (“ICL”), a chemical supplier to us, pursuant to which we mutually resolved the previously disclosed litigation and all disputes among us. The settlement agreement provided for a cash payment by us to ICLthe supplier and provided that both parties enter into new contracts for the supply by ICLthe supplier of certain chemicals to us. Our obligations under the settlement agreement resulted in a $3.2 million charge to pre-tax income recorded in cost of sales (approximately $2.0 million after tax, or $0.19 per share, fully diluted after tax)share) in the first quarter of fiscal 2013, which was recorded in our Industrial segment.2013.
We are a party from time to time in litigation arising in the ordinary course of our business. To date, other litigation has not had a material effect on us. Legal costs associated with such matters are expensed as incurred.
Asset Retirement Obligations - We have three leases of land andwhich contain terms that state that at the end of the lease term (currently 2023 for one lease and 2018 for the other two leases if the leases are not renewed)leases), we have a specified amount of time to remove the property and buildings. At the end of the specified amount ofthat time, anything that remains on the land becomes the property of the lessor, and the lessor has the option to either maintain the property or remove the property at our expense. We are currently negotiating extensions for a period of 15-20 years for the two leases which expire in 2018. We have not been able to reasonably estimate the fair value of the asset retirement obligations, primarily due to the combination of the following factors: The leases do not expire in the near future; we have a history of extending the leases with the lessors and currently intend to do so at expiration of the lease periods; the lessors do not have a history of terminating leases with their tenants; and because it is more likely than not that the buildings will have value at the end of the lease life and therefore, may not be removed by either
the lessee or the lessor. Therefore, in accordance with accounting guidance related to asset retirement and environmental obligations, we have not recorded an asset retirement obligation as of March 31, 2013.29, 2015. We will continue to monitor the factors surrounding the requirement to record an asset retirement obligation and will recognize the fair value of a liability in the period in which it is incurred and a reasonable estimate can be made.
HAWKINS, INC.
NOTES TO CONSOLIDATED FINANCIAL STATEMENTS — (Continued)
Note 1011 — Income Taxes
The provisions for income taxes for fiscal 2013, 20122015, 2014 and 20112013 are as follows:
| | | | | 2013 | | 2012 | | 2011 | | 2015 | | 2014 | | 2013 |
| (In thousands) | | | | | | | | | | | | |
| Federal — current | | $ | 8,967 |
| | $ | 8,632 |
| | $ | 9,818 |
| | $ | 9,574 |
| | $ | 7,612 |
| | $ | 8,967 |
|
| State — current | | 2,417 |
| | 2,546 |
| | 2,531 |
| | 2,133 |
| | 1,255 |
| | 2,417 |
|
| Total current | | 11,384 |
| | 11,178 |
| | 12,349 |
| | 11,707 |
| | 8,867 |
| | 11,384 |
|
| | | | | | | | |
| Federal — deferred | | (2,466 | ) | | 2,796 |
| | (69 | ) | | (517 | ) | | 676 |
| | (2,466 | ) |
| State — deferred | | (600 | ) | | 316 |
| | (299 | ) | | 50 |
| | 424 |
| | (600 | ) |
| Total deferred | | (3,066 | ) | | 3,112 |
| | (368 | ) | | (467 | ) | | 1,100 |
| | (3,066 | ) |
| Total provision | | $ | 8,318 |
| | $ | 14,290 |
| | $ | 11,981 |
| | $ | 11,240 |
| | $ | 9,967 |
| | $ | 8,318 |
|
Our effective tax rate for fiscal 2014 was reduced by a non-recurring state tax benefit of $0.4 million. During fiscal 2013, we amended previously filed U.S. federalFederal tax returns resulting in an increase of $0.8$0.8 million in the benefits related to the domestic manufacturing deduction and investment tax credits, which positively impactedreduced our tax rate for thethat year. Reconciliations of the provisions for income taxes, based on income from continuing operations, to the applicable federal statutory income tax rate of 35% are listed below.
| | | | | 2013 | | 2012 | | 2011 | | 2015 | | 2014 | | 2013 |
| Statutory federal income tax | | 35.0 | % | | 35.0 | % | | 35.0 | % | | 35.0 | % | | 35.0 | % | | 35.0 | % |
| State income taxes, net of federal deduction | | 4.9 | % | | 5.0 | % | | 4.7 | % | | 4.7 | % | | 3.2 | % | | 4.9 | % |
| ESOP dividend deduction on allocated shares | | (1.0 | )% | | (0.7 | )% | | (1.2 | )% | | (0.7 | )% | | (0.8 | )% | | (1.0 | )% |
| Domestic production deduction | | (2.7 | )% | | (0.9 | )% | | (1.3 | )% | | (2.4 | )% | | (2.1 | )% | | (2.7 | )% |
| Impact of amended tax returns | | (3.3 | )% | | — | % | | — | % | | — | % | | — | % | | (3.3 | )% |
| Other — net | | (0.2 | )% | | 0.2 | % | | (0.1 | )% | | 0.3 | % | | 0.2 | % | | (0.2 | )% |
| Total | | 32.7 | % | | 38.6 | % | | 37.1 | % | | 36.9 | % | | 35.5 | % | | 32.7 | % |
The tax effects of items comprising our net deferred tax asset (liability) as of March 31, 201329, 2015 and April 1, 2012March 30, 2014 are as follows:
| | | (In thousands) | | 2013 | | 2012 | | 2015 | | 2014 |
| Deferred tax assets: | | | | | | | | |
| Trade receivables | | $ | 188 |
| | $ | 184 |
| | $ | 178 |
| | $ | 191 |
|
| Stock compensation accruals | | 776 |
| | 601 |
| | 949 |
| | 1,031 |
|
| Pension withdrawal liability | | 2,902 |
| | — |
| | 2,755 |
| | 2,872 |
|
| Other accruals | | 1,031 |
| | 756 |
| |
| Other | | 69 |
| | 82 |
| | 811 |
| | 842 |
|
| Total deferred tax assets | | $ | 4,966 |
| | $ | 1,623 |
| | $ | 4,693 |
| | $ | 4,936 |
|
| Deferred tax liabilities: | | | | | | | | |
| Inventories | | $ | (3,319 | ) | | $ | (3,556 | ) | | $ | (3,307 | ) | | $ | (3,618 | ) |
| Prepaid | | (525 | ) | | (703 | ) | | (689 | ) | | (727 | ) |
| Excess of tax over book depreciation | | (11,385 | ) | | (10,807 | ) | | (12,699 | ) | | (13,221 | ) |
| Amortization of intangibles | | (354 | ) | | (149 | ) | | (674 | ) | | (456 | ) |
| Total deferred tax liabilities | | $ | (15,583 | ) | | $ | (15,215 | ) | | $ | (17,369 | ) | | $ | (18,022 | ) |
| Net deferred tax liabilities | | $ | (10,617 | ) | | $ | (13,592 | ) | | $ | (12,676 | ) | | $ | (13,086 | ) |
HAWKINS, INC.
NOTES TO CONSOLIDATED FINANCIAL STATEMENTS — (Continued)
As of March 31, 2013,29, 2015, the Company has determined that it is more likely than not that the deferred tax assets at March 31, 201329, 2015 will be realized either through future taxable income or reversals of taxable temporary differences. As of March 31, 201329, 2015 and April 1, 2012,March 30, 2014, there were no unrecognized tax benefits. Accordingly, a tabular reconciliation from beginning to ending periods is not provided.
HAWKINS, INC.
NOTES TO CONSOLIDATED FINANCIAL STATEMENTS — (Continued)
We are subject to U.S. federal income tax as well as income tax of multiple state jurisdictions. The tax years beginning withprior to our fiscal year ended March 29, 2009 remain openare closed to examination by the Internal Revenue Service, and with few exceptions, state and local income tax jurisdictions.
Note 1112 — Discontinued Operations
During the fiscal year ended March 29, 2009, we agreed to sell our inventory and entered into a marketing agreement regarding the business of our Pharmaceutical segment, which provided pharmaceutical chemicals to retail pharmacies and small-scale pharmaceutical manufacturers. We have no remaining obligations to fulfill under the agreement. The results of the Pharmaceutical segment have been reported as discontinued operations for all periods presented.
Note 1213 — Segment Information
We have two reportable segments: Industrial and Water Treatment. The accounting policies of the segments are the same as those described in the summary of significant accounting policies. Product costs and expenses for each segment are based on actual costs incurred along with cost allocationallocations of shared and centralized functions. We evaluate performance based on profit or loss from operations before income taxes not including nonrecurring gains and losses. Reportable segments are defined primarily by product and type of customer. Segments are responsible for the sales, marketing and development of their products and services. The segments do not have separate accounting, administration, customer service or purchasing functions. There are no intersegment sales and no operating segments have been aggregated. Given the nature of our nature,business, it is not practical to disclose revenues from external customers for each product or each group of similar products. No single customer'scustomer’s revenues amounted to 10% or more of our total revenue. We have one customer in our Industrial segment that represented 10.3% of Industrial segment sales. Sales are primarily within the United States and all assets are located within the United States.
| | | Reportable Segments | | Industrial | | Water Treatment | | Total | | Industrial | | Water Treatment | | Total |
| (In thousands) | | | | | | | | | | | | |
| Fiscal Year Ended March 29, 2015: | | | | | | | |
| Sales | | | $ | 249,066 |
| | $ | 114,957 |
| | $ | 364,023 |
|
| Gross profit | | | 33,619 |
| | 32,172 |
| | 65,791 |
|
| Selling, general, and administrative expenses | | | 19,793 |
| | 15,582 |
| | 35,375 |
|
| Operating income | | | 13,826 |
| | 16,590 |
| | 30,416 |
|
| Identifiable assets* | | | $ | 151,157 |
| | $ | 42,860 |
| | $ | 194,017 |
|
| Fiscal Year Ended March 30, 2014: | | | | | | | |
| Sales | | | $ | 244,888 |
| | $ | 103,375 |
| | $ | 348,263 |
|
| Gross profit | | | 32,041 |
| | 29,559 |
| | 61,600 |
|
| Selling, general, and administrative expenses | | | 19,781 |
| | 13,729 |
| | 33,510 |
|
| Operating income | | | 12,260 |
| | 15,830 |
| | 28,090 |
|
| Identifiable assets* | | | $ | 141,506 |
| | $ | 29,001 |
| | $ | 170,507 |
|
| Fiscal Year Ended March 31, 2013: | | | | | | | | | | | | |
| Sales | | $ | 248,556 |
| | $ | 101,831 |
| | $ | 350,387 |
| | $ | 248,556 |
| | $ | 101,831 |
| | $ | 350,387 |
|
| Gross profit | | 28,878 |
| | 28,058 |
| | 56,936 |
| | 28,878 |
| | 28,058 |
| | 56,936 |
|
| Selling, general, and administrative expenses | | 19,923 |
| | 11,683 |
| | 31,606 |
| | 19,923 |
| | 11,683 |
| | 31,606 |
|
| Operating income | | 8,955 |
| | 16,375 |
| | 25,330 |
| | 8,955 |
| | 16,375 |
| | 25,330 |
|
| Identifiable assets* | | $ | 143,827 |
| | $ | 25,448 |
| | $ | 169,275 |
| | $ | 143,827 |
| | $ | 25,448 |
| | $ | 169,275 |
|
| Fiscal Year Ended April 1, 2012: | | | | | | | |
| Sales | | $ | 251,451 |
| | $ | 92,383 |
| | $ | 343,834 |
| |
| Gross profit | | 40,357 |
| | 25,511 |
| | 65,868 |
| |
| Selling, general, and administrative expenses | | 19,805 |
| | 10,954 |
| | 30,759 |
| |
| Operating income | | 20,552 |
| | 14,557 |
| | 35,109 |
| |
| Identifiable assets* | | $ | 129,782 |
| | $ | 23,543 |
| | $ | 153,325 |
| |
| Fiscal Year Ended April 3, 2011: | | | | | | | |
| Sales | | $ | 208,724 |
| | $ | 88,917 |
| | $ | 297,641 |
| |
| Gross profit | | 36,938 |
| | 24,964 |
| | 61,902 |
| |
| Selling, general, and administrative expenses | | 19,828 |
| | 10,112 |
| | 29,940 |
| |
| Operating income | | 17,110 |
| | 14,852 |
| | 31,962 |
| |
| Identifiable assets* | | $ | 121,250 |
| | $ | 21,139 |
| | $ | 142,389 |
| |
* Unallocated assets, consisting primarily of cash and cash equivalents, investments and prepaid expenses, were $53.7 million at March 29, 2015, $66.7 million at March 30, 2014 and $52.9 million at March 31, 2013, $48.0 million at April 1, 2012 and $41.7 million at April 3, 2011. Additionally, assets associated with the
discontinued operations of the Pharmaceutical segment were zero at March 31, 2013, $1.2 million at April 1, 2012 and $0.9 million at April 3, 2011.2013.
In fiscal 2013, gross profit for our Industrial segment was negatively impacted by a $7.2$7.2 million (pre-tax) charge related to our withdrawal from a multiemployer pension plan (see Note 89 for further discussion) as well as a $3.2$3.2 million (pre-tax) charge related to a legal settlement (see Note 910 for further discussion).
HAWKINS, INC.
NOTES TO CONSOLIDATED FINANCIAL STATEMENTS — (Continued)
Note 1314 — Selected Quarterly Financial Data (Unaudited)
| | | (In thousands, except per share data) | | Fiscal 2013 | | Fiscal 2015 |
| | | First | | Second | | Third | | Fourth | | First | | Second | | Third | | Fourth |
| Sales | | $ | 90,099 |
| | $ | 87,160 |
| | $ | 85,527 |
| | $ | 87,601 |
| | $ | 98,036 |
| | $ | 88,881 |
| | $ | 83,825 |
| | $ | 93,281 |
|
| Gross profit | | 15,307 |
| | 19,196 |
| | 8,126 |
| | 14,307 |
| | 18,496 |
| | 18,122 |
| | 13,642 |
| | 15,531 |
|
| Selling, general, and administrative expenses | | 8,227 |
| | 7,455 |
| | 7,617 |
| | 8,307 |
| | 8,875 |
| | 8,271 |
| | 8,697 |
| | 9,532 |
|
| Operating income | | 7,080 |
| | 11,741 |
| | 509 |
| | 6,000 |
| | 9,621 |
| | 9,851 |
| | 4,945 |
| | 5,999 |
|
| Income from continuing operations, net of tax | | 4,365 |
| | 7,230 |
| | 1,348 |
| | 4,165 |
| |
| Income from discontinued operations, net of tax | | 18 |
| | — |
| | — |
| | — |
| |
| Net income | | $ | 4,383 |
| | $ | 7,230 |
| | $ | 1,348 |
| | $ | 4,165 |
| | $ | 6,021 |
| | $ | 6,147 |
| | $ | 3,146 |
| | $ | 3,900 |
|
| Basic net income per share | | $ | 0.42 |
| | $ | 0.69 |
| | $ | 0.13 |
| | $ | 0.40 |
| | $ | 0.57 |
| | $ | 0.58 |
| | $ | 0.30 |
| | $ | 0.37 |
|
| Diluted net income per share | | $ | 0.42 |
| | $ | 0.69 |
| | $ | 0.13 |
| | $ | 0.39 |
| | $ | 0.57 |
| | $ | 0.58 |
| | $ | 0.30 |
| | $ | 0.37 |
|
| | | | | | | | | | | | | | | | | |
| | | Fiscal 2012 | | Fiscal 2014 |
| | | First | | Second | | Third | | Fourth | | First | | Second | | Third | | Fourth |
| Sales | | $ | 88,594 |
| | $ | 87,870 |
| | $ | 84,160 |
| | $ | 83,210 |
| | $ | 94,744 |
| | $ | 86,599 |
| | $ | 81,697 |
| | $ | 85,223 |
|
| Gross profit | | 17,927 |
| | 18,750 |
| | 15,679 |
| | 13,512 |
| | 17,231 |
| | 16,570 |
| | 13,550 |
| | 14,249 |
|
| Selling, general, and administrative expenses | | 7,857 |
| | 7,844 |
| | 7,163 |
| | 7,895 |
| | 8,970 |
| | 8,293 |
| | 8,167 |
| | 8,080 |
|
| Operating income | | 10,070 |
| | 10,906 |
| | 8,516 |
| | 5,617 |
| | 8,261 |
| | 8,277 |
| | 5,383 |
| | 6,169 |
|
| Income from continuing operations, net of tax | | 6,353 |
| | 6,717 |
| | 5,285 |
| | 3,273 |
| |
| Income from discontinued operations, net of tax | | 374 |
| | 184 |
| | 267 |
| | 232 |
| |
| Net income | | $ | 6,727 |
| | $ | 6,901 |
| | $ | 5,552 |
| | $ | 3,505 |
| | $ | 5,112 |
| | $ | 5,207 |
| | $ | 3,480 |
| | $ | 4,295 |
|
| Basic net income per share | | $ | 0.65 |
| | $ | 0.67 |
| | $ | 0.54 |
| | $ | 0.34 |
| | $ | 0.49 |
| | $ | 0.49 |
| | $ | 0.33 |
| | $ | 0.41 |
|
| Diluted net income per share | | $ | 0.65 |
| | $ | 0.67 |
| | $ | 0.53 |
| | $ | 0.34 |
| | $ | 0.48 |
| | $ | 0.49 |
| | $ | 0.33 |
| | $ | 0.40 |
|
In the first quarter of fiscal 2013, we recorded a $3.2 million (pre-tax) charge related to a legal settlement (see Note 9 for further discussion). In the third quarter of fiscal 2013, we recorded a $7.2 million (pre-tax) charge related to our withdrawal from a multiemployer pension plan (see Note 8 for further discussion). Both items negatively impacted gross profit.
| |
ITEM 9. | CHANGES IN AND DISAGREEMENTS WITH ACCOUNTANTS ON ACCOUNTING AND FINANCIAL DISCLOSURE |
ITEM 9. CHANGES IN AND DISAGREEMENTS WITH ACCOUNTANTS ON ACCOUNTING AND FINANCIAL DISCLOSURE
Not applicable.
ITEM 9A. CONTROLS AND PROCEDURES
Evaluation of disclosure controls and procedures
As of the end of the period covered by this Annual Report on Form 10-K, we conducted an evaluation, under supervision and with the participation of management, including the chief executive officer and chief financial officer, of the effectiveness of the design and operation of our disclosure controls and procedures pursuant to Rules 13a-15(f) and 15d-15(f) of the Exchange Act. Based upon that evaluation, our chief executive officer and chief financial officer concluded that our disclosure controls and procedures are effective. Disclosure controls and procedures are defined by Rules 13a-15(e) and 15d-15(e) of the Exchange Act as controls and other procedures that are designed to ensure that information required to be disclosed by us in reports filed with the SEC under the Exchange Act is recorded, processed, summarized and reported within the time periods specified in the SEC'sSEC’s rules and forms. Disclosure controls and procedures include, without limitation, controls and procedures designed to ensure that information required to be disclosed by us in reports filed under the Exchange Act is accumulated and communicated to our management, including our principal executive and principal financial officers, or person performing similar functions, as appropriate to allow timely decisions regarding required disclosure.
Management'sManagement’s Report on Internal Control Over Financial Reporting
Our management is responsible for establishing and maintaining adequate internal control over financial reporting as defined in Rules 13a-15(f) and 15d-15(f) of the Securities Exchange Act. Our internal control over financial reporting is designed to provide reasonable assurance regarding the reliability of financial reporting and the preparation of financial statements for external purposes in accordance with generally accepted accounting principles. Our internal control over financial reporting includes those policies and procedures that (1) pertain to maintenance of records that, in reasonable detail, accurately and fairly reflect the transactions and dispositions of our assets; (2) provide reasonable assurance that transactions are recorded as necessary to permit preparation of the financial statements in accordance with generally accepted accounting principles, and that our receipts and expenditures are being made only in accordance with authorizations of our management and directors; and (3) provide reasonable assurance regarding prevention or timely detection of unauthorized acquisition, use or disposition of our assets that could have a material effect on the financial statements.
Because of its inherent limitations, internal control over financial reporting may not prevent or detect misstatements. Projections of any evaluation of the effectiveness of internal control over financial reporting to future periods are subject to the risk that the controls may become inadequate because of changes in conditions, or that the degree of compliance with the policies or procedures may deteriorate.
Our management assessed the effectiveness of our internal control over financial reporting as of March 31, 201329, 2015, based on the criteria described in Internal Control - Integrated Framework (1992) issued by the Committee of Sponsoring Organizations (“COSO���) of the Treadway Commission. Based on this assessment, management believes that our internal control over financial reporting was effective as of March 31, 201329, 2015.
In making this assessment as of March 29, 2015, we have excluded the Florida water treatment operations acquired from The Dumont Company, Inc. on October 20, 2014. The financial statements of this business comprise 4.3% of total assets and 1.6% of total revenues in our consolidated financial amounts as of and for the year ended March 29, 2015. We have excluded this business because we have not had sufficient time to make an assessment of its internal controls using the COSO criteria in accordance with Section 404 of the Sarbanes-Oxley Act of 2002. In excluding this business from our assessment, we have considered the “Frequently Asked Questions” as set forth by the office of the Chief Accountant and the Division of Corporate Finance on June 24, 2004, as revised on September 24, 2007, which acknowledges that it may not be possible to conduct an assessment of an acquired business’s internal control over financial reporting in the period between the consummation date and the date of management’s assessment and contemplates that such business would be excluded from management’s assessment in the year of acquisition.
Our independent registered public accounting firm has issued an attestation report on our internal control over financial reporting for March 31, 201329, 2015. That attestation report is set forth immediately following this management report.
|
| | | | |
| | | |
| /s/ Patrick H. Hawkins | | | | /s/ Kathleen P. Pepski |
| Patrick H. Hawkins | | | | Kathleen P. Pepski |
| Chief Executive Officer and President | | | | Vice President, Chief Financial Officer, and Treasurer |
May 30, 201328, 2015 | | | | May 30, 201328, 2015 |
Attestation Report of Registered Public Accounting Firm
The attestation report required under this Item 9A is contained in Item 8 of this Annual Report on 10-K under the caption “Report of Independent Registered Public Accounting Firm.”
Changes in Internal Control Procedures
There was no change in our internal control over financial reporting during the fourth quarter of fiscal 20132015 that has materially affected, or is reasonably likely to materially affect, our internal control over financial reporting.
ITEM 9B. OTHER INFORMATION
Not Applicable
PART III
Certain information required by Part III is incorporated by reference from Hawkins'Hawkins’ definitive Proxy Statement for the Annual Meeting of Shareholders to be held on August 1, 2013July 30, 2015 (the “20132015 Proxy Statement”). Except for those portions specifically incorporated in this Form 10-K by reference to the 20132015 Proxy Statement, no other portions of the 20132015 Proxy Statement are deemed to be filed as part of this Form 10-K.
ITEM 10. DIRECTORS, EXECUTIVE OFFICERS, AND CORPORATE GOVERNANCE
Our executive officers, their ages and offices held, as of May 24, 201322, 2015 are set forth below:
|
| | | | |
| Name | | Age | | Office |
| Patrick H. Hawkins | | 4244 | | Chief Executive Officer and President |
| Kathleen P. Pepski | | 5860 | | Vice President, Chief Financial Officer, and Treasurer |
| Richard G. Erstad | | 4951 | | Vice President, General Counsel and Secretary |
| Thomas J. Keller | | 5355 | | Vice President — Water Treatment Group |
| Steven D. Matthews II | | 44 | | Vice President — Operations |
| Theresa R. Moran | | 5052 | | Vice President — Quality and Support |
| John R. Sevenich | | 5557 | | Vice President — Industrial Group |
Patrick H. Hawkins was appointed to serve ashas been our Chief Executive Officer and President inand member of our board since March 2011. He had previously been promoted tohas held the position of President insince March 2010 as part of the Board's succession planning efforts.2010. He joined the Company in 1992 and served as the Business Director - Food and Pharmaceuticals, a position he held from 2009 to 2010. Previously he served as Business Manager - Food and Co-Extrusion Products from 2007 to 2009 and Sales Representative - Food Ingredients from 2002 to 2007. He previously served the Company in various other capacities, including Plant Manager, Quality Director and Technical Director.
Kathleen P. Pepski has been the Company'sour Vice President, Chief Financial Officer and Treasurer since February 2008 and was Secretary from February 2008 to November 2008. She was the Executive Vice President and Chief Financial Officer of PNA Holdings, LLC and Katun Corporation, a supplier of business equipment parts, from 2003 to 2007, the Vice President of Finance of Hoffman Enclosures, a manufacturer of systems enclosures and a subsidiary of Pentair, Inc., from 2002 to 2003, Senior Vice President and Chief Financial Officer of BMC Industries, Inc., a manufacturer of lenses and aperture masks, from 2000 to 2001, and Vice President and Controller at Valspar Corporation, a paint and coatings manufacturer, from 1994 to 2000.
Richard G. Erstad has been the Company'sour Vice President, General Counsel and Secretary since November 2008. He was General Counsel and Secretary of BUCA, Inc., a restaurant company, from 2005 to 2008. Mr. Erstad had previously been an attorney with the corporate group of Faegre & Benson LLP, a law firm, from 1996 to 2005, where his practice focused on securities law and mergers and acquisitions. He is a member of the Minnesota Bar.
Thomas J. Keller has been the Company'sour Vice President - Water Treatment Group since April 2012. Prior to attaining this position, Mr. Keller held various positions during his 32-year tenure withsince joining the Company in 1980, most recently as its Water Treatment General Manager, a position he held since June 2011. Previously, Mr. Keller served as a Regional Manager of the Water Treatment Group from 2002 to 2011.
Steven D. Matthews II has been our Vice President - Operations since December 2013. He was a Regional General Manager in the Paperboard Converting Division of Newark Recycled Paperboard Solutions, a producer of recycled paperboard, from 2012 to 2013. Previously, he spent a total of fifteen years during two different periods at General Electric in a variety of engineering, Six Sigma, supply chain and plant leadership positions in the Plastics, Aircraft Engines, Lighting and Water divisions. From 2005-2008, he was a Corporate Supply Chain Engagement Leader with Ingersoll Rand, a global diversified industrial company.
Theresa R. Moran has been the Company'sour Vice President - Quality and Support since February 2010. Since joining the Company in 1981, Ms. Moran has served the Company in a variety of positions, including Administration Operations Manager from 1999 to 2007 and most recently as Director - Process Improvement, a position she held from 2007 until the time of her promotion.
John R. Sevenich has been the Company'sour Vice President - Industrial Group since May 2000. He was the Business Unit Manager of Manufacturing from 1998 to 2000 and was a Sales Representative with the Company from 1989 to 1998.
“Election of Directors,” “Corporate Governance,” and “Section 16(a) Beneficial Ownership Reporting Compliance” of the 20122015 Proxy Statement are incorporated herein by reference.
Steven D. Matthews II filed a bankruptcy petition related to the dissolution of a small family business of which Mr. Matthews was an owner and guarantor. The bankruptcy was discharged in 2009.
We have adopted a Code of Business Conduct and Ethics that applies to all of our directors and employees, including our principal executive officer, principal financial officer, controller and other persons performing similar functions. We have posted the Code of Business Conduct and Ethics on our website located at http://www.hawkinsinc.com. Hawkins'Hawkins’ Code of Business Conduct and Ethics is also available in print to any shareholder who requests it in writing from our Corporate Secretary. We intend to post on our website any amendment to, or waiver from, a provision of our Code of Business Conduct and Ethics that applies to our principal executive officer, principal financial officer, controller and other persons performing similar functions within four business days following the date of such amendment or waiver. We are not including the information contained on our website as part of, or incorporating it by reference into, this report.
ITEM 11. EXECUTIVE COMPENSATION
“Compensation of Executive Officers and Directors” of the 20132015 Proxy Statement is incorporated herein by this reference.
| |
ITEM 12. | SECURITY OWNERSHIP OF CERTAIN BENEFICIAL OWNERS AND MANAGEMENT AND RELATED STOCKHOLDER MATTERS |
ITEM 12. SECURITY OWNERSHIP OF CERTAIN BENEFICIAL OWNERS AND MANAGEMENT AND RELATED STOCKHOLDER MATTERS
“Security Ownership of Management and Beneficial Ownership” and “Equity Compensation Plan Information” of the 20132015 Proxy Statement are incorporated herein by this reference.
ITEM 13. CERTAIN RELATIONSHIPS AND RELATED TRANSACTIONS, AND DIRECTOR INDEPENDENCE
“Election of Directors” and “Related Party Transactions” of the 20132015 Proxy Statement are incorporated herein by this reference.
ITEM 14. PRINCIPAL ACCOUNTANT FEES AND SERVICES
“Independent Registered Public Accounting Firm’s Fees” of the 20132015 Proxy Statement is incorporated herein by this reference.
PART IV
ITEM 15. EXHIBITS AND FINANCIAL STATEMENT SCHEDULES
|
| | |
| (a)(1) | | FINANCIAL STATEMENTS OF THE COMPANY |
| | |
| | | The following financial statements of Hawkins, Inc. are filed as part of this Annual Report on Form 10-K: |
| | |
| | | ReportsReport of Independent Registered Public Accounting Firms.Firm. |
| | |
| | | Consolidated Balance Sheets at March 31, 201329, 2015 and April 1, 2012.March 30, 2014. |
| | |
| | | Consolidated Statements of Income for the fiscal years ended March 29, 2015, March 30, 2014 and March 31, 2013, April 1, 2012, and April 3, 2011.2013. |
| | |
| | | Consolidated Statements of Comprehensive Income for the fiscal years ended March 29, 2015, March 30, 2014 and March 31, 2013, April 1, 2012, and April 3, 2011.2013. |
| | |
| | | Consolidated Statements of Shareholders'Shareholders’ Equity for the fiscal years ended March 29, 2015, March 30, 2014 and March 31, 2013, April 1, 2012, and April 3, 2011.2013. |
| | |
| | | Consolidated Statements of Cash Flows for the fiscal years ended March 29, 2015, March 30, 2014 and March 31, 2013, April 1, 2012, and April 3, 2011.2013. |
| | | |
| | | Notes to Consolidated Financial Statements. |
| | |
| (a)(2) | | FINANCIAL STATEMENT SCHEDULES OF THE COMPANY |
| | |
| | | The additional financial data listed below is included as a schedule to this Annual Report on Form 10-K and should be read in conjunction with the financial statements presented in Part II, Item 8. Schedules not included with this additional financial data have been omitted because they are not required or the required information is included in the financial statements or the notes. |
| | |
| | | The following financial statement schedule for the fiscal years 2013, 20122015, 2014 and 2011.2013. |
| | |
| | | Schedule II — Valuation and Qualifying Accounts. |
| | |
| (a)(3) | | EXHIBITS |
| | |
| | | The exhibits of this Annual Report on Form 10-K included herein are set forth on the attached Exhibit Index. |
SIGNATURES
Pursuant to the requirements of Section 13 or 15(d) of the Securities Exchange Act of 1934, the Company has duly caused this report to be signed on its behalf by the undersigned, thereunto duly authorized.
|
| | | | | |
| | | | HAWKINS, INC. |
| | | | |
| Date: | May 30, 201328, 2015 | | By | | /s/ Patrick H. Hawkins |
| | | | | | Patrick H. Hawkins, Chief Executive Officer and President |
POWER OF ATTORNEY
Each of the undersigned directors of the Company, does hereby make, constitute and appoint Patrick H. Hawkins and Kathleen P. Pepski, and either of them, the undersigned’s true and lawful attorney-in-fact and agent, acting alone, with full power of substitution, for the undersigned and in the undersigned’s name, place and stead, to sign and affix the undersigned’s name as such director of the Company, in any and all capacities, to any and all amendments to this Annual Report on Form 10-K and to file the same, with all exhibits thereto, and other documents in connection wherewith, with the Securities and Exchange Commission, granting unto said attorney-in-fact, and either of them, full power and authority to do and perform each and every act necessary or incidental to the performance and execution of the powers herein expressly granted.
Pursuant to the requirements of the Securities Exchange Act of 1934, this report has also been signed below by the following persons on behalf of the Company and in the capacities indicated on the date set forth beside their signature.
|
| | | |
| | | | |
| /s/ Patrick H. Hawkins | | Date: | May 30, 201328, 2015 |
Patrick H. Hawkins, Chief Executive Officer and President (Principal Executive Officer) and Director | | | |
| | |
| /s/ Kathleen P. Pepski | | Date: | May 30, 201328, 2015 |
Kathleen P. Pepski, Vice President, Chief Financial Officer, and Treasurer (Principal Financial Officer and Principal Accounting Officer) | | | |
| | |
| /s/ John S. McKeon | | Date: | May 30, 201328, 2015 |
| John S. McKeon, Director, Chairman of the Board | | | |
| | |
| /s/ Duane M. Jergenson | | Date: | May 30, 201328, 2015 |
| Duane M. Jergenson, Director | | | |
| | |
| /s/ Daryl I. Skaar | | Date: | May 30, 201328, 2015 |
| Daryl I. Skaar, Director | | | |
| | |
| /s/ James A. Faulconbridge | | Date: | May 30, 201328, 2015 |
| James A. Faulconbridge, Director | | | |
| | |
| /s/ James T. Thompson | | Date: | May 30, 201328, 2015 |
| James T. Thompson, Director | | | |
| | |
| /s/ Jeffrey L. Wright | | Date: | May 30, 201328, 2015 |
| Jeffrey L. Wright, Director | | | |
| | | | |
| /s/ Mary J. Schumacher | | Date: | May 30, 201328, 2015 |
| Mary J. Schumacher, Director | | | |
| | | | |
SCHEDULE II
HAWKINS, INC.
VALUATION AND QUALIFYING ACCOUNTS
FOR THE FISCAL YEARS ENDED MARCH 29, 2015, MARCH 30, 2014, AND MARCH 31, 2013 APRIL 1, 2012, AND APRIL 3, 2011
| | | | | | | Additions | | | | | | | | Additions | | | | |
| Description | | Balance at Beginning of Year | | Charged to Costs and Expenses | | Charged to Other Accounts | | Deductions Write-Offs | | Balance at End of Year | | Balance at Beginning of Year | | Charged to Costs and Expenses | | Charged to Other Accounts | | Deductions Write-Offs | | Balance at End of Year |
| | | (In thousands) | | (In thousands) |
| Reserve deducted from asset to which it applies: | | | | | | | | | | | | | | | | | | | | |
| Year Ended March 29, 2015: | | | | | | | | | | | |
| Allowance for doubtful accounts | | | $ | 477 |
| | $ | (32 | ) | | $ | — |
| | $ | — |
| | $ | 445 |
|
| Year Ended March 30, 2014: | | | | | | | | | | | |
| Allowance for doubtful accounts | | | $ | 469 |
| | $ | 44 |
| | $ | — |
| | $ | 36 |
| | $ | 477 |
|
| Year Ended March 31, 2013: | | | | | | | | | | | | | | | | | | | | |
| Allowance for doubtful accounts | | $ | 460 |
| | $ | 201 |
| | $ | — |
| | $ | 192 |
| | $ | 469 |
| | $ | 460 |
| | $ | 201 |
| | $ | — |
| | $ | 192 |
| | $ | 469 |
|
| Year Ended April 1, 2012: | | | | | | | | | | | |
| Allowance for doubtful accounts | | $ | 406 |
| | $ | 78 |
| | $ | — |
| | $ | 24 |
| | $ | 460 |
| |
| Year Ended April 3, 2011: | | | | | | | | | | | |
| Allowance for doubtful accounts | | $ | 300 |
| | $ | 120 |
| | $ | — |
| | $ | 14 |
| | $ | 406 |
| |
Exhibit Index
Unless otherwise indicated, all documents incorporated into this Annual Report on Form 10-K by reference to a document filed with the SEC are located under file number 0-7647.
|
| | | | | |
| Exhibit |
| | Description | | Method of Filing |
| | | |
| 3.1 |
| | Amended and Second Restated Articles of Incorporation.(1) | | Incorporated by Reference |
| | | |
| 3.2 |
| | Amended and Restated By-Laws.(2) | | Incorporated by Reference |
| | | |
| 10.1* |
| | Description of Consulting Arrangement with John S. McKeon.Hawkins, Inc. 2004 Omnibus Stock Plan.(3) | | Incorporated by Reference |
| | | |
| 10.2* |
| | Hawkins, Inc.Form of Non-Statutory Stock Option Agreement under the Company’s 2004 Omnibus Stock Plan.(4) | | Incorporated by Reference |
| | | |
| 10.3* |
| | Form of Restricted Stock Agreement under the Company’s 2004Hawkins, Inc. 2010 Omnibus StockIncentive Plan.(5) | | Incorporated by Reference |
| | | |
| 10.4* |
| | Form of Performance-Based Unit Award Notice and Restricted Stock Agreement (Directors) under the Company’s 20042010 Omnibus StockIncentive Plan.(6) | | Incorporated by Reference |
| | | |
| 10.5* |
| | Form of Non-StatutoryRestricted Stock Option Agreement under the Company’s 20042010 Omnibus StockIncentive Plan.(7) | | Incorporated by Reference |
| | | |
| 10.6* |
| | Form of Performance-Based Restricted Stock Unit Award Notice and Restricted Stock Agreement under the Company’s 2004 Omnibus Stock Plan.(8) | | Incorporated by Reference |
| | |
10.7* |
| | Hawkins, Inc. 2010 Omnibus Incentive Plan.(9) | | Incorporated by Reference |
| | |
10.8* |
| | Form of Performance-Based Unit Award Notice and Restricted Stock Agreement under the Company’s 2010 Omnibus Incentive Plan.(10) | | Incorporated by Reference |
| | |
10.9* |
| | Form of Restricted Stock Agreement under the Company’s 2010 Omnibus Incentive Plan.(11) | | Incorporated by Reference |
| | |
10.10* |
| | Hawkins, Inc. Executive Severance Plan.(12)(8) | | Incorporated by Reference |
| | | |
| 21 |
| | Subsidiaries of the registrant (9) | | Filed ElectronicallyIncorporated by Reference |
| | | | | |
| 23.1 |
| | Consent of Independent Registered Public Accounting Firm. | | Filed Electronically |
| | | |
| 31.1 |
| | Certification by Chief Executive Officer pursuant to Rule 13a-14(a) of the Exchange Act. | | Filed Electronically |
| | | |
| 31.2 |
| | Certification by Chief Financial Officer pursuant to Rule 13a-14(a) of the Exchange Act. | | Filed Electronically |
| | | |
| 32.1 |
| | Section 1350 Certification by Chief Executive Officer. | | Filed Electronically |
| | | |
| 32.2 |
| | Section 1350 Certification by Chief Financial Officer. | | Filed Electronically |
| | | |
| 101 |
| | Financial statements from the Annual Report on Form 10-K of Hawkins, Inc. for the period ended March 31, 2013,29, 2015, filed with the SEC on May 30, 2013,29, 2014, formatted in Extensible Business Reporting Language (XBRL); (i) the Consolidated Balance Sheets at March 31, 201329, 2015 and April 1, 2012,March 30, 2014, (ii) the Consolidated Statements of Income for the fiscal years ended March 29, 2015, March 30, 2014 and March 31, 2013 April 1, 2012, and April 3, 2011, (iii) the Consolidated Statements of Comprehensive Income (Loss) for the fiscal years ended March 29, 2015, March 30, 2014 and March 31, 2013 April 1, 2012, and April 3, 2011, (iv) the Consolidated Statements of Shareholders'Shareholders’ Equity for the fiscal years ended March 29, 2015, March 30, 2014 and March 31, 2013 April 1, 2012, and April 3, 2011, (v) Consolidated Statements of Cash Flows for the fiscal years ended March 29, 2015, March 30, 2014 and March 31, 2013 April 1, 2012, and April 3, 2011, and (iv) Notes to Condensed Consolidated Financial Statements. | | Filed Electronically |
46
|
| |
| * | Management contract or compensation plan or arrangement required to be filed as an exhibit to this Annual Report on Form 10-K. |
| |
| (1) | Incorporated by reference to Exhibit 3.1 to the Company’s Quarterly Report on Form 10-Q for the quarterly period ended June 30, 2010. |
| |
| (2) | Incorporated by reference to Exhibit 3.1 to the Company’s Current Report on Form 8-K dated October 28, 2009 and filed November 3, 2009. |
| |
| (3) | Incorporated by reference to Item 1.01 of the Company’s Current Report on Form 8-K dated August 5, 2009 and filed August 11, 2009. |
| |
(4) | Incorporated by reference to Appendix B to the Company’s Proxy Statement for the 2004 Annual Meeting of Shareholders filed July 23, 2004. |
| |
(5) | Incorporated by reference to Exhibit 10.2 to the Company’s Quarterly Report on Form 10-Q for the quarterly period ended September 30. |
| |
(6) | Incorporated by reference to Exhibit 10.1 to the Company’s Quarterly Report on Form 10-Q for the quarterly period ended September 30, 2008. |
| |
(7)(4) | Incorporated by reference to Exhibit 10.1 to the Company’s Quarterly Report on Form 10-Q for the quarterly period ended June 30, 2008. |
| |
(8) | Incorporated by reference to Exhibit 10.2 to the Company’s Quarterly Report on Form 10-Q for the quarterly period ended June 30, 2008. |
| |
(9)(5) | Incorporated by reference to Exhibit 10.1 to the Company’s Registration Statement on Form S-8 filed June 6, 2011 (file no. 333-174735). |
| |
(10)(6) | Incorporated by reference to Exhibit 10.1 to the Company’s Quarterly Report on Form 10-Q for the quarterly period ended June 30, 2010. |
| |
(11)(7) | Incorporated by reference to Exhibit 10.2 to the Company’s Quarterly Report on Form 10-Q for the quarterly period ended June 30, 2010. |
| |
(12)(8) | Incorporated by reference to Exhibit 10.1 to the Company’s Quarterly Report on Form 10-Q for the quarterly period ended July 3, 2011. |
| |
| (9) | Incorporated by reference to Exhibit 21 to the Company’s Annual Report on Form 10-K for the annual period ended March 30, 2014. |