0000049196us-gaap:MeasurementInputConstantPrepaymentRateMembersrt:WeightedAverageMemberus-gaap:FairValueInputsLevel3Memberus-gaap:FairValueMeasurementsRecurringMemberus-gaap:ResidentialMortgageBackedSecuritiesMemberus-gaap:ValuationTechniqueDiscountedCashFlowMember2019-12-310000049196hban:InterestandFeeIncomeMemberhban:LoansheldforinvestmentMember2022-01-012022-12-31
UNITED STATES
SECURITIES AND EXCHANGE COMMISSION
WASHINGTON, D.C. 20549
FORM 10-K
| | | | | |
| ☒ | Annual Report Pursuant to Section 13 or 15(d) of the Securities Exchange Act of 1934 |
For the fiscal year ended December 31, 20202023
Commission File Number 1-34073
| | |
| Huntington Bancshares Incorporated |
(Exact name of registrant as specified in its charter)
| | | | | | | | | | | | | | |
| Maryland | | | | 31-0724920 |
| (State or other jurisdiction of incorporation or organization) | | | | (I.R.S. Employer Identification No.) |
| | | | |
| 41 South High Street | Columbus, | Ohio | | 43287 |
| (Address of principal executive offices) | | | | (Zip Code) |
Registrant’s telephone number, including area code (614) 480-2265
Securities registered pursuant to Section 12(b) of the Act:
| | | | | | | | |
| Title of class | Trading Symbol(s) | Name of exchange on which registered |
| Depositary Shares (each representing a 1/40th interest in a share of 5.875% Series C Non-Cumulative, perpetual preferred stock) | HBANN | NASDAQ
| Depositary Shares (each representing a 1/40th interest in a share of 6.250% Series D Non-Cumulative, perpetual preferred stock) | HBANO | NASDAQ
| Depositary Shares (each representing a 1/40th interest in a share of 4.500% Series H Non-Cumulative, perpetual preferred stock) | HBANP | NASDAQ |
| Depositary Shares (each representing a 1/1000th interest in a share of 5.70% Series I Non-Cumulative, perpetual preferred stock) | HBANM | NASDAQ |
| Depositary Shares (each representing a 1/40th interest in a share of 6.875% Series J Non-Cumulative, perpetual preferred stock) | HBANL | NASDAQ |
| Common Stock—Par Value $0.01 per Share | HBAN | NASDAQ |
Indicate by check mark if the registrant is a well-known seasoned issuer, as defined in Rule 405 of the Securities Exchange Act. x Yes ¨ No
Indicate by check mark if the registrant is not required to file reports pursuant to Section 13 or 15(d) of the Act. ¨ Yes x No
Indicate by check mark whether the registrant (1) has filed all reports required to be filed by Section 13 or 15(d) of the Securities Exchange Act of 1934 during the preceding 12 months (or for such shorter period that the registrant was required to file such reports), and (2) has been subject to such filing requirements for the past 90 days. x Yes ¨ No
Indicate by check mark whether the registrant has submitted electronically every Interactive Data File required to be submitted pursuant to Rule 405 of Regulation S-T (§232.405 of this chapter) during the preceding 12 months (or for such shorter period that the registrant was required to submit such files). x Yes ¨ No
Indicate by check mark whether the registrant is a large accelerated filer, an accelerated filer, a non-accelerated filer, a smaller reporting company, or an emerging growth company. See the definitions of “large
accelerated filer”, “accelerated filer”, “smaller reporting company”, and “emerging growth company” in Rule 12b-2 of the Exchange Act.
| | | | | | | | | | | | | | | | | |
| Large Accelerated Filer | x | | Accelerated filer | ☐ |
| | | | | |
| Non-accelerated filer | ☐ | | Smaller reporting company | ☐ |
| | | | Emerging growth company | ☐ |
If an emerging growth company, indicate by check mark if the registrant has elected not to use the extended transition period for complying with any new or revised financial accounting standards provided pursuant to Section 13(a) of the Exchange Act. ¨
Indicate by check mark whether the registrant has filed a report on and attestation to its management’s assessment of the effectiveness of its internal control over financial reporting under Section 404(b) of the Sarbanes-Oxley Act (15 U.S.C. 7262(b)) by the registered public accounting firm that prepared or issued its audit report. ☒
If securities are registered pursuant to Section 12(b) of the Act, indicate by check mark whether the financial statements of the registrant included in the filing reflect the correction of an error to previously issued financial statements. ¨
Indicate by check mark whether any of those error corrections are restatements that required a recovery analysis of incentive-based compensation received by any of the registrant’s executive officers during the relevant recovery period pursuant to §240.10D-1(b). ¨
Indicate by check mark whether the registrant is a shell company (as defined in Rule 12b-2 of the Act)
☐ Yes x No
The aggregate market value of voting and non-voting common equity held by non-affiliates of the registrant as of June 30, 2020,2023, determined by using a per share closing price of $9.04,$10.78, as quoted by Nasdaq on that date, was $9,353,081,984.$15,337,338,365. As of January 31, 2021,2024, there were 1,017,194,9681,448,345,863 shares of common stock with a par value of $0.01 outstanding.
Documents Incorporated By Reference
Part III of this Form 10-K incorporates by reference certain information from the registrant’s definitive Proxy Statement for the 20212024 Annual Shareholders’ Meeting.
HUNTINGTON BANCSHARES INCORPORATED
INDEX
| | | | | | | | |
| | | | | | | | | |
| Part I. | | |
| | |
| | |
| | |
| | |
| | |
| | |
| | |
| Part II. | | |
| | |
| | |
| | |
| | |
| | |
| | |
| | |
| | |
| | |
| | |
| | |
| | |
| | |
| | |
| | |
| | |
| | |
| | |
| | |
| | |
| | |
| | |
| | |
| | |
| | |
| | |
| | |
| Part III. | | |
| | |
| | |
| | |
| | |
| | |
| Part IV. | | |
| | |
| | |
| |
Glossary of Acronyms and Terms
The following listing provides a comprehensive reference of common acronyms and terms used throughout the document:
| | | | | |
| |
| ACL | Allowance for Credit Losses |
| AFS | Available-for-Sale |
| ALCO | Asset-Liability Management Committee |
| ALLL | Allowance for Loan and Lease Losses |
| AML | Anti-Money Laundering |
| ANPR | Advance Notice of Proposed Rulemaking
| AOCI | Accumulated Other Comprehensive Income (Loss) |
| ASC | Accounting Standards Codification |
| ASU | Accounting Standards Update |
| |
| ATM | Automated Teller Machine |
| AULC | Allowance for Unfunded LoanLending Commitments |
| Bank Secrecy Act | Financial Recordkeeping and Reporting of Currency and Foreign Transactions Act of 1970 |
| Basel III | Refers to the final rule issued by the FRBFederal Reserve and OCC and published in the Federal Register on October 11, 2013 |
| BHC | Bank Holding Company |
| BHC Act | Bank Holding Company Act of 1956 |
| BTFP | Bank Term Funding Program |
| |
CARES ActCapstone Partners | Coronavirus Aid, Relief, and Economic Security Act, as amendedCapstone Enterprises LLC |
| |
| C&I | Commercial and Industrial |
| CCAR | Comprehensive Capital Analysis and Review |
| CCB | Capital Conservation Buffer |
| CCPA | California Consumer Privacy Act of 2018, as amended by the California Privacy Rights Act of 2020 |
| |
| CDs | Certificates of Deposit |
| |
| CDS | Credit Default Swap |
| CECL | Current Expected Credit Losses |
| CEO | Chief Executive Officer |
| CET1 | Common equity tierEquity Tier 1 on a transitional Basel III basis |
| CFO | Chief Financial Officer |
| CFPB | Bureau of Consumer Financial Protection |
| CISA | Cybersecurity Information Sharing Act |
| CMO | Collateralized Mortgage Obligations |
| CODM | Chief Operating Decision Maker |
| COVID-19 | Coronavirus Disease 2019 |
| |
| |
| CDP | Carbon Disclosure Project |
| CRA | Community Reinvestment Act |
| CRE | Commercial Real Estate |
| CRO | Chief Risk Officer |
| CRT | Credit Risk Transfer |
| DEI | Diversity, Equity, and Inclusion |
| DIF | Deposit Insurance Fund |
| Dodd-Frank Act | Dodd-Frank Wall Street Reform and Consumer Protection Act |
| EAD | Exposure at Default |
| Economic Growth Act | Economic Growth, Regulatory Relief and Consumer Protection Act |
4 Huntington Bancshares Incorporated
| | | | | |
| ELT | Executive Leadership Team |
| EOP | End of Period |
| EPS | Earnings Per Share |
| |
| ERM | Enterprise Risk Management |
| ESG | Environmental, Social, and Governance |
| EVE | Economic Value of Equity |
| FASB | Financial Accounting Standards Board |
| FCRA | Fair Credit Reporting Act |
| FDIA | Federal Deposit Insurance Act |
| FDIC | Federal Deposit Insurance Corporation |
| Federal Reserve | Board of Governors of the Federal Reserve System |
| |
| FHC | Financial Holding Company |
| FHFA | Federal Housing Finance Agency
| FHLB | Federal Home Loan Bank of Cincinnati |
| FICO | Fair Isaac Corporation |
3 Huntington Bancshares Incorporated
| | | | | |
| FinCEN | Financial Crimes Enforcement Network |
| FINRA | Financial Industry Regulatory Authority, Inc. |
| |
| FRB | Federal Reserve Bank |
| FRG | Financial Recovery Group |
| FTE | Fully-Taxable Equivalent |
| FTP | Funds Transfer Pricing |
| FVO | Fair Value Option |
| GAAP | Generally Accepted Accounting Principles in the United States of America |
| GDP | Gross Domestic Product |
| GLBA | Gramm-Leach-Bliley Act |
| |
GSEHIC | Government Sponsored EnterpriseHuntington Investment Company |
| HMDA | Home Mortgage Disclosure Act |
| |
| HTM | Held-to-Maturity |
| IRS | Internal Revenue Service |
| Last-of-Layer | Last-of-layer is a fair value hedge of the interest rate risk of a portfolio of similar prepayable assets whereby the last dollar amount within the portfolio of assets is identified as the hedged item |
| LCR | Liquidity Coverage Ratio |
| LFI Rating System | Large Financial Institution Rating System |
| LGD | Loss Given Default |
| LIBOR | London Interbank Offered Rate |
| LIHTC | Low Income Housing Tax Credit |
| |
| LTV | Loan-to-Value |
| MBS | Mortgage-Backed Securities |
| MD&A | Management’s Discussion and Analysis of Financial Condition and Results of Operations |
| MSA | Metropolitan Statistical Area |
| MSR | Mortgage Servicing Right |
| NAICS | North American Industry Classification System |
| NALs | Nonaccrual Loans |
| NCO | Net Charge-off |
| NII | NoninterestNet Interest Income |
| NIM | Net Interest Margin |
NOWNM | Negotiable Order of WithdrawalNot Meaningful |
| NPAs | Nonperforming Assets |
| NSF | Non-Sufficient Funds
| | | | | |
| OCC | Office of the Comptroller of the Currency |
| OCI | Other Comprehensive Income (Loss) |
| OCR | Optimal Customer Relationship |
| OFAC | Office of Foreign Assets Control |
| OIS | Overnight Indexed Swaps
| OLEM | Other Loans Especially Mentioned |
| |
| OREO | Other Real Estate Owned |
| Patriot Act | Uniting and Strengthening America by Providing Appropriate Tools Required to Intercept and Obstruct Terrorism Act of 2001 |
| PCAOB | Public Company Accounting Oversight Board |
| PCD | Purchased financial assets with credit deteriorationCredit Deteriorated |
| PD | Probability of Default |
| Plan | Huntington Bancshares Retirement Plan |
| PPP | Paycheck Protection Program |
| PPPLF | Paycheck Protection Program Liquidity Facility
| | | | | |
| Problem Loans | Includes nonaccrual loans and leases, accruing loans and leases past due 90 days or more, troubled debt restructured loans, and criticized commercial loans |
| Capital and Liquidity Tailoring Rule | Refers to the changes to applicability thresholds for regulatory and capital and liquidity requirements, issued by the OCC, the Federal Reserve and the FDIC
| EPS Tailoring Rule | Refers to Prudential Standards for Large Bank Holding Companies and Savings and Loan Holding, issued by the Federal Reserve
| Tailoring Rules | Refers to the Capital and Liquidity Tailoring Rule and the EPS Tailoring Rule
| RBHPCG | Regional Banking and The Huntington Private Client Group |
| REIT | Real Estate Investment Trust |
| Riegle-Neal Act | The Riegle-Neal Interstate Banking and Branching Efficiency Act of 1994 |
| ROC | Risk Oversight Committee |
| RPS | Retirement Plan Services |
| RV | Recreational vehicle |
| RWA | Risk-Weighted Assets |
| SBA | Small Business Administration |
| SCB | |
| Stress Capital Buffer |
SIFMASEC | Securities Industry and Financial Markets AssociationExchange Commission |
| |
| SOFR | Secured Overnight Financing Rate |
| |
SRIPTailoring Rules | Supplemental Retirement Income PlanRefers to the Capital and Liquidity Tailoring Rule, which refers to changes to applicability thresholds for regulatory and capital and liquidity requirements, issued by the OCC, the Federal Reserve, and the FDIC, and the EPS Tailoring Rule, which refers to the Prudential Standards for Large Bank Holding Companies and Savings and Loan Holding, issued by the Federal Reserve |
| TBA | To Be Announced |
| TCF | TCF Financial Corporation |
TCJATCFD | H.R. 1, Originally known as the Tax Cuts and Jobs ActTask Force on Climate-Related Financial Disclosures |
| TDR | Troubled Debt Restructuring |
| Torana | Digital Payments Torana, Inc. |
| |
| U.S. Treasury | U.S. Department of the Treasury |
| UCS | Uniform Classification System
| |
| |
| |
| VIE | Variable Interest Entity |
| XBRL | eXtensible Business Reporting Language |
56 Huntington Bancshares Incorporated
Huntington Bancshares Incorporated
PART I
When we refer to “Huntington,” “we,” “our,” “us,” and “the Company” in this report, we mean Huntington Bancshares Incorporated and our consolidated subsidiaries, unless the context indicates that we refer only to the parent company, Huntington Bancshares Incorporated. When we refer to the “Bank” in this report, we mean our only bank subsidiary, The Huntington National Bank, and its subsidiaries.
Item 1: Business
General Business Description
We are a multi-state diversified regional bank holding company organized under Maryland law in 1966 and headquartered in Columbus, Ohio. We have 15,578 average full-time equivalent employees. Through the Bank, we are committed to making people’s lives better, helping businesses thrive, and strengthening the communities we serve, and we have over 150 years ofbeen servicing the financial needs of our customers.customers since 1866. Through our subsidiaries, we provide full-service commercial and consumer deposit, lending, and other banking services,services. These include, but are not limited to, payments, mortgage banking, services, automobile, financing, recreational vehicle and marine financing, investment banking, capital markets, advisory, equipment financing, distribution finance, investment management, trust, services, brokerage, services, insurance, products and services, and other financial products and services. AtAs of December 31, 2020, the Bank had 112023, our 999 full-service branches and private client group offices and 828 branchesare primarily located in Ohio, Colorado, Illinois, Indiana, Kentucky, Michigan, Minnesota, Pennsylvania, West Virginia, and West Virginia.Wisconsin. Select financial services and other activities are also conducted in various other states. International banking services are available through the headquarters office in Columbus, Ohio. Our foreign banking activities, in total or with any individual country, are not significant.
Business Segments
Our business segments are based on our internally-aligned segment leadership structure, which is how we monitor results and assess performance. For each of our four business segments,segment, we expect the combination of our business model, investment in products and capabilities, and exceptional service to provide a competitive advantage that supports revenue and earnings growth. Our business model emphasizes the delivery of a complete set of banking products and services offered by larger banks but distinguished by local delivery and customer service.
A key strategic emphasis has been for our business segments to operate in cooperation to provide products and services to our customers and to build stronger and more profitable relationships using our OCR sales and service process.process, which aligns to our vision to be the leading people-first, digitally powered bank. The objectives of OCR are to:
•Use a consultative and advisory sales approach to provide solutions that are specific to each customer.customer;
•Leverage each business segment in terms of its products and expertise to benefit customers.customers; and
•Develop prospects who may want to have multiple products and services as part of their relationship with us.
To align with our strategic priorities, during the second quarter of 2023, we completed an organizational realignment and now report on two business segments: Consumer & Regional Banking and Commercial Banking. The organizational realignment primarily involved consolidating our previously reported Consumer and Business Banking, Vehicle Finance and RBHPCG, into one new business segment called Consumer & Regional Banking.
Following is a description of our four business segments and the Treasury / Other function:
•Consumer and Business& Regional Banking: The Consumer and Business& Regional Banking segment provides a wide array of financial products and services to consumer and small business customers including, but not limited to, checking accounts, savings accounts, money market accounts, CDs, investments, consumer loans, credit cards,deposits, lending, payments, mortgage banking, dealer financing, investment management, trust, brokerage, insurance, and small business loans. Otherother financial services available to customers include mortgages, insurance, interest rate risk protection, foreign exchange,products and treasury management. Huntington servesservices. We serve our customers through our network of branches. In addition to our extensive branch network, customers can access Huntington throughchannels, including branches and ATMs, online banking,and mobile banking, telephone banking, and ATMs.through our customer call centers.
We have a “Fair Play” banking philosophy: providing differentiated products and services, built on a strong foundation of customer friendly products and advocacy. Our brand resonates with consumers and businesses, helping us acquire new customers and deepen relationships with current customers. Our Fair Play banking suite of products includes 24-Hour Grace®, Asterisk-Free Checking®, Money Scout®, $50 Safety Zone®, Standby Cash®, Early Pay, Instant Access, Savings Goal Getter® and Huntington Heads Up®.
Consumer & Regional Banking offers a comprehensive set of digitally powered consumer and business financial solutions to Consumer Lending, Regional Banking, Branch Banking, and Wealth Management customers.
Consumer Lending provides direct and indirect consumer loans, as well as dealer finance loans and deposits. The direct consumer loan products, including mortgage and home equity, are originated through branch, online, and third-party channels. Indirect consumer loans are originated through deep relationships with dealerships to finance consumer purchases of automobiles, recreational vehicles, marine craft, and powersports. We also provide dealer finance loans (including floorplan loans), deposits, and other financial products to these dealerships and their owners.
Regional Banking, along with our business and specialty banking offerings, is a dynamic part of our business and we are committed to being the bank of choice for businesses in our markets. BusinessRegional Banking is defined as serving companies with annual revenues upsmall to $20 million.mid-sized businesses. Beyond conventional lending solutions, Huntington offers access to capital markets, practice finance, and SBA lending capabilities. We are the #1 SBA lender in the nation by loan volume as of federal fiscal year end September 30, 2023. In addition, our payments business provides credit and debit cards and treasury management services to our customers. Huntington continues to develop products and services that are designed specifically to meet the needs of small business customers and looklooks for ways to help companies find solutions to their financing needs.
Home Lending, an operating unitBranch Banking provides a full range of Consumerfinancial products and Business Banking, originatesservices to consumer loans and mortgages forbusiness customers whothrough our extensive branch and ATM network. The branch network offers full-service branches that are generallyprimarily located in our primaryOhio, Colorado, Illinois, Indiana, Kentucky, Michigan, Minnesota, Pennsylvania, West Virginia, and Wisconsin.
Wealth Management has a comprehensive product offering, including private banking, markets. Consumerwealth management and mortgage lending products are primarily distributedlegacy planning through the Consumerinvestment and Business Bankingportfolio management, fiduciary administration and Regional Bankingtrust services, institutional custody services, and The Huntington Private Client Group segments, as well as through commissioned loan
originators. Home Lending earns interest on portfolio loans and loans held-for-sale, earns fee income from the origination and servicing of mortgage loans, and recognizes gains or losses from the sale of mortgage loans. Home Lending supports the origination of mortgage loans across all segments.full-service retail brokerage investments.
•Commercial Banking: Through a relationship banking model, thisThe Commercial Banking segment provides expertise through bankers, capabilities, and digital channels, and includes a wide arraycomprehensive set of products and servicesproduct offerings. Our target clients span from mid-market to the middle market, large corporate, real estate and government public sector customers located primarily within our geographiccorporates across a national footprint. The Commercial Banking segment is divided into four business units: Relationshipleverages internal partnerships for wealth management, trust, insurance, payments, and treasury management capabilities. In particular, our payments capabilities continue to expand as we develop unique solutions for our diverse client segments, including Huntington ChoicePay. The Commercial Banking Group, Specialized Lending Group, Treasury Management/Deposits Groupsegment includes customers in Middle Market Banking, Corporate, Specialty, and Government Banking, Asset Finance, Commercial Real Estate Banking, and Capital Markets Group.Markets.
The RelationshipMiddle Market Banking Group primarily focusesserves the banking needs of mid-sized clients, leveraging our local presence to serve our clients, and extending our full suite of banking products including lending, liquidity, treasury management and other payment services, and capital markets.
Corporate, Specialty, and Government Banking serves medium to large enterprises. We focus on providingspecific industry verticals such as government and non-profits, healthcare, technology and telecommunications, franchises, financial sponsors, and global services. Our expertise in these markets allows us to uniquely serve our clients’ sophisticated banking, capital markets, and payments requirements.
Asset Finance serves our clients’ capital expenditure and working capital needs through equipment financing, asset-based lending, distribution finance, structured lending, and municipal financing solutions. Our relationship with large manufacturers is bolstered by a strong commitment to their dealers and financing needs.
Commercial Real Estate Banking provides banking solutions to middle market companies with annual revenues of $20 to $500 million and specialized industries as well as commercial real estate developers REITS and other customers with lending needs that are secured by commercial properties. Through a relationship management approach, various products, capabilities, and solutions are seamlessly delivered in a client centric way. Most of these customers are located within our footprint.institutional sponsors across the nation. Within commercial real estate,this group, Huntington Community Development focuses on improvingimproves the quality of life for our communities and the residents of low-to-moderate income neighborhoods by developing and delivering innovative products and services to support affordable housing and neighborhood stabilization.
Specialized Lending Group offers lending-centric products and servicesstabilization, including Huntington Business Credit, Asset Finance and other specialized lending areas. Huntington Business Credit is an asset-based lender providing financing solutions to a broad range of industries that exhibit a quick turning of working capital in a collateral controlled environment. Asset Finance is a combination of our Huntington Equipment Finance, Huntington Public Capital, Huntington Technology Finance, and Lender Finance divisions that focus on providing financing solutions against these respective asset classes.
The Capital Markets Group has three distinct product offerings: 1) corporate risk management services, 2) institutional sales, trading, and underwriting, and 3) institutional corporate banking. The Capital Markets Group offers a full suite of risk management tools including commodities, foreign exchange, and interest rate hedging services. The Institutional Sales, Trading, & Underwriting team provides access to capital and investment solutions for both municipal and corporate institutions. Institutional Banking works primarily with larger, often more complex companies with annual revenues greater than $500 million. These entities, many of which are publicly traded, require an approach customized to their banking needs.
The Treasury Management/Deposit Group work with the relationship banking and lending groups to help businesses manage their working capital programs and reduce expenses. Our liquidity solutions help customers save and invest wisely, while our payables and receivables capabilities help them manage purchases and the receipt of payments for goods and services. All of this is provided while helping customers take a sophisticated approach to managing their overhead, inventory, equipment, and labor.
•Vehicle Finance: Our products and services include providing financing to consumers for the purchase of automobiles, light-duty trucks, recreational vehicles, and marine craft at franchised and other select dealerships, and providing financing to franchised dealerships for the acquisition of new and used inventory. Products and services are delivered through highly specialized relationship-focused bankers and product partners. Huntington creates well-defined relationship plans which identify needs where solutions are developed and customer commitments are obtained.
The Vehicle Finance team services automobile dealerships, their owners, and consumers buying automobiles through these franchised dealerships. Huntington has provided new and used automobile financing and dealer services throughout the Midwest since the early 1950s. This consistency in the market and our focus on working with strong dealerships has allowed us to expand into select markets outside of the Midwest and to actively deepen relationships in 23 states while building a strong reputation. Huntington also provides financing for the purchase by consumers of recreational vehicles and marine craft on an indirect basis through a series of dealerships with a 34 state footprint, including coastal states.
•Regional Banking and The Huntington Private Client Group: Regional Banking and The Huntington Private Client Group is closely aligned with our regional banking markets. A fundamental point of differentiation is our commitment to be actively engaged within our local markets - building connections with community andtax credit investments.
78 Huntington Bancshares Incorporated
business leadersCapital Markets delivers corporate risk management, institutional sales and offering a uniquely personal experience delivered by colleagues working within those markets.
The core business of The Huntington Private Client Group is The Huntington Private Bank, which consists of Private Banking, Wealth & Investment Management,trading, debt and Retirement Plan Services. The Huntington Private Bank provides high net-worth customers with deposit, lending (including specialized lending options),equity issuance, and banking services. The Huntington Private Bank also delivers wealth management and legacy planning through investment and portfolio management, fiduciary administration, and trust services. This group also provides retirement plan services to corporate businesses. The Huntington Private Client Group also provides corporate trust services and institutional and mutual fund custodyadditional advisory services.
•Treasury / Other: The Treasury / Other function includes technology and operations, and other unallocated assets, liabilities, revenue, and expense.
On December 13, 2020, we entered into an Agreement and Plan of Merger (the “Merger Agreement”) with TCF. The Merger Agreement provides that TCF will merge with and into Huntington (the “Merger”), with Huntington continuing as the surviving corporation in the Merger. Immediately following the Merger, TCF’s wholly owned banking subsidiary, TCF National Bank, will merge with and into Huntington’s wholly owned banking subsidiary, The Huntington National Bank (the “Bank Merger”), which will continue as the surviving bank in the Bank Merger. The Merger Agreement was unanimously approved by the Board of Directors of each of Huntington and TCF.
At the effective time of the Merger (the “Effective Time”), each share of common stock, par value $1.00 per share, of TCF outstanding immediately prior to the Effective Time, other than certain shares held by Huntington or TCF, will be converted into the right to receive 3.0028 shares of common stock, par value $0.01 per share, of Huntington. Holders of TCF Common Stock will receive cash in lieu of fractional shares. At the Effective Time, each share of 5.70% Series C Non-Cumulative Perpetual Preferred Stock, no par value, of TCF outstanding immediately prior to the Effective Time will be converted into the right to receive a share of a newly created series of preferred stock of Huntington.
In September 2020, we announced a new five-year, $20 billion Community Plan. The Community Plan focuses on access to capital for small business, affordable housing and home ownership, and community lending and investment focused in our local communities across our footprint. It consists of 3 commitments. The first is a $7.6 billion commitment to help small businesses, with special emphasis on those owned by minorities, women and veterans. The second is a $7.5 billion commitment to enable greater opportunities for first-time home buyers, improve housing security for financially distressed consumers, and help create generational wealth building through home ownership. Finally, we have a $4.9 billion commitment related to affordable housing, food security, workforce development and social equity as we believe these areas are fundamental to helping people find basic economic security and prosper in the communities we serve.
Human Capital
Huntington aspires to be a Category of One financial services institution: an organization unique in the combination of its culture and performance. Huntington had 15,578 average full-time equivalent colleagues during 2020, all of whom are encouraged to live out a shared purpose, making peoples’ lives better, helping businesses thrive, and strengthening the communities we serve. We believe purpose driven leadership facilitates progress in achieving a diverse and inclusive workforce and in driving performance results.
Huntington engages with its colleagues to gain valuable feedback on a wide range of subjects related to the experience of working at Huntington, with a strategic focus on culture, engagement and trust. We value the feedback colleagues choose to share and use the information to drive our talent management strategy, which focuses on four key areas:
•Engagement
•Development
•Retention, and
•Attraction of top talent
Engagement
At Huntington, we believe we have highly engaged colleagues committed to looking out for each other and our customers with a balanced focus on “what we do” and “how we do it.” The results of our most recent 2020 colleague survey places Huntington in the top 10% of all companies in a benchmark group for colleague engagement and trust and in the top 1% for company culture. This benchmark group includes more than 350 companies with more than 15% of the Fortune 500 represented covering a wide variety of industries, including financial services.
At Huntington, living out our shared Purpose extends beyond our daily work. We believe that building connections between colleagues, their families and our communities creates a meaningful, fulfilling and enjoyable colleague experience. During 2020, Huntington colleagues successfully navigated through the on-going pandemic challenges, safely providing over 15,000 volunteer hours to organizations across our footprint.
Development
We have created specialized programs to help our colleagues grow and develop. These programs include an online library which allows colleagues to take ownership of their development via direct access to role-based content. The content is divided into three key areas of development: learning and growth, maximizing performance, and protecting the company. During 2020, all our colleagues had experienced training within one or more of these areas. Additionally, we expanded learning opportunities across our footprint offering all colleagues the ability to obtain post-secondary education with reimbursement of tuition.
Retention
Huntington offers competitive rewards programs that further strengthen our employment value proposition and encourages colleague retention. Our compensation structure includes benefit plans and programs focused on multiple facets of well-being, including physical, mental, and financial wellness.
In response to the COVID-19 pandemic, we implemented significant changes to support the interests and needs of our colleagues, as well as the communities in which we operate. This includes mobilizing work access for roles that can be performed remotely and implementing additional safety measures for colleagues while continuing critical on-site duties. Further, we implemented colleague relief benefits, such as paid emergency leave and emergency childcare time off so that our colleagues can have peace of mind concerning events that may require time away from work.
Collectively, these strategies create a colleague experience that entices colleagues to stay and fulfill their dreams with Huntington. In 2020, full-year turnover results were 23% lower than in 2019.
Attraction
We are dedicated to attracting top talent with an emphasis on experience and behaviors that align with our Purpose and our core values of ‘Can Do, Forward Thinking, and Service Heart’.
The diversity of our colleagues is a key component of our success as an organization as it allows us to have a workforce that is representative of the communities we serve. We define diversity as women and any Equal Employment Opportunity ethnicity and race category other than white. We proactively seek out a diverse candidate pool during the recruitment process across all levels and include a declaration in our employee handbooks about our commitment to fair and equitable treatment for all colleagues. To keep current on colleague diversity, Huntington offers an opportunity annually for all colleagues to self-identify with respect to gender, ethnicity and race, disability and veteran’s status. During 2020, we offered select student internships to serve as a pipeline for entry-level talent with 65% of these internships fulfilled by diverse students. Additionally, we are focused on identifying, supporting and promoting qualified diverse candidates in leadership roles, where currently our combined middle, senior and executive management levels are 45% diverse.
We understand that to support our diverse culture, we must also have inclusion, which is a corporate strategic objective. Huntington executes a strategy of inclusion in multiple ways. First, our Chief Diversity, Equity, and Inclusion Officer ensures Diversity, Equity, and Inclusion perspectives are an integral part of executive decisions made at Huntington. This is achieved by measuring and socializing progress on diversity across our footprint and providing diversity and inclusion programs to our colleagues. In addition, we have Inclusion Councils and Business Resource Groups to support our commitment to engage, develop, retain and attract top diverse talent. Inclusion Councils are voluntary, colleague driven regional councils that focus on an inclusive, respectful and supportive
9 Huntington Bancshares Incorporated
environment for all colleagues. The Business Resource Groups are voluntary, colleague-driven groups organized around a shared interest or common diversity dimension. Both are important components to our inclusion strategy and deliver content throughout the year.
Competition
We compete with other banks and financial services companies such as savings and loans, credit unions, and finance and trust companies, as well as mortgage banking companies, equipment and automobile financing companies (including captive automobile finance companies), insurance companies, mutual funds, investment advisors, and brokerage firms, and non-bank lenders both within and outside of our primary market areas. Financial Technology Companies, or FinTechs, are also providing nontraditional, but increasingly strong, competition for our borrowers, depositors, and other customers.
We compete for loans primarily on the basis of a combination of value and service by building customer relationships as a result ofthrough addressing our customers’ entire suite of banking needs, demonstrating expertise, and providing convenience to our customers.convenience. We also consider the competitive pricing pressureslevels in each of our markets.
We compete for deposits similarly on the basis of a combination of value and service and by providing convenience through a banking network of branches and ATMs within our markets and our website at www.huntington.com. We also employ customer friendly practices, such as a $50 “safety zone,”Safety Zonesm, which prevents customers from being charged an overdraft fee if they accidentally overdraw by $50 or less, as well as our 24-Hour Grace® account feature for both commercial and consumer accounts, which gives customers an additional business day to cover overdrafts to their account without being charged overdraft fees, Early Pay, which allows customers with direct deposit availability to their paycheck up to two days early, Instant Access, which allows up to $500 of a check deposit available to customers immediately, and Asterisk-Free Checking where there is no cost to open and no monthly maintenance fees. In addition, customers can qualify for Standby Cash® based primarily on their checking deposit history, not their credit score, which provides a $100 to $500 short-term line of credit free with automatic payments, or a 1% monthly interest charge without automatic payments. Huntington also has created a feature called “MoneyMoney Scoutsm,” which is a tool that analyzes a customer’s spending habits and moves money that is not being used into that customer’s savings account.account and have introduced tools including The Hub and Huntington Heads Up® to provide customers greater visibility and control over their financial future. These measures fall under our approach of “Fair Play Banking.”
The table below shows our competitive ranking and market share based on deposits of FDIC-insured institutions as of June 30, 2020,2023, in the top 10 MSAs in which we compete:
| | MSA | MSA | | Rank | | Deposits (in millions) | | Market Share | MSA | | Rank | | Deposits (in millions) | | Market Share |
| Columbus, OH | Columbus, OH | | 1 | | | $ | 28,347 | | | 34 | % | Columbus, OH | | 1 | | | $ | | $ | 41,638 | | | 40 | | 40 | % |
| Detroit, MI | |
| Cleveland, OH | Cleveland, OH | | 3 | | | 12,196 | | | 12 | |
| Detroit, MI | | 6 | | | 9,919 | | | 5 | |
| Chicago, IL | |
| Minneapolis-St. Paul, MN | |
| Grand Rapids, MI | |
| Indianapolis, IN | |
| Akron, OH | Akron, OH | | 1 | | | 4,875 | | | 29 | |
| Indianapolis, IN | | 4 | | | 4,349 | | | 6 | |
| Cincinnati, OH | Cincinnati, OH | | 5 | | | 4,199 | | | 3 | |
| Pittsburgh, PA | Pittsburgh, PA | | 9 | | | 3,559 | | | 2 | |
| Toledo, OH | | 1 | | | 3,343 | | | 22 | |
| Grand Rapids, MI | | 2 | | | 3,080 | | | 11 | |
| Chicago, IL | | 20 | | | 2,875 | | | 1 | |
| Source: FDIC.gov, based on June 30, 2020 survey. | |
| Source: FDIC.gov, based on June 30, 2023 survey. | |
Many of our nonfinancial institution competitors have fewer regulatory constraints, broader geographic service areas, greateraccess to a larger pool of capital to deploy, and, in some cases, lower cost structures. In addition, competition for quality customers has intensified as a result of changes in regulation, advances in technology and product delivery systems, and consolidation among financial service providers.
FinTechs continue to emerge in key areas of banking. In addition, larger established technology platform companies continue to evaluate, and in some cases, create businesses focused on banking products. We are closely monitoringmonitor activity in the marketplace to ensure that our products and services are technologically competitive. Further, we continue to invest in and evolve our innovation program to develop, incubate, and launch new products and services driving ongoing differentiated value for our customers. Our overall strategy involves an active corporate development program that seeks to identify partnership and possible investment opportunities in technology-driven companies that can augment our distribution and product capabilities.
Regulatory Matters
Regulatory Environment
The banking industry is highly regulated. We are subject to supervision, regulation, and examination by various federal and state regulators, including the Federal Reserve, OCC, SEC, CFPB, FDIC, FINRA, and various state regulatory agencies. The statutory and regulatory framework that governs us is generally intended to protect depositors and customers, the DIF, the U.S. banking and financial system, and financial markets as a whole.
Banking statutes, regulations, and policies are continually under review by Congress, state legislatures, and federal and state regulatory agencies. In addition to laws and regulations, state and federal bank regulatory agencies may issue policy statements, interpretive letters, and similar written guidance applicable to Huntington and its subsidiaries. Any change in the statutes, regulations, or regulatory policies applicable to us, including changes in their interpretation or implementation, could have a material effect on our business or organization.
On May 24, 2018, the Economic Growth Act was signed into law, which amended, among other regulatory changes, various sections of the Dodd-Frank Act. In October 2019, the Federal Reserve adopted the EPS Tailoring Rule pursuant to the Economic Growth Act, which adjusted the thresholds at which certain enhanced prudential standards apply to U.S. BHCs with $100 billion or more in total consolidated assets. Also in October 2019, the Federal Reserve, OCC, and FDIC adopted the Capital and Liquidity Tailoring Rule, which similarly adjusted the thresholds at which certain other capital and liquidity standards apply to U.S. BHCs and banks with $100 billion or more in total consolidated assets. Under the Tailoring Rules, these BHCs and banks, including Huntington and the Bank, are placed into one of four risk-based categories based on the banking organization’s size, status as a global systemically important bank (or not), cross-jurisdictional activity, weighted short-term wholesale funding, nonbank assets, and off-balance sheet exposure. The extent to which enhanced prudential standards and certain other capital and liquidity standards apply to these BHCs and banks depends on the banking organization’s category. Under the Tailoring Rules, Huntington and the Bank each qualify as a Category IV banking organization subject to the least restrictive of the requirements applicable to firms with $100 billion or more in total consolidated assets.
As a result of the Economic Growth Act and the Tailoring Rules, Huntington and the Bank are now subject to less restrictive requirements with respect to certain enhanced prudential standards and capital and liquidity requirements than in past years, but our Our business, will remainhowever, remains subject to extensive regulation and supervision. Thesupervision, and the U.S. banking agencies may issue additional rules to tailor the application of certain other regulatory requirements to BHCs and banks, including Huntington and the Bank. The scope of laws and regulations and the intensity of supervision to which we are subject has increased in response to the banking turmoil in early 2023, technological factors, market changes, and climate change concerns, and there is increased scrutiny and possible denials of bank mergers and acquisitions by federal banking regulators.
We are also subject to the disclosure and regulatory requirements of the Securities Act of 1933, as amended, and the Securities Exchange Act of 1934, as amended, both as administered by the SEC, as well as the rules of Nasdaq that apply to companies with securities listed on the Nasdaq Global Select Market.
The following discussion describes certain elements of the comprehensive regulatory framework applicable to us. This discussion is not intended to describe all laws and regulations applicable to Huntington, the Bank, and Huntington’s other subsidiaries.
Huntington as a Bank Holding CompanySupervision, Examination and Enforcement
Huntington is registered as a BHC with the Federal Reserve under the BHC Act and qualifies for andthat has elected to becomebe a FHC under the GLBA. As a FHC, Huntington is permitted toFHC. FHCs may engage in, and be affiliated with, companies engaging in a broader range of activities than those permitted for a BHC. BHCsBHC, so long as such activities are generally restricted to engaging in the business of banking, managing or controlling banks, and certain other activities determined by the Federal Reserve to be closely related to banking. FHCs may also engage in activities that are considered to be(i) financial in nature as well as thoseor incidental to such financial activity or (ii) complementary to a financial activity and that do not pose a substantial risk to the safety and soundness of a depository institution or to the financial system generally. These activities includinginclude, for example, securities underwriting, securities dealing, and making marketsa market in securities, and making merchant banking investments in non-financial companies. Huntingtoncompanies, and the Bankengaging in insurance underwriting and agency activities. To become and remain eligible for FHC status, a BHC and its subsidiary depository institutions must each remain “well-capitalized”meet certain criteria, including capital, management, and “well managed”CRA requirements. Failure to meet such criteria could result, depending on which requirements were not met, in order for Huntingtonrestrictions on new financial activities or acquisitions, or being required to maintain its status as a FHC. In addition, the Bank must receive a CRA rating of at least “Satisfactory” at its most recent examination for Huntington to engage in the full range ofdiscontinue existing activities that are not generally permissible for FHCs.BHCs.
10 Huntington Bancshares Incorporated
Huntington is subject to primary supervision, regulation, and examination by the Federal Reserve, which serves as the primary regulator of our consolidated organization. The primary regulators of our non-bank subsidiaries
11 Huntington Bancshares Incorporated
directly regulate the activities of those subsidiaries, with the Federal Reserve exercising a supervisory role. Such non-bank subsidiaries include, for example, broker-dealers and investment advisers both registered with the SEC.
The Bank as a National Bank
The Bank is a national banking association chartered under the laws of the United States.U.S. As a national bank, the activities of the Bank are limited to those specifically authorized under the National Bank Act and OCC regulations. The Bank is subject to comprehensive primary supervision, regulation, and examination by the OCC. As a member of the DIF, the Bank is also subject to regulation and examination by the FDIC.
Supervision, Examination and Enforcement
A principal objective of the U.S. bank regulatory regime is to protect depositors and customers, the DIF, the U.S. banking and financial system, and financial markets as a whole by ensuring the financial safety and soundness of BHCs and banks, including Huntington and the Bank. Bank regulators regularly examine the operations of BHCs and banks. In addition, BHCs and banks are subject to periodic reporting and filing requirements.
The Federal Reserve, OCC, and FDIC have broad supervisory and enforcement authority with regard to BHCs and banks, including the power to conduct examinations and investigations, impose nonpublic supervisory agreements, issue cease and desist orders, impose fines and other civil and criminal penalties, terminate deposit insurance, and appoint a conservator or receiver. In addition, Huntington, the Bank, and other Huntington subsidiaries are subject to supervision, regulation, and examination by the CFPB, which is the primary administrator of most federal consumer financial statutes and Huntington’s primary consumer financial regulator. Supervision and examinations are confidential, and the outcomes of these actions may not be made public.
Bank regulators have various remedies available if they determine that the financial condition, capital resources, asset quality, earnings prospects, management, liquidity, or other aspects of a banking organization’s operations are unsatisfactory. The regulators may also take action if they determine that the banking organization or its management is violating or has violated any law or regulation. The regulators have the power to, among other things, (1) prohibit unsafe or unsound practices, (2) require affirmative actions to correct any violation or practice, (3) issue administrative orders that can be judicially enforced, (4) direct increases in capital, (5) direct the sale of subsidiaries or other assets, (6) limit dividends and distributions, (7) restrict growth, (8) assess civil monetary penalties, (9) remove officers and directors, and (10) terminate deposit insurance.
Engaging in unsafe or unsound practices or failing to comply with applicable laws, regulations, and supervisory agreements could subject the Company, its subsidiaries, and their respective officers, directors, and institution-affiliated parties to the remedies described above, and other sanctions. In addition, the FDIC may terminate a bank’s deposit insurance upon a finding that the bank’s financial condition is unsafe or unsound or that the bank has engaged in unsafe or unsound practices or has violated an applicable rule, regulation, order, or condition enacted or imposed by the bank’s regulatory agency.
In November 2018,Huntington is subject to the Federal Reserve adopted a new rating system, theReserve’s LFI Rating System, to align its supervisory rating system for large financial institutions, including Huntington, with its current supervisory programs for these firms. As compared to the rating system it replaces, which will continue to be used for smaller BHCs, the LFI Rating System places a greater emphasis on capital and liquidity, including related planning and risk management practices. Huntington received its firstpractices, as compared to the supervisory rating under the LFI Rating System in 2020.system applicable to smaller BHCs. These ratings will remainare confidential.
Bank Acquisitions by Huntington
BHCs, such as Huntington, must obtain prior approval of the Federal Reserve in connection with any acquisition that results in the BHC owning or controlling 5% or more of any class of voting securities of a bank or another BHC.
Acquisitions of Ownership of the Company
Acquisitions of Huntington’s voting stock above certain thresholds are subject to prior regulatory notice or approval under federal banking laws, including the BHC Act and the Change in Bank Control Act of 1978. Under the Change in Bank Control Act, a person or entity generally must provide prior notice to the Federal Reserve before
acquiring the power to vote 10% or more of our outstanding common stock. Investors should be aware of these requirements when acquiring shares in our stock.
Interstate Banking
Under the Riegle-Neal Act, a BHC may acquire banks in states other than its home state, subject to any state requirement that the bank has been organized and operating for a minimum period of time, not to exceed five years, and the requirement that the BHC not control, prior to or following the proposed acquisition, more than 10% of the total amount of deposits of insured depository institutions nationwide or, unless the acquisition is the BHC’s initial entry into the state, more than 30% of such deposits in the state (or such lesser or greater amount set by the state). The Riegle-Neal Act also authorizes banks to merge across state lines, thereby creating interstate branches. A national bank, such as the Bank, with the approval of the OCC may open a branch in any state if the law of that state would permit a state bank chartered in that state to establish the branch.
Regulatory Capital RequirementsEnhanced Prudential Standards
BHCs with consolidated assets of more than $100 billion, such as Huntington, are currently subject to certain enhanced prudential standards. As a result, Huntington is subject to more stringent standards, including liquidity and the Bankcapital requirements, leverage limits, stress testing, resolution planning, and risk management standards, than those applicable to smaller institutions. Certain larger banking organizations are subject to certain risk-based capital and leverage ratio requirements under the U.S. Basel III capital rules adopted by the Federal Reserve, for Huntington, and by the OCC, for the Bank. These rules implement the Basel III international regulatory capital standards in the United States, as well as certain provisions of the Dodd-Frank Act. These quantitative calculations are minimums, and the Federal Reserve and OCC may determine thatadditional enhanced prudential standards. As a Category IV banking organization, based on its size, complexity, or risk profile, must maintain a higher level of capital in order to operate in a safe and sound manner.
Under the U.S. Basel III capital rules, Huntington’s and the Bank’s assets, exposures, and certain off-balance sheet items areHuntington is subject to risk weights used to determine the institutions’ risk-weighted assets. These risk-weighted assets are used to calculate the following minimum capital ratios for Huntington and the Bank:
•CET1 Risk-Based Capital Ratio, equal to the ratio of CET1 capital to risk-weighted assets. CET1 capital primarily includes common shareholders’ equity subject to certain regulatory adjustments and deductions, including goodwill, intangible assets, certain deferred tax assets, and AOCI. Effective April 1, 2020, Huntington and the Bank adopted rules issued by regulators that simplified the capital treatment of mortgage servicing assets, deferred tax assets arising from temporary differences that an institution could not realize through net operating loss carrybacks, and investments in the capital of unconsolidated financial institutions, as well as simplified the recognition and calculation of minority interests that are includable in regulatory capital.
•Tier 1 Risk-Based Capital Ratio, equal to the ratio of Tier 1 capital to risk-weighted assets. Tier 1 capital is primarily comprised of CET1 capital, perpetual preferred stock, and certain qualifying capital instruments.
•Total Risk-Based Capital Ratio, equal to the ratio of total capital, including CET1 capital, Tier 1 capital, and Tier 2 capital, to risk-weighted assets. Tier 2 capital primarily includes qualifying subordinated debt and qualifying ALLL. Tier 2 capital also includes, among other things, certain trust preferred securities.
•Tier 1 Leverage Ratio, equal to the ratio of Tier 1 capital to quarterly average assets (net of goodwill, certain other intangible assets, and certain other deductions).
In December 2018, the U.S. federal banking agencies finalized rules that permit BHCs and banks to phase-in the day-one retained earnings impact of the new CECL accounting rule over a period of three years for regulatory capital purposes. As part of its response to the impact of COVID-19, the U.S. federal banking agencies issued another final rule that provides the option to temporarily delay certain effects of CECL on regulatory capital for two years, followed by a three-year transition period beginning January 1, 2022. The final rule allows BHCs and banks to delay for two years 100% of the day-one impact of adopting CECL and 25% of the cumulative change in the reported allowance for credit losses since adopting CECL. Huntington and the Bank have elected to adopt this final rule. For further discussion of the new CECL accounting rule, see Note 2 of the Notes to Consolidated Financial Statements.
In August 2020, the U.S. federal banking agencies adopted a final rule altering the definition of eligible retained income in their respective capital rules. Under the new rule, eligible retained income is the greater of a firm’s (i) net income over the four preceding calendar quarters, net of any distributions and associated tax effects not already
13 Huntington Bancshares Incorporated
reflected in net income, and (ii) average net income over the preceding four quarters. This definition applies with respect to all of Huntington’s capital requirements.
The total minimum regulatory capital ratios and well-capitalized minimum ratios are reflected on the following page. The Federal Reserve has not yet revised the well-capitalized standard for BHCs to reflect the higher capital requirements imposed under the U.S. Basel III capital rules. For purposes of the Federal Reserve’s Regulation Y, including determining whether a BHC meets the requirements to be an FHC, BHCs, such as Huntington, must maintain a Tier 1 Risk-Based Capital Ratio of 6.0% or greater and a Total Risk-Based Capital Ratio of 10.0% or greater. If the Federal Reserve were to apply the same or a very similar well-capitalized standard to BHCs as thatleast restrictive enhanced prudential standards applicable to the Bank, Huntington’s capital ratios as of December 31, 2020, would exceed such revised well-capitalized standard. The Federal Reserve may require BHCs, including Huntington, to maintain capital ratios substantiallyfirms with $100 billion or more in excess of mandated minimum levels, depending upon general economic conditions and a BHC’s particular condition, risk profile, and growth plans.total consolidated assets.
Failure to be well-capitalized or to meet minimum capital requirements could result in certain mandatory and possible additional discretionary actions by regulators that, if undertaken, could have an adverse material effect on our operations or financial condition. Failure to be well-capitalized or to meet minimum capital requirements could also result in restrictions on Huntington’s or the Bank’s ability to pay dividends or otherwise distribute capital or to receive regulatory approval of applications.
In addition to meeting the minimum capital requirements, under the U.S. Basel III capital rules, Huntington and the Bank must also maintain the required stress capital buffer and Capital Conservation Buffer, respectively, to avoid becoming subject to restrictions on capital distributions and certain discretionary bonus payments to management. The Capital Conservation Buffer is 2.5% and is calculated as a ratio of CET1 capital to risk-weighted assets, and it effectively increases the required minimum risk-based capital ratios. The Tier 1 Leverage Ratio is not impacted by the Capital Conservation Buffer, and a banking institution may be considered well-capitalized while remaining out of compliance with the Capital Conservation Buffer. In March 2020, the Federal Reserve issued a final rule that, among other things, replaced the Capital Conservation Buffer with stress buffer requirements for certain large BHCs, including Huntington. Please refer to the Stress Buffer Requirements section below for further details.
The following table presents the minimum regulatory capital ratios, minimum ratio plus capital conservation buffer, and well-capitalized minimums compared with Huntington’s and the Bank’s regulatory capital ratios as of December 31, 2020, calculated using the regulatory capital methodology applicable during 2020.
| | | | | | | | | | | | | | | | | | | | | | |
| | Minimum Regulatory Capital Ratio | Minimum Ratio + Capital Conservation Buffer (1) | Well-Capitalized Minimums (2) | | At December 31, 2020 |
| | | Actual | | |
| Ratios: | | | | | | | | |
| | | | | | | | |
| | | | | | | | |
| CET 1 risk-based capital ratio | Consolidated | 4.50 | % | 7.00 | % | N/A | | 10.00 | % | | |
| Bank | 4.50 | | 7.00 | | 6.50 | % | | 10.65 | | | |
| Tier 1 risk-based capital ratio | Consolidated | 6.00 | | 8.50 | | 6.00 | | | 12.47 | | | |
| Bank | 6.00 | | 8.50 | | 8.00 | | | 11.97 | | | |
| Total risk-based capital ratio | Consolidated | 8.00 | | 10.50 | | 10.00 | | | 14.46 | | | |
| Bank | 8.00 | | 10.50 | | 10.00 | | | 13.58 | | | |
| Tier 1 leverage ratio | Consolidated | 4.00 | | N/A | N/A | | 9.32 | | | |
| Bank | 4.00 | | N/A | 5.00 | | | 8.94 | | | |
(1) Reflects a stress capital buffer of 2.5% for Huntington and the capital conservation buffer of 2.5% for the Bank.
(2) Reflects the well-capitalized standard applicable to Huntington under Federal Reserve Regulation Y and the well-capitalized standard applicable to the Bank.
Huntington has the ability to provide additional capital to the Bank to maintain the Bank’s risk-based capital ratios at levels which would be considered well-capitalized.
As of December 31, 2020, Huntington’s and the Bank’s regulatory capital ratios were above the well-capitalized standards and met the stress capital buffer and the Capital Conservation Buffer, respectively.
Liquidity Requirements
Under the Capital and Liquidity Tailoring Rule, Huntington, as a Category IV banking organization with less than $50 billion in weighted short-term wholesale funding, is exempt from the LCR and net stable funding ratio requirements but will continuecontinues to be subject to internal liquidity stress tests and standards.
Enhanced Prudential StandardsLong-term Debt Requirements
UnderIn August 2023, the Dodd-Frank Act, as modified by the Economic Growth Act, BHCs with consolidated assets of more than $100 billion,U.S. banking agencies issued a proposed rule that would require certain large banking organizations such as Huntington to comply with long-term debt requirements and “clean holding company requirements” similar to those that currently only apply to U.S. global systemically important banking organizations. This proposal would also impose a long-term debt requirement on certain categories of insured depository institutions that are currently subject to certain enhanced prudential standards. As a result, Huntington is subject to more stringent standards, including liquidity and capital requirements, leverage limits, stress testing, resolution planning, and risk management standards, than those applicable to smaller institutions. Certain largernot consolidated subsidiaries of U.S. global systematically important banking organizations, are subject to additional enhanced prudential standards.
A rule to implement one additional enhanced prudential standard—early remediation requirements—is still under consideration by the Federal Reserve. In June 2018, the Federal Reserve adopted a final rule that established single counterparty credit limits. The single counterparty credit limits do not apply to BHCs like Huntington that do not have at least $250 billion of total consolidated assets.
As discussed in the Regulatory Environment section above, under the EPS Tailoring Rule, Huntington, as a Category IV banking organization, is subject to the least restrictive enhanced prudential standards applicable to firmsincluding insured depository institutions with $100 billion or more in total assets, such as the Bank. If adopted, this proposal, would require Huntington and the Bank to each maintain a minimum outstanding eligible long-term debt amount of no less than the greater of (i) 6% of total risk-weighted assets, (ii) 2.5% of total leverage exposure (if subject to the supplementary leverage ratio), or (iii) 3.5% of average total consolidated assets. To comply with the requirement, the Bank would be required to issue the minimum amount of eligible long-term debt to Huntington, and Huntington would be required to issue the minimum amount of eligible long-term debt externally. The proposal allows banking organizations to include, as part of the required minimum outstanding eligible long-term debt amounts, certain existing long-term debt. Once the rule is finalized, covered institutions would have three years to comply with the new requirements following a phased-in approach, with 25% of the long-term debt requirement by one year after finalization of the rule, 50% after two years, and 100% after three years.
In addition, if adopted as proposed, the “clean holding company requirements” would limit or prohibit Huntington from entering into certain transactions that could impede its orderly resolution, including, for example, prohibiting Huntington from entering into transactions that could spread losses to subsidiaries and third parties, as well as limiting the amount of the Company’s liabilities that are not eligible long-term debt.
Regulatory Capital Requirements
Huntington and the Bank are subject to certain risk-based capital and leverage ratio requirements under the U.S. Basel III capital rules adopted by the Federal Reserve, for Huntington, and by the OCC, for the Bank. These rules implement the Basel III international regulatory capital standards in the U.S., as well as certain provisions of the Dodd-Frank Act. These quantitative calculations are minimums, and the Federal Reserve and OCC may determine that a banking organization, based on its size, complexity, or risk profile, must maintain a higher level of capital in order to operate in a safe and sound manner.
12 Huntington Bancshares Incorporated
Under the U.S. Basel III capital rules, Huntington’s and the Bank’s assets, exposures, and certain off-balance sheet items are subject to risk weights used to determine the institutions’ risk-weighted assets. These risk-weighted assets are used to calculate the following minimum capital ratios for Huntington and the Bank:
•CET1 Risk-Based Capital Ratio, equal to the ratio of CET1 capital to risk-weighted assets. CET1 capital primarily includes common shareholders’ equity subject to certain regulatory adjustments and deductions, including goodwill, intangible assets, certain deferred tax assets, and AOCI.
•Tier 1 Risk-Based Capital Ratio, equal to the ratio of Tier 1 capital to risk-weighted assets. Tier 1 capital is primarily comprised of CET1 capital, perpetual preferred stock, and certain qualifying capital instruments.
•Total Risk-Based Capital Ratio, equal to the ratio of total capital, including CET1 capital, Tier 1 capital, and Tier 2 capital, to risk-weighted assets. Tier 2 capital primarily includes qualifying subordinated debt and qualifying ALLL. Tier 2 capital also includes, among other things, certain trust preferred securities.
•Tier 1 Leverage Ratio, equal to the ratio of Tier 1 capital to quarterly average assets (net of goodwill, certain other intangible assets, and certain other deductions).
Huntington and the Bank elected to temporarily delay certain effects of CECL on regulatory capital until January 1, 2022, pursuant to a rule that allowed BHCs and banks to delay for two years 100% of the day-one impact of adopting CECL and 25% of the cumulative change in the reported allowance for credit losses since adopting CECL. As of December 31, 2023, we have phased in 50% of the cumulative CECL deferral with the remaining impact to be recognized through the first quarter 2025.
The total minimum regulatory capital ratios and well-capitalized minimum ratios are reflected in the table below in this section. The Federal Reserve has not yet revised the well-capitalized standard for BHCs to reflect the higher capital requirements imposed under the U.S. Basel III capital rules. For purposes of the Federal Reserve’s Regulation Y, including determining whether a BHC meets the requirements to be an FHC, BHCs, such as Huntington, must maintain a Tier 1 Risk-Based Capital Ratio of 6.0% or greater and a Total Risk-Based Capital Ratio of 10.0% or greater. If the Federal Reserve were to apply the same or a very similar well-capitalized standard to BHCs as that applicable to the Bank, Huntington’s capital ratios as of December 31, 2023, would exceed such revised well-capitalized standard. The Federal Reserve may require BHCs, including Huntington, to maintain capital ratios substantially in excess of mandated minimum levels, depending upon general economic conditions and a BHC’s particular condition, risk profile, and growth plans.
Failure to be well-capitalized or to meet minimum capital requirements could result in certain mandatory and possible additional discretionary actions by regulators that, if undertaken, could have an adverse material effect on our operations or financial condition. Failure to be well-capitalized or to meet minimum capital requirements could also result in restrictions on Huntington’s or the Bank’s ability to pay dividends or otherwise distribute capital or to receive regulatory approval of applications.
In addition to meeting the minimum capital requirements under the U.S. Basel III capital rules, Huntington and the Bank must maintain the applicable capital buffer (SCB or CCB) requirements to avoid becoming subject to restrictions on capital distributions and certain discretionary bonus payments to management. Huntington is subject to a SCB of 3.2% effective for the period October 1, 2023 through September 30, 2024. Refer to the SCB Requirements section below for further details. The Bank is subject to a CCB of 2.5%. The Tier 1 Leverage Ratio is not impacted by the SCB or CCB, and a banking institution may be considered well-capitalized while remaining out of compliance with the SCB or CCB.
The following table presents the minimum regulatory capital ratios, minimum ratio plus the capital buffer, and well-capitalized minimums compared to enhanced prudential standards that werewith Huntington’s and the Bank’s regulatory capital ratios as of December 31, 2023, calculated using the regulatory capital methodology applicable as of the end of 2023.
| | | | | | | | | | | | | | | | | | | | | | |
| | Minimum Regulatory Capital Ratio | Minimum Ratio + Capital Buffer (1) | Well-Capitalized Minimums (2) | | At December 31, 2023 |
| | | Actual | | |
| Ratios: | | | | | | | | |
| | | | | | | | |
| | | | | | | | |
| CET1 risk-based capital ratio | Consolidated | 4.50 | % | 7.70 | % | N/A | | 10.25 | % | | |
| Bank | 4.50 | | 7.00 | | 6.50 | % | | 10.60 | | | |
| Tier 1 risk-based capital ratio | Consolidated | 6.00 | | 9.20 | | 6.00 | | | 11.98 | | | |
| Bank | 6.00 | | 8.50 | | 8.00 | | | 11.47 | | | |
| Total risk-based capital ratio | Consolidated | 8.00 | | 11.20 | | 10.00 | | | 14.17 | | | |
| Bank | 8.00 | | 10.50 | | 10.00 | | | 13.09 | | | |
| Tier 1 leverage ratio | Consolidated | 4.00 | | N/A | N/A | | 9.32 | | | |
| Bank | 4.00 | | N/A | 5.00 | | | 8.51 | | | |
(1) Reflects a SCB of 3.2% for Huntington and CCB of 2.5% for the Bank.
(2) Reflects the well-capitalized standard applicable to Huntington under Federal Reserve Regulation Y and the EPS Tailoring Rule, well-capitalized standard applicable to the Bank.
Huntington is no longer subjecthas the ability to company-run stress testing requirementsprovide additional capital to the Bank to maintain the Bank’s risk-based capital ratios at levels which would be considered well-capitalized.
As of December 31, 2023, Huntington’s and is subject to supervisory stress tests every other year (as opposed to annually), less frequent internal liquidity stress tests,the Bank’s regulatory capital ratios were above the well-capitalized standards and reduced liquidity risk managementmet the applicable capital buffer requirements. Future rules
Basel III Endgame Proposal
In July 2023, the U.S. banking agencies issued a proposed rule to implement the Economic Growth Act may further changeBasel III endgame agreement for large banks (Basel III Endgame Proposal). In addition to calculating risk-weighted assets under the enhanced prudentialcurrent U.S. standardized approach, the proposal introduces a new “expanded risk-based approach.” As compared with the standardized approach, the expanded risk-based approach includes more granular risk weights for credit risk and introduces a new market risk framework. The expanded risk-based approach also includes operational risk and credit valuation adjustment risk-weighted asset components. The proposal also would require the new market risk standards applicablefrom the proposal be applied in the standardized approach.
If adopted as proposed, Huntington would be required to Huntington.calculate its risk-based capital ratios under both the current U.S. standardized approach and the expanded risk-based approach and would be subject to the lower of the two resulting ratios for each risk-based capital ratio. The proposal would also require banking organizations to recognize most elements of AOCI in regulatory capital, including unrealized gains and losses on available-for-sale securities, and lower thresholds for deductions from CET1 capital for mortgage servicing assets and deferred tax assets, among other things. In addition, the proposal would apply the SCB to risk-based capital requirements calculated under both U.S. standardized approach and the expanded risk-based approach. The proposal includes a proposed effective date of July 1, 2025, with three-year transition arrangements until revised standards are fully phased in on July 1, 2028.
Capital Planning and Stress Testing
Huntington is required to develop, maintain, and submit to the Federal Reserve a capital plan every other year, forwhich is subject to supervisory review in connection with itsthe Federal Reserve’s CCAR process. Huntington is required to include within its capital plan an assessment of the expected uses and sources of capital and a description of all planned capital actions over the nine-quarter planning horizon, a detailed description of the process for assessing capital adequacy, its capital policy, and a discussion of any expected changes to its business plan that are likely to have a material impact on its capital adequacy. Under the stress buffer requirements, final rule adopted in March 2020, the CCAR process is used to determine a BHC’s stress capital bufferSCB requirement. Please refer to the Stress BufferSCB Requirements section below for further details.
14 Huntington Bancshares Incorporated
The Federal Reserve expects BHCs subject to CCAR, such as Huntington, to have sufficient capital to withstand a highly adverse operating environment and to be able to continue operations, maintain ready access to funding, meet obligations to creditors and counterparties, and serve as credit intermediaries. In addition, the Federal Reserve evaluates the planned capital actions of these BHCs, including planned capital distributions such as dividend payments or stock repurchases. This involves a quantitative assessment of capital based on supervisory-run stress tests that assess the ability to maintain capital levels above certain minimum ratios, after taking all capital actions included in a BHC’s capital plan, under baseline and stressful conditions throughout the nine-quarter planning horizon. As part of CCAR, the Federal Reserve evaluates whether BHCs have sufficient capital to continue operations throughout times of economic and financial market stress and whether they have robust, forward-looking capital planning processes that account for their unique risks. We are generally prohibited from making a capital distribution unless, after giving effect to the distribution, we will meet all minimum regulatory capital ratios. Under the stress buffer requirements final rule adopted in March 2020, BHCs, including Huntington may increase theircertain types of capital distributions in excess of the amount included in theirits capital plan without seeking prior approval from the Federal Reserve as long as the BHCit otherwise complies with the automatic restrictions on distributions under the Federal Reserve’s capital rules.
15 Huntington Bancshares Incorporated
Under revised CCAR rules that became effective on March 6, 2017,Although the Federal Reserve is no longer allowed to object to the capital plan of a large and non-complex BHC, such as Huntington, on a qualitative, as opposed to quantitative, basis. Instead,basis, the Federal Reserve may evaluate the strength of Huntington’s qualitative capital planning process through the regular supervisory process and targeted horizontal reviews of particular aspects of capital planning. In addition, under the stress buffer requirements final rule adopted in March 2020, the Federal Reserve may no longer object to capital plans of BHCs, including Huntington, on a quantitative basis. Please refer to the Stress Buffer
SCB Requirements section below for further details.
During the fourth quarter of 2020, certain large BHCs, including Huntington, were required to update and resubmit their capital plans to reflect ongoing stresses caused by the COVID-19 pandemic. We conducted a second round of stress tests and submitted our updated capital plan to the Federal Reserve in November 2020. On December 18, 2020, the Federal Reserve released the results of its second round of supervisory stress tests. While, the Federal Reserve did not recalculate our stress capital buffer requirement at this time; they have the ability to do so until March 31, 2021.
Stress Buffer Requirements
In March 2020, the Federal Reserve issued a final rule to integrate its annual capital planning and stress testing requirements with certain ongoing regulatory capital requirements. The final rule applies to certain BHCs, including Huntington, and introduces a stress capital buffer and related changes to the capital planning and stress testing processes.
For risk-based capital requirements, Huntington, as a large BHC, is provided an SCB by the stress capital buffer replaces the existing Capital Conservation Buffer, which was 2.5% as of January 1, 2019. Under the final rule, beginning in the 2020 CCAR cycle, Huntington will be required to calculate a stress capital buffer equal toFederal Reserve that is determined annually based on the greater of (i) the difference between its starting and minimum projected CET1 Risk-Based Capital Ratio under the severely adverse scenario in the supervisory stress test, plus the sum of the dollar amount of Huntington’s planned common stock dividends for each of the fourth through seventh quarters of the planning horizon as a percentage of risk-weighted assets, or (ii) 2.5%. As of December 31, 2020, Huntington’s stress capital buffer is 2.5%.
The final rule also makes related changesOn April 5, 2023, Huntington submitted its 2023 Capital Plan to the Federal Reserve for supervisory review. By notice dated June 28, 2023, the Federal Reserve informed Huntington that, effective for the period of October 1, 2023 through September 20, 2024, its indicative SCB requirement associated with its 2023 Capital Plan is 3.2%, a decrease from its previous SCB of 3.3%. Although we were not subject to the Federal Reserve’s 2023 supervisory stress test, our indicative SCB was updated for 2023 based on the dividend add-on component of the SCB.
Huntington is authorized to make capital planning and stress testing process. Among other changes,distributions that are consistent with the revisedrequirements in the Federal Reserve’s capital plan rule, eliminatesinclusive of the assumption that Huntington’s balance sheet assets would increase over the planning horizon. In addition, providedSCB requirement. Provided that Huntington is otherwise in compliance with automatic restrictions on distributions under the Federal Reserve’s capital rules, Huntington willis no longer be required to seek prior approval to make capital distributions in excess of those included in its capital plan.
Restrictions on Dividends
Huntington is a legal entity separate and distinct from its banking and non-banking subsidiaries. Since our consolidated net income consists largely of net income of Huntington’s subsidiaries, our ability to make capital distributions, including paying dividends and repurchasing shares, depends upon our receipt of dividends from these subsidiaries. Under federal law, there are various limitations on the extent to which the Bank can declare and pay dividends to Huntington, including those related to regulatory capital requirements, general regulatory oversight to prevent unsafe or unsound practices, and federal banking law requirements concerning the payment of dividends out of net profits, surplus, and available earnings. Certain contractual restrictions also may limit the ability of the Bank to pay dividends to Huntington. No assurances can be given that the Bank will, in any circumstances, pay dividends to Huntington.
Huntington’s ability to declare and pay dividends to our shareholders is similarly limited by federal banking law and Federal Reserve regulations and policy. As discussed in the Capital Planning section above, in general, a BHC may pay dividends and repurchase stock only in accordance with a capital plan that has been reviewed by the Federal Reserve and as to which the Federal Reserve has not objected. The FRB announced that certain large BHCs, including Huntington, will be permitted to make both dividend and share repurchases during the first quarter of 2021, subject to limits based on the amount of dividends paid in the second quarter of 2020 and the bank's average net income for the four preceding quarters.
Huntington must maintain the applicable stress capital buffer and the Bank must maintain the CET1 Capital Conservation Buffer of 2.5%applicable capital buffer requirements to avoid becoming subject to restrictions on capital distributions, including dividends. For more information on the capital buffer requirements, see the SCB Requirements and the Regulatory Capital Requirements sections above.
For more information on the stress buffer requirements and the Capital Conservation Buffer, see the Stress Capital Buffer Requirements and the Regulatory Capital Requirements sections above, respectively.
The Federal Reserve policy provideshas indicated generally that it may be an unsafe or unsound practice for a BHC generally should notto pay dividends unless (1) the BHC’sa its net income over the last four quarters (net of dividends paid) is sufficient to fully fund the dividends (2)and the prospectiveexpected rate of earnings retention appearsis consistent with theits capital needs, asset quality, and overall financial condition of the BHC and its subsidiaries, and (3) the BHC will continue to meet minimum required capital adequacy ratios. Accordingly, a BHC should not pay cash dividends that can only be funded in ways that weaken the BHC’s financial health, such as by borrowing. A BHC should inform the Federal Reserve reasonably in advance of declaring or paying a dividend that exceeds earnings for the period for which the dividend is being paid or that could result in a material adverse change to the BHC’s capital structure. BHCs should also consult with the Federal Reserve before increasing dividends or redeeming or repurchasing capital instruments. Additionally, thecondition. The Federal Reserve could prohibit or limit the payment of dividends by a BHC if it determines that payment of the dividend would constitute an unsafe or unsound practice.
In response to the uncertainty caused by the COVID-19 pandemic, certain large BHCs, including Huntington, were not permitted to make share repurchases, subject to certain limited exceptions, during the third and fourth quarters of 2020, but were permitted to make dividend payments subject to limits based on the amount of dividends paid in the second quarter and the firm’s average net income over the preceding four quarters. For the first quarter of 2021, provided that a BHC does not increase its common stock dividends higher than the level paid in the second quarter of 2020, BHCs, including Huntington, are permitted to pay common dividends and make share repurchases that, in the aggregate, do not exceed an amount equal to the average of the firm’s net income over the four preceding calendar quarters. BHCs may also make additional share repurchases up to the amount of share issuances related to expensed employee compensation.
Volcker Rule
Under the Volcker Rule, we are prohibited from (1) engaging in short-term proprietary trading for our own account and (2) having certain ownership interests in and relationships with hedge funds or private equity funds (covered funds). The Volcker Rule regulations contain exemptions for market-making, hedging, underwriting, trading in U.S. government and agency obligations, and also permit certain ownership interests in certain types of covered funds to be retained. They also permit the offering and sponsoring of covered funds under certain conditions. The Volcker Rule regulations impose significant compliance and reporting obligations on banking entities, such as Huntington. We have put in place the compliance programs required by the Volcker Rule and have either divested or received extensions for any holdings in illiquid covered funds.
The five federal agencies implementingfunds are in compliance with the Volcker Rule regulations have approved an interim final rule to permit banking entities to retain interests in certain collateralized debt obligations backed primarily by trust preferred securities if certain qualifications are met. In addition, the agencies released a non-exclusive list of issuers that meet the requirements of the interim final rule. As of December 31, 2020, we had no investments in trust preferred securities.Rule.
As of October 2019, the five federal agencies with rulemaking authority with respect to the Volcker Rule finalized amendments to the proprietary trading provisions of the Volcker Rule. These amendments tailor the Volcker Rule’s compliance requirements to the amount of a firm’s trading activity, revise the definition of trading account, clarify certain key provisions in the Volcker Rule, and modify the information companies are required to provide the federal agencies. These amendments to the Volcker Rule are not material to our investing and trading activities.
In June 2020, the five federal agencies finalized amendments to the Volcker Rule’s restrictions on ownership interests in and relationships with covered funds. Among other things, these amendments permit banking entities to have relationships with and offer additional financial services to additional types of funds and investment vehicles. These requirements are not expected to have a material impact on Huntington’s investing and trading activities.
17 Huntington Bancshares Incorporated
Recovery and Resolution Planning
In past years, Huntington was required to submit annually to the Federal Reserve and the FDICAs a resolution plan for the orderly resolution of Huntington and its significant legal entities under the U.S. Bankruptcy Code or other applicable insolvency laws in a rapid and orderly fashion in the event of future material financial distress or failure. In October 2019, the Federal Reserve and the FDIC adopted amendments to their resolution planning rule, and as a result of these amendments,Category IV banking organization, Huntington is no longernot required to submit a resolution plan to the Federal Reserve andReserve. As an insured depository institution, the FDIC.
The Bank is required to periodically file a resolution plan with the FDIC. The public versions of the resolution plans previously submitted by HuntingtonFDIC, and the Bank are availablesubmitted its most recent resolution plan to the FDIC on November 30, 2022. In August 2023, the FDIC issued a proposed rule that would require covered insured depository institutions, such as the Bank, to submit a full resolution plan to the FDIC every two years and submit an interim supplement in each year that it is not required to submit a full resolution plan. The proposed rule would also increase the content requirements for plan submissions and introduce a new credibility standard for the FDIC’s website and, in the caseevaluation of Huntington’s resolution plans, also onwhich would be enforceable against the Federal Reserve’s website.
In April 2019, the FDIC released an advanced notice of proposed rulemaking with respect to the FDIC’s bank resolution plan requirements that requested comments on how to better tailor bank resolution plans to a firm’s size, complexity, and risk profile, and delayed bank resolution plan submissions to the rulemaking process. The FDIC announced in January 2021 that it will resume requiring bank-level resolution plan submissions, but will not require banks to submit resolution plans without at least 12 months advance notice, and as a result, the Bank does not currently have an anticipated submission date for its next resolution plan.covered insured depository institutions.
Source of Strength
Huntington is required to serve as a source of financial and managerial strength to the Bank and, under appropriate conditions, to commit resources to support the Bank. This support may be required by the Federal Reserve at times when we might otherwise determine not to provide it or when doing so is not otherwise in the interests of Huntington or our shareholders or creditors. The Federal Reserve may require a BHC to make capital injections into a troubled subsidiary bank and may charge the BHC with engaging in unsafe and unsound practices if the BHC fails to commit resources to such a subsidiary bank or if it undertakes actions that the Federal Reserve believes might jeopardize the BHC’s ability to commit resources to such subsidiary bank.
Under these requirements, Huntington may in the future be required to provide financial assistance to the Bank should it experience financial distress. Capital loans by Huntington to the Bank would be subordinate in right of payment to deposits and certain other debts of the Bank. In the event of Huntington’s bankruptcy, any commitment by Huntington to a federal bank regulatory agency to maintain the capital of the Bank would be assumed by the bankruptcy trustee and entitled to a priority of payment.
FDIC as Receiver or Conservator of Huntington
Upon the insolvency of an insured depository institution, such as the Bank, the FDIC may be appointed as the conservator or receiver of the institution. Under the Orderly Liquidation Authority, upon the insolvency of a BHC, such as Huntington, the FDIC may be appointed as conservator or receiver of the BHC, if certain findings are made by the FDIC, the Federal Reserve, and the Secretary of the Treasury, in consultation with the President. Acting as a conservator or receiver, the FDIC would have broad powers to transfer any assets or liabilities of the institution without the approval of the institution’s creditors.
16 Huntington Bancshares Incorporated
Depositor Preference
The FDIA provides that, in the event of the liquidation or other resolution of an insured depository institution, including the Bank, the claims of depositors of the institution (including the claims of the FDIC as subrogee of insured depositors) and certain claims for administrative expenses of the FDIC as a receiver would have priority over other general unsecured claims against the institution. If the Bank were to fail, insured and uninsured depositors, along with the FDIC, would have priority in payment ahead of unsecured, non-deposit creditors, including Huntington, with respect to any extensions of credit they have made to such insured depository institution.
Transactions between a Bank and its Affiliates
Federal banking laws and regulations impose qualitative standards and quantitative limitations upon certain transactions between a bank and its affiliates, including between a bank and its holding company and companies that the BHC may be deemed to control for these purposes. Transactions covered by these provisions must be on
arm’s-length terms and cannot exceed certain amounts which are determined with reference to the Bank’s regulatory capital. Moreover, if the transaction is a loan or other extension of credit, it must be secured by collateral in an amount and quality expressly prescribed by statute, and if the affiliate is unable to pledge sufficient collateral, the BHC may be required to provide it. The Dodd-Frank Act expanded the coverage and scope of these regulations, including by applying them to the credit exposure arising under derivative transactions, repurchase and reverse repurchase agreements, and securities borrowing and lending transactions. Federal banking laws also place similar restrictions on loans and other extensions of credit by FDIC-insured banks, such as the Bank, and their subsidiaries to their directors, executive officers, and principal shareholders.
Lending Standards and Guidance
The federal bank regulatory agencies have adopted uniform regulations prescribing standards for extensions of credit that are secured by liens or interests in real estate or made for the purpose of financing permanent improvements to real estate. Under these regulations, all insured depository institutions, such as the Bank, must adopt and maintain written policies establishing appropriate limits and standards for extensions of credit that are secured by liens or interests in real estate or are made for the purpose of financing permanent improvements to real estate. These policies must establish loan portfolio diversification standards, prudent underwriting standards (including loan-to-value limits) that are clear and measurable, loan administration procedures, and documentation, approval, and reporting requirements. The real estate lending policies must reflect consideration of the federal bank regulatory agencies’ Interagency Guidelines for Real Estate Lending Policies.
Heightened Governance and Risk Management Standards
The OCC has published guidelines to set expectations for the governance and risk management practices of certain large financial institutions, including the Bank. The guidelines require covered institutions to establish and adhere to a written governance framework in order to manage and control their risk-taking activities. In addition, the guidelines provide standards for the institutions’ boards of directors to oversee the risk governance framework. As discussed in the “Risk Management and Capital” section of the MD&A, the Bank currently has a written governance framework and associated controls.
Anti-Money Laundering
The Bank Secrecy Act and the Patriot Act contain anti-money laundering and financial transparency provisions intended to detect and prevent the use of the U.S. financial system for money laundering and terrorist financing activities. The Bank Secrecy Act, as amended by the Patriot Act, requires depository institutions and their holding companies to undertake activities, including maintaining an AML program, verifying the identity of customers, verifying the identity of certain beneficial owners for legal entity customers, monitoring for and reporting suspicious transactions, reporting on cash transactions exceeding specified thresholds, and responding to requests for information by regulatory authorities and law enforcement agencies. The Bank is subject to the Bank Secrecy Act and, therefore, is required to provide its employees with AML training, designate an AML compliance officer, and undergo an annual, independent audit to assess the effectiveness of its AML program. The Bank has implemented policies, procedures, and internal controls that are designed to comply with these AML requirements. Bank regulators are focusing their examinations on AML compliance, and we will continue to monitor and augment, where necessary, our AML compliance programs. The federal banking agencies are required, when reviewing bank and BHC acquisition or merger applications, to take into account the effectiveness of the AML activities of the applicant.
The Anti-Money Laundering Act of 2020, enacted on January 1, 2021 as part of the National Defense Authorization Act, does not directly impose new requirements on banks, but requires the U.S. Treasury Department to issue National Anti-Money Laundering and Countering the Financing of Terrorism Priorities, and conduct studies and issue regulations that may, over the next few years, significantly alter some of the due diligence, recordkeeping and reporting requirements that the Bank Secrecy Act and USA PATRIOTPatriot Act impose on banks. The Anti-Money Laundering Act of 2020 also contains provisions that promote increased information-sharing and use of technology and increases penalties for violations of the Bank Secrecy Act and includes whistleblower incentives, both of which could increase the prospect of regulatory enforcement.
19 Huntington Bancshares Incorporated
OFAC Regulation
OFAC is responsible for administering economic sanctions that affect transactions with designated foreign countries, nationals, and others, as defined by various Executive Orders and in various legislation. OFAC-administered sanctions take many different forms. For example, sanctions may include: (1) restrictions on trade with or investment in a sanctioned country, including prohibitions against direct or indirect imports from and exports to a sanctioned country and prohibitions on U.S. persons engaging in financial transactions relating to, making investments in, or providing investment-related advice or assistance to, a sanctioned country; and (2) a blocking of assets in which the government or “specially designated nationals” of the sanctioned country have an interest by prohibiting transfers of property subject to U.S. jurisdiction, including property in the possession or control of U.S. persons. OFAC also publishes lists of persons, organizations, and countries suspected of aiding, harboring, or engaging in terrorist acts, known as Specially Designated Nationals and Blocked Persons. Blocked assets, for example property and bank deposits, cannot be paid out, withdrawn, set off, or transferred in any manner without a license from OFAC. Failure to comply with these sanctions could have serious legal and reputational consequences.
Data Privacy
Federal and state law contains extensive consumer privacy protection provisions. The GLBA requires financial institutions to periodically disclose their privacy policies and practices relating to sharing such information and enables retail customers to opt out of our ability to share information with unaffiliated third parties under certain circumstances. Other federal and state laws and regulations impact our ability to share certain information with affiliates and non-affiliates for marketing and/or non-marketing purposes, or to contact customers with marketing offers. These security and privacy policies and procedures for the protection of personal and confidential information are in effect across all businesses and geographic locations as applicable. Federal law also makes it a criminal offense, except in limited circumstances, to obtain or attempt to obtain customer information of a financial nature by fraudulent or deceptive means.
18 Huntington Bancshares Incorporated
Data privacy and data protection are areas of increasing state legislative focus. For example, in June of 2018,under California state law, the GovernorCCPA broadly defines personal information and substantially increases the rights of California signed into law the CCPA. The CCPA, which became effective on January 1, 2020, appliesresidents to for-profitunderstand how their personal information is collected, used, and otherwise processed by commercial businesses, that conduct business in California and meet certain revenue or data collection thresholds. The CCPA gives consumerssuch as affording them the right to request disclosure of information collected about them,access and whether that information has been sold or shared with others, the right to request deletion of personaltheir information (subject to certain exceptions), the rightand to opt out of the salecertain sharing and sales of personal information. The CCPA contemplates civil penalties of up to $2,500 for each violation and up to $7,500 for each intentional violation and includes a private right of action (permitting lawsuits to be brought by private individuals instead of the consumer’sstate Attorney General or other government actor for certain breaches). In addition, laws in all 50 U.S. states require businesses to provide notice under certain circumstances to consumers whose personal information has been disclosed as a result of a data breach. Moreover, the U.S. Congress has recently considered, and the right notis currently considering, various proposals for more comprehensive data privacy and security legislation, to be discriminated against for exercising these rights. The CCPA contains several exemptions, including that many, but not all, requirements of the CCPA are inapplicable to information that is collected, processed, sold, or disclosed pursuant to the GLBA. California voters also recently passed the California Privacy Rights Act, which will take effect on January 1, 2023, and significantly modifies the CCPA, including imposing additional obligations on covered companies and expanding California consumers’ rights with respect to certain sensitive personal information, potentially resulting in further uncertainty and requiring us to incur additional costs and expenses in an effort to comply. In California, the CCPAwe may be interpreted or applied in a manner inconsistent with our understanding or similar laws may be adopted by other states where we operate. The federal government may also pass data privacy or data protection legislation.subject if passed.
Like other lenders, the Bank and other of our subsidiaries use credit bureau data in their underwriting activities. Use of such data is regulated under the FCRA, and the FCRA also regulates reporting information to credit bureaus, prescreening individuals for credit offers, sharing of information between affiliates, and using affiliate data for marketing purposes. Similar state laws may impose additional requirements on us and our subsidiaries.
FDIC Insurance
The DIF provides insurance coverage for certain deposits, up to a standard maximum deposit insurance amount of $250,000 per depositor, and is funded through assessments on insured depository institutions, based on the risk each institution poses to the DIF. The Bank accepts customer deposits that are insured by the DIF and, therefore, must pay insurance premiums. The FDIC may increase the Bank’s insurance premiums based on various factors, including the FDIC’s assessment of its risk profile.
The FDIC issued a rule thatalso requires large insured depository institutions, including the Bank, to enhance theirmaintain enhanced deposit account recordkeeping and related information technology system capabilities to facilitate prompt payment of insured deposits if such an institution were to fail. The FDIC has established an initial compliance date of April 1, 2020, and allows each large insured depository institution to file for an optional extension of the compliance date for up to one year, to a date no later than April 1, 2021. Huntington filed for the optional extension and certified its compliance to the FDIC, as required by the rule, during fourth quarter 2020.
As of June 30, 2020, the DIF reserve ratio fell to 1.30%. The FDIC, as required under the Federal Deposit Insurance Act,FDIA, established a plan on September 15, 2020, to restore the DIF reserve ratio to meet or exceed the statutory minimum of 1.35% within eight years. TheThis plan did not include an increase in the deposit insurance assessment rate. Based on the FDIC’s restoration plan projectsrecent projections, however, the FDIC determined that the DIF reserve ratio to exceed 1.35%is at risk of not reaching the statutory minimum by the statutory deadline of September 30, 2028 without increasing the deposit insurance assessment rates. In October 2022, the FDIC adopted a final rule to increase initial base deposit insurance assessment rate schedules uniformly by 2 basis points, beginning on January 1, 2023. The FDIC also concurrently maintained the Designated Reserve Ratio for the DIF at 2%.
In November 2023, the FDIC issued a final rule to implement a special assessment to recoup losses to the DIF associated with bank failures in the first half of 2023. Under the final rule, the assessment base for the special assessment is equal to an insured depository institution’s estimated uninsured deposits reported as of December 31, 2022, adjusted to exclude the first $5 billion of uninsured deposits. The final rule provides that the FDIC will collect the special assessment at a quarterly rate of 3.36 basis points over eight quarterly assessment periods, subject to ongoing monitoring overchange depending on any adjustments to the next eight years.loss estimate, mergers or failures, or amendments to reported estimates of uninsured deposits. Based on the Bank’s reported uninsured deposits as of December 31, 2022, the entire estimated amount of approximately $214 million was recognized as an accrued liability and related expense in the fourth quarter of 2023. The FDIC could increasefinal rule becomes effective April 1, 2024, and the deposit insurance assessmentsfirst collection will be reflected on the invoice for certain insured depository institutions, including the Bank, iffirst quarterly assessment period of 2024, with the DIF reserve ratio is not restored as projected.first payment due on June 28, 2024.
Compensation
Our compensation practices are subject to oversight by the Federal Reserve and, with respect to some of our subsidiaries and employees, by other financial regulatory bodies. The scope and content of compensation regulation in the financial industry are continuing to develop, and we expect that these regulations and resulting market practices will continue to evolve over a number of years.
The federal bank regulatory agencies have issued joint guidance on executive compensation designed to ensure that the incentive compensation policies of banking organizations, such as Huntington and the Bank, do not encourage imprudent risk taking and are consistent with the safety and soundness of the organization. In addition, the Dodd-Frank Act requires the federal bank regulatory agencies and theThe SEC to issue regulations or guidelines requiring covered financial institutions, including Huntington and the Bank, to prohibit incentive-based payment arrangementsalso finalized a rule that encourage inappropriate risks by providing compensation that is excessive or that could lead to material financial loss to the institution. A proposed rule was issued in 2016. Also pursuant to the Dodd-Frank Act, in 2015, the SEC proposed rules that would directdirects stock exchanges to require listed companies to implement clawback policies to recover incentive-based compensation from current or former executive officers in the event of certain financial restatements and would also requirerequires companies to disclose their clawback policies and their actions under those policies. Huntington continues to evaluate the proposed rules, both of which are subject to further rulemaking procedures.
Cybersecurity
The GLBA requires financial institutions to implement a comprehensive information security program that includes administrative, technical, and physical safeguards to ensure the security and confidentiality of customer records and information.
The CISA is intended to improve cybersecurity in the United StatesU.S. by enhanced sharing of information about security threats among the U.S. government and private sector entities, including financial institutions. The CISA also authorizes companies to monitor their own systems notwithstanding any other provision of law and allows companies to carry out defensive measures on their own systems from cyber-attacks. The law includes liability protections for companies that share cyber threatcyber-threat information with third parties so long as such sharing activity is conducted in accordance with CISA.
In October 2016, the federal bank regulatory agencies issued an ANPR regarding enhanced cyber risk management standards which would apply to a wide range of large financial institutions and their third-party service providers, including us and the Bank. The proposed rules would expand existing cybersecurity regulations and guidance to focus on cyber risk governance and management, management of internal and external dependencies, and incident response, cyber resilience, and situational awareness. In addition, the proposal contemplates more stringent standards for institutions with systems that are critical to the financial sector. The Federal Reserve announced in May 2019 that it would revisit the ANPR in the future.
In addition, in December 2020,effective April 1, 2022, the Federal Reserve, OCC and FDIC issued a notice of proposed rulemakingrule that, among other things, would requirerequires a banking organization to notify its primary federal regulatorsregulator within 36 hours after identifying a “computer-security incident” that the banking organization believes in good faith could materially
21 Huntington Bancshares Incorporated
disrupt, degrade or impair its business or operations in a manner that would, among other things, jeopardize the viability of its operations, result in customers being unable to access their deposit and other accounts, result in a material loss of revenue, profit or franchise value, or pose a threat to the financial stability of the United States.U.S.
Community Reinvestment Act
The CRA is intended to encourage banks to help meet the credit needs of their service areas, including low- and moderate-income neighborhoods, consistent with safe and soundness practices. The relevant federal bank regulatory agency, the OCC in the Bank’s case, examines each bank and assigns it a public CRA rating. A bank’s record of fair lending compliance is part of the resulting CRA examination report.
The CRA requires the relevant federal bank regulatory agency to consider a bank’s CRA assessment when considering the bank’s application to conduct certain mergers or acquisitions or to open or relocate a branch office. The Federal Reserve also must consider the CRA record of each subsidiary bank of a BHC in connection with any acquisition or merger application filed by the BHC. An unsatisfactory CRA record could substantially delay or result in the denial of an approval or application by Huntington or the Bank. The Bank received athe highest possible overall CRA rating of “Outstanding” in its most recent examination.
In May 2020,October 2023, the OCC finalized amendments to its CRA rules, which apply to national banks, including the Bank. The OCC’sU.S. banking agencies issued a final rule clarifies and expandsto amend their regulations implementing the types of activities that qualify for positiveCRA. The rule materially revises the current CRA consideration, updates how banks determineframework, including the assessment areas in which they area bank is evaluated establishes objective performance standardsto include activities associated with online and mobile banking, the tests used to evaluate CRA performancethe Bank in its assessment areas, new methods of calculating credit for lending, investment, and imposes more comprehensive CRA-relatedservice activities, and additional data collection and reporting requirements. The Bank must complyrule is expected to result in a significant increase in the thresholds for large banks to receive “Outstanding” ratings in the future. The rule is expected to take effect on April 1, 2024, with most of these amended requirements byits provisions becoming applicable on January 1, 2023.
The other federal banking agencies, the FDIC and Federal Reserve, are also in the process of proposing amendments to their respective CRA rules. While FDIC and Federal Reserve CRA rules do not apply to the Bank, future rulemaking to harmonize the CRA rules2026. Reporting of the three federal banking agencies could result in changes to CRA requirements applicable to national banks, including the Bank.collected data will not be required until 2027.
20 Huntington Bancshares Incorporated
Debit Interchange Fees
We are subject to a statutory requirement that interchange fees for electronic debit transactions that are paid to or charged by payment card issuers, including the Bank, be reasonable and proportional to the cost incurred by the issuer. Interchange fees for electronic debit transactions are limited to 21 cents plus 0.05% of the transaction, plus an additional one cent per transaction fraud adjustment. These fees impose requirements regarding routing and exclusivity of electronic debit transactions, and generally requiretransactions. On October 3, 2022, the Federal Reserve finalized a rule that amends Regulation II to, among other things, specify that debit cardscard issuers should enable all debit card transactions, including card-not-present transactions such as online payments, to be usable inprocessed on at least two unaffiliated payment card networks. The final rule became effective July 1, 2023. As an issuer with over $10 billion in assets, Huntington is subject to Regulation II and is in compliance with these new requirements.
In October 2023, the Federal Reserve released a notice of proposed rulemaking that would lower the maximum interchange fee that a large debit card issuer can receive on a debit card transaction. Under the proposal, the base component would initially decrease from 21.0 cents to 14.4 cents, the ad valorem component would decrease from 5.0 basis points to 4.0 basis points multiplied by the value of the transaction, and the fraud-prevention adjustment would increase from 1.0 cents to 1.3 cents for debit card transactions performed from the effective date of the final rule to June 30, 2025. In addition, the proposal would adopt an approach for future adjustments to the interchange fee cap, which would occur every other year based on issuer cost data gathered from large debit card issuers.
Consumer Protection Regulation and Supervision
We are subject to supervision and regulation by the CFPB with respect to federal consumer protection laws. We are also subject to certain state consumer protection laws, and under the Dodd-Frank Act, state attorneys general and other state officials are empowered to enforce certain federal consumer protection laws and regulations. State authorities have increased their focus on and enforcement of consumer protection rules. These federal and state consumer protection laws apply to a broad range of our activities and to various aspects of our business and include laws relating to interest rates, fair lending, disclosures of credit terms and estimated transaction costs to consumer borrowers, debt collection practices, the use of and the provision of information to consumer reporting agencies, and the prohibition of unfair, deceptive, or abusive acts or practices in connection with the offer, sale, or provision of consumer financial products and services.
In January 2024, the CFPB issued a notice of proposed rulemaking that would amend Regulation Z, which implements the Truth in Lending Act, to apply to overdraft credit provided by insured depository institutions with more than $10 billion in total assets unless the overdraft fee is restricted to a small amount that only recovers applicable costs and losses. Under the proposal, covered institutions, including the Bank, would be allowed to choose to offer overdrafts as a courtesy overdraft service or as a line of credit. If the courtesy overdraft option is chosen, overdrafts would remain exempt from Regulation Z, as long as fees charged are based on the higher of an institutions breakeven point derived from its own costs and losses, or a benchmark fee established by the CFPB. If the overdraft line of credit option is chosen, overdrafts would be considered a loan subject to Regulation Z, and therefore, subject to account opening and loan disclosures, required to be held in an account separate from the customer’s checking or transaction account, and may not be conditioned on preauthorized electronic funds transfers. If adopted, the proposal would go into effect on the October 1st that follows publication of the final rule in the Federal Register by at least six months. The CFPB has promulgated many mortgage-related final rules since it was established undercurrently expects the Dodd-Frank Act, including rules relatedeffective date to the ability to repay and qualified mortgage standards, mortgage servicing standards, loan originator compensation standards, high-cost mortgage requirements, HMDA requirements, and appraisal and escrow standards for higher priced mortgages. The mortgage-related final rules issued by the CFPB have materially restructured the origination, servicing, and securitization of residential mortgagesbe October 1, 2025. We are in the United States. These rules have impacted,process of evaluating this proposed rulemaking and will continue toassessing its potential impact on the business practices of mortgage lenders, includingCompany and the Company.
In January 2021, the OCC released a final rule that would require certain OCC-supervised banks to provide access to services, capital, and credit based on their risk assessment of individual customers, rather than broad-Bank if adopted as proposed.
ESG
ESG Oversight
With oversight from our Board of Directors, we are committed to implementing strong ESG practices by living out our Purpose of making people’s lives better, helping businesses thrive, and strengthening the communities we serve. The following represents how ESG is governed and integrated throughout the Company:
| | | | | | | | | | | | | | | | | | | | | | | | | | | | | | | | | | | | | | | | | |
| Board Nominating and ESG Committee | | | Board Risk Oversight Committee |
| | | | | | | | | | |
| Executive Leadership Team |
| | | | | | | | | | |
| Chief ESG Officer | | | Climate Risk Director |
| | | | | | | | | | | | | |
| | | | | | |
Chief ESG Officer and Strategy Team
Our Chief ESG Officer leads an ESG Strategy Team, responsible for (1) advancing enterprise ESG strategy and facilitating implementation of the strategy at the business levels; (2) ensuring consistent understanding of ESG strategy throughout the Company; (3) leading ESG regulatory compliance efforts; and (4) overseeing ESG goal setting, reporting, and monitoring. The team also works to identify ESG-related innovation and advancement opportunities aligned with strategic planning. This group includes executive leaders across business segments and support units. The Chief ESG Officer also coordinates an ESG Working Group comprised of a cross functional enterprise team that is responsible for publishing various ESG related disclosures, including our ESG and TCFD reports.
Climate Risk Director and Team
Our Climate Risk Director and climate risk management team are responsible for providing input into the identification, assessment, and monitoring of climate-related risks, including guidance and insight relative to areas of expertise by the members who represent business units across the Company. This team is also tasked with offering input into emissions calculations and climate scenario analyses to help identify and mitigate prospective risks.
Economic
We are committed to delivering sustainable, long-term shareholder value through financial performance, while maintaining an aggregate moderate-to-low, through-the-cycle risk appetite and a well-capitalized position. We align our corporate strategy to our purpose of helping others and building upon our market-leading, purpose-driven bank through focused efforts on the environmental and social issues most important to our business and our stakeholders.
In June 2021, we made a five-year $40 billion commitment toward our Community Plan to strengthen small businesses and foster economic justice throughout our footprint. Our Community Plan was developed to support communities by enabling and improving financial opportunities for people, businesses, and neighborhoods through commitments focusing on increasing lending, investing, and services to address economic, social, environmental, and racial equity areas of need as follows:
•Huntington committed to providing $24 billion in affordable housing financing and consumer lending. Through September 30, 2023, we have reached $13.6 billion of this commitment.
•Huntington expanded its Small Business lending programs into its acquired TCF footprint and committed $10 billion to the programs. Through September 30, 2023, we have reached $5.6 billion of this commitment.
•Huntington committed $6.5 billion in community development loans and investments to establish programs and services that foster equity in areas such as affordable housing, small business financing, and community services. Through September 30, 2023, we have reached $5.7 billion of this commitment.
•Embedded in the areas of need above is a $16 billion commitment for Diversity, Equity, and Inclusion initiatives, with allocation of funds to diverse borrowers and communities to advance systemic change. Through September 30, 2023, we have reached $10.2 billion of this commitment.
22 Huntington Bancshares Incorporated
based decisions affecting whole categories or classesHuntington has additionally developed a Lift Local Business® program, and made a commitment of $100 million, which supports entrepreneurs who have been historically under-resourced, particularly minority-, woman-, and veteran-owned small businesses throughout the business life cycle. This program offers loans, business planning support, free financial education courses delivered through Operation HOPE, and other services to help small business owners achieve their goals. Through October 31, 2023, we have reached $89 million of this commitment.
Environmental
Huntington supports environmental stewardship, reflecting our commitment to mitigating the effects of climate change, promoting biodiversity, and reducing our reliance on natural resources. Our path to a more sustainable future is guided by our environmental and climate strategies, preparing to comply with future regulatory and reporting requirements, transitioning to renewable sources of energy, improving our energy efficiency, and growing our renewable energy financing capabilities.
We report on our commitment and transparency in numerous ways. These include:
•Annual disclosures to CDP, a global initiative where we track and submit data annually toward managing our carbon footprint and certain other aspects of our environmental impact;
•Preparing an annual TCFD Report that discusses in detail our approach toward environmental and climate governance, strategy, risk management, and performance; and
•Working closely with shareholders and key ESG rating agencies to disclose details about our environmental programs.
In 2023, we published our second standalone TCFD Report on 2022 data; we established new Scope 1 and Scope 2 emissions reductions goals, building on the success of our prior emission reduction efforts; and we established new water consumption and landfill waste goals. We have made progress in achieving our use of 50% renewable energy goal, having executed two power purchase agreements. Consistent with our membership in the Partnership for Carbon Accounting Financials organization, we have disclosed the Scope 3, Category 15 emissions associated with our consumer automobile portfolio. Our Climate Risk team continues to work toward computing reliable, accurate estimates of other Scope 3, Category 15 portfolios.
Human Capital (Social)
Huntington aspires to be a Category of One financial services institution: an organization unique in the combination of its culture and performance. Huntington had 19,955 average full-time equivalent colleagues during 2023, whom we encourage to support a shared purpose of making our colleagues’ and customers’ lives better, helping businesses thrive, and strengthening the communities we serve. We believe that our diverse workforce, supported by a culture of inclusiveness, enriches the experience of colleagues, and enhances our ability to perform as a company.
We engage with our colleagues to gain valuable feedback on a wide range of subjects related to the experience of working at Huntington, with a strategic focus on culture, trust, and engagement. We value the feedback colleagues choose to share and use the information to drive our talent management strategy, which focuses on four key areas and a commitment to diversity, equity, and inclusion:
•Engagement
•Development
•Retention, and
•Attraction of top talent
Engagement
At Huntington, we have taken steps to ensure our values, beliefs, and behaviors align with those of our colleagues. We have highly engaged colleagues committed to looking out for each other and our customers with a balanced focus on “what we do” and “how we do it.” This synergy has proven to positively impact colleague performance and satisfaction. 2023 marked the tenth consecutive year we conducted a company-wide engagement survey to measure our colleagues’ experience with a strategic focus on culture, trust, and engagement – and the results were reaffirming. In 2023, 85%, 82%, and 84% of colleagues responded favorably on trust, culture, and engagement, respectively. These results place Huntington in the top quartile of favorability for Culture and Trust among our benchmark peer group. 81% of colleagues responded they would recommend Huntington as a great place to work.
The annual company-wide engagement survey is just one element of our continual colleague feedback program, which includes requiring banksquick colleague pulse, new hire, manager-specific, and exit surveys. These surveys enhance leader understanding of the colleague experience, position Huntington to make each financial servicerespond to colleague needs, and provide strong support to colleagues as they offer available to all personsdeliver performance in the geographic market served by them on proportionally equal terms. The rule is scheduledspirit of our Purpose and Values.
At Huntington, living our shared Purpose extends beyond our daily work. We believe that building connections between colleagues, their families and our communities create a meaningful, fulfilling, and enjoyable colleague experience. During 2023, Huntington colleagues provided almost 36,000 volunteer hours to over 1,300 organizations across our footprint, including foodbanks, homeless shelters, local schools, senior housing, and afterschool programs.
Development
We have created specialized programs to help our colleagues grow and develop. These programs include an online library which allows colleagues to take effect on April 1, 2021. However,ownership of their development via direct access to role-based content. The content is divided into three key areas of development: learning and growth, maximizing performance, and protecting the OCC announced that the next confirmed Comptrollercompany. All of the Currency will reviewprogramming offered includes diversity, equity, and inclusion content. During 2023, colleagues at Huntington completed more than 500,000 training hours. Huntington also provided a High-Potential Talent Development Program to top talent colleagues, so that they may further develop and accelerate their career growth. Additionally, we offer our full-time colleagues the final rule,ability to obtain post-secondary education with reimbursement of eligible tuition. In addition to these programs, Huntington has also launched a program to capture the skills of all colleagues and match colleagues to internal job opportunities based on those skills.
Retention
Huntington is committed to creating an environment where colleagues are valued, supported, and empowered. We offer competitive compensation and benefit programs that further strengthen our employment value proposition and encourages colleague retention. With respect to pay, Huntington offers a minimum hourly rate of $20 per hour and competitive wages at all levels of the organization. To ensure competitive pay, we regularly benchmark against the marketplace. Our compensation structure includes benefit plans and programs focused on multiple facets of well-being, including physical, mental, and financial wellness. We also offer Workplace Flex, a program of practices for colleagues, so that we can support them to achieve a healthy balance between work and life outside of work. The program includes certain practices that enable colleagues multiple paths to achieving balance, when available and appropriate, including: flexible scheduling (staggered hours, compressed workweeks, part-time schedules, and job-sharing), flexible work location (remote, hybrid, and on-site), and both health and financial wellness support beyond the basic medical/visual/dental programs (adoption and fertility, parental leave, on-site fitness and fitness discounts, mental health and financial counseling services, support for chronic conditions). Collectively, these practices are designed to position colleagues to be their best self both at work and outside of work.
Huntington’s commitment to pay equity works to ensure that gender, race, and ethnicity are not determining factors in salaries, bonuses, and stock-based awards. We continue to identify and implement effective practices to promote pay equity, including pay analyses, additional hiring practices that protect pay equity, and training managers on explicit and implicit bias in compensation and promotion decisions. Huntington conducts a pay equity analysis annually, evaluating pay for colleagues performing the same work, designed to ensure equity across races and genders.
24 Huntington Bancshares Incorporated
Collectively, these strategies create a colleague experience that entices colleagues to stay and fulfill their goals with Huntington.
Attraction of top talent
We are dedicated to attracting top talent with an emphasis on experience and behaviors that align with our Purpose and our core values of ‘Can Do Attitude, Forward Thinking, and Service Heart.’
The diversity of our colleagues is a key component of our success as an organization as it allows us to have a workforce that is representative of the communities we serve and is critical to our sustained success and growth. We proactively seek out a diverse candidate pool during the recruitment process across all levels. We are focused on identifying, supporting, and promoting qualified diverse candidates in leadership roles. As of December 31, 2023, our combined middle, senior, and executive management levels were 48% diverse and our total workforce was 67% diverse. For the purpose of reporting the aforementioned data, we acknowledge diverse individuals as those who are identified as women, or as being racially/ethnically diverse.
Our commitment to creating an inclusive, diverse environment involves embracing different skills, backgrounds, and perspectives, both in our communities and at work. Our DEI Strategy and Operating Plan encompasses four focus areas, workplace inclusion, workforce diversity, community engagement, and supplier diversity. We execute this strategy and operating plan in multiple ways. Our Chief Diversity, Equity and Inclusion Officer promotes DEI perspectives as an integral part of executive decisions made at Huntington by measuring and socializing progress on diversity across our footprint and providing diversity and inclusion programs to our colleagues. In addition, we have Inclusion Councils, Business Resource Groups, and Communities of Practice to support our commitment to engage, develop, retain, and attract top diverse talent. Inclusion Councils are voluntary, colleague driven regional and office-specific councils that focus on an inclusive, respectful, and supportive environment for all colleagues. The Business Resource Groups are voluntary, colleague-driven groups organized around a shared interest or common diversity dimension, each sponsored by a senior executive. The Communities of Practice are colleague-led, volunteer affinity groups which share information and experiences with fellow members. We believe that all of these are important components to our inclusion strategy and deliver content throughout the year.
Governance
Our Board of Directors and ELT are committed to executing on our long-term vision and aligning our strategic objectives with the interests of our stakeholders. Our Board members are accomplished leaders from diverse backgrounds, bringing the perspectives, skills, and experience necessary to use independent judgment to provide effective oversight and drive continued success. Our Board sets the strategy, risk appetite, and ethical standards for the entire organization, and our ELT ensures our business and enterprise functions operate with high legal, ethical, and moral standards through clearly stated policies and procedures. Additionally, our leaders set the tone at the top and oversee compliance with our standards and direct the company’s financial reporting and internal controls.
At the end of 2023, our Board consisted of 15 directors, comprised of our Chairman/President/CEO, our Huntington National Bank Chairman, and 13 independent directors. Our key risk and governance committees require at least three directors who are independent and are chaired by an independent director with the knowledge and expertise to lead the committee. Each year, the Board evaluates its future remains uncertain.leadership organization to ensure it is best structure to provide oversight of the Company and execute against our strategy objectives. As of December 31, 2023, our ELT and Board were 50% and 47% diverse, respectively.
Available Information
We are subject to the informational requirements of the Exchange Act and, in accordance with the Exchange Act, we file annual, quarterly, and current reports, proxy statements, and other information with the SEC. The SEC maintains an Internet web site that contains reports, proxy statements, and other information about issuers, like us, who file electronically with the SEC. The address of the site is http://www.sec.gov. The reports and other information, including any related amendments, filed by us with, or furnished by us to, the SEC are also available free of charge at our Internet web site as soon as reasonably practicable after such material is electronically filed with, or furnished to, the SEC. The address of the site is http://www.huntington.com. Except as specifically incorporated by reference into this Annual Report on Form 10-K, information on those web sites is not part of this report. You also should be able to inspect reports, proxy statements, and other information about us at the offices of the Nasdaq National Market at 33 Whitehall Street, New York, New York 10004.
2326 Huntington Bancshares Incorporated
Item 1A: Risk Factors
Risk Factor Summary
Our business is subject to numerous risks and uncertainties. While there is no assurance that any lists ofThe risks and uncertainties of risk factors is complete,listed below ispresent risks that could have a summary of risk factors whichmaterial impact our business. This summary should be read in conjunction with the “Detailed Discussion of Risk Pillars and Risk Factors” immediately following this summary on pages 25 through 43 in this 2020 Annual Report on Form 10-K. Risks which impact our business include but are not limited to:COVID-19 related Risk:
•The COVID-19 pandemic is adversely affecting, and will likely continue to adversely affect, our business,Huntington’s financial condition, liquidity, and results of operations.
Credit Risks:
•Our ACL level may prove to not be adequate or be negatively affected by credit risk exposures which could adversely affect our income and capital.
Market Risks:
•Changes in interest rates could reduce our net interest income, reduce transactional income, and negatively impact the value of our loans, securities, and other assets.This could have an adverse impact on our cash flows, financial condition, results of operations, or its business. Some of these risks and capital.
•Uncertainty aboutuncertainties are interrelated and the futureoccurrence of LIBORone or more of them may exacerbate the effect of others. The risks and uncertainties described below are not the only ones Huntington faces. Additional risks and uncertainties not presently known to Huntington or that Huntington believes to be immaterial may also adversely affect ourits business.
Liquidity Risks:
•Changes in either Huntington’s financial condition or Additionally refer to factors set forth under the caption “Forward-Looking Statements.” For more information on how we manage risks, see discussion in the general banking industry could result in a loss of depositor confidence.
•“If we lose access to capital markets, we may not be able to meet the cash flow requirementsRisk Governance” section of our depositors, creditors, and borrowers, or have the operating cash needed to fund corporate expansion and other corporate activities.Operational Risks:
•Our operational or security systems or infrastructure, or those of third parties, could fail or be breached, which could disrupt our business and adversely impact our operations, liquidity, and financial condition, as well as cause legal or reputational harm.
•We face security risks, including denial of service attacks, hacking, social engineering attacks targeting our colleagues and customers, malware intrusion or data corruption attempts, and identity theft that could result in the disclosure of confidential information, adversely affect our business or reputation, and create significant legal and financial exposure.
•Failure to maintain effective internal controls over financial reporting could impair our ability to accurately and timely report our financial results or prevent fraud, resulting in loss of investor confidence and adversely affecting our business and our stock price.
Compliance Risks:
•We operate in a highly regulated industry, and the laws and regulations that govern our operations, corporate governance, executive compensation and financial accounting, or reporting, including changes in them, or our failure to comply with them, may adversely affect us.
•Legislative and regulatory actions taken now or in the future that impact the financial industry may materially adversely affect us by increasing our costs, adding complexity in doing business, impeding the efficiency of our internal business processes, negatively impacting the recoverability of certain of our recorded assets, requiring us to increase our regulatory capital, limiting our ability to pursue business opportunities, and otherwise resulting in a material adverse impact on our financial condition, results of operation, liquidity, or stock price.
•Noncompliance with the Bank Secrecy Act and other anti-money laundering statutes and regulations could cause us material financial loss
Strategic Risks:
•We operate in a highly competitive industry which depends on our ability to successfully execute our strategic plan and adapt our products and services to evolving industry standards and consumer preferences.
•Bank regulations regarding capital and liquidity, including the CCAR assessment process and the U.S. Basel III capital and liquidity standards, could require higher levels of capital and liquidity. Among other things, these regulations could impact our ability to pay common stock dividends, repurchase common stock, attract cost-effective sources of deposits, or require the retention of higher amounts of low yielding securities.
Risks related to the TCF Merger:
•We are expected to incur substantial costs related to the Merger and integration.
•Combining Huntington and TCF may be more difficult, costly or time consuming than expected and Huntington and TCF may fail to realize the anticipated benefits of the Merger.
•Huntington will be subject to business uncertainties and contractual restrictions while the Merger is pending.
Detailed Discussion of Risk Pillars and Risk Factors
Huntington has formalized a holistic risk governance framework in alignment with the size, complexity, and profile of the Company. We, like other financial companies, are subject to a number of risks that may adversely affect our financial condition or results of operations, many of which are outside of our direct control. Our framework is approved by the ROC of Huntington’s Board of Directors (the Board). Key components include establishing our risk appetite, lines of defense and risk pillars, governance and committee oversight and limit setting and escalation processes. Huntington classifies/aggregates risk into seven risk pillars. Huntington recognizes that risks can be interrelated or embedded within each other, and therefore managing across risk pillars is a key component of the framework. The following defines the Company’s risk pillars.
•Credit risk, which is the risk of loss due to loan and lease customers or other counterparties not being able to meet their financial obligations under agreed upon terms;
•Market risk, which occurs when fluctuations in interest rates impact earnings and capital. Financial impacts are realized through changes in the interest rates of balance sheet assets and liabilities (net interest margin) or directly through valuation changes of capitalized MSR and/or trading assets (noninterest income);
•Liquidity risk, which is the risk to current or anticipated earnings or capital arising from an inability to meet obligations when they come due. Liquidity risk includes the inability to access funding sources or manage fluctuations in funding levels. Liquidity risk also results from the failure to recognize or address changes in market conditions that affect our ability to liquidate assets quickly and with minimal loss in value;
•Operational risk, which is the risk of loss arising from inadequate or failed internal processes or systems, including information security breaches or cyberattacks, human errors or misconduct, or adverse external events. Operational losses result from internal fraud, external fraud, inadequate or inappropriate employment practices and workplace safety, failure to meet professional obligations involving customers, products, and business practices, damage to physical assets, business disruption and systems failures, and failures in execution, delivery, and process management;
•Compliance risk, which exposes us to money penalties, enforcement actions, or other sanctions as a result of non-conformance with laws, rules, and regulations that apply to the financial services industry;
•Strategic risk, which is defined as risk to current or anticipated earnings, capital, or enterprise value arising from adverse business decisions, improper implementation of business decisions or lack of responsiveness to industry / market changes; and
25 Huntington Bancshares Incorporated
•Reputation risk, which is the risk that negative publicity regarding an institution’s business practices, whether true or not, will cause a decline in the customer base, costly litigation, or revenue reductions.MD&A.
In addition to the other information included or incorporated by reference into this report, readers should carefully consider that the following important factors, among others, could negatively impact our business, future results of operations, and future cash flows materially.
COVID-19 related Risk:
The COVID-19 pandemic is adversely affecting, and will likely continue to adversely affect, our business, financial condition, liquidity, and results of operations.
The COVID-19 pandemic has negatively impacted the U.S. and global economy; disrupted U.S. and global supply chains; created significant volatility and disruption in financial markets; contributed to a decrease in the rates and yields on U.S. Treasury securities; resulted in ratings downgrades, credit deterioration, and defaults in many industries; increased demands on capital and liquidity; and increased unemployment levels and decreased consumer confidence. In addition, the pandemic has resulted in temporary closures of many businesses and the institution of social distancing and sheltering in place requirements in many states and communities, including those in our footprint. The pandemic has caused us, and could continue to cause us, to recognize credit losses in our loan portfolios and increases in our allowance for credit losses. Furthermore, the pandemic could cause us to recognize impairment of our goodwill and our financial assets. Sustained adverse effects may also increase our cost of capital, prevent us from satisfying our minimum regulatory capital ratios and other supervisory requirements, or result in downgrades in our credit ratings. The extent to which the COVID-19 pandemic impacts our business, financial condition, liquidity, and results of operations will depend on future developments, which are highly uncertain and cannot be predicted, including the scope and duration of the pandemic, the continued effectiveness of our business continuity plan, the direct and indirect impact of the pandemic on our customers, colleagues, counterparties and service providers, and actions taken by governmental authorities and other third parties in response to the pandemic.
Governmental authorities have taken significant measures to provide economic assistance to individual households and businesses, stabilize the markets, and support economic growth. The success of these measures is unknown, and they may not be sufficient to fully mitigate the negative impact of the pandemic. Additionally, some measures, such as a suspension of consumer and commercial loan payments and the reduction in interest rates to near zero, may have a negative impact on our business, financial condition, liquidity, and results of operations. We also face an increased risk of litigation and governmental and regulatory scrutiny as a result of the effects of the pandemic on market and economic conditions and actions governmental authorities take in response to those conditions.
The COVID-19 pandemic has resulted in heightened operational risks. Many of our colleagues have been working remotely, and increased levels of remote access create additional cybersecurity risk and opportunities for cybercriminals to exploit vulnerabilities. Cybercriminals may increase their attempts to compromise business emails, including an increase in phishing attempts, and fraudulent vendors or other parties may view the pandemic as an opportunity to prey upon consumers and businesses during this time.The increase in online and remote banking activities may also increase the risk of fraud in certain instances.
The length of the pandemic and the effectiveness of the measures being put in place to address it are unknown. Until the effects of the pandemic subside, we expect continued draws on lines of credit, reduced revenues in our businesses, and increased customer defaults. Furthermore, the U.S. economy is experiencing a recession as a result of the pandemic, and our business could be materially and adversely affected by a prolonged recession. To the extent the pandemic adversely affects our business, financial condition, liquidity, or results of operations, it may also have the effect of heightening many of the other risks described in this 2020 Annual Report on Form 10-K.
We have also participated as a lender in certain government programs designed to provide economic relief in response to the pandemic. We are participating in the SBA’s PPP as an eligible lender, and while these loans to small business clients benefit from a government guaranty, many of these businesses may face difficulties even after being granted such a loan. We also participated in the Federal Reserve’s Main Street Lending Program. As a result of participating in these programs, we face increased risks, including credit, fraud risk and litigation.
Credit Risks:
Our ACL level may prove to not be adequate or be negatively affected by credit risk exposures which could adversely affect our net income and capital.
Effective January 1, 2020, Huntington adopted ASU 2016-13 Financial Instruments - Credit Losses (ASC Topic 326): Measurement of Credit Losses on Financial Instruments. Upon adoption of ASU 2016-13, Huntington implemented new credit loss models within our loan and lease portfolio which incorporated historical loss experience, as well as current and future economic conditions over a reasonable and supportable period beyond the balance sheet date. The models materially affected how we determine our ACL and report our financial condition and results of operations. For further discussion, see Note 2 “Accounting Standards Update” of the Notes to Consolidated Financial Statements.Our business depends on the creditworthiness of our customers. Our ACL of $1.9$2.4 billion at December 31, 2020,2023, represented management’s estimate of the current expected losses in our loan and lease portfolio (ALLL) as well as our unfunded loanlending commitments and letters of credit (AULC). We regularly review our ACL for appropriateness. In doing so, we consider probability of default, loss given default, and exposure at default depending on economic parameters for each month of the remaining contractual term of the credit exposure. The economic parameters are developed using available information relating to past events, current conditions, and reasonable and supportable forecasts. There is no certainty that our ACL will be appropriate over time to cover lifetime losses of the portfolio because of unanticipated adverse changes in the economy, market conditions, or events adversely affecting specific customers, industries, or markets. If the credit quality of our customer base materially decreases, if the risk profile of a market, industry, or group of customers changes materially, or if the ACL is not appropriate, our net income and capital could be materially adversely affected, which could have a material adverse effect on our financial condition and results of operations.
In addition, regulatory review of risk ratings and loan and lease losses may impact the level of the ACL and could have a material adverse effect on our financial condition and results of operations.
Weakness in economic conditions could adversely affect our business.
Continued economic uncertainty and a recessionary or stagnant economy could adversely affect our business, financial condition, and results of operations. Our performance could be negatively affected to the extent there is deterioration in business and economic conditions, including persistent inflation, rising interest rates, supply chain issues or labor shortages, which have direct or indirect material adverse impacts on us, our customers, and our counterparties. These conditions could result in one or more of the following:
•A decrease in the demand for loans and other products and services offered by us;
•A decrease in customer savings generally, and in the demand for savings and investment products offered by us; and
•An increase in the number of customers and counterparties who become delinquent, file for protection under bankruptcy laws, or default on their loans or other obligations to us.us; and
•An increase in the number of delinquencies, bankruptcies, or defaults could result in a higher level of NPAs, NCOs, provision for credit losses, and valuation adjustments on loans held for sale.
The markets we serve are dependent on industrial and manufacturing businesses and, thus, are particularly vulnerable to adverse changes in economic conditions affecting these sectors.
A U.S. government debt default would have a material adverse impact on our business and financial performance, including a decrease in the value of Treasury bonds and other government securities held by us, which could negatively impact the Bank’s capital position and its ability to meet regulatory requirements. Other negative impacts of a U.S. government debt default, budget deficit concerns, government shutdown, or related credit ratings downgrades could include volatile capital markets, an adverse impact on the U.S. economy and the U.S. dollar, as well as increased default rates among borrowers in light of increased economic uncertainty. Some of these impacts might occur even in the absence of an actual default or government shutdown as a consequence of extended political negotiations around the threat of such a default or government shutdown.
Market Risks:
Changes in interest rates could reduce our net interest income, reduce transactional income, and negatively impact the value of our loans, securities, and other assets. This could have an adverse impact on our cash flows, financial condition, results of operations, and capital.
Our results of operations depend substantially on net interest income, which is the difference between interest earned on interest earning assets (such as investments and loans) and interest paid on interest bearing liabilities (such as deposits and borrowings). Interest rates are highly sensitive to many factors, including governmental monetary policies, inflation, and domestic and international economic and political conditions. Conditions such as inflation, deflation, recession, unemployment, money supply, and other factors beyond our control may also affect interest rates. In addition, decisions by the Federal Reserve to increaseReserve’s monetary policies, including changes in the federal funds rate and increasing or reducereducing the size of its balance sheet, may also affect
27 Huntington Bancshares Incorporated
interest rates. If our interest earning assets mature or reprice faster than interest bearing liabilities in a declining interest rate environment, net interest income could be materially adversely impacted. Likewise, if interest bearing liabilities mature or reprice more quickly than interest earning assets in a rising interest rate environment, net interest income could be adversely impacted.
Changes in interest rates can affect the value of loans, securities, assets under management, and other assets, including mortgage servicing rights. An increase in interest rates that adversely affects the ability of borrowers to pay the principal or interest on loans and leases may lead to an increase in NPAs and a reduction of income recognized, which could have a material adverse effect on our results of operations and cash flows. When we place a loan on nonaccrual status, we reverse any accrued but unpaid interest receivable, which decreases interest income. However, we continue to incur interest expense as a cost of funding NALs without any corresponding interest income. In addition, transactional income, including trust income, brokerage income, and gain on sales of loans can vary significantly from period-to-period based on a number of factors, including the interest rate environment. A decline in interest rates along with a flattening yield curve limits our ability to reprice deposits given the current historically low level of interest rates and could result in declining net interest margins if longer duration assets reprice faster than deposits.
Rising interest rates reduce the value of our fixed-rate securities. Any unrealized loss from these portfolios impacts OCI, shareholders’ equity, and the Tangible Common Equity ratio. Any realized loss from these portfolios impacts regulatory capital ratios. In a rising interest rate environment, pension and other post-retirement obligations somewhat mitigate negative OCI impacts from securities and financial instruments. For more information, refer to “Market Risk”“Market Risk” section of the MD&A. Certain investment securities, notably mortgage-backed securities, are sensitive to rising and falling rates. Generally, when rates rise, prepayments of principal and interest will decrease, and the duration of mortgage-backed securities will increase. Conversely, when rates fall, prepayments of principal and interest will increase, and the duration of mortgage-backed securities will decrease. In either case, interest rates have a significant impact on the value of mortgage-backed securities.
MSR fair values are sensitive to movements in interest rates, as expected future net servicing income depends on the projected outstanding principal balances of the underlying loans, which can be reduced by prepayments. Prepayments usually increase when mortgage interest rates decline and decrease when mortgage interest rates rise.
In response to the economic consequences of the COVID-19 pandemic, the Federal Reserve lowered its target for the federal funds rate to a range of 0% to 0.25%. Such low rates increase the risk in the U.S. of a negative interest rate environment in which interest rates drop below zero, either broadly or for some types of instruments. For example, yields on one-month and three-month Treasuries briefly dropped below zero in March 2020. Such an occurrence would likely further reduce the interest we earn on loans and other earning assets, while also likely requiring us to pay more to maintain our deposits with the Federal Reserve Bank. Although, we have evaluated our systems and have made appropriate changes, our systems may not be able to adequately handle a negative interest rate environment and not all variable rate instruments are designed for such a circumstance. We cannot predict the nature or timing of future changes in monetary policies in response to the outbreak or the precise effects that they may have on our activities and financial results.
In addition to volatility associated with interest rates, the Company also has exposure to equity markets related to the investments within the benefit plans and other income from client-based transactions.
28 Huntington Bancshares Incorporated
Inflation could negatively impact our business, our profitability, and our stock price.
Prolonged periods of inflation may impact our profitability by negatively impacting our fixed costs and expenses, including increasing funding costs and expense related to talent acquisition and retention. Additionally, inflation may lead to a decrease in consumer and clients’ purchasing power and negatively affect the need or demand for our products and services. If significant inflation continues, our business could be negatively affected by, among other things, increased default rates leading to credit losses which could decrease our appetite for new credit extensions. These inflationary pressures could result in missed earnings and budgetary projections causing our stock price to suffer.
Industry competition may have an adverse effect on our success.
Our profitability depends on our ability to compete successfully. We operate in a highly competitive environment, and we expect competition to intensify. Certain of our competitors are larger and have more resources than we do, enabling them to be more aggressive than us in competing for loans and deposits. In our market areas, we face competition from other banks and financial service companies that offer similar services. Some of our non-bank competitors are not subject to the same extensive regulations we are and, therefore, may have greater flexibility in competing for business. Technological advances have made it possible for our non-bank competitors to offer products and services that traditionally were banking products and for financial institutions and other companies to provide electronic and internet-based financial solutions, including mobile payments, online deposit accounts, electronic payment processing, and marketplace lending, without having a physical presence
where their customers are located. Legislative or regulatory changes also could lead to increased competition in the financial services sector. For example, the Economic Growth Act and the Tailoring Rules reduce the regulatory burden of certain large BHCs and raise the asset thresholds at which more onerous requirements apply, which could cause certain large BHCs to become more competitive or to more aggressively pursue expansion. Our ability to compete successfully depends on a number of factors, including customer convenience, quality of service by investing in new products and services, electronic platforms, personal contacts, pricing, and range of products. If we are unable to successfully compete for new customers and retain our current customers, our business, financial condition, or results of operations may be adversely affected. In particular, if we experience an outflow of deposits as a result of our customers seeking investments with higher yields or greater financial stability, or a desire to do business with our competitors, we may be forced to rely more heavily on borrowings and other sources of funding to operate our business and meet withdrawal demands, thereby adversely affecting our net interest margin. For more information, refer to
“Competition”“Competition” section of Item 1: Business.Uncertainty about the future of LIBOR may adversely affect our business.
LIBOR and certain other interest rate “benchmarks” are the subject of recent national, international, and other regulatory guidance and proposals for reform. These reforms may cause such benchmarks to perform differently than in the past or have other consequences which cannot be predicted. On November 30, 2020, theICE Benchmark Administration, the administrator of LIBOR, announced it will consult on its intention to cease the publication of one-week and two-month tenors of USD LIBOR after December 31, 2021, while all remaining tenors of USD LIBOR would continue to be published until June 30, 2023. Therefore, it is expected that publication of all USD LIBORs will cease to exist after June 30, 2023. In parallel, the Federal Reserve, OCC and FDIC issued guidance encouraging banks to transition away from USD LIBOR as soon as practicable. The statement suggested that banks should not enter into new transactions referencing USD LIBOR after December 31, 2021.
While there is no consensus on what rate or rates may become accepted alternatives to LIBOR, a group of market participants convened by the Federal Reserve, the Alternative Reference Rate Committee (ARRC), has selected SOFR as its recommended alternative to LIBOR. The Federal Reserve Bank of New York started to publish SOFR in April 2018. SOFR is a broad measure of the cost of overnight borrowings collateralized by Treasury securities that was selected by the Alternative Reference Rate Committee due to the depth and robustness of the U.S. Treasury repurchase market. At this time, it is impossible to predict whether SOFR will become an accepted alternative to LIBOR. In January of 2020, Huntington was added as an ARRC member.
The market transition away from LIBOR to an alternative reference rate, such as SOFR, is complex and could have a range of adverse effects on our business, financial condition and results of operations. In particular, any such transition could:
•Adversely affect the interest rates paid or received on, the revenue and expenses associated with or the value of Huntington’s LIBOR-based assets and liabilities, which include certain variable rate loans, Huntington’s Series B preferred stock, certain of Huntington’s junior subordinated debentures, certain of the Bank’s senior notes and certain other securities or financial arrangements;
•Adversely affect the interest rates paid or received on, the revenue and expenses associated with or the value of other securities or financial arrangements, given LIBOR’s role in determining market interest rates globally;
•Prompt inquiries or other actions from regulators in respect of Huntington’s preparation and readiness for the replacement of LIBOR with an alternative reference rate; and
•Result in disputes, litigation or other actions with counterparties regarding the interpretation and enforceability of certain fallback language in LIBOR-based contracts and securities.
The transition away from LIBOR to an alternative reference rate will require the transition to or development of appropriate systems and analytics to effectively transition Huntington’s risk management and other processes from LIBOR-based products to those based on the applicable alternative reference rate, such as SOFR. Huntington has developed a LIBOR transition team and project plan that outlines timelines and priorities to prepare its processes, systems and people to support this transition. Timelines and priorities include assessing the impact on our customers, as well as assessing system requirements for operational processes. There can be no guarantee that these efforts will successfully mitigate the operational risks associated with the transition away from LIBOR to an alternative reference rate.
29 Huntington Bancshares Incorporated
The manner and impact of the transition from LIBOR to an alternative reference rate, as well as the effect of these developments on our funding costs, loan and investment and trading securities portfolios, asset-liability management, and business, is uncertain.
Liquidity Risks:
Changes in either Huntington’s financial condition or in the general banking industry, or changes in interest rates, could result in a loss of depositor confidence.
Liquidity is the ability to meet cash flow needs on a timely basis at a reasonable cost. The Bank uses its liquidity to extend credit and to repay liabilities as they become due or as demanded by customers.
Our primary source of liquidity is our large supply of deposits from consumer and commercial customers. The continued availability of this supply depends on customer willingness to maintain deposit balances with banks in general, and us in particular. The availability of deposits can also be impacted by regulatory changes (e.g., changes in FDIC insurance, liquidity requirements, etc.), changes in the financial condition of Huntington, other banks, or the banking industry in general, changes in the interest rates our competitors pay on their deposits, and other events which can impact the perceived safety or economic benefits of bank deposits. While we make significant efforts to consider and plan for hypothetical disruptions in our deposit funding, market related,market-related, geopolitical, or other events could impact the liquidity derived from deposits.
We are a holding company and depend on dividends by our subsidiaries for most of our funds.
Huntington is an entity separate and distinct from the Bank. The Bank conducts most of our operations, and Huntington depends upon dividends from the Bank to service Huntington’s debt and to pay dividends to Huntington’s shareholders. The availability of dividends from the Bank is limited by various statutes and regulations. It is possible, depending upon the financial condition including liquidity and capital adequacy of the Bank and other factors, that the OCC could limit the payment of dividends or other payments to Huntington by the Bank. In addition, the payment of dividends by our other subsidiaries is also subject to the laws of the subsidiary’s state of incorporation, and regulatory capital and liquidity requirements applicable to such subsidiaries. In the event that the Bank was unable to pay dividends to us, we in turn would likely have to reduce or stop paying dividends on our Preferred and Common Stock. Our failure to pay dividends on our Preferred and Common Stock could have a material adverse effect on the market price of our Preferred and Common Stock. Additional information regarding dividend restrictions is provided in Item 1: Business - “Regulatory Matters.” If we lose access to capital markets, we may not be able to meet the cash flow requirements of our depositors, creditors, and borrowers, or have the operating cash needed to fund corporate expansion and other corporate activities.
Wholesale funding sources can include securitization, federal funds purchased, securities sold under repurchase agreements, non-core deposits, and long-term debt. The Bank is also a member of the FHLB, which provides members access to funding through advances collateralized with mortgage-related assets. We maintain a portfolio of highly-rated, marketable securities that is available as a source of liquidity.
Capital markets disruptions can directly impact the liquidity of Huntington and the Bank. The inability to access capital markets funding sources as needed could adversely impact our financial condition, results of operations, cash flows, and level of regulatory-qualifying capital. We may, from time-to-time, consider using our existing liquidity position to opportunistically retire outstanding securities in privately negotiated or open market transactions.
Huntington and the Bank. Our ability to access the capital markets, if needed, will depend on a number of factors, including the state of the financial markets. Rising interest rates, disruptions in financial markets, negative perceptions of our business or our financial strength, negative perceptions of the overall banking industry or of other regional banks, or other factors may impact our ability to raise additional capital, if needed, on terms acceptable to us. For example, in the event of future turmoil in the banking industry or other idiosyncratic events, there is no guarantee that the U.S. government will invoke the systemic risk exception, create additional liquidity programs, or take any other action to stabilize the banking industry or provide liquidity. Any diminished ability to access short-term funding or capital markets to raise additional capital, if needed, could subject us to liability, restrict our ability to grow, require us to take actions that would affect our earnings negatively or otherwise adversely affect our business and our ability to implement our business plan, capital plan and strategic goals. A reduction in our credit rating could adversely affect our access to capital and could increase our cost of funds.
The credit rating agencies regularly evaluate Huntington and the Bank, and credit ratings are based on a number of factors, including our financial strength and ability to generate earnings, as well as factors not entirely within our control, including conditions affecting the financial services industry, the economy, and changes in rating methodologies. There can be no assurance that we will maintain our current credit ratings. A downgrade of the credit ratings of Huntington or the Bank could adversely affect our access to liquidity and capital, and could significantly increase our cost of funds, trigger additional collateral or funding requirements, and decrease the number of investors and counterparties willing to lend to us or purchase our securities. This could affect our growth, profitability, and financial condition, including liquidity.
30 Huntington Bancshares Incorporated
Instability in global economic conditions and geopolitical matters, as well as volatility in financial markets, could have a material adverse effect on our results of operations and financial condition.
Instability in global economic conditions and geopolitical matters, as well as volatility in financial markets, could have a material adverse effect on our results of operations and financial condition. The macroeconomic environment in the U.S. is susceptible to global events and volatility in financial markets. For example, global conflicts (including the continuing conflicts involving Ukraine and the Russian Federation and those in the Middle East) or other similar events, as well as government actions of other restrictions in connection with such events, and trade negotiations between the U.S. and other nations could adversely impact economic and market conditions for the Company and its clients and counterparties. In addition, global supply chain disruptions may cause prolonged inflation, adversely impact consumer and business confidence, and adversely affect the economy as well as our financial condition and results.
Operational Risks:
Our operational or security systems or infrastructure, or those of third parties, could fail or be breached, which could disrupt our business and adversely impact our operations, liquidity, and financial condition, as well as cause legal or reputational harm.
The potential for operational risk exposure exists throughout our business and, as a result of our interactions with, and reliance on, third parties, is not limited to our own internal operational functions. Our operational and security systems and infrastructure, including our computer systems, data management, and internal processes, as well as those of third parties, are integral to our performance. We rely on our employees and third parties in our day-to-day and ongoing operations, who may, as a result of human error, misconduct, malfeasance, failure, or breach of our or of third-party systems or infrastructure, expose us to risk. For example, our ability to conduct business may be adversely affected by any significant disruptions to us or to third parties with whom we interact or upon whom we rely. Our financial, accounting, data processing, backup, or other operating or security systems and infrastructure may fail to operate properly or become disabled or damaged as a result of a number of factors, including events that are wholly or partially beyond our control, which could adversely affect our ability to process transactions or provide services. Such events may include: sudden increases in customer transaction volume; electrical, telecommunications, or other major physical infrastructure outages; disease pandemics; cyber-attacks; and events arising from local or larger scale political or social matters, including wars and terrorist attacks. Additional events beyond our control that could impact our business directly or indirectly include natural disasters such as earthquakes and weather events, including tornadoes, hurricanes, and floods. Neither the occurrence nor the potential impact of these events can be predicted, and the frequency and severity of weather events may be impacted by climate changes. In addition, we may need to take our systems off-line if they become infected with malware or a computer virus or as a result of another form of cyber-attack. In the event that backup systems are utilized, they may not process data as quickly as our primary systems and some data might not have been saved to backup systems, potentially resulting in a temporary or permanent loss of such data. In addition, our ability to implement backup systems and other safeguards with respect to third-party systems is more limited than with respect to our own systems. We frequently update our systems to support our operations and growth and to remain compliant with applicable laws, rules, and regulations. This updating entails significant costs and creates risks associated with implementing new systems and integrating them with existing ones, including business interruptions. Implementation and testing of controls related to our computer systems, security monitoring, and retaining and training personnel required to operate our systems also entail significant costs. Operational risk exposures could adversely impact our operations, liquidity, and financial condition, as well as cause reputational harm. In addition, we may not have adequate insurance coverage to compensate for losses from a major interruption.
312023 Form 10-K Huntington Bancshares Incorporated31
We face security risks, including denial of service attacks, hacking, social engineering attacks targeting our colleagues and customers, malware intrusion or data corruption attempts, and identity theft that could result in the disclosure of confidential information, adversely affect our business or reputation, and create significant legal and financial exposure.
Our computer systems and network infrastructure and those of third parties, on which we are highly dependent, are subject to security risks and could be susceptible to cyber-attacks, such as denial of service attacks, hacking, terrorist activities, or identity theft. Our business relies on the secure processing, transmission, storage, and retrieval of confidential, proprietary, and other information in our computer and data management systems and networks, and in the computer and data management systems and networks of third parties. In addition, to access our network, products, and services, our customers and other third parties may use personal mobile devices or computing devices that are outside of our network environment and are subject to their own cybersecurity risks.
We, our customers, regulators, and other third parties, including other financial services institutions and companies engaged in data processing, have been subject to, and are likely to continue to be the target of, cyber-attacks. These cyber-attacks include computer viruses, malicious or destructive code, phishing attacks, denial of service or information, ransomware, improper access by employees or vendors, attacks on personal email of employees, ransom demands to not expose security vulnerabilities in our systems or the systems of third parties or other security breaches that could result in the unauthorized release, gathering, monitoring, misuse, loss, or destruction of confidential, proprietary, and other information of ours, our employees, our customers, or of third parties, damage our systems or otherwise materially disrupt our or our customers’ or other third parties’ network access or business operations. As cyber-threats continue to evolve, we may be required to expend significant additional resources to continue to modify or enhance our protective measures or to investigate and remediate any information security vulnerabilities or incidents. Despite efforts to ensure the integrity of our systems and implement controls, processes, policies, and other protective measures, we may not be able to anticipate all security breaches, nor may we be able to implement sufficient preventive measures against such security breaches, which may result in material losses or consequences for us.
Cybersecurity risks for banking organizations have significantly increased in recent years in part because of the proliferation of new technologies, and the use of the internet and telecommunications technologies to conduct financial transactions. For example, cybersecurity risks may increase in the future as we continue to increase our mobile-payment and other internet-based product offerings and expand our internal usage of web-based products and applications. In addition, cybersecurity risks have significantly increased in recent years in part due to the increased sophistication and activities of organized crime affiliates, terrorist organizations, hostile foreign governments, disgruntled employees or vendors, activists, and other external parties, including those involved in corporate espionage. Even the most advanced internal control environment may be vulnerable to compromise. Due to increasing geopolitical tensions, nation state cyber attackscyber-attacks and ransomware are both increasing in sophistication and prevalence. Targeted social engineering and email attacks (i.e., “spear phishing” attacks) are becoming more sophisticated and are extremely difficult to prevent. In such an attack, an attacker will attempt to fraudulently induce colleagues, customers, or other users of our systems to disclose sensitive information in order to gain access to itsour data or that of itsour clients. Persistent attackers may succeed in penetrating defenses given enough resources, time, and motive. The techniques used by cyber criminals change frequently, may not be recognized until launched, and may not be recognized until well after a breach has occurred. The speed at which new vulnerabilities are discovered and exploited often before security patches are published continues to rise. Remote work further increases the risk that we may experience cyber incidents as a result of our employees, vendors, and other third parties with which we interact working remotely on less secure systems and environments.
32 Huntington Bancshares Incorporated
The risk of a security breach caused by a cyber-attack at a vendor or by unauthorized vendor access has also increased in recent years. Additionally, the existence of cyber-attacks or security breaches at third-party vendors with access to our data may not be disclosed to us in a timely manner. Further, our ability to monitor our vendors’ cybersecurity practices is limited. Although we generally have agreements relating to cybersecurity and data privacy in place with our vendors, we cannot guarantee that such agreements will prevent a cyber-incident impacting our systems or information or enable us to obtain adequate or any reimbursement from our service providers in the event we should suffer any such incidents. Due to applicable laws and regulations or contractual obligations, we may be held responsible for cyber-incidents attributed to our vendors as they relate to the information we share with them.
We also face indirect technology, cybersecurity, and operational risks relating to the customers, clients, and other third parties with whom we do business or upon whom we rely to facilitate or enable our business activities, including, for example, financial counterparties, regulators, and providers of critical infrastructure such as internet access and electrical power. As a result of increasing consolidation, interdependence, and complexity of financial entities and technology systems, a technology failure, cyber-attack, or other information or security breach that significantly degrades, deletes, or compromises the systems or data of one or more financial entities could have a material impact on counterparties or other market participants, including us. This consolidation, interconnectivity,
and complexity increases the risk of operational failure, on both individual and industry-wide bases, as disparate systems need to be integrated, often on an accelerated basis.failure. Any third-party technology failure, cyber-attack, or other information or security breach, termination, or constraint could, among other things, adversely affect our ability to effect transactions, service our clients, manage our exposure to risk, or expand our business.
Cyber-attacks or other information or security breaches, whether directed at us or third parties, may result in a material loss or have material consequences. Furthermore, the public perception that a cyber-attack on our systems has been successful, whether or not this perception is correct, may damage our reputation with customers and third parties with whom we do business. Hacking of personal information and identity theft risks, in particular, could cause serious reputational harm. A successful penetration or circumvention of system security could cause us serious negative consequences, including ourincluding: loss of customers and business opportunities,opportunities; costs associated with maintaining business relationships after an attack or breach; significant business disruption to our operations and business, misappropriation, exposure, or destruction of our confidential information, intellectual property, funds, and/or those of our customers; or damage to our or our customers’ and/or third parties’ computers or systems, andsystems. The occurrence of any of these events could result in a violation of applicable privacy laws and other laws, litigation exposure, regulatory fines, penalties or intervention, loss of confidence in our security measures, reputational damage, reimbursement or other compensatory costs, additional compliance costs, and could adversely impact our results of operations, liquidity and financial condition. In addition, we may not have adequate insurance coverage to compensate for losses from a cybersecurity event.
For more information regarding the Company’s process for assessing, identifying, and managing material risks from cybersecurity threats, refer to Item 1C: Cybersecurity. Cybersecurity and data privacy are areas of heightened legislative and regulatory focus.
As cybersecurity and data privacy risks for banking organizations and the broader financial system have significantly increased in recent years, cybersecurity and data privacy issues have become the subject of increasing legislative and regulatory focus. The federal bank regulatory agencies have proposed regulations that would enhance cyber risk management standards, which would apply to a wide range of large financial institutions and their third-party service providers, including us and the Bank, and would focus on cyber risk governance and management, management of internal and external dependencies, and incident response, cyber resilience, and situational awareness. SeveralLaws in all 50 states have also proposed or adopted cybersecurity legislation and regulations, whichgenerally require, among other things, notification to affected individuals when there has been a security breach of their personal data.data under certain circumstances. For more information regarding cybersecurity and data privacy, refer to Item 1: Business - “Regulatory Matters.”.
We receive, maintain, and store non-public personal information of our customers and counterparties, including, but not limited to, personally identifiable information and personal financial information. The sharing, use, disclosure, and protection of these types of information are governed by federal and state law. Both personally identifiable information and personal financial information are increasingly subject to legislation and regulation, the intent of which is to protect the privacy of personal information and personal financial information that is collected and handled. For example, in June of 2018,under California state law, the GovernorCCPA broadly defines personal information and substantially increases the rights of California signed into lawresidents to understand how their personal information is collected, used, and otherwise processed by commercial businesses, such as affording them the CCPA. The CCPA, which became effective on January 1, 2020, appliesright to for-profit businesses that conduct businessaccess and request deletion of their information and to opt out of certain sharing and sales of personal information. Numerous other states have also enacted or are in California and meet certain revenue the process of enacting state-level privacy, data protection and/or data collection thresholds.security laws and regulations. For more information regarding data privacy laws and regulations, refer to Item 1: Business - “Regulatory Matters.”. Further, we make public statements about our use, collection, disclosure, and other processing of personal information through our privacy policies, information provided on our website and press statements. Although we endeavor to comply with our public statements and documentation, we may at times fail to do so or be alleged to have failed to do so. The publication of our privacy policies and other statements that provide promises and assurances about privacy, data protection, and data security can subject us to potential government or legal action if they are found to be deceptive, unfair, or misrepresentative of our actual practices.
We may become subject to new legislation or regulation concerning cybersecurity or the privacy of personally identifiable information and personal financial information or of any other information we may store or maintain. We could be adversely affected if new legislation or regulations are adopted or if existing legislation or regulations are modified such that we are required to alter our systems or require changes to our business practices or privacy policies. If cybersecurity, data privacy, data protection, data transfer, or data retention laws are implemented, interpreted, or applied in a manner inconsistent with our current practices, we may be subject to fines, litigation, or regulatory enforcement actions or ordered to change our business practices, policies, or systems in a manner that adversely impacts our operating results.
33 Huntington Bancshares Incorporated
We face significant operational risks which could lead to financial loss, expensive litigation, and loss of confidence by our customers, regulators, and capital markets.
We are exposed to many types of operational risks, including the risk of fraud or theft by colleagues or outsiders, unauthorized transactions by colleagues or outsiders, operational errors by colleagues, business disruption, and system failures. Huntington executes against a significant number of controls, a large percent of which are manual and dependent on adequate execution by colleagues and third-party service providers. There is inherent risk that unknown single points of failure through the execution chain could give rise to material loss through inadvertent errors or malicious attack. These operational risks could lead to financial loss, expensive litigation, and loss of confidence by our customers, regulators, and the capital markets.
Moreover, negative public opinion can result from our actual or alleged conduct in any number of activities, including clients, products, and business practices; corporate governance; acquisitions; and from actions taken by government regulators and community organizations in response to those activities. Negative public opinion can adversely affect our ability to attract and retain customers and can also expose us to litigation and regulatory action.
Relative to acquisitions, we incur risks and challenges associated with the integration of employees, accounting systems, and technology platforms from acquired businesses and institutions in a timely and efficient manner, and we cannot guarantee that we will be successful in retaining existing customer relationships or achieving anticipated operating efficiencies expected from such acquisitions. Acquisitions may be subject to the receipt of approvals from certain governmental authorities, including the Federal Reserve, the OCC, and the United StatesU.S. Department of Justice, as well as the approval of our shareholders and the shareholders of companies that we seek to acquire. These approvals for acquisitions may not be received, may take longer than expected, or may impose conditions that are not presently anticipated or that could have an adverse effect on the combined company following the acquisitions. Subject to requisite regulatory approvals, future business acquisitions may result in the issuance and payment of additional shares of stock, which would dilute current shareholders’ ownership interests. Additionally, acquisitions may involve the payment of a premium over book and market values. Therefore, dilution of our tangible book value and net income per common share could occur in connection with any future transaction.
34 Huntington Bancshares Incorporated
Failure to maintain effective internal controls over financial reporting could impair our ability to accurately and timely report our financial results or prevent fraud, resulting in loss of investor confidence and adversely affecting our business and our stock price.
Effective internal controls over financial reporting are necessary to provide reliable financial reports and prevent fraud. We are subject to regulation that focuses on effective internal controls and procedures. Such controls and procedures are modified, supplemented, and changed from time-to-time as necessitated by our growth and in reaction to external events and developments. Any failure to maintain an effective internal control environment could impact our ability to report our financial results on an accurate and timely basis, which could result in regulatory actions, loss of investor confidence, and an adverse impact on our business and our stock price.
We rely on quantitative models to measure risks and to estimate certain financial values.
Quantitative models may be used to help manage certain aspects of our business and to assist with certain business decisions, including estimating expected lifetime credit losses, measuring the fair value of financial instruments when reliable market prices are unavailable, estimating the effects of changing interest rates and other market measures on our financial condition and results of operations, managing risk, and for capital planning purposes (including during the CCAR capital planning and capital adequacy process). Our measurement methodologies rely on many assumptions, historical analyses, and correlations. These assumptions may not capture or fully incorporate conditions leading to losses, particularly in times of market distress, and the historical correlations on which we rely may no longer be relevant. Additionally, as businesses and markets evolve, our measurements may not accurately reflect this evolution. Even if the underlying assumptions and historical correlations used in our models are adequate, our models may be deficient due to errors in computer code, inaccurate data, misuse of data, or the use of a model for a purpose outside the scope of the model’s design.
All models have certain limitations. Reliance on models presents the risk that our business decisions based on information incorporated from models will be adversely affected due to incorrect, missing, or misleading information. In addition, our models may not capture or fully express the risks we face, may suggest that we have
sufficient capitalization when we do not, or may lead us to misjudge the business and economic environment in which we will operate. If our models fail to produce reliable results on an ongoing basis, we may not make appropriate risk management, capital planning, or other business or financial decisions. Strategies that we employ to manage and govern the risks associated with our use of models may not be effective or fully reliable. Also, information that we provide to the public or regulators based on poorly designed models could be inaccurate or misleading.
Banking regulators continue to focus on the models used by banks and bank holding companies in their businesses. Some of our decisions that the regulators evaluate, including distributions to our shareholders, could be affected adversely due to their perception that the quality of the models used to generate the relevant information are insufficient.
We rely on third parties to provide key components of our business infrastructure.
We rely on third-party service providers, both domestically and offshore, to leverage subject matter expertise and industry best practice, provide enhanced products and services, and reduce costs. Although there are benefits in entering into third-party relationships with vendors and others, there are risks associated with such activities. When entering a third-party relationship, the risks associated with that activity are not passed to the third-party but remain our responsibility. The TechnologyRisk Oversight Committee of the boardBoard of directorsDirectors provides oversight related to the overall risk management process associated with third-party relationships. Management is accountable for the review and evaluation of all new and existing third-party relationships. Management is responsible for ensuring that adequate controls are in place to protect us and our customers from the risks associated with vendor relationships.
Increased risk could occur based on poor planning, oversight, control, and inferior performance or service on the part of the third-party and may result in legal costs or loss of business. While we have implemented a vendor management program to actively manage the risks associated with the use of third-party service providers, any problems caused by third-party service providers could adversely affect our ability to deliver products and services to our customers and to conduct our business. Replacing a third-party service provider could also take a long period of time and result in increased expenses.
Changes in accounting policies, standards, and interpretations could affect how we report our financial condition and results of operations.
The FASB, regulatory agencies, and other bodies that establish accounting standards periodically change the financial accounting and reporting standards governing the preparation of our financial statements. Additionally, those bodies that establish and interpret the accounting standards (such as the FASB, SEC, and banking regulators) may change prior interpretations or positions on how these standards should be applied.
Impairment of goodwill could require charges to earnings, which could result in a negative impact on our results of operations.
Our goodwill could become impaired in the future. If goodwill were to become impaired, it could limit the ability of the Bank to pay dividends to Huntington, adversely impacting Huntington liquidity and ability to pay dividends or repay debt. The most significant assumptionsAssumptions affecting our goodwill impairment evaluation are variables including the market price of our Common Stock,include earnings projections, of earnings, the discount rates used in the income approach to measure fair value, and observed peer multiples used in estimating the control premium above our current stock price that an acquirer would pay to obtain control of us.fair value under the market approach. We are required to test goodwill for impairment at least annually or when impairment indicators are present. If an impairment determination is made in a future reporting period, our earnings and book value of goodwill will be reduced by the amount of the impairment. If an impairment loss is recorded, it will have little or no impact on the tangible book value of our Common Stock, or our regulatory capital levels, but such an impairment loss could significantly reduce the Bank’s earnings and thereby restrict the Bank’s ability to make dividend payments to us without prior regulatory approval, because Federal Reserve policy states the bank holding company dividends should be paid from current earnings.which in turn could impact our ability to pay dividends. At December 31, 2020,2023, the book value of our goodwill was $2.0$5.6 billion, substantially all of which was recorded at the Bank. Any such write down of goodwill or other acquisition related intangibles will reduce Huntington’s earnings, as well.
Climate change manifesting as physical or transition risks could adversely affect our operations, businesses, and customers.
There is an increasing concern over the risks of climate change and related environmental sustainability matters. The physical risks of climate change include discrete events, such as flooding and wildfires, and longer-term shifts in climate patterns, such as extreme heat, sea level rise, and more frequent and prolonged drought. Under medium or longer-term scenarios, such events, if uninterrupted or unaddressed, could disrupt our operations or those of our customers or third parties on which we rely, including through direct damage to assets and indirect impacts from supply chain disruption and market volatility. Additionally, transitioning to a low-carbon economy may entail extensive policy, legal, technology and market initiatives. Transition risks, including changes in consumer preferences and additional regulatory requirements or supervisory expectations or taxes, could increase our expenses and undermine our strategies. In addition, our reputation and client relationships may be damaged as a result of our practices related to climate change, including our involvement, or our customers’ involvement, in certain industries or projects, in the absence of mitigation and/or transition measures, associated with causing or exacerbating climate change, as well as any decisions we make to continue to conduct or change our activities in response to considerations relating to climate change. As climate risk is interconnected with all key risk types, we have established a formal climate risk program to embed climate risk considerations into our risk management processes across all established risk pillars, such as market, credit, and operational risks. While the timing and severity of climate change may not be entirely predictable and our risk management processes may not be effective in mitigating climate risk exposure, we continue to build capabilities to identify, assess, and manage climate risks.
3536 Huntington Bancshares Incorporated
Compliance Risks:
We operate in a highly regulated industry, and the laws and regulations that govern our operations, corporate governance, executive compensation and financial accounting, or reporting, including changes in them, or our failure to comply with them, may adversely affect us.
The banking industry is highly regulated. We are subject to supervision, regulation, and examination by various federal and state regulators, including the Federal Reserve, OCC, SEC, CFPB, FDIC, FINRA, and various state regulatory agencies. The statutory and regulatory framework that governs us is generally intended to protect depositors and customers, the DIF, the U.S. banking and financial system, and financial markets as a whole - not to protect shareholders. These laws and regulations, many of which are discussed in Item 1: Business - “Regulatory Matters,” among other matters, prescribe minimum capital requirements, impose limitations on our business activities (including foreclosure and collection practices), limit the dividend or distributions that we can pay, restrict the ability of institutions to guarantee our debt, and impose certain specific accounting requirements that may be more restrictive and may result in greater or earlier charges to earnings or reductions in our capital than accounting principles generally accepted in the United States.U.S. Compliance with laws and regulations can be difficult and costly, and changes to laws and regulations often impose additional compliance costs. Both the scope of the laws and regulations and the intensity of the supervision to which we are subject have increased in recent years in response to the financial crisis, as well as other factors such as technological and market changes. Such regulation and supervision may increase our costs and limit our ability to pursue business opportunities. Further, our failure to comply with these laws and regulations, even if the failure was inadvertent or reflects a difference in interpretation, could subject us to restrictions on our business activities, fines, and other penalties, any of which could adversely affect our results of operations, capital base, and the price of our securities. Further, any new laws, rules, and regulations could make compliance more difficult or expensive or otherwise adversely affect our business and financial condition. Under the supervision of the CFPB, our Consumer and Business Banking products and services are subject to heightened regulatory oversight and scrutiny with respect to compliance under consumer laws and regulations. We may face a greater number or wider scope of investigations, enforcement actions, and litigation in the future related to consumer practices, thereby increasing costs associated with responding to or defending such actions. Also, federal and state regulators have been increasingly focused on sales practices of branch personnel, including taking regulatory action against other financial institutions. In addition, increased regulatory inquiries and investigations, as well as any additional legislative or regulatory developments affecting our consumer businesses, and any required changes to our business operations resulting from these developments, could result in significant loss of revenue, require remuneration to our customers, trigger fines or penalties, limit the products or services we offer, require us to increase our prices and, therefore, reduce demand for our products, impose additional compliance costs on us, increase the cost of collection, cause harm to our reputation, or otherwise adversely affect our consumer businesses.
Legislative and regulatory actions taken now or in the future that impact the financial industry may materially adversely affect us by increasing our costs, adding complexity in doing business, impeding the efficiency of our internal business processes, negatively impacting the recoverability of certain of our recorded assets, requiring us to increase our regulatory capital, limiting our ability to pursue business opportunities, and otherwise resulting in a material adverse impact on our financial condition, results of operation, liquidity, or stock price.
Both the scope of the laws and regulations and the intensity of the supervision to which we are subject increasedmay increase in response to thetimes of financial crisis, as well as a result of other factors such as technological and market changes. Regulatory enforcement and fines have also increased across the banking and financial services sector. Compliance with these laws and regulations have resulted in and will continue to result in additional costs, which could be significant, and may have a material and adverse effect on our results of operations. In addition, if we do not appropriately comply with current or future legislation and regulations, especially those that apply to our consumer operations, which has been an area of heightened focus, we may be subject to fines, penalties or judgments, or material regulatory restrictions on our businesses, which could adversely affect operations and, in turn, financial results.
We expect that the Biden Administrationcurrent administration will seekcontinue to implement a regulatory reform agenda that is significantly different than that of the Trump Administration.former administration. This reform agenda could include a heightened focus on consumer protection, fair lending, the regulation of loan portfolios and credit concentrations to borrowers impacted by climate change, heightened scrutiny on Bank Secrecy Act and AML requirements, topics related to social equity, executive compensation, and increased capital and liquidity, as well as limits on share buybacks and dividends. In addition, mergers and acquisitions could be dampened by increased antitrust scrutiny. We also expect reform proposals for the short-term wholesale markets. It is too early for usThe evolving regulatory and supervisory environment and uncertainty about the timing and scope of future laws, regulations and policies may contribute to assessdecisions we may make to suspend, reduce, or withdraw from existing businesses, activities, or initiatives, which if anymay result in potential lost revenue or significant restructuring or related costs or exposures.
In addition, regulatory responses in connection with severe market downturns or unforeseen stress events may alter or disrupt our planned future strategies and actions. Adverse developments affecting the overall strength and soundness of these policies, would be implementedother financial institutions, the financial services industry as a whole, and what theirthe general economic climate and U.S. Treasury market could have a negative impact on perceptions about the strength and soundness of our business would be.
Silicon Valley Bank, Signature Bank, and First Republic Bank, respectively. The failure of other banks and financial institutions and the measures taken by governments and regulators in response to these events could adversely impact our business, financial condition, and results of operations. The resolution of significant pending litigation, if unfavorable, could have an adverse effect on our results of operations for a particular period.
We face legal risks in our businesses, and the volume of claims and amount of damages and penalties claimed in litigation and regulatory proceedings against financial institutions remain high. Substantial legal liability against us could have material adverse financial effects or cause significant reputational harm to us, which in turn could seriously harm our business prospects. It is possible that the ultimate resolution of these matters, if unfavorable, may be material to the results of operations for a particular reporting period.
Noncompliance with the Bank Secrecy Act and other anti-money laundering statutes and regulations could cause us material financial loss.
The Bank Secrecy Act and the Patriot Act contain anti-money laundering and financial transparency provisions intended to detect and prevent the use of the U.S. financial system for money laundering and terrorist financing activities. The Bank Secrecy Act, as amended by the Patriot Act, requires depository institutions and their holding companies to undertake activities including maintaining an anti-money laundering program, verifying the identity of clients, monitoring for and reporting suspicious transactions, reporting on cash transactions exceeding specified thresholds, and responding to requests for information by regulatory authorities and law enforcement agencies. FinCEN, a unit of the Treasury Department that administers the Bank Secrecy Act, is authorized to impose significant civil money penalties for violations of those requirements and has recently engaged in coordinated enforcement efforts with the federal bank regulatory agencies, as well as the United StatesU.S. Department of Justice, Drug Enforcement Administration, and IRS.
There is also increased scrutiny of compliance with the rules enforced by the OFAC. If our policies, procedures, and systems are deemed deficient or the policies, procedures, and systems of the financial institutions that we have already acquired or may acquire in the future are deficient, we would be subject to liability, including fines and regulatory actions such as restrictions on our ability to pay dividends and the necessity to obtain regulatory approvals to proceed with certain planned business activities, including acquisition plans, which would negatively impact our business, financial condition, and results of operations. Failure to maintain and implement adequate programs to combat money laundering and terrorist financing could also have serious reputational consequences for us.
For more information regarding the Bank Secrecy Act, Patriot Act, anti-money laundering requirements and OFAC-administered sanctions, refer to Item 1: Business - “Regulatory Matters.”. 38 Huntington Bancshares Incorporated
Strategic Risk:
We operate in a highly competitive industry which depends on our ability to successfully execute our strategic plan and adapt our products and services to evolving industry standards and consumer preferences.
We are subject to intense competition from both other financial institutions and from non-bank entities, including FinTech companies. Technology has lowered the barriers to entry, with customers having a growing variety of traditional and nontraditional alternatives, including crowdfunding, digital wallets, and money transfer services. The continuous widespread adoption of new technologies, including internet services and mobile applications, and advanced ATM functionality, is influencing how individuals and firms conduct their financial affairs and is changing the delivery channels for financial services. Our “People-First, Digitally-Powered” strategic plan considers the implications of these changes in technology. Additionally, these changes require us to adapt our product and services, as well as our distribution of them, to evolving industry standards and customer preferences. Failure to address competitive pressures could make it more difficult for us to attract and retain customers across our businesses.
Our success depends, in part, on our ability to successfully implement our strategic plan as well as adapt existing products and services and develop competitive new products and services demanded by our customers. The widespread adoption of technologies will continue to require substantial investments to modify or adapt existing products and services and to develop new product or services. Additionally, we may not be successful in executing
37 Huntington Bancshares Incorporated
our strategic plan, introducing new products or services, achieving market acceptance of new product or services, anticipating or reacting to customers changing preferences, or attracting and retaining loyal customers.
We depend on our executive officers and key personnel to continue the implementation of our long-term business strategy and could be harmed by the loss of their services.
We believe that our continued growth and future success will depend in large part on the skills of our management team and our ability to motivate and retain these individuals and other key personnel. The loss of service of one or more of our executive officers or key personnel could reduce our ability to successfully implement our long-term business strategy, our business could suffer, and the value of our stock could be materially adversely affected. Leadership changes will occur from time to time, and we cannot predict whether significant resignations will occur or whether we will be able to recruit additional qualified personnel. We believe our management team possesses valuable knowledge about the banking industry and that their knowledge and relationships would be very difficult to replicate. Our success also depends on the experience of our branch managers and lending officers and on their relationships with the customers and communities they serve. The loss of these key personnel could negatively impact our banking operations. The loss of key personnel, or the inability to recruit and retain qualified personnel in the future, could have an adverse effect on our business, financial condition, or operating results.
Bank regulations regarding capital and liquidity, including the CCAR assessment process and the U.S. Basel III capital and liquidity standards, could require higher levels of capital and liquidity. Among other things, these regulations could impact our ability to pay common stock dividends, repurchase common stock, attract cost-effective sources of deposits, or require the retention of higher amounts of low yielding securities.
The Federal Reserve administers CCAR, a periodic forward-looking quantitative assessment of Huntington’s capital adequacy and planned capital distributions and a review of the strength of Huntington’s practices to assess capital needs. The Federal Reserve makes a quantitative assessment of capital based on supervisory-run stress tests that assess the ability to maintain capital levels above each minimum regulatory capital ratio after making all capital actions included in Huntington’s capital plan, under baseline and stressful conditions throughout a nine-quarter planning horizon. The CCAR process is also used to determine Huntington’s stress capital bufferSCB requirement. There can be no assurance that the Federal Reserve or OCC will respond favorably to our capital plans, planned capital actions, or stress test results, and the Federal Reserve, OCC, or other regulatory capital requirements may limit or otherwise restrict how we utilize our capital, including common stock dividends and stock repurchases.
We are also required to maintain minimum capital ratios and the Federal Reserve and OCC may determine that Huntington and/or the Bank, based on size, complexity, or risk profile, must maintain capital ratios above these minimums in order to operate in a safe and sound manner. In the event we are required to raise capital to maintain required minimum capital and leverage ratios or ratios above the required applicable minimums, we may be forced to do so when market conditions are undesirable or on terms that are less favorable to us than we would otherwise require. Furthermore, in order to prevent becoming subject to restrictions on our ability to distribute capital or make certain discretionary bonus payments to management, the Bank must maintain a Capital Conservation BufferCCB of 2.5%, and Huntington must maintain the applicable stress capital bufferSCB determined as part of the CCAR process, which are in addition to our required minimum capital ratios.
We also face the risk of becoming subject to new or more stringent requirements in connection with the introduction of new regulations or modification of existing regulations, which could require us to hold more capital or liquidity or have other adverse effects on our businesses or profitability. For example, proposed changes to applicable capital and liquidity requirements, such as the Basel III Endgame Proposal and the long-term debt proposal, could result in increased expenses or cost of funding, which could negatively affect our financial results or our ability to pay dividends and engage in share repurchases.
For more information regarding CCAR, stress testing, and capital and liquidity requirements, refer to Item 1: Business - “Regulatory Matters.”. If our regulators deem it appropriate, they can take regulatory actions that could result in a material adverse impact on our financial results, ability to compete for new business, or preclude mergers or acquisitions. In addition, regulatory actions could constrain our ability to fund our liquidity needs or pay dividends. Any of these actions could increase the cost of our services.
We are subject to the supervision and regulation of various state and federal regulators, including the OCC, Federal Reserve, FDIC, SEC, CFPB, FINRA, and various state regulatory agencies. As such, we are subject to a wide variety of laws and regulations, many of which are discussed in Item 1: Business - “Regulatory Matters”. As part of their supervisory process, which includes periodic examinations and continuous monitoring, the regulators have the authority to impose restrictions or conditions on our activities and the manner in which we manage the organization. Such actions could negatively impact us in a variety of ways, including charging monetary fines,
impacting our ability to pay dividends, precluding mergers or acquisitions, limiting our ability to offer certain products or services, or imposing additional capital requirements.
Under the supervision of the CFPB, our Consumer and Business Banking products and services are subject to heightened regulatory oversight and scrutiny with respect to compliance under consumer laws and regulations. We may face a greater number or wider scope of investigations, enforcement actions, and litigation in the future related to consumer practices, thereby increasing costs associated with responding to or defending such actions. Also, federal and state regulators have been increasingly focused on sales practices of branch personnel, including taking regulatory action against other financial institutions. In addition, increased regulatory inquiries and investigations, as well as any additional legislative or regulatory developments affecting our consumer businesses, and any required changes to our business operations resulting from these developments, could result in significant loss of revenue, require remuneration to our customers, trigger fines or penalties, limit the products or services we offer, require us to increase our prices and, therefore, reduce demand for our products, impose additional compliance costs on us, increase the cost of collection, cause harm to our reputation, or otherwise adversely affect our consumer businesses.
In addition, we are allowed to conduct certain activities that are financial in nature by virtue of Huntington’s status as an FHC, as discussed in more detail in Item 1. Regulatory Matters. If Huntington or the Bank cease to meet the requirements necessary for Huntington to continue to qualify as an FHC, the Federal Reserve may impose upon us corrective capital and managerial requirements, and may place limitations on our ability to conduct all of the business activities that we conduct as a FHC. If the failure to meet these standards persists, we could be required to divest our Bank, or cease all activities other than those activities that may be conducted by a BHC but not an FHC.
Reputation Risk:
Damage to our reputation could significantly harm our business, including our competitive position and business prospects.
Our ability to attract and retain customers, clients, investors, and employees is affected by our reputation. Significant harm to our reputation can arise from various sources, including officer, director, or employee misconduct, actual or perceived unethical behavior, conflicts of interest, security breaches, litigation or regulatory outcomes, compensation practices, failing to deliver minimum or required standards of service and quality, failing to address customer and agency complaints, compliance failures, unauthorized release of personal, proprietary or confidential information due to cyber-attacks or otherwise, perception of our environmental, social, and governance practices and disclosures, and the activities of our clients, customers, and counterparties, including vendors. Actions by the financial service industry generally or by institutions or individuals in the industry can adversely affect our reputation indirectly by association. In addition, adverse publicity or negative information posted on social media, whether or not factually correct, may affect our business prospects. All of these could adversely affect our growth, results of operation, and financial condition.
Risks related to the TCF Merger:
We are expected to incur substantial costs related to the Merger and integration.
We have incurred and expect to incur a number of non-recurring costs associated with the Merger. These costs include legal, financial advisory, accounting, consulting and other advisory fees, severance/employee benefit-related costs, public company filing fees and other regulatory fees and financial printing and other related costs. Some of these costs are payable by us regardless of whether or not the Merger is completed.
The combined company is expected to incur substantial costs in connection with the related integration. There are a large number of processes, policies, procedures, operations, technologies and systems that may need to be integrated, including purchasing, accounting and finance, payroll, compliance, treasury management, branch operations, vendor management, risk management, lines of business, pricing and benefits. While we have assumed that a certain level of costs will be incurred, there are many factors beyond our control that could affect the total amount or the timing of the integration costs. Moreover, many of the costs that will be incurred are, by their nature, difficult to estimate accurately. These integration costs may result in the combined company taking charges against
39 Huntington Bancshares Incorporated
earnings following the completion of the Merger, and the amount and timing of such charges are uncertain at present.
Combining Huntington and TCF may be more difficult, costly or time consuming than expected and Huntington and TCF may fail to realize the anticipated benefits of the Merger.
The success of the Merger will depend, in part, on the ability to realize the anticipated cost savings from combining the businesses of Huntington and TCF. To realize the anticipated benefits and cost savings from the Merger, Huntington and TCF must successfully integrate and combine their businesses in a manner that permits those cost savings to be realized. If Huntington and TCF are not able to successfully achieve these objectives, the anticipated benefits of the Merger may not be realized fully or at all or may take longer to realize than expected. In addition, the actual cost savings and anticipated benefits of the Merger could be less than anticipated, and integration may result in additional unforeseen expenses.
Huntington and TCF have operated and, until the completion of the Merger, must continue to operate, independently. It is possible that the integration process could result in the loss of key employees, the disruption of each company’s ongoing businesses or inconsistencies in standards, controls, procedures and policies that adversely affect the companies’ ability to maintain relationships with clients, customers, depositors and employees or to achieve the anticipated benefits and cost savings of the Merger. Integration efforts between the two companies may also divert management attention and resources. In addition, the impacts of the COVID-19 pandemic may make it more costly or more difficult to integrate the businesses of Huntington and TCF, which, in turn, may make it more difficult for the combined company to realize anticipated synergies or cost savings in the amounts estimated or in the timeframe contemplated or at all. These integration matters could have an adverse effect on each of Huntington and TCF during this transition period and for an undetermined period after completion of the Merger on the combined company.
The future results of the combined company following the Merger may suffer if the combined company does not effectively manage its expanded operations.
Following the Merger, the size of the business of the combined company will increase significantly beyond the current size of either Huntington’s or TCF’s business. The combined company’s future success will depend, in part, upon its ability to manage this expanded business, which may pose challenges for management, including challenges related to the management and monitoring of new operations and associated increased costs and complexity. The combined company may also face increased scrutiny from governmental authorities as a result of the significant increase in the size of its business. There can be no assurances that the combined company will be successful or that it will realize the expected operating efficiencies, cost savings, revenue enhancements or other benefits currently anticipated from the Merger.
The combined company may be unable to retain Huntington or TCF personnel successfully while the Merger is pending or after the Merger is completed.
The success of the Merger will depend in part on the combined company’s ability to retain key employees currently employed by Huntington and TCF. It is possible that these employees may decide not to remain with Huntington or TCF, as applicable, while the Merger is pending or with the combined company after the Merger is consummated. If Huntington and TCF are unable to retain key employees, including management, who are critical to the successful integration and future operations of the companies, Huntington and TCF could face disruptions in their operations, loss of existing customers, loss of key information, expertise or know-how and unanticipated additional recruitment costs. In addition, if key employees terminate their employment, the combined company’s business activities may be adversely affected and management’s attention may be diverted from successfully integrating Huntington and TCF to hiring suitable replacements, all of which may cause the combined company’s business to suffer. In addition, Huntington and TCF may not be able to locate or retain suitable replacements for any key employees who leave either company.
The COVID-19 pandemic may delay and adversely affect the completion of the Merger.
The COVID-19 pandemic has created economic and financial disruptions that have adversely affected, and are likely to continue to adversely affect, the business, financial condition, liquidity, capital and results of operations of Huntington and TCF. If the effects of the COVID-19 pandemic cause continued or extended decline in the economic environment and the financial results of Huntington or TCF, or the business operations of Huntington or TCF are further disrupted as a result of the COVID-19 pandemic, efforts to complete the Merger and integrate the businesses of Huntington and TCF may also be delayed and adversely affected. Additional time may be required to obtain the requisite regulatory approvals, and the Federal Reserve, the OCC and/or other regulators may impose additional requirements on Huntington or TCF that must be satisfied prior to completion of the Merger, which could delay and adversely affect the completion of the Merger.
Regulatory approvals may not be received, may take longer than expected or may impose conditions that are not presently anticipated or that could have an adverse effect on the combined company following the Merger.
Before the Merger and the Bank Merger may be completed, various approvals, consents and non-objections must be obtained from the Federal Reserve, the OCC and other regulatory authorities. These approvals could be delayed or not obtained at all, including due to any or all of the following: an adverse development in either party’s regulatory standing, or any other factors considered by regulators in granting such approvals; governmental, political or community group inquiries, investigations or opposition; changes in legislation or the political environment, including as a result of changes of the U.S. executive administration, Congressional leadership and regulatory agency leadership; or impacts and disruptions resulting from the COVID-19 pandemic.
The approvals that are granted may impose terms and conditions, limitations, obligations or costs, require branch divestitures, or place restrictions on the conduct of the combined company’s business or require changes to the terms of the transactions contemplated by the Merger Agreement. There can be no assurance that regulators will not impose any such conditions, limitations, obligations or restrictions or that such conditions, limitations, obligations or restrictions will not have the effect of delaying the completion of any of the transactions contemplated by the Merger Agreement, imposing additional material costs on or materially limiting the revenues of the combined company following the Merger or will otherwise reduce the anticipated benefits of the Merger. In addition, there can be no assurance that any such conditions, limitations, obligations or restrictions will not result in the delay or abandonment of the Merger. Additionally, the completion of the Merger is conditioned on the absence of certain orders, injunctions or decrees by any governmental entity of competent jurisdiction that would prohibit or make illegal the completion of any of the transactions contemplated by the Merger Agreement.
Despite the parties’ commitments to use their reasonable best efforts to respond to any request for information and resolve any objection that may be asserted by any governmental entity with respect to the Merger Agreement, neither Huntington, TCF nor their respective subsidiaries is required under the terms of the Merger Agreement to take any action, or commit to take any action, or agree to any condition or restriction in connection with obtaining these approvals, that would reasonably be likely to have a material adverse effect on the combined company and its subsidiaries, taken as a whole, after giving effect to the Merger.
Termination of the Merger Agreement could negatively affect Huntington.
If the Merger is not completed for any reason, including as a result of Huntington shareholders or TCF shareholder failing to approve the proposal for the Merger, there may be various adverse consequences and Huntington may experience negative reactions from the financial markets and from their customers and employees. For example, Huntington’s businesses may have been affected adversely by the failure to pursue other beneficial opportunities due to the focus of management on the Merger, without realizing any of the anticipated benefits of completing the Merger. If the Merger Agreement is terminated under certain circumstances, Huntington may be required to pay a termination fee of $238.8 million to TCF.
Additionally, Huntington has incurred and will incur substantial expenses in connection with the negotiation and completion of the transactions contemplated by the Merger Agreement, including legal, accounting and financial advisory costs, as well as the costs and expenses of filing, printing and mailing the joint proxy statement/prospectus
41 Huntington Bancshares Incorporated
for the Merger, and all filing and other fees paid to the SEC in connection with the Merger. If the Merger is not completed, Huntington would have to pay these expenses without realizing the expected benefits of the Merger.
Huntington will be subject to business uncertainties and contractual restrictions while the Merger is pending.
Uncertainty about the effect of the Merger on employees and customers may have an adverse effect on Huntington. These uncertainties may impair Huntington’s ability to attract, retain and motivate key personnel until the Merger is completed, and could cause customers and others that deal with Huntington to seek to change existing business relationships with Huntington. In addition, subject to certain exceptions, Huntington has agreed to operate its business in the ordinary course prior to closing, and has agreed not to take certain actions, which could cause Huntington to be unable to pursue other beneficial opportunities that may arise prior to the completion of the Merger.
Shareholder litigation could prevent or delay the closing of the Merger or otherwise negatively affect the business and operations of Huntington.
Huntington may incur costs in connection with the defense or settlement of any shareholder lawsuits filed in connection with the Merger. Such litigation could have an adverse effect on the financial condition and results of operations of Huntington and could prevent or delay the consummation of the Merger.
The Merger Agreement subjects Huntington to certain restrictions on its business activities prior to the Effective Time.
The Merger Agreement subjects Huntington to certain restrictions on its business activities prior to the Effective Time. Subject to certain specified exceptions, the Merger Agreement obligates Huntington to, and to cause each of its subsidiaries to, take no action that would reasonably be likely to adversely affect or delay the ability of either Huntington or TCF to obtain any necessary approvals of any regulatory agency or other governmental entity required for the transactions contemplated by the Merger Agreement or to perform its respective covenants and agreements under the Merger Agreement or to consummate the transactions contemplated by the Merger Agreement on a timely basis. These restrictions could prevent Huntington from pursuing certain business opportunities that arise prior to the Effective Time.
The COVID-19 pandemic’s impact on the combined company’s business and operations is uncertain.
The extent to which the COVID-19 pandemic will negatively affect the business, financial condition, liquidity, capital and results of operations of the combined company will depend on future developments, which are highly uncertain and cannot be predicted, including the scope and duration of the COVID-19 pandemic, the direct and indirect impact of the COVID-19 pandemic on employees, clients, counterparties and service providers, as well as other market participants, and actions taken by governmental authorities and other third parties in response to the COVID-19 pandemic. Given the ongoing and dynamic nature of the circumstances, it is difficult to predict the impact of the COVID-19 pandemic on the combined company’s business, and there is no guarantee that efforts by the combined company to address the adverse impacts of the COVID-19 pandemic will be effective.
Even after the COVID-19 pandemic has subsided, the combined company may continue to experience adverse impacts to its business as a result of the COVID-19 pandemic’s global economic impact, including reduced availability of credit, adverse impacts on liquidity and the negative financial effects from any recession or depression that may occur.
Item 1B: Unresolved Staff Comments
None.
2020 Form 10-K 4042 Huntington Bancshares Incorporated
Item 1C: Cybersecurity
Cybersecurity represents an important component of Huntington’s overall cross-functional approach to risk management. Our cybersecurity practices are integrated into Huntington’s ERM approach, and cybersecurity risks are among the core enterprise risks identified for oversight by our Board of Directors (“Board”) through our annual ERM assessment. See “Risk Factors—Operational Risks” for information on risks from cybersecurity threats. Our cybersecurity policies and practices follow the cybersecurity framework of the National Institute of Standards and Technology and other applicable industry standards.
Consistent with Huntington’s overall ERM policies and practices, our cybersecurity program includes:
•Vigilance: We maintain a global cybersecurity threat operation designed to detect, contain, and respond to cybersecurity threats and incidents in a prompt and effective manner with the goal of minimizing disruptions to our business.
•Collaboration: We have established collaboration mechanisms with public and private entities, including intelligence and enforcement agencies, industry groups, and third-party service providers to identify and assess cybersecurity risks.
•Systems Safeguards: We deploy technical safeguards that are designed to protect our information systems from cybersecurity threats, including firewalls, intrusion prevention and detection systems, anti-malware functionality, access controls, and ongoing vulnerability assessments.
•Third-Party Management: We maintain a risk-based approach to identifying and overseeing cybersecurity risks presented by third parties, such as vendors, service providers, and other users of our systems.
•Education: We provide periodic and ongoing training for personnel regarding cybersecurity threats, with such training scaled to reflect the roles, responsibilities, and access of relevant personnel.
•Incident Response Planning: We have established and maintain incident response plans that address our response to a cybersecurity incident, and such plans are tested at least annually, or more frequently as needed.
•Communication and Coordination: We utilize a cross-functional approach to evaluating the risk from cybersecurity threats, involving management personnel from the technology, operations, legal, risk management, internal audit, and other key business functions, as well as members of our Board and the Technology Committee of the Board regarding cybersecurity threats and incidents.
•Governance: The Board’s oversight of cybersecurity risk management is supported by the Technology Committee, which has responsibility for the development, implementation, maintenance, and risk management of the cybersecurity program andregularly interacts with Huntington’s ERM function, individual members of management, and relevant management committees.
A key part of Huntington’s strategy for managing risks from cybersecurity threats is the ongoing assessment and testing of our processes and practices through auditing, assessments, tabletop exercises, and other exercises focused on evaluating effectiveness. We regularly engage third parties to perform assessments on our cybersecurity measures, including information security maturity assessments, and independent reviews of our information security control environment and operating effectiveness. The results of such assessments and reviews are reported to the Technology Committee and the Board, and we adjust our cybersecurity processes and practices as necessary based on the information provided by the third-party assessments and reviews.
The Technology Committee of the Board oversees the management of risks from cybersecurity threats, including the policies, processes and practices that management implements to address risks from cybersecurity threats. The Board and the Technology Committee each receive regular presentations and reports on cybersecurity risks which address a wide range of topics including, for example, recent developments, evolving standards, vulnerability assessments, third-party and independent reviews, the threat environment, technological trends, and information security considerations arising with respect to peers and vendors. The Board and the Technology Committee also receive prompt information regarding the occurrence of any potentially material cybersecurity incidents, including ongoing updates, when applicable. To keep the Board apprised of the continually shifting landscape, the Chief Information Security Officer provides updates to the Technology Committee on information security and cybersecurity matters on at least a quarterly basis, and more frequently as necessary. The entire Board also participates in periodic cyber-related tabletop exercises.
Huntington’s Chief Information Security Officer is a member of our Information and Technology Risk Committee that is principally responsible for overseeing our cybersecurity risk management program, in partnership with other business leaders across Huntington. The Chief Information Security Officer also works with members of the ELT, which includes our Chief Executive Officer, Chief Financial Officer, Chief Risk Officer, and General Counsel. We believe our Board and management have the appropriate expertise, background, and depth of experience to manage risks arising from cybersecurity threats including applicable knowledge gained through industry experience, academia, ongoing internal and external training, and regular discussions with consultants and peers with applicable knowledge and expertise. In particular, one of our Board members has an extensive cybersecurity background, including having most recently served as the first-ever U.S. National Cyber Director. In addition, other members of our Board and management hold varying levels of relevant cybersecurity certifications.
The Company’s Chief Information Security Officer works collaboratively across Huntington to implement a program designed to identify and protect our information systems from cybersecurity threats and to promptly detect and respond to cybersecurity incidents. To facilitate this program, multi-disciplinary teams throughout Huntington are deployed to address cybersecurity threats and to respond to cybersecurity incidents in accordance with Huntington’s incident response plan. Through ongoing communications across the organization, the Chief Information Security Officer monitors the prevention, detection, mitigation, and remediation of cybersecurity incidents in real time, and reports such incidents to the CEO and the Technology Committee and the Board when appropriate, as discussed above.
Item 2: Properties
Our headquarters, as well as the Bank’s, is located in the Huntington Center, a thirty-seven story office building located in Columbus, Ohio. Of the building’s total office space available, we lease approximately 22%. The lease term expires in 2030, with six five-year renewal options for up to 30 years but with no purchase option. The Bank has an indirect minority equity interest of 18% in the building.
Our other major properties consistcommercial headquarters is located in the Detroit Tower, a twenty story office building, located in Detroit, Michigan. We lease the entirety of the following:building’s total office space available. The lease term expires in 2044, with four seven-year renewal options for up to 28 years with no purchase option. The Bank has no ownership interest in the building.
| | | | | | | | | | | | | | | | | | | | | | | | | | | | | | | | | | |
Description | | Location | | Primary Business Segment | | Utilization of Property for HBI purposes | | Own | | Lease | | |
Tower Building - Office | | Akron, OH | | Regional Leadership, Commercial Banking, Business Banking, Private Client Banking, Trust, Bank Operations, Retail Bank Branch | | 57% | | ü | | | | |
Cascade III (own building, lease land) | | Akron, OH | | Compliance, Consumer & Private Bank Technology, Corporate Sourcing, Bank Operations, Indirect Lending, Information Security Services | | 63% | | ü | | ü | | |
| | | | | | | | | | | | |
Easton - HNB Business Service Center | | Columbus, OH | | Bank Operations, Vehicle Finance, Business Banking Credit, Technology, Special Assets, Human Resources | | 80% | | ü | | | | |
Capitol Square | | Columbus, OH | | Bank Security, Internal Audit, Risk Administration, Treasury Management, Retail Bank Branch | | 63% | | ü | | | | |
Gateway Center | | Columbus, OH | | Bank Operations, Corporate Sourcing, Indirect Loan, Insurance, Phone Bank | | 73% | | ü | | | | |
Huntington Center (lease a portion of building) | | Columbus, OH | | Bank Administration, Private Client Group, Commercial Risk, Treasury, Finance, Accounting, Legal, Marketing, Human Resources, Tax | | 76% | | | | ü | | |
Huntington Plaza | | Columbus, OH | | Bank Operations, Compliance, HIC, Human Resources, Insurance | | 75% | | ü | | | | |
| | | | | | | | | | | | |
| | | | | | | | | | | | |
Indianapolis Main | | Indianapolis, IN | | Regional Leadership, Business Banking, Commercial Banking, Vehicle Finance, HIC, Trust, Private Client | | 61% | | ü | | | | |
Downtown Saginaw | | Saginaw, MI | | Regional Leadership, Private Banking, Retail Bank Branch | | 15% | | ü | | | | |
Mahoning Federal Plaza Building | | Youngstown, OH | | Business Banking Credit, Bank Operations, Commercial Banking | | 64% | | ü | | | | |
The majorWe own or lease numerous other premises for use in conducting business activities, including operations centers, offices, and branches and other facilities. We consider the facilities owned or occupied under lease by our subsidiaries to be adequate for the purposes of our business operations. Additional information regarding our properties occupied by the Company are used across allis set forth in Note 9 - “Premises and Equipment” and Note 10 - “Operating Leases” of the business segmentsNotes to Consolidated Financial Statements and for corporate purposes.is incorporated into this item by reference.Item 3: Legal Proceedings
Information required by this item is set forth in Note 2322 - “Commitments and Contingent Liabilities” of the Notes to Consolidated Financial Statements under the caption “Litigation and Regulatory Matters” and is incorporated into this Item by reference. Item 4: Mine Safety Disclosures
Not applicable.
4342 Huntington Bancshares Incorporated
PART II
Item 5: Market for Registrant’s Common Equity, Related Shareholder Matters and Issuer Purchases of Equity Securities
The common stock of Huntington Bancshares Incorporated is traded on the Nasdaq Global Stock Market under the symbol “HBAN”.“HBAN.” As of January 31, 2021,2024, we had 27,38429,674 shareholders of record.
Information regarding restrictions on dividends, as required by this Item, is set forth in Item 1: “Business - Regulatory Matters” and in Note 2423 - “Other Regulatory Matters” of the Notes to Consolidated Financial Statements and incorporated into this Item by reference. The following graph shows the changes, over the five-year period, in the value of $100 invested in (i) shares of Huntington’s Common Stock; (ii) the Standard & Poor’s 500 Stock Index (the S&P 500 Index) and (iii) Keefe, Bruyette & Woods Bank Index, for the period December 31, 2015,2018, through December 31, 2020.2023. The KBW Bank Index is a market capitalization-weighted bank stock index published by Keefe, Bruyette & Woods. The index is composed of the largest banking companies and includes all money center banks and many regional banks, including Huntington. An investment of $100 on December 31, 2015,2018, and the reinvestment of all dividends, are assumed. The plotted points represent the cumulative total return on the last trading day of the fiscal year indicated.
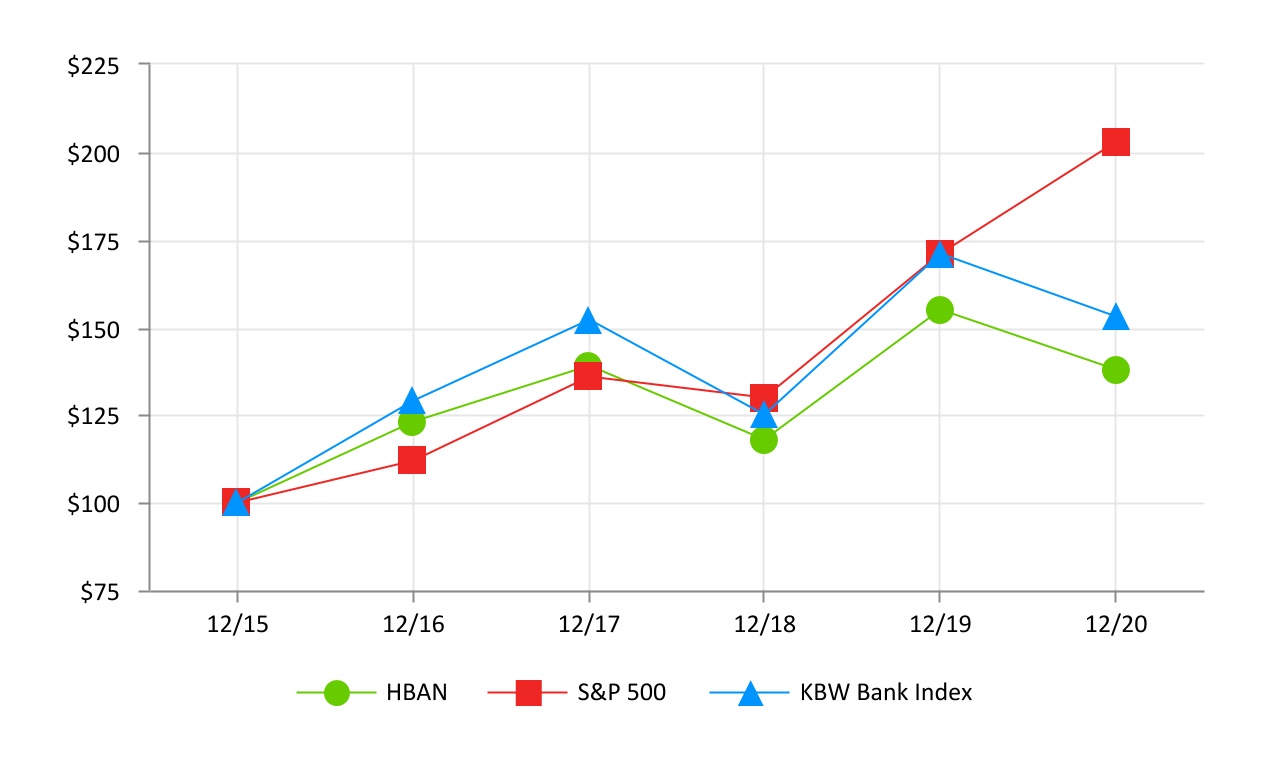

| | 2015 | | 2016 | | 2017 | | 2018 | | 2019 | | 2020 |
| 2018 | | | 2018 | | 2019 | | 2020 | | 2021 | | 2022 | | 2023 |
| HBAN | HBAN | $100 | | $123 | | $139 | | $118 | | $155 | | $138 | HBAN | $100 | | $132 | | $117 | | $149 | | $142 | | $136 |
| S&P 500 | S&P 500 | 100 | | 112 | | 136 | | 130 | | 171 | | 203 | S&P 500 | 100 | | 131 | | 156 | | 200 | | 164 | | 207 |
| KBW Bank Index | KBW Bank Index | 100 | | 129 | | 152 | | 125 | | 171 | | 153 | KBW Bank Index | 100 | | 136 | | 122 | | 169 | | 133 | | 132 |
For information regarding securities authorized for issuance under Huntington’s equity compensation plans, see Part III,
Item 12.The following table provides information regarding Huntington’s purchases of its Common Stock during the three-month period ended December 31, 2020.
| | | | | | | | | | | | | | | | | |
| | | | | |
| Period | Total Number of Shares Purchased (1) | | Average Price Paid Per Share | | Maximum Number of Shares (or Approximate Dollar Value) that May Yet Be Purchased Under the Plans or Programs (2) |
| October 1, 2020 to October 31, 2020 | — | | | — | | | — | |
| November 1, 2020 to November 30, 2020 | 415,488 | | | 11.13 | | | — | |
| December 1, 2020 to December 31, 2020 | — | | | — | | | — | |
| Total | 415,488 | | | $ | 11.13 | | | $ | — | |
(1)12The reported shares were repurchased pursuant to Huntington’s publicly-announced share repurchase authorization..
(2)The number shown represents, as of the end of each period, the approximate dollar value of Common Stock that may yet be purchased under publicly-announced share repurchase authorizations. The shares may be purchased, from time-to-time, depending on market conditions.
The Board authorized the repurchase of common shares during the 2020 fourth quarter to offset compensation plan-related share issuances as permitted by the Federal Reserve Board. Huntington may, at its discretion, repurchase common shares as permitted by this Board authorization. Purchases of common shares under the authorization may include open market purchases, privately negotiated transactions, and accelerated share repurchase programs.Item 6:
[Reserved]
452023 Form 10-K Huntington Bancshares Incorporated43
Item 7: Management’s Discussion and Analysis of Financial Condition and Results of Operations
INTRODUCTION
This MD&A provides information we believe necessary for understanding our financial condition, changes in financial condition, results of operations, and cash flows. The MD&A should be read in conjunction with the Consolidated Financial Statements, Notes to Consolidated Financial Statements, and other information contained in this report. The forward-looking statements in this section and other parts of this report involve assumptions, risks, uncertainties, and other factors, including statements regarding our plans, objectives, goals, strategies, and financial performance. Our actual results could differ materially from the results anticipated in these forward-looking statements as a result of factors set forth under the caption “Forward-Looking Statements” and those set forth in Item 1A. EXECUTIVE OVERVIEW
2020Acquisitions and Divestitures
In March 2023, Huntington completed the sale of the RPS business and entered into an ongoing partnership with the purchaser. The sale of our RPS business resulted in a $57 million gain including associated goodwill allocation, recorded within other noninterest income.
In June 2022, Huntington completed the acquisition of Capstone Partners, a top tier middle market investment bank and advisory firm. The transaction brings a national scale to serve middle market business owners throughout the corporate lifecycle, building on Huntington’s regional banking foundation. Capstone Partners related revenue, including mergers and acquisitions, capital raising and other advisory-related fees, is recognized within capital markets fees in the Consolidated Statements of Income. For further information, refer to Note 3 - “Business Combinations” of the Notes to Consolidated Financial Statements. In May 2022, Huntington completed the acquisition of Torana, now known as Huntington ChoicePay, a digital payments business focused on business to consumer payments. This acquisition, along with the formation of our enterprise-wide payments group, reflects one of our strategic priorities to accelerate our payments capabilities and expand the services provided to our customers.
In June 2021, Huntington closed the acquisition of TCF Financial Corporation. TCF was a financial holding company headquartered in Detroit, Michigan with operations across the Midwest. The acquisition brought increased scale and market density, as well as added new markets and capabilities. Our operating results include the impact of TCF subsequent to the acquisition on June 9, 2021. For further information, refer to Note 3 - “Business Combinations” of the Notes to Consolidated Financial Statements. Reporting Updates
During the fourth quarter of 2023, we updated the presentation of our noninterest income categories to align product and service types more closely with how we strategically manage our business. For a description of each updated noninterest income revenue stream refer to Note 15 - “Revenue from Contracts with Customers” of the Notes to the Consolidated Financial Statements. During the fourth quarter of 2023, we revised our FTP methodology for non-maturity deposits, which has been enhanced to consider the internally modeled weighted average life by non-maturity deposit type. In general, the impact of the FTP methodology revision resulted in a higher cost of funds allocation as compared with the previous method.
To align with our strategic priorities, during the second quarter of 2023, we completed an organizational realignment and now report on two business segments: Consumer & Regional Banking and Commercial Banking. The Treasury / Other function includes technology and operations, and other unallocated assets, liabilities, revenue, and expense. Huntington’s business segments are based on our internally-aligned segment leadership structure, which is how management monitors results and assesses performance. The organizational realignment primarily involved consolidating our previously reported Consumer and Business Banking, Vehicle Finance and RBHPCG, into one new business segment called Consumer & Regional Banking.
44 Huntington Bancshares Incorporated
During the second quarter of 2023, we revised our process for assessing and monitoring the risk and performance of non-real estate secured commercial loans, primarily loans to REITs. These loans were reclassified from commercial real estate to the commercial and industrial loan category to align reporting with this process revision.
For the reporting updates discussed above, prior period results have been adjusted to conform to the current presentation.
2023 Financial Performance Review
Selected Financial Data
| | | | | | | | | | | | | | | | | | | | | | | | | | | | | | | | | | | | | | | | | |
| Table 1 - Selected Year to Date Income Statement Data |
| | Year Ended December 31, |
| | | | Change from 2022 | | | | Change from 2021 | | |
| (amounts in millions, except per share data) | 2023 | | Amount | | Percent | | 2022 | | Amount | | Percent | | 2021 |
| Interest income | $ | 8,916 | | | $ | 2,947 | | | 49 | % | | $ | 5,969 | | | $ | 1,778 | | | 42 | % | | $ | 4,191 | |
| Interest expense | 3,477 | | | 2,781 | | | 400 | | | 696 | | | 607 | | | 682 | | | 89 | |
| Net interest income | 5,439 | | | 166 | | | 3 | | | 5,273 | | | 1,171 | | | 29 | | | 4,102 | |
| Provision for credit losses | 402 | | | 113 | | | 39 | | | 289 | | | 264 | | | NM | | 25 | |
| Net interest income after provision for credit losses | 5,037 | | | 53 | | | 1 | | | 4,984 | | | 907 | | | 22 | | | 4,077 | |
| | | | | | | | | | | | | |
| | | | | | | | | | | | | |
| | | | | | | | | | | | | |
| | | | | | | | | | | | | |
| | | | | | | | | | | | | |
| | | | | | | | | | | | | |
| | | | | | | | | | | | | |
| | | | | | | | | | | | | |
| | | | | | | | | | | | | |
| | | | | | | | | | | | | |
| | | | | | | | | | | | | |
| Noninterest income | 1,921 | | | (60) | | | (3) | | | 1,981 | | | 92 | | | 5 | | | 1,889 | |
| | | | | | | | | | | | | |
| | | | | | | | | | | | | |
| | | | | | | | | | | | | |
| | | | | | | | | | | | | |
| | | | | | | | | | | | | |
| | | | | | | | | | | | | |
| | | | | | | | | | | | | |
| | | | | | | | | | | | | |
| | | | | | | | | | | | | |
| | | | | | | | | | | | | |
| Noninterest expense | 4,574 | | | 373 | | | 9 | | | 4,201 | | | (174) | | | (4) | | | 4,375 | |
| Income before income taxes | 2,384 | | | (380) | | | (14) | | | 2,764 | | | 1,173 | | | 74 | | | 1,591 | |
| Provision for income taxes | 413 | | | (102) | | | (20) | | | 515 | | | 221 | | | 75 | | | 294 | |
| Income after income taxes | 1,971 | | | (278) | | | (12) | | | 2,249 | | | 952 | | | 73 | | | 1,297 | |
| Income attributable to non-controlling interest | 20 | | | 9 | | | 82 | | | 11 | | | 9 | | | NM | | 2 | |
| Net income attributable to Huntington Bancshares Inc | 1,951 | | | (287) | | | (13) | | | 2,238 | | | 943 | | | 73 | | | 1,295 | |
| Dividends on preferred shares | 142 | | | 29 | | | 26 | | | 113 | | | (18) | | | (14) | | | 131 | |
| Impact of preferred stock repurchases and redemptions | (8) | | | (8) | | | NM | | — | | | (11) | | | NM | | 11 | |
| Net income applicable to common shares | $ | 1,817 | | | $ | (308) | | | (14) | % | | $ | 2,125 | | | $ | 972 | | | 84 | % | | $ | 1,153 | |
| Average common shares—basic | 1,446 | | | 5 | | | — | % | | 1,441 | | | 179 | | | 14 | % | | 1,262 | |
| Average common shares—diluted | 1,468 | | | 3 | | | — | | | 1,465 | | | 178 | | | 14 | | | 1,287 | |
| Net income per common share—basic | $ | 1.26 | | | $ | (0.21) | | | (14) | % | | $ | 1.47 | | | $ | 0.56 | | | 62 | % | | $ | 0.91 | |
| Net income per common share—diluted | 1.24 | | | (0.21) | | | (14) | | | 1.45 | | | 0.55 | | | 61 | | | 0.90 | |
| Cash dividends declared | 0.62 | | | — | | | — | | | 0.62 | | | 0.015 | | | 2 | | | 0.605 | |
| Revenue and Net Interest Income—FTE (Non-GAAP) | | | | | | | | | | | | | |
| Net interest income | $ | 5,439 | | | $ | 166 | | | 3 | % | | $ | 5,273 | | | $ | 1,171 | | | 29 | % | | $ | 4,102 | |
| FTE adjustment(1) | 42 | | | 11 | | | 35 | | | 31 | | | 6 | | | 24 | | | 25 | |
| Net interest income, FTE (non-GAAP)(1) | 5,481 | | | 177 | | | 3 | | | 5,304 | | | 1,177 | | | 29 | | | 4,127 | |
| Noninterest income | 1,921 | | | (60) | | | (3) | | | 1,981 | | | 92 | | | 5 | | | 1,889 | |
| Total revenue, FTE (non-GAAP)(1) | $ | 7,402 | | | $ | 117 | | | 2 | % | | $ | 7,285 | | | $ | 1,269 | | | 21 | % | | $ | 6,016 | |
(1) On an FTE basis assuming a 21% tax rate.
In 2020,2023, we reported net income of $817$2.0 billion, a $287 million, a 42%or 13%, decrease from the prior year. Earnings per common share on a diluted basis for the year were $0.69,$1.24, down 46%14% from the prior year.
Fully-taxable equivalent The current year reported net interest income for 2020 increased $6 million from 2019. This reflectedwas negatively impacted by the impactrecognition of 9% average earning asset growth and a 4% growth of average interest-bearing liabilities. FTE net interest margin decreased 27 basis points to 2.99%. Average earning asset growth reflects a $4.4 billion, or 6%, increase in average loans and leases. The NIM compression reflected an 87 basis point decline in average earning asset yields, a 19 basis point decline in the benefit from noninterest-bearing funds, partially offset by a 79 basis point decrease in average funding costs.
The provision for credit losses was $1.0 billion, up $761FDIC DIF special assessment totaling $214 million, or 265%.$169 million after tax ($0.11 per common share), to recover the cost associated with protecting uninsured depositors as part of the 2023 bank failures and $69 million, or $55 million after tax ($0.04 per common share), of expense from staffing related initiatives and the consolidation of corporate locations. The increase in provision expense over the prior year was primarily attributed to the deterioration in the macroeconomic environment resulting from the COVID-19 pandemic and risk rating downgrades within the commercial portfolio.
Noninterestyear’s reported net income was $1.6 billion, up $137negatively impacted by acquisition-related expenses totaling $95 million, or 9%, from the prior year. Among the primary drivers, mortgage banking income increased $199$76 million or 119%, primarily reflecting higher secondary marketing spreads and an increase in salable mortgage originations. Offsetting this increase, service charges on deposit accounts decreased $71 million, or 19%, primarily reflecting reduced customer activity and pandemic-related fee waivers and other noninterest income decreased $23 million, or 13%, reflecting several notable items impacting both periods as well as lower fixed income brokerage revenue, deposit placement fees and operating lease income. Notable items in 2020 include a $13 million gain on the annuitization of a retiree health plan and a $5 million gain on the sale of the retirement plan services recordkeeping business, whereas 2019 included a $14 million gain from the sale of Wisconsin retail branches.
Noninterest expense was $2.8 billion, up $74 million, or 3%, from the prior year. Contributing to the increase, personnel costs were up $38 million, or 2%, primarily reflecting increased salaries, incentives, commissions, contract help and overtime expense partially offset by lower payroll taxes. Outside data processing and other services increased $38 million, or 11%, primarily driven by expenses related to technology investmentsafter tax ($0.05 per common share). Equipment expense increased $17 million driven by increased depreciation and software development expense. Offsetting these increases, other noninterest expense decreased $10 million, or 4%, primarily as a result of lower travel and business development expenses partially offset by an increase in the contribution to the Columbus Foundation.
Net interest income for 2023 was $5.4 billion, up $166 million, or 3%, from 2022. FTE net interest income, a non-GAAP financial measure, increased $177 million, or 3%, from 2022. The increase in FTE net interest income reflected an increase in earning asset yields and the benefit of a $8.3 billion, or 5%, increase in average earning assets, partially offset by higher cost of funds and a $15.3 billion, or 13%, increase in average interest-bearing liabilities. Average earning asset growth included a $5.7 billion, or 5%, increase in loans and leases and a $4.5 billion, or 92%, increase in interest-earning deposits with banks, partially offset by a $1.4 billion, or 3%, decrease in average securities. The growth in average interest-bearing liabilities included a $10.1 billion, or 10%, increase in average interest-bearing deposits and a $5.2 billion, or 46%, increase in average borrowings.
The provision for credit losses increased $113 million, or 39%, to $402 million, primarily driven by a combination of loan and lease growth and modest overall ACL coverage ratio builds throughout 2023 that is reflective of the current macroeconomic environment. The ACL was $2.4 billion, or 1.97% of total loans and leases, at December 31, 2023, compared to $2.3 billion, or 1.90% of total loans and leases, at December 31, 2022.
Noninterest income of $1.9 billion, decreased $60 million, or 3%, from the prior year primarily due to lower gain on sale of loans, customer deposit and loan fees, and mortgage banking income, in addition to $24 million of unfavorable mark-to-market on the pay-fixed swaptions program, partially offset by a $57 million gain on the sale of our RPS business and increases in payments and cash management revenue and wealth and asset management revenue. Noninterest expense of $4.6 billion, increased $373 million, or 9%, from the prior year primarily due to the FDIC DIF special assessment of $214 million and an increase in personnel costs, partially offset by a decrease in acquisition-related expenses.
Total assets at December 31, 2023 were $189.4 billion, an increase of $6.5 billion, or 4%, compared to December 31, 2022. The increase in total assets was primarily driven by increases in interest-earning deposits with banks of $3.6 billion, or 71%, and loans and leases of $2.5 billion, or 2%. Total liabilities at December 31, 2023 were $170.0 billion, an increase of $4.8 billion, or 3%, compared to December 31, 2022. The increase in total liabilities was primarily driven by increases in total deposits of $3.3 billion, or 2%, and borrowings of $1.3 billion, or 11%.
The tangible common equity to tangible assets ratio was 7.16%, down 726.14% at December 31, 2023, up 59 basis points. The regulatory Common Equity Tier 1 (CET1)points from December 31, 2022, primarily due to an increase in tangible common equity related to earnings, net of dividends, and a decrease in accumulated other comprehensive loss due in part from a modest decline in interest rates at year-end, partially offset by higher tangible assets. CET1 risk-based capital ratio was 10.00%10.25%, up 12 basis points.from 9.36% at December 31, 2022. The regulatory Tier 1 risk-based capital ratio was 12.47%, up 121 basis points. The balance sheet growth impact onincrease in regulatory capital ratios was largelyprimarily driven by earnings and a decrease in risk-weighted assets, partially offset by a changedividends. The decrease in asset mix during 2020risk-weighted assets was largely driven by the synthetic CRT related to the PPP loans and elevated deposits at the Federal Reserve, bothan approximately $3 billion portfolio of which are 0% risk weighted. The capital impact of earnings, adjusted for the CECL transition was largely offset by the repurchase of $92 million of common stock over the last four quarters (primarily in the 2020 first quarter) and cash dividends. The regulatory Tier 1 risk-based capital ratio also reflects the issuance of $500 million of Series F preferred stock and $500 million of Series G preferred stock in the 2020 second quarter and third quarter, respectively.on-balance sheet prime indirect auto loans.
Business Overview
General
Our general business objectives are:are to:
•Consistent organic revenue and balance sheet growth.Build on our vision to be the country’s leading people-first, digitally powered bank;
•Invest in our businesses, particularly technologyDrive sustainable long-term revenue growth and risk management.efficiency;
•Deliver positive long-term operating leverage.a Category of One customer experience through our distinguished brand and culture;
•Extend our digital leadership with focus on ease of use, access to information, and self-service across products and services;
•Leverage expertise and capabilities to acquire and deepen relationships and launching of select partnerships;
•Maintain positive operating leverage and execute disciplined capital management; and
•Provide stability and resilience through risk management, while maintaining an aggregate moderate-to-low, through-the-cycle risk appetite.
•Disciplined capital management.
COVID-19
The COVID-19 pandemic has caused and continues to cause significant, unprecedented disruption that affects daily living and negatively impacts the global economy. The pandemic has resulted in temporary closures of many businesses and the institution of social distancing and shelter in place requirements in many states and communities, increasing unemployment levels and causing volatility in the financial markets. As further discussed in “Discussion of Results of Operations,” the reduction in interest rates, borrower and counterparty credit deterioration and market volatility, among other factors, impacted our 2020 performance. Though we are unable to estimate the magnitude, we expect the pandemic and related global economic crisis will adversely affect our future operating results.
Huntington was able to react quickly to these changes because of the commitment and flexibility of its workforce coupled with well-prepared business continuity plans. To ensure the safety of our branch colleagues, while still meeting the needs of our customers, we moved to the use of branches with drive-thru only, with in-person meetings by appointment during shelter-in-place orders. For other colleagues, we have implemented a work-from-home approach with increased communication to keep them informed, engaged, productive and connected. Additional benefits have been provided, including medical, emergency paid time off and other programs for those whose families have been directly impacted by the virus. While state and local governments have partially eased temporary business closures and shelter in place requirements and we have opened our branches, we expect our colleagues who have been operating remotely to continue for some period of time. While vaccines have been approved and are being administered throughout our footprint, it remains unknown when, or if, there will be a return to historical normal economic and social activity.
For our customers, we have established a variety of temporary relief programs which include loan payment deferrals, late fee and overdraft waivers and the suspension of foreclosure and repossessions. We continue to work with our customers to originate and renew business loans as well as originated loans made available through the initial Small Business Administration Paycheck Protection Program, a lending program established as part of the relief to American consumers and businesses in the Coronavirus Aid, Relief, and Economic Security Act (“CARES Act”). The Economic Aid to Hard-Hit Small Businesses, Nonprofits, and Venues Act (“Economic Aid Act”) reopens and extends the PPP loan program. As of February 19, 2021, we have processed approximately 16,000 applications totaling $1.8 billion under the reopened program.
CARES Act
The CARES Act was passed by Congress and signed into law on March 27, 2020. It provides for financial stimulus and government lending programs at unprecedented levels. The benefits of these programs within the economy remain uncertain. The CARES Act includes a total allocation of $659 billion for loans to be issued by financial institutions through the SBA. This program is known as the PPP. PPP loans are forgivable, in whole or in part, if the
4746 Huntington Bancshares Incorporated
proceeds are used for payrollEconomy
Inflation continues to trend lower while remaining at levels above the Federal Reserve’s long run target. The Federal Reserve has shifted policy to a more balanced interest rate view and other permitted purposes in accordance withcontinues to further evaluate the requirementsimpact of their monetary tightening and the overall health of the PPP. These loans carry a fixed rateeconomy. The economy has continued to expand with fourth quarter of 1.00% and terms of two or five years, if not forgiven, in whole or in part. The loans also require deferral of principal and interest repayment. The loans are 100% guaranteed by the SBA. The SBA pays the originating bank a processing fee ranging2023 growth trending towards 2.0%. Equity markets have remained buoyant anticipating easier policy from 1% to 5%, based on the size of the loan. In addition, the FRB has implemented a liquidity facility available to financial institutions participating in the PPP (“PPPLF”). In conjunction with the PPP, the PPPLF will allow the Federal Reserve Banksin 2024. Further banking regulation has been delayed as recent regulatory proposals have been in their comment periods for an extended amount of time, with clarity on proposed amendments to lendthe regulatory capital rule and long-term debt requirements for banks anticipated.
The consensus economic outlook assumes a soft landing through the first half of 2024 with modest growth in the second half of 2024. Inflation is expected to member banks on a non-recourse basis with PPP loanscontinue to fall, approaching target levels of 2% by the third quarter of 2024, as collateral.the Federal Reserve actions will likely result in lower GDP growth and higher unemployment.
Additionally,Our 2023 results reflect the CARES Act provides for relief on existingexecution of our growth strategy and new SBA loansleveraging the strength of our balance sheet, delivered through Small Business Debt Relief. As part of the SBA Small Business Debt Relief, the SBA will automatically pay principal, interest and fees of certain SBA loans for a period of six months for both existing loans and new loans issued prior to September 27, 2020. To aid small- and medium-sized businessessustained deposit growth, bolstered capabilities across our footprint in 2020,payments and other fee revenue areas, and expansion of our CET1. We have continued our disciplined management of credit consistent with our aggregate moderate-to-low, through-the-cycle risk appetite. With our disciplined and proactive approach, we funded more than 38,000 loans in the amount of $6.6 billionbelieve Huntington is well positioned to manage through the SBA’s PPP. As of December 31, 2020, we have an outstanding PPP loan balance of $6.1 billionuncertain economic outlook on the horizon. We remain focused on delivering profitable growth and have received PPP forgiveness payments of $225 million from the SBA. Between January 1, 2021 and February 19, 2021, we have received PPP forgiveness payments of an additional $1.2 billion from the SBA.
The CARES Act also providesdriving value for Mortgage Payment Relief and a foreclosure moratorium. Refer to the “Credit Risk” section for additional details on customer relief.Economic Aid Act
The Economic Aid Act became law on December 27, 2020. The Act reopens and expands the PPP loan program through March 31, 2021. The changes to the PPP program allow new borrowers to apply for a loan under the original PPP loan program (“First Draw Loan”) and the creation of an additional PPP loan for eligible borrowers (“Second Draw Loan”). The Economic Aid Act also revises certain PPP requirements, including aspects of loan forgiveness on existing PPP loans.
Federal Reserve Board Actions
The FRB has taken a range of actions to support the flow of credit to households and businesses. For example, on March 15, 2020, the FRB reduced the target range for the federal funds rate to 0 to 0.25% and announced that it would increase its holdings of U.S. Treasury securities and agency mortgage-backed securities and begin purchasing agency commercial mortgage-backed securities. The FRB has also encouraged depository institutions to borrow from the discount window and has lowered the primary credit rate for such borrowing by 150 basis points while extending the term of such loans up to 90 days. Reserve requirements have been reduced to zero as of March 26, 2020.
The FRB has established, or has taken steps to establish, a range of facilities and programs to support the U.S. economy and U.S. marketplace participants in response to economic disruptions associated with COVID-19, including among others, Main Street Lending facilities to purchase loan participations, under specified conditions, from banks lending to small and medium U.S. businesses. During 2020, we participated in the Main Street Lending program originating $117 million of loans under these facilities.
Economy
Our 2020 results reflect strong execution across the bank given the pandemic and economic challenges faced by our customers, colleagues, communities and the country. We proactively managed through the continued low interest rate environment and unprecedented economic volatility experienced in the wake of the pandemic. The economy in our footprint continues to strengthen as demonstrated by the strong close to the year in commercial lending and our increasing loan pipelines. Additionally, many of the key economic indicators in the region such as unemployment rate, consumer confidence and consumer retail spending, are recovering more quickly than the nation as a whole. We believe that Huntington enters 2021 with strong momentum. We are positioned to advance the strategy and long-term financial performance of the company through investments in technology, digital innovation, marketing and people as well as the recently announced acquisition of TCF.shareholders.
Legislative and Regulatory
A comprehensive discussion of legislative and regulatory matters affecting us can be found in Item 1: Business - “Regulatory Matters” section of this Form 10-K.
| | | | | | | | | | | | | | | | | | | | | | | | | | | | | | | | | | | | | | | | | |
| Table 1 - Selected Year to Date Income Statements |
| (amounts in millions, except per share data) |
| | Year Ended December 31, |
| | | | Change from 2019 | | | | Change from 2018 | | |
| 2020 | | Amount | | Percent | | 2019 | | Amount | | Percent | | 2018 |
| Interest income | $ | 3,647 | | | $ | (554) | | | (13) | % | | $ | 4,201 | | | $ | 252 | | | 6 | % | | $ | 3,949 | |
| Interest expense | 423 | | | (565) | | | (57) | | | 988 | | | 228 | | | 30 | | | 760 | |
| Net interest income | 3,224 | | | 11 | | | — | | | 3,213 | | | 24 | | | 1 | | | 3,189 | |
| Provision for credit losses | 1,048 | | | 761 | | | 265 | | | 287 | | | 52 | | | 22 | | | 235 | |
| Net interest income after provision for credit losses | 2,176 | | | (750) | | | (26) | | | 2,926 | | | (28) | | | (1) | | | 2,954 | |
| Mortgage banking income | 366 | | | 199 | | | 119 | | | 167 | | | 59 | | | 55 | | | 108 | |
| Service charges on deposit accounts | 301 | | | (71) | | | (19) | | | 372 | | | 8 | | | 2 | | | 364 | |
| Card and payment processing income | 248 | | | 2 | | | 1 | | | 246 | | | 22 | | | 10 | | | 224 | |
| Trust and investment management services | 189 | | | 11 | | | 6 | | | 178 | | | 7 | | | 4 | | | 171 | |
| Capital markets fees | 125 | | | 2 | | | 2 | | | 123 | | | 15 | | | 14 | | | 108 | |
| Insurance income | 97 | | | 9 | | | 10 | | | 88 | | | 6 | | | 7 | | | 82 | |
| Bank owned life insurance income | 64 | | | (2) | | | (3) | | | 66 | | | (1) | | | (1) | | | 67 | |
| Gain on sale of loans | 42 | | | (13) | | | (24) | | | 55 | | | — | | | — | | | 55 | |
| Net (losses) gains on sales of securities | (1) | | | 23 | | | 96 | | | (24) | | | (3) | | | (14) | | | (21) | |
| Other noninterest income | 160 | | | (23) | | | (13) | | | 183 | | | 20 | | | 12 | | | 163 | |
| Total noninterest income | 1,591 | | | 137 | | | 9 | | | 1,454 | | | 133 | | | 10 | | | 1,321 | |
| Personnel costs | 1,692 | | | 38 | | | 2 | | | 1,654 | | | 95 | | | 6 | | | 1,559 | |
| Outside data processing and other services | 384 | | | 38 | | | 11 | | | 346 | | | 52 | | | 18 | | | 294 | |
| Equipment | 180 | | | 17 | | | 10 | | | 163 | | | (1) | | | (1) | | | 164 | |
| Net occupancy | 158 | | | (1) | | | (1) | | | 159 | | | (25) | | | (14) | | | 184 | |
| Professional services | 55 | | | 1 | | | 2 | | | 54 | | | (6) | | | (10) | | | 60 | |
| Amortization of intangibles | 41 | | | (8) | | | (16) | | | 49 | | | (4) | | | (8) | | | 53 | |
| Marketing | 38 | | | 1 | | | 3 | | | 37 | | | (16) | | | (30) | | | 53 | |
| Deposit and other insurance expense | 32 | | | (2) | | | (6) | | | 34 | | | (29) | | | (46) | | | 63 | |
| Other noninterest expense | 215 | | | (10) | | | (4) | | | 225 | | | 8 | | | 4 | | | 217 | |
| Total noninterest expense | 2,795 | | | 74 | | | 3 | | | 2,721 | | | 74 | | | 3 | | | 2,647 | |
| Income before income taxes | 972 | | | (687) | | | (41) | | | 1,659 | | | 31 | | | 2 | | | 1,628 | |
| Provision for income taxes | 155 | | | (93) | | | (38) | | | 248 | | | 13 | | | 6 | | | 235 | |
| Net income | 817 | | | (594) | | | (42) | | | 1,411 | | | 18 | | | 1 | | | 1,393 | |
| Dividends on preferred shares | 100 | | | 26 | | | 35 | | | 74 | | | 4 | | | 6 | | | 70 | |
| Net income applicable to common shares | $ | 717 | | | $ | (620) | | | (46) | % | | $ | 1,337 | | | $ | 14 | | | 1 | % | | $ | 1,323 | |
| Average common shares—basic | 1,017 | | | (22) | | | (2) | % | | 1,039 | | | (43) | | | (4) | % | | 1,082 | |
| Average common shares—diluted | 1,033 | | | (23) | | | (2) | | | 1,056 | | | (50) | | | (5) | | | 1,106 | |
| Per common share: | | | | | | | | | | | | | |
| Net income—basic | $ | 0.71 | | | $ | (0.58) | | | (45) | % | | $ | 1.29 | | | $ | 0.07 | | | 6 | % | | $ | 1.22 | |
| Net income—diluted | 0.69 | | | (0.58) | | | (46) | | | 1.27 | | | 0.07 | | | 6 | | | 1.20 | |
| Cash dividends declared | 0.60 | | | 0.02 | | | 3 | | | 0.58 | | | 0.08 | | | 16 | | | 0.50 | |
| Revenue—FTE | | | | | | | | | | | | | |
| Net interest income | $ | 3,224 | | | $ | 11 | | | — | % | | $ | 3,213 | | | $ | 24 | | | 1 | % | | $ | 3,189 | |
| FTE adjustment | 21 | | | (5) | | | (19) | | | 26 | | | (4) | | | (13) | | | 30 | |
Net interest income(1) | 3,245 | | | 6 | | | — | | | 3,239 | | | 20 | | | 1 | | | 3,219 | |
| Noninterest income | 1,591 | | | 137 | | | 9 | | | 1,454 | | | 133 | | | 10 | | | 1,321 | |
Total revenue(1) | $ | 4,836 | | | $ | 143 | | | 3 | % | | $ | 4,693 | | | $ | 153 | | | 3 | % | | $ | 4,540 | |
(1) On a fully-taxable equivalent (FTE) basis assuming a 21% tax rate.
49 Huntington Bancshares Incorporated
DISCUSSION OF RESULTS OF OPERATIONS
This section provides a review of financial performance fromon a consolidated perspective.basis. Key consolidated balance sheet and income statement trends are discussed. All earnings per share data are reported on a diluted basis. For additional insight on financial performance, please read this section in conjunction with the “Business Segment Discussion.” For a discussion of our results of operations for 20192022 versus 2018,2021, see “Part II, Item 7: Management’s Discussion and Analysis of Financial Condition and Results of Operations” Discussion of Results of Operations included in our 20192022 Form 10-K, filed with the SEC on February 14, 2020.17, 2023. In addition, discussion of our results of operations for 2022 versus 2021 for noninterest income and business segment discussion where prior period results have been adjusted to conform to the current presentation are included within this MD&A.
Average Balance Sheet / Net Interest Income / Average Balance Sheet
Our primary source of revenue is net interest income, which is the difference between interest income from earning assets (primarily loans, securities,leases, and direct financing leases)securities), and interest expense of funding sources (primarily interest-bearing deposits and borrowings). Earning asset balances and related funding sources, as well as changes in the levels of interest rates, impact net interest income. The difference between the average yield on earning assets and the average rate paid for interest-bearing liabilities is the net interest spread. Noninterest-bearing sources of funds, such as demand deposits and shareholders’ equity, also support earning assets. The impact of the noninterest-bearing sources of funds, often referred to as “free” funds, is captured in the net interest margin, which is calculated as net interest income divided by average earning assets. Both the net interest margin and net interest spread are presented on a fully-taxable equivalentan FTE basis, which means that tax-free interest income has been adjusted to a pretax equivalent income, assuming a 21% tax rate.
| | | | | | | | | | | | | | | | | | | | | | | | | | | | | | | | | | | | | | | | | | | | | | | | | | | |
| Table 2 - Consolidated Average Balance Sheet and Net Interest Margin Analysis | | | | |
| | Year Ended December 31, | | | | | | | |
| 2023 | | 2022 | | | | | | |
| Average | | Interest Income | | Yield/ | | Average | | Interest Income | | Yield/ | | Change from 2022 Average Balances | | |
| (dollar amounts in millions) | Balances | | (FTE) (1) | | Rate (2) | | Balances | | (FTE) (1) | | Rate (2) | | Amount | | Percent | | | | |
| Assets: | | | | | | | | | | | | | | | | | | | |
| | | | | | | | | | | | | | | | | | | |
| | | | | | | | | | | | | | | | | | | |
| Interest-earning deposits with banks | $ | 9,309 | | | $ | 492 | | | 5.30 | % | | $ | 4,852 | | | $ | 83 | | | 1.70 | % | | $ | 4,457 | | | 92 | % | | | | |
| Securities: | | | | | | | | | | | | | | | | | | | |
| Trading account securities | 77 | | | 4 | | | 5.14 | | | 32 | | | 1 | | | 4.14 | | | 45 | | | 141 | | | | | |
| Available-for-sale securities: | | | | | | | | | | | | | | | | | | | |
| Taxable | 20,539 | | | 1,016 | | | 4.95 | | | 21,994 | | | 576 | | | 2.62 | | | (1,455) | | | (7) | | | | | |
| Tax-exempt | 2,720 | | | 132 | | | 4.84 | | | 2,842 | | | 94 | | | 3.32 | | | (122) | | | (4) | | | | | |
| Total available-for-sale securities | 23,259 | | | 1,148 | | | 4.93 | | | 24,836 | | | 670 | | | 2.70 | | | (1,577) | | | (6) | | | | | |
| Held-to-maturity securities—taxable | 16,507 | | | 401 | | | 2.43 | | | 16,509 | | | 351 | | | 2.13 | | | (2) | | | — | | | | | |
| | | | | | | | | | | | | | | | | | | |
| | | | | | | | | | | | | | | | | | | |
| | | | | | | | | | | | | | | | | | | |
| Other securities | 933 | | | 53 | | | 5.70 | | | 845 | | | 27 | | | 3.16 | | | 88 | | | 10 | | | | | |
| Total securities | 40,776 | | | 1,606 | | | 3.94 | | | 42,222 | | | 1,049 | | | 2.48 | | | (1,446) | | | (3) | | | | | |
| Loans held for sale | 554 | | | 35 | | | 6.34 | | | 973 | | | 41 | | | 4.24 | | | (419) | | | (43) | | | | | |
| Loans and leases: (3) | | | | | | | | | | | | | | | | | | | |
| Commercial: | | | | | | | | | | | | | | | | | | | |
| Commercial and industrial | 49,640 | | | 2,991 | | | 6.03 | | | 45,362 | | | 1,956 | | | 4.31 | | | 4,278 | | | 9 | | | | | |
| | | | | | | | | | | | | | | | | | | |
| | | | | | | | | | | | | | | | | | | |
| | | | | | | | | | | | | | | | | | | |
| Commercial real estate | 13,140 | | | 972 | | | 7.40 | | | 13,524 | | | 602 | | | 4.45 | | | (384) | | | (3) | | | | | |
| Lease financing | 5,128 | | | 289 | | | 5.63 | | | 4,974 | | | 251 | | | 5.04 | | | 154 | | | 3 | | | | | |
| Total commercial | 67,908 | | | 4,252 | | | 6.26 | | | 63,860 | | | 2,809 | | | 4.40 | | | 4,048 | | | 6 | | | | | |
| Consumer: | | | | | | | | | | | | | | | | | | | |
| Residential mortgage | 22,990 | | | 825 | | | 3.59 | | | 20,907 | | | 661 | | | 3.16 | | | 2,083 | | | 10 | | | | | |
| Automobile | 12,881 | | | 561 | | | 4.36 | | | 13,454 | | | 472 | | | 3.51 | | | (573) | | | (4) | | | | | |
| Home equity | 10,156 | | | 760 | | | 7.48 | | | 10,409 | | | 532 | | | 5.11 | | | (253) | | | (2) | | | | | |
| RV and marine | 5,650 | | | 271 | | | 4.79 | | | 5,322 | | | 227 | | | 4.26 | | | 328 | | | 6 | | | | | |
| Other consumer | 1,362 | | | 156 | | | 11.53 | | | 1,314 | | | 126 | | | 9.51 | | | 48 | | | 4 | | | | | |
| Total consumer | 53,039 | | | 2,573 | | | 4.85 | | | 51,406 | | | 2,018 | | | 3.92 | | | 1,633 | | | 3 | | | | | |
| Total loans and leases | 120,947 | | | 6,825 | | | 5.64 | | | 115,266 | | | 4,827 | | | 4.19 | | | 5,681 | | | 5 | | | | | |
| | | | | | | | | | | | | | | | | | | |
| | | | | | | | | | | | | | | | | | | |
| Total earning assets | 171,586 | | | 8,958 | | | 5.22 | | | 163,313 | | | 6,000 | | | 3.67 | | | 8,273 | | | 5 | | | | | |
| Cash and due from banks | 1,576 | | | | | | | 1,666 | | | | | | | (90) | | | (5) | | | | | |
| Goodwill and other intangible assets | 5,731 | | | | | | | 5,688 | | | | | | | 43 | | | 1 | | | | | |
| All other assets | 10,850 | | | | | | | 10,184 | | | | | | | 666 | | | 7 | | | | | |
| Allowance for loan and lease losses | (2,187) | | | | | | | (2,083) | | | | | | | (104) | | | (5) | | | | | |
| Total assets | $ | 187,556 | | | | | | | $ | 178,768 | | | | | | | $ | 8,788 | | | 5 | % | | | | |
| Liabilities and Shareholders’ Equity: | | | | | | | | | | | | | | | | | | | |
| Interest-bearing deposits: | | | | | | | | | | | | | | | | | | | |
| Demand deposits—interest-bearing | $ | 39,826 | | | $ | 702 | | | 1.76 | % | | $ | 41,779 | | | $ | 158 | | | 0.38 | % | | $ | (1,953) | | | (5) | % | | | | |
| Money market deposits | 40,401 | | | 1,135 | | | 2.81 | | | 33,733 | | | 112 | | | 0.33 | | | 6,668 | | | 20 | | | | | |
| Savings and other domestic deposits | 18,345 | | | 23 | | | 0.13 | | | 21,316 | | | 5 | | | 0.02 | | | (2,971) | | | (14) | | | | | |
| Core certificates of deposit (4) | 9,780 | | | 390 | | | 3.99 | | | 2,439 | | | 12 | | | 0.50 | | | 7,341 | | | 301 | | | | | |
| Other domestic deposits of $250,000 or more | 354 | | | 13 | | | 3.56 | | | 233 | | | 1 | | | 0.47 | | | 121 | | | 52 | | | | | |
| Negotiable CDs, brokered and other deposits | 4,697 | | | 234 | | | 4.98 | | | 3,838 | | | 75 | | | 1.96 | | | 859 | | | 22 | | | | | |
| | | | | | | | | | | | | | | | | | | |
| Total interest-bearing deposits | 113,403 | | | 2,497 | | | 2.20 | | | 103,338 | | | 363 | | | 0.35 | | | 10,065 | | | 10 | | | | | |
| Short-term borrowings | 3,081 | | | 179 | | | 5.81 | | | 2,485 | | | 46 | | | 1.86 | | | 596 | | | 24 | | | | | |
| Long-term debt | 13,324 | | | 801 | | | 6.01 | | | 8,724 | | | 287 | | | 3.29 | | | 4,600 | | | 53 | | | | | |
| Total interest-bearing liabilities | 129,808 | | | 3,477 | | | 2.68 | | | 114,547 | | | 696 | | | 0.61 | | | 15,261 | | | 13 | | | | | |
| Demand deposits—noninterest-bearing | 33,985 | | | | | | | 41,574 | | | | | | | (7,589) | | | (18) | | | | | |
| All other liabilities | 5,080 | | | | | | | 4,353 | | | | | | | 727 | | | 17 | | | | | |
| Total liabilities | 168,873 | | | | | | | 160,474 | | | | | | | 8,399 | | | 5 | | | | | |
| Total Huntington shareholders’ equity | 18,634 | | | | | | | 18,263 | | | | | | | 371 | | | 2 | | | | | |
| Non-controlling interest | 49 | | | | | | | 31 | | | | | | | 18 | | | 58 | | | | |
| Total equity | 18,683 | | | | | | | 18,294 | | | | | | | 389 | | | 2 | | | | | |
| Total liabilities and shareholders’ equity | $ | 187,556 | | | | | | | $ | 178,768 | | | | | | | $ | 8,788 | | | 5 | % | | | | |
| Net interest rate spread | | | | | 2.54 | | | | | | | 3.06 | | | | | | | | | |
| Impact of noninterest-bearing funds on margin | | | | | 0.65 | | | | | | | 0.19 | | | | | | | | | |
| Net interest margin/NII (FTE) | | | $ | 5,481 | | | 3.19 | % | | | | $ | 5,304 | | | 3.25 | % | | | | | | | | |
(1)FTE yields are calculated assuming a 21% tax rate.
(2)Yield/rates include the impact of applicable derivatives. Loan and lease and deposit average yield/rates also include impact of applicable non-deferrable and amortized fees.
(3)For purposes of this analysis, NALs are reflected in the average balances of loans and leases.
(4)Includes consumer certificates of deposit of $250,000 or more.
48 Huntington Bancshares Incorporated
| | | | | | | | | | | | | | | | | | | | | | | | | | | | | | | | | | | | | | | | | | | | | | | | | | | |
| Table 2 - Consolidated Average Balance Sheet and Net Interest Margin Analysis (Continued) | | | | |
| | Year Ended December 31, | | | | | | | |
| 2022 | | 2021 | | | | | | |
| Average | | Interest Income | | Yield/ | | Average | | Interest Income | | Yield/ | | Change from 2021 Average Balances | | |
| (dollar amounts in millions) | Balances | | (FTE) (1) | | Rate (2) | | Balances | | (FTE) (1) | | Rate (2) | | Amount | | Percent | | | | |
| Assets: | | | | | | | | | | | | | | | | | | | |
| | | | | | | | | | | | | | | | | | | |
| | | | | | | | | | | | | | | | | | | |
| Interest-earning deposits with banks | $ | 4,852 | | | $ | 83 | | | 1.70 | % | | $ | 8,501 | | | $ | 12 | | | 0.13 | % | | $ | (3,649) | | | (43) | % | | | | |
| Securities: | | | | | | | | | | | | | | | | | | | |
| Trading account securities | 32 | | | 1 | | | 4.14 | | | 50 | | | 1 | | | 3.32 | | | (18) | | | (36) | | | | | |
| Available-for-sale securities: | | | | | | | | | | | | | | | | | | | |
| Taxable | 21,994 | | | 576 | | | 2.62 | | | 19,767 | | | 261 | | | 1.32 | | | 2,227 | | | 11 | | | | | |
| Tax-exempt | 2,842 | | | 94 | | | 3.32 | | | 2,916 | | | 71 | | | 2.42 | | | (74) | | | (3) | | | | | |
| Total available-for-sale securities | 24,836 | | | 670 | | | 2.70 | | | 22,683 | | | 332 | | | 1.46 | | | 2,153 | | | 9 | | | | | |
| Held-to-maturity securities—taxable | 16,509 | | | 351 | | | 2.13 | | | 10,000 | | | 174 | | | 1.74 | | | 6,509 | | | 65 | | | | | |
| | | | | | | | | | | | | | | | | | | |
| | | | | | | | | | | | | | | | | | | |
| | | | | | | | | | | | | | | | | | | |
| Other securities | 845 | | | 27 | | | 3.16 | | | 556 | | | 10 | | | 1.75 | | | 289 | | | 52 | | | | | |
| Total securities | 42,222 | | | 1,049 | | | 2.48 | | | 33,289 | | | 517 | | | 1.55 | | | 8,933 | | | 27 | | | | | |
| Loans held for sale | 973 | | | 41 | | | 4.24 | | | 1,398 | | | 41 | | | 2.96 | | | (425) | | | (30) | | | | | |
| Loans and leases: (3) | | | | | | | | | | | | | | | | | | | |
| Commercial: | | | | | | | | | | | | | | | | | | | |
| Commercial and industrial | 45,362 | | | 1,956 | | | 4.31 | | | 38,294 | | | 1,476 | | | 3.86 | | | 7,068 | | | 18 | | | | | |
| | | | | | | | | | | | | | | | | | | |
| | | | | | | | | | | | | | | | | | | |
| | | | | | | | | | | | | | | | | | | |
| Commercial real estate | 13,524 | | | 602 | | | 4.45 | | | 10,016 | | | 332 | | | 3.31 | | | 3,508 | | | 35 | | | | | |
| Lease financing | 4,974 | | | 251 | | | 5.04 | | | 3,739 | | | 186 | | | 4.98 | | | 1,235 | | | 33 | | | | | |
| Total commercial | 63,860 | | | 2,809 | | | 4.40 | | | 52,049 | | | 1,994 | | | 3.83 | | | 11,811 | | | 23 | | | | | |
| Consumer: | | | | | | | | | | | | | | | | | | | |
| Residential mortgage | 20,907 | | | 661 | | | 3.16 | | | 15,953 | | | 479 | | | 3.00 | | | 4,954 | | | 31 | | | | | |
| Automobile | 13,454 | | | 472 | | | 3.51 | | | 13,008 | | | 471 | | | 3.62 | | | 446 | | | 3 | | | | | |
| Home equity | 10,409 | | | 532 | | | 5.11 | | | 10,018 | | | 391 | | | 3.90 | | | 391 | | | 4 | | | | | |
| RV and marine | 5,322 | | | 227 | | | 4.26 | | | 4,672 | | | 199 | | | 4.27 | | | 650 | | | 14 | | | | | |
| Other consumer | 1,314 | | | 126 | | | 9.51 | | | 1,118 | | | 112 | | | 10.04 | | | 196 | | | 18 | | | | | |
| Total consumer | 51,406 | | | 2,018 | | | 3.92 | | | 44,769 | | | 1,652 | | | 3.69 | | | 6,637 | | | 15 | | | | | |
| Total loans and leases | 115,266 | | | 4,827 | | | 4.19 | | | 96,818 | | | 3,646 | | | 3.77 | | | 18,448 | | | 19 | | | | | |
| | | | | | | | | | | | | | | | | | | |
| | | | | | | | | | | | | | | | | | | |
| Total earning assets | 163,313 | | | 6,000 | | | 3.67 | | | 140,006 | | | 4,216 | | | 3.01 | | | 23,307 | | | 17 | | | | | |
| Cash and due from banks | 1,666 | | | | | | | 1,356 | | | | | | | 310 | | | 23 | | | | | |
| Goodwill and other intangible assets | 5,688 | | | | | | | 4,108 | | | | | | | 1,580 | | | 38 | | | | | |
| All other assets | 10,184 | | | | | | | 8,804 | | | | | | | 1,380 | | | 16 | | | | | |
| Allowance for loan and lease losses | (2,083) | | | | | | | (1,993) | | | | | | | (90) | | | (5) | | | | | |
| Total assets | $ | 178,768 | | | | | | | $ | 152,281 | | | | | | | $ | 26,487 | | | 17 | % | | | | |
| Liabilities and Shareholders’ Equity: | | | | | | | | | | | | | | | | | | | |
| Interest-bearing deposits: | | | | | | | | | | | | | | | | | | | |
| Demand deposits—interest-bearing | $ | 41,779 | | | $ | 158 | | | 0.38 | % | | $ | 32,708 | | | $ | 12 | | | 0.04 | % | | $ | 9,071 | | | 28 | % | | | | |
| Money market deposits | 33,733 | | | 112 | | | 0.33 | | | 30,039 | | | 21 | | | 0.07 | | | 3,694 | | | 12 | | | | | |
| Savings and other domestic deposits | 21,316 | | | 5 | | | 0.02 | | | 17,357 | | | 5 | | | 0.03 | | | 3,959 | | | 23 | | | | | |
| Core certificates of deposit (4) | 2,439 | | | 12 | | | 0.50 | | | 2,368 | | | 1 | | | 0.03 | | | 71 | | | 3 | | | | | |
| Other domestic deposits of $250,000 or more | 233 | | | 1 | | | 0.47 | | | 353 | | | 1 | | | 0.21 | | | (120) | | | (34) | | | | | |
| Negotiable CDs, brokered and other deposits | 3,838 | | | 75 | | | 1.96 | | | 3,525 | | | 5 | | | 0.16 | | | 313 | | | 9 | | | | | |
| | | | | | | | | | | | | | | | | | | |
| Total interest-bearing deposits | 103,338 | | | 363 | | | 0.35 | | | 86,350 | | | 45 | | | 0.05 | | | 16,988 | | | 20 | | | | | |
| Short-term borrowings | 2,485 | | | 46 | | | 1.86 | | | 278 | | | 1 | | | 0.20 | | | 2,207 | | | 794 | | | | | |
| Long-term debt (5) | 8,724 | | | 287 | | | 3.29 | | | 7,479 | | | 43 | | | 0.57 | | | 1,245 | | | 17 | | | | | |
| Total interest-bearing liabilities | 114,547 | | | 696 | | | 0.61 | | | 94,107 | | | 89 | | | 0.09 | | | 20,440 | | | 22 | | | | | |
| Demand deposits—noninterest-bearing | 41,574 | | | | | | | 37,960 | | | | | | | 3,614 | | | 10 | | | | | |
| All other liabilities | 4,353 | | | | | | | 3,205 | | | | | | | 1,148 | | | 36 | | | | | |
| Total liabilities | 160,474 | | | | | | | 135,272 | | | | | | | 25,202 | | | 19 | | | | | |
| Total Huntington shareholders’ equity | 18,263 | | | | | | | 16,997 | | | | | | | 1,266 | | | 7 | | | | | |
| Non-controlling interest | 31 | | | | | | | 12 | | | | | | | 19 | | | 158 | | | | | |
| Total equity | 18,294 | | | | | | | 17,009 | | | | | | | 1,285 | | | 8 | | | | | |
| Total liabilities and shareholders’ equity | $ | 178,768 | | | | | | | $ | 152,281 | | | | | | | $ | 26,487 | | | 17 | % | | | | |
| Net interest rate spread | | | | | 3.06 | | | | | | | 2.92 | | | | | | | | | |
| Impact of noninterest-bearing funds on margin | | | | | 0.19 | | | | | | | 0.03 | | | | | | | | | |
| Net interest margin/NII (FTE) | | | $ | 5,304 | | | 3.25 | % | | | | $ | 4,127 | | | 2.95 | % | | | | | | | | |
(1)FTE yields are calculated assuming a 21% tax rate.
(2)Average yield rates include the impact of applicable derivatives. Loan and lease and deposit average yield rates also include impact of applicable non-deferrable and amortized fees.
(3)For purposes of this analysis, NALs are reflected in the average balances of loans and leases.
(4)Includes consumer certificates of deposit of $250,000 or more.
(5)Reflects the benefit of $89 million mark-to-market of interest rate caps for 2021. There was no impact for 2022.
The following table shows changes in fully-taxable equivalent interest income, interest expense, and net interest income due to volume and rate variances for major categories of earning assets and interest-bearing liabilities:
| Table 2 - Change in Net Interest Income Due to Changes in Average Volume and Interest Rates (1) | | Table 3 - Change in Net Interest Income Due to Changes in Average Volume and Interest Rates (1) | | Table 3 - Change in Net Interest Income Due to Changes in Average Volume and Interest Rates (1) |
| | | 2020 | | 2019 | | 2023 | | 2022 |
| (dollar amounts in millions) | (dollar amounts in millions) | Increase (Decrease) From
Previous Year Due To | | Increase (Decrease) From
Previous Year Due To | (dollar amounts in millions) | Increase (Decrease) From
Previous Year Due To | | Increase (Decrease) From
Previous Year Due To |
| Fully-taxable equivalent basis (2) | Volume | | Yield/
Rate | | Total | | Volume | | Yield/
Rate | | Total |
| FTE basis (2) | | FTE basis (2) | Volume | | Yield/
Rate | | Total | | Volume | | Yield/
Rate | | Total |
| Loans and leases | Loans and leases | $ | 200 | | | $ | (655) | | | $ | (455) | | | $ | 127 | | | $ | 108 | | | $ | 235 | |
| Investment securities | Investment securities | 23 | | | (122) | | | (99) | | | (12) | | | 10 | | | (2) | |
| Other earning assets | Other earning assets | 50 | | | (55) | | | (5) | | | 20 | | | (5) | | | 15 | |
| Total interest income from earning assets | Total interest income from earning assets | 273 | | | (832) | | | (559) | | | 135 | | | 113 | | | 248 | |
| Deposits | Deposits | 38 | | | (425) | | | (387) | | | 17 | | | 177 | | | 194 | |
| Short-term borrowings | Short-term borrowings | (21) | | | (20) | | | (41) | | | (6) | | | 12 | | | 6 | |
| Long-term debt | Long-term debt | 6 | | | (143) | | | (137) | | | 12 | | | 16 | | | 28 | |
| Total interest expense of interest-bearing liabilities | Total interest expense of interest-bearing liabilities | 23 | | | (588) | | | (565) | | | 23 | | | 205 | | | 228 | |
| Net interest income | Net interest income | $ | 250 | | | $ | (244) | | | $ | 6 | | | $ | 112 | | | $ | (92) | | | $ | 20 | |
(1)The change in interest income or expense due to both rate and volume has been allocated between the factors in proportion to the relationship of the absolute dollar amounts of the change in each.
(2)Calculated assuming a 21% tax rate.
| | | | | | | | | | | | | | | | | | | | | | | | | | | | | | | | | | | | | | | | | |
| Table 3 - Consolidated Average Balance Sheet and Net Interest Margin Analysis |
| (dollar amounts in millions) | Average Balances |
| | | Change from 2019 | | | | Change from 2018 | | |
| Fully-taxable equivalent basis (1) | 2020 | | Amount | | Percent | | 2019 | | Amount | | Percent | | 2018 |
| Assets | | | | | | | | | | | | | |
| Interest-bearing deposits in Federal Reserve Bank (2) | $ | 3,874 | | | $ | 3,322 | | | 602 | % | | $ | 552 | | | $ | 430 | | | 352 | % | | $ | 122 | |
| Interest-bearing deposits in banks | 176 | | | 34 | | | 24 | | | 142 | | | 54 | | | 61 | | | 88 | |
| Securities: | | | | | | | | | | | | | |
| Trading account securities | 59 | | | (77) | | | (57) | | | 136 | | | 40 | | | 42 | | | 96 | |
| Available-for-sale securities: | | | | | | | | | | | | | |
| Taxable | 11,392 | | | 498 | | | 5 | | | 10,894 | | | 194 | | | 2 | | | 10,700 | |
| Tax-exempt | 2,735 | | | (172) | | | (6) | | | 2,907 | | | (556) | | | (16) | | | 3,463 | |
| Total available-for-sale securities | 14,127 | | | 326 | | | 2 | | | 13,801 | | | (362) | | | (3) | | | 14,163 | |
| Held-to-maturity securities—taxable | 9,248 | | | 603 | | | 7 | | | 8,645 | | | 2 | | | — | | | 8,643 | |
| Other securities | 443 | | | (28) | | | (6) | | | 471 | | | (113) | | | (19) | | | 584 | |
| Total securities | 23,877 | | | 824 | | | 4 | | | 23,053 | | | (433) | | | (2) | | | 23,486 | |
| Loans held for sale | 1,121 | | | 305 | | | 37 | | | 816 | | | 181 | | | 29 | | | 635 | |
| Loans and leases: (3) | | | | | | | | | | | | | |
| Commercial: | | | | | | | | | | | | | |
| Commercial and industrial | 33,917 | | | 3,368 | | | 11 | | | 30,549 | | | 1,662 | | | 6 | | | 28,887 | |
| Commercial real estate: | | | | | | | | | | | | | |
| Construction | 1,156 | | | (15) | | | (1) | | | 1,171 | | | 25 | | | 2 | | | 1,146 | |
| Commercial | 5,898 | | | 196 | | | 3 | | | 5,702 | | | (347) | | | (6) | | | 6,049 | |
| Commercial real estate | 7,054 | | | 181 | | | 3 | | | 6,873 | | | (322) | | | (4) | | | 7,195 | |
| Total commercial | 40,971 | | | 3,549 | | | 9 | | | 37,422 | | | 1,340 | | | 4 | | | 36,082 | |
| Consumer: | | | | | | | | | | | | | |
| Automobile loans and leases | 12,838 | | | 495 | | | 4 | | | 12,343 | | | 51 | | | — | | | 12,292 | |
| Home equity | 8,930 | | | (486) | | | (5) | | | 9,416 | | | (499) | | | (5) | | | 9,915 | |
| Residential mortgage | 11,694 | | | 607 | | | 5 | | | 11,087 | | | 1,180 | | | 12 | | | 9,907 | |
| RV and marine | 3,876 | | | 425 | | | 12 | | | 3,451 | | | 604 | | | 21 | | | 2,847 | |
| Other consumer | 1,086 | | | (173) | | | (14) | | | 1,259 | | | 56 | | | 5 | | | 1,203 | |
| Total consumer | 38,424 | | | 868 | | | 2 | | | 37,556 | | | 1,392 | | | 4 | | | 36,164 | |
| Total loans and leases | 79,395 | | | 4,417 | | | 6 | | | 74,978 | | | 2,732 | | | 4 | | | 72,246 | |
| Allowance for loan and lease losses | (1,581) | | | (795) | | | (101) | | | (786) | | | (39) | | | (5) | | | (747) | |
| Net loans and leases | 77,814 | | | 3,622 | | | 5 | | | 74,192 | | | 2,693 | | | 4 | | | 71,499 | |
| Total earning assets | 108,443 | | | 8,902 | | | 9 | | | 99,541 | | | 2,964 | | | 3 | | | 96,577 | |
| Cash and due from banks | 1,124 | | | 282 | | | 33 | | | 842 | | | (342) | | | (29) | | | 1,184 | |
| Intangible assets | 2,201 | | | (45) | | | (2) | | | 2,246 | | | (65) | | | (3) | | | 2,311 | |
| All other assets | 7,045 | | | 917 | | | 15 | | | 6,128 | | | 471 | | | 8 | | | 5,657 | |
| Total assets | $ | 117,232 | | | $ | 9,261 | | | 9 | % | | $ | 107,971 | | | $ | 2,989 | | | 3 | % | | $ | 104,982 | |
| Liabilities and Shareholders’ Equity | | | | | | | | | | | | | |
| Interest-bearing deposits: | | | | | | | | | | | | | |
| Demand deposits—interest-bearing | $ | 23,514 | | | $ | 3,656 | | | 18 | % | | $ | 19,858 | | | $ | 563 | | | 3 | % | | $ | 19,295 | |
| Money market deposits | 25,695 | | | 1,923 | | | 8 | | | 23,772 | | | 2,326 | | | 11 | | | 21,446 | |
| Savings and other domestic deposits | 10,720 | | | 804 | | | 8 | | | 9,916 | | | (1,167) | | | (11) | | | 11,083 | |
| Core certificates of deposit (4) | 2,610 | | | (2,980) | | | (53) | | | 5,590 | | | 1,402 | | | 33 | | | 4,188 | |
| | | | | | | | | | | | | |
| Other domestic time deposits of $250,000 or more | 216 | | | (103) | | | (32) | | | 319 | | | 39 | | | 14 | | | 280 | |
| Brokered time deposits and negotiable CDs | 3,822 | | | 1,006 | | | 36 | | | 2,816 | | | (687) | | | (20) | | | 3,503 | |
| | | | | | | | | | | | | |
| Total interest-bearing deposits | 66,577 | | | 4,306 | | | 7 | | | 62,271 | | | 2,476 | | | 4 | | | 59,795 | |
| Short-term borrowings | 1,147 | | | (1,297) | | | (53) | | | 2,444 | | | (304) | | | (11) | | | 2,748 | |
| Long-term debt | 9,496 | | | 164 | | | 2 | | | 9,332 | | | 340 | | | 4 | | | 8,992 | |
| Total interest-bearing liabilities | 77,220 | | | 3,173 | | | 4 | | | 74,047 | | | 2,512 | | | 4 | | | 71,535 | |
| Demand deposits—noninterest-bearing | 25,336 | | | 5,275 | | | 26 | | | 20,061 | | | (330) | | | (2) | | | 20,391 | |
| All other liabilities | 2,373 | | | 70 | | | 3 | | | 2,303 | | | 306 | | | 15 | | | 1,997 | |
| Shareholders’ equity | 12,303 | | | 743 | | | 6 | | | 11,560 | | | 501 | | | 5 | | | 11,059 | |
| Total liabilities and shareholders’ equity | $ | 117,232 | | | $ | 9,261 | | | 9 | % | | $ | 107,971 | | | $ | 2,989 | | | 3 | % | | $ | 104,982 | |
(1)FTE yields are calculated assuming a 21% tax rate.
(2)Deposits in Federal Reserve Bank were treated as non-earning assets prior to 4Q 2018.
(3)For purposes of this analysis, nonaccrual loans are reflected in the average balances of loans.
(4)Includes consumer certificates of deposit of $250,000 or more
51 Huntington Bancshares Incorporated
| | | | | | | | | | | | | | | | | | | | | | | | | | | | | | | | | | | |
| Table 3 - Consolidated Average Balance Sheet and Net Interest Margin Analysis (Continued) |
| (dollar amounts in millions) | | | | | | | | | | | |
| Interest Income / Expense | | Average Rate (5) |
| Fully-taxable equivalent basis (1) | 2020 | | 2019 | | 2018 | | 2020 | | 2019 | | 2018 |
| Assets | | | | | | | | | | | |
| Interest-bearing deposits in Federal Reserve Bank (2) | $ | 6 | | | $ | 12 | | | $ | 3 | | | 0.15 | % | | 2.12 | % | | 2.33 | % |
| Interest-bearing deposits in banks | 1 | | | 3 | | | 2 | | | 0.47 | | | 2.01 | | | 1.97 | |
| Securities: | | | | | | | | | | | |
| Trading account securities | 2 | | | 3 | | | 1 | | | 3.10 | | | 2.17 | | | 0.80 | |
| Available-for-sale securities: | | | | | | | | | | | |
| Taxable | 237 | | | 295 | | | 280 | | | 2.08 | | | 2.71 | | | 2.61 | |
| Tax-exempt | 77 | | | 105 | | | 122 | | | 2.84 | | | 3.61 | | | 3.53 | |
| Total available-for-sale securities | 314 | | | 400 | | | 402 | | | 2.23 | | | 2.90 | | | 2.84 | |
| Held-to-maturity securities—taxable | 216 | | | 218 | | | 211 | | | 2.33 | | | 2.52 | | | 2.44 | |
| Other securities | 6 | | | 16 | | | 25 | | | 1.41 | | | 3.47 | | | 4.34 | |
| Total securities | 538 | | | 637 | | | 639 | | | 2.25 | | | 2.76 | | | 2.72 | |
| Loans held for sale | 34 | | | 31 | | | 26 | | | 3.06 | | | 3.76 | | | 4.15 | |
| Loans and leases: (3) | | | | | | | | | | | |
| Commercial: | | | | | | | | | | | |
| Commercial and industrial | 1,290 | | | 1,441 | | | 1,337 | | | 3.80 | | | 4.72 | | | 4.63 | |
| Commercial real estate: | | | | | | | | | | | |
| Construction | 44 | | | 64 | | | 60 | | | 3.84 | | | 5.51 | | | 5.26 | |
| Commercial | 181 | | | 273 | | | 283 | | | 3.07 | | | 4.79 | | | 4.67 | |
| Commercial real estate | 225 | | | 337 | | | 343 | | | 3.19 | | | 4.91 | | | 4.77 | |
| Total commercial | 1,515 | | | 1,778 | | | 1,680 | | | 3.70 | | | 4.75 | | | 4.66 | |
| Consumer: | | | | | | | | | | | |
| Automobile loans and leases | 504 | | | 500 | | | 456 | | | 3.93 | | | 4.05 | | | 3.71 | |
| Home equity | 358 | | | 508 | | | 512 | | | 4.01 | | | 5.40 | | | 5.16 | |
| Residential mortgage | 406 | | | 422 | | | 371 | | | 3.47 | | | 3.81 | | | 3.74 | |
| RV and marine | 181 | | | 171 | | | 145 | | | 4.68 | | | 4.95 | | | 5.09 | |
| Other consumer | 125 | | | 165 | | | 145 | | | 11.48 | | | 13.11 | | | 12.04 | |
| Total consumer | 1,574 | | | 1,766 | | | 1,629 | | | 4.10 | | | 4.70 | | | 4.50 | |
| Total loans and leases | 3,089 | | | 3,544 | | | 3,309 | | | 3.89 | | | 4.73 | | | 4.58 | |
| Total earning assets | $ | 3,668 | | | $ | 4,227 | | | $ | 3,979 | | | 3.38 | % | | 4.25 | % | | 4.12 | % |
| Liabilities and Shareholders’ Equity | | | | | | | | | | | |
| Interest-bearing deposits: | | | | | | | | | | | |
| Demand deposits—interest-bearing | $ | 32 | | | $ | 116 | | | $ | 78 | | | 0.14 | % | | 0.58 | % | | 0.40 | % |
| Money market deposits | 100 | | | 260 | | | 148 | | | 0.39 | | | 1.09 | | | 0.69 | |
| Savings and other domestic deposits | 10 | | | 22 | | | 24 | | | 0.09 | | | 0.22 | | | 0.22 | |
| Core certificates of deposit (4) | 38 | | | 119 | | | 72 | | | 1.44 | | | 2.13 | | | 1.72 | |
| | | | | | | | | | | |
| Other domestic time deposits of $250,000 or more | 3 | | | 7 | | | 3 | | | 1.18 | | | 1.82 | | | 1.25 | |
| Brokered time deposits and negotiable CDs | 15 | | | 61 | | | 66 | | | 0.38 | | | 2.18 | | | 1.88 | |
| | | | | | | | | | | |
| Total interest-bearing deposits | 198 | | | 585 | | | 391 | | | 0.30 | | | 0.94 | | | 0.65 | |
| Short-term borrowings | 13 | | | 54 | | | 48 | | | 1.18 | | | 2.23 | | | 1.74 | |
| Long-term debt | 212 | | | 349 | | | 321 | | | 2.24 | | | 3.74 | | | 3.57 | |
| Total interest-bearing liabilities | 423 | | | 988 | | | 760 | | | 0.55 | | | 1.34 | | | 1.06 | |
| Net interest income | $ | 3,245 | | | $ | 3,239 | | | $ | 3,219 | | | | | | | |
| | | | | | | | | | | |
| Net interest rate spread | | | | | | | 2.83 | | | 2.91 | | | 3.06 | |
| Impact of noninterest-bearing funds on margin | | | | | | | 0.16 | | | 0.35 | | | 0.27 | |
| Net interest margin | | | | | | | 2.99 | % | | 3.26 | % | | 3.33 | % |
(1)FTE yields are calculated assuming a 21% tax rate.
(2)Deposits in Federal Reserve Bank were treated as non-earning assets prior to 4Q 2018.
(3)For purposes of this analysis, NALs are reflected in the average balances of loans.
(4)Includes consumer certificates of deposit of $250,000Net interest income for 2023 increased $166 million, or more.
(5)Average rates include the impact of applicable derivatives. Loan and lease and deposit average rates also include impact of applicable non-deferrable and amortized fees.
2020 versus 2019
Fully-taxable equivalent3%, from 2022. FTE net interest income, a non-GAAP financial measure, for 20202023 increased $6$177 million, or 3%, from 2019.2022. The increase reflects the benefit of a $8.9in FTE net interest income reflected an increase in yields on loans and leases and investment securities and an $8.3 billion, or 9%5%, increase in average total earning assets, partially offset by higher cost of funds and a 27 basis point decrease$15.3 billion, or 13%, increase in average interest-bearing liabilities.
Net interest income for 2023 included $30 million of net interest income from purchase accounting accretion, compared to $61 million and $21 million from purchase accounting accretion and accelerated PPP loan fees recognized upon forgiveness payments from the FTE NIM to 2.99%.SBA, respectively, in 2022.
Average earningBalance Sheet
Average assets of $187.6 billion for 20202023 increased $8.9$8.8 billion, or 9%5%, from the prior year, reflecting loan growth of $4.4 billion, or 6% and an increase of $3.3 billion or 602%2022, primarily due to increases in interest-bearing deposits at the Federal Reserve Bank. Averageaverage loans and leases increased $4.4of $5.7 billion, or 6%, primarily reflecting an increase of $3.5 billion in average commercial loans, primarily PPP loans, and an increase in average residential mortgage loans and RV and marine loans.
Average total interest-bearing liabilities increased $3.2 billion, reflecting an increase in average total interest-bearing deposits of $4.3 billion, or 7%, partially offset by a $1.3 billion or 53%, decrease in short‐term borrowings. The increase in average in interest bearing deposits was primarily driven by business and commercial growth related to the PPP loans and increased liquidity levels in reaction to the economic downturn, consumer growth largely related to government stimulus, increased consumer and business banking account production, and reduced attrition. Specifically within core deposits, average total interest bearing demand deposits increased $3.7 billion, or 18%5%, and average money marketinterest-earning deposits increased $1.9with banks of $4.5 billion, or 8%. These increases were92%, partially offset by a decrease in average core CDstotal securities of $3.0$1.4 billion, or 53%3%. The increase in average loans and leases was driven by growth in average commercial loans and leases of $4.0 billion, or 6%, and average consumer loans of $1.6 billion, or 3%.
Average liabilities for 2023 increased $8.4 billion, or 5%, from 2022, primarily due to increases in average borrowings and deposits. Average borrowings increased $5.2 billion, or 46%, driven by new debt issuances and higher FHLB borrowings reflecting the maturityactions taken as part of balances relatedongoing management of funding needs. Total average deposits increased $2.5 billion, or 2%, primarily due to the 2018 consumer deposit growth initiatives. Brokeredan increase in average interest-bearing deposits of $10.1 billion, or 10%, largely due to increases in average certificates of deposits and negotiable CDs increased $1.0 billion or 36%, reflecting balance growth in new and existing brokered deposit accounts.
The NIM compression reflected an 87 basis point decline in average earning asset yields, a 19 basis point decline in the benefit from noninterest-bearing funds,money market deposits, partially offset by a 79 basis point decrease in average funding costs. The decline in average earning asset yields isnoninterest-bearing deposits of $7.6 billion, or 18%.
Average shareholders’ equity for 2023 increased $371 million, or 2%, from 2022 primarily due to lowerearnings net of dividends, a reduction in average accumulated other comprehensive loss driven by changes in interest rates, on loans (down 84 basis points), a decline in securities yields and elevated deposits at the Federal Reserve Bank. The decline in average funding costs is primarily driven by lower costnet issuance of interest-bearing deposits (down 64 basis points) and long-term debt (down 150 basis points).preferred stock.
50 Huntington Bancshares Incorporated
Provision for Credit Losses
(This section should be read in conjunction with the “Credit Risk” section.) The provision for credit losses is the expense necessary to maintain the ALLL and the AULCACL at levels appropriate to absorb our estimate of credit losses expected over the life of the loan and lease portfolio, securities portfolio, and the portfolio of unfunded loan commitments and letters of credit.lending commitments.
The provision for credit losses in 20202023 was $1.0 billion, up $761$402 million, an increase of $113 million, or 265%39%, from 2019.2022. The increase in provision expense over the prior year was primarily attributed todriven by a combination of loan and lease growth and modest overall ACL coverage ratio builds throughout 2023 that is reflective of the deterioration incurrent macroeconomic environment.
The components of the macroeconomic environment resulting from the COVID-19 pandemic and risk rating downgrades within the commercial portfolio.provision for credit losses were as follows:
| | | | | | | | | | | | | | | | | | | | | | | | | | | |
| Table 4 - Provision for Credit Losses |
| Year Ended December 31, |
| (dollar amounts in millions) | 2023 | | | | | | | | 2022 | | 2021 | | | | |
| Provision for loan and lease losses | $ | 407 | | | | | | | | | $ | 212 | | | $ | (1) | | | | | |
| Provision for unfunded lending commitments | (5) | | | | | | | | | 73 | | | 26 | | | | | |
| Provision for securities | — | | | | | | | | | 4 | | | — | | | | | |
| Total provision for credit losses | $ | 402 | | | | | | | | | $ | 289 | | | $ | 25 | | | | | |
53 Huntington Bancshares Incorporated
Noninterest Income
The following table reflects noninterest income for each of the periods presented:
| Table 4 - Noninterest Income | | Table 5 - Noninterest Income | | Table 5 - Noninterest Income |
| | | Year Ended December 31, | | Year Ended December 31, |
| | | Change from 2022 | | | | | Change from 2022 | | | | Change from 2021 | | |
| (dollar amounts in millions) | (dollar amounts in millions) | | Change from 2019 | | | | Change from 2018 | | | (dollar amounts in millions) | 2023 | | Amount | | Percent | | 2022 | | Amount | | Percent | | 2021 |
| 2020 | | Amount | | Percent | | 2019 | | Amount | | Percent | | 2018 |
| Payments and cash management revenue | |
| Wealth and asset management revenue | |
| Customer deposit and loan fees | |
| Capital markets and advisory fees | |
| Leasing revenue | |
| Mortgage banking income | Mortgage banking income | $ | 366 | | | $ | 199 | | | 119 | % | | $ | 167 | | | $ | 59 | | | 55 | % | | $ | 108 | |
| Service charges on deposit accounts | 301 | | | (71) | | | (19) | | | 372 | | | 8 | | | 2 | | | 364 | |
| Card and payment processing income | 248 | | | 2 | | | 1 | | | 246 | | | 22 | | | 10 | | | 224 | |
| Trust and investment management services | 189 | | | 11 | | | 6 | | | 178 | | | 7 | | | 4 | | | 171 | |
| Capital markets fees | 125 | | | 2 | | | 2 | | | 123 | | | 15 | | | 14 | | | 108 | |
| Insurance income | Insurance income | 97 | | | 9 | | | 10 | | | 88 | | | 6 | | | 7 | | | 82 | |
| Bank owned life insurance income | Bank owned life insurance income | 64 | | | (2) | | | (3) | | | 66 | | | (1) | | | (1) | | | 67 | |
| Gain on sale of loans | Gain on sale of loans | 42 | | | (13) | | | (24) | | | 55 | | | — | | | — | | | 55 | |
| Net (losses) gains on sales of securities | (1) | | | 23 | | | 96 | | | (24) | | | (3) | | | (14) | | | (21) | |
| Net gains (losses) on sales of securities | |
| Other noninterest income | Other noninterest income | 160 | | | (23) | | | (13) | | | 183 | | | 20 | | | 12 | | | 163 | |
| Total noninterest income | Total noninterest income | $ | 1,591 | | | $ | 137 | | | 9 | % | | $ | 1,454 | | | $ | 133 | | | 10 | % | | $ | 1,321 | |
2020 versus 2019
Noninterest2023 noninterest income was $1.6$1.9 billion, up $137a decrease of $60 million, or 9%3%, from the prior year. Gain on sale of loans decreased $43 million, or 75%, primarily resulting from the strategic decision to retain the guaranteed portion of SBA loans at origination. Customer deposit and loan fees decreased $38 million, or 11%, primarily due to program changes and a reduction in loan commitment fees. Mortgage banking income increased $199decreased $35 million, or 119%24%, primarily reflecting higherlower secondary marketing spreads and lower salable volume. Capital markets and advisory fees decreased $17 million, or 6%, primarily due to lower interest rate derivative and trading fees, partially offset by an increase in salable mortgage originations. Trust and investment managementadvisory fees. Partially offsetting these decreases, other noninterest income increased $11$37 million, or 86%, primarily due to an increase in investment management account fees and an increase in personal trust income reflecting strong sales activities and market performance. While there were no material gains or losses on sales of securities in the current year, 2019 included $22 million of net losses related to the $2 billion portfolio repositioning. Offsetting these increases, service charges on deposit accounts decreased $71 million, or 19%, primarily reflecting reduced customer activity and elevated deposits. Gains on the sale of loans decreased $13 million, or 24%, due largely to a decline in SBA sales gains. Other noninterest income decreased $23 million, or 13%, reflecting several notable items impacting both periods as well as lower fixed income brokerage revenue, lower deposit placement fees and operating lease income. Notable items in 2020 included a $13 million gain on the annuitization of a retiree health plan and a $5$57 million gain on the sale of our RPS business, including associated goodwill allocation, partially offset by $24 million of unfavorable mark-to-market related to the retirement plan services recordkeeping business whereas 2019 included a $14pay-fixed swaptions program. Wealth and asset management revenue increased $28 million, gain from the sale of Wisconsin retail branches.or 9%, primarily due to an increase in annuity commissions. Payments and cash management revenue increased $24 million, or 4%, primarily due to higher debit and credit card transaction revenue.
| | | | | | | | | | | | | | | | | | | | | | | | | | | | | | | | | | | | | | | | | |
| Noninterest Expense | | | | | | | | | | | | | |
| | | | |
| | | | |
| The following table reflects noninterest expense for each of the periods presented: | | | | |
| | | | | | | | | | | | | |
| Table 5 - Noninterest Expense |
| | Year Ended December 31, |
| (dollar amounts in millions) | | | Change from 2019 | | | | Change from 2018 | | |
| 2020 | | Amount | | Percent | | 2019 | | Amount | | Percent | | 2018 |
| Personnel costs | $ | 1,692 | | | $ | 38 | | | 2 | % | | $ | 1,654 | | | $ | 95 | | | 6 | % | | $ | 1,559 | |
| Outside data processing and other services | 384 | | | 38 | | | 11 | | | 346 | | | 52 | | | 18 | | | 294 | |
| Equipment | 180 | | | 17 | | | 10 | | | 163 | | | (1) | | | (1) | | | 164 | |
| Net occupancy | 158 | | | (1) | | | (1) | | | 159 | | | (25) | | | (14) | | | 184 | |
| Professional services | 55 | | | 1 | | | 2 | | | 54 | | | (6) | | | (10) | | | 60 | |
| Amortization of intangibles | 41 | | | (8) | | | (16) | | | 49 | | | (4) | | | (8) | | | 53 | |
| Marketing | 38 | | | 1 | | | 3 | | | 37 | | | (16) | | | (30) | | | 53 | |
| Deposit and other insurance expense | 32 | | | (2) | | | (6) | | | 34 | | | (29) | | | (46) | | | 63 | |
| Other noninterest expense | 215 | | | (10) | | | (4) | | | 225 | | | 8 | | | 4 | | | 217 | |
| Total noninterest expense | $ | 2,795 | | | $ | 74 | | | 3 | % | | $ | 2,721 | | | $ | 74 | | | 3 | % | | $ | 2,647 | |
| Number of employees (average full-time equivalent) | 15,578 | | | (86) | | | (1) | % | | 15,664 | | | (29) | | | — | % | | 15,693 | |
2020 versus 2019
Noninterest expense2022 noninterest income was $2.8$2.0 billion, up $74an increase of $92 million, or 3%5%, from the prior year. Capital markets and advisory fees increased $109 million, or 70%, primarily reflecting higher advisory fees supported by the impact of Capstone Partners acquisition, in addition to an increase in syndication, foreign exchange, and interest rate derivative fees. Payments and cash management revenue increased $60 million, or 12%, primarily due to the full-period impact on volume due to TCF customers, partially offset by program changes. Gain on sale of loans increased $48 million primarily due to sales of SBA loans during the first through third quarters of 2022. Customer deposit and loan fees increased $40 million, or 13%, primarily due to the full-period impact on volume due to TCF customers, partially offset by the impact from program changes. Wealth and asset management revenue increased $31 million, or 12%, primarily due to the full-period impact of the TCF acquisition and an increase in sales. Leasing revenue increased $27 million, or 27%, primarily due to the full-period impact of the TCF acquisition. Partially offsetting these decreases, mortgage banking income decreased $165 million, or 53%, primarily reflecting lower salable volume and secondary marketing spreads and bank owned life insurance decreased $13 million, or 19%, primarily due to valuation adjustments and lower benefit claims.
| | | | | | | | | | | | | | | | | | | | | | | | | | | | | | | | | | | | | | | | | |
| Noninterest Expense | | | | | | | | | | | | | |
| | | | |
| | | | |
| The following table reflects noninterest expense for each of the periods presented: | | | | |
| | | | | | | | | | | | | |
| Table 6 - Noninterest Expense |
| | Year Ended December 31, |
| | | Change from 2022 | | | | Change from 2021 | | |
| (dollar amounts in millions) | 2023 | | Amount | | Percent | | 2022 | | Amount | | Percent | | 2021 |
| Personnel costs | $ | 2,529 | | | $ | 128 | | | 5 | % | | $ | 2,401 | | | $ | 66 | | | 3 | % | | $ | 2,335 | |
| Outside data processing and other services | 605 | | | (5) | | | (1) | | | 610 | | | (240) | | | (28) | | | 850 | |
| Deposit and other insurance expense | 302 | | | 235 | | | NM | | 67 | | | 16 | | | 31 | | | 51 | |
| Equipment | 263 | | | (6) | | | (2) | | | 269 | | | 21 | | | 8 | | | 248 | |
| Net occupancy | 246 | | | — | | | — | | | 246 | | | (31) | | | (11) | | | 277 | |
| Marketing | 115 | | | 24 | | | 26 | | | 91 | | | 2 | | | 2 | | | 89 | |
| Professional services | 99 | | | 22 | | | 29 | | | 77 | | | (36) | | | (32) | | | 113 | |
| Amortization of intangibles | 50 | | | (3) | | | (6) | | | 53 | | | 5 | | | 10 | | | 48 | |
| Lease financing equipment depreciation | 27 | | | (18) | | | (40) | | | 45 | | | 4 | | | 10 | | | 41 | |
| Other noninterest expense | 338 | | | (4) | | | (1) | | | 342 | | | 19 | | | 6 | | | 323 | |
| Total noninterest expense | $ | 4,574 | | | $ | 373 | | | 9 | % | | $ | 4,201 | | | $ | (174) | | | (4) | % | | $ | 4,375 | |
| Number of employees (average full-time equivalent) | 19,955 | | | 35 | | | — | % | | 19,920 | | | 1,478 | | | 8 | % | | 18,442 | |
Noninterest expense was $4.6 billion, an increase of $373 million, or 9%, from the prior year. Deposit and other insurance expense increased $235 million primarily due to the FDIC DIF special assessment of $214 million and the 2 basis point higher base assessment rate enacted for the banking industry at the beginning of 2023. Personnel costs increased $38$128 million, or 2%5%, primarily due to $52 million of expense related to staffing efficiency initiatives, the impact of merit increases, and the impact of the Capstone Partners acquisition, partially offset by $8 million of acquisition-related expenses recognized in the prior year. Marketing expense increased $24 million, or 26%, primarily reflecting actions taken to deepen and acquire new customer relationships. Professional services expense increased salaries, incentives, commissions, contract help$22 million, or 29%, primarily due to an increase in consulting fees related to regulatory and overtime expense partially offset by lower payroll taxes. Outsidescale initiatives. Partially offsetting these increases, lease financing equipment depreciation decreased $18 million, or 40%, and outside data processing and other services increased $38decreased $5 million, or 11%1%, primarily driven bydue to a decrease of $41 million in acquisition-related expenses, related to technology investments. Equipment expense increased $17 million driven by increased depreciation and software development expense. Other noninterest expense decreased $10 million, or 4%, primarily as a result of a $23 million decrease in travel and business development expense and a $7 million insurance recovery in third quarter 2020. These decreases were partially offset by the $7 million of expense related to the November 2020 debt tenderhigher technology investments. Net occupancy remained unchanged as corporate real estate and branch consolidation expenses and a $20decrease in gain on sale of fixed assets were offset by $32 million donation to The Columbus Foundation compared to a $5 million donation during 2019.in acquisition-related expenses recognized in the prior year.
52 Huntington Bancshares Incorporated
Provision for Income Taxes
2020 versus 2019
The provision for income taxes was $155$413 million for 20202023, compared with a provision for income taxes of $248$515 million in 2019.2022. The effective tax rates for 20202023 and 20192022 were 15.9%17.3% and 15.0%18.6%, respectively. Both years included the benefits from tax-exempt income, tax-advantaged investments, general business credits, tax-exempt income, tax-exempt bank owned life insurance income and investments in qualified affordable housing projects, excessprojects. The decrease in the effective tax deductions for stock-based compensation,rate was largely due to lower pretax income, higher general business credits and an increase in discrete tax benefits, partially offset by capital losses.losses recognized in 2022.
The net federal deferred tax asset was $616 million, and the net state deferred tax asset was $94 million at December 31, 2023. As of December 31, 20202023 and 20192022, there was no valuation allowance on federal deferred taxes. In 2020,2023, a $5decrease of $1 million increase in the provision for state income taxes, net of federal tax effect, was recorded for the portion of state deferred tax assets that are not more likely than not to be realized, compared to 2019, where there was essentially no change.a decrease of $3 million, net of federal tax effect, in 2022.
RISK MANAGEMENT AND CAPITAL
Risk Governance
Risk awareness, identification and assessment, reporting, and active management are key elements in overall risk management. Controls include, among other, effective segregation of duties, access management, and authorization and reconciliation procedures, as well as staff education and a disciplined assessment process.
We use a multi-faceted approach to risk governance. It begins with the Board of Directors, definingwhich has defined our risk appetite as aggregate moderate-to-low.moderate-to-low, through-the-cycle. This does not preclude engagement in select higher risk activities. Rather, the definition is intended to represent an aggregate view of where we want our overall risk to be managed.
Three Board committees primarily oversee implementation and monitoring of the risk appetite:
•Our Risk Oversight Committee assists the Board in overseeing management of material risks, the approval and monitoring of our capital position and plan that aligns to our overall aggregate moderate-to-low, through-the-cycle risk appetite, the risk governance structure, compliance with applicable laws and regulations, and determining adherence to the board’s stated risk appetite. The ROC has oversight responsibility of our key risk exposures: credit, market, liquidity, compliance, operational, strategic, and reputational. Both our Chief Risk Officer and Credit Review Director report directly to the ROC. This committee also oversees our capital management and planning process, ensures that the amount and quality of capital are adequate in relation to expected and unexpected risks, and that our capital levels exceed “well-capitalized” requirements.
•Our Technology Committee assists our Board in fulfilling its oversight responsibilities with respect to all technology and cybersecurity strategies and plans. The Technology Committee is charged with evaluating Huntington’s capability to properly perform all technology functions necessary for its business plan, including projected growth, technology capacity, planning, operational execution, product development, and management capacity. Our Technology Committee provides oversight of technology investments and plans to drive efficiency as well as to meet defined standards for risk, information security, and redundancy. Our Technology Committee oversees the allocation of technology costs and ensures that they are understood by the Board. Our Technology Committee monitors and evaluates innovation and technology trends that may affect our strategic plans, including monitoring of overall industry trends. The Technology Committee reviews and provides oversight of our continuity and disaster recovery planning and preparedness.
552023 Form 10-K Huntington Bancshares Incorporated53
Three board committees primarily oversee implementation of this desired risk appetite and monitoring of our risk profile:
•TheOur Audit Committee oversees the integrity of the consolidated financial statements, including policies, procedures, and practices regarding the preparation of financial statements, the financial reporting process, disclosures, and internal control over financial reporting. The Audit Committee also provides assistance to the boardour Board in overseeing the internal audit divisiondepartment and the independent registered public accounting firm’s qualifications and independence; compliance with our Financial Code of Ethics for the chief executive officer and senior financial officers; and compliance with corporate securities trading policies.
•The Risk Oversight Committee assists the board of directors in overseeing management of material risks, the approval and monitoring of the Company’s capital position and plan supporting our overall aggregate moderate-to-low risk profile, the risk governance structure,policies; compliance with applicable lawslegal and regulations,regulatory requirements; and determining adherence tofinancial risk exposures in coordination with the board’s stated risk appetite. The committee has oversight responsibility with respect to the full range of inherent risks: credit, market, liquidity, legal, compliance/regulatory, operational, strategic, and reputational. The ROC provides assistance to the Board in overseeing the credit review division. This committee also oversees our capital management and planning process, ensures that the amount and quality of capital are adequate in relation to expected and unexpected risks, and that our capital levels exceed “well-capitalized” requirements.ROC.
•The Technology Committee assists the board of directors in fulfilling its oversight responsibilities with respect to all technology, cyber security, and third-party risk management strategies and plans. The committee is charged with evaluating Huntington’s capability to properly perform all technology functions necessary for its business plan, including projected growth, technology capacity, planning, operational execution, product development, and management capacity. The committee provides oversight of technology investments and plans to drive efficiency as well as to meet defined standards for risk, information security, and redundancy. The Committee oversees the allocation of technology costs and ensures that they are understood by the board of directors. The Technology Committee monitors and evaluates innovation and technology trends that may affect the Company’s strategic plans, including monitoring of overall industry trends. The Technology Committee reviews and provides oversight of the Company’s continuity and disaster recovery planning and preparedness.
TheOur Audit and Risk Oversight Committees routinely hold executive sessions with our key officers engaged in accounting and risk management. On a periodic basis, the two committees meet in joint session to cover matters relevant to both, such as the construct and appropriateness of the ACL, which is reviewed quarterly. All directors have access to information provided to each committee and all scheduled meetings are open to all directors.
TheOur Risk Oversight and Technology Committees routinely hold joint sessions to cover matters relevant to both such as cybersecurity and IT risk and control projects and risk assessments.
Further, through itsour Human Resources and Compensation Committee, the board of directorsour Board seeks to ensure its system of rewards is risk-sensitiveoverall compensation programs are balanced and alignsalign the interests of management, creditors, and shareholders. We utilize a variety of compensation-related tools to induce appropriate behavior, including common stock ownership thresholds for the chief executive officer and certain members of senior management, a requirement to hold until retirement or exit from the Company, a portion of net shares received upon exercise of stock options or release of restricted stock awards (50% for executive officers and 25% for other award recipients), equity deferrals, recoupment provisions, and the right to terminate compensation plans at any time.
Management has implemented an Enterprise Risk Management and Risk Appetite Framework. Critically important is our self-assessment process, in which each first-line business segment produces an analysis of its risks and the strength of its risk controls. The segment analyses are combined with assessments by our second-line risk management organization of major risk sectors (e.g., credit, market, liquidity, operational, compliance, strategic, and reputation) to produce an overall enterprise risk assessment. Outcomes of the process include a determination of the quality of the overall control process,environment, the direction of risk, and our position compared to the Board’s defined risk appetite.
Management also utilizes a wide seriesrange of metrics (key risk indicators) to monitor risk positions throughout the Company. In general, a rangethresholds for each metric isare established, which allows the Company in aggregate, to operate
within an aggregate moderate-to-low, through-the-cycle risk profile.appetite. Deviations from the rangethresholds will indicate if the risk being measured exceeds desired tolerance, which may then necessitate corrective action.
We also have four executive level committees to manage risk:and oversee risk, including: ALCO, Credit Policy and Strategy, Risk Management, and Capital Management. Each committee focuses on specific categories of risk and is supported by a series of subcommittees that are tactical in nature. We believe this structure helps ensure appropriate escalation of issues and overall communication of strategies.
Huntington utilizes three lines of defense with regard to risk management: (1) business segments, (2) corporate risk management, and (3) internal audit and credit review. To induce greater ownership of risk within itsour business segments, segment risk officers have been embedded in the business to identify and monitor risk, elevate and remediate issues, establish controls, perform self-testing, and oversee the self-assessment process. Corporate Risk Management establishes policies, sets operating limits, reviews new or modified products/processes, ensures consistency and quality assurance within the segments,oversees first-line risk-taking activity, and produces the enterprise risk assessment. The Chief Risk Officer has significant input into the design and outcome of incentive compensation plans as they apply to risk.plans. Internal Auditaudit and Credit Reviewcredit review provide additional assurance that risk-related functions are operating as intended.
Huntington classifies/aggregates risk into seven risk pillars. Huntington recognizes that risks can be interrelated or embedded within each other, and therefore managing across risk pillars is a key component of the framework. The following defines the Company’s risk pillars:
•Credit risk, which is the risk of loss due to loan and lease customers or other counterparties not being able to meet their financial obligations under agreed upon terms;
•Market risk, which occurs when fluctuations in interest rates impact earnings and capital. Financial impacts are realized through changes in the interest rates of balance sheet assets and liabilities (net interest margin) or directly through valuation changes of capitalized MSR and/or trading assets (noninterest income);
54 Huntington Bancshares Incorporated
•Liquidity risk, which is the risk to current or anticipated earnings or capital arising from an inability to meet obligations when they come due. Liquidity risk includes the inability to access funding sources or manage fluctuations in funding levels. Liquidity risk also results from the failure to recognize or address changes in market conditions that affect our ability to liquidate assets quickly and with minimal loss in value;
•Operational risk, which is the risk of loss arising from inadequate or failed internal processes or systems, including information security breaches or cyberattacks, human errors or misconduct, or adverse external events. Operational losses result from internal fraud, external fraud, inadequate or inappropriate employment practices and workplace safety, failure to meet professional obligations involving customers, products, and business practices, damage to physical assets, business disruption and systems failures, and failures in execution, delivery, and process management;
•Compliance risk, which exposes us to money penalties, enforcement actions, or other sanctions as a result of non-conformance with laws, rules, and regulations that apply to the financial services industry;
•Strategic risk, which is defined as risk to current or anticipated earnings, capital, or enterprise value arising from adverse business decisions, improper implementation of business decisions or lack of responsiveness to industry / market changes; and
•Reputation risk, which is the risk that negative publicity regarding an institution’s business practices, whether true or not, will cause a decline in the customer base, costly litigation, or revenue reductions.
A comprehensive discussion of risk management and capital matters affecting us can be found in the Risk Factors section included in Item 1A: Risk Factors and the “Regulatory Matters” section of Item 1: Business of this Form 10-K. Some of the more significant processes used to manage and control credit, market, liquidity, operational, and compliance risks are described in the following sections.
Credit Risk
Credit risk is the risk of financial loss if a counterparty is not able to meet the agreed upon terms of the financial obligation. The majority of our credit risk is associated with lending activities, as the acceptance and management of credit risk is central to profitable lending. We also have credit risk associated with our investment securities portfolios (see Note 4 - "Investment Securities and Other Securities" of the Notes to Consolidated Financial Statements). We engage with other financial counterparties for a variety of purposes including investing, asset and liability management, mortgage banking, and trading activities. A variety of derivative financial instruments, principally interest rate swaps, caps, swaptions, swaption collars, floors, forward contracts, and collars,forward starting interest rate swaps are used in asset and liability management activities to protect against the risk of adverse price or interest rate movements. HuntingtonWe also usesuse derivatives, principally loan sale commitments, in hedging itsour mortgage loan interest rate lock commitments and its mortgage loans held for sale. While there is credit risk associated with derivative activity, we believe this exposure is minimal. (See Note 1 - "Significant Accounting Policies" of the Notes to Consolidated Financial Statements.) We focus on the early identification, monitoring, and management of all aspects of our credit risk. In addition to the traditional credit risk mitigation strategies of credit policies and processes, market risk management activities, and portfolio diversification, we use quantitative measurement capabilities utilizing external data sources, enhanced modeling technology, and internal stress testing processes. Our continued ongoing expansion of portfolio management resources is central to our our commitment to maintaining an aggregate moderate-to-low, through-the-cycle risk profile.appetite. In our efforts to identify risk mitigation techniques, we have focused on product design features, origination policies, and solutions for delinquent or stressed borrowers.
The maximum level of credit exposure to individual credit borrowers is limited by policy guidelines based on the perceived risk of each borrower or related group of borrowers. All authorityAuthority to grant commitments sits with the independent credit administration function, with limited exceptions, and is closely monitored and regularly updated. Concentration risk is managed through limits on loan type, geography, industry, and loan quality factors. We focus predominantly on extending credit to retailconsumer and commercial customers with existing or expandable relationships within our primary banking markets, although we will consider lending opportunities outside our primary markets if we believe the associated risks are acceptable and aligned with strategic initiatives. Although we offer a broad set of products, we continue to develop new lending products and opportunities. Each of these new products and opportunities goes through a rigorous development and approval process prior to implementation to ensure our overall objective of maintaining an aggregate moderate-to-low risk portfolio profile.
57 Huntington Bancshares Incorporated
The checks and balances in the credit process and the separation of the credit administration and risk management functions are designed to appropriately assess and sanction the level of credit risk being accepted, facilitate the early recognition of credit problems when they occur, and provide for effective problem asset management and resolution. For example, we do not extend additional credit to delinquent borrowers except in certain circumstances that substantially improve our overall repayment or collateral coverage position.
Over the course of 2020, we have assessed the impact of COVID-19 on our loan portfolio as we would with any natural disaster or significant economic decline. Huntington proactively addressed the situation by offering our customers payment deferrals and the suspension of late fees, while also suspending repossession and foreclosures. We believe that these decisions were prudent due to the widespread impact economic conditions had on both commercial and consumer borrowers. During the third quarter, we re-instated late fees and repossessions, while continuing to offer payment help to impacted borrowers. The longer term impact of our response is dependent upon a number of variables, including the prolonged impact of the COVID-19 virus and its impact on the economic recovery. Continued weakness in the labor market could lead to increased delinquencies and defaults in our consumer portfolio. Additionally, increased economic deterioration could lead to elevated default rates in our Commercial portfolio, specifically industries highly impacted by COVID-19.
Huntington initiated a customer centric payment deferral plan in mid-March 2020. The response across the consumer portfolios was immediate, with substantial deferral activity across the portfolio in March and April. Our commercial loan deferral activity was initiated in April and May. The vast majority of the deferrals granted to our customers, both commercial and consumer, have expired with positive subsequent payment patterns. The remaining deferrals in the consumer portfolios are centered in the residential portfolio, consistent with the generally longer-term payment deferral time frames.The post deferral performance to date for the consumer portfolios has been positive.Our customer assistance teams remain well positioned to continue to help our consumer customers who have been impacted by the current economic conditions. The commercial deferrals were primarily 90 days in length and began to expire in the third quarter of 2020 as expected. For commercial borrowers requiring additional modifications to existing terms and conditions, expiring deferrals were replaced with modified terms and conditions, including payment terms in some instances, to the extent appropriate, as we continue to work with our customers.
The table below summarizes our deferral activity as of December 31, 2020, September 30, 2020, and June 30, 2020 under our COVID-19-related forbearance and other customer accommodation programs that are guided by the CARES Act.
| | | | | | | | | | | | | | | | | | | | | | | | | | | | | | | | | | | | | | | | | | | | | | | | | | | | | | | | | | | |
| Table 6 - Loan and Lease Portfolio Deferrals |
| | December 31, 2020 | | September 30, 2020 | | June 30, 2020 |
| | Deferred | | | Deferred | | % of | | Deferred | | | Deferred | | % of | | Deferred | | | Deferred | | % of |
| (dollar amounts in millions) | | # of Loans | | | Balance | | Portfolio | | # of Loans | | | Balance | | Portfolio | | # of Loans | | | Balance | | Portfolio |
| Commercial: | | | | | | | | | | | | | | | | | | | | | |
| Commercial and industrial | | 331 | | | | $ | 75 | | | — | % | | 429 | | | | $ | 431 | | | 1 | % | | 5,584 | | | | $ | 3,186 | | | 9 | % |
| Commercial real estate: | | | | | | | | | | | | | | | | | | | | | |
| Construction | | 1 | | | | — | | | — | % | | 8 | | | | 40 | | | 3 | % | | 27 | | | | 90 | | | 8 | % |
| Commercial | | 18 | | | | 76 | | | 1 | % | | 77 | | | | 471 | | | 8 | % | | 536 | | | | 1,719 | | | 29 | % |
| Commercial real estate | | 19 | | | | 76 | | | 1 | % | | 85 | | | | 511 | | | 7 | % | | 563 | | | | 1,809 | | | 25 | % |
| Total commercial | | 350 | | | | 151 | | | — | % | | 514 | | | | 942 | | | 2 | % | | 6,147 | | | | 4,995 | | | 12 | % |
| Consumer: | | | | | | | | | | | | | | | | | | | | | |
| Automobile | | 348 | | | | 5 | | | — | % | | 1,226 | | | | 20 | | | — | % | | 21,984 | | | | 426 | | | 3 | % |
| Home equity | | 196 | | | | 15 | | | — | % | | 627 | | | | 49 | | | 1 | % | | 3,321 | | | | 267 | | | 3 | % |
| Residential mortgage (1) | | 967 | | | | 150 | | | 1 | % | | 2,121 | | | | 411 | | | 3 | % | | 3,322 | | | | 1,002 | | | 9 | % |
| RV and marine | | 15 | | | | 1 | | | — | % | | 88 | | | | 4 | | | — | % | | 2,200 | | | | 117 | | | 3 | % |
| Other consumer | | 3 | | | | — | | | — | % | | 169 | | | | 1 | | | — | % | | 1,336 | | | | 12 | | | 1 | % |
| Total consumer | | 1,529 | | | | 171 | | | — | % | | 4,231 | | | | 485 | | | 1 | % | | 32,163 | | | | 1,824 | | | 5 | % |
| Total loans and leases | | 1,879 | | | | $ | 322 | | | — | % | | 4,745 | | | | $ | 1,427 | | | 2 | % | | 38,310 | | | | $ | 6,819 | | | 9 | % |
| | | | | | | | | | | | | | | | | | | | | |
(1) Residential mortgage deferrals include GNMA serviced loans that entered forbearance and then subsequently were bought out of the pool: 750 loans for $108 million at December 31, 2020 and 1,272 loans for $178 million at September 30, 2020.
Loan and Lease Credit Exposure Mix
At December 31, 2020,2023, our loans and leases totaled $81.6$122.0 billion, representing a $6.2$2.5 billion, or 8%2%, increase compared to $75.4$119.5 billion at December 31, 2019.2022.
The table below provides the composition of our total loan and lease portfolio:
| | | | | | | | | | | | | | | | | | | | | | | | | | | | | | | | | | | |
| Table 7 - Loan and Lease Portfolio Composition |
| At December 31, |
| (dollar amounts in millions) | 2023 | | 2022 | | | | | | |
| Commercial: | | | | | | | | | | | | | | | | | | | |
| Commercial and industrial | $ | 50,657 | | | 42 | % | | $ | 48,121 | | | 41 | % | | | | | | | | | | | | |
| | | | | | | | | | | | | | | | | | | |
| | | | | | | | | | | | | | | | | | | |
| | | | | | | | | | | | | | | | | | | |
| | | | | | | | | | | | | | | | | | | |
| Commercial real estate | 12,422 | | | 10 | | | 13,640 | | | 11 | | | | | | | | | | | | | |
| Lease financing | 5,228 | | | 4 | | | 5,252 | | | 4 | | | | | | | | | | | | | |
| Total commercial | 68,307 | | | 56 | | | 67,013 | | | 56 | | | | | | | | | | | | | |
| Consumer: | | | | | | | | | | | | | | | | | | | |
| Residential mortgage | 23,720 | | | 20 | | | 22,226 | | | 19 | | | | | | | | | | | | | |
| Automobile | 12,482 | | | 10 | | | 13,154 | | | 11 | | | | | | | | | | | | | |
| Home equity | 10,113 | | | 8 | | | 10,375 | | | 9 | | | | | | | | | | | | | |
| RV and marine | 5,899 | | | 5 | | | 5,376 | | | 4 | | | | | | | | | | | | | |
| Other consumer | 1,461 | | | 1 | | | 1,379 | | | 1 | | | | | | | | | | | | | |
| Total consumer | 53,675 | | | 44 | | | 52,510 | | | 44 | | | | | | | | | | | | | |
| Total loans and leases | $ | 121,982 | | | 100 | % | | $ | 119,523 | | | 100 | % | | | | | | | | | | | | |
56 Huntington Bancshares Incorporated
Total commercial loans and leases were $42.6$68.3 billion at December 31, 2020,2023 and represented 52%56% of our total loan and lease credit exposure.exposure at that date. Our commercial loan portfolio is diversified by product type, customer size, and geography, within our footprint, and is comprised of the following (see Commercial Credit discussion):
C&I – C&I loans and leases are made to commercial customers for use in normal business operations to finance working capital needs, equipment purchases, or other projects.projects, and to institutional sponsors supporting REITs. We focus on borrowers doing business within our geographic regions.markets. C&I loans and leases are generally underwritten individually and secured with the assets of the company and/or the personal guarantee of the business owners. The financing of owner-occupied facilities is considered a C&I loan even though there is improved real estate as collateral. This treatment is a result of the credit decision process, which focuses on cash flow from operations of the business to repay the debt. The operation, sale, rental, or refinancing of the real estate is not considered the primary repayment source for these types of loans. As we have expanded our C&I portfolio, we have developed a series of “vertical specialties” to ensure that new products or lending types are embedded within a structured, centralized Commercial Lending area with designated, experienced credit officers. These specialties are comprised of either targeted industries (for example, Healthcare, Foodhealthcare, technology & Agribusiness, Financetelecom, finance and Insurance,insurance, etc.) and/or lending disciplines (Equipment Finance, Asset Based Lending,(equipment finance, distribution finance, asset-based lending, etc.), all of which requires a high degree of expertise and oversight to effectively mitigate and monitor risk. As such, we have dedicated colleagues and teams focused on bringing value-added expertise to these specialty clients.customers.
CRE – The CRE portfolio includes both CRE commercial and CRE construction loans. CRE commercial loans consist ofare loans to developers and REITs supporting income-producing or for-sale commercial real estate properties.developers. We mitigate our risk on these loans by requiring collateral values that exceed the loan amount and underwriting the loan with projected cash flow in excess of the debt service requirement. These loans are made to finance properties such as apartment buildings, office and industrial buildings, and retail shopping centers, and are repaid through cash flows related to the operation, sale, or refinance of the property. For loans secured by real estate, appropriateAppropriate appraisals are obtained at origination and updated on an as needed basis in compliance with regulatory requirements.
Constructionrequirements and our credit policies. CRE – Construction CRE construction loans are loans to developers, companies, or individuals used for the construction of a commercial or residential property for which repayment will be generated by the sale or permanent financing of the property. Our CRE construction CRE portfolio primarily consists of retail, multi-family, office,retail, and warehouse projectproperty types. Generally, these loans are for construction projects that have been pre-sold or pre-leased, or have secured permanent financing, as well as loans to real estate companies with significant equity invested in each project. These loans are underwritten and managed by a specialized real estate lending group that actively monitors the construction phase and manages the loan disbursements according to the predetermined construction schedule.
Lease Financing – Lease financing products are designed to address the diverse financing needs of small to large companies primarily for the acquisition of equipment. Our lease financing portfolio will utilize a variety of origination partners and third-party sources including equipment manufacturers, dealers, or vendors set up under program structures to generate transactions from a nationwide footprint. High level business lines comprise of industrial finance, specialty finance, healthcare finance, technology finance, and specialized transportation, franchise, & government.
Total consumer loans and leases were $39.0$53.7 billion at December 31, 2020,2023 and represented 48%44% of our total loan and lease credit exposure.exposure at that date. The consumer portfolio is comprised primarily of residential mortgages, automobile loans, home equity loans and lines-of-credit, residential mortgages, and RV and marine finance (see Consumer Credit discussion).
Residential mortgage – Residential mortgage loans represent loans to consumers for the purchase or refinance of a residence. These loans are generally financed over a 15-year to 30-year term, and in most cases, are extended to borrowers to finance their primary residence. Applications are underwritten centrally using consistent credit policies and processes. All residential mortgage loan decisions utilize a full appraisal for collateral valuation. Huntington has not originated or acquired residential mortgages that allow negative amortization or allow the borrower multiple payment options.
Automobile – Automobile loans are comprised primarily of loans made through automotive dealerships and include exposure in selected states outside of our primary banking markets. The exposure outside of our core footprint states represents 27%17% of the total exposure, with no individual state representing more than 6%. Applications are underwritten using an automated underwriting system that applies consistent policies and processes across the portfolio.
Home equity – Home equity lending includes both home equity loans and lines-of-credit. This type of lending, which is secured by a first-lien or junior-lien on the borrower’s residence, allows customers to borrow against the equity in their home or refinance existing mortgage debt. Products include closed-end loans which are generally fixed-rate with principal and interest payments, and variable-rate, interest-only lines-of-credit which do not require payment of principal during the 10-year revolving period. The home equity line of credit converts to a 20-year amortizing structure at the end of the revolving period. Applications are underwritten centrally in conjunction with an automated underwriting system. The home equity underwriting criteria is based on
59 Huntington Bancshares Incorporated
minimum credit scores, debt-to-income ratios, and LTV ratios, with current collateral valuations. The underwriting for the floating rate lines of credit also incorporates a stress analysis for rising interest rates.
Residential mortgage – Residential mortgage loans represent loans to consumers for the purchase or refinance of a residence. These loans are generally financed over a 15-year to 30-year term, and in most cases, are extended to borrowers to finance their primary residence. Applications are underwritten centrally using consistent credit policies and processes. All residential mortgage loan decisions utilize a full appraisal for collateral valuation. Huntington has not originated or acquired residential mortgages that allow negative amortization or allow the borrower multiple payment options.
RV and marine – RV and marine loans are loans provided to consumers for the purpose of financing recreational vehicles and boats. Loans are originated on an indirect basis through a series of dealerships across 3435 states. The loans are underwritten centrally using an application and decisioning system similar to automobile loans. The current portfolio includes 23%24% of the balances within our core footprint states.
Other consumer – Other consumer loans primarily consists of consumer loans not secured by real estate, including credit cards, personal unsecured loans, and overdraft balances. We originate these products within our established set of credit policies and guidelines.
The table below provides the composition of our totalOur loan and lease portfolio:
| | | | | | | | | | | | | | | | | | | | | | | | | | | | | | | | | | | | | | | | | | | | | | | | | | | | | | | | | | | |
| Table 7 - Loan and Lease Portfolio Composition |
| At December 31, |
| (dollar amounts in millions) | 2020 | | 2019 | | 2018 | | 2017 | | 2016 |
| Commercial: | | | | | | | | | | | | | | | | | | | |
| Commercial and industrial | $ | 35,373 | | | 43 | % | | $ | 30,664 | | | 41 | % | | $ | 30,605 | | | 41 | % | | $ | 28,107 | | | 40 | % | | $ | 28,059 | | | 42 | % |
| Commercial real estate: | | | | | | | | | | | | | | | | | | | |
| Construction | 1,035 | | | 1 | | | 1,123 | | | 1 | | | 1,185 | | | 2 | | | 1,217 | | | 2 | | | 1,446 | | | 2 | |
| Commercial | 6,164 | | | 8 | | | 5,551 | | | 7 | | | 5,657 | | | 8 | | | 6,008 | | | 9 | | | 5,855 | | | 9 | |
| Commercial real estate | 7,199 | | | 9 | | | 6,674 | | | 8 | | | 6,842 | | | 10 | | | 7,225 | | | 11 | | | 7,301 | | | 11 | |
| Total commercial | 42,572 | | | 52 | | | 37,338 | | | 49 | | | 37,447 | | | 51 | | | 35,332 | | | 51 | | | 35,360 | | | 53 | |
| Consumer: | | | | | | | | | | | | | | | | | | | |
| Automobile | 12,778 | | | 16 | | | 12,797 | | | 17 | | | 12,429 | | | 16 | | | 12,100 | | | 17 | | | 10,969 | | | 16 | |
| Home equity | 8,894 | | | 11 | | | 9,093 | | | 12 | | | 9,722 | | | 13 | | | 10,099 | | | 14 | | | 10,106 | | | 15 | |
| Residential mortgage | 12,141 | | | 15 | | | 11,376 | | | 15 | | | 10,728 | | | 14 | | | 9,026 | | | 13 | | | 7,725 | | | 12 | |
| RV and marine | 4,190 | | | 5 | | | 3,563 | | | 5 | | | 3,254 | | | 4 | | | 2,438 | | | 3 | | | 1,846 | | | 3 | |
| Other consumer | 1,033 | | | 1 | | | 1,237 | | | 2 | | | 1,320 | | | 2 | | | 1,122 | | | 2 | | | 956 | | | 1 | |
| Total consumer | 39,036 | | | 48 | | | 38,066 | | | 51 | | | 37,453 | | | 49 | | | 34,785 | | | 49 | | | 31,602 | | | 47 | |
| Total loans and leases | $ | 81,608 | | | 100 | % | | $ | 75,404 | | | 100 | % | | $ | 74,900 | | | 100 | % | | $ | 70,117 | | | 100 | % | | $ | 66,962 | | | 100 | % |
Our loan portfolio is a managed mix of consumer and commercial credits. At the corporate level, weWe manage the overall credit exposure and portfolio composition via a credit concentration policy. The policy designates specific loan types, collateral types, and loan structures to be formally tracked and assigned maximum exposure limits as a percentage of capital. C&ICommercial lending by NAICS categories, specific limits for CRE project types, loans secured by residential real estate, large dollar exposures, and designated high risk loan categories represent examples of specifically tracked components of our concentration management process. There are no identified concentrations that exceed the assigned exposure limit. Our concentration management policy is approved by the ROC of the Board of Directors and is used to ensure a high quality, well diversified portfolio that is consistent with our overall objective of maintaining an aggregate moderate-to-low, through-the-cycle risk profile.appetite. Changes to existing concentration limits, incorporating specific information relating to the potential impact on the overall portfolio composition and performance metrics, require the approval of the ROC prior to implementation.
2020 Form 10-K 5860 Huntington Bancshares Incorporated
The table below provides our total loan and lease portfolio segregated by industry type. The changes in the industry composition from December 31, 20192022 are consistent with the portfolio growth metrics.
| | Table 8 - Loan and Lease Portfolio by Industry Type | Table 8 - Loan and Lease Portfolio by Industry Type | | Table 8 - Loan and Lease Portfolio by Industry Type | | At December 31, |
| (dollar amounts in millions) | (dollar amounts in millions) | December 31, 2020 | | December 31, 2019 | (dollar amounts in millions) | | 2023 | | 2022 |
| | PPP Loans | | Total Loans (2) | | |
| Commercial loans and leases: | Commercial loans and leases: | | | | | |
| Real estate and rental and leasing | $ | 192 | | | $ | 6,962 | | | 9 | % | | $ | 6,662 | | | 9 | % |
| Commercial loans and leases: | |
| Commercial loans and leases: | |
| Real estate and rental and leasing (1) | |
| Real estate and rental and leasing (1) | |
| Real estate and rental and leasing (1) | | | $ | 15,897 | | | 13 | % | | $ | 16,310 | | | 14 | % |
| Retail trade (2) | |
| Manufacturing | Manufacturing | 826 | | | 5,556 | | | 7 | | | 5,248 | | | 7 | |
| Retail trade (1) | 631 | | | 5,111 | | | 6 | | | 5,239 | | | 7 | |
| Health care and social assistance | 801 | | | 3,646 | | | 4 | | | 2,498 | | | 3 | |
| Finance and insurance | 123 | | | 3,389 | | | 4 | | | 3,307 | | | 4 | |
| Finance and insurance (1) | |
| Health care and social assistance (1) | |
| Wholesale Trade | |
| Accommodation and food services | Accommodation and food services | 781 | | | 3,100 | | | 4 | | | 2,072 | | | 3 | |
| Wholesale trade | 374 | | | 2,652 | | | 3 | | | 2,437 | | | 3 | |
| Transportation and warehousing | |
| Utilities | |
| Professional, scientific, and technical services | Professional, scientific, and technical services | 704 | | | 2,051 | | | 3 | | | 1,360 | | | 2 | |
| Other services | 312 | | | 1,613 | | | 2 | | | 1,310 | | | 2 | |
| Transportation and warehousing | 184 | | | 1,401 | | | 2 | | | 1,207 | | | 2 | |
| Other Services | |
| Construction | Construction | 586 | | | 1,389 | | | 2 | | | 900 | | | 1 | |
| Admin./Support/Waste Mgmt. and Remediation Services | Admin./Support/Waste Mgmt. and Remediation Services | 239 | | | 975 | | | 1 | | | 731 | | | 1 | |
| Arts, entertainment, and recreation | |
| Information | Information | 77 | | | 829 | | | 1 | | | 649 | | | 1 | |
| Utilities | 19 | | | 793 | | | 1 | | | 546 | | | 1 | |
| Arts, entertainment, and recreation | 73 | | | 744 | | | 1 | | | 690 | | | 1 | |
| Educational services | 111 | | | 735 | | | 1 | | | 463 | | | — | |
| Public Administration | 12 | | | 662 | | | 1 | | | 261 | | | — | |
| Public administration | |
| Agriculture, forestry, fishing, and hunting | |
| Educational Services | |
| Management of companies and enterprises | |
| Mining, quarrying, and oil and gas extraction | Mining, quarrying, and oil and gas extraction | 27 | | | 601 | | | — | | | 1,304 | | | 2 | |
| Agriculture, forestry, fishing and hunting | 19 | | | 157 | | | — | | | 154 | | | — | |
| Management of companies and enterprises | 16 | | | 144 | | | — | | | 105 | | | — | |
| Unclassified/Other | 10 | | | 64 | | | — | | | 195 | | | — | |
| Unclassified/other | |
| Total commercial loans and leases by industry category | Total commercial loans and leases by industry category | $ | 6,117 | | 6117000000 | 42,572 | | | 52 | % | | 37,338 | | | 49 | % |
| Residential mortgage | |
| Automobile | Automobile | | | 12,778 | | | 16 | | | 12,797 | | | 17 | |
| Home Equity | Home Equity | | 8,894 | | | 11 | | | 9,093 | | | 12 | |
| Residential mortgage | | 12,141 | | | 15 | | | 11,376 | | | 15 | |
| RV and marine | RV and marine | | 4,190 | | | 5 | | | 3,563 | | | 5 | |
| Other consumer loans | Other consumer loans | | 1,033 | | | 1 | | | 1,237 | | | 2 | |
| Total loans and leases | Total loans and leases | | $ | 81,608 | | | 100 | % | | $ | 75,404 | | | 100 | % | Total loans and leases | | $ | 121,982 | | | 100 | | 100 | % | | $ | 119,523 | | | 100 | | 100 | % |
|
(1) Non-real estate secured commercial loans to REITs, which are classified in the C&I loan category, are included in the real estate, finance and insurance, and
health care industry types.
(2) Amounts include $2.4$3.3 billion and $3.7$2.3 billion of auto dealer services loans at December 31, 20202023 and December 31, 2019,2022, respectively.
(2) Total loans include PPP loans outstanding at December 31, 2020.
Commercial Credit
The primary factors considered in commercial credit approvals are the financial strength of the borrower, assessment of the borrower’s management capabilities, cash flows from operations, industry sector trends, type and sufficiency of collateral, type of exposure, transaction structure, and the general economic outlook. While these are the primary factors considered, there are a number of other factors that may be considered in the decision process. We utilize centralized previewrequire the signature approval of both the appropriate line of business leaders and loan approval committees, led by ourindependent credit officers.executives. The risk rating, credit exposure amount, and complexity of the credit determines the threshold for approval. Credit officers who understand each local region and are experienced in the industries and loan structures of the requested credit exposure are involved in all loan decisions not requiring loan committee approval and have the primary credit authority, with the exception of small business loans. For small business loans, we utilize a centralized loan approval process for standard products and structures. In this centralized decision environment, certain individuals who understand each local region may make credit-extension decisions to preserve our commitment to the communities
61 Huntington Bancshares Incorporated
in which we operate. In addition to disciplined and consistent judgmental factors, a sophisticated credit scoring process is used as a primary evaluation tool in the determination of approving a loan.
In commercial lending, on-going credit management is dependent on the type and nature of the loan. We monitor all significant exposures. All commercial credit extensions are assigned internal risk ratings reflecting the borrower’s PD and LGD. This two-dimensional rating methodology provides granularity in the portfolio management process. The PD is rated and applied at the borrower level. The LGD is rated and applied based on the specific type of credit extension and the quality and lien position associated with the underlying collateral. The internal risk ratings are assessed at origination and updated at each periodic monitoring event. There is also extensive macro-portfolio management analysis. We review and adjust our risk-rating criteria based on actual experience, which provides us with the current risk level in the portfolio and is the basis for determining an appropriate ACL amount.portfolio. A centralized portfolio management teamfunction monitors and reports on the performance of the entire commercial portfolio, including small business loans, to provide consistent oversight.
In addition to the initial credit analysis conducted during the approval process, our Credit Reviewcredit review group performs testing to provide an independent review and assessment of the quality and risk of new loan originations. This group is part of our Risk Management area and conducts portfolio reviews on a risk-based cycle to evaluate individual loans, validate risk ratings, and test the consistency of credit processes.
Our standardized loan grading system considers many components that directly correlate to loan quality and likelihood of repayment, one of which is guarantor support. On an at least annual basis, we consider, among other things, the guarantor’s reputation and creditworthiness, where available, along with various key financial metrics such as liquidity and net worth. Our assessment of the guarantor’s credit strength, or lack thereof, is reflected in our risk ratings for such loans, which is directly tied to, and an integral component of, our ACL methodology. When a loan goes to impaired status, viable guarantor support is considered in the determination of a credit loss.
If our assessment of the guarantor’s credit strength yields an inherent capacity to perform, we will seek repayment from the guarantor as part of the collection process and have done so successfully.
Substantially all loans categorized as Classified (See Note 5 - “Loans /and Leases” of the Notes to Consolidated Financial Statements) are managed by FRG. FRG is a specialized group of credit professionals that handle the day-to-day management of workouts, commercial recoveries, and problem loan sales. Its responsibilities include developing and implementing action plans, assessing risk ratings, and determining the appropriateness of the allowance, the accrual status, and the ultimate collectability of the Classified loan portfolio. C&I PORTFOLIO
We manage the risks inherent in the C&I portfolio through origination policies, a defined loan concentration policy with established limits, on-going loan-level and portfolio-level reviews, recourse requirements, and continuous portfolio risk management activities. Our origination policies for the C&I portfolio include loan product-type specific policies such as LTV and debt service coverage ratios, as applicable.
60 Huntington Bancshares Incorporated
The C&I portfolio continues to have solid origination activity while we maintain a focus on high quality originations. We continue to maintain a proactive approach to identifying borrowers that may be facing financial difficulty in order to maximize the potential credit outcomes. Subsequent to the origination of the loan, the Credit Reviewcredit review group provides an independent review and assessment of the quality of the underwriting and risk of new loan originations.
CRE PORTFOLIO
We manage the risks inherent in this portfolio specific to CRE lending, focusing on the quality of the developer and the specifics associated with each project. Generally, we: (1) limit our loans to 80% of the appraised value of the commercial real estate at origination, (2) require net operating cash flows to be 120% of required interest and principal payments, and (3) if the commercial real estate is non-owner occupied, require that pre-leasing generategenerates break-even interest-only debt service. We actively monitor property-type concentrations and both geographic and project-type concentrations andproperty-type performance metrics of all CRE loan types, with a focus on loans identified as higher risk based on the risk rating methodology. Both macro-level and loan-level stress-test scenarios based on existing and forecast market conditions are part of the on-going portfolio management process for the CRE portfolio.
Dedicated real estate professionals originate and manage the portfolio. The portfolio is diversified by project typeproperty-type and loan size, and this diversification represents a significant portion of the credit risk management strategies employed for this portfolio. Subsequent to the origination of the loan, the Credit Reviewcredit review group provides an independent review and assessment of the quality of the underwriting and risk of new loan originations.
The following tables present our commercial real estate portfolio by property-type and geographic location.
| | | | | | | | | | | | | | | | | | | | | | | | | | | | | |
| Table 9 - Commercial Real Estate Portfolio by Property-type |
| At December 31, 2023 | | At December 31, 2022 | | | | | | |
| (dollar amounts in millions) | Amount by Property-Type | | % of Total Loans and Leases | | Amount by Property-Type | | % of Total Loans and Leases | | | | | | |
| | | | | | | | | | | | | |
| Multi-family | $ | 4,708 | | | 4 | % | | $ | 4,701 | | | 4 | % | | | | | | |
| Warehouse/industrial | 2,029 | | | 2 | | | 2,256 | | | 2 | | | | | | | |
| Office | 1,825 | | | 1 | | | 2,167 | | | 2 | | | | | | | |
| Retail | 1,725 | | | 1 | | | 1,841 | | | 1 | | | | | | | |
| Hotel | 938 | | | 1 | | | 1,186 | | | 1 | | | | | | | |
| | | | | | | | | | | | | |
| Other | 1,197 | | | 1 | | | 1,489 | | | 1 | | | | | | | |
| Total commercial real estate loans and leases | $ | 12,422 | | | 10 | % | | $ | 13,640 | | | 11 | % | | | | | | |
| | | | | | | | | | | | | |
| | | | | | | | | | | | | |
| | | | | | | | | | | | | | | | | | | | | | | | | | | | | |
| Table 10 - Commercial Real Estate Portfolio by Geographic Location |
| At December 31, 2023 | | At December 31, 2022 | | | | | | |
| (dollar amounts in millions) | Amount by Location (1) | | % of Total CRE loans and leases | | Amount by Location (1) | | % of Total CRE loans and leases | | | | | | |
| | | | | | | | | | | | | |
| Michigan | $ | 2,498 | | | 20 | % | | $ | 3,005 | | | 22 | % | | | | | | |
| Ohio | 2,364 | | | 19 | | | 2,674 | | | 20 | | | | | | | |
| Illinois | 904 | | | 7 | | | 872 | | | 6 | | | | | | | |
| Florida | 733 | | | 6 | | | 807 | | | 6 | | | | | | | |
| Texas | 605 | | | 5 | | | 633 | | | 5 | | | | | | | |
| Minnesota | 462 | | | 4 | | | 496 | | | 4 | | | | | | | |
| Wisconsin | 407 | | | 3 | | | 431 | | | 3 | | | | | | | |
| Colorado | 398 | | | 3 | | | 501 | | | 4 | | | | | | | |
| Virginia | 393 | | | 3 | | | 138 | | | 1 | | | | | | | |
| Georgia | 368 | | | 3 | | | 548 | | | 4 | | | | | | | |
| Other | 3,290 | | | 27 | | | 3,535 | | | 25 | | | | | | | |
| Total commercial real estate loans and leases | $ | 12,422 | | | 100 | % | | $ | 13,640 | | | 100 | % | | | | | | |
| | | | | | | | | | | | | |
| | | | | | | | | | | | | |
(1)Geographic location based on location of underlying collateral.
Appraisal values are obtained in conjunction with all originations and renewals, and on an as-needed basis, in compliance with regulatory requirements and to ensure appropriate decisions regarding the on-going management of the portfolio reflect the changing market conditions. Appraisals are obtained from approved vendors and are reviewed by an internal appraisal review group comprised of certified appraisers to ensure the quality of the valuation used in the underwriting process. We continue to perform on-going portfolio level reviews within the CRE portfolio. These reviews generate action plans based on occupancy levels or sales volumeleasing revenues associated with the projects being reviewed. This highly individualized process requires working closely with all of our borrowers, as well as an in-depth knowledge of CRE project lending and the market environment.
Following the COVID-19 pandemic, remote work options have led to increased vacancy rates and underutilization of office space across the country. Our office portfolio, which is predominantly suburban and multi-tenant loans, totaled $1.8 billion, or 1%, of total loans and leases, as of December 31, 2023. We have established ACL reserves of approximately 10% for our office portfolio. At December 31, 2023, there was $25 million of outstanding balances in the office portfolio that were 30 or more days past due.
LEASE FINANCING
We manage the risks inherent in the Lease Financing portfolio through external consumer and business credit scoring solutions, internally developed custom probability of default and loss given default models, continuous portfolio risk management activities, and equipment and customer diversification. Our origination policies are aligned by transaction size with increased use of the personal guarantee of principals and external credit scoring tools for smaller transactions and expanded financial analysis and reporting requirements for larger transactions. Our program focuses on high-quality manufacturer, distributor, vendor, or third party originations sources with in-depth partner diligence. The lease financing group may use manufacturer loss risk share programs that provide additional transaction support, but the origination strategy prioritizes strong customer financial condition.
High level business lines are comprised of Industrial Finance, Specialty Finance, Healthcare Finance, Technology Finance, and Specialized Transportation, Franchise, and Government with multiple segments under each main line. We also have specific equipment types or industries designated as low tolerance with additional front-end guidance and diligence requirements. Subsequent to the origination of the lease, the credit review group provides an independent review and assessment of the quality of the underwriting and risk of new lease originations.
Consumer Credit
Consumer credit approvals are based on, among other factors, the financial strength and payment history of the borrower, type of exposure, and transaction structure. Consumer credit decisions are generally made in a centralized environment utilizing decision models. Importantly, certain individuals who understand each local region have the authority to make credit extension decisions to preserve our focus on the local communities in which we operate. For all classes within the consumer loan portfolio, loans are assigned pool level PD factors based on the FICO range within which the borrower’s credit bureau score falls. The credit bureau score is widely accepted as the standard measure of consumer credit risk used by lenders, regulators, rating agencies, and consumers. The LGD is related to the type of collateral associated with the credit extension, which typically does not change over the course of the loan term. This allows Huntington to maintain a current view of the customer for credit risk management and ACL purposes.
In consumer lending, credit risk is managed from a segment (i.e., loan type, collateral position, geography, etc.) and vintage performance analysis. All portfolio segments are continuously monitored for changes in delinquency trends and other asset quality indicators. We make extensive use of portfolio assessment models to continuously monitor the quality of the portfolio, which may result in changes to future origination strategies. The credit review group conducts ongoing independent risk management group has a consumercredit origination and process review componentreviews to ensure the effectiveness and efficiency of the consumer credit processes.
Collection actions by our customer assistance team are initiated as needed through a centrally managed collection and recovery function. We employ a series of collection methodologies designed to maintain a high level of effectiveness, while maximizing efficiency. In addition to the consumer loan portfolio, the customer assistance team is responsible for collection activity on all sold and securitized consumer loans and leases. Collection practices include a single contact point for the majority of the residential real estate secured portfolios.
6362 Huntington Bancshares Incorporated
AUTOMOBILE PORTFOLIO
Our strategy in the automobile portfolio continues to focus on high quality borrowers as measured by both FICO and internal custom scores, combined with appropriate LTVs, terms, and profitability. Our strategy and operational capabilities allow us to appropriately manage the origination quality across the entire portfolio, including our newer markets. Although increased origination volume and entering new markets can be associated with increased risk levels, we believe our disciplined strategy and operational processes significantly mitigate these risks.
We have continued to consistently execute our value proposition and take advantage of available market opportunities. Importantly, we have maintained our high credit quality standards while expanding the portfolio.
RESIDENTIAL REAL ESTATE SECURED PORTFOLIOS
The properties securing our residential mortgage and home equity portfolios are primarily located within our geographic footprint. Huntington continues to support our local markets with consistent underwriting across all residential secured products. The residential secured portfolio originations continue to be of high quality. Our portfolio management strategies associated with our Home Savers group allow us to focus on effectively helping our customers with appropriate solutions for their specific circumstances.
Huntington underwrites all residential mortgage applications centrally, with a focus on higher quality borrowers. We do not originate residential mortgages that allow negative amortization or allow the borrower multiple payment options. Residential mortgages are originated based on a completed full appraisal during the credit underwriting process. We update values in compliance with applicable regulations to facilitate our portfolio management, as well as our workout and loss mitigation functions.
We are subject to repurchase risk associated with residential mortgage loans sold in the secondary market. An appropriate level of reserve for representations and warranties related to residential mortgage loans sold has been established to address this repurchase risk inherent in the portfolio.
AUTOMOBILE PORTFOLIO
Our strategy in the automobile portfolio continues to focus on high quality borrowers as measured by both FICO and internal custom scores, combined with appropriate LTVs, terms, and profitability. Our strategy and operational capabilities allow us to appropriately manage the origination quality across the entire portfolio, including our newer markets. Although increased origination volume and entering new markets can be associated with increased risk levels, we believe our disciplined strategy and operational processes significantly mitigate these risks.
We have continued to consistently execute our value proposition and take advantage of available market opportunities. Importantly, we have maintained our high credit quality standards while also maintaining strong origination volume.
RV AND MARINE PORTFOLIO
Our strategy in the RV and Marine portfolio focuses on high quality borrowers, combined with appropriate LTVs, terms, and profitability. Although entering new markets can be associated with increased risk levels, we believe our disciplined strategy and operational processes significantly mitigate these risks.
Credit Quality
We believe the most meaningful way to assess overall credit quality performance is through an analysis of specific performance ratios. This approach forms the basis of the discussion in the sections immediately following: NPAs, NALs, TDRs, ACL, and NCOs. In addition, we utilize delinquency rates, risk distribution and migration patterns, product segmentation, and origination trends in the analysis of our credit quality performance.
Credit quality performance in 2020 was weaker than prior periods primarily due to the deterioration in the economic environment as a result2023 reflected NCOs of the COVID-19 pandemic. Total NCOs were $449$273 million, or 0.57%0.23%, of average total loans and leases, an increase from $265$121 million, or 0.35%0.11%, in the prior year. There was a 13%year, driven by an $143 million increase in Commercial NCOs. NPAs from the prior year. The ACLincreased $117 million, or 20%, to total loans ratio was 2.29% at December 31, 2020 compared to 1.18% at December 31, 2019, which$711 million, primarily reflects the transition to the CECL lifetime loss methodologydriven by increases in commercial and the deterioration in the macroeconomic outlook resulting from the COVID-19 pandemic.
industrial and commercial real estate NALs. NPAs and NALs
NPAs consist of (1) NALs, which represent loans and leases no longer accruing interest, (2) OREO properties, and (3) other NPAs. Any loan or lease in our portfolio may be placed on nonaccrual status prior to the policies described below when collection of principal or interest is in doubt. Also, when a borrower with discharged non-reaffirmed debt in a Chapter 7 bankruptcy is identified and the loan or lease is determined to be collateral dependent, the loan is placed on nonaccrual status.
Commercial loans and leases are placed on nonaccrual status at 90-days past due, or earlier if repayment of principal and interest is in doubt. Of the $368$498 million of commercial related NALs at December 31, 2020, $2262023, $260 million, or 61%52%, represent loans and leases that were less than 30-days past due, demonstrating our continued commitment to proactive credit risk management. With the exception of residential mortgage loans guaranteed by government organizations which continue to accrue interest, first lien loans secured by residential mortgage collateral are placed on nonaccrual status at 150-days past due. Junior-lien home equity loans are placed on nonaccrual status at the earlier of 120-days past due or when the related first-lien loan has been identified as nonaccrual. Automobile, RV and marine, and other consumer loans are generally fully charged-off at 120-days past due.due, and if not fully charged-off are placed on non-accrual.
When loans and leases are placed on nonaccrual, any accrued interest income is reversed with current year accruals charged toagainst interest income and prior year amounts generally charged-off as a credit loss.income. When, in our judgment, the borrower’s ability to make required interest and principal payments has resumed and collectability is no longer in doubt, the loan or lease could be returned to accrual status.
The following table reflects period-end NALs and NPAs detail for each of the last five years:detail:
| Table 9 - Nonaccrual Loans and Leases and Nonperforming Assets (1) | | December 31, |
| Table 11 - Nonaccrual Loans and Leases and Nonperforming Assets | |
| Table 11 - Nonaccrual Loans and Leases and Nonperforming Assets | |
| Table 11 - Nonaccrual Loans and Leases and Nonperforming Assets | |
| At December 31, | | | At December 31, |
| (dollar amounts in millions) | (dollar amounts in millions) | 2020 | | 2019 | | 2018 | | 2017 | | 2016 |
| Nonaccrual loans and leases (NALs): | Nonaccrual loans and leases (NALs): | | | | | | | | | |
| Nonaccrual loans and leases (NALs): | |
| Nonaccrual loans and leases (NALs): | |
| Commercial and industrial | |
| Commercial and industrial | |
| Commercial and industrial | Commercial and industrial | $ | 353 | | | $ | 323 | | | $ | 188 | | | $ | 161 | | | $ | 234 | |
| Commercial real estate | Commercial real estate | 15 | | | 10 | | | 15 | | | 29 | | | 20 | |
| Commercial real estate | |
| Commercial real estate | |
| Lease financing | |
| Lease financing | |
| Lease financing | |
| Residential mortgage | |
| Residential mortgage | |
| Residential mortgage | |
| Automobile | |
| Automobile | |
| Automobile | Automobile | 4 | | | 4 | | | 5 | | | 6 | | | 6 | |
| Home equity | Home equity | 70 | | | 59 | | | 62 | | | 68 | | | 72 | |
| Residential mortgage | 88 | | | 71 | | | 69 | | | 84 | | | 91 | |
| Home equity | |
| Home equity | |
| RV and marine | RV and marine | 2 | | | 1 | | | 1 | | | 1 | | | — | |
| Other consumer | — | | | — | | | — | | | — | | | — | |
| RV and marine | |
| RV and marine | |
| | Total nonaccrual loans and leases | Total nonaccrual loans and leases | 532 | | | 468 | | | 340 | | | 349 | | | 423 | |
| | Other real estate, net: | |
| Residential | 4 | | | 9 | | | 19 | | | 24 | | | 31 | |
| Commercial | — | | | 2 | | | 4 | | | 9 | | | 20 | |
| Total other real estate, net | 4 | | | 11 | | | 23 | | | 33 | | | 51 | |
| Total nonaccrual loans and leases | |
| | Total nonaccrual loans and leases | |
| | Other real estate, net | |
| | Other real estate, net | |
| | Other real estate, net | |
| Other NPAs (1) | Other NPAs (1) | 27 | | | 19 | | | 24 | | | 7 | | | 7 | |
| Other NPAs (1) | |
| Other NPAs (1) | |
| Total nonperforming assets | |
| Total nonperforming assets | |
| Total nonperforming assets | Total nonperforming assets | $ | 563 | | | $ | 498 | | | $ | 387 | | | $ | 389 | | | $ | 481 | |
| | Nonaccrual loans and leases as a % of total loans and leases | Nonaccrual loans and leases as a % of total loans and leases | 0.65 | % | | 0.62 | % | | 0.45 | % | | 0.50 | % | | 0.63 | % |
| | Nonaccrual loans and leases as a % of total loans and leases | |
| | Nonaccrual loans and leases as a % of total loans and leases | |
| NPA ratio (2) | NPA ratio (2) | 0.69 | | | 0.66 | | | 0.52 | | | 0.55 | | | 0.72 | |
| NPA ratio (2) | |
| NPA ratio (2) | |
|
(1)Other nonperforming assets include certain impaired investment securities and/or nonaccrual loans held-for-sale.
(2)Nonperforming assets divided by the sum of loans and leases, other real estate owned, and other NPAs.
65 Huntington Bancshares Incorporated
2020 versus 2019
Total NPAs increased by $65 million, or 13%, compared with December 31, 2019. The increase was due to a $30 million, or 9%, increase in the C&I portfolio. OREO balances decreased $7 million, or 64%, from the prior year.
The following table reflects period-end accruing loans and leases 90 days or more past due for each of the last five years:
| | | | | | | | | | | | | | | | | | | | | | | | | | | | | |
| Table 10 - Accruing Past Due Loans and Leases |
| December 31, |
| (dollar amounts in millions) | 2020 | | 2019 | | 2018 | | 2017 | | 2016 |
| Accruing loans and leases past due 90 days or more: | | | | | | | | | |
| Commercial and industrial (1) | $ | 10 | | | $ | 11 | | | $ | 7 | | | $ | 9 | | | $ | 18 | |
| Commercial real estate | — | | | — | | | — | | | 3 | | | 17 | |
| Automobile | 9 | | | 8 | | | 8 | | | 7 | | | 10 | |
| Home equity | 14 | | | 14 | | | 17 | | | 18 | | | 12 | |
| Residential mortgage (excluding loans guaranteed by the U.S. Government) | 30 | | | 20 | | | 32 | | | 21 | | | 15 | |
| RV and marine | 3 | | | 2 | | | 1 | | | 1 | | | 1 | |
| Other consumer | 3 | | | 7 | | | 6 | | | 5 | | | 4 | |
| Total, excl. loans guaranteed by the U.S. Government | 69 | | | 62 | | | 71 | | | 64 | | | 77 | |
| Add: loans guaranteed by U.S. Government | 102 | | | 109 | | | 99 | | | 51 | | | 52 | |
| Total accruing loans and leases past due 90 days or more, including loans guaranteed by the U.S. Government | $ | 171 | | | $ | 171 | | | $ | 170 | | | $ | 115 | | | $ | 129 | |
| Ratios: | | | | | | | | | |
| Excluding loans guaranteed by the U.S. Government, as a percent of total loans and leases | 0.08 | % | | 0.08 | % | | 0.09 | % | | 0.09 | % | | 0.12 | % |
| Guaranteed by U.S. Government, as a percent of total loans and leases | 0.13 | | | 0.14 | | | 0.13 | | | 0.07 | | | 0.08 | |
| Including loans guaranteed by the U.S. Government, as a percent of total loans and leases | 0.21 | | | 0.23 | | | 0.23 | | | 0.16 | | | 0.19 | |
(1)Amounts include Huntington Technology Finance administrative lease delinquencies and accruing purchase impaired loans related to acquisitions.
TDR Loans
TDRs are modified loans where a concession was provided to a borrower experiencing financial difficulties. TDRs can be classified as either accruing or nonaccruing loans. Nonaccruing TDRs are included in NALs whereas accruing TDRs are excluded from NALs, as it is probable that all contractual principal and interest due under the restructured terms will be collected. TDRs primarily reflect our loss mitigation efforts to proactively work with borrowers in financial difficulty or to comply with regulations regarding the treatment of certain bankruptcy filing and discharge situations.
On March 22, 2020 and April 7, 2020, the federal bank regulatory agencies including the FRB and OCC released statements encouraging financial institutions to work prudently with borrowers that may be unable to meet their contractual obligations because of the effects of COVID-19. The statements go on to explain that, in consultation with the FASB staff, the federal bank regulatory agencies concluded that short-term modifications (e.g. six months) made on a good faith basis to borrowers who were current as of the implementation date of a relief program are not TDRs. Section 4013 of the CARES Act, as amended by Section 541 of the Consolidated Appropriations Act of 2021, (“CARES Act”) further addresses COVID-19 related modifications occurring between March 1, 2020 through January 1, 2022 and specifies that such COVID-19 related modifications on loans that were current as of December 31, 2019 are not TDRs.
For COVID-19 related loan modifications occurring during 2020, which met the loan modification criteria under the CARES Act, Huntington elected to suspend TDR accounting. For loan modifications not eligible for the CARES Act, Huntington applied the interagency regulatory guidance that was clarified on April 7, 2020. Accordingly, insignificant concessions (related to the current COVID-19 crisis) granted through payment deferrals, fee waivers, or other short-term modifications (generally 6 months or less) and provided to borrowers less than 30 days past due at March 17,
2020 were not deemed to be TDRs. Therefore, modified loans that met the required guidelines for relief are excluded from the TDR disclosures below.
Over the past five years, the accruing component of the total TDR balance has been consistently over 80%, indicating there is no identified credit loss and the borrowers continue to make their monthly payments. As of December 31, 2020, over 78% of the $435 million of accruing TDRs secured by residential real estate (Residential mortgage and Home equity in Table 11) are current on their required payments, with over 53% of the accruing pool having had no delinquency in the past 12 months. There is limited migration from the accruing to non-accruing components, and virtually all of the charge-offs within this group of loans come from the non-accruing TDR balances.
The table below presents our accruing and nonaccruing TDRs at period-end for each of the past five years:
| | | | | | | | | | | | | | | | | | | | | | | | | | | | | |
| Table 11 - Accruing and Nonaccruing Troubled Debt Restructured Loans |
| | | | | | | | | |
| (dollar amounts in millions) | December 31, |
| 2020 | | 2019 | | 2018 | | 2017 | | 2016 |
| TDRs—accruing: | | | | | | | | | |
| Commercial and industrial | $ | 193 | | | $ | 213 | | | $ | 269 | | | $ | 300 | | | $ | 210 | |
| Commercial real estate | 33 | | | 37 | | | 54 | | | 78 | | | 77 | |
| Automobile | 50 | | | 40 | | | 35 | | | 30 | | | 26 | |
| Home equity | 187 | | | 226 | | | 252 | | | 265 | | | 270 | |
| Residential mortgage | 248 | | | 223 | | | 218 | | | 224 | | | 243 | |
| RV and marine | 6 | | | 3 | | | 2 | | | 1 | | | — | |
| Other consumer | 9 | | | 11 | | | 9 | | | 8 | | | 4 | |
| Total TDRs—accruing | 726 | | | 753 | | | 839 | | | 906 | | | 830 | |
| TDRs—nonaccruing: | | | | | | | | | |
| Commercial and industrial | 95 | | | 109 | | | 97 | | | 82 | | | 107 | |
| Commercial real estate | 3 | | | 6 | | | 6 | | | 15 | | | 5 | |
| Automobile | 2 | | | 2 | | | 3 | | | 4 | | | 5 | |
| Home equity | 30 | | | 26 | | | 28 | | | 28 | | | 28 | |
| Residential mortgage | 51 | | | 42 | | | 44 | | | 55 | | | 59 | |
| RV and marine | 1 | | | 1 | | | — | | | — | | | — | |
| Other consumer | — | | | — | | | — | | | — | | | — | |
| Total TDRs—nonaccruing | 182 | | | 186 | | | 178 | | | 184 | | | 204 | |
| Total TDRs | $ | 908 | | | $ | 939 | | | $ | 1,017 | | | $ | 1,090 | | | $ | 1,034 | |
Our strategy is to structure TDRs in a manner that avoids new concessions subsequent to the initial TDR terms. However, there are times when subsequent modifications are required, such as when a loan matures. Often loans are performing in accordance with the TDR terms, and a new note is originated with similar modified terms. These loans are subjected to the normal underwriting standards and processes for similar credit extensions, both new and existing. If the loan is not performing in accordance with the existing TDR terms, typically an individualized approach to repayment is established. In accordance with GAAP, the refinanced note is evaluated to determine if it is considered a new loan or a continuation of the prior loan. A new loan is considered for the removal of the TDR designation. A continuation of the prior note requires the continuation of the TDR designation.
The types of concessions granted include below market interest rates, longer amortization or extended maturity date changes beyond what the collateral supports, as well as principal forgiveness based on the borrower’s specific needs at a point in time. Our policy does not limit the number of times a loan may be modified. A loan may be modified multiple times if it is considered to be in the best interest of both the borrower and us.
Commercial loans are not automatically considered to be accruing TDRs upon the granting of a concession. If the loan is in accruing status and no loss is expected based on the modified terms, the modified TDR remains in accruing status. For loans that are on nonaccrual status before the modification, reasonable assurance of repayment under modified terms and demonstrated repayment performance for a minimum of six months is needed to return to accruing status. This six-month period could extend before or after the restructure date.
67 Huntington Bancshares Incorporated
Any granted change in terms or conditions that are not readily available in the market for that borrower, requires the designation as a TDR. There are no provisions for the removal of the TDR designation based on payment activity for consumer loans. A loan may be returned to accrual status when all contractually due interest and principal has been paid and the borrower demonstrates the financial capacity to continue to pay as agreed, with the risk of loss diminished.
ACL
Our total credit reserveACL is comprised of two different components, both of which in our judgment are appropriate to absorb lifetime expected credit losses in our loan and lease portfolio: the ALLL and the AULC. Combined, these reserves comprise the total ACL.
Effective January 1, 2020, Huntington adopted ASU 2016-13 Financial Instruments - Credit Losses (ASC Topic 326): Measurement of Credit Losses on Financial Instruments. Upon adoption of ASU 2016-13, Huntington implemented new credit loss models within our loan and lease portfolio. These models incorporate historical loss experience, as well as current and future economic conditions over a reasonable and supportable period beyond the balance sheet date. We make various judgments combined with historical loss experience to generate a loss rate that is applied to the outstanding loan or receivable balance to produce a reserve for expected credit losses.
We use a combination of statistically-based models that utilizeemploy assumptions about current and future economic conditions throughout the contractual life of the loan. The process of estimating expected credit losses is based on severalthree key parameters: Probability of Default (PD), Exposure at Default (EAD),PD, EAD, and Loss Given Default (LGD).LGD. Beyond the reasonable and supportable period (two to three years), the economic variables revert to a historical equilibrium at a pace dependent on the state of the economy reflected within the economic scenario.
These three parameters, PD, EAD, and LGD, are utilized to estimate the cumulative credit losses over the remaining expected life64 Huntington Bancshares Incorporated
Future economic conditions consider multiple macroeconomic scenarios provided to us by an independent third party and are reviewed through the appropriate committee governance channels discussedAllowance for Credit Loss Development Methodology Committee described below. These macroeconomic scenarios contain certain geography based variables that are influential to our modeling process, the most significant being unemployment rates and GDP. The probability weights assigned to each scenario are generally expected to be consistent from period to period. Any changes in probability weights must be supported by appropriate documentation and approval of senior management. Additionally, we consider whether to adjust the modeled estimates to address possible limitations within the models or factors not captured within the macroeconomic scenarios. Lifetime losses for most of our loans and receivablesleases are evaluated collectively based on similar risk characteristics, risk ratings, origination credit bureau scores, delinquency status, and remaining months within loan agreements, among other factors.
The macroeconomic scenarios evaluated by Huntington during 2020 continued to reflect the impact of the COVID-19 pandemic. The baseline scenario used at year-endfor the 2023 fourth quarter assumes that the worstsoftening of the economic disruption fromlabor market is underway and will continue through early 2025 causing the pandemic has passed, withunemployment rate to gradually increase, peaking at 4.1% in the expectation that subsequent wavesfirst quarter of 2025 before marginally improving to 3.9% by 2027. The overnight federal funds rate is forecasted to have peaked during the virus will not carrythird quarter of 2023, remaining at this terminal level until mid-2024 as the same levelFederal Reserve continues to address inflation levels and tightness in the labor market. The Federal Reserve is expected to start cutting rates in the third quarter of economic disruption experienced to date. The unemployment variable is incorporated within our models as both2024 at a rate of change and level variable. Historically, changes25 basis points per quarter until reaching 3% in unemployment have taken gradual paths resulting in more measured impacts.
The baseline scenario forecasts stronger GDP growth throughout 2021 comparedlate 2026. Inflation is forecasted to drop from 3.3% year over year at the end of 2023 to the Federal Reserve’s target rate of 2% by the fourth quarter 2020of 2024. The GDP forecast drivenfor 2024 has fallen from prior year end, a result of elevated interest rates and tightening credit conditions over the past year. GDP is now forecasted to be 1.5% by additional fiscal stimulus anticipated in 2021.the fourth quarter of 2024.
Management uses a probability-weighted approach that incorporates a baseline, an adverse and a more favorable economic scenario when formulating the quantitative estimate for the allowance. The table below is intended to show how the forecasted path of these key macroeconomic variablesunemployment and GDP in the baseline scenario has changed since CECL implementation:between those used in the year 2022 and 2023 ACL determination:
| | Table 12 - Forecasted Key Macroeconomic Variables | | 2019 | | 2020 | | 2021 |
| Table 12 - Forecasted Key Macroeconomic Variables | |
| Table 12 - Forecasted Key Macroeconomic Variables | |
| | 2022 | | | | 2022 | | 2023 | | 2024 |
| Baseline scenario forecast | Baseline scenario forecast | | Q4 | | Q2 | | Q4 | | Q2 | | Q4 | Baseline scenario forecast | | Q4 | | Q2 | | Q4 | | Q2 | | Q4 |
| | Unemployment rate (1) | Unemployment rate (1) | |
| 4Q 2019 (2) | | 3.5% | | 3.5% | | 3.8% | | 4.3% | | 4.5% |
| | Unemployment rate (1) | |
| | Unemployment rate (1) | |
| 4Q 2022 | |
| 4Q 2022 | |
| 4Q 2022 | | | 3.7% | | 3.9% | | 4.1% | | 3.9% |
| | 4Q 2020 | | n/a | | n/a | | 7.2% | | 7.5% | | 7.2% |
| 4Q 2023 | |
| | 4Q 2023 | |
| | 4Q 2023 | | | N/A | | 3.8 | | 3.9 | | 4.0 |
| | Gross Domestic Product (1) | Gross Domestic Product (1) | |
| 4Q 2019 (2) | | 1.9% | | 2.0% | | 0.8% | | 2.9% | | 3.6% |
| Gross Domestic Product (1) | |
| Gross Domestic Product (1) | |
| 4Q 2022 | |
| 4Q 2022 | |
| 4Q 2022 | | | (0.1)% | | 0.4% | | 2.0% | | 2.3% | | 2.7% |
| | 4Q 2020 | | n/a | | n/a | | 3.0% | | 3.8% | | 5.8% |
| 4Q 2023 | |
| | 4Q 2023 | |
| | 4Q 2023 | | | N/A | | 0.8 | | 1.2 | | 1.5 |
(1)Values reflect the baseline scenario forecast inputs for each period presented, not updated for subsequent actual amounts.
(2)Base case estimates for stated period in Q4 2019 used to model January 1st 2020 implementation adjustment.
The uncertainty related to the COVID-19 pandemic prompted management to continueManagement continues to assess the uncertainty in the macroeconomic environment, throughincluding ongoing risks in the end of the year. Management consideredcommercial real estate environment, current inflation levels, political uncertainty, and geopolitical instability, considering multiple macro-economicmacroeconomic forecasts that reflected a range of possible outcomes in order to capture the continued severity of and the economic disruption associated with the pandemic.outcomes. While we have incorporated our estimated impactestimates of COVID-19economic uncertainty into our allowance for credit losses,ACL, the ultimate impact of COVID-19 is still uncertain, includingspecific challenges in the success ofcommercial real estate industry, recent inflation levels, higher interest rates, and the vaccination programs underway,significant conflicts on-going around the resulting rate of virus abatement, how long economic activities will be impacted and what effect the unprecedented levels of government fiscal and monetary actionsworld will have on the economy and our credit losses.remains unknown.
Given significant COVID-19 specific government relief programs and potential stimulus packages, as well as certain limitations of our models in the current economic environment particularly the level of unemployment, management developedManagement develops additional analytics to support adjustments to our modeled results. The Bank’s governance committeesOur Allowance for Credit Loss Development Methodology Committee reviewed model results of each economic scenario for appropriate usage, concluding that the quantitative transactionaltransaction reserve (collectively assessed) will continue to utilize the scenario weighting approach established in prior quarters.weighting. Given the impact of the unemployment variable utilized within the models and the uncertainty associated with key economic scenario assumptions, the December 31, 20202023 ACL included a material general reserve componentthat consists of various risk profile components, including profiles to capture this economic uncertainty risk not addressed within the quantitative transaction reserve.
Our ACL methodology committeeAllowance for Credit Loss Development Methodology Committee is responsible for developing the methodology, assumptions and estimates used in the calculation, as well as determining the appropriateness of the ACL. The ALLL represents the estimate of lifetime expected losses in the loan and lease portfolio at the reported date. The loss modeling process uses an EAD concept to calculate total expected losses on both funded balances and unfunded lending commitments, where appropriate. Losses related to the unfunded lending commitments are then recorded as AULC within other liabilities in the Consolidated Balance Sheet. A liability for expected credit losses for off-balance sheet credit exposures is recognized if Huntington has a present contractual obligation to extend the credit and the obligation is not unconditionally cancelable.
Huntington adopted ASC Topic 326 using the modified retrospective method for all financial assets in scope of the standard. Results for reporting periods beginning after January 1, 2020 are presented under ASC Topic 326, while prior period amounts continue to be reported in accordance with previously applicable GAAP. Upon adoption, Huntington recorded an increase to the ACL of $393 million and a corresponding decrease to retained earnings of approximately $306 million, net of tax of $87 million. The overall increase to the ACL at January 1, 2020 was comprised of a $180 million increase in the commercial ALLL, a $211 million increase in the consumer ALLL, and a $2 million increase to the AULC. The increase in the commercial portfolio was largely attributable to adjustments to cover heightened risks of future deterioration in the oil and gas and leveraged lending portfolios. The increase in the consumer portfolio was largely attributable to the longer asset duration associated with many of these products.
The AULC is determined by applying the same quantitative reserve determination process to the unfunded portion of the loan exposures adjusted by an applicable funding expectation. (See Note 1 - "Significant Accounting Policies" of the Notes to Consolidated Financial Statements). 69 Huntington Bancshares Incorporated
Our ACL evaluation process includes the on-going assessment of credit quality metrics, and a comparison of certain ACL benchmarks to current performance. While the total ACL balance increased year over year, all of the relevant benchmarks remain strong, while reflecting the level of uncertainty around the future macroeconomic environment resulting from the COVID-19 pandemic.
The following table reflects activity inFor further information, including the ALLL and AULC
activity by portfolio segment, refer to Note 6 - “Allowance for eachCredit Losses” of the last five years: | | | | | | | | | | | | | | | | | | | | | | | | | | | | | |
| Table 13 - Summary of Allowance for Credit Losses |
| (dollar amounts in millions) | Year Ended December 31, |
| 2020 | | 2019 | | 2018 | | 2017 | | 2016 |
| ALLL, beginning of year | $ | 783 | | | $ | 772 | | | $ | 691 | | | $ | 638 | | | $ | 598 | |
| Cumulative-effect of change in accounting principle for financial instruments - credit losses (1) | 391 | | | — | | | — | | | — | | | — | |
| Loan and lease charge-offs | | | | | | | | | |
| Commercial: | | | | | | | | | |
| Commercial and industrial | (328) | | | (160) | | | (68) | | | (68) | | | (77) | |
| Commercial real estate: | | | | | | | | | |
| Construction | (1) | | | — | | | (1) | | | 2 | | | (2) | |
| Commercial | (46) | | | (5) | | | (10) | | | (6) | | | (14) | |
| Commercial real estate | (47) | | | (5) | | | (11) | | | (4) | | | (16) | |
| Total commercial | (375) | | | (165) | | | (79) | | | (72) | | | (93) | |
| Consumer: | | | | | | | | | |
| Automobile | (60) | | | (57) | | | (58) | | | (64) | | | (50) | |
| Home equity | (16) | | | (21) | | | (21) | | | (20) | | | (26) | |
| Residential mortgage | (7) | | | (9) | | | (11) | | | (11) | | | (11) | |
| RV and marine | (18) | | | (15) | | | (14) | | | (13) | | | (3) | |
| Other consumer | (64) | | | (95) | | | (85) | | | (72) | | | (44) | |
| Total consumer | (165) | | | (197) | | | (189) | | | (180) | | | (134) | |
| Total charge-offs | (540) | | | (362) | | | (268) | | | (252) | | | (227) | |
| Recoveries of loan and lease charge-offs | | | | | | | | | |
| Commercial: | | | | | | | | | |
| Commercial and industrial | 29 | | | 32 | | | 36 | | | 26 | | | 32 | |
| Commercial real estate: | | | | | | | | | |
| Construction | 1 | | | 2 | | | 2 | | | 3 | | | 4 | |
| Commercial | 3 | | | 6 | | | 27 | | | 12 | | | 38 | |
| Total commercial real estate | 4 | | | 8 | | | 29 | | | 15 | | | 42 | |
| Total commercial | 33 | | | 40 | | | 65 | | | 41 | | | 74 | |
| Consumer: | | | | | | | | | |
| Automobile | 27 | | | 25 | | | 24 | | | 22 | | | 18 | |
| Home equity | 10 | | | 13 | | | 15 | | | 15 | | | 17 | |
| Residential mortgage | 4 | | | 3 | | | 5 | | | 5 | | | 5 | |
| RV and marine | 6 | | | 4 | | | 5 | | | 3 | | | — | |
| Other consumer | 11 | | | 12 | | | 9 | | | 7 | | | 4 | |
| Total consumer | 58 | | | 57 | | | 58 | | | 52 | | | 44 | |
| Total recoveries | 91 | | | 97 | | | 123 | | | 93 | | | 118 | |
| Net loan and lease charge-offs | (449) | | | (265) | | | (145) | | | (159) | | | (109) | |
| Provision for loan and lease losses | 1,089 | | | 277 | | | 226 | | | 212 | | | 169 | |
| Allowance for assets sold and securitized or transferred to loans held for sale | — | | | (1) | | | — | | | — | | | (20) | |
| ALLL, end of year | 1,814 | | | 783 | | | 772 | | | 691 | | | 638 | |
| AULC, beginning of year | 104 | | | 96 | | | 87 | | | 98 | | | 72 | |
| Cumulative-effect of change in accounting principle for financial instruments - credit losses (1) | 2 | | | — | | | — | | | — | | | — | |
| Provision for (Reduction in) unfunded loan commitments and letters of credit losses | (41) | | | 10 | | | 9 | | | (11) | | | 22 | |
| Fair value of acquired AULC | — | | | — | | | — | | | — | | | 4 | |
| Unfunded commitment losses | (13) | | | (2) | | | — | | | — | | | — | |
| AULC, end of year | 52 | | | 104 | | | 96 | | | 87 | | | 98 | |
| ACL, end of year | $ | 1,866 | | | $ | 887 | | | $ | 868 | | | $ | 778 | | | $ | 736 | |
(1)RelatesNotes to day one impact of the CECL adjustment as a result of the implementation of ASU 2016-13.Consolidated Financial Statements.
71 Huntington Bancshares Incorporated
The table below reflects the allocation of our ALLL among our various loan and lease categories andas well as certain coverage metrics of the reported ACL during each of the past five years:ALLL and ACL:
| Table 14 - Allocation of Allowance for Credit Losses (1) | | Table 13 - Allocation of Allowance for Credit Losses | |
| Table 13 - Allocation of Allowance for Credit Losses | |
| Table 13 - Allocation of Allowance for Credit Losses | |
| At December 31, | | | At December 31, |
| 2023 | |
| (dollar amounts in millions) | (dollar amounts in millions) | December 31, |
| 2020 | | 2019 | | 2018 | | 2017 | | 2016 |
| ACL | | | | | | | | | |
| (dollar amounts in millions) | |
| (dollar amounts in millions) | |
| Commercial | |
| Commercial | |
| Commercial | Commercial | |
| Commercial and industrial | Commercial and industrial | $ | 939 | | | 43 | % | | $ | 469 | | | 41 | % | | $ | 422 | | | 41 | % | | $ | 377 | | | 40 | % | | $ | 356 | | | 42 | % |
| Commercial and industrial | |
| Commercial and industrial | |
| Commercial real estate | Commercial real estate | 297 | | | 9 | | | 83 | | | 8 | | | 120 | | | 10 | | | 105 | | | 11 | | | 95 | | | 11 | |
| Commercial real estate | |
| Commercial real estate | |
| Lease financing | |
| Lease financing | |
| Lease financing | |
| Total commercial | |
| Total commercial | |
| Total commercial | Total commercial | 1,236 | | | 52 | | | 552 | | | 49 | | | 542 | | | 51 | | | 482 | | | 51 | | | 451 | | | 53 | |
| Consumer | Consumer | | | | | | | | | | | | | | | | | | | |
| Consumer | |
| Consumer | |
| Residential mortgage | |
| Residential mortgage | |
| Residential mortgage | |
| Automobile | |
| Automobile | |
| Automobile | Automobile | 166 | | | 16 | | | 57 | | | 17 | | | 56 | | | 16 | | | 53 | | | 17 | | | 48 | | | 16 | |
| Home equity | Home equity | 124 | | | 11 | | | 50 | | | 12 | | | 55 | | | 13 | | | 60 | | | 14 | | | 65 | | | 15 | |
| Residential mortgage | 79 | | | 15 | | | 23 | | | 15 | | | 25 | | | 14 | | | 21 | | | 13 | | | 33 | | | 12 | |
| Home equity | |
| Home equity | |
| RV and marine | |
| RV and marine | |
| RV and marine | RV and marine | 129 | | | 5 | | | 21 | | | 5 | | | 20 | | | 4 | | | 15 | | | 3 | | | 5 | | | 3 | |
| Other consumer | Other consumer | 80 | | | 1 | | | 80 | | | 2 | | | 74 | | | 2 | | | 60 | | | 2 | | | 36 | | | 1 | |
| Other consumer | |
| Other consumer | |
| Total consumer | |
| Total consumer | |
| Total consumer | Total consumer | 578 | | | 48 | | | 231 | | | 51 | | | 230 | | | 49 | | | 209 | | | 49 | | | 187 | | | 47 | |
| Total ALLL | Total ALLL | 1,814 | | | 100 | % | | 783 | | | 100 | % | | 772 | | | 100 | % | | 691 | | | 100 | % | | 638 | | | 100 | % |
| Total ALLL | |
| Total ALLL | |
| AULC | |
| AULC | |
| AULC | AULC | 52 | | | | | 104 | | | | | 96 | | | | | 87 | | | | | 98 | | | |
| Total ACL | Total ACL | $ | 1,866 | | | $ | 887 | | | $ | 868 | | | $ | 778 | | | $ | 736 | | |
| Total ACL | |
| Total ACL | |
| Total ALLL as % of: | |
| Total ALLL as % of: | |
Total ALLL as % of: | | Total loans and leases | Total loans and leases | | 2.22 | % | | 1.04 | % | | 1.03 | % | | 0.99 | % | | 0.95 | % |
| Nonaccrual loans and leases | Nonaccrual loans and leases | | 341 | | | 167 | | | 228 | | | 198 | | | 151 | |
| Nonaccrual loans and leases | |
| Nonaccrual loans and leases | |
| NPAs | |
| NPAs | |
| NPAs | NPAs | | 323 | | | 157 | | | 200 | | | 178 | | | 133 | |
| Total ACL as % of: | Total ACL as % of: | |
| Total ACL as % of: | |
| Total ACL as % of: | |
| Total loans and leases | |
| Total loans and leases | |
| Total loans and leases | Total loans and leases | | 2.29 | % | | 1.18 | % | | 1.16 | % | | 1.11 | % | | 1.10 | % |
| Nonaccrual loans and leases | Nonaccrual loans and leases | | 351 | | | 190 | | | 256 | | | 223 | | | 174 | |
| Nonaccrual loans and leases | |
| Nonaccrual loans and leases | |
| NPAs | NPAs | | 332 | | | 178 | | | 225 | | | 200 | | | 153 | |
| NPAs | |
| NPAs | |
(1)Percentages represent the percentage of each loan and lease category to total loans and leases.
2020 versus 2019
At December 31, 2020,2023, the ALLLACL was $1.8$2.4 billion, or 2.22%1.97%, of total loans and leases, compared to $783 million$2.3 billion, or 1.04%1.90%, at December 31, 2019. Of the2022. The increase $640 million relates primarily to the deterioration in the macroeconomic outlook resulting from the COVID-19 pandemic, with the remaining $391 million related to transition to the CECL lifetime loss methodology. The majoritytotal ACL was primarily driven by a combination of the increase was related to the commercial portfolio. The ALLL to total loansloan and leaseslease growth and modest overall coverage ratio increased 118 basis points to 2.22%
As referenced above, the implementation of CECL resulted in a January 1 adoption impact of $391 million.builds throughout 2023. The ACL to total loanscoverage ratio was 2.29% at December 31, 2020 compared to 1.18% at December 31, 2019, which primarily reflects2023 is reflective of the transition to the CECL lifetime loss methodology and the deterioration in the macroeconomic outlook resulting from the COVID-19 pandemic.current macro-economic environment.
66 Huntington Bancshares Incorporated
NCOs
A loan in any portfolio may be charged-off prior to the policies described below if a loss confirming event has occurred. Loss confirming events include, but are not limited to, bankruptcy (unsecured), continued delinquency, foreclosure, or receipt of an asset valuation indicating a collateral deficiency where that asset is the sole source of repayment. Additionally, discharged, collateral dependent non-reaffirmed debt in Chapter 7 bankruptcy filings will result in a charge-off to estimated collateral value, less anticipated selling costs at the time of discharge.
Commercial loans and leases are either charged-off or written down to net realizable value by 90-days past due with the exception of administrative small ticket lease delinquencies. Automobile loans, RV and marine, and other consumer loans are generally fully charged-off at 120-days past due. First-lien and junior-lien home equity loans are charged-off to the estimated fair value of the collateral, less anticipated selling costs, at 150-days past due and 120-days past due, respectively. Residential mortgages are charged-off to the estimated fair value of the collateral, less anticipated selling costs, at 150-days past due. The remaining balance is in delinquent status until a modification can be completed, or the loan goes through the foreclosure process.
The following table reflects NCO detail:
| | | | | | | | | | | | | | | | | | | | | |
| Table 14 - Net Loan and Lease Charge-offs | | | | | | | | | |
| Year Ended December 31, |
| (dollar amounts in millions) | 2023 | | 2022 | | 2021 | | | | |
| Net charge-offs (recoveries) by loan and lease type: | | | | | | | | | |
| Commercial: | | | | | | | | | |
| Commercial and industrial | $ | 107 | | | $ | (2) | | | $ | 99 | | | | | |
| | | | | | | | | |
| | | | | | | | | |
| | | | | | | | | |
| Commercial real estate | 57 | | | 8 | | | 17 | | | | | |
| Lease financing | (6) | | | 9 | | | 44 | | | | | |
| Total commercial | 158 | | | 15 | | | 160 | | | | | |
| Consumer: | | | | | | | | | |
| Residential mortgage | 2 | | | (2) | | | (1) | | | | | |
| Automobile | 21 | | | 6 | | | (6) | | | | | |
| Home equity | (1) | | | (5) | | | (5) | | | | | |
| RV and marine | 12 | | | 8 | | | 5 | | | | | |
| Other consumer | 81 | | | 99 | | | 62 | | | | | |
| Total consumer | 115 | | | 106 | | | 55 | | | | | |
| Total net charge-offs | $ | 273 | | | $ | 121 | | | $ | 215 | | | | | |
| | | | | | | | | |
| Net charge-offs (recoveries) - annualized percentages: | | | | | | | | | |
| Commercial: | | | | | | | | | |
| Commercial and industrial | 0.22 | % | | — | % | | 0.26 | % | | | | |
| | | | | | | | | |
| | | | | | | | | |
| | | | | | | | | |
| Commercial real estate | 0.43 | | | 0.06 | | | 0.16 | | | | | |
| Lease financing | (0.12) | | | 0.18 | | | 1.18 | | | | | |
| Total commercial | 0.23 | | | 0.03 | | | 0.31 | | | | | |
| Consumer: | | | | | | | | | |
| Residential mortgage | 0.01 | | | (0.01) | | | — | | | | | |
| Automobile | 0.16 | | | 0.05 | | | (0.05) | | | | | |
| Home equity | (0.01) | | | (0.05) | | | (0.05) | | | | | |
| RV and marine | 0.21 | | | 0.15 | | | 0.10 | | | | | |
| Other consumer | 6.03 | | | 7.55 | | | 5.56 | | | | | |
| Total consumer | 0.22 | | | 0.21 | | | 0.12 | | | | | |
| Net charge-offs as a % of average loans | 0.23 | % | | 0.11 | % | | 0.22 | % | | | | |
The following table reflects NCO detailNCOs were 0.23% of average loans and leases in 2023, up from 0.11% in 2022. NCOs for eachcommercial loans and leases were higher, with net charge-offs of the last five years:
| | | | | | | | | | | | | | | | | | | | | | | | | | | | | |
| Table 15 - Net Loan and Lease Charge-offs | | | | | | | | | |
| (dollar amounts in millions) | Year Ended December 31, |
| 2020 | | 2019 | | 2018 | | 2017 | | 2016 |
| Net charge-offs by loan and lease type: | | | | | | | | | |
| Commercial: | | | | | | | | | |
| Commercial and industrial | $ | 299 | | | $ | 128 | | | $ | 32 | | | $ | 42 | | | $ | 45 | |
| Commercial real estate: | | | | | | | | | |
| Construction | — | | | (2) | | | (1) | | | (5) | | | (2) | |
| Commercial | 43 | | | (1) | | | (17) | | | (6) | | | (24) | |
| Commercial real estate | 43 | | | (3) | | | (18) | | | (11) | | | (26) | |
| Total commercial | 342 | | | 125 | | | 14 | | | 31 | | | 19 | |
| Consumer: | | | | | | | | | |
| Automobile | 33 | | | 32 | | | 34 | | | 42 | | | 32 | |
| Home equity | 6 | | | 8 | | | 6 | | | 5 | | | 9 | |
| Residential mortgage | 3 | | | 6 | | | 6 | | | 6 | | | 6 | |
| RV and marine | 12 | | | 11 | | | 9 | | | 10 | | | 2 | |
| Other consumer | 53 | | | 83 | | | 76 | | | 65 | | | 41 | |
| Total consumer | 107 | | | 140 | | | 131 | | | 128 | | | 90 | |
| Total net charge-offs | $ | 449 | | | $ | 265 | | | $ | 145 | | | $ | 159 | | | $ | 109 | |
| | | | | | | | | |
| Net charge-offs - annualized percentages: | | | | | | | | | |
| Commercial: | | | | | | | | | |
| Commercial and industrial | 0.88 | % | | 0.42 | % | | 0.11 | % | | 0.15 | % | | 0.19 | % |
| Commercial real estate: | | | | | | | | | |
| Construction | (0.05) | | | (0.15) | | | (0.13) | | | (0.36) | | | (0.19) | |
| Commercial | 0.74 | | | (0.02) | | | (0.26) | | | (0.10) | | | (0.49) | |
| Commercial real estate | 0.61 | | | (0.04) | | | (0.24) | | | (0.15) | | | (0.44) | |
| Total commercial | 0.84 | | | 0.33 | | | 0.04 | | | 0.09 | | | 0.06 | |
| Consumer: | | | | | | | | | |
| Automobile | 0.26 | | | 0.26 | | | 0.27 | | | 0.36 | | | 0.30 | |
| Home equity | 0.07 | | | 0.08 | | | 0.06 | | | 0.05 | | | 0.10 | |
| Residential mortgage | 0.03 | | | 0.06 | | | 0.06 | | | 0.08 | | | 0.09 | |
| RV and marine | 0.31 | | | 0.31 | | | 0.32 | | | 0.48 | | | 0.33 | |
| Other consumer | 4.84 | | | 6.62 | | | 6.27 | | | 6.36 | | | 5.53 | |
| Total consumer | 0.28 | | | 0.37 | | | 0.36 | | | 0.39 | | | 0.32 | |
| Net charge-offs as a % of average loans | 0.57 | % | | 0.35 | % | | 0.20 | % | | 0.23 | % | | 0.19 | % |
2020 versus 2019
NCOs increased $184 million, or 69%,0.23% in 2020. The increase was2023 compared to 0.03% in 2022, driven by increases in both commercial NCOs, whichand industrial and commercial real estate portfolios and reflecting the continued normalization of net charge-offs. Consumer net charge-offs were centeredmodestly higher in our oil2023 compared to 2022, with increases in the automobile and gas portfolio,RV and marine portfolios partially offset by a declinelower NCOs in other consumer.consumer loans.
Market Risk
Market risk refers to potential losses arising from changes in interest rates, foreign exchange rates, equity prices, and commodity prices, including the correlation among these factors and their volatility. When the value of an instrument is tied to such external factors, the holder faces market risk. We are primarily exposed to interest rate risk as a result of offering a wide array of financial products to our customers, and secondarily, to price risk from trading securities, securities owned by our broker-dealer subsidiaries, foreign exchange positions, equity investments, and investments in securities backed by mortgage loans.
Huntington measuresWe measure market risk exposure via financial simulation models, which provide management with insights on the potential impact to net interest income and other key metrics as a result of changes in market interest rates. Models are used to simulate cash flows and accrual characteristics of the balance sheet based on assumptions regarding the slope or shape of the yield curve, the direction and volatility of interest rates, and the
73 Huntington Bancshares Incorporated
changing composition and characteristics of the balance sheet resulting from strategic objectives and customer behavior. AssumptionsOur models incorporate market-based assumptions that include the impact of changing interest rates on prepayment rates of assets and runoff of deposits. The models provide insight on forecasted balance sheet growthalso include our projections of the future volume and composition, and the pricing and maturity characteristics of current and future business.various business lines.
In measuring the financial risks associated with interest rate sensitivity in Huntington’sour balance sheet, Huntington compareswe compare a set of alternative interest rate scenarios to the results of a base case scenario derived using market forward rates. The market forward reflectsrates reflect the market consensus regarding the future level and slope of the yield curve across a range of tenor points. The standard set of interest rate scenarios includes two types: “shock” scenarios which are instantaneousimmediate parallel rate shifts, and “ramp” scenarios where the parallel shift is applied gradually over the first 12 months of the forecast on a pro rata basis. In both shock and ramp scenarios with falling rates, Huntington presumeswe presume that market rates cannotwill not go below 0%. The scenarios are inclusive of all executed interest rate risk hedging activities. Forward starting hedges are included to the extent that they have been transacted and that they start within the measurement horizon.
| | | | | | | | | | | | | | | | | |
| Table 16 - Net Interest Income at Risk |
| | Net Interest Income at Risk (%) |
| Basis point change scenario | -25 | | +100 | | +200 |
| Board policy limits | -1.3 | % | | -2.0 | % | | -4.0 | % |
| December 31, 2020 | -1.1 | | | 3.4 | | | 7.3 | |
| December 31, 2019 | NA | | 1.0 | | | 2.3 | |
Interest rate risk is measured across a range of scenarios and the results are reported to the ROC at least quarterly. A comprehensive discussion of risk management governance can be found in Item 7: Management’s Discussion and Analysis of Financial Condition and Results of Operations and the “Risk Governance” section of this Form 10-K. We use two approaches to model interest rate risk: Net interest income at risk (NII at risk) and economic value of equity at risk modeling sensitivity analysis (EVE at Risk).
NII at Risk is used by management to measure the risk and impact to earnings over the next 12 months, using a variety of interest rate scenarios. The NII at Risk results included in the table abovebelow reflect the analysis used monthly by management. It models gradual (“ramp” as defined above)“ramp” -200, -100, +100 and +200 basis point parallel shifts in market interest rates,shift scenarios implied by the forward yield curve over the next twelve months as well as an instantaneous12 months.
68 Huntington Bancshares Incorporated
| | | | | | | | | | | | | | | | | | | | | | | | | | | | | | | | | | | |
| Table 15 - Net Interest Income at Risk |
| December 31, 2023 | | December 31, 2022 |
| Federal Funds Rate (1) | | | | Federal Funds Rate (1) | | |
| Basis point change scenario | Starting Point (2) | | Month 12 (3) | | NII at Risk (%) | | Starting Point (2) | | Month 12 (3) | | NII at Risk (%) |
| +200 | 5.50 | | 5.75 | | 5.5 | | | 4.50 | | | 6.75 | | | 4.0 | |
| +100 | 5.50 | | 4.75 | | 3.0 | | | 4.50 | | | 5.75 | | | 2.0 | |
| Base | 5.50 | | 3.75 | | — | | | 4.50 | | | 4.75 | | | — | |
| -100 | 5.50 | | 2.75 | | -2.8 | | | 4.50 | | | 3.75 | | | -2.0 | |
| -200 | 5.50 | | 1.75 | | -5.6 | | | 4.50 | | | 2.75 | | | -4.1 | |
(1)Represents the upper bound.
(2)Represents the spot federal funds rate.
(3)Represents the federal funds rate in month 12 given a gradual, parallel shock of -25 basis points.
With“ramp” relative to the continued decline in rates, the down 100 basis point ramp scenario can produce a distorted view of interest rate risks metrics. As a result, the down 100 basis point ramp scenario was replaced with the down 25 basis point shock scenario by the Board as a policy metric beginning September 30, 2020. Management does consider additional scenarios with forecasted negative market rates which would result in margin deterioration.
The increase in sensitivity was driven by the impact of lower forecast rates on non-maturity deposits resulting in slower balance runoff and higher securities prepayments in thebase implied forward scenario resulting in more opportunity for reinvestment at higher rates in rising rate environments. Additionally, an increase in the securities portfolio and the hedge program have also resulted in increased sensitivity.scenario.
Our NII at Risk is within our Board of Directors’ policy limits for the -25, +100 and +200 basis point scenarios. The NII at Risk shows that ourthe balance sheet is asset sensitive at both December 31, 2020,2023 and December 31, 2019.2022. The primary drivers to the change in sensitivity during 2023 include changes in the projected composition and characteristics of the balance sheet, pricing assumptions, hedging activity, and the evolution of market rates over the next 12 months.
| | | | | | | | | | | | | | | | | |
| Table 17 - Economic Value of Equity at Risk |
| | Economic Value of Equity at Risk (%) |
| Basis point change scenario | -25 | | +100 | | +200 |
| Board policy limits | -1.5 | % | | -6.0 | % | | -12.0 | % |
| December 31, 2020 | -0.7 | | | 1.4 | | | -0.1 | |
| December 31, 2019 | NA | | -3.1 | | | -9.1 | |
EVE at Risk is used by management to measure the impact of interest rate changes on the net present value of assets and liabilities, including derivative exposures. The EVE results included in the table abovebelow reflect the analysis used monthly by management. It models immediate -25,-200, -100, +100 and +200 basis point parallel shifts (“shocks” as defined above)“shock” scenarios from the yield curve term points at the specific point in market interest rates.time that EVE sensitivity is measured.
With the continued decline in rates, the down 100 basis point shock scenario can produce a distorted view of interest rate risks metrics. As a result, the down 100 basis point shock scenario was replaced with the down 25 basis point shock scenario by the Board as a policy metric beginning September 30, 2020. Management does consider additional scenarios with forecasted negative market rates to understand the impact on EVE. | | | | | | | | | | | | | | | | | | | | | | | |
| Table 16 - Economic Value of Equity at Risk |
| | Economic Value of Equity at Risk (%) |
| Basis point change scenario | -200 | | -100 | | +100 | | +200 |
| | | | | | | |
| December 31, 2023 | 0.1 | | | 1.6 | | | -3.8 | | | -8.8 | |
| December 31, 2022 | 9.0 | | | 5.9 | | | -8.0 | | | -17.3 | |
We are within our Board of Directors’ policy limits for the -25, +100 and +200 basis point scenarios. The EVE depicts an asset sensitive balance sheet profile. The change in sensitivity from December 31, 2022 was driven primarily by lower interest rates slowing deposit runoff and to a lesser extent, expected securities portfolio runoff.
We have LIBOR-based exposurechanges in the formcomposition and characteristics of certain variablethe balance sheet, routine enhancements to deposit and prepayment modeling assumptions, changes in hedging activity aligned with interest rate loans, derivatives, Series B preferred stock, long term debtrisk positioning through macroeconomic cycles, and other securities and financial arrangements. market rates.
To address the discontinuance of LIBOR, in its current form, we have established a LIBOR transition team and project plan under the oversight of the CRO and CFO,
providing periodic updates to the ROC. In reviewingContract remediation efforts coordinated by the contract fallback language, certain contracts were identified as needing updated provisions for transition. The LIBOR transition team is coordinating remediation, where necessary. Our technology team has undertaken core loan servicing system projectswere complete as of June 2023. Upon the discontinuation of LIBOR, loans and leases that referenced LIBOR were transitioned to support alternative reference rates with some already operational and others with target project completion datesa SOFR-based replacement rate as set forth in the first half of 2021. Additionally, we have developed a SOFR-enabled interest rate risk monitoring framework and a strategy for managing interest rate risk duringrelated contract. For further details on the transition from LIBOR to SOFR. During the fourth quarter of 2020, Huntington began indexing new retail adjustable rate mortgages to SOFR (Secured Overnight Funding Rate).We continue to monitor market developments and regulatory updates, including the recent announcements from the ICE Benchmark Administrator to extend the cessation date for several USD LIBOR tenors to June 30, 2023. For a discussion of the risks associated with the LIBOR transition to alternative reference rates,notional derivatives, refer to "Item 1A:the Use of Derivatives to Manage Interest Rate Risk Factors.”section below.
Use of Derivatives to Manage Interest Rate Risk
An integral component of our interest rate risk management strategy is the use of derivative instruments to minimize significant fluctuations in earnings caused by changes in market interest rates. Examples of derivative instruments that we may use as part of our interest rate risk management strategy include interest rate swaps, interest ratecaps and floors, interest rate caps,collars, forward contracts, and forward starting interest rate swaps.
Huntington has entered into a number of interest rate derivative contracts to manage our interest rate risk position which are economic hedges (i.e., do not receive hedge accounting treatment). The impact of changes in the fair value of derivatives designated as economic hedges are reported in current period earnings. While these interest rate derivatives are used to reduce the long-term interest rate sensitivity, these economic hedges can result in short-term volatility in net interest income as a result of the changes in interest rates.
Table 1817 shows all swap, floorswaption, swaption collar and capfloor positions that are utilized for purposes of managing our exposures to the variability of interest rates. The interest rates variability may impact either the fair value of the assets and liabilities or impact the cash flows attributable to net interest margin. These positions are used to convertprotect the fair value of asset and liabilities by converting the contractual interest rate index of agreed-upon amountson a specified amount of assets and liabilities (i.e., notional amounts) to another interest rate index orindex. The positions are also used to hedge forecasted transactions for the variability in cash flows attributable to the contractually specified interest rate by converting the variable rate index into a fixed rate. The volume, maturity, and mix of portfolio derivative positions change frequently as we adjust our broader interest rate risk management objectives and the balance sheet positions to be hedged. For further information, including the notional amount and fair values of these derivatives, refer to Note 2120 - “Derivative Financial Instruments” of the Notes to Consolidated Financial Statements. 752023 Form 10-K Huntington Bancshares Incorporated69
The following table presents additional information about the interest rate swaps, floorsswaptions, swaption collars, and capsfloors used in Huntington’s asset and liability management activities at December 31, 2020 and December 31, 2019.activities.
| | | | | | | | | | | | | | | | | | | | | | | | | | | | | |
| Table 18 - Weighted-Average Maturity, Receive Rate and LIBOR Reset Rate on Asset Liability Management Instruments |
| December 31, 2020 |
| Notional Value | | Average Maturity (years) | | Fair
Value | | Weighted-Average
Fixed Rate | | Weighted-Average
Reset Rate |
| (dollar amounts in millions) | | | | |
| Asset conversion swaps | | | | | | | | | |
| Receive Fixed - Pay 1 month LIBOR | $ | 6,525 | | | 2.03 | | | $ | 231 | | | 1.81 | % | | 0.15 | % |
| Pay Fixed - Receive 1 month LIBOR (1) | 3,076 | | | 1.99 | | | 3 | | | 0.17 | | | 0.15 | |
| Receive Fixed - Pay 1 month LIBOR - forward starting (2) | 750 | | | 3.29 | | | 23 | | | 1.24 | | | — | |
| Pay Fixed - Receive 1 month LIBOR - forward starting (3) | 408 | | | 9.08 | | | 2 | | | 0.68 | | | — | |
| Liability conversion swaps | | | | | | | | | |
| Receive Fixed - Pay 1 month LIBOR | 5,397 | | | 2.02 | | | 262 | | | 2.28 | | | 0.15 | |
| Receive Fixed - Pay 3 month LIBOR | 800 | | | 0.21 | | | 5 | | | 1.31 | | | 0.22 | |
| | | | | | | | | |
| Basis swaps | | | | | | | | | |
| Pay SOFR- Receive Fed Fund (economic hedges) (4) | $ | 230 | | | 4.66 | | $ | — | | | 0.09 | | | 0.10 | |
| Pay Fed Fund - Receive SOFR (economic hedges) (4) | 41 | | | 1.98 | | | — | | | 0.09 | | | 0.09 | |
| Total swap portfolio | $ | 17,227 | | | | | $ | 526 | | | | | |
| | | | | | | | | |
| December 31, 2020 |
| Notional Value | | Average Maturity (years) | | Fair
Value | | Weighted-Average Floor Strike | | Weighted-Average
Reset Rate |
| (dollar amounts in millions) | | | | |
| Interest rate floors | | | | | | | | | |
| Purchased Interest Rate Floors - 1 month LIBOR | $ | 7,200 | | | 0.37 | | | $ | 59 | | | 1.81 | % | | 0.15 | % |
| Purchased Floor Spread - 1 month LIBOR | 400 | | | 1.74 | | | 7 | | | 2.50 / 1.50 | | 0.15 | |
| Purchased Floor Spread - 1 month LIBOR forward starting (5) | 2,500 | | | 3.72 | | | 76 | | | 1.65 / 0.70 | | — | |
| Purchased Floor Spread - 1 month LIBOR (economic hedges) | 1,000 | | | 2.29 | | 18 | | | 1.75 / 1.00 | | 0.16 | |
| Interest rate caps | | | | | | | | | |
| Purchased Cap - 1 month LIBOR (economic hedges) | 5,000 | | | 6.91 | | 91 | | | 0.98 | | | 0.15 | |
| Total floors portfolio | $ | 16,100 | | | | | $ | 251 | | | | | |
| | | | | | | | | |
| December 31, 2019 |
| Notional Value | | Average Maturity (years) | | Fair
Value | | Weighted-Average Fixed Rate | | Weighted-Average
Reset Rate |
| (dollar amounts in millions) | | | | |
| Asset conversion swaps | | | | | | | | | |
| Receive Fixed - Pay 1 month LIBOR | $ | 5,387 | | | 2.87 | | | $ | 51 | | | 1.89 | % | | 1.73% |
| | | | | | | | | |
| Receive Fixed - Pay 1 month LIBOR - forward starting (6) | 3,250 | | | 4.02 | | | (28) | | | 1.32 | | | — | |
| | | | | | | | | |
| Liability conversion swaps | | | | | | | | | |
| Receive Fixed - Pay 1 month LIBOR | 5,250 | | | 2.97 | | | 146 | | | 2.37 | | | 1.72 | |
| Receive Fixed - Pay 3 month LIBOR | 2,290 | | | 0.84 | | | 5 | | | 1.80 | | | 1.94 | |
| | | | | | | | | |
| | | | | | | | | |
| Total swap portfolio | $ | 16,177 | | | | | $ | 174 | | | | | |
| | | | | | | | | |
| December 31, 2019 |
| Notional Value | | Average Maturity (years) | | Fair
Value | | Weighted-Average Floor Strike | | Weighted-Average
Reset Rate |
| (dollar amounts in millions) | | | | |
| Interest rate floors | | | | | | | | | |
| Purchased Interest Rate Floors - 1 month LIBOR | $ | 9,200 | | | 1.45 | | | $ | 36 | | | 1.84 | % | | 1.54 | % |
| Purchased Floor Spread - 1 month LIBOR | 400 | | | 2.74 | | | 8 | | | 2.50 / 1.50 | | 1.79 | |
| Purchased Floor Spread - 1 month LIBOR - forward starting (7) | 150 | | | 4.34 | | 2 | | | 1.75 / 1.00 | | — | |
| | | | | | | | | |
| | | | | | | | | |
| | | | | | | | | |
| Total floors portfolio | $ | 9,750 | | | | | $ | 46 | | | | | |
| | | | | | | | | | | | | | | | | | | | | | | | | | | | | |
| Table 17 - Information on Asset Liability Management Instruments |
| | | | | | | | | |
| Notional Value | | Weighted-Average Maturity (years) | | Fair
Value | | Weighted-Average Fixed Rate | | Weighted-Average Reset Rate |
| (dollar amounts in millions) | | | | |
| At December 31, 2023 | |
| Asset conversion swaps | | | | | | | | | |
| Securities (1): | | | | | | | | | |
| Pay Fixed - Receive SOFR | $ | 10,721 | | | 3.11 | | | $ | 683 | | | 1.37 | % | | 5.42 | % |
| Pay Fixed - Receive SOFR - forward starting (2) | 928 | | | 8.46 | | | 18 | | | 2.81 | | | — | |
| Loans: | | | | | | | | | |
| | | | | | | | | |
| Receive Fixed - Pay SOFR | 9,275 | | | 3.06 | | | (243) | | | 2.77 | | | 5.34 | |
| Receive Fixed - Pay SOFR - forward starting (3) | 1,400 | | | 4.20 | | | (19) | | | 2.90 | | | — | |
| | | | | | | | | |
| Liability conversion swaps | | | | | | | | | |
| | | | | | | | | |
| | | | | | | | | |
| Receive Fixed - Pay SOFR | 7,568 | | | 3.40 | | | (199) | | | 2.95 | | | 5.14 | |
| Receive Fixed - Pay SOFR - forward starting (3) | 2,125 | | | 3.16 | | | 45 | | | 4.33 | | | — | |
| | | | | | | | | |
| | | | | | | | | |
| Purchased floor spreads (4) | | | | | | | | | |
| Purchased Floor Spread - SOFR | 5,000 | | | 2.29 | | | 38 | | | 2.97 / 3.97 | | — | |
| Purchased Floor Spread - SOFR forward starting (3) | 1,000 | | | 5.54 | | | $ | 26 | | | 1.88 / 3.38 | | — | |
| Basis swaps (5) | | | | | | | | | |
| Pay SOFR- Receive Fed Fund (economic hedges) | 174 | | | 2.58 | | | — | | | 5.33 | | | 5.41 | |
| Pay Fed Fund - Receive SOFR (economic hedges) | 1 | | | 11.81 | | | — | | | 5.45 | | | 5.33 | |
| | | | | | | | | |
| | | | | | | | | |
| Total swap portfolio | $ | 38,192 | | | | | $ | 349 | | | | | |
| | | | | | | | | |
| |
| | | | | | | | | |
| | | | |
| | | | | | | | | |
| | | | | | | | | |
| | | | | | | | | |
| | | | | | | | | |
| | | | | | | | | |
| | | | | | | | | |
| | | | | | | | | |
| | | | | | | | | |
| | | | | | | | | |
| | | | | | | | | |
| | | | | | | | | |
| | | | |
| At December 31, 2022 | |
| Asset conversion swaps | | | | | | | | | |
| Securities (1): | | | | | | | | | |
| Pay Fixed - Receive 1 month LIBOR | $ | 8,024 | | | 3.89 | | | $ | 834 | | | 0.93 | % | | 4.37 | % |
| Pay Fixed - Receive SOFR | 366 | | | 7.02 | | | 49 | | | 1.46 | | | 3.82 | |
| Pay Fixed - Receive 1 month LIBOR - forward starting (6) | 91 | | | 7.31 | | | 12 | | | 1.62 | | | — | |
| Pay Fixed - Receive SOFR - forward starting (7) | 1,926 | | | 6.17 | | | 85 | | | 2.17 | | | — | |
| Loans: | | | | | | | | | |
| Receive Fixed - Pay SOFR - forward starting (8) | 2,950 | | | 4.91 | | | (109) | | | 2.64 | | | — | |
| Receive Fixed - Pay 1 month LIBOR | 7,875 | | | 1.41 | | | (390) | | | 1.21 | | | 4.20 | |
| Receive Fixed - Pay SOFR | 8,700 | | | 3.55 | | | (351) | | | 2.57 | | | 3.90 | |
| Liability conversion swaps | | | | | | | | | |
| Receive Fixed - Pay 1 month LIBOR | 1,430 | | | 1.85 | | | (60) | | | 2.01 | | | 4.25 | |
| Receive Fixed - Pay SOFR | 6,299 | | | 4.91 | | | (201) | | | 3.16 | | | 3.36 | |
| Purchased swaption collars (4) | | | | | | | | | |
| Purchased Interest Rate Swaption Collars | 4,800 | | | 0.27 | | | (6) | | | 2.87 / 4.05 | | — | |
| Basis swaps (5) | | | | | | | | | |
| Pay SOFR- Receive Fed Fund (economic hedges) | 174 | | | 3.58 | | — | | | 4.33 | | | 4.31 | |
| Pay Fed Fund - Receive SOFR (economic hedges) | 1 | | | 12.81 | | | — | | | 4.35 | | | 4.33 | |
| | | | | | | | | |
| | | | | | | | | |
| Total swap portfolio | $ | 42,636 | | | | | $ | (137) | | | | | |
| | | | | | | | | |
| |
| | | | | | | | | |
| | | | |
| | | | | | | | | |
| | | | | | | | | |
| | | | | | | | | |
| | | | | | | | | |
| | | | | | | | | |
| | | | | | | | | |
| | | | | | | | | |
| | | | | | | | | |
| | | | | | | | | |
| | | | | | | | | |
(1)Amounts include interest rate swaps as fair value hedges of fixed-rate investment securities using the last-of-layerportfolio layer method.
(2)Forward starting swaps will become effective starting from April 2021.2025 to October 2027.
(3)Forward starting swaps will become effective starting from January 2021April 2024 to May 2021.March 2025.
(4)SwapsThe weighted average fixed rates for floor spread and swaption collars are the weighted average strike rates for the upper and lower bounds of the instruments.
(5)Basis swaps have variable pay and variable receive resets. Weighted Average Fixed Rateaverage fixed fate column represents pay rate reset.
(5)Forward starting floor spreads will become effective from March 2021 to June 2021.
(6)Forward starting swaps will become effective starting from January 20202023 to June 2021.February 2023.
(7)Forward starting floors will becomeswaps effective starting from March 2021January 2023 to June 2021.October 2027.
(8)Forward starting swaps effective starting from January 2023 to July 2024.
During the year ended December 31, 2023, we purchased interest rate swaptions to reduce the impact on capital from rising rates. These swaptions were economic hedges of interest rate risk attributable to our investment securities with the change in value of these instruments recorded in other noninterest income. We terminated these positions during the 2023 fourth quarter. Cumulatively for the full-year, the net unfavorable mark-to-market on the pay-fixed swaptions program totaled $24 million.
2020 Form 10-K 7076 Huntington Bancshares Incorporated
In the second quarter of 2023, all cleared derivatives that referenced LIBOR transitioned from LIBOR to a SOFR-based replacement rate in accordance with the conventions established by the applicable clearinghouse. Upon the discontinuation of LIBOR, all over-the-counter derivatives that referenced LIBOR were transitioned to a SOFR-based replacement rate as set forth in the related contract. Those derivatives that did not have a clearly defined or practicable replacement benchmark rate set forth in the related contract used the LIBOR Act to replace LIBOR with a SOFR-based rate established by FRB rulemaking. For every LIBOR referenced instrument with a reset date after the LIBOR cessation date, counterparties received a LIBOR referenced instrument maturing on the first reset date after the LIBOR cessation date, and a forward starting SOFR instrument. The instruments received through the transition were economically similar to the instruments held prior to the transition.
Use of Derivatives to Manage Credit Risk
We may utilize credit derivatives as a tool to manage credit risk within the portfolio by purchasing credit protection over certain types of loan products. When we purchase credit protection, such as a CDS, we pay a fee to the seller, or CDS counterparty, in return for the right to receive a payment if a specified credit event occurs. During the fourth quarter of 2023, we completed a synthetic CRT transaction consisting of a CDS to mitigate credit risk associated with a $3 billion portfolio of on-balance sheet prime indirect auto loans and which benefited our regulatory capital ratios by reducing the RWA on the associated pool of loans by approximately $2.4 billion.
MSRs
On January 1, 2020, Huntington made an irrevocable election to subsequently measure all classes of residential MSRs at fair value in order to eliminate any potential measurement mismatch between our economic hedges and the MSRs. The impact of the irrevocable election was not material.
At December 31, 2020,2023, we had a total of $210$515 million of capitalized MSRs representing the right to service $23$33.2 billion in mortgage loans.
MSR fair values are sensitive to movements in interest rates as expected future net servicing income depends on the projected outstanding principal balances of the underlying loans, which can be reduced by prepayments.prepayments and declines in credit quality. Prepayments usually increase when mortgage interest rates decline and decrease when mortgage interest rates rise. We also employ hedging strategies to reduce the risk of MSR fair value changes or impairment. However, volatile changes in interest rates can diminish the effectiveness of these economic hedges. We report changes in the MSR value net of hedge-related trading activity in the mortgage banking income category of noninterest income.
MSR assets are included in servicing rights and other intangible assets in the Consolidated Financial Statements.
Price Risk
Price risk represents the risk of loss arising from adverse movements in the prices of financial instruments that are carried at fair value and are subject to fair value accounting. We have price risk from trading securities, securities owned by our broker-dealer subsidiaries, foreign exchange positions, derivative instruments, and equity investments. We have established loss limits on the trading portfolio, on the amount of foreign exchange exposure that can be maintained, and on the amount of marketable equity securities that can be held.
Liquidity Risk
Liquidity risk is the possibility of us being unable to meet current and future financial obligations in a timely manner. LiquidityThe goal of liquidity management is managed to ensure adequate, stable, reliable, and cost-effective sources of funds to satisfy changes in loan and lease demand, for credit,unexpected levels of deposit withdrawals, investment opportunities, and investment opportunities.other contractual obligations. We consider core earnings, strong capital ratios, and credit quality essential for maintaining high credit ratings, which allows us cost-effective access to market-based liquidity. We rely onmitigate liquidity risk by maintaining liquid assets in the form of cash, cash equivalents, and securities. In addition, we maintain a large, stable core deposit base and a diversified base of readily available wholesale funding sources, including secured funding sources from the FHLB and Federal Reserve through pledged borrowing capacity, issuance through dealers in the capital markets, and access to managecertificates of deposit issued through brokers.
The Board of Directors is responsible for establishing an acceptable level of liquidity risk.risk at Huntington, including approval of the liquidity risk appetite at least annually. The liquidity risk appetite includes certain structural and contingent liquidity risk metrics and limits that are designed and monitored to ensure Huntington maintains adequate liquidity to meet current and future funding needs, including during periods of potential stress. Further, the ALCO is appointed by the ROC to oversee liquidity risk management, andincluding the establishment of liquidity risk policies and limits.additional liquidity risk metrics and limits to support our overall liquidity risk appetite. Liquidity Riskrisk appetite metrics monitored by senior management and reported to the Board at least semi-annually include loans as a percentage of core deposits, a structural funding ratio, internal liquidity stress test coverage ratios, and a holding company cash coverage ratio. Additional key liquidity risk metrics monitored by senior management and reported to ALCO monthly include non-core funds (such as brokered deposits and wholesale borrowings) as a percentage of tangible assets, various deposit concentration limits, including large dollar depositor and brokered deposit limits, and varying types of internally defined liquidity coverage ratios, including minimum reserve balances at the FRB and U.S. Treasury holdings relative to internal liquidity stress outflows. Our liquidity risk metric monitoring thresholds are evaluated at a minimum annually, and more frequently if conditions warrant.
Liquidity risk is managed centrally by Corporate Treasury. TheTreasury with independent oversight of liquidity risk performed by Corporate Risk Management. Our liquidity position is evaluated daily, weekly, and monthly by analyzing the composition of all funding sources, reviewing projected liquidity commitments by future months, and identifying sources and uses of funds. The overall management of our liquidity position is also integrated into retailconsumer and commercial pricing policies to ensure a stable core deposit base. Liquidity risk is reviewed and managed continuously for the Bank and the parent company, as well as its subsidiaries. In addition, liquidity working groups meet regularly to identify and monitor liquidity positions, provide policy guidance, review funding strategies, and oversee the adherence to, and maintenance of, the contingency funding plans.
Our primary source of liquidity is our core deposit base. Core deposits comprised approximately 96% of total deposits at At December 31, 2020. We also have available unused wholesale2023, management believes current sources of liquidity including advances from the FHLB, issuance through dealers in the capital markets,are sufficient to meet Huntington’s on and access to certificates of deposit issued through brokers. Liquidity is further provided by unencumbered, or unpledged, investment securities that totaled $10.8 billion as of December 31, 2020. The treasury department also preparesoff-balance sheet obligations.
We maintain a contingency funding plan that detailsprovides for liquidity stress testing, which assesses the potential erosion of funds in the event of aan institution-specific event or systemic financial market crisis or institutional-specific stress scenario. An examplecrisis. Examples of an institution specific event would beevents could include a downgrade in our public credit rating by a rating agency, due to factors such as deterioration in asset quality, a large charge to earnings, a declinedeclines in profitability or other financial measures, declines in liquidity sources including reductions in deposit balances or access to contingent funding sources, or a significant merger or acquisition. Examples of systemic events unrelated to us that could have an effect on our access to liquidity would becould include terrorism or war, natural disasters, political events, failure of a major financial institution, or the default or bankruptcy of a major corporation, mutual fund, or hedge fund. Similarly, market speculation or rumors about us, or the banking industry in general, may adversely affect the cost and availability of normal funding sources. The liquidity contingency funding plan, thereforewhich is reviewed and approved by the ROC at least annually, outlines the process for addressing a liquidity crisis. The plancrisis and provides for an
77 Huntington Bancshares Incorporated
evaluation of funding sources under various market conditions. It also assigns specific roles and responsibilities and communication protocols for effectively managing liquidity through a problem period.period and outlines early warning indicators that are used to monitor emerging liquidity stress events.
During 2020, Huntington heightened its overallOur largest source of liquidity on a consolidated basis is core deposits, which provide stable and lower-cost funding. Core deposits were $145.5 billion at December 31, 2023 which comprised 96% of total deposits, compared to $142.1 billion, and 96% of total deposits at December 31, 2022. The $3.3 billion increase in core deposits, compared to December 31, 2022, was primarily driven by an increase in consumer deposits, largely money market and certificates of deposits, partially offset by a decrease in commercial core deposits driven by shifts to off-balance sheet liquidity solutions we provide for our customers. Our core deposits come from a base of primary bank customer relationships, and we continue to focus on acquiring and deepening those relationships resulting in our granular and diversified deposit base.
Non-core deposits consist primarily of brokered money market balances. Non-core deposits were $5.8 billion, or 4% of total deposits, at both December 31, 2023 and December 31, 2022. Non-core deposits were below our established liquidity risk management process, including additional communication, monitoring, and reporting, given changesmetric limits at December 31, 2023.
Insured deposits comprised approximately 70% of our total deposits at December 31, 2023, compared to 68% at December 31, 2022. Throughout 2023, we maintained one of the highest levels of insured deposits amongst banks with more than $100 billion in deposits.
72 Huntington Bancshares Incorporated
| | | | | | | | | | | | | | | | | | | | | | | | | | | |
| Table 18 - Deposit Composition | | | | | | | | | | | |
| At December 31, |
| (dollar amounts in millions) | 2023 | | 2022 | | |
| By Type: | | | | | | | | | | | |
| Demand deposits—noninterest-bearing | $ | 30,967 | | | 20 | % | | $ | 38,242 | | | 26 | % | | | | |
| Demand deposits—interest-bearing | 39,190 | | | 26 | | | 43,136 | | | 29 | | | | | |
| Money market deposits | 44,947 | | | 30 | | | 36,082 | | | 24 | | | | | |
| Savings and other domestic deposits | 16,722 | | | 11 | | | 20,357 | | | 14 | | | | | |
| Core certificates of deposit (1) | 13,626 | | | 9 | | | 4,324 | | | 3 | | | | | |
| Total core deposits: | 145,452 | | | 96 | | | 142,141 | | | 96 | | | | | |
| Other domestic deposits of $250,000 or more | 447 | | | — | | | 220 | | | — | | | | | |
| Negotiable CDs, brokered and other deposits | 5,331 | | | 4 | | | 5,553 | | | 4 | | | | | |
| | | | | | | | | | | |
| Total deposits | $ | 151,230 | | | 100 | % | | $ | 147,914 | | | 100 | % | | | | |
| | | | | | | | | | | |
| Total core deposits: | | | | | | | | | | | |
| Commercial | $ | 60,547 | | | 42 | % | | $ | 64,107 | | | 45 | % | | | | |
| Consumer | 84,905 | | | 58 | | | 78,034 | | | 55 | | | | | |
| Total core deposits | $ | 145,452 | | | 100 | % | | $ | 142,141 | | | 100 | % | | | | |
| | | | | | | | | | | |
| Total deposits (insured/uninsured): | | | | | | | | | | | |
| Insured deposits | $ | 105,986 | | | 70 | % | | $ | 100,631 | | | 68 | % | | | | |
| Uninsured deposits (2) | 45,244 | | | 30 | | | 47,283 | | | 32 | | | | | |
| Total deposits | $ | 151,230 | | | 100 | % | | $ | 147,914 | | | 100 | % | | | | |
(1)Includes consumer certificates of deposit of $250,000 or more.
(2)Represents consolidated Huntington uninsured deposits, determined by adjusting the amounts reported in the economic environment as a resultBank Call Report (FFIEC 031) by inter-company deposits, which are not customer deposits and are therefore eliminated through consolidation. As of COVID-19. Overnight funding markets continueDecember 31, 2023, the Bank Call Report uninsured deposit balance was $49.8 billion, which includes $4.6 billion of inter-company deposits. As of December 31, 2022, the Bank Call Report uninsured deposit balance was $84.6 billion, which includes $37.3 billion of inter-company deposits.
| | | | | | | | | | | | | | | | | | | | | | | | | | | | | |
| At December 31, 2023 |
| (dollar amounts in millions) | 3 months
or less | | 3 months
to 6 months | | 6 months
to 12 months | | 12 months
or more | | Total |
| | | | | | | | | |
| | | | | | | | | |
| Portion of U.S. time deposits in excess of insurance limit | $ | 443 | | | $ | 527 | | | $ | 368 | | | $ | 29 | | | $ | 1,367 | |
Cash and cash equivalents were $10.1 billion and $6.7 billion at December 31, 2023 and December 31, 2022, respectively. The $3.4 billion increase in cash and cash equivalents is primarily due to demonstrate ample liquidity withan increase in interest-bearing deposits at the abilityFederal Reserve Bank to obtainsupport short-term funding. We continue to closely monitor wholesale funding markets and all government sponsored programs in relation to Huntington’s liquidity position.
Investment securities portfolio
Our investment securities portfolio is evaluated under established ALCO objectives. Changing market conditions could affect the profitability of the portfolio, as well as the level of interest rate risk exposure.
Total investment securities were $41.2 billion at December 31, 2023, compared to $40.5 billion at December 31, 2022. The composition and contractual maturity$686 million increase in securities compared to December 31, 2022, was due to a managed increase in the portfolio through the purchase of U.S. Treasuries, in addition to an increase in fair market value, partially offset by maturities during the year. At December 31, 2023, the duration of the investment securities portfolio is presented onwas 4.5 years, or 3.7 years net of hedging. Securities are pledged to secure borrowing capacity with the following two tables:
| | | | | | | | | | | | | | | | | |
| Table 19 - Investment Securities and Other Securities Portfolio Summary | | | | | |
| (dollar amounts in millions) | At December 31, |
| Available-for-sale securities, at fair value: | 2020 | | 2019 | | 2018 |
| U.S. Treasury, Federal agency, and other agency securities | $ | 12,831 | | | $ | 10,458 | | | $ | 9,968 | |
| Municipal securities | 3,004 | | | 3,055 | | | 3,440 | |
| Other | 650 | | | 636 | | | 372 | |
| Total available-for-sale securities | $ | 16,485 | | | $ | 14,149 | | | $ | 13,780 | |
| | | | | |
| Held-to-maturity securities, at cost: | | | | | |
| Federal agency and other agency securities | $ | 8,858 | | | $ | 9,066 | | | $ | 8,560 | |
| Municipal securities | 3 | | | 4 | | | 5 | |
| Total held-to-maturity securities | $ | 8,861 | | | $ | 9,070 | | | $ | 8,565 | |
| | | | | |
| Other securities: | | | | | |
| Other securities, at cost: | | | | | |
| Non-marketable equity securities (1) | $ | 359 | | | $ | 387 | | | $ | 543 | |
| Other securities, at fair value: | | | | | |
| Mutual Funds | 50 | | | 53 | | | 20 | |
| Marketable equity securities | 9 | | | 1 | | | 2 | |
| Total other securities | $ | 418 | | | $ | 441 | | | $ | 565 | |
| Duration in years (2) | 3.4 | | | 4.5 | | 4.3 |
(1)Consists of FHLB and FRB restricted stock holdings carried at par.
(2)the Federal Reserve, discussed further in the The average duration assumes aBank Liquidity and Sources of Funding section below. At December 31, 2023, investment securities with market driven prepayment rate on securities subject to prepayment.value of $5.8 billion were unpledged.
| | | | | | | | | | | | | | | | | | | | | | | | | | | | | | | | | | | | | | | | | | | | | | | | | | | | | | | | | | | |
| Table 20 - Investment Securities Portfolio Composition and Contractual Maturity |
| At December 31, 2020 |
| | 1 year or less | | After 1 year through 5 years | | After 5 years through 10 years | | After 10 years | | Total |
| (dollar amounts in millions) | Amount | | Yield (1) | | Amount | | Yield (1) | | Amount | | Yield (1) | | Amount | | Yield (1) | | Amount | | Yield (1) |
| Available-for-sale securities, at fair value: | | | | | | | | | | | | | | | | | | |
| U.S. Treasury | $ | — | | | — | % | | $ | 5 | | | 0.14 | % | | $ | — | | | — | % | | $ | — | | | — | % | | $ | 5 | | | 0.14 | % |
| Federal agencies: | | | | | | | | | | | | | | | | | | | |
| Residential CMO | — | | | — | | | 55 | | | 1.87 | | | — | | | — | | | 3,611 | | | 2.39 | | | 3,666 | | | 2.39 | |
| Residential MBS | — | | | — | | | — | | | — | | | — | | | — | | | 7,935 | | | 1.59 | | | 7,935 | | | 1.59 | |
| Commercial MBS | — | | | — | | | — | | | — | | | — | | | — | | | 1,163 | | | 2.17 | | | 1,163 | | | 2.17 | |
| Other agencies | 1 | | | 3.44 | | | 45 | | | 2.52 | | | 16 | | | 2.48 | | | — | | | — | | | 62 | | | 2.53 | |
| Total U.S. Treasury, Federal agencies and other agencies | 1 | | | 3.46 | | | 105 | | | 2.06 | | | 16 | | | 2.49 | | | 12,709 | | | 1.87 | | | 12,831 | | | 1.87 | |
| Municipal securities | 289 | | | 2.41 | | | 1,016 | | | 2.13 | | | 1,186 | | | 2.77 | | | 513 | | | 3.20 | | | 3,004 | | | 2.58 | |
| Private-label CMO | — | | | — | | | 4 | | | 0.54 | | | 3 | | | 2.50 | | | 2 | | | 1.73 | | | 9 | | | 1.49 | |
| Asset-backed securities | 10 | | | 1.14 | | | 2 | | | 2.74 | | | 31 | | | 1.60 | | | 149 | | | 3.64 | | | 192 | | | 3.16 | |
| Corporate debt | 1 | | | 3.30 | | | 26 | | | 1.80 | | | 418 | | | 1.78 | | | — | | | — | | | 445 | | | 1.78 | |
| Other securities/Sovereign debt | 3 | | | 2.60 | | | 1 | | | 1.64 | | | — | | | — | | | — | | | — | | | 4 | | | 2.42 | |
| Total available-for-sale securities | $ | 304 | | | 2.38 | % | | $ | 1,154 | | | 2.11 | % | | $ | 1,654 | | | 2.49 | % | | $ | 13,373 | | | 1.94 | % | | $ | 16,485 | | | 2.01 | % |
| | | | | | | | | | | | | | | | | | | |
| Held-to-maturity securities, at cost: | | | | | | | | | | | | | | | | | | | |
| Federal agencies: | | | | | | | | | | | | | | | | | | | |
| Residential CMO | $ | — | | | — | % | | $ | 25 | | | 3.07 | % | | $ | — | | | — | % | | $ | 1,754 | | | 2.67 | % | | $ | 1,779 | | | 2.67 | % |
| Residential MBS | — | | | — | | | — | | | — | | | — | | | — | | | 3,715 | | | 2.01 | | | 3,715 | | | 2.01 | |
| Commercial MBS | — | | | — | | | 86 | | | 3.04 | | | 34 | | | 2.77 | | | 2,998 | | | 2.97 | | | 3,118 | | | 2.97 | |
| Other agencies | — | | | — | | | 49 | | | 2.47 | | | 97 | | | 2.47 | | | 100 | | | 2.53 | | | 246 | | | 2.50 | |
| Total Federal agencies and other agencies | — | | | — | | | 160 | | | 2.87 | | | 131 | | | 2.55 | | | 8,567 | | | 2.49 | | | 8,858 | | | 2.50 | |
| Municipal securities | — | | | — | | | — | | | — | | | — | | | — | | | 3 | | | 2.63 | | | 3 | | | 2.63 | |
| Total held-to-maturity securities | $ | — | | | — | % | | $ | 160 | | | 2.87 | % | | $ | 131 | | | 2.55 | % | | $ | 8,570 | | | 2.49 | % | | $ | 8,861 | | | 2.50 | % |
| | | | | | | | | | | | | | | | | | | |
| | | | | | | | | | | | | | | | | | | |
| | | | | | | | | | | | | | | | | | | |
| | | | | | | | | | | | | | | | | | | |
| | | | | | | | | | | | | | | | | | | |
| | | | | | | | | | | | | | | | | | | |
| | | | | | | | | | | | | | | | | | | |
| | | | | | | | | | | | | | | | | | | |
| | | | | | | | | | | | | | | | | | | |
| | | | | | | | | | | | | | | | | | | | | | | | | | | | | | | | | | | | | | | |
| Table 19 - Investment Securities Weighted Average Yield by Maturity |
| | | At December 31, 2023 |
| | | | 1 year or less | | | | After 1 year through 5 years | | | | After 5 years through 10 years | | | | After 10 years | | | | Total |
| (dollar amounts in millions) | | | Yield (1) | | | | Yield (1) | | | | Yield (1) | | | | Yield (1) | | | | Yield (1) |
| Available-for-sale securities: | | | | | | | | | | | | | | | | | | |
| U.S. Treasury | | | 5.40 | % | | | | 4.15 | % | | | | — | % | | | | — | % | | | | 5.40 | % |
| Federal agencies: | | | | | | | | | | | | | | | | | | | |
| Residential CMO | | | — | | | | | — | | | | | 2.46 | | | | | 3.22 | | | | | 3.22 | |
| Residential MBS | | | — | | | | | — | | | | | 1.66 | | | | | 2.17 | | | | | 2.17 | |
| Commercial MBS | | | — | | | | | — | | | | | — | | | | | 2.85 | | | | | 2.85 | |
| Other agencies | | | 2.55 | | | | | 1.55 | | | | | 7.33 | | | | | 7.09 | | | | | 4.52 | |
| Total U.S. Treasury, Federal agency, and other agency securities | | | 5.40 | | | | | 1.71 | | | | | 2.93 | | | | | 2.47 | | | | | 2.85 | |
| Municipal securities | | | 6.65 | | | | | 5.95 | | | | | 4.76 | | | | | 4.63 | | | | | 5.36 | |
| Private-label CMO | | | — | | | | | 0.20 | | | | | 2.42 | | | | | 2.97 | | | | | 2.73 | |
| Asset-backed securities | | | 8.31 | | | | | 1.90 | | | | | 1.67 | | | | | 2.52 | | | | | 3.58 | |
| Corporate debt | | | — | | | | | 2.04 | | | | | 2.30 | | | | | — | | | | | 2.23 | |
| Other securities/Sovereign debt | | | 0.80 | | | | | 0.80 | | | | | — | | | | | — | | | | | 0.80 | |
| Total available-for-sale securities | | | 5.63 | % | | | | 3.79 | % | | | | 3.66 | % | | | | 2.55 | % | | | | 3.12 | % |
| | | | | | | | | | | | | | | | | | | |
| Held-to-maturity securities: | | | | | | | | | | | | | | | | | | | |
| Federal agencies: | | | | | | | | | | | | | | | | | | | |
| Residential CMO | | | — | % | | | | — | % | | | | 2.69 | % | | | | 2.57 | % | | | | 2.58 | % |
| Residential MBS | | | — | | | | | — | | | | | — | | | | | 2.52 | | | | | 2.52 | |
| Commercial MBS | | | — | | | | | — | | | | | 3.02 | | | | | 2.44 | | | | | 2.45 | |
| Other agencies | | | 2.29 | | | | | 2.49 | | | | | 2.36 | | | | | 2.60 | | | | | 2.51 | |
| Total Federal agencies and other agencies | | | 2.29 | | | | | 2.49 | | | | | 2.78 | | | | | 2.53 | | | | | 2.53 | |
| Municipal securities | | | — | | | | | — | | | | | — | | | | | 2.63 | | | | | 2.63 | |
| Total held-to-maturity securities | | | 2.29 | % | | | | 2.49 | % | | | | 2.78 | % | | | | 2.53 | % | | | | 2.53 | % |
| | | | | | | | | | | | | | | | | | | |
| | | | | | | | | | | | | | | | | | | |
| | | | | | | | | | | | | | | | | | | |
| | | | | | | | | | | | | | | | | | | |
| | | | | | | | | | | | | | | | | | | |
| | | | | | | | | | | | | | | | | | | |
| | | | | | | | | | | | | | | | | | | |
| | | | | | | | | | | | | | | | | | | |
| | | | | | | | | | | | | | | | | | | |
(1)Weighted average yields were calculated using amortized cost on a fully-taxable equivalent basis, assuming a 21% tax rate where applicable.
Sources of wholesale funding include non-core deposits (other domestic deposits of $250,000 or more, negotiable CDs, brokered and other deposits), short-term borrowings, and long-term debt. Our wholesale funding totaled $18.8 billion at December 31, 2023, compared to $17.5 billion at December 31, 2022, with the increase primarily due to increases in long-term FHLB borrowings and senior notes, partially offset by a decrease in short-term FHLB borrowings. For further information on our short-term borrowings and long-term debt, refer to Note 11 - “Borrowings” of the Notes to Consolidated Financial Statements. Bank Liquidity and Sources of Funding
Our primary sources of funding for the Bank are retailconsumer and commercial core deposits. At December 31, 2020,2023, these core deposits funded 77% of total assets (116%(119% of total loans). Other sourcesTo the extent we are unable to obtain sufficient liquidity through core deposits and cash and cash equivalents, we may meet out liquidity needs through wholesale funding and asset securitization or sale.
The Bank maintains borrowing capacity at both the FHLB and the Federal Reserve secured by pledged loans and securities. The Bank does not consider borrowing capacity at the Federal Reserve a primary source of funding, however, it could be used as a potential source of liquidity include non-core deposits,in a stressed environment or during a market disruption. At December 31, 2023, the Bank’s available contingent borrowing capacity at the FHLB advances, wholesale debt instruments, and securitizations. Demand deposit overdrafts have been reclassified as loan balances and were $14 million and $25 millionFederal Reserve totaled $83.0 billion, compared to $53.5 billion at December 31, 20202022. The increase reflects our optimization of contingent borrowing capacity through the pledge of incremental assets. The amount of available contingent borrowing capacity may fluctuate based on the level of borrowings outstanding and December 31, 2019, respectively.
The following table reflects contractual maturitieslevel of certain deposits at December 31, 2020.
| | | | | | | | | | | | | | | | | | | | | | | | | | | | | |
| Table 21 - Maturity Schedule of time deposits, brokered deposits, and negotiable CDs | |
| At December 31, 2020 |
| (dollar amounts in millions) | 3 Months or Less | | 3 Months to 6 Months | | 6 Months to 12 Months | | 12 Months or More | | Total |
| Other domestic time deposits of $250,000 or more and brokered deposits and negotiable CDs | $ | 4,237 | | | $ | 54 | | | $ | 45 | | | $ | 18 | | | $ | 4,354 | |
| Other domestic time deposits of $100,000 or more and brokered deposits and negotiable CDs | $ | 4,326 | | | $ | 197 | | | $ | 162 | | | $ | 83 | | | $ | 4,768 | |
7974 Huntington Bancshares Incorporated
Following the first quarter of 2023 bank failures, the FRB established the BTFP as an additional source of available liquidity to support depository institutions through pledging qualifying assets as collateral. The following table reflects deposit composition detail for each of the last three years:
| | | | | | | | | | | | | | | | | | | | | | | | | | | | | | | | | | | |
| Table 22 - Deposit Composition | | | | | | | | | | | |
| At December 31, |
| (dollar amounts in millions) | 2020 | | 2019 | | 2018 (1) |
| By Type: | | | | | | | | | | | |
| Demand deposits—noninterest-bearing | $ | 28,553 | | | 29 | % | | $ | 20,247 | | | 25 | % | | $ | 21,783 | | | 26 | % |
| Demand deposits—interest-bearing | 26,757 | | | 27 | | | 20,583 | | | 25 | | | 20,042 | | | 24 | |
| Money market deposits | 26,248 | | | 27 | | | 24,726 | | | 30 | | | 22,721 | | | 27 | |
| Savings and other domestic deposits | 11,722 | | | 12 | | | 9,549 | | | 12 | | | 10,451 | | | 12 | |
| Core certificates of deposit (2) | 1,425 | | | 1 | | | 4,356 | | | 5 | | | 5,924 | | | 7 | |
| Total core deposits: | 94,705 | | | 96 | | | 79,461 | | | 97 | | | 80,921 | | | 96 | |
| Other domestic deposits of $250,000 or more | 131 | | | — | | | 313 | | | — | | | 337 | | | — | |
| Brokered deposits and negotiable CDs | 4,112 | | | 4 | | | 2,573 | | | 3 | | | 3,516 | | | 4 | |
| | | | | | | | | | | |
| Total deposits | $ | 98,948 | | | 100 | % | | $ | 82,347 | | | 100 | % | | $ | 84,774 | | | 100 | % |
| Total core deposits: | | | | | | | | | | | |
| Commercial | $ | 44,698 | | | 47 | % | | $ | 34,957 | | | 44 | % | | $ | 37,268 | | | 46 | % |
| Consumer | 50,007 | | | 53 | | | 44,504 | | | 56 | | | 43,653 | | | 54 | |
| Total core deposits | $ | 94,705 | | | 100 | % | | $ | 79,461 | | | 100 | % | | $ | 80,921 | | | 100 | % |
(1)Bank has taken steps to support readiness but has not participated through December 31, 2018 includes $210 million of noninterest-bearing and $662 million of interesting bearing deposits classified as held-for-sale.
(2)Includes consumer certificates of deposit of $250,000 or more.
The Bank maintains borrowing capacity at2023. In January 2024, the FHLB andFRB announced it will stop extending loans under the Federal Reserve Bank Discount Window. The Bank does not consider borrowing capacity from the Federal Reserve Bank Discount Window as a primary source of liquidity. Total loans and securities pledged to the Federal Reserve Bank Discount Window and the FHLB are $53.4 billion and $39.6 billion at December 31, 2020 and December 31, 2019, respectively.
To the extent we are unable to obtain sufficient liquidity through core deposits, we may meet our liquidity needs through sources of wholesale funding, asset securitization or sale. Sources of wholesale funding include other domestic deposits of $250,000 or more, brokered deposits and negotiable CDs, short-term borrowings, and long-term debt. At December 31, 2020, total wholesale funding was $12.8 billion, a decrease from $15.3 billion at December 31, 2019. The decrease from the prior year-end primarily relates to an decrease in short-term borrowings and maturity, redemption and tender of long-term debt, partially offset by a increase in brokered deposits and negotiable CDs.BTFP after March 11, 2024.
At December 31, 2020,2023, we believe the Bank has sufficient liquidity and capital resources to meet its cash flow obligations over the next 12 months and for the foreseeable future.
| | | | | | | | | | | | | | | | | | | | | | | | | | | | | |
| Table 23 - Maturity Schedule of Commercial Loans |
| At December 31, 2020 |
| (dollar amounts in millions) | One Year
or Less | | One to
Five Years | | After
Five Years | | Total | | Percent
of total |
| Commercial and industrial | $ | 9,329 | | | $ | 21,603 | | | $ | 4,441 | | | $ | 35,373 | | | 83 | % |
| Commercial real estate—construction | 381 | | | 579 | | | 75 | | | 1,035 | | | 3 | |
| Commercial real estate—commercial | 1,053 | | | 3,694 | | | 1,417 | | | 6,164 | | | 14 | |
| Total | $ | 10,763 | | | $ | 25,876 | | | $ | 5,933 | | | $ | 42,572 | | | 100 | % |
| Variable-interest rates | $ | 8,798 | | | $ | 20,693 | | | $ | 3,578 | | | $ | 33,069 | | | 78 | % |
| Fixed-interest rates | 1,965 | | | 5,183 | | | 2,355 | | | 9,503 | | | 22 | |
| Total | $ | 10,763 | | | $ | 25,876 | | | $ | 5,933 | | | $ | 42,572 | | | 100 | % |
| Percent of total | 25 | % | | 61 | % | | 14 | % | | 100 | % | | |
At December 31, 2020, | | | | | | | | | | | | | | | | | | | | | | | | | | | | | | | |
| Table 20 - Maturity Schedule of Loans and leases |
| At December 31, 2023 |
| (dollar amounts in millions) | One Year
or Less | | One to
Five Years | | Five to
Fifteen Years | | After
Fifteen Years | | Total | | |
| Commercial: | | | | | | | | | | | |
| Commercial and industrial | $ | 14,795 | | | $ | 28,553 | | | $ | 6,447 | | | $ | 862 | | | $ | 50,657 | | | |
| | | | | | | | | | | |
| | | | | | | | | | | |
| | | | | | | | | | | |
| Commercial real estate | 3,846 | | | 6,912 | | | 1,614 | | | 50 | | | 12,422 | | | |
| Lease financing | 408 | | | 3,247 | | | 962 | | | 611 | | | 5,228 | | | |
| Total commercial | 19,049 | | | 38,712 | | | 9,023 | | | 1,523 | | | 68,307 | | | |
| Consumer: | | | | | | | | | | | |
| Residential mortgage | 10 | | | 105 | | | 1,725 | | | 21,880 | | | 23,720 | | | |
| Automobile | 163 | | | 7,985 | | | 4,313 | | | 21 | | | 12,482 | | | |
| | | | | | | | | | | |
| Home equity | 148 | | | 315 | | | 2,259 | | | 7,391 | | | 10,113 | | | |
| RV and marine | 2 | | | 130 | | | 3,328 | | | 2,439 | | | 5,899 | | | |
| Other consumer | 353 | | | 901 | | | 170 | | | 37 | | | 1,461 | | | |
| Total consumer | 676 | | | 9,436 | | | 11,795 | | | 31,768 | | | 53,675 | | | |
| Total loans and leases | $ | 19,725 | | | $ | 48,148 | | | $ | 20,818 | | | $ | 33,291 | | | $ | 121,982 | | | |
| | | | | | | | | | | |
| | | | | | | | | | | |
| | | | | | | | | | | |
| Percent of total | 16 | % | | 40 | % | | 17 | % | | 27 | % | | 100 | % | | |
The following table reflects the market value of investment securities pledged to secure publicloans and trust deposits, trading account liabilities, U.S. Treasury demand notes, and security repurchase agreements totaled $14.4 billion. There were no securities of a single issuer, which are not governmental or government-sponsored, that exceeded 10% of shareholders’ equity at December 31, 2020.leases due after one year:
| | | | | | | | | | | |
| Table 21 - Loans and leases due after one year |
| Interest rate |
| (dollar amounts in millions) | Fixed | | Floating or Adjustable |
| Commercial: | | | |
| Commercial and industrial | $ | 11,563 | | | $ | 24,299 | |
| | | |
| | | |
| | | |
| Commercial real estate | 887 | | | 7,689 | |
| Lease financing | 4,571 | | | 249 | |
| Total commercial | 17,021 | | | 32,237 | |
| Consumer: | | | |
| Residential mortgage | 10,114 | | | 13,596 | |
| Automobile | 12,319 | | | — | |
| | | |
| Home equity | 2,841 | | | 7,124 | |
| RV and marine finance | 5,897 | | | — | |
| Other consumer | 522 | | | 586 | |
| Total consumer | 31,693 | | | 21,306 | |
| Total loans and leases | $ | 48,714 | | | $ | 53,543 | |
Parent Company Liquidity
The parent company’s funding requirements consist primarily of dividends to shareholders, debt service, income taxes, operating expenses, funding of nonbank subsidiaries, repurchases of our stock, and acquisitions. The parent company obtains funding to meet obligations from dividends and interest received from the Bank, interest and dividends received from direct subsidiaries, net taxes collected from subsidiaries included in the federal consolidated tax return, fees for services provided to subsidiaries, and the issuance of debt securities.
AtThe parent company had cash and cash equivalents of $4.0 billion and $3.5 billion at December 31, 20202023 and December 31, 2019, the parent company had $4.4 billion and $3.1 billion, respectively, in cash and cash equivalents.2022, respectively.
On January 20, 2021, the17, 2024, our Board of Directors declared a quarterly common stock cash dividend of $0.15$0.155 per common share. The dividend is payable on April 1, 2021,2024, to shareholders of record on March 18, 2021.2024. Based on the current quarterly dividend of $0.15$0.155 per common share, cash demands required for common stock dividends are estimated to be approximately $153$224 million per quarter. OnAdditionally, on January 20, 2021, the17, 2024, our Board of Directors declared a quarterly Series B, Series C, Series D, Series E, Series F, Series G, Series H, and Series GJ Preferred Stock dividend payable on April 15, 20212024 to shareholders of record on April 1, 2021.2024. On December 7, 2023, our Board of Directors declared a quarterly dividend for the Series I Preferred Stock payable on March 1, 2024 to shareholders of record on February 15, 2024. Total cash demands required for Series B, Series C, Series D, Series E, Series F, and Series G Preferred Stockpreferred stock dividends are expected to be approximately $31$36 million per quarter.
During 2020,2023, the Bank paid preferred and common dividends to the parent company of $45 million and $1.5$1.7 billion, respectively. To meet any additional liquidity needs, the parent company may issue debt or equity securities. To support the parent company’s ability to issue debt or equity securities, we have filed with the SEC an automatic shelf registration statement covering an indeterminate amount or number of securities to be offered or sold from time to time.time as authorized by the Huntington’s Board of Directors.
At December 31, 2023, we believe the Company has sufficient liquidity and capital resources to meet its cash flow obligations over the next 12 months and for the foreseeable future.
Off-Balance Sheet Arrangements
In the normal course of business, we enter into various off-balance sheet arrangements. These arrangements include commitments to extend credit, interest rate swaps, caps and floors, swaption collars, financial guarantees contained in standby letters-of-credit issued by the Bank, and commitments by the Bank to sell mortgage loans.
COMMITMENTS TO EXTEND CREDIT
Commitments to extend credit generally have fixed expiration dates, are variable-rate, and contain clauses that permit Huntington to terminate or otherwise renegotiate the contracts in the event of a significant deterioration in the customer’s credit quality. These arrangements normally require the payment of a fee by the customer, the pricing of which is based on prevailing market conditions, credit quality, probability of funding, and other relevant factors. Since many of these commitments are expected to expire without being drawn upon, the contract amounts are not necessarily indicative of future cash requirements. The interest rate risk arising from these financial instruments is insignificant as a result of their predominantly short-term, variable-rate nature. See Note 2322 - “Commitments and Contingent Liabilities” of the Notes to Consolidated Financial Statements for more information. INTEREST RATE SWAPS
Balance sheet hedging activity is arranged to receive hedge accounting treatment and is classified as either fair value or cash flow hedges. Fair value hedges are purchased to convert deposits and long-term debt from fixed-rate obligations to floating rate. Cash flow hedges are also used to convert floating rate loans made to customers into fixed rate loans. See Note 21 - “Derivative Financial Instruments” of the Notes to Consolidated Financial Statements for more information.STANDBY LETTERS-OF-CREDIT
Standby letters-of-credit are conditional commitments issued to guarantee the performance of a customer to a third-party. These guarantees are primarily issued to support public and private borrowing arrangements, including commercial paper, bond financing, and similar transactions. Most of these arrangements mature within two years and are expected to expire without being drawn upon. Standby letters-of-credit are included in the determination of the amount of risk-based capital that the parent company and the Bank are required to hold. Through our credit process, we monitor the credit risks of outstanding standby letters-of-credit. When it is probable that a standby letter-of-credit will be drawn and not repaid in full, a loss is recognized in the provision for credit losses. See Note 2322 - “Commitments and Contingent Liabilities” of the Notes to Consolidated Financial Statements for more information. 8176 Huntington Bancshares Incorporated
COMMITMENTS TO SELL LOANS
Activity related to our mortgage origination activity supports the hedging of the mortgage pricing commitments to customers and the secondary sale to third parties. In addition, we have commitments to sell residential real estate loans. These contracts mature in less than one year. See Note 2322 - “Commitments and Contingent Liabilities” of the Notes to Consolidated Financial Statements for more information. We believe thatContractual obligations, including off-balance sheet arrangements, are properly considered in our liquidity risk management process.
| Table 24 - Contractual Obligations (1) | | Table 22 - Contractual Obligations (1) | | Table 22 - Contractual Obligations (1) |
| At December 31, 2023 | | | At December 31, 2023 |
| (dollar amounts in millions) | (dollar amounts in millions) | At December 31, 2020 | (dollar amounts in millions) | Less than 1 Year | | 1 to 3 Years | | 3 to 5 Years | | More than 5 Years | | Total |
| Less than 1 Year | | 1 to 3 Years | | 3 to 5 Years | | More than 5 Years | | Total |
| Deposits without a stated maturity | Deposits without a stated maturity | $ | 96,966 | | | $ | — | | | $ | — | | | $ | — | | | $ | 96,966 | |
| Certificates of deposit and other time deposits | Certificates of deposit and other time deposits | 1,591 | | | 336 | | | 55 | | | — | | | 1,982 | |
| Short-term borrowings | Short-term borrowings | 183 | | | — | | | — | | | — | | | 183 | |
| Long-term debt | 1,866 | | | 3,629 | | | 1,442 | | | 1,254 | | | 8,191 | |
| Long-term debt (2) | |
| Operating lease obligations | Operating lease obligations | 43 | | | 79 | | | 58 | | | 77 | | | 257 | |
| Purchase commitments | Purchase commitments | 121 | | | 113 | | | 45 | | | 67 | | | 346 | |
(1)Amounts do not include associated interest payments.
(2)Maturities are based upon the par value.
Operational Risk
Operational risk is the risk of loss due to human error, third-party performance failures, inadequate or failed internal systems and controls, including the use of financial or other quantitative methodologies that may not adequately predict future results; violations of, or noncompliance with, laws, rules, regulations, prescribed practices, or ethical standards; and external influences such as market conditions, fraudulent activities, disasters, failed business contingency plans, and security risks. We continuously strive to test and strengthen our system of internal controls to ensure compliance with significant contracts, agreements, laws, rules, and regulations, to reduce our exposure to fraud, and to improve the oversight of our operational risk.
We actively monitor cyberattacks such as attempts related to online deception and loss of sensitive customer data.
We evaluate internal systems, processes, and controls to mitigate loss from cyber-attacks and, to date, have not experienced any material losses. Cybersecurity threats have increased, primarily through COVID-19 themed phishing campaigns. We are actively monitoring our email gateways for malicious phishing email campaigns. We have also increased our cybersecurity and fraud monitoring activities through the implementation of specific monitoring of remote connections by geography and volume of connections to detect anomalous remote logins, since a significant portion of our workforce is now workinghas the option to work remotely.
Our objective for managing cyber securitycybersecurity risk is to avoid or minimize the impacts of external threat events or other efforts to penetrate our systems. We work to achieve this objective by hardening networks and systems against attack, and by diligently managing visibility and monitoring controls within our data and communications environment to recognize events and respond before the attacker has the opportunity to plan and execute on its own goals. To this end we employ a set of defense in-depth strategies, which include efforts to make us less attractive as a target and less vulnerable to threats, while investing in threat analytic capabilities for rapid detection and response. Potential concerns related to cyber securitycybersecurity may be escalated to our board-level Technology Committee, as appropriate. As a complement to the overall cyber securitycybersecurity risk management, we use a number of internal training methods, both formally through mandatory courses and informally through written communications and other updates. Internal policies and procedures have been implemented to encourage the reporting of potential phishing attacks or other security risks. We also use third-party services to test the effectiveness of our cyber securitycybersecurity risk management framework, and any such third parties are required to comply with our policies regarding information security and confidentiality.
To mitigategovern operational risks, we have an Operational Risk Committee, a Legal, Regulatory, and Compliance Committee, a Funds Movement Committee, a Fraud Risk Committee, an Information and Technology Risk Committee, and a Third Party Risk Management Committee. The responsibilities of these committees, among other duties, include establishing and maintaining management information systems to monitor material risks and to identify potential concerns, risks, or trends that may have a significant impact and
ensuring that recommendations are developed to address the identified issues. In addition, we have a Model Risk Oversight Committee that is responsible for policies and procedures describing how model risk is evaluated and managed and the application of the governance process to implement these practices throughout the enterprise. These committees report any significant findings and remediation recommendations to the Risk Management Committee. Potential concerns may be escalated to our ROC and theour Audit Committee, as appropriate. Significant findings or issues are escalated by the Third Party Risk Management Committee to the Technology Committee of the Board, as appropriate.
The goal of this framework is to implement effective operational risk-monitoring techniques and strategies;risk-monitoring; minimize operational, fraud, and legal losses; minimize the impact of inadequately designed models and enhance our overall performance.
Compliance Risk
Financial institutions are subject to many laws, rules, and regulations at both the federal and state levels. These broad-based laws, rules, and regulations include, but are not limited to, expectations relating to anti-money laundering, lending limits, client privacy, fair lending, prohibitions against unfair, deceptive, or abusive acts or practices, protections for military members as they enter active duty, and community reinvestment. The volume and complexity of recent regulatory changes have increased our overall compliance risk. As such, we utilize various resources to help ensure expectations are met, including a team of compliance experts dedicated to ensuring our conformance with all applicable laws, rules, and regulations. Our colleagues receive training for several broad-based laws and regulations including, but not limited to, anti-money laundering and customer privacy. Additionally, colleagues engaged in lending activities receive training for laws and regulations related to flood disaster protection, equal credit opportunity, fair lending, and/or other courses related to the extension of credit. We sethold ourselves to a high standard of expectation for adherence to compliance management and seek to continuously enhance our performance.
Capital
(This section should be read in conjunction with the “Regulatory Matters” section included in Part I, Item 1: Business and Note 2423 - “Other Regulatory Matters” of the Notes to Consolidated Financial Statements.) Our primary capital objective is to maintain appropriate levels of capital within our Board-approved risk appetite to support the Bank's operations, absorb unanticipated losses and declines in asset values, and provide protection to uninsured depositors and debt holders in the event of liquidation, while also funding organic growth and providing appropriate returns to our shareholders. Both regulatory capital and shareholders’ equity are managed at the Bank and on a consolidated basis. We have an active program for managing capital and maintain a comprehensive process for assessing the Company’s overall capital adequacy.adequacy, including the monitoring and reporting of capital risk metrics to the Board and ROC that we believe are useful for evaluating capital adequacy and making capital decisions. In addition to as-reported regulatory capital and tangible common equity metrics, which are discussed in more detail below, we also actively monitor other measures of capital, such as tangible common equity including the mark-to-market impact on HTM securities and CET1 inclusive of AOCI excluding cash flow hedges. We believe our currentcapital levels of both regulatory capital and shareholders’ equity are adequate.
The U.S. federal banking regulatory agencies have permitted BHCs and banks to phase-in, for regulatory capital purposes, the day-one impact of the new CECL accounting rule on retained earnings over a period of three years. As part of its response to the impact of COVID-19, the U.S. federal banking regulatory agencies issued a final rule that provides the option to temporarily delay certain effects of CECL on regulatory capital for two years, followed by a three-year transition period. The final rule allows BHCs and banks to delay for two years 100% of the day-one impact of adopting CECL and 25% of the cumulative change in the reported allowance for credit losses since adopting CECL. Huntington has elected to adopt the final rule, which is reflected in the regulatory capital data presented below.
83 Huntington Bancshares Incorporated
Regulatory Capital
We are subject to the Basel III capital requirements including the standardized approach for calculating risk-weighted assets in accordance with subpart D of the final capital rule. The following table presents risk-weighted assets and other financial data necessary to calculate certain financial ratios, including CET1, which we use to measure capital adequacy.
| | | | | | | | | | | | | | | | | |
| Table 25 - Capital Under Current Regulatory Standards (Basel III) | | | | | | |
| At December 31, |
| (dollar amounts in millions) | 2020 | | 2019 | | | | | | |
| CET 1 risk-based capital ratio: | | | | | | | | | |
| Total shareholders’ equity | $ | 12,992 | | | 11,795 | | | | | | | |
| Regulatory capital adjustments: | | | | | | | | | |
| CECL transitional amount (1) | 453 | | | — | | | | | | | |
| Shareholders’ preferred equity and related surplus | (2,196) | | | (1,207) | | | | | | | |
| Accumulated other comprehensive loss (income) offset | (192) | | | 256 | | | | | | | |
| Goodwill and other intangibles, net of taxes | (2,107) | | | (2,153) | | | | | | | |
| Deferred tax assets that arise from tax loss and credit carryforwards | (63) | | | (44) | | | | | | | |
| CET 1 capital | 8,887 | | | 8,647 | | | | | | | |
| Additional tier 1 capital | | | | | | | | | |
| Shareholders’ preferred equity and related surplus | 2,196 | | | 1,207 | | | | | | | |
| | | | | | | | | |
| | | | | | | | | |
| Tier 1 capital | 11,083 | | | 9,854 | | | | | | | |
| Long-term debt and other tier 2 qualifying instruments | 660 | | | 672 | | | | | | | |
| Qualifying allowance for loan and lease losses | 1,113 | | | 887 | | | | | | | |
| | | | | | | | | |
| | | | | | | | | |
| Total risk-based capital | $ | 12,856 | | | $ | 11,413 | | | | | | | |
| Risk-weighted assets (RWA) | $ | 88,878 | | | $ | 87,512 | | | | | | | |
| CET 1 risk-based capital ratio | 10.00 | % | | 9.88 | % | | | | | | |
| Other regulatory capital data: | | | | | | | | | |
| Tier 1 risk-based capital ratio | 12.47 | | | 11.26 | | | | | | | |
| Total risk-based capital ratio | 14.46 | | | 13.04 | | | | | | | |
| Tier 1 leverage ratio | 9.32 | | | 9.62 | | | | | | | |
78 Huntington Bancshares Incorporated
| | | | | | | | | | | | | | | | | |
| Table 23 - Capital Under Current Regulatory Standards (Basel III) | | | | | | |
| At December 31, |
| (dollar amounts in millions) | 2023 | | 2022 | | | | | | |
| CET1 risk-based capital ratio: | | | | | | | | | |
| Total shareholders’ equity | $ | 19,353 | | | $ | 17,731 | | | | | | | |
| Regulatory capital adjustments: | | | | | | | | | |
| CECL transitional amount (1) | 219 | | | 328 | | | | | | | |
| Shareholders’ preferred equity and related surplus | (2,404) | | | (2,177) | | | | | | | |
| Accumulated other comprehensive loss | 2,676 | | | 3,098 | | | | | | | |
| Goodwill and other intangible assets, net of taxes | (5,591) | | | (5,663) | | | | | | | |
| Deferred tax assets that arise from tax loss and credit carryforwards | (41) | | | (27) | | | | | | | |
| CET1 capital | 14,212 | | | 13,290 | | | | | | | |
| Additional tier 1 capital | | | | | | | | | |
| Shareholders’ preferred equity and related surplus | 2,404 | | | 2,177 | | | | | | | |
| | | | | | | | | |
| | | | | | | | | |
| Tier 1 capital | 16,616 | | | 15,467 | | | | | | | |
| Long-term debt and other tier 2 qualifying instruments | 1,306 | | | 1,424 | | | | | | | |
| Qualifying allowance for loan and lease losses | 1,735 | | | 1,682 | | | | | | | |
| | | | | | | | | |
| Tier 2 capital | 3,041 | | | 3,106 | | | | | | | |
| Total risk-based capital | $ | 19,657 | | | $ | 18,573 | | | | | | | |
| RWA | $ | 138,706 | | | $ | 141,940 | | | | | | | |
| CET1 risk-based capital ratio | 10.25 | % | | 9.36 | % | | | | | | |
| Other regulatory capital data: | | | | | | | | | |
| Tier 1 risk-based capital ratio | 11.98 | | | 10.90 | | | | | | | |
| Total risk-based capital ratio | 14.17 | | | 13.09 | | | | | | | |
| Tier 1 leverage ratio | 9.32 | | | 8.60 | | | | | | | |
(1)TheHuntington and the Bank elected to temporarily delay certain effects of CECL transitional amount includeson regulatory capital until January 1, 2022 pursuant to a rule that allowed BHCs and banks to delay for two years 100% of the day-one impact of Huntington's adoptionadopting CECL and 25% of the new CECL accounting standard on January 1, 2020cumulative change in the reported allowance for credit losses since adopting CECL. As of December 31, 2023 and 25 percentDecember 31, 2022, we have phased in 50% and 25%, respectively, of the increase in reserves from January 1, 2020cumulative CECL deferral with the remaining impact to be recognized through December 31, 2020.
| | | | | | | | | | | |
| Table 26 - Capital Adequacy—Non-Regulatory (Non-GAAP) |
| (dollar amounts in millions) | At December 31, |
| 2020 | | 2019 |
| Consolidated capital calculations: | | | |
| Common shareholders’ equity | $ | 10,800 | | | $ | 10,592 | |
| Preferred shareholders’ equity | 2,192 | | | 1,203 | |
| Total shareholders’ equity | 12,992 | | | 11,795 | |
| Goodwill | (1,990) | | | (1,990) | |
| Other intangible assets (1) | (151) | | | — | |
| Total tangible equity | 10,851 | | | 9,805 | |
| Preferred shareholders’ equity | (2,192) | | | (1,203) | |
| Total tangible common equity | $ | 8,659 | | | $ | 8,602 | |
| Total assets | $ | 123,038 | | | $ | 109,002 | |
| Goodwill | (1,990) | | | (1,990) | |
| | | |
| | | |
| Other intangible assets (1) | (151) | | | (183) | |
| Total tangible assets | $ | 120,897 | | | $ | 106,829 | |
| Tangible equity / tangible asset ratio | 8.98 | % | | 9.01 | % |
| Tangible common equity / tangible asset ratio | 7.16 | | | 7.88 | |
| Tangible common equity / RWA ratio | 9.74 | | | 9.62 | |
(1)Other intangible assets are net of deferred tax liability.the first quarter 2025.
| | | | | | | | | | | |
| Table 24 - Capital Adequacy—Non-Regulatory (Non-GAAP) |
| At December 31, |
| (dollar amounts in millions) | 2023 | | 2022 |
| Consolidated capital calculations: | | | |
| Total shareholders’ equity | $ | 19,353 | | | $ | 17,731 | |
| Goodwill and other intangible assets | (5,704) | | | (5,766) | |
| Deferred tax liability on other intangible assets (1) | 30 | | | 41 | |
| Total tangible equity (2) | 13,679 | | | 12,006 | |
| Preferred equity | (2,394) | | | (2,167) | |
| Total tangible common equity (2) | $ | 11,285 | | | $ | 9,839 | |
| Total assets | $ | 189,368 | | | $ | 182,906 | |
| Goodwill and other intangible assets | (5,704) | | | (5,766) | |
| Deferred tax liability on other intangible assets (1) | 30 | | | 41 | |
| Total tangible assets (2) | $ | 183,694 | | | $ | 177,181 | |
| Tangible equity / tangible asset ratio (2) | 7.45 | % | | 6.78 | % |
| Tangible common equity / tangible asset ratio (2) | 6.14 | | | 5.55 | |
| Tangible common equity / RWA ratio (2) | 8.14 | | | 6.93 | |
(1)Deferred tax liability related to other intangible assets is calculated at a 21% tax rate.
(2)Tangible equity, tangible common equity, and tangible assets, as well as ratios utilizing these financial measures are non-GAAP financial measures. See Non-GAAP Financial Measures in the Additional Disclosures section.
The following table presents certain regulatory capital data at the consolidated and Bank level:
| | | | | | | | | | | | | | |
| Table 25 - Regulatory Capital Data (1) | | | | |
| | Basel III |
| | At December 31, |
| (dollar amounts in millions) | | 2023 | | 2022 |
| Total risk-weighted assets | Consolidated | $ | 138,706 | | | $ | 141,940 | |
| Bank | 138,462 | | | 141,571 | |
| CET1 risk-based capital | Consolidated | 14,212 | | | 13,290 | |
| Bank | 14,671 | | | 14,133 | |
| Tier 1 risk-based capital | Consolidated | 16,616 | | | 15,467 | |
| Bank | 15,879 | | | 15,334 | |
| Tier 2 risk-based capital | Consolidated | 3,042 | | | 3,106 | |
| Bank | 2,247 | | | 2,313 | |
| Total risk-based capital | Consolidated | 19,657 | | | 18,573 | |
| Bank | 18,126 | | | 17,647 | |
| CET1 risk-based capital ratio | Consolidated | 10.25 | % | | 9.36 | % |
| Bank | 10.60 | | | 9.98 | |
| Tier 1 risk-based capital ratio | Consolidated | 11.98 | | | 10.90 | |
| Bank | 11.47 | | | 10.83 | |
| Total risk-based capital ratio | Consolidated | 14.17 | | | 13.09 | |
| Bank | 13.09 | | | 12.47 | |
| Tier 1 leverage ratio | Consolidated | 9.32 | | | 8.60 | |
| Bank | 8.51 | | | 8.54 | |
(1) Huntington and the Bank elected to temporarily delay certain effects of CECL on regulatory capital until January 1, 2022 pursuant to a rule that allowed BHCs and banks to delay for two years 100% of the day-one impact of adopting CECL and 25% of the cumulative change in the reported allowance for credit losses since adopting CECL. As of December 31, 2023 and December 31, 2022, we have phased in 50% and 25%, respectively, of the cumulative CECL deferral with the remaining impact to be recognized through the first quarter 2025.
At December 31, 2023, we, at both the consolidated and Bank levels for each of the periods presented:
| | | | | | | | | | | | | | |
| Table 27 - Regulatory Capital Data (1) | | | | |
| | At December 31, |
| (dollar amounts in millions) | | Basel III |
| | 2020 | | 2019 |
| Total risk-weighted assets | Consolidated | $ | 88,878 | | | $ | 87,512 | |
| Bank | 88,601 | | | 87,298 | |
| CET 1 risk-based capital | Consolidated | 8,887 | | | 8,647 | |
| Bank | 9,438 | | | 9,747 | |
| Tier 1 risk-based capital | Consolidated | 11,083 | | | 9,854 | |
| Bank | 10,601 | | | 10,621 | |
| Tier 2 risk-based capital | Consolidated | 1,774 | | | 1,559 | |
| Bank | 1,431 | | | 1,243 | |
| Total risk-based capital | Consolidated | 12,856 | | | 11,413 | |
| Bank | 12,032 | | | 11,864 | |
| CET 1 risk-based capital ratio | Consolidated | 10.00 | % | | 9.88 | % |
| Bank | 10.65 | | | 11.17 | |
| Tier 1 risk-based capital ratio | Consolidated | 12.47 | | | 11.26 | |
| Bank | 11.97 | | | 12.17 | |
| Total risk-based capital ratio | Consolidated | 14.46 | | | 13.04 | |
| Bank | 13.58 | | | 13.59 | |
| Tier 1 leverage ratio | Consolidated | 9.32 | | | 9.26 | |
| Bank | 8.94 | | | 10.01 | |
At December 31, 2020, welevel, maintained Basel III capital ratios in excess of the well-capitalized standards established by the FRB.Federal Reserve. The balance sheet growth impact on regulatoryincrease in the consolidated CET1 risk-based capital ratiosratio compared to the prior year, was primarily driven by current period earnings and a decrease in risk-weighted assets, partially offset by dividends. The decrease in risk-weighted assets was largely offset by a change in asset mix during 2020 related to PPP loans and elevated deposits at the Federal Reserve, both of which are 0% risk weighted. The capital impact of earnings, adjusted for the CECL transition, was largely offsetdriven by the repurchasesynthetic CRT transaction, which reduced risk-weighted assets by approximately $2.4 billion, with the risk-weight moving from 100% to 20% on the selected pool of $92 million of common stock over the last four quarters (primarily in the 2020 first quarter) and cash dividends. The regulatory Tier 1 risk-based capital and total risk-based capital ratios also reflect the issuance of $500 million of Series F preferred stock and $500 million of Series G preferred stock in the 2020 second quarter and third quarter, respectively.assets.
Shareholders’ Equity
We generate shareholders’ equity primarily through the retention of earnings, net of dividends and share repurchases. Other potential sources of shareholders’ equity include issuances of common and preferred stock. Our objective is to maintain capital at an amount commensurate with our risk profileappetite and risk tolerance objectives, to meet both regulatory and market expectations, and to provide the flexibility needed for future growth and business opportunities.
Shareholders’ equity totaled $13.0$19.4 billion at December 31, 2020,2023, an increase of $1.2$1.6 billion, or 10%9%, when compared with December 31, 2019 due to2022. The increase was primarily driven by earnings, net of dividends, the changing rate environment causing a decrease in accumulated other comprehensive loss, and net issuance of $500preferred stock. The net issuance of preferred stock is reflective of the first quarter of 2023 issuance of $317 million of Series F Preferred Stock and $500J perpetual preferred stock, partially offset by the fourth quarter of 2023 repurchases totaling $90 million of Series G Preferred Stock in the 2020 second quarter and third quarter, respectively.
On February 2, 2021, Huntington issued $500 million ofE perpetual preferred stock. Huntington issued 20,000,000 depositary shares, each representing a 1/40th ownership interest in a share of 4.50% Series H Non-Cumulative Perpetual Preferred Stock (Preferred H Stock), par value $0.01 per share, with a liquidation preference of $1,000 per share (equivalent to $25 per depositary share).
On June 25, 2020, we were notified by the FRB that certain large BHCs, including Huntington, were required to update and resubmit their capital plans because of changes in financial markets and the macroeconomic outlook that could have a material impact on the BHC’s risk profile and financial condition required the use of updated scenarios. On December 18, 2020, we were notified by the FRB that under both of the severely adverse and the alternative severely adverse economic stress scenarios in the supervisory stress tests, our modeled capital ratios
8580 Huntington Bancshares Incorporated
would continue to exceed the minimum requirements under the FRB's capital adequacy rules. In addition, the FRB announced that they were extending, through March 31, 2021, the time period for the FRB to notify certain large BHCs, including Huntington, whether the FRB will recalculate BHC’s stress capital buffer.
The FRB also announced that certain large BHCs, including Huntington, will be permitted to make both dividend and share repurchases during the first quarter of 2021, subject to limits based on the amount of dividends paid in the second quarter of 2020 and the Bank's average net income for the four preceding quarters. Our first quarter dividend that was declared by the Board of Directors on January 22, 2021 complies with these limits. The FRB will conduct additional analysis each quarter to determine if the restrictions on first quarter capital distributions should be extended to future quarters.
Dividends
We consider disciplined capital management as a key objective, with dividends representing one component. Our strong capital ratios position us to take advantage of additional capital management opportunities.
Share Repurchases
From time to time the Board of Directors authorizes the Company to repurchase shares of our common stock. Although we announce when theour Board of Directors authorizes share repurchases, we typically do not give any public notice before we repurchase our shares. Future stock repurchases may be private or open-market repurchases, including block transactions, accelerated or delayed block transactions, forward transactions, and similar transactions. Various factors determine the amount and timing of our share repurchases, including our capital requirements, the number of shares we expect to issue for employee benefit plans and acquisitions, market conditions (including the trading price of our stock), and regulatory and legal considerations.
On January 18, 2023, our Board authorized the repurchase of up to $1.0 billion of common shares within the eight quarter period ending December 31, 2024, subject to the Federal Reserve’s capital regulations. Purchases of common stock under the authorization may include open market purchases, privately negotiated transactions, and accelerated share repurchase programs. During the year ended December 31, 2023, we repurchased no
shares of common stock under the current repurchase authorization. As part of the 2023 capital plan and our
current expectation that organic capital will be used for funding loan and lease growth and proposed changes to
regulatory capital requirements, we do not expect to utilize the share repurchase program through 2024. However,
we may at our discretion resume share repurchases at any time while considering factors including, but not limited
to, capital requirements and market conditions.
BUSINESS SEGMENT DISCUSSION
Overview
OurHuntington’s business segments are based on our internally-aligned segment leadership structure, which is how we monitor results and assess performance. We have four majorTo align with our strategic priorities, during the second quarter of 2023, we completed an organizational realignment and now report on two business segments: Consumer and Business Banking, Commercial Banking, Vehicle Finance, and& Regional Banking and The Huntington Private Client Group (RBHPCG).Commercial Banking. The Treasury / Other function includes technology and operations, and other unallocated assets, liabilities, revenue, and expense. The organizational realignment primarily involved consolidating our previously reported Consumer and Business Banking, Vehicle Finance and RBHPCG, into one new business segment called Consumer & Regional Banking. Prior period results have been adjusted to conform to the new segment presentation.
Business segment results are determined based upon our management practices, which assigns balance sheet and income statement items to each of the business segments. The process is designed around our organizational and management structure and, accordingly, the results derived are not necessarily comparable with similar information published by other financial institutions.
For a discussion of business segment trends for 2019 versus 2018, see “Part II, Item 7: Management’s Discussion and Analysis of Financial Condition and Results of Operations” Business Segment Discussion included in our 2019 Form 10-K, filed with the SEC on February 14, 2020.
Revenue Sharing
Revenue is recorded in the business segment responsible for the related product or service. Fee sharing is recorded to allocate portions of such revenue to other business segments involved in selling to or providing service to customers. Results of operations for the business segments reflect these fee sharing allocations.
Expense Allocation
The management process that develops the business segment reporting utilizes various estimates and allocation methodologies to measure the performance of the business segments. Expenses are allocated to business segments using a two-phase approach. The first phase consists of measuring and assigning unit costs (activity-based costs) to activities related to product origination and servicing. These activity-based costs are then extended, based on volumes, with the resulting amount allocated to business segments that own the related products. The second phase consists of the allocation of overhead costs to all fourthe business segments from Treasury / Other. We utilize a full-allocation methodology, where all Treasury / Other expenses, except reported acquisition-related expenses, if any, and a small amount of other residual unallocated expenses, are allocated to the four business segments.
Funds Transfer Pricing (FTP)
We use an active and centralized FTP methodology to attribute appropriate net interest income to the business segments. The intent of the FTP methodology is to transfer interest rate risk from the business segments by providing matchedmodeled duration funding of assets and liabilities. The result is to centralize the financial impact, management, and reporting of interest rate risk in the Treasury / Other function where it can be centrally monitored and managed. The Treasury / Other function charges (credits) an internal cost of funds for assets held in (or pays for funding provided by) each business segment. The
During the fourth quarter of 2023, we revised our FTP rate is based on prevailing market interest ratesmethodology for comparable duration assets (or liabilities).non-maturity deposits, which has been enhanced to consider the internally modeled weighted average life by non-maturity deposit type. In general, the impact of the FTP methodology revision resulted in a higher cost of funds allocation as compared with the previous method. Prior period results have been adjusted to conform to the revised FTP methodology.
Net Income (Loss) by Business Segment
Net income (loss) by business segment for the past three years is presented in the following table:
| Table 28 - Net Income by Business Segment | | Table 26 - Net Income (Loss) by Business Segment | | Table 26 - Net Income (Loss) by Business Segment |
| Year Ended December 31, | | | Year Ended December 31, |
| (dollar amounts in millions) | | (dollar amounts in millions) | 2023 | | 2022 | | 2021 |
| | Year Ended December 31, |
| (dollar amounts in millions) | 2020 | | 2019 | | 2018 |
| Consumer and Business Banking | $ | 270 | | | $ | 635 | | | $ | 502 | |
| Consumer & Regional Banking | |
| Consumer & Regional Banking | |
| Consumer & Regional Banking | |
| Commercial Banking | Commercial Banking | 78 | | | 553 | | | 624 | |
| Vehicle Finance | 120 | | | 172 | | | 162 | |
| RBHPCG | 85 | | | 113 | | | 119 | |
| | Treasury / Other | |
| | Treasury / Other | |
| | Treasury / Other | Treasury / Other | 264 | | | (62) | | | (14) | |
| Net income | Net income | $ | 817 | | | $ | 1,411 | | | $ | 1,393 | |
| | | | | | | | | | | | | | | | | | | | | | | | | | | | | | | | | | | | | | | |
| | | | | | | | | | | | | | | | | | | |
| | | | | | | | | | | | | | | | | | | |
| Table 27 - Key Performance Indicators for Consumer & Regional Banking | | | | | | |
| | Year Ended December 31, | | Change from 2022 | | | | | | Year Ended December 31, | | | | | | |
| (dollar amounts in millions unless otherwise noted) | 2023 | | 2022 | | Amount | | Percent | | | | | | 2021 | | | | | | |
| Net interest income | $ | 3,717 | | | $ | 3,213 | | | $ | 504 | | | 16 | % | | | | | | $ | 3,103 | | | | | | | |
| Provision for credit losses | 246 | | | 260 | | | (14) | | | (5) | | | | | | | 2 | | | | | | | |
| Noninterest income | 1,257 | | | 1,272 | | | (15) | | | (1) | | | | | | | 1,289 | | | | | | | |
| Noninterest expense | 3,064 | | | 2,924 | | | 140 | | | 5 | | | | | | | 2,698 | | | | | | | |
| Provision for income taxes | 349 | | | 274 | | | 75 | | | 27 | | | | | | | 355 | | | | | | | |
| Net income | $ | 1,315 | | | $ | 1,027 | | | $ | 288 | | | 28 | % | | | | | | $ | 1,337 | | | | | | | |
| Number of employees (average full-time equivalent) | 11,536 | | | 11,984 | | | (448) | | | (4) | % | | | | | | 11,322 | | | | | | | |
| Total average assets | $ | 71,214 | | | $ | 69,176 | | | $ | 2,038 | | | 3 | | | | | | | $ | 64,121 | | | | | | | |
| Total average loans/leases | 65,349 | | | 62,881 | | | 2,468 | | | 4 | | | | | | | 58,715 | | | | | | | |
| Total average deposits | 105,821 | | | 105,469 | | | 352 | | | — | | | | | | | 91,485 | | | | | | | |
| Net interest margin | 3.45 | % | | 2.99 | % | | 0.46 | % | | 15 | | | | | | | 3.31 | % | | | | | | |
| NCOs | $ | 155 | | | $ | 120 | | | $ | 35 | | | 29 | | | | | | | $ | 96 | | | | | | | |
| NCOs as a % of average loans and leases | 0.24 | % | | 0.19 | % | | 0.05 | % | | 26 | | | | | | | 0.16 | % | | | | | | |
| Total assets under management (in billions)—eop | $ | 23.8 | | | $ | 21.7 | | | $ | 2.1 | | | 10 | | | | | | | $ | 19.8 | | | | | | | |
| Total trust assets (in billions)—eop | 172.2 | | | 135.7 | | | 36.5 | | | 27 | | | | | | | 123.0 | | | | | | | |
82 Huntington Bancshares Incorporated
Consumer & Regional Banking reported net income of $1.3 billion in 2023, an increase of $288 million, or 28%, compared to the year-ago period. Segment net interest income increased $504 million, or 16%, primarily due to a $2.5 billion, or 4%, increase in average loans and leases and a 46 basis point increase in NIM driven by the higher rate environment. The provision for credit losses decreased $14 million, or 5%, primarily due to modest improvement in the macroeconomic environment that was somewhat offset by consumer loan growth over the course of 2023. Noninterest income decreased $15 million, or 1%, primarily due to decreases in gain on sale of loans resulting from the strategic decision to retain the guaranteed portion of SBA loans at origination, in customer deposit and loan fees largely due to program changes, and in mortgage banking income reflecting secondary marketing spreads and lower salable volume. The decreases in noninterest income were partially offset by a $57 million gain on the sale of our RPS business and increases in wealth and asset management revenue and payments and cash management revenue. Noninterest expense increased $140 million, or 5%, primarily due to higher overhead allocations, gains from branch sales recognized in 2022, an increase in personnel expense, and the impact of the FDIC DIF special assessment.
Consumer & Regional Banking reported net income of $1.0 billion in 2022, a decrease of $310 million, compared to the prior year period. Segment net interest income increased $110 million, or 4%, primarily due to an increase in average assets reflecting organic growth and the impact of the TCF acquisition, partially offset by a 32 basis point decrease in NIM driven by higher cost of funds and a decrease in accelerated PPP loan fees recognized upon forgiveness payments from the SBA. The provision for credit losses increased $258 million, primarily due to reserve releases in 2021 as the economic environment was improving, contrasted with reserve builds in 2022 that recognized the increased near-term recessionary risks. Noninterest income decreased $17 million, or 1%, primarily due to lower mortgage banking income reflecting lower salable volume and secondary marketing spreads, partially offset by the impact of the TCF acquisition and an increase in gain on sale of loans, primarily due to sales of SBA loans during the first through third quarters of 2022. Noninterest expense increased $226 million, or 8%, primarily due to the impact of the TCF acquisition largely driven by higher personnel expense reflecting an increase in the number of full-time equivalent employees and allocated overhead.
| | | | | | | | | | | | | | | | | | | | | | | | | | | | | | | | | | | | | | |
| | | | | | | | | | | | | | | | | | |
| | | | | | | | | | | | | | | | | | |
| Table 28 - Key Performance Indicators for Commercial Banking | | | | | |
| | Year Ended December 31, | | Change from 2022 | | | | | | Year Ended December 31, | | | | | |
| (dollar amounts in millions unless otherwise noted) | 2023 | | 2022 | | Amount | | Percent | | | | | | 2021 | | | | | |
| Net interest income | $ | 2,162 | | | $ | 1,807 | | | $ | 355 | | | 20 | % | | | | | | $ | 1,483 | | | | | | |
| Provision for credit losses | 156 | | | 29 | | | 127 | | | NM | | | | | | 23 | | | | | | |
| Noninterest income | 646 | | | 667 | | | (21) | | | (3) | | | | | | | 519 | | | | | | |
| Noninterest expense | 1,134 | | | 1,056 | | | 78 | | | 7 | | | | | | | 787 | | | | | | |
| Provision for income taxes | 319 | | | 292 | | | 27 | | | 9 | | | | | | | 251 | | | | | | |
| Income attributable to non-controlling interest | 20 | | | 10 | | | 10 | | | 100 | | | | | | | 2 | | | | | | |
| Net income attributable to Huntington Bancshares Inc | $ | 1,179 | | | $ | 1,087 | | | $ | 92 | | | 8 | % | | | | | | $ | 939 | | | | | | |
| Number of employees (average full-time equivalent) | 2,276 | | | 2,100 | | | 176 | | | 8 | % | | | | | | 1,734 | | | | | | |
| Total average assets | $ | 63,932 | | | $ | 59,772 | | | $ | 4,160 | | | 7 | | | | | | | $ | 43,924 | | | | | | |
| Total average loans/leases | 55,385 | | | 52,094 | | | 3,291 | | | 6 | | | | | | | 37,900 | | | | | | |
| Total average deposits | 36,152 | | | 34,771 | | | 1,381 | | | 4 | | | | | | | 28,545 | | | | | | |
| Net interest margin | 3.74 | % | | 3.30 | % | | 0.44 | % | | 13 | | | | | | | 3.64 | % | | | | | |
| NCOs | $ | 119 | | | $ | 2 | | | $ | 117 | | | NM | | | | | | $ | 119 | | | | | | |
| NCOs as a % of average loans and leases | 0.21 | % | | — | % | | 0.21 | % | | NM | | | | | | 0.31 | % | | | | | |
Commercial Banking reported net income of $1.2 billion in 2023, an increase of $92 million, or 8%, compared to the year-ago period. Segment net interest income increased $355 million, or 20%, primarily due to a 44 basis point increase in NIM, driven by the higher rate environment resulting in an increase in spreads and an increase in average loans and leases, partially offset by an increase in average deposits. The provision for credit losses increased $127 million due to a combination of commercial loan and lease growth and an increase in the coverage ratio in the commercial real estate portfolio, reflecting ongoing risks in the commercial real estate environment. Noninterest income decreased $21 million, or 3%, primarily due to a decrease in customer deposit and loan fees driven by a reduction in loan commitment fees and a decrease in capital markets and advisory fees, largely due to lower interest rate derivatives fees, partially offset by higher advisory fees from the Capstone acquisition. Partially offsetting these decreases in noninterest income were increases in payments and cash management revenue and wealth and asset management revenue. Noninterest expense increased $78 million, or 7%, primarily due to an increase in personnel costs reflecting the impact of the Capstone acquisition and an increase in average full-time equivalent employees, higher allocated overhead, and the impact of the FDIC DIF special assessment, partially offset by lower lease financing equipment depreciation.
Commercial Banking reported net income of $1.1 billion in 2022, an increase of $148 million, or 16%, compared to the prior year period. Segment net interest income increased $324 million, or 22%, primarily due to an increase in average loans and leases, reflecting the impact of the TCF acquisition and continued organic loan and lease growth, partially offset by a 34 basis point decrease in NIM, driven by higher cost of funds. The provision for credit losses increased $6 million due to a combination of loan and lease growth in 2022 and a reduction in ACL coverage ratios over the course of 2021, as there was more clarity around the economic impacts of COVID-19. Noninterest income increased $148 million, or 29%, reflecting the impact of the TCF acquisition in addition to an increase in capital markets and advisory fees, primarily due to higher advisory fees supported by the impact of the Capstone Partners acquisition, loan syndication fees, foreign exchange fees, and interest rate derivatives fees. Noninterest expense increased $269 million, or 34%, primarily reflecting the impact of the TCF and Capstone Partners acquisitions, which led to higher personnel costs and allocated overhead.
Treasury / Other
The Treasury / Other function includes revenue and expense related to assets, liabilities, derivatives (including mark-to-market of interest rate caps, as applicable), and equity not directly assigned or allocated to one of the four business segments. Assets include investment securities and bank owned life insurance.
Net interest income includes the impact of administering our investment securities portfolios, the net impact of derivatives used to hedge interest rate sensitivity, as well as the financial impact associated with our FTP methodology, as described above. Noninterest income includes miscellaneous fee income not allocated to other business segments, such as bank owned life insurance income and securities and trading asset gains or losses. Noninterest expense includes certain corporate administrative, acquisition-related, if any, and other miscellaneous expenses not allocated to other business segments. The provision for income taxes for the business segments is calculated at a statutory 21% tax rate, although our overall effective tax rate is lower.
Treasury / Other reported a net loss of $543 million in 2023, a decrease in net income of $667 million, compared to the year-ago period, driven by a decrease in net interest income and an increase in noninterest expense, partially offset by an increase in provision benefit for income tax. Net interest income decreased $693 million primarily due to a higher cost of funds. Noninterest expense increased $155 million primarily due to increases in personnel costs and professional services. The increase in provision benefit for income taxes of $204 million is primarily due to lower pre-tax income in addition an increase in discrete tax benefits.
Treasury / Other reported net income of $124 million in 2022, an increase of $1.1 billion, compared to the year-ago period, driven by a $737 million increase in net interest income and a $669 million decrease in noninterest expense, partially offset by a $261 million reduction in provision benefit for income taxes.
8784 Huntington Bancshares Incorporated
| | | | | | | | | | | | | | | | | | | | | | | | | | | | | | | | | |
| Consumer and Business Banking | | | | | | | | | | | | | |
| | | | | | | | | | | | | |
| Table 29 - Key Performance Indicators for Consumer and Business Banking |
| | Year Ended December 31, | | Change from 2019 | | | | | | |
| (dollar amounts in millions unless otherwise noted) | 2020 | | 2019 | | Amount | | Percent | | | | | | 2018 |
| Net interest income | $ | 1,436 | | | $ | 1,766 | | | $ | (330) | | | (19) | % | | | | | | $ | 1,727 | |
| Provision for credit losses | 265 | | | 114 | | | 151 | | | 132 | | | | | | | 137 | |
| Noninterest income | 945 | | | 825 | | | 120 | | | 15 | | | | | | | 744 | |
| Noninterest expense | 1,774 | | | 1,673 | | | 101 | | | 6 | | | | | | | 1,699 | |
| Provision for income taxes | 72 | | | 169 | | | (97) | | | (57) | | | | | | | 133 | |
| Net income | $ | 270 | | | $ | 635 | | | $ | (365) | | | (57) | % | | | | | | $ | 502 | |
| Number of employees (average full-time equivalent) | 7,908 | | | 8,000 | | | (92) | | | (1) | % | | | | | | 8,348 | |
| Total average assets | $ | 28,853 | | | $ | 25,411 | | | $ | 3,442 | | | 14 | | | | | | | $ | 25,147 | |
| Total average loans/leases | 25,453 | | | 22,130 | | | 3,323 | | | 15 | | | | | | | 22,037 | |
| Total average deposits | 56,960 | | | 51,645 | | | 5,315 | | | 10 | | | | | | | 47,782 | |
| Net interest margin | 2.48 | % | | 3.37 | % | | (0.89) | % | | (26) | | | | | | | 3.56 | % |
| NCOs | $ | 102 | | | $ | 128 | | | $ | (26) | | | (20) | | | | | | | $ | 108 | |
| NCOs as a % of average loans and leases | 0.40 | % | | 0.58 | % | | (0.18) | % | | (31) | | | | | | | 0.49 | % |
2020 versus 2019
Consumer and Business Banking, including Home Lending, reported net income of $270 million in 2020, a decrease of $365 million, or 57%, compared with net income of $635 million in 2019. Segment net interest income decreased $330 million, or 19%, due to decreased spread on deposits. The provision for credit losses increased $151 million, or 132% due to the deteriorating economic environment as a result of the COVID-19 pandemic. Noninterest income increased $120 million, or 15%, primarily due to increased mortgage banking income, partially offset by lower service charge income reflecting reduced customer activity and elevated deposit levels. Noninterest expense increased $101 million, or 6%, due to increased personnel and allocated overhead, slightly offset by lower occupancy and equipment expense as a result of branch consolidations and divestitures, along with decreased travel.
Home Lending, an operating unit of Consumer and Business Banking, reflects the result of the origination, sale, and servicing of mortgage loans less referral fees and net interest income for mortgage banking products distributed by the retail branch network and other business segments. Home Lending reported net income of $78 million in 2020, compared with a net income of $23 million in the prior year. Noninterest income increased $179 million, driven primarily by higher secondary marketing spreads and an increase in salable mortgage originations. Noninterest expense increased $80 million due to higher personnel expense as a result of higher origination volumes.
| | | | | | | | | | | | | | | | | | | | | | | | | | | | | | | | | |
| Commercial Banking | | | | | | | | | | | | | |
| | | | | | | | | | | | | |
| Table 30 - Key Performance Indicators for Commercial Banking |
| | Year Ended December 31, | | Change from 2019 | | | | | | |
| (dollar amounts in millions unless otherwise noted) | 2020 | | 2019 | | Amount | | Percent | | | | | | 2018 |
| Net interest income | $ | 903 | | | $ | 1,037 | | | $ | (134) | | | (13) | % | | | | | | $ | 1,013 | |
| Provision for credit losses | 626 | | | 132 | | | 494 | | | 374 | | | | | | | 42 | |
| Noninterest income | 364 | | | 359 | | | 5 | | | 1 | | | | | | | 321 | |
| Noninterest expense | 542 | | | 564 | | | (22) | | | (4) | | | | | | | 502 | |
| Provision for income taxes | 21 | | | 147 | | | (126) | | | (86) | | | | | | | 166 | |
| Net income | $ | 78 | | | $ | 553 | | | $ | (475) | | | (86) | % | | | | | | $ | 624 | |
| Number of employees (average full-time equivalent) | 1,276 | | | 1,317 | | | (41) | | | (3) | % | | | | | | 1,256 | |
| Total average assets | $ | 35,490 | | | $ | 33,843 | | | $ | 1,647 | | | 5 | | | | | | | $ | 31,209 | |
| Total average loans/leases | 27,234 | | | 27,151 | | | 83 | | | — | | | | | | | 26,137 | |
| Total average deposits | 23,321 | | | 21,072 | | | 2,249 | | | 11 | | | | | | | 22,197 | |
| Net interest margin | 3.04 | % | | 3.49 | % | | (0.45) | % | | (13) | | | | | | | 3.53 | % |
| NCOs | $ | 302 | | | $ | 93 | | | $ | 209 | | | 225 | | | | | | | $ | (7) | |
| NCOs as a % of average loans and leases | 1.11 | % | | 0.34 | % | | 0.77 | % | | 226 | | | | | | | (0.03) | % |
2020 versus 2019
Commercial Banking reported net income of $78 million in 2020, a decrease of $475 million, or 86%, compared to the year ago period. Segment net interest income decreased $134 million, or 13%, primarily due to a 45 basis point decrease in net interest margin driven by a sharp decline in the benefit of deposits.The provision for credit losses increased $494 million, or 374%, due to the deteriorating economic environment as a result of the COVID-19 pandemic, as well as an increase incurred losses largely driven by oil and gas, a coal-related credit and a large retail mall REIT relationship. Noninterest income increased $5 million, or 1%, largely driven by an increase in treasury management related revenue reflecting the impact of lower earnings credits on commercial deposit service charges, partially offset by a decline in the gains on sale of loans and leases. Noninterest expense decreased $22 million, or 4%, primarily due to personnel expense reflecting a reduction in incentives and a 3% reduction in full-time equivalent employees, and lower travel and business development expense as a result of COVID-19 related shelter-in-place ordinances, partially offset by an increase in outside data processing and other services.
| | | | | | | | | | | | | | | | | | | | | | | | | | | | | | | | | |
| Vehicle Finance | | | | | | | | | | | | | |
| | | | | | | | | | | | | |
| Table 31 - Key Performance Indicators for Vehicle Finance |
| | Year Ended December 31, | | Change from 2019 | | | | | | |
| (dollar amounts in millions unless otherwise noted) | 2020 | | 2019 | | Amount | | Percent | | | | | | 2018 |
| Net interest income | $ | 430 | | | $ | 397 | | | $ | 33 | | | 8 | % | | | | | | $ | 392 | |
| Provision (reduction in allowance) for credit losses | 146 | | | 44 | | | 102 | | | 232 | | | | | | | 55 | |
| Noninterest income | 9 | | | 12 | | | (3) | | | (25) | | | | | | | 11 | |
| Noninterest expense | 141 | | | 148 | | | (7) | | | (5) | | | | | | | 143 | |
| Provision for income taxes | 32 | | | 45 | | | (13) | | | (29) | | | | | | | 43 | |
| Net income | $ | 120 | | | $ | 172 | | | $ | (52) | | | (30) | % | | | | | | $ | 162 | |
| Number of employees (average full-time equivalent) | 266 | | | 265 | | | 1 | | | — | % | | | | | | 264 | |
| Total average assets | $ | 19,760 | | | $ | 19,393 | | | $ | 367 | | | 2 | | | | | | | $ | 18,430 | |
| Total average loans/leases | 19,939 | | | 19,466 | | | 473 | | | 2 | | | | | | | 18,484 | |
| Total average deposits | 653 | | | 333 | | | 320 | | | 96 | | | | | | | 338 | |
| Net interest margin | 2.15 | % | | 2.04 | % | | 0.11 | % | | 5 | | | | | | | 2.12 | % |
| NCOs | $ | 45 | | | $ | 43 | | | $ | 2 | | | 5 | | | | | | | $ | 43 | |
| NCOs as a % of average loans and leases | 0.23 | % | | 0.22 | % | | 0.01 | % | | 5 | | | | | | | 0.23 | % |
2020 versus 2019
Vehicle Finance reported net income of $120 million in 2020, a decrease of $52 million, or 30%, compared with net income of $172 million in 2019. The decrease was primarily driven by a $102 million increase in the provision for loan losses due to the changes in the economic outlook as a result of the COVID-19 pandemic. Segment net interest income increased $33 million or 8%, due to a 11 basis point increase in the net interest margin and a $0.5 billion increase in average loan balances. The increase in average loan balances reflects strong indirect auto and RV and marine originations over the past 12 months which have more than offset lower commercial balances as a result of lower floor plan line utilization. Noninterest income decreased $3 million primarily as a result of lower servicing revenue as the remaining underlying serviced loans were repurchased during the latter half of 2020, while noninterest expense decreased $7 million, or 5%, primarily reflecting lower allocated overhead.
89 Huntington Bancshares Incorporated
| | | | | | | | | | | | | | | | | | | | | | | | | | | | | | | | | |
| Regional Banking and The Huntington Private Client Group | | | | | | | | | | |
| | | | | | | | | | | | | |
| Table 32 - Key Performance Indicators for Regional Banking and The Huntington Private Client Group |
| | Year Ended December 31, | | Change from 2019 | | | | | | |
| (dollar amounts in millions unless otherwise noted) | 2020 | | 2019 | | Amount | | Percent | | | | | | 2018 |
| Net interest income | $ | 160 | | | $ | 198 | | | $ | (38) | | | (19) | % | | | | | | $ | 203 | |
| Provision (reduction in allowance) for credit losses | 11 | | | (3) | | | 14 | | | 467 | | | | | | | 1 | |
| Noninterest income | 201 | | | 198 | | | 3 | | | 2 | | | | | | | 193 | |
| Noninterest expense | 243 | | | 256 | | | (13) | | | (5) | | | | | | | 244 | |
| Provision for income taxes | 22 | | | 30 | | | (8) | | | (27) | | | | | | | 32 | |
| Net income | $ | 85 | | | $ | 113 | | | $ | (28) | | | (25) | % | | | | | | $ | 119 | |
| Number of employees (average full-time equivalent) | 1,018 | | | 1,057 | | | (39) | | | (4) | % | | | | | | 1,026 | |
| Total average assets | $ | 6,845 | | | $ | 6,438 | | | $ | 407 | | | 6 | | | | | | | $ | 5,802 | |
| Total average loans/leases | 6,574 | | | 6,132 | | | 442 | | | 7 | | | | | | | 5,487 | |
| Total average deposits | 6,531 | | | 5,983 | | | 548 | | | 9 | | | | | | | 5,926 | |
| Net interest margin | 2.36 | % | | 3.18 | % | | (0.82) | % | | (26) | | | | | | | 3.32 | % |
| NCOs | $ | — | | | $ | 1 | | | $ | (1) | | | (100) | | | | | | | $ | — | |
| NCOs as a % of average loans and leases | 0.01 | % | | 0.02 | % | | (0.01) | % | | (50) | | | | | | | — | % |
Total assets under management (in billions)—eop | $ | 19.8 | | | $ | 17.5 | | | $ | 2.3 | | | 13 | | | | | | | $ | 15.3 | |
Total trust assets (in billions)—eop | 123.0 | | | 121.8 | | | 1.2 | | | 1 | | | | | | | 105.1 | |
eop—End of Period.
2020 versus 2019
RBHPCG reported net income of $85 million in 2020, a decrease of $28 million, or 25%, compared with a net income of $113 million in 2019. Net interest income decreased $38 million, or 19%, due to an 82 basis point decrease in net interest margin, reflecting both lower deposit and loan spreads. Average loans increased $0.4 billion, or 7%, primarily due to residential real estate mortgage loans, and average deposits increased $0.5 billion, or 9%, primarily related to PPP, stimulus, and higher customer liquidity levels. Noninterest income increased $3 million, or 2%, primarily due to the gain on sale of Retirement Plan Services recordkeeping and administrative services, higher residential title and life insurance fees, and an increase in assets under management. Noninterest expense decreased $13 million, or 5%, primarily due to lower travel and business development expense as well as lower sponsorships due to delays or cancellation of events.
RESULTS FOR THE FOURTH QUARTER
Earnings Discussion
In the 2020 fourth quarter, we reported net income of $316 million, a decrease of $1 million, from the 2019 fourth quarter. Diluted earnings per common share for the 2020 fourth quarter were $0.27, a decrease of $0.01 from the year-ago quarter.
Net Interest Income / Average Balance Sheet
FTE net interest income for the 2020 fourth quarter increased $44 million, or 6%, from the 2019 fourth quarter. This reflected a $12.2 billion, or 12%, increase in average earning assets, partially offset by an 18 basis point decrease in the FTE net interest margin to 2.94%. The NIM compression reflected a 90 basis point decrease in average earning asset yields and a 25 basis point decrease in the benefit of non-interest bearing funding sources, partially offset by a 97 basis point decrease in the cost of interest bearing liabilities. These decreases reflected the impact of lower interest rates and changes in balance sheet mix, including elevated deposits at the Federal Reserve Bank.
| | | | | | | | | | | | | | | | | | | | | | | |
| Table 33 - Average Earning Assets - 2020 Fourth Quarter vs. 2019 Fourth Quarter |
| | Fourth Quarter | | Change |
| (dollar amounts in millions) | 2020 | | 2019 | | Amount | | Percent |
| Loans/Leases | | | | | | | |
| Commercial and industrial | $ | 34,850 | | | $ | 30,373 | | | $ | 4,477 | | | 15 | % |
| Commercial real estate | 7,177 | | | 6,806 | | | 371 | | | 5 | |
| Total commercial | 42,027 | | | 37,179 | | | 4,848 | | | 13 | |
| Automobile | 12,857 | | | 12,607 | | | 250 | | | 2 | |
| Home equity | 8,919 | | | 9,192 | | | (273) | | | (3) | |
| Residential mortgage | 12,100 | | | 11,330 | | | 770 | | | 7 | |
| RV and marine | 4,181 | | | 3,564 | | | 617 | | | 17 | |
| Other consumer | 1,032 | | | 1,231 | | | (199) | | | (16) | |
| Total consumer | 39,089 | | | 37,924 | | | 1,165 | | | 3 | |
| Total loans/leases | 81,116 | | | 75,103 | | | 6,013 | | | 8 | |
| Total securities | 24,075 | | | 23,161 | | | 914 | | | 4 | |
| Loans held-for-sale and other earning assets | 7,031 | | | 1,798 | | | 5,233 | | | 291 | |
| Total earning assets | $ | 112,222 | | | $ | 100,062 | | | $ | 12,160 | | | 12 | % |
Average earning assets for the 2020 fourth quarter increased $12.2 billion, or 12%, from the year-ago quarter, primarily reflecting a $6.0 billion, or 8%, increase in average total loans and leases. Average C&I loans increased $4.5 billion, or 15%, primarily reflecting $6.2 billion of average PPP loans, partially offset by a $0.9 billion decrease in dealer floorplan loans. Average residential mortgage loans increased $0.8 billion, or 7%, reflecting robust mortgage production in the second half of 2020. Average RV and marine loans increased $0.6 billion, or 17%, reflecting strong consumer demand and continued strong production levels. Average held-for-sale and other earning assets increased $5.2 billion, or 291%, primarily reflecting the $4.8 billion increase in interest bearing deposits at the Federal Reserve Bank. Average total securities increased $0.9 billion, or 4%, primarily reflecting the net purchase of securities during the 2020 fourth quarter and the $0.2 billion mark-to-market of the available-for-sale portfolio.
| | | | | | | | | | | | | | | | | | | | | | | |
| Table 34 - Average Interest-Bearing Liabilities - 2020 Fourth Quarter vs. 2019 Fourth Quarter |
| | Fourth Quarter | | Change |
| (dollar amounts in millions) | 2020 | | 2019 | | Amount | | Percent |
| Interest-bearing deposits: | | | | | | | |
| Demand deposits: interest-bearing | 25,094 | | | 20,140 | | | 4,954 | | | 25 | |
| Money market deposits | 26,144 | | | 24,560 | | | 1,584 | | | 6 | |
| Savings and other domestic deposits | 11,468 | | | 9,552 | | | 1,916 | | | 20 | |
| Core certificates of deposit | 1,479 | | | 4,795 | | | (3,316) | | | (69) | |
| Other domestic deposits of $250,000 or more | 139 | | | 313 | | | (174) | | | (56) | |
| Brokered deposits and negotiable CDs | 4,100 | | | 2,589 | | | 1,511 | | | 58 | |
| | | | | | | |
| Total interest-bearing deposits | 68,424 | | | 61,949 | | | 6,475 | | | 10 | |
| Short-term borrowings | 239 | | | 1,965 | | | (1,726) | | | (88) | |
| Long-term debt | 8,799 | | | 9,886 | | | (1,087) | | | (11) | |
| Total interest-bearing liabilities | $ | 77,462 | | | $ | 73,800 | | | $ | 3,662 | | | 5 | % |
Average total interest-bearing liabilities for the 2020 fourth quarter increased $3.7 billion, or 5%, from the year-ago quarter. Average interest-bearing demand deposits increased $5.0 billion, or 25%, average savings and other domestic deposits increased $1.9 billion, or 20%, and average money market deposits increased $1.6 billion, or 6%. Average brokered deposits and negotiable CDs increased $1.5 billion, or 58%, reflecting balance growth in new and existing brokered deposit accounts. Partially offsetting these increases, average core CDs decreased $3.3 billion, or 69%, reflecting the maturity of balances related to the 2018 consumer deposit growth initiatives. Average total debt decreased $2.8 billion, or 24%, reflecting the repayment of short‐term borrowings, the maturity and issuance of $2.1 billion and $1.2 billion of long-term debt, respectively, over the past five quarters, and the purchase of $0.5 billion of long-term debt under the tender offer completed in November 2020, all due to the strong core deposit growth.
91 Huntington Bancshares Incorporated
Provision for Credit Losses
The provision for credit losses increased $24 million to $103 million in the 2020 fourth quarter compared to $79 million from the year-ago quarter.
| | | | | | | | | | | | | | | | | | | | | | | |
| Noninterest Income | | | | | | | |
| | | | | | | |
| Table 35 - Noninterest Income - 2020 Fourth Quarter vs. 2019 Fourth Quarter |
| | Fourth Quarter | | Change |
| (dollar amounts in millions) | 2020 | | 2019 | | Amount | | Percent |
| Mortgage banking income | $ | 90 | | | $ | 58 | | | $ | 32 | | | 55 | % |
| Service charges on deposit accounts | 78 | | | 95 | | | (17) | | | (18) | |
| Card and payment processing income | 65 | | | 64 | | | 1 | | | 2 | |
| Trust and investment management services | 49 | | | 47 | | | 2 | | | 4 | |
| Capital markets fees | 34 | | | 31 | | | 3 | | | 10 | |
| Insurance income | 25 | | | 24 | | | 1 | | | 4 | |
| Bank owned life insurance income | 14 | | | 17 | | | (3) | | | (18) | |
| Gain on sale of loans | 13 | | | 16 | | | (3) | | | (19) | |
| Net (losses) gains on sales of securities | — | | | (22) | | | 22 | | | 100 | |
| Other noninterest income | 41 | | | 42 | | | (1) | | | (2) | |
| Total noninterest income | $ | 409 | | | $ | 372 | | | $ | 37 | | | 10 | % |
Noninterest income for the 2020 fourth quarter increased $37 million, or 10%, from the year-ago quarter. Mortgage banking income increased $32 million, or 55%, primarily reflecting higher volume and overall salable spreads, partially offset bya $16 million decrease in income from net mortgage servicing rights (MSR) risk management. The 2020 fourth quarter included no net gains or losses on sales of securities, while the year-ago quarter included $22 million of net losses related to the $2 billion portfolio repositioning completed in the quarter. Service charges on deposits accounts decreased $17 million, or 18%, primarily reflecting reduced customer activity and elevated deposits.
| | | | | | | | | | | | | | | | | | | | | | | |
| Noninterest Expense | | | | | | | |
| | | | | | | |
| Table 36 - Noninterest Expense - 2020 Fourth Quarter vs. 2019 Fourth Quarter |
| | Fourth Quarter | | Change |
| (dollar amounts in millions) | 2020 | | 2019 | | Amount | | Percent |
| Personnel costs | $ | 426 | | | $ | 426 | | | $ | — | | | — | % |
| Outside data processing and other services | 111 | | | 89 | | | 22 | | | 25 | |
| Equipment | 49 | | | 42 | | | 7 | | | 17 | |
| Net occupancy | 39 | | | 41 | | | (2) | | | (5) | |
| Professional services | 21 | | | 14 | | | 7 | | | 50 | |
| Amortization of intangibles | 10 | | | 12 | | | (2) | | | (17) | |
| Marketing | 15 | | | 9 | | | 6 | | | 67 | |
| Deposit and other insurance expense | 8 | | | 10 | | | (2) | | | (20) | |
| Other noninterest expense | 77 | | | 58 | | | 19 | | | 33 | |
| Total noninterest expense | $ | 756 | | | $ | 701 | | | $ | 55 | | | 8 | % |
| Number of employees (average full-time equivalent) | 15,477 | | | 15,495 | | | (18) | | | — | % |
Noninterest expense for the 2020 fourth quarter increased $55 million, or 8%, from the year-ago quarter. Outside data processing and other services expense increased $22 million, or 25%, primarily driven by expenses related to technology investments. Other noninterest expense increased $19 million, or 33%, primarily reflecting a $20 million donation to The Columbus Foundation and $7 million of expense from the November 2020 debt tender, partially offset by a $4 million final true-up of the earn out related to the Hutchinson, Shockey, Erley & Co. acquisition in the year-ago quarter. Equipment expense increased $7 million, or 17%, primarily reflecting increased depreciation expense related to technology investments as well as expense related to the branch and facilities consolidations announced in the 2020 third quarter. Professional services expense increased $7 million, or 50%, due to $8 million of TCF merger-related expense. Marketing increased $6 million, or 67%, primarily reflecting strategic
marketing campaigns. The 2020 fourth quarter and 2019 fourth quarter included $6 million and $25 million of total noninterest expense, respectively, related to the previously-announced position reductions and consolidation of branches and other corporate facilities.
Provision for Income Taxes
The provision for income taxes was $59 million in the 2020 fourth quarter compared to $55 million in the 2019 fourth quarter. The effective tax rates for the 2020 fourth quarter and 2019 fourth quarter were 15.8% and 14.8%, respectively.
At December 31, 2020, the Company had a net federal deferred tax liability of $158 million and a net state deferred tax asset of $24 million.
Credit Quality
NCOs
NCOs increased $39 million year-over-year to $112 million. The increase in commercial NCOs was related to the loss incurred on loan sales from one retail mall REIT relationship, while the decrease in consumer NCOs reflected continued strong performance in those portfolios. NCOs represented an annualized 0.55% of average loans and leases in the current quarter, relatively unchanged from the prior quarter and up from 0.39% in the year-ago quarter.
NALs
Asset quality metrics remained in line with overall expectations. The consumer portfolio metrics remained relatively stable, reflecting normal seasonal impacts. The commercial portfolio metrics reflected continued volatility in the oil and gas portfolio, while the remainder of the commercial portfolio has performed well.
NALs increased $64 million, or 14%, from the year-ago quarter to $532 million, or 0.65% of total loans and leases. The year-over-year increase was primarily in the C&I portfolio. OREO balances decreased $7 million, or 64%, from the year-ago quarter. NPAs increased to $563 million, or 0.69% of total loans and leases and OREO. On a linked quarter basis, NALs decreased $37 million, or 7%, while NPAs decreased $39 million, or 6%.
ACL
The ALLL increased by $1.0 billion from the year ago quarter, increasing as a percentage of total loans and leases to 2.22% compared to 1.04% a year ago. The ALLL as a percentage of period-end total NALs increased to 341% from 167% over the same period. The ACL increased by $1.0 billion from the year-ago quarter to $1.9 billion, or 2.29% of total loans and leases. On a linked quarter basis, the ACL decreased $12 million. We believe the levels of the ALLL and ACL are appropriate given the current level of problem loans and the economic outlook.
93 Huntington Bancshares Incorporated
| | | | | | | | | | | | | | | | | | | | | | | |
| Table 37 - Selected Quarterly Financial Information |
| Three Months Ended |
| (amounts in millions, except per share data) | December 31, | | September 30, | | June 30, | | March 31, |
| 2020 | | 2020 | | 2020 | | 2020 |
| Interest income | $ | 878 | | | $ | 892 | | | $ | 902 | | | $ | 975 | |
| Interest expense | 53 | | | 75 | | | 110 | | | 185 | |
| Net interest income | 825 | | | 817 | | | 792 | | | 790 | |
| Provision for credit losses | 103 | | | 177 | | | 327 | | | 441 | |
| Net interest income after provision for credit losses | 722 | | | 640 | | | 465 | | | 349 | |
| Total noninterest income | 409 | | | 430 | | | 391 | | | 361 | |
| Total noninterest expense | 756 | | | 712 | | | 675 | | | 652 | |
| Income before income taxes | 375 | | | 358 | | | 181 | | | 58 | |
| Provision (benefit) for income taxes | 59 | | | 55 | | | 31 | | | 10 | |
| Net income | 316 | | | 303 | | | 150 | | | 48 | |
| Dividends on preferred shares | 35 | | | 28 | | | 19 | | | 18 | |
| Net income applicable to common shares | $ | 281 | | | $ | 275 | | | $ | 131 | | | $ | 30 | |
| Common shares outstanding | | | | | | | |
| Average—basic | 1,017 | | | 1,017 | | | 1,016 | | | 1,018 | |
| Average—diluted | 1,036 | | | 1,031 | | | 1,029 | | | 1,035 | |
| Ending | 1,017 | | | 1,017 | | | 1,017 | | | 1,014 | |
| Book value per common share | $ | 10.62 | | | $ | 10.54 | | | $ | 10.44 | | | $ | 10.42 | |
| Tangible book value per common share (1) | 8.51 | | | 8.43 | | | 8.32 | | | 8.28 | |
| Per common share | | | | | | | |
| Net income—basic | $ | 0.28 | | | $ | 0.27 | | | $ | 0.13 | | | $ | 0.03 | |
| Net income—diluted | 0.27 | | | 0.27 | | | 0.13 | | | 0.03 | |
| | | | | | | |
| | | | | | | |
| | | | | | | |
| | | | | | | |
| | | | | | | |
| | | | | | | |
| Return on average total assets | 1.04 | % | | 1.01 | % | | 0.51 | % | | 0.17 | % |
| Return on average common shareholders’ equity | 10.4 | | | 10.2 | | | 5.0 | | | 1.1 | |
| Return on average tangible common shareholders’ equity (2) | 13.3 | | | 13.2 | | | 6.7 | | | 1.8 | |
| Efficiency ratio (3) | 60.2 | | | 56.1 | | | 55.9 | | | 55.4 | |
| Effective tax rate | 15.8 | | | 15.2 | | | 17.2 | | | 17.0 | |
| Margin analysis-as a % of average earning assets (5) | | | | | | | |
| Interest income (4) | 3.13 | % | | 3.22 | % | | 3.35 | % | | 3.88 | % |
| Interest expense | 0.19 | | | 0.26 | | | 0.41 | | | 0.74 | |
| Net interest margin (4) | 2.94 | % | | 2.96 | % | | 2.94 | % | | 3.14 | % |
| Revenue—FTE | | | | | | | |
| Net interest income | $ | 825 | | | $ | 817 | | | $ | 792 | | | $ | 790 | |
| FTE adjustment | 5 | | | 5 | | | 5 | | | 6 | |
| Net interest income (4) | 830 | | | 822 | | | 797 | | | 796 | |
| Noninterest income | 409 | | | 430 | | | 391 | | | 361 | |
| Total revenue (4) | $ | 1,239 | | | $ | 1,252 | | | $ | 1,188 | | | $ | 1,157 | |
| | | | | | | | | | | | | | | | | | | | | | | |
| Table 38 - Selected Quarterly Capital Data |
| Capital adequacy (Basel III) | 2020 |
| (dollar amounts in millions) | December 31, | | September 30, | | June 30, | | March 31, |
| Total risk-weighted assets | $ | 88,878 | | | $ | 88,417 | | | $ | 87,323 | | | $ | 90,193 | |
| Tier 1 leverage ratio (period end) | 9.32 | % | | 9.31 | % | | 8.86 | % | | 9.01 | % |
| CET 1 risk-based capital ratio | 10.00 | | | 9.89 | | | 9.84 | | | 9.47 | |
| Tier 1 risk-based capital ratio (period end) | 12.47 | | | 12.37 | | | 11.79 | | | 10.81 | |
| Total risk-based capital ratio (period end) | 14.46 | | | 14.39 | | | 13.84 | | | 12.74 | |
| Tangible common equity / tangible asset ratio (5) (7) | 7.16 | | | 7.27 | | | 7.28 | | | 7.52 | |
| Tangible equity / tangible asset ratio (6) (7) | 8.98 | | | 9.13 | | | 8.74 | | | 8.60 | |
| Tangible common equity / risk-weighted assets ratio (7) | 9.74 | | | 9.70 | | | 9.69 | | | 9.32 | |
(1)Other intangible assets are net of deferred tax liability.
(2)Net income applicable to common shares excluding expense for amortization of intangibles for the period divided by average tangible shareholders’ equity. Average tangible shareholders’ equity equals average total shareholders’ equity less average intangible assets and goodwill. Expense for amortization of intangibles and average intangible assets are net of deferred tax liability.
(3)Noninterest expense less amortization of intangibles and goodwill impairment divided by the sum of FTE net interest income and noninterest income excluding securities gains (losses).
(4)Presented on a FTE basis assuming a 21% tax rate.
(5)Tangible common equity (total common equity less goodwill and other intangible assets) divided by tangible assets (total assets less goodwill and other intangible assets). Other intangible assets are net of deferred tax.
(6)Tangible equity (total equity less goodwill and other intangible assets) divided by tangible assets (total assets less goodwill and other intangible assets). Other intangible assets are net of deferred tax.
(7)Tangible equity, tangible common equity, and tangible assets are non-GAAP financial measures. Additionally, any ratios utilizing these financial measures are also non-GAAP. These financial measures have been included as they are considered to be critical metrics with which to analyze and evaluate financial condition and capital strength. Other companies may calculate these financial measures differently.
| | | | | | | | | | | | | | | | | | | | | | | |
| Table 39 - Selected Quarterly Financial Information |
| | Three Months Ended |
| (amounts in millions, except per share data) | December 31, | | September 30, | | June 30, | | March 31, |
| 2019 | | 2019 | | 2019 | | 2019 |
| Interest income | $ | 1,011 | | | $ | 1,052 | | | $ | 1,068 | | | $ | 1,070 | |
| Interest expense | 231 | | | 253 | | | 256 | | | 248 | |
| Net interest income | 780 | | | 799 | | | 812 | | | 822 | |
| Provision for credit losses | 79 | | | 82 | | | 59 | | | 67 | |
| Net interest income after provision for credit losses | 701 | | | 717 | | | 753 | | | 755 | |
| Total noninterest income | 372 | | | 389 | | | 374 | | | 319 | |
| Total noninterest expense | 701 | | | 667 | | | 700 | | | 653 | |
| Income before income taxes | 372 | | | 439 | | | 427 | | | 421 | |
| Provision (benefit) for income taxes | 55 | | | 67 | | | 63 | | | 63 | |
| Net income | 317 | | | 372 | | | 364 | | | 358 | |
| Dividends on preferred shares | 19 | | | 18 | | | 18 | | | 19 | |
| Net income applicable to common shares | $ | 298 | | | $ | 354 | | | $ | 346 | | | $ | 339 | |
| Common shares outstanding | | | | | | | |
| Average—basic | 1,029 | | | 1,035 | | | 1,045 | | | 1,047 | |
| Average—diluted | 1,047 | | | 1,051 | | | 1,060 | | | 1,066 | |
| Ending | 1,020 | | | 1,033 | | | 1,038 | | | 1,046 | |
| Book value per share | $ | 10.38 | | | $ | 10.37 | | | $ | 10.08 | | | $ | 9.78 | |
| Tangible book value per share (1) | 8.25 | | | 8.25 | | | 7.97 | | | 7.67 | |
| Per common share | | | | | | | |
| Net income—basic | $ | 0.29 | | | $ | 0.34 | | | $ | 0.33 | | | $ | 0.32 | |
| Net income —diluted | 0.28 | | | 0.34 | | | 0.33 | | | 0.32 | |
| | | | | | | |
| | | | | | | |
| | | | | | | |
| | | | | | | |
| | | | | | | |
| | | | | | | |
| Return on average total assets | 1.15 | % | | 1.37 | % | | 1.36 | % | | 1.35 | % |
| Return on average common shareholders’ equity | 11.1 | | | 13.4 | | | 13.5 | | | 13.8 | |
| Return on average tangible common shareholders’ equity (2) | 14.3 | | | 17.3 | | | 17.7 | | | 18.3 | |
| Efficiency ratio (3) | 58.4 | | | 54.7 | | | 57.6 | | | 55.8 | |
| Effective tax rate | 14.8 | | | 15.4 | | | 14.6 | | | 15.0 | |
| Margin analysis-as a % of average earning assets (5) | | | | | | | |
| Interest income (4) | 4.03 | % | | 4.21 | % | | 4.35 | % | | 4.40 | % |
| Interest expense | 0.91 | | | 1.01 | | | 1.04 | | | 1.01 | |
| Net interest margin (4) | 3.12 | % | | 3.20 | % | | 3.31 | % | | 3.39 | % |
| Revenue—FTE | | | | | | | |
| Net interest income | $ | 780 | | | $ | 799 | | | $ | 812 | | | $ | 822 | |
| FTE adjustment | 6 | | | 6 | | | 7 | | | 7 | |
| Net interest income (4) | 786 | | | 805 | | | 819 | | | 829 | |
| Noninterest income | 372 | | | 389 | | | 374 | | | 319 | |
| Total revenue (4) | $ | 1,158 | | | $ | 1,194 | | | $ | 1,193 | | | $ | 1,148 | |
95 Huntington Bancshares Incorporated
| | | | | | | | | | | | | | | | | | | | | | | |
| Table 40 - Selected Quarterly Capital Data |
| Capital adequacy (Basel III) | 2019 |
| (dollar amounts in millions) | December 31, | | September 30, | | June 30, | | March 31, |
| Total risk-weighted assets | $ | 87,512 | | | $ | 86,719 | | | $ | 86,332 | | | $ | 85,966 | |
| Tier 1 leverage ratio | 9.26 | % | | 9.34 | % | | 9.24 | % | | 9.16 | % |
| Tier 1 risk-based capital ratio | 9.88 | | | 10.02 | | | 9.88 | | | 9.84 | |
| Total risk-based capital ratio | 11.26 | | | 11.41 | | | 11.28 | | | 11.25 | |
| Tier 1 common risk-based capital ratio | 13.04 | | | 13.29 | | | 13.13 | | | 13.11 | |
| Tangible common equity / tangible asset ratio (5)(7) | 7.88 | | | 8.00 | | | 7.80 | | | 7.57 | |
| Tangible equity / tangible asset ratio (6)(7) | 9.01 | | | 9.13 | | | 8.93 | | | 8.71 | |
| Tangible common equity / risk-weighted assets ratio (7) | 9.62 | | | 9.83 | | | 9.58 | | | 9.34 | |
(1)Other intangible assets are net of deferred tax liability.
(2)Net income applicable to common shares excluding expense for amortization of intangibles for the period divided by average tangible shareholders’ equity. Average tangible shareholders’ equity equals average total shareholders’ equity less average intangible assets and goodwill. Expense for amortization of intangibles and average intangible assets are net of deferred tax.
(3)Noninterest expense less amortization of intangibles and goodwill impairment divided by the sum of FTE net interest income and noninterest income excluding securities gains (losses).
(4)Presented on a FTE basis assuming a 21% tax rate.
(5)Tangible common equity (total common equity less goodwill and other intangible assets) divided by tangible assets (total assets less goodwill and other intangible assets). Other intangible assets are net of deferred tax.
(6)Tangible equity (total equity less goodwill and other intangible assets) divided by tangible assets (total assets less goodwill and other intangible assets). Other intangible assets are net of deferred tax.
(7)Tangible equity, tangible common equity, and tangible assets are non-GAAP financial measures. Additionally, any ratios utilizing these financial measures are also non-GAAP. These financial measures have been included as they are considered to be critical metrics with which to analyze and evaluate financial condition and capital strength. Other companies may calculate these financial measures differently.
ADDITIONAL DISCLOSURES
Forward-Looking Statements
This report, including MD&A, contains certain forward-looking statements, including, but not limited to, certain plans, expectations, goals, projections, and statements, which are not historical facts and are subject to numerous assumptions, risks, and uncertainties. Statements that do not describe historical or current facts, including statements about beliefs and expectations, are forward-looking statements. Forward-looking statements may be identified by words such as expect, anticipate, believe, intend, estimate, plan, target, goal, or similar expressions, or future or conditional verbs such as will, may, might, should, would, could, or similar variations. The forward-looking statements are intended to be subject to the safe harbor provided by Section 27A of the Securities Act of 1933, Section 21E of the Securities Exchange Act of 1934, and the Private Securities Litigation Reform Act of 1995.
While there is no assurance that any list of risks and uncertainties or risk factors is complete, below are certain factors which could cause actual results to differ materially from those contained or implied in the forward-looking statements: changes in general economic, political, or industry conditions; deterioration in business and economic conditions, including persistent inflation, supply chain issues or labor shortages; instability in global economic conditions and geopolitical matters, as well as volatility in financial markets;the magnitude and durationimpact of pandemics, including the COVID-19 pandemic and itsrelated variants and mutations, and their impact on the global economy and financial market conditions and our business, results of operations, and financial condition; the impacts related to or resulting from recent bank failures and other volatility, including potential increased regulatory requirements and costs, such as FDIC special assessments, long-term debt requirements and heightened capital requirements, and potential impacts to macroeconomic conditions, which could affect the ability of depository institutions, including us, to attract and retain depositors and to borrow or raise capital; unexpected outflows of uninsured deposits which may require us to sell investment securities at a loss; rising interest rates which could negatively impact the value of our portfolio of investment securities; the loss of value of our investment portfolio which could negatively impact market perceptions of us and could lead to deposit withdrawals; the effects of social media on market perceptions of us and banks generally; cybersecurity risks; uncertainty in U.S. fiscal and monetary policy, including the interest rate policies of the Federal Reserve Board;Reserve; volatility and disruptions in global capital and credit markets; movements in interest rates; reform of LIBOR; competitive pressures on product pricing and services; success, impact, and timing of our business strategies, including market acceptance of any new products or services including those implementing our “Fair Play” banking philosophy; the nature, extent, timing, and results of governmental actions, examinations, reviews, reforms, regulations, and interpretations, including those related to the Dodd-Frank Wall Street Reform and Consumer Protection Act and the Basel III regulatory capital reforms, as well as those involving the OCC, Federal Reserve, FDIC, and CFPB; the occurrence of any event, change or other circumstances that could give rise to the right of one or both of the parties to terminate the merger agreement between Huntington and TCF; the outcome of any legal proceedings that may be instituted against Huntington or TCF; delays in completing the transaction; the failure to obtain necessary regulatory approvals (and the risk that such approvals may result in the imposition of conditions that could adversely affect the combined company or the expected benefits of the transaction); the failure to obtain shareholder approvals or to satisfy any of the other conditions to the transaction on a timely basis or at all; the possibility that the anticipated benefits of the transaction are not realized when expected or at all, including as a result of the impact of, or problems arising from, the integration of the two
companies or as a result of the strength of the economy and competitive factors in the areas where Huntington and TCF do business; the possibility that the transaction may be more expensive to complete than anticipated, including as a result of unexpected factors or events; diversion of management’s attention from ongoing business operations and opportunities; potential adverse reactions or changes to business or employee relationships, including those resulting from the announcement or completion of the transaction; the ability to complete the transaction and integration of Huntington and TCF successfully; the dilution caused by Huntington’s issuance of additional shares of its capital stock in connection with the transaction; and other factors that may affect the future results of Huntington and TCF.Huntington.
All forward-looking statements speak only as of the date they are made and are based on information available at that time. Neither Huntington nor TCF assumesdoes not assume any obligation to update forward-looking statements to reflect circumstances or events that occur after the date the forward-looking statements were made or to reflect the occurrence of unanticipated events except as required by federal securities laws. As forward-looking statements involve significant risks and uncertainties, caution should be exercised against placing undue reliance on such statements.
Non-GAAP Financial Measures
This document contains GAAP financial measures and non-GAAP financial measures where management believes it to be helpful in understanding our results of operations or financial position. Where non-GAAP financial measures are used, the comparable GAAP financial measure, as well as the reconciliation to the comparable GAAP financial measure, can be found herein.
Fully-Taxable Equivalent Basis
Interest income, yields, and ratios on aan FTE basis are considered non-GAAP financial measures. Management believes net interest income on aan FTE basis provides an insightful picture of the interest margin for comparison purposes. The FTE basis also allows management to assess the comparability of revenue arising from both taxable and tax-exempt sources. The FTE basis assumes a federal statutory tax rate of 21 percent.21%. We encourage readers to consider the Consolidated Financial Statements and other financial information contained in this Form 10-K in their entirety, and not to rely on any single financial measure.
Non-Regulatory Capital Ratios
In addition to capital ratios defined by banking regulators, the Company considers various other measures when evaluating capital utilization and adequacy, including:
•Tangible common equity to tangible assets,
•Tangible equity to tangible assets, and
•Tangible common equity to risk-weighted assets using Basel III definitions.
These non-regulatory capital ratios are viewed by management as useful additional methods of reflecting the level of capital available to withstand unexpected market conditions. Additionally, presentation of these ratios allows readers to compare our capitalization to other financial services companies. These ratios differ from capital ratios defined by banking regulators principally in that the numerator excludes goodwill and other intangible assets, the nature and extent of which varies among different financial services companies. These ratios are not defined in GAAP or federal banking regulations. As a result, these non-regulatory capital ratios disclosed by the Company are considered non-GAAP financial measures.
Because there are no standardized definitions for these non-regulatory capital ratios, the Company’s calculation methods may differ from those used by other financial services companies. Also, there may be limits in the usefulness of these measures to investors. As a result, we encourage readers to consider the Consolidated Financial Statements and other financial information contained in this Form 10-K in their entirety, and not to rely on any single financial measure.
Risk Factors
More information on risk is discussed in the Risk Factors section included in Item 1A: “Risk Factors” of this report. Additional information regarding risk factors can also be found in the Risk Management and Capital discussion of this report, as well as the “Regulatory Matters” section included in Item 1 :1: Business of this report. 97 Huntington Bancshares Incorporated
Critical Accounting Policies and Use of Significant Estimates
Our Consolidated Financial Statements are prepared in accordance with GAAP. The preparation of financial statements in conformity with GAAP requires us to establish accounting policies and make estimates that affect amounts reported in our Consolidated Financial Statements. Note 1 - “Significant Accounting Policies” of the Notes to Consolidated Financial Statements, which is incorporated by reference into this MD&A, describes the significant accounting policies we used in our Consolidated Financial Statements. An accounting estimate requires assumptions and judgments about uncertain matters that could have a material effect on the Consolidated Financial Statements. Estimates are made under facts and circumstances at a point in time, and changes in those facts and circumstances could produce results substantially different from those estimates. Our most significant accounting policies and estimates and their related application are discussed below.
Allowance for Credit Losses
Our ACL at December 31, 20202023 represents our current estimate of the lifetime credit losses expected from our loan and lease portfolio and our unfunded loan commitments and letters of credit.lending commitments. Management estimates the allowance for credit lossesACL by projecting probability of default, loss given default and exposure at default conditional on economic parameters, for the remaining contractual term. Internal factors that impact the quarterly allowance estimate include the level of outstanding balances, the portfolio performance and assigned risk ratings.
One of the most significant judgments influencing the allowance for credit lossesACL estimate is the macro-economicmacroeconomic forecasts. Key external economic parameters that directly impact our loss modeling framework include forecasted footprint unemployment rates and Gross Domestic Product.GDP. Changes in the economic forecasts could significantly affect the estimated credit losses, which could potentially lead to materially different allowance levels from one reporting period to the next.
Given the dynamic relationship between macro-economicmacroeconomic variables within our modeling framework, it is difficult to estimate the impact of a change in any one individual variable on the allowance. As a result, management uses a probability-weighted approach that incorporates a baseline, an adverse, and a more favorable economic scenario when formulating the quantitative estimate this quarter.estimate.
86 Huntington Bancshares Incorporated
However, to illustrate a hypothetical sensitivity analysis, management calculated a quantitative allowance using a 100% weighting applied to an adverse scenario. This scenario includes assumptions around new infectionscontemplates an increased risk of an extended government shutdown, persisting inflation concerns at the Federal Reserve causing the federal funds rate to remain elevated through the first quarter of 2024, ongoing banking industry uncertainty, and COVID-19 deaths being significantly abovethe tightening of lending standards. Increased geopolitical tensions between China and Taiwan impact the supply chain for semiconductors and the threat of a wider conflict causes consumer confidence to fall. Additionally, the Russian invasion of Ukraine lasts longer than in the baseline projections,scenario and concerns increase around the Hamas-Israel conflict leading to a much slower re-openingbroader war in the Middle East. The combination of the economy.risk of federal shutdown, political tensions, tightening lending standards and the federal funds rate remaining elevated cause the stock market to fall. The economy falls into a recession in the first quarter of 2024. In response to the recession, the Federal Reserve starts lowering the federal funds rate in the second quarter of 2024, with significant rate reductions by the end of 2024. Under this scenario, as an example, the unemployment rate increases from baseline levels and remains elevated for a prolonged period, andthe rate is estimated to remain at 10.2%7.6% and 8.7%6.9% at the end of 20212024 and 2022,2025, respectively. These numbers representThis forecast reflects unemployment rates that are approximately 3%3.6% and 2.9% higher unemployment estimates than baseline scenario projections of 7.2%4.0% and 5.6%4.0%, respectively, for the same time periods.
To demonstrate the sensitivity to key economic parameters used in the calculation of our ACL at December 31, 2023, management calculated the difference between a 100% baseline weightingour quantitative ACL and athis 100% adverse scenario weighting for modeled results. Thisscenario. Excluding consideration of qualitative adjustments, this sensitivity analysis would result in an incremental quantitative allowance impacta hypothetical increase in our ACL of approximately $700 million.$1.1 billion at December 31, 2023. This hypothetical increase is reflective of the sensitivity of the rate of change in the unemployment variable on our models.
The resulting difference is not intended to represent an expected increase in allowance levels for a number of reasons including the following:
•Management uses a weighted approach applied to multiple economic scenarios for its allowance estimation process;
•The highly uncertain economic environment;
•The difficulty in predicting the inter-relationships between the economic parameters used in the various economic scenarios; and
•The sensitivity estimate does not account for any general reserve components and associated risk profile adjustments incorporated by management as part of its overall allowance framework.
We regularly review our ACL for appropriateness by performing on-going evaluations of the loan and lease portfolio. In doing so, we consider factors such as the differing economic risks associated with each loan category, the financial condition of specific borrowers, the level of delinquent loans, the value of any collateral and, where applicable, the existence of any guarantees or other documented support. We also evaluate the impact of changes in key economic parameters and overall economic conditions on the ability of borrowers to meet their financial
obligations when quantifying our exposure to credit losses and assessing the appropriateness of our ACL at each reporting date. There is no certainty that our ACL will be appropriate over time to cover losses in our portfolio as economic and market conditions may ultimately differ from our reasonable and supportable forecast. Additionally, events adversely affecting specific customers, industries, or our markets such as the current COVID-19 pandemic,geopolitical instability, or risks of inflation including a near-term recession, could severely impact our current expectations. If the credit quality of our customer base materially deteriorates or the risk profile of a market, industry, or group of customers changes materially, our net income and capital could be materially adversely affected which, in turn, could have a material adverse effect on our financial condition and results of operations. The extent to which the current COVID-19 pandemic hasgeopolitical instability and risks of inflation will continue to negatively impact our businesses, financial condition, liquidity, and results will depend on future developments, which are highly uncertain and cannot be forecasted with precision at this time. For more information, see Note 5 - ”Loans / Leases” and Note 6 - “Allowance for CreditCredit Losses” of the Notes to Consolidated Financial Statements.
Certain assets and liabilities are measured at fair value on a recurring basis, including securities and derivative instruments. Assets and liabilities carried at fair value inherently include subjectivity and may require the useTable of significant assumptions, adjustments and judgment including, among others, discount rates, rates of return on assets, cash flows, default rates, loss rates, terminal values and liquidation values. A significant change in assumptions may result in a significant change in fair value, which in turn, may result in a higher degree of financial statement volatility and could result in significant impact on our results of operations, financial condition or disclosures of fair value information. The fair value hierarchy requires use of observable inputs first and subsequently unobservable inputs when observable inputs are not available. Our fair value measurements involve various valuation techniques and models, which involve inputs that are observable (Level 1 or Level 2 in fair value hierarchy), when available. The level of judgment required to determine fair value is dependent on the methods or techniques used in the process. Assets and liabilities that are measured at fair value using quoted prices in active markets (Level 1) do not require significant judgment while the valuation of assets and liabilities when quoted market prices are not available (Levels 2 and 3) may require significant judgment to assess whether observable or unobservable inputs for those assets and liabilities provide reasonable determination of fair value. The fair values measured at each level of the fair value hierarchy, additional discussion regarding fair value measurements, and a brief description of how fair value is determined for categories that have unobservable inputs, can be found in Note 20 - “Fair Value of Assets and LiabilitiesContents” of the Notes to Consolidated Financial Statements.Goodwill and Intangible Assets
The acquisition method of accounting requires that acquired assets and liabilities acquired in a business combination are recorded at their fair valuesvalue as of the dateacquisition date. The valuation of acquisition. Thisassets and liabilities often involves estimates based on third party valuations or internal valuations based on discounted cash flow analyses or other valuation techniques, all of which are inherently subjective. AcquisitionsThis typically resultresults in goodwill, the amount by which the cost of net assets acquired in a business combination exceeds their fair value, which is subject to impairment testing at least annually. The amortization of identified intangible assets recognized in a business combination is based upon the estimated economic benefits to be received over their economic life, which is also subjective. Customer attrition rates that are based on historical experience are used to determine the estimated economic life of certain intangibles assets, including but not limited to, customer deposit intangibles.
The emergence of COVID-19 as a global pandemic during 2020 has resulted in significant deterioration of the economic environment which has impacted expected earnings. The heightened uncertainty in the economic environment has remained throughout 2020. As a result, management performed an assessment ofManagement reviews the goodwill balance at December 31, 2020. A qualitative assessment was deemed to be sufficient and reasonable andof each reporting unit for impairment on an annual basis as of October 1 or more often if events or circumstances indicate that it is more-likely-than-not that the resultfair value of this assessment indicateda reporting unit is below its carrying value.
Based on our annual impairment analysis of goodwill as of October 1, 2023, it was probabledetermined that the fair value of each reporting unit was in excess of our reporting units continues to exceed theits respective carrying values andvalue as of October 1, 2023; therefore, management determined that a full goodwill test wasis considered not warranted. Goodwill assessments are highly sensitiveimpaired. Huntington additionally performs sensitivity analyses around discount rate assumptions utilized in order to economic projectionsassess the reasonableness of the rates, and the related assumptionsresulting estimated fair values. As of October 1, 2023, a 100 basis point increase in discount rates would reduce estimated entity level fair value by approximately $2 billion and estimates used by management. In the event of a prolonged economic downturn or further deteriorationwould not result in the economic outlook, continued assessments of our goodwill balance could be required in future periods. Anyany impairment, chargeas each reporting unit’s fair value would still exceed its carrying value.
99 Huntington Bancshares Incorporated
not affect Huntington’s regulatory capital ratios, tangible common equity ratio or liquidity position. For more information, see Note 8 - “Goodwill and Other Intangible Assets” of the Notes to Consolidated Financial Statements.Recent Accounting Pronouncements and Developments
Note 2 - “Accounting Standards Update” of the Notes to Consolidated Financial Statements discusses new accounting pronouncements adopted during 20202023 and the expected impact of accounting pronouncements recently issued but not yet required to be adopted. To the extent the adoption of new accounting standards materially affectaffects financial condition, results of operations, or liquidity, the impacts are discussed in the applicable section of this MD&A and the Notes to Consolidated Financial Statements. Item 7A: Quantitative and Qualitative Disclosures About Market Risk
Information required by this item is set forth under the heading of “Market Risk” in Item 7: MD&A, which is incorporated by reference into this item. Item 8: Financial Statements and Supplementary Data
2020 Form 10-K 88100 Huntington Bancshares Incorporated
REPORT OF MANAGEMENT’S EVALUATION OF DISCLOSURE CONTROLS AND PROCEDURES
The Management of Huntington Bancshares Incorporated (Huntington or the Company) is responsible for the financial information and representations contained in the Consolidated Financial Statements and other sections of this report. The Consolidated Financial Statements have been prepared in conformity with accounting principles generally accepted in the United States. In all material respects, they reflect the substance of transactions that should be included based on informed judgments, estimates, and currently available information. Management maintains a system of internal accounting controls, which includes the careful selection and training of qualified personnel, appropriate segregation of responsibilities, communication of written policies and procedures, and a broad program of internal audits. The costs of the controls are balanced against the expected benefits. During 2020,2023, the audit committee of the board of directors met regularly with Management, Huntington’s internal auditors, and the independent registered public accounting firm, PricewaterhouseCoopers LLP, to review the scope of their audits and to discuss the evaluation of internal accounting controls and financial reporting matters. The independent registered public accounting firm and the internal auditors have free access to, and meet confidentially with, the audit committee to discuss appropriate matters. Also, Huntington maintains a disclosure review committee. This committee’s purpose is to design and maintain disclosure controls and procedures to ensure that material information relating to the financial and operating condition of Huntington is properly reported to its chief executive officer, chief financial officer, chief auditor, and the audit committee of the board of directors in connection with the preparation and filing of periodic reports and the certification of those reports by the chief executive officer and the chief financial officer.
REPORT OF MANAGEMENT’S ASSESSMENT OF INTERNAL CONTROL OVER FINANCIAL REPORTING
Management is responsible for establishing and maintaining adequate internal control over financial reporting as such term is defined in Rules 13a-15(f) and 15d-15(f) of the Securities Exchange Act of 1934, as amended. Huntington’s Management assessed the effectiveness of the Company’s internal control over financial reporting as of December 31, 2020.2023. In making this assessment, Management used the criteria set forth by the Committee of Sponsoring Organizations of the Treadway Commission (COSO) in Internal Control—Integrated Framework (2013). Based on that assessment, Management concluded that, as of December 31, 2020,2023, the Company’s internal control over financial reporting is effective based on those criteria. The Company’s internal control over financial reporting as of December 31, 20202023 has been audited by PricewaterhouseCoopers LLP, an independent registered public accounting firm, as stated in their report appearing on the next page.

Stephen D. Steinour – Chairman, President, and Chief Executive Officer
Zachary Wasserman – Senior Executive Vice President and Chief Financial Officer
February 26, 202116, 2024
1012023 Form 10-K Huntington Bancshares Incorporated89
Report of Independent Registered Public Accounting Firm
To the Board of Directors and Shareholders of
Huntington Bancshares Incorporated
Opinions on the Financial Statements and Internal Control over Financial Reporting
We have audited the accompanying consolidated balance sheets of Huntington Bancshares Incorporated and its subsidiaries(the (the “Company”) as of December 31, 20202023 and 2019,2022, and the related consolidatedstatements of income, of comprehensive income, of changes in shareholders’shareholders' equity and of cash flows for each of the three years in the period ended December 31, 2020,2023, including the related notes (collectively referred to as the “consolidated financial statements”).We also have audited the Company's internal control over financial reporting as of December 31, 2020,2023, based on criteria established in Internal Control - Integrated Framework (2013) issued by the Committee of Sponsoring Organizations of the Treadway Commission (COSO).
In our opinion, the consolidatedfinancial statements referred to above present fairly, in all material respects, the financial position of the Company as of December 31, 20202023 and 2019, 2022, and the results of its operations and its cash flows for each of the three years in the period ended December 31, 20202023 in conformity with accounting principles generally accepted in the United States of America. Also in our opinion, the Company maintained, in all material respects, effective internal control over financial reporting as ofDecember 31, 2020,2023, based on criteria established in Internal Control - Integrated Framework (2013) issued by the COSO.
Change in Accounting Principle
As discussed in Note 2 to the consolidated financial statements, the Company changed the manner in which it accounts for the allowance for credit losses as of January 1, 2020.
Basis for Opinions
The Company's management is responsible for these consolidated financial statements, for maintaining effective internal control over financial reporting, and for its assessment of the effectiveness of internal control over financial reporting, included in the accompanying Report of Management’sManagement's Assessment of Internal Control over Financial Reporting. Our responsibility is to express opinions on the Company’s consolidatedfinancial statements and on the Company's internal control over financial reporting based on our audits. We are a public accounting firm registered with the Public Company Accounting Oversight Board (United States) (PCAOB) and are required to be independent with respect to the Company in accordance with the U.S. federal securities laws and the applicable rules and regulations of the Securities and Exchange Commission and the PCAOB.
We conducted our audits in accordance with the standards of the PCAOB. Those standards require that we plan and perform the audits to obtain reasonable assurance about whether the consolidatedfinancial statements are free of material misstatement, whether due to error or fraud, and whether effective internal control over financial reporting was maintained in all material respects.
Our audits of the consolidatedfinancial statements included performing procedures to assess the risks of material misstatement of the consolidatedfinancial statements, whether due to error or fraud, and performing procedures that respond to those risks. Such procedures included examining, on a test basis, evidence regarding the amounts and disclosures in the consolidatedfinancial statements. Our audits also included evaluating the accounting principles used and significant estimates made by management, as well as evaluating the overall presentation of the consolidatedfinancial statements. Our audit of internal control over financial reporting included obtaining an understanding of internal control over financial reporting, assessing the risk that a material weakness exists, and testing and evaluating the design and operating effectiveness of internal control based on the assessed risk. Our audits also included performing such other procedures as we considered necessary in the circumstances. We believe that our audits provide a reasonable basis for our opinions.
90 Huntington Bancshares Incorporated
Definition and Limitations of Internal Control over Financial Reporting
A company’s internal control over financial reporting is a process designed to provide reasonable assurance regarding the reliability of financial reporting and the preparation of financial statements for external purposes in accordance with generally accepted accounting principles. A company’s internal control over financial reporting
includes those policies and procedures that (i) pertain to the maintenance of records that, in reasonable detail, accurately and fairly reflect the transactions and dispositions of the assets of the company; (ii) provide reasonable assurance that transactions are recorded as necessary to permit preparation of financial statements in accordance with generally accepted accounting principles, and that receipts and expenditures of the company are being made only in accordance with authorizations of management and directors of the company; and (iii) provide reasonable assurance regarding prevention or timely detection of unauthorized acquisition, use, or disposition of the company’s assets that could have a material effect on the financial statements.
Because of its inherent limitations, internal control over financial reporting may not prevent or detect misstatements. Also, projections of any evaluation of effectiveness to future periods are subject to the risk that controls may become inadequate because of changes in conditions, or that the degree of compliance with the policies or procedures may deteriorate.
Critical Audit Matters
The critical audit matter communicated below is a matter arising from the current period audit of the consolidated financial statements that was communicated or required to be communicated to the audit committee and that (i) relates to accounts or disclosures that are material to the consolidated financial statements and (ii) involved our especially challenging, subjective, or complex judgments. The communication of critical audit matters does not alter in any way our opinion on the consolidatedfinancial statements, taken as a whole, and we are not, by communicating the critical audit matter below, providing a separate opinion on the critical audit matter or on the accounts or disclosures to which it relates.
Valuation of the General Reserve of the Allowance for Credit Losses – General Reserve
As described in Notes 1 and 6 to the consolidated financial statements, management’s estimate of the allowance for credit losses of $2.4 billion as of December 31, 2023 includes a general reserve component whichthat consists of various risk-profile reserve components. The risk-profile components consider items unique to the Company’s structure, policies, processes, and portfolio composition. The general reserve also considerscomposition, as well as qualitative measurements and assessments of the Company’s loan portfolios including, but not limited to, economic uncertainty, concentrations, portfolio composition, industry comparisons, and internal review functions.
The principal considerations for our determination that performing procedures relating to the valuation of the general reserve component of the allowance for credit losses is a critical audit matter are (i) the valuation involved the application of significant judgment and estimation by management when determining the general reserve, calculation, which in turn led to a high degree of auditor judgment, subjectivity, and subjectivityeffort in performing procedures and evaluating audit evidence relating to the methodology and assumptions used into determine the general reserve, (ii) the significant audit effort in evaluating management’s methodology, significant assumptions and calculations relating to the general reserve component, and (iii)(ii) the audit effort includedinvolved the involvementuse of professionals with specialized skill and knowledge.
Addressing the matter involved performing procedures and evaluating audit evidence in connection with forming our overall opinion on the consolidated financial statements. These procedures included testing the effectiveness of controls relatingrelated to the valuation of the Company’s general reserve component of the allowance for credit losses. These procedures also included, among others, testing management’s process for determining the general reserve, component, including evaluating the appropriateness of management’s methodology, testing the completeness and accuracy of data utilized by management and evaluating the reasonableness of significant assumptions relating to the general reserve component.reserve. Evaluating management’s assumptions relatingrelated to the general reserve component involved evaluating whether the assumptions used were reasonable considering portfolio composition, relevant market data, and indicators of economic uncertainty. Professionals with specialized skill and knowledge were used to assist in evaluating the appropriateness of management’s methodology significantand assumptions and calculations relatingrelated to the general reserve component.reserve.

PricewaterhouseCoopers LLP
Columbus, Ohio
February 26, 202116, 2024
We have served as the Company’s auditor since 2015.
Huntington Bancshares Incorporated
Consolidated Balance Sheets
| | | | | | | | | | | |
| | At December 31, |
| (dollar amounts in millions) | 2023 | | 2022 |
| Assets | | | |
| Cash and due from banks | $ | 1,558 | | | $ | 1,796 | |
| | | |
| Interest-earning deposits with banks | 8,765 | | | 5,122 | |
| Trading account securities | 125 | | | 19 | |
| Available-for-sale securities | 25,305 | | | 23,423 | |
| Held-to-maturity securities | 15,750 | | | 17,052 | |
| | | |
| | | |
| Other securities | 725 | | | 854 | |
| | | |
| Loans held for sale (includes $506 and $520 respectively, measured at fair value)(1) | 516 | | | 529 | |
| | | |
| | | |
| | | |
| | | |
| | | |
| | | |
| | | |
| | | |
| Loans and leases (includes $174 and $185 respectively, measured at fair value)(1) | 121,982 | | | 119,523 | |
| Allowance for loan and lease losses | (2,255) | | | (2,121) | |
| Net loans and leases | 119,727 | | | 117,402 | |
| Bank owned life insurance | 2,759 | | | 2,753 | |
| Accrued income and other receivables | 1,646 | | | 1,573 | |
| Premises and equipment | 1,109 | | | 1,156 | |
| Goodwill | 5,561 | | | 5,571 | |
| Servicing rights and other intangible assets | 672 | | | 712 | |
| Other assets | 5,150 | | | 4,944 | |
| Total assets | $ | 189,368 | | | $ | 182,906 | |
| Liabilities and shareholders’ equity | | | |
| Liabilities | | | |
| Deposits: | | | |
| Demand deposits—noninterest-bearing | $ | 30,967 | | | $ | 38,242 | |
| Interest-bearing | 120,263 | | | 109,672 | |
| | | |
| Total deposits | 151,230 | | | 147,914 | |
| Short-term borrowings | 620 | | | 2,027 | |
| Long-term debt | 12,394 | | | 9,686 | |
| Other liabilities | 5,726 | | | 5,510 | |
| Total liabilities | 169,970 | | | 165,137 | |
| Commitments and Contingent Liabilities (Note 22) | | | |
| Shareholders’ equity | | | |
| Preferred stock | 2,394 | | | 2,167 | |
| Common stock | 15 | | | 14 | |
| Capital surplus | 15,389 | | | 15,309 | |
| Less treasury shares, at cost | (91) | | | (80) | |
| Accumulated other comprehensive income (loss) | (2,676) | | | (3,098) | |
| Retained earnings | 4,322 | | | 3,419 | |
| Total Huntington Bancshares Inc shareholders’ equity | 19,353 | | | 17,731 | |
| Non-controlling interest | 45 | | | 38 | |
| Total equity | 19,398 | | | 17,769 | |
| Total liabilities and shareholders’ equity | $ | 189,368 | | | $ | 182,906 | |
| Common shares authorized (par value of $0.01) | 2,250,000,000 | | | 2,250,000,000 | |
| Common shares outstanding | 1,448,319,953 | | | 1,443,068,036 | |
| Treasury shares outstanding | 7,403,008 | | | 6,322,052 | |
| Preferred stock, authorized shares | 6,617,808 | | | 6,617,808 | |
| Preferred shares outstanding | 881,587 | | | 557,500 | |
See Notes to Consolidated Financial Statements
92 Huntington Bancshares Incorporated
Huntington Bancshares Incorporated
Consolidated Balance SheetsStatements of Income
| | | | | | | | | | | |
| | December 31, |
| (dollar amounts in millions) | 2020 | | 2019 |
| Assets | | | |
| Cash and due from banks | $ | 1,319 | | | $ | 1,045 | |
| Interest-bearing deposits at Federal Reserve Bank | 5,276 | | | 125 | |
| Interest-bearing deposits in banks | 117 | | | 102 | |
| Trading account securities | 62 | | | 99 | |
| Available-for-sale securities | 16,485 | | | 14,149 | |
| Held-to-maturity securities | 8,861 | | | 9,070 | |
| | | |
| | | |
| Other securities | 418 | | | 441 | |
| | | |
| Loans held for sale (includes $1,198 and $781 respectively, measured at fair value)(1) | 1,275 | | | 877 | |
| | | |
| | | |
| | | |
| | | |
| | | |
| | | |
| | | |
| | | |
| Loans and leases (includes $94 and $81 respectively, measured at fair value)(1) | 81,608 | | | 75,404 | |
| Allowance for loan and lease losses | (1,814) | | | (783) | |
| Net loans and leases | 79,794 | | | 74,621 | |
| Bank owned life insurance | 2,577 | | | 2,542 | |
| Premises and equipment | 757 | | | 763 | |
| Goodwill | 1,990 | | | 1,990 | |
| Servicing rights and other intangible assets | 428 | | | 475 | |
| Other assets | 3,679 | | | 2,703 | |
| Total assets | $ | 123,038 | | | $ | 109,002 | |
| Liabilities and shareholders’ equity | | | |
| Liabilities | | | |
| Deposits: | | | |
| Demand deposits—noninterest-bearing | $ | 28,553 | | | $ | 20,247 | |
| Interest-bearing | 70,395 | | | 62,100 | |
| | | |
| Total Deposits | 98,948 | | | 82,347 | |
| Short-term borrowings | 183 | | | 2,606 | |
| Long-term debt | 8,352 | | | 9,849 | |
| Other liabilities | 2,562 | | | 2,405 | |
| Total liabilities | 110,045 | | | 97,207 | |
| Commitments and Contingent Liabilities (Note 23) | | | 0 |
| Shareholders’ equity | | | |
| Preferred stock | 2,191 | | | 1,203 | |
| Common stock | 10 | | | 10 | |
| Capital surplus | 8,781 | | | 8,806 | |
| Less treasury shares, at cost | (59) | | | (56) | |
| Accumulated other comprehensive loss | 192 | | | (256) | |
| Retained earnings | 1,878 | | | 2,088 | |
| Total shareholders’ equity | 12,993 | | | 11,795 | |
| Total liabilities and shareholders’ equity | $ | 123,038 | | | $ | 109,002 | |
| Common shares authorized (par value of $0.01) | 1,500,000,000 | | | 1,500,000,000 | |
| Common shares outstanding | 1,017,196,776 | | | 1,020,003,482 | |
| Treasury shares outstanding | 5,062,054 | | | 4,537,605 | |
| Preferred stock, authorized shares | 6,617,808 | | | 6,617,808 | |
| Preferred shares outstanding | 750,500 | | | 740,500 | |
| | | | | | | | | | | | | | | | | |
| | Year Ended December 31, |
| (dollar amounts in millions, except per share data, share amounts in thousands) | 2023 | | 2022 | | 2021 |
| Interest and fee income: | | | | | |
| Loans and leases | $ | 6,811 | | | $ | 4,816 | | | $ | 3,636 | |
| Available-for-sale securities | | | | | |
| Taxable | 1,016 | | | 576 | | | 261 | |
| Tax-exempt | 104 | | | 74 | | | 56 | |
| Held-to-maturity securities-taxable | 401 | | | 351 | | | 174 | |
| Other securities-taxable | 53 | | | 27 | | | 10 | |
| Other interest income | 531 | | | 125 | | | 54 | |
| Total interest income | 8,916 | | | 5,969 | | | 4,191 | |
| Interest expense | | | | | |
| Deposits | 2,497 | | | 363 | | | 45 | |
| Short-term borrowings | 179 | | | 46 | | | 1 | |
| | | | | |
| Long-term debt | 801 | | | 287 | | | 43 | |
| Total interest expense | 3,477 | | | 696 | | | 89 | |
| Net interest income | 5,439 | | | 5,273 | | | 4,102 | |
| Provision for credit losses | 402 | | | 289 | | | 25 | |
| Net interest income after provision for credit losses | 5,037 | | | 4,984 | | | 4,077 | |
| Payments and cash management revenue | 585 | | | 561 | | | 501 | |
| Wealth and asset management revenue | 328 | | | 300 | | | 269 | |
| Customer deposit and loan fees | 312 | | | 350 | | | 310 | |
| Capital markets and advisory fees | 248 | | | 265 | | | 156 | |
| Leasing revenue | 112 | | | 126 | | | 99 | |
| Mortgage banking income | 109 | | | 144 | | | 309 | |
| Insurance income | 74 | | | 79 | | | 82 | |
| Bank owned life insurance income | 66 | | | 56 | | | 69 | |
| Gain on sale of loans | 14 | | | 57 | | | 9 | |
| Net gains (losses) on sales of securities | (7) | | | — | | | 9 | |
| Other noninterest income | 80 | | | 43 | | | 76 | |
| Total noninterest income | 1,921 | | | 1,981 | | | 1,889 | |
| Personnel costs | 2,529 | | | 2,401 | | | 2,335 | |
| Outside data processing and other services | 605 | | | 610 | | | 850 | |
| Deposit and other insurance expense | 302 | | | 67 | | | 51 | |
| Equipment | 263 | | | 269 | | | 248 | |
| Net occupancy | 246 | | | 246 | | | 277 | |
| Marketing | 115 | | | 91 | | | 89 | |
| Professional services | 99 | | | 77 | | | 113 | |
| Amortization of intangibles | 50 | | | 53 | | | 48 | |
| Lease financing equipment depreciation | 27 | | | 45 | | | 41 | |
| | | | | |
| Other noninterest expense | 338 | | | 342 | | | 323 | |
| Total noninterest expense | 4,574 | | | 4,201 | | | 4,375 | |
| Income before income taxes | 2,384 | | | 2,764 | | | 1,591 | |
| Provision for income taxes | 413 | | | 515 | | | 294 | |
| Income after income taxes | 1,971 | | | 2,249 | | | 1,297 | |
| Income attributable to non-controlling interest | 20 | | | 11 | | | 2 | |
| Net income attributable to Huntington Bancshares Inc | 1,951 | | | 2,238 | | | 1,295 | |
| Dividends on preferred shares | 142 | | | 113 | | | 131 | |
| Impact of preferred stock redemption | (8) | | | — | | | 11 | |
| Net income applicable to common shares | $ | 1,817 | | | $ | 2,125 | | | $ | 1,153 | |
| | | | | |
| |
| | | | | |
| Average common shares—basic | 1,446,449 | | | 1,441,279 | | | 1,262,435 | |
| Average common shares—diluted | 1,468,016 | | | 1,465,220 | | | 1,286,733 | |
| Per common share: | | | | | |
| Net income—basic | $ | 1.26 | | | $ | 1.47 | | | $ | 0.91 | |
| Net income—diluted | 1.24 | | | 1.45 | | | 0.90 | |
(1)Amounts represent loans for which Huntington has elected the fair value option. See Note 20.
See Notes to Consolidated Financial Statements
Huntington Bancshares Incorporated
Consolidated Statements of Comprehensive Income
| | | | | | | | | | | | | | | | | |
| | Year Ended December 31, |
| (dollar amounts in millions, except per share data, share amounts in thousands) | 2020 | | 2019 | | 2018 |
| Interest and fee income: | | | | | |
| Loans and leases | $ | 3,085 | | | $ | 3,541 | | | $ | 3,305 | |
| Available-for-sale securities | | | | | |
| Taxable | 237 | | | 295 | | | 279 | |
| Tax-exempt | 61 | | | 83 | | | 97 | |
| Held-to-maturity securities-taxable | 215 | | | 218 | | | 211 | |
| Other securities-taxable | 6 | | | 16 | | | 25 | |
| Other interest income | 43 | | | 48 | | | 32 | |
| Total interest income | 3,647 | | | 4,201 | | | 3,949 | |
| Interest expense | | | | | |
| Deposits | 197 | | | 585 | | | 391 | |
| Short-term borrowings | 13 | | | 54 | | | 48 | |
| | | | | |
| Long-term debt | 213 | | | 349 | | | 321 | |
| Total interest expense | 423 | | | 988 | | | 760 | |
| Net interest income | 3,224 | | | 3,213 | | | 3,189 | |
| Provision for credit losses | 1,048 | | | 287 | | | 235 | |
| Net interest income after provision for credit losses | 2,176 | | | 2,926 | | | 2,954 | |
| Mortgage banking income | 366 | | | 167 | | | 108 | |
| Service charges on deposit accounts | 301 | | | 372 | | | 364 | |
| Card and payment processing income | 248 | | | 246 | | | 224 | |
| Trust and investment management services | 189 | | | 178 | | | 171 | |
| Capital markets fees | 125 | | | 123 | | | 108 | |
| Insurance income | 97 | | | 88 | | | 82 | |
| Bank owned life insurance income | 64 | | | 66 | | | 67 | |
| Gain on sale of loans | 42 | | | 55 | | | 55 | |
| Net (losses) gains on sales of securities | (1) | | | (24) | | | (21) | |
| | | | | |
| Other noninterest income | 160 | | | 183 | | | 163 | |
| Total noninterest income | 1,591 | | | 1,454 | | | 1,321 | |
| Personnel costs | 1,692 | | | 1,654 | | | 1,559 | |
| Outside data processing and other services | 384 | | | 346 | | | 294 | |
| Equipment | 180 | | | 163 | | | 164 | |
| Net occupancy | 158 | | | 159 | | | 184 | |
| Professional services | 55 | | | 54 | | | 60 | |
| Amortization of intangibles | 41 | | | 49 | | | 53 | |
| Marketing | 38 | | | 37 | | | 53 | |
| Deposit and other insurance expense | 32 | | | 34 | | | 63 | |
| | | | | |
| Other noninterest expense | 215 | | | 225 | | | 217 | |
| Total noninterest expense | 2,795 | | | 2,721 | | | 2,647 | |
| Income before income taxes | 972 | | | 1,659 | | | 1,628 | |
| Provision for income taxes | 155 | | | 248 | | | 235 | |
| Net income | 817 | | | 1,411 | | | 1,393 | |
| Dividends on preferred shares | 100 | | | 74 | | | 70 | |
| Net income available to common shareholders | $ | 717 | | | $ | 1,337 | | | $ | 1,323 | |
| | | | | |
| |
| | | | | |
| Average common shares—basic | 1,017,117 | | | 1,038,840 | | | 1,081,542 | |
| Average common shares—diluted | 1,032,683 | | | 1,056,079 | | | 1,105,985 | |
| Per common share: | | | | | |
| Net income—basic | $ | 0.71 | | | $ | 1.29 | | | $ | 1.22 | |
| Net income—diluted | 0.69 | | | 1.27 | | | 1.20 | |
| | | | | | | | | | | | | | | | | |
| | Year Ended December 31, |
| (dollar amounts in millions) | 2023 | | 2022 | | 2021 |
| Net income attributable to Huntington Bancshares Inc | $ | 1,951 | | | $ | 2,238 | | | $ | 1,295 | |
| Other comprehensive income, net of tax: | | | | | |
| | | | | |
| | | | | |
| | | | | |
| Unrealized (losses) gains on available-for-sale securities, net of hedges | 154 | | | (2,184) | | | (254) | |
| | | | | |
| Net change related to cash flow hedges on loans | 269 | | | (695) | | | (192) | |
| Translations adjustments, net of hedges | 2 | | | (5) | | | (3) | |
| Change in accumulated unrealized gains for pension and other post-retirement obligations | (3) | | | 15 | | | 28 | |
| Other comprehensive income (loss), net of tax | 422 | | | (2,869) | | | (421) | |
| Comprehensive (loss) income attributable to Huntington Bancshares | 2,373 | | | (631) | | | 874 | |
| Comprehensive income attributed to non-controlling interest | 20 | | | 11 | | | 2 | |
| Comprehensive income (loss) | $ | 2,393 | | | $ | (620) | | | $ | 876 | |
See Notes to Consolidated Financial Statements
10594 Huntington Bancshares Incorporated
Huntington Bancshares Incorporated
Consolidated Statements of Comprehensive Income
| | | | | | | | | | | | | | | | | |
| | Year Ended December 31, |
| (dollar amounts in millions) | 2020 | | 2019 | | 2018 |
| Net income | $ | 817 | | | $ | 1,411 | | | $ | 1,393 | |
| Other comprehensive income, net of tax: | | | | | |
| | | | | |
| | | | | |
| | | | | |
| Total unrealized gains (losses) on available-for-sale securities | 216 | | | 335 | | | (84) | |
| | | | | |
| Change in fair value related to cash flow hedges | 234 | | | 23 | | | 0 | |
| Change in accumulated unrealized gains (losses) for pension and other post-retirement obligations | (2) | | | (5) | | | 4 | |
| Other comprehensive income (loss), net of tax | 448 | | | 353 | | | (80) | |
| Comprehensive income | $ | 1,265 | | | $ | 1,764 | | | $ | 1,313 | |
See Notes to Consolidated Financial Statements
Huntington Bancshares Incorporated
Consolidated Statements of Changes in Shareholders’ Equity
| | Accumulated | |
| Preferred Stock | | Other | |
| Preferred Stock | |
| (dollar amounts in millions, except per share data, share amounts in thousands) | (dollar amounts in millions, except per share data, share amounts in thousands) | Preferred Stock | | Common Stock | | Capital | | Treasury Stock | | Comprehensive | | Retained | |
| Shares | | Amount | | Surplus | | Shares | | Amount | | Gain (Loss) | | Earnings | | Total |
| Year Ended December 31, 2020 | | | | | | | | | | | | | | | | | |
| (dollar amounts in millions, except per share data, share amounts in thousands) | | (dollar amounts in millions, except per share data, share amounts in thousands) | | | Capital | | Treasury Stock | | | Retained | | | | | Total |
| Amount | | Shares | | Amount | | Surplus | | Shares | | Amount | | | Earnings | | Total | | Interest | | Equity |
| Year Ended December 31, 2023 | |
| Balance, beginning of year | Balance, beginning of year | $ | 1,203 | | | 1,024,541 | | | $ | 10 | | | $ | 8,806 | | | (4,537) | | | $ | (56) | | | $ | (256) | | | $ | 2,088 | | | $ | 11,795 | |
Cumulative-effect of change in accounting principle
(ASU 2016-13), net of tax | | | | | | | | | | | | | | | (306) | | | (306) | |
| Balance, beginning of year | |
| Balance, beginning of year | |
| Net income | Net income | | 817 | | | 817 | |
| Other comprehensive income (loss) | | 448 | | | 448 | |
| Other comprehensive income, net of tax | |
| Net proceeds from issuance of Series J Preferred Stock | |
| Repurchase of preferred stock | |
| | Cash dividends declared: | |
| Cash dividends declared: | |
| Cash dividends declared: | |
| Common ($0.62 per share) | |
| Common ($0.62 per share) | |
| Common ($0.62 per share) | |
| | Net proceeds from issuance of Preferred Stock | 988 | | | 988 | |
| Repurchases of common stock | | (7,504) | | | 0 | | | (92) | | | (92) | |
| Cash dividends declared: | |
| Common ($0.60 per share) | | (621) | | | (621) | |
| | Preferred | |
| Preferred | |
| Preferred | Preferred | | (100) | | | (100) | |
| Recognition of the fair value of share-based compensation | Recognition of the fair value of share-based compensation | | 77 | | | 77 | |
| Other share-based compensation activity | Other share-based compensation activity | | 5,372 | | | — | | | (9) | | | — | | | (9) | |
| | Other | Other | | (151) | | | — | | | (1) | | | (525) | | | (3) | | | — | | | (4) | |
| Balance, end of year | Balance, end of year | $ | 2,191 | | | 1,022,258 | | | $ | 10 | | | $ | 8,781 | | | (5,062) | | | $ | (59) | | | $ | 192 | | | $ | 1,878 | | | $ | 12,993 | |
| | Year Ended December 31, 2022 | |
| Year Ended December 31, 2022 | |
| Year Ended December 31, 2022 | |
| Balance, beginning of year | |
| Balance, beginning of year | |
| Balance, beginning of year | |
| Net income | |
| Other comprehensive (loss) income, net of tax | |
| Cash dividends declared: | |
| Common ($0.62 per share) | |
| Common ($0.62 per share) | |
| Common ($0.62 per share) | |
| Preferred | |
| Recognition of the fair value of share-based compensation | |
| Other share-based compensation activity | |
| Other | |
| Balance, end of year | |
| | Year Ended December 31, 2021 | |
| Year Ended December 31, 2021 | |
| Year Ended December 31, 2021 | |
| Balance, beginning of year | |
| Balance, beginning of year | |
| Balance, beginning of year | |
| Net income | |
| Other comprehensive (loss) income, net of tax | |
| TCF Financial Corp Acquisition: | |
| Issuance of common stock | |
| Issuance of common stock | |
| Issuance of common stock | |
| Issuance of Series I Preferred Stock | |
| Non-controlling interest acquired | |
| Net proceeds from issuance of Series H Preferred Stock | |
| Redemption of preferred stock | |
| Repurchases of common stock | |
| Cash dividends declared: | |
| Common ($0.605 per share) | |
| Common ($0.605 per share) | |
| Common ($0.605 per share) | |
| Preferred | |
| Recognition of the fair value of share-based compensation | |
| Other share-based compensation activity | |
| Other | |
| Balance, end of year | |
| | | | | | | | | | | | | | | | | | | | | | | | | | | | | | | | | | | | | | | | | | | | | | | | | | | | | |
| | | | | | | | | | | | | | | | | |
| | | | | | | | | | | | | | | | | |
| | | | | | | | | | | | |
| | | | | | | | | | | | | | | | |
| Year Ended December 31, 2019 | | | | | | | | | | | | | | | | | |
| Balance, beginning of year | $ | 1,203 | | | 1,050,584 | | | $ | 11 | | | $ | 9,181 | | | (3,817) | | | $ | (45) | | | $ | (609) | | | $ | 1,361 | | | $ | 11,102 | |
| | | | | | | | | | | | | | | | | |
| Net income | | | | | | | | | | | | | | | 1,411 | | | 1,411 | |
| Other comprehensive income (loss) | | | | | | | | | | | | | 353 | | | | | 353 | |
| | | | | | | | | | | | | | | | | |
| Repurchases of common stock | | | (31,494) | | | (1) | | | (440) | | | | | | | | | | | (441) | |
| | | | | | | | | | | | | | | | | |
| | | | | | | | | | | | | | | | | |
| | | | | | | | | | | | | | | | | |
| | | | | | | | | | | | | | | | | |
| Cash dividends declared: | | | | | | | | | | | | | | | | | |
| Common ($0.58 per share) | | | | | | | | | | | | | | | (611) | | | (611) | |
| | | | | | | | | | | | | | | | | |
| | | | | | | | | | | | | | | | | |
| | | | | | | | | | | | | | | | | |
| | | | | | | | | | | | | | | | | |
| | | | | | | | | | | | | | | | | |
| | | | | | | | | | | | | | | | | |
| | | | | | | | | | | | | | | | | |
| Preferred | | | | | | | | | | | | | | | (74) | | | (74) | |
| | | | | | | | | | | | | | | | | |
| Recognition of the fair value of share-based compensation | | | | | | | 83 | | | | | | | | | | | 83 | |
| Other share-based compensation activity | | | 5,451 | | | — | | | (18) | | | | | | | | | 0 | | (18) | |
| | | | | | | | | | | | | | | | | |
| | | | | | | | | | | | | | | | | |
| Other | | | — | | | — | | | — | | | (720) | | | (11) | | | | | 1 | | | (10) | |
| Balance, end of year | $ | 1,203 | | | 1,024,541 | | | $ | 10 | | | $ | 8,806 | | | (4,537) | | | $ | (56) | | | $ | (256) | | | $ | 2,088 | | | $ | 11,795 | |
| | | | | | | | | | | | | | | | | | | | | | | | | | | | | | | | | | | | | | | | | | | | | | | | | | | | | |
| | | | | | | | | | | | | | | | | |
| | | | | | | | | | | | | | | | | |
| | | | | | | | | | | | |
| | | | | | | | | | | | | | | | |
| Year Ended December 31, 2018 | | | | | | | | | | | | | | | | | |
| Balance, beginning of year | $ | 1,071 | | | 1,075,295 | | | $ | 11 | | | $ | 9,707 | | | (3,268) | | | $ | (35) | | | $ | (528) | | | $ | 588 | | | $ | 10,814 | |
Cumulative-effect of change in accounting principle
(ASU 2016-01), net of tax | | | | | | | | | | | | | (1) | | | 1 | | | 0 | |
| Net income | | | | | | | | | | | | | | | 1,393 | | | 1,393 | |
| Other comprehensive income (loss) | | | | | | | | | | | | | (80) | | | | | (80) | |
| | | | | | | | | | | | | | | | | |
| | | | | | | | | | | | | | | | | |
| | | | | | | | | | | | | | | | | |
| Net proceeds from issuance of Preferred Series E Stock | 495 | | | | | | | | | | | | | | | | 495 | |
| Repurchases of common stock | | | (61,644) | | | — | | | (939) | | | | | | | | | | | (939) | |
| Cash dividends declared: | | | | | | | | | | | | | | | | | |
| Common ($0.50 per share) | | | | | | | | | | | | | | | (541) | | | (541) | |
| | | | | | | | | | | | | | | | | |
| | | | | | | | | | | | | | | | | |
| | | | | | | | | | | | | | | | | |
| | | | | | | | | | | | | | | | | |
| | | | | | | | | | | | | | | | | |
| Preferred | | | | | | | | | | | | | | | (70) | | | (70) | |
| | | | | | | | | | | | | | | | | |
| Conversion of Preferred Series A Stock to Common Stock | (363) | | | 30,330 | | | | | 363 | | | | | | | | | | | 0 | |
| Recognition of the fair value of share-based compensation | | | | | | | 78 | | | | | | | | | | | 78 | |
| | | | | | | | | | | | | | | | | |
| Other share-based compensation activity | | | 6,603 | | | — | | | (31) | | | | | | | | | (10) | | | (41) | |
| | | | | | | | | | | | | | | | | |
| Other | | | 0 | | | — | | | 3 | | | (549) | | | (10) | | | | | 0 | | | (7) | |
| Balance, end of year | $ | 1,203 | | | 1,050,584 | | | $ | 11 | | | $ | 9,181 | | | (3,817) | | | $ | (45) | | | $ | (609) | | | $ | 1,361 | | | $ | 11,102 | |
See Notes to Consolidated Financial Statements
1072023 Form 10-K Huntington Bancshares Incorporated95
Huntington Bancshares Incorporated
Consolidated Statements of Cash Flows
| | | | | | | | | | | | | | | | | |
| | Year Ended December 31, |
| (dollar amounts in millions) | 2023 | | 2022 | | 2021 |
| Operating activities | | | | | |
| Net income | $ | 1,971 | | | $ | 2,249 | | | $ | 1,297 | |
| Adjustments to reconcile net income to net cash provided by operating activities: | | | | | |
| | | | | |
| Provision for credit losses | 402 | | | 289 | | | 25 | |
| Depreciation and amortization | 798 | | | 484 | | | 391 | |
| Share-based compensation expense | 97 | | | 105 | | | 129 | |
| Deferred income tax expense (benefit) | (302) | | | 319 | | | (76) | |
| | | | | |
| Net change in: | | | | | |
| Trading account securities | (106) | | | 27 | | | 16 | |
| Loans held for sale | (83) | | | 675 | | | (56) | |
| Other assets | (491) | | | (1,156) | | | 366 | |
| Other liabilities | 341 | | | 1,024 | | | 27 | |
| Other, net | 30 | | | 11 | | | (57) | |
| Net cash provided by operating activities | 2,657 | | | 4,027 | | | 2,062 | |
| Investing activities | | | | | |
| Change in interest bearing deposits in banks | 23 | | | 332 | | | 716 | |
| Net cash (paid) received from business acquisition | — | | | (223) | | | 466 | |
| Proceeds from: | | | | | |
| Maturities and calls of available-for-sale securities | 2,689 | | | 4,053 | | | 7,275 | |
| Maturities and calls of held-to-maturity securities | 1,523 | | | 2,803 | | | 4,151 | |
| Maturities and calls of other securities | 615 | | | 832 | | | — | |
| Sales of available-for-sale securities | 767 | | | — | | | 5,892 | |
| Sales of other securities | 144 | | | 41 | | | 98 | |
| Purchases of available-for-sale securities | (4,965) | | | (7,107) | | | (19,936) | |
| Purchases of held-to-maturity securities | (256) | | | (3,229) | | | (4,777) | |
| Purchases of other securities | (630) | | | (1,080) | | | (126) | |
| | | | | |
| Net proceeds from sales of portfolio loans and leases | 450 | | | 995 | | | 517 | |
| Principal payments received under direct finance and sales-type leases | 1,891 | | | 1,882 | | | 1,055 | |
| Purchases of loans and leases | (71) | | | (610) | | | (1,197) | |
| Net loan and lease activity, excluding sales and purchases | (5,108) | | | (10,169) | | | 3,303 | |
| | | | | |
| Purchases of premises and equipment | (140) | | | (214) | | | (247) | |
| | | | | |
| Net accrued income and other receivables activity | (17) | | | (66) | | | (653) | |
| Net cash paid for branch disposition | — | | | — | | | (618) | |
| | | | | |
| Other, net | 88 | | | 151 | | | 119 | |
| Net cash used in investing activities | (2,997) | | | (11,609) | | | (3,962) | |
| Financing activities | | | | | |
| Increase in deposits | 3,316 | | | 4,651 | | | 6,501 | |
| Increase (decrease) in short-term borrowings | (1,295) | | | 2,161 | | | (1,245) | |
| | | | | |
| Net proceeds from issuance of long-term debt | 14,965 | | | 11,004 | | | 775 | |
| Maturity/redemption of long-term debt | (12,376) | | | (8,017) | | | (3,404) | |
| Dividends paid on preferred stock | (134) | | | (113) | | | (138) | |
| Dividends paid on common stock | (900) | | | (897) | | | (750) | |
| Repurchases of common stock | — | | | — | | | (650) | |
| | | | | |
| | | | | |
| Repurchase/redemption of preferred stock | (82) | | | — | | | (700) | |
| Net proceeds from issuance of preferred stock | 317 | | | — | | | 486 | |
| | | | | |
| | | | | |
| Other, net | (46) | | | (25) | | | (48) | |
| Net cash provided by financing activities | 3,765 | | | 8,764 | | | 827 | |
| Increase (decrease) in cash and cash equivalents | 3,425 | | | 1,182 | | | (1,073) | |
| Cash and cash equivalents at beginning of period (1) | 6,704 | | | 5,522 | | | 6,595 | |
| Cash and cash equivalents at end of period (1) | $ | 10,129 | | | $ | 6,704 | | | $ | 5,522 | |
| | | | | | | | | | | | | | | | | |
| | Year Ended December 31, |
| (dollar amounts in millions) | 2020 | | 2019 | | 2018 |
| Operating activities | | | | | |
| Net income | $ | 817 | | | $ | 1,411 | | | $ | 1,393 | |
| Adjustments to reconcile net income to net cash provided by (used in) operating activities: | | | | | |
| | | | | |
| Provision for credit losses | 1,048 | | | 287 | | | 235 | |
| Depreciation and amortization | 367 | | | 386 | | | 493 | |
| Share-based compensation expense | 77 | | | 83 | | | 78 | |
| Deferred income tax expense | (93) | | | 23 | | | 63 | |
| | | | | |
| Net change in: | | | | | |
| Trading account securities | 37 | | | (32) | | | (11) | |
| Loans held for sale | (534) | | | (214) | | | (301) | |
| Other assets | (1,077) | | | (593) | | | (235) | |
| Other liabilities | 683 | | | 194 | | | 22 | |
| Other, net | (2) | | | 29 | | | (11) | |
| Net cash provided by (used in) operating activities | 1,323 | | | 1,574 | | | 1,726 | |
| Investing activities | | | | | |
| Change in interest bearing deposits in banks | (81) | | | (112) | | | 90 | |
| Cash paid for acquisition of a business, net of cash received | 0 | | | 0 | | | (15) | |
| Proceeds from: | | | | | |
| Maturities and calls of available-for-sale securities | 5,697 | | | 2,124 | | | 2,109 | |
| Maturities and calls of held-to-maturity securities | 3,042 | | | 1,021 | | | 743 | |
| | | | | |
| Sales of available-for-sale securities | 392 | | | 3,903 | | | 1,419 | |
| | | | | |
| Purchases of available-for-sale securities | (11,104) | | | (6,036) | | | (2,485) | |
| Purchases of held-to-maturity securities | 0 | | | (1,519) | | | (338) | |
| | | | | |
| | | | | |
| Net proceeds from sales of portfolio loans | 1,113 | | | 1,049 | | | 697 | |
| Principal payments received from finance leases | 704 | | | 714 | | | 0 | |
| Net loan and lease activity, excluding sales and purchases | (6,844) | | | (2,149) | | | (5,333) | |
| | | | | |
| Purchases of premises and equipment | (119) | | | (107) | | | (110) | |
| | | | | |
| Purchases of loans and leases | (1,506) | | | (445) | | | (542) | |
| Net cash paid for branch disposition | 0 | | | (548) | | | 0 | |
| | | | | |
| Other, net | 67 | | | 228 | | | 102 | |
| Net cash provided by (used in) investing activities | (8,639) | | | (1,877) | | | (3,663) | |
| Financing activities | | | | | |
| Increase (decrease) in deposits | 16,601 | | | (1,702) | | | 7,733 | |
| (Decrease) Increase in short-term borrowings | (2,373) | | | 586 | | | (3,025) | |
| | | | | |
| Net proceeds from issuance of long-term debt | 1,386 | | | 1,796 | | | 2,229 | |
| Maturity/redemption of long-term debt | (3,052) | | | (743) | | | (2,798) | |
| Dividends paid on preferred stock | (84) | | | (74) | | | (70) | |
| Dividends paid on common stock | (614) | | | (597) | | | (514) | |
| Repurchases of common stock | (92) | | | (441) | | | (939) | |
| | | | | |
| | | | | |
| Net proceeds from issuance of preferred stock | 988 | | | 0 | | | 495 | |
| | | | | |
| Payments related to tax-withholding for share based compensation awards | (20) | | | (26) | | | (27) | |
| Other, net | 1 | | | 2 | | | 5 | |
| Net cash provided by (used for) financing activities | 12,741 | | | (1,199) | | | 3,089 | |
| Increase (decrease) in cash and cash equivalents | 5,425 | | | (1,502) | | | 1,152 | |
| Cash and cash equivalents at beginning of period | 1,170 | | | 2,672 | | | 1,520 | |
| Cash and cash equivalents at end of period | $ | 6,595 | | | $ | 1,170 | | | $ | 2,672 | |
| | | | | |
| | | | | |
| | | | | |
| | | | | |
| | | | | |
| | | | | |
| Year Ended December 31, |
| (dollar amounts in millions) | 2020 | | 2019 | | 2018 |
| Supplemental disclosures: | | | | | |
| Interest paid | $ | 453 | | | $ | 989 | | | $ | 742 | |
| Income taxes paid (refunded) | 81 | | | 111 | | | (52) | |
| Non-cash activities: | | | | | |
| | | | | |
| | | | | |
| | | | | |
| Loans transferred to held-for-sale from portfolio | 1,139 | | | 963 | | | 818 | |
| Loans transferred to portfolio from held-for-sale | 53 | | | 19 | | | 51 | |
| | | | | |
| Transfer of securities from held-to-maturity to available-for-sale | 0 | | | 0 | | | 2,833 | |
| Transfer of securities from available-for-sale to held-to-maturity | 2,842 | | | 0 | | | 2,707 | |
| | | | | | | | | | | | | | | | | |
| | Year Ended December 31, |
| (dollar amounts in millions) | 2023 | | 2022 | | 2021 |
| Supplemental disclosures: | |
| Interest paid | $ | 3,359 | | | $ | 627 | | | $ | 185 | |
| Income taxes (refunded) paid | 90 | | | (109) | | | 269 | |
| | | | | |
| Non-cash activities | |
| Loans transferred to held-for-sale from portfolio | 439 | | | 748 | | | 872 | |
| Loans transferred to portfolio from held-for-sale | 22 | | | 126 | | | 102 | |
| | | | | |
| | | | | |
| Transfer of securities from available-for-sale to held-to-maturity | — | | | 4,225 | | | 3,007 | |
| | | | | |
| | | | | |
| Business Combination (2) | |
| | | | | |
| | | | | |
| | | | | |
| | | | | |
| | | | | |
(1) Includes cash and due from banks and interest-earning deposits at the Federal Reserve Bank, included within Interest-earning deposits with banks on our Consolidated Balance Sheets.
(2) In the year ended 2021, the TCF acquisition included fair value of tangible assets acquired of $46.3 billion, goodwill and other intangible assets of $3.5 billion, liabilities assumed $42.6 billion, preferred stock of $185 million, and common stock of $7.0 billion.
See Notes to Consolidated Financial Statements
1082023 Form 10-K Huntington Bancshares Incorporated96
Huntington Bancshares Incorporated
Notes to Consolidated Financial Statements
1. SIGNIFICANT ACCOUNTING POLICIES
Nature of Operations — Huntington Bancshares Incorporated (Huntington or the Company) is a multi-state diversified regional bank holding company organized under Maryland law in 1966 and headquartered in Columbus, Ohio. Through its subsidiaries, including its bank subsidiary, The Huntington National Bank (the Bank), Huntington is engaged in providing full-service commercial small business,and consumer deposit, lending, and other banking services,services. This includes, but is not limited to, payments, mortgage banking, services, automobile, financing, recreational vehicle and marine financing, investment banking, capital markets, advisory, equipment leasing,financing, distribution finance, investment management, trust, services, brokerage, services, insurance, programs, and other financial products and services. Huntington’s bankingfull-service branches and private client group offices are primarily located in Ohio, Colorado, Illinois, Indiana, Kentucky, Michigan, Minnesota, Pennsylvania, Indiana, West Virginia, and Kentucky.Wisconsin. Select financial services and other activities are also conducted in various other states. International banking services are available through the headquarters office in Columbus, Ohio.
Basis of Presentation — The Consolidated Financial Statements include the accounts of Huntington and its majority-owned subsidiaries and are presented in accordance with GAAP. All intercompany transactions and balances are eliminated in consolidation. Entities in which Huntington holds a controlling financial interest are consolidated. For a voting interest entity, a controlling financial interest is generally where Huntington holds, directly or indirectly, more than 50 percent50% of the outstanding voting shares. For a variable interest entity (VIE),VIE, a controlling financial interest is where Huntington has the power to direct the activities of an entity that most significantly impact the entity’s economic performance and has an obligation to absorb losses or the right to receive benefits from the VIE. For consolidated entities where Huntington holds less than a 100% interest, Huntington recognizes non-controlling interest (included in shareholders’ equity) for the equity held by minority shareholders and non-controlling profit or loss (included in noninterest expense)income attributable to non-controlling interest) for the portion of the entity’s earnings attributable to minority interests. Investments in companies that are not consolidated are accounted for using the equity method when Huntington has the ability to exert significant influence. Investments in non-marketable equity securities for which Huntington does not have the ability to exert significant influence are generally accounted for using thefair value or a cost methodmeasurement alternative adjusted for impairment and other changes in observable prices. Investments in private investment partnerships that are accounted for under the equity method or the cost methodmeasurement alternative are included in other assets and Huntington’s earnings in equity investments are included in other noninterest income. Investments accounted for under the cost measurement alternative and equity methods are periodically evaluated for impairment.
Huntington updated the presentation of our noninterest income categories during the 2023 fourth quarter to align product and service types more closely with how we strategically manage our business. All prior period results have been adjusted to conform to the current presentation. See Note 15 - “Revenue from Contracts with Customers” for a description of our major noninterest income categories. Use of Estimates —The preparation of financial statements in conformity with GAAP requires management to make estimates and assumptions that significantly affect amounts reported in the Consolidated Financial Statements. Huntington utilizes processes that involve the use of significant estimates and the judgments of management in determining the amount of its allowance for credit losses, income taxes, as well as certain fair value measurements of investment securities, derivative instruments, goodwill, other intangible assets, pension assets and liabilities, short-term borrowings, mortgage servicing rights, and loans held for sale.measurements. As with any estimate, actual results could differ from those estimates.
Cash and cash equivalents —For statements of cash flows purposes, cash and cash equivalents are defined as the sum of cash and due from banks and interest-bearing deposits at Federal Reserve Bank.Bank, included within Interest-bearing deposits with banks on our Consolidated Balance Sheets.
Resale and Repurchase Agreements 97— Securities purchased under agreements to resell and securities sold under agreements to repurchase are treated as collateralized financing transactions and are recorded at the amounts at which the securities were acquired or sold plus accrued interest. The fair value Huntington Bancshares Incorporated
Securities — Securities purchased with the intention of recognizing short-term profits or which are actively bought and sold are classified as trading account securities and reported at fair value. The unrealized gains or losses on trading account securities are recorded in other noninterest income. Debt securities purchased that Huntington has the positive intent and ability to hold to their maturity are classified as held-to-maturity securities. Held-to-maturity securities are recorded at amortized cost. All other debt securities are classified as available for sale
available-for-sale securities. Available-for-sale securities are recognized and measured at fair value with any change in the fair value recognized in other comprehensive income. All equity securities are classified as other securities.
Securities transactions are recognized on the trade date (the date the order to buy or sell is executed). The carrying value plus any related accumulated OCIAOCI balance of sold securities is used to compute realized gains and losses. Interest on securities, including amortization of premiums and accretion of discounts using the effective interest method over the period to maturity, is included in interest income.
Non-marketable equity securities include stock held for membership and regulatory purposes, such as FHLB stock and FRB stock.Federal Reserve Bank stock, and other non-marketable equity securities. These securities are accounted for at cost, evaluated for impairment, and are included in other securities. Other securities also include mutual funds and other marketable equity securities. These securities are carried at fair value, with changes in fair value recognized in other noninterest income.
Loans and Leases — Loans for which Huntington has the intent and ability to hold for the foreseeable future, or until maturity or payoff, except loans for which the fair value option has been elected, are carried at the principal amount outstanding, net of charge-offs, unamortized deferred loan origination fees and costs, premiums and discounts, and unearned income. Direct financing leases are reported at the aggregate of lease payments receivable and estimated residual values, net of unearned and deferred income, and any initial direct costs incurred to originate these leases. Renewal options for leases are at the option of the lessee and are typically not included in the measurement of the lease receivable as they are not considered reasonably certain of exercise. Purchase options are typically at fair value, and as such those options are not considered in the measurement of lease receivables or in lease classification. Interest income is accrued as earned using the interest method. Huntington defers the fees it receives from the origination of loans and leases, as well as the direct costs of those activities. Huntington also acquires loans at premiums and/or discounts to their contractual values. Huntington amortizes loan discounts, premiums, and net loan origination fees and costs over the contractual lives of the related loans using the effective interest method.
Effective January 1, 2023, Huntington adopted ASU 2022-02 Financial Instruments - Credit Losses (Topic 326) Troubled debt restructurings areDebt Restructurings (TDR) and Vintage Disclosures, which removed the existing measurement and disclosure requirements for TDR loans for which the originaland added additional disclosure requirements related to modifications provided to borrowers experiencing financial difficulty. Prior to adoption a change in contractual terms have been modifiedof a loan where a borrower was experiencing financial difficulty and received a concession not available through other sources the loan was required to providebe disclosed as a concessionTDR, whereas now a borrower that is experiencing financial difficulty and receives a modification in the form of principal forgiveness, interest rate reduction, an other-than-insignificant payment delay or a term extension in the current period is disclosed as a modification to a borrower experiencing financial difficulties. Loandifficulty. Huntington may modify loans to borrowers experiencing financial difficulty as a way of managing risk and mitigating credit loss from the borrower. Huntington may make various types of modifications are considered TDRs when the concessions provided are not availableand may in certain circumstances use a combination of modification types in order to the borrower through either normal channels or other sources. However, not all loan modifications are TDRs. Modifications resulting in troubled debt restructurings may include changes to one or more terms of the loan, including but not limited to, a change in interest rate, an extension of the repayment period, a reduction in payment amount, and partial forgiveness or deferment of principal or accrued interest.mitigate future loss.
Impairment of the residual values of direct financing leases is evaluated quarterly, with impairment arising if the expected fair value is less than the carrying amount. Huntington assesses net investments in leases (including residual values) for impairment and recognizes impairment losses in accordance with the impairment guidance for financial instruments. As such, net investments in leases may be reduced by an allowance for credit losses, with changes recognized as provision expense.
For leased equipment, the residual component of a direct financing lease represents the estimated fair value of the leased equipment at the end of the lease term. Huntington uses industry data, historical experience, and independent appraisals to establish these residual value estimates. Additional information regarding product life cycle, product upgrades, as well as insight into competing productsUpon expiration of a lease, residual assets are obtained through relationships with industry contacts and are factored intoremarketed, resulting in an extension of the lease by the lessee, a lease to a new customer, or purchase of the residual asset by the lessee or another party. Huntington also purchases insurance guaranteeing the value estimates where applicable.of certain residual assets.
Loans Held for Sale — Loans in which Huntington does not have the intent and ability to hold for the foreseeable future are classified as loans held for sale. Loans held for sale are carried at (a) the lower of cost or fair value less costs to sell, or (b) fair value where the fair value option is elected. The fair value option is generally elected for mortgage loans originated with the intent to sell to facilitate hedging of the loans. The fair value of such loans is estimated based on the inputs that include prices of mortgage backed securities adjusted for other variables such as, interest rates, expected credit defaults and market discount rates. The adjusted value reflects the price we expect to receive from the sale of such loans.sell.
Nonaccrual and Past Due Loans — Loans are considered past due when the contractual amounts due with respect to principal and interest are not received within 30 days of the contractual due date.
Any loan in any portfolio may be placed on nonaccrual status prior to the policies described below when collection of principal or interest is in doubt. When a borrower with debt is discharged in a Chapter 7 bankruptcy and the debt is not reaffirmed by the borrower, the loan is determined to be collateral dependent and placed on nonaccrual status, unless there is a co-borrower or the repayment is likely to occur based on objective evidence.
110 Huntington Bancshares Incorporated
All classes within the C&Icommercial loan and CRE portfolioslease portfolio are placed on nonaccrual status at 90-days past due. First-lien home equity loans are placed on nonaccrual status at 150-days past due. Junior-lien home equity loans are placed on nonaccrual status at the earlier of 120-days past due or when the related first-lien loan has been identified as nonaccrual. Automobile, RV and marine, and other consumer loans are generally fully charged-off at 120-days past due, and if not fully charged-off are placed on non-accrual, if not charged off, when the loan is 120-days past due.non-accrual. Residential mortgage loans are placed on nonaccrual status at 150-days past due, with the exception of residential mortgages guaranteed by government agencies which continue to accrue interest at the rate guaranteed by the government agency.
For all classes within all loan portfolios, when a loan is placed on nonaccrual status, any accrued interest income, to the extent it is recognized in the current year, is reversed and charged toagainst interest income.
For all classes within all loan portfolios, cash receipts on NALs are applied against principal until the loan or lease has been collected in full, including the charged-off portion, after which time any additional cash receipts are recognized as interest income. However, for secured non-reaffirmed debt in a Chapter 7 bankruptcy, payments are applied to principal and interest when the borrower has demonstrated a capacity to continue payment of the debt and collection of the debt is reasonably assured. For unsecured non-reaffirmed debt in a Chapter 7 bankruptcy where the carrying value has been fully charged-off, payments are recorded as loan recoveries.
Within the C&IManagement monitors several factors to evaluate a borrower’s financial condition and CRE portfolios, the determination of a borrower’stheir ability to make the required principal and interest payments is based on an examination of the borrower’s current financial statements, industry, management capabilities, and other qualitative measures. For all classes within the consumer loan portfolio, the determination of a borrower’s ability to make the required principal and interest payments is based on multiple factors, including number of days past due and, in some instances, an evaluation of the borrower’s financial condition.payments. When, in management’s judgment, the borrower’s ability to make required principal and interest payments resumes and collectability is no longer in doubt, supported by sustained repayment history, the loan is returned to accrual status. For loans that are returned to accrual status, cash receipts are applied according to the contractual terms of the loan.
Collateral-dependent LoansLoans — Certain commercial and consumer loans for which repayment is expected to be provided substantially through the operation or sale of the loan collateral are considered to be collateral-dependent. Commercial collateral-dependent loans are generally secured by business assets and/or commercial real estate. Consumer collateral-dependent loans are primarily secured by residential real estate or automobiles.
Allowance for Credit Losses — Huntington maintains allowance for credit lossesperforms an ACL evaluation on its loan and lease portfolio, held-to-maturity securities as well as on available-for-sale securities. The allowance for credit lossesACL on loan and lease portfolio and held-to-maturity securities are provided through an expected loss methodology referred to as current expected credit loss (“CECL”)CECL methodology. The allowance for credit lossesACL on AFS securities is provided when a credit loss is deemed to have occurred for securities which Huntington does not intend to sell or is not required to sell. The CECL methodology also applies to credit exposures on off-balance-sheet loan commitments, financial guarantees not accounted for as insurance, including standby letters of credit, and other similar instruments not recognized as derivative financial instruments.
Loans99 Huntington Bancshares Incorporated
Loan and Lease portfolio - The allowance for credit lossesACL is deducted from the amortized cost basis of a financial asset or a group of financial assets so that the balance sheet reflects the net amount Huntington expects to collect. Amortized cost is the principal balance outstanding, net of purchase premiums and discounts, fair value hedge accounting adjustments, and deferred fees and costs. Subsequent changes (favorable and unfavorable) in expected credit losses are recognized immediately in net income as a provision for credit loss expenselosses or a reversal of provision for credit loss expense.losses. Management estimates the allowance by projecting probability-of-default, loss-given-default and exposure-at-default depending onutilizing models dependent upon loan risk characteristics and economic parameters for each month of the remaining contractual term.parameters. Commercial loan risk characteristics include but are not limited to risk ratings, industry type and maturity type. Consumer loan risk characteristics include but are not limited to FICO scores, LTV, and loan vintages. The economic parameters are developed using available information relating to past events, current conditions, and reasonable and supportable forecasts. Huntington’s reasonable and supportable forecast period reverts to a historical norm based on inputs within approximately two to three years. The reversion period is dependent on the state of the economy at the beginning of the forecast. Historical credit experience provides the basis for the estimation of expected credit losses, with adjustments made for differences in current loan-specific risk
characteristics such as differences in underwriting standards, portfolio mix, delinquency levels and terms, as well as for changes in the micro- and macro-economic environments.macroeconomic environment. The contractual terms of financial assets are adjusted for expected prepayments and any extensions outside of Huntington’s control.
The allowance for credit lossesACL is measured on a collective basis when similar risk characteristics exist. Loans that are determined to have unique risk characteristics are evaluated on an individual basis by management. If a loan is determined to be collateral dependent or meets the criteria to apply the collateral dependent practical expedient, expected credit losses are determined based on the fair value of the collateral at the reporting date, less costs to sell as appropriate. Loans with unique risk characteristics that are not subject to collateral dependent accounting, are assessed using a discounted cash flows methodology.
Management believes the products within each of the entity’s portfolio classes exhibit similar risk characteristics. Huntington has identified its portfolio classes as disclosed in Note 5 - “Loans and Leases.”. In addition to the transactionaltransaction reserve described above, Huntington also maintains a general reserve that consists of various risk-profile reserve components. The risk-profile components consider items unique to Huntington’s structure, policies, processes, and portfolio composition, as well as qualitative measurements and assessments of the loan portfolios including, but not limited to, economic uncertainty, concentrations, portfolio composition, industry comparisons and internal review functions.
Huntington has elected to exclude accrued interest receivable from the measurement of its ACL given the well-defined non-accrual policies in place for all loan portfolios which results in timely reversal of outstanding interest through interest income. For certain loans on active deferral related to COVID-19, the collection of interest may be delayed for an extended period of time. The accrued interest on these active deferral loans is contemplated in establishing the ACL.
The estimate for the off-balance sheet exposures, the AULC, is determined using the same procedures and methodologies as used for the loan and lease portfolio supplemented by the information related to future draws and related credit loss expectations. The AULC is recorded in other liabilities in the Consolidated Balance Sheets.
Prior to the implementation of ASU 2016-13 (CECL) on January 1, 2020, the allowance for credit losses was subject to the guidance included in ASC 310 and ASC 450. Under the guidance, the bank was required to use an incurred loss methodology to estimate credit losses that were estimated to be incurred in the loan portfolio and that could ultimately materialize into confirmed losses in the form of charge-offs. The incurred loss methodology was a backward-looking approach to loss recognition and based on the concept of a triggering event having taken place, causing a loss to be inherent within the portfolio. This methodology under ASC 450 was predicated on a loss emergence period that was applied at a portfolio level. Loss emergence periods, PD’s and LGD’s were all based on historical loss experience within the loan portfolios. Consideration of forward looking macro-economic expectations was not permitted under this allowance methodology. Additionally, loans that were identified as impaired under the definition of ASC 310, were required to be assessed on an individual basis. The allowance for credit losses and resulting provision expense levels for comparative periods presented in this document were estimated in accordance with these requirements.
HTM Securities - The allowance for held-to-maturity debt securities is estimated using a CECL methodology. Any expected credit loss is provided through the allowance for credit loss on HTM securities and is deducted from the amortized cost basis of the security so that the balance sheet reflects the net amount Huntington expects to collect. Nearly all of Huntington’s HTM debt securities are issued by U.S. government entities and agencies. These securities are either explicitly or implicitly guaranteed by the U.S. government, are highly rated by major rating agencies, and have a long history of no credit losses. Accordingly, there is a zero credit loss expectation on these securities.
Prior to the implementation of ASU 2016-13 (CECL) on January 1, 2020, Huntington evaluated its HTM securities portfolio on a quarterly basis for indicators of OTTI. Huntington assessed whether OTTI had occurred when the fair value of a debt security was less than the amortized cost at the balance sheet date. If an OTTI was deemed to have occurred, the credit portion of the OTTI was recognized in noninterest income while the noncredit portion was recognized in OCI. In determining the credit portion, Huntington used a discounted cash flow analysis which included evaluating the timing and amount of the expected cash flows.
1122023 Form 10-K Huntington Bancshares Incorporated100
AFS Securities - Huntington evaluates its available-for-sale investment securities portfolio on a quarterly basis for indicators of impairment. Huntington assesses whether an impairment has occurred when the fair value of a debt security is less than the amortized cost at the balance sheet date. Management reviews the amount of unrealized loss, the credit rating history, market trends of similar security classes, time remaining to maturity, and the source of both interest and principal payments to identify securities which could potentially be impaired. For those debt securities that Huntington intends to sell or is more likely than not required to sell, before the recovery of their amortized cost basis, the difference between fair value and amortized cost is considered to be impaired and is recognized in noninterest income.provision for credit losses. For those debt securities that Huntington does not intend to sell or is not more likely than not required to sell, prior to expected recovery of amortized cost basis, the credit portion of the impairment is recognized through an allowance in noninterest incomeprovision for credit losses while the noncredit portion is recognized in OCI. In determining the credit portion, Huntington uses a discounted cash flow analysis, which includes evaluating the timing and amount of the expected cash flows. Non-credit-related impairment results from other factors, including increased liquidity spreads and higher interest rates.
Prior to the implementation of ASU 2016-13 (CECL) on January 1, 2020, Huntington evaluated its AFS securities portfolio in accordance with the methodology specified in the preceding paragraph except that the credit portion of the impairment would reduce the amortized cost basis of the security. Any subsequent increase in the expected cash flows would be recognized as an adjustment to interest income.
Charge-off of Uncollectible Loans — Any loan in any portfolio may be charged-off prior to the policies described below if a loss confirming event has occurred. Loss confirming events include, but are not limited to, bankruptcy (unsecured), continued delinquency, foreclosure, or receipt of an asset valuation indicating a collateral deficiency and that asset is the sole source of repayment. Additionally, discharged, collateral dependent non-reaffirmed debt in Chapter 7 bankruptcy filings will result in a charge-off to estimated collateral value, less anticipated selling costs, unless the repayment is likely to occur based on objective evidence.
C&ICommercial loans and CRE loansleases are generally either charged-off or written down to net realizable value at 90-days past due. Automobile, RV and marine, and other consumer loans are generally charged-off at 120-days past due. First-lien and junior-lien home equity loans are charged-off to the estimated fair value of the collateral, less anticipated selling costs, at 150-days past due and 120-days past due, respectively. Residential mortgages are charged-off to the estimated fair value of the collateral at 150-days past due.
Collateral — Huntington pledges assets as collateral as required for various transactions including security repurchase agreements, public deposits, loan notes, derivative financial instruments, short-term borrowings, and long-term borrowings. Assets that have been pledged as collateral, including those that can be sold or repledged by the secured party, continue to be reported on the Consolidated Balance Sheets.
Huntington also accepts collateral, primarily as part of various transactions including derivative instruments and security resale agreements. Collateral received is excluded from the Consolidated Balance Sheets.
The market value of collateral accepted or pledged is regularly monitored and additional collateral is obtained or provided as necessary to ensure appropriate collateral coverage in these transactions.
Premises and Equipment — Premises and equipment are stated at cost, less accumulated depreciation and amortization. Depreciation is computed principally by the straight-line method over the estimated useful lives of the related assets. Buildings and building improvements are depreciated over an average of 30 to 40 years and 10 to 30 years, respectively. Land improvements and furniture and fixtures are depreciated over an average of 5 to 20 years, while equipment is depreciated over a range of 3 to 10 years. Leasehold improvements are amortized over the lesser of the asset’s useful life or the lease term, including any renewal periods for which renewal is reasonably assured. Maintenance and repairs are charged to expense as incurred, while improvements that extend the useful life of an asset are capitalized and depreciated over the remaining useful life. Amounts in premises and equipment may include items classified as held-for-sale, which are carried at lower of cost or fair value, less costs to sell. Premises and equipment are evaluated for impairment whenever events or changes in circumstances indicate that the carrying amount of the asset may not be recoverable.
Mortgage Servicing Rights — Huntington recognizes the rights to service mortgage loans as an asset when servicing is contractually separated from the underlying mortgage loans by sale or securitization of the loans with
servicing rights retained or when purchased. MSRs are included in servicing rights and other intangible assets in the Consolidated Balance Sheets. At the time of initial capitalization, MSRs may be grouped into servicing classes based on the availability of market inputs used in determining fair value and the method used for managing the risks of the servicing assets. All MSR assets are recorded using the fair value method. Any change in the fair value of MSRs during the period is recorded in mortgage banking income.
101 Huntington economically hedges the valueBancshares Incorporated
Goodwill and Other Intangible Assets — Under the acquisition method of accounting, the net assets of entities acquired by Huntington are recorded at their estimated fair value at the date of acquisition. The excess cost of consideration paid over the fair value of net assets acquired is recorded as goodwill. Other intangible assets with finite useful lives are amortized either on an accelerated or straight-line basis over their estimated useful lives. Goodwill is evaluated for impairment on an annual basis at October 1st of each year or whenever events or changes in circumstances indicate that the carrying value may not be recoverable. Other intangible assets with finite useful lives are amortized either on an accelerated or straight-line basis over their estimated useful lives. Other intangible assets are reviewed for impairment whenever events or changes in circumstances indicate that the carrying amount of the asset may not be recoverable.
Operating Leases (Lessee) — Huntington has elected not to include non-lease components in the measurement of right-of-use assets, and as such allocates the costs attributable to such components, where those costs are not separately identifiable, via per-square-foot costing analysis developed by the entity for owned and leased spaces. Huntington uses a portfolio approach to develop discount rates as its lease portfolio is comprised of substantially all branch space and office space used in the entity’s operations. That rate, an input used in the measurement of the entity’s right-of-use assets, leverages an incremental borrowing rate of appropriate tenor and collateralization.
Derivative Financial Instruments — A variety of derivative financial instruments, principally interest rate swaps, swaptions, caps, swaption collars, floors, forward contracts, and collars,forward starting interest rate swaps are used in asset and liability management activities to protect against the risk of adverse price or interest rate movements. These instruments provide flexibility in adjusting Huntington’s sensitivity to changes in interest rates without exposure to loss of principal and higher funding requirements.
Huntington also uses derivatives, principally loan sale commitments, in hedging its mortgage loan interest rate lock commitments and its mortgage loans held for sale. Mortgage loan sale commitments and the related interest rate lock commitments are carried at fair value on the Consolidated Balance Sheets with changes in fair value reflected in mortgage banking income. Huntington also uses certain derivative financial instruments to offset changes in value of its MSRs. These derivatives consist primarily of forward interest rate agreements and forward mortgage contracts. The derivative instruments used are not designated as qualifying hedges. Accordingly, such derivatives are recorded at fair value with changes in fair value reflected in mortgage banking income.
Derivative financial instruments are recorded in the Consolidated Balance Sheets as either an asset or a liability (in other assets and other liabilities, respectively) and measured at fair value. OnAccounting for changes in fair value of derivatives depends on whether the datederivative is designated and qualifies in a hedging relationship. At inception a derivative contract is entered into, we designate it as either:can be designated as:
•a qualifying hedge of the fair value of a recognized asset or liability or of an unrecognized firm commitment (fair value hedge);
•a qualifying hedge of the variability of cash flows to be received or paid related to a recognized asset, liability or forecasted transaction (cash flow hedge); or
•a trading instrument or a non-qualifying (economic) hedge.qualifying hedge of Huntington’s investment in non-U.S. dollar functional currency entities (net investment hedge).
Changes in the fair value of a derivative that has been designated and qualifies as a fair value hedge, along with the changes in the fair value of the hedged asset or liability that is attributable to the hedged risk, are recorded in current period earnings. Changes in the fair value of a derivative that has been designated and qualifies as a cash flow hedge are recorded in other comprehensive income, net of income taxes, and reclassified into earnings in the period during which the hedged item affects earnings. Changes in the fair value of derivatives held for trading purposesthat have been designated as net investment hedges are recorded in other comprehensive income, net of income taxes, and reclassified into earnings during the period the foreign entity is substantially liquidated or other elements of the currency translation adjustment are reclassified into earnings. Changes in the fair value of derivatives which do not qualify for hedge accounting are reported in current period earnings.
For those derivatives to which hedge accounting is applied, Huntington formally documents the hedging relationship and the risk management objective and strategy for undertaking the hedge. This documentation identifies the hedging instrument, the hedged item or transaction, the nature of the risk being hedged, and, unless
114 Huntington Bancshares Incorporated
the hedge meets all of the criteria to assume there is no ineffectiveness, the method that will be used to assess the effectiveness of the hedging instrument. Except for specifically designated fair value hedges of certain fixed-rate debt for which Huntington utilizes the short-cut method when certain criteria are met, Huntington utilizes thetypically assesses effectiveness using statistical regression method to evaluate hedge effectivenessat inception and on all its qualifying hedges on a quarterlyan ongoing basis.
Hedge accounting is discontinued prospectively when:
•the derivative is no longer effective or expected to be effective in offsetting changes in the fair value, or cash flows or changes in net investment of a hedged item (including firm commitments or forecasted transactions);
•the derivative expires, is sold, terminated, or exercised;
•the forecasted transaction is no longer probable of occurring;occurring by the end of the originally specified time period;
•the hedged firm commitment no longer meets the definition of a firm commitment; or
•the designation of the derivative as a hedging instrument is removed.
When hedge accounting is discontinued and the derivative no longer qualifies as an effective fair value, or cash flow or net investment hedge, the derivative continues to be carried on the balance sheet at fair value.
In the case of a discontinued fair value hedge of a recognized asset or liability, as long as the hedged item continues to exist on the balance sheet, the hedged item will no longer be adjusted for changes in fair value. The basis adjustment that had previously been recorded to the hedged item during the period from the hedge designation date to the hedge discontinuation date is recognized as an adjustment to the yield of the hedged item over the remaining life of the hedged item.
In the case of a discontinued cash flow hedge of a recognized asset or liability, as long as the hedged item continues to exist on the balance sheet, theand changes in fair value of the hedging derivative will no longer be recorded to other comprehensive income. The balance applicable to the discontinued hedging relationship will be recognized in earnings over the remaining life of the hedged item as an adjustment to yield. If the discontinued hedged item was a forecasted transaction that is not expected to occur, any amounts recorded in accumulated other comprehensive income are immediately reclassified to current period earnings.
In the case of either a fair value hedge or a cash flow hedge, if the previously hedged item is sold or extinguished, the basis adjustment to the underlying asset or liability or any remaining unamortized amount in accumulated other comprehensive income will be recognized in the current period earnings.
In all other situations in which hedge accounting is discontinued, the derivative will be carried at fair value on the consolidated balance sheets, with changes in its fair value recognized in current period earnings unless re-designated as a qualifying hedge.re-designated.
Like other financial instruments, derivatives contain an element of credit risk, which is the possibility that Huntington will incur a loss because the counterparty fails to meet its contractual obligations. Notional values of interest rate swaps and other off-balance sheet financial instruments significantly exceed the credit risk associated with these instruments and represent contractual balances on which calculations of amounts to be exchanged are based. Credit exposure is limited to the sum of the aggregate fair value of positions that have become favorable to Huntington, including any accrued interest receivable due from counterparties. Potential credit losses are mitigated through tradingby derivatives through central clearing parties, careful evaluation of counterparty credit standing, selection of counterparties from a limited group of high quality institutions, collateral agreements, and other contract provisions. Huntington considers the value of collateral held and collateral provided in determining the net carrying value of derivatives.
Huntington offsets the fair value amounts recognized for derivative instruments and the fair value for the right to reclaim cash collateral or the obligation to return cash collateral arising from derivative instruments recognized at fair value executed with the same counterparty under a master netting arrangement.
Fair Value Measurements — The Company records or discloses certain of its assets and liabilities at fair value. Fair value is defined as the exchange price that would be received for an asset or paid to transfer a liability (an exit price) in the principal or most advantageous market for the asset or liability in an orderly transaction between market participants on the measurement date. Fair value measurements are classified within one of three levels in a valuation hierarchy based upon the observability of inputs to the valuation of an asset or liability as of the measurement date. The three levels are defined as follows:
•Level 1 – inputs to the valuation methodology are quoted prices (unadjusted) for identical assets or liabilities in active markets.
•Level 2 – inputs to the valuation methodology include quoted prices for similar assets and liabilities in active markets, and inputs that are observable for the asset or liability, either directly or indirectly, for substantially the full term of the financial instrument.
•Level 3 – inputs to the valuation methodology are unobservable and significant to the fair value measurement.
A financial instrument’s categorization within the valuation hierarchy is based upon the lowest level of input that is significant to the fair value measurement.
103 Huntington Bancshares Incorporated
Bank Owned Life Insurance — Huntington’s bank owned life insurance policies are recorded at their cash surrender value. Huntington recognizes tax-exempt income from the periodic increases in the cash surrender value of these policies and from death benefits. A portion of the cash surrender value is supported by holdings in separate accounts. Book value protection for the separate accounts is provided by the insurance carriers and a highly rated major bank.
Transfers of Financial Assets and Securitizations — Transfers of financial assets in which we have surrendered control over the transferred assets are accounted for as sales. In assessing whether control has been surrendered, Huntington considers whether the transferee would be a consolidated affiliate, the existence and extent of any continuing involvement in the transferred financial assets, and the impact of all arrangements or agreements made contemporaneously with, or in contemplation of, the transfer, even if they were not entered into at the time of transfer. Control is generally considered to have been surrendered when (i) the transferred assets have been legally isolated from Huntington or any of its consolidated affiliates, even in bankruptcy or other receivership, (ii) the transferee (or, if the transferee is an entity whose sole purpose is to engage in securitization or asset-backed financing that is constrained from pledging or exchanging the assets it receives, each third-party holder of its beneficial interests) has the right to pledge or exchange the assets (or beneficial interests) it received without any constraints that provide more than a trivial benefit to Huntington, and (iii) neither Huntington nor its consolidated affiliates and agents have (a) both the right and obligation under any agreement to repurchase or redeem the transferred assets before their maturity, (b) the unilateral ability to cause the holder to return specific financial assets that also provides Huntington with a more-than-trivial benefit (other than through a cleanup call) or (c) an agreement that permits the transferee to require Huntington to repurchase the transferred assets at a price so favorable that it is probable that it will require Huntington to repurchase them.
If the sale criteria are met, the transferred financial assets are removed from the balance sheet and a gain or loss on sale is recognized. If the sale criteria are not met, the transfer is recorded as a secured borrowing in which the assets remain on the balance sheet and the proceeds from the transaction are recognized as a liability. For the majority of financial asset transfers, it is clear whether or not Huntington has surrendered control. For other transfers, such as in the case of complex transactions or where Huntington have continuing involvement, we generally obtain a legal opinion as to whether the transfer results in a true sale by law.
Gains and losses on the loans and leases sold and servicing rights associated with loan and lease sales are determined when the related loans or leases are sold to either a securitization trust or third-party. For loan or lease sales with servicing retained, a servicing asset is recorded at fair value for the right to service the loans sold.
Pension and Other Postretirement Benefits — Huntington recognizes the funded status of the postretirement benefit plans on the Consolidated Balance Sheets. Net postretirement benefit cost charged to current earnings related to these plans is predominantly based on various actuarial assumptions regarding expected future experience.
Certain employees are participants in various defined contribution and other non-qualified supplemental retirement plans. Contributions to defined contribution plans are charged to current earnings.
In addition, Huntington maintains a 401(k) plan covering substantially all employees. Employer contributions to the plan are charged to current earnings.
Revenue Recognition — Huntington earns a variety of revenue including interest and fees from customers as well as revenues from non-customers. Certain sources of revenue are recognized within interest or fee income and are outside of the scope of ASC 606. Other sources of revenue fall within the scope of ASC 606 and are generally recognized within noninterest income.
1162023 Form 10-K Huntington Bancshares Incorporated104
Noninterest Income — Huntington recognizes revenue when the performance obligations related to the transfer of goods or services under the terms of a contract are satisfied. Some obligations are satisfied at a point in time while others are satisfied over a period of time. Revenue is recognized as the amount of consideration to which Huntington expects to be entitled to in exchange for transferring goods or services to a customer. When consideration includes a variable component, the amount of consideration attributable to variability is included in the transaction price only to the extent it is probable that significant revenue recognized will not be reversed when uncertainty associated with the variable consideration is subsequently resolved. Generally, the variability relating to the consideration is explicitly stated in the contracts, but may also arise from Huntington’s customer business practices, for example, waiving certain fees related to customer’s deposit accounts such as NSF fees.accounts. Huntington’s contracts generally do not contain terms that require significant judgement to determine the variability impacting the transaction price.
Revenue is segregated based on the nature of product and services offered as part of contractual arrangements. Revenue from contracts with customers is broadly segregated as follows:
•Service charges on deposit accounts include fees and other charges Huntington receives to provide various services, including but not limited to, maintaining an account with a customer, providing overdraft services, wire transfer, transferring funds, and accepting and executing stop-payment orders. The consideration includes both fixed (e.g., account maintenance fee) and transaction fees (e.g., wire-transfer fee). The fixed fee is recognized over a period of time while the transaction fee is recognized when a specific service (e.g., execution of wire-transfer) is rendered to the customer. Huntington may, from time to time, waive certain fees (e.g., NSF fee) for customers but generally does not reduce the transaction price to reflect variability for future reversals due to the insignificance of the amounts. Waiver of fees reduces the revenue in the period the waiver is granted to the customer.
•Card and payment processing income includes interchange fees earned on debit cards and credit cards. All other fees (e.g., annual fees), and interest income are recognized in accordance with ASC 310. Huntington recognizes interchange fees for services performed related to authorization and settlement of a cardholder’s transaction with a merchant. Revenue is recognized when a cardholder’s transaction is approved and settled.
Certain volume or transaction based interchange expenses (net of rebates) paid to the payment network reduce the interchange revenue and are presented net on the income statement. Similarly, rewards payable under a reward program to cardholders are recognized as a reduction of the transaction price and are presented net against the interchange revenue.
•Trust and investment management services includes fee income generated from personal, corporate and institutional customers. Huntington also provides investment management services, cash management services and tax reporting to customers. Services are rendered over a period of time, over which revenue is recognized. Huntington may also recognize revenue from referring a customer to outside third-parties including mutual fund companies that pay distribution (12b-1) fees and other expenses. 12b-1 fees are received upon initially placing an account holder’s funds with a mutual fund company as well as in the future periods as long as the account holder (i.e., the fund investor), remains invested in the fund. The transaction price includes a variable consideration which is considered constrained as it is not probable that a significant revenue reversal in the amount of cumulative revenue recognized will not occur. Accordingly, those fees are recognized as revenue when the uncertainty associated with the variable consideration is subsequently resolved, that is, initial fees are recognized in the initial period while the future fees are recognized in future periods.
•Insurance income includes agency commissions that are recognized when Huntington sells insurance policies to customers. Huntington is also entitled to renewal commissions and, in some cases, profit sharing which are recognized in subsequent periods. The initial commission is recognized when the insurance policy is sold to a customer. Renewal commission is variable consideration and is recognized in subsequent periods when the uncertainty around variable consideration is subsequently resolved (i.e., when customer renews the policy). Profit sharing is also variable consideration that is not recognized until the variability surrounding realization of revenue is resolved (i.e., Huntington has reached a minimum volume of sales). Another source of variability is the ability of the policy holder to cancel the policy anytime. In such cases, Huntington may be
required, under the terms of the contract, to return part of the commission received. A policy cancellation reserve is established for such expected cancellations.
•Other noninterest income includes a variety of other revenue streams including capital markets revenue, miscellaneous consumer fees and marketing allowance revenue. Revenue is recognized when, or as, the performance obligation is satisfied. Inherent variability in the transaction price is not recognized until the uncertainty affecting the variability is resolved.
Control is transferred to a customer either at a point in time or over time. A performance obligation is deemed satisfied when the control over goods or services is transferred to the customer. To determine when control is transferred at a point in time, Huntington considers indicators, including, but not limited to, the right to payment for the asset, transfer of significant risk and rewards of ownership of the asset and acceptance of the asset by the customer.
Refer to Note 15 - “Revenue is recorded infrom Contracts with Customers” for details related to revenue from contracts with customers within the business segment responsible for the related product or service. Fee sharing arrangements exist to allocate portionsscope of such revenue to other business segments involved in selling to, or providing service to, customers. Business segment results are determined based upon management’s reporting system, which assigns balance sheet and income statement items to each of the business segments. The process is designed around Huntington’s organizational and management structure and, accordingly, the results derived are not necessarily comparableASC Topic 606, Revenue from Contracts with similar information published by other financial institutions.Customers (“ASC 606”). Income Taxes — Income taxes are accounted for under the asset and liability method. Accordingly, deferred tax assets and liabilities are recognized for the future book and tax consequences attributable to temporary differences between the financial statement carrying amounts of existing assets and liabilities and their respective tax bases. Deferred tax assets and liabilities are determined using enacted tax rates expected to apply in the year in which those temporary differences are expected to be recovered or settled. The effect on deferred tax assets and liabilities of a change in tax rates is recognized in income at the time of enactment of such change in tax rates.
Any interest or penalties due for payment of income taxes are included in the provision for income taxes. To the extent we do not consider it more likely than not that a deferred tax asset will be recovered, a valuation allowance is recorded. All positive and negative evidence is reviewed when determining how much of a valuation allowance is recognized on a quarterly basis. In determining the requirements for a valuation allowance, sources of possible taxable income are evaluated including future reversals of existing taxable temporary differences, future taxable income exclusive of reversing temporary differences and carryforwards, taxable income in appropriate carryback years, and tax-planning strategies. Huntington applies a more likely than not recognition threshold for all tax uncertainties.
Share-Based Compensation — Huntington uses the fair value based method of accounting for awards of HBAN stock granted to employees under various share-based compensation plans. Share-based compensation costs are recognized prospectively for all new awards granted under these plans. Compensation expense relating to stock options is calculated using a methodology that is based on the underlying assumptions of the Black-Scholes option pricing model and is charged to expense over the requisite service period (e.g., vesting period). taking into account retirement eligibility. Compensation expense relating to restricted stock awards is based upon the fair value of the awards on the date of grant and is charged to earnings over the requisite service period (e.g., vesting period) taking into account the retirement eligibility of the award.
Stock Repurchases — Acquisitions of Huntington stock are recorded at cost.
Segment Results — Accounting policies for the business segments are the same as those used in the preparation of the Consolidated Financial Statements with respect to activities specifically attributable to each business segment. However, the preparation of business segment results requires management to establish methodologies to allocate funding costs and benefits, expenses, and other financial elements to each business segment, which are described in Note 26 - “Segment Reporting”.118105 Huntington Bancshares Incorporated
2. ACCOUNTING STANDARDS UPDATE
Accounting standards adopted in the current period
| | | | | | | | |
| Standard | Summary of guidance | Effects on financial Statements |
ASU 2022-02 - Financial Instruments - Credit Losses (Topic 326): Troubled Debt Restructurings and Vintage Disclosures Issued March 2022 | •The amendments in this update eliminate TDR accounting while enhancing disclosure requirements for certain loan modifications when a borrower is experiencing financial difficulty. The ASU also requires disclosure of current period gross charge-offs by year of origination for financing receivables and net investments in leases. | •Management adopted the guidance during the first quarter of 2023. •The ASU has been applied prospectively, except the portion of the standard related to the recognition and measurement of TDRs where we elected to use a modified retrospective transition method. •The adoption did not result in a material impact on Huntington’s Consolidated Financial Statements. |
| | |
| | | | | | | | |
Accounting standards yet to be adopted in current period |
| | | | | | | | | | |
| Standard | Summary of guidance | Effects on financial statements | | |
ASU 2016-132023-02 - Financial InstrumentsInvestments - Equity Method and Joint Ventures (Topic 323): Accounting for Investments in Tax Credit Losses. Issued June 2016
Structures Using the Proportional Amortization Method Issued: March 2023 | •EliminatesPermits the probable recognition thresholdelection of the proportional amortization method for credit losses on financial assets measured at amortized cost, replacing the current incurred loss framework with an expected credit loss model.any tax equity investment that meets specific criteria. •Requires those financial assets subject tothat the new guidance toelection be presented at the net amount expected to be collected (i.e., net of expected credit losses).made on a tax-credit-program-by-tax-credit-program basis. •MeasurementReceipt of expected credit lossestax credits must be accounted for using the flow through method. •Requires that a liability be recorded for delayed equity contributions. •Expands disclosure requirements for the nature of investments and financial statement effect. | •Effective for fiscal years beginning after December 15, 2023, including interim periods within those fiscal years. •Huntington adopted the standard effective January 1, 2024. on a modified retrospective basis. •Huntington does not expect adoption of the standard to have a material impact on its Consolidated Financial Statements.
| | |
| ASU 2023-07 - Segment Reporting (Topic 280): Improvement to Reportable Segments | •Requires disclosure of the position and title of the CODM and significant segment expenses that the CODM is regularly provided. •Requires the disclosure of other segment items representing the difference between segment revenue and expense and the profit and loss measure of the segment. •Allows for the CODM to use more than one measure of segment profit and loss, as long as one measure is consistent with GAAP.
| •Effective for fiscal years beginning after December 15, 2023, and interim periods within fiscal years beginning after December 15, 2024. •Early adoption is permitted. •The amendments are to be applied retrospectively to all periods presented and segment expense categories should be based on relevant information including historical experience, current conditions, and reasonable and supportable forecasts that affect the collectability of the reported amount. •The guidance will require additional quantitative and qualitative disclosures related to the credit risk inherent in Huntington’s portfolio and how management monitors the portfolio’s credit quality.
| •Management adopted the guidance on January 1, 2020 through a cumulative-effect adjustment to retained earnings and implemented changes to relevant systems, processes, and controls where necessary.
•The adoption of ASU 2016-13 on January 1, 2020 resulted in an increase to our total ACL of $393 million. This represented an increase of 44% from the 2019 year end ACL level of $887 million. For more detail on the day 1 adoption impacts, please refer to Note 6 - Allowance for Credit Losses.
•The ASU eliminated the current accounting model for purchased-credit-impaired loans, but requires an allowance to be recognized for purchased-credit-deteriorated (PCD) assets (those that have experienced more-than-insignificant deterioration in credit quality since origination). Huntington did not have any loans accounted for as PCD uponcategories identified at adoption.
•AtHuntington does not expect adoption Huntington did not record an allowance with respectof the standard to HTM securities as the portfolio consists almost entirely of agency-backed securities that inherently have minimal nonpayment risk.a material impact on its Consolidated Financial Statements. | | |
| | |
| | |
| | |
ASU 2019-122023-09 - Income Taxes (Topic 740): Simplifying the Accounting forImprovements to Income Taxes Issued: December 2019
Tax Disclosures | •The ASU simplifiesRequires a tabular rate reconciliation using both percentages and reporting currency amounts between the accountingreported amount of income tax expense (or benefit) to the amount of statutory federal income tax at current rates for income taxes by removing exceptions to the: ◦Incremental approach for intra-period tax allocation when there is a loss from continuing operations and income or a gain from other items;
◦Requirement to recognize a deferred tax liability for equity method investments when a foreign subsidiary becomes an equity method investment;
◦Ability not to recognize a deferred tax liability for a foreign subsidiary when a foreign equity method investment becomes a subsidiary; and,
◦General methodology for calculating income taxes in an interim period when a year-to-date loss exceeds the anticipated loss for the year.specified categories using specified disaggregation criteria.
•The ASUamount of net income taxes paid for federal, state, and foreign taxes, as well as the amount paid to any jurisdiction that net taxes exceed a 5% quantitative threshold. •The amendments will require the disclosure of pre-tax income disaggregated between domestic and foreign, as well as income tax expense disaggregated by federal, state, and foreign. •The amendment also simplifies various other aspects of the accounting for income taxes.eliminates certain disclosures related to unrecognized tax benefits and certain temporary differences. | •Management early adopted the guidance on October 1, 2020.Effective for fiscal years beginning after December 15, 2024.
•The ASU didamendments should be applied on a prospective basis but retrospective application is permitted. •Huntington does not expect adoption of the standard to have a material impact on Huntington’sits Consolidated Financial Statements. | | |
| | | | |
| | | | |
| | | | |
| | | | |
| | | | |
| | | | |
| | | | |
20202023 Form 10-K 119106
| | | | | | | | |
Standard | Summary of guidance | Effects on financial statements |
ASU 2020-04 - Reference Rate Reform (Topic 848):Facilitation of the Effects of Reference Rate Reform on Financial Reporting
Issued: March 2020; Amended: January 2021
| •The ASU provides optional expedients and exceptions for applying U.S. GAAP to contracts, hedging relationships, and other transactions affected by reference rate reform if certain criteria are met, including the following:
◦Modifications of contracts within the scope of Topics 310, Receivables, and 470, Debt, should be accounted for by prospectively adjusting the effective interest rate;
◦Modifications of contracts within the scope of Topic 842, Leases, should be accounted for as a continuation of the existing contracts with no reassessments of the lease classification or discount rate;
◦The ASU also provides optional expedients for various hedging relationships, allowing hedge accounting to continue uninterrupted, provided certain criteria are met; and,
◦An entity may make a one time election to sell, transfer, or both sell and transfer debt securities classified as held to maturity if certain criteria are met.
•Topic 848 was subsequently amended in January 2021, allowing entities to elect certain optional expedients and exceptions in Topic 848 relating to derivative contracts and hedge accounting affected by the discounting transition initiated by certain central clearing parties.
| •Management early adopted the guidance on October 1, 2020.
•While neither the ASU or the amendment had a material impact on Huntington’s Consolidated Financial Statements, they do ease the administrative burden of accounting for contracts impacted by reference rate reform.
|
| | |
| | |
| | |
| | |
3. BUSINESS COMBINATIONS
3. PENDING ACQUISITION OF TCF FINANCIAL CORPORATIONCapstone Partners
On December 13, 2020,June 15, 2022, Huntington announcedacquired Capstone Partners, a leading middle market investment bank and advisory firm dedicated to servicing middle market companies throughout their full business lifecycle. The acquisition resulted in $192 million of goodwill, allocated to the signing of a definitive merger agreement (the “TCF/Huntington Merger Agreement”). Under the terms of the agreement,Commercial Banking segment, which was unanimously approved by the boards of directors of both companies, approximates total consideration. The goodwill recognized is deductible for tax purposes.
TCF Financial Corporation
On June 9, 2021, Huntington closed the parent companyacquisition of TCF National Bank will merge into HuntingtonFinancial Corporation in an all-stock transaction valued at approximately $6.0 billion based on the closing stock price on the day preceding the announcement.$7.2 billion. TCF iswas a financial holding company headquartered in Detroit, Michigan with reported total assets of $47.8 billion based on their balance sheet at December 31, 2020. Followingoperations across the merger, Huntington will operate with dual headquarters for banking operations in Detroit, MichiganMidwest. The acquisition brought increased scale and Columbus, Ohio.market density, as well as added new markets and capabilities.
Under the terms of the Merger Agreement,agreement, TCF shareholders will receivereceived 3.0028 shares of Huntington common stock for each share of TCF common stock. Holders of TCF common stock will receivealso received cash in lieu of fractional shares. EachIn addition, each outstanding share of 5.70% Series C Non-Cumulative Perpetual Preferred Stock of TCF will bewas converted into the right to receive 1one share of a newly created series of preferred stock of Huntington. SubjectHuntington, Series I Preferred Stock.
Huntington's operating results for the years ended December 31, 2023, December 31, 2022, and December 31, 2021 include the operating results of the acquired assets and assumed liabilities of TCF Financial Corporation subsequent to receiptthe acquisition on June 9, 2021. Due to the conversions of regulatory approvalsTCF system occurring throughout 2021, as well as other streamlining and satisfactionintegration of other customary closing conditions, including approvalthe operating activities into those of boththe Company, historical reporting for the former TCF operations is impracticable and Huntington shareholders,thus disclosures of the transactionrevenue from the assets acquired and income before income taxes is anticipatedimpracticable for the period subsequent to close in the second quarter of 2021.acquisition.
120107 Huntington Bancshares Incorporated
4. INVESTMENT SECURITIES AND OTHER SECURITIES
Debt securities purchased in which Huntington has the intent and ability to hold to their maturity are classified as held-to-maturity securities. All other debt and equity securities are classified as either available-for-sale or other securities.
The following tables provide amortized cost, fair value, and gross unrealized gains and losses by investment category at December 31, 2020 and 2019:category.
| | Unrealized | |
| | | Unrealized | |
| (dollar amounts in millions) | (dollar amounts in millions) | Amortized
Cost (1) | | Gross Gains | | Gross Losses | | Fair Value |
| December 31, 2020 | | | | | | | |
| (dollar amounts in millions) | |
| (dollar amounts in millions) | | Amortized
Cost (1)(2) | | Gross Gains | | Gross Losses | | Fair Value |
| At December 31, 2023 | |
| Available-for-sale securities: | |
| Available-for-sale securities: | |
| Available-for-sale securities: | Available-for-sale securities: | |
| U.S. Treasury | U.S. Treasury | $ | 5 | | | $ | 0 | | | $ | 0 | | | $ | 5 | |
| U.S. Treasury | |
| U.S. Treasury | |
| Federal agencies: | Federal agencies: | |
| Residential CMO | |
| Residential CMO | |
| Residential CMO | Residential CMO | 3,550 | | | 121 | | | (5) | | | 3,666 | |
| Residential MBS | Residential MBS | 7,843 | | | 97 | | | (5) | | | 7,935 | |
| Commercial MBS | Commercial MBS | 1,151 | | | 21 | | | (9) | | | 1,163 | |
| Other agencies | Other agencies | 60 | | | 2 | | | 0 | | | 62 | |
| Total U.S. Treasury, federal agency and other agency securities | 12,609 | | | 241 | | | (19) | | | 12,831 | |
| Total U.S. Treasury, federal agency, and other agency securities | |
| Municipal securities | Municipal securities | 2,928 | | | 91 | | | (15) | | | 3,004 | |
| Private-label CMO | Private-label CMO | 9 | | | 0 | | | 0 | | | 9 | |
| Asset-backed securities | Asset-backed securities | 185 | | | 7 | | | 0 | | | 192 | |
| Corporate debt | Corporate debt | 440 | | | 5 | | | 0 | | | 445 | |
| Other securities/Sovereign debt | Other securities/Sovereign debt | 4 | | | 0 | | | 0 | | | 4 | |
| Total available-for-sale securities | Total available-for-sale securities | $ | 16,175 | | | $ | 344 | | | $ | (34) | | | $ | 16,485 | |
| | Held-to-maturity securities: | Held-to-maturity securities: | |
| Held-to-maturity securities: | |
| Held-to-maturity securities: | |
| Federal agencies: | Federal agencies: | |
| Federal agencies: | |
| Federal agencies: | |
| Residential CMO | |
| Residential CMO | |
| Residential CMO | Residential CMO | $ | 1,779 | | | $ | 88 | | | $ | 0 | | | $ | 1,867 | |
| Residential MBS | Residential MBS | 3,715 | | | 103 | | | 0 | | | 3,818 | |
| Commercial MBS | Commercial MBS | 3,118 | | | 191 | | | 0 | | | 3,309 | |
| Other agencies | Other agencies | 246 | | | 12 | | | 0 | | | 258 | |
| Total federal agency and other agency securities | Total federal agency and other agency securities | 8,858 | | | 394 | | | 0 | | | 9,252 | |
| Municipal securities | Municipal securities | 3 | | | 0 | | | 0 | | | 3 | |
| Total held-to-maturity securities | Total held-to-maturity securities | $ | 8,861 | | | $ | 394 | | | $ | 0 | | | $ | 9,255 | |
| | Other securities, at cost: | Other securities, at cost: | |
| Other securities, at cost: | |
| Other securities, at cost: | |
| Non-marketable equity securities: | |
| Non-marketable equity securities: | |
| Non-marketable equity securities: | Non-marketable equity securities: | |
| Federal Home Loan Bank stock | Federal Home Loan Bank stock | $ | 60 | | | $ | 0 | | | $ | 0 | | | $ | 60 | |
| Federal Home Loan Bank stock | |
| Federal Home Loan Bank stock | |
| Federal Reserve Bank stock | Federal Reserve Bank stock | 299 | | | 0 | | | 0 | | | 299 | |
| Other non-marketable equity securities | |
| Other securities, at fair value | Other securities, at fair value | |
| Mutual funds | |
| Mutual funds | |
| Mutual funds | Mutual funds | 50 | | | 0 | | | 0 | | | 50 | |
| Equity securities | Equity securities | 8 | | | 1 | | | 0 | | | 9 | |
| Total other securities | Total other securities | $ | 417 | | | $ | 1 | | | $ | 0 | | | $ | 418 | |
|
(1)Amortized cost amounts excludesexclude accrued interest receivable, which is recorded within accrued income and other assetsreceivables on the Consolidated Balance Sheets. At December 31, 2020,2023, accrued interest receivable on available-for-sale securities and held-to-maturity securities totaled $32$61 million and $20$36 million, respectively.
(2)Excluded from the amortized cost are portfolio level basis adjustments for securities designated in fair value hedges under the portfolio layer method. The basis adjustments totaled $619 million and represent a reduction to the amortized cost of the securities being hedged. The securities being hedged under the portfolio layer method are primarily Residential CMO and Residential MBS securities.
20202023 Form 10-K 121108
| | Unrealized | |
| | | Unrealized | |
| (dollar amounts in millions) | (dollar amounts in millions) | Amortized
Cost | | Gross
Gains | | Gross
Losses | | Fair Value |
| December 31, 2019 | | | | | | | |
| (dollar amounts in millions) | |
| (dollar amounts in millions) | | Amortized Cost (1)(2) | | Gross
Gains | | Gross
Losses | | Fair Value |
| At December 31, 2022 | |
| Available-for-sale securities: | |
| Available-for-sale securities: | |
| Available-for-sale securities: | Available-for-sale securities: | |
| U.S. Treasury | U.S. Treasury | $ | 10 | | | $ | 0 | | | $ | 0 | | | $ | 10 | |
| U.S. Treasury | |
| U.S. Treasury | |
| Federal agencies: | Federal agencies: | |
| Residential CMO | |
| Residential CMO | |
| Residential CMO | Residential CMO | 5,055 | | | 48 | | | (18) | | | 5,085 | |
| Residential MBS | Residential MBS | 4,180 | | | 45 | | | (3) | | | 4,222 | |
| Commercial MBS | Commercial MBS | 979 | | | 1 | | | (4) | | | 976 | |
| Other agencies | Other agencies | 165 | | | 1 | | | (1) | | | 165 | |
| Total U.S. Treasury, federal agency and other agency securities | 10,389 | | | 95 | | | (26) | | | 10,458 | |
| Total U.S. Treasury, federal agency, and other agency securities | |
| Municipal securities | Municipal securities | 3,044 | | | 34 | | | (23) | | | 3,055 | |
| Private-label CMO | Private-label CMO | 2 | | | 0 | | | 0 | | | 2 | |
| Asset-backed securities | Asset-backed securities | 575 | | | 6 | | | (2) | | | 579 | |
| Corporate debt | Corporate debt | 49 | | | 2 | | | 0 | | | 51 | |
| Other securities/Sovereign debt | Other securities/Sovereign debt | 4 | | | 0 | | | 0 | | | 4 | |
| Total available-for-sale securities | Total available-for-sale securities | $ | 14,063 | | | $ | 137 | | | $ | (51) | | | $ | 14,149 | |
| | Held-to-maturity securities: | Held-to-maturity securities: | |
| Held-to-maturity securities: | |
| Held-to-maturity securities: | |
| Federal agencies: | Federal agencies: | |
| Federal agencies: | |
| Federal agencies: | |
| Residential CMO | |
| Residential CMO | |
| Residential CMO | Residential CMO | $ | 2,351 | | | $ | 33 | | | $ | (3) | | | $ | 2,381 | |
| Residential MBS | Residential MBS | 2,463 | | | 50 | | | 0 | | | 2,513 | |
| Commercial MBS | Commercial MBS | 3,959 | | | 34 | | | 0 | | | 3,993 | |
| Other agencies | Other agencies | 293 | | | 2 | | | 0 | | | 295 | |
| Total federal agency and other agency securities | Total federal agency and other agency securities | 9,066 | | | 119 | | | (3) | | | 9,182 | |
| Municipal securities | Municipal securities | 4 | | | 0 | | | 0 | | | 4 | |
| Total held-to-maturity securities | Total held-to-maturity securities | $ | 9,070 | | | $ | 119 | | | $ | (3) | | | $ | 9,186 | |
| | Other securities, at cost: | Other securities, at cost: | |
| Other securities, at cost: | |
| Other securities, at cost: | |
| Non-marketable equity securities: | |
| Non-marketable equity securities: | |
| Non-marketable equity securities: | Non-marketable equity securities: | |
| Federal Home Loan Bank stock | Federal Home Loan Bank stock | $ | 90 | | | $ | 0 | | | $ | 0 | | | $ | 90 | |
| Federal Home Loan Bank stock | |
| Federal Home Loan Bank stock | |
| Federal Reserve Bank stock | Federal Reserve Bank stock | 297 | | | 0 | | | 0 | | | 297 | |
| Other non-marketable equity securities | |
| Other securities, at fair value | Other securities, at fair value | |
| Mutual funds | |
| Mutual funds | |
| Mutual funds | Mutual funds | 53 | | | 0 | | | 0 | | | 53 | |
| Equity securities | Equity securities | 1 | | | 0 | | | 0 | | | 1 | |
| Total other securities | Total other securities | $ | 441 | | | $ | 0 | | | $ | 0 | | | $ | 441 | |
|
(2)Excluded from the amortized cost are portfolio level basis adjustments for securities designated in fair value hedges under the portfolio layer method. The basis adjustments totaled $849 million and represent a reduction to the amortized cost of the securities being hedged. The securities being hedged under the portfolio layer method are primarily Residential CMO and Residential MBS securities.
122109 Huntington Bancshares Incorporated
The following table provides the amortized cost and fair value of securities by contractual maturity at December 31, 2020 and 2019.maturity. Expected maturities may differ from contractual maturities as issuers may have the right to call or prepay obligations with or without incurring penalties.
| | 2020 | | 2019 |
| At December 31, | | | At December 31, |
| 2023 | | | 2023 | | 2022 |
| (dollar amounts in millions) | (dollar amounts in millions) | Amortized Cost | | Fair Value | | Amortized Cost | | Fair Value | (dollar amounts in millions) | Amortized Cost | | Fair Value | | Amortized Cost | | Fair Value |
| Available-for-sale securities: | Available-for-sale securities: | | | | | | | |
| Under 1 year | |
| Under 1 year | |
| Under 1 year | Under 1 year | $ | 308 | | | $ | 304 | | | $ | 231 | | | $ | 229 | |
| After 1 year through 5 years | After 1 year through 5 years | 1,145 | | | 1,154 | | | 1,196 | | | 1,189 | |
| After 5 years through 10 years | After 5 years through 10 years | 1,607 | | | 1,654 | | | 1,594 | | | 1,606 | |
| After 10 years | After 10 years | 13,115 | | | 13,373 | | | 11,042 | | | 11,125 | |
| Total available-for-sale securities | Total available-for-sale securities | $ | 16,175 | | | $ | 16,485 | | | $ | 14,063 | | | $ | 14,149 | |
| | Held-to-maturity securities: | Held-to-maturity securities: | |
| Held-to-maturity securities: | |
| Held-to-maturity securities: | |
| Under 1 year | |
| Under 1 year | |
| Under 1 year | Under 1 year | $ | 0 | | | $ | 0 | | | $ | 0 | | | $ | 0 | |
| After 1 year through 5 years | After 1 year through 5 years | 160 | | | 169 | | | 17 | | | 17 | |
| After 5 years through 10 years | After 5 years through 10 years | 131 | | | 138 | | | 300 | | | 305 | |
| After 10 years | After 10 years | 8,570 | | | 8,948 | | | 8,753 | | | 8,864 | |
| Total held-to-maturity securities | Total held-to-maturity securities | $ | 8,861 | | | $ | 9,255 | | | $ | 9,070 | | | $ | 9,186 | |
|
The following tables provide detail on investment securities with unrealized losses aggregated by investment category and the length of time the individual securities have been in a continuous loss position at December 31, 2020 and 2019:position.
| | Less than 12 Months | | Over 12 Months | | Total |
| Less than 12 Months | | | Less than 12 Months | | Over 12 Months | | Total |
| (dollar amounts in millions) | (dollar amounts in millions) | Fair
Value | | Gross Unrealized
Losses | | Fair
Value | | Gross Unrealized
Losses | | Fair
Value | | Gross Unrealized
Losses | (dollar amounts in millions) | Fair
Value | | Gross Unrealized
Losses | | Fair
Value | | Gross Unrealized
Losses | | Fair
Value | | Gross Unrealized
Losses |
| December 31, 2020 | | | | | | | | | | | |
| At December 31, 2023 | |
| Available-for-sale securities: | |
| Available-for-sale securities: | |
| Available-for-sale securities: | Available-for-sale securities: | |
| Federal agencies: | Federal agencies: | |
| Federal agencies: | |
| Federal agencies: | |
| Residential CMO | |
| Residential CMO | |
| Residential CMO | Residential CMO | $ | 302 | | | $ | (5) | | | $ | 0 | | | $ | 0 | | | $ | 302 | | | $ | (5) | |
| Residential MBS | Residential MBS | 1,633 | | | (5) | | | 0 | | | 0 | | | 1,633 | | | (5) | |
| Commercial MBS | Commercial MBS | 321 | | | (9) | | | 0 | | | 0 | | | 321 | | | (9) | |
| Other agencies | Other agencies | 0 | | | 0 | | | 0 | | | 0 | | | 0 | | | 0 | |
| Total federal agency and other agency securities | Total federal agency and other agency securities | 2,256 | | | (19) | | | 0 | | | 0 | | | 2,256 | | | (19) | |
| Municipal securities | Municipal securities | 110 | | | (3) | | | 490 | | | (12) | | | 600 | | | (15) | |
| | Private-label CMO | |
| Asset-backed securities | Asset-backed securities | 15 | | | 0 | | | 0 | | | 0 | | | 15 | | | 0 | |
| Corporate debt | Corporate debt | 51 | | | 0 | | | 0 | | | 0 | | | 51 | | | 0 | |
| | Total temporarily impaired available-for-sale securities | Total temporarily impaired available-for-sale securities | $ | 2,432 | | | $ | (22) | | | $ | 490 | | | $ | (12) | | | $ | 2,922 | | | $ | (34) | |
| Total temporarily impaired available-for-sale securities | |
| Total temporarily impaired available-for-sale securities | |
| | Held-to-maturity securities: | |
| Held-to-maturity securities: | |
| Held-to-maturity securities: | |
| Federal agencies: | |
| Federal agencies: | |
| Federal agencies: | |
| Residential CMO | |
| Residential CMO | |
| Residential CMO | |
| Residential MBS | |
| Commercial MBS | |
| Other agencies | |
| Total federal agency and other agency securities | |
| | Total temporarily impaired held-to-maturity securities | |
| Total temporarily impaired held-to-maturity securities | |
| Total temporarily impaired held-to-maturity securities | |
20202023 Form 10-K 123110
| | Less than 12 Months | | Over 12 Months | | Total |
| Less than 12 Months | | | Less than 12 Months | | Over 12 Months | | Total |
| (dollar amounts in millions) | (dollar amounts in millions) | Fair
Value | | Gross Unrealized
Losses | | Fair
Value | | Gross Unrealized
Losses | | Fair
Value | | Gross Unrealized
Losses | (dollar amounts in millions) | Fair
Value | | Gross Unrealized
Losses | | Fair
Value | | Gross Unrealized
Losses | | Fair
Value | | Gross Unrealized
Losses |
| December 31, 2019 | | | | | | | | | | | |
| At December 31, 2022 | |
| Available-for-sale securities: | |
| Available-for-sale securities: | |
| Available-for-sale securities: | Available-for-sale securities: | |
| Federal agencies: | Federal agencies: | |
| Federal agencies: | |
| Federal agencies: | |
| Residential CMO | |
| Residential CMO | |
| Residential CMO | Residential CMO | $ | 1,206 | | | $ | (10) | | | $ | 519 | | | $ | (8) | | | $ | 1,725 | | | $ | (18) | |
| Residential MBS | Residential MBS | 1,169 | | | (3) | | | 9 | | | 0 | | | 1,178 | | | (3) | |
| Commercial MBS | Commercial MBS | 472 | | | (2) | | | 272 | | | (2) | | | 744 | | | (4) | |
| Other agencies | Other agencies | 86 | | | (1) | | | 0 | | | 0 | | | 86 | | | (1) | |
| Total federal agency and other agency securities | Total federal agency and other agency securities | 2,933 | | | (16) | | | 800 | | | (10) | | | 3,733 | | | (26) | |
| Municipal securities | Municipal securities | 273 | | | (4) | | | 1,204 | | | (19) | | | 1,477 | | | (23) | |
| | Private-label CMO | |
| Asset-backed securities | Asset-backed securities | 116 | | | (1) | | | 37 | | | (1) | | | 153 | | | (2) | |
| Corporate debt | Corporate debt | 1 | | | 0 | | | 0 | | | 0 | | | 1 | | | 0 | |
| | Total temporarily impaired available-for-sale securities | Total temporarily impaired available-for-sale securities | $ | 3,323 | | | $ | (21) | | | $ | 2,041 | | | $ | (30) | | | $ | 5,364 | | | $ | (51) | |
| Total temporarily impaired available-for-sale securities | |
| Total temporarily impaired available-for-sale securities | |
| | Held-to-maturity securities: | Held-to-maturity securities: | |
| Held-to-maturity securities: | |
| Held-to-maturity securities: | |
| Federal agencies: | Federal agencies: | |
| Federal agencies: | |
| Federal agencies: | |
| Residential CMO | |
| Residential CMO | |
| Residential CMO | Residential CMO | $ | 218 | | | $ | (1) | | | $ | 112 | | | $ | (2) | | | $ | 330 | | | $ | (3) | |
| Residential MBS | Residential MBS | 317 | | | 0 | | | 0 | | | 0 | | | 317 | | | 0 | |
| Commercial MBS | Commercial MBS | 81 | | | 0 | | | 0 | | | 0 | | | 81 | | | 0 | |
| Other agencies | Other agencies | 58 | | | 0 | | | 0 | | | 0 | | | 58 | | | 0 | |
| Total federal agency and other agency securities | Total federal agency and other agency securities | 674 | | | (1) | | | 112 | | | (2) | | | 786 | | | (3) | |
| Municipal securities | 4 | | | 0 | | | 0 | | | 0 | | | 4 | | | 0 | |
| | Total temporarily impaired held-to-maturity securities | Total temporarily impaired held-to-maturity securities | $ | 678 | | | $ | (1) | | | $ | 112 | | | $ | (2) | | | $ | 790 | | | $ | (3) | |
| Total temporarily impaired held-to-maturity securities | |
| Total temporarily impaired held-to-maturity securities | |
During 2020,2022, Huntington transferred a total of $2.8$4.2 billion of securities from the AFS portfolio to the HTM portfolio. At the time of the transfers, AOCI included a combined total of $21$58 million of net unrealized gainslosses attributed to these securities. This gainThe net unrealized loss will be amortized into interest income over the remaining life of the securities.
At December 31, 20202023 and December 31, 2019,2022, the carrying value of investment securities pledged to secure public and trust deposits, trading account liabilities, U.S. Treasury demand notes, security repurchase agreements and to support borrowing capacity totaled $14.4$35.1 billion and $3.8$26.9 billion, respectively. There were no securities of a single issuer, which were not governmental or government-sponsored, that exceeded 10% of shareholders’ equity at either December 31, 20202023 or December 31, 2019.2022. At December 31, 2020,2023, all HTM debt securities are considered AAA rated.comprised of securities issued by government sponsored entities or are explicitly guaranteed by the U.S. government. In addition, there were no HTM debt securities considered past due at December 31, 2020.
AFS Securities Impairment/HTM Securities Allowance for Credit Losses2023.
Based on an evaluation of available information including security type, counterparty credit quality, past events, current conditions, and reasonable and supportable forecasts that are relevant to collectability of cash flows, as of December 31, 2023, Huntington has concluded that it expects to receive all contractual cash flows from each security held in its AFS and HTM debt securities portfolio. As such,There was no allowance or impairment is recorded with respectrelated to securities as of December 31, 2020.2023 or December 31, 2022.
124111 Huntington Bancshares Incorporated
5. LOANS /AND LEASES
Loans and leases which Huntington has the intent and ability to hold for the foreseeable future, or until maturity or payoff, are classified in the Consolidated Balance Sheets as loans and leases. The total balance of unamortized premiums, discounts, fees, and costs, recognized as part of loans and leases, was a net premium of $491 million and $525 million at December 31, 2020 and 2019, respectively.
Loan and Lease Portfolio Composition
The following table provides a detailed listing of Huntington’s loan and lease portfolio at December 31, 2020portfolio.
| | | | | | | | | | | |
| At December 31, |
| (dollar amounts in millions) | 2023 | | 2022 |
| | | |
| | | |
| | | |
| | | |
| | | |
| | | |
| | | |
| | | |
| | | |
| | | |
| | | |
| | | |
| | | |
| | | |
| | | |
| | | |
| | | |
| | | |
| Commercial loan and lease portfolio: | | | |
| Commercial and industrial | $ | 50,657 | | | $ | 48,121 | |
| Commercial real estate | 12,422 | | | 13,640 | |
| Lease financing | 5,228 | | | 5,252 | |
| Total commercial loan and lease portfolio | 68,307 | | | 67,013 | |
| Consumer loan portfolio: | | | |
| Residential mortgage | 23,720 | | | 22,226 | |
| Automobile | 12,482 | | | 13,154 | |
| Home equity | 10,113 | | | 10,375 | |
| RV and marine | 5,899 | | | 5,376 | |
| Other consumer | 1,461 | | | 1,379 | |
| Total consumer loan portfolio | 53,675 | | | 52,510 | |
| Total loans and leases (1)(2) | 121,982 | | | 119,523 | |
| Allowance for loan and lease losses | (2,255) | | | (2,121) | |
| Net loans and leases | $ | 119,727 | | | $ | 117,402 | |
(1)Loans and December 31, 2019.
| | | | | | | | | | | |
| At December 31, |
| (dollar amounts in millions) | 2020 | | 2019 |
| | | |
| | | |
| | | |
| | | |
| | | |
| | | |
| | | |
| | | |
| | | |
| | | |
| | | |
| | | |
| | | |
| | | |
| | | |
| | | |
| | | |
| | | |
| Loans and leases: | | | |
| Commercial and industrial | $ | 35,373 | | | $ | 30,664 | |
| Commercial real estate | 7,199 | | | 6,674 | |
| Automobile | 12,778 | | | 12,797 | |
| Home equity | 8,894 | | | 9,093 | |
| Residential mortgage | 12,141 | | | 11,376 | |
| RV and marine | 4,190 | | | 3,563 | |
| Other consumer | 1,033 | | | 1,237 | |
| Total Loans and leases | 81,608 | | | 75,404 | |
| Allowance for loan and lease losses | (1,814) | | | (783) | |
| Net loans and leases | $ | 79,794 | | | $ | 74,621 | |
Equipment Leases
Huntington leases equipment to customers, and substantially all such arrangements are classified as either sales-type or direct financing leases, which are included in C&I loans. These leases are reported at the aggregate of lease payments receivableprincipal amount outstanding including unamortized purchase premiums and estimated residual values, net ofdiscounts, unearned and deferred income, and any initialnet direct fees and costs incurred to originateassociated with originating and acquiring loans and leases. The aggregate amount of these leases. Renewal optionsloan and lease adjustments was a net (discount) premium of $(323) million and $3 million at December 31, 2023 and 2022, respectively.
(2)The total amount of accrued interest recorded for these loans and leases are at December 31, 2023, was $333 million and $220 million of commercial and consumer loan and lease portfolios, respectively, and at December 31, 2022, was $274 million and $186 million of commercial and consumer loan and lease portfolios, respectively. Accrued interest is presented in accrued income and other receivables within the option of the lessee, and are not included in the measurement of lease receivables as they are not considered reasonably certain of exercise. Purchase options are typically at fair value, and as such those options are not considered in the measurement of lease receivables or in lease classification.
For leased equipment, the residual component of a direct financing lease represents the estimated fair value of the leased equipment at the end of the lease term. Huntington uses industry data, historical experience, and independent appraisals to establish these residual value estimates. Additional information regarding product life cycle, product upgrades, as well as insight into competing products are obtained through relationships with industry contacts and are factored into residual value estimates where applicable. Upon expiration of a lease, residual assets are remarketed, resulting in an extension of the lease by the lessee, a lease to a new customer, or purchase of the residual asset by the lessee or another party. Huntington also purchases insurance guaranteeing the value of certain residual assets.Condensed Consolidated Balance Sheets.
Huntington assesses net investments in leases (including residual values)revised its process for impairmentassessing and recognizes any impairment losses in accordancemonitoring the risk and performance of non-real estate secured commercial loans, primarily loans to REITs, during the 2023 second quarter. These loans were reclassified from commercial real estate to the commercial and industrial loan category to align reporting with this process
revision. All prior period results have been adjusted to conform to the impairment guidance for financial instruments. As such, net investments in leases may be reduced by an allowance for credit losses, with changes recognized as provision expense.current presentation.
The following table presents net investments in lease financing receivables by category at December 31, 2020 and 2019:category.
| | | | At December 31, | | At December 31, |
| (dollar amounts in millions) | (dollar amounts in millions) | 2020 | | 2019 | (dollar amounts in millions) | 2023 | | 2022 |
| Commercial and industrial: | | | |
| | Lease payments receivable | |
| Lease payments receivable | |
| Lease payments receivable | Lease payments receivable | $ | 1,737 | | | $ | 1,841 | |
| Estimated residual value of leased assets | Estimated residual value of leased assets | 664 | | | 728 | |
| Gross investment in commercial and industrial lease financing receivables | 2,401 | | | 2,569 | |
| Gross investment in lease financing receivables | |
| Deferred origination costs | Deferred origination costs | 21 | | | 19 | |
| Deferred fees | (200) | | | (249) | |
| Total net investment in commercial and industrial lease financing receivables | $ | 2,222 | | | $ | 2,339 | |
| Deferred fees, unearned income and other | |
| Total lease financing receivables | |
The carrying value of residual values guaranteed was $93$478 million and $466 million as of December 31, 2020.2023 and December 31, 2022, respectively. The future lease rental payments due from customers on sales-type and direct financing leases at December 31, 2020,2023, totaled $1.7$5.0 billion and were due as follows: $0.6 billion in 2021, $0.4 billion in 2022, $0.3 billion in 2023, $0.2 billion$810 million in 2024, $0.1 billion$749 million in 2025, $704 million in 2026, $752 million in 2027, $766 million in 2028, and $0.1$1.2 billion thereafter. Interest income recognized for these types of leases was $106$287 million, $108$249 million, and $100$193 million for the years 2020, 2019,2023, 2022, and 20182021, respectively.
Nonaccrual and Past Due Loans and Leases
The following table presents NALs by loan class at December 31, 2020 and 2019:class.
| | December 31, 2020 | | December 31, 2019 |
| At December 31, 2023 | | | At December 31, 2023 | | At December 31, 2022 |
| (dollar amounts in millions) | (dollar amounts in millions) | Nonaccrual loans with no ACL | Total nonaccrual loans | | Nonaccrual loans with no ACL | Total nonaccrual loans | (dollar amounts in millions) | Nonaccrual loans and leases with no ACL | | Total nonaccrual loans and leases | | Nonaccrual loans and leases with no ACL | | Total nonaccrual loans and leases |
| Commercial and industrial | Commercial and industrial | $ | 69 | | $ | 353 | | | $ | 109 | | $ | 323 | |
| Commercial real estate | Commercial real estate | 8 | | 15 | | | 2 | | 10 | |
| Lease financing | |
| Residential mortgage | |
| Automobile | Automobile | 0 | | 4 | | | 0 | | 4 | |
| Home equity | 0 | | 70 | | | 0 | | 59 | |
| Residential mortgage | 0 | | 88 | | | 0 | | 71 | |
| Home Equity | |
| RV and marine | RV and marine | 0 | | 2 | | | 0 | | 1 | |
| Other consumer | 0 | | 0 | | | 0 | | 0 | |
| Total nonaccrual loans | $ | 77 | | $ | 532 | | | $ | 111 | | $ | 468 | |
| | Total nonaccrual loans and leases | |
| Total nonaccrual loans and leases | |
| Total nonaccrual loans and leases | |
The amount of interest that would have been recorded under the original terms for total NAL loans was $33 million, $26 million, and $22 million for 2020, 2019, and 2018, respectively. The total amount of interest recorded to interest income for NAL loans was $6$21 million, $9$23 million, and $12$10 million in 2020, 2019,2023, 2022, and 2018,2021, respectively.
The following table presentstables present an aging analysis of loans and leases, including past due loans and leases, by loan class at December 31, 2020 and 2019:class.
| | December 31, 2020 |
| Past Due (1)(2) | | | | Loans Accounted for Under FVO | | Total Loans
and Leases | | 90 or
more days
past due
and accruing | |
| At December 31, 2023 | |
| At December 31, 2023 | |
| At December 31, 2023 | |
| Past Due (1) | |
| (dollar amounts in millions) | |
| (dollar amounts in millions) | |
| (dollar amounts in millions) | (dollar amounts in millions) | 30-59
Days | | 60-89
Days | | 90 or
more days | Total | | Current | | | Loans Accounted for Under FVO | | Total Loans
and Leases | | 90 or
more days
past due
and accruing |
| Commercial and industrial | Commercial and industrial | $ | 60 | | | $ | 38 | | | $ | 95 | | | $ | 193 | | | $ | 35,180 | | | | (3) |
| Commercial and industrial | |
| Commercial and industrial | | $ | 90 | | | $ | 48 | | | $ | 90 | | | $ | 228 | | | $ | 50,429 | | | | | $ | — | | | $ | 50,657 | | | $ | 1 | | (2) |
| Commercial real estate | Commercial real estate | 0 | | | 1 | | | 11 | | | 12 | | | 7,187 | | | | 0 | | | 7,199 | | | 0 | | |
| Lease financing | |
| Lease financing | |
| Lease financing | |
| Residential mortgage | |
| Residential mortgage | |
| Residential mortgage | | 205 | | | 88 | | | 193 | | | 486 | | | 23,060 | | | | | 174 | | | 23,720 | | | 146 | | (3) |
| Automobile | Automobile | 84 | | | 22 | | | 12 | | | 118 | | | 12,660 | | | | 0 | | | 12,778 | | | 9 | | |
| Home equity | Home equity | 35 | | | 15 | | | 61 | | | 111 | | | 8,782 | | | | 1 | | | 8,894 | | | 14 | | |
| Residential mortgage | 114 | | | 38 | | | 194 | | | 346 | | | 11,702 | | | | 93 | | | 12,141 | | | 132 | | (4) |
| Home equity | |
| Home equity | |
| RV and marine | |
| RV and marine | |
| RV and marine | RV and marine | 17 | | | 3 | | | 3 | | | 23 | | | 4,167 | | | | 0 | | | 4,190 | | | 3 | | |
| Other consumer | Other consumer | 9 | | | 4 | | | 3 | | | 16 | | | 1,017 | | | | 0 | | | 1,033 | | | 3 | | |
| Other consumer | |
| Other consumer | |
| Total loans and leases | Total loans and leases | $ | 319 | | | $ | 121 | | | $ | 379 | | | $ | 819 | | | $ | 80,695 | | | | $ | 94 | | | $ | 81,608 | | | $ | 171 | | |
| Total loans and leases | |
| Total loans and leases | |
126 Huntington Bancshares Incorporated
| | December 31, 2019 |
| Past Due (1) | | | Loans Accounted for Under FVO | | Total Loans
and Leases | | 90 or
more days
past due
and accruing | |
| At December 31, 2022 | |
| At December 31, 2022 | |
| At December 31, 2022 | |
| Past Due (1) | |
| (dollar amounts in millions) | |
| (dollar amounts in millions) | |
| (dollar amounts in millions) | (dollar amounts in millions) | 30-59
Days | | 60-89
Days | | 90 or
more days | Total | | Current | | | Loans Accounted for Under FVO | | Total Loans
and Leases | | 90 or
more days
past due
and accruing | |
| Commercial and industrial | Commercial and industrial | $ | 65 | | | $ | 31 | | | $ | 69 | | | $ | 165 | | | $ | 30,499 | | | | | (3) |
| Commercial and industrial | |
| Commercial and industrial | | $ | 53 | | | $ | 19 | | | $ | 108 | | | $ | 180 | | | $ | 47,941 | | | | | $ | — | | | $ | 48,121 | | | $ | 23 | | (2) |
| Commercial real estate | Commercial real estate | 3 | | | 1 | | | 7 | | | 11 | | | 6,663 | | | | 0 | | | 6,674 | | | 0 | | |
| Lease financing | |
| Lease financing | |
| Lease financing | |
| Residential mortgage | |
| Residential mortgage | |
| Residential mortgage | | 246 | | | 69 | | | 199 | | | 514 | | | 21,528 | | | | | 184 | | | 22,226 | | | 146 | | (3) |
| Automobile | Automobile | 95 | | | 19 | | | 11 | | | 125 | | | 12,672 | | | | 0 | | | 12,797 | | | 8 | | |
| Home equity | Home equity | 50 | | | 19 | | | 51 | | | 120 | | | 8,972 | | | | 1 | | | 9,093 | | | 14 | | |
| Residential mortgage | 103 | | | 49 | | | 170 | | | 322 | | | 10,974 | | | | 80 | | | 11,376 | | | 129 | | (4) |
| Home equity | |
| Home equity | |
| RV and marine | |
| RV and marine | |
| RV and marine | RV and marine | 13 | | | 4 | | | 2 | | | 19 | | | 3,544 | | | | 0 | | | 3,563 | | | 2 | | |
| Other consumer | Other consumer | 13 | | | 6 | | | 7 | | | 26 | | | 1,211 | | | | 0 | | | 1,237 | | | 7 | | |
| Other consumer | |
| Other consumer | |
| Total loans and leases | Total loans and leases | $ | 342 | | | $ | 129 | | | $ | 317 | | | $ | 788 | | | $ | 74,535 | | | | $ | 81 | | | $ | 75,404 | | | $ | 171 | | |
| Total loans and leases | |
| Total loans and leases | |
|
(1)NALs are included in this aging analysis based on the loan’s past due status.
(2)At December 31, 2020, the principal balance ofAmounts include SBA loans in payment deferral programs offered in response to the COVID-19 pandemic which are performing according to their modified terms are generally not considered delinquent.and leases.
(3)Amounts include Huntington Technology Finance administrative lease delinquencies.
(4)Amounts include mortgage loans insured by U.S. government agencies.
113 Huntington Bancshares Incorporated
Credit Quality Indicators
To facilitate the monitoring of credit quality for commercial loans, and for the purposes of determining an appropriate ACL level for these loans, Huntington utilizes the following internally defined categories of credit grades:
•Pass - Higher quality loans that do not fit any of the other categories described below.
•OLEM - The credit risk may be relatively minor yet represents a risk given certain specific circumstances. If the potential weaknesses are not monitored or mitigated, the loan may weaken or the collateral may be inadequate to protect Huntington’s position in the future. For these reasons, Huntington considers the loans to be potential problem loans.
•Substandard - Inadequately protected loans resulting from the borrower’s ability to repay, equity, and/or the collateral pledged to secure the loan. These loans have identified weaknesses that could hinder normal repayment or collection of the debt. It is likely Huntington will sustain some loss if any identified weaknesses are not mitigated.
•Doubtful - Loans that have all of the weaknesses inherent in those loans classified as Substandard, with the added elements of the full collection of the loan is improbable and that the possibility of loss is high.
Loans are generally assigned a category of “Pass” rating upon initial approval and subsequently updated as appropriate based on the borrower’s financial performance.
Commercial loans categorized as OLEM, Substandard, or Doubtful are considered Criticized loans. Commercial loans categorized as Substandard or Doubtful are both considered Classified loans.
For all classes within the consumer loan portfolios, loans are assigned pool level PD factors based on the FICO range within which the borrower’sborrower credit bureau score falls.scores are monitored as an indicator of credit quality. A credit bureau score is a credit score developed by FICO based on data provided by the credit bureaus. The credit bureau score is widely accepted as the standard measure of consumer credit risk used by lenders, regulators, rating agencies, and consumers. The higher the credit bureau score, the higher likelihood of repayment and therefore, an indicator of higher credit quality.
Huntington assesses the risk in the loan portfolio by utilizing numerous risk characteristics. The classifications described above, and also presented in the table below, represent one of those characteristics that are closely monitored in the overall credit risk management processes.
20202023 Form 10-K 127114
The following table presents each loantables present the amortized cost basis of loans and lease classleases by vintage and credit quality indicator at December 31, 2020:indicator.
| | As of December 31, 2020 |
| Term Loans Amortized Cost Basis by Origination Year | | Revolver Total at Amortized Cost Basis | | Revolver Total Converted to Term Loans | |
| | At December 31, 2023 | |
| | At December 31, 2023 | |
| | At December 31, 2023 | |
| | Term Loans Amortized Cost Basis by Origination Year | |
| (dollar amounts in millions) | |
| (dollar amounts in millions) | |
| (dollar amounts in millions) | (dollar amounts in millions) | | 2020 | | 2019 | | 2018 | | 2017 | | 2016 | | Prior | | Revolver Total at Amortized Cost Basis | | Revolver Total Converted to Term Loans | | Total (3) | | 2023 | | 2022 | | 2021 | | 2020 | | 2019 | | Prior | | | | Total |
| Commercial and industrial | Commercial and industrial | | | | | | | | | | | | | | |
| Credit Quality Indicator (1): | Credit Quality Indicator (1): | |
| Credit Quality Indicator (1): | |
| Credit Quality Indicator (1): | |
| Pass | |
| Pass | |
| Pass | Pass | | $ | 13,757 | | | $ | 4,525 | | | $ | 2,758 | | | $ | 1,347 | | | $ | 974 | | | $ | 916 | | | $ | 8,894 | | | $ | 2 | | | $ | 33,173 | |
| OLEM | OLEM | | 421 | | | 116 | | | 69 | | | 30 | | | 33 | | | 22 | | | 124 | | | 0 | | | 815 | |
| Substandard | Substandard | | 196 | | | 144 | | | 188 | | | 224 | | | 46 | | | 159 | | | 423 | | | 0 | | | 1,380 | |
| Doubtful | | 2 | | | 0 | | | 1 | | | 0 | | | 0 | | | 1 | | | 1 | | | 0 | | | 5 | |
| | Total Commercial and industrial | Total Commercial and industrial | | $ | 14,376 | | | $ | 4,785 | | | $ | 3,016 | | | $ | 1,601 | | | $ | 1,053 | | | $ | 1,098 | | | $ | 9,442 | | | $ | 2 | | | $ | 35,373 | |
| | Total Commercial and industrial | |
| Total Commercial and industrial | |
| Commercial real estate | Commercial real estate | |
| Credit Quality Indicator (1): | Credit Quality Indicator (1): | |
| Credit Quality Indicator (1): | |
| Credit Quality Indicator (1): | |
| Pass | |
| Pass | |
| Pass | Pass | | $ | 1,742 | | | $ | 1,610 | | | $ | 1,122 | | | $ | 507 | | | $ | 507 | | | $ | 539 | | | $ | 633 | | | $ | 0 | | | $ | 6,660 | |
| OLEM | OLEM | | 94 | | | 78 | | | 63 | | | 37 | | | 28 | | | 14 | | | 4 | | | 0 | | | 318 | |
| Substandard | Substandard | | 27 | | | 46 | | | 10 | | | 29 | | | 58 | | | 14 | | | 36 | | | 0 | | | 220 | |
| Doubtful | | 0 | | | 0 | | | 0 | | | 0 | | | 0 | | | 1 | | | 0 | | | 0 | | | 1 | |
| | Total Commercial real estate | Total Commercial real estate | | $ | 1,863 | | | $ | 1,734 | | | $ | 1,195 | | | $ | 573 | | | $ | 593 | | | $ | 568 | | | $ | 673 | | | $ | 0 | | | $ | 7,199 | |
| Total Commercial real estate | |
| Total Commercial real estate | |
| Lease financing | |
| Credit Quality Indicator (1): | |
| Credit Quality Indicator (1): | |
| Credit Quality Indicator (1): | |
| Pass | |
| Pass | |
| Pass | |
| OLEM | |
| Substandard | |
| | Total Lease financing | |
| Total Lease financing | |
| Total Lease financing | |
| Residential mortgage | |
| Credit Quality Indicator (2): | |
| Credit Quality Indicator (2): | |
| Credit Quality Indicator (2): | |
| 750+ | |
| 750+ | |
| 750+ | |
| 650-749 | |
| <650 | |
| | Total Residential mortgage | |
| Total Residential mortgage | |
| Total Residential mortgage | |
| Automobile | Automobile | |
| Credit Quality Indicator (2): | Credit Quality Indicator (2): | |
| Credit Quality Indicator (2): | |
| Credit Quality Indicator (2): | |
| 750+ | |
| 750+ | |
| 750+ | 750+ | | $ | 2,670 | | | $ | 2,013 | | | $ | 1,144 | | | $ | 742 | | | $ | 317 | | | $ | 81 | | | $ | 0 | | | $ | 0 | | | $ | 6,967 | |
| 650-749 | 650-749 | | 1,965 | | | 1,343 | | | 755 | | | 386 | | | 175 | | | 52 | | | 0 | | | 0 | | | 4,676 | |
| <650 | <650 | | 312 | | | 301 | | | 244 | | | 157 | | | 84 | | | 37 | | | 0 | | | 0 | | | 1,135 | |
| | Total Automobile | Total Automobile | | $ | 4,947 | | | $ | 3,657 | | | $ | 2,143 | | | $ | 1,285 | | | $ | 576 | | | $ | 170 | | | $ | 0 | | | $ | 0 | | | $ | 12,778 | |
| | Home equity | |
| Total Automobile | |
| Total Automobile | |
| Home Equity | |
| Credit Quality Indicator (2): | Credit Quality Indicator (2): | |
| Credit Quality Indicator (2): | |
| Credit Quality Indicator (2): | |
| 750+ | |
| 750+ | |
| 750+ | 750+ | | $ | 793 | | | $ | 26 | | | $ | 26 | | | $ | 32 | | | $ | 89 | | | $ | 451 | | | $ | 4,373 | | | $ | 192 | | | $ | 5,982 | |
| 650-749 | 650-749 | | 147 | | | 9 | | | 8 | | | 11 | | | 27 | | | 157 | | | 1,906 | | | 181 | | | 2,446 | |
| <650 | <650 | | 1 | | | 1 | | | 1 | | | 1 | | | 6 | | | 70 | | | 286 | | | 99 | | | 465 | |
| | Total Home equity | Total Home equity | | $ | 941 | | | $ | 36 | | | $ | 35 | | | $ | 44 | | | $ | 122 | | | $ | 678 | | | $ | 6,565 | | | $ | 472 | | | $ | 8,893 | |
| | Residential mortgage | |
| Total Home equity | |
| Total Home equity | |
| RV and marine | |
| Credit Quality Indicator (2): | |
| Credit Quality Indicator (2): | |
| Credit Quality Indicator (2): | Credit Quality Indicator (2): | |
| 750+ | 750+ | | $ | 3,269 | | | $ | 1,370 | | | $ | 891 | | | $ | 1,064 | | | $ | 762 | | | $ | 1,243 | | | $ | 1 | | | $ | 0 | | | $ | 8,600 | |
| 650-749 | | 991 | | | 435 | | | 307 | | | 278 | | | 171 | | | 495 | | | 0 | | | 0 | | | 2,677 | |
| <650 | | 34 | | | 89 | | | 111 | | | 108 | | | 81 | | | 348 | | | 0 | | | 0 | | | 771 | |
| | Total Residential mortgage | | $ | 4,294 | | | $ | 1,894 | | | $ | 1,309 | | | $ | 1,450 | | | $ | 1,014 | | | $ | 2,086 | | | $ | 1 | | | $ | 0 | | | $ | 12,048 | |
| | RV and marine | |
| Credit Quality Indicator (2): | |
| 750+ | |
| 750+ | 750+ | | $ | 1,136 | | | $ | 525 | | | $ | 589 | | | $ | 337 | | | $ | 153 | | | $ | 254 | | | $ | 0 | | | $ | 0 | | | $ | 2,994 | |
| 650-749 | 650-749 | | 348 | | | 215 | | | 201 | | | 136 | | | 64 | | | 129 | | | 0 | | | 0 | | | 1,093 | |
| <650 | <650 | | 4 | | | 15 | | | 21 | | | 22 | | | 12 | | | 29 | | | 0 | | | 0 | | | 103 | |
| | Total RV and marine | Total RV and marine | | $ | 1,488 | | | $ | 755 | | | $ | 811 | | | $ | 495 | | | $ | 229 | | | $ | 412 | | | $ | 0 | | | $ | 0 | | | $ | 4,190 | |
| | Total RV and marine | |
| Total RV and marine | |
| Other consumer | Other consumer | |
| Credit Quality Indicator (2): | Credit Quality Indicator (2): | |
| Credit Quality Indicator (2): | |
| Credit Quality Indicator (2): | |
| 750+ | |
| 750+ | |
| 750+ | 750+ | | $ | 69 | | | $ | 58 | | | $ | 26 | | | $ | 8 | | | $ | 4 | | | $ | 14 | | | $ | 340 | | | $ | 2 | | | $ | 521 | |
| 650-749 | 650-749 | | 36 | | | 56 | | | 17 | | | 5 | | | 2 | | | 3 | | | 294 | | | 30 | | | 443 | |
| <650 | <650 | | 2 | | | 8 | | | 3 | | | 1 | | | 0 | | | 1 | | | 26 | | | 28 | | | 69 | |
| | Total Other consumer | Total Other consumer | | $ | 107 | | | $ | 122 | | | $ | 46 | | | $ | 14 | | | $ | 6 | | | $ | 18 | | | $ | 660 | | | $ | 60 | | | $ | 1,033 | |
| Total Other consumer | |
| Total Other consumer | |
115 Huntington Bancshares Incorporated
| | | | | | | | | | | | | | | | | | | | | | | | | | | | | | | | | | | | | | | | | | | | | | | | | | | | | | |
| | At December 31, 2022 |
| | Term Loans Amortized Cost Basis by Origination Year | | Revolver Total at Amortized Cost Basis | | Revolver Total Converted to Term Loans | | |
| (dollar amounts in millions) | | 2022 | | 2021 | | 2020 | | 2019 | | 2018 | | Prior | | | | Total |
| Commercial and industrial | | | | | | | | | | | | | | | | | | |
| Credit Quality Indicator (1): | | | | | | | | | | | | | | | | | | |
| Pass | | $ | 18,092 | | | $ | 6,742 | | | $ | 3,332 | | | $ | 2,107 | | | $ | 1,156 | | | $ | 1,186 | | | $ | 13,060 | | | $ | 3 | | | $ | 45,678 | |
| OLEM | | 108 | | | 139 | | | 72 | | | 21 | | | 49 | | | 26 | | | 113 | | | — | | | 528 | |
| Substandard | | 368 | | | 183 | | | 203 | | | 212 | | | 142 | | | 256 | | | 550 | | | — | | | 1,914 | |
| Doubtful | | — | | | — | | | — | | | — | | | — | | | 1 | | | — | | | — | | | 1 | |
| Total Commercial and industrial | | $ | 18,568 | | | $ | 7,064 | | | $ | 3,607 | | | $ | 2,340 | | | $ | 1,347 | | | $ | 1,469 | | | $ | 13,723 | | | $ | 3 | | | $ | 48,121 | |
| Commercial real estate | | | | | | | | | | | | | | | | | | |
| Credit Quality Indicator (1): | | | | | | | | | | | | | | | | | | |
| Pass | | $ | 4,022 | | | $ | 3,115 | | | $ | 1,562 | | | $ | 1,662 | | | $ | 829 | | | $ | 1,020 | | | $ | 519 | | | $ | — | | | $ | 12,729 | |
| OLEM | | 61 | | | 53 | | | 1 | | | 43 | | | 6 | | | 9 | | | — | | | — | | | 173 | |
| Substandard | | 231 | | | 116 | | | 92 | | | 74 | | | 84 | | | 140 | | | 1 | | | — | | | 738 | |
| | | | | | | | | | | | | | | | | | |
| Total Commercial real estate | | $ | 4,314 | | | $ | 3,284 | | | $ | 1,655 | | | $ | 1,779 | | | $ | 919 | | | $ | 1,169 | | | $ | 520 | | | $ | — | | | $ | 13,640 | |
| Lease financing | | | | | | | | | | | | | | | | | | |
| Credit Quality Indicator (1): | | | | | | | | | | | | | | | | | | |
| Pass | | $ | 1,930 | | | $ | 1,291 | | | $ | 952 | | | $ | 447 | | | $ | 186 | | | $ | 143 | | | $ | — | | | $ | — | | | $ | 4,949 | |
| OLEM | | 32 | | | 9 | | | 15 | | | 18 | | | 6 | | | 3 | | | — | | | — | | | 83 | |
| Substandard | | 65 | | | 37 | | | 74 | | | 24 | | | 9 | | | 11 | | | — | | | — | | | 220 | |
| | | | | | | | | | | | | | | | | | |
| Total Lease financing | | $ | 2,027 | | | $ | 1,337 | | | $ | 1,041 | | | $ | 489 | | | $ | 201 | | | $ | 157 | | | $ | — | | | $ | — | | | $ | 5,252 | |
| Residential mortgage | | | | | | | | | | | | | | | | | | |
| Credit Quality Indicator (2): | | | | | | | | | | | | | | | | | | |
| 750+ | | $ | 3,666 | | | $ | 6,274 | | | $ | 3,566 | | | $ | 846 | | | $ | 469 | | | $ | 2,070 | | | $ | — | | | $ | — | | | $ | 16,891 | |
| 650-749 | | 1,394 | | | 1,172 | | | 617 | | | 211 | | | 137 | | | 777 | | | — | | | — | | | 4,308 | |
| <650 | | 49 | | | 68 | | | 61 | | | 95 | | | 90 | | | 480 | | | — | | | — | | | 843 | |
| | | | | | | | | | | | | | | | | | |
| Total Residential mortgage | | $ | 5,109 | | | $ | 7,514 | | | $ | 4,244 | | | $ | 1,152 | | | $ | 696 | | | $ | 3,327 | | | $ | — | | | $ | — | | | $ | 22,042 | |
| Automobile | | | | | | | | | | | | | | | | | | |
| Credit Quality Indicator (2): | | | | | | | | | | | | | | | | | | |
| 750+ | | $ | 2,770 | | | $ | 2,212 | | | $ | 1,243 | | | $ | 777 | | | $ | 289 | | | $ | 98 | | | $ | — | | | $ | — | | | $ | 7,389 | |
| 650-749 | | 1,944 | | | 1,508 | | | 683 | | | 367 | | | 162 | | | 52 | | | — | | | — | | | 4,716 | |
| <650 | | 307 | | | 352 | | | 173 | | | 115 | | | 67 | | | 35 | | | — | | | — | | | 1,049 | |
| | | | | | | | | | | | | | | | | | |
| Total Automobile | | $ | 5,021 | | | $ | 4,072 | | | $ | 2,099 | | | $ | 1,259 | | | $ | 518 | | | $ | 185 | | | $ | — | | | $ | — | | | $ | 13,154 | |
| Home equity | | | | | | | | | | | | | | | | | | |
| Credit Quality Indicator (2): | | | | | | | | | | | | | | | | | | |
| 750+ | | $ | 463 | | | $ | 573 | | | $ | 611 | | | $ | 23 | | | $ | 20 | | | $ | 301 | | | $ | 4,787 | | | $ | 252 | | | $ | 7,030 | |
| 650-749 | | 131 | | | 88 | | | 68 | | | 9 | | | 8 | | | 122 | | | 2,129 | | | 261 | | | 2,816 | |
| <650 | | 3 | | | 3 | | | 3 | | | 2 | | | 2 | | | 51 | | | 335 | | | 129 | | | 528 | |
| | | | | | | | | | | | | | | | | | |
| Total Home equity | | $ | 597 | | | $ | 664 | | | $ | 682 | | | $ | 34 | | | $ | 30 | | | $ | 474 | | | $ | 7,251 | | | $ | 642 | | | $ | 10,374 | |
| RV and marine | | | | | | | | | | | | | | | | | | |
| Credit Quality Indicator (2): | | | | | | | | | | | | | | | | | | |
| 750+ | | $ | 1,148 | | | $ | 1,031 | | | $ | 731 | | | $ | 361 | | | $ | 354 | | | $ | 438 | | | $ | — | | | $ | — | | | $ | 4,063 | |
| 650-749 | | 290 | | | 315 | | | 200 | | | 118 | | | 113 | | | 169 | | | — | | | — | | | 1,205 | |
| <650 | | 5 | | | 18 | | | 15 | | | 17 | | | 17 | | | 36 | | | — | | | — | | | 108 | |
| | | | | | | | | | | | | | | | | | |
| Total RV and marine | | $ | 1,443 | | | $ | 1,364 | | | $ | 946 | | | $ | 496 | | | $ | 484 | | | $ | 643 | | | $ | — | | | $ | — | | | $ | 5,376 | |
| Other consumer | | | | | | | | | | | | | | | | | | |
| Credit Quality Indicator (2): | | | | | | | | | | | | | | | | | | |
| 750+ | | $ | 207 | | | $ | 64 | | | $ | 35 | | | $ | 34 | | | $ | 13 | | | $ | 52 | | | $ | 393 | | | $ | 3 | | | $ | 801 | |
| 650-749 | | 71 | | | 30 | | | 12 | | | 15 | | | 4 | | | 14 | | | 355 | | | 16 | | | 517 | |
| <650 | | 3 | | | 3 | | | 2 | | | 3 | | | 1 | | | 2 | | | 33 | | | 14 | | | 61 | |
| | | | | | | | | | | | | | | | | | |
| Total Other consumer | | $ | 281 | | | $ | 97 | | | $ | 49 | | | $ | 52 | | | $ | 18 | | | $ | 68 | | | $ | 781 | | | $ | 33 | | | $ | 1,379 | |
(1)Consistent with the credit quality disclosures, indicators for the Commercial portfolio are based on internally defined categories of credit grades which are generally refreshed at least semi-annually.grades.
(2)Consistent with the credit quality disclosures, indicators for the Consumer portfolio are based on updated customer credit scores refreshed at least quarterly.
The totalfollowing tables present the gross charge-offs of loans and leases by vintage.
| | | | | | | | | | | | | | | | | | | | | | | | | | | | | | | | | | | | | | | | | | | | | | | | | | | | | | | | |
| | Year Ended December 31, 2023 |
| | Term Loans Gross Charge-offs by Origination Year | | Revolver Gross Charge-offs | | Revolver Converted to Term Loans Gross Charge-offs | | |
| (dollar amounts in millions) | | 2023 | | 2022 | | 2021 | | 2020 | | 2019 | | Prior | | | | Total |
| | | | | | | | | | | | | | | | | | |
| | | | | | | | | | | | | | | | | | |
| | | | | | | | | | | | | | | | | | |
| | | | | | | | | | | | | | | | | | |
| | | | | | | | | | | | | | | | | | |
| | | | | | | | | | | | | | | | | | |
| | | | | | | | | | | | | | | | | | |
| | | | | | | | | | | | | | | | | | |
| | | | | | | | | | | | | | | | | | |
| | | | | | | | | | | | | | | | | | |
| | | | | | | | | | | | | | | | | | |
| Commercial and industrial | | $ | 9 | | | $ | 47 | | | $ | 48 | | | $ | 14 | | | $ | 33 | | | $ | 13 | | | $ | 11 | | | $ | 2 | | | $ | 177 | |
| Commercial real estate | | 8 | | | 9 | | | 31 | | | — | | | 26 | | | 4 | | | 7 | | | — | | | 85 | |
| Lease Financing | | — | | | 4 | | | 2 | | | 1 | | | 1 | | | — | | | — | | | — | | | 8 | |
| Residential mortgage | | — | | | — | | | 1 | | | — | | | — | | | 4 | | | — | | | — | | | 5 | |
| Automobile | | 3 | | | 16 | | | 16 | | | 7 | | | 5 | | | 3 | | | — | | | — | | | 50 | |
| Home equity | | — | | | — | | | — | | | — | | | — | | | 1 | | | 2 | | | 6 | | | 9 | |
| RV and marine | | — | | | 2 | | | 4 | | | 3 | | | 3 | | | 7 | | | — | | | — | | | 19 | |
| Other consumer | | 14 | | | 23 | | | 13 | | | 5 | | | 5 | | | 12 | | | — | | | 29 | | | 101 | |
| Total | | $ | 34 | | | $ | 101 | | | $ | 115 | | | $ | 30 | | | $ | 73 | | | $ | 44 | | | $ | 20 | | | $ | 37 | | | $ | 454 | |
| | | | | | | | | | | | | | | | | | |
Modifications to Debtors Experiencing Financial Difficulty
Effective January 1, 2023, Huntington adopted ASU 2022-02- Financial Instruments - Credit Losses (Topic 326): Troubled Debt Restructurings and Vintage Disclosures. For additional information on the adoption, refer to both Note 1 - “Significant Accounting Policies” and Note 2 - “Accounting Standards Update.” Huntington will modify the contractual terms of loans to a borrower experiencing financial difficulties as a way to mitigate loss, proactively work with borrowers in financial difficulty, or to comply with regulations regarding the treatment of certain bankruptcy filing and discharge situations.
A debtor is considered to be experiencing financial difficulty when there is significant doubt about the debtor’s ability to make required payments on the debt or to get equivalent financing from another creditor at a market rate for similar debt. A loan placed on nonaccrual because the borrower is experiencing financial difficulty may be returned to accrual status when all contractually due interest and principal has been paid and the borrower demonstrates the financial capacity to continue to pay as agreed, with the risk of loss diminished.
Reported Modification Types
Modifications in the form of principal forgiveness, an interest rate reduction, an other than insignificant payment delay or a term extension that have occurred in the current reporting period to a borrower experiencing financial difficulty are disclosed along with the financial impact of the modifications.
Huntington will generally try other forms of relief before principal forgiveness but would define any contractual reduction in the amount of accruedprincipal due without receiving payment or assets as forgiveness. For the purpose of the disclosure Huntington considers any contractual change in interest recordedrate that results in the borrower receiving a below market rate to be an interest rate reduction. Many factors can go into what is considered an other than insignificant payment delay, for these loans at December 31, 2020, presentedexample, the significance of the restructured payment amount relative to the normal loan payment or the relative significance of the delay to the original loan terms. Generally, Huntington would consider any delay in other assets withinpayment of greater than 90 days in the Consolidated Balance Sheets, was $146 million and $123 million for commercial and consumer, respectively.last 12 months to be significant. For the purpose of the disclosure modification of contingent payment features or covenants that would have accelerated payment are not considered term extensions.
128117 Huntington Bancshares Incorporated
Following is a description of what is considered a borrower experiencing financial difficulty by the different loan types:
Commercial loan modifications – Our strategy involving commercial borrowers generally includes working with these borrowers to allow them time to improve their financial position and remain a Huntington customer through restructuring their notes or to restructure elsewhere if necessary. Borrowers that are rated substandard or worse in accordance with the regulatory definition, or that cannot otherwise restructure at market terms and conditions, are considered to be experiencing financial difficulty. A subsequent restructuring or modification of a loan may occur when either the loan matures according to the terms of the modified agreement, or the borrower requests a change to the loan agreements. It is subjected to the normal underwriting standards and processes for other similar credit extensions, both new and existing. The restructured note is evaluated to determine if it is considered a new loan or a continuation of the prior loan.
Consumer loan modifications – Consumer loans in which a borrower requires a modification as a result of negative changes to their financial condition or to avoid default, generally indicate the borrower is experiencing financial difficulty. The primary modifications made to consumer loans are amortization, maturity date and interest rate changes. Consumer borrowers identified as experiencing financial difficulty are unable to refinance their loans through the Company’s normal origination channels or through other independent sources. Most, but not all, of the loans may be delinquent. The Company’s primary loan categories that receive modifications are residential mortgage, automobile, home equity, RV and marine, and other consumer loans.
Impact on Credit Quality of Borrowers Experiencing Financial Difficulty
Huntington’s ALLL is influenced by loan level characteristics that inform the assessed propensity to default. As such, the provision for credit losses is impacted primarily by changes in such loan level characteristics, such as payment performance. Commercial borrowers experiencing financial difficulty are risk rated to reflect the increase in default characteristics so that that the ALLL reflects the future risk of loss. Borrowers experiencing financial difficulty can be classified as either accrual or nonaccrual loans.
The following tables present each loantable summarizes the amortized cost basis of loans modified during the reporting period to borrowers experiencing financial difficulty, disaggregated by class of financing receivable and lease class by credit quality indicator at December 31, 2019:type of modification.
| | Year Ended December 31, 2023 | |
| Year Ended December 31, 2023 | |
| Year Ended December 31, 2023 | |
| Amortized Cost | |
| Amortized Cost | |
| Amortized Cost | |
| (dollar amounts in millions) | |
| (dollar amounts in millions) | |
| (dollar amounts in millions) | | Interest rate reduction | | Term extension | | Payment deferral | | | | Combo - interest rate reduction and term extension | | | | | | Total | | % of total loan class (1) |
| | | December 31, 2019 |
| | Credit Risk Profile by UCS Classification |
| (dollar amounts in millions) | Pass | | OLEM | | Substandard | | Doubtful | | Total |
| | Commercial and industrial | |
| | Commercial and industrial | |
| | Commercial and industrial | Commercial and industrial | $ | 28,477 | | | $ | 634 | | | $ | 1,551 | | | $ | 2 | | | $ | 30,664 | | $ | 64 | | | $ | | $ | 387 | | | $ | | $ | — | | | | | $ | | | | $ | 4 | | | | | | | $ | | | | | | $ | 455 | | | 0.90 | | 0.90 | % |
| Commercial real estate | Commercial real estate | 6,487 | | | 98 | | | 88 | | | 1 | | | 6,674 | |
| Credit Risk Profile by FICO Score (1), (2) |
| 750+ | | 650-749 | | <650 | | Total |
| Residential mortgage | |
| Automobile | Automobile | | $ | 6,759 | | | $ | 4,661 | | | $ | 1,377 | | | 12,797 | |
| Home equity | Home equity | | 5,763 | | | 2,772 | | | 557 | | | 9,092 | |
| Residential mortgage | | 7,976 | | | 2,742 | | | 578 | | | 11,296 | |
| RV and marine | RV and marine | | 2,391 | | | 1,053 | | | 119 | | | 3,563 | |
| Other consumer | Other consumer | | 546 | | | 571 | | | 120 | | | 1,237 | |
| Total loans to borrowers experiencing financial difficulty in which modifications were made | | Total loans to borrowers experiencing financial difficulty in which modifications were made | $ | 67 | | | $ | 613 | | | $ | 2 | | | | | $ | 23 | | | | | | | $ | 705 | | | 0.58 | % |
|
(1)ExcludesRepresents the amortized cost of loans accounted for undermodified during the fair value option.reporting period as a percentage of the period-end loan balance by class.
(2)2023 Form 10-K Reflects updated customer credit scores.118
The following table describes the financial effect of the modification made to borrowers experiencing financial difficulty.
| | | | | | | | | | | | | | | | | | | | | | |
| Year Ended December 31, 2023 | | | | | |
| Interest Rate Reduction (1) | | Term Extension (1) | | | |
| Weighted-average contractual interest rate | | Weighted-average years added to the life | | | | | |
| From | | To | | | | | |
| | | | | | | | | | |
| | | | | | | | | | |
| | | | | | | | | | |
| | | | | | | | | | |
| | | | | | | | | | |
| | | | | | | | | | |
| | | | | | | | | | |
| | | | | | | | | | |
| | | | | | | | | | |
| Commercial and industrial | 8.62 | % | | 8.05 | % | | 1.0 | | | | | |
| Commercial real estate | 13.42 | | | 8.75 | | | 1.0 | | | | | |
| Residential mortgage | 6.32 | | | 4.64 | | | 7.7 | | | | | |
| Automobile | 6.60 | | | 6.26 | | | 1.9 | | | | | |
| Home equity | 8.88 | | | 6.15 | | | 14.6 | | | | | |
| | | | | | | | | | |
| | | | | | | | | | |
(1)Certain disclosures related to financial effects of modifications do not include deemed to be immaterial.
The performance of loans made to borrowers experiencing financial difficulty in which modifications were made is closely monitored to understand the effectiveness of modification efforts. Loans are considered to be in payment default at 90 or more days past due. The following table depicts the performance of loans that have been modified during the reporting period.
| | | | | | | | | | | | | | | | | | | | | | | | | | | | | | | | | | | | | |
| At December 31, 2023 |
| Past Due | | | | | | |
| (dollar amounts in millions) | 30-59
Days | | 60-89
Days | | 90 or
more days | | Total | | Current | | Total | | |
| Commercial and industrial | $ | 21 | | | $ | 25 | | | $ | 7 | | | $ | 53 | | | $ | 402 | | | $ | 455 | | | |
| Commercial real estate | — | | | — | | | 5 | | | 5 | | | 152 | | | 157 | | | |
| Residential mortgage | 9 | | | 8 | | | 11 | | | 28 | | | 36 | | | 64 | | | |
| Automobile | 2 | | | 1 | | | — | | | 3 | | | 12 | | | 15 | | | |
| Home equity | 1 | | | 1 | | | 1 | | | 3 | | | 9 | | | 12 | | | |
| RV and marine | — | | | — | | | — | | | — | | | 1 | | | 1 | | | |
| Other consumer | — | | | — | | | — | | | — | | | 1 | | | 1 | | | |
| Total loans to borrowers experiencing financial difficulty in which modifications were made in the twelve months ended December 31, 2023 | $ | 33 | | | $ | 35 | | | $ | 24 | | | $ | 92 | | | $ | 613 | | | $ | 705 | | | |
TDR Loans
On March 22, 2020 and April 7, 2020, the federal bank regulatory agencies including the FRB and OCC released statements encouraging financial institutions to work prudently with borrowers that may be unable to meet their contractual obligations because of the effects of COVID-19. The statements go on to explain that, in consultation with the FASB staff, the federal bank regulatory agencies concluded that short-term modifications (e.g. six months) made on a good faith basis to borrowers who were current as of the implementation date of a relief program are not TDRs. Section 4013 of the CARES Act, as amended by Section 541 of the Consolidated Appropriations Act of 2021, (“CARES Act”) further addresses COVID-19 related modifications occurring between March 1, 2020 through January 1, 2022 and specifies that such COVID-19 related modifications on loans that were current as of December 31, 2019 are not TDRs.
For COVID-19 related loan modifications occurring during 2020, which met the loan modification criteria under the CARES Act, Huntington elected to suspend TDR accounting. For loan modifications not eligible for the CARES Act, Huntington applied the interagency regulatory guidance that was clarified on April 7, 2020. Accordingly, insignificant concessions (related to the current COVID-19 crisis) granted through payment deferrals, fee waivers, or other short-term modifications (generally 6 months or less) and provided to borrowers less than 30 days past due at March 17, 2020 were not deemed to be TDRs. Therefore, modified loans that met the required guidelines for relief are excluded from the TDR disclosures below.
The amount of interest that would have been recorded under the original terms for total accruing TDR loans was $46 million, $52 million, and $51 million for 2020, 2019, and 2018, respectively. The total amount of actual interest recorded to interest income for these loans was $43 million, $49 million, and $48 million for 2020, 2019, and 2018, respectively.
TDR Concession Types
The following provides additional disclosures previously required by ASC Subtopic 310-40, Receivables—Troubled Debt Restructurings by Creditors, related to the year ended December 31, 2022.
The Company’s standards relating to loan modifications consider, among other factors, minimum verified income requirements, cash flow analyses, and collateral valuations. Each potential loan modification is reviewed individually and the terms of the loan are modified to meet a borrower’s specific circumstances at a point in time. All commercial TDRs are reviewed and approved by our FRG.
Following is a description of TDRs by the different loan types:
Commercial loan TDRs – Our strategy involving commercial TDR borrowers includes working with these borrowers to allow them to refinance elsewhere, as well as allow them time to improve their financial position and remain a Huntington customer through refinancing their notes according to market terms and conditions in the future. A subsequent refinancing or modification of a loan may occur when either the loan matures according to the terms of the TDR-modified agreement, or the borrower requests a change to the loan agreements. At that time, the loan is evaluated to determine if the borrower is creditworthy. It is subjected to the normal underwriting standards and processes for other similar credit extensions, both new and existing. The refinanced note is evaluated to determine if it is considered a new loan or a continuation of the prior loan.
2020 Form 10-K 119129 Huntington Bancshares Incorporated
Consumer loan TDRs – Residential mortgage TDRs represent loan modifications associated with traditional first-lien mortgage loans in which a concession has been provided to the borrower. The primary concessions given to residential mortgage borrowers are amortization, or maturity date, changes and interest rate reductions.concessions. Residential mortgages identified as TDRs involve borrowers unable to refinance their mortgages through the Company’s normal mortgage origination channels or through other independent sources. Some, but not all, of the loans may be delinquent. The Company may make similar interest rate, term, and principal concessions for Automobile, Home Equity, RV and Marine, and Other Consumer loan TDRs.
TDR Impact on Credit Quality
Huntington’s ALLL is largely determinedinfluenced by risk ratings assignedloan level characteristics that inform the assessed propensity to commercial loans, updated borrower credit scores on consumer loans, and borrower delinquency history in both the commercial and consumer portfolios. These risk ratings and credit scores consider the default history of the borrower, including payment redefaults.default. As such, the provision for credit losses is impacted primarily by changes in borrowersuch loan level characteristics, such as payment performance, rather than the TDR classification. TDRs can be classified as either accrual or nonaccrual loans. Nonaccrual TDRs are included in NALs whereas accruing TDRs are excluded from NALs as it is probable that all contractual principal and interest due under the restructured terms will be collected.
The Company’s TDRs may include multiple concessions and the disclosure classifications are presented based on the primary concession provided to the borrower. The majority of the concessions for the C&I and CRE portfolios are the extension of the maturity date, but could also include an interest rate concession. In these instances, the primary concession is the maturity date extension.
The following table presents, by class and modification type, the number of contracts, post-modification outstanding balance, and the financial effects of the modification for the years ended December 31, 2020 and 2019.modification.
| | At December 31, 2022 | |
| At December 31, 2022 | |
| At December 31, 2022 | |
| New Troubled Debt Restructurings (1) | |
| Number of
Contracts | |
| Number of
Contracts | |
| Number of
Contracts | |
| (dollar amounts in millions) | |
| (dollar amounts in millions) | |
| (dollar amounts in millions) | |
| | Commercial and industrial | |
| | Commercial and industrial | |
| | Commercial and industrial | |
| Commercial real estate | |
| Commercial real estate | |
| Commercial real estate | |
| | Residential mortgage | |
| | Residential mortgage | |
| | Residential mortgage | |
| Automobile | |
| Automobile | |
| Automobile | |
| Home equity | |
| Home equity | |
| Home equity | |
| RV and marine | |
| RV and marine | |
| RV and marine | |
| Other consumer | |
| Other consumer | |
| Other consumer | |
| Total new TDRs | |
| Total new TDRs | |
| Total new TDRs | |
| | | New Troubled Debt Restructurings (1) |
| | Year Ended December 31, 2020 |
| | Number of
Contracts | | Post-modification Outstanding Recorded Investment (2) | |
| (dollar amounts in millions) | | Interest rate reduction | | Amortization or maturity date change | | Chapter 7 bankruptcy | | Other | | Total | |
| | Commercial and industrial | 317 | | | $ | 0 | | | $ | 123 | | | $ | 0 | | | $ | 58 | | | $ | 181 | | |
| Commercial real estate | 13 | | | 0 | | | 3 | | | 0 | | | 0 | | | 3 | | |
| Automobile | 3,018 | | | 0 | | | 29 | | | 6 | | | 0 | | | 35 | | |
| Home equity | 273 | | | 0 | | | 6 | | | 8 | | | 2 | | | 16 | | |
| Residential mortgage | 585 | | | 0 | | | 79 | | | 7 | | | 0 | | | 86 | | |
| RV and marine | 168 | | | 0 | | | 4 | | | 1 | | | 0 | | | 5 | | |
| Other consumer | 622 | | | 3 | | | 0 | | | 0 | | | 1 | | | 4 | | |
| Total new TDRs | 4,996 | | | $ | 3 | | | $ | 244 | | | $ | 22 | | | $ | 61 | | | $ | 330 | | |
| | | Year Ended December 31, 2019 |
| | Number of
Contracts | | Post-modification Outstanding Recorded Investment (2) | |
| (dollar amounts in millions) | | Interest rate reduction | | Amortization or maturity date change | | Chapter 7 bankruptcy | | Other | | Total | |
| | Commercial and industrial | 482 | | | $ | 0 | | | $ | 172 | | | $ | 0 | | | $ | 7 | | | $ | 179 | | |
| Commercial real estate | 29 | | | 0 | | | 13 | | | 0 | | | 0 | | | 13 | | |
| Automobile | 2,971 | | | 0 | | | 19 | | | 7 | | | 0 | | | 26 | | |
| Home equity | 306 | | | 0 | | | 9 | | | 8 | | | 0 | | | 17 | | |
| Residential mortgage | 330 | | | 0 | | | 35 | | | 2 | | | 0 | | | 37 | | |
| RV and marine | 139 | | | 0 | | | 1 | | | 2 | | | 0 | | | 3 | | |
| Other consumer | 972 | | | 8 | | | 0 | | | 0 | | | 0 | | | 8 | | |
| Total new TDRs | 5,229 | | | $ | 8 | | | $ | 249 | | | $ | 19 | | | $ | 7 | | | $ | 283 | | |
| |
(1)TDRs may include multiple concessions. Theconcessions and the disclosure classification isclassifications are based on the primary concession provided to the borrower.
(2)Post-modification balances approximate pre-modification balances.
Pledged Loans and Leases
The aggregate amountBank has access to secured borrowings from the Federal Reserve’s discount window and advances from the FHLB. As of charge-offs as a result of a restructuring are not significant.December 31, 2023 and 2022, loans and leases totaling $101.8 billion and $70.9 billion, respectively, were pledged to the Federal Reserve and FHLB for access to these contingent funding sources.
6.ALLOWANCE FOR CREDIT LOSSES
The following table presents ACL activity by portfolio segment.
| | | | | | | | | | | | | | | | | | | | | | | | | | | | | | | | | |
| (dollar amounts in millions) | | | | | | | | | | | | | | | Commercial | | Consumer | | Total |
| Year Ended December 31, 2023: | | | | | | | | | | | | | | | | | | | |
| ALLL balance, beginning of period | | | | | | | | | | | | | | | $ | 1,424 | | | $ | 697 | | | $ | 2,121 | |
| | | | | | | | | | | | | | | | | | | |
| Loan and lease charge-offs | | | | | | | | | | | | | | | (270) | | | (184) | | | (454) | |
| Recoveries of loans and leases previously charged-off | | | | | | | | | | | | | | | 112 | | | 69 | | | 181 | |
| Provision for loan and lease losses | | | | | | | | | | | | | | | 297 | | | 110 | | | 407 | |
| | | | | | | | | | | | | | | | | | | |
| | | | | | | | | | | | | | | | | | | |
| ALLL balance, end of period | | | | | | | | | | | | | | | $ | 1,563 | | | $ | 692 | | | $ | 2,255 | |
| AULC balance, beginning of period | | | | | | | | | | | | | | | $ | 71 | | | $ | 79 | | | $ | 150 | |
| | | | | | | | | | | | | | | | | | | |
| Benefit for unfunded lending commitments | | | | | | | | | | | | | | | (5) | | | — | | | (5) | |
| | | | | | | | | | | | | | | | | | | |
| AULC balance, end of period | | | | | | | | | | | | | | | $ | 66 | | | $ | 79 | | | $ | 145 | |
| ACL balance, end of period | | | | | | | | | | | | | | | $ | 1,629 | | | $ | 771 | | | $ | 2,400 | |
| | | | | | | | | | | | | | | | | | | |
| Year Ended December 31, 2022: | | | | | | | | | | | | | | | | | | | |
| ALLL balance, beginning of period | | | | | | | | | | | | | | | $ | 1,462 | | | $ | 568 | | | $ | 2,030 | |
| | | | | | | | | | | | | | | | | | | |
| Loan and lease charge-offs | | | | | | | | | | | | | | | (129) | | | (184) | | | (313) | |
| Recoveries of loans and leases previously charged-off | | | | | | | | | | | | | | | 114 | | | 78 | | | 192 | |
| Provision (benefit) for loan and lease losses | | | | | | | | | | | | | | | (23) | | | 235 | | | 212 | |
| | | | | | | | | | | | | | | | | | | |
| ALLL balance, end of period | | | | | | | | | | | | | | | $ | 1,424 | | | $ | 697 | | | $ | 2,121 | |
| AULC balance, beginning of period | | | | | | | | | | | | | | | $ | 41 | | | $ | 36 | | | $ | 77 | |
| | | | | | | | | | | | | | | | | | | |
| Provision for unfunded lending commitments | | | | | | | | | | | | | | | 30 | | | 43 | | | 73 | |
| | | | | | | | | | | | | | | | | | | |
| AULC balance, end of period | | | | | | | | | | | | | | | $ | 71 | | | $ | 79 | | | $ | 150 | |
| ACL balance, end of period | | | | | | | | | | | | | | | $ | 1,495 | | | $ | 776 | | | $ | 2,271 | |
| | | | | | | | | | | | | | | | | | | |
| Year Ended December 31, 2021: | | | | | | | | | | | | | | | | | | | |
| ALLL balance, beginning of period | | | | | | | | | | | | | | | $ | 1,236 | | | $ | 578 | | | $ | 1,814 | |
| | | | | | | | | | | | | | | | | | | |
| Loan and lease charge-offs | | | | | | | | | | | | | | | (243) | | | (139) | | | (382) | |
| Recoveries of loans and leases previously charged-off | | | | | | | | | | | | | | | 83 | | | 84 | | | 167 | |
| Provision (benefit) for loan and lease losses | | | | | | | | | | | | | | | 12 | | | (13) | | | (1) | |
| Allowance on PCD loans and leases at acquisition | | | | | | | | | | | | | | | 374 | | | 58 | | | 432 | |
| ALLL balance, end of period | | | | | | | | | | | | | | | $ | 1,462 | | | $ | 568 | | | $ | 2,030 | |
| AULC balance, beginning of period | | | | | | | | | | | | | | | $ | 34 | | | $ | 18 | | | $ | 52 | |
| | | | | | | | | | | | | | | | | | | |
| Provision for unfunded lending commitments | | | | | | | | | | | | | | | 8 | | | 18 | | | 26 | |
| Unfunded lending commitment losses | | | | | | | | | | | | | | | (1) | | | — | | | (1) | |
| AULC balance, end of period | | | | | | | | | | | | | | | $ | 41 | | | $ | 36 | | | $ | 77 | |
| ACL balance, end of period | | | | | | | | | | | | | | | $ | 1,503 | | | $ | 604 | | | $ | 2,107 | |
At December 31, 2023, the ACL was $2.4 billion, an increase of $129 million from the December 31, 2022 balance of $2.3 billion. The increase in the total ACL was primarily driven by a combination of loan and lease growth and modest overall coverage ratio builds throughout 2023.
The Commercial ACL was $1.6 billion at December 31, 2023, an increase of $134 million from the December 31, 2022 balance of $1.5 billion. The primary drivers were approximately $1.3 billion of commercial loan growth and an increase in the coverage ratio for the commercial real estate loan portfolio, reflecting the ongoing risks presented by higher interest rates, increased vacancy rates and deteriorating property values.
The Consumer ACL balance was $771 million at December 31, 2023, relatively flat compared to the December 31, 2022 balance of $776 million. Consumer loan growth over the course of 2023 was offset by modest improvement in the macroeconomic environment.
121 Huntington Bancshares Incorporated
The financial effects of modification represent the impact on the provision (recovery) for loan and lease losses. Amounts for the years ended December 31, 2020 and December 31, 2019 were $6 million and $(2) million, respectively.
Pledged Loans
The Bank has access to the Federal Reserve’s discount window and advances from the FHLB. As of December 31, 2020 and 2019, these borrowings and advances are secured by $43.0 billion and $39.6 billion, respectively, of loans.
6.ALLOWANCE FOR CREDIT LOSSES
On January 1, 2020, Huntington adopted ASU 2016-13 Financial Instruments - Credit Losses (ASC Topic 326): Measurement of Credit Losses on Financial Instruments, which replaced the incurred loss methodology with an expected loss methodology that is referred to as the current expected credit loss (“CECL”) methodology. The measurement of expected credit losses under CECL is applicable to financial assets measured at amortized cost, including loan receivables and held-to-maturity debt securities. It also applies to off-balance sheet exposures not accounted for as insurance and net investments in leases accounted for under ASC Topic 842. Additionally, ASC Topic 326 made changes to the accounting for AFS debt securities, including a requirement to present credit losses as an allowance rather than as a write-down on AFS debt securities that management does not intend to sell, or believes will not be required to sell.
Huntington adopted ASC Topic 326 using the modified retrospective method for all financial assets in scope of the standard. Results for reporting periods beginning after January 1, 2020 are presented under ASC Topic 326, while prior period amounts continue to be reported in accordance with previously applicable GAAP. Upon adoption, Huntington recorded an increase to the ACL of $393 million and a corresponding decrease to retained earnings of approximately $306 million, net of tax of $87 million. The overall increase to the ACL at adoption is comprised of a $180 million increase in the commercial ALLL, a $211 million increase in the consumer ALLL, and a $2 million increase to the AULC.
Allowance for Loan and Lease Losses and Allowance for Credit Losses - Roll-forward
The following table presents ALLL and AULC activity by portfolio segment for the years ended December 31, 2020, 2019, and 2018:
| | | | | | | | | | | | | | | | | | | | | | | | | | | | | | | | | |
| (dollar amounts in millions) | | | | | | | | | | | | | | | Commercial | | Consumer | | Total |
| Year ended December 31, 2020: | | | | | | | | | | | | | | | | | | | |
| ALLL balance, beginning of period | | | | | | | | | | | | | | | $ | 552 | | | $ | 231 | | | $ | 783 | |
| Cumulative-effect of change in accounting principle for financial instruments - credit losses (1) | | | | | | | | | | | | | | | 180 | | | 211 | | | 391 | |
| Loan charge-offs | | | | | | | | | | | | | | | (374) | | | (166) | | | (540) | |
| Recoveries of loans previously charged-off | | | | | | | | | | | | | | | 32 | | | 59 | | | 91 | |
| Provision for loan and lease losses | | | | | | | | | | | | | | | 846 | | | 243 | | | 1,089 | |
| | | | | | | | | | | | | | | | | | | |
| ALLL balance, end of period | | | | | | | | | | | | | | | $ | 1,236 | | | $ | 578 | | | $ | 1,814 | |
| AULC balance, beginning of period | | | | | | | | | | | | | | | $ | 102 | | | $ | 2 | | | $ | 104 | |
| Cumulative-effect of change in accounting principle for financial instruments - credit losses (1) | | | | | | | | | | | | | | | (38) | | | 40 | | | 2 | |
Provision (reduction in allowance) for unfunded loan commitments and letters of credit | | | | | | | | | | | | | | | (17) | | | (24) | | | (41) | |
| Unfunded commitment losses | | | | | | | | | | | | | | | (13) | | | 0 | | | (13) | |
| AULC balance, end of period | | | | | | | | | | | | | | | $ | 34 | | | $ | 18 | | | $ | 52 | |
| ACL balance, end of period | | | | | | | | | | | | | | | $ | 1,270 | | | $ | 596 | | | $ | 1,866 | |
| | | | | | | | | | | | | | | | | | | |
| Year ended December 31, 2019: | | | | | | | | | | | | | | | | | | | |
| ALLL balance, beginning of period | | | | | | | | | | | | | | | $ | 542 | | | $ | 230 | | | $ | 772 | |
| | | | | | | | | | | | | | | | | | | |
| Loan charge-offs | | | | | | | | | | | | | | | (165) | | | (197) | | | (362) | |
| Recoveries of loans previously charged-off | | | | | | | | | | | | | | | 40 | | | 57 | | | 97 | |
| Provision for loan and lease losses | | | | | | | | | | | | | | | 135 | | | 142 | | | 277 | |
| Allowance for loans sold or transferred to loans held for sale | | | | | | | | | | | | | | | 0 | | | (1) | | | (1) | |
| ALLL balance, end of period | | | | | | | | | | | | | | | $ | 552 | | | $ | 231 | | | $ | 783 | |
| AULC balance, beginning of period | | | | | | | | | | | | | | | $ | 94 | | | $ | 2 | | | $ | 96 | |
| | | | | | | | | | | | | | | | | | | |
Provision (reduction in allowance) for unfunded loan commitments and letters of credit | | | | | | | | | | | | | | | 10 | | | — | | | 10 | |
| Unfunded commitment losses | | | | | | | | | | | | | | | (2) | | | 0 | | | (2) | |
| AULC balance, end of period | | | | | | | | | | | | | | | $ | 102 | | | $ | 2 | | | $ | 104 | |
| ACL balance, end of period | | | | | | | | | | | | | | | $ | 654 | | | $ | 233 | | | $ | 887 | |
| | | | | | | | | | | | | | | | | | | |
| Year ended December 31, 2018: | | | | | | | | | | | | | | | | | | | |
| ALLL balance, beginning of period | | | | | | | | | | | | | | | $ | 482 | | | $ | 209 | | | $ | 691 | |
| | | | | | | | | | | | | | | | | | | |
| Loan charge-offs | | | | | | | | | | | | | | | (79) | | | (189) | | | (268) | |
| Recoveries of loans previously charged-off | | | | | | | | | | | | | | | 65 | | | 58 | | | 123 | |
| Provision for loan and lease losses | | | | | | | | | | | | | | | 74 | | | 152 | | | 226 | |
| | | | | | | | | | | | | | | | | | | |
| ALLL balance, end of period | | | | | | | | | | | | | | | $ | 542 | | | $ | 230 | | | $ | 772 | |
| AULC balance, beginning of period | | | | | | | | | | | | | | | $ | 84 | | | $ | 3 | | | $ | 87 | |
| | | | | | | | | | | | | | | | | | | |
Provision (reduction in allowance) for unfunded loan commitments and letters of credit | | | | | | | | | | | | | | | 10 | | | (1) | | | 9 | |
| | | | | | | | | | | | | | | | | | | |
| AULC balance, end of period | | | | | | | | | | | | | | | $ | 94 | | | $ | 2 | | | $ | 96 | |
| ACL balance, end of period | | | | | | | | | | | | | | | $ | 636 | | | $ | 232 | | | $ | 868 | |
(1)Relates to day one impact of the CECL adjustment as a result of the implementation of ASU 2016-13.
At December 31, 2020, the ACL was $1.9 billion, an increase of $979 million from the December 31, 2019 balance of $887 million. Of the increase, $586 million relates primarily to the deterioration in the macroeconomic outlook resulting from the COVID-19 pandemic as evidenced in part by the changes in assumed unemployment rate levels during 2020. When estimating the January 1, 2020 CECL implementation adjustment, the assumed unemployment rate for fourth quarter 2020 in the base casebaseline economic scenario was 3.75%. When estimating the December 31, 2020 ACL, the assumed unemployment rate for fourth quarter 2020 in the base case scenario was 7.20%. The remaining increase of $393 million was related to the transition to the CECL lifetime loss methodology. The majority of the increase in the ACL from 2019 year-end levels related to the commercial portfolio.
132 Huntington Bancshares Incorporated
The suite of CECL models are generally dependent on the rate of change in unemployment rather than the absolute unemployment levels. Additionally, the economic scenarios used in the December 31, 20202023 ACL determination contained significant judgmental assumptions aroundincluded the ultimate numberfederal funds rate projected to have peaked during the third quarter of COVID-19 cases2023 and is forecast to remain at this terminal level until mid-2024 as the Federal Reserve continues to address the elevated inflation levels and tightness in the labor market. The Federal Reserve is expected to start cutting rates in the third quarter of 2024 at a rate of 25 basis points per quarter until reaching 3% in late 2026. Inflation is forecast to drop from 3.3% year over year at the end of 2023, to the Federal Reserve’s target level and timing of government stimulus. Given2% by the fourth quarter of 2024. Unemployment is projected to gradually increase, peaking at 4.1% in the first quarter of 2025 before marginally improving to 3.9% by 2027.
The economic scenarios used included elevated levels of economic uncertainty including the impact of specific challenges in the unemployment variable utilized withinCommercial Real Estate industry, high inflation readings, the modelsU.S labor market, the expected path of interest rate changes by the Federal Reserve, and the impact of significant conflicts on-going around the world. Given the uncertainty associated with key economic scenario assumptions, the December 31, 20202023 ACL included a material general reserve componentthat consists of various risk profile components to capture this economicaddress uncertainty risk not addressedmeasured within the quantitative transaction reserve.
NCOs increased $184 million, or 69%, in 2020. The increase was driven by commercial NCOs, which were centered in our oil and gas portfolio, partially offset by a decline in other consumer.
7. MORTGAGE LOAN SALES AND SERVICING RIGHTS
Residential Mortgage Portfolio
The following table summarizes activity relating to residential mortgage loans sold with servicing retained for the years ended December 31, 2020, 2019, and 2018:retained.
| | | Year Ended December 31, | | Year Ended December 31, |
| (dollar amounts in millions) | (dollar amounts in millions) | 2020 | | 2019 | | 2018 | (dollar amounts in millions) | 2023 | | 2022 | | 2021 |
| Residential mortgage loans sold with servicing retained | Residential mortgage loans sold with servicing retained | $ | 8,436 | | | $ | 4,841 | | | $ | 3,846 | |
| Pretax gains resulting from above loan sales (1) | Pretax gains resulting from above loan sales (1) | 311 | | | 119 | | | 87 | |
(1)Recorded in mortgage banking income.
The following table summarizes the changes in MSRs recorded using the fair value method for the years ended December 31, 2020 and 2019 (1):method:
| | | Year Ended December 31, | | | | Year Ended December 31, |
| (dollar amounts in millions) | | (dollar amounts in millions) | | 2023 | | 2022 |
| Fair value, beginning of period | |
| | | Year Ended
December 31, |
| (dollar amounts in millions) | | 2020 | | 2019 (1) |
| Fair value, beginning of period | | $ | 7 | | | $ | 10 | |
| Fair value election for servicing assets previously measured using the amortized method | | 205 | | | 0 | |
| New servicing assets created | New servicing assets created | | 102 | | | 0 | |
| | New servicing assets created | |
| | New servicing assets created | |
| Servicing assets sold | |
| Change in fair value during the period due to: | Change in fair value during the period due to: | |
| Time decay (2) | | (9) | | | (1) | |
| Payoffs (3) | | (43) | | | (1) | |
| Changes in valuation inputs or assumptions (4) | | (52) | | | (1) | |
| Time decay (1) | |
| Time decay (1) | |
| Time decay (1) | |
| Payoffs (2) | |
| Changes in valuation inputs or assumptions (3) | |
| Fair value, end of period | Fair value, end of period | | $ | 210 | | | $ | 7 | |
| Weighted-average life (years) | | 7.6 | | 6.4 |
|
(1)Prior to January 1, 2020, substantially all of Huntington’s MSR assets were recorded at amortized cost.
(2)Represents decrease in value due to passage of time, including the impact from both regularly scheduled principal payments and partial loan paydowns.
(3)(2)Represents decrease in value associated with loans that paid off during the period.
(4)(3)Represents change in value resulting primarily from market-driven changes in interest rates.
MSRs do not trade in an active, open market with readily observable prices. Therefore, the fair value of MSRs is estimated using a discounted future cash flow model. Changes in the assumptions used may have a significant impact on the valuation of MSRs. MSR values are highly sensitive to movement in interest rates as expected future net servicing income depends on the projected outstanding principal balances of the underlying loans, which can be greatlyare impacted by the level of prepayments.
20202023 Form 10-K 133122
For MSRs underThe following table summarizes the fair value method, a summary of key assumptions and the sensitivity of the MSR value to changes in these assumptions at December 31, 2020, and December 31, 2019 follows:assumptions.
| | | | | | | | | | | | | | | | | | | | | | | | | | | | | | | | | | | | | | | | | |
| December 31, 2020 | | December 31, 2019 (1) |
| | | | Decline in fair value due to | | | | | Decline in fair value due to |
| (dollar amounts in millions) | Actual | | 10%
adverse
change | | 20%
adverse
change | | Actual | | 10%
adverse
change | | 20%
adverse
change |
Constant prepayment rate (annualized) | 17.36 | % | | | $ | (12) | | | $ | (23) | | | 8.21 | % | | | $ | 0 | | | $ | 0 | |
| Spread over forward interest rate swap rates | 519 | | bps | | (4) | | | (8) | | | 824 | | bps | | 0 | | | 0 | |
(1)Prior to January 1, 2020, substantially all of Huntington’s MSR assets were recorded at amortized cost. | | | | | | | | | | | | | | | | | | | | | | | | | | | | | | | | | | | | | | | | | |
| At December 31, 2023 | | At December 31, 2022 |
| | | | Decline in fair value due to | | | | | Decline in fair value due to |
| (dollar amounts in millions) | Actual | | 10%
adverse
change | | 20%
adverse
change | | Actual | | 10%
adverse
change | | 20%
adverse
change |
Constant prepayment rate (annualized) | 8.61 | % | | | $ | (15) | | | $ | (28) | | | 7.05 | % | | | $ | (13) | | | $ | (25) | |
| Spread over forward interest rate swap rates | 538 | | bps | | (11) | | | (22) | | | 578 | | bps | | (12) | | | (22) | |
Total servicing, late and other ancillary fees included in mortgage banking income was $64$98 million, $63$91 million, and $60$79 million for the years ended December 31, 2020, 2019,2023, 2022, and 2018,2021, respectively. The unpaid principal balance of residential mortgage loans serviced for third parties was $23.5$33.2 billion, $22.4$32.4 billion, and $21.0$31.0 billion at December 31, 2020, 2019,2023, 2022, and 2018,2021, respectively.
8. GOODWILL AND OTHER INTANGIBLE ASSETS
Business segments are based on segment leadership structure, which reflects how segment performance is monitored and assessed. We have 4two major business segments: Consumer and Business Banking, Commercial Banking, Vehicle Finance, and& Regional Banking and The Huntington Private Client Group (RBHPCG).Commercial Banking. The Treasury / Other function includes technology and operations, other unallocated assets, liabilities, revenue, and expense.
A rollforward of goodwill by business segment for the years ended December 31, 2020 and 2019,which goodwill is allocated is presented in the table below:
| | | | | | | | | | | | | | | | | | | | | | | | | | | | | | | | | | | | | |
| | Consumer & | | | | | | | | | | |
| | Business | | Commercial | | Vehicle | | | | | | Treasury/ | | Huntington |
| (dollar amounts in millions) | Banking | | Banking | | Finance | | RBHPCG | | | | Other | | Consolidated |
| Balance, January 1, 2019 | $ | 1,393 | | | $ | 426 | | | $ | 0 | | | $ | 170 | | | | | $ | 0 | | | $ | 1,989 | |
| Goodwill acquired during the period | 0 | | | 0 | | | 0 | | | 0 | | | | | 0 | | | 0 | |
| Adjustments | 0 | | | 1 | | | 0 | | | 0 | | | | | 0 | | | 1 | |
| | | | | | | | | | | | | |
| Balance, December 31, 2019 | 1,393 | | | 427 | | | 0 | | | 170 | | | | | 0 | | | 1,990 | |
| Goodwill acquired during the period | 0 | | | 0 | | | 0 | | | 0 | | | | | 0 | | | 0 | |
| Adjustments | 0 | | | 0 | | | 0 | | | 0 | | | | | 0 | | | 0 | |
| | | | | | | | | | | | | |
| Balance, December 31, 2020 | $ | 1,393 | | | $ | 427 | | | $ | 0 | | | $ | 170 | | | | | $ | 0 | | | $ | 1,990 | |
Goodwill is not amortized but is evaluated for impairment on an annual basis at October 1 of each year or whenever events or changes in circumstances indicate the carrying value may not be recoverable. NaNbelow. No goodwill impairment was recorded in 20202023 or 2019.2022.
The emergence of COVID-19 as a global pandemic early in 2020 led to significant deterioration in the economic environment which has impacted expected earnings. Following qualitative assessments of the goodwill balance in each of the first 3 quarters of 2020, management conducted its annual goodwill impairment test effective October 1, 2020. Impairment was not identified in any of the Bank’s reporting units during the annual test and further deterioration in the economic environment was not identified leading up to year end. Goodwill assessments are highly sensitive to economic projections and the related assumptions and estimates used by management. | | | | | | | | | | | | | | | | | | | | | | | |
| | | | | | | | | | |
| | Consumer & | | Commercial | | | | | | | | Huntington |
| (dollar amounts in millions) | Regional Banking | | Banking | | | | | | | | Consolidated |
| Balance, January 1, 2022 | $ | 3,650 | | | $ | 1,699 | | | | | | | | | $ | 5,349 | |
| Acquisitions | — | | | 222 | | | | | | | | | 222 | |
| | | | | | | | | | | |
| | | | | | | | | | | |
| Balance, December 31, 2022 | 3,650 | | | 1,921 | | | | | | | | | 5,571 | |
| | | | | | | | | | | |
| RPS sale | (10) | | | — | | | | | | | | | (10) | |
| | | | | | | | | | | |
| Balance, December 31, 2023 | $ | 3,640 | | | $ | 1,921 | | | | | | | | | $ | 5,561 | |
134 Huntington Bancshares Incorporated
At December 31, 2020 and 2019, Huntington’s other intangible assets consisted of the following:
| | (dollar amounts in millions) | (dollar amounts in millions) | Gross
Carrying
Amount | | Accumulated
Amortization | | Net
Carrying
Value | (dollar amounts in millions) | Gross
Carrying
Amount | | Accumulated
Amortization | | Net
Carrying
Value |
| December 31, 2020 | | | | | |
| At December 31, 2023 | |
| Core deposit intangible | |
| Core deposit intangible | |
| Core deposit intangible | Core deposit intangible | $ | 310 | | | $ | (150) | | | $ | 160 | |
| Customer relationship | Customer relationship | 101 | | | (70) | | | 31 | |
| | Total other intangible assets | Total other intangible assets | $ | 411 | | | $ | (220) | | | $ | 191 | |
| December 31, 2019 | | | | | |
| Total other intangible assets | |
| Total other intangible assets | |
| At December 31, 2022 | |
| Core deposit intangible | |
| Core deposit intangible | |
| Core deposit intangible | Core deposit intangible | $ | 310 | | | $ | (120) | | | $ | 190 | |
| Customer relationship | Customer relationship | 115 | | | (73) | | | 42 | |
| | Total other intangible assets | Total other intangible assets | $ | 425 | | | $ | (193) | | | $ | 232 | |
| Total other intangible assets | |
| Total other intangible assets | |
The estimated amortization expense of other intangible assets for the next five years is as follows:
| | (dollar amounts in millions) | (dollar amounts in millions) | Amortization Expense | (dollar amounts in millions) | Amortization Expense |
| 2021 | $ | 38 | |
| 2022 | 36 | |
| 2023 | 34 | |
| 2024 | 2024 | 32 | |
| 2025 | 2025 | 31 | |
| 2026 | |
| 2027 | |
| 2028 | |
123 Huntington Bancshares Incorporated
9. PREMISES AND EQUIPMENT
Premises and equipment were comprised of the following at December 31, 2020 and 2019:following:
| | | | At December 31, | | At December 31, |
| (dollar amounts in millions) | (dollar amounts in millions) | 2020 | | 2019 | (dollar amounts in millions) | 2023 | | 2022 |
| Land and land improvements | Land and land improvements | $ | 198 | | | $ | 189 | |
| Buildings | Buildings | 586 | | | 587 | |
| Leasehold improvements | Leasehold improvements | 203 | | | 205 | |
| Equipment | Equipment | 736 | | | 742 | |
| Total premises and equipment | Total premises and equipment | 1,723 | | | 1,723 | |
| Less accumulated depreciation and amortization | Less accumulated depreciation and amortization | (966) | | | (960) | |
| Net premises and equipment | Net premises and equipment | $ | 757 | | | $ | 763 | |
Depreciation and amortization charged to expense and rental income credited to net occupancy expense for the three years ended December 31, 2020, 2019, and 2018 were:was as follows:
| | Year Ended December 31, | | | Year Ended December 31, |
| (dollar amounts in millions) | (dollar amounts in millions) | 2020 | | 2019 | | 2018 | (dollar amounts in millions) | 2023 | | 2022 | | 2021 |
| Total depreciation and amortization of premises and equipment | Total depreciation and amortization of premises and equipment | $ | 119 | | | $ | 116 | | | $ | 130 | |
| Rental income credited to occupancy expense | 10 | | | 11 | | | 13 | |
|
10. OPERATING LEASES
At December 31, 2020,2023, Huntington was obligated under non-cancelable leases for branch and office space. These leases are all classified as operating due to the amount of time such spaces are occupied relative to the underlying assets useful lives. Many of these leases contain renewal options, most of which are not included in measurement of the right-of-use asset as they are not considered reasonably certain of exercise (i.e., Huntington does not currently have a significant economic incentive to exercise these options). Some leases contain escalation clauses calling for rentals to be adjusted for increased real estate taxes
Net lease assets and other operating expenses or proportionately adjusted for increases in the consumer or other price indices. Occasionally, Huntington will sublease the land and buildings for which it has obtained the right to use; substantially all of those sublease arrangementsliabilities are classified as operating, with sublease income recognized on a straight-line basis over the contractual term of the arrangement.follows:
| | | | | | | | | | | | | | | | | | | | |
| | | | At December 31, |
| (dollar amounts in millions) | | Classification | | 2023 | | 2022 |
| Assets | | | | | | |
| Operating lease assets | | Other assets | | $ | 265 | | | $ | 279 | |
| | | | | | |
| | | | | | |
| | | | | | |
| Liabilities | | | | | | |
| | | | | | |
| | | | | | |
| | | | | | |
| | | | | | |
| | | | | | |
| | | | | | |
| Lease liabilities | | Other liabilities | | $ | 379 | | | $ | 401 | |
Net lease cost are as follows:
| | | | | | | | | | | | | | | | | | | | |
| | | | Year Ended December 31, |
| (dollar amounts in millions) | | Classification | | 2023 | | 2022 |
| Operating lease cost | | Net occupancy | | $ | 68 | | | $ | 81 | |
| Short-term lease cost | | Net occupancy | | 1 | | | 2 | |
| | | | | | |
| | | | | | |
| | | | | | |
| Net lease cost | | | | $ | 69 | | | $ | 83 | |
20202023 Form 10-K 135124
Net lease assets and liabilities at December 31, 2020 and 2019 are as follows:
| | | | | | | | | | | | | | | | | | | | |
| | | | At December 31, |
| (dollar amounts in millions) | | Classification | | 2020 | | 2019 |
| Assets | | | | | | |
| Operating lease assets | | Other assets | | $ | 199 | | | $ | 210 | |
| | | | | | |
| | | | | | |
| | | | | | |
| Liabilities | | | | | | |
| | | | | | |
| | | | | | |
| | | | | | |
| | | | | | |
| | | | | | |
| | | | | | |
| Lease liabilities | | Other liabilities | | $ | 220 | | | $ | 233 | |
Net lease cost for the years ended December 31, 2020 and 2019 are as follows:
| | | | | | | | | | | | | | | | | | | | |
| | | | Year Ended December 31, |
| (dollar amounts in millions) | | Classification | | 2020 | | 2019 |
| Operating lease cost | | Net occupancy | | $ | 50 | | | $ | 47 | |
| Short-term lease cost | | Net occupancy | | 1 | | | 1 | |
| | | | | | |
| | | | | | |
| Sublease income | | Net occupancy | | (2) | | | (3) | |
| Net lease cost | | | | $ | 49 | | | $ | 45 | |
Maturity of lease liabilities at December 31, 20202023 are as follows:
| | (dollar amounts in millions) | (dollar amounts in millions) | | | Total |
| 2021 | | | $ | 43 | |
| 2022 | | | 42 | |
| 2023 | | | 37 | |
| (dollar amounts in millions) | |
| (dollar amounts in millions) | | | | | | | Total |
| 2024 | 2024 | | | 32 | |
| 2025 | 2025 | | | 26 | |
| 2026 | |
| 2027 | |
| 2028 | |
| Thereafter | Thereafter | | | 77 | |
| Total lease payments | Total lease payments | | | $ | 257 | |
| Less: Interest | Less: Interest | | | (37) | |
| Total lease liabilities | Total lease liabilities | | | $ | 220 | |
Additional supplemental information related to the Company’s operating leases as of December 31, 2020 and 2019 areis as follows:
| | | | | | | | | | | | | | |
| | Year Ended December 31, |
| (dollar amounts in millions) | | 2020 | | 2019 |
| Cash paid for amounts included in the measurement of lease liabilities for Operating cash flows | $ | (53) | | | $ | (54) | |
| | | | |
| | | | |
| | | | |
| | | | |
| Right-of-use assets obtained in exchange for lease obligations for Operating leases | 23 | | | 40 | |
| | | | |
| | | | |
| Weighted-average remaining lease term (years) for Operating leases | | 7.17 | | 7.31 |
| | | | |
| | | | |
| | | | |
| Weighted-average discount rate for Operating leases | | 4.26 | % | | 4.56 | % |
| | | | |
| | | | | | | | | | | | | | |
| | |
| (dollar amounts in millions) | | 2023 | | 2022 |
| Year ended December 31: | | | | |
| Cash paid for amounts included in the measurement of lease liabilities for operating cash flows | $ | (77) | | | $ | (80) | |
| | | | |
| | | | |
| | | | |
| | | | |
| Right-of-use assets obtained in exchange for lease obligations for operating leases | 37 | | | 22 | |
| At December 31: | | | | |
| Weighted-average remaining lease term (years) for operating leases | | 11.30 | | 11.48 |
| | | | |
| | | | |
| | | | |
| Weighted-average discount rate for operating leases | | 4.93 | % | | 4.64 | % |
| | | | |
11. SHORT-TERM BORROWINGS
Borrowings with original maturities of one year or less are classified as short-term and were comprised of the following at December 31, 2020 and 2019:following:
| | | | At December 31, | | At December 31, |
| (dollar amounts in millions) | (dollar amounts in millions) | 2020 | | 2019 | (dollar amounts in millions) | 2023 | | 2022 |
| Federal funds purchased and securities sold under agreements to repurchase | Federal funds purchased and securities sold under agreements to repurchase | $ | 71 | | | $ | 1,041 | |
| Federal Home Loan Bank advances | 0 | | | 1,500 | |
| FHLB advances | |
| Other borrowings | Other borrowings | 112 | | | 65 | |
| Total short-term borrowings | Total short-term borrowings | $ | 183 | | | $ | 2,606 | |
136125 Huntington Bancshares Incorporated
12. LONG-TERM DEBT
Huntington’s long-term debt consisted of the following:
| | | | | | | | | | | |
| | At December 31, |
| (dollar amounts in millions) | 2020 | | 2019 |
| The Parent Company: | | | |
| Senior Notes: | | | |
| 3.19% Huntington Bancshares Incorporated medium-term notes due 2021 | $ | 802 | | | $ | 993 | |
| 2.33% Huntington Bancshares Incorporated senior notes due 2022 | 699 | | | 972 | |
| 2.67% Huntington Bancshares Incorporated senior notes due 2024 | 838 | | | 798 | |
| 4.05% Huntington Bancshares Incorporated senior notes due 2025 | 553 | | | 528 | |
| 2.60% Huntington Bancshares Incorporated senior notes due 2030 | 743 | | | 0 | |
| Subordinated Notes: | | | |
| 7.00% Huntington Bancshares Incorporated subordinated notes due 2020 | — | | | 305 | |
| 3.55% Huntington Bancshares Incorporated subordinated notes due 2023 | 256 | | | 247 | |
| Huntington Capital I Trust Preferred 0.94% junior subordinated debentures due 2027 (1) | 69 | | | 70 | |
| Huntington Capital II Trust Preferred 0.86% junior subordinated debentures due 2028 (2) | 32 | | | 32 | |
| Sky Financial Capital Trust III 1.64% junior subordinated debentures due 2036 (3) | 72 | | | 72 | |
| Sky Financial Capital Trust IV 1.64% junior subordinated debentures due 2036 (3) | 74 | | | 74 | |
| Camco Financial Statutory Trust I 1.57% due 2037 (4) | 4 | | | 4 | |
| Total notes issued by the parent | 4,142 | | | 4,095 | |
| The Bank: | | | |
| Senior Notes: | | | |
| 2.47% Huntington National Bank senior notes due 2020 | — | | | 699 | |
| 2.42% Huntington National Bank senior notes due 2020 (5) | — | | | 300 | |
| 2.43% Huntington National Bank senior notes due 2020 | — | | | 500 | |
| 2.97% Huntington National Bank senior notes due 2020 | — | | | 499 | |
| 0.79% Huntington National Bank senior notes due 2021 (6) | 298 | | | 299 | |
| 3.33% Huntington National Bank senior notes due 2021 | 752 | | | 759 | |
| 2.55% Huntington National Bank senior notes due 2022 | 710 | | | 691 | |
| 3.16% Huntington National Bank senior notes due 2022 | 511 | | | 507 | |
| 1.83% Huntington National Bank senior notes due 2023 | 489 | | | 0 | |
| 3.60% Huntington National Bank senior notes due 2023 | 773 | | | 778 | |
| | | |
| Subordinated Notes: | | | |
| 3.86% Huntington National Bank subordinated notes due 2026 | 233 | | | 231 | |
| | | |
| Total notes issued by the bank | 3,766 | | | 5,263 | |
| FHLB Advances: | | | |
| 1.54% weighted average rate, varying maturities greater than one year | 3 | | | 5 | |
| Other: | | | |
| Huntington Technology Finance nonrecourse debt, 3.63% weighted average interest rate, varying maturities | 266 | | | 312 | |
| 2.12% Huntington Preferred Capital II - Class F securities (7) | 75 | | | 74 | |
| 2.12% Huntington Preferred Capital II - Class G securities (7) | 50 | | | 50 | |
| 2.24% Huntington Preferred Capital II - Class I securities (8) | 50 | | | 50 | |
| | | |
| Total long-term debt | $ | 8,352 | | | $ | 9,849 | |
| | | | | | | | | | | |
| | At December 31, |
| (dollar amounts in millions) | 2023 | | 2022 |
| The Parent Company: | | | |
| Senior Notes: | | | |
| 2.67% Huntington Bancshares Incorporated senior notes due 2024 | $ | 719 | | | $ | 762 | |
| 4.05% Huntington Bancshares Incorporated senior notes due 2025 | 457 | | | 481 | |
| 4.51% Huntington Bancshares Incorporated senior notes due 2028 | 716 | | | 704 | |
| 6.29% Huntington Bancshares Incorporated senior notes due 2029 | 1,266 | | | — | |
| 2.60% Huntington Bancshares Incorporated senior notes due 2030 | 692 | | | 679 | |
| 5.08% Huntington Bancshares Incorporated senior notes due 2033 | 383 | | | 379 | |
| Subordinated Notes: | | | |
| 3.55% Huntington Bancshares Incorporated subordinated notes due 2023 | — | | | 225 | |
| Huntington Capital I Trust Preferred 6.34% junior subordinated debentures due 2027 (1) (7) | 69 | | | 69 | |
| Huntington Capital II Trust Preferred 6.27% junior subordinated debentures due 2028 (2) (7) | 32 | | | 32 | |
| Sky Financial Capital Trust III 7.04% junior subordinated debentures due 2036 (3) (7) | 72 | | | 72 | |
| Sky Financial Capital Trust IV 7.04% junior subordinated debentures due 2036 (3) (7) | 74 | | | 74 | |
| 2.49% Huntington Bancshares Incorporated subordinated notes due 2036 | 1 | | | 1 | |
| 2.53% Huntington Bancshares Incorporated subordinated notes due 2036 | 512 | | | 502 | |
| | | |
| Total notes issued by the parent | 4,993 | | | 3,980 | |
| The Bank: | | | |
| Senior Notes: | | | |
| 3.60% Huntington National Bank senior notes due 2023 | — | | | 735 | |
| 6.66% Huntington National Bank senior notes due 2025 | 278 | | | 299 | |
| 4.11% Huntington National Bank senior notes due 2025 | 467 | | | 486 | |
| 5.81% Huntington National Bank senior notes due 2025 | 1,060 | | | 1,094 | |
| 4.55% Huntington National Bank senior notes due 2028 | 776 | | | 766 | |
| 5.76% Huntington National Bank senior notes due 2030 | 899 | | | 892 | |
| Subordinated Notes: | | | |
| 0.96% Huntington National Bank subordinated notes due 2025 | 129 | | | 129 | |
| 3.86% Huntington National Bank subordinated notes due 2026 | 223 | | | 218 | |
| 3.03% Huntington National Bank subordinated notes due 2029 | 156 | | | 153 | |
| 3.75% Huntington National Bank subordinated notes due 2030 | 154 | | | 151 | |
| Total notes issued by the bank | 4,142 | | | 4,923 | |
| FHLB Advances: | | | |
| 4.21% weighted average rate, varying maturities greater than one year | 2,731 | | | 211 | |
| Other: | | | |
| Huntington Technology Finance nonrecourse debt, 5.38% weighted average interest rate, varying maturities | 343 | | | 337 | |
| | | |
| 6.65% Huntington Preferred Capital II - Class G securities | — | | | 50 | |
| 7.64% Huntington Preferred Capital II - Class I securities (4) | 50 | | | 50 | |
| 8.24% Huntington Preferred Capital II - Class J securities (5) | 75 | | | 75 | |
| 8.74% Huntington Preferred Capital II - Class L securities (6) | 60 | | | 60 | |
| | | |
| Total long-term debt | $ | 12,394 | | | $ | 9,686 | |
(1)Variable effective rate at December 31, 2020,2023, based on three-month LIBOR +0.70%SOFR +0.96%.
(2)Variable effective rate at December 31, 2020,2023, based on three-month LIBOR +0.625%SOFR +0.866%.
(3)Variable effective rate at December 31, 2020,2023, based on three-month LIBOR +1.40%SOFR +1.66%.
(4)Variable effective rate at December 31, 2020,2023, based on three-month LIBOR +1.33%SOFR +2.00%.
(5)Variable effective rate at December 31, 2019,2023, based on three-month LIBOR +0.51%SOFR +2.60%.
(6)Variable effective rate at December 31, 2020,2023, based onthree-month LIBOR +0.55%on three-month SOFR +3.10%.
(8)Variable effective rate at December 31, 2020, based on three-month LIBOR +2.00%Interest Entities” for trust-preferred securities details.
20202023 Form 10-K 137126
Amounts above are net of unamortized discounts and adjustments related to hedging with derivative financial instruments. We use interest rate swaps to hedge interest rate risk of certain fixed-rate debt by converting the debt to a variable rate. See Note 2120 - “Derivative Financial Instruments“ for more information regarding such financial instruments. During the 2023 third quarter, Huntington issued $1.3 billion of fixed-to-floating senior notes. The following table presentsfixed-to-floating senior notes are due August 21, 2029 and bear an initial fixed interest rate of 6.208%. Commencing August 21, 2028, the interest rate will reset to a floating rate equal to a benchmark rate based on the Compounded SOFR Index Rate plus 202 basis points.
On January 26, 2024, Huntington issued during 2020:
| | | | | | | | | | | | | | | | | | | | | | | | | | | | | | | | | | | | | | |
| Date of Issuance | | Issuer | | Amount | | % of face value | | Interest Rate | | Term | | Maturity |
| January 2020 | | Bank | | $ | 500 | million | | 99.916 | % | | 1.80 | % | | fixed | | February 3, 2023 |
| January 2020 | | Parent | | 750 | million | | 99.597 | | | 2.55 | | | fixed | | February 4, 2030 |
| | | | | | | | | | | | |
| | | | | | | | | | | | |
| | | | | | | | | | | | |
| | | | | | | | | | | | |
During 2020, Huntington retired $500 million$1.3 billion of fixed-to-floating senior notes. The fixed-to-floating senior notes which resulted in net pre-tax lossare due February 2, 2035 and bear an initial fixed interest rate of $7 million These transactions have been recorded as loss5.709%. Commencing February 2, 2034, the interest rate will reset to a floating rate equal to a benchmark rate based on early extinguishment of debt, and reflected in other noninterest expense, in the Consolidated Income Statement.Compounded SOFR Index Rate plus 187 basis points.
Long-term debt maturities, based upon the par values of the long-term debt, for the next five years and thereafter are as follows:
| | | | | | | | | | | | | | | | | | | | | | | | | | | | | | | | | | | | | | | | | |
| (dollar amounts in millions) | 2021 | | 2022 | | 2023 | | 2024 | | 2025 | | Thereafter | | Total |
| The Parent Company: | | | | | | | | | | | | | |
| Senior notes | $ | 800 | | | $ | 700 | | | $ | 0 | | | $ | 800 | | | $ | 500 | | | $ | 750 | | | $ | 3,550 | |
| Subordinated notes | 0 | | | 0 | | | 250 | | | 0 | | | 0 | | | 253 | | | 503 | |
| The Bank: | | | | | | | | | | | | | |
| Senior notes | 1,044 | | | 1,198 | | | 1,202 | | | 0 | | | 0 | | | 0 | | | 3,444 | |
| Subordinated notes | 0 | | | 0 | | | 0 | | | 0 | | | 0 | | | 250 | | | 250 | |
| FHLB Advances | 0 | | | 1 | | | 1 | | | 0 | | | 0 | | | 1 | | | 3 | |
| Other | 22 | | | 141 | | | 136 | | | 103 | | | 39 | | | 0 | | | 441 | |
| Total | $ | 1,866 | | | $ | 2,040 | | | $ | 1,589 | | | $ | 903 | | | $ | 539 | | | $ | 1,254 | | | $ | 8,191 | |
These maturities are based upon the par values of the long-term debt. | | | | | | | | | | | | | | | | | | | | | | | | | | | | | | | | | | | | | | | | | |
| (dollar amounts in millions) | 2024 | | 2025 | | 2026 | | 2027 | | 2028 | | Thereafter | | Total |
| The Parent Company: | | | | | | | | | | | | | |
| Senior notes | $ | 734 | | | $ | 468 | | | $ | — | | | $ | — | | | $ | 750 | | | $ | 2,400 | | | $ | 4,352 | |
| Subordinated notes | — | | | — | | | — | | | 70 | | | 32 | | | 707 | | | 809 | |
| The Bank: | | | | | | | | | | | | | |
| Senior notes | — | | | 1,817 | | | — | | | — | | | 800 | | | 900 | | | 3,517 | |
| Subordinated notes | — | | | 130 | | | 239 | | | — | | | — | | | 300 | | | 669 | |
| FHLB Advances | — | | | 200 | | | 1,500 | | | 500 | | | 500 | | | 1 | | | 2,701 | |
| Other | 70 | | | 75 | | | 151 | | | 125 | | | 106 | | | 1 | | | 528 | |
| Total | $ | 804 | | | $ | 2,690 | | | $ | 1,890 | | | $ | 695 | | | $ | 2,188 | | | $ | 4,309 | | | $ | 12,576 | |
The terms of certain long-term debt obligations contain various restrictive covenants including limitations on the acquisition of additional debt, dividend payments, and the disposition of subsidiaries. As of December 31, 2020,2023, Huntington was in compliance with all such covenants.
127 Huntington Bancshares Incorporated
13.
12. OTHER COMPREHENSIVE INCOME
The components of Huntington’s OCI for the years ended December 31, 2020, 2019, and 2018, were as follows:
| | | | | | | | | | | | | | | | | |
| 2020 |
| Tax (expense) |
| (dollar amounts in millions) | Pretax | | Benefit | | After-tax |
| | | | | |
| Unrealized gains (losses) on available-for-sale securities arising during the period | $ | 235 | | | $ | (52) | | | $ | 183 | |
| Less: Reclassification adjustment for realized net losses (gains) included in net income | 42 | | | (9) | | | 33 | |
| Net change in unrealized holding gains (losses) on available-for-sale securities | 277 | | | (61) | | | 216 | |
| | | | | |
| | | | | |
| | | | | |
| Net change in fair value on cash flow hedges | 302 | | | (68) | | | 234 | |
| Net change in pension and other post-retirement obligations | (3) | | | 1 | | | (2) | |
| Total other comprehensive income (loss) | $ | 576 | | | $ | (128) | | | $ | 448 | |
| | | | | | | | | | | | | | | | | |
| (dollar amounts in millions) | Pretax | | Tax (expense) benefit | | After-tax |
| Year Ended December 31, 2023 | | | | | |
| | | | | |
| Unrealized losses on available-for-sale securities arising during the period, net of hedges | $ | 154 | | | $ | (36) | | | $ | 118 | |
| Reclassification adjustment for realized net losses included in net income | 47 | | | (11) | | | 36 | |
| Total unrealized gains (losses) on available-for-sale securities, net of hedges | 201 | | | (47) | | | 154 | |
| | | | | |
| Unrealized gains (losses) on cash flow hedges during the period | 162 | | | (37) | | | 125 | |
| Reclassification adjustment for cash flow hedges included in net income | 187 | | | (43) | | | 144 | |
| Net change related to cash flow hedges on loans | 349 | | | (80) | | | 269 | |
| | | | | |
| | | | | |
| Translation adjustments, net of hedges (1) | 2 | | | — | | | 2 | |
| Change in accumulated unrealized gains for pension and other post-retirement obligations | (4) | | | 1 | | | (3) | |
| Other comprehensive income (loss) | $ | 548 | | | $ | (126) | | | $ | 422 | |
| Year Ended December 31, 2022 | | | | | |
| | | | | |
| Unrealized losses on available-for-sale securities arising during the period, net of hedges | $ | (2,934) | | | $ | 673 | | | $ | (2,261) | |
| Reclassification adjustment for realized net losses included in net income | 100 | | | (23) | | | 77 | |
| Total unrealized gains (losses) on available-for-sale securities, net of hedges | (2,834) | | | 650 | | | (2,184) | |
| | | | | |
| Unrealized gains (losses) on cash flow hedges during the period | (896) | | | 201 | | | (695) | |
| Reclassification adjustment for cash flow hedges included in net income | — | | | — | | | — | |
| Net change related to cash flow hedges on loans | (896) | | | 201 | | | (695) | |
| | | | | |
| | | | | |
| Translation adjustments, net of hedges (1) | (5) | | | — | | | (5) | |
| Change in accumulated unrealized gains for pension and other post-retirement obligations | 19 | | | (4) | | | 15 | |
| Other comprehensive income (loss) | $ | (3,716) | | | $ | 847 | | | $ | (2,869) | |
| Year Ended December 31, 2021 | | | | | |
| | | | | |
| Unrealized losses on available-for-sale securities arising during the period, net of hedges | $ | (361) | | | $ | 81 | | | $ | (280) | |
| Reclassification adjustment for realized net losses included in net income | 34 | | | (8) | | | 26 | |
| Total unrealized gains (losses) on available-for-sale securities, net of hedges | (327) | | | 73 | | | (254) | |
| | | | | |
| Unrealized gains (losses) on cash flow hedges during the period | (257) | | | 65 | | | (192) | |
| Reclassification adjustment for cash flow hedges included in net income | — | | | — | | | — | |
| Net change related to cash flow hedges on loans | (257) | | | 65 | | | (192) | |
| | | | | |
| | | | | |
| Translation adjustments, net of hedges (1) | (3) | | | — | | | (3) | |
| Change in accumulated unrealized gains for pension and other post-retirement obligations | 36 | | | (8) | | | 28 | |
| Other comprehensive income (loss) | $ | (551) | | | $ | 130 | | | $ | (421) | |
| | | | | | | | | | | | | | | | | |
| | 2019 |
| | | | Tax (expense) | | |
| (dollar amounts in millions) | Pretax | | Benefit | | After-tax |
| | | | | |
| Unrealized gains (losses) on available-for-sale securities arising during the period | $ | 403 | | | $ | (89) | | | $ | 314 | |
| Less: Reclassification adjustment for realized net losses (gains) included in net income | 26 | | | (5) | | | 21 | |
| Net change in unrealized holding gains (losses) on available-for-sale securities | 429 | | | (94) | | | 335 | |
| | | | | |
| | | | | |
| | | | | |
| Net change in fair value on cash flow hedges | 26 | | | (3) | | | 23 | |
| Net change in pension and other post-retirement obligations | (7) | | | 2 | | | (5) | |
| Total other comprehensive income (loss) | $ | 448 | | | $ | (95) | | | $ | 353 | |
1382023 Form 10-K Huntington Bancshares Incorporated128
| | | | | | | | | | | | | | | | | |
| | 2018 |
| | | | Tax (expense) | | |
| (dollar amounts in millions) | Pretax | | Benefit | | After-tax |
| | | | | |
| Unrealized gains (losses) on available-for-sale securities arising during the period | $ | (151) | | | $ | 35 | | | $ | (116) | |
| Less: Reclassification adjustment for net gains (losses) included in net income | 41 | | | (9) | | | 32 | |
| Net change in unrealized holding gains (losses) on available-for-sale debt securities | (110) | | | 26 | | | (84) | |
| | | | | |
| | | | | |
| | | | | |
| | | | | |
| | | | | |
| | | | | |
| Net change in pension and post-retirement obligations | 4 | | | 0 | | | 4 | |
| Total other comprehensive income (loss) | $ | (106) | | | $ | 26 | | | $ | (80) | |
Activity in accumulated OCI for the years ended December 31, 2020 and 2019 were as follows:
| | (dollar amounts in millions) | (dollar amounts in millions) | Unrealized gains (losses) on debt securities (1) | | | Change in fair value related to cash flow hedges | | Unrealized gains (losses) for pension and other post-retirement obligations | | Total |
| December 31, 2018 | $ | (363) | | | | $ | 0 | | | $ | (246) | | | $ | (609) | |
| (dollar amounts in millions) | |
| (dollar amounts in millions) | | Unrealized (losses) gains on available-for-sale securities, net of hedges (1) | | | | Net change related to cash flow hedges on loans | | Translation adjustments, net of hedges | | Unrealized
(losses) gains for
pension and other
post-retirement
obligations | | Total |
| December 31, 2020 | |
| Other comprehensive income (loss) before reclassifications | |
| Amounts reclassified from accumulated OCI to earnings | |
| Period change | |
| December 31, 2021 | |
| | Other comprehensive income (loss) before reclassifications | |
| Other comprehensive income (loss) before reclassifications | |
| Other comprehensive income (loss) before reclassifications | |
| Amounts reclassified from accumulated OCI to earnings | |
| Period change | |
| | December 31, 2022 | |
| December 31, 2022 | |
| December 31, 2022 | |
| | Other comprehensive income before reclassifications | |
| Other comprehensive income before reclassifications | |
| Other comprehensive income before reclassifications | Other comprehensive income before reclassifications | 314 | | | | 23 | | | 0 | | | 337 | |
| Amounts reclassified from accumulated OCI to earnings | Amounts reclassified from accumulated OCI to earnings | 21 | | | | 0 | | | (5) | | | 16 | |
| Period change | Period change | 335 | | | | 23 | | | (5) | | | 353 | |
| | December 31, 2019 | (28) | | | | 23 | | | (251) | | | (256) | |
| | Other comprehensive income before reclassifications | 183 | | | | 234 | | | 0 | | | 417 | |
| Amounts reclassified from accumulated OCI to earnings | 33 | | | | 0 | | | (2) | | | 31 | |
| Period change | 216 | | | | 234 | | | (2) | | | 448 | |
| | December 31, 2020 | $ | 188 | | | | $ | 257 | | | $ | (253) | | | $ | 192 | |
| December 31, 2023 | |
| December 31, 2023 | |
| December 31, 2023 | |
(1)AOCI amounts at December 31, 2020, 2019,2023, 2022, and 20182021 include $69$58 million, $121$66 million, and $137$27 million, respectively, of net of unrealized losses (after-tax) on securities transferred from the available-for-sale securities portfolio to the held-to-maturity securities portfolio. The net unrealized losses will be recognized in earnings over the remaining life of the security using the effective interest method.
14.13. SHAREHOLDERS’ EQUITY
Preferred Stock
The following is a summary of Huntington’s non-cumulative, non-voting, perpetual preferred stock outstanding as of December 31, 2020.outstanding.
| | | | | | | | | | | | | | | | | | | | | | | | | | | | | | | | |
| (dollar amounts in millions, share amounts in thousands) | | | | | | |
| Series | | Issuance Date | | Total Shares Outstanding | | Carrying Amount | | Dividend Rate | | Earliest Redemption Date |
| | | | | | | | | | |
| Series B | | 12/28/2011 | | 35,500 | | | $ | 23 | | | 3-mo. LIBOR + 270 bps | | 1/15/2017 |
| Series D | | 3/21/2016 | | 400,000 | | | 386 | | | 6.25 | % | | 4/15/2021 |
| Series D | | 5/5/2016 | | 200,000 | | | 199 | | | 6.25 | | | 4/15/2021 |
| Series C | | 8/16/2016 | | 100,000 | | | 100 | | | 5.875 | | | 10/15/2021 |
| Series E | | 2/27/2018 | | 5,000 | | | 495 | | | 5.70 | | | 4/15/2023 |
| Series F | | 5/27/2020 | | 5,000 | | | 494 | | | 5.625 | | | 7/15/2030 |
| Series G | | 8/3/2020 | | 5,000 | | | 494 | | | 4.45 | | | 10/15/2027 |
| Total | | | | 750,500 | | | $ | 2,191 | | | | | |
| | | | | | | | | | | | | | | | | | | | | | | | | | | | | | | | | | | | | | | | |
| (dollar amounts in millions) | | | | Carrying Amount |
| Series | | Issuance Date | | Shares Outstanding | | | | Dividend Rate | | Earliest Optional Redemption Date (1) | | December 31, 2023 | | December 31, 2022 |
| Series B (2) | | 12/28/2011 | | 35,500 | | | | | Variable (3) | | 1/15/2017 | | $ | 23 | | | $ | 23 | |
| | | | | | | | | | | | | | |
| | | | | | | | | | | | | | |
| | | | | | | | | | | | | | |
| Series E (4) | | 2/27/2018 | | 4,087 | | | | | Variable (5) | | 4/15/2023 | | 405 | | | 495 | |
| Series F (4) | | 5/27/2020 | | 5,000 | | | | | 5.625 | % | | 7/15/2030 | | 494 | | | 494 | |
| Series G (4) | | 8/3/2020 | | 5,000 | | | | | 4.45 | | | 10/15/2027 | | 494 | | | 494 | |
| Series H (2) | | 2/2/2021 | | 500,000 | | | | | 4.50 | | | 4/15/2026 | | 486 | | | 486 | |
| Series I (6) | | 6/9/2021 | | 7,000 | | | | | 5.70 | | | 12/01/2022 | | 175 | | | 175 | |
| Series J (2) | | 3/6/2023 | | 325,000 | | | | | 6.875 | | | 4/15/2028 | | 317 | | | — | |
| Total | | | | 881,587 | | | | | | | | | $ | 2,394 | | | $ | 2,167 | |
(1)Redeemable at Huntington’s option on the date stated or on a quarterly basis thereafter.
(2)Series B, D,H, and C ofJ preferred stock hashave a liquidation value and redemption price per share of $1,000, plus any declared and unpaid dividends.
(3)Series B dividend rate converted to 3-month CME Term SOFR + 26 bps LIBOR spread adjustment + 270 bps effective July 15, 2023. Prior to July 15, 2023, the dividend rate was 3-month LIBOR + 270 bps.
(4)Series E, F, and G, preferred stock hashave a liquidation value and redemption price per share of $100,000, plus any declared and unpaid dividends. All
(5)Series E dividend rate converted to 3-month CME Term SOFR + 26 bps LIBOR spread adjustment + 288 bps effective July 15, 2023. Prior to July 15, 2023, the dividend rate was 3-month LIBOR + 288 bps.
(6)Series I preferred stock has no stated maturitya liquidation value and redemption is solely at the option of the Company. Under current rules, any redemption of the preferred stock is subject to prior approval of the FRB.
Preferred F Stock issued and outstanding
During the 2020 second quarter, Huntington issued $500 million of preferred stock. Huntington issued 500,000 depositary shares, each depositary shares representing a 1/100th ownership interest in aprice per share of 5.625% Series F Non-Cumulative Perpetual Preferred Stock (Series F Preferred Stock), par value $0.01 per share, with a liquidation preference of $100,000 per share (equivalent to $1,000 per depositary share). Each holder of a depositary share will be entitled to all proportional rights and preferences of the Series F Preferred Stock (including dividend, voting,
redemption, and liquidation rights). Costs of $6 million related to the issuance of the Series F Preferred Stock are reported as a direct deduction from the face amount of the stock.
Dividends on the Series F Preferred Stock will be non-cumulative and payable quarterly in arrears, when, as and if authorized by the Company's board of directors or a duly authorized committee of the board and declared by the Company, at an annual rate of 5.625% per year on the liquidation preference of $100,000 per share, equivalent to $1,000 per depositary share. The dividend payment dates will be the fifteenth day of each January, April, July and October, which commenced on October 15, 2020.
The Series F Preferred Stock is perpetual and has no maturity date. Huntington may redeem the Series F Preferred Stock at its option, (i) in whole or in part, from time to time, on any dividend payment date on or after July 15, 2030 or (ii) in whole but not in part, within 90 days following a regulatory capital treatment event, in each case, at a redemption price equal to $100,000 per share (equivalent to $1,000 per depositary share),$25,000, plus any declared and unpaid dividends, without regard to any undeclared dividends, on the Series F Preferred Stock prior to the date fixed for redemption. If Huntington redeems the Series F Preferred Stock, the depositary will redeem a proportional number of depositary shares. Neither the holders of Series Preferred F Stock nor holders of depositary shares will have the right to require the redemption or repurchase of the Series F Preferred Stock or the depositary shares.dividends.
Preferred G Stock issued and outstanding
During the 2020 third quarter, Huntington issued $500 million of preferred stock. Huntington issued 500,000 depositary shares, each depositary shares representing a 1/100th ownership interest in a share of 4.450% Series G Non-Cumulative Perpetual Preferred Stock (Series G Preferred Stock), par value $0.01 per share, with a liquidation preference of $100,000 per share (equivalent to $1,000 per depositary share). Each holder of a depositary share will be entitled to all proportional rights and preferences of the Series G Preferred Stock (including dividend, voting, redemption, and liquidation rights). Costs of $6 million related to the issuance of the Series G Preferred Stock are reported as a direct deduction from the face amount of the stock.
Dividends on the Series G Preferred Stock will be non-cumulative and payable quarterly in arrears, when, as and if authorized by the Company's board of directors or a duly authorized committee of the board and declared by the Company, at an annual rate of 4.450% per year on the liquidation preference of $100,000 per share, equivalent to $1,000 per depositary share. The dividend payment dates will be the fifteenth day of each January, April, July and October, commencing on January 15, 2021.
The Series G Preferred Stock is perpetual and has no maturity date. Huntington may redeem the Series G Preferred Stock at its option, (i) in whole or in part, from time to time, on any dividend payment date on or after October 15, 2027 or (ii) in whole but not in part, within 90 days following a regulatory capital treatment event, in each case, at a redemption price equal to $100,000 per share (equivalent to $1,000 per depositary share), plus any declared and unpaid dividends, without regard to any undeclared dividends, on the Series G Preferred Stock prior to the date fixed for redemption. If Huntington redeems the Series G Preferred Stock, the depositary will redeem a proportional number of depositary shares. Neither the holders of Series Preferred G Stock nor holders of depositary shares will have the right to require the redemption or repurchase of the Series G Preferred Stock or the depositary shares.
Preferred H Stock issued and outstanding
On February 2, 2021, Huntington issued $500 million of preferred stock. Huntington issued 20,000,000 depositary shares, each representing a 1/40th ownership interest in a share of 4.50% Series H Non-Cumulative Perpetual Preferred Stock (Preferred H Stock), par value $0.01 per share, with a liquidation preference of $1,000 per share (equivalent to $25 per depositary share). Each holder of a depositary share, will be entitled to all proportional rights and preferences of the Preferred H Stock (including dividend, voting, redemption, and liquidation rights). Costs of $16 million related to the issuance of the Preferred H Stock are reported as a direct deduction from the face amount of the stock.
Dividends on the Preferred H Stock will be non-cumulative and payable quarterly in arrears, when, as and if authorized by the Company's board of directors or a duly authorized committee of the board and declared by the Company, at an annual rate of 4.50% per year on the liquidation preference of $1,000 per share, equivalent to $25
140129 Huntington Bancshares Incorporated
per depositary share. The dividend payment dates will be the fifteenth day of each January, April, July and October, commencing on July 15, 2021, or the next business day if any such day is not a business day.
The Preferred H Stock is perpetual and has no maturity date. Huntington may redeem the Preferred H Stock at its option, (i) in whole or in part, from time to time, on any dividend payment date on or after April 15, 2026 or (ii) in whole but not in part, within 90 days following a regulatory capital treatment event, in each case, at a redemption price equal to $1,000 per share (equivalent to $25 per depositary share), plus any declared and unpaid dividends and, in the case of a redemption following a regulatory capital treatment event, the pro-rated portion of dividends, whether or not declared, for the dividend period in which such redemption occurs. If Huntington redeems the Preferred H Stock, the depositary will redeem a proportional number of depositary shares. Neither the holders of Preferred H Stock nor holders of depositary shares will have the right to require the redemption or repurchase of the Preferred H Stock or the depositary shares. Any redemption of the Preferred H Stock is subject to Huntington's receipt of any required prior approval by the Board of Governors of the Federal Reserve System.
The following table presents the dividends declared for each series of Preferred shares forshares.
| | | | | | | | | | | | | | | | | | | | | | | | | | | | | | | | | | | | | | |
| | Year Ended December 31, |
| | 2023 | | 2022 | | 2021 |
| (amounts in millions, except per share data) | | Cash Dividend Declared Per Share | | | | Cash Dividend Declared Per Share | | | | Cash Dividend Declared Per Share | | |
| Preferred Series | | | Amount ($) | | | Amount ($) | | | Amount ($) |
| Series B | | $ | 80.28 | | | $ | (3) | | | $ | 46.68 | | | $ | (2) | | | $ | 28.69 | | | $ | (1) | |
| Series C | | — | | | — | | | — | | | — | | | 44.07 | | | (4) | |
| Series D | | — | | | — | | | — | | | — | | | 31.25 | | | (18) | |
| Series E | | 7,753.75 | | | (37) | | | 5,700.00 | | | (29) | | | 5,700.00 | | | (29) | |
| Series F | | 5,625.00 | | | (28) | | | 5,625.00 | | | (28) | | | 5,625.00 | | | (28) | |
| Series G | | 4,450.00 | | | (22) | | | 4,450.00 | | | (22) | | | 4,450.00 | | | (23) | |
| Series H | | 45.00 | | | (23) | | | 45.00 | | | (22) | | | 42.00 | | | (21) | |
| Series I | | 1,425.00 | | | (10) | | | 1,425.00 | | | (10) | | | 1,068.75 | | | (7) | |
| Series J | | 59.02 | | | (19) | | | — | | | — | | | — | | | — | |
| Total | | | | $ | (142) | | | | | $ | (113) | | | | | $ | (131) | |
| | | | | | | | | | | | |
During the years ended December 31, 2020, 2019, and 2018:fourth quarter of 2023, $90 million of outstanding Series E Non-Cumulative Perpetual Preferred Stock, par value $0.01 per share, was repurchased.
| | | | | | | | | | | | | | |
| (amounts in millions, except per share data) | | Cash Dividend Declared Per Share | | |
| Preferred Series | | | Amount ($) |
| Year Ended December 31, 2020 |
| Series B | | $ | 35.91 | | | $ | (1) | |
| Series C | | 58.76 | | | (6) | |
| Series D | | 62.50 | | | (37) | |
| Series E | | 5,700.00 | | | (29) | |
| Series F | | 3,468.75 | | | (17) | |
| Series G | | 1,915.97 | | | (10) | |
| | | | $ | (100) | |
| | | | |
| Year Ended December 31, 2019 |
| Series B | | $ | 51.22 | | | $ | (2) | |
| Series C | | 58.76 | | | (6) | |
| Series D | | 62.50 | | | (37) | |
| Series E | | 5,700.00 | | | (29) | |
| | | | |
| | | | |
| | | | $ | (74) | |
| | | | |
| Year Ended December 31, 2018 |
| Series B | | $ | 49.11 | | | $ | (3) | |
| Series C | | 58.76 | | | (6) | |
| Series D | | 62.50 | | | (37) | |
| Series E | | 4,892.50 | | | (24) | |
| | | | |
| | | | |
| | | | $ | (70) | |
On July 15, 2021, all $600 million of outstanding Series D Non-Cumulative Perpetual Preferred Stock, par value $0.01 per share, was redeemed.
15.14. EARNINGS PER SHARE
Basic earnings per share is the amount of earnings (adjusted for preferred stock dividends declared onand the impact of preferred stock)stock repurchases and redemptions) available to each share of common stock outstanding during the reporting period. Diluted earnings per share is the amount of earnings available to each share of common stock outstanding during the reporting period adjusted to include the effect of potentially dilutive common shares. Potentially dilutive common shares include incremental shares issued for stock options, restricted stock units and awards, and distributions from deferred compensation plans. Potentially dilutive common shares are excluded from the computation of diluted earnings per share in periods in which the effect would be antidilutive.
20202023 Form 10-K 141130
The calculation of basic and diluted earnings per share for each of the three years ended December 31 wasis as follows:
| | Year Ended December 31, |
| (amounts in millions, except per share data, share count in thousands) | 2020 | | 2019 | | 2018 |
| | Net income | $ | 817 | | | $ | 1,411 | | | $ | 1,393 | |
| Year Ended December 31, | | | Year Ended December 31, |
| (dollar amounts in millions, except per share data, share count in thousands) | | (dollar amounts in millions, except per share data, share count in thousands) | 2023 | | 2022 | | 2021 |
| Basic earnings per common share: | |
| Net income attributable to Huntington | |
| Net income attributable to Huntington | |
| Net income attributable to Huntington | |
| Preferred stock dividends | Preferred stock dividends | (100) | | | (74) | | | (70) | |
| Impact of preferred stock repurchases and redemptions | |
| Net income available to common shareholders | Net income available to common shareholders | $ | 717 | | | $ | 1,337 | | | $ | 1,323 | |
| Average common shares issued and outstanding | |
| Basic earnings per common share | |
| Diluted earnings per common share: | |
| | Average dilutive potential common shares: | |
| | | Average common shares issued and outstanding | 1,017,117 | | | 1,038,840 | | | 1,081,542 | |
| Dilutive potential common shares | |
| | Average dilutive potential common shares: | |
| | Average dilutive potential common shares: | |
| Stock options and restricted stock units and awards | |
| Stock options and restricted stock units and awards | |
| Stock options and restricted stock units and awards | Stock options and restricted stock units and awards | 10,613 | | | 12,994 | | | 16,529 | |
| Shares held in deferred compensation plans | Shares held in deferred compensation plans | 4,953 | | | 4,245 | | | 3,511 | |
| Dilutive impact of Preferred Stock (1) | 0 | | | 0 | | | 4,403 | |
| Other | 0 | | | 0 | | | 0 | |
| Dilutive potential common shares | 15,566 | | | 17,239 | | | 24,443 | |
| | Average dilutive potential common shares | |
| | Average dilutive potential common shares | |
| | Average dilutive potential common shares | |
| Total diluted average common shares issued and outstanding | Total diluted average common shares issued and outstanding | 1,032,683 | | | 1,056,079 | | | 1,105,985 | |
| | Basic earnings per common share | $ | 0.71 | | | $ | 1.29 | | | $ | 1.22 | |
| | Diluted earnings per common share | Diluted earnings per common share | $ | 0.69 | | | $ | 1.27 | | | $ | 1.20 | |
| | Anti-dilutive awards (2) | 9,760 | | | 5,253 | | | 2,307 | |
| Diluted earnings per common share | |
| | Diluted earnings per common share | |
| | Anti-dilutive awards (1) | |
| Anti-dilutive awards (1) | |
| Anti-dilutive awards (1) | |
(1)The 2018 total diluted average common shares issued and outstanding was impacted by using the if-converted method.
(2)Reflects the total number of shares related to outstanding options that have been excluded from the computation of diluted earnings per share because the impact would have been anti-dilutive.
16. NONINTEREST INCOME15. REVENUE FROM CONTRACTS WITH CUSTOMERS
Huntington earns a varietyRevenue is segregated based on the nature of revenue including interestproduct and fees from customersservices offered as well as revenues from non-customers. Certain sourcespart of revenue are recognized within interest or fee income and are outside of the scope of ASC Topic 606,contractual arrangements. Revenue from Contractscontracts with Customers (“ASC 606”). Other sources of revenue fallcustomers within the scope of ASC 606 is broadly segregated within the following noninterest income categories:
•Payments and cash management revenue primarily includes interchange fees earned on debit cards and credit cards and fees earned from providing cash management services to corporate deposit customers. Within the scope of ASC 606, Huntington recognizes debit and credit card interchange fees for services performed related to authorization and settlement of a cardholder’s transaction with a merchant. Revenue is recognized when a cardholder’s transaction is approved and settled. Certain volume or transaction based interchange expenses (net of rebates) paid to the payment network reduce the interchange revenue and are presented net on the income statement. Similarly, rewards payable under a reward program to cardholders are recognized as a reduction of the transaction price and are presented net against the interchange revenue. Revenue from providing cash management services to corporate deposit customers is recognized over the period of time services are rendered.
•Wealth and asset management revenue primarily includes fee income generated from providing wealth and asset management services to personal, corporate, and institutional customers, including, but not limited to, fees and commissions earned from trust and investment management services, sales of annuity products, and tax reporting services. Within the scope of ASC 606, Huntington recognizes revenue from wealth and asset management services are rendered over a period of time. Huntington may also recognize revenue from referring a customer to outside third-parties to purchase annuities and mutual funds which is recognized in the period earned.
131 Huntington Bancshares Incorporated
•Customer deposit and loan fees primarily includes fees and other charges Huntington receives related to service charges on deposit accounts, loan commitments and standby letters of credits, and other deposit and lending activity. Within the scope of ASC 606, Huntington recognizes fees and other charges for providing various services, including, but not limited to, maintaining accounts, providing overdraft services, transferring funds, and accepting and executing stop-payment orders for customers. Revenue includes both fixed fees (e.g., account maintenance fee), recognized over a period of time, and transaction fees (e.g., wire-transfer fee), recognized when a specific service is performed. Huntington may, from time to time, waive certain fees for customers but generally does not reduce the transaction price to reflect variability for future reversals due to the insignificance of the amounts. Waiver of fees reduces the revenue in the period the waiver is granted to the customer.
•Capital markets and advisory fees primarily includes advisory fees for merger, acquisition and capital markets activity,interest rate derivative fees, underwriting fees, foreign exchange fees, loan syndication fees, and fees earned from customer-related sales activity. Within the scope of ASC 606, Huntington recognizes revenue associated with capital markets and advisory fees when the related transaction closes.
•Leasing revenue primarily includes income from operating lease payments and termination of leases. Within the scope of ASC 606, Huntington recognizes leasing revenue when, or as, the performance obligation is satisfied. Inherent variability in the transaction price is not recognized until the uncertainty affecting the variability is resolved.
•Insurance income primarily includes agency commissions from the sale of insurance premiums to customers. All insurance income is recognized within noninterest income. These revenuesthe scope of ASC 606. Huntington receives commissions from the sales of insurance policies to customers. The initial commission is recognized when the insurance policy is sold to a customer. Huntington is also entitled to renewal commissions and, in some cases, profit sharing which are included within various sectionsrecognized in subsequent periods.
•Other - Within the scope of ASC 606, Huntington recognizes a variety of other miscellaneous revenue streams which are recognized when, or as, the Consolidated Financial Statements. performance obligation is satisfied.
The following table shows Huntington’s total noninterest income segregated between revenue with contracts with customers within the scope of ASC 606 and thoserevenue within the scope of other GAAP Topics.
| | Year Ended December 31, |
| | Year Ended December 31, | | | | Year Ended December 31, |
| (dollar amounts in millions) | (dollar amounts in millions) | | 2020 | | 2019 | | 2018 | (dollar amounts in millions) | | 2023 | | 2022 | | 2021 |
| Noninterest income | Noninterest income | | |
| Noninterest income from contracts with customers | | $ | 884 | | | $ | 939 | | | $ | 881 | |
| Noninterest income within the scope of other GAAP topics | | 707 | | | 515 | | | 440 | |
| Revenue from contracts with customers | |
| Revenue from contracts with customers | |
| Revenue from contracts with customers | |
| Revenue within the scope of other GAAP topics | |
| Total noninterest income | Total noninterest income | | $ | 1,591 | | | $ | 1,454 | | | $ | 1,321 | |
Revenue is recorded in the business segment responsible for the related product or service. Fee sharing arrangements exist to allocate portions of such revenue to other business segments involved in selling to, or providing service to, customers. Business segment results are determined based upon management’s reporting system, which assigns balance sheet and income statement items to each of the business segments. The process is designed around Huntington’s organizational and management structure and, accordingly, the results derived are not necessarily comparable with similar information published by other financial institutions.
1422023 Form 10-K Huntington Bancshares Incorporated132
The following table illustrates the disaggregation by operating segment and major revenue stream and reconciles disaggregated revenue to segment revenue presented in Note 2625 - “Segment Reporting”: | | | | | | | | | | | | | | | | | | | | | | | | | | | | | | | | | | | |
| Year Ended December 31, 2020 |
| (dollar amounts in millions) | Consumer & Business Banking | | Commercial Banking | | Vehicle Finance | | RBHPCG | | Treasury / Other | | Huntington Consolidated |
| Major Revenue Streams | | | | | | | | | | | |
| Service charges on deposit accounts | $ | 217 | | | $ | 74 | | | $ | 6 | | | $ | 4 | | | $ | 0 | | | $ | 301 | |
| Card and payment processing income | 221 | | | 15 | | | 0 | | | 0 | | | 0 | | | 236 | |
| Trust and investment management services | 44 | | | 5 | | | 0 | | | 140 | | | 0 | | | 189 | |
| Insurance income | 43 | | | 7 | | | 0 | | | 46 | | | 1 | | | 97 | |
| Other noninterest income | 26 | | | 22 | | | 2 | | | 11 | | | 0 | | | 61 | |
| Net revenue from contracts with customers | $ | 551 | | | $ | 123 | | | $ | 8 | | | $ | 201 | | | $ | 1 | | | $ | 884 | |
Noninterest income within the scope of other GAAP topics | 394 | | | 241 | | | 1 | | | 0 | | | 71 | | | 707 | |
| Total noninterest income | $ | 945 | | | $ | 364 | | | $ | 9 | | | $ | 201 | | | $ | 72 | | | $ | 1,591 | |
| | | | | | | | | | | |
| | | | | | | | | | | |
| Year Ended December 31, 2019 |
| (dollar amounts in millions) | Consumer & Business Banking | | Commercial Banking | | Vehicle Finance | | RBHPCG | | Treasury / Other | | Huntington Consolidated |
| Major Revenue Streams | | | | | | | | | | | |
| Service charges on deposit accounts | $ | 297 | | | $ | 64 | | | $ | 7 | | | $ | 4 | | | $ | 0 | | | $ | 372 | |
| Card and payment processing income | 218 | | | 15 | | | 0 | | | 0 | | | 0 | | | 233 | |
| Trust and investment management services | 34 | | | 4 | | | 0 | | | 139 | | | 1 | | | 178 | |
| Insurance Income | 34 | | | 6 | | | 0 | | | 47 | | | 1 | | | 88 | |
| Other noninterest income | 32 | | | 24 | | | 4 | | | 6 | | | 2 | | | 68 | |
| Net revenue from contracts with customers | $ | 615 | | | $ | 113 | | | $ | 11 | | | $ | 196 | | | $ | 4 | | | $ | 939 | |
Noninterest income within the scope of other GAAP topics | 210 | | | 246 | | | 1 | | | 2 | | | 56 | | | 515 | |
| Total noninterest income | $ | 825 | | | $ | 359 | | | $ | 12 | | | $ | 198 | | | $ | 60 | | | $ | 1,454 | |
| | | | | | | | | | | |
| | | | | | | | | | | |
| Year Ended December 31, 2018 |
| (dollar amounts in millions) | Consumer & Business Banking | | Commercial Banking | | Vehicle Finance | | RBHPCG | | Treasury / Other | | Huntington Consolidated |
| Major Revenue Streams | | | | | | | | | | | |
| Service charges on deposit accounts | $ | 290 | | | $ | 64 | | | $ | 5 | | | $ | 4 | | | $ | 0 | | | $ | 363 | |
| Card and payment processing income | 198 | | | 11 | | | 0 | | | 0 | | | 0 | | | 209 | |
| Trust and investment management services | 28 | | | 4 | | | 0 | | | 139 | | | 0 | | | 171 | |
| Insurance Income | 34 | | | 5 | | | 0 | | | 41 | | | 2 | | | 82 | |
| Other noninterest income | 38 | | | 6 | | | 3 | | | 8 | | | 1 | | | 56 | |
| Net revenue from contracts with customers | $ | 588 | | | $ | 90 | | | $ | 8 | | | $ | 192 | | | $ | 3 | | | $ | 881 | |
Noninterest income within the scope of other GAAP topics | 156 | | | 231 | | | 3 | | | 1 | | | 49 | | | 440 | |
| Total noninterest income | $ | 744 | | | $ | 321 | | | $ | 11 | | | $ | 193 | | | $ | 52 | | | $ | 1,321 | |
| | | | | | | | | | | | | | | | | | | | | | | | | | | |
| | | | | | | | | | | |
| (dollar amounts in millions) | Consumer & Business Banking | | Commercial Banking | | | | | | Treasury / Other | | Huntington Consolidated |
| Year Ended December 31, 2023 | | | | | | | | | | | |
| Major Revenue Streams | | | | | | | | | | | |
| Payments and cash management revenue | $ | 433 | | | $ | 103 | | | | | | | $ | — | | | $ | 536 | |
| Wealth and asset management revenue | 313 | | | 15 | | | | | | | — | | | 328 | |
| Customer deposit and loan fees | 203 | | | 8 | | | | | | | — | | | 211 | |
| Capital markets and advisory fees | 16 | | | 118 | | | | | | | (2) | | | 132 | |
| Leasing revenue | 2 | | | 49 | | | | | | | — | | | 51 | |
| Insurance income | 64 | | | 11 | | | | | | | (1) | | | 74 | |
| Other | 67 | | | 3 | | | | | | | (2) | | | 68 | |
| Net revenue from contracts with customers | $ | 1,098 | | | $ | 307 | | | | | | | $ | (5) | | | $ | 1,400 | |
| Noninterest income within the scope of other GAAP topics | 159 | | | 339 | | | | | | | 23 | | | 521 | |
| Total noninterest income | $ | 1,257 | | | $ | 646 | | | | | | | $ | 18 | | | $ | 1,921 | |
| | | | | | | | | | | |
| | | | | | | | | | | |
| | | | | | | | | | | |
| | | | | | | | | | | |
| Year Ended December 31, 2022 | | | | | | | | | | | |
| Major Revenue Streams | | | | | | | | | | | |
| Payments and cash management revenue | $ | 405 | | | $ | 108 | | | | | | | $ | — | | | $ | 513 | |
| Wealth and asset management revenue | 294 | | | 6 | | | | | | | — | | | 300 | |
| Customer deposit and loan fees | 226 | | | 5 | | | | | | | — | | | 231 | |
| Capital markets and advisory fees | 15 | | | 98 | | | | | | | (3) | | | 110 | |
| Leasing revenue | 1 | | | 66 | | | | | | | — | | | 67 | |
| Insurance income | 71 | | | 9 | | | | | | | (1) | | | 79 | |
| Other | 8 | | | 12 | | | | | | | (2) | | | 18 | |
| Net revenue from contracts with customers | $ | 1,020 | | | $ | 304 | | | | | | | $ | (6) | | | $ | 1,318 | |
| Noninterest income within the scope of other GAAP topics | 252 | | | 363 | | | | | | | 48 | | | 663 | |
| Total noninterest income | $ | 1,272 | | | $ | 667 | | | | | | | $ | 42 | | | $ | 1,981 | |
| | | | | | | | | | | |
| | | | | | | | | | | |
| | | | | | | | | | | |
| | | | | | | | | | | |
| Year Ended December 31, 2021 | | | | | | | | | | | |
| Major Revenue Streams | | | | | | | | | | | |
| Payments and cash management revenue | $ | 360 | | | $ | 104 | | | | | | | $ | — | | | $ | 464 | |
| Wealth and asset management revenue | 266 | | | 3 | | | | | | | — | | | 269 | |
| Customer deposit and loan fees | 226 | | | 1 | | | | | | | — | | | 227 | |
| Capital markets and advisory fees | 10 | | | 19 | | | | | | | — | | | 29 | |
| Leasing revenue | 2 | | | 21 | | | | | | | — | | | 23 | |
| Insurance income | 75 | | | 6 | | | | | | | 1 | | | 82 | |
| Other | 6 | | | 2 | | | | | | | 11 | | | 19 | |
| Net revenue from contracts with customers | $ | 945 | | | $ | 156 | | | | | | | $ | 12 | | | $ | 1,113 | |
| Noninterest income within the scope of other GAAP topics | 344 | | | 363 | | | | | | | 69 | | | 776 | |
| Total noninterest income | $ | 1,289 | | | $ | 519 | | | | | | | $ | 81 | | | $ | 1,889 | |
Huntington generally provides services for customers in which it acts as principal. Payment terms and conditions vary amongst services and customers, and thus impact the timing and amount of revenue recognition. Some fees may be paid before any service is rendered and accordingly, such fees are deferred until the obligations pertaining to those fees are satisfied. Most Huntington contracts with customers are cancelable by either party without penalty or they are short-term in nature, with a contract duration of less than one year. Accordingly, most revenue deferred for the reporting period ended December 31, 20202023 is expected to be earned within one year. Huntington does not have significant balances of contract assets or contract liabilities and any change in those balances during the reporting period ended December 31, 20202023 was determined to be immaterial.
2020 Form 10-K 133143 Huntington Bancshares Incorporated
17.16. SHARE-BASED COMPENSATION
Share-based awards are eligible for issuance under the Huntington sponsors nonqualified and incentive share based compensation plans. These plans provideBancshares Incorporated 2018 Long Term Incentive Plan. This plan provides for the granting of stock options, restricted stock awards, restricted stock units, performance share units and other awards to officers, directors, and other employees. In connection with the TCF acquisition in 2021, equity awards granted under the TCF equity plans were assumed subject to the same terms and conditions applicable to such awards prior to the date of acquisition. At December 31, 2023, 15 million shares were available for future grants.
Huntington issues shares to fulfill share-based award vesting from available authorized common shares. At December 31, 2023, Huntington believes there are adequate authorized common shares to satisfy anticipated share-based award vesting in 2024.
The following table presents total share-based compensation expense and related tax benefit.
| | | | | | | | | | | | | | | | | | | | |
| Year Ended December 31, | |
| (dollar amounts in millions) | 2023 | | | 2022 | | | 2021 | |
| Share-based compensation expense (1) | $ | 114 | | | | $ | 119 | | | | $ | 138 | | |
| Tax benefit | 19 | | | | 20 | | | | 22 | | |
(1)Compensation costs are included in personnel costs on the Consolidated Statements of Income.
Huntington issues shares to fulfill stock option exercises and restricted stock unit and award vesting from available authorized common shares. At December 31, 2020, Huntington believes there are adequate authorized common shares to satisfy anticipated stock option exercises and restricted stock unit award vesting in 2021.
The following table presents total share-based compensation expense and related tax benefit for the three years ended December 31, 2020, 2019, and 2018:
| | | | | | | | | | | | | | | | | | | | |
| (dollar amounts in millions) | 2020 | | | 2019 | | | 2018 | |
| Share-based compensation expense | $ | 77 | | | | $ | 83 | | | | $ | 78 | | |
| Tax benefit | 13 | | | | 15 | | | | 14 | | |
2018 Long-Term Incentive Plan
In 2018, shareholders approved the Huntington Bancshares Incorporated 2018 Long-Term Incentive Plan (the 2018 Plan). Shares remaining under the 2015 Long-Term Incentive Plan have been incorporated into the 2018 Plan. Accordingly, the total number of shares authorized under the 2018 Plan is 33 million shares. At December 31, 2020, 5 million shares from the Plan were available for future grants.
Stock Options
Stock options, awarded by Huntington, are granted at the closing market price on the date of the grant. Options granted typicallygrant and vest ratably over four years or when other conditions are met. Options assumed in the TCF acquisition have been fully vested. Stock options, which represented a portion of the grant values, have no intrinsic value until the stock price increases. Options granted on or after May 1, 2015All options have a contractual term of ten years. All options granted on or before April 30, 2015 have a contractual term of seven years.
Huntington uses the Black-Scholes option pricing model to value options in determining the share-based compensation expense. Forfeitures are estimated atyears from the date of grant based on historical rates, and are updated as necessary, and reduce the compensation expense recognized. The risk-free interest rate is based on the U.S. Treasury yield curve in effect at the date of grant. The expected dividend yield is based on the dividend rate and stock price at the date of the grant. Expected volatility is based on the estimated volatility of Huntington’s stock over the expected term of the option.
The following table presents the weighted average assumptions used in the option pricing model at the grant date for options granted in the three years ended December 31, 2020, 2019, and 2018:
| | | | | | | | | | | | | | | | | | | | |
| Assumptions | 2020 | | | 2019 | | | 2018 | |
| Risk-free interest rate | 0.48 | % | | | 2.41 | % | | | 2.88 | % | |
| Expected dividend yield | 6.98 | | | | 4.36 | | | | 3.71 | | |
| Expected volatility of Huntington’s common stock | 39.7 | | | | 22.5 | | | | 24.0 | | |
| Expected option term (years) | 6.5 | | | 6.5 | | | 6.5 | |
| Weighted-average grant date fair value per share | $ | 1.49 | | | | $ | 1.91 | | | | $ | 2.58 | | |
144 Huntington Bancshares Incorporated
Huntington’s stock option activity and related information for the year ended December 31, 2020, was as follows:
| | | | | | | | | | | | | | | | | | | | | | | |
| (dollar amounts in millions, except per share and options amounts in thousands) | Options | | Weighted-
Average
Exercise Price | | Weighted-Average
Remaining Contractual Life (Years) | | Aggregate
Intrinsic Value |
| Outstanding at January 1, 2020 | 11,309 | | | $ | 12.23 | | | | | |
| Granted | 4,378 | | | 8.60 | | | | | |
| | | | | | | |
| Exercised | (1,372) | | | 7.56 | | | | | |
| Forfeited/expired | (163) | | | 13.25 | | | | | |
| Outstanding at December 31, 2020 | 14,152 | | | $ | 11.55 | | | 7.4 | | $ | 25 | |
| Expected to vest (1) | 7,994 | | | $ | 11.18 | | | 8.6 | | $ | 17 | |
| Exercisable at December 31, 2020 | 5,919 | | | $ | 12.09 | | | 5.6 | | $ | 7 | |
| | | | | | | | | | | | | | | | | | | | | | | |
| (dollar amounts in millions, except per share and options amounts in thousands) | Options | | Weighted-
Average
Exercise Price | | Weighted-Average
Remaining Contractual Life (Years) | | Aggregate
Intrinsic Value |
| Outstanding at January 1, 2023 | 13,458 | | | $ | 12.50 | | | | | |
| | | | | | | |
| | | | | | | |
| Exercised | (425) | | | 9.93 | | | | | |
| Forfeited/expired | (111) | | | 12.74 | | | | | |
| Outstanding at December 31, 2023 | 12,922 | | | $ | 12.58 | | | 5.0 | | $ | 17 | |
| Expected to vest | 1,909 | | | $ | 12.26 | | | 6.8 | | $ | 4 | |
| Exercisable at December 31, 2023 | 11,001 | | | $ | 12.63 | | | 4.7 | | $ | 13 | |
(1)The number of options expected to vest reflect an estimate of 239,000 shares expected to be forfeited.
The aggregate intrinsic value represents the amount by which the fair value of underlying stock exceeds the “in-the-money” option exercise price. The total intrinsic value of options exercised for the years ended December 31, 2020, 2019, and 2018 were $6 million, $16 million and $52 million, respectively. For the years ended December 31, 2020, 2019, and 2018, cash received for the exercises of stock options was $1 million, $2 million and $5 million, respectively. The tax benefit realized for the tax deductions from option exercises totaled $1 million, $3 million and $10 million in 2020, 2019, and 2018, respectively.
Restricted Stock Awards, Restricted Stock Units and Performance Share Units
Huntington also grants restrictedRestricted stock units and performance share units. These units awarded by Huntington are granted at the closing market price on the date of the grant. Restricted stock units are issued at no cost to the recipient, and awards can be settled only in shares ator cash depending on the end of the vesting period.award. Restricted stock units, do notfor the most part, provide the holder with voting rights oreither accumulated cash dividends during the vesting period but door, accrue a dividend equivalent that is paid upon vesting,vesting. Both restricted stock awards and restricted stock units are subject to certain service restrictions. Performance share units are payable contingent upon Huntington achieving certain predefined performance objectives over thea three-year measurement period. The fair value of these awards and units reflectreflects the closing market price of Huntington’s common stock on the grant or assumption date.
The following table summarizes the status of Huntington’s restricted stock awards, restricted stock units, and performance share units as of December 31, 2020,2023, and activity for the year ended December 31, 2020:2023:
| | | Restricted Stock Units | | Performance Share Units |
| Restricted Stock Awards | | | Restricted Stock Awards | | Restricted Stock Units | | Performance Share Units |
| (amounts in thousands, except per share amounts) | (amounts in thousands, except per share amounts) | | Quantity | | Weighted- Average Grant Date Fair Value Per Share | | Quantity | | Weighted- Average Grant Date Fair Value Per Share | (amounts in thousands, except per share amounts) | Quantity | | Weighted- Average Grant Date Fair Value Per Share | | Quantity | | Weighted- Average Grant Date Fair Value Per Share | | Quantity | | Weighted- Average Grant Date Fair Value Per Share |
| Nonvested at January 1, 2020 | | 15,289 | | | $ | 13.42 | | | 2,769 | | | $ | 13.49 | |
| Nonvested at January 1, 2023 | |
| Granted | Granted | | 7,360 | | | 8.98 | | | 2,154 | | | 8.57 | |
| | Vested | Vested | | (5,416) | | | 12.39 | | | (1,626) | | | 12.19 | |
| Vested | |
| Vested | |
| Forfeited | Forfeited | | (581) | | | 12.49 | | | (22) | | | 12.93 | |
| Nonvested at December 31, 2020 | | 16,652 | | | $ | 12.05 | | | 3,275 | | | $ | 11.74 | |
| Nonvested at December 31, 2023 | |
The weighted-average fair value at grant date of nonvested shares granted for the years ended December 31, 2020, 2019,2023, 2022, and 20182021 were $8.90, $13.91,$14.14, $13.47, and $14.98,$15.78, respectively. The total fair value of awards vested during the years ended December 31, 2020, 2019,2023, 2022, and 20182021 was $86$99 million, $69$105 million, and $62$135 million, respectively. As of December 31, 2020,2023, the total unrecognized compensation cost related to nonvested shares was $91$289 million with a weighted-average expense recognition period of 2.4 years.
18.17. BENEFIT PLANS
Huntington sponsors a non-contributory defined benefit pension plan covering substantially all employees hired or rehired prior to January 1, 2010. The plan, which was modified in 2013,Plan no longer accrues service benefits to participants and provides benefits based upon length of service and compensation levels. Huntington’s funding policy is to contribute an annual amount that is at least equal to the minimum funding requirements but not more than the amount deductible under the Internal Revenue Code. There were 0no required minimum contributions during 2020.2023.
The following table shows the weighted-average assumptions used to determine the benefit obligation at December 31, 2020 and 2019, and the net periodic benefit cost for the years then ended:cost:
| | | | | | | | | | | | | | | |
| Pension Benefits | | |
| 2020 | | 2019 | | | | |
| Weighted-average assumptions used to determine benefit obligations | | | | | | | |
| Discount rate | 2.50 | % | | 3.40 | % | | | | |
| | | | | | | |
| Weighted-average assumptions used to determine net periodic benefit cost | | | | | | | |
| Discount rate | 3.40 | | | 4.41 | | | | | |
| Expected return on plan assets | 5.00 | | | 5.25 | | | | | |
| | | | | | | |
| | | | | | | |
The expected long-term rate of return on plan assets is an assumption reflecting the average rate of earnings expected on the funds invested or to be invested to provide for the benefits included in the projected benefit obligation. The expected long-term rate of return is established at the beginning of the plan year based upon historical returns and projected returns on the underlying mix of invested assets. | | | | | | | | | | | | | | | |
| At December 31, | | |
| 2023 | | 2022 | | | | |
| Weighted-average assumptions used to determine benefit obligations | | | | | | | |
| Discount rate | 5.15 | % | | 5.41 | % | | | | |
| | | | | | | |
| Weighted-average assumptions used to determine net periodic benefit cost | | | | | | | |
| Discount rate | 5.41 | | | 2.86 | | | | | |
| Expected return on plan assets | 5.00 | | | 4.50 | | | | | |
| | | | | | | |
| | | | | | | |
The following table reconciles the beginning and ending balances of the benefit obligation of the Plan with the amounts recognized in the consolidated balance sheets at December 31:sheets:
| | | | | | | | | | | | | | | |
| Pension Benefits | | |
| (dollar amounts in millions) | 2020 | | 2019 | | | | |
| Projected benefit obligation at beginning of measurement year | $ | 923 | | | $ | 821 | | | | | |
| Changes due to: | | | | | | | |
| Service cost | 3 | | | 2 | | | | | |
| Interest cost | 26 | | | 32 | | | | | |
| Benefits paid | (29) | | | (29) | | | | | |
| Settlements | (19) | | | (14) | | | | | |
| | | | | | | |
| Actuarial assumptions and gains (losses) | 122 | | | 111 | | | | | |
| Total changes | 103 | | | 102 | | | | | |
| Projected benefit obligation at end of measurement year | $ | 1,026 | | | $ | 923 | | | | | |
The increase in the benefit obligation compared with the end of the prior year is primarily attributed to a decrease in the discount rate.
The following table reconciles the beginning and ending balances of the fair value of plan assets at the December 31, 2020 and 2019 measurement dates:
| | | | | | | | | | | |
| Pension Benefits |
| (dollar amounts in millions) | 2020 | | 2019 |
| Fair value of plan assets at beginning of measurement year | $ | 931 | | | $ | 828 | |
| Changes due to: | | | |
| Actual return on plan assets | 164 | | | 145 | |
| | | |
| Settlements | (16) | | | (13) | |
| Benefits paid | (29) | | | (29) | |
| Total changes | 119 | | | 103 | |
| Fair value of plan assets at end of measurement year | $ | 1,050 | | | $ | 931 | |
As of December 31, 2020, the difference between the accumulated benefit obligation and the fair value of Huntington’s plan assets was $24 million and is recorded in other assets. | | | | | | | | | | | | | | | |
| At December 31, | | |
| (dollar amounts in millions) | 2023 | | 2022 | | | | |
| Projected benefit obligation at beginning of measurement year | $ | 692 | | | $ | 956 | | | | | |
| Changes due to: | | | | | | | |
| Service cost | 3 | | | 3 | | | | | |
| Interest cost | 36 | | | 22 | | | | | |
| Benefits paid | (33) | | | (32) | | | | | |
| Settlements | (16) | | | (29) | | | | | |
| | | | | | | |
| Actuarial gains | 5 | | | (228) | | | | | |
| Total changes | (5) | | | (264) | | | | | |
| Projected benefit obligation at end of measurement year | $ | 687 | | | $ | 692 | | | | | |
146135 Huntington Bancshares Incorporated
The following table reconciles the beginning and ending balances of the fair value of Plan assets:
| | | | | | | | | | | |
| At December 31, |
| (dollar amounts in millions) | 2023 | | 2022 |
| Fair value of plan assets at beginning of measurement year | $ | 740 | | | $ | 1,007 | |
| Changes due to: | | | |
| Actual return on plan assets | 39 | | | (197) | |
| | | |
| Settlements | (17) | | | (38) | |
| Benefits paid | (33) | | | (32) | |
| Total changes | (11) | | | (267) | |
| Fair value of plan assets at end of measurement year | $ | 729 | | | $ | 740 | |
As of December 31, 2023, the difference between the accumulated benefit obligation and the fair value of Plan assets was $42 million and is recorded in other assets.
The following table shows the components of net periodic benefit costs recognized in the three years ended December 31, 2020, 2019 and 2018:recognized:
| | Pension Benefits (1) | |
| Year Ended December 31, (1) | |
| Year Ended December 31, (1) | |
| Year Ended December 31, (1) | |
| (dollar amounts in millions) | |
| (dollar amounts in millions) | |
| (dollar amounts in millions) | (dollar amounts in millions) | 2020 | | 2019 | | 2018 | |
| Service cost | Service cost | $ | 3 | | | $ | 2 | | | $ | 3 | | |
| Service cost | |
| Service cost | |
| Interest cost | Interest cost | 26 | | | 32 | | | 29 | | |
| Interest cost | |
| Interest cost | |
| Expected return on plan assets | |
| Expected return on plan assets | |
| Expected return on plan assets | Expected return on plan assets | (42) | | | (44) | | | (49) | | |
| | Amortization of loss | Amortization of loss | 9 | | | 6 | | | 9 | | |
| | Amortization of loss | |
| | Amortization of loss | |
| Settlements | |
| Settlements | |
| Settlements | Settlements | 5 | | | 5 | | | 7 | | |
| Benefit costs | Benefit costs | $ | 1 | | | $ | 1 | | | $ | (1) | | |
| Benefit costs | |
| Benefit costs | |
It is Huntington’s policyDuring 2023, all Plan assets were transferred to recognize settlement gains and lossesNorthern Trust who held them as incurred. Assuming no cash contributions are made to the plan during 2021, Huntington expects net periodic pension benefit, excluding any expense of settlements, to approximate $6 million for 2021.
trustee at December 31, 2023. At December 31, 2020 and 2019,2022, The Huntington National Bank, as trustee, held all planPlan assets. The planPlan assets consisted of investments in a variety of cash equivalent, corporate and government fixed income, and equity investments as follows:
| | Fair Value |
| Fair Value at December 31, | | | Fair Value at December 31, |
| (dollar amounts in millions) | (dollar amounts in millions) | 2020 | | 2019 | (dollar amounts in millions) | 2023 | | 2022 |
| Cash equivalents: | Cash equivalents: | | | |
| Mutual funds-money market | Mutual funds-money market | $ | 20 | | | 2 | % | | $ | 7 | | | 1 | % |
| Mutual funds-money market | |
| Mutual funds-money market | | $ | 17 | | | 2 | % | | $ | 23 | | | 3 | % |
| | Fixed income: | Fixed income: | |
| Fixed income: | |
| Fixed income: | |
| Corporate obligations | |
| Corporate obligations | |
| Corporate obligations | Corporate obligations | 522 | | | 50 | | | 460 | | | 49 | |
| U.S. Government obligations | U.S. Government obligations | 208 | | | 20 | | | 199 | | | 21 | |
| | Municipal obligations | Municipal obligations | 6 | | | 0 | | | 5 | | | 1 | |
| Municipal obligations | |
| Municipal obligations | |
| | Collective trust funds | |
| Collective trust funds | |
| Collective trust funds | Collective trust funds | 118 | | | 11 | | | 105 | | | 11 | |
| Equities: | Equities: | |
| | Common stock | 48 | | | 5 | | | 53 | | | 6 | |
| Preferred stock | 5 | | | 0 | | | 5 | | | 1 | |
| | Limited liability companies | |
| | Limited liability companies | |
| | | Limited liability companies | Limited liability companies | 39 | | | 4 | | | 43 | | | 4 | |
| Collective trust funds | Collective trust funds | 33 | | | 3 | | | 35 | | | 4 | |
| Limited partnerships | Limited partnerships | 51 | | | 5 | | | 19 | | | 2 | |
| Fair value of plan assets | Fair value of plan assets | $ | 1,050 | | | 100 | % | | $ | 931 | | | 100 | % | Fair value of plan assets | $ | 729 | | | 100 | | 100 | % | | $ | 740 | | | 100 | | 100 | % |
Investments of the Plan are accounted for at cost on the trade date and are reported at fair value. The valuation methodologies used to measure the fair value of pension plan assets vary depending on the type of asset. At December 31, 2020, cash equivalent2023, mutual money market funds and U.S. Treasury bills are valued at the closing price reported from an actively traded exchange and are classified as Level 1. Fixed income investments are valued using unadjusted quoted prices from active markets for similar assets are classified as Level 2. Common and preferred stock areis valued using the year-end closing price as determined by a national securities exchange and are classified as Level 1. Collective trust funds and limited liability companies are valued at net asset value per unit as a practical expedient, which is calculated based on the fair values of the underlying investments held by the fund less its liabilities as reported by the issuer of the fund. The investment in the limited partnerships is reported at net asset value per share as determined by the general partners of each limited partnership, based on their proportionate share of the partnership’s fair value as recorded in the partnership’s audited financial statements.
The investment objective of the planPlan is to maximize the return on planPlan assets over a long-time period, while meeting the planPlan obligations. At December 31, 2020, plan2023, Plan assets were invested 2% in cash equivalents, 17%14% in equity investments, and 81%84% in bonds,fixed income investments, with an average duration of 15.313.0 years on bond investments. The estimated life of benefit obligations was 13.510.4 years. Although it may fluctuate with market conditions, Huntington has targeted a long-term allocation of planPlan assets of 20% to 50%1% in cash equivalents, 10% in equity investments, and 80% to 50%89% in bond investments. The allocation of planPlan assets between equity investments and fixed income investments will change from time to time.
At December 31, 2020,2023, the following table shows when benefit payments wereare expected to be paid:
| | | | | | | |
| (dollar amounts in millions) | Pension Benefits | | |
| 2021 | $ | 58 | | | |
| 2022 | 55 | | | |
| 2023 | 53 | | | |
| 2024 | 51 | | | |
| 2025 | 50 | | | |
| 2026 through 2030 | 243 | | | |
Huntington also sponsors an unfunded defined benefit post-retirement plan as well as other nonqualified retirement plans.
The following table presents the amounts recognized in the Consolidated Balance Sheets at December 31, 2020 and 2019, for all defined benefit and nonqualified retirement plans:
| | | | | | | | | | | |
| (dollar amounts in millions) | 2020 | | 2019 |
| Other liabilities | $ | 48 | | | $ | 67 | |
The following tables present the amounts recognized in OCI as of December 31, 2020, 2019, and 2018, and the changes in accumulated OCI for the years ended December 31, 2020, 2019, and 2018:
| | | | | | | | | | | | | | | | | |
| (dollar amounts in millions) | 2020 | | 2019 | | 2018 |
| Net actuarial loss | $ | (253) | | | $ | (261) | | | $ | (257) | |
| Prior service cost | 0 | | | 10 | | | 11 | |
| Defined benefit pension plans | $ | (253) | | | $ | (251) | | | $ | (246) | |
| | | | | | | | | | | | | | | | | |
| 2020 |
| (dollar amounts in millions) | Pretax | | Tax (expense) Benefit | | After-tax |
| | | | | |
| Net actuarial (loss) gain: | | | | | |
| Amounts arising during the year | $ | (7) | | | $ | 2 | | | $ | (5) | |
| Amortization included in net periodic benefit costs | 17 | | | (4) | | | 13 | |
| | | | | |
| Prior service cost: | | | | | |
| Amounts arising during the year | (11) | | | 3 | | | (8) | |
| Amortization included in net periodic benefit costs | (2) | | | 0 | | | (2) | |
| Total recognized in OCI | $ | (3) | | | $ | 1 | | | $ | (2) | |
| | | | | |
| | | | | |
| | | | | | | | | | | | | | | | | |
| 2019 |
| (dollar amounts in millions) | Pretax | | Tax (expense) Benefit | | After-tax |
| | | | | |
| Net actuarial (loss) gain: | | | | | |
| Amounts arising during the year | $ | (17) | | | $ | 5 | | | $ | (12) | |
| Amortization included in net periodic benefit costs | 12 | | | (3) | | | 9 | |
| | | | | |
| Prior service cost: | | | | | |
| | | | | |
| Amortization included in net periodic benefit costs | (2) | | | 0 | | | (2) | |
| Total recognized in OCI | $ | (7) | | | $ | 2 | | | $ | (5) | |
| | | | | |
| | | | | |
| | | | | | | | | | | | | | | | | |
| 2018 |
| (dollar amounts in millions) | Pretax | | Tax (expense) Benefit | | After-tax |
| | | | | |
| Net actuarial (loss) gain: | | | | | |
| Amounts arising during the year | $ | (5) | | | $ | 2 | | | $ | (3) | |
| Amortization included in net periodic benefit costs | 13 | | | (3) | | | 10 | |
| | | | | |
| Prior service cost: | | | | | |
| | | | | |
| Amortization included in net periodic benefit costs | (4) | | | 1 | | | (3) | |
| Total recognized in OCI | $ | 4 | | | $ | 0 | | | $ | 4 | |
| | | | | |
148 Huntington Bancshares Incorporated
| | | | | | | |
| (dollar amounts in millions) | Pension Benefits | | |
| 2024 | $ | 51 | | | |
| 2025 | 52 | | | |
| 2026 | 53 | | | |
| 2027 | 53 | | | |
| 2028 | 53 | | | |
| 2029 through 2033 | 253 | | | |
Huntington has a defined contribution plan that is available to eligible employees. Huntington’s expense related to the defined contribution plans for the years ended December 31, 2020, 2019,2023, 2022, and 20182021 was $47$61 million, $51$58 million, and $46$70 million, respectively.
The following table shows the number of shares, market value, and dividends received on shares of Huntington stock held by the defined contribution plan:
| | December 31, |
| At December 31, | | | At December 31, |
| (dollar amounts in millions, share amounts in thousands) | (dollar amounts in millions, share amounts in thousands) | 2020 | | 2019 | (dollar amounts in millions, share amounts in thousands) | 2023 | | 2022 |
| Shares in Huntington common stock | Shares in Huntington common stock | 10,121 | | | 10,334 | |
| Market value of Huntington common stock | Market value of Huntington common stock | $ | 128 | | | $ | 156 | |
| Dividends received on shares of Huntington stock | Dividends received on shares of Huntington stock | 6 | | | 6 | |
137 Huntington Bancshares Incorporated
18. INCOME TAXES
The following is a summary of the provision (benefit) for income taxes:
| | | | Year Ended December 31, | | Year Ended December 31, |
| (dollar amounts in millions) | (dollar amounts in millions) | 2020 | | 2019 | | 2018 | (dollar amounts in millions) | 2023 | | 2022 | | 2021 |
| Current tax provision (benefit) | Current tax provision (benefit) | | | | | |
| Federal | Federal | $ | 236 | | | $ | 209 | | | $ | 152 | |
| Federal | |
| Federal | |
| State | State | 12 | | | 16 | | | 20 | |
| Foreign | |
| Total current tax provision | Total current tax provision | 248 | | | 225 | | | 172 | |
| Deferred tax provision (benefit) | Deferred tax provision (benefit) | | | | | |
| Federal | Federal | (103) | | | 24 | | | 71 | |
| Federal | |
| Federal | |
| State | State | 10 | | | (1) | | | (8) | |
| Total deferred tax provision | (93) | | | 23 | | | 63 | |
| | Total deferred tax provision (benefit) | |
| Total deferred tax provision (benefit) | |
| Total deferred tax provision (benefit) | |
| Provision for income taxes | Provision for income taxes | $ | 155 | | | $ | 248 | | | $ | 235 | |
The following is a reconciliation for provision for income taxes:
| | | | Year Ended December 31, | | Year Ended December 31, |
| (dollar amounts in millions) | (dollar amounts in millions) | 2020 | | 2019 | | 2018 | (dollar amounts in millions) | 2023 | | 2022 | | 2021 |
| Provision for income taxes computed at the statutory rate | Provision for income taxes computed at the statutory rate | $ | 204 | | | $ | 348 | | | $ | 342 | |
| Increases (decreases): | Increases (decreases): | |
| General business credits | General business credits | (99) | | | (88) | | | (80) | |
| General business credits | |
| General business credits | |
| | Tax-exempt income | |
| Tax-exempt income | |
| Tax-exempt income | |
| Capital loss | Capital loss | (25) | | | (62) | | | (60) | |
| Tax-exempt income | (17) | | | (21) | | | (23) | |
| Tax-exempt bank owned life insurance income | (13) | | | (14) | | | (14) | |
| | Affordable housing investment amortization, net of tax benefits | Affordable housing investment amortization, net of tax benefits | 78 | | | 70 | | | 64 | |
| Affordable housing investment amortization, net of tax benefits | |
| Affordable housing investment amortization, net of tax benefits | |
| | State income taxes, net | |
| State income taxes, net | |
| State income taxes, net | State income taxes, net | 17 | | | 11 | | | 10 | |
| | Stock based compensation | 1 | | | (5) | | | (14) | |
| Impact from TCJA | 0 | | | 0 | | | (3) | |
| Other | |
| Other | |
| Other | Other | 9 | | | 9 | | | 13 | |
| Provision for income taxes | Provision for income taxes | $ | 155 | | | $ | 248 | | | $ | 235 | |
20202023 Form 10-K 149138
The significant components of deferred tax assets and liabilities at December 31, 2020 and 2019 were as follows:
| | | | At December 31, | | At December 31, |
| (dollar amounts in millions) | (dollar amounts in millions) | 2020 | | 2019 | (dollar amounts in millions) | 2023 | | 2022 |
| Deferred tax assets: | Deferred tax assets: | | | |
| Fair value adjustments | |
| Fair value adjustments | |
| Fair value adjustments | |
| Allowances for credit losses | Allowances for credit losses | $ | 448 | | | $ | 184 | |
| Tax credit carryforward | |
| Net operating and other loss carryforward | Net operating and other loss carryforward | 128 | | | 99 | |
| Research and development expenses | |
| Lease liability | Lease liability | 54 | | | 47 | |
| Purchase accounting and other intangibles | Purchase accounting and other intangibles | 30 | | | 33 | |
| Pension and other employee benefits | Pension and other employee benefits | 10 | | | 12 | |
| | Fair value adjustments | 0 | | | 77 | |
| | Accrued expense/prepaid | |
| Accrued expense/prepaid | |
| Accrued expense/prepaid | |
| Other assets | Other assets | 5 | | | 11 | |
| Total deferred tax assets | Total deferred tax assets | 675 | | | 463 | |
| Deferred tax liabilities: | Deferred tax liabilities: | | | |
| Lease financing | Lease financing | 409 | | | 359 | |
| Lease financing | |
| Lease financing | |
| Loan origination costs | Loan origination costs | 137 | | | 119 | |
| Mortgage servicing rights | |
| Operating assets | Operating assets | 85 | | | 74 | |
| Fair value adjustments | 55 | | | 0 | |
| Right-of-use asset | Right-of-use asset | 46 | | | 41 | |
| Mortgage servicing rights | 43 | | | 36 | |
| Securities adjustments | |
| | Other liabilities | Other liabilities | 23 | | | 11 | |
| | Other liabilities | |
| | Other liabilities | |
| Total deferred tax liabilities | Total deferred tax liabilities | 798 | | | 640 | |
| Net deferred tax liability before valuation allowance | (123) | | | (177) | |
| Net deferred tax asset (liability) before valuation allowance | |
| Valuation allowance | Valuation allowance | (11) | | | (6) | |
| Net deferred tax liability | $ | (134) | | | $ | (183) | |
| Net deferred tax asset | |
At December 31, 2020,2023, Huntington’s net deferred tax asset related to net operating loss and other carryforwards was $128$341 million. This was comprised of federal net operating loss carryforwards of $45$43 million, which will begin expiring in 2029, $39 million of2025, state net operating loss carryforwards which will begin expiring in 2021, and a capital loss carryforward of $42 million, which will begin expiring in 2022.2024, a federal capital loss carryforward of $13 million, which will expire in 2025, state capital loss carryforwards of $4 million, which will begin expiring in 2024, and general business credits of $240 million, which will expire in 2042.
The Company has established a valuation allowance on its state deferred tax assets as it believes it is more likely than not, portions will not be realized.
The Company and its subsidiaries file income tax returns in the U.S. federal jurisdiction and various state, city, and cityforeign jurisdictions. Federal income tax audits have been completed for tax years through 2009. In 2019, the 2010 and 2011 audits were submitted to the Congressional Joint Committee on Taxation of the U.S. Congress for approval. During the 2020 third quarter, the Joint Committee referred the audit back to the IRS exam team for reconsideration. This action led to the re-characterization of the audit resolution from a settlement to an uncertain 2016. The 2017-2022
tax position. Whileyears remain open under the statute of limitations remains open for tax years 2012 through 2019, the IRS has advised that tax years 2012 through 2014 will not be audited and is currently examining the 2015 and 2016 federal income tax returns.limitations. Also, with few exceptions, the Company is no longer subject to state, and localcity, or foreign income tax examinations for tax years before 2016.2019.
The following table provides a reconciliation of the beginning and ending amounts of gross unrecognized tax benefits:
| | Year Ended December 31, | | | Year Ended December 31, |
| (dollar amounts in millions) | (dollar amounts in millions) | 2020 | | 2019 | (dollar amounts in millions) | 2023 | | 2022 |
| Unrecognized tax benefits at beginning of year | Unrecognized tax benefits at beginning of year | $ | 0 | | | $ | 0 | |
| | Gross increases for tax positions taken during prior years | Gross increases for tax positions taken during prior years | 46 | | | 0 | |
| Gross increases for tax positions taken during prior years | |
| Gross increases for tax positions taken during prior years | |
| | Settlements with taxing authorities | |
| Settlements with taxing authorities | |
| Settlements with taxing authorities | |
| Unrecognized tax benefits at end of year | Unrecognized tax benefits at end of year | $ | 46 | | | $ | 0 | |
|
139 Huntington Bancshares Incorporated
Due to the complexities of some of these uncertainties, the ultimate resolution may result in a liability that is materially different from the current estimate of the tax liabilities. We do not currently anticipate thatCertain proposed adjustments resulting from the amountIRS examination of unrecognizedour 2010 through 2011 tax benefits will significantly change over the next 12 months.returns were effectively settled in 2023.
Any interest and penalties on income tax assessments or income tax refunds are recognized in the Consolidated Statements of Income as a component of provision for income taxes. The amounts of accrued tax-related interest and penalties were immaterial at December 31, 20202023 and 2019.2022. Further, the amount of net interest and penalties
150 Huntington Bancshares Incorporated
related to unrecognized tax benefits was immaterial for all periods presented. All of the gross unrecognized tax benefits would impact the Company’s effective tax rate if recognized.
At December 31, 2020,2023, retained earnings included approximately $12$182 million of base year reserves of acquired thrift institutions, for which no deferred federal income tax liability has been recognized. Under current law, if these bad debt reserves are used for purposes other than to absorb bad debt losses, they will be subject to federal income tax at the corporate tax rate enacted at the time. The amount of unrecognized deferred tax liability relating to the cumulative bad debt deduction was approximately $3$38 million at December 31, 2020.2023.
20.19. FAIR VALUES OF ASSETS AND LIABILITIES
Following is a description of the valuation methodologies used for instruments measured at fair value, as well as the general classification of such instruments pursuant to the valuation hierarchy. Assets and liabilities measured at fair value rarely transfer between Level 1 and Level 2 measurements. There were no such transfers during the years ended December 31, 2023 and 2022.
Loans held for sale
Huntington has elected to apply the fair value option for mortgage loans originated with the intent to sell which are included in loans held for sale. Mortgage loans held for sale are classified as Level 2 and are estimated using security prices for similar product types.
Loans held for investment
Certain mortgage loans originated with the intent to sell for which the FVO was elected have been reclassified to mortgage loans held for investment. These loans continue to be measured at fair value. The fair value is determined using fair value of similar mortgage-backed securities adjusted for loan specific variables.
Huntington elected the fair value option for certain consumer loans with deteriorated credit quality. These consumer loans are classified as Level 3. The key assumption used to determine the fair value of the consumer loans is discounted cash flows.
Available-for-sale securities and trading account securities
Securities accounted for at fair value include both the available-for-sale and trading account portfolios. Huntington determines the fair value of securities utilizing quoted market prices obtained for identical or similar assets, third-party pricing services, third-party valuation specialists and other observable inputs such as recent trade observations. AFS and trading securities classified as Level 1 use quoted market prices (unadjusted) in active markets for identical securities at the measurement date. Less than 1% of theLevel 1 positions in these portfolios are Level 1, and consist of U.S. Treasury securities and money market mutual funds.securities. When quoted market prices are not available, fair values are classified as Level 2 using quoted prices for similar assets in active markets, quoted prices of identical or similar assets in markets that are not active, and inputs that are observable for the asset, either directly or indirectly, for substantially the full term of the financial instrument. Level 2 represents 82% of the positions in these portfolios which consistsconsist of U.S. Government and agency debt securities, agency mortgage backed securities, private-label asset-backed securities, certain municipal securities, and other securities. For Level 2 securities Huntington primarily uses prices obtained from third-party pricing services to determine the fair value of securities. Huntington independently evaluates and corroborates the fair value received from pricing services through various methods and techniques, including references to dealer or other market quotes, by reviewing valuations of comparable instruments, and by comparing the prices realized on the sale of similar securities. If relevant market prices are limited or unavailable, valuations may require significant management judgment or estimation to determine fair value, in which case the fair values are classified as Level 3, which represent 18% of the positions.3. The Level 3 positions predominantly consist of direct purchase municipal securities. A significant change in the unobservable inputs for these securities may result in a significant change in the ending fair value measurement of these securities.
The direct purchase municipal securities are classified as Level 3 and require significant estimates to determine fair value which results in greater subjectivity. The fair value is determined by utilizing a discounted cash flow valuation technique employed by a third-party valuation specialist. The third-party specialist uses assumptions related to yield, prepayment speed, conditional default rates and loss severity based on certain factors such as,
credit worthiness of the counterparty, prevailing market rates, and analysis of similar securities. Huntington evaluates the fair values provided by the third-party specialist for reasonableness.
Derivative assets and liabilities
Derivatives classified as Level 2 primarily consist of foreign exchange and commodity contracts, which are valued using exchange traded swaps and futures market data. In addition, Level 2 includes interest rate contracts, which are valued using a discounted cash flow method that incorporates current market interest rates. In addition, Level 2 includes foreign exchange and commodity contracts, which are valued using exchange traded swaps, exchange traded options, and futures market data. Level 2 also includes exchange traded options and forward commitments to deliver mortgage-backed securities, which are valued using quoted prices.
Derivatives classified as Level 3 consist of interest rate lock agreements related to mortgage loan commitments, and the Visa® share swap. The determination ofswap, and credit default swaps.
MSRs
MSRs are accounted for using the fair value of the interest rate locks includes assumptions relatedmethod and are classified as Level 3. Refer to the likelihood that a commitment will ultimately result in a closed loan, which is a significant unobservable assumption. A significant increase or decrease in the external market price would result in a significantly higher or lower fair value measurement.Note 7 - “Mortgage Loan Sales and Servicing Rights” for information on valuation methodology. Assets and Liabilities measured at fair value on a recurring basis
Assets and liabilities measured at fair value on a recurring basis at December 31, 2020 and 2019 are summarized below:
| | Fair Value Measurements at Reporting Date Using | | Netting Adjustments (1) | | December 31, 2020 |
| Fair Value Measurements at Reporting Date Using | | | Fair Value Measurements at Reporting Date Using | | Netting Adjustments (1) | | At December 31, 2023 |
| (dollar amounts in millions) | (dollar amounts in millions) | Level 1 | | Level 2 | | Level 3 | | Netting Adjustments (1) | | December 31, 2020 |
| Assets | Assets | | | | | | |
| Assets | |
| Assets | |
| Trading account securities: | Trading account securities: | |
| Trading account securities: | |
| Trading account securities: | |
| U.S. Treasury securities | |
| U.S. Treasury securities | |
| U.S. Treasury securities | |
| | Other agencies | |
| Other agencies | |
| Other agencies | |
| | Municipal securities | Municipal securities | $ | 0 | | | $ | 62 | | | $ | 0 | | | $ | — | | | $ | 62 | |
| Municipal securities | |
| Municipal securities | |
| | Total trading account securities | |
| Total trading account securities | |
| Total trading account securities | |
| Available-for-sale securities: | Available-for-sale securities: | |
| U.S. Treasury securities | U.S. Treasury securities | 5 | | | 0 | | | 0 | | | — | | | 5 | |
| Residential CMOs | 0 | | | 3,666 | | | 0 | | | — | | | 3,666 | |
| U.S. Treasury securities | |
| U.S. Treasury securities | |
| Residential CMO | |
| Residential MBS | Residential MBS | 0 | | | 7,935 | | | 0 | | | — | | | 7,935 | |
| Commercial MBS | Commercial MBS | 0 | | | 1,163 | | | 0 | | | — | | | 1,163 | |
| Other agencies | Other agencies | 0 | | | 62 | | | 0 | | | — | | | 62 | |
| Municipal securities | Municipal securities | 0 | | | 53 | | | 2,951 | | | — | | | 3,004 | |
| Private-label CMO | Private-label CMO | 0 | | | 0 | | | 9 | | | — | | | 9 | |
| Asset-backed securities | Asset-backed securities | 0 | | | 182 | | | 10 | | | — | | | 192 | |
| Corporate debt | Corporate debt | 0 | | | 445 | | | 0 | | | — | | | 445 | |
| Other securities/sovereign debt | Other securities/sovereign debt | 0 | | | 4 | | | 0 | | | — | | | 4 | |
| Total available-for-sale securities | |
| | 5 | | | 13,510 | | | 2,970 | | | — | | | 16,485 | |
| | Other securities | |
| Other securities | |
| Other securities | Other securities | 59 | | | 0 | | | 0 | | | — | | | 59 | |
| Loans held for sale | Loans held for sale | 0 | | | 1,198 | | | 0 | | | — | | | 1,198 | |
| Loans held for investment | Loans held for investment | 0 | | | 71 | | | 23 | | | — | | | 94 | |
| MSRs | MSRs | 0 | | | 0 | | | 210 | | | — | | | 210 | |
| Other assets: | |
| Derivative assets | Derivative assets | 0 | | | 1,903 | | | 43 | | | (889) | | | 1,057 | |
| Derivative assets | |
| Derivative assets | |
| Assets held in trust for deferred compensation plans | |
| Liabilities | Liabilities | |
| | Derivative liabilities | |
| | Derivative liabilities | |
| | Derivative liabilities | Derivative liabilities | 0 | | | 1,031 | | | 2 | | | (917) | | | 116 | |
|
152141 Huntington Bancshares Incorporated
| | Fair Value Measurements at Reporting Date Using | | Netting Adjustments (1) | | December 31, 2019 |
| Fair Value Measurements at Reporting Date Using | | | Fair Value Measurements at Reporting Date Using | | Netting Adjustments (1) | | At December 31, 2022 |
| (dollar amounts in millions) | (dollar amounts in millions) | Level 1 | | Level 2 | | Level 3 | | Netting Adjustments (1) | | December 31, 2019 |
| Assets | Assets | | | | | | |
| Assets | |
| Assets | |
| Trading account securities: | |
| Trading account securities: | |
| Trading account securities: | Trading account securities: | |
| | Federal agencies: Other agencies | $ | 0 | | | $ | 4 | | | $ | 0 | | | $ | — | | | $ | 4 | |
| | Municipal securities | Municipal securities | 0 | | | 63 | | | 0 | | | — | | | 63 | |
| Other securities | 30 | | | 2 | | | 0 | | | — | | | 32 | |
| | Municipal securities | |
| | Municipal securities | |
| | | 30 | | | 69 | | | 0 | | | — | | | 99 | |
| Available-for-sale securities: | Available-for-sale securities: | |
| | Available-for-sale securities: | |
| | Available-for-sale securities: | |
| U.S. Treasury securities | |
| U.S. Treasury securities | |
| U.S. Treasury securities | U.S. Treasury securities | 10 | | | 0 | | | 0 | | | — | | | 10 | |
| Residential CMOs | Residential CMOs | 0 | | | 5,085 | | | 0 | | | — | | | 5,085 | |
| Residential MBS | Residential MBS | 0 | | | 4,222 | | | 0 | | | — | | | 4,222 | |
| Commercial MBS | Commercial MBS | 0 | | | 976 | | | 0 | | | — | | | 976 | |
| Other agencies | Other agencies | 0 | | | 165 | | | 0 | | | — | | | 165 | |
| Municipal securities | Municipal securities | 0 | | | 56 | | | 2,999 | | | — | | | 3,055 | |
| Private-label CMO | Private-label CMO | 0 | | | 0 | | | 2 | | | — | | | 2 | |
| Asset-backed securities | Asset-backed securities | 0 | | | 531 | | | 48 | | | — | | | 579 | |
| Corporate debt | Corporate debt | 0 | | | 51 | | | 0 | | | — | | | 51 | |
| Other securities/sovereign debt | Other securities/sovereign debt | 0 | | | 4 | | | 0 | | | — | | | 4 | |
| Total available-for-sale securities | |
| | 10 | | | 11,090 | | | 3,049 | | | — | | | 14,149 | |
| Other securities | |
| Other securities | |
| Other securities | Other securities | 54 | | | 0 | | | 0 | | | — | | | 54 | |
| Loans held for sale | Loans held for sale | 0 | | | 781 | | | 0 | | | — | | | 781 | |
| Loans held for investment | Loans held for investment | 0 | | | 55 | | | 26 | | | — | | | 81 | |
| MSRs | MSRs | 0 | | | 0 | | | 7 | | | — | | | 7 | |
| Other assets: | |
| Derivative assets | Derivative assets | 0 | | | 848 | | | 8 | | | (404) | | | 452 | |
| Derivative assets | |
| Derivative assets | |
| Assets held in trust for deferred compensation plans | |
| Liabilities | Liabilities | |
| | Derivative liabilities | Derivative liabilities | 0 | | | 519 | | | 2 | | | (417) | | | 104 | |
| | | Derivative liabilities | |
| | Derivative liabilities | |
(1)Amounts represent the impact of legally enforceable master netting agreements that allow the Company to settle positive and negative positions and cash collateral held or placed with the same counterparties.
20202023 Form 10-K 153142
The following tables below present a rollforward of the balance sheet amounts for the years ended December 31, 2020, 2019, and 2018 for financial instruments measured at fair value on a recurring basis and classified as Level 3. The classification of an item as Level 3 is based on the significance of the unobservable inputs to the overall fair value measurement. However, Level 3 measurements may also include observable components of value that can be validated externally. Accordingly, the gains and losses in the table below include changes in fair value due in part to observable factors that are part of the valuation methodology.
| | Level 3 Fair Value Measurements | | | Level 3 Fair Value Measurements |
| | | | | Available-for-sale securities | | | | | | | Available-for-sale securities | | Loans held for investment |
| (dollar amounts in millions) | |
| Year Ended December 31, 2023 | |
| Year Ended December 31, 2023 | |
| Year Ended December 31, 2023 | |
| Opening balance | |
| Opening balance | |
| Opening balance | |
| Transfers into Level 3 | |
| Transfers out of Level 3 (1) | |
| Total gains/losses for the period: | |
| Included in earnings: | |
| Included in earnings: | |
| Included in earnings: | |
| Mortgage banking income | |
| Mortgage banking income | |
| Mortgage banking income | |
| | Interest and fee income | |
| Interest and fee income | |
| Interest and fee income | |
| | | Level 3 Fair Value Measurements
Year Ended December 31, 2020 |
| Noninterest income | |
| | | Available-for-sale securities | |
| (dollar amounts in millions) | MSRs | | Derivative instruments | | Municipal securities | | Private-
label
CMO | | Asset- backed securities | | Loans held for investment |
| Opening balance | $ | 7 | | | $ | 6 | | | $ | 2,999 | | | $ | 2 | | | $ | 48 | | | $ | 26 | |
| Fair value election for serving assets previously measured using the amortized method | 205 | | | — | | | — | | | — | | | — | |
| Transfers out of Level 3 (1) | 0 | | | (198) | | | 0 | | | 0 | | | 0 | | | 0 | |
| Total gains/losses for the period: | |
| Included in earnings | (104) | | | 233 | | | (2) | | | 0 | | | 0 | | | 0 | |
| Noninterest income | |
| | Noninterest income | |
| Included in OCI | Included in OCI | 0 | | | 0 | | | 65 | | | 0 | | | 0 | | | 0 | |
| Purchases/originations | Purchases/originations | 102 | | | 0 | | | 623 | | | 7 | | | 28 | | | 0 | |
| Sales | |
| | Repayments | 0 | | | 0 | | | 0 | | | 0 | | | 0 | | | (3) | |
| | Settlements | |
| | Settlements | |
| | Settlements | Settlements | 0 | | | 0 | | | (734) | | | 0 | | | (66) | | | 0 | |
| Closing balance | Closing balance | $ | 210 | | | $ | 41 | | | $ | 2,951 | | | $ | 9 | | | $ | 10 | | | $ | 23 | |
| Change in unrealized gains or losses for the period included in earnings for assets held at end of the reporting date | Change in unrealized gains or losses for the period included in earnings for assets held at end of the reporting date | $ | (104) | | | $ | 34 | | | $ | 0 | | | $ | — | | | $ | 0 | | | $ | 0 | |
| Change in unrealized gains or losses for the period included in other comprehensive income for assets held at the end of the reporting period | Change in unrealized gains or losses for the period included in other comprehensive income for assets held at the end of the reporting period | $ | — | | | $ | — | | | $ | 68 | | | $ | — | | | $ | — | | | $ | — | |
| | Level 3 Fair Value Measurements
Year Ended December 31, 2019 |
| | Available-for-sale securities | | Loans held for investment |
| Level 3 Fair Value Measurements | | | Level 3 Fair Value Measurements |
| | | | | Available-for-sale securities | | | | | | | Available-for-sale securities | | Loans held for investment |
| (dollar amounts in millions) | (dollar amounts in millions) | MSRs | | Derivative instruments | | Municipal securities | | Private-
label
CMO | | Asset- backed securities | | Loans held for investment |
| Year Ended December 31, 2022 | |
| Year Ended December 31, 2022 | |
| Year Ended December 31, 2022 | |
| Opening balance | |
| Opening balance | |
| Opening balance | Opening balance | $ | 10 | | | $ | 2 | | | $ | 3,165 | | | $ | 0 | | | $ | 0 | | | $ | 30 | |
| | Transfers out of Level 3 (1) | Transfers out of Level 3 (1) | 0 | | | (62) | | | 0 | | | 0 | | | 0 | | | 0 | |
| Transfers out of Level 3 (1) | |
| Transfers out of Level 3 (1) | |
| Total gains/losses for the period: | Total gains/losses for the period: | |
| Included in earnings | (3) | | | 66 | | | (1) | | | 0 | | | 0 | | | 1 | |
| Included in earnings: | |
| Included in earnings: | |
| Included in earnings: | |
| Mortgage banking income | |
| Mortgage banking income | |
| Mortgage banking income | |
| | Interest and fee income | |
| Interest and fee income | |
| Interest and fee income | |
| Provision for credit losses | |
| | Included in OCI | Included in OCI | 0 | | | 0 | | | 77 | | | 0 | | | 0 | | | 0 | |
| Purchases/originations | 0 | | | 0 | | | 254 | | | 2 | | | 55 | | | 0 | |
| | Included in OCI | |
| | Included in OCI | |
| Purchases/originations/acquisitions | |
| | Repayments | |
| Repayments | |
| Repayments | Repayments | 0 | | | 0 | | | 0 | | | 0 | | | 0 | | | (5) | |
| | Settlements | Settlements | 0 | | | 0 | | | (496) | | | 0 | | | (7) | | | 0 | |
| Settlements | |
| Settlements | |
| Closing balance | Closing balance | $ | 7 | | | $ | 6 | | | $ | 2,999 | | | $ | 2 | | | $ | 48 | | | $ | 26 | |
| Change in unrealized gains or losses for the period included in earnings (or changes in net assets) for assets held at end of the reporting date | $ | (3) | | | $ | 3 | | | $ | 0 | | | $ | — | | | $ | 0 | | | $ | 0 | |
| Change in unrealized gains or losses for the period included in earnings for assets held at end of the reporting date | |
| Change in unrealized gains or losses for the period included in other comprehensive income for assets held at the end of the reporting period | Change in unrealized gains or losses for the period included in other comprehensive income for assets held at the end of the reporting period | $ | — | | | $ | — | | | $ | 74 | | | $ | — | | | $ | — | | | $ | — | |
154143 Huntington Bancshares Incorporated
| | Level 3 Fair Value Measurements
Year Ended December 31, 2018 |
| Level 3 Fair Value Measurements | | | Level 3 Fair Value Measurements |
| | | | | | | Available-for-sale securities | | Loans held for investment | | | | | | Available-for-sale securities | | Loans held for investment |
| (dollar amounts in millions) | (dollar amounts in millions) | MSRs | | Derivative instruments | | Municipal securities | | | Asset- backed securities | |
| Year Ended December 31, 2021 | |
| Year Ended December 31, 2021 | |
| Year Ended December 31, 2021 | |
| Opening balance | |
| Opening balance | |
| Opening balance | Opening balance | $ | 11 | | | $ | (1) | | | $ | 3,167 | | | | $ | 24 | | | $ | 38 | |
| | Transfers out of Level 3 (1) | Transfers out of Level 3 (1) | 0 | | | (35) | | | 0 | | | | 0 | | | 0 | |
| Transfers out of Level 3 (1) | |
| Transfers out of Level 3 (1) | |
| Total gains/losses for the period: | Total gains/losses for the period: | | | |
| Included in earnings | (1) | | | 35 | | | (3) | | | | (2) | | | 0 | |
| Included in earnings: | |
| Included in earnings: | |
| Included in earnings: | |
| Mortgage banking income | |
| Mortgage banking income | |
| Mortgage banking income | |
| Interest and fee income | |
| Included in OCI | Included in OCI | 0 | | | 0 | | | (52) | | | | 11 | | | 0 | |
| Purchases/originations | 0 | | | 0 | | | 658 | | | | 0 | | | 0 | |
| Purchases/originations/acquisitions | |
| Sales | Sales | 0 | | | 0 | | | 0 | | | | (33) | | | 0 | |
| Repayments | Repayments | 0 | | | 0 | | | 0 | | | | 0 | | | (8) | |
| Settlements | Settlements | 0 | | | 3 | | | (605) | | | | 0 | | | 0 | |
| Closing balance | Closing balance | $ | 10 | | | $ | 2 | | | $ | 3,165 | | | | $ | 0 | | | $ | 30 | |
| Change in unrealized gains or losses for the period included in earnings (or changes in net assets) for assets held at end of the reporting date | Change in unrealized gains or losses for the period included in earnings (or changes in net assets) for assets held at end of the reporting date | $ | (1) | | | $ | 0 | | | $ | 0 | | | | $ | 0 | | | $ | 0 | |
| Change in unrealized gains or losses for the period included in other comprehensive income for assets held at the end of the reporting period | Change in unrealized gains or losses for the period included in other comprehensive income for assets held at the end of the reporting period | $ | — | | | $ | — | | | $ | (52) | | | | $ | — | | | $ | — | |
(1) Transfers out of Level 3 represent the settlement value of the derivative instruments (i.e., interest rate lock agreements) that are transferred to loans held for sale, which is classified as Level 2.
The tables below summarize the classification of gains and losses due to changes in fair value, recorded in earnings for Level 3 assets and liabilities for the years ended December 31, 2020, 2019, and 2018:
| | | | | | | | | | | | | | | | | | | | | |
| Level 3 Fair Value Measurements
Year Ended December 31, 2020 |
| | | | | Available-for-sale securities | | | | |
| (dollar amounts in millions) | MSRs | | Derivative instruments | | Municipal securities | | | |
| Classification of gains and losses in earnings: | | | | | | | | | |
| Mortgage banking income | $ | (104) | | | $ | 233 | | | $ | 0 | | | | | |
| | | | | | | | | |
| Interest and fee income | 0 | | | 0 | | | (2) | | | | | |
| | | | | | | | | |
| | | | | | | | | |
| Total | $ | (104) | | | $ | 233 | | | $ | (2) | | | | | |
| | | | | | | | | | | | | | | | | | | | | | | | | |
| Level 3 Fair Value Measurements
Year Ended December 31, 2019 |
| | | | | Available-for-sale securities | | Loans held for investment |
| (dollar amounts in millions) | MSRs | | Derivative instruments | | Municipal securities | | | |
| Classification of gains and losses in earnings: | | | | | | | | | |
| Mortgage banking income | $ | (3) | | | $ | 66 | | | $ | 0 | | | | | $ | 0 | |
| | | | | | | | | |
| Interest and fee income | 0 | | | 0 | | | (1) | | | | | 1 | |
| | | | | | | | | |
| Total | $ | (3) | | | $ | 66 | | | $ | (1) | | | | | $ | 1 | |
| | | | | | | | | | | | | | | | | | | | | | | | | |
| Level 3 Fair Value Measurements
Year Ended December 31, 2018 |
| | | | | | Available-for-sale securities | | |
| (dollar amounts in millions) | MSRs | | Derivative instruments | | Municipal securities | | Asset- backed securities | | |
| Classification of gains and losses in earnings: | | | | | | | | | |
| Mortgage banking income (loss) | $ | (1) | | | $ | 35 | | | $ | 0 | | | $ | 0 | | | |
| Securities gains (losses) | 0 | | | 0 | | | 0 | | | (2) | | | |
| Interest and fee income | 0 | | | 0 | | | (3) | | | 0 | | | |
| | | | | | | | | |
| Total | $ | (1) | | | $ | 35 | | | $ | (3) | | | $ | (2) | | | |
Assets and liabilities under the fair value option
The following tables presenttable presents the fair value and aggregate principal balance of certain assets and liabilities under the fair value option:
| | | December 31, 2020 |
| Total Loans | |
| Total Loans | |
| Total Loans | | | Loans that are 90 or more days past due |
| (dollar amounts in millions) | | (dollar amounts in millions) | Fair value
carrying
amount | | Aggregate
unpaid
principal | | Difference | | Fair value
carrying
amount | | Aggregate
unpaid
principal | | Difference |
| At December 31, 2023 | |
| | Total Loans | | Loans that are 90 or more days past due |
| (dollar amounts in millions) | Fair value
carrying
amount | | Aggregate
unpaid
principal | | Difference | | Fair value
carrying
amount | | Aggregate
unpaid
principal | | Difference |
| Assets | | | | | | | | | | | |
| Loans held for sale | |
| | Loans held for sale | |
| | Loans held for sale | Loans held for sale | $ | 1,198 | | | $ | 1,134 | | | $ | 64 | | | $ | 2 | | | $ | 2 | | | $ | 0 | |
| Loans held for investment | Loans held for investment | 94 | | | 99 | | | (5) | | | 7 | | | 8 | | | (1) | |
| At December 31, 2022 | |
| | Loans held for sale | |
| | Loans held for sale | |
| | Loans held for sale | |
| Loans held for investment | |
| | | | | | | | | | | | | | | | | | | | | | | | | | | | | | | | | | | |
| December 31, 2019 |
| Total Loans | | Loans that are 90 or more days past due |
| (dollar amounts in millions) | Fair value
carrying
amount | | Aggregate
unpaid
principal | | Difference | | Fair value
carrying
amount | | Aggregate
unpaid
principal | | Difference |
| Assets | | | | | | | | | | | |
| Loans held for sale | $ | 781 | | | $ | 755 | | | $ | 26 | | | $ | 2 | | | $ | 2 | | | $ | 0 | |
| Loans held for investment | 81 | | | 87 | | | $ | (6) | | | 3 | | | 4 | | | (1) | |
The following tables presenttable presents the net (losses) gains from fair value changes for the years ended December 31, 2020, 2019, and 2018:changes:
| | | | Net gains (losses) from fair value changes Year Ended December 31, | | Year Ended December 31, |
| (dollar amounts in millions) | (dollar amounts in millions) | 2020 | | 2019 | | 2018 | (dollar amounts in millions) | 2023 | | 2022 | | 2021 |
| Assets | | | | | |
| Loans held for sale (1) | |
Loans held for sale (1) | |
Loans held for sale (1) | Loans held for sale (1) | $ | 38 | | | $ | 7 | | | $ | 5 | |
| Loans held for investment | Loans held for investment | 1 | | | 1 | | | 0 | |
(1)The net gains (losses) from fair value changes are included in Mortgage banking income on the Consolidated Statements of Income.
Assets and Liabilities measured at fair value on a nonrecurring basis
Certain assets and liabilities may be required to be measured at fair value on a nonrecurring basis in periods subsequent to their initial recognition. These assets and liabilities are not measured at fair value on an ongoing basis; however, they are subject to fair value adjustments in certain circumstances, such asfor example, when there is evidence of impairment. The amounts presented represent the fair value on the various measurement dates throughout the period. The gains(losses)gains (losses) represent the amounts recorded during the period regardless of whether the asset is still held at period end.
The amounts measured at fair value on a nonrecurring basis at December 31, 2020 were as follows:
| | | | | | | | | | | | | | | | | | | | | | | | | | | | | |
| | | Fair Value Measurements Using | | |
| (dollar amounts in millions) | Fair Value | | Quoted Prices In Active Markets for Identical Assets (Level 1) | | Significant Other Observable Inputs (Level 2) | | Significant Other Unobservable Inputs (Level 3) | | Total
Gains/(Losses)
Year Ended
December 31, 2020 |
| | | | | | | | | |
| Collateral-dependent loans | $ | 144 | | | $ | 0 | | | $ | 0 | | | $ | 144 | | | $ | (43) | |
| | | | | | | | | |
| Loans held for sale | 124 | | | — | | | — | | | 124 | | | (63) | |
| | | | | | | | | | | | | | | | | | | | | | | | | | | | | | | | | |
| | | | | Fair Value Measurements Using Significant Unobservable Inputs (Level 3) | | Total Gains/(Losses) Year Ended |
| (dollar amounts in millions) | | | | | December 31, 2023 | | December 31, 2022 | | December 31, 2023 | | December 31, 2022 | | December 31, 2021 |
| Collateral-dependent loans | | | | | $ | 40 | | | $ | 16 | | | $ | (21) | | | $ | (1) | | | $ | (4) | |
| | | | | | | | | | | | | |
| | | | | | | | | | | | | |
Huntington records nonrecurring adjustments of collateral-dependent loans held for investment. Such amounts are generally based on the fair value of the underlying collateral supporting the loan. Appraisals are generally obtained to support the fair value of the collateral and incorporate measures such asthat include recent sales prices for comparable properties and cost of construction. Periodically, in cases where the carrying value exceeds the fair value of the collateral less cost to sell, an impairment charge is recognized in the form of a charge-off.
Loans held for sale are measured at lower of cost or fair value less costs to sell. The fair value of loans held for sale is based on binding or non-binding bids for the respective loans or similar loans.
156 Huntington Bancshares Incorporated
Significant unobservable inputs for assets and liabilities measured at fair value on a recurring and nonrecurring basis
The following table below presents quantitative information about the significant unobservable inputs for assets and liabilities measured at fair value on a recurring and nonrecurring basis at December 31, 2020 and 2019:value:
| | | | | | | | | | | | | | | | | | | | | | | | | | | | | | | | | | | |
| Quantitative Information about Level 3 Fair Value Measurements at December 31, 2020 (1) |
| (dollar amounts in millions) | Fair Value | | Valuation Technique | | Significant Unobservable Input | | Range | | Weighted Average |
| Measured at fair value on a recurring basis: | | | | | | | | |
| MSRs | $ | 210 | | | Discounted cash flow | | Constant prepayment rate | | 8 | % | - | 24 | % | | 17 | % |
| | | | | Spread over forward interest rate swap rates | | 4 | % | - | 11 | % | | 5 | % |
| Derivative assets | 43 | | | Consensus Pricing | | Net market price | | (4) | % | - | 11 | % | | 3 | % |
| | | | | Estimated Pull through % | | 1 | % | - | 100 | % | | 88 | % |
| | | | | | | | | | | |
| | | | | | | | | | | |
| | | | | | | | | | | |
| | | | | | | | | | | |
| Municipal securities | 2,951 | | | Discounted cash flow | | Discount rate | | 0 | % | - | 1 | % | | 1 | % |
| Asset-backed securities | 10 | | | | | Cumulative default | | 0 | % | - | 39 | % | | 4 | % |
| | | | | Loss given default | | 5 | % | - | 80 | % | | 25 | % |
| | | | | | | | | | | |
| | | | | | | | | | | |
| | | | | | | | | | | |
| | | | | | | | | | | |
| | | | | | | | | | | |
| Measured at fair value on a nonrecurring basis: | | | | | | | | |
| | | | | | | | | | | |
| | | | | | | | | | | |
| Collateral-dependent loans | 144 | | | Appraisal value | | NA | | | | | | NA |
| | | | | | | | | | | |
| | | | | | | | | | | |
| | | | | | | | | | | |
| | | | | | | | | | | | | | | | | | | | | | | | | | | | | | | | | | | | | | | | | | | | | | | | | |
| | | Quantitative Information about Level 3 Fair Value Measurements (1) |
| | | | | | | At December 31, 2023 | | At December 31, 2022 |
| (dollar amounts in millions) | | | Valuation Technique | | Significant Unobservable Input | | Range | | Weighted Average | | Range | | Weighted Average |
| Measured at fair value on a recurring basis: | | | | | | | | | | | | | | |
| MSRs | | | Discounted cash flow | | Constant prepayment rate | | 4 | % | - | 37 | % | | 9 | % | | 5 | % | - | 40 | % | | 7 | % |
| | | | | Spread over forward interest rate swap rates | | 5 | % | - | 13 | % | | 5 | % | | 5 | % | - | 13 | % | | 6 | % |
| | | | | | | | | | | | | | | | | |
| | | | | | | | | | | | | | | | | |
| | | | | | | | | | | | | | | | | |
| | | | | | | | | | | | | | | | | |
| | | | | | | | | | | | | | | | | |
| | | | | | | | | | | | | | | | | |
| Municipal securities and asset-backed securities | | | Discounted cash flow | | Discount rate | | 4 | % | - | 6 | % | | 5 | % | | 5 | % | - | 5 | % | | 5 | % |
| | | | | Cumulative default | | — | % | - | 64 | % | | 6 | % | | — | % | - | 64 | % | | 7 | % |
| | | | | Loss given default | | 20 | % | - | 20 | % | | 20 | % | | 20 | % | - | 20 | % | | 20 | % |
| | | | | | | | | | | | | | | | | |
| | | | | | | | | | | | | | | | | |
| | | | | | | | | | | | | | | | | |
| | | | | | | | | | | | | | | | | |
| | | | | | | | | | | | | | | | | |
| | | | | | | | | | | | | | |
| | | | | | | | | | | | | | | | | |
| | | | | | | | | | | | | | | | | |
| | | | | | | | | | | | | | | | | |
| | | | | | | | | | | | | | | | | |
| | | | | | | | | | | | | | | | | |
| | | | | | | | | | | | | | | | | |
| | | | | | | | | | | | | | | | | | | | | | | | | | | | | | | | | | | |
| Quantitative Information about Level 3 Fair Value Measurements at December 31, 2019 (1) |
| (dollar amounts in millions) | Fair Value | | Valuation Technique | | Significant Unobservable Input | | Range | | Weighted Average |
| Measured at fair value on a recurring basis: | | | | | | | | |
| MSRs | $ | 7 | | | Discounted cash flow | | Constant prepayment rate | | 0 | % | - | 26 | % | | 8 | % |
| | | | | Spread over forward interest rate swap rates | | 5 | % | - | 11 | % | | 8 | % |
| Derivative assets | 8 | | | Consensus Pricing | | Net market price | | (2) | % | - | 11 | % | | 2 | % |
| | | | | Estimated Pull through % | | 2 | % | - | 100 | % | | 91 | % |
| | | | | | | | | | | |
| | | | | | | | | | | |
| | | | | | | | | | | |
| | | | | | | | | | | |
| Municipal securities | 2,999 | | | Discounted cash flow | | Discount rate | | 2 | % | - | 3 | % | | 2 | % |
| Asset-backed securities | 48 | | | | | Cumulative default | | 0 | % | - | 39 | % | | 4 | % |
| | | | | Loss given default | | 5 | % | - | 80 | % | | 24 | % |
| | | | | | | | | | | |
| | | | | | | | | | | |
| | | | | | | | | | | |
| | | | | | | | | | | |
| | | | | | | | | | | |
| | | | | | | | | | | |
| | | | | | | | | | | |
| | | | | | | | |
| Measured at fair value on a nonrecurring basis: | | | | | | | | |
| MSRs | 206 | | | Discounted cash flow | | Constant prepayment rate | | 10 | % | | 31 | % | | 12 | % |
| | | | | Spread over forward interest rate swap rates | | 5 | % | | 11 | % | | 9 | % |
| Impaired loans | 26 | | | Appraisal value | | NA | | | | | | NA |
| | | | | | | | | | | |
| | | | | | | | | | | |
| | | | | | | | | | | |
(1)Certain disclosures related to quantitative level 3 fair value measurements do not include those deemed to be immaterial.
The following provides a general description of the impact of a change in an unobservable input on the fair value measurement and the interrelationship between unobservable inputs, where relevant/significant. Interrelationships may also exist between observable and unobservable inputs.
CreditComponents of credit loss estimates such asincluding probability of default, constant default, cumulative default, loss given default, cure given deferral, and loss severity, are driven by the ability of the borrowers to pay their loans and the value of the underlying collateral and are impacted by changes in macroeconomic conditions, typically increasing when economic conditions worsen and decreasing when conditions improve. An increase in the estimated prepayment rate typically results in a decrease in estimated credit losses and vice versa. Higher credit loss estimates generally result in lower fair values. Credit spreads generally increase when liquidity risks and market volatility increase and decrease when liquidity conditions and market volatility improve.
Discount rates and spread over forward interest rate swap rates typically increase when market interest rates increase and/or credit and liquidity risks increase and decrease when market interest rates decline and/or credit and liquidity conditions improve. Higher discount rates and credit spreads generally result in lower fair market values.
Net market price and pull through percentages generally increase when market interest rates increase and decline when market interest rates decline. Higher net market price and pull through percentages generally result in higher fair values.
Fair values of financial instruments
The following table providesMany of the carrying amountsassets and estimatedliabilities subject to the disclosure requirements are not actively traded, requiring fair values to be estimated by management. These estimations necessarily involve the use of Huntington’s financialjudgment about a wide variety of factors, including, but not limited to, relevancy of market prices of comparable instruments, at December 31, 2020expected future cash flows, and December 31, 2019:
| | | | | | | | | | | | | | | | | | | | | | | | | | | | | |
| December 31, 2020 |
| (dollar amounts in millions) | Amortized Cost | | Lower of Cost or Market | | Fair Value or Fair Value Option | | Total Carrying Amount | | Estimated Fair Value |
| Financial Assets | | | | | | | | | |
| Cash and short-term assets | $ | 6,712 | | | $ | — | | | $ | — | | | $ | 6,712 | | | $ | 6,712 | |
| Trading account securities | — | | | — | | | 62 | | | 62 | | | 62 | |
| Available-for-sale securities | — | | | — | | | 16,485 | | | 16,485 | | | 16,485 | |
| Held-to-maturity securities | 8,861 | | | — | | | — | | | 8,861 | | | 9,255 | |
| Other securities | 359 | | | — | | | 59 | | | 418 | | | 418 | |
| Loans held for sale | — | | | 77 | | | 1,198 | | | 1,275 | | | 1,275 | |
| Net loans and leases (1) | 79,700 | | | — | | | 94 | | | 79,794 | | | 80,477 | |
| Derivative assets | — | | | — | | | 1,057 | | | 1,057 | | | 1,057 | |
| Financial Liabilities | | | | | | | | | |
| Deposits | 98,948 | | | — | | | — | | | 98,948 | | | 99,021 | |
| Short-term borrowings | 183 | | | — | | | — | | | 183 | | | 183 | |
| Long-term debt | 8,352 | | | — | | | — | | | 8,352 | | | 8,568 | |
| Derivative liabilities | — | | | — | | | 116 | | | 116 | | | 116 | |
| | | | | | | | | | | | | | | | | | | | | | | | | | | | | |
| December 31, 2019 |
| (dollar amounts in millions) | Amortized Cost | | Lower of Cost or Market | | Fair Value or Fair Value Option | | Total Carrying Amount | | Estimated Fair Value |
| Financial Assets | | | | | | | | | |
| Cash and short-term assets | $ | 1,272 | | | $ | — | | | $ | — | | | $ | 1,272 | | | $ | 1,272 | |
| Trading account securities | — | | | — | | | 99 | | | 99 | | | 99 | |
| Available-for-sale securities | — | | | — | | | 14,149 | | | 14,149 | | | 14,149 | |
| Held-to-maturity securities | 9,070 | | | — | | | — | | | 9,070 | | | 9,186 | |
| Other securities | 387 | | | — | | | 54 | | | 441 | | | 441 | |
| Loans held for sale | — | | | 96 | | | 781 | | | 877 | | | 879 | |
| Net loans and leases (1) | 74,540 | | | — | | | 81 | | | 74,621 | | | 75,177 | |
| Derivative assets | — | | | — | | | 452 | | | 452 | | | 452 | |
| Financial Liabilities | | | | | | | | | |
| Deposits | 82,347 | | | — | | | — | | | 82,347 | | | 82,344 | |
| Short-term borrowings | 2,606 | | | — | | | — | | | 2,606 | | | 2,606 | |
| Long-term debt | 9,849 | | | — | | | — | | | 9,849 | | | 10,075 | |
| Derivative liabilities | — | | | — | | | 104 | | | 104 | | | 104 | |
(1)Includes collateral-dependent loans.
158145 Huntington Bancshares Incorporated
The following table presents the level in the fair value hierarchy for the estimated fair values at December 31, 2020 and December 31, 2019:
| | | | | | | | | | | | | | | | | | | | | | | | | | | | | |
| Estimated Fair Value Measurements at Reporting Date Using | | Netting | | December 31, 2020 |
| (dollar amounts in millions) | Level 1 | | Level 2 | | Level 3 | | Adjustments (1) | |
| Financial Assets | | | | | | | | | |
| Trading account securities | $ | 0 | | | $ | 62 | | | $ | 0 | | | | | $ | 62 | |
| Available-for-sale securities | 5 | | | 13,510 | | | 2,970 | | | | | 16,485 | |
| Held-to-maturity securities | 0 | | | 9,255 | | | 0 | | | | | 9,255 | |
| Other securities (2) | 59 | | | 0 | | | 0 | | | | | 59 | |
| Loans held for sale | 0 | | | 1,198 | | | 77 | | | | | 1,275 | |
| Net loans and direct financing leases | 0 | | | 71 | | | 80,406 | | | | | 80,477 | |
| Derivative assets | 0 | | | 1,903 | | | 43 | | | (889) | | | 1,057 | |
| Financial Liabilities | | | | | | | | | |
| Deposits | 0 | | | 96,656 | | | 2,365 | | | | | 99,021 | |
| Short-term borrowings | 0 | | | 183 | | | 0 | | | | | 183 | |
| Long-term debt | 0 | | | 7,999 | | | 569 | | | | | 8,568 | |
| Derivative liabilities | 0 | | | 1,031 | | | 2 | | | (917) | | | 116 | |
| | | | | | | | | | | | | | | | | | | | | | | | | | | | | |
| Estimated Fair Value Measurements at Reporting Date Using | | Netting | | December 31, 2019 |
| (dollar amounts in millions) | Level 1 | | Level 2 | | Level 3 | | Adjustments (1) | |
| Financial Assets | | | | | | | | | |
| Trading account securities | $ | 30 | | | $ | 69 | | | $ | 0 | | | | | $ | 99 | |
| Available-for-sale securities | 10 | | | 11,090 | | | 3,049 | | | | | 14,149 | |
| Held-to-maturity securities | 0 | | | 9,186 | | | 0 | | | | | 9,186 | |
| Other securities (2) | 54 | | | 0 | | | 0 | | | | | 54 | |
| Loans held for sale | 0 | | | 781 | | | 98 | | | | | 879 | |
| Net loans and direct financing leases | 0 | | | 55 | | | 75,122 | | | | | 75,177 | |
| Derivative assets | 0 | | | 848 | | | 8 | | | (404) | | | 452 | |
| Financial Liabilities | | | | | | | | | |
| Deposits | 0 | | | 76,790 | | | 5,554 | | | | | 82,344 | |
| Short-term borrowings | 0 | | | 0 | | | 2,606 | | | | | 2,606 | |
| Long-term debt | 0 | | | 9,439 | | | 636 | | | | | 10,075 | |
| Derivative liabilities | 0 | | | 519 | | | 2 | | | (417) | | | 104 | |
(1)Amounts represent the impact of legally enforceable master netting agreements that allow the Company to settle positive and negative positions and cash collateral held or placed with the same counterparties.
(2)Excludes securities without readily determinable fair values.
The short-term nature of certain assets and liabilities result in their carrying value approximating fair value. These include trading account securities, customers’ acceptance liabilities, short-term borrowings, bank acceptances outstanding, FHLB advances, and cash and short-term assets, which include cash and due from banks, interest-bearing deposits in banks, interest-bearing deposits at the Federal Reserve Bank, and federal funds sold, and securities purchased under resale agreements.sold. Loan commitments and letters-of-credit generally have short-term, variable-rate features and contain clauses that limit Huntington’s exposure to changes in customer credit quality. Accordingly, their carrying values, which are immaterial at the respective balance sheet dates, are reasonable estimates of fair value.
Certain assets, the most significant being operating lease assets, bank owned life insurance, and premises and equipment, do not meet the definition of a financial instrument and are excluded from this disclosure. Similarly, mortgage servicing rights deposit base, and other customer relationship intangibles are not considered financial instruments and are not included above.below. Accordingly, this fair value information is not intended to, and does not, represent Huntington’s underlying value. Many
The following table provides the carrying amounts and estimated fair values of Huntington’s financial instruments:
| | | | | | | | | | | | | | | | | | | | | | | | | | | | | |
| |
| (dollar amounts in millions) | Amortized Cost | | Lower of Cost or Market | | Fair Value or Fair Value Option | | Total Carrying Amount | | Estimated Fair Value |
| At December 31, 2023 | | | | | | | | | |
| Financial Assets | | | | | | | | | |
| Cash and short-term assets | $ | 10,323 | | | $ | — | | | $ | — | | | $ | 10,323 | | | $ | 10,323 | |
| Trading account securities | — | | | — | | | 125 | | | 125 | | | 125 | |
| Available-for-sale securities | — | | | — | | | 25,305 | | | 25,305 | | | 25,305 | |
| Held-to-maturity securities | 15,750 | | | — | | | — | | | 15,750 | | | 13,718 | |
| Other securities | 693 | | | — | | | 32 | | | 725 | | | 725 | |
| Loans held for sale | — | | | 10 | | | 506 | | | 516 | | | 516 | |
| Net loans and leases (1) | 119,553 | | | — | | | 174 | | | 119,727 | | | 116,781 | |
| Derivative assets | — | | | — | | | 393 | | | 393 | | | 393 | |
| Assets held in trust for deferred compensation plans | — | | | — | | | 177 | | | 177 | | | 177 | |
| Financial Liabilities | | | | | | | | | |
| Deposits (2) | 151,230 | | | — | | | — | | | 151,230 | | | 151,183 | |
| Short-term borrowings | 620 | | | — | | | — | | | 620 | | | 620 | |
| Long-term debt | 12,394 | | | — | | | — | | | 12,394 | | | 12,276 | |
| Derivative liabilities | — | | | — | | | 670 | | | 670 | | | 670 | |
| At December 31, 2022 | | | | | | | | | |
| Financial Assets | | | | | | | | | |
| Cash and short-term assets | $ | 6,918 | | | $ | — | | | $ | — | | | $ | 6,918 | | | $ | 6,918 | |
| Trading account securities | — | | | — | | | 19 | | | 19 | | | 19 | |
| Available-for-sale securities | — | | | — | | | 23,423 | | | 23,423 | | | 23,423 | |
| Held-to-maturity securities | 17,052 | | | — | | | — | | | 17,052 | | | 14,754 | |
| Other securities | 822 | | | — | | | 32 | | | 854 | | | 854 | |
| Loans held for sale | — | | | 9 | | | 520 | | | 529 | | | 529 | |
| Net loans and leases (1) | 117,217 | | | — | | | 185 | | | 117,402 | | | 112,591 | |
| Derivative assets | — | | | — | | | 356 | | | 356 | | | 356 | |
| Assets held in trust for deferred compensation plans | — | | | — | | | 155 | | | 155 | | | 155 | |
| Financial Liabilities | | | | | | | | | |
| Deposits (2) | 147,914 | | | — | | | — | | | 147,914 | | | 147,796 | |
| Short-term borrowings | 2,027 | | | — | | | — | | | 2,027 | | | 2,027 | |
| Long-term debt | 9,686 | | | — | | | — | | | 9,686 | | | 9,564 | |
| Derivative liabilities | — | | | — | | | 992 | | | 992 | | | 992 | |
(1)Includes collateral-dependent loans.
(2)Includes $1.4 billion and $462 million in time deposits in excess of the assetsFDIC insurance coverage limit at December 31, 2023 and liabilities subject to the disclosure requirements are not actively traded, requiring fair values to be estimated by Management. These estimations necessarily involve the use of judgment about a wide variety of factors, including but not limited to, relevancy of market prices of comparable instruments, expected future cash flows, and appropriate discount rates.December 31, 2022, respectively.
20202023 Form 10-K 159146
21.The following table presents the level in the fair value hierarchy for estimated fair values:
| | | | | | | | | | | | | | | | | | | | | | | | | | | | | |
| Estimated Fair Value Measurements at Reporting Date Using | | Netting | | Presented Balance |
| (dollar amounts in millions) | Level 1 | | Level 2 | | Level 3 | | Adjustments (1) | |
| At December 31, 2023 | | | | | | | | | |
| Financial Assets | | | | | | | | | |
| Trading account securities | $ | 91 | | | $ | 34 | | | $ | — | | | $ | — | | | $ | 125 | |
| Available-for-sale securities | 2,856 | | | 19,019 | | | 3,430 | | | — | | | 25,305 | |
| Held-to-maturity securities | — | | | 13,718 | | | — | | | — | | | 13,718 | |
| Other securities (2) | 30 | | | 2 | | | — | | | — | | | 32 | |
| Loans held for sale | — | | | 506 | | | 10 | | | — | | | 516 | |
| Net loans and leases | — | | | 120 | | | 116,661 | | | — | | | 116,781 | |
| Derivative assets | — | | | 1,720 | | | 3 | | | (1,330) | | | 393 | |
| Financial Liabilities | | | | | | | | | |
| Deposits | — | | | 135,627 | | | 15,556 | | | — | | | 151,183 | |
| Short-term borrowings | — | | | 620 | | | — | | | — | | | 620 | |
| Long-term debt | — | | | 8,929 | | | 3,347 | | | — | | | 12,276 | |
| Derivative liabilities | — | | | 1,416 | | | 5 | | | (751) | | | 670 | |
| At December 31, 2022 | | | | | | | | | |
| Financial Assets | | | | | | | | | |
| Trading account securities | $ | — | | | $ | 19 | | | $ | — | | | $ | — | | | $ | 19 | |
| Available-for-sale securities | 103 | | | 19,978 | | | 3,342 | | | — | | | 23,423 | |
| Held-to-maturity securities | — | | | 14,754 | | | — | | | — | | | 14,754 | |
| Other securities (2) | 31 | | | 1 | | | — | | | — | | | 32 | |
| Loans held for sale | — | | | 520 | | | 9 | | | — | | | 529 | |
| Net loans and leases | — | | | 169 | | | 112,422 | | | — | | | 112,591 | |
| Derivative assets | — | | | 2,161 | | | 3 | | | (1,808) | | | 356 | |
| Financial Liabilities | | | | | | | | | |
| Deposits | — | | | 142,081 | | | 5,715 | | | — | | | 147,796 | |
| Short-term borrowings | — | | | 2,027 | | | — | | | — | | | 2,027 | |
| Long-term debt | — | | | 8,680 | | | 884 | | | — | | | 9,564 | |
| Derivative liabilities | — | | | 2,332 | | | 5 | | | (1,345) | | | 992 | |
(1)Amounts represent the impact of legally enforceable master netting agreements that allow the Company to settle positive and negative positions and cash collateral held or placed with the same counterparties.
(2)Excludes securities without readily determinable fair values.
20. DERIVATIVE FINANCIAL INSTRUMENTS
Derivative financial instruments are recorded in the Consolidated Balance Sheets as either an asset or a liability (in other assets or other liabilities, respectively) and measured at fair value.
Derivative financial instruments can be designated as accounting hedges under GAAP. Designating a derivative as an accounting hedge allows Huntington to recognize gains and losses on the hedging instruments in the income statement line item where the gains and losses on the hedged item are recognized. Gains and losses on derivatives that are not designated in an effective hedge relationship under GAAP immediately impact earnings within the period they occur.
147 Huntington Bancshares Incorporated
The following table presents the fair values and notional values of all derivative instruments included in the Consolidated Balance Sheets at December 31, 2020 and December 31, 2019.Sheets. Amounts in the table below are presented gross without the impact of any net collateral arrangements.
| | | | | | | | | | | | | | | | | | | | | | | | | | | | | | | | | | | |
| December 31, 2020 | | December 31, 2019 |
| (dollar amounts in millions) | Notional Value | | Asset | | Liability | | Notional Value | | Asset | | Liability |
| Derivatives designated as Hedging Instruments |
| Interest rate contracts | $ | 27,056 | | | $ | 719 | | | $ | 51 | | | $ | 25,927 | | | $ | 256 | | | $ | 36 | |
| Derivatives not designated as Hedging Instruments |
| Interest rate contracts | 44,495 | | | 1,074 | | | 828 | | | 27,614 | | | 420 | | | 314 | |
| Foreign exchange contracts | 2,718 | | | 46 | | | 47 | | | 2,173 | | | 19 | | | 18 | |
| Commodities contracts | 1,952 | | | 107 | | | 103 | | | 3,020 | | | 155 | | | 152 | |
| Equity contracts | 517 | | | 0 | | | 4 | | | 427 | | | 6 | | | 1 | |
| Total Contracts | $ | 76,738 | | | $ | 1,946 | | | $ | 1,033 | | | $ | 59,161 | | | $ | 856 | | | $ | 521 | |
| | | | | | | | | | | | | | | | | | | | | | | | | | | | | | | | | | | |
| At December 31, 2023 | | At December 31, 2022 |
| (dollar amounts in millions) | Notional Value | | Asset | | Liability | | Notional Value | | Asset | | Liability |
| Derivatives designated as Hedging Instruments |
| Interest rate contracts | $ | 38,017 | | | $ | 868 | | | $ | 519 | | | $ | 42,461 | | | $ | 1,008 | | | $ | 1,145 | |
| Foreign exchange contracts | 222 | | | 6 | | | — | | | 202 | | | 2 | | | — | |
| Derivatives not designated as Hedging Instruments |
| Interest rate contracts | 41,526 | | | 718 | | | 757 | | | 37,562 | | | 968 | | | 1,008 | |
| Foreign exchange contracts | 5,257 | | | 69 | | | 76 | | | 4,889 | | | 68 | | | 68 | |
| Credit contracts | 381 | | | — | | | 2 | | | — | | | — | | | — | |
| Commodities contracts | 681 | | | 62 | | | 60 | | | 762 | | | 114 | | | 113 | |
| Equity contracts | 759 | | | — | | | 7 | | | 636 | | | 4 | | | 3 | |
| Total Contracts | $ | 86,843 | | | $ | 1,723 | | | $ | 1,421 | | | $ | 86,512 | | | $ | 2,164 | | | $ | 2,337 | |
| | | | | | | | | | | |
| | | | | | | | | | | |
| | | | | | | | | | | |
| | | | | | | | | | | |
The following table presents the amount of gain or loss recognized in income for derivatives not designated as hedging instruments under ASC Subtopic 815-10 in the Consolidated Income Statement for the years ended December 31, 2020 and 2019.Statement.
| | | Location of Gain or (Loss) Recognized in Income on Derivatives | |
| | Location of Gain or (Loss) Recognized in Income on Derivative | | |
| | | Year Ended December 31, | |
| | | | Year Ended December 31, | |
| | Location of Gain or (Loss) Recognized in Income on Derivative | | Year Ended December 31, |
| | | Year Ended December 31, | |
| | | | Year Ended December 31, | |
| | | | Year Ended December 31, | |
| | | | Year Ended December 31, | |
| | | | Year Ended December 31, | |
| | | | Year Ended December 31, | |
| | | | Year Ended December 31, | |
| | | | Year Ended December 31, | |
| | | | Year Ended December 31, | |
| | | | Year Ended December 31, | |
| (dollar amounts in millions) | (dollar amounts in millions) | | Location of Gain or (Loss) Recognized in Income on Derivative | | 2020 | | 2019 | | 2018 | (dollar amounts in millions) | | | 2023 | | 2022 | | 2021 |
| Interest rate contracts: | Interest rate contracts: | | | | | | |
| Customer | Customer | | $ | 47 | | | $ | 49 | | | $ | 41 | |
| Mortgage Banking | | 52 | | | 37 | | | (19) | |
| Customer | |
| Customer | |
| Mortgage banking | |
| Interest rate floors | Interest rate floors | | Interest and fee income on loans and leases | | (2) | | | 4 | | | 0 | |
| Interest rate caps | Interest rate caps | | Interest expense on long-term debt | | 5 | | | 0 | | | 0 | |
| Interest rate swaptions | |
| Foreign exchange contracts | Foreign exchange contracts | | Capital markets fees | | 27 | | | 28 | | | 27 | |
| Credit contracts | |
| Commodities contracts | Commodities contracts | | Capital markets fees | | 4 | | | (2) | | | 6 | |
| Equity contracts | Equity contracts | | Other noninterest expense | | (4) | | | (4) | | | 4 | |
| Total | Total | | $ | 129 | | | $ | 112 | | | $ | 59 | |
Derivatives used in asset and liability management activities
Huntington engages in balance sheet hedging activity, principally for asset and liability management purposes. Balance sheet hedging activity is generally arranged to receive hedge accounting treatment that can be classified as either fair value or cash flow hedges. Fair value hedges are executed to hedge changes in fair value of outstanding fixed-rate debt and investment securities caused by fluctuations in market interest rates. Cash flow hedges are executed to modify interest rate characteristics of designated commercial loans in order to reduce the impact of changes in future cash flows due to market interest rate changes.
1602023 Form 10-K Huntington Bancshares Incorporated148
The following table presents the gross notional values of derivatives used in Huntington’s asset and liability management activities, at December 31, 2020 and December 31, 2019, identified by the underlying interest rate-sensitive instruments:
| | December 31, 2020 |
| At December 31, 2023 | | | At December 31, 2023 |
| (dollar amounts in millions) | (dollar amounts in millions) | Fair Value Hedges | | Cash Flow Hedges | | Economic Hedges | | Total | (dollar amounts in millions) | Fair Value Hedges | | Cash Flow Hedges | | Economic Hedges | | Total |
| Instruments associated with: | Instruments associated with: | | | | | | | |
| Investment securities | |
| Investment securities | |
| Investment securities | Investment securities | $ | 3,484 | | | $ | 0 | | | $ | 0 | | | $ | 3,484 | |
| Loans | Loans | 0 | | | 17,375 | | | 1,271 | | | 18,646 | |
| | Long-term debt | Long-term debt | 6,197 | | | 0 | | | 5,000 | | | 11,197 | |
| Total notional value at December 31, 2020 | $ | 9,681 | | | $ | 17,375 | | | $ | 6,271 | | | $ | 33,327 | |
| | Long-term debt | |
| | Long-term debt | |
| Total notional value | |
| | At December 31, 2022 | |
| | December 31, 2019 |
| At December 31, 2022 | |
| | At December 31, 2022 | |
| (dollar amounts in millions) | (dollar amounts in millions) | Fair Value Hedges | | Cash Flow Hedges | | Economic Hedges | | Total | (dollar amounts in millions) | Fair Value Hedges | | Cash Flow Hedges | | Economic Hedges | | Total |
| Instruments associated with: | Instruments associated with: | | | | | | | |
| Investment securities | |
| Investment securities | |
| Investment securities | Investment securities | $ | 0 | | | $ | 12 | | | $ | 0 | | | $ | 12 | |
| Loans | Loans | 0 | | | 18,375 | | | 0 | | | 18,375 | |
| | Long-term debt | Long-term debt | 7,540 | | | 0 | | | 0 | | | 7,540 | |
| Total notional value at December 31, 2019 | $ | 7,540 | | | $ | 18,387 | | | $ | 0 | | | $ | 25,927 | |
| | Long-term debt | |
| | Long-term debt | |
| Total notional value | |
These derivative financial instruments were entered into for the purpose of managing the interest rate risk of assets and liabilities. Net amounts receivable or payable on contracts hedging either interest earning assets or interest bearing liabilities were accrued as an adjustment to either interest income or interest expense. Also, recorded as an adjustmentAdjustments to interest income were also recorded for the amounts related to the amortization of floorpremiums for collars and forward-starting floor premiumsfloors that were excluded from the hedge effectiveness, changesnot included in the fair valuemeasurement of economic hedges,hedge effectiveness, as well as the amounts related to terminated hedges reclassified from AOCI. The net amounts resulted in an increase (decrease)a decrease to net interest income of $239$248 million $(53)for the year ended December 31, 2023, and an increase to net interest income of $76 million, and $(36)$337 million for the years ended December 31, 2020, 2019,2022 and 2018,2021, respectively.
Fair Value Hedges
The changes in fair value of the fair value hedges are recorded through earnings and offset against changes in the fair value of the hedged item.
Huntington has designated $3.1$11.0 billion of interest rate swaps as fair value hedges of fixed-rate investment securities using the last-of-layerportfolio layer method. This approach allows the Company to designate as the hedged item a stated amount of the assets that are not expected to be affected by prepayments, defaults and other factors affecting the timing and amount of cash flows. The fair value portfolio level basis adjustment on our hedged mortgage-backed securities is included inportfolio has not been attributed to the individual available-for-sale securities on thein our Consolidated Statements of Financial Condition. Huntington has also designated $662 million of interest rate swaps as fair value hedges of fixed-rate corporate bonds.
The following table presents the change in fair value for derivatives designated as fair value hedges as well as the offsetting change in fair value on the hedged item for the years ended December 31, 2020 and 2019:item.
| | | | Year Ended December 31, | | Year Ended December 31, |
| (dollar amounts in millions) | (dollar amounts in millions) | 2020 | | 2019 | | 2018 | (dollar amounts in millions) | 2023 | | 2022 | | 2021 |
| Interest rate contracts | Interest rate contracts | | | | | |
| Change in fair value of interest rate swaps hedging investment securities (1) | |
| Change in fair value of interest rate swaps hedging investment securities (1) | |
| Change in fair value of interest rate swaps hedging investment securities (1) | Change in fair value of interest rate swaps hedging investment securities (1) | $ | 6 | | | $ | 0 | | | $ | 0 | |
| Change in fair value of hedged investment securities (1) | Change in fair value of hedged investment securities (1) | 3 | | | 0 | | | 0 | |
| Change in fair value of interest rate swaps hedging long-term debt (2) | Change in fair value of interest rate swaps hedging long-term debt (2) | 113 | | | 127 | | | 112 | |
| Change in fair value of hedged long term debt (2) | Change in fair value of hedged long term debt (2) | (118) | | | (125) | | | (104) | |
|
2020 Form 10-K 149161 Huntington Bancshares Incorporated
As of December 31, 2020, theThe following amounts were recorded on the balance sheet related to cumulative basis adjustments for fair value hedges.
| | Amortized Cost | | Cumulative Amount of Fair Value Hedging Adjustment To Hedged Items |
| At December 31, | | At December 31, |
| Amortized Cost | | | Amortized Cost | | Cumulative Amount of Fair Value Hedging Adjustment To Hedged Items |
| At December 31, | | | At December 31, |
| (dollar amounts in millions) | (dollar amounts in millions) | 2020 | | 2019 | | 2020 | | 2019 | (dollar amounts in millions) | 2023 | | 2022 | | 2023 | | 2022 |
| Assets | Assets | | | | | | | |
| Investment securities (1) | Investment securities (1) | $ | 6,637 | | | $ | 0 | | | $ | 3 | | | $ | 0 | |
| Investment securities (1) | |
| Investment securities (1) | |
| Liabilities | Liabilities | |
| | Long-term debt | 6,383 | | | 7,578 | | | 232 | | | 114 | |
| Long-term debt (2) | |
| | Long-term debt (2) | |
| | Long-term debt (2) | |
(1)Amounts include the amortized cost basis of closed portfolios used to designate hedging relationships in whichunder the portfolio layer method. The hedged item is a layer of the last layerclosed portfolio which is expected to be remaining at the end of the hedging relationship. As of December 31, 2020,2023, the amortized cost basis of the closed portfolios used in these hedging relationships was $6.2$17.6 billion, the cumulative basis adjustments associated with these hedging relationships was $2$619 million, and the notional amounts of the designated hedged itemshedging instruments were $3.1$11.0 billion.
The(2)Excluded from the above table are the cumulative amount of fair value hedginghedge adjustments remaining for any hedged assets and liabilitieslong-term debt for which hedge accounting has been discontinued is $(62)in the amounts of $(69) million at December 31, 20202023 and $(93)$(70) million at December 31, 2019.2022.
Cash Flow Hedges
At December 31, 2020,2023, Huntington has $17.4had $16.7 billion of interest rate floors, floor spreads,swaps and swaps.floors. These are designated as cash flow hedges for variable rate commercial loans indexed to LIBOR.loans. The change in the fair value of a derivative instrument designated as a cash flow hedge is initially recognized in OCI and is reclassified into income when the hedged item impacts earnings. The initial premium paid for the interest rate floor contracts represents the time value of the contracts and is not included in the measurement of hedge effectiveness. Any change in fair value related to time value is recognized in OCI. The initial premium paid is amortized on a straight line basis as a reduction to interest income over the contractual life of these contracts.
Gains on interest rate floors, floor spreads, and swaps recognized in other comprehensive income were $234 million and $23 million for the years ended December 31, 2020 and 2019, respectively. No gains were recognized for the year ended December 31, 2018. At December 31, 2020,2023, the net gainslosses recognized in AOCI that are expected to be reclassified into earnings within the next 12 months were $37$236 million.
Derivatives used in mortgage banking activities
Mortgage loan origination hedging activity
Huntington’s mortgage origination hedging activity is related to economically hedging of Huntington’s mortgage pricing commitments to customers and the secondary sale to third parties. The value of a newly originated mortgage is not firm until the interest rate is committed or locked. Forward commitments to sell economically hedge the possible loss on interest rate lock commitments due to interest rate change. The net asset position of these derivatives was a net liability of $4 million and $3 million at December 31, 20202023 and December 31, 2019 are $26 million and $6 million,2022, respectively. At December 31, 20202023 and 2019,December 31, 2022, Huntington had commitments to sell residential real estate loans of $2.9 billion$674 million and $1.4 billion,$766 million, respectively. These contracts mature in less than one year.
162 Huntington Bancshares Incorporated
MSR hedging activity
Huntington’s MSR economic hedging activity uses securities and derivatives to manage the value of the MSR asset and to mitigate the various types of risk inherent in the MSR asset, including risks related to duration, basis, convexity, volatility, and yield curve. The hedging instruments include forward commitments, TBA securities, Treasury futures contracts, interest rate swaps, and options on interest rate swaps.
| | | | | | | | | | | | | | | | | | | | |
| MSR hedging activity | | | | At December 31, |
| (dollar amounts in millions) | | | | 2020 | | 2019 |
| Notional value | | | | $ | 1,170 | | | $ | 778 | |
| Trading assets | | | | 43 | | | 19 | |
| | | |
| | | |
| | Year December 31, |
| (dollar amounts in millions) | | 2020 | | 2019 | | 2018 |
| Trading gains (losses) | | $ | 52 | | | $ | 30 | | | $ | (8) | |
| | | | | | |
MSR hedging trading assets and liabilities are included in other assets and other liabilities, respectively, in the Consolidated Balance Sheets. Trading gains (losses) are included in mortgage banking income in the Consolidated Statement of Income. The notional value of the derivative financial instruments, the corresponding trading assets and liabilities positions, and net trading gains (losses) related to MSR hedging activity is summarized in the following tables:
| | | | | | | | | | | | | | | | | | | | |
| | | | At December 31, |
| (dollar amounts in millions) | | | | 2023 | | 2022 |
| Notional value | | | | $ | 1,668 | | | $ | 1,120 | |
| Trading assets | | | | — | | | 4 | |
| Trading liabilities | | | | (69) | | | (78) | |
| | | |
| | Year December 31, |
| (dollar amounts in millions) | | 2023 | | 2022 | | 2021 |
| Trading (losses) gains | | $ | (10) | | | $ | (109) | | | $ | (26) | |
| | | | | | |
Derivatives used in customer related activities
Various derivative financial instruments are offered to enable customers to meet their financing and investing objectives and for their risk management purposes. Derivative financial instruments used in trading activities consist of commodity, interest rate, and foreign exchange contracts. Huntington enters into offsetting third-party contracts with approved, reputable counterparties with substantially matching terms and currencies in order to economically hedge significant exposure related to derivatives used in trading activities.
The interest rate or price risk of customer derivatives is mitigated by entering into similar derivatives having offsetting terms with other counterparties. The credit risk to these customers is evaluated and included in the calculation of fair value. Foreign currency derivatives help the customer hedge risk and reduce exposure to fluctuations in exchange rates. Transactions are primarily in liquid currencies with Canadian dollars and Euros comprising a majority of all transactions. Commodity derivatives help the customer hedge risk and reduce exposure to fluctuations in the price of various commodities. Hedging of energy-related products and base metals comprise the majority of these transactions.
The net fair values of these derivative financial instruments, for which the gross amounts are included in other assets or other liabilities at December 31, 20202023 and December 31, 2019,2022, were $70$47 million and $87$59 million, respectively. The total notional values of derivative financial instruments used by Huntington on behalf of customers, including offsetting derivatives, were $37$44.5 billion and $30$40.7 billion at December 31, 20202023 and December 31, 2019,2022, respectively. Huntington’s credit risk from customer derivatives was $882$122 million and $407$118 million at the same dates, respectively.
Credit derivative instruments
Huntington enters into credit default swaps to hedge credit risk associated with certain loans and leases. These contracts are accounted for as derivatives, and accordingly, these contracts are recorded at fair value. The total notional value of credit contracts at December 31, 2023 totaled $381 million and the position of these derivatives was a net liability of $2 million at that date.
Financial assets and liabilities that are offset in the Consolidated Balance Sheets
Derivative balances are presented on a net basis taking into consideration the effects of legally enforceable master netting agreements. Additionally, collateral exchanged with counterparties is also netted against the applicable derivative fair values. Huntington enters into derivative transactions with two primary groups: broker-dealers and banks, and Huntington’s customers. Different methods are utilized for managing counterparty credit exposure and credit risk for each of these groups.
151 Huntington Bancshares Incorporated
Huntington enters into transactions with broker-dealers and banks for various risk management purposes. These types of transactions generally are high dollar volume. Huntington enters into collateral and master netting agreements with these counterparties, and routinely exchanges cash and high quality securities collateral.
Huntington enters into transactions with customers to meet their financing, investing, payment and risk management needs. These types of transactions generally are low dollar volume. Huntington enters into master netting agreements with customer counterparties,counterparties; however, collateral is generally not exchanged with customer counterparties.
In addition to the customer derivative credit exposure, aggregate credit risk associated with broker-dealer and bank derivative transactions was net credit risk of collateral that has been pledged by the counterparty, was $175$238 million and $22$227 million at December 31, 20202023 and December 31, 2019,2022, respectively. The net credit risk associated with derivatives is calculated after considering master netting agreements.agreements and is reduced by collateral that has been pledged by the counterparty.
At December 31, 2020,2023, Huntington pledged $276$206 million of investment securities and cash collateral to counterparties, while other counterparties pledged $387$745 million of investment securities and cash collateral to Huntington to satisfy collateral netting agreements. In the event of credit downgrades, Huntington would not be required to provide additional collateral.
The following tables present the gross amounts of these assets and liabilities with any offsets to arrive at the net amounts recognized in the Consolidated Balance Sheets at December 31, 2020 and December 31, 2019:Sheets.
| Offsetting of Financial Assets and Derivative Assets | | Gross amounts offset in the consolidated balance sheets | | Net amounts of assets presented in the consolidated balance sheets | | Gross amounts not offset in the consolidated balance sheets | |
| Offsetting of Financial Assets and Derivative Assets | |
| Offsetting of Financial Assets and Derivative Assets | |
| | | | Gross amounts offset in the consolidated balance sheets | |
| (dollar amounts in millions) | (dollar amounts in millions) | | Gross amounts of recognized assets | | Gross amounts offset in the consolidated balance sheets | | Net amounts of assets presented in the consolidated balance sheets | | Financial instruments | | Cash collateral received | | Net amount |
| December 31, 2020 | Derivatives | $ | 1,946 | | | $ | (112) | | | $ | (142) | | | $ | 803 | |
| December 31, 2019 | Derivatives | 856 | | | (404) | | | 452 | | | (65) | | | (29) | | | 358 | |
| (dollar amounts in millions) | |
| (dollar amounts in millions) | | | Gross amounts of recognized assets | | | | Financial instruments | | Cash collateral received | | Net amount |
| At December 31, 2023 | |
| At December 31, 2022 | |
| Offsetting of Financial Liabilities and Derivative Liabilities | | Gross amounts offset in the consolidated balance sheets | | Net amounts of liabilities presented in the consolidated balance sheets | | Gross amounts not offset in the consolidated balance sheets | |
| Offsetting of Financial Liabilities and Derivative Liabilities | |
| Offsetting of Financial Liabilities and Derivative Liabilities | |
| | | | Gross amounts offset in the consolidated balance sheets | |
| (dollar amounts in millions) | (dollar amounts in millions) | | Gross amounts of recognized liabilities | | Gross amounts offset in the consolidated balance sheets | | Net amounts of liabilities presented in the consolidated balance sheets | | Financial instruments | | Cash collateral delivered | | Net amount |
| December 31, 2020 | Derivatives | $ | 1,033 | | | $ | (9) | | | $ | (105) | | | $ | 2 | |
| December 31, 2019 | Derivatives | 521 | | | (417) | | | 104 | | | 0 | | | (75) | | | 29 | |
| (dollar amounts in millions) | |
| (dollar amounts in millions) | | | Gross amounts of recognized liabilities | | | | Financial instruments | | Cash collateral delivered | | Net amount |
| At December 31, 2023 | |
| At December 31, 2022 | |
22. VIEs21. VARIABLE INTEREST ENTITIES
Unconsolidated VIEs
The following tables provide a summary of the assets and liabilities included in Huntington’s Consolidated Financial Statements, as well as the maximum exposure to losses, associated with its interests related to unconsolidated VIEs for which Huntington holds an interest in, but is not the primary beneficiary of, the VIE at December 31, 2020, and 2019:VIE.
| | | | | | | | | | | | | | | | | |
| December 31, 2020 |
| (dollar amounts in millions) | Total Assets | | Total Liabilities | | Maximum Exposure to Loss |
| Trust Preferred Securities | $ | 14 | | | $ | 252 | | | $ | 0 | |
| Affordable Housing Tax Credit Partnerships | 956 | | | 500 | | | 956 | |
| Other Investments | 308 | | | 72 | | | 308 | |
| Total | $ | 1,278 | | | $ | 824 | | | $ | 1,264 | |
| | | December 31, 2019 |
| (dollar amounts in millions) | (dollar amounts in millions) | Total Assets | | Total Liabilities | | Maximum Exposure to Loss | (dollar amounts in millions) | Total Assets | | Total Liabilities | | Maximum Exposure to Loss |
| At December 31, 2023 | |
| Affordable Housing Tax Credit Partnerships | |
| Affordable Housing Tax Credit Partnerships | |
| Affordable Housing Tax Credit Partnerships | |
| Trust Preferred Securities | Trust Preferred Securities | $ | 14 | | | $ | 252 | | | $ | 0 | |
| Affordable Housing Tax Credit Partnerships | 727 | | | 332 | | | 727 | |
| Other Investments | Other Investments | 179 | | | 63 | | | 179 | |
| Total | Total | $ | 920 | | | $ | 647 | | | $ | 906 | |
| At December 31, 2022 | |
| Affordable Housing Tax Credit Partnerships | |
| Affordable Housing Tax Credit Partnerships | |
| Affordable Housing Tax Credit Partnerships | |
| Trust Preferred Securities | |
| Other Investments | |
| Total | |
1642023 Form 10-K Huntington Bancshares Incorporated152
Trust-Preferred Securities
Huntington has certain consolidatedwholly-owned trusts whose assets, liabilities, equity, income, and expenses are not included within Huntington’s Consolidated Financial Statements. These trusts have been formed for the sole purpose of issuing trust-preferred securities, from which the proceeds are then invested in Huntington junior subordinated debentures, which are reflected in Huntington’s Consolidated Balance Sheet as long-term debt. Refer to Note 11 - “Borrowings” for the outstanding amount of debentures issued to each trust and corresponding trust securities. The trust securities are the obligations of the trusts, and as such, are not consolidated within Huntington’s Consolidated Financial Statements. A list of trust-preferred securities outstanding at December 31, 2020 follows:
| | | | | | | | | | | | | | | | | |
| (dollar amounts in millions) | Rate | | Principal amount of subordinated note/ debenture issued to trust (1) | | Investment in unconsolidated subsidiary |
| Huntington Capital I | 0.94 | % | (2) | $ | 70 | | | $ | 6 | |
| Huntington Capital II | 0.86 | | (3) | 32 | | | 3 | |
| Sky Financial Capital Trust III | 1.64 | | (4) | 72 | | | 2 | |
| Sky Financial Capital Trust IV | 1.64 | | (4) | 74 | | | 2 | |
| Camco Financial Trust | 1.57 | | (5) | 4 | | | 1 | |
| Total | | | $ | 252 | | | $ | 14 | |
(1)Represents the principal amount of debentures issued to each trust, including unamortized original issue discount.
(2)Variable effective rate at December 31, 2020, based on three-month LIBOR + 0.70%.
(3)Variable effective rate at December 31, 2020, based on three-month LIBOR + 0.625%.
(4)Variable effective rate at December 31, 2020, based on three-month LIBOR + 1.40%.
(5)Variable effective rate at December 31, 2020, based on three month LIBOR + 1.33%.
Each issue of the junior subordinated debentures has an interest rate equal to the corresponding trust securities distribution rate. Huntington has the right to defer payment of interest on the debentures at any time, or from time-to-time for a period not exceeding five years provided that no extension period may extend beyond the stated maturity of the related debentures. During any such extension period, distributions to the trust securities will also be deferred and Huntington’s ability to pay dividends on its common stock will be restricted. Periodic cash payments and payments upon liquidation or redemption with respect to trust securities are guaranteed by Huntington to the extent of funds held by the trusts. The guarantee ranks subordinate and junior in right of payment to all indebtedness of the Company to the same extent as the junior subordinated debt. The guarantee does not place a limitation on the amount of additional indebtedness that may be incurred by Huntington.
Affordable Housing Tax Credit Partnerships
Huntington makes certain equity investments in various limited partnerships that sponsor affordable housing projects utilizing the LIHTC pursuant to Section 42 of the Internal Revenue Code. The purpose of these investments is to achieve a satisfactory return on capital, to facilitate the sale of additional affordable housing product offerings, and to assist in achieving goals associated with the Community Reinvestment Act. The primary activities of the limited partnerships include the identification, development, and operation of multi-family housing that is leased to qualifying residential tenants. Generally, these types of investments are funded through a combination of debt and equity.
Huntington uses the proportional amortization method to account for a majority of its investments in these entities. These investments are included in other assets. Investments that do not meet the requirements of the proportional amortization method are accounted for using the equity method. Investment losses related to these investments are included in Other noninterest income in the Consolidated Statements of Income.
The following table presents the balances of Huntington’s affordable housing tax credit investments and related unfunded commitments at December 31, 2020 and 2019.commitments.
| | | | | | | | | | | |
| (dollar amounts in millions) | December 31,
2020 | | December 31,
2019 |
| Affordable housing tax credit investments | $ | 1,568 | | | $ | 1,242 | |
| Less: amortization | (612) | | | (515) | |
| Net affordable housing tax credit investments | $ | 956 | | | $ | 727 | |
| Unfunded commitments | $ | 500 | | | $ | 332 | |
| | | | | | | | | | | |
| At December 31, |
| (dollar amounts in millions) | 2023 | | 2022 |
| Affordable housing tax credit investments | $ | 3,335 | | | $ | 2,891 | |
| Less: amortization | (1,038) | | | (855) | |
| Net affordable housing tax credit investments | $ | 2,297 | | | $ | 2,036 | |
| Unfunded commitments | $ | 1,279 | | | $ | 1,260 | |
The following table presents other information relating to Huntington’s affordable housing tax credit investmentsinvestments.
| | | | | | | | | | | | | | | | | |
| Year Ended December 31, |
| (dollar amounts in millions) | 2023 | | 2022 | | 2021 |
| Tax credits and other tax benefits recognized | $ | 260 | | | $ | 203 | | | $ | 144 | |
| Proportional amortization expense included in provision for income taxes | 205 | | | 170 | | | 126 | |
| | | | | |
| | | | | |
There was no impairment recognized for the years ended December 31, 2020, 2019,2023 and 2018:
| | | | | | | | | | | | | | | | | |
| Year Ended December 31, |
| (dollar amounts in millions) | 2020 | | 2019 | | 2018 |
| Tax credits and other tax benefits recognized | $ | 113 | | | $ | 98 | | | $ | 92 | |
| Proportional amortization expense included in provision for income taxes | 97 | | | 84 | | | 79 | |
| | | | | |
| | | | | |
Other Investments
Other investments determined to be VIE’s include investments in Small Business Investment Companies, Historic Tax Credit Investments, certain equity method investments, renewable energy financings, and other miscellaneous investments.
153 Huntington Bancshares Incorporated
23.
22. COMMITMENTS AND CONTINGENT LIABILITIES
Commitments to extend creditExtend Credit
In the ordinary course of business, Huntington makes various commitments to extend credit that are not reflected in the Consolidated Financial Statements. The contract amounts of these financial agreements at December 31, 2020, and December 31, 2019 were as follows:
| | | | At December 31, | | At December 31, |
| (dollar amounts in millions) | (dollar amounts in millions) | 2020 | | 2019 | (dollar amounts in millions) | 2023 | | 2022 |
| Contract amount representing credit risk | Contract amount representing credit risk | | | |
| Commitments to extend credit: | Commitments to extend credit: | |
| Commitments to extend credit: | |
| Commitments to extend credit: | |
| Commercial | |
| Commercial | |
| Commercial | Commercial | $ | 20,701 | | | $ | 18,326 | |
| Consumer | Consumer | 14,808 | | | 14,831 | |
| Commercial real estate | Commercial real estate | 1,313 | | | 1,364 | |
| Standby letters of credit | 581 | | | 587 | |
| Standby letters of credit and guarantees on industrial revenue bonds | |
| Commercial letters of credit | Commercial letters of credit | 21 | | | 8 | |
Commitments to extend credit generally have fixed expiration dates, are variable-rate, and contain clauses that permit Huntington to terminate or otherwise renegotiate the contracts in the event of a significant deterioration in the customer’s credit quality. These arrangements normally require the payment of a fee by the customer, the pricing of which is based on prevailing market conditions, credit quality, probability of funding, and other relevant factors. Since many of these commitments are expected to expire without being drawn upon, the contract amounts are not necessarily indicative of future cash requirements. The interest rate risk arising from these financial instruments is insignificant as a result of their predominantly short-term, variable-rate nature. Certain commitments to extend credit are secured by collateral, including residential and commercial real estate, inventory, receivables, cash and securities, and other business assets.
Standby letters of credit and guarantees on industrial revenue bonds are conditional commitments issued to guarantee the performance of a customer to a third-party. These guarantees are primarily issued to support public and private borrowing arrangements, including commercial paper, bond financing, and similar transactions. Most of these arrangements mature within two years. Since the conditions under which Huntington is required to fund these commitments may not materialize, the cash requirements are expected to be less than the total outstanding commitments. The carrying amount of deferred revenue associated with these guarantees was $5$9 million and $8$27 million at December 31, 20202023 and December 31, 2019,2022, respectively.
Commercial letters of credit represent short-term, self-liquidating instruments that facilitate customer trade transactions and generally have maturities of no longer than 90 days. The goods or cargo being traded normally secure these instruments.
Litigation and Regulatory Matters
In the ordinary course of business, Huntington is routinelyor may be a defendant in or party to pending and threatened legal and regulatory actions and proceedings.
In view of the inherent difficulty of predicting the outcome of such matters, particularly where the claimants seek very large or indeterminate damages or where the matters present novel legal theories or involve a large number of parties, Huntington generally cannot predict what the eventual outcome of the pending matters will be,
166 Huntington Bancshares Incorporated
what the timing of the ultimate resolution of these matters will be, or what the eventual loss, fines, or penalties related to each matter may be.
Huntington establishes an accrued liability when those matters present loss contingencies that are both probable and estimable. In such cases, there may be an exposure to loss in excess of any amounts accrued. Huntington thereafter continues to monitor the matter for further developments that could affect the amount of the accrued liability that has been previously established.
For certain matters, Huntington is able to estimate a range of possible loss. In cases in which Huntington possesses information to estimate a range of possible loss, that estimate is aggregated and disclosed below. There may be other matters for which a loss is probable or reasonably possible but such an estimate of the range of possible loss may not be possible. For those matters where an estimate of the range of possible loss is possible, management currently estimates the aggregate range of reasonably possible loss is $0 to $10$20 million at December 31, 20202023 in excess of the accrued liability (if any) related to those matters. This estimated range of possible loss is based upon currently available information and is subject to significant judgment, a variety of assumptions, and known and unknown uncertainties. The matters underlying the estimated range will change from time to time, and actual results may vary significantly from the current estimate. The estimated range of possible loss does not represent Huntington’s maximum loss exposure.
Based on current knowledge, management does not believe that loss contingencies arising from pending matters will have a material adverse effect on the consolidated financial position of Huntington. Further, management believes that amounts accrued are adequate to address Huntington’s contingent liabilities. However, in light of the inherent uncertainties involved in these matters, some of which are beyond Huntington’s control, and the large or indeterminate damages sought in some of these matters, an adverse outcome in one or more of these matters could be material to Huntington’s results of operations for any particular reporting period.
24.23. OTHER REGULATORY MATTERS
Huntington and the Bank are subject to certain risk-based capital and leverage ratio requirements under the U.S. Basel III capital rules adopted by the Federal Reserve, for Huntington, and by the OCC, for the Bank. These rules implement the Basel III international regulatory capital standards in the United States,U.S., as well as certain provisions of the Dodd-Frank Act. These quantitative calculations are minimums, and the Federal Reserve and OCC may determine that a banking organization, based on its size, complexity, or risk profile, must maintain a higher level of capital in order to operate in a safe and sound manner.
Under the U.S. Basel III capital rules, Huntington’s and the Bank’s assets, exposures and certain off-balance sheet items are subject to risk weights used to determine the institutions’ risk-weighted assets. These risk-weighted assets are used to calculate the following minimum capital ratios for Huntington and the Bank:
CET1 Risk-Based Capital Ratio, equal to the ratio of CET1 capital to risk-weighted assets. CET1 capital primarily includes common shareholders’ equity subject to certain regulatory adjustments and deductions, including with respect to goodwill, intangible assets, certain deferred tax assets, and AOCI.
Tier 1 Risk-Based Capital Ratio, equal to the ratio of Tier 1 capital to risk-weighted assets. Tier 1 capital is primarily comprised of CET1 capital, perpetual preferred stock and certain qualifying capital instruments.
Total Risk-Based Capital Ratio, equal to the ratio of total capital, including CET1 capital, Tier 1 capital and Tier 2 capital, to risk-weighted assets. Tier 2 capital primarily includes qualifying subordinated debt and qualifying ALLL. Tier 2 capital also includes, among other things, certain trust preferred securities.
Tier 1 Leverage Ratio, equal to the ratio of Tier 1 capital to quarterly average assets (net of goodwill, certain other intangible assets and certain other deductions).
The total minimum regulatory capital ratios and well-capitalized minimum ratios are reflected on the following page.
Failure to be well-capitalized or to meet minimum capital requirements could result in certain mandatory and possible additional discretionary actions by regulators that, if undertaken, could have an adverse material effect on our operations or financial condition. Failure to be well-capitalized or to meet minimum capital requirements could
also result in restrictions on Huntington’s or the Bank’s ability to pay dividends or otherwise distribute capital or to receive regulatory approval of applications.
In addition to meeting the minimum capital requirements under the U.S. Basel III capital rules, Huntington and the Bank must also maintain the required stressapplicable capital buffer and Capital Conservation Buffer, respectively,requirements, SCB or CCB, to avoid becoming subject to restrictions on capital distributions and certain discretionary bonus payments to management. The Capital Conservation Buffer is calculated as a ratio
155 Huntington Bancshares Incorporated
As of December 31, 2020,2023, Huntington’s and the Bank’s regulatory capital ratios were above the well-capitalized standards and met the applicable stress capital buffer and the Capital Conservation Buffer, respectively.requirements. Please refer to the table below for a summary of Huntington’s and the Bank’s regulatory capital ratios as ofratios.
| | | | | | | | | | | | | | | | | | | | | | | | | | | | | | | | | | | | | | | | | | | | | | | | | | |
| | Minimum | | Minimum Ratio+ | | | | Basel III |
| | Regulatory | | Capital Buffer (1) | | Well- | | At December 31, |
| | Capital | | At December 31, | | Capitalized | | 2023 | | 2022 |
| (dollar amounts in millions) | | Ratios | | 2023 | | 2022 | | Minimums | | Ratio | | Amount | | Ratio | | Amount |
| | | | | | | | | | | | | | | | |
| | | | | | | | | | | | | | | | |
| CET1 risk-based capital | Consolidated | 4.50 | % | | 7.70 | % | | 7.80 | % | | N/A | | 10.25 | % | | $ | 14,212 | | | 9.36 | % | | $ | 13,290 | |
| Bank | 4.50 | | | 7.00 | | | 7.00 | | | 6.50 | % | | 10.60 | | | 14,671 | | | 9.98 | | | 14,133 | |
| Tier 1 risk-based capital | Consolidated | 6.00 | | | 9.20 | | | 9.30 | | | 6.00 | | | 11.98 | | | 16,616 | | | 10.90 | | | 15,467 | |
| Bank | 6.00 | | | 8.50 | | | 8.50 | | | 8.00 | | | 11.47 | | | 15,879 | | | 10.83 | | | 15,334 | |
| Total risk-based capital | Consolidated | 8.00 | | | 11.20 | | | 11.30 | | | 10.00 | | | 14.17 | | | 19,657 | | | 13.09 | | | 18,573 | |
| Bank | 8.00 | | | 10.50 | | | 10.50 | | | 10.00 | | | 13.09 | | | 18,126 | | | 12.47 | | | 17,647 | |
| Tier 1 leverage | Consolidated | 4.00 | | | N/A | | N/A | | N/A | | 9.32 | | | 16,616 | | | 8.60 | | | 15,467 | |
| Bank | 4.00 | | | N/A | | N/A | | 5.00 | | | 8.51 | | | 15,879 | | | 8.54 | | | 15,334 | |
(1) The SCB, applicable to Huntington, was 3.2% and 3.3% at December 31, 2020, calculated using2023 and December 31, 2022, respectively. The CCB, applicable to the regulatory capital methodology applicable during 2020.
| | | | | | | | | | | | | | | | | | | | | | | | | | | | | | | | | | | | | | | | | | | | |
| | Minimum | | Minimum | | | | Basel III |
| | Regulatory | | Ratio+Capital | | Well- | | December 31, |
| | Capital | | Conservation | | Capitalized | | 2020 | | 2019 |
| (dollar amounts in millions) | | Ratios | | Buffer (1) | | Minimums | | Ratio | | Amount | | Ratio | | Amount |
| | | | | | | | | | | | | | |
| | | | | | | | | | | | | | |
| CET 1 risk-based capital | Consolidated | 4.50 | % | | 7.00 | % | | N/A | | 10.00 | % | | $ | 8,887 | | | 9.88 | % | | $ | 8,647 | |
| Bank | 4.50 | | | 7.00 | | | 6.50 | % | | 10.65 | | | 9,438 | | | 11.17 | | | 9,747 | |
| Tier 1 risk-based capital | Consolidated | 6.00 | | | 8.50 | | | 6.00 | | | 12.47 | | | 11,083 | | | 11.26 | | | 9,854 | |
| Bank | 6.00 | | | 8.50 | | | 8.00 | | | 11.97 | | | 10,601 | | | 12.17 | | | 10,621 | |
| Total risk-based capital | Consolidated | 8.00 | | | 10.50 | | | 10.00 | | | 14.46 | | | 12,856 | | | 13.04 | | | 11,413 | |
| Bank | 8.00 | | | 10.50 | | | 10.00 | | | 13.58 | | | 12,032 | | | 13.59 | | | 11,864 | |
| Tier 1 leverage | Consolidated | 4.00 | | | N/A | | N/A | | 9.32 | | | 11,083 | | | 9.26 | | | 9,854 | |
| Bank | 4.00 | | | N/A | | 5.00 | | | 8.94 | | | 10,601 | | | 10.01 | | | 10,621 | |
(1) Reflects the stress capital buffer ofBank, was 2.5% for Huntingtonat both December 31, 2023 and the Capital Conservation Buffer of 2.5% for the Bank.
Huntington and its subsidiaries are also subject to various regulatory requirements that impose restrictions on cash, debt, and dividends. The Bank is required to maintain cash reserves based on the level of certain of its deposits. This reserve requirement may be met by holding cash in banking offices or on deposit at the FRB. During 2020 and 2019, the average balances of these deposits were $3.9 billion and $0.6 billion, respectively.December 31, 2022.
Under current Federal Reserve regulations, the Bank is limited as to the amount and type of loans it may make to the parent company and nonbank subsidiaries. At December 31, 2020,2023, the Bank could lend $1.2$1.8 billion to a single affiliate, subject to the qualifying collateral requirements defined in the regulations.
Dividends from the Bank are one of the major sources of funds for the Company. These funds aid the Company in the payment of dividends to shareholders, expenses, and other obligations. Payment of dividends and/or return of capital to the parent company is subject to various legal and regulatory limitations. During 2020, the Bank paid dividends of $1.5 billion to the holding company. Also, there are statutory and regulatory limitations on the ability of national banks to pay dividends or make other capital distributions.
168 Huntington Bancshares Incorporated
25.24. PARENT-ONLY FINANCIAL STATEMENTS
The parent-only financial statements, which include transactions with subsidiaries, are as follows:
| | Balance Sheets | Balance Sheets | December 31, | Balance Sheets | At December 31, |
| (dollar amounts in millions) | (dollar amounts in millions) | 2020 | | 2019 | (dollar amounts in millions) | 2023 | | 2022 |
| Assets | Assets | | | |
| Cash and due from banks | |
| Cash and due from banks | |
| Cash and due from banks | Cash and due from banks | $ | 4,466 | | | $ | 3,119 | |
| Due from The Huntington National Bank | Due from The Huntington National Bank | 297 | | | 47 | |
| Due from non-bank subsidiaries | Due from non-bank subsidiaries | 37 | | | 34 | |
| Investment in The Huntington National Bank | Investment in The Huntington National Bank | 12,509 | | | 12,833 | |
| Investment in non-bank subsidiaries | Investment in non-bank subsidiaries | 147 | | | 165 | |
| Accrued interest receivable and other assets | Accrued interest receivable and other assets | 429 | | | 349 | |
| Total assets | Total assets | $ | 17,885 | | | $ | 16,547 | |
| Liabilities and shareholders’ equity | Liabilities and shareholders’ equity | | | |
| Long-term borrowings | Long-term borrowings | $ | 4,142 | | | $ | 4,095 | |
| Long-term borrowings | |
| Long-term borrowings | |
| Dividends payable, accrued expenses, and other liabilities | Dividends payable, accrued expenses, and other liabilities | 750 | | | 657 | |
| Total liabilities | Total liabilities | 4,892 | | | 4,752 | |
| Shareholders’ equity (1) | Shareholders’ equity (1) | 12,993 | | | 11,795 | |
| Total liabilities and shareholders’ equity | Total liabilities and shareholders’ equity | $ | 17,885 | | | $ | 16,547 | |
(1)See Consolidated Statements of Changes in Shareholders’ Equity.
| | | | | | | | | | | | | | | | | |
| Statements of Income | Year Ended December 31, |
| (dollar amounts in millions) | 2020 | | 2019 | | 2018 |
| Income | | | | | |
| Dividends from: | | | | | |
| The Huntington National Bank | $ | 1,527 | | | $ | 685 | | | $ | 1,722 | |
| Non-bank subsidiaries | 36 | | | 3 | | | 0 | |
| Interest from: | | | | | |
| The Huntington National Bank | 4 | | | 8 | | | 27 | |
| Non-bank subsidiaries | 1 | | | 2 | | | 2 | |
| Other | 11 | | | 2 | | | (2) | |
| Total income | 1,579 | | | 700 | | | 1,749 | |
| Expense | | | | | |
| Personnel costs | 17 | | | 6 | | | 2 | |
| Interest on borrowings | 115 | | | 143 | | | 124 | |
| Other | 123 | | | 145 | | | 118 | |
| Total expense | 255 | | | 294 | | | 244 | |
| Income before income taxes and equity in undistributed net income of subsidiaries | 1,324 | | | 406 | | | 1,505 | |
| Provision (benefit) for income taxes | (46) | | | (63) | | | (48) | |
| Income before equity in undistributed net income of subsidiaries | 1,370 | | | 469 | | | 1,553 | |
| Increase (decrease) in undistributed net income (loss) of: | | | | | |
| The Huntington National Bank | (547) | | | 908 | | | (186) | |
| Non-bank subsidiaries | (6) | | | 34 | | | 26 | |
| Net income | $ | 817 | | | $ | 1,411 | | | $ | 1,393 | |
| Other comprehensive income (loss) (1) | 448 | | | 353 | | | (80) | |
| Comprehensive income | $ | 1,265 | | | $ | 1,764 | | | $ | 1,313 | |
| | | | | | | | | | | | | | | | | |
| Statements of Income | Year Ended December 31, |
| (dollar amounts in millions) | 2023 | | 2022 | | 2021 |
| Income | | | | | |
| Dividends from: | | | | | |
| The Huntington National Bank | $ | 1,706 | | | $ | 1,566 | | | $ | 1,394 | |
| Non-bank subsidiaries | 27 | | | 19 | | | 19 | |
| Interest from: | | | | | |
| The Huntington National Bank | 77 | | | 16 | | | 3 | |
| Non-bank subsidiaries | 2 | | | 1 | | | 1 | |
| Other | (1) | | | (1) | | | — | |
| Total income | 1,811 | | | 1,601 | | | 1,417 | |
| Expense | | | | | |
| Personnel costs | 5 | | | 8 | | | 6 | |
| Interest on borrowings | 252 | | | 107 | | | 60 | |
| Other | 191 | | | 169 | | | 230 | |
| Total expense | 448 | | | 284 | | | 296 | |
| Income before income taxes and equity in undistributed net income of subsidiaries | 1,363 | | | 1,317 | | | 1,121 | |
| Provision (benefit) for income taxes | (75) | | | (44) | | | (56) | |
| Income before equity in undistributed net income of subsidiaries | 1,438 | | | 1,361 | | | 1,177 | |
| Increase in undistributed net income of: | | | | | |
| The Huntington National Bank | 486 | | | 853 | | | 97 | |
| Non-bank subsidiaries | 27 | | | 24 | | | 21 | |
| Net income | $ | 1,951 | | | $ | 2,238 | | | $ | 1,295 | |
| Other comprehensive income (loss)(1) | 422 | | | (2,869) | | | (421) | |
| Comprehensive income (loss) | $ | 2,373 | | | $ | (631) | | | $ | 874 | |
(1)See Consolidated Statements of Comprehensive Income for other comprehensive (loss) income (loss) detail.
| | | | | | | | | | | | | | | | | |
| Statements of Cash Flows | Year Ended December 31, |
| (dollar amounts in millions) | 2023 | | 2022 | | 2021 |
| Operating activities | | | | | |
| Net income | $ | 1,951 | | | $ | 2,238 | | | $ | 1,295 | |
| Adjustments to reconcile net income to net cash provided by operating activities: | | | | | |
| Equity in undistributed net income of subsidiaries | (513) | | | (877) | | | (118) | |
| Depreciation and amortization | — | | | (22) | | | 23 | |
| | | | | |
| Other, net | 192 | | | (55) | | | (217) | |
| Net cash provided by operating activities | 1,630 | | | 1,284 | | | 983 | |
| Investing activities | | | | | |
| Repayments from subsidiaries | 503 | | | 14 | | | 8 | |
| Advances to subsidiaries | (1,753) | | | (503) | | | (59) | |
| Net purchases of securities | — | | | (20) | | | (28) | |
| Net cash (paid) received from business combination | — | | | (194) | | | 248 | |
| | | | | |
| Other, net | (10) | | | (1) | | | — | |
| Net cash (used for) provided by investing activities | (1,260) | | | (704) | | | 169 | |
| Financing activities | | | | | |
| | | | | |
| Proceeds from issuance of long-term debt | 1,250 | | | 1,144 | | | 513 | |
| | | | | |
| | | | | |
| | | | | |
| | | | | |
| Payment of long-term debt | (323) | | | — | | | (1,508) | |
| Dividends paid on common and preferred stock | (1,034) | | | (1,010) | | | (888) | |
| Repurchases of common stock | — | | | — | | | (650) | |
| Net proceeds from issuance of preferred stock | 317 | | | — | | | 486 | |
| | | | | |
| Repurchase/redemption of preferred stock | (82) | | | — | | | (700) | |
| Other, net | (22) | | | (21) | | | (39) | |
| Net cash provided by (used for) financing activities | 106 | | | 113 | | | (2,786) | |
| Increase (decrease) in cash and cash equivalents | 476 | | | 693 | | | (1,634) | |
| Cash and cash equivalents at beginning of year | 3,525 | | | 2,832 | | | 4,466 | |
| Cash and cash equivalents at end of year | $ | 4,001 | | | $ | 3,525 | | | $ | 2,832 | |
| | | | | |
| Supplemental disclosure: Interest paid | $ | 228 | | | $ | 89 | | | $ | 71 | |
2020 Form 10-K 157169 Huntington Bancshares Incorporated
| | | | | | | | | | | | | | | | | |
| Statements of Cash Flows | Year Ended December 31, |
| (dollar amounts in millions) | 2020 | | 2019 | | 2018 |
| Operating activities | | | | | |
| Net income | $ | 817 | | | $ | 1,411 | | | $ | 1,393 | |
| Adjustments to reconcile net income to net cash provided by operating activities: | | | | | |
| Equity in undistributed net income of subsidiaries | 553 | | | (942) | | | 197 | |
| Depreciation and amortization | 0 | | | (2) | | | (2) | |
| | | | | |
| Other, net | 89 | | | (19) | | | 121 | |
| Net cash (used for) provided by operating activities | 1,459 | | | 448 | | | 1,709 | |
| Investing activities | | | | | |
| Repayments from subsidiaries | 8 | | | 701 | | | 21 | |
| Advances to subsidiaries | (256) | | | (11) | | | (13) | |
| (Purchases)/Proceeds from sale of securities | (1) | | | (38) | | | 0 | |
| Cash paid for acquisitions, net of cash received | 0 | | | 0 | | | (15) | |
| | | | | |
| | | | | |
| Net cash (used for) provided by investing activities | (249) | | | 652 | | | (7) | |
| Financing activities | | | | | |
| | | | | |
| Net proceeds from issuance of medium-term notes | 747 | | | 797 | | | 501 | |
| | | | | |
| Payment of medium-term notes | 0 | | | 0 | | | (400) | |
| | | | | |
| | | | | |
| Payment of long-term debt | (800) | | | 0 | | | 0 | |
| Dividends paid on common and preferred stock | (698) | | | (671) | | | (584) | |
| Repurchases of common stock | (92) | | | (441) | | | (939) | |
| Net proceeds from issuance of preferred stock | 988 | | | 0 | | | 495 | |
| | | | | |
| | | | | |
| Other, net | (8) | | | (18) | | | (41) | |
| Net cash provided by (used for) financing activities | 137 | | | (333) | | | (968) | |
| Increase (decrease) in cash and cash equivalents | 1,347 | | | 767 | | | 734 | |
| Cash and cash equivalents at beginning of year | 3,119 | | | 2,352 | | | 1,618 | |
| Cash and cash equivalents at end of year | $ | 4,466 | | | $ | 3,119 | | | $ | 2,352 | |
| Supplemental disclosure: | | | | | |
| Interest paid | $ | 113 | | | $ | 135 | | | $ | 126 | |
26.25. SEGMENT REPORTING
Huntington’s business segments are based on our internally-aligned segment leadership structure, which is how management monitors results and assesses performance. The Company has 4 majorHuntington completed an organizational realignment during the 2023 second quarter and now reports on two business segments: Consumer & Regional Banking and Commercial Banking. The organizational realignment primarily involved consolidating our previously reported Consumer and Business Banking, Vehicle Finance and RBHPCG, into one new business segment called Consumer & Regional Banking. Prior period results have been adjusted to conform to the new segment presentation.
The following is a description of our business segments and the Treasury / Other function:
Consumer & Regional Banking - Consumer & Regional Banking offers a comprehensive set of digitally powered consumer and business financial solutions to Consumer Lending, Regional Banking, Branch Banking, and Wealth Management customers. The Consumer & Regional Banking segment provides a wide array of financial products and services to consumer and business customers including, but not limited to, deposits, lending, payments, mortgage banking, dealer financing, investment management, trust, brokerage, insurance, and other financial products and services. We serve our customers through our network of channels, including branches and ATMs, online and mobile banking, and through our customer call centers.
Commercial Banking - The Commercial Banking Vehiclesegment provides expertise through bankers, capabilities, and digital channels, which include a comprehensive set of product offerings. Our target clients span from mid-market to large corporates across a national footprint. The Commercial Banking segment leverages internal partnerships for wealth management, trust, insurance, payments, and treasury management capabilities. In particular, our payment capabilities continue to expand as we develop unique solutions for our diverse client segments, including Huntington ChoicePay. This segment includes customers in Middle Market Banking, Corporate, Specialty, and Government Banking, Asset Finance, RegionalCommercial Real Estate Banking, and The Huntington Private Client Group (RBHPCG).Capital Markets.
Treasury / Other - The Treasury / Other function includes technology and operations, and other unallocated assets, liabilities, revenue, and expense.
Business segment results are determined based upon Huntington’s management reporting system, which assigns balance sheet and income statement items to each of the business segments. The process is designed around the organizational and management structure and, accordingly, the results derived are not necessarily comparable with similar information published by other financial institutions. Additionally, because of the interrelationships of the various segments, the information presented is not indicative of how the segments would perform if they operated as independent entities.
Revenue is recorded in the business segment responsible for the related product or service. Fee sharing is recorded to allocate portions of such revenue to other business segments involved in selling to, or providing service to, customers. Results of operations for the business segments reflect these fee sharing allocations.
The management process that develops the business segment reporting utilizes various estimates and allocation methodologies to measure the performance of the business segments. Expenses are allocated to business segments using a two-phase approach. The first phase consists of measuring and assigning unit costs (activity-based costs) to activities related to product origination and servicing. These activity-based costs are then extended, based on volumes, with the resulting amount allocated to business segments that own the related products. The second phase consists of the allocation of overhead costs to all 4the business segments from Treasury / Other. Huntington
170 Huntington Bancshares Incorporated
utilizes a full-allocation methodology, where all Treasury / Other expenses, except reported acquisition-related net expenses, if any, and a small amount of other residual unallocated expenses, are allocated to the 4 business segments.
The management policies and processes utilized in compiling segment financial information are highly subjective and, unlike financial accounting, are not based on authoritative guidance similar to GAAP. As a result, reported segment results are not necessarily comparable with similar information reported by other financial institutions. Furthermore, changes in management structure or allocation methodologies and procedures result in changes in reported segment financial data. Accordingly, certain amounts have been reclassified to conform to the current period presentation.
Huntington uses an active and centralized FTP methodology to attribute appropriate net interest income to the business segments. The intent of the FTP methodology is to transfer interest rate risk from the business segments by providing matched duration funding of assets and liabilities. The result is to centralize the financial impact, management, and reporting of interest rate risk in the Treasury / Other function where it can be centrally monitored and managed. The Treasury / Other function charges (credits) an internal cost of funds for assets held in (or pays for funding provided by) each business segment. TheDuring the fourth quarter of 2023, we revised our FTP rate is based on prevailing market interest ratesmethodology for comparable duration assets (or liabilities).
Consumer and Business Banking - The Consumer and Business Banking segment, including Home Lending, provides a wide array of financial products and servicesnon-maturity deposits, which has been enhanced to consumer and small business customers including but not limitedconsider the internally modeled weighted average life by non-maturity deposit type. Prior period results have been adjusted to checking accounts, savings accounts, money market accounts, certificates of deposit, mortgage loans, consumer loans, credit cards, and small business loans and investment products. Other financial services available to customers include insurance, interest rate risk protection, foreign exchange, and treasury management. Business Banking is defined as serving companies with revenues up to $20 million. Home Lending supports origination and servicing of consumer loans and mortgages for customers who are generally located in our primary banking markets across all segments.
Commercial Banking - Through a relationship banking model, this segment provides a wide array of products and servicesconform to the middle market, large corporate, real estate and government public sector customers located primarily within our geographic footprint. The segment is divided into 4 business units: Relationship Banking Group, Specialized Lending Group, Treasury Management/Deposits Group and Capital Markets Group.
Vehicle Finance - Our products and services include providing financing to consumers for the purchase of automobiles, light-duty trucks, recreational vehicles, and marine craft at franchised and other select dealerships, and providing financing to franchised dealerships for the acquisition of new and used inventory. Products and services are delivered through highly specialized relationship-focused bankers and product partners.
Regional Banking and The Huntington Private Client Group - The core business of The Huntington Private Client Group is The Huntington Private Bank, which consists of Private Banking, Wealth & Investment Management, and Retirement Plan Services. The Huntington Private Bank provides high net-worth customers with deposit, lending (including specialized lending options), and banking services. The Huntington Private Bank also delivers wealth management and legacy planning through investment and portfolio management, fiduciary administration, and trust services. This group also provides retirement plan services to corporate businesses. The Huntington Private Client Group provides corporate trust services and institutional and mutual fund custody services.
Listed in the table below is certain operating basis financial information reconciled to Huntington’s, December 31, 2020, December 31, 2019, and December 31, 2018, reported results by business segment:segment.
| Income Statements (dollar amounts in millions) | Income Statements (dollar amounts in millions) | Consumer & Business Banking | | Commercial Banking | | Vehicle Finance | | RBHPCG | | Treasury / Other | | Huntington Consolidated |
| 2020 | | | | | | | | | | | |
| Net interest income | $ | 1,436 | | | $ | 903 | | | $ | 430 | | | $ | 160 | | | $ | 295 | | | $ | 3,224 | |
| Provision (benefit) for credit losses | 265 | | | 626 | | | 146 | | | 11 | | | 0 | | | 1,048 | |
Income Statements (dollar amounts in millions) | |
Income Statements (dollar amounts in millions) | | Consumer & Regional Banking | | Commercial Banking | | | | | | Treasury / Other | | Huntington Consolidated |
| Year Ended December 31, 2023 | |
| Net interest income (loss) | |
| Net interest income (loss) | |
| Net interest income (loss) | |
| Provision for credit losses | |
| Noninterest income | Noninterest income | 945 | | | 364 | | | 9 | | | 201 | | | 72 | | | 1,591 | |
| Noninterest expense | Noninterest expense | 1,774 | | | 542 | | | 141 | | | 243 | | | 95 | | | 2,795 | |
| Provision (benefit) for income taxes | Provision (benefit) for income taxes | 72 | | | 21 | | | 32 | | | 22 | | | 8 | | | 155 | |
| Net income (loss) | $ | 270 | | | $ | 78 | | | $ | 120 | | | $ | 85 | | | $ | 264 | | | $ | 817 | |
| 2019 | | | | | | | | | | | |
| Income attributable to non-controlling interest | |
| Net income (loss) attributable to Huntington Bancshares Inc | |
| Year Ended December 31, 2022 | |
| Net interest income | Net interest income | $ | 1,766 | | | $ | 1,037 | | | $ | 397 | | | $ | 198 | | | $ | (185) | | | $ | 3,213 | |
| Provision (benefit) for credit losses | 114 | | | 132 | | | 44 | | | (3) | | | 0 | | | 287 | |
| Net interest income | |
| Net interest income | |
| Provision for credit losses | |
| Noninterest income | Noninterest income | 825 | | | 359 | | | 12 | | | 198 | | | 60 | | | 1,454 | |
| Noninterest expense | Noninterest expense | 1,673 | | | 564 | | | 148 | | | 256 | | | 80 | | | 2,721 | |
| Provision (benefit) for income taxes | Provision (benefit) for income taxes | 169 | | | 147 | | | 45 | | | 30 | | | (143) | | | 248 | |
| Net income (loss) | $ | 635 | | | $ | 553 | | | $ | 172 | | | $ | 113 | | | $ | (62) | | | $ | 1,411 | |
| 2018 | | | | | | | | | | | |
| Net interest income | $ | 1,727 | | | $ | 1,013 | | | $ | 392 | | | $ | 203 | | | $ | (146) | | | $ | 3,189 | |
| Provision (benefit) for credit losses | 137 | | | 42 | | | 55 | | | 1 | | | 0 | | | 235 | |
| Income attributable to non-controlling interest | |
| Net income attributable to Huntington Bancshares Inc | |
| Year Ended December 31, 2021 | |
| Net interest income (loss) | |
| Net interest income (loss) | |
| Net interest income (loss) | |
| Provision for credit losses | |
| Noninterest income | Noninterest income | 744 | | | 321 | | | 11 | | | 193 | | | 52 | | | 1,321 | |
| Noninterest expense | Noninterest expense | 1,699 | | | 502 | | | 143 | | | 244 | | | 59 | | | 2,647 | |
| Provision (benefit) for income taxes | Provision (benefit) for income taxes | 133 | | | 166 | | | 43 | | | 32 | | | (139) | | | 235 | |
| Net income (loss) | $ | 502 | | | $ | 624 | | | $ | 162 | | | $ | 119 | | | $ | (14) | | | $ | 1,393 | |
| Income attributable to non-controlling interest | |
| Net income (loss) attributable to Huntington Bancshares Inc | |
| | | | Assets at December 31, | | Deposits at December 31, | | Assets at December 31, | | Deposits at December 31, |
| (dollar amounts in millions) | (dollar amounts in millions) | 2020 | | 2019 | | 2020 | | 2019 | (dollar amounts in millions) | 2023 | | 2022 | | 2023 | | 2022 |
| Consumer & Business Banking | $ | 30,758 | | | $ | 25,073 | | | $ | 60,910 | | | $ | 51,675 | |
| Consumer & Regional Banking | |
| Commercial Banking | Commercial Banking | 36,311 | | | 34,337 | | | 24,766 | | | 20,762 | |
| Vehicle Finance | 19,789 | | | 20,155 | | | 722 | | | 376 | |
| RBHPCG | 7,064 | | | 6,665 | | | 7,635 | | | 6,370 | |
| | Treasury / Other | |
| | Treasury / Other | |
| | | Treasury / Other | Treasury / Other | 29,116 | | | 22,772 | | | 4,915 | | | 3,164 | |
| Total | Total | $ | 123,038 | | | $ | 109,002 | | | $ | 98,948 | | | $ | 82,347 | |
172159 Huntington Bancshares Incorporated
Item 9: Changes In and Disagreements With Accountants on Accounting and Financial Disclosure
None.
Item 9A: Controls and Procedures
Disclosure Controls and Procedures
Huntington maintains disclosure controls and procedures designed to ensure that the information required to be disclosed in the reports that it files or submits under the Securities Exchange Act of 1934, as amended (the Exchange Act), are recorded, processed, summarized, and reported within the time periods specified in the SEC’s rules and forms. Disclosure controls and procedures include, without limitation, controls and procedures designed to ensure that information required to be disclosed by an issuer in the reports that it files or submits under the Exchange Act is accumulated and communicated to the issuer’s management, including its principal executive and principal financial officers, or persons performing similar functions, as appropriate to allow timely decisions regarding required disclosure. Huntington’s Management,management, with the participation of its Chief Executive Officer and the Chief Financial Officer, evaluated the effectiveness of Huntington’s disclosure controls and procedures (as such term is defined in Rules 13a-15(e) and 15d-15(e) under the Exchange Act) as of December 31, 2020.2023. Based upon such evaluation, Huntington’s Chief Executive Officer and Chief Financial Officer have concluded that, as of December 31, 2020,2023, Huntington’s disclosure controls and procedures were effective.
Internal Control Over Financial Reporting
Information required by this item is set forth in the Report of Management’s Assessment of Internal Control over Financial Reporting and the Report of Independent Registered Public Accounting Firm.
Changes in Internal Control Over Financial Reporting
There have not been any changes in our internal control over financial reporting (as such term is defined in Rules 13a-15(f) and 15d-15(f) under the Exchange Act) during the quarter ended December 31, 2020,2023, that have materially affected, or are reasonably likely to materially affect, internal control over financial reporting.
Item 9B: Other Information
Trading Plans
On November 20, 2023, Julie C. Tutkovics, our Chief Marketing and Communications Officer, adopted a trading plan intended to satisfy the conditions under Rule 10b5-1(c) of the Exchange Act. Ms. Tutkovics’ plan is for the sale of up to 178,395 shares of our common stock in amounts and prices determined in accordance with formulae set forth in the plan and terminates on the earlier of the date all the shares under the plan are sold and November 4, 2024.
Item 9C: Disclosure Regarding Foreign Jurisdictions that Prevent Inspections.
Not applicable.
PART III
We refer in Part III of this report to relevant sections of our 20212024 Proxy Statement for the 2021 annual meeting2024 Annual Meeting of shareholders, which will be filed with the SEC pursuant to Regulation 14A within 120 days of the close of our 20202023 fiscal year. Portions of our 20212024 Proxy Statement, including the sections we refer to in this report, are incorporated by reference into this report.
Item 10: Directors, Executive Officers, and Corporate Governance
Information required by this item is set forth under the captions Election of Directors, Corporate Governance, Our Executive Officers, Family Relationships, Delinquent Section 16(a) Reports, Codes of Ethics, Proposals by Shareholders for the 2024 Annual Meeting, Recommendations for Directorship, and Board Meetings and Committee Information Report of the Audit Committee, and Section 16(a) Beneficial Ownership Reporting Compliance of our 20212024 Proxy Statement, which is incorporated by reference into this item.
Item 11: Executive Compensation
Information required by this item is set forth under the captions Compensation of Executive Officers and Compensation of Directors of our 20212024 Proxy Statement, which is incorporated by reference into this item.
Item 12: Security Ownership of Certain Beneficial Owners and Management and Related Stockholder Matters
Information requiredThe following table sets forth information about Huntington common stock authorized for issuance under Huntington’s existing equity compensation plans as of December 31, 2023.
| | | | | | | | | | | | | | | | | | | | |
| Plan Category (1) | | Number of securities to be issued upon exercise of outstanding options, warrants, and rights (2)(3) (a) | | Weighted-average exercise price of outstanding options, warrants, and rights (4)
(b) | | Number of securities remaining available for future issuance under equity compensation plans (excluding securities reflected in column (a)) (5)
(c) |
| Equity compensation plans approved by security holders | | 34,359,531 | | | $ | 4.53 | | | 14,508,872 | |
| Equity compensation plans not approved by security holders | | — | | | — | | | — | |
| Total | | 34,359,531 | | | $ | 4.53 | | | 14,508,872 | |
(1)All equity compensation plan authorizations for shares of common stock provide for the number of shares to be adjusted for stock splits, stock dividends, and other changes in capitalization. The Huntington 401(k) Plan, a broad-based plan qualified under Internal Revenue Code Section 401(a) which includes Huntington common stock as one of a number of investment options available to participants, is excluded from the table.
(2)The numbers in this column (a) reflect shares of common stock to be issued upon exercise of outstanding stock options and the vesting of outstanding awards of restricted stock awards, restricted share units, and performance share units, and the release of deferred share units.
(3)As of December 31, 2023, an additional 991,178 common shares, at a weighted-average exercise price of $7.07, are to be issued upon exercise or vesting under the TCF Incentive Plan, which was assumed in the acquisition of TCF, is no longer active, and for which Huntington has not reserved the right to make subsequent grants or awards.
(4)The weighted-average exercise prices in this column are based on outstanding options and do not take into account unvested awards of restricted stock awards, restricted stock units and performance share units and unreleased deferred share units as these awards do not have an exercise price.
(5)The number of shares in this column (c) reflects the number of shares remaining available for future issuance under Huntington’s 2018 Plan, excluding shares reflected in column (a). The number of shares in this column (c) does not include shares of common stock to be issued under the following compensation plans: the Executive Deferred Compensation Plan, which provides senior officers designated by thisthe Human Resources and Compensation Committee the opportunity to defer up to 90% of base salary, annual bonus compensation and certain equity awards, and up to 90% of long-term incentive awards; the Supplemental Plan under which voluntary participant contributions made by payroll deduction are used to purchase shares; the Deferred Compensation for Huntington Bancshares Incorporated Directors under which directors may defer their director compensation and such amounts may be invested in shares of common stock; and the Deferred Compensation Plan for directors (now inactive) under which directors of selected subsidiaries may defer their director compensation and such amounts may be invested in shares of Huntington common stock. These plans do not contain a limit on the number of shares that may be issued under them.
The information related to item 403 of regulation S-K is set forth under the captions Compensationcaption Ownership of Executive OfficersVoting Stock of our 20212024 Proxy Statement, which is incorporated by reference into this item.
Item 13: Certain Relationships and Related Transactions, and Director Independence
Information required by this item is set forth under the captions Independence of Directors and Review, Approval, or Ratification of Transactions with Related Persons and Independence of Directors of our 20212024 Proxy Statement, which are incorporated by reference into this item.
Item 14: Principal Accounting Fees and Services
Information required by this item is set forth under the caption Proposal to Ratify the Appointment of Independent Registered Public Accounting FirmAudit Matters of our 20212024 Proxy Statement which is incorporated by reference into this item.
161 Huntington Bancshares Incorporated
PART IV
Item 15: Exhibits and Financial Statement Schedules
Financial Statements and Financial Statement Schedules
Our consolidated financial statements required in response to this Item are incorporated by reference from Item 8 of this Report.
Exhibits
Our exhibits listed on the Exhibit Index of this Form 10-K are filed with this Report or are incorporated herein by reference.
Item 16: 10-K Summary
Not applicable.
174 Huntington Bancshares Incorporated2023 Form 10-K 162
Exhibit Index
This report incorporates by reference the documents listed below that we have previously filed with the SEC. The SEC allows us to incorporate by reference information in this document. The information incorporated by reference is considered to be a part of this document, except for any information that is superseded by information that is included directly in this document.
The SEC maintains an Internet web site that contains reports, proxy statements, and other information about issuers, like us, who file electronically with the SEC. The address of the site is http://www.sec.gov. The reports and other information filed by us with the SEC are also available free of charge at our Internet web site. The address of the site is http://www.huntington.com. Except as specifically incorporated by reference into this Annual Report on Form 10-K, information on those web sites is not part of this report. You also should be able to inspect reports, proxy statements, and other information about us at the offices of the Nasdaq National Market at 33 Whitehall Street, New York, New York 10004.
| Exhibit Number | Exhibit Number | Document Description | Report or Registration Statement | SEC File or Registration Number | Exhibit Reference | Exhibit Number | Document Description | Report or Registration Statement | SEC File or Registration Number | Exhibit Reference |
| 2.1 | 2.1 | | | | | 2.1 | | | | |
| 3.1 | 3.1 | | | | | 3.1 | | | | |
| 3.2 | 3.2 | | | | | 3.2 | | | | |
| | 3.3 | 3.3 | | | | |
| 3.3 | |
| 3.3 | | | | | |
| 3.4 | 3.4 | | | | | 3.4 | | | | |
| 3.5 | 3.5 | | | | | 3.5 | | | | |
| 3.6 | 3.6 | | | | | 3.6 | | | | |
| 3.7 | | 3.7 | | | | |
| 3.8 | | 3.8 | | | | |
| 3.9 | | 3.9 | | | | |
| 4.1 | 4.1 | Instruments defining the Rights of Security Holders — reference is made to Articles Fifth, Eighth, and Tenth of Articles of Restatement of Charter, as amended and supplemented. Instruments defining the rights of holders of long-term debt will be furnished to the Securities and Exchange Commission upon request. | |
| 4.2 | 4.2 | | |
| |
| | |
|
|
| 10.1 | 10.1 | | | | | 10.1 | | | | |
| 10.2 | | | | |
| 10.3 | | | | |
| 10.4(P) | * Deferred Compensation Plan and Trust for Directors | Post-Effective Amendment No. 2 to Registration Statement on Form S-8 filed on January 28, 1991. | 33-10546 | 4(a) |
| | 10.2(P) | |
| | 10.2(P) | |
| | 10.2(P) | | * Deferred Compensation Plan and Trust for Directors | Post-Effective Amendment No. 2 to Registration Statement on Form S-8 filed on January 28, 1991. | 33-10546 | 4(a) |
| | 10.3 | |
| | 10.3 | |
| | 10.3 | | | | | |
| 10.4 | | 10.4 | | | | |
| 10.5 | | 10.5 | | | | |
| | 10.6 | |
| | 10.6 | |
| | 10.6 | | | | | |
| 10.7 | 10.7 | | | | | 10.7 | | | | |
| 10.8 | 10.8 | | | | | 10.8 | | | | |
| | 10.9 | |
| 10.9 | |
| 10.9 | 10.9 | | | | | | | | |
| 10.10 | 10.10 | | | | | 10.10 | | | | |
| 10.11 | | | | |
| 10.12 | | | | |
| 10.13 | | | | |
| 10.14 | | | | |
|
| | | | | | | | | | | | | | |
| 10.15 | | | | |
| 10.16 | | | | |
| 10.17 | | | | |
| 10.18 | | | | |
| 10.19 | | | | |
| 10.20 | | | | |
| 10.21 | | | | |
| 10.22 | | | | |
| 10.23 | | | | |
| 10.24 | | | | |
| 10.25 | | | | |
| 10.26 | | | | |
| 10.27 | | | | |
| 10.28 | | | | |
| 10.29 | | | | |
| 10.30 | | | | |
| 10.31 | | | | |
| 10.32 | | | | |
| 10.33 | | | | |
| 10.34 | | | | |
| 10.35 | | | | |
| 10.36 | | | | |
| 10.37 | | | | |
| 10.38 | | | | |
| 10.39 | | | | |
| 10.40 | | | | |
| 10.41 | | | | |
| 10.42 | | | | |
| 10.43 | | | | |
| | | | |
| 14.1(P) | Code of Business Conduct and Ethics dated January 14, 2003 and revised on January 24, 2018 and Financial Code of Ethics for Chief Executive Officer and Senior Financial Officers, adopted January 18, 2003 and revised on October 20, 2015, are available on our website at http://www.huntington.com/About-Us/corporate-governance | | | |
| | | | |
| | | | |
176163 Huntington Bancshares Incorporated
| | | | | | | | | | | | | | |
| | | | |
| | | | |
| | | | |
| | | | |
| | | | |
| | | | |
101 | | | | |
104 | Cover Page Interactive Data File - the cover page XBRL tags are embedded within the Inline XBRL document.
| | | |
| * Denotes management contract or compensatory plan or arrangement. | | | |
| | | | | | | | | | | | | | |
| 10.11 | | | | |
| 10.12 | | | | |
| 10.13 | | | | |
| 10.14 | | | | |
| | | | |
| 10.15 | | | | |
| 10.16 | | | | |
| 10.17 | | | | |
| 10.18 | | | | |
| | | | |
| 10.19 | | | | |
| | | | |
| 10.20 | | | | |
| 10.21 | | | | |
| 10.22 | | | | |
| 10.23 | | | | |
| 10.24 | | | | |
| 10.25 | | | | |
| 10.26 | | | | |
| 10.27 | | | | |
| 10.28 | | | | |
| 10.29 | | | | |
| 10.30 | | | | |
| | | | |
| 10.31 | | | | |
| 10.32 | | | | |
| 10.33 | | | | |
| 10.34 | | | | |
| 10.35 | | | | |
| 10.36 | | | | |
| 10.37 | | | | |
| 10.38 | | | | |
| 10.39 | | | | |
| 10.40 | | | | |
| | | | | | | | | | | | | | |
| 10.41 | | | | |
| 10.42 | | | | |
| 10.43 | | | | |
| 10.44 | | | | |
| 10.45 | | | | |
| 14.1(P) | Code of Business Conduct and Ethics dated January 14, 2003 and revised on January 31, 2023 and Financial Code of Ethics for Chief Executive Officer and Senior Financial Officers, adopted January 18, 2003, and revised on October 17, 2023, are available on our website at http://www.huntington.com/About-Us/corporate-governance | | | |
| | | | |
| | | | |
| | | | |
| | | | |
| | | | |
| | | | |
| | | | |
| | | | |
| | | | |
| 101 | | | | |
| 104 | Cover Page Interactive Data File - the cover page XBRL tags are embedded within the Inline XBRL document.
| | | |
| * Denotes management contract or compensatory plan or arrangement. | | | |
2020 Form 10-K 165177 Huntington Bancshares Incorporated
Signatures
Pursuant to the requirements of Section 13 or 15(d) of the Securities Exchange Act of 1934, the Registrant has duly caused this report to be signed on its behalf by the undersigned, thereunto duly authorized, on the 26th day16th Day of February, 2021.2024.
HUNTINGTON BANCSHARES INCORPORATED
(Registrant)
| | | | | | | | | | | | | | | | | | | | |
| | | | | | |
| By: | | /s/ Stephen D. Steinour | | By: | | /s/ Zachary Wasserman |
| | Stephen D. Steinour | | | | Zachary Wasserman |
| | Chairman, President, Chief Executive | | | | Chief Financial Officer |
| | Officer, and Director (Principal Executive Officer) | | | | (Principal Financial Officer) |
| | | | | | |
| | | | By: | | /s/ Nancy E. Maloney |
| | | | | | Nancy E. Maloney |
| | | | | | Executive Vice President, Controller |
| | | | | | (Principal Accounting Officer) |
Pursuant to the requirements of the Securities Exchange Act of 1934, this report has been signed below by the following persons on behalf of the Registrant and in the capacities indicated on the 26th day16th Day of February, 2021.2024.
| | | | | |
Lizabeth Ardisana * | |
Lizabeth Ardisana | |
Director | |
| |
| Alanna Y. Cotton * | |
| Alanna Y. Cotton | |
| Director | |
| |
| Ann B. Crane * | |
| Ann B. Crane | |
| Director | |
| |
Robert S. Cubbin * | |
Robert S. Cubbin | |
Director | |
| |
Steven G. Elliott * | |
Steven G. Elliott | |
Director | |
| |
| |
| |
| |
| |
| Gina D. France * | |
| Gina D. France | |
| Director | |
| |
| Rafael Andres Diaz-Granados * | |
| Rafael Andres Diaz-Granados | |
| Director | |
| |
| J. Michael Hochschwender * | |
| J. Michael Hochschwender | |
| Director | |
| |
| John C. Inglis * | |
| John C. Inglis | |
| Director | |
| |
| |
1782023 Form 10-K Huntington Bancshares Incorporated166
| | | | | |
J. Michael HochschwenderRichard H. King * | |
J. Michael HochschwenderRichard H. King | |
| Director | |
| |
John C. InglisKatherine M.A. Kline * | |
John C. InglisKatherine M.A. Kline | |
| Director | |
| |
| Katherine M. A. Kline * |
| Katherine M. A. Kline |
| Director |
| |
| Richard W. Neu * | |
| Richard W. Neu | |
| Director | |
| |
| Kenneth J. Phelan * | |
| Kenneth J. Phelan | |
| Director | |
| |
| David L. Porteous * | |
| David L. Porteous | |
| Director | |
| |
| Roger J. Sit * | |
| Roger J. Sit | |
| Director | |
| |
| Jeffrey L. Tate * | |
| Jeffrey L. Tate | |
| Director | |
| |
| Gary Torgow * | |
| Gary Torgow | |
| Director | |
| |
*/s/ Jana J. LitseyMarcy C. Hingst | |
Jana J. LitseyMarcy C. Hingst | |
| Attorney-in-fact for each of the persons indicated | |
2020 Form 10-K 167179 Huntington Bancshares Incorporated

