UNITED STATES
SECURITIES AND EXCHANGE COMMISSION
Washington, D.C. 20549
FORM 10-K
|
| | |
| (Mark One) | | |
x☒ | | ANNUAL REPORT PURSUANT TO SECTION 13 OR 15(d) OF THE SECURITIES EXCHANGE ACT OF 1934 |
For the fiscal year ended December 31, 20182019 |
| OR |
o☐ | | TRANSITION REPORT PURSUANT TO SECTION 13 OR 15(d) OF THE SECURITIES EXCHANGE ACT OF 1934 |
| For the transition period from to |
Commission File Number 001-15283
 Dine Brands Global, Inc.
(Exact name of registrant as specified in its charter)
|
| | | | |
Delaware | | | 95-3038279 |
(State or other jurisdiction of incorporation or organization) | | 95-3038279
| (I.R.S. Employer Identification No.) |
450 North Brand Boulevard, | | | |
Glendale, California | CA | | | 91203-1903 |
| (Address of principal executive offices) | | 91203-2306
| (Zip Code) |
Registrant's telephone number, including area code:(818) 240-6055 |
| |
| (818) | 240-6055 |
| (Registrant’s telephone number, including area code) |
Securities registered pursuant to Section 12(b) of the Act: |
| | | | |
| | Title of each class | | Trading Symbol(s) | Name of each exchange on which registered | |
| Common Stock, $.01 Par Value$0.01 par value | | DIN | New York Stock Exchange | |
Securities registered pursuant to Section 12(g) of the Act:None
Indicate by check mark if the registrant is a well-known seasoned issuer, as defined in Rule 405 of the Securities Act. Yesx No o
Indicate by check mark if the registrant is not required to file reports pursuant to Section 13 or Section 15(d) of the Act. Yes oNox
Indicate by check mark whether the registrant (1) has filed all reports required to be filed by Section 13 or 15(d) of the Securities Exchange Act of 1934 during the preceding 12 months (or for such shorter period that the registrant was required to file such reports), and (2) has been subject to such filing requirements for the past 90 days. Yesx No o
Indicate by check mark whether the registrant has submitted electronically every Interactive Data File required to be submitted pursuant to Rule 405 of Regulation S-T (§232.405 of this chapter) during the preceding 12 months (or for such shorter period that the registrant was required to submit such files). Yesx No o
Indicate by check mark if disclosure of delinquent filers pursuant to Item 405 of Regulation S-K (§232.405) is not contained herein, and will not be contained, to the best of registrant's knowledge, in definitive proxy or information statements incorporated by reference in Part III of this Form 10-K or any amendment to this Form 10-K. x
Indicate by check mark whether the registrant is a large accelerated filer, an accelerated filer, a non-accelerated filer, a smaller reporting company or an emerging growth company. See definitions of “large accelerated filer,” “accelerated filer,” “smaller reporting company,” and “emerging growth company” in Rule 12b-2 of the Exchange Act.
|
| | | | |
Large accelerated filerx | ☒ | | Accelerated filero | ☐ |
| Non-accelerated filer | ☐ | | | |
| | | |
Non-accelerated filer o
Smaller reporting company | ☐ |
| | | Smaller reporting company o
|
| | | Emerging growth companyo | ☐ |
If an emerging growth company, indicate by check mark if the registrant has elected not to use the extended transition period for complying with any new or revised financial accounting standards provided pursuant to Section 13(a) of the Exchange Act o
Indicate by check mark whether the registrant is a shell company (as defined in Rule 12b-2 of the Act). Yes o☐ No x
State theThe aggregate market value of the voting and non-voting common equity held by non-affiliates of the registrant as of June 30, 2018: $1.262019 was $1.56 billion.
IndicateAs of February 17, 2020, the numberRegistrant had 16,487,372 shares of shares outstanding of each of the registrant's classes of common stock, as of the latest practicable date. |
| | | | |
| Class | | February 15, 2019 | |
| Common Stock, $.01 par value | | 17,533,991 | |
Common Stock outstanding.DOCUMENTS INCORPORATED BY REFERENCE
Portions of the Proxy Statement for the Annual Meeting of Stockholders to be held on Tuesday, May 14, 2019 (the “2019 Proxy Statement”)12, 2020 are incorporated by reference into Part III.III of this Annual Report on Form 10-K where indicated. Except as expressly incorporated by reference, the registrant’s Proxy Statement shall not be deemed to be part of this report.
DINE BRANDS GLOBAL, INC. AND SUBSIDIARIES
Annual Report on Form 10-K
For the Fiscal Year Ended December 31, 20182019
Table of Contents
Cautionary Statement Regarding Forward-Looking Statements
Statements contained in this Annual Report on Form 10-K may constitute “forward-looking statements” within the meaning of Section 27A of the Securities Act of 1933, as amended, and Section 21E of the Securities Exchange Act of 1934, as amended. These statements involve known and unknown risks, uncertainties and other factors, which may cause actual results to be materially different from those expressed or implied in such statements. You can identify these forward-looking statements by words such as “may,” “will,” “would,” “should,” “could,” “expect,” “anticipate,” “believe,” “estimate,” “intend,” “plan,” “goal” and other similar expressions. You should consider our forward-looking statements in light of the risks discussed under the heading “Risk Factors,” as well as our consolidated financial statements, related notes, and the other financial information appearing elsewhere in this report and our other filings with the United States Securities and Exchange Commission. The forward-looking statements contained in this report are made as of the date hereof and the CompanyDine Brands Global, Inc. does not intend to, nor does it assume any obligation to, update or supplement any forward-looking statements after the date of this report to reflect actual results or future events or circumstances.
Factors that could cause actual results to differ materially from the projections, forecasts, estimates and expectations discussed in this Annual Report on Form 10-K include, among other things: general economic conditions; our level of indebtedness; compliance with the terms of our securitized debt; our ability to refinance our current indebtedness or obtain additional financing; our dependence on information technology; potential cyber incidents; risks associated with doing business in international markets; the results of litigation and other legal proceedings; third-party claims with respect to intellectual property assets; delivery initiatives and use of third-party delivery vendors; our allocation of human capital and our ability to
attract and retain management and other key employees; compliance with federal, state and local governmental regulations; risks associated with our self-insurance; natural disasters or other serious incidents; our success with development initiatives outside of our core business; the adequacy of our internal controls over financial reporting and future changes in accounting standards; the implementation of restaurant development plans; our dependence on our franchisees; the concentration of our Applebee’s franchised restaurants in a limited number of franchisees; the financial health of our franchisees, including any insolvency or bankruptcy; credit risks from our IHOP franchisees operating under our previous IHOP business model in which we built and equipped IHOP restaurants and then franchised them to franchisees; insufficient insurance coverage to cover potential risks associated with the ownership and operation of restaurants; our franchisees’ and other licensees’ compliance with our quality
standards and trademark usage; general risks associated with the restaurant industry; potential harm to our brands’ reputation; possible future impairment charges; the effectsrisks of tax reform; trading volatility and fluctuations in the price of our stock; our ability to achieve the financial guidance we provide to investors; successful implementation of our business strategy;food-borne illness or food tampering; the availability of suitable locations for new restaurants; shortages or interruptions in the supply or delivery of products from third parties or availability of utilities; the management and forecasting of appropriate inventory levels; development and implementation of innovative marketing and use of social media; changing health or dietary preference of consumers; risks associated with doing businesspossible future impairment charges; trading volatility and fluctuations in international markets; the resultsprice of litigation and other legal proceedings; third-party claims with respect to intellectual property assets;our stock; our ability to attract and retain managementachieve the financial guidance we provide to investors; successful implementation of our business strategy; and other key employees; compliance with federal, state and local governmental regulations; risks associated withmatters in the “Risk Factors” section of this Annual Report on Form 10-K, many of which are beyond our self-insurance; natural disasters or other serious incidents; our success with development initiatives outside of our core business; the adequacy of our internal controls over financial reporting and future changes in accounting standards.control.
Fiscal Year End
We have a 52/53 week fiscal year ending on the Sunday nearest to December 31 of each year. For convenience, in this annual report on Form 10-K, we refer to all fiscal years as ending on December 31 and all interim fiscal quarters as ending on March 31, June 30 and September 30 of the respective fiscal year. There were 52 calendar weeks in our 2019, 2018 2017 and 20162017 fiscal years that ended on December 29, 2019, December 30, 2018, and December 31, 2017, and January 1, 2017, respectively.
PART I
Item 1. Business
Dine Brands Global, Inc.SM, together with its subsidiaries (referred to as the “Company,” “Dine Brands Global,” “we,” “our” and “us”), owns, franchises and operates the Applebee's Neighborhood Grill + Bar® (“Applebee's”) concept in the bar and grill segment within the casual dining category of the restaurant industry and owns and franchises the International House of Pancakes® (“IHOP”) concept in the family dining category of the restaurant industry. References herein to Applebee's® and IHOP® restaurants are to these two restaurant concepts, whether operated by franchisees, area licensees and their sub-licensees or by us. As of December 31, 2018,2019, the substantial majority of our 3,6683,628 restaurants across both brands were franchised. We believe this highly franchised business model requires less capital investment and general and administrative overhead, generates higher gross profit margins and reduces the volatility of adjusted free cash flow performance, as compared to a business model based on owning a significant number of company-operated restaurants.
We generated revenue from five operating segments during the year ended December 31, 2018,2019, comprised as follows:
Our two franchise operations (each a separate operating segment) - primarily royalties, advertising fees and other income from 1,7681,718 Applebee’s franchised restaurants and 1,8311,841 IHOP franchised and area licensed restaurants;
Rental operations - primarily rental income derived from lease or sublease agreements covering 676657 IHOP franchised restaurants and onetwo Applebee’s franchised restaurant;restaurants;
Financing operations - primarily interest income from approximately $66$56 million of receivables for equipment leases and franchise fee notes generally associated with IHOP franchised restaurants developed before 2003;2003 and approximately $23 million of notes receivable from Applebee's franchisees; and
Company restaurant operations - retail sales from 69 Applebee's companycompany-operated restaurants we acquired from a former Applebee's franchisee in December 2018.
Most of our revenue is derived from domestic sources within these five operating segments, with approximately 82%72% of our total 20182019 revenues being generated from our two franchise operating segments. Internationally, our restaurants are in 17 countries outside the United States and three United States territories. Revenue derived from all international operations comprised less than 3%2% of total consolidated revenue for the year ended December 31, 2018.2019. At December 31, 2018,2019, there were no long-lived assets located outside of the United States. See Note 19 - Segment Reporting, of the Notes to the Consolidated Financial Statements included in this report for additional segment information.
This report should be read in conjunction with the cautionary statements under “Item 7. Management's Discussion and Analysis of Financial Condition and Results of Operations - Cautionary Statement Regarding Forward-Looking Statements.”
Our Goal
Our goal is to accelerate profitable growth and create significant value for shareholders and franchisees.
Our Strategic Priorities
To build value, we seek to maximize our business by focusing on the followingthese key strategic priorities:
•Evolve strong brands and drive same-restaurant sales, traffic and system sales growth;
•Facilitate franchisee restaurant development; and
•Maintain strong financial discipline.
Our fundamental approach to brand building centers on a strategic combination of initiatives to continually innovate and evolve our existing brands as well as explore small investments in or acquisitions of new concepts. We intend to leverage our significant scale and our franchise business model to drive robust margins and cash flows. We are actively supporting our brands with focused teams that are responsible and accountable at the brand level to drive strong performance. In partnership with our franchisees, significant investments have been made and will continue to be made in marketing across traditional and digital channels to drive traffic to our restaurants. We are placing greater emphasis on quantitative analytics to leverage our favorable guest dynamics. We are investing in technology to create more ways for customers to access our brands and in new growth platforms such as on-line ordering, off premise business and delivery. We will continue to focus on generating strong adjusted free cash flow and returning a substantial portion of it to stockholders through quarterly cash dividends and repurchases of our common stock. Our business strategy includes evaluating the addition of new brands to our restaurant portfolio through mergers and acquisitions.
Corporate Social Responsibility
In executing on these strategic priorities, we recognize our responsibility to drive long-term stockholder value through ethical business practices. Our corporate social responsibility efforts are organized into the following categories: caring for the environment, supporting our neighborhoods and valuing our team members. For additional information, please refer to the Impact and Sustainability section of our website at www.dinebrands.com
We will continue to focus on generating strong adjusted free cash flow and returning a substantial portion of it to stockholders.
Our History
The first IHOP restaurant opened in 1958 in Toluca Lake, California. Since that time, the Company and its predecessors have engaged in the development, franchising and operation of IHOP restaurants. Prior to 2003, new IHOP restaurants were generally developed by us, and we were involved in all aspects of the construction and financing of the restaurants. We typically identified and leased or purchased the restaurant sites for new company-developed IHOP restaurants, built and equipped the restaurants and then franchised them to franchisees. In addition, we typically financed as much as 80% of the franchise fee for periods ranging from five to eight years and leased the restaurant and equipment to the franchisee over a 25-year period. We refer to this as our “Previous IHOP Business Model,” which accounts for most of the activity in our rental and financing operations.
For most IHOP restaurants opened after 2003, the franchisee is primarily responsible for the development and financing of the restaurant. In general, we no longer provide any financing with respect to the franchise fee, restaurant site or equipment. The franchisee uses its own capital and financial resources along with third-party financial sources obtained by the franchisee to purchase or lease a restaurant site, build and equip the business and fund its working capital needs. We refer to this as our “Current IHOP Business Model.”
The first restaurant in what became the Applebee’s chain opened in 1980 in Decatur, Georgia. Applebee's International, Inc, (“AII”) became a public company in 1989, comprised of 100 restaurants. In November 2007, we completed the acquisition of AII, which comprised 1,455 franchised restaurants and 510 company-operated restaurants at the time of the acquisition. We subsequently refranchised all the Applebee's company-restaurants and were 100% franchised until we acquired 69 restaurants from a former Applebee's franchisee in December 2018.
Restaurant Concepts
Applebee's
We franchise and operate Applebee’s restaurants in the bar and grill segment within the casual dining category of the restaurant industry. As one of the world’s largest casual dining brands, Applebee’s Neighborhood Grill + Bar offers guests a dining experience that combines simple American fare with classic drinks and local drafts - all for a moderate price. Applebee's restaurants that are franchised are owned and operated by franchisees dedicated to the neighborhoods they serve.
We strive to provide genuine and neighborly service, appetizers, drinks and entrees and limited-time offers. Our menu features a selection of grill and bar fare, such as appetizers, bar snacks, burgers, classicpasta entrees and lighter fare, as well as cocktails, beers and desserts. We continue to enhance our very popular “Eatin’ Good in the Neighborhood” positioning, with creative, targeted, occasion-based and insight-driven marketing initiatives, such as “All-You-Can-Eat Riblets, TendersBoneless Wings and Shrimp” and our Neighborhood drink of the month promotions that we kicked off with the first “Dollarita” promotion in October 2017. We offer “Lighter Plates with Great Taste” which include meals like the Shrimp Wonton Stir Fry or Cedar Grilled Lemon Chicken. Applebee's offers online ordering, a mobile app and Carside To-Go options, with delivery available through leading national service providers, such as DoorDash, GrubhubUber Eats and Amazon Restaurants.GrubHub. Applebee's began offering catering, a third component of our off-premise options, as a national program in 2019. Usage of the catering option is expected to grow in 2020, the first full year of activation.
As of December 31, 2018, 562019, 52 franchise groups (33 domestic and 19 international) operated 1,7681,718 Applebee’s franchise restaurants. We operated 69 Applebee's restaurants acquired from a former franchisee in December 2018. Applebee's restaurants were in all 50 states within the United States, two United States territories and 1312 countries outside of the United States. The June 18, 201817, 2019 issue of Nation's Restaurant News reported Applebee's was the largestsecond-largest casual dining concept in terms of 20172018 United States system-wide sales.
IHOP
We franchise restaurants in the family dining category of the restaurant industry under the names IHOP and International House of Pancakes. IHOP restaurants feature full table service and high quality, moderately priced food and beverage offerings in an attractive and comfortable family atmosphere. Although the restaurants are best known for their award-winning pancakes and putting an unexpected twist on “all things breakfast, any time of the day,” IHOP is committed to accelerating growth through menu innovation, daypart expansion, off-premise initiatives and development. Focused on meeting the needs of today’s
guest, IHOP leverages industry analytics and brand-specific insights to help effectively drive positive behaviors, including increased frequency and check averages.
IHOP restaurants are open throughout the day and evening hours. Approximately half45% of IHOP restaurants operate 24 hours a day, seven days a week, with 225245 additional restaurants operating 24 hours a day for some portion of the week. We announced the most comprehensive remodel program in our brand’s 60-year history, “Rise ‘N’ Shine,” in late 2015. Since starting the program in 2016, our domestic franchisees have remodeled 890over 1,100 of their restaurants. Including new restaurants opened in the past threefour years, approximately two-thirdsmore than 75% of our domestic IHOP franchise restaurants reflect the new, contemporary look. We remain committed to giving more people, more reasons to enjoy more IHOP, more often. Placing an emphasis on building its IHOP ‘N’ Go business, IHOP introducedoffers an online ordering platform, a mobile app, and a national delivery program with leading service providers including DoorDash, Grubhub,Uber Eats and Amazon RestaurantsGrubHub this year.
As of December 31, 2018, 3192019, 313 franchise groups (290 domestic, 23 international) operated 1,8311,841 IHOP franchise and area license restaurants. These restaurants were in all 50 states within the United States, in the District of Columbia, in three United States territories and 1213 countries outside of the United States. We no longer operate any company-owned IHOP restaurants, but we may operate, on a temporary basis until refranchised, IHOP restaurants that we reacquire for a variety of reasons from IHOP franchisees. The June 18, 201817, 2019 issue of Nation's Restaurant News reported IHOP was the largest family dining concept in terms of 20172018 United States system-wide sales.
See Item 2 - Properties, for the geographic location of all Applebee’s and IHOP restaurants.
Franchising
Franchisee Relationships
We highly value good relationships with our IHOP and Applebee's franchisees and strive to maintain positive working relationships with them. For several years, IHOP and Applebee’s franchisees have participated in Company-sponsored advisory groups. These groups provide a forum for franchisees to share demonstrated best practices, offer counsel and review successful strategies, while working side-by-side with management of the Applebee's and IHOP brands. Applebee’s sponsors its Franchise Brand Council (“FBC”), which consists of eight franchisee representatives. One franchisee representative, the founder of Applebee's, is a member for life, while the other franchisee representatives are elected by our franchisees. IHOP sponsors its Franchise Leadership Council (“FLC”), an elected and appointed body of 12 IHOP franchisees. The Applebee's FBC and the IHOP FLC assist Applebee's and IHOP senior management in key areas of the business and strategy, including brand marketing, operations, restaurant development, information technology, menu, and innovation.
Franchise Agreements and Fees
Franchise arrangements for Applebee's restaurants typically consist of a development agreement and a separate franchise agreement for each restaurant. Development agreements grant to the franchisee the exclusive right to develop Applebee's restaurants within a designated geographical area over a specified period of time. The term of a domestic development agreement is generally 20 years. The development agreements typically provide for initial development periods of one to five years as agreed upon by us and the franchisee. At or shortly prior to the completion of the initial development schedule or any subsequent supplemental development schedule, we and the franchisee may execute supplemental development schedules providing for the development of additional Applebee's restaurants in the franchisee's exclusive territory.
Prior to the opening of each new Applebee's restaurant, we enter into a separate franchise agreement with the franchisee for that restaurant. Our current standard domestic Applebee's franchise agreement provides for an initial term of 20 years and provides an option for four successive renewal terms, in five-year increments, for up to an additional 20 years, upon payment of an additional franchise fee. Our current standard domestic Applebee's franchise arrangement calls for a development fee equal to $10,000 for each Applebee's restaurant that the franchisee contracts to develop and an initial franchisee fee of $35,000 for each restaurant developed (against which the $10,000 development fee will be credited) and a royalty fee equal to 4% of the restaurant's monthly gross sales. Our agreements for most Applebee's restaurants opened before January 1, 2000, provide for a royalty rate of 4%, while the terms, royalty rate and advertising fees under a limited number of franchise agreements and other franchise fees under older development agreements vary from the currently offered arrangements.
Under the Current IHOP Business Model, a potential franchisee that is approved first enters into a single-restaurant franchise agreement, a single-restaurant development agreement, or a multi-restaurant development agreement with us and is responsible for the development and financing of one or more new IHOP franchised restaurants. Our current standard domestic IHOP franchise agreement typically provides for an initial term of 20 years and permits one renewal for a term of 10 years, upon payment of a renewal fee of $10,000.
The revenues we receive from a typical domestic franchise development arrangement under the Current IHOP Business Model include (a) a location fee equal to $15,000 for an IHOP restaurant that the franchisee contracts to develop upon execution of a single-restaurant development agreement; (b) a development fee equal to $20,000 for each IHOP restaurant that the franchisee contracts to develop upon execution of a multi-restaurant development agreement; (c) an initial franchise fee equal to (i) $40,000 (against which the $20,000 development fee will be credited) for each restaurant developed under a multi-restaurant development agreement, (ii) $50,000 (against which the $15,000 location fee will be credited) for a restaurant developed under a single-restaurant development agreement or (iii) $50,000 for a restaurant opened pursuant to a single-restaurant franchise agreement, in each case paid upon execution of the franchise agreement; (d) franchise royalties equal to 4.5% of weekly gross sales; (e) revenue from the sale of our proprietary pancake and waffle dry-mixes; and (f) franchise advertising fees.
The principal commercial terms of the franchise arrangements under the Previous IHOP Business Model and the Current IHOP Business Model, including the franchise royalties and the franchise advertising fees, are substantially the same except
with respect to the terms relating to the franchise fee, lease or sublease rents for the restaurant property and building, and interest income from any franchise fee notes and equipment leases.
Development of Applebee’s and IHOP restaurants outside of the United States has historically been conducted through a separate development agreement and franchise agreement. More recently, certain franchisees have entered into a multi-unit franchise agreement that governs the rights and obligations to develop a territory, in addition to terms of operating each restaurant opened in the territory. The term of a franchisee’s exclusive right to develop a territory expires when the agreement’s development schedule is completed. The term to operate the restaurant is typically 20 years, subject to applicable renewals.
In limited instances, we have agreed to accept reduced royalties and/or lease payments from franchisees or have provided other accommodations to franchisees for specified periods of time to assist them in either establishing or reinvigorating their businesses. We have the contractual right, subject to applicable law, to terminate a development and franchise agreement for a variety of reasons, such as a franchisee’s failure to make required payments when due, failure to timely develop restaurants and failure to adhere to specified brand policies and standards.
Advertising Fees
We currentlyThe Applebee's franchise agreements generally require domestic franchisees of Applebee's restaurants to (i) contribute 3.25% of their gross sales to a national advertising fund, which funds the development of national promotions, television and radio commercials and print advertising materials. Applebee's franchisees are also required tomaterials and (ii) spend at least 0.5% of their gross sales on local marketing and promotional activities. Under the current Applebee's franchise agreements, we have the ability to increase the amount of the required combined contribution to the national advertising fund and the amount required to be spent on local marketing and promotional activities to a maximum of 5% of gross sales. All domestic Applebee’s franchisees have either entered into an amendment to their franchise agreements to increase their contribution to the Applebee's national advertising fund (the “Applebee’s NAF”), or entered into new franchise agreements in connection with virtuallyrenewals setting forth the current advertising contribution requirements. Virtually all agreeingfranchisees who entered into amendments agreed to a 0.25% increase to 3.50% of their gross sales and a decrease to their minimum local promotional expenditures to 0.25% of their gross sales for the period from January 1, 2018 to December 31, 2019. Such franchisees who entered into amendments also agreed to an incremental temporary increase of 0.75% in the advertising contribution rate to 4.25% effective July 1, 2018 and have agreed to extend such temporary increase through January 1, 2021. The franchisees who entered into new franchise agreements in connection with renewals agreed to contribute between 4% and 4.25% of their gross sales to the Applebee’s NAF through December 31, 2019.2019 and have agreed to extend such contribution through January 1, 2021.
IHOP franchisees allocate a percentage of their sales to local advertising cooperatives and a national advertising fund (the “IHOP NAF”). The IHOP franchise agreements generally provide for advertising fees comprised of (i) a local advertising fee generally equal to 2.0% of weekly gross sales under the franchise agreement, which is typically used to cover the cost of local media purchases and other local advertising expenses incurred by a local advertising cooperative, and (ii) a national advertising fee equal to 1.0% of weekly gross sales under the franchise agreement. Area licensees are generally required to pay lesser amounts toward advertising.
The local IHOP advertising cooperatives have historically used advertising fees for various local marketing programs. The IHOP NAF is primarily used for buying media and national advertising, in addition to the related production costs. The IHOP NAF is also used to defray certain expenses associated with our marketing and advertising functions.
Beginning in 2005, and every year thereafter, we and the IHOP franchisees agreed to reallocate portions of the local advertising fees to purchase national broadcast, syndication and cable television time to reach our target audience more frequently and more cost effectively.
In 2014, we and franchisees whose restaurants account for a large majority of total annual contributions to the IHOP NAF entered into franchise agreement amendments that increased the advertising contribution percentage of those restaurants' gross sales. Pursuant to the amendment, for the period from June 30, 2014 to December 31, 2014, 2.74% of each participating restaurant's gross sales was contributed to the IHOP NAF and 0.76% was contributed to local advertising cooperatives. For the period from January 1, 2015 to December 31, 2017, 3.50% of each participating restaurant's gross sales was contributed to the IHOP NAF with no significant contribution to local advertising cooperatives required. The amended advertising contribution percentage also was also applicable to all new franchise agreements and to IHOP company-operated restaurants open at the time. In 2016, we and franchisees whose restaurants account for a large majority of total annual contributions to the IHOP NAF extended this additional contribution through 2022. The current IHOP franchise agreements generally provide for advertising fees comprised of (i) a local advertising fee equal to 0% of gross sales under the franchise agreement, and (ii) a national advertising fee equal to 3.5% of weekly gross sales under the franchise agreement. Commencing on January 1, 2023, the local advertising fee and the national advertising fee are subject to change.
IHOP Area License Agreements
We have entered into three long-term area license agreements for IHOP restaurants covering the state of Florida and certain counties in the state of Georgia, the province of British Columbia, Canada and the country of Pakistan. The area license agreements provide the licensees with the right to develop and franchise new IHOP restaurants in their respective territories and provide for royalties ranging from 1.0% to 4.5% of gross sales and advertising fees ranging from 0.25% to approximately 2.0% of gross sales. During 2014, the advertising fee contribution provisions of the Florida area license agreement were amended for the period through December 31, 2017 on substantially similar terms as the franchise agreement amendment described above and such amendments were subsequently extended through 2022. We also derive revenues from the sale of proprietary products to these area licensees and, in certain instances, to their sub-franchisees. Revenues from our area licensees are included in franchise operations revenues.
As of December 31, 2018,2019, the area licensee for the state of Florida and certain counties in Georgia operated or sub-franchised a total of 150149 IHOP restaurants. The area licensee for the province of British Columbia, Canada operated or sub-franchised a total of 12 IHOP restaurants. The area licensee for the country of Pakistan is required to open its first IHOP restaurant in 2019.2020. The area license for British Columbia expires in 2026. The area license for Florida and Georgia expires in 2120.2123. The area license for Pakistan expires in 2027.
Other Franchise-related Revenues and Fees
Approximately 90% of franchise segment revenue for the year ended December 31, 20182019 consisted of Applebee's and IHOP royalties and advertising revenue. Most of the remaining 10% consisted of sales of proprietary products (primarily IHOP pancake and waffle dry-mix)dry mix), initial franchise and renewal fees and software maintenance and support fees. Depending on circumstances, we may seek to recover a portion of any royalties and fees lost due to early termination of a franchise agreement; however, not all franchise restaurant closures necessarily result in our receipt of such fees.
International Franchising
We continue to pursue international franchising of the Applebee's and the IHOP concepts. To this end, we seek qualified franchisees that possess the financial, development and operational resources needed to open multiple restaurants in each territory and are experienced in conducting business in the development territory. We work closely with our international franchisees to develop and implement the Applebee's and IHOP systems outside the United States, recognizing commercial, cultural and dietary diversity. Differences in tastes and cultural norms and standards require that we be flexible and pragmatic regarding many elements of the Applebee's and IHOP systems, including menu, restaurant design, restaurant operations, training, marketing, purchasing and financing.
The success of further international expansion will depend on, among other things, local acceptance of the Applebee's and IHOP concepts and menu offerings and our ability to attract qualified franchisees and operating personnel. Our franchisees must comply with the regulatory requirements of the local jurisdictions.
Domestic and International Franchise Restaurant Development
Each franchisee is responsible for selecting the site for each new restaurant. We may consult with franchisees when they are selecting appropriate sites, and selections made by franchisees are subject to our approval. We also conduct a physical inspection, review any proposed lease or purchase agreement for compliance with our requirements and may make available to franchisees demographic and other studies for domestic restaurants. We make the design specifications for a typical restaurant available to franchisees, and we retain the right to prohibit or modify the use of any set of plans.
As of December 31, 2018,2019, we had signed commitments from IHOP franchisees to build 290354 IHOP restaurants over the next 1512 years, comprised of five96 restaurants under single restaurant or non-traditional development agreements, 153126 restaurants under domestic multi-restaurant development agreements and 132 restaurants under international development agreements. We announced agreements in 2018 that will bring the first IHOP restaurants to South America, with agreements signed for the development of 25 IHOP restaurants in Peru and 12 restaurants in Ecuador. The
signed agreements include options to build an additional 3528 restaurants over the next 12 years, primarily under domestic multi-restaurant development agreements. As of December 31, 2018, Applebee’s development agreements in place call2019, we had signed commitments from Applebee's franchisees for the opening of 3424 international restaurants over the next 10eight years. While Applebee's also has domestic development agreements in place, we do not expect a significant number of Applebee's restaurants will be opened domestically in the near future. Developers’ level of compliance with development obligations varyvaries per year and could change and,change; therefore, the number of signed commitment and/or development agreements in place at any given time may not be a reliable indicator of future development activity for any given period of time.
activity.
Franchise Operations
We continuously monitor franchise restaurant operations. Company and third-party representatives make both scheduled and unannounced inspections of franchised restaurants to ensure that only approved products are in use and that our prescribed operations practices and procedures are being followed. We have the right to terminate a franchise agreement if a franchisee does not operate and maintain a restaurant in accordance with our requirements. Due to cultural and regulatory differences, we may have different requirements for restaurants opened outside of the United States. We also monitor the financial health of our franchisees through business and financial reviews.
Composition of Franchise Systems
As of December 31, 2018, 342019, 33 Applebee’s franchisees owned a total of 1,6241,596 domestic Applebee's restaurants. The number of domestic restaurants held by a single franchisee ranged from one restaurant to 459451 restaurants. As of December 31, 2018, 222019, 19 franchisees owned a total of 144122 international Applebee's restaurants. The number of international restaurants held by a single franchisee ranged from one restaurant to 2221 restaurants. Our five largest Applebee’s franchisees owned 50%51% of the total 1,7681,718 Applebee's franchise restaurants.
As of December 31, 2018, 2972019, 290 franchisees owned a total of 1,7051,710 domestic IHOP restaurants, including 125121 franchisees that each owned one restaurant. The largest single IHOP franchisee owned 299304 domestic restaurants. As of December 31, 2018, 222019, 23 franchisees owned a total of 126131 international IHOP franchise restaurants. The number of international restaurants held by a single franchisee ranged from one restaurant to 3435 restaurants. Our five largest IHOP franchisees owned 31% of the total 1,8311,841 IHOP restaurants.
Company-Operated Restaurants
At the beginning of fiscal 2018, we did not operate any restaurants of either brand on a permanent basis. In December 2018, we acquired 69 Applebee's restaurants in North Carolina and South Carolina from a former Applebee's franchisee. While we currently intend to own and operate these restaurants for the near term, we will assess and monitor opportunities to refranchise these restaurants under favorable circumstances. We believe this transaction was a unique circumstance and should not be considered a change in our business strategy.
Our business strategy includes the possible addition of new brands to our restaurant portfolio, through mergers and acquisitions, which may result in our acquiring additional company-operated restaurants.
From time to time, we also may reacquire a very small number of restaurants from franchisees for a variety of reasons. Historically, we have been able to quickly refranchise these restaurants to new franchisees. When reacquired restaurants are not quickly refranchised, we typically operate the reacquired restaurants until they can be refranchised. These temporarily reacquired restaurants may require investments in remodeling and rehabilitation before they can be refranchised. As a result, a reacquired restaurant may incur operating losses for some period of time.
Supply Chain
In February 2009, Centralized Supply Chain Services, LLC (“CSCS” or the “Co-op”), an independent cooperative entity, was formed by us and franchisees of Applebee's and IHOP domestic restaurants. CSCS has been appointed as the sole authorized purchasing organization and purchasing agent for goods, equipment and distribution services for Applebee's and IHOP restaurants in the United States. As of December 31, 2018,2019, 100% of Applebee's domestic franchise restaurants and slightly less than 100% of IHOP domestic franchise restaurants were members of CSCS.
CSCS combines the purchasing volume for goods, equipment and distribution services within and across the Applebee's and IHOP concepts. Its mission is to achieve for its members the benefit of continuously available goods, higher quality equipment and distribution services in adequate quantities at the lowest possible sustainable prices. We do not control CSCS, but do have contractual rights associated with supplier certification, quality assurance and protection of our intellectual property. The operations of CSCS are funded by a separately stated administrative fee added to one or more products purchased by operators.
We believe the larger scale provided by combining the supply chain requirements of both brands provides continuing cost savings and efficiencies while helping to ensure compliance with our quality and safety standards.
Industry Overview and Competition
Applebee's and IHOP are among the numerous restaurant chains and independent restaurants competing in the restaurant industry in the United States. The restaurant industry is generally categorized into segments by price point ranges, the types of food and beverages offered and the types of service available to customers. These segments include, among others, fast food or
quick service restaurants (“QSR”), fast-casual dining, family dining, casual dining and fine dining. Casual dining restaurants offer full table service and typically have bars or serve liquor, wine and beer, while family dining restaurants offer full table service, typically do not have bars or serve liquor, and usually offer breakfast in addition to lunch and dinner items.
Applebee's competes in the casual dining segment against national and multi-state restaurant chains such as Olive Garden, Buffalo Wild Wings, Chili's Grill & Bar, Texas Roadhouse and Outback Steakhouse, and Texas Roadhouse, among others, as well as fast-casual restaurant chains. In addition, there are many independent restaurants across the country in the casual dining segment. The June 18, 201817, 2019 issue of Nation's Restaurant News reported that Applebee's was the largestsecond-largest casual dining concept in terms of 20172018 United States system-wide sales.
IHOP competes in the family dining segment against national and multi-state restaurant chains such as Cracker Barrel Old Country Store, Denny's, Golden Corral, Waffle House and Bob Evans Restaurants. IHOP also faces competition from QSR restaurant chains and fast-casual restaurant chains that serve breakfast. In addition, there are many independent restaurants and diners across the country in the family dining segment. The June 18, 201817, 2019 issue of Nation's Restaurant News reported that IHOP was the largest family dining concept in terms of 20172018 United States system-wide sales.
The restaurant and related food-service industries are highly competitive and are affected by, among other things, economic conditions, price levels, on-going changes in eating habits and food preferences, population trends and traffic patterns. The principal bases of competition in the industry are the type, quality and price of the food products served. Restaurant location, quality and speed of service, advertising, name identification and attractiveness of facilities are important. Additionally, changes in the price of groceries may influence the attractiveness of dining at home versus dining out.
The market for high quality commercial real estate is also very competitive. We and our franchisees compete with other restaurant chains and retail businesses for suitable sites for the development of new restaurants. We also compete against other franchisors both within and outside the restaurant industry for new franchisees. For further information regarding competition, see Item 1A, Risk Factors.
Trademarks and Service Marks
We and our affiliates have registered or submitted registrations for certain trademarks and service marks with the United States Patent and Trademark Office and various international jurisdictions, including “Dine Brands GlobalSM.” We own trademarks and service marks used in the Applebee's system, including various logos and the trademarks “Applebee's®,” “Applebee's Neighborhood Grill + Bar®” and variations of each. In addition, we own trademarks and service marks used in the IHOP system, including various logos and the trademarks “IHOP®,” “International House of Pancakes®” and variations of each.
We consider our trademarks and service marks important to the identification of our company and our restaurants and believe they are of material importance to the conduct of our business. Depending upon the jurisdiction, trademarks and service marks generally are valid as long as they are used and/or registered. We generally intend to renew our trademarks and service marks as they come up for renewal. We own or have rights to all trademarks we believe are material to our restaurant operations. In addition, we have registered various domain names on the Internet that incorporate certain of our trademarks and service marks and believe these domain name registrations are an integral part of our identity. From time to time, we may take appropriate legal action to defend and protect the use of our intellectual property.
Information Technology
We use in-house developed and third-party point of sale systems, kitchen data systems, and back-of-the house systems for accounting, labor and inventory management in our franchisees' restaurants. In addition, we have several consumer-facing technology initiatives focused on improving our customers' experience. Sales and product mix information is transmitted to our restaurant support centers daily and this information supports our operations and marketing initiatives. We mitigate the potential impact from operational interruption of our information technology systems through a disaster recovery plan that is updated on a regular basis. We believe that technology is and will continue to be a key component of our long-term plans and are committed to providing system stability and targeted innovation. Our use of technology, particularly in terms of managing electronic payments and confidential information, also represents security and operational risks that we must manage and may result in additional costs incurred.
Protection of financial and personal information is a high priority for us, led by our Cybersecurity Department with a committee representing key functional areas. We continuously focus on enhancing our cybersecurity capabilities, educating our team members on cybersecurity importance, and managing our cyber risks. In addition, we participate in annual audits of our financial and human resources systems to verify that measures are in place to protect our employees' personally identifiable information. We accept credit cards, third party gift cards, and branded gift cards as payment in our restaurants. We submit our systems to regular audit and review, as required by the Payment Card Industry Data Security Standard (“PCI DSS”), including periodic scanning of our networks to check for vulnerability. To further secure customers' payment data, we worked
with our franchisees to deploy and implement encryption and tokenization technologies, ensuring credit card data is not stored in our franchisees' and our restaurants systems. This includes installation of equipment to improve authentication and to prevent fraud using EMV (Europay, Mastercard, Visa) technology. We and our franchisees are required to comply, and are responsible for maintaining compliance, with PCI DSS, and we regularly communicate and encourage our franchisees to maintain compliance and to manage risk. For further information regarding Information Technology, see Item 1A, Risk Factors.
Seasonality
We do not consider our operations to be seasonal to any material degree. We do experience a slight increase in system-wide sales in the first quarter due to redemptions of gift cards sold during the December holiday season. OverIn terms of average sales over the past five years, 26% of our annual system-wide sales (retail sales reported to us by our franchisees plus sales at our company-operated restaurants) occurred in the first quarter of the fiscal year.year, 24% in the third quarter and 25% in both the second and fourth quarters. Sales at restaurants owned by franchisees are not attributable to the Company.
Government Regulation
We are subject to regulation by the Federal Trade Commission (“FTC”) and a number of foreign and state laws that regulate the offer and sale of franchises. We also are subject to a number of foreign and state laws that regulate substantive aspects of the franchisor-franchisee relationship. The FTC's Trade Regulation Rule on Franchising, as amended (the “FTC Rule”), requires us to furnish to prospective domestic franchisees a Franchise Disclosure Document containing information prescribed by the FTC Rule.
State laws that regulate the offer and sale of franchises and the franchisor-franchisee relationship presently exist in a number of states and some of these laws require registration of the franchise offering with state authorities. Those states that regulate the franchise relationship generally require that the franchisor deal with its franchisees in good faith, prohibit interference with the right of free association among franchisees, limit the imposition of unreasonable standards of performance on a franchisee and regulate discrimination against franchisees with respect to charges, royalty fees or other fees. Although such laws may restrict a franchisor in the termination and/or non-renewal of a franchise agreement by, for example, requiring "good cause"“good cause” to exist as a basis for the termination and/or non-renewal, advance notice to the franchisee of the termination or non-renewal, an opportunity to cure a default and a repurchase of inventory or other compensation upon termination, these provisions have not historically had a significant effect on our franchise operations.
Each restaurant is subject to licensing and regulation by a number of governmental authorities, which may include liquor license authorities (primarily in the case of Applebee's restaurants), health, sanitation, safety, fire, building and other agencies in the state or municipality in which the restaurant is located. We are also subject to new laws and regulations, which may vary from jurisdiction to jurisdiction, relating to nutritional content and menu labeling.
More stringent and varied requirements of local governmental bodies with respect to zoning, land use and environmental factors could delay or prevent the development of new restaurants in particular areas.
Various federal and state labor laws govern our relationship with employees and our franchisees' relationship with their own employees. These include such matters as minimum wage requirements, overtime and other working requirements and conditions. Significant additional government-imposed increases in minimum wages, paid leaves of absence, mandated health benefits or increased tax reporting and tax payment requirements with respect to employees who receive gratuities could be detrimental to the economic viability of companycompany-operated restaurants and our franchisees' restaurants.
We are subject to a number of privacy and data protection laws and regulations globally.globally, including the California Consumer Privacy Act, which took effect on January 1, 2020. The legislative and regulatory landscape for privacy and data protection continues to evolve, and there has been increased attention in privacy and data protection issues. This has the potential to affect directly our business, including recently enacted laws and regulations in the United States and internationally requiring notification to individuals and government authorities of security breaches involving certain categories of personal information.
The Patient Protection and Affordable Care Act and the Health Care and Education Affordability Reconciliation Act of 2010 (the “ACA”) are far-reaching and are intended to expand access to health insurance coverage over time by adjusting the
eligibility thresholds for most state Medicaid programs and providing certain other individuals and small businesses with tax credits to subsidize a portion of the cost of health insurance coverage. The laws include a requirement that most individuals obtain health insurance coverage and a requirement that certain large employers offer coverage to their employees or pay a financial penalty. In October 2017, the President of the United States of America issued an executive order titled “Promoting Healthcare Choice and Competition Across the United States.” We do not know how our franchisees will be affected (if at all) by this executive order. In addition, with enactment of the Tax Cuts and Jobs Act of 2017, in December 2017, Congress eliminated certain tax penalties in the ACA, effectively repealing the “individual mandate” portion of the ACA. The Patient Protectionrepeal of this provision, which required most Americans to carry a minimal level of health insurance, became effective in January 2019, although several states have implemented similar individual mandates. The ACA and Affordable Care Act hassimilar state laws have increased our franchisees' employee costs in some respects and may continue to do so.
In recent years, there has been an increased legislative, regulatory and consumer focus at the federal, state and municipal levels on the food industry including nutrition and advertising practices. Restaurants operating in the quick-service and fast-casual segments have been a particular focus. In addition to the United States Food and Drug Administration’s menu labeling requirements for restaurants requiring that chain restaurants include calorie information on their menus or make other nutritional information available, a number of other jurisdictions around the United States have adopted regulations related to disclosure of other information, such as sodium content, and imposing requirements for children's menus. Initiatives in the area of nutrition disclosure or advertising, such as requirements to provide information about the nutritional content of our food, may result in increased costs of compliance with the requirements and may also change customer buying habits in a way that adversely impacts our sales. For further information regarding governmental regulation, see Item 1A, Risk Factors.
Environmental Matters
We are subject to federal and state environmental regulations, but historically these have not had a material effect on our operations. We are not aware of any federal, state or local environmental laws or regulations that are likely to materially impact our revenues, cash flow or competitive position, or result in any material capital expenditure. However, we cannot predict the effect of possible future environmental legislation or regulations.
Employees
At December 31, 2018,2019, we had approximately 3,3003,560 employees, of which approximately 560558 were full-time, non-restaurant corporate employees. Additionally, at December 31, 2019, we were utilizing approximately 200 independent contractors, primarily in information technology-related functions. Our employees are not presently represented by any collective bargaining agreements and we have never experienced a work stoppage. We believe our relations with employees are good. Our franchisees are independent business owners and their employees are not our employees. Therefore, their employees are not included in our employee count.
Corporate Information
We were incorporated under the laws of the State of Delaware in 1976 with the name IHOP Corp. In November 2007, we completed the acquisition of Applebee’s, which became a wholly-owned subsidiary of the Company. Effective June 2, 2008, we changed our name to DineEquity, Inc. and on February 20, 2018, we changed our name to Dine Brands Global, Inc. Our principal executive offices are located at 450 North Brand Boulevard, Glendale, California 91203-2306 and our telephone number is (818) 240-6055. Our Internet address is www.dinebrands.com. Our common stock is listed on the New York Stock Exchange (“NYSE”) and trades under the ticker symbol “DIN.”
Available Information
Our annual reports on Form 10-K, quarterly reports on Form 10-Q, current reports on Form 8-K, proxy statements and amendments to those reports filed with or furnished to the United States Securities and Exchange Commission (the “SEC”) pursuant to Section 13(a) or 15(d) of the Securities Exchange Act of 1934, as amended, are available free of charge through our website as soon as reasonably practicable after electronically filing such material with the SEC. The SEC maintains an Internet site that contains periodic reports, proxy and information statements and other information regarding our filings at www.sec.gov. The above references to our website and the SEC’s website do not constitute incorporation by reference of the information contained on those websites and should not be considered part of this document.
Item 1A. Risk Factors.
This Item 1A includes forward-looking statements. You should refer to our discussion of the qualifications and limitations on forward-looking statements included in Item 7.
The occurrence of any of the events discussed in the following risk factors may materially adversely affect our business, financial condition and results of operations, which may materially adversely affect the value of our common stock. It is not possible to identify or predict all risk factors. There may be risks and uncertainties that are not currently known or that are currently deemed by us to be immaterial. These other risks and uncertainties may also impact our business, financial condition and results of operations.
Risks Relating to Our Business and Financial Condition
Our business is affected by general economic conditions that are largely out of our control. Our business is dependent to a significant extent on national, regional and local economic conditions, and, to a lesser extent, on global economic conditions, particularly those conditions affecting the demographics of the guests that frequently patronize Applebee's or IHOP restaurants. If our customers' disposable income available for discretionary spending is reduced (because of circumstances such as job losses, credit constraints, higher housing costs, changes to tax regulations, energy costs, interest rates or other costs) or if the perceived wealth of customers decreases (because of circumstances such as lower residential real estate values, increased foreclosure rates, changes to tax regulations or other economic disruptions), our business could experience a decline in sales and/or customer traffic as potential customers choose lower-cost alternatives (such as quick-service restaurants) or other alternatives to dining out. Additionally, negative trends in the availability of credit and in expenses such as interest rates and the cost of construction materials could affect our and our franchisees' ability to maintain and remodel existing restaurants. Any decreases in customer traffic or average customer check due to these or other reasons could reduce gross sales at our and our franchised restaurants, resulting in lower revenues, royalty payments and other payments from franchisees. This could negatively impact the financial performance of our company-operated restaurants and reduce the profitability of franchised restaurants, potentially impacting the ability of franchisees to make royalty payments owed to us when due and negatively impacting franchisees’ ability to develop new restaurants as may be required in their respective development agreements.
Our level of indebtedness could adversely affect our financial health and prevent us from fulfilling our obligations under our debt. As of December 31, 2018,2019, certain of our indirect, wholly-owned subsidiaries had approximately $1.3 billion of long-term debt. In addition, we had approximately $0.1$0.5 billion in financingoperating lease, finance lease and capital leaseother financing obligations as of December 31, 2018.2019. Our level of indebtedness and the financial and other restrictive covenants in our indebtedness could have important consequences to our financial health. For example, it could:
make it more difficult for us to satisfy our obligations with respect to our debt or refinance any of our debt on attractive terms, commercially reasonable terms, or at all;
increase our vulnerability to general adverse economic and industry conditions or a downturn in our business;
require us to dedicate a substantial portion of our cash flow from operations to debt service, thereby reducing the availability of our cash flow to pay dividends to our stockholders, repurchase shares of our common stock, fund working capital, capital expenditures and other general corporate purposes;
limit our flexibility in planning for, or reacting to, changes in our business and the industry in which we operate;
place us at a competitive disadvantage compared to our competitors that are not as highly leveraged;
limit our ability to borrow additional funds;
prevent us from taking actions that we believe would be in the best interest of our business and make it difficult for us to successfully execute our business strategy;
subject us to risks associated with rising interest rates and uncertainty related to the proposed phase-out of the London Interbank Offered Rate (LIBOR); and
result in an event of default if we fail to satisfy our obligations under our debt or fail to comply with the financial and other restrictive covenants contained in our debt documents, which event of default could result in all of our debt becoming immediately due and payable and could permit certain of our lenders to foreclose on our assets securing such debt.
In addition, we may incur substantial additional indebtedness in the future. If new debt is added to our current debt levels, the related risks that we now face could increase.
The terms of the securitized debt issued by certain of our indirect, wholly-owned subsidiaries have restrictive terms and the failure to comply with such restrictive terms could put us in default, which would have an adverse effect on our business and prospects. Unless and until we repay all outstanding borrowings under our securitized debt, we will remain subject to the restrictive terms of the securitized debt issued by certain of our indirect, wholly-owned subsidiaries. For example, the indenture entered into by such subsidiaries in connection with the securitized debt contains covenants that limit the ability of certain of our wholly-owned subsidiaries to, among other things: sell assets; alter the business conducted by such subsidiaries; engage in mergers or acquisitions; declare dividends or redeem or purchase certain equity interests; incur, assume or permit to exist additional indebtedness or guarantees; make loans and investments; incur liens; and enter into transactions with affiliates other than on an arms-length basis. These covenants are applicable only to the securitization subsidiaries and do not apply to any of Dine Brands Global, Inc., International House of Pancakes, LLC, Applebee’s International, Inc. or Dine Brands International, Inc. as these entities are not a partyparties to the indenture. A breach of a covenant could result in a rapid amortization event or default under the securitized debt.
Further, the securitized debt also includes limitations on our ability to incur additional indebtedness and contains a number of financial performance measures that must be met to avoid a possible rapid amortization event or event of default. The most significant of these measures include a minimum debt service coverage ratio and minimum domestic franchise system sales. The ability to meet these financial performance measures can be affected by events beyond our control and there can be no assurance that we will satisfy these financial measures.
If amounts owed under the securitized debt are accelerated because of a default and we are unable to pay such amounts, the investors may have the right to assume control of substantially all of the securitized assets, which consist of substantially all of our domestic revenue-generating assets and domestic intellectual property.
During the five-year term following issuance, the outstanding fixed-rate class A-2-I senior notes will accrue interest at a rate of 4.194% per year. During the seven-year term following issuance, the outstanding fixed-rate class A-2-II senior notes will accrue interest at a rate of 4.277%4.723% per year. Additionally, the fixed-rate class A-2-I and class A-2-II senior notes have scheduled quarterly principal amortization payments of $3.25 million.$1.75 million and $1.5 million, respectively. If we maintain a leverage ratio of less than or equal to 5.25x total debt to adjusted EBITDA, we may elect to not make the scheduled principal payments. From time to time, our leverage ratio has exceeded the 5.25x total debt to adjusted EBITDA ratio and we have made the required scheduled principal payments. If we are unable to refinance or repay amounts under the securitized debt prior to the expiration of the applicable five- or seven-year term, our cash flow would be directed to the repayment of the securitized debt and, other than a weekly management fee sufficient to cover minimal selling, general and administrative expenses, would not be available for operating our business.
In the event that a rapid amortization event occurs under the indenture (including, without limitation, upon an event of default under the indenture or the failure to repay the securitized debt at the end of the applicable five- or seven-year term), the funds available to us would be reduced or eliminated, which would in turn reduce our ability to operate or grow our business.
Our ability to refinance all or a portion of our indebtedness or obtain additional financing depends on many factors beyond our control. No assurance can be given that any refinancing or additional financing will be possible when needed or that we will be able to negotiate favorable terms. In addition, our access to capital is affected by prevailing conditions in the financial and capital markets and other factors beyond our control. There can be no assurance that market conditions will be favorable at the times that we require new or additional financing. Further, changes by any rating agency to our credit rating may negatively impact the value and liquidity of both our debt and equity securities, as well as the potential costs associated with refinancing our debt. Downgrades in our credit ratings could also affect the terms of any such financing and restrict our ability to obtain additional financing in the future.
We are heavily dependent on information technology and any material failure of that technology could impair our ability to effectively and efficiently operate our business. We rely heavily on information technology systems across our operations, including point-of-sale processing in our and our franchisees' restaurants, online ordering and delivery, management of our supply chain, collection of cash and other receivables, payment of obligations and various other processes and procedures. Our ability to effectively and efficiently manage our business depends significantly on the reliability and capacity of these systems. The failure of these systems to operate effectively, problems with maintenance, upgrades or the transition to replacement systems, inaccurate or fraudulent manipulation of sales reporting from our restaurants resulting in loss of sales and royalty payments, or a breach in security of these systems could be harmful and cause delays in customer service, reduce efficiency in our operations and negatively impact our business. Significant capital investment might be required to remediate any problems.
In addition, we outsource certain essential technology-based business processes to third-party vendors and we may share sensitive financial and other information with third party vendors which subjects us to risks, including disruptions in business, increased costs and exposure to data breaches or privacy law compliance issues of our third-party vendors.
The occurrence of cyber incidents, or a deficiency in our cybersecurity, could negatively impact our business by causing a disruption to our operations, a compromise or corruption of our confidential information, and/or damage to our employee and business relationships, all of which could subject us to loss and harm our brands. A cyber incident is considered to be any adverse event that threatens the confidentiality, integrity, or availability of our information resources. More specifically, a cyber incident is an intentional attack or an unintentional event that can include gaining unauthorized access to systems to disrupt operations, corrupt data, or steal confidential information about our customers, franchisees, vendors and employees. As our reliance on technology has increased, so have the risks posed to our systems, both internal and those that we have outsourced. Primary adverse events that could directly result from the occurrence of a cyber incident include (i) exposure of confidential data about our customers, franchisees, vendors and employees, (ii) damage to the reputation of our brands (iii) damage to our relationship with our franchisees; (iv) interruption of our business; and (v) an event of default under our securitized debt agreements if a cybersecurity breach impacts our ability to comply with the terms of securitized debt agreements. We, our franchisees, third-party vendors and others with whom we may do business or interact with may have inadequate cyber liability insurance or coverage terms may be restrictive or insufficient to cover potential losses and remediation costs associated with a cyber attack.
As a merchant and service provider of point of sale related services, we and our franchisees are subject to PCI DSS, issued by the Payment Card Industry Council. PCI DSS contains compliance guidelines and standards with regard to our security surrounding the physical and electronic storage, processing and transmission of individual cardholder data. Despite our cybersecurity measures and our efforts to comply with PCI DSS guidelines, we cannot be certain that all of our information technology systems are able to prevent, contain or detect any cyber-attacks or security breaches from known malware or malware that may be developed in the future.
Our use of personally identifiable information is regulated by international, federal and state laws, as well as by certain third-party agreements. If our security and information systems are compromised or if our employees or franchisees fail to comply with these laws and regulations, and this information is obtained by unauthorized persons or used inappropriately, it could adversely affect our reputation and could disrupt our operations and result in costly litigation, judgments, or penalties resulting from violation of federal and state laws and payment card industry regulations. As privacy and information security laws and regulations change, we may incur additional costs to ensure that we remain in compliance with those laws and regulations. For example, the California Consumer Privacy Act took effect on January 1, 2020, requiring new processes and protections to be implemented.
We face a variety of risks associated with doing business in international markets. Our expansion into and continued operations in international markets could create risks to our brands and reputation. There is no assurance that our international operations will be profitable or that international growth will continue. Our international operations are subject to the same risks associated with our domestic operations, as well as a number of additional risks. These include, among other things, international economic and political conditions, issues with collections, international currency fluctuations, difficulty in enforcing intellectual property rights, terrorism, global travel risks and differing cultures and consumer preferences.
We also are subject to governmental regulations throughout the world that impact the way we do business with our international franchisees and vendors. These include antitrust and tax requirements, import/export/customs regulations, anti-boycott regulations, other international trade regulations, the USA Patriot Act and the Foreign Corrupt Practices Act. Failure to comply with any such legal requirements could subject us to monetary liabilities and other sanctions, which could harm our business, results of operations and financial condition.
We may be subject to litigation and other legal proceedings that could be time consuming, require significant amounts of management time and result in the diversion of significant operational resources. We are involved in lawsuits, claims and proceedings incident to the ordinary course of our business. Litigation is inherently unpredictable. Any claims against us, whether meritorious or not, could be time consuming, result in costly litigation, require significant amounts of management time and result in the diversion of significant operational resources. There have been a growing number of lawsuits in recent years. There also has been a rise in employment-related lawsuits. From time to time, we have been subject to these types of lawsuits. The cost of defending claims against us or the ultimate resolution of such claims may harm our business and operating results. In addition, the increasingly regulated business environment may result in a greater number of enforcement actions and private litigation. This could subject us to increased exposure to stockholder lawsuits.
We and our franchisees are subject to complaints or litigation from guests alleging illness, injury or other food quality, food safety, health or operational concerns as well as claims related to social issues (e.g., allegations of discrimination), the Americans with Disabilities Act and other premises liability. We and our franchisees are also subject to "dram shop" laws in some states pursuant to which we and our franchisees may be subject to liability in connection with personal injuries or property damages incurred in connection with wrongfully serving alcoholic beverages to an intoxicated person.
Although our franchise agreements require our franchisees to defend and indemnify us, we may be named as a defendant and sustain liability in legal proceedings against franchisees under the doctrines of vicarious liability, agency, negligence or otherwise. Claims against our franchisees may reduce the ability of our franchisees to make payments to us. We may also initiate legal proceedings against franchisees for breach of the terms of their franchise agreements, including underreporting of sales, failure to operate restaurants according to standard operating procedures and payment defaults. These claims also may reduce the ability of franchisees to enter into new franchise agreements with us.
Third-party claims with respect to intellectual property assets, if decided against us, may result in competing uses or require adoption of new, non-infringing intellectual property, which may in turn adversely affect sales and revenues. We regard our service marks and trademarks related to our restaurant businesses as having significant value and being important to our marketing efforts. To protect our brands from infringement, we rely on contracts, copyrights, patents, trademarks, service marks and other common law rights, such as trade secret and unfair competition laws. We have registered certain trademarks and service marks in the United States and international jurisdictions; however, effective intellectual property protection may not be available in every country in which we have or intend to open or franchise a restaurant. Although we believe we have taken appropriate measures to protect our intellectual property, there can be no assurance that these protections will be adequate.
In addition, there can be no assurance that third parties will not assert infringement or misappropriation claims against us, or assert claims that our rights in our trademarks, service marks and other intellectual property assets are invalid or unenforceable. Any such claims could have a material adverse effect on us or our franchisees if such claims were to be decided against us. If our rights in any intellectual property were invalidated or deemed unenforceable, it could permit competing uses of intellectual property which, in turn, could lead to a decline in restaurant revenues and sales of other branded products and services (if any). If the intellectual property became subject to third-party infringement, misappropriation or other claims, and such claims were decided against us, we may be forced to pay damages, be required to develop or adopt non-infringing intellectual property or be obligated to acquire a license to the intellectual property that is the subject of the asserted claim. There could be significant expenses associated with the defense of any infringement, misappropriation, or other third-party claims.
Our delivery initiatives and use of third-party delivery vendors subjects us and our franchisees to a variety of risks related to the delivery of our products by third parties and may not generate expected returns. There can be no assurance that delivery vendors will not take actions that could have a material adverse effect on our brands and or subject us to increased litigation and costs. Our delivery initiatives also introduce new operating procedures to our and our franchisees’ restaurants, which could adversely affect the business, brands, and the experience of our guests.
Our business depends on the proper allocation of our human capital and our ability to attract and retain talented management and other key employees. We have dedicated brand resources for key functions such as marketing, consumer insights and operations and a shared service model for certain other functions such as legal, technology and human resources. There can be no assurance that our allocation of our human capital will effectively meet the needs of our business and brands. Further, our business is based on successfully attracting and retaining talented employees. The market for highly skilled employees and leaders in our industry is extremely competitive. If we are less successful in our recruiting efforts, or if we are unable to retain management and other key employees, our ability to develop and deliver successful products and services may be adversely affected. Effective succession planning is also important to our long-term success. The departure of a key executive or employee and/or the failure to ensure an effective transfer of knowledge and a smooth transition upon such departure may be disruptive to the business and could hinder our strategic planning and execution.
Our failure or the failure of our franchisees to comply with federal, state and local governmental regulations may subject us to losses and harm our brands. We and our franchisees are subject to the Fair Labor Standards Act (which governs such matters as minimum wage, overtime and other working conditions), along with the Americans with Disabilities Act (which provides civil rights protections to individuals with disabilities in the context of employment, public accommodations, and other areas), the Immigration Reform and Control Act of 1986, various family leave mandates and a variety of other laws enacted, or rules and regulations promulgated by federal, state and local governmental authorities that govern these and other employment matters, including tip credits, working conditions, safety standards and immigration status. There have been several complaints alleging franchisors to be joint employers with franchisees. Although we do not consider ourselves to be
joint employers with our franchisees, there can be no assurance that other franchisors will not receive similar complaints in the future which may result in legal proceedings based on the actions of franchisees. Increases in payroll expenses as a result of any federal and state mandated increases in the minimum wage may negatively impact our and our franchisees’ profitability. Enactment and enforcement of various federal, state and local laws, rules and regulations on immigration and labor organizations may adversely impact the availability and costs of labor in a particular area or across the United States. Other labor shortages or increased team member turnover could also increase labor costs. In addition, our vendors may be affected by higher minimum wage standards or availability of labor, which may increase the price of goods and services they supply to us. The Patient Protection and Affordable Care Act has impacted our franchisees’ employee costs in some respects. There are no assurances that a combination of cost management and price increases can accommodate all of the costs associated with compliance.
We and our franchisees are subject to extensive federal, state and local governmental regulations, including those relating to food safety and inspection and the preparation and sale of food and alcoholic beverages. Disruptions within any government agencies could impact the U.S. food industry, which may have an adverse effect on our business. We and our franchisees are also subject to laws and regulations relating to building and zoning requirements. Our and our franchisees' restaurants are also subject to licensing and regulation by alcoholic beverage control, health, sanitation, safety and fire agencies in the state, county and/or municipality where the restaurant is located. We cannot assure you that we or our franchisees will not encounter material difficulties or failures, including with respect to obtaining and maintaining required licenses and approvals, which could impact the continuing operations of an existing restaurant, or delay or prevent the opening of a new restaurant.
In addition, we are subject to laws and regulations, which vary from jurisdiction to jurisdiction, relating to nutritional content and menu labeling. Compliance with these laws and regulations may lead to increased costs and operational complexity and may increase our exposure to governmental investigations or litigation. In connection with the continued operation or remodeling of certain restaurants, we and our franchisees may be required to expend funds to meet federal, state, local and international regulations. The inability to obtain or maintain such licenses or publicity resulting from actual or alleged violations of such laws could have an adverse effect on our results of operations.
We are subject to federal regulation and certain foreign and state laws, including state laws that govern the offer and sale of franchises. Many state franchise laws contain provisions that supersede the terms of franchise agreements, including provisions concerning the termination or non-renewal of a franchise. Some state franchise laws require that certain materials be registered before franchises can be offered or sold in that state. The failure to obtain or retain licenses or approvals to sell franchises could adversely affect us and the franchisees. Changes in, and the cost of compliance with, government regulations could have a material effect on operations.
Finally, regulatory changes or actions under current or future U.S. political administrations may impact the laws or regulations described above. We cannot predict whether or when any of these potential changes in law might become effective in any jurisdiction nor the impact, if any, of these changes to our business.
We are subject to risks associated with self-insurance for medical, dental and vision benefits. We self-insure all of our employee medical, dental and vision benefits. We maintain a per claim stop loss coverage but do not maintain coverage at an aggregate level. Our reserves are based on historical loss trends that may not correlate to actual loss experience in the future. If we experience an unexpectedly large number of claims that result in costs or liabilities in excess of our projections, our reserves may prove to be insufficient and we may be exposed to significant and unexpected losses. For these and other reasons, including our inability to renew stop loss coverage at competitive rates, we are subject to risks associated with self-insurance that may have an adverse effect on our financial condition and operating results.
In addition, access to personal medical information is regulated by federal, state and/or local laws as well as by certain third-party agreements. If our security and information systems or the systems of our third-party vendors are compromised, we could be subject to costly litigation or penalties and our reputation and operations could be adversely affected.
Any inability or failure to execute on a comprehensive business continuity plan following a major natural disaster such as an earthquake, tornado, flood or a man-made disaster, including terrorism or a cyber incident, at or affecting our corporate facilities could materially adversely impact our business. Our corporate systems and processes and corporate support for our restaurant operations are handled primarily at our restaurant support centers. We have disaster recovery procedures and business continuity plans in place to address most events of a crisis nature, including earthquakes, tornadoes, floods and other natural or man-made disasters, and back up and off-site locations for recovery of electronic and other forms of data and information. However, if we are unable to fully implement our disaster recovery plans, we may experience delays in recovery of data, inability to perform vital corporate functions, tardiness in required reporting and compliance, failures to
adequately support field operations and other breakdowns in normal communication and operating procedures that could have a material adverse effect on our financial condition, results of operation and exposure to administrative and other legal claims.
Development initiatives outside our core business could negatively impact our brands. Our business expansion into non-traditional restaurant formats, including restaurants with a smaller footprint and restaurants located in non-traditional locations could create new risks to our brand and reputation.
Failure of our internal controls over financial reporting and future changes in accounting standards may cause adverse unexpected operating results, affect our reported results of operations or otherwise harm our business and financial results. Our management is responsible for establishing and maintaining effective internal controls over financial reporting. Internal controls over financial reporting is a process to provide reasonable assurance regarding the reliability of financial reporting for external purposes in accordance with accounting principles generally accepted in the United States. Because of its inherent limitations, internal control over financial reporting is not intended to provide absolute assurance that we would prevent or detect a misstatement of our financial statements or fraud. Any failure to maintain an effective system of internal control over financial reporting could limit our ability to report our financial results accurately and timely or to detect and prevent fraud. A significant financial reporting failure or material weakness in internal control over financial reporting could cause a loss of investor confidence and decline in the market price of our common stock.
A change in accounting standards can have a significant effect on our reported results and may affect our reporting of transactions before the change is effective. New pronouncements and varying interpretations of pronouncements have occurred and may occur in the future. Changes to existing accounting rules or the questioning of current accounting practices may adversely affect our reported financial results. Additionally, our assumptions, estimates and judgments related to complex accounting matters could significantly affect our financial results. Generally accepted accounting principles and related accounting pronouncements, implementation guidelines and interpretations are highly complex and involve many subjective assumptions, estimates and judgments by us. Changes in these rules or their interpretation or changes in underlying assumptions, estimates or judgments by us could significantly change our reported or expected financial performance.
Risks Related to Our Franchised Business Model
Restaurant development plans under development agreements may not be implemented effectively and developed restaurants may not achieve desired results. We rely on franchisees to develop Applebee's and IHOP restaurants. From time to time, our franchisees have failed to fulfill their commitments to build new restaurants in the numbers and within the timeframes required by their development agreements, and we expect that this will continue to varying degrees in the future. Restaurant development and the success of restaurants opened by our franchisees involve substantial risks, including the following:
the demand for Applebee’s and IHOP restaurants and the selection of appropriate franchisee candidates;
costs of construction, permit issuance and regulatory compliance;
the availability of suitable locations and terms for potential development sites, including lease or purchase terms for new locations;
the availability of financing, at acceptable rates and terms, to both franchisees and third-party landlords, for restaurant development and/or implementation of our business strategy through new remodel programs and other operational changes;
delays in obtaining construction permits and in completion of construction;
competition for suitable development sites;
changes in governmental rules, regulations, and interpretations (including interpretations of the requirements of the Americans with Disabilities Act); and
general economic and business conditions.
Additionally, developed restaurants may not achieve desired revenue or cash flow levels once opened. This could result in restaurant closures, which may be significant in number, and may cause our royalty revenues and financial performance to decline. The inability to open new restaurants that achieve and sustain acceptable sales volumes and/or the closure of existing restaurants that do not achieve or sustain acceptable sales volumes which if significant in number, may have a material adverse effect on our business and financial condition.
We are significantly franchised; as a result, we are highly dependent upon our franchisees. All IHOP and almost all Applebee’s restaurants are owned and operated by our franchisees. Our dependence on our franchisees could adversely affect us, our brands, and our business, financial condition and results of operations. Our financial results are significantly contingent upon the performance of our franchised restaurants because we derive a substantial portion of our revenues from royalties that are based on a percentage of gross sales at franchised restaurants. Worsening economic conditions and declining trends in sales,
traffic and/or average check could impact the performance of our franchised restaurants, resulting in lower royalty, advertising fund and other payments from franchisees. If declining conditions persist, franchisee profitability and financial health may worsen and franchisees may suffer from financial, personal or other difficulties, including insolvency. Franchisees may also experience financial risks unrelated to the operation of restaurants under our brands, such as a decline in performance of other brands or businesses held by franchisees. Additionally, lenders to our franchisees may be less likely to provide current or prospective franchisees necessary financing on favorable terms, or at all, due to market conditions and our or our franchisees’ operating results. These and other factors could impact franchisees’ ability to make royalty and other payments owed to us when due and franchisees could default on their financial obligations to us. A decrease in franchisee profitability as well as other reasons could also cause franchisees’ failure or inability to meet new restaurant development obligations and other obligations such as maintenance or remodel requirements and rent obligations for certain leases on which we retain contingent liability.
Additionally, our franchise agreements have expiration dates. Upon expiration, franchisees are generally required to enter into new franchise agreements in order to extend the franchise relationship. We or the franchisee may or may not elect to enter into these successor franchise agreements based on a number of factors, including a failure to meet our criteria, lack of interest by either party and/or the inability of franchisees to enter into successor franchise agreements. It is expected that, in the ordinary course of business, some franchise agreements will expire without successor franchise agreements. However, a substantial number of franchise agreements are set to expire in 2020 and 2021 for Applebee’s and 2024 through 2028 for IHOP, and while we have begun efforts to extend the terms of these franchise agreements, we cannot ensure that we and/or our franchisees will enter into successor franchise agreements or extensions once current terms expire. This may result in reduced royalties and other payments due to a decrease in the number of restaurants operating under our brands.
As independent third parties, franchisees own, operate and oversee the daily operations of their restaurants and their employees are not our employees. Accordingly, we do not control their actions. While our franchise agreements are designed to maintain brand consistency, having almost all franchise operatedfranchisee-operated restaurants may expose us to risks not otherwise encountered if we maintained ownership and control of all of the restaurants. Franchisees may breach the terms of their franchise agreements in a manner that adversely affects our brands, such as failing to operate restaurants in accordance with our required standards, and we may be limited in our ability to enforce franchise obligations. Franchisees are required to conform to specified product quality standards and other requirements pursuant to their franchise agreements in order to protect our brands and to optimize restaurant performance. If franchisees do not successfully operate their restaurants in a manner consistent with our standards, or customers have negative experiences due to issues with food quality or operational execution, our reputation and brands could suffer, and we could be subject to claims by guests even if we are not legally liable for the franchisee's actions or failure to act. This could result in a material adverse effect on our business. The quality of franchisees’ operations may also be diminished by factors beyond our control, including a lack of investment in enhancing or maintaining acceptable standards for restaurant operations due to financial and other constraints. Franchisees also may fail or be unable to hire or retain qualified managers and other personnel and training of managers and other personnel may be inadequate. These and other such negative factors could reduce franchisees' restaurant revenues, impact payments to us under the franchise agreements and could have a material adverse effect on us.
Various other risks associated with the operation of a franchised business model that may have a material adverse effect on our business or financial condition include:
inability or unwillingness of franchisees to participate in implementing changes or to participate in business strategy changes;
inability or unwillingness of franchisees to support our marketing programs and strategic initiatives;
inability of franchisees to participate in business strategy changes due to financial constraints;
failure of franchisees to report sales information accurately;
greater proportional impact of general and administrative expenses on our business and financial condition; and
inability to retain franchisees in the future, both in terms of number and quality, and inability to attract, retain and motivate sufficient numbers of franchisees of the same caliber, including top performing franchisees.
While we try to maintain positive working relationships with our franchisees, the nature of the franchisor-franchisee relationship inherently subjects us to potential disagreements with our franchisees on matters pertaining to the business and/or our brands. From time to time, we have experienced, and we may continue to experience, poor franchise relations caused by the efforts of one or more of our larger franchisees or an organized franchise association.
Concentration of Applebee's franchised restaurants in a limited number of franchisees subjects us to greater risk. As of December 31, 2018,2019, Applebee's franchisees operated 1,6241,596 Applebee's restaurants in the United States. Of those restaurants, the
ten largest Applebee's franchisees owned 1,1751,170 restaurants, representing 72%73% of all franchised Applebee's restaurants in the United States. The largest Applebee's franchisee owned 459451 restaurants, representing 28% of all franchised Applebee's restaurants in the United States. The concentration of franchised restaurants in a limited number of franchisees subjects us to a potentially higher level of risk with respect to such franchisees because their obligations to us, including financial obligations, are greater as compared to those franchisees with fewer restaurants. The risk associated with these franchisees is also greater where franchisees are the sole or dominant franchisee for a particular region of the United States, as is the case for most domestic Applebee's franchised territories. In particular, if any of these franchisees experience financial or other difficulties, the franchisee may default on its obligations under multiple franchise agreements, notes receivable or other agreements, including payments to us and the maintenance and improvement of its restaurants. From time to time, we may work with our franchisees who are experiencing financial difficulties to assess and address their financial health and their ability to satisfy their financial obligations to us. In certain of these situations, we may agree to alternative arrangements with franchisees for the payment of amounts due to us under our franchise and other agreements. We cannot assure you that these arrangements will be successful, nor can we assure you that they will result in us receiving all or any of the amounts due to us under our franchise agreements, notes receivable and other agreements. Any franchisee that owns and operates a significant number of Applebee's restaurants and fails to comply with other obligations under the franchise agreement, such as those relating to the quality and preparation of food and maintenance of restaurants, could cause significant harm to the Applebee's brand and subject us to claims by consumers even if we are not legally liable for the franchisee's actions or failure to act. Development rights for Applebee's restaurants are also concentrated among a limited number of existing franchisees. If any of these existing franchisees experience financial difficulties, future development of Applebee's restaurants may be materially adversely affected.
An insolvency or bankruptcy proceeding involving a franchisee could prevent or delay the collection of payments or the exercise of rights under the related franchise agreement. An insolvency proceeding involving a franchisee could prevent or delay us from collecting payments or exercising any of our other rights under the related franchise agreement. If a franchisee is subject to bankruptcy or insolvency proceedings, a bankruptcy court may prevent the termination of the related franchise and development agreement. In particular, the protection of the statutory automatic stay that arises under Section 362 of the United States Bankruptcy Code upon the commencement of a bankruptcy proceeding by or against a franchisee may prohibit us from terminating a franchise agreement previously entered into with a franchisee. Furthermore, a franchisee that is subject to bankruptcy proceedings may reject the franchise agreement in which case we would be limited to a general unsecured claim against the franchisee's bankruptcy estate on account of breach-of-contract damages arising from the rejection. Payments previously made to us by a franchisee that is subject to a bankruptcy proceeding also may be recoverable from us on behalf of the franchisee as a preferential transfer under the United States Bankruptcy Code.
We are subject to credit risk from our IHOP franchisees operating under our Previous IHOP Business Model, and a default by these franchisees may negatively affect our cash flows. Prior to 2003, new IHOP restaurants were generally developed by us, and we were involved in all aspects of the construction and financing of the restaurants. We typically identified and leased or purchased the restaurant sites for new company-developed IHOP restaurants, built and equipped the restaurants and then franchised them to franchisees. In addition, we typically financed as much as 80% of the franchise fee for periods ranging from five to eight years and leased the restaurant and equipment to the franchisee over a 25-year period. Therefore, in addition to franchise fees and royalties, the revenues received from an IHOP franchisee operating under the Previous IHOP Business Model may include, among other things, lease or sublease rents for the restaurant property building, rent under an equipment lease and interest income from the financing arrangements for the unpaid portion of the franchise fee under the franchise notes. If any of these IHOP franchisees were to default on their payment obligations to us, we may be unable to collect the amounts owed under the building property lease/sublease agreement and our notes and equipment contract receivables, as well as outstanding franchise royalties. The additional amounts owed to us by each of these IHOP franchisees subject us to greater credit risk and defaults by IHOP franchisees operating under our Previous IHOP Business Model and may negatively affect our cash flows. Of the 1,5551,561 IHOP domestic franchise restaurants as of December 31, 2018,2019, approximately 680660 restaurants have building property lease/sublease agreements and/or notes and equipment contract obligations outstanding.
We and our franchisees are subject to potential losses that may not be covered by insurance. We and our franchisees may have insufficient insurance coverage to cover all of the potential risks associated with the ownership and operation of restaurants. We and our franchisees may have insufficient funds to cover future unanticipated increases in insurance premiums or losses that are not covered by insurance. Certain extraordinary hazards may not be insurable and insurance may not be available (or may be available only at prohibitively expensive rates) with respect to many other risks. Moreover, there is no assurance that any loss incurred will not exceed the limits on the policies obtained, or that claim payments on such policies will be received on a timely basis. Further, there can be no assurance that any such payments, even if obtained on a timely basis, will prevent losses to franchisees or enable timely franchise payments. Accordingly, in cases in which a franchisee experiences increased insurance premiums or must pay claims out-of-pocket, the franchisee may not have the funds necessary to make franchise and other payments to us, and franchisees may be unable to perform other obligations under their franchise agreements.
If franchisees and other licensees do not observe the required quality and trademark usage standards, our brands may suffer reputational damage, which could in turn adversely affect our business. We license our intellectual property to our franchisees, product suppliers, manufacturers, distributors, advertisers and other third parties. The franchise agreements and other license agreements require that each franchisee or other licensee use our intellectual property in accordance with established or approved quality control guidelines. However, there can be no assurance that the franchisees or other licensees will use the intellectual property assets in accordance with such guidelines. Franchisee and licensee noncompliance with the terms and conditions of the governing franchise agreement or other license agreement may reduce the overall goodwill associated with our brands. Franchisees and other licensees may refer to our intellectual property improperly in communications, resulting in the weakening of the distinctiveness of our intellectual property. There can be no assurance that the franchisees or other licensees will not take actions that could have a material adverse effect on the Applebee's or IHOP intellectual property.
In addition, even if the licensee product suppliers, manufacturers, distributors, or advertisers observe and maintain the quality and integrity of our intellectual property assets in accordance with the relevant license agreement, any product manufactured by such suppliers may be subject to regulatory sanctions and other actions by third parties which can, in turn, negatively impact the perceived quality of our restaurants and the overall goodwill of our brands, regardless of the nature and type of product involved. Any such sanctions or actions could reduce restaurant revenues and corresponding franchise payments to us.
Risks Related to Operating in the Restaurant Industry
Our performance is subject to risks associated with the restaurant industry, including the highly competitive nature of the industry. We derive a substantial portion of our revenues in the form of (i) royalties based on the gross sales of our franchised restaurants and (ii) gross sales derived from company-operated restaurants. Sales and profitability of these restaurants may be negatively impacted by a number of factors associated with operating in the restaurant industry, some of which are outside of our control. These factors include:
changes in consumer behavior driven by macro-level shifts in retail, technology, media, e-commerce, global safety and demography which may impact where, when, whether and how often customers visit full-service restaurants;
declines in comparable restaurant sales growth rates due to: (i) failure to meet or adequately adapt to changing customer expectations for food type, quality and taste, or to innovate and develop new menu items to retain existing customers and attract new customers; (ii) competitive intrusions in our markets, including competitive pricing initiatives and daypart expansion by competitors; (iii) opening new restaurants that cannibalize the sales of existing restaurants; (iv) failure of national or local marketing to be effective; and (v) natural or man-made disasters or adverse weather conditions;
negative trends in operating expenses such as: (i) increases in food and other commodity costs or related distribution costs; (ii) increases in labor costs due to minimum wage and other employment laws or regulations, immigration reform, the potential impact of union organizing efforts and tight labor market conditions; and (iii) increases in other operating costs including advertising, utilities, lease-related expenses and credit card processing fees;
the highly competitive nature of the restaurant and related industries with respect to, among other things: (i) price, service, location, personnel and the type and quality of food; (ii) the trend toward convergence in grocery, deli, retail and restaurant services, as well as the continued expansion of restaurants into the breakfast daypart; (iii) the entry of major market players in non-competing industries into the food services market; (iv) the decline in the price of groceries which may increase the attractiveness of dining at home versus dining out; and (v) the emergence of new or improved technologies and changes in consumer behavior facilitated by such technology;
the inability to increase menu pricing to offset increased operating expenses; and
failure to effectively manage further penetration into mature markets.
Factors outside our control may harm our brands' reputations. The success of our business is largely dependent upon brand recognition and the strength of our franchise systems. Our and our franchisees’ continued success is directly dependent upon maintaining a favorable public view of the Applebee's and IHOP brands. Negative publicity (e.g., crime, scandal, litigation, on-site accidents and injuries or other harm to customers, social issues, and food-borne illness) at a single Applebee's or IHOP location can have a substantial negative impact on all restaurants within the Applebee's or IHOP system. Multi-unit food service businesses such as ours can be materially and adversely affected by widespread negative publicity of any type, including through social media, but particularly regarding food quality, food-borne illness, food tampering or preparation, obesity, discrimination or bias, injury or other health concerns with respect to certain foods and actions of our or our franchisees’ managers or employees, regardless of whether such claims are accurate or valid.
The risk of food-borne illness or food tampering cannot be completely eliminated. Any outbreak of food-borne illness or other food-related incidents attributed to Applebee's or IHOP restaurants or within the food service industry or any widespread negative publicity regarding the Applebee's or IHOP brands or the restaurant industry in general could harm our reputation. Even where such food-related incidents occur solely at restaurants of our competitors or within the industry, our business could be adversely affected by negative publicity about the restaurant industry generally. Our company-owned restaurants and our franchisees may produce or receive through the supply chain sub-standard or non-compliant food or beverage products. In addition, our franchisees’ failure to comply with food quality and preparation requirements may subject us to potential losses, even when we are not legally liable for a franchisee's actions or failure to act. Although the Company maintains liability insurance, and each franchisee is required to maintain liability insurance pursuant to its franchise agreements, a liability claim could injure the reputation of all Applebee's or IHOP restaurants, whether or not it is ultimately successfulsuccessful.
Declines in our financial performance have resulted in and could result in future impairment charges. United States generally accepted accounting principles (“U.S. GAAP”) require annual (or more frequently if events or changes in circumstances warrant) impairment tests of goodwill, intangible assets and other long-lived assets. Generally speaking, if the carrying value of the asset is in excess of the estimated fair value of the asset, the carrying value will be adjusted to fair value through an impairment charge. Fair values of goodwill and intangible assets are primarily estimated using discounted cash flows based on five-year forecasts of financial results that incorporate assumptions including, among other things, same-restaurant sales trends, future development plans, brand-enhancing initiatives, restaurant closures and an appropriate discount rate. Fair values of long-lived tangible assets are primarily estimated using discounted cash flows over the estimated useful lives of the assets. Significant underachievement of forecasted results or changes in the discount rate assumption could reduce the estimated fair value of these assets below the carrying value, requiring non-cash impairment charges to reduce the carrying value of the asset. As of December 31, 2018, our total stockholders' deficit was $202.3 million. Any significant impairment write-down of goodwill, intangible assets or long-lived assets in the future could increase the stockholders' deficit. Repurchases of our common stock will also increase the stockholders' deficit. While such a deficit balance does not create an event of default in any of our contractual agreements, the negative perception of such a deficit could have an adverse effect on our stock price and could impair our ability to obtain new financing, or refinance existing indebtedness on commercially reasonable terms or at all.
Many factors, including those over which we have no control, affect the trading volatility and price of our stock. Many factors, in addition to our operating results, may have an impact on the trading volatility and price of our common stock. These factors include general economic and market conditions, publicity regarding us, our competitors, or the restaurant industry generally, changes in financial estimates by securities analysts, changes in financial or tax reporting and accounting principles or practices, trading activity in our common stock, overall liquidity and the impact of our capital allocation initiatives, including any future stock repurchase programs or dividend declarations. A number of these factors are outside of our control, and any failure to meet market expectations whether for sales growth, earnings per share or other metrics could cause our share price to decline.
Our actual operating and financial results in any given period may differ from guidance we provide to the public, including our most recent public guidance. From time to time, in press releases, SEC filings, public conference calls and other contexts, we have provided guidance to the public regarding current business conditions and our expectations for our future financial results. We expect that we will provide guidance periodically in the future. Our guidance is based upon a number of assumptions, expectations and estimates that are inherently subject to significant business, economic and competitive uncertainties and contingencies, many of which are beyond our control. In providing our guidance, we also make various assumptions with respect to our future business decisions, some of which will change. Our actual financial results, therefore, may vary from our guidance due to our inability to meet the assumptions upon which our guidance is based and the impact on our business of the various risks and uncertainties described in these risk factors and in our public filings with the SEC. Variances between our actual results and our guidance may be material. To the extent that our actual financial results do not meet or exceed our guidance, the trading prices of our securities may be materially adversely affected.
Our business strategy may not achieve anticipated results. We expect to continue to apply a business strategy that includes operation of a significantly franchised restaurant system across multiple brands and brand-specific business strategies suited to each brand. There can be no assurance that the business strategy we apply to one franchise system will be suitable or will achieve results similar to the application of such business strategy to another franchise system. In addition, operational improvement, purchasing and other strategic initiatives for any of our brands may not be successful or achieve the desired results, and there can be no assurance that franchisees will respond favorably to such initiatives. Additionally, our strategic initiatives may subject us and our franchisees to new and additional risks.
Our business strategy includes the addition of new brands to our restaurant portfolio through mergers and acquisitions. There can be no assurance that any such transaction will be successful or produce favorable financial or other results.
A lack of availability of suitable locations for new restaurants or a decline in the quality of the locations of our current restaurants may adversely affect our sales and results of operations. The success of our brands depends in large part on restaurant locations. As demographic and economic patterns change, current locations may not continue to be attractive or profitable. Potential declines in neighborhoods where restaurants are located or adverse economic conditions in areas surrounding those neighborhoods could result in reduced sales in those locations. In addition, desirable locations for new restaurant openings or for the relocation of existing restaurants may not be available at an acceptable cost when we identify a particular opportunity for a new restaurant or relocation. Additionally, restaurant revitalization initiatives may not be completed as and when projected and may not produce the results we expect. We also may be unable to operate effectively in new and/or highly competitive geographic regions or local markets in which our franchisees have limited operating experience.
We may experience shortages or interruptions in the supply or delivery of food and other products from third parties or in the availability of utilities. Our and our franchised restaurants are dependent on frequent deliveries of fresh produce, food, beverages and other products. Shortages or interruptions in food and beverage supplies may result from a variety of causes, including shortages due to adverse weather, labor unrest, labor shortages, political unrest, terrorism, pandemics, epidemics, outbreaks of food-borne illness, disruption of operation of production facilities, financial difficulties (including bankruptcy) of our distributors or suppliers or other unforeseen circumstances. Such shortages could adversely affect our and our franchisees’ ability to operate our restaurants and, in turn, affect our and our franchisees’ revenue and profits. Additionally, the inability to secure adequate and reliable supplies or distribution of food and beverage products could limit our ability to make changes to our core menus or offer promotional "limited time only" menu items, which may limit our ability to implement our business strategies. Our and our franchisees’ restaurants bear risks associated with the timeliness of deliveries by suppliers and distributors as well as the solvency, reputation, labor relationships, freight rates, prices of raw materials and health and safety standards of each supplier and distributor. Other significant risks associated with our suppliers and distributors include improper handling of food and beverage products and/or the adulteration or contamination of such food and beverage products. Disruptions in our relationships with suppliers and distributors may reduce the payments we receive from our franchisees or our pancake and waffle dry mix distributors or the profits generated by our company-operated restaurants. In addition, interruptions to the availability of gas, electric, water or other utilities may adversely affect the operations of our and our franchised restaurants.
Any inability to effectively manage or forecast appropriate inventory levels may adversely affect our business. Effective management of inventory levels depends, in part, on our ability to anticipate and respond in a timely manner to changing consumer demand and preferences. From time to time, we may carry excessive inventory resulting from menu events that vary from forecasted demand which may result in financial loss to us and/or to our franchisees. Conversely, if we underestimate demand, we may experience inventory shortages which may result in lost revenues.
A failure to develop and implement innovative marketing and guest relationship initiatives, ineffective or improper use of social media or other marketing initiatives and increased advertising and marketing costs could adversely affect our business results. If our competitors increase their spending on advertising and promotions, if our advertising, media or marketing expenses increase, or if our advertising and promotions become less effective than those of our competitors, we could experience a material adverse effect on our business results. A failure to sufficiently innovate, develop guest relationship initiatives, or maintain adequate and effective advertising could inhibit our ability to maintain brand relevance and drive increased sales.
As part of our marketing efforts, we rely on search engine marketing and social media platforms to attract and retain guests. These efforts may not be successful, resulting in expenses incurred without the benefit of higher revenues or increased employee engagement. In addition, a variety of risks are associated with the use of social media, including the improper disclosure of proprietary information, posting of negative comments about our brands or experiences in our or our franchisees’ restaurants, exposure of personally identifiable information, fraud, and use of outdated information. The use, including any inappropriate or otherwise harmful use, of social media vehicles by our franchisees and their employees, guests, our employees
or others in the general public could increase our costs, lead to litigation or result in negative publicity that could damage our reputation.
Changing health or dietary preferences may cause consumers to avoid Applebee's and IHOP restaurants in favor of alternative options. The food service industry as a whole rests on consumer preferences and demographic trends at the local, regional, national and international levels. Franchise development and system-wide sales depend on the sustained demand for our products, which may be affected by factors we do not control. New information regarding diet, nutrition and health and efforts by advocacy groups to influence consumer eating habits may negatively affect the demand for our food. Various additional factors such as: (i) the Food and Drug Administration’s menu labeling rules, (ii) nutritional guidelines issued by the United States Department of Agriculture and issuance of similar guidelines or statistical information by state or local municipalities, (iii) academic studies; or (iv) efforts by environmental, animal welfare and sustainability advocacy groups, may impact consumer choice and cause consumers to select foods other than those that are offered by Applebee's or IHOP restaurants. We may not be able to adequately adapt Applebee's or IHOP restaurants' menu offerings to keep pace with developments in consumer preferences, which may result in reduced royalty revenues from a decline in demand for our food and fewer guests visiting Applebee’s and IHOP restaurants.
We face a varietyRisks Related to Ownership of risks associated with doing businessOur Common Stock
Declines in international markets. Our expansion intoour financial performance have resulted in and continued operationscould result in international markets could create risks to our brandsfuture impairment charges. United States generally accepted accounting principles (“U.S. GAAP”) require annual (or more frequently if events or changes in circumstances warrant) impairment tests of goodwill, intangible assets and reputation. Thereother long-lived assets. Generally speaking, if the carrying value of the asset is no assurance that our international operationsin excess of the estimated fair value of the asset, the carrying value will be profitable oradjusted to fair value through an impairment charge. Fair values of goodwill and intangible assets are primarily estimated using discounted cash flows based on five-year forecasts of financial results that international growth will continue. Our international operations are subject to the same risks associated with our domestic operations, as well as a number of additional risks. These include,incorporate assumptions including, among other things, international economicsame-restaurant sales trends, future development plans, brand-enhancing initiatives, restaurant closures and political conditions, issues with collections, international currency fluctuations, terrorism, global travel risks and differing cultures and consumer preferences.
We alsoan appropriate discount rate. Fair values of long-lived tangible assets are subject to governmental regulations throughoutprimarily estimated using discounted cash flows over the world that impactestimated useful lives of the way we do business with our international franchisees and vendors. These include antitrust and tax requirements, import/export/customs regulations, anti-boycott regulations, other international trade regulations, the USA Patriot Act and the Foreign Corrupt Practices Act. Failure to comply with any such legal requirements could subject us to monetary liabilities and other sanctions, which could harm our business,assets. Significant underachievement of forecasted results of operations and financial condition.
We may be subject to litigation and other legal proceedings that could be time consuming, require significant amounts of management time and resultor changes in the diversion of significant operational resources. We are involved in lawsuits, claims and proceedings incident to the ordinary course of our business. Litigation is inherently unpredictable. Any claims against us, whether meritorious or not,discount rate assumption could be time consuming, result in costly litigation, require significant amounts of management time and result in the diversion of significant operational resources. There have been a growing number of lawsuits in recent years. There also has been a rise in employment-related lawsuits. From time to time, we have been subject to these types of lawsuits. The cost of defending claims against us or the ultimate resolution of such claims may harm our business and operating results. In addition, the increasingly regulated business environment may result in a greater number of enforcement actions and private litigation. This could subject us to increased exposure to stockholder lawsuits.
We and our franchisees are subject to complaints or litigation from guests alleging illness, injury or other food quality, food safety, health or operational concerns as well as claims related to social issues (.e.g., allegations of discrimination), the Americans with Disabilities Act and other premises liability. We and our franchisees are also subject to "dram shop" laws in some states pursuant to which we and our franchisees may be subject to liability in connection with personal injuries or property damages incurred in connection with wrongfully serving alcoholic beverages to an intoxicated person.
Although our franchise agreements require our franchisees to defend and indemnify us, we may be named as a defendant and sustain liability in legal proceedings against franchisees under the doctrines of vicarious liability, agency, negligence or otherwise. Claims against our franchisees may reduce the abilityestimated fair value of our franchiseesthese assets below the carrying value, requiring non-cash impairment charges to make payments to us. We may also initiate legal proceedings against franchisees for breachreduce the carrying value of the termsasset. In the third quarter of their franchise agreements, including underreporting of sales, failure to operate restaurants according to standard operating procedures and payment defaults. These claims also may reduce the ability of franchisees to enter into new franchise agreements with us.
Third-party claims with respect to intellectual property assets, if decided against us, may result in competing uses or require adoption of new, non-infringing intellectual property, which may in turn adversely affect sales and revenues. We regard our service marks and trademarks related to our restaurant businesses as having significant value and being important to our marketing efforts. To protect our brands from infringement, we rely on contracts, copyrights, patents, trademarks, service marks and other common law rights, such as trade secret and unfair competition laws. We have registered certain trademarks and service marks in the United States and international jurisdictions; however, effective intellectual property protection may not be available in every country in which we have or intend to open or franchise a restaurant. Although we believe we have taken appropriate measures to protect our intellectual property, there can be no assurance that these protections will be adequate.
In addition, there can be no assurance that third parties will not assert infringement or misappropriation claims against us, or assert claims that our rights in our trademarks, service marks and other intellectual property assets are invalid or unenforceable. Any such claims could have a material adverse effect on us or our franchisees if such claims were to be decided against us. If our rights in any intellectual property were invalidated or deemed unenforceable, it could permit competing uses of intellectual property which, in turn, could lead to a decline in restaurant revenues and sales of other branded products and services (if any). If the intellectual property became subject to third-party infringement, misappropriation or other claims, and such claims were decided against us, we may be forced to pay damages, be required to develop or adopt non-infringing intellectual property or be obligated to acquire a license to the intellectual property that is the subject of the asserted claim. There could be significant expenses associated with the defense of any infringement, misappropriation, or other third-party claims.
Our delivery initiatives and use of third-party delivery vendors subjects us and our franchisees to a variety of risks related to the delivery of our products by third parties and may not generate expected returns. There can be no assurance that these vendors will not take actions that could have a material adverse effect on our brands and or subject us to increased litigation and costs. Our delivery initiatives also introduce new operating procedures to our and our franchisees’ restaurants, which could adversely affect the business, brands, and the experience of our guests.
Our business depends on the proper allocation of our human capital and our ability to attract and retain talented management and other key employees. We have dedicated brand resources for key functions such as marketing, consumer insights and operations and a shared service model for certain other functions such as legal, technology and human resources. There can be no assurance that our allocation of our human capital will effectively meet the needs of our business and brands. Further, our business is based on successfully attracting and retaining talented employees. The market for highly skilled employees and leaders in our industry is extremely competitive. If we are less successful in our recruiting efforts, or if we are unable to retain management and other key employees, our ability to develop and deliver successful products and services may be adversely affected. Effective succession planning is also important to our long-term success. The departure of a key executive or employee and/or the failure to ensure an effective transfer of knowledge and a smooth transition upon such departure may be disruptive to the business and could hinder our strategic planning and execution.
Our failure or the failure of our franchisees to comply with federal, state and local governmental regulations may subject us to losses and harm our brands. We are subject to the Fair Labor Standards Act (which governs such matters as minimum wage, overtime and other working conditions), along with the Americans with Disabilities Act (which provides civil rights protections to individuals with disabilities in the context of employment, public accommodations, and other areas), the Immigration Reform and Control Act of 1986, various family leave mandates and a variety of other laws enacted, or rules and regulations promulgated by federal, state and local governmental authorities that govern these and other employment matters, including tip credits, working conditions, safety standards and immigration status. There have been several complaints alleging franchisors to be joint employers with franchisees. Although we do not consider ourselves to be joint employers with our franchisees, there can be no assurance that other franchisors will not receive similar complaints in the future which may result in legal proceedings based on the actions of its franchisees. Increases in payroll expenses2017, as a result of any federalperforming the interim quantitative test, we recognized an impairment of Applebee's goodwill of $358.2 million and state mandated increasesan impairment of Applebee's tradename of $173.4 million. As of December 31, 2019, our total stockholders' deficit was $241.8 million. Any significant impairment write-down of goodwill, intangible assets or long-lived assets in the minimum wage may negatively impactfuture could increase the stockholders' deficit. Repurchases of our and our franchisees’ profitability. Enactment and enforcement of various federal, state and local laws, rules and regulations on immigration and labor organizations may adversely impact the availability and costs of labor in a particular area or across the United States. Other labor shortages or increased team member turnover couldcommon stock will also increase labor costs. In addition,the stockholders' deficit. While such a deficit balance does not create an event of default in any of our vendors may be affected by higher minimum wage standards or availability of labor, which may increasecontractual agreements, the price of goods and services they supply to us. The Patient Protection and Affordable Care Act has impacted our franchisees’ employee costs in some respects. There are no assurances that a combination of cost management and price increases can accommodate all of the costs associated with compliance.
We are subject to extensive federal, state and local governmental regulations, including those relating to food safety and inspection and the preparation and sale of food and alcoholic beverages. Disruptions within any government agencies could impact the U.S. food industry, which may have an adverse effect on our business. We are also subject to laws and regulations relating to building and zoning requirements. Our and our franchisees' restaurants are also subject to licensing and regulation by alcoholic beverage control, health, sanitation, safety and fire agencies in the state, county and/or municipality where the restaurant is located. We cannot assure you that we or our franchisees will not encounter material difficulties or failures, including with respect to obtaining and maintaining required licenses and approvals, which could impact the continuing operations of an existing restaurant, or delay or prevent the opening of a new restaurant.
In addition, we are subject to laws and regulations, which vary from jurisdiction to jurisdiction, relating to nutritional content and menu labeling. Compliance with these laws and regulations may lead to increased costs and operational complexity and may increase our exposure to governmental investigations or litigation. In connection with the continued operation or remodeling of certain restaurants, we and our franchisees may be required to expend funds to meet federal, state, local and international regulations. The inability to obtain or maintain such licenses or publicity resulting from actual or alleged violationsnegative perception of such lawsa deficit could have an adverse effect on our results of operations.
We are subject to federal regulationstock price and certain foreign and state laws, including state laws that govern the offer and sale of franchises. Many state franchise laws contain provisions that supersede the terms of franchise agreements, including provisions concerning the termination or non-renewal of a franchise. Some state franchise laws require that certain materials be registered before franchises can be offered or sold in that state. The failurecould impair our ability to obtain new financing, or retain licensesrefinance existing indebtedness on commercially reasonable terms or approvals to sell franchises could adverselyat all.
Many factors, including those over which we have no control, affect usthe trading volatility and the franchisees. Changesprice of our stock. Many factors, in and the cost of compliance with, government regulations could have a material effect on operations.
Finally, regulatory changes or actions under the current U.S. political administration may impact the laws or regulations described above. We cannot predict whether or when any of these potential changes in law might become effective in any jurisdiction nor the impact, if any, of these changesaddition to our business.
We are subject to risks associated with self-insurance for medical, dental and vision benefits. We self-insure all of our employee medical, dental and vision benefits. We maintain a per claim stop loss coverage but do not maintain coverage at an aggregate level. Our reserves are based on historical loss trends that may not correlate to actual loss experience in the future. If we experience an unexpectedly large number of claims that result in costs or liabilities in excess of our projections, our reserves may prove to be insufficient and we may be exposed to significant and unexpected losses. For these and other reasons, including our inability to renew stop loss coverage at competitive rates, we are subject to risks associated with self-insurance thatoperating results, may have an adverse effectimpact on the Corporation’s financial conditiontrading volatility and operating results.
In addition, access to personal medical information is regulated by federal, state and/or local laws as well as by certain third-party agreements. If our security and information systems or the systems of our third-party vendors are compromised, we could be subject to costly litigation or penalties and our reputation and operations could be adversely affected.
Any inability or failure to execute on a comprehensive business continuity plan following a major natural disaster such as an earthquake, tornado, flood or a man-made disaster, including terrorism or a cyber incident, at or affecting our corporate facilities could materially adversely impact our business. Our corporate systems and processes and corporate support for our restaurant operations are handled primarily at our restaurant support center. We have disaster recovery procedures and business continuity plans in place to address most events of a crisis nature, including earthquakes, tornadoes, floods and other natural or man-made disasters, and back up and off-site locations for recovery of electronic and other forms of data and information. However, if we are unable to fully implement our disaster recovery plans, we may experience delays in recovery of data, inability to perform vital corporate functions, tardiness in required reporting and compliance, failures to adequately support field operations and other breakdowns in normal communication and operating procedures that could have a material adverse effect on our financial condition, results of operation and exposure to administrative and other legal claims.
Development initiatives outside our core business could negatively impact our brands. Our business expansion into non-traditional restaurant formats, including restaurants with a smaller footprint and restaurants located in non-traditional locations could create new risks to our brand and reputation.
Failure of our internal controls over financial reporting and future changes in accounting standards may cause adverse unexpected operating results, affect our reported results of operations or otherwise harm our business and financial results. Our management is responsible for establishing and maintaining effective internal controls over financial reporting. Internal controls over financial reporting is a process to provide reasonable assurance regarding the reliability of financial reporting for external purposes in accordance with accounting principles generally accepted in the United States. Because of its inherent limitations, internal control over financial reporting is not intended to provide absolute assurance that we would prevent or detect a misstatement of our financial statements or fraud. Any failure to maintain an effective system of internal control over financial reporting could limit our ability to report our financial results accurately and timely or to detect and prevent fraud. A significant financial reporting failure or material weakness in internal control over financial reporting could cause a loss of investor confidence and decline in the market price of our common stock. These factors include general economic and market conditions, publicity regarding us, our competitors, or the restaurant industry generally, changes in financial estimates by securities analysts, changes in financial or tax reporting and accounting principles or practices, trading activity in our common stock, overall liquidity and the impact of our capital allocation initiatives, including any future stock repurchase programs or dividend declarations. A number of these factors are outside of our control, and any failure to meet market expectations whether for sales growth, earnings per share or other metrics could cause our share price to decline.
A changeOur actual operating and financial results in accounting standards canany given period may differ from guidance we provide to the public, including our most recent public guidance. From time to time, in press releases, SEC filings, public conference calls and other contexts, we have a significant effect onprovided guidance to the public regarding current business conditions and our reported results and may affectexpectations for our reporting of transactions before the change is effective. New pronouncements and varying interpretations of pronouncements have occurred and may occurfuture financial results. We expect that we will provide guidance periodically in the future. ChangesOur guidance is based upon a number of assumptions, expectations and estimates that are inherently subject to existing accounting rulessignificant business, economic and competitive uncertainties and contingencies, many of which are beyond our control. In providing our guidance, we also make various assumptions with respect to our future business decisions, some of which will change. Our actual financial results, therefore, may vary from our guidance due to our inability to meet the assumptions upon which our guidance is based and the impact on our business of the various risks and uncertainties described in these risk factors and in our public filings with the SEC. Variances between our actual results and our guidance may be material. To the extent that our actual financial results do not meet or exceed our guidance, the questioningtrading prices of current accounting practicesour securities may be materially adversely affectaffected.
Our business strategy may not achieve anticipated results. We expect to continue to apply a business strategy that includes operation of a significantly franchised restaurant system across multiple brands and brand-specific business strategies suited to each brand. There can be no assurance that the business strategy we apply to one franchise system will be suitable or will achieve results similar to the application of such business strategy to another franchise system. In addition, operational improvement, purchasing and other strategic initiatives for any of our reported financial results.brands may not be successful or achieve the desired results, and there can be no assurance that franchisees will respond favorably to such initiatives. Additionally, our assumptions, estimatesstrategic initiatives may subject us and judgments relatedour franchisees to complex accounting matters could significantly affectnew and additional risks.
Our business strategy includes the addition of new brands to our restaurant portfolio through mergers and acquisitions. There can be no assurance that any such transaction will be successful or produce favorable financial results. Generally accepted accounting principles and related accounting pronouncements, implementation guidelines and interpretations are highly complex and involve many subjective assumptions, estimates and judgments by us. Changes in these rules or their interpretation or changes in underlying assumptions, estimates or judgments by us could significantly change our reported or expected financial performance.other results.
Item 1B. Unresolved Staff Comments.
None.
Item 2. Properties.
The table below shows the location and ownership type of Applebee's and IHOP restaurants as of December 31, 2018:2019: | | | | Applebee's (a) | | IHOP (a) | Applebee's (a) | | IHOP (a) |
| | Franchise | | Company | | Total Applebee's | | Franchise | | Area License | | Total IHOP | Franchise | | Company | | Total Applebee's | | Franchise | | Area License | | Total IHOP |
| United States | | | | | | | | | | | | | | | | | | | | | | |
| Alabama | 29 |
| | — |
| | 29 |
| | 19 |
| | — |
| | 19 |
| 30 |
| | — |
| | 30 |
| | 18 |
| | — |
| | 18 |
|
| Alaska | 1 |
| | — |
| | 1 |
| | 4 |
| | — |
| | 4 |
| 1 |
| | — |
| | 1 |
| | 4 |
| | — |
| | 4 |
|
| Arizona | 22 |
| | — |
| | 22 |
| | 45 |
| | — |
| | 45 |
| 22 |
| | — |
| | 22 |
| | 45 |
| | — |
| | 45 |
|
| Arkansas | 8 |
| | — |
| | 8 |
| | 17 |
| | — |
| | 17 |
| 8 |
| | — |
| | 8 |
| | 17 |
| | — |
| | 17 |
|
| California | 114 |
| | — |
| | 114 |
| | 233 |
| | — |
| | 233 |
| 111 |
| | — |
| | 111 |
| | 233 |
| | — |
| | 233 |
|
| Colorado | 24 |
| | — |
| | 24 |
| | 37 |
| | — |
| | 37 |
| 24 |
| | — |
| | 24 |
| | 37 |
| | — |
| | 37 |
|
| Connecticut | 6 |
| | — |
| | 6 |
| | 9 |
| | — |
| | 9 |
| 6 |
| | — |
| | 6 |
| | 9 |
| | — |
| | 9 |
|
| Delaware | 12 |
| | — |
| | 12 |
| | 7 |
| | — |
| | 7 |
| 12 |
| | — |
| | 12 |
| | 7 |
| | — |
| | 7 |
|
| District of Columbia | — |
| | — |
| | — |
| | 2 |
| | — |
| | 2 |
| — |
| | — |
| | — |
| | 2 |
| | — |
| | 2 |
|
| Florida | 105 |
| | — |
| | 105 |
| | — |
| | 146 |
| (b) | 146 |
| 103 |
| | — |
| | 103 |
| | — |
| | 146 |
| (b) | 146 |
|
| Georgia | 63 |
| | — |
| | 63 |
| | 77 |
| | 4 |
| (b) | 81 |
| 63 |
| | — |
| | 63 |
| | 78 |
| | 3 |
| | 81 |
|
| Hawaii | 2 |
| | — |
| | 2 |
| | 8 |
| | — |
| | 8 |
| 2 |
| | — |
| | 2 |
| | 7 |
| | — |
| | 7 |
|
| Idaho | 12 |
| | — |
| | 12 |
| | 8 |
| | — |
| | 8 |
| 12 |
| | — |
| | 12 |
| | 8 |
| | — |
| | 8 |
|
| Illinois | 39 |
| | — |
| | 39 |
| | 52 |
| | — |
| | 52 |
| 39 |
| | — |
| | 39 |
| | 51 |
| | — |
| | 51 |
|
| Indiana | 58 |
| | — |
| | 58 |
| | 24 |
| | — |
| | 24 |
| 58 |
| | — |
| | 58 |
| | 24 |
| | — |
| | 24 |
|
| Iowa | 26 |
| | — |
| | 26 |
| | 11 |
| | — |
| | 11 |
| 26 |
| | — |
| | 26 |
| | 12 |
| | — |
| | 12 |
|
| Kansas | 32 |
| | — |
| | 32 |
| | 28 |
| | — |
| | 28 |
| 31 |
| | — |
| | 31 |
| | 30 |
| | — |
| | 30 |
|
| Kentucky | 27 |
| | — |
| | 27 |
| | 10 |
| | — |
| | 10 |
| 27 |
| | — |
| | 27 |
| | 11 |
| | — |
| | 11 |
|
| Louisiana | 15 |
| | — |
| | 15 |
| | 31 |
| | — |
| | 31 |
| 14 |
| | — |
| | 14 |
| | 31 |
| | — |
| | 31 |
|
| Maine | 12 |
| | — |
| | 12 |
| | 4 |
| | — |
| | 4 |
| 12 |
| | — |
| | 12 |
| | 4 |
| | — |
| | 4 |
|
| Maryland | 22 |
| | — |
| | 22 |
| | 52 |
| | — |
| | 52 |
| 22 |
| | — |
| | 22 |
| | 52 |
| | — |
| | 52 |
|
| Massachusetts | 28 |
| | — |
| | 28 |
| | 21 |
| | — |
| | 21 |
| 27 |
| | — |
| | 27 |
| | 22 |
| | — |
| | 22 |
|
| Michigan | 86 |
| | — |
| | 86 |
| | 27 |
| | — |
| | 27 |
| 86 |
| | — |
| | 86 |
| | 26 |
| | — |
| | 26 |
|
| Minnesota | 50 |
| | — |
| | 50 |
| | 9 |
| | — |
| | 9 |
| 48 |
| | — |
| | 48 |
| | 9 |
| | — |
| | 9 |
|
| Mississippi | 21 |
| | — |
| | 21 |
| | 15 |
| | — |
| | 15 |
| 21 |
| | — |
| | 21 |
| | 13 |
| | — |
| | 13 |
|
| Missouri | 49 |
| | — |
| | 49 |
| | 33 |
| | — |
| | 33 |
| 49 |
| | — |
| | 49 |
| | 33 |
| | — |
| | 33 |
|
| Montana | 8 |
| | — |
| | 8 |
| | 5 |
| | — |
| | 5 |
| 8 |
| | — |
| | 8 |
| | 5 |
| | — |
| | 5 |
|
| Nebraska | 18 |
| | — |
| | 18 |
| | 8 |
| | — |
| | 8 |
| 18 |
| | — |
| | 18 |
| | 6 |
| | — |
| | 6 |
|
| Nevada | 13 |
| | — |
| | 13 |
| | 24 |
| | — |
| | 24 |
| 13 |
| | — |
| | 13 |
| | 22 |
| | — |
| | 22 |
|
| New Hampshire | 14 |
| | — |
| | 14 |
| | 6 |
| | — |
| | 6 |
| 13 |
| | — |
| | 13 |
| | 6 |
| | — |
| | 6 |
|
| New Jersey | 60 |
| | — |
| | 60 |
| | 46 |
| | — |
| | 46 |
| 58 |
| | — |
| | 58 |
| | 49 |
| | — |
| | 49 |
|
| New Mexico | 20 |
| | — |
| | 20 |
| | 22 |
| | — |
| | 22 |
| 20 |
| | — |
| | 20 |
| | 22 |
| | — |
| | 22 |
|
| New York | 109 |
| | — |
| | 109 |
| | 57 |
| | — |
| | 57 |
| 104 |
| | — |
| | 104 |
| | 58 |
| | — |
| | 58 |
|
| North Carolina | 1 |
| | 42 |
| | 43 |
| | 54 |
| | — |
| | 54 |
| 1 |
| | 42 |
| | 43 |
| | 56 |
| | — |
| | 56 |
|
| North Dakota | 11 |
| | — |
| | 11 |
| | 2 |
| | — |
| | 2 |
| 11 |
| | — |
| | 11 |
| | 2 |
| | — |
| | 2 |
|
| Ohio | 77 |
| | — |
| | 77 |
| | 41 |
| | — |
| | 41 |
| 77 |
| | — |
| | 77 |
| | 39 |
| | — |
| | 39 |
|
| Oklahoma | 13 |
| | — |
| | 13 |
| | 34 |
| | — |
| | 34 |
| 13 |
| | — |
| | 13 |
| | 33 |
| | — |
| | 33 |
|
| Oregon | 19 |
| | — |
| | 19 |
| | 9 |
| | — |
| | 9 |
| 17 |
| | — |
| | 17 |
| | 11 |
| | — |
| | 11 |
|
| Pennsylvania | 80 |
| | — |
| | 80 |
| | 27 |
| | — |
| | 27 |
| 80 |
| | — |
| | 80 |
| | 28 |
| | — |
| | 28 |
|
| Rhode Island | 8 |
| | — |
| | 8 |
| | 5 |
| | — |
| | 5 |
| 8 |
| | — |
| | 8 |
| | 5 |
| | — |
| | 5 |
|
| South Carolina | — |
| | 27 |
| | 27 |
| | 33 |
| | — |
| | 33 |
| — |
| | 27 |
| | 27 |
| | 33 |
| | — |
| | 33 |
|
| South Dakota | 6 |
| | — |
| | 6 |
| | 2 |
| | — |
| | 2 |
| 6 |
| | — |
| | 6 |
| | 2 |
| | — |
| | 2 |
|
| Tennessee | 30 |
| | — |
| | 30 |
| | 41 |
| | — |
| | 41 |
| 29 |
| | — |
| | 29 |
| | 40 |
| | — |
| | 40 |
|
| Texas | 97 |
| | — |
| | 97 |
| | 209 |
| | — |
| | 209 |
| 96 |
| | — |
| | 96 |
| | 211 |
| | — |
| | 211 |
|
| Utah | 10 |
| | — |
| | 10 |
| | 21 |
| | — |
| | 21 |
| 9 |
| | — |
| | 9 |
| | 22 |
| | — |
| | 22 |
|
| Vermont | 3 |
| | — |
| | 3 |
| | 1 |
| | — |
| | 1 |
| 3 |
| | — |
| | 3 |
| | 1 |
| | — |
| | 1 |
|
| Virginia | 63 |
| | — |
| | 63 |
| | 67 |
| | — |
| | 67 |
| 62 |
| | — |
| | 62 |
| | 69 |
| | — |
| | 69 |
|
| Washington | 41 |
| | — |
| | 41 |
| | 32 |
| | — |
| | 32 |
| 41 |
| | — |
| | 41 |
| | 32 |
| | — |
| | 32 |
|
| West Virginia | 16 |
| | — |
| | 16 |
| | 8 |
| | — |
| | 8 |
| 16 |
| | — |
| | 16 |
| | 8 |
| | — |
| | 8 |
|
| Wisconsin | 40 |
| | — |
| | 40 |
| | 15 |
| | — |
| | 15 |
| 35 |
| | — |
| | 35 |
| | 15 |
| | — |
| | 15 |
|
| Wyoming | 4 |
| | — |
| | 4 |
| | 3 |
| | — |
| | 3 |
| 4 |
| | — |
| | 4 |
| | 3 |
| | — |
| | 3 |
|
| Total Domestic | 1,624 |
| | 69 |
| | 1,693 |
| | 1,555 |
| | 150 |
| | 1,705 |
| 1,596 |
| | 69 |
| | 1,665 |
| | 1,561 |
| | 149 |
| | 1,710 |
|
| | | | Applebee's (a) | | IHOP (a) | Applebee's (a) | | IHOP (a) |
| | Franchise | | Company | | Total Applebee's | | Franchise | | Area License | | Total IHOP | Franchise | | Company | | Total Applebee's | | Franchise | | Area License | | Total IHOP |
| International | | | | | | | | | | | | | | | | | | | | | | |
| Bahrain | — |
| | — |
| | — |
| | 3 |
| | — |
| | 3 |
| 1 |
| | — |
| | 1 |
| | 3 |
| | — |
| | 3 |
|
| Brazil | 2 |
| | — |
| | 2 |
| | — |
| | — |
| | — |
| 2 |
| | — |
| | 2 |
| | — |
| | — |
| | — |
|
| Canada | 16 |
| | — |
| | 16 |
| | 16 |
| | 12 |
| (b) | 28 |
| 15 |
| | — |
| | 15 |
| | 15 |
| | 12 |
| (b) | 27 |
|
| Costa Rica | 3 |
| | — |
| | 3 |
| | — |
| | — |
| | — |
| |
| Dominican Republic | 3 |
| | — |
| | 3 |
| | — |
| | — |
| | — |
| 2 |
| | — |
| | 2 |
| | — |
| | — |
| | — |
|
| Ecuador | | — |
| | — |
| | — |
| | 3 |
| | — |
| | 3 |
|
| Egypt | 1 |
| | — |
| | 1 |
| | — |
| | — |
| | — |
| 1 |
| | — |
| | 1 |
| | — |
| | — |
| | — |
|
| Guam | 1 |
| | — |
| | 1 |
| | 2 |
| | — |
| | 2 |
| 1 |
| | — |
| | 1 |
| | 2 |
| | — |
| | 2 |
|
| Guatemala | 5 |
| | — |
| | 5 |
| | 2 |
| | — |
| | 2 |
| 4 |
| | — |
| | 4 |
| | 1 |
| | — |
| | 1 |
|
| India | — |
| | — |
| | — |
| | 2 |
| | — |
| | 2 |
| — |
| | — |
| | — |
| | 3 |
| | — |
| | 3 |
|
| Indonesia | 1 |
| | — |
| | 1 |
| | — |
| | — |
| | — |
| 1 |
| | — |
| | 1 |
| | — |
| | — |
| | — |
|
| Kuwait | 8 |
| | — |
| | 8 |
| | 6 |
| | — |
| | 6 |
| 6 |
| | — |
| | 6 |
| | 8 |
| | — |
| | 8 |
|
| Lebanon | — |
| | — |
| | — |
| | 1 |
| | — |
| | 1 |
| |
| Mexico | 56 |
| | — |
| | 56 |
| | 45 |
| | — |
| | 45 |
| 51 |
| | — |
| | 51 |
| | 47 |
| | — |
| | 47 |
|
| Northern Mariana Islands | — |
| | — |
| | — |
| | 1 |
| | — |
| | 1 |
| — |
| | — |
| | — |
| | 1 |
| | — |
| | 1 |
|
| Panama | 2 |
| | — |
| | 2 |
| | 4 |
| | — |
| | 4 |
| 2 |
| | — |
| | 2 |
| | 4 |
| | — |
| | 4 |
|
| Peru | | — |
| | — |
| | — |
| | 1 |
| | — |
| | 1 |
|
| Puerto Rico | 6 |
| | — |
| | 6 |
| | 5 |
| | — |
| | 5 |
| 7 |
| | — |
| | 7 |
| | 6 |
| | — |
| | 6 |
|
| Qatar | 8 |
| | — |
| | 8 |
| | 1 |
| | — |
| | 1 |
| 8 |
| | — |
| | 8 |
| | 1 |
| | — |
| | 1 |
|
| Saudi Arabia | 22 |
| | — |
| | 22 |
| | 17 |
| | — |
| | 17 |
| 21 |
| | — |
| | 21 |
| | 17 |
| | — |
| | 17 |
|
| Thailand | — |
| | — |
| | — |
| | 3 |
| | — |
| | 3 |
| — |
| | — |
| | — |
| | 1 |
| | — |
| | 1 |
|
| United Arab Emirates | 10 |
| | — |
| | 10 |
| | 6 |
| | — |
| | 6 |
| — |
| | — |
| | — |
| | 6 |
| | — |
| | 6 |
|
| Total International | 144 |
| | — |
| | 144 |
| | 114 |
| | 12 |
| | 126 |
| 122 |
| | — |
| | 122 |
| | 119 |
| | 12 |
| | 131 |
|
| Totals | 1,768 |
| | 69 |
| | 1,837 |
| | 1,669 |
| | 162 |
| | 1,831 |
| 1,718 |
| | 69 |
| | 1,787 |
| | 1,680 |
| | 161 |
| | 1,841 |
|
(a) The properties identified in this table generate revenue in our franchise, rental, financing and company restaurant operating segments.
(b) Of these restaurants, 3528 in Florida one in Georgia and nine in Canada have been sub-licensed by the area licensee.
Of the 1,6691,680 IHOP restaurants operated by franchisees, 5857 were located on sites owned by us, 618600 were located on sites leased by us from third parties and 9931,023 were located on sites owned or leased by franchisees. All of the IHOP restaurants operated by area licensees and 1,7661,716 of the franchisee-operated Applebee's restaurants were located on sites owned or leased by the area licensees or the franchisees. We owned one site on which a franchisee-operated Applebee's restaurant was located.located and one franchisee-operated Applebee's restaurant was located on site leased by us from third parties. The 69 Applebee's restaurants we operated as of December 31, 20182019 were located on sites leased by us from third parties.
Leases of IHOP restaurants generally provide for an initial term of 20 to 25 years, with most having one or more five-year renewal options. Leases of Applebee's restaurants generally have an initial term of 10 to 20 years, with renewal terms of five to 20 years. In addition, a substantial number of the leases for both IHOP and Applebee's restaurants include provisions calling for the periodic escalation of rents during the initial term and/or during renewal terms. The leases typically provide for payment of rents in an amount equal to the greater of a fixed amount or a specified percentage of gross sales and for payment of taxes, insurance premiums, maintenance expenses and certain other costs. Historically, it has been our practice to seek to extend, through negotiation, those leases that expire without renewal options. However, from time to time, we choose not to renew a lease or are unsuccessful in negotiating satisfactory renewal terms. When this occurs, the restaurant is closed and possession of the premises is returned to the landlord.
Under our Applebee's franchise agreements, we have certain rights to gain control of a restaurant site in the event of default under the franchise agreement. Because substantially all IHOP franchised restaurants developed by us under our Previous IHOP Business Model are subleased to the franchisees, IHOP has the ability to regain possession of the subleased restaurant if the franchisee defaults in the payment of rent or other terms of the sublease.
We currently occupy our principal corporate offices and restaurant support center in Glendale, California, under a lease expiring in April 2023. We lease approximately 50,000 square feet of office space in Kansas City, Missouri, under a lease expiring in October 2021. We lease approximately 3,000 square feet of office space in Raleigh, North Carolina under a lease expiring in April 2024.
Item 3. Legal Proceedings.
We are subject to various lawsuits, administrative proceedings, audits, and claims arising in the ordinary course of business. Some of these lawsuits purport to be class actions and/or seek substantial damages. We are required to record an accrual for litigation loss contingencies that are both probable and reasonably estimable. Legal fees and expenses associated with the defense of all of our litigation are expensed as such fees and expenses are incurred. Management regularly assesses our insurance deductibles, analyzes litigation information with our attorneys and evaluates our loss experience in connection with pending legal proceedings. While we do not presently believe that any of the legal proceedings to which we are currently a party will ultimately have a material adverse impact on us, there can be no assurance that we will prevail in all the proceedings we are party to, or that we will not incur material losses from them.
Item 4. Mine Safety Disclosure.
Not Applicable.
PART II
Item 5. Market for Registrant's Common Equity, Related Stockholder Matters and Issuer Purchases of Equity Securities.
Market Information
Our common stock is traded on the NYSE under the symbol “DIN”.
Holders
The number of stockholders of record and beneficial owners of our common stock as of February 1, 201912, 2020 was estimated to be 19,100.28,700.
Dividends on Common Stock
Please refer to Note 12 - Stockholders' Deficit, of the Notes to the Consolidated Financial Statements for information on dividends declared and paid in the fiscal years ended December 31, 20182019 and December 31, 2017.2018.
On February 20, 2019,2020, our Board of Directors approved payment of a cash dividend of $0.69$0.76 per share of common stock, payable at the close of business on April 5, 20193, 2020 to the stockholders of record as of the close of business on March 20, 2019.2020.
We evaluate dividend payments on common stock within the context of our overall capital allocation strategy with our Board of Directors on an ongoing basis, giving consideration to our current and forecast earnings, financial condition, cash requirements and other factors. There can be no assurance that we will continue to pay such dividends or the amount of such dividends.
Securities Authorized for Issuance Under Equity Compensation Plans
The following table provides information as of December 31, 2018, regarding shares outstanding and available for issuance under the Dine Brands Global, Inc. 2016 Stock Incentive Plan (the “2016 Plan”): |
| | | | | | | | | |
| Plan Category | Number of securities to be issued upon exercise of outstanding options, warrants and rights | | Weighted average exercise price of outstanding options, warrants and rights | | Number of securities remaining available for future issuance under equity compensation plans (excluding securities reflected in column (a)) |
| (a) | | (b) | | (c) |
| Equity compensation plans approved by security holders | 1,439,708 |
| | $ | 63.21 |
| | 567,829 |
|
| Equity compensation plans not approved by security holders | — |
| | — |
| | — |
|
| Total | 1,439,708 |
| | $ | 63.21 |
| | 567,829 |
|
The number of securities remaining available for future issuance represents shares under the 2016 Plan. Please refer to Note 14 - Stock-Based Incentive Plans, of the Notes to the Consolidated Financial Statements for a description of the 2016 Plan.
Issuer Purchases of Equity Securities
| | Purchases of Equity Securities by the Company | | Period | | Total number of shares purchased | | Average price paid per share | | Total number of shares purchased as part of publicly announced plans or programs (c) | | Approximate dollar value of shares that may yet be purchased under the plans or programs (c) | | Total number of shares purchased | | Average price paid per share | | Total number of shares purchased as part of publicly announced plans or programs (c) | | Approximate dollar value of shares that may yet be purchased under the plans or programs (c) |
October 1, 2018 – October 28, 2018(a) | | 29,253 |
| | $76.80 | | 27,730 |
| | $ | 37,100,000 |
| |
October 29, 2018 – November 25, 2018(b) | | 788 |
| | $88.73 | | — |
| | $ | 37,100,000 |
| |
November 26, 2018 – December 30, 2018(a) | | 68,057 |
| | $73.07 | | 67,494 |
| | $ | 32,200,000 |
| |
September 29, 2019 – October 27, 2019(a) | | | 283 |
| | $72.28 | | — |
| | $ | 118,300,000 |
|
October 28, 2019 – November 24, 2019(b) | | | 201,824 |
| | $74.83 | | 200,527 |
| | $ | 103,300,000 |
|
November 25, 2019 – December 29, 2019(b) | | | 80,512 |
| | $82.47 | | 80,324 |
| | $ | 96,700,000 |
|
| Total | | 98,098 |
| | $74.31 | | 95,224 |
| | $ | 32,200,000 |
| | 282,619 |
| | $77.01 | | 280,851 |
| | $ | 96,700,000 |
|
(a) Include 1,523 shares owned and tendered by employees at an average price of $81.24 per share during the fiscal month ended October 28, 2018 and 563 shares owned and tendered by employees at an average price of $82.59 per share during the fiscal month ended December 30, 2018 to satisfy tax withholding obligations arising upon the vesting of restricted stock awards. Shares so surrendered by the participants are repurchased by us pursuant to the terms of the plan under which the shares were issued and the applicable individual award agreements and not pursuant to publicly announced repurchase authorizations.
(b) These amounts represent shares owned and tendered by employees to satisfy tax withholding obligations arising upon the vesting of restricted stock awards. Shares so surrendered by the participants are repurchased by us pursuant to the terms of the plan under which the shares were issued and the applicable individual award agreements and not pursuant to publicly announced repurchase authorizations.
(b) Total number of shares repurchased includes 1,297 shares owned and tendered by employees at an average price of $79.39 per share during the fiscal month ended November 24, 2019 and 188 shares owned and tendered by employees at an average price of $81.44 per share during the fiscal month ended December 29, 2019 to satisfy tax withholding obligations arising upon the vesting of restricted stock awards. Shares so surrendered by the participants are repurchased by us pursuant to the terms of the plan under which the shares were issued and the applicable individual award agreements and not pursuant to publicly announced repurchase authorizations.
(c) In October 2015,February 2019, our Board of Directors approved a stock repurchase programthe 2019 Repurchase Program authorizing usthe Company to repurchase up to $150$200 million of the Company's common stock on an opportunistic basis from time to time in open market transactions and in privately negotiated transactions, including Rule 10b-5 stock repurchase plans, based on business, market, applicable legal requirements and other considerations.stock. The program2019 Repurchase Program, as approved by the Board of Directors, does not require the repurchase of a specific number of shares and can be terminated at any time.
Stock Performance Graph
The graph below shows a comparison of the cumulative total stockholder return on our common stock with the cumulative total return on the Standard & Poor's 500 Composite Index and the Value-Line Restaurants Index (“Restaurant Index”) over the five-year period ended December 31, 2018.2019. The graph and table assume $100 was invested at the close of trading on the last day of trading in 20132014 in our common stock and in each of the market indices, with reinvestment of all dividends. Stockholder returns over the indicated periods should not be considered indicative of future stock prices or stockholder returns.
Comparison of Five-Year Cumulative Total Stockholder Return
Dine Brands Global, Inc., Standard & Poor's 500 and Value Line Restaurant Index
(Performance Results through December 31, 2018)2019)
| | | | 2013 | | 2014 | | 2015 | | 2016 | | 2017 | | 2018 | 2014 | | 2015 | | 2016 | | 2017 | | 2018 | | 2019 |
| Dine Brands Global, Inc. | $ | 100.00 |
| | $ | 128.63 |
| | $ | 109.08 |
| | $ | 103.70 |
| | $ | 74.25 |
| | $ | 101.97 |
| $ | 100.00 |
| | $ | 84.81 |
| | $ | 80.63 |
| | $ | 57.73 |
| | $ | 79.27 |
| | $ | 101.65 |
|
| Standard & Poor's 500 | 100.00 |
| | 113.69 |
| | 115.27 |
| | 129.06 |
| | 157.23 |
| | 150.34 |
| 100.00 |
| | 101.39 |
| | 113.52 |
| | 138.30 |
| | 132.24 |
| | 173.88 |
|
| Restaurant Index | 100.00 |
| | 112.21 |
| | 135.82 |
| | 145.60 |
| | 180.63 |
| | 200.74 |
| 100.00 |
| | 121.05 |
| | 129.76 |
| | 160.98 |
| | 178.90 |
| | 225.11 |
|
The foregoing performance graph is being furnished as part of this report solely in accordance with the requirement under Rule 14a-3(b)(9) to furnish our stockholders with such information, and therefore, shall not be deemed to be filed or incorporated by reference into any filings by the Company under the Securities Act of 1933, as amended (the “Securities Act”) or the Exchange Act.
Item 6. Selected Financial Data.
The following selected consolidated financial data should be read in conjunction with the consolidated financial statements and notes thereto and “Management's Discussion and Analysis of Financial Condition and Results of Operations” appearing elsewhere in this Annual Report on Form 10-K. The consolidated statement of operations information and the consolidated balance sheet data for the years ended and as of December 31, 2019, December 31, 2018, December 31, 2017, December 31, 2016 December 31, 2015 and December 31, 20142015 are derived from our audited consolidated financial statements.
| | | | Fiscal Year Ended December 31, | Fiscal Year Ended December 31, |
| | 2018 | | 2017 | | 2016 | | 2015 | | 2014 | 2019 | | 2018 | | 2017 | | 2016 | | 2015 |
| | | | (as adjusted) (a) | | | | | | | | | (as adjusted) (a) | | |
| Revenues: | (In millions, except per share amounts and restaurant data) | (In millions, except per share amounts and restaurant data) |
| Royalties, franchise fees and other franchise revenues | $ | 375.6 |
| | $ | 360.2 |
| | $ | 377.9 |
| | $ | 386.6 |
| | $ | 365.8 |
| $ | 368.2 |
| | $ | 375.6 |
| | $ | 360.2 |
| | $ | 377.9 |
| | $ | 386.6 |
|
| Advertising revenue | 268.3 |
| | 234.2 |
| | 260.1 |
| | 108.1 |
| | 90.3 |
| 283.0 |
| | 268.3 |
| | 234.2 |
| | 260.1 |
| | 108.1 |
|
| Total franchise revenues | 643.9 |
| | 594.4 |
| | 638.0 |
| | 494.7 |
| | 456.1 |
| 651.2 |
| | 643.9 |
| | 594.4 |
| | 638.0 |
| | 494.7 |
|
| Rental revenues | 121.9 |
| | 121.4 |
| | 123.0 |
| | 127.7 |
| | 122.9 |
| |
| Financing revenues | 8.0 |
| | 8.4 |
| | 9.2 |
| | 10.8 |
| | 13.5 |
| |
Company restaurant sales (c) | 7.1 |
| | 7.5 |
| | 17.4 |
| | 47.9 |
| | 62.5 |
| |
| Rental and financing revenues | | 127.8 |
| | 129.9 |
| | 129.8 |
| | 132.2 |
| | 138.5 |
|
Company restaurant sales (b) | | 131.2 |
| | 7.1 |
| | 7.5 |
| | 17.4 |
| | 47.9 |
|
| Total revenues | 780.9 |
| | 731.7 |
| | 787.6 |
| | 681.1 |
| | 655.0 |
| 910.2 |
| | 780.9 |
| | 731.7 |
| | 787.6 |
| | 681.1 |
|
| Cost of revenues: | | | | | | | | | | | | | | | | | | |
| Advertising expenses | 269.6 |
| | 243.1 |
| | 260.1 |
| | 108.1 |
| | 90.3 |
| 281.8 |
| | 269.6 |
| | 243.1 |
| | 260.1 |
| | 108.1 |
|
| Other franchise expenses | 61.0 |
| | 50.9 |
| | 33.4 |
| | 30.9 |
| | 31.5 |
| 31.0 |
| | 61.0 |
| | 50.9 |
| | 33.4 |
| | 30.9 |
|
| Total franchise expenses | 330.6 |
| | 294.0 |
| | 293.5 |
| | 139.0 |
| | 121.8 |
| 312.8 |
| | 330.6 |
| | 294.0 |
| | 293.5 |
| | 139.0 |
|
| Rental revenues | 90.7 |
| | 90.6 |
| | 91.5 |
| | 94.6 |
| | 94.7 |
| |
| Financing revenues | 0.6 |
| | 0.6 |
| | 0.2 |
| | 0.5 |
| | 0.8 |
| |
Company restaurant expenses (c) | 5.9 |
| | 7.8 |
| | 18.2 |
| | 48.0 |
| | 62.6 |
| |
| Rental and financing expenses | | 91.3 |
| | 91.4 |
| | 91.2 |
| | 91.7 |
| | 95.1 |
|
Company restaurant expenses (b) | | 123.3 |
| | 5.9 |
| | 7.8 |
| | 18.2 |
| | 48.0 |
|
| Total cost of revenues | 427.8 |
| | 393.0 |
| | 403.4 |
| | 282.1 |
| | 279.9 |
| 527.4 |
| | 427.8 |
| | 393.0 |
| | 403.4 |
| | 282.1 |
|
| Gross profit | 353.1 |
| | 338.7 |
| | 384.1 |
| | 399.0 |
| | 375.1 |
| 382.8 |
| | 353.1 |
| | 338.7 |
| | 384.1 |
| | 399.0 |
|
| General and administrative expenses | 166.7 |
| | 165.7 |
| | 148.9 |
| | 155.4 |
| | 145.9 |
| 162.8 |
| | 166.7 |
| | 165.7 |
| | 148.9 |
| | 155.4 |
|
| Interest expense | 61.7 |
| | 62.0 |
| | 61.5 |
| | 63.3 |
| | 96.6 |
| 60.4 |
| | 61.7 |
| | 62.0 |
| | 61.5 |
| | 63.3 |
|
| Impairment of goodwill and intangible assets | — |
| | 531.6 |
| | — |
| | — |
| | — |
| — |
| | — |
| | 531.6 |
| | — |
| | — |
|
Other expense, net (b) | 14.1 |
| | 7.7 |
| | 15.9 |
| | 11.7 |
| | 81.0 |
| |
| Income before income taxes | 110.6 |
| | (428.3 | ) | | 157.8 |
| | 168.6 |
| | 51.6 |
| |
Other expense, net (c) | | 21.1 |
| | 14.1 |
| | 7.7 |
| | 15.9 |
| | 11.7 |
|
| Income (loss) before income taxes | | 138.4 |
| | 110.6 |
| | (428.3 | ) | | 157.8 |
| | 168.6 |
|
| Income tax (provision) benefit | (30.3 | ) | | 85.6 |
| | (56.8 | ) | | (63.7 | ) | | (15.1 | ) | (34.1 | ) | | (30.2 | ) | | 85.6 |
| | (56.8 | ) | | (63.7 | ) |
| Net income (loss) | 80.4 |
| | (342.8 | ) | | 101.0 |
| | 104.9 |
| | 36.5 |
| 104.3 |
| | 80.4 |
| | (342.8 | ) | | 101.0 |
| | 104.9 |
|
| Net income (loss) available to common stockholders | $ | 77.6 |
| | $ | (336.0 | ) | | $ | 99.6 |
| | $ | 103.5 |
| | $ | 35.9 |
| $ | 100.8 |
| | $ | 77.6 |
| | $ | (336.0 | ) | | $ | 99.6 |
| | $ | 103.5 |
|
| Net income (loss) available to common stockholders per share: | | | | | | | | | | | | | | | | | | |
| Basic | $ | 4.43 |
| | $ | (18.96 | ) | | $ | 5.52 |
| | $ | 5.55 |
| | $ | 1.92 |
| $ | 5.95 |
| | $ | 4.43 |
| | $ | (18.96 | ) | | $ | 5.52 |
| | $ | 5.55 |
|
| Diluted | $ | 4.37 |
| | $ | (18.96 | ) | | $ | 5.49 |
| | $ | 5.52 |
| | $ | 1.90 |
| $ | 5.85 |
| | $ | 4.37 |
| | $ | (18.96 | ) | | $ | 5.49 |
| | $ | 5.52 |
|
| Weighted average shares outstanding: | | | | | | | | | | | | | | | | | | |
| Basic | 17.5 |
| | 17.7 |
| | 18.0 |
| | 18.6 |
| | 18.8 |
| 16.9 |
| | 17.5 |
| | 17.7 |
| | 18.0 |
| | 18.6 |
|
| Diluted | 17.8 |
| | 17.7 |
| | 18.1 |
| | 18.8 |
| | 19.0 |
| 17.2 |
| | 17.8 |
| | 17.7 |
| | 18.1 |
| | 18.8 |
|
| Dividends declared per common share | $ | 2.52 |
| | $ | 3.88 |
| | $ | 3.73 |
| | $ | 3.545 |
| | $ | 3.125 |
| $ | 2.76 |
| | $ | 2.52 |
| | $ | 3.88 |
| | $ | 3.73 |
| | $ | 3.545 |
|
| Dividends paid per common share | $ | 2.86 |
| | $ | 3.88 |
| | $ | 3.68 |
| | $ | 3.50 |
| | $ | 2.25 |
| $ | 2.70 |
| | $ | 2.86 |
| | $ | 3.88 |
| | $ | 3.68 |
| | $ | 3.50 |
|
| Balance Sheet Data (end of year): | | | | | | | | | | | | | | | | | | |
| Cash and cash equivalents | $ | 137.2 |
| | $ | 117.0 |
| | $ | 140.5 |
| | $ | 144.8 |
| | $ | 104.0 |
| $ | 116.0 |
| | $ | 137.2 |
| | $ | 117.0 |
| | $ | 140.5 |
| | $ | 144.8 |
|
| Property and equipment, net | 240.3 |
| | 199.6 |
| | 219.6 |
| | 219.6 |
| | 241.2 |
| 216.4 |
| | 240.3 |
| | 199.6 |
| | 205.1 |
| | 219.6 |
|
| Total assets | 1,774.7 |
| | 1,735.6 |
| | 2,331.9 |
| | 2,331.9 |
| | 2,393.7 |
| |
Total assets (d) | | 2,049.5 |
| | 1,774.7 |
| | 1,735.6 |
| | 2,278.6 |
| | 2,331.9 |
|
| Long-term debt, less current maturities | 1,274.1 |
| | 1,269.8 |
| | 1,282.7 |
| | 1,279.5 |
| | 1,276.5 |
| 1,288.2 |
| | 1,274.1 |
| | 1,269.8 |
| | 1,282.7 |
| | 1,279.5 |
|
| Capital lease and financing obligations, less current maturities | 126.2 |
| | 101.1 |
| | 114.2 |
| | 127.2 |
| | 140.6 |
| |
Operating lease, finance lease, financing obligations, less current maturities (d) | | 474.1 |
| | 126.2 |
| | 101.1 |
| | 114.2 |
| | 127.2 |
|
| Stockholders' (deficit) equity | (202.3 | ) | | (215.5 | ) | | 252.8 |
| | 267.2 |
| | 279.1 |
| (241.8 | ) | | (202.3 | ) | | (215.5 | ) | | 252.8 |
| | 267.2 |
|
| Other Financial Data: | | | | | | | | | | | | | | | | | | |
| Cash flows provided by operating activities | $ | 140.3 |
| | $ | 65.7 |
| | $ | 118.1 |
| | $ | 135.5 |
| | $ | 118.5 |
| $ | 155.2 |
| | $ | 140.3 |
| | $ | 65.7 |
| | $ | 118.1 |
| | $ | 135.5 |
|
| Capital expenditures | 14.3 |
| | 13.4 |
| | 5.6 |
| | 6.6 |
| | 5.9 |
| 19.4 |
| | 14.3 |
| | 13.4 |
| | 5.6 |
| | 6.6 |
|
| Domestic system-wide same-restaurant sales percentage change: | | | | | | | | | | | | | | | | | | |
| Applebee's | 5.0 | % | | (5.3 | )% | | (5.0 | )% | | 0.2 | % | | 1.1 | % | (0.7 | )% | | 5.0 | % | | (5.3 | )% | | (5.0 | )% | | 0.2 | % |
| IHOP | 1.5 | % | | (1.9 | )% | | (0.1 | )% | | 4.5 | % | | 3.9 | % | 1.1 | % | | 1.5 | % | | (1.9 | )% | | (0.1 | )% | | 4.5 | % |
| Total restaurants (end of year): | | | | | | | | | | | | | | | | | | |
| Applebee's | 1,837 |
| | 1,936 |
| | 2,016 |
| | 2,033 |
| | 2,017 |
| 1,787 |
| | 1,837 |
| | 1,936 |
| | 2,016 |
| | 2,033 |
|
| IHOP | 1,831 |
| | 1,786 |
| | 1,733 |
| | 1,683 |
| | 1,650 |
| 1,841 |
| | 1,831 |
| | 1,786 |
| | 1,733 |
| | 1,683 |
|
| Total restaurants | 3,668 |
| | 3,722 |
| | 3,749 |
| | 3,716 |
| | 3,667 |
| 3,628 |
| | 3,668 |
| | 3,722 |
| | 3,749 |
| | 3,716 |
|
| |
| (a) | We adopted a new revenue recognition standard on January 1, 2018 that was applied retrospectively to 2017 and 2016 (See Note 2 of Notes to Consolidated Financial Statements);2016; financial information for years 2015 and 2014 has not been adjusted to reflect the new standard. |
| |
| (b) | Includes amortization of intangible assets, closure and other impairment charges and gain/loss on disposition of assets in each year as well as $2.5 million of debt refinancing costs in 2018 and a $64.9 million loss on extinguishment of debt in 2014. |
| |
(c) | We acquired 69 Applebee's franchise restaurants in December 2018. We refranchised nine IHOP company-operated restaurants in June 2017 and 23 Applebee's company-operated restaurants in July 2015. |
| |
| (c) | Includes amortization of intangible assets, closure and other impairment charges and gain/loss on disposition of assets in each year as well as loss on extinguishment of debt of $8.3 million in 2019 and $2.5 million of debt refinancing costs in 2018. |
| |
| (d) | We adopted a new lease accounting standard on January 1, 2019 that resulted in balance sheet recognition of operating lease liabilities and right-of-use assets (See Note 2 of Notes to Consolidated Financial Statements). Financial information for years before 2019 has not been adjusted to reflect the new standard. |
Item 7. Management's Discussion and Analysis of Financial Condition and Results of Operations.
Overview
The following discussion provides an analysis of our results of operations and reasons for material changes for 2019 as compared to 2018 and should be read together with the financial statements included in this Annual Report on Form 10-K. For a detailed discussion of year-to-year comparisons between fiscal 2018 and fiscal 2017, please refer to “Management's Discussion and Analysis of Financial Condition and Results of Operations” contained in Part II, Item 7 of our Annual Report on Form 10-K for the fiscal year ended December 31, 2018, filed with the SEC on February 21, 2019.
Cautionary Statement Regarding Forward-Looking Statements
Statements contained in this report may constitute forward-looking statements within the meaning of the Private Securities Litigation Reform Act of 1995. These statements involve known and unknown risks, uncertainties and other factors, which may cause actual results to be materially different from those expressed or implied in such statements. You can identify these forward-looking statements by words such as “may,” “will,” “should,” “could,” “expect,” “anticipate,” “believe,” “estimate,” “intend,” “plan,” “goal” and other similar expressions. You should consider our forward-looking statements in light of the risks discussed under the heading “Risk Factors,” as well as our consolidated financial statements, related notes, and the other financial information appearing elsewhere in this report and our other filings with the United States Securities and Exchange Commission. The forward-looking statements contained in this report are made as of the date hereof and the Company assumes no obligation to update or supplement any forward-looking statements.
You should read the following Management's Discussion and Analysis of Financial Condition and Results of Operations in conjunction with the consolidated financial statements and the related notes that appear elsewhere in this report.
General
The first International House of Pancakes restaurant opened in 1958 in Toluca Lake, California. Shortly thereafter, the Company's predecessor began developing and franchising additional restaurants. The Company was incorporated under the laws of the State of Delaware in 1976 with the name IHOP Corp. In November 2007, the Company completed the acquisition of Applebee's International, Inc., which became a wholly-owned subsidiary of the Company. Effective June 2, 2008, the name of the Company was changed to DineEquity, Inc. and on February 20, 2018, the name of the Company was changed to Dine Brands Global, Inc.SM (“Dine Brands Global,” “we” or “our”). Through various subsidiaries (see Exhibit 21, Subsidiaries of Dine Brands Global, Inc.), we own, franchise and operate the Applebee's Neighborhood Grill + Bar® (“Applebee's”) concept in the bar and grill segment within the casual dining category of the restaurant industry and we own and franchise the International House of Pancakes® (“IHOP”) concept in the family dining category of the restaurant industry. References herein to Applebee's® and IHOP® restaurants are to these two concepts, whether operated by franchisees, area licensees or us.
Domestically, Applebee's and IHOP franchise restaurants are in all 50 states and two IHOP franchise restaurants are in the District of Columbia. Internationally, IHOP restaurants are in three United States territories and 12 countries outside of the United States;13 countries; Applebee's restaurants are in two United States territories and 13 countries outside of the United States.12 countries. With nearly 3,700over 3,600 restaurants combined, we believe we are the largest full-service restaurant company in the world. The June 18, 201817, 2019 issue of Nation's Restaurant News reported that IHOP and Applebee's werewas the largest restaurant systemssystem in the family dining category and Applebee's was the second largest restaurant system in the casual dining categories,category, respectively, in terms of United States system-wide sales during 2017. This marks the eleventh consecutive year our two brands have achieved the number one ranking in Nation's Restaurant News.2018.
We have a 52/53 week fiscal year ending on the Sunday nearest to December 31 of each year. For convenience, in this annual report on Form 10-K, we refer to all fiscal years as ending on December 31 and all interim fiscal quarters as ending on March 31, June 30 and September 30 of the respective fiscal year. There were 52 calendar weeks in our 2019, 2018 2017 and 20162017 fiscal years that ended on December 29, 2019, December 30, 2018 and December 31, 2017, respectively. Our 2020 fiscal year will contain 53 calendar weeks and will end on January 1, 2017, respectively.3, 2021.
Executive Summary of 20182019 Results
OverviewHighlights
| |
| • | We reported net income of$104.3 million, or $5.85 per diluted share, in 2019, compared to net income of $80.4 million, or $4.37 per diluted share, in 2018; |
We reported net incomerefinanced $1.3 billion of$80.4 4.277% fixed rate senior secured notes, effectively due in 2021, with two tranches of new notes: $700 million or $4.37 per diluted shareof 4.194% fixed rate senior secured notes, effectively due in 2018, compared to a loss2024 and $600 million of $342.7 million generated4.723% fixed rate senior secured notes, effectively due in 2017 that was primarily due to impairment charges taken in the third quarter of 2017 related to Applebee's goodwill and intangible assets;
Our gross profit grew $14.4 million, primarily due to an increase in gross profit from franchise operations;
Applebee's domestic same-restaurant sales grew 5.0% in 2018, the largest annual increase since our acquisition of the brand in 2007;
IHOP's reported system-wide sales grew 3.9% in 2018 driven by an increase in franchise restaurants due to development and a 1.5% increase in domestic same-restaurant sales;
The combined system-wide sales of both brands grew to nearly $7.6 billion, a 3.0% increase compared to 2017.2026;
We generated cash from operating activities of $140.3$155.2 million and adjusted free cash flow (cash provided by operating activities, plus receipts from notes and equipment contract receivables, less additions to property and equipment) of $140.9$148.8 million in 2018;2019;
We returned nearly $85over $156 million to our stockholders, comprised of $51.1 million in cash dividends and $33.6$109.7 million in the form of stock repurchases;repurchases and $46.9 million in cash dividends, with cash dividends reflecting a 10% increase in our quarterly dividend to $0.69 per share, effective with the dividend declared in the first quarter 2019. The 1.3 million shares repurchased in 2019 represented nearly 8% of total shares outstanding at the end of 2018.
We signed the largest multi-unit development agreement in IHOP's history, calling for the development, with TravelCenters of America, of nearly 100 IHOP franchisees opened 71 new restaurants worldwide, with net development of 45 restaurants. Applebee's franchisees closed 106 restaurants worldwide, with a net reduction of 99 restaurants. Taken together,over the total number of our restaurants declined by less than 1% from last year's total;next five years; and
IHOP franchisees remodeled 270 domestic restaurants in 2018 under our new Rise ‘N’ Shine design. A total of 890 restaurants have been remodeled since the Rise ‘N’ Shine design was announced in late 2015.
| |
| • | IHOP franchisees remodeled 208 domestic restaurants in 2019 under our new Rise ‘N’ Shine design. Over 1,100 IHOP restaurants have been remodeled since the Rise ‘N’ Shine design was announced in late 2015. |
Key Performance Indicators
An overview of our key performance indicators for the year ended December 31, 20182019 is as follows:
|
| | | | | |
| | Applebee's | | IHOP |
| Sales percentage increase | 2.3 | % | | 3.9 | % |
| % increase in domestic same-restaurant sales | 5.0 | % | | 1.5 | % |
Net franchise restaurant (reduction) development (1) | (99 | ) | | 45 |
|
| Net (decrease) increase in effective franchise restaurants | (87 | ) | | 55 |
|
|
| | | | | |
| | Applebee's | | IHOP |
| System-wide sales percentage (decrease) increase | (3.0 | )% | | 2.2 | % |
| Domestic system-wide same-restaurant sales percentage (decrease) increase | (0.7 | )% | | 1.1 | % |
Net franchise restaurant (reduction) development (1) | (50 | ) | | 10 |
|
Net (decrease) increase in total effective restaurants (2) | (72 | ) | | 25 |
|
(1)Franchise and area license restaurant openings, net of closings, during the year ended December 31, 2019.
(2)Change in the weighted average number of franchise, area license and company-operated restaurants open during the year ended December 31, 2019, compared to the weighted average number of those open during the same period of 2018.
|
| | | | | | | | | | | | | |
Financial Summary
| | 2018 | | Favorable
(Unfavorable) Variance | | 2017 | |
| | | | | | (as adjusted) | |
| | | (In millions, except per share amounts) | |
| Income (loss) before income taxes | | $ | 110.6 |
| | $ | 538.9 |
| | $ | (428.3 | ) | |
| Income tax (provision) benefit | | (30.2 | ) | | (115.8 | ) | | 85.6 |
| |
| Net income (loss) | | $ | 80.4 |
| | $ | 423.1 |
| | $ | (342.7 | ) | |
| | | | | Variance | | | |
| Effective tax rate | | 27.4 | % | | (7.4 | )% | | 20.0 | % | |
| Net income (loss) per diluted share | | $ | 4.37 |
| | $ | 23.33 |
| | $ | (18.96 | ) | |
| Weighted average diluted shares outstanding | | 17.8 |
| | (0.1 | ) | | 17.7 |
| |
|
| | | | | | | | | | | | |
Financial Summary
| | | | Favorable
(Unfavorable) Variance | | |
| | | 2019 | | | 2018 |
| | | (In millions, except per share amounts) |
| Income before income taxes | | $ | 138.4 |
| | $ | 27.8 |
| | $ | 110.6 |
|
| Income tax provision | | (34.1 | ) | | (3.9 | ) | | (30.2 | ) |
| Net income | | $ | 104.3 |
| | $ | 23.9 |
| | $ | 80.4 |
|
| | | | | Variance | | |
| Effective tax rate | | 24.6 | % | | 2.8 | % | | 27.4 | % |
| Net income per diluted share | | $ | 5.85 |
| | $ | 1.48 |
| | $ | 4.37 |
|
| Weighted average diluted shares outstanding | | 17.2 |
| | (0.6 | ) | | 17.8 |
|
Income before income taxes for the year ended December 31, 20182019 increased $538.9$27.8 million compared to the year ended December 31, 2017.2018. The primary reasons for the increase are summarized as follows:
|
| | | |
| | (In millions) |
| Impairment of goodwill and intangible assets taken in 2017 that did not recur | $ | 531.6 |
|
| Increase in gross profit: | |
| Franchise operations | 12.9 |
|
| All other operations | 1.5 |
|
| Total gross profit increase | 14.4 |
|
| Change in General and Administrative (“G&A”) expenses: | |
| Decrease due to executive separation costs in 2017 that did not recur | 8.8 |
|
| Increase in all other G&A, net | (9.8 | ) |
| Total G&A increase | (1.0 | ) |
| Other expense/income items, net | (6.1 | ) |
| Increase in income before income taxes | $ | 538.9 |
|
|
| | | |
| | (In millions) |
| Increase (decrease) in gross profit: | |
| Franchise operations | $ | 25.1 |
|
| Company operations | 6.8 |
|
| All other operations | (2.2 | ) |
| Total gross profit increase | 29.7 |
|
| Decrease in General and Administrative (“G&A”) expenses | 3.9 |
|
| Loss on extinguishment of debt (incurred in 2019) | (8.3 | ) |
| Decrease in debt refinancing costs (incurred in 2018) | 2.5 |
|
| All other | 0.0 |
|
| Increase in income before income taxes | $ | 27.8 |
|
Gross profit from franchise operations increased primarily because franchisor contributions to the Applebee’s National Advertising Fund (the “Applebee's NAF”) of $30.0 million we made during the year ended December 31, 2018 did not recur in 2019, and because of increases in the number of IHOP effective restaurants due to development and in IHOP domestic same-restaurant sales. These favorable items were partially offset by decreases in the number of Applebee's effective restaurants and
On January 1, 2018, we adopted
in Applebee's domestic same-restaurant sales. Gross profit from our operation of 69 Applebee's restaurants increased $6.8 million, of which $1.9 million was incremental to consolidated gross profit as the guidanceincreased gross profit from operating the restaurants was economically offset by foregone royalty revenue of Accounting Standards Codification 606 - Revenue from Contracts with Customers (“ASC 606”) using$4.9 million that would have been recognized in franchise operations had the full retrospective method. Accordingly, previously reported financial information hasrestaurants been adjusted to reflect the application of ASC 606 to the comparative 2017 and 2016 periods presented. The retrospective adoption of ASC 606 increased our net lossfranchisee-operated.
Our effective tax rate for the year ended December 31, 2017 by $12.2 million (approximately $0.68 per diluted share) and increased our net income2019 was lower than the effective tax rate for the year ended December 31, 2016 by $3.0 million (approximately $0.16 per diluted share).2018, primarily due to (i) general business credits recognized in 2019 that lowered the effective rate for 2019 and (ii) an increase to the 2018 tax provision related to adjustments resulting from Internal Revenue Service (“IRS”) audits which increased our effective tax rate for 2018. See Note 216 - Income Taxes, of the Notes to the Consolidated Financial Statements included in this report, for additional discussiona reconciliation between the federal statutory rate and our effective rate.
Our net income per diluted share for the year ended December 31, 2019 increased $1.48, of which approximately $0.18 was due to a decrease in weighted average shares outstanding for the period. The decrease in weighted shares outstanding was primarily due to shares repurchased pursuant to stock repurchase programs. See “Liquidity and Capital Resources - Share Repurchases” for details on our adoption of ASC 606.share repurchase programs.
Key Performance Indicators
In evaluating the performance of each restaurant concept, we consider the key performance indicators to be the system-wide sales percentage change, the percentage change in domestic system-wide same-restaurant sales (“domestic same-restaurant sales”), net franchise restaurant development and the change in total effective franchise restaurants. Changes in both domestic same-restaurant sales and in the number of Applebee's and IHOP franchise restaurants will impact our system-wide retail sales that drive franchise royalty revenues. Restaurant development also impacts franchise revenues in the form of initial franchise fees and, in the case of IHOP restaurants, sales of proprietary pancake and waffle dry mix.
System-wide Sales and Domestic Same-Restaurant Sales
The following table sets forth for each of the past three years the number of “Effective Restaurants”Effective Restaurants in the Applebee’s and IHOP systems and information regarding the percentage change in sales at those restaurants compared to the same periods in the prior two years. Sales at restaurants that are owned by franchisees and area licensees are not attributable to the Company and, as such, the percentage changes in sales presented below are based on non-GAAP sales data. However, we believe that presentation of this information is useful in analyzing our revenues because franchisees and area licensees pay us royalties and advertising fees that are generally based on a percentage of their sales, and, where applicable, rental payments under leases that partially may be based on a percentage of their sales. Management also uses this information to make decisions about future plans for the development of additional restaurants as well as evaluation of current operations.
| | | Applebee's Restaurant Data | Year Ended December 31, | | | | | |
| | | Year Ended December 31, |
Global Effective Restaurants:(a) | 2018 | | 2017 | | 2016 | 2019 | | 2018 | | 2017 |
| Franchise | 1,883 |
| | 1,970 |
| | 2,027 |
| 1,745 |
| | 1,883 |
| | 1,970 |
|
| Company | 3 |
| | — |
| | — |
| 69 |
| | 3 |
| | — |
|
| Total | 1,886 |
| | 1,970 |
| | 2,027 |
| 1,814 |
| | 1,886 |
| | 1,970 |
|
System-wide:(b) | | | | | | | | | | |
Domestic sales percentage change(c) | 2.3 | % | | (6.8 | )% | | (6.8 | )% | (3.0 | )% | | 2.3 | % | | (6.8 | )% |
Domestic same-restaurant sales change(d) | 5.0 | % | | (5.3 | )% | | (5.0 | )% | |
Domestic same-restaurant sales percentage change(d) | | (0.7 | )% | | 5.0 | % | | (5.3 | )% |
Franchise:(b) | | | | | | | | | | |
Domestic sales percentage change(c) | 2.1 | % | | (6.8 | )% | | (6.2 | )% | |
Domestic same-restaurant sales change(d) | 4.9 | % | | (5.3 | )% | | (5.0 | )% | |
Domestic sales percentage change(c) (e) | | (5.9 | )% | | 2.1 | % | | (6.8 | )% |
Domestic same-restaurant sales percentage change(d) | | (0.7 | )% | | 4.9 | % | | (5.3 | )% |
| Domestic average weekly unit sales (in thousands) | $ | 46.7 |
| | $ | 43.6 |
| | $ | 45.3 |
| $ | 47.3 |
| | $ | 46.7 |
| | $ | 43.6 |
|
| | | IHOP Restaurant Data | | | | | | | | | | |
| | | Year Ended December 31, |
| | | 2019 | | 2018 | | 2017 |
Global Effective Restaurants:(a) | | | | | | | | | | |
| Franchise | 1,633 |
| | 1,576 |
| | 1,517 |
| 1,663 |
| | 1,633 |
| | 1,576 |
|
| Area license | 162 |
| | 164 |
| | 166 |
| 157 |
| | 162 |
| | 164 |
|
| Company | — |
| | 5 |
| | 10 |
| — |
| | — |
| | 5 |
|
| Total | 1,795 |
| | 1,745 |
| | 1,693 |
| 1,820 |
| | 1,795 |
| | 1,745 |
|
System-wide:(b) | | | | | | | | | | |
Sales percentage change(c) | 3.9 | % | | 0.7 | % | | (0.3 | )% | 2.2 | % | | 3.9 | % | | 0.7 | % |
| Domestic same-restaurant sales change(d) | 1.5 | % | | (1.9 | )% | | (0.1 | )% | |
Domestic same-restaurant sales percentage change(d) (f) | | 1.1 | % | | 1.5 | % | | (1.9 | )% |
Franchise:(b) | | | | | | | | | | |
Sales percentage change(c) | 4.4 | % | | 1.2 | % | | (0.3 | )% | 2.2 | % | | 4.4 | % | | 1.2 | % |
| Domestic same-restaurant sales change(d) | 1.5 | % | | (1.9 | )% | | (0.1 | )% | |
Domestic same-restaurant sales percentage change(d) | | 1.0 | % | | 1.5 | % | | (1.9 | )% |
| Average weekly unit sales (in thousands) | $ | 36.6 |
| | $ | 36.3 |
| | $ | 37.3 |
| $ | 36.7 |
| | $ | 36.6 |
| | $ | 36.3 |
|
Area License:(b) | | | | | | | | | | |
IHOP sales percentage change(c) | 0.5 | % | | (0.7 | )% | | 0.6 | % | 2.7 | % | | 0.5 | % | | (0.7 | )% |
| |
(a) | “Global Effective Restaurants” are the weighted average number of restaurants open in a given fiscal period, adjusted to account for restaurants open for only a portion of the period. Information is presented for all Effective Restaurants in the Applebee’s and IHOP systems, domestic and international, which includes restaurants owned by franchisees and area licensees as well as those owned by the Company. |
| |
(b) | “System-wide sales” are retail sales at Applebee’s restaurants operated by franchisees and IHOP restaurants operated by franchisees and area licensees, as reported to the Company, in addition to retail sales at company-operated restaurants. Sales at restaurants that are owned by franchisees and area licensees are not attributable to the Company. An increase or decrease in franchisees' reported sales will result in a corresponding increase or decrease in our royalty revenue. Unaudited reported sales for Applebee's domestic franchise restaurants, IHOP franchise restaurants and IHOP area license restaurants for the years ended December 31, 2019, December 31, 2018 and December 31, 2017 and December 31, 2016 and salesales at company-operated restaurants were as follows: |
| | | | Year Ended December 31, | Year Ended December 31, |
| Reported sales | 2018 | | 2017 | | 2016 | 2019 | | 2018 | | 2017 |
| | (In millions) | (In millions) |
| Applebee's domestic franchise restaurant sales | $ | 4,204.1 |
| | $ | 4,117.1 |
| | $ | 4,418.6 |
| $ | 3,954.3 |
| | $ | 4,204.1 |
| | $ | 4,117.1 |
|
| Applebee's company-operated restaurants | 7.1 |
| | — |
| | — |
| 131.2 |
| | 7.1 |
| | — |
|
| IHOP franchise restaurant sales | 3,106.7 |
| | 2,974.6 |
| | 2,939.9 |
| 3,174.2 |
| | 3,106.7 |
| | 2,974.6 |
|
| IHOP area license restaurant sales | 282.0 |
| | 280.6 |
| | 282.5 |
| 289.5 |
| | 282.0 |
| | 280.6 |
|
| IHOP company-operated restaurants | — |
| | 7.5 |
| | 17.4 |
| — |
| | — |
| | 7.5 |
|
| Total | $ | 7,599.9 |
| | $ | 7,379.8 |
| | $ | 7,658.4 |
| $ | 7,549.2 |
| | $ | 7,599.9 |
| | $ | 7,379.8 |
|
| |
(c) | “Sales percentage change” reflects, for each category of restaurants, the percentage change in sales in any given fiscal year compared to the prior fiscal year for all restaurants in that category. The sales percentage change for the year ended December 31, 2016 was impacted by a 53rd calendar week in fiscal year 2015. |
| |
(d) | “Domestic same-restaurant sales change” reflects the percentage change in sales in any given fiscal year, compared to the same weeks in the prior year, for domestic restaurants that have been operated throughout both fiscal years that are being compared and have been open for at least 18 months. Because of new unitrestaurant openings and restaurant closures, the domestic restaurants open throughout the fiscal years being compared may be different from year to year. Domestic same-restaurant sales percentage change does not include data on IHOP area license restaurants.restaurants for 2018 and 2017. |
| |
(e) | The franchise sales percentage change for 2019 was impacted by the acquisition of 69 franchise restaurants in December 2018 now reported as company-operated. |
| |
(f) | IHOP same-restaurant sales data includes area license restaurants beginning in 2019 |
Domestic Same-Restaurant Sales Trends
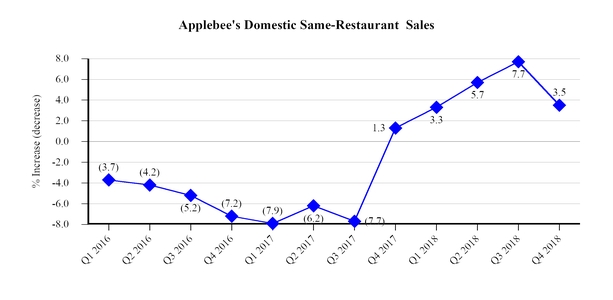
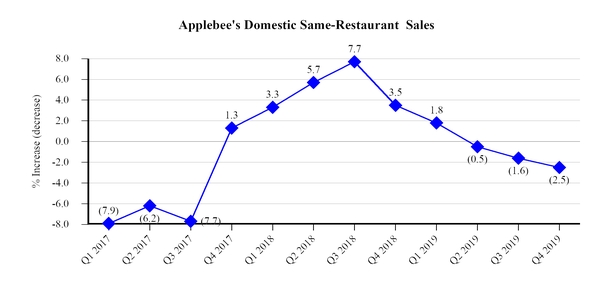
Applebee’s domestic same-restaurant sales increased 3.5%decreased 2.5% for the three months ended December 31, 20182019 from the same period in 2017, the fifth consecutive quarter of growth in same-restaurant sales.2018. The increasedecrease in the fourth quarter of 20182019 was primarily due to ana decrease in customer traffic that was slightly offset by a small increase in average customer check that was partially offset by a decrease in customer traffic. We believe the decrease in traffic during the fourth quarter was due in part to the comparison to a strong fourth quarter of 2017 during which we first introduced promotional initiatives that effectively increased customer traffic.check. Applebee's same-restaurant sales increasedecrease for the fourth quarter of 2018 exceeded2019 was larger than that of the casual dining segment of the restaurant industry. Based on data from Black Box Intelligence, a restaurant sales reporting firm (“Black Box”), the casual dining segment of the restaurant industry experienced an increasea small decrease in same-restaurant sales during the fourth quarter of 20182019 resulting from a decline in customer traffic that was substantially offset by an increase in average customer check. The primary reason for the performance differential between Applebee's and the casual dining segment during the fourth quarter of 2019 was the increase in average customer check, as Applebee's increase in average customer check was significantly smaller than that was offset by a decline in customer traffic.of the casual dining segment.
For the full year ended December 31, 2018,2019, Applebee’s domestic same-restaurant sales increased 5.0%, more than a 1,000 basis point improvement over a 5.3%decreased 0.7%. This decrease in 2017. The increase in domestic same-restaurant sales for the full year 2018 was primarily due to an increase in customer traffic, as well as an increase in average customer check. For the full year 2018,
Applebee's substantially outperformed the casual dining segment, primarily with respect to traffic. Based on data from Black Box, the casual dining segment's increase in same-restaurant sales was smaller than Applebee's and2019 was due to a declinedecrease in customer traffic that was partially offset by an increase in average customer check.
We believe Applebee's significantly outperformedsame-restaurant sales decrease for the year ended December 31, 2019 was larger than that of the casual dining segment of the restaurant industry. Based on data from Black Box, the casual dining segment experienced a slight decrease in same-restaurant sales due to a multi-faceted strategy we began implementingdecline in the latter half of 2017. The goal ofcustomer traffic that strategy was to redefine the Applebee's brand identity and culture and reconnect with our core customer base. Our recent marketing, culinary and operational initiatives appear to have resonated positively with our guests asessentially offset by an increase in average customer check. The primary reason for the performance differential between Applebee's and the casual dining segment for the year ended December 31, 2019 was the decrease in traffic, as Applebee's decrease in traffic was primarily responsiblelarger than that of the casual dining segment.
The change in Applebee's same-restaurant sales for both the three months and twelve months ended December 31, 2019 was impacted by comparisons against significant increases in same-restaurant sales and traffic for the respective periods of 2018. Applebee's 5.0% increase in domestic same-restaurant sales in 2018. Thefor the year ended December 31, 2018 was the largest increase since our 2007 acquisition of the brand, whereas the casual dining segment had a much smaller increase in 2018 against which its 2019 results were compared. In terms of a two-year comparison of results, Applebee's has outperformed the casual dining segment in both domestic same-restaurant sales and traffic.
Also, while our traffic declined overall, the decrease in on-premise dining was driven,mitigated by increases in part, by growth in our off-premise business (Carside-to-Go take-homedining (take-out and to a lesser degree, third-party delivery). Delivery was available at 771 Applebee's restaurants byDuring the endthree months ended December 31, 2019, off-premise sales increased 10.9% compared to the same period of 2018 asand comprised 12.8% of sales mix. For the twelve months ended December 31, 2019, off-premise sales increased 22.4% compared to 260 at the end2018 and comprised 12.6% of 2017.sales mix.
* Same-restaurant sales data includes area license restaurants beginning in 2019
IHOP’s domestic same-restaurant sales increased 3.0%1.1% for the three months ended December 31, 2018.2019, the eighth consecutive quarter with an increase. The increasegrowth in the fourth quarter of 20182019 was primarily due to an increase in average customer check driven by menu price increases as well as a favorable mix shift and a larger size of party.shift. The increase in customer check was partially offset by a slight decline in customer traffic. We believe the improvement in IHOP's domestic same-restaurant sales in the fourth quarter of 2018 compared to the third quarter of 2018 was due to a successful promotional tie-in with The Grinch movie along with growth in our “IHOP 'N Go” off-premise business. IHOP's performance for fourth quarter 2018 exceeded that of the family dining segment of the restaurant industry. Based on data from Black Box, during the fourth quarter of 2018,2019 the family dining segment had an increase in same-restaurant sales due to small increases in both traffic and average customer check. IHOP'san increase in average customer check that was substantially larger than thepartially offset by a decrease in customer traffic. IHOP's increase in domestic same-restaurant sales was smaller than that of the family dining segment.segment, primarily attributable to the change in customer traffic. IHOP's decrease in customer traffic was larger than that of the family dining segment, while the change in average check was essentially the same.
For the full year ended December 31, 2018,2019, IHOP's domestic same-restaurant sales increased 1.5%. The1.1% due to an increase in average customer check partially offset by a decline in customer traffic. Based on data from Black Box, for the full year 2018 wasof 2019, the family dining segment experienced an increase in same-restaurant sales due to an increase in average customer check partially offset by a decline in customer traffic. IHOP's performance for the full year of 2018 surpassedincrease in domestic same-restaurant sales was smaller than that of the family dining segment, ofprimarily attributable to the restaurant industry. Based on data from Black Box, for the full yearchange in customer traffic. IHOP's decrease in customer traffic was larger than that of 2018, the family dining segment, had a decrease in same-restaurant sales due primarily to a decrease in customer traffic,although that differential was partially offset by anbecause IHOP's increase in average check. IHOP's increase in averagecustomer check was larger than that of the family dining segment,segment.
We believe the increase in average customer check during both the three and IHOP'stwelve months ended December 31, 2019 was due in part to several successful promotions that drove larger orders, including a tie-in with the Addam's Family movie and the pairing of “All You Can Eat” pancakes with different menu items. Also, while our traffic declined overall, the decrease in trafficon-premise dining was smaller than that ofmitigated by increases in off-premise dining (take-out and delivery). During the family dining segment. The increase in domestic same-restaurantthree months ended December 31, 2019, off-premise sales was driven, in part, by growth in our off-premise business (IHOP ‘N’ Go take-home and,increased 22.3% compared to a lesser degree, third-party delivery). We tested delivery with third-party delivery service providers at several hundred locations in the first half of 2018. We expanded these partnerships system-wide in July and by the endsame period of 2018 delivery was available at over 1,000 IHOP restaurants.and comprised 9.9% of sales mix. For the year ended December 31, 2019, off-premise sales increased 32.3% compared to 2018 and comprised 9.5% of sales mix.
Net Franchise Restaurant Development
The total number of Applebee's restaurants open at December 31, 20182019 declined 5.1%2.7% from the number open at December 31, 20172018, as franchisees opened seventhree new restaurants but closed 10653 restaurants. Restaurant closures can occur for a variety of reasons that may differ for each restaurant and for each franchisee. Closures generally fall into one of two categories: restaurants in older locations whose retail, residential and traffic demographics have changed unfavorably over time, and restaurants with non-viable unit economics. The majority of Applebee's restaurant closures in 2018from 2017 to 2019 were due to these factors. We believe 2019 marks the completion of a three-year strategic initiative to close approximately 200 underperforming, low-volume domestic restaurants.
The total number of IHOP restaurants open at December 31, 2019 increased 0.5% from the number open at December 31, 2018, as IHOP franchisees and area licensees opened 7151 restaurants in 20182019 and closed 2641 restaurants, resulting in net development of 4510 restaurants. We believe the number of IHOP closures were primarily duein 2019 was unusually high, and that trend is not expected to natural attrition as the total number of closurescontinue in 2018 was only slightly higher than the average annual closure rate of 21 restaurants per year over the past five years.2020.
Internationally, franchisees of both brands opened 2215 restaurants and closed 21, for32, a net developmentdecrease of one restaurant. The17 international restaurants. This international development activity is included in the total activity for each brand cited above.
The following tables summarize Applebee's and IHOP restaurant development and franchising activity over the past three years: | | | | Year Ended December 31, | Year Ended December 31, |
| | 2018 | | 2017 | | 2016 | 2019 | | 2018 | | 2017 |
| Applebee's Restaurant Development Activity | | | | | | | | | | |
| | | | | | | | | | | |
| Summary - beginning of period: | | | | | | |
| Franchise | | 1,768 |
| | 1,936 |
| | 2,016 |
|
Company restaurants (a) | | 69 |
| | — |
| | — |
|
| Total Applebee's restaurants, beginning of period | 1,936 |
| | 2,016 |
| | 2,033 |
| 1,837 |
| | 1,936 |
| | 2,016 |
|
| Domestic | 1,782 |
| | 1,858 |
| | 1,878 |
| 1,693 |
| | 1,782 |
| | 1,858 |
|
| International | 154 |
| | 158 |
| | 155 |
| 144 |
| | 154 |
| | 158 |
|
| | | | | | | | | | | |
| Franchise restaurants opened: | | | | | | | | | | |
| Domestic | 2 |
| | 10 |
| | 19 |
| 1 |
| | 2 |
| | 10 |
|
| International | 5 |
| | 9 |
| | 10 |
| 2 |
| | 5 |
| | 9 |
|
| Total franchise restaurants opened | 7 |
| | 19 |
| | 29 |
| 3 |
| | 7 |
| | 19 |
|
| Franchise restaurants closed: | | | | | | | | | | |
| Domestic | (91 | ) | | (86 | ) | | (39 | ) | (29 | ) | | (91 | ) | | (86 | ) |
| International | (15 | ) | | (13 | ) | | (7 | ) | (24 | ) | | (15 | ) | | (13 | ) |
| Total franchise restaurants closed | (106 | ) | | (99 | ) | | (46 | ) | (53 | ) | | (106 | ) | | (99 | ) |
| Net franchise restaurant reduction | (99 | ) | | (80 | ) | | (17 | ) | (50 | ) | | (99 | ) | | (80 | ) |
| Franchise restaurants acquired by the Company | (69 | ) | | — |
| | — |
| — |
| | (69 | ) | | — |
|
| Net franchise restaurant decrease | (168 | ) | | (80 | ) | | (17 | ) | (50 | ) | | (168 | ) | | (80 | ) |
| | | | | | | | | | | |
| Summary - end of period: | | | | | | | | | | |
| Franchise | 1,768 |
| | 1,936 |
| | 2,016 |
| 1,718 |
| | 1,768 |
| | 1,936 |
|
Company restaurants (a) | 69 |
| | — |
| | — |
| 69 |
| | 69 |
| | — |
|
| Total Applebee's restaurants, end of period | 1,837 |
| | 1,936 |
| | 2,016 |
| 1,787 |
| | 1,837 |
| | 1,936 |
|
| Domestic | 1,693 |
| | 1,782 |
| | 1,858 |
| 1,665 |
| | 1,693 |
| | 1,782 |
|
| International | 144 |
| | 154 |
| | 158 |
| 122 |
| | 144 |
| | 154 |
|
| % Decrease in total Applebee's restaurants from prior year | (5.1 | )% | | (4.0 | )% | | (0.8 | )% | (2.7 | )% | | (5.1 | )% | | (4.0 | )% |
(a)In December 2018, the Company acquired 69 Applebee's restaurants from a former franchisee.
| | | | Year Ended December 31, | Year Ended December 31, |
| | 2018 | | 2017 | | 2016 | 2019 | | 2018 | | 2017 |
| IHOP Restaurant Development Activity | | | | | | | | | | |
| | | | | | | | | | | |
| Summary - beginning of period: | | | | | | | | | | |
| Franchise | 1,622 |
| | 1,556 |
| | 1,507 |
| 1,669 |
| | 1,622 |
| | 1,556 |
|
| Area license | 164 |
| | 167 |
| | 165 |
| 162 |
| | 164 |
| | 167 |
|
Company(a) | — |
| | 10 |
| | 11 |
| — |
| | — |
| | 10 |
|
| Total IHOP restaurants, beginning of period | 1,786 |
| | 1,733 |
| | 1,683 |
| 1,831 |
| | 1,786 |
| | 1,733 |
|
| Domestic | 1,671 |
| | 1,637 |
| | 1,604 |
| 1,705 |
| | 1,671 |
| | 1,637 |
|
| International | 115 |
| | 96 |
| | 79 |
| 126 |
| | 115 |
| | 96 |
|
| | | | | | | | | | | |
| Franchise/area license restaurants opened: | | | | | | | | | | |
| Domestic franchise | 51 |
| | 48 |
| | 43 |
| 33 |
| | 51 |
| | 48 |
|
| Domestic area license | 3 |
| | 1 |
| | 3 |
| 5 |
| | 3 |
| | 1 |
|
| International franchise | 17 |
| | 28 |
| | 20 |
| 13 |
| | 17 |
| | 28 |
|
| Total franchise/area license restaurants opened | 71 |
| | 77 |
| | 66 |
| 51 |
| | 71 |
| | 77 |
|
| Franchise/area license restaurants closed: | | | | | | | | | | |
| Domestic franchise | (15 | ) | | (11 | ) | | (12 | ) | (27 | ) | | (15 | ) | | (11 | ) |
| Domestic area license | (5 | ) | | (3 | ) | | (1 | ) | (6 | ) | | (5 | ) | | (3 | ) |
| International franchise | (6 | ) | | (8 | ) | | (3 | ) | (8 | ) | | (6 | ) | | (8 | ) |
| International area license | — |
| | (1 | ) | | — |
| — |
| | — |
| | (1 | ) |
| Total franchise/area license restaurants closed | (26 | ) | | (23 | ) | | (16 | ) | (41 | ) | | (26 | ) | | (23 | ) |
| Net franchise/area license restaurant development | 45 |
| | 54 |
| | 50 |
| 10 |
| | 45 |
| | 54 |
|
| Refranchised from Company restaurants | 1 |
| | 9 |
| | 1 |
| — |
| | 1 |
| | 9 |
|
| Franchise restaurants reacquired by the Company | (1 | ) | | — |
| | — |
| — |
| | (1 | ) | | — |
|
| Net franchise/area license restaurant additions | 45 |
| | 63 |
| | 51 |
| 10 |
| | 45 |
| | 63 |
|
| | | | | | | | | | | |
| Summary - end of period: | | | | | | | | | | |
| Franchise | 1,669 |
| | 1,622 |
| | 1,556 |
| 1,680 |
| | 1,669 |
| | 1,622 |
|
| Area license | 162 |
| | 164 |
| | 167 |
| 161 |
| | 162 |
| | 164 |
|
Company(a) | — |
| | — |
| | 10 |
| — |
| | — |
| | — |
|
| Total IHOP restaurants, end of period | 1,831 |
| | 1,786 |
| | 1,733 |
| 1,841 |
| | 1,831 |
| | 1,786 |
|
| Domestic | 1,705 |
| | 1,671 |
| | 1,637 |
| 1,710 |
| | 1,705 |
| | 1,671 |
|
| International | 126 |
| | 115 |
| | 96 |
| 131 |
| | 126 |
| | 115 |
|
| % Increase in total IHOP restaurants from prior year | 2.5 | % | | 3.1 | % | | 3.0 | % | 0.5 | % | | 2.5 | % | | 3.1 | % |
(a)During the twelve months ending December 31, 2017, nine company-operated restaurants were refranchised and one was permanently closed.
For the full year of 2019,2020, we expect development activity by Applebee's domestic franchisees to result in net closures of between 20zero and 30 restaurants globally,10 restaurants. For the majorityfull year of which are expected to be2020, we expect development activity by IHOP domestic closures. IHOP franchisees and area licensees are expected to developresult in net openings of between 3540 and 55 net new IHOP restaurants globally in 2019, the majority of which are expected to be domestic openings.50 restaurants.
The actual number of openings may differ from both our expectations and development commitments. Historically, the actual number of restaurants developed in a particular year has been less than the total number committed to be developed due to various factors, including economic conditions and franchisee noncompliance with development agreements. The timing of new restaurant openings also may be affected by various factors including weather-related and other construction delays, difficulties in obtaining timely regulatory approvals and the impact of currency fluctuations on our international franchisees. The actual number of closures also may differ from our expectations. Our franchisees are independent businesses and decisions to close restaurants can be impacted by numerous factors in addition to changes in Applebee's domestic same-restaurant sales that are outside of our control, including but not limited to, franchisees' agreements with landlords and lenders.
Consolidated Results of Operations - Fiscal 2019, 2018 2017 and 20162017
Significant Known Events, Trends or Uncertainties Impacting or Expected to Impact Comparisons of Reported or Future Results
Applebee’s experienced a decline in system-wide sales between the third quarter of 2015 and the third quarter of 2017 which adversely impacted the financial health of some of our franchisees and the timely payment of amounts owed to us for royalty payments and advertising fund contributions. Most recently, non-timely or partial payments were primarily concentrated amongst several franchisees. These issues have been resolved. As part of the resolution of these issues, and as previously disclosed, we reached a court-approved settlement with one franchisee which, among other things, resultedThe tables in the paymentfollowing section of $12.5 millionthis Form 10-K present information from the franchisee to usour Consolidated Statements of Comprehensive Income (Loss) for past due royaltyour 2019, 2018 and advertising fees2017 fiscal years. A detailed discussion of year-to-year comparisons between fiscal 2019 and the dismissal of all outstanding litigation between the parties and we completed the acquisition of 69 Applebee’s restaurants in North Carolina and South Carolina in December 2018.fiscal 2018 can be found below.
We are closely monitoring and working with one remaining franchisee of significantly smaller scale on resolving outstanding issues related to past due royalty and advertising payments.
In working with our franchisees to resolve financial health issues, we provided various forms of assistance, primarily the approved closures of non-viable restaurants and waiver of related termination fees as well as making loans to certain franchisees, of which there are approximately $22.8 million outstanding at December 31, 2018. The majority of the loans resulted from the conversion of short-term accounts receivable for royalties and advertising fees into interest-bearing notes receivable.
Events Impacting Comparability of Financial Information
Change in Accounting Policy
On January 1, 2018, we adopted the guidance of ASC 606. The two most significant impacts of this change in accounting policy are as follows:
Prior to the adoption of ASC 606, we did not record advertising fees received under Applebee's franchise agreements as franchise revenue and expense; we did record advertising fees received under IHOP franchise agreements as franchise revenue and expense. In evaluating advertising activity under the guidance of ASC 606, we consider ourselves to be primarily responsible for fulfilling the promise to provide all the services specified in the contract, including advertising activities, which are not considered to be distinct services in the context of providing the right to the symbolic intellectual property. Accordingly, under ASC 606, we are recording all advertising fees received as franchise revenue. Under previous accounting guidance for franchisors, advertising revenue and expense were recognized in the same amount in each period. That guidance was modified by ASC 606, such that advertising expense may now be recognized in a different period than the advertising revenue recognized as described above.
Prior to the adoption of ASC 606, the Company generally recognized the entire franchise and/or development fee as revenue at the restaurant opening date. Under ASC 606, franchise and development fees are recognized as revenue ratably on a straight-line basis over the term of the franchise agreement commencing with the restaurant opening date.
We adopted this change in accounting principle using the full retrospective method. Accordingly, previously reported financial information for the years ended December 31, 2017 and 2016 has been adjusted to reflect the changes as described above from application of ASC 606. See Notes 2 and 3 of the Notes to Consolidated Financial Statements for additional discussion of our adoption of ASC 606 and our policies for recognition of revenue from contracts with customers.
In conjunction with the adoption of ASC 606, we implemented internal controls to ensure we adequately evaluated our contracts with franchisees and properly assessed the impact of ASC 606 on our consolidated financial statements.
Temporary Increase in Franchisee Contribution Rate to the Applebee's NAF
All domestic Applebee’s franchisees have entered into an amendment to their franchise agreements to increase their contribution to the Applebee's national advertising fund (the “Applebee’s NAF”), with virtually all agreeing to a 0.25% increase to 3.50% of their gross sales and a decrease to their minimum local promotional expenditures to 0.25% of their gross sales for the period from January 1, 2018 to December 31, 2019. Such franchisees also agreed to an incremental temporary increase of 0.75% in the advertising contribution rate to 4.25% effective July 1, 2018 to December 31, 2019. As a result of these rate increases, advertising revenue increased approximately $25 million in 2018 as compared to 2017.
Franchisor Contributions to the Applebee's NAF
We contributed $30.0 million $9.5 million and $2.5 million to the Applebee's NAF induring the yearsyear ended December 31, 2018 2017 and 2016, respectively, to mitigate the decline in franchisee contributions due to restaurant closures and the non-timely payment of advertising fees by certain franchisees. Our contributions ceased as of June 30, 2018 and we do not anticipate making similarmade no such contributions to the Applebee's NAF in the foreseeable future.
Tax Cuts and Jobs Act
The Tax Cuts and Jobs Act (the “Tax Act”) enacted in December 2017 lowered the Federal statutory corporate tax rate from 35% to 21%, beginning in 2018. In accordance with U.S. GAAP, we revalued our net deferred tax liability as of December 31, 2017, based on a U.S. federal tax rate of 21 percent. This revaluation reduced our 2017 net loss by $66.5 million, or $3.75 per share.
Duringduring the year ended December 31, 2019.
Temporary Increase in Franchisee Contribution Rate to the Applebee's NAF
All domestic Applebee’s franchisees have either entered into an amendment to their franchise agreements to increase their contribution to the Applebee’s NAF or entered into new franchise agreements in connection with renewals, with virtually all agreeing to a 0.25% increase to 3.50% of their gross sales and a decrease in their minimum local promotional expenditures to 0.25% of their gross sales for the period from January 1, 2018 we increased our tax provision by $5.1 million related to adjustments resulting from IRS auditsDecember 31, 2019. Such franchisees who entered into amendments also agreed to an incremental temporary increase of 0.75% in the advertising contribution rate to 4.25% effective July 1, 2018 to January 1, 2021. The franchisees who entered into new franchise agreements in connection with renewals agreed to contribute between 4% and 4.25% of their gross sales to the Applebee’s NAF through December 31, 2019 and have agreed to extend such contribution through January 1, 2021. As a result, the advertising contribution rate for tax years 2011 through 2013.virtually all Applebee's franchisees was 4.25% throughout the year ended December 30, 2019, as compared to 3.50% during the first six months of 2018 and 4.25% during the last six months of 2018. This increased our effective tax rate from what would have been an estimated combined federal and state rate of 25% (reflecting the reduction in the federal tax rate from the Tax Act) toadvertising revenue by approximately 27.4%$15 million for the year ended December 31,30, 2019 compared to the same period of 2018. Completion of the IRS audits for tax years 2011 through 2013 will allow us to accelerate the collection of certain tax benefits recognized in prior years. As a result, we expect to receive a cash refund of approximately $12.5 million within the next 12 months.
Acquisition of Franchise Restaurants and Refranchising of Company-Operated Restaurants
In December 2018, we acquired 69 Applebee's restaurants in North Carolina and South Carolina from a former Applebee's franchisee. We operated these restaurants for 12 months in 2019 as compared to approximately three weeks in 2018.
While we currently intend to own and operate these restaurants for the near term, we will assess and monitor opportunities to refranchise these restaurants under favorable circumstances. We believe this transaction was a unique circumstance and should not be considered a change in our business strategy.strategy to operate as a highly franchised company.
In June 2017, we refranchised nine of our ten company-operated IHOP restaurants in the Cincinnati, Ohio market area; the one restaurant not refranchised was closed. As a result, we no longer operate any IHOP restaurants on a permanent basis.
Impairment of Applebee's Goodwill and Tradename
We performed an interim quantitative test for impairment of Applebee's goodwill and indefinite-lived intangible assets in the third quarter of 2017. As a result of performing the interim quantitative test, we recognized an impairment of Applebee's goodwill of $358.2 million and an impairment of Applebee's tradename of $173.4 million.
Throughout 2018, we performed assessments to determine whether events or changes in circumstances have occurred that could indicate any potential additional impairment to our goodwill and indefinite-lived intangible assets. We considered, among other things, changes in Applebee's key performance indicators and what, if any, impact that performance had on the long-term forecast of future trends in sales, operating expenses, overhead expenses, depreciation, capital expenditures and changes in working capital that was used in performing the quantitative impairment test in the third quarter of 2017. We also considered the current market price of our common stock and the favorable impact of the Tax Act on future cash flows. We performed our annual test of impairment on a qualitative basis in the fourth quarter of 2018 and concluded it was not “more likely than not” that the fair value of the Applebee's franchise reporting unit is less than its carrying amount and therefore, a quantitative test of impairment was not necessary.
Executive Separation Costs
On February 17, 2017, we announced the resignation of our former Chairman and Chief Executive Officer (the “former CEO”), effective March 1, 2017. In accordance with the terms of the Separation Agreement and General Release filed as Exhibit 10.1 to Form 8-K filed on February 17, 2017, we recorded approximately $5.9 million for severance, separation pay and ancillary costs in the first quarter of 2017. All stock options and restricted stock awards held by the former CEO that were unvested at the time of the announcement became vested in connection with the separation. We recorded a charge of approximately $2.9 million related to the accelerated vesting of the equity awards in the first quarter of 2017. Total costs of $8.8 million related to the separation were included in G&A expenses for the year ended December 31, 2017.
Financial Review
| | | | | 2018 | | Favorable
(Unfavorable) Variance | | 2017 | | Favorable
(Unfavorable) Variance | | 2016 | | | | Favorable
(Unfavorable) Variance | | | | Favorable
(Unfavorable) Variance | | |
| Revenue | | | | (as adjusted) | | (as adjusted) | | 2019 | | 2018 | | 2017 |
| | | (In millions) | | (In millions) |
| Franchise operations | | $ | 643.9 |
| | $ | 49.5 |
| | $ | 594.4 |
| | $ | (43.6 | ) | | $ | 638.0 |
| | $ | 651.2 |
| | $ | 7.3 |
| | $ | 643.9 |
| | $ | 49.5 |
| | $ | 594.4 |
|
| Company restaurant operations | | | 131.2 |
| | 124.1 |
| | 7.1 |
| | (0.4 | ) | | 7.5 |
|
| Rental operations | | 121.9 |
| | 0.5 |
| | 121.4 |
| | (1.6 | ) | | 123.0 |
| | 120.7 |
| | (1.2 | ) | | 121.9 |
| | 0.5 |
| | 121.4 |
|
| Financing operations | | 8.0 |
| | (0.4 | ) | | 8.4 |
| | (0.8 | ) | | 9.2 |
| | 7.1 |
| | (0.9 | ) | | 8.0 |
| | (0.4 | ) | | 8.4 |
|
| Company restaurant operations | | 7.1 |
| | (0.4 | ) | | 7.5 |
| | (9.9 | ) | | 17.4 |
| |
| Total revenue | | $ | 780.9 |
| | $ | 49.2 |
| | $ | 731.7 |
| | $ | (55.8 | ) | | $ | 787.6 |
| | $ | 910.2 |
| | $ | 129.3 |
| | $ | 780.9 |
| | $ | 49.2 |
| | $ | 731.7 |
|
| Change vs. prior year | | | 16.6 | % | | | | 6.7 | % | | | | 14.2 | % |
Our 20182019 total revenue grew by $49.2increased $129.3 million compared to 2017. The significant components of the change are as follows:
Franchise advertising revenue increased $34.1 million, of which $25 million was2018, primarily due to the temporary increase in the franchisee contribution rate to theoperation of 69 Applebee's NAFrestaurants, as discussed above under Events Impacting Comparability of Financial Information. Collection of amounts not recognized asInformation. Franchise operations revenue in the prior year and increases in domestic system-wide sales at both brands also contributedincreased due to the increase in Applebee's advertising revenue.
Franchise royaltyrevenue also cited above, as well as to IHOP's restaurant development and fee revenue increased $15.4 million, primarily due to a 5.0%1.1% increase in Applebee's domestic same-restaurant sales, a 3.2% increase in IHOP effective franchise restaurants due to franchisee development and revenue from the cash collection of royalties previously unrecognized due to uncertainty as to collectibility.
Our 2017 total revenue declined $55.8 million compared to 2016. The significant components of the change are as follows:
Franchise revenues decreased due to a 5.3% decline in Applebee's same-restaurant sales, an increase in Applebee's revenue we did not recognize due to uncertainty as to collectibility, an increase in closures of Applebee's restaurants, and a decrease in sales of IHOP pancake and waffle dry mix. These unfavorable items were partially offset by newApplebee's restaurant development by IHOP franchisees.
Company restaurantclosures and 0.7% decrease in domestic same-restaurant sales. Rental and financing revenue declined primarily due to declines in interest income as balances owed to us are repaid.
|
| | | | | | | | | | | | | | | | | | | | |
| | | | | Favorable
(Unfavorable) Variance | | | | Favorable
(Unfavorable) Variance | | |
| Gross Profit (Loss) | | 2019 | | | 2018 | | | 2017 |
| | | (In millions) |
| Franchise operations | | $ | 338.4 |
| | $ | 25.1 |
| | $ | 313.3 |
| | $ | 12.9 |
| | $ | 300.4 |
|
| Company restaurant operations | | 8.0 |
| | 6.8 |
| | 1.2 |
| | 1.5 |
| | (0.3 | ) |
| Rental operations | | 29.9 |
| | (1.3 | ) | | 31.2 |
| | 0.4 |
| | 30.8 |
|
| Financing operations | | 6.5 |
| | (0.9 | ) | | 7.4 |
| | (0.4 | ) | | 7.8 |
|
| Total gross profit | | $ | 382.8 |
| | $ | 29.7 |
| | $ | 353.1 |
| | $ | 14.4 |
| | $ | 338.7 |
|
| Change vs. prior year | | 8.4 | % | | | | 4.2 | % | | | | (11.8 | )% |
Our 2019 gross profit grew by over 8% compared to 2018, primarily due to the refranchising of nine IHOP company-operated restaurants$30 million contribution we made to the Applebee's NAF in June 20172018 that did not recur in 2019, as noteddiscussed above under “EventsEvents Impacting Comparability of Financial Information.” Our operation of 69 Applebee's restaurants incrementally impacted total gross profit by $1.9 million, as the increase in gross profit from operating the restaurants was economically offset by foregone royalty revenue of $4.9 million that would have been recognized in franchise operations had the restaurants been franchisee-operated.
Rental and financing revenues decreased primarily due to the progressive decline in interest income as financed receivables were repaid.
|
| | | | | | | | | | | | | | | | | | | | |
| | | 2018 | | Favorable
(Unfavorable) Variance | | 2017 | | Favorable
(Unfavorable) Variance | | 2016 |
| Gross Profit (Loss) | | | | | (as adjusted) | | | (as adjusted) |
| | | (In millions) |
| Franchise operations | | $ | 313.3 |
| | $ | 12.9 |
| | $ | 300.4 |
| | $ | (44.1 | ) | | $ | 344.5 |
|
| Rental operations | | 31.2 |
| | 0.4 |
| | 30.8 |
| | (0.7 | ) | | 31.5 |
|
| Financing operations | | 7.4 |
| | (0.4 | ) | | 7.8 |
| | (1.2 | ) | | 9.0 |
|
| Company restaurant operations | | 1.2 |
| | 1.5 |
| | (0.3 | ) | | 0.5 |
| | (0.8 | ) |
| Total gross profit | | $ | 353.1 |
| | $ | 14.4 |
| | $ | 338.7 |
| | $ | (45.5 | ) | | $ | 384.2 |
|
| Change vs. prior year | | 4.2 | % | | | | (11.8 | )% | | | | (3.7 | )% |
Our 2018 gross profit grew by $14.4 million compared to 2017. Significant components of the total change are as follows:
Franchise gross profit increased primarily due to favorable resolution of certain franchisee financial health issues in the form of lower bad debt expense and cash collections of previously unrecognized royalty revenues, as well as a lower advertising fund deficit, increases in Applebee's and IHOP domestic same-restaurant sales and IHOP restaurant development.
The favorable impacts on franchise gross profit were partially offset by an increase of $20.5 million in franchisor contributions to the Applebee's NAF.
Company-operated restaurant gross profit improved due to the reacquisition of restaurants discussed above under “Events Impacting Comparability of Financial Information.”
Our 2017 gross profit decreased $45.5 million compared to 2016. Primary components of the total change are as follows:
Franchise gross profit declined primarily due to the decrease in revenue described above, an increase in Applebee's bad debt expense and an increase in franchisor contributions to the Applebee's NAF.
Rental and financing gross profit were adversely impacted by the progressive decline in interest income as financed receivables were repaid.
Company-operated restaurant gross profit improved slightly due to the refranchising of nine IHOP company-operated restaurants noted above.
| | | Franchise Operations | | 2018 | | Favorable
(Unfavorable) Variance | | 2017 | | Favorable
(Unfavorable) Variance | | 2016 | | | | Favorable
(Unfavorable) Variance | | | | Favorable
(Unfavorable) Variance | | |
| | | | | (as adjusted) | | (as adjusted) | | 2019 | | 2018 | | 2017 |
| | | (In millions, except number of restaurants) | | (In millions, except number of restaurants) |
Effective Franchise Restaurants:(1) | | | | | | | | | | | | | | | | | | | | |
| Applebee’s | | 1,883 | | (87) | | 1,970 | | (57) | | 2,027 | | 1,745 | | (138) | | 1,883 | | (87) | | 1,970 |
| IHOP | | 1,795 | | 55 | | 1,740 | | 57 | | 1,683 | | 1,820 | | 25 | | 1,795 | | 55 | | 1,740 |
| | | | | | | | | | | | | | | | | | | | | |
| Franchise Revenues: | | | | | | | | | | | | | | | | | | | | |
| Applebee's | | $ | 176.6 |
| | $ | 7.8 |
| | $ | 168.8 |
| | $ | (18.7 | ) | | $ | 187.5 |
| | $ | 163.6 |
| | $ | (13.0 | ) | | $ | 176.6 |
| | $ | 7.8 |
| | $ | 168.8 |
|
| IHOP | | 199.0 |
| | 7.6 |
| | 191.4 |
| | 1.0 |
| | 190.4 |
| | 204.6 |
| | 5.6 |
| | 199.0 |
| | 7.6 |
| | 191.4 |
|
| Advertising | | 268.3 |
| | 34.1 |
| | 234.2 |
| | (25.9 | ) | | 260.1 |
| | 283.0 |
| | 14.7 |
| | 268.3 |
| | 34.1 |
| | 234.2 |
|
| Total franchise revenues | | 643.9 |
| | 49.5 |
| | 594.4 |
| | (43.6 | ) | | 638.0 |
| | 651.2 |
| | 7.3 |
| | 643.9 |
| | 49.5 |
| | 594.4 |
|
| Franchise Expenses: | | | | | | | | | | | | | | | | | | | | |
| Applebee’s | | 35.1 |
| | (7.4 | ) | | 27.7 |
| | (18.6 | ) | | 9.1 |
| | 4.3 |
| | 30.8 |
| | 35.1 |
| | (7.4 | ) | | 27.7 |
|
| IHOP | | 25.9 |
| | (2.7 | ) | | 23.2 |
| | 1.1 |
| | 24.3 |
| | 26.7 |
| | (0.8 | ) | | 25.9 |
| | (2.7 | ) | | 23.2 |
|
| Advertising | | 269.6 |
| | (26.5 | ) | | 243.1 |
| | 17.0 |
| | 260.1 |
| | 281.8 |
| | (12.2 | ) | | 269.6 |
| | (26.5 | ) | | 243.1 |
|
| Total franchise expenses | | 330.6 |
| | (36.6 | ) | | 294.0 |
| | (0.5 | ) | | 293.5 |
| | 312.8 |
| | 17.8 |
| | 330.6 |
| | (36.6 | ) | | 294.0 |
|
| Franchise Segment Profit: | | | | | | | | | | | | | | | | | | | | |
| Applebee’s | | 141.5 |
| | 0.3 |
| | 141.2 |
| | (37.2 | ) | | 178.4 |
| | 159.3 |
| | 17.8 |
| | 141.5 |
| | 0.4 |
| | 141.1 |
|
| IHOP | | 173.1 |
| | 5.0 |
| | 168.1 |
| | 2.0 |
| | 166.1 |
| | 177.9 |
| | 4.8 |
| | 173.1 |
| | 4.9 |
| | 168.2 |
|
| Advertising | | (1.3 | ) | | 7.6 |
| | (8.9 | ) | | (8.9 | ) | | — |
| | 1.2 |
| | 2.5 |
| | (1.3 | ) | | 7.6 |
| | (8.9 | ) |
| Total franchise segment profit | | $ | 313.3 |
| | $ | 12.9 |
| | $ | 300.4 |
| | $ | (44.1 | ) | | $ | 344.5 |
| | $ | 338.4 |
| | $ | 25.1 |
| | $ | 313.3 |
| | $ | 12.9 |
| | $ | 300.4 |
|
| Gross profit as % total revenue | | 48.7 | % | | | | 50.5 | % | | | | 54.0 | % | |
Gross profit as % franchise fees (2) | | 83.8 | % | | | | 85.9 | % | | | | 91.2 | % | |
| Gross profit as % of total revenue | | | 52.0 | % | | | | 48.7 | % | | | | 50.5 | % |
Gross profit as % of franchise fees (2) | | | 91.6 | % | | | | 83.8 | % | | | | 85.9 | % |
(1) Effective Franchise Restaurants are the weighted average number of franchise and area license restaurants open in a given fiscal period, adjusted to account for franchise and area license restaurants open for only a portion of the period.
(2) Total franchise revenue excluding advertising
Our 2018 total franchise revenue increased $49.5$7.3 million in 2019 compared to 2017, of which $34.1 million was2018, due to an increasechanges in advertising revenue discussed below. The significant components of the other revenue changes are as follows:following components:
Applebee's franchise revenue increased 4.6%decreased $13.0 million compared to 2017, primarily2018. Revenue declined approximately $8.7 million due to 138 fewer effective franchise restaurants in operation during the year, the number of which declined due to restaurant closures by franchisees and to our acquisition of 69 Applebee's restaurants as noted above. A decrease in revenue recognized upon cash collection reduced franchise revenue by $1.2 million. Revenue that had been recognized in 2018 upon cash collection, primarily of past-due amounts, did not recur to the same degree in 2019 as franchisee health improved. A decrease of 0.7% in domestic franchise same-restaurant sales reduced franchise revenue by $1.0 million. Lower franchise fees, credits against royalties for delivery charges and a 5.0% increasedecrease in international royalty revenue also contributed to the decline in Applebee's domestic same-restaurant sales. We also recognized $6.4 million of revenue from the cash collection of royalties previously unrecognized due to uncertainty as to collectibility. These favorable items were partially offset by restaurant closures that reduced revenue by $4.7 million and lower international revenue of $0.6 million.franchise revenue.
IHOP franchise revenues increased 4.0%$5.6 million, or 2.8%, primarily due to the impact on royalty and dry mix revenues of a 3.2%1.4% increase in effective franchise restaurants due to franchisee development and a 1.5%1.1% increase in domestic same-restaurant on royalty and dry mix revenues.sales.
Advertising revenue increased $14.7 million compared to 2018, as discussed by brand below.
Our 20182019 total franchise expenses increased $36.6decreased $17.8 million compared to 2017, of which $26.5 million was2018, due to an increasechanges in advertising expense discussed below. The significant components of the other expense changes are as follows:following components:
Applebee's franchise expenses increased $7.4decreased $30.8 million, primarily becausedue to the absence of a $20.5 million increase in franchisor marketing contributions.contributions in 2019. We contributed $30.0 million to the Applebee's NAF induring the year ended December 31, 2018. Our contributions ceased as of June 30, 2018 as compared the $9.5 million contributionand we made in 2017. The increase inno such contributions to the Applebee's NAF contributions was partially offset by a $13.0 million decline in bad debt expense. After resolution ofduring the significant majority of the franchisee health issues discussed under “Significant Known Events, Trends or Uncertainties Impacting or Expected to Impact Comparisons of Reported or Future Results” above, Applebee's bad debt expense was virtually zero in 2018.year ended December 31, 2019.
IHOP franchise expenses increased $2.7$0.8 million, primarily due to an increase in pancake and waffle dry mix purchases related tocontributions for menu management programs, partially offset by lower bad debt expense.
Advertising expenses increased sales and an increase of $0.6$12.2 million, in franchisor contributions to the IHOP national advertising fund.
Our 2017 total franchise revenue declined $43.6 million compared to 2016, of which $25.9 million was due to a decreasecorresponding increase in advertising revenue, discussed below. The significant components of the other revenue changes are as follows:
Applebee's franchise revenue decreased by approximately 10%. A 5.3% decrease in Applebee's domestic same-restaurant sales reduced revenue by $8.3 million and there was a decrease of $6.2 million of royalty revenue due to uncertainty as to its collectibility. Restaurant closures reduced revenue by $4.1 million. Lower franchise termination and transfer fees also contributed to the decrease.
IHOP franchise revenues improved primarily due to increases in effective franchise restaurants due to franchisee development and an increase in international sales. These favorable items were primarily offset by a $1.6 million decrease in sales of pancake and waffle dry mix and a 1.9% decrease in IHOP's domestic same-restaurant sales.
Our 2017 total franchise expenses were essentially unchanged compared to 2016. The significant components of the total change are as follows:
Applebee's franchise expenses increased primarily because of an $11.5 million increase in bad debt expense and an increase in franchisor marketing contributions. We contributed $9.5 million to the Applebee's NAF in 2017 to mitigate the decline in franchisee contributions that are based on sales as compared to a $2.5 million contribution in 2016.
IHOP franchise expenses improved due primarily to favorability in pancake and waffle dry mix purchases partially offset by the recovery in 2019 of a $0.8$1.3 million franchisor contribution to the IHOP national advertising fund.
The decreasedeficit that had been recorded in advertising expenses is2018, as discussed below.
Gross profit as a percentage of total revenue declinedimproved in 20182019 compared to 20172018, primarily because of the increasedecrease in franchisor contributions to the Applebee's NAF and increases in IHOP effective restaurants and domestic same-restaurant sales, partially offset by the decreasedecreases in Applebee's bad debt expense, the increase in Applebee'seffective restaurants and domestic same-restaurant sales and IHOP restaurant development. Gross profit as a percentage of revenue declined in 2017 compared to 2016 primarily because of the increase in Applebee's bad debt and franchisor contributions to the Applebee's NAF and the decrease in Applebee's franchise revenues.sales.
As discussed under “Events Impacting Comparability of Financial Information,” we adopted ASC 606 effective January 1, 2018; the financial statements for fiscal 2017 and 2016 have been adjusted to reflect the application of ASC 606 to all comparative periods presented. Advertising revenue and expense by brand for fiscal 2019, 2018 2017 and 20162017 were as follows:
| | | | | 2018 | | Favorable
(Unfavorable) Variance | | 2017 | | Favorable
(Unfavorable) Variance | | 2016 | | | | Favorable
(Unfavorable) Variance | | | | Favorable
(Unfavorable) Variance | | |
| | | | | (as adjusted) | | (as adjusted) | | 2019 | | 2018 | | 2017 |
| | | (In millions) | | (In millions) |
| Advertising Revenues: | | | | | | | | | | | | | | | | | | | | |
| Applebee's | | $ | 153.0 |
| | $ | 30.8 |
| | $ | 122.2 |
| | $ | (27.7 | ) | | 149.9 |
| | $ | 165.5 |
| | $ | 12.5 |
| | $ | 153.0 |
| | $ | 30.8 |
| | 122.2 |
|
| IHOP | | 115.3 |
| | 3.3 |
| | 112.0 |
| | 1.8 |
| | 110.2 |
| | 117.5 |
| | 2.2 |
| | 115.3 |
| | 3.3 |
| | 112.0 |
|
| Total advertising revenues | | $ | 268.3 |
| | 34.1 |
| | $ | 234.2 |
| | (25.9 | ) | | $ | 260.1 |
| | $ | 283.0 |
| | 14.7 |
| | $ | 268.3 |
| | 34.1 |
| | $ | 234.2 |
|
| | | | | | | | | | | | | | | | | | | | | |
| Advertising Expenses: | | | | | | | | | | | | | | | | | | | | |
| Applebee’s | | $ | 153.0 |
| | $ | (21.9 | ) | | $ | 131.1 |
| | $ | 18.8 |
| | $ | 149.9 |
| | $ | 165.6 |
| | $ | (12.6 | ) | | $ | 153.0 |
| | $ | (21.9 | ) | | $ | 131.1 |
|
| IHOP | | 116.6 |
| | (4.6 | ) | | 112.0 |
| | (1.8 | ) | | 110.2 |
| | 116.2 |
| | 0.4 |
| | 116.6 |
| | (4.6 | ) | | 112.0 |
|
| Total advertising expenses | | $ | 269.6 |
| | $ | (26.5 | ) | | $ | 243.1 |
| | $ | 17.0 |
| | $ | 260.1 |
| | $ | 281.8 |
| | $ | (12.2 | ) | | $ | 269.6 |
| | $ | (26.5 | ) | | $ | 243.1 |
|
Applebee's advertising revenue increased $30.8$12.5 million in 20182019 compared to 2017,2018. Most of which approximately $25 millionthe change was due to the temporary increase in the franchisee contribution rate discussed above under “Events“Events Impacting Comparability of Financial Information.Information,” Additional factors in the increase were the 5.0% increase in which increased Applebee's domestic same-restaurant sales and the collection of amounts not paid in the prior year, partially offset by the impact of restaurant closures. IHOP advertising revenue increasedby $15.1 million, and to an improvement in collectibility of advertising fees from certain franchisees. Partially offsetting these favorable items were decreases in advertising revenue due to the increase in effective restaurantsrestaurant closures and the 1.5% increasea 0.7% decrease in domestic same-restaurant sales. IHOP advertising spending exceeded advertising revenue by $1.3 million in 2018, with the deficit recognized as additional segment expense.
Applebee's advertising revenue decreased $27.7 million in 2017 compared to 2016, of which approximately $12 million was due to the non-payment of amounts due by several franchisees. Additional factors in the decrease were the 5.3% decrease in Applebee's domestic same-restaurant sales and the impact of restaurant closures. Additionally, franchisees had made an $8 million incremental advertising contribution in 2016 related to a promotional campaign that did not recur in 2017. Applebee's advertising spending exceeded advertising revenue by $8.9 million in 2017, with the deficit recognized as additional segment expense. IHOP advertising revenue increased due to an increase in effective restaurants partially offset by the 1.9% decreasebecause of net restaurant development and a 1.1% increase in domestic same-restaurant sales.
Any deficit in advertising fee revenue compared to advertising expenditures is recognized at the end of each fiscal year. Any excess of advertising fee revenue over advertising expenditures is recognized only to the extent of previously recognized deficits. IHOP advertising revenue exceeded advertising expenditures by $1.3 million in 2019, due to the recovery of a $1.3 million deficit that had been recognized in 2018.
| | | Rental Operations | | | | Favorable
(Unfavorable) Variance | | | | Favorable
(Unfavorable) Variance | | | | | | Favorable
(Unfavorable) Variance | | | | Favorable
(Unfavorable) Variance | | |
| | | 2018 | | 2017 | | 2016 | | 2019 | | 2018 | | 2017 |
| | | (In millions) | | (In millions) |
| Rental revenues | | $ | 121.9 |
| | $ | 0.5 |
| | $ | 121.4 |
| | $ | (1.6 | ) | | $ | 123.0 |
| | $ | 120.7 |
| | $ | (1.2 | ) | | $ | 121.9 |
| | $ | 0.5 |
| | $ | 121.4 |
|
| Rental expenses | | 90.7 |
| | (0.1 | ) | | 90.6 |
| | 0.9 |
| | 91.5 |
| | 90.8 |
| | (0.1 | ) | | 90.7 |
| | (0.1 | ) | | 90.6 |
|
| Rental operations segment profit | | $ | 31.2 |
| | $ | 0.4 |
| | $ | 30.8 |
| | $ | (0.7 | ) | | $ | 31.5 |
| | $ | 29.9 |
| | $ | (1.3 | ) | | $ | 31.2 |
| | $ | 0.4 |
| | $ | 30.8 |
|
| Gross profit as % revenue | | 25.6 | % | | | | 25.4 | % | | | | 25.6 | % | |
| Gross profit as % of revenue | | | 24.8 | % | | | | 25.6 | % | | | | 25.4 | % |
Rental operations relate primarily to IHOP franchise restaurants that were developed under the Previous IHOP Business Model described under Item 1. - Business. Rental income includes revenue from operating leases and interest income from direct financing leases. Rental expenses are costs of prime operating leases and interest expense on prime capitalfinance leases on certain franchise restaurants.
Rental revenue increased $0.5 milliondecreased in 20182019 compared to 20172018 primarily due to contractual increases in base sublease rental revenue and a $0.3 million increase in rental income based on a percentage of franchisees' retail sales, partially offset by the expected progressive decline of $1.3$1.4 million in interest income as amounts owed to us from direct financing leases are repaid. Rental expenses increased $0.1 million in 2018 compared to 2017 primarily because of contractual increases in prime lease expenses offset by a $1.3 million decline in interest expense as capital lease obligations are repaid and a decline in depreciation expense.
Rental revenue declined $1.6 million in 2017 compared to 2016 primarily due to a $1.4 million decrease in rental income based on a percentage of franchisees' retail sales and the expected progressive decline of $1.2 million in interest income as direct financing leases are repaid. These unfavorable items were partially offset by contractual increases in base sublease rental revenue. Rental expenses decreased $0.9 million in 2017 compared to 2016 primarily because of a $1.3 million decline in interest expense as capital lease obligations are repaid and a decline in depreciation expense, partially offset by contractual increases in prime lease expenses.
| | | Financing Operations | | | | Favorable
(Unfavorable) Variance | | | | Favorable
(Unfavorable) Variance | | | | | | Favorable
(Unfavorable) Variance | | | | Favorable
(Unfavorable) Variance | | |
| | | 2018 | | 2017 | | 2016 | | 2019 | | 2018 | | 2017 |
| | | (In millions) | | (In millions) |
| Financing revenues | | $ | 8.0 |
| | $ | (0.4 | ) | | $ | 8.4 |
| | $ | (0.8 | ) | | $ | 9.2 |
| | $ | 7.1 |
| | $ | (0.9 | ) | | $ | 8.0 |
| | $ | (0.4 | ) | | $ | 8.4 |
|
| Financing expenses | | 0.6 |
| | 0.0 |
| | 0.6 |
| | (0.4 | ) | | 0.2 |
| | 0.6 |
| | 0.0 |
| | 0.6 |
| | 0.0 |
| | 0.6 |
|
| Financing operations segment profit | | $ | 7.4 |
| | $ | (0.4 | ) | | $ | 7.8 |
| | $ | (1.2 | ) | | $ | 9.0 |
| | $ | 6.5 |
| | $ | (0.9 | ) | | $ | 7.4 |
| | $ | (0.4 | ) | | $ | 7.8 |
|
| Gross profit as % revenue | | 92.5 | % | | | | 92.8 | % | | | | 98.3 | % | |
| Gross profit as % of revenue | | | 91.9 | % | | | | 92.5 | % | | | | 92.8 | % |
Financing operations relate primarily to IHOP franchise restaurants that were developed under the Previous IHOP Business Model described under Item 1. - Business. Financing operations revenue primarily consists of interest income from the financing of IHOP franchise fees and equipment leases.leases, as well as from several notes receivable from Applebee's franchisees originated in 2018 and 2019. We also may sell equipment associated with IHOP franchise restaurants we have reacquired when those restaurants are subsequently refranchised to a new franchisee. Financing expenses are primarily the cost of the restaurant equipment sold.
Financing revenues decreased $0.4$0.9 million in 20182019 compared to 2017.2018. The change was due to a $1.1 million decrease in IHOP interest income decreased by $0.9 million due to the progressive decline in interest income from the financing of franchise fees and equipment leases as note balances are repaid, partially offset by interest income on Applebee's notes from franchisees. IHOP interest income decreased by $1.2 million between 2017 and 2016 due to the decline in interest revenue as note balances are repaid. The remaining minor variances in financing revenues and expenses are due to changes in sales and cost of sales of equipment associated with reacquired IHOP franchise restaurants subsequently refranchised to new franchisees. Sales of equipment associated with reacquired IHOP restaurants are, by nature, unpredictable and variable in any given year.
| | | Company Operations | | | | Favorable
(Unfavorable) Variance | | | | Favorable
(Unfavorable) Variance | | | | | | Favorable
(Unfavorable) Variance | | | | Favorable
(Unfavorable) Variance | | |
| | | 2018 | | 2017 | | 2016 | | 2019 | | 2018 | | 2017 |
| | | (In millions, except number of restaurants) | | (In millions, except number of restaurants) |
Effective Company Restaurants:(1) | | | | | | | | | | | | | | | | | | | | |
| Applebee’s | | 3 |
| | 3 |
| | — |
| | — |
| | — |
| | 69 |
| | 66 |
| | 3 |
| | 3 |
| | — |
|
| IHOP | | — |
| | (5 | ) | | 5 |
| | (5 | ) | | 10 |
| | — |
| | — |
| | — |
| | (5 | ) | | 5 |
|
| | | | | | | | | | | | | | | | | | | | | |
| Company restaurant sales | | $ | 7.1 |
| | $ | (0.4 | ) | | $ | 7.5 |
| | $ | (9.9 | ) | | $ | 17.4 |
| | $ | 131.2 |
| | $ | 124.1 |
| | $ | 7.1 |
| | $ | (0.4 | ) | | $ | 7.5 |
|
| Company restaurant expenses | | 5.9 |
| | 1.9 |
| | 7.8 |
| | 10.4 |
| | 18.2 |
| | 123.2 |
| | (117.3 | ) | | 5.9 |
| | 1.9 |
| | 7.8 |
|
| Company restaurant segment profit (loss) | | $ | 1.2 |
| | $ | 1.5 |
| | $ | (0.3 | ) | | $ | 0.5 |
| | $ | (0.8 | ) | | $ | 8.0 |
| | $ | 6.8 |
| | $ | 1.2 |
| | $ | 1.5 |
| | $ | (0.3 | ) |
| Gross profit (loss) as % revenue | | 17.1 | % | | | | (3.6 | )% | | | | (4.9 | )% | |
| Gross profit (loss) as % of revenue | | | 6.1 | % | | | | 17.1 | % | | | | (3.6 | )% |
___________________________________________________________________________________________________ (1) Effective Company Restaurants are the weighted average number of company-operated restaurants open in a given fiscal period, adjusted to account for company-operated restaurants open for only a portion of the period.
As discussed above under “Events“Events Impacting Comparability of Financial Information,” over the past two years we have entered into transactions impacting the company-operated restaurants of both brands. On in December 13, 2018, we acquired 69 Applebee's restaurants in North Carolina and South Carolina from a former Applebee's franchisee. In June 2017, we refranchised nine of our ten company-operated IHOPWe operated these restaurants for 12 months in the Cincinnati, Ohio market area; the one restaurant not refranchised was closed. The table above reflects our operation of 69 Applebee's restaurants for2019 as compared to approximately three weeks in 2018,2018. The gross profit percentage generated from operating the operations of 10 IHOP restaurants for approximately six months in 2017 andthree weeks of 2018, which included a holiday period, was not indicative of the operation of 10 IHOP restaurants for 52 weeks in 2016. As a result, comparisons of revenues and expenses between those years are not meaningful and the amount of gross profit or loss generated in any year was not significant.percentage to be expected over the long term.
From time to time, we have operated IHOP restaurants reacquired from franchisees on a temporary basis until those restaurants are refranchised and we may reacquire both IHOP and Applebee's restaurants on a temporary basis in the future. There were no such restaurants under temporary operation at December 31, 2018.2019.
|
| | | | | | | | | | | | | | | | | | | | |
| General and Administrative Expenses | | | | Favorable
(Unfavorable) Variance | | | | Favorable
(Unfavorable) Variance | | |
| | | 2018 | | | 2017 | | | 2016 |
| | | (In millions) |
| | $ | 166.7 |
| | $ | (1.0 | ) | | $ | 165.7 |
| | $ | (16.8 | ) | | $ | 148.9 |
|
|
| | | | | | | | | | | | | | | | | | | | |
| General and Administrative Expenses | | | | Favorable
(Unfavorable) Variance | | | | Favorable
(Unfavorable) Variance | | |
| | | 2019 | | | 2018 | | | 2017 |
| | | (In millions) |
| | $ | 162.8 |
| | $ | 3.9 |
| | $ | 166.7 |
| | $ | (1.0 | ) | | $ | 165.7 |
|
G&A expenses increased $1.0were $3.9 million lower in 20182019 compared to 2017. Personnel-related costs increased $19.12018. Additionally, 2019 G&A expenses included $5.3 million primarily due to higher costs of stock-based and other incentive compensation, partially offset by a decrease of $8.8 million in costs related to the 2017 executive separationcompany-operated restaurants, as compared to $1.1 million of such costs discussed above under “Events Impacting Comparabilityin 2018. The decrease in total G&A expenses primarily was due to lower costs of Financial Information” that did not recur. The net increase of $10.3 million in personnel-related costs was partially offset byincentive compensation, a $7.5 million decrease in professional services costs and a $1.4 million decrease in recruiting/relocation costs, as well as smaller decreases in other cost categories. The decrease in professionallower expenses for travel and conferences and consumer research. Professional services costs was duedeclined primarily tobecause costs incurred in 2018 addressing issues associated with the increased usagefinancial health of third-party consultants in 2017 related tocertain Applebee's stabilization initiatives discussed below; similar utilizationfranchisees did not recur in 2018.
G&A expenses2019. Partially offsetting these favorable items were higher costs of software maintenance, increased $16.8 million in 2017 compared to 2016, primarily due to chargesdepreciation of $8.8 million related to the executive separationcapitalized software, higher costs discussed above under “Events Impacting Comparability of Financial Information.” Additionally, we incurred $8.6salaries and benefits as well as higher severance costs that included approximately $1.5 million of costs related to Applebee's stabilization initiatives, primarily costs of third-party consultants engaged to assess the decline in Applebee's traffic and same-restaurant sales, to provide actionable recommendations to stabilize the decline and to assist with franchisee health initiatives. All other G&A expenses declined $0.6 million, due primarily to a $1.5
million decrease in recruiting and relocation costs, a $1.1 million decrease in professional services and a $1.1 million decrease in conference and travel costs, partially offset by a $3.2 million increase in personnel-related costs.certain organizational management structural changes. The increase in personnel-related costs was primarilysoftware maintenance and depreciation of capitalized software is due to salary and benefit costs for open management positions that were filled during 2016, partially offset by lower costs of incentive compensation.the Company's continuing investment in consumer-facing information technology.
| | | Impairment of Goodwill and Intangible Assets | | | | Favorable
(Unfavorable) Variance | | | | Favorable
(Unfavorable) Variance | | | | | | Favorable
(Unfavorable) Variance | | | | Favorable
(Unfavorable) Variance | | |
| | | 2018 | | 2017 | | 2016 | | 2019 | | 2018 | | 2017 |
| | | (In millions) | | (In millions) |
| Impairment of goodwill | | $ | — |
| | $ | 358.2 |
| | $ | 358.2 |
| | $ | — |
| | $ | — |
| | $ | — |
| | $ | — |
| | $ | — |
| | $ | 358.2 |
| | $ | 358.2 |
|
| Impairment of tradename | | — |
| | 173.4 |
| | 173.4 |
| | — |
| | — |
| | — |
| | — |
| | — |
| | 173.4 |
| | 173.4 |
|
| Total | | $ | — |
| | $ | 531.6 |
| | $ | 531.6 |
| | $ | — |
| | $ | — |
| | $ | — |
| | $ | — |
| | $ | — |
| | $ | 531.6 |
| | $ | 531.6 |
|
As discussed above under “Events Impacting Comparability of Financial Information,” we recognized an impairment of Applebee's goodwill of $358.2 million and an impairment of Applebee's tradename of $173.4 million in 2017. After the impairments, the balances of goodwill and the tradename intangible asset allocated to the Applebee's franchise unit as of September 30, 2017 were $328.5 million and $479.0 million, respectively. We adopted the guidance in FASB Accounting Standards Update 2017-04 on January 1, 2017; accordingly, the amount of the goodwill impairment was determined as the amount by which the carrying amount of the goodwill exceeded the fair value of the Applebee's franchise reporting unit that was estimated in the quantitative test.
We performed our annual test of goodwill and intangible assets for impairment on a qualitative basis in the fourth quarter of 2018.2019. In performing that analysis we considered, among other things, Applebee's key performance indicators during 20182019 and what, if any, impact that performance had on the long-term forecast of future trends in sales, operating expenses, overhead expenses, depreciation, capital expenditures and changes in working capital that had been used in performing a quantitative impairment test in the third quarter of 2017.2017 that resulted in an impairment of Applebee's goodwill and tradename totaling $531.6 million. We also considered the current market price of our common stock, the continuing favorable impact of the Tax Actlower federal income tax rates on future cash flows and the impact these changes wouldcould have on an appropriate discount rate. As a result of the qualitative test performed in 2019, we concluded it was not more likely than not that the fair value of the Applebee's franchise reporting unit is less than its carrying amount and therefore, a quantitative test of impairment was not necessary.
Loss on Extinguishment of Debt |
| | | | | | | | | | | | | | | | | | | | |
| Other Income and Expense Items | | | | Favorable
(Unfavorable) Variance | | | | Favorable
(Unfavorable) Variance | | |
| | | 2018 | | | 2017 | | | 2016 |
| | | (In millions) |
| Interest expense | | $ | 61.7 |
| | $ | 0.3 |
| | $ | 62.0 |
| | $ | (0.5 | ) | | $ | 61.5 |
|
| Amortization of intangible assets | | 10.1 |
| | (0.1 | ) | | 10.0 |
| | (0.0 | ) | | 10.0 |
|
| Closure and other impairment charges | | 2.1 |
| | 1.9 |
| | 4.0 |
| | 1.1 |
| | 5.1 |
|
| Debt refinancing costs | | 2.5 |
| | (2.5 | ) | | — |
| | — |
| | — |
|
| (Gain) loss on disposition of assets | | (0.6 | ) | | (5.7 | ) | | (6.3 | ) | | 7.1 |
| | 0.8 |
|
| Total | | $ | 75.8 |
| | $ | (6.1 | ) | | $ | 69.7 |
| | $ | 7.7 |
| | $ | 77.4 |
|
Interest Expense
Interest expense has been substantially consistent for eachAs discussed in additional detail under “Liquidity and Capital Resources,” on June 5, 2019, we repaid our outstanding long-term debt of the past three years.
Amortization$1.28 billion with an anticipated repayment date of Intangible Assets
Amortizationof intangible assets primarily relates to franchising rights arisingSeptember, 2021 (the “2014 Notes”) with proceeds from the November 2007 acquisitionissuance of Applebee'snew debt totaling $1.3 billion, comprised of tranches of $700 million and has been substantially consistent for each$600 million having anticipated repayment dates of the past three years. See Note 7 - Other Intangible Assets,June 2024 and June 2026, respectively. In connection with this transaction, we recognized a loss on extinguishment of the Notes to the Consolidated Financial Statements for additional information.
|
| | | | | | | | | | | | | | | | | | | | |
| Closure and Other Impairment Charges | | | | Favorable
(Unfavorable) Variance | | | | Favorable
(Unfavorable) Variance | | |
| | | 2018 | | | 2017 | | | 2016 |
| | | (In millions) |
| Closure charges | | $ | 2.0 |
| | $ | 1.9 |
| | $ | 3.9 |
| | (2.7 | ) | | $ | 1.2 |
|
| Kansas City lease exit costs | | — |
| | — |
| | — |
| | 2.9 |
| | 2.9 |
|
| Long-lived tangible asset impairments | | 0.1 |
| | — |
| | 0.1 |
| | 0.9 |
| | 1.0 |
|
| Total closure and impairment charges | | $ | 2.1 |
| | $ | 1.9 |
| | $ | 4.0 |
| | $ | 1.1 |
| | $ | 5.1 |
|
Closure Charges
Approximately $1.8debt of $8.3 million of closure charges for the year ended December 31, 2018 related to one IHOP company-operated restaurant closed during 2018,2019, representing the remaining unamortized issuance costs associated with the remainder primarily related to adjustments to the estimated reserve for IHOP and Applebee's restaurants closed prior to 2018. Approximately $2.2 million of closure charges for the year ended December 31, 2017 related to one IHOP company-operated restaurant closed during 2017, with the remainder primarily related to adjustments to the estimated reserve for IHOP and Applebee's restaurants closed prior to 2017. Approximately $0.7 million of closure charges for the year ended December 31, 2016 related to one IHOP franchise restaurant and one Applebee's restaurant closed during 2016, with the remainder related to adjustments to the estimated reserve for IHOP and Applebee's restaurants closed prior to 2016.2014 Notes.
Kansas City Lease Exit Costs
The Company incurred costs of $2.9 million during the year ended December 31, 2016 to exit a facility in connection with the consolidation of the Applebee's Kansas City restaurant support center. Of that total, $2.5 million related to the termination of our involvement in a lease covering two floors of the facility and $0.4 million was accrued as the present value of future lease payments, net of assumed sublease rentals, of a portion of one floor of the facility.
Long-lived Tangible Asset Impairments
Long-lived tangible asset impairment charges for the year ended December 31, 2018 and 2017 were insignificant. Long-lived tangible asset impairment charges for the year ended December 31, 2016 comprised a charge of $0.6 million for one IHOP company-operated restaurant and charges totaling $0.4 million of individually insignificant charges at eight IHOP company-operated restaurants. The Company evaluated the causal factors of all impairments of long-lived assets as they were recorded in each year and concluded they were based on factors specific to each asset and not potential indicators of an impairment of other long-lived assets.
Debt Refinancing Costs
During the year ended December 31, 2018, we explored opportunities related to possible refinancing of our long-term debt. As discussed in additional detail under “Liquidity and Capital Resources,” onOn September 5, 2018, certain subsidiaries of the Company entered into a financing facility that allowsallowed for drawings of up to $225 million of variable funding notes on a revolving basis and the issuance of letters of credit (the “2018 Variable FundingClass A-1 Notes”). In connection with issuance of the 2018 Variable FundingClass A-1 Notes, on September 5, 2018, we repaid $20 million, representing the entire outstanding principal amount of our $100 million revolving financing facility under certain Series 2014-1 Class A-1 Notes (the “2014 Class A-1 Notes”) and terminated the corresponding Class A-1 Note Purchase Agreement, dated September 30, 2014 (the “2014 Note Purchase Agreement”), related to the Series 2014-1 Class A-1 Notes (the “2014 Class A-1 Notes”). In connection with the termination of the 2014 Note Purchase Agreement, we recognized as an expense approximately $0.9 million of remaining unamortized issuance costs associated with the 2014 Class A-1 Notes.
We incurred approximately $1.6 million of costs during 2018 in evaluating options with respect to refinancing our current securitization debt. After completing the evaluation, we did not consummate a refinancing transaction and the entire $1.6 million was charged to expense during the year ended December 31, 2018.
The combined total related to these transactions of $2.5 million is reported as “Debt refinancing costs” in the Consolidated Statements of Comprehensive Income (Loss) for the year ended December 31, 2018.
|
| | | | | | | | | | | | | | | | | | | | |
| Other Income and Expense Items | | | | Favorable
(Unfavorable) Variance | | | | Favorable
(Unfavorable) Variance | | |
| | | 2019 | | | 2018 | | | 2017 |
| | | (In millions) |
| Interest expense, net | | $ | 60.4 |
| | $ | 1.3 |
| | $ | 61.7 |
| | $ | 0.3 |
| | $ | 62.0 |
|
| Amortization of intangible assets | | 11.7 |
| | (1.6 | ) | | 10.1 |
| | (0.1 | ) | | 10.0 |
|
| Closure and other impairment charges | | 1.5 |
| | 0.6 |
| | 2.1 |
| | 1.9 |
| | 4.0 |
|
| Gain on disposition of assets | | (0.3 | ) | | (0.3 | ) | | (0.6 | ) | | (5.7 | ) | | (6.3 | ) |
| Total | | $ | 73.3 |
| | $ | 0.0 |
| | $ | 73.3 |
| | $ | (3.6 | ) | | $ | 69.7 |
|
Interest Expense, Net
Interest expense, net declined $1.3 million in 2019 compared to 2018 primarily due to an increase in interest income. We earned interest income of $1.6 million during the year ended December 31, 2019 as compared to $0.6 million during the year ended December 31, 2018.
Amortization of Intangible Assets
Amortizationof intangible assets primarily relates to franchising rights arising from the November 2007 acquisition of Applebee's and reacquired franchise rights arising from the December 2018 acquisition of 69 Applebee's restaurants from a former franchisee as discussed under Events Impacting Comparability of Financial Information. Amortization expense increased $1.6 million in 2019 as compared to 2018 due to the amortization of the reacquired franchise rights. See Note 7 - Other Intangible Assets, of the Notes to the Consolidated Financial Statements for additional information.
|
| | | | | | | | | | | | | | | | | | | | |
| Closure and Other Impairment Charges | | | | Favorable
(Unfavorable) Variance | | | | Favorable
(Unfavorable) Variance | | |
| | | 2019 | | | 2018 | | | 2017 |
| | | (In millions) |
| Closure charges | | $ | 1.5 |
| | $ | 0.5 |
| | $ | 2.0 |
| | 1.9 |
| | $ | 3.9 |
|
| Long-lived tangible asset impairments | | — |
| | 0.1 |
| | 0.1 |
| | — |
| | 0.1 |
|
| Total closure and impairment charges | | $ | 1.5 |
| | $ | 0.6 |
| | $ | 2.1 |
| | $ | 1.9 |
| | $ | 4.0 |
|
Closure Charges
Approximately $0.5 million of closure charges for the year ended December 31, 2019 related to two IHOP and one Applebee's restaurant closed during 2019, with the remainder primarily related to adjustments to the reserve for IHOP and Applebee's restaurants closed prior to 2019. Approximately $1.8 million of closure charges for the year ended December 31, 2018 related to one IHOP franchise restaurant closed during 2018, with the remainder primarily related to adjustments to the reserve for IHOP and Applebee's restaurants closed prior to 2018.
Long-lived Tangible Asset Impairments
There were no long-lived tangible asset impairment charges for the year ended December 31, 2019. Long-lived tangible asset impairment charges for the year ended December 31, 2018 were insignificant.
(Gain) Loss on Disposition of Assets
The gain on disposition of assets the year ended December 31, 2019 primarily related to a gain on sale of the land and building on which an IHOP restaurant was located, partially offset a loss on disposal of capitalized software of $0.8 million. There were no individually significant transactions in 2018. In June 2017, we completed the refranchising and sale of related restaurant assets of nine company-operated IHOP restaurants in the Cincinnati, Ohio market area. As part of the transaction, we entered into an asset purchase agreement, nine franchise agreements and nine sublease agreements for land and
buildings. The Company compared the stated rent under the sublease agreements with comparable market rents and recorded net favorable lease assets of $2.3 million related to the transaction. The Company also received cash of $1.1 million and a note receivable for $4.8 million. After allocating a portion of the consideration to franchise fees and derecognition of the assets sold, we recognized a gain of $6.3 million on the refranchising and sale of the nine restaurants. There were no individually significant transactions in 2016.
| | | Income Tax Benefit (Provision) | | | | Favorable
(Unfavorable) Variance | | | | Favorable
(Unfavorable) Variance | | | | | | Favorable
(Unfavorable) Variance | | | | Favorable
(Unfavorable) Variance | | |
| | | 2018 | | 2017 | | 2016 | | 2019 | | 2018 | | 2017 |
| | | (In millions) | | (In millions) |
| Income tax (provision) benefit | | $ | (30.2 | ) | | $ | (115.8 | ) | | $ | 85.6 |
| | $ | 142.4 |
| | $ | (56.8 | ) | | $ | (34.1 | ) | | $ | (3.9 | ) | | $ | (30.2 | ) | | $ | (115.8 | ) | | $ | 85.6 |
|
| Effective tax rate | | 27.4 | % | | (7.4 | )% | | 20.0 | % | | 16.0 | % | | 36.0 | % | | 24.6 | % | | 2.8 | % | | 27.4 | % | | (7.4 | )% | | 20.0 | % |
The income tax provision will vary from period to period for two primary reasons: a change in pretax book income and a change in the effective tax rate. Changes in our pretax book income between 20182019 and 2017 and between 2017 and 20162018 are addressed in the preceding sections of “Results“Consolidated Results of Operations - Fiscal 2019, 2018 2017 and 2016.2017.”
On December 22, 2017, the President of the United States of America signed into law the Tax Cuts and Jobs Act (the “Tax Act”). The Tax Act contains significant changes to corporate taxes, including a permanent reduction of the corporate2019 effective tax rate of 24.6% applied to pretax book income was higher than the statutory Federal tax rate of 21% primarily due to tax expense associated with unrecognized tax benefits and state and local income taxes, offset by the recognized benefit from 35% to 21% effective January 1, 2018. The reduction in the corporate rate requires a one-time revaluation of certain tax-related assets and liabilities. As a result of the revaluation of our deferred tax assets and liabilities at December 31, 2017, we recorded a one-time tax benefit of approximately $66.5 million. We have completed analyzing the Tax Act and refined our calculations as December 31, 2018.general business credits.
The 2018 effective tax rate of 27.4% applied to pretax book income was higher than the statutory Federal tax rate of 21% primarily due to additional tax expense associated with unrecognized tax benefits related to IRS auditaudits and state and local income taxes, offset by applying a lower state tax rate to the deferred tax balances.
The 2017 effective tax rate of 20.0% applied to pretax book loss was lower than the statutory Federal tax rate of 35% primarily due to the non-deductibility of the impairment of Applebee’s goodwill for federal income tax purposes, which partially offsets the income tax benefit resulted from the revaluation of our deferred taxes at the federal tax rate of 21% in accordance with the Tax Act. See Note 16 - Income Taxes, of the Notes to Consolidated Financial Statements for additional information on differences between our effective tax rate and the statutory Federal tax rate.
The 2016 effective tax rate of 36.0% applied to pretax book income was higher than the statutory Federal tax rate of 35% primarily due to state and local income taxes, offset by applying a lower state tax rate to the deferred tax balances.
As of each reporting date, we consider new evidence, both positive and negative, that could impact our view with regards to future realization of deferred tax assets. As of December 31, 2018,2019, management determined that it is more likely than not that the benefit from foreign tax credit carryforward will not be realized. In recognition of this risk, management providedrecorded a valuation allowance of $0.4$1.5 million on the deferred tax assets related to the foreign tax credit carryforward.
Liquidity and Capital Resources of the Company
Long-Term Debt
On September 30, 2014,June 5, 2019, Applebee’s Funding LLC and IHOP Funding LLC (each a “Co-Issuer”(the “Co-Issuers”), each a special purpose, wholly-owned indirect subsidiary of the Company, issued $1.3 billiontwo tranches of fixed rate senior secured notes, the Series 2014-1 4.277%2019-1 4.194% Fixed Rate Senior Secured Notes, Class A-2A-2-I (“Class A-2-I Notes”) in an initial aggregate principal amount of $700 million and the Series 2019-1 4.723% Fixed Rate Senior Secured Notes, Class A-2-II (“Class A-2-II Notes”) in an initial aggregate principal amount of $600 million (the “Class A-2-II Notes” and, together with the Class A-2-I Notes, the “2019 Class A-2 Notes”) in. The 2019 Class A-2 Notes were issued pursuant to an offering exempt from registration under the Securities Act. Act of 1933, as amended.
The Co-Issuers also entered into areplaced their existing revolving financing facility, of Series 2014-1the 2018-1 Variable Funding Senior Notes, Class A-1 (“2018 Class A-1 Notes”), with a new revolving financing facility, the 2019-1 Variable Funding Senior Notes, Class A-1 (the “2014 Variable Funding“2019 Class A-1 Notes”), which allowedon substantially the same terms as the 2018 Class A-1 Notes in order to conform the term of the 2019 Class A-1 Notes to the anticipated repayment dates for drawings of up to $100 million of 2014 Variable Fundingthe 2019 Class A-2 Notes. The 2019 Class A-1 Notes and the issuance of letters of credit. The2019 Class A-2 Notes and the 2014 Variable Funding Notes are referred to collectively herein as the “Notes.“New Notes.”
The New Notes were issued in a securitization transaction pursuant to which substantially all ourthe domestic revenue-generating assets and our domestic intellectual property, areas further described below, held by the Co-Issuers and certain other special-purpose, wholly-owned indirect subsidiaries of the Company (the “Guarantors”) that actwere pledged as guarantors of the Notes and that have pledged substantially all their assetscollateral to secure the New Notes.
We used the majority of the net proceeds of the offering to repay the entire outstanding balance of approximately $1.28 billion of our Series 2014-1 4.277% Fixed Rate Senior Notes, Class A-2 (the “2014 Class A-2 Notes”). We used the remaining proceeds of the offering to pay for transactions costs associated with the securitization refinancing transaction and for general corporate purposes.
2019 Class A-2 Notes
The New Notes were issued under a Base Indenture, dated as of September 30, 2014, and amended and restated as of June 5, 2019 (the “Base Indenture”), and the related Series 2014-12019-1 Supplement to the Base Indenture, dated September 30, 2014June 5, 2019 (the “Series 2014-12019-1 Supplement”), among the Co-Issuers and Citibank, N.A., as the trustee (in such capacity, the “Trustee”) and securities intermediary. The Base Indenture and the Series 2014-12019-1 Supplement (collectively, the “Indenture”) will allow the Co-Issuers to issue additional series of notes in the future subject to certain conditions set forth therein.
While the 2019 Class A-2 Notes are outstanding, payment of principal and interest is required to be made on the Class A-2 Notes on a quarterly basis. The quarterly principal payment of $3.25 millionprincipal on the 2019 Class A-2 Notes may be suspended when the leverage ratio for the Company and its subsidiaries is less than or equal to 5.25x. In general, the leverage ratio is our indebtedness divided by adjusted EBITDA for the four preceding quarterly periods. The complete definitions of all calculation elements of the leverage ratio are contained in the Base Indenture filed as Exhibit 4.1 to our Form 8-K filed with the SEC on October 3, 2014 (“Base Indenture”). Exceeding the leverage ratio of 5.25x does not violate any covenant related to the New Notes.
Our leverage ratio did not exceed 5.25x at any quarterly payment date during 2019; accordingly, we were not required to make a principal payment on either the 2019 Class A-2 Notes or the 2014 Class A-2 Notes during the year ended December 31, 2019. As of December 31, 2018, our2019, the Company's leverage ratio was 4.90x.4.57x. We made four principal payments of $3.25 million each during 2018; we do not anticipate we will be required to make any principal payments during 2019.2020.
We may voluntarily repay the New Notes at any time; however, if we repay the New Notes prior to certain dates we would be required to pay make-whole premiums. As of December 31, 2019, the make-whole premium associated with voluntary prepayment of the Class A-2-I Notes was approximately $35 million; this amount declines progressively each quarter to zero in June 2022. As of December 31, 2019, the make-whole premium associated with voluntary prepayment of the Class A-2-II Notes was approximately $63 million; this amount declines progressively each quarter to zero in June 2024. We would also be subject to a make-whole premium in the event of a mandatory prepayment required following a Rapid Amortization Event or certain asset dispositions. The mandatory make-whole premium requirements are considered derivatives embedded in the New Notes that must be bifurcated for separate valuation. We estimated the fair value of these derivatives to be immaterial as of December 31, 2019, based on the probability-weighted discounted cash flows associated with either event.
The legal final maturity of the 2019 Class A-2 Notes is in September 2044,June 2049, but it is anticipated that, unless earlier prepaid to the extent permitted under the Indenture, the Class A-2A-2-I Notes will be repaid in September 2021June 2024 (the “Class A-2A-2-I Anticipated Repayment Date”) and the Class A-2-II Notes will be repaid in June 2026 (the “Class A-2-II Anticipated Repayment Date”). If the Co-Issuers have not repaid or refinanced the Class A-2A-2-I Notes prior toby the Class A-2A-2-I Anticipated Repayment Date the interest rate onor the Class A-2A-2-II Notes will increase significantly. Specifically,by the Class A-2-II Anticipated Repayment Date, then additional interest will accrue on the Class A-2A-2-I Notes equal toand the Class A-2-II Notes, as applicable, at the greater of (i) 5.00% per annumof: (A) 5.0% and (ii) a per annum interest rate equal to(B) the amount, if any, by which the sum of the following exceeds the applicable Class A-2 Note interest rate: (A)(x) the yield to maturity (adjusted to a quarterly bond-equivalent basis) on the Class A-2 Anticipated Repayment Dateapplicable anticipated repayment date of the United States Treasury Security having a term closest to 10 years plus (B) 5.00%(y) 5.0%, plus (C) 2.150%. Additionally,(z) 2.15% for the Company's cash flow would become subject to a rapid amortization event as described below under “CovenantsClass A-2-I Notes and Restrictions.”2.64% for the Class A-2-II Notes.
2019 Class A-1 Notes
The Notes are secured by the collateral described below under “Guarantees and Collateral.”
Variable Funding Notes
In connection with the issuance of the Class A-2 Notes, the Co-Issuers also entered into a revolving financing facility, the 2019 Class A-1 Notes, that allowedallows for the drawings of up to $100$225 million of 2014 Variable Funding Notesvariable funding notes and the issuance of letters of credit. The 2014 Variable Funding2019 Class A-1 Notes were issued under the Indenture and allowed for drawings on a revolving basis. On September 5, 2018 (the “Closing Date”), the Co-Issuers entered into a financing facility that allows for drawings of up to $225 million of variable funding notes on a revolving basis and the issuance of letters of credit (the “2018 Variable Funding Notes”). The 2018 Variable Funding Notes were issued under the Base Indenture and the Series 2018-1 Supplement to the Base Indenture, dated September 5, 2018, among the Co-Issuers and Citibank, N.A., as Trustee and the 2018-1 Securities Intermediary (“Series 2018-1 Supplement”). In connection therewith, the Company terminated the corresponding Class A-1 Note Purchase Agreement.
Indenture. Drawings and certain additional terms related to the 2018 Variable Funding2019 Class A-1 Notes are governed by the 2019 Class A-1 Note Purchase Agreement, dated SeptemberJune 5, 2018,2019, among the Co-Issuers, certain special-purpose, wholly-owned indirect subsidiaries of the Company, each as a Guarantor, the Corporation,Company, as manager, certain conduit investors, financial institutions
and funding agents, and Barclays Bank PLC, as provider of letters of credit, swingline lender and administrative agent (the “2018 Purchase“Purchase Agreement”).
The 2018 Variable Funding2019 Class A-1 Notes will be governed, in part, by the 2018 Purchase Agreement and by certain generally applicable terms contained in the Base Indenture and the Series 2018-1 Supplement.Indenture. The applicable interest rate under the 2018 Variable Funding2019 Class A-1 Notes depends on the type of borrowing by the Co-Issuers. The applicable interest rate for advances is generally calculated at a per annum rate equal to the commercial paper funding rate or one-, two-, three- or six-month Eurodollar Funding Rate, in either case, plus 2.15%. There is an upfront fee of 1% and a fee of 50 basis points on any unused portion of the 2018 Variable Funding Notes facility. The applicable interest rate for swingline advances and unreimbursed draws on outstanding letters of credit is a per annum base rate equal to the sum of (a) 1.15% plus (b) the greatergreatest of (i) the Prime Rate in effect from time to time, (ii) the Federal Funds Rate in effect from time to time plus 0.50% and (iii) the one-month Eurodollar Funding Rate plus 1.00%. There is no upfront fee for the 2019 Class A-1 Notes. There is a fee of 50 basis points on any unused portion of the 2019 Class A-1 Notes facility. Undrawn face amounts of outstanding letters of credit that are not cash collateralized accrue a fee of 2.15% per annum. It is anticipated that the principal and interest on the 2018 Variable Funding2019 Class A-1 Notes will be repaid in full on or prior to September 7, 2021the quarterly payment date in June 2024 (the “Anticipated“2019 Class A-1 Anticipated Repayment Date”), subject to fourtwo additional one-year extensions at the option of the Company upon the satisfaction of certain conditions. The 2018 Variable Funding Notes
Guarantee and other credit instruments issued under the 2018 PurchaseCollateral Agreement are secured by the collateral described in the Base Indenture and
Under the Guarantee and Collateral Agreement, dated September 30, 2014, by certain special-purpose, wholly-owned indirect subsidiariesas amended and restated as of June 5, 2019, among the Company, each as a Guarantor,Guarantors in favor of Citibank, N.A., asthe Trustee, (the “Guarantee and Collateral Agreement”).
In connection with the above transaction, the Company also amended and restated the Management Agreement, dated September 30, 2014 (the “Management Agreement”), among the Co-Issuers, other securitization entities party thereto from time to time, the Company, Applebee’s Services, Inc. and International House of Pancakes, LLC as Sub-managers and Citibank, N.A., as Trustee, to revise the calculation of the weekly management fee and to make certain other revisions. The Company also amended the Base Indenture to, among other things, make certain administrative and definitional updates.
Prior to the termination of the 2014 Purchase Agreement referenced above, during fiscal 2018 we borrowed and repaid a total of $30.0 million in 2014 Variable Funding Notes, inclusive of $20.0 million repaid September 5, 2018 representing the entire then-outstanding principal amount of the 2014 Variable Funding Notes. The maximum amount of 2014 Variable Funding Notes outstanding during the year ended December 31, 2018 was $30.0 million and the weighted average interest rate on 2014 Variable Funding Notes outstanding during the year ended December 31, 2018 was 4.5%.
During the year ended December 31, 2018 we borrowed $45.0 million in 2018 Variable Notes and repaid $20.0 million, leaving $25.0 million outstanding at December 31, 2018. The maximum amount of 2018 Variable Funding Notes outstanding during the year ended December 31, 2018 was $25.0 million and the weighted average interest rate on the 2018 Variable Funding Notes for the period outstanding was 4.93%. Additionally, at December 31, 2018, $3.1 million was pledged against the 2018 Variable Funding Notes for outstanding letters of credit, leaving $196.9 million of 2018 Variable Funding Notes available for borrowings. The letters of credit are used primarily to satisfy insurance-related collateral requirements.
We incurred costs of approximately $3.6 million in connection with the establishment of the 2018 Variable Funding Notes facility. These debt issuance costs are being amortized using the effective interest method over the estimated three-year life of the 2018 Variable Funding Notes. Unamortized debt issuance costs of $3.3 million are reported as other long-term assets in the Consolidated Balance Sheets at December 31, 2018.
In connection with the termination referenced above of the 2014 Purchase Agreement, we recognized as expense $0.9 million of unamortized debt issuance costs associated with the 2014 Variable Funding Notes. In addition, we incurred costs of $1.6 million associated with the evaluation of various alternatives for refinancing our securitized indebtedness that were also charged to expense. These costs totaling $2.5 million are reported as “Debt refinancing costs” in the Consolidated Statements of Comprehensive Income (Loss).
Guaranteesand Collateral
Under the Guarantee and Collateral Agreement, the Guarantors guarantee the obligations of the Co-Issuers under the Indenture and related documents and secure the guarantee by granting a security interest in substantially all of their assets.
The New Notes are secured by a security interest in substantially all of the assets of the Co-Issuers and the Guarantors (collectively, the “Securitization Entities”). As of September 30, 2014,On the Closing Date, these assets (the “Securitized Assets”) generally included substantially all of the domestic revenue-generating assets of the Company and its subsidiaries, which principally consist of franchise agreements, area license agreements, development agreements, franchisee fee notes, equipment leases, agreements related to the domestic production of and the sale of pancake and waffle dry-mixes, owned and leased real property and intellectual property.
The New Notes are the obligations only of the Co-Issuers pursuant to the Indenture and are unconditionally and irrevocably guaranteed by the Guarantors pursuant to the Guarantee and Collateral Agreement. Except as described below, neither wethe Company nor any subsidiary of our subsidiaries,the Company, other than the Securitization Entities, will guarantee or in any way arebe liable for the obligations of the Co-Issuers under the Indenture or the New Notes.
Management Agreement
Under the terms of the Management Agreement, dated September 30, 2014, as amended and restated as of September 5, 2018, as further amended and restated as of June 5, 2019 and as amended by that certain Amendment No. 1 to Management Agreement dated November 21, 2019, among the Company, the Securitization Entities, Applebee’s Services, Inc., International House of Pancakes, LLC and the Trustee, the Company will act as the manager with respect to the Securitized Assets. The primary responsibilities of the manager will be to perform certain franchising, distribution, intellectual property and operational functions on behalf of the Securitization Entities with respect to the Securitized Assets pursuant to the Management Agreement. The manager will be entitled to the payment of the weekly management fee, as set forth in the Management Agreement and will be subject to the liabilities set forth in the Management Agreement.
The manager will manage and administer the Securitized Assets in accordance with the terms of the Management Agreement and, except as otherwise provided in the Management Agreement, the management standards set forth in the Management Agreement. Subject to limited exceptions set forth in the Management Agreement, the Management Agreement does not require the manager to expend or risk its funds or otherwise incur any financial liability in the performance of any of its rights or powers under the Management Agreement if the manager has reasonable grounds for believing that repayment of such funds or adequate indemnity against such risk or liability is not compensated by payment of the weekly management fee or is otherwise not reasonably assured or provided to it.
Subject to limited exceptions set forth in the Management Agreement, the manager will indemnify each Securitization Entity, the Trustee and certain other parties, and their respective officers, directors, employees and agents for all claims, penalties, fines, forfeitures, losses, liabilities, obligations, damages, actions, suits and related costs and judgments and other costs, fees and reasonable expenses that any of them may incur as a result of (a) failure of the manager to perform or observe its obligations under the Management Agreement, (b) the breach by the manager of any representation, warranty or covenant under the Management Agreement, or (c) the manager’s negligence, bad faith or willful misconduct in the performance of its duties under the Management Agreement.
Covenants and Restrictions
The New Notes are subject to a series of covenants and restrictions customary for transactions of this type, includingincluding: (i) that the Co-Issuers maintain specified reserve accounts to be used to make required payments in respect of the New Notes, (ii) provisions relating to optional and mandatory prepayments, and the related payment of specified amounts, including specified make-whole paymentscall redemption premiums in the case of the Class A-2 Notes under certain circumstances,circumstances; (iii) certain indemnification payments in the event, among other things, the transfers of the assets pledged as collateral for the New Notes are in stated ways defective or ineffective and (iv) covenants relating to recordkeeping, access to information and similar matters. The New Notes are also subject to customary rapid amortization events provided for in the Indenture, including events tied to failure of the Securitization Entities to maintain the stated debt service coverage ratio (“DSCR”) ratio,, the trailing-twelve-month sum of domestic retail sales for all restaurants being below $3.5 billioncertain levels on quarterlycertain measurement dates, certain manager termination events, certain events of default and the failure to repay or refinance the Class A-2 Notes on the Class A-2 Anticipated Repayment Date.anticipated repayment dates. The New Notes are also subject to certain customary events of default, including events relating to non-payment of required interest, principal or other amounts due on or with respect to the New Notes, failure of the Securitization Entities to maintain the stated debt service coverage ratio,DSCR, failure to comply with covenants within certain time frames, certain bankruptcy events, breaches of specified representations and warranties and certain judgments.
The DSCR ratio is Net Cash Flow for the four quarters preceding the calculation date divided by the total debt service payments of the preceding four quarters. The complete definitions of the DSCR and all calculation elements are contained in the Base Indenture. Failure to maintain a prescribed DSCR ratio can trigger a Cash TrappingFlow Sweeping Event, Aa Rapid Amortization Event, a Manager Termination Event or a Default Event as described below. In a Cash TrappingFlow Sweeping Event, the Trustee is required to retain a certain percentage50% of cash flowexcess Cash Flow (as defined in the New Notes) in a restricted account. In a Rapid Amortization Event, all excess Cash Flow is retained and used to retire principal amounts of debt.
Key DSCR ratiosDSCRs are as follows:
•DSCR less than 1.75x but equal to or greater than 1.50x - Cash TrappingFlow Sweeping Event 50% of Net Cash Flow
•DSCR less than 1.50x - Cash Trapping Event, 100% of Net Cash Flow
•DSCR less than 1.30x1.20x - Rapid Amortization Event
•Interest-only DSCR less than 1.20x - Manager Termination Event
•Interest-only DSCR less than 1.10x - Default Event
Our DSCR for the reporting period ended December 31, 2019 was 4.27x.
Use of Credit Facilities
We have not drawn on the 2019 Class A-1 Notes subsequent to their June 5, 2019, issuance. At December 31, 2019, $2.8 million was pledged against the 2019 Class A-1 Notes for outstanding letters of credit, leaving $222.2 million of 2019 Class A-1 Notes available for borrowing. The letters of credit are used primarily to satisfy insurance-related collateral requirements.
During the year ended December 31, 2019, we repaid $25.0 million of 2018 Class A-1 Notes, representing the amount outstanding at December 31, 2018; we did not draw on the 2018 Class A-1 Notes during 2019 prior to their replacement on June 5, 2019. The maximum amount of 2018 Class A-1 Notes outstanding during the period from January 1, 2019 to June 5, 2019 was 4.58x.$25.0 million and the weighted average interest rate on the 2018 Class A-1 Note for the period outstanding was 4.88%.
Loss on Extinguishment of Debt
In connection with the repayment of the 2014 Class A-2 Notes, the Company recognized a loss on extinguishment of debt of $8.3 million, representing the remaining unamortized costs related to the 2014 Class A-2 Notes. Prior to the extinguishment on June 5, 2019, amortization costs of $1.4 million associated with the 2014 Class A-2 Notes were included in interest expense for the year ended December 31, 2019.
Debt Issuance Costs
We incurred costs of approximately $12.9 million in connection with the issuance of the 2019 Class A-2 Notes. These debt issuance costs are being amortized using the effective interest method over the estimated life of each tranche of the 2019 Class A-2 Notes. Amortization costs of $1.2 million were included in interest expense for the year ended December 31, 2019. Unamortized debt issuance costs of $11.8 million are reported as a direct reduction of the Class A-2 Notes in the Consolidated Balance Sheets.
We incurred costs of approximately $0.2 million in connection with the replacement of the 2018-1 Class A-1 Notes with the 2019 Class A-1 Notes. These debt issuance costs have been added to the remaining unamortized costs of approximately $2.8 million related to the 2018 Class A-1 Notes, the total of which costs is now being amortized using the effective interest method over the estimated five-year life of the 2019 Class A-1 Notes. Amortization costs of $0.8 million were included in interest expense for the year ended December 31, 2019.
Unamortized debt issuance costs of $2.7 million related to the 2019-1 Class A-1 Notes are reported as other long-term assets in the Consolidated Balance Sheets at December 31, 2019.
Based on our current level of operations, we believe that our cash flow from operations, available cash and available borrowingsborrowing capacity under our 2018 Variable Funding2019 Class A-1 Notes will be adequate to meet our liquidity needs during 2019.2020.
We will be required to adopt new guidance with respect to accounting for leases beginning with the first fiscal quarter of 2019. Upon implementation of the guidance, lease-related liabilities will be recognized at the present value of the remaining contractual fixed lease payments, discounted using the Company’s incremental borrowing rate. Lease-related assets, or right-of-use assets, will be recognized at an amount equal to the respective lease liabilities, adjusted for accrued lease payments, lease incentives and impairment due shortfall of projected amounts to be received compared to projected amounts to be paid in lease/sublease agreements. The Company expects adoption of the standard will have the impact of increasing its consolidated assets and liabilities by approximately $400 million. We do not believe there will be a material impact on out Consolidated Statements of Comprehensive Income (Loss) or Consolidated Statements of Cash Flows. Recognition of a lease liability related to operating leases will not impact any covenants related to our long-term debt because our debt agreements specify that covenant ratios be calculated using U.S. GAAP in effect at the time the debt agreements were entered.
| | | Cash Flows | | | | Favorable
(Unfavorable) Variance | | | | Favorable
(Unfavorable) Variance | | | | | | Favorable
(Unfavorable) Variance | | | | Favorable
(Unfavorable) Variance | | |
| | | 2018 | | 2017 | | 2016 | | 2019 | | 2018 | | 2017 |
| | | (In millions) | | (In millions) |
| Net cash provided by operating activities | | $ | 140.3 |
| | $ | 74.6 |
| | $ | 65.7 |
| | $ | (52.4 | ) | | $ | 118.1 |
| | $ | 155.2 |
| | $ | 14.9 |
| | $ | 140.3 |
| | $ | 74.6 |
| | $ | 65.7 |
|
| Net cash (used in) provided by investing activities | | (14.8 | ) | | (22.5 | ) | | 7.7 |
| | (4.8 | ) | | 12.5 |
| | (0.2 | ) | | 14.6 |
| | (14.8 | ) | | (22.5 | ) | | 7.7 |
|
| Net cash used in financing activities | | (88.3 | ) | | 7.5 |
| | (95.8 | ) | | 41.4 |
| | (137.2 | ) | | (182.9 | ) | | (94.6 | ) | | (88.3 | ) | | 7.5 |
| | (95.8 | ) |
| Net increase (decrease) in cash, cash equivalents and restricted cash | | $ | 37.2 |
| | $ | 59.6 |
| | $ | (22.4 | ) | | $ | (15.8 | ) | | $ | (6.6 | ) | | $ | (27.9 | ) | | $ | (65.1 | ) | | $ | 37.2 |
| | $ | 59.6 |
| | $ | (22.4 | ) |
Operating Activities
Cash provided by operating activities is primarily driven by revenues earned and collected from our franchisees, and profit from our company-owned restaurant, rental operations and financing operations. Franchise revenues primarily consist of royalties, advertising and franchise fees from Applebee's and IHOP franchised restaurants and sales of proprietary products by IHOP, each of which fluctuates with increases or decreases in franchise retail sales. Franchise retail sales are impacted by the development of IHOP and Applebee's restaurants by our franchisees and by fluctuations in same-restaurant sales. Rental operations profit is rental income less rental expenses. Rental income includes revenues from operating leases and interest income from direct financing leases. Rental income is impacted by fluctuations in same-restaurant sales as some operating leases include a provision for contingent rent based on retail sales and by a progressive decline in rental income as leases expire. Rental expenses are costs of prime operating leases and interest expense on prime capital leases on franchisee-operated restaurants. Interest expense on prime capital leases also declines progressively as lease obligations are repaid. Financing operations revenue consists of interest income from the financing of franchise fees and equipment leases as well as periodic sales of restaurant equipment. Financing income is impacted by a progressive decline in interest revenue as the obligations financed are repaid. Financing expenses are primarily the cost of restaurant equipment.
Cash provided by operating activities increased $74.6$14.9 million in 20182019 compared to 2017. Our2018. The components of that change are as follows:
|
| | | | | | | | | | | | |
| | | | | Favorable
(Unfavorable) Variance | | |
| | | 2019 | | | 2018 |
| | | (In millions) |
| Net income | | $ | 104.3 |
| | $ | 23.9 |
| | $ | 80.4 |
|
| Non-cash reconciling items | | 47.6 |
| | 18.1 |
| | 29.5 |
|
| Changes in working capital | | 3.3 |
| | (27.1 | ) | | 30.4 |
|
| Cash provided by operating activities | | $ | 155.2 |
| | $ | 14.9 |
| | $ | 140.3 |
|
The change in net income plus the non-cashwas primarily due to increased profit from franchise operations and lower G&A expenses, each of which was discussed in preceding sections of this MD&A.
Non-cash reconciling items shown in our statements(primarily depreciation and amortization, deferred taxes, loss on extinguishment of cash flows (primarily impairment charges, depreciation, deferred taxesdebt and stock-based compensation) increased $25.818.1 million from 2017. This change2018. Our depreciation and amortization charges were higher in 2019 compared to 2018 because we operated 69 Applebee's restaurants for 12 months in 2019 as opposed to operating them for less than one month in 2018. Depreciation on capitalized software was primarilyalso higher due to an increaseadditional investment in gross profit and a lower corporate tax rate. Additionally, netconsumer-facing information technology.
Net changes in working capital provided cash of $3.3 million during 2019 compared to providing cash of $30.4 million during 2018 compared to using cash of $18.4 million during 2017.2018. This favorableunfavorable change of $48.8$27.1 million between years primarily resulted from an increase in payments for incentive compensation and the timing of prepaid rent, (a favorable change between years of approximately $16 million), the change in net income tax receivables (favorable $16 million), the increased accrual of incentive compensation to be paid in 2019 (favorable $14 million) and a favorable change in accounts receivable of $12 million due to improved collections from Applebee's franchisees. These favorable changes were partially offset by a $17 million unfavorable change between years in accounts payable, primarily due to the timing of payments forof marketing accruals.
Cash provided by operating activities decreased $52.4 million Incentive compensation payments made in 2017 compared2019 (earned in 2018) were larger than those made in 2018 (earned in 2017). In addition, cash collections of past-due accounts receivable that took place in 2018 did not recur to 2016. Our net income plus the non-cash reconciling items shownsame degree in our statements of cash flows (primarily impairment charges, depreciation, deferred taxes and stock-based compensation) decreased $45.8 million from 2016. This decrease was primarily due to a decline in gross profit from Applebee's franchise operations and the increase in G&A expenses discussed in preceding sections2019 because of the MD&A. Additionally, net changes in working capital used cash of $18.4 million during 2017 compared to using cash of $11.8 million during 2016. This unfavorable change of $6.6 million primarily resulted from an increase in accounts receivable of $12 million, an increase in current tax assets and liabilities of $8 million and the prepayment of approximately $8 million in rent, partially offset by a decrease in payments of incentive compensation (smaller paymentsoverall improvement in the first quarterfinancial health of 2017 for 2016 bonuses compared to first quarter 2016 payments for 2015 bonuses). The increase in accounts receivable was due in part slow payment of receivables by certain Applebee's franchisees.
Investing Activities
Net cash used in investing activities in 2018 was primarily attributable2019 decreased by $14.6 million compared to our acquisition2018. The components of that change are as follows:
|
| | | | | | | | | | | | |
| | | | | Favorable
(Unfavorable) Variance | | |
| | | 2019 | | | 2018 |
| | | (In millions) |
| Principal receipts from notes, equipment contracts and other long-term receivables | | $ | 24.1 |
| | $ | (1.7 | ) | | $ | 25.8 |
|
| Additions to property and equipment | | (19.4 | ) | | (5.1 | ) | | (14.3 | ) |
| Acquisition of business | | — |
| | 20.2 |
| | (20.2 | ) |
| Additions to long-term receivables | | (7.0 | ) | | (0.5 | ) | | (6.5 | ) |
| Other | | 2.2 |
| | 1.8 |
| | 0.4 |
|
| Cash provided by operating activities | | $ | (0.2 | ) | | $ | 14.6 |
| | $ | (14.8 | ) |
The Company acquired 69 Applebee's restaurants for $20.2 million in 2018 (See Note 18 - Acquisition of Business, of the Notes to Consolidated Financial Statements), capital expenditures of $14.3 million but had no acquisitions in 2019. Additions to property and loans to franchisees of $6.5 million. These investing outflows were partially offset by $25.8equipment increased
$5.1 million, of principal receipts fromwhich approximately $3.2 million related to the 69 restaurants acquired in 2018; the remainder of the increase related to increased investment in consumer-facing information technology.
The Company has notes equipment contracts and other long-term receivables.
Net cash provided by investing activities in 2017 was primarily attributable to $20.5 million of principal receipts from notes, equipment contracts andvarious other long-term receivables partially offset by $13.3from franchisees totaling $$118.5 million of capital expenditures. The increase in capital expenditures compared to 2016 was primarily due to spending in information technology infrastructure projects.
at December 31, 2019. The following table represents the timing of principal receipts on various long-term receivables due from our franchisees as of December 31, 2018:these receivables:
| | | | Principal Receipts Due By Period | Principal Receipts Due By Period |
| | 2019 | | 2020 | | 2021 | | 2022 | | 2023 | | Thereafter | | Total | 2020 | | 2021 | | 2022 | | 2023 | | 2024 | | Thereafter | | Total |
| | (In millions) | (In millions) |
Equipment leases(1) | $ | 8.5 |
| | $ | 9.0 |
| | $ | 8.9 |
| | $ | 8.6 |
| | $ | 8.1 |
| | $ | 22.7 |
| | $ | 65.8 |
| $ | 9.0 |
| | $ | 8.7 |
| | $ | 8.5 |
| | $ | 7.9 |
| | $ | 7.2 |
| | $ | 15.0 |
| | $ | 56.3 |
|
Direct financing leases(2) | 11.2 |
| | 11.2 |
| | 9.6 |
| | 7.2 |
| | 3.1 |
| | 2.6 |
| | 44.9 |
| 11.0 |
| | 9.4 |
| | 7.2 |
| | 3.2 |
| | 1.1 |
| | 2.1 |
| | 34.0 |
|
Other notes(3) | 4.8 |
| | 5.2 |
| | 4.4 |
| | 4.1 |
| | 3.9 |
| | 6.6 |
| | 29.0 |
| 4.6 |
| | 4.1 |
| | 7.8 |
| | 3.8 |
| | 3.7 |
| | 4.2 |
| | 28.2 |
|
| Total | $ | 24.5 |
| | $ | 25.4 |
| | $ | 22.9 |
| | $ | 19.9 |
| | $ | 15.1 |
| | $ | 31.9 |
| | $ | 139.7 |
| $ | 24.6 |
| | $ | 22.2 |
| | $ | 23.5 |
| | $ | 14.9 |
| | $ | 12.0 |
| | $ | 21.3 |
| | $ | 118.5 |
|
| |
(1) | Equipment lease receivables extend through the year 2029. |
| |
(2) | Direct financing lease receivables extend through the year 2036.2038. |
| |
(3) | Other notes receivable extend through the year 20282024. |
Financing Activities
Financing activitiesNet cash used net cash of $88.3 million during 2018. The primary uses of cash in financing activities consistedincreased $94.6 million during 2019 as compared to 2018. The components of that change are as follows:
|
| | | | | | | | | | | | |
| | | | | (Increase) decrease in cash used | | |
| | | 2019 | | | 2018 |
| | | (In millions) |
| Repurchase of common stock | | $ | (109.7 | ) | | $ | (76.1 | ) | | $ | (33.6 | ) |
| Dividends paid | | (46.9 | ) | | 4.2 |
| | (51.1 | ) |
| Net issuance (payments) of long-term debt, including issuance costs | | 3.1 |
| | 19.7 |
| | (16.6 | ) |
| Net (payment) borrowing of revolving credit | | (25.0 | ) | | (50.0 | ) | | 25.0 |
|
| All other | | (4.4 | ) | | 7.6 |
| | (12.0 | ) |
| Cash used in financing activities | | $ | (182.9 | ) | | $ | (94.6 | ) | | $ | (88.3 | ) |
Resolution of issues related to the financial health of certain Applebee's franchisees enabled us to increase our return of cash to shareholders in the form of repurchases of common stock. Our dividends paid declined due to stockholders totaling $51.1 million, repurchasesa decrease in total dividends paid per share ($2.70 per share in 2019 compared to $2.86 per share in 2018) and a decrease in the number of our common stock totaling $33.6 million repaymentsshares outstanding. Note that dividends declared during 2019 increased by 10% to $2.76 per share (four quarterly declarations of capital lease obligations$0.69 per share) from dividends declared of $13.9 million, repayment$2.52 per share (four quarterly declarations of long-term debt$0.63 per share). However, dividends paid in 2018 included a dividend of $13.0 million$0.97 declared in the fourth quarter of 2017. See Note 12 - Stockholders' Deficit, of the Notes to the Consolidated Financial Statements included in this report for additional detail on the timing of the declaration and payment of issuance costsdividends. We evaluate dividend payments on common stock and repurchases of common stock within the 2018 Variable Funding Notescontext of $3.6 million. These outflows were partially offset by net borrowings under revolving credit facilitiesour overall capital allocation strategy with our Board of $25.0 millionDirectors on an ongoing basis, giving consideration to our current and a netforecast earnings, financial condition, cash inflowrequirements and other factors. There can be no assurance that we will continue to pay such dividends or the amount of $2.0 millionsuch dividends or repurchase common stock or the amount of such repurchases.
Net cash related to equity awards.long-term debt improved in 2019 compared to 2018, primarily because we were not required to make any principal payments in 2019. As discussed above under “Class A-2 Notes,“Long-Term Debt,” we must make a principal payment on long-term debt of $3.25 million each quarter if our leverage ratio is greater than 5.25x. We were not required to make any principal payments in 2019; we made four such payments totaling $13.0 million in 2018. We do not anticipate we will be required to make any such payments in 2020.
As discussed above under “Use of Credit Facilities,” we did not utilize our credit facility during 2019 and we repaid the outstanding balance at December 31, 2018 in January 2019.
Financing activities used net cash of $95.8 million during 2017. The primary uses ofreason for the decrease in other cash used in financing activities consistedwas an increase of $8.0 million in proceeds from exercise of stock options. A decision as to the exercise of a stock option is that of the individual option holder, but we believe the increase in cash dividends paidfrom the exercise of options was due in part to stockholders totaling $69.8 million, repayments of capital lease and financing obligations of $12.9 million, repurchases ofan increase in our common stock totaling $10.0 million and a repayment of long-term debt of $3.25 million. There was a net cash inflow of $0.2 million relatedprice during 2019 as compared to equity awards.2018.
Adjusted Free Cash Flow
We define “adjusted free cash flow” for a given period as cash provided by operating activities, plus receipts from notes and equipment contract receivables, less additions to property and equipment. Management uses this liquidity measure in its periodic assessments of, among other things, the amount of cash dividends per share of common stock and repurchases of common stock and we believe it is important for investors to have the same measure used by management for that purpose. Adjusted free cash flow does not represent residual cash flow available for discretionary purposes.
Adjusted free cash flow is a non-U.S. GAAP measure. This non-U.S. GAAP measure is not defined in the same manner by all companies and may not be comparable to other similarly titled measures of other companies. Non-U.S. GAAP measures should be considered in addition to, and not as a substitute for, the U.S. GAAP information contained within our financial statements. Reconciliation of the cash provided by operating activities to adjusted free cash flow is as follows:
| | | | | | Favorable
(Unfavorable) Variance | | | | Favorable
(Unfavorable) Variance | | | | | Favorable
(Unfavorable) Variance | | | | Favorable
(Unfavorable) Variance | | |
| | 2018 | | 2017 | | 2016 | 2019 | | 2018 | | 2017 |
| | (In millions) | (In millions) |
| Cash flows provided by operating activities | $ | 140.3 |
| | $ | 74.6 |
| | $ | 65.7 |
| | $ | (52.4 | ) | | $ | 118.1 |
| $ | 155.2 |
| | $ | 14.9 |
| | $ | 140.3 |
| | $ | 74.6 |
| | $ | 65.7 |
|
| Net receipts from notes and equipment receivables | 14.9 |
| | 4.3 |
| | 10.6 |
| | 0.6 |
| | 10.0 |
| 13.0 |
| | (1.9 | ) | | 14.9 |
| | 4.3 |
| | 10.6 |
|
| Additions to property and equipment | (14.3 | ) | | (1.0 | ) | | (13.3 | ) | | (7.7 | ) | | (5.6 | ) | (19.4 | ) | | (5.1 | ) | | (14.3 | ) | | (1.0 | ) | | (13.3 | ) |
| Adjusted free cash flow | $ | 140.9 |
| | $ | 77.9 |
| | $ | 63.0 |
| | $ | (59.5 | ) | | $ | 122.5 |
| $ | 148.8 |
| | $ | 7.9 |
| | $ | 140.9 |
| | $ | 77.9 |
| | $ | 63.0 |
|
The increase in adjusted free cash flow in 20182019 compared to 20172018 was primarily due to the increase in cash provided by operating activities, discussed above and the balloon payoff of one equipment contract receivable. The decrease in adjusted free cash flow in 2017 compared to 2016 was primarily due to the decrease in cash providedpartially offset by operating activities discussed above and an increase in capital expenditures.expenditures, each of which was discussed in preceding sections of this MD&A.
At December 31, 20182019, our cash and cash equivalents totaled $137.2116.0 million, including $52.2$56.6 million of cash held for gift card programs and IHOP advertising funds.
Capital Allocation
Dividends
During the fiscal years ended December 31, 2019, 2018 2017 and 2016,2017, we declared and paid dividends on common stock as shown in Note 12 - Stockholders' Deficit, of the Notes to the Consolidated Financial Statements included in this report.
On February 20, 2019,2020, our Board of Directors approved payment of a cash dividend of $0.69$0.76 per share of common stock, payable at the close of business on April 5, 20193, 2020 to the stockholders of record as of the close of business on March 20, 2019.2020.
Share Repurchases
In October 2015, the Company'sFebruary 2019, our Board of Directors approved a stock repurchase program authorizing the Company to repurchase up to $150 million of the Company's common stock (the “2015 Repurchase Program”) on an opportunistic basis from time to time in open market transactions and in privately negotiated transactions based on business, market, applicable legal requirements and other considerations. The 2015 Repurchase Program, as approved by the Board of Directors, does not require the repurchase of a specific number of shares and can be terminated at any time. In February 2019, the Company’s Board of Directors approved a stock repurchase program authorizing the Companyus to repurchase up to $200 million of the Company’sour common stock (“2019(the “2019 Repurchase Program”) on an opportunistic basis from time to time in the open market or in privately negotiated transactions based on business, market, applicable legal requirements and other considerations. The 2019 Repurchase Program, as approved by the Board of Directors, does not require the repurchase of a specific number of shares and can be terminated at any time.
In October 2015, our Board of Directors approved a stock repurchase program authorizing us to repurchase up to $150 million of our common stock (the “2015 Repurchase Program”) on an opportunistic basis from time to time in open market transactions and in privately negotiated transactions based on business, market, applicable legal requirements and other considerations. The 2015 Repurchase Program, as approved by the Board of Directors, did not require the repurchase of a specific number of shares and could be terminated at any time. In connection with the approval of the 2019 Repurchase Program, the Board of Directors terminated the prior repurchase program approved2015 Repurchase Program in October 2015 which had authorized the Company to repurchase up to $150 million of the Company’s common stock.February 2019.
A summary of shares repurchased under the 2019 Repurchase Program and the 2015 Repurchase Program, during the year ended December 31, 20182019 and cumulatively, is as follows:
|
| | | | | | |
| 2015 Repurchase Program | Shares | | Cost of shares |
| | | | (In millions) |
| Repurchased during the year ended December 31, 2018 | 478,839 |
| | $ | 34.9 |
|
| Cumulative repurchases as of December 31, 2018 | 1,479,496 |
| | $ | 117.8 |
|
| Remaining dollar value of shares that may be repurchased | n/a | | $ | 32.2 |
|
|
| | | | | | |
| | Shares | | Cost of shares |
| | | | (In millions) |
| 2019 Repurchase Program: | | | |
| Repurchased during the year ended December 31, 2019 | 1,237,698 |
| | $ | 103.3 |
|
| Cumulative (life-of-program) repurchases | 1,237,698 |
| | $ | 103.3 |
|
| Remaining dollar value of shares that may be repurchased | n/a | | $ | 96.7 |
|
| | | | |
| 2015 Repurchase Program: | | | |
| Repurchased during the year ended December 31, 2019 | 110,499 |
| | $ | 8.4 |
|
| Cumulative (life-of-program) repurchases | 1,589,995 |
| | $ | 126.2 |
|
| Remaining dollar value of shares that may be repurchased | n/a | | n/a |
We evaluate dividend payments on common stock and repurchases of common stock within the context of our overall capital allocation strategy with our Board of Directors on an ongoing basis, giving consideration to our current and forecast earnings, financial condition, cash requirements and other factors. There can be no assurance that we will continue to pay such dividends or the amount of such dividends.
From time to time, we also repurchase shares owned and tendered by employees to satisfy tax withholding obligations on the vesting of restricted stock awards. Shares are deemed purchased at the closing price of our common stock on the vesting date. See Part II, Item 5 for detail on all share repurchase activity during the fourth quarter of 2018.2019.
Off-Balance Sheet Arrangements
We have obligations for guarantees on certain franchisee lease agreements, as disclosed below in “Contractual Obligations and Commitments” and Note 11 - Commitments and Contingencies, of the Notes to Consolidated Financial Statements. Other than such guarantees, we did not have any off-balance sheet arrangements, as defined in Item 303(a)(4) of SEC Regulation S-K as of December 31, 20182019.
Contractual Obligations and Commitments
The following are our significant contractual obligations and commitments as of December 31, 20182019:
| | | | Payments Due By Period | Payments Due By Period |
| Contractual Obligations | 1 Year | | 2 - 3 Years | | 4 - 5 Years | | More than 5 Years | | Total | 1 Year | | 2 - 3 Years | | 4 - 5 Years | | More than 5 Years | | Total |
| | (In millions) | (In millions) |
Debt(1) | $ | 79.9 |
| | $ | 1,379.8 |
| | $ | — |
| | $ | — |
| | $ | 1,459.7 |
| $ | 57.7 |
| | $ | 115.4 |
| | $ | 800.7 |
| | $ | 628.3 |
| | $ | 1,602.1 |
|
Operating leases | 91.2 |
| | 168.4 |
| | 122.8 |
| | 210.6 |
| | 593.0 |
| 97.4 |
| | 154.4 |
| | 115.6 |
| | 173.0 |
| | 540.4 |
|
Capital leases(1) | 21.0 |
| | 35.4 |
| | 25.9 |
| | 63.5 |
| | 145.8 |
| |
Finance leases(1) | | 19.9 |
| | 31.1 |
| | 20.9 |
| | 55.7 |
| | 127.6 |
|
Financing obligations(1) | 5.1 |
| | 10.7 |
| | 10.1 |
| | 50.4 |
| | 76.3 |
| 5.6 |
| | 10.3 |
| | 10.6 |
| | 44.8 |
| | 71.3 |
|
| Purchase commitments | 171.2 |
| | 0.1 |
| | — |
| | — |
| | 171.3 |
| 103.6 |
| | 12.3 |
| | — |
| | — |
| | 115.9 |
|
Unrecognized income tax benefits(2)(3) | 1.0 |
| | — |
| | — |
| | 4.2 |
| | 5.2 |
| 1.5 |
| | — |
| | — |
| | 6.1 |
| | 7.6 |
|
| Total minimum payments | 369.4 |
| | 1,594.4 |
| | 158.8 |
| | 328.7 |
| | 2,451.3 |
| 285.7 |
| | 323.5 |
| | 947.8 |
| | 907.9 |
| | 2,464.9 |
|
| Less interest | (66.7 | ) | | (116.4 | ) | | (15.2 | ) | | (30.2 | ) | | (228.5 | ) | (94.0 | ) | | (167.9 | ) | | (135.4 | ) | | (83.4 | ) | | (480.7 | ) |
| Total | $ | 302.7 |
| | $ | 1,478.0 |
| | $ | 143.6 |
| | $ | 298.5 |
| | $ | 2,222.8 |
| $ | 191.7 |
| | $ | 155.6 |
| | $ | 812.4 |
| | $ | 824.5 |
| | $ | 1,984.2 |
|
(1) Includes interest calculated on balances as of December 31, 20182019 using interest rates in effect as of December 31, 2018.2019.
(2) Includes interest calculated on balances as of December 31, 2019 using interest rates used to calculate operating lease liability.
(3) While up to $1.0$1.5 million is expected to be paid within one year, there is no contractual obligation to do so. For the remaining liability, due to the uncertainties related to these tax matters, we are unable to make a reasonably reliable estimate when a cash settlement with a taxing authority will occur.
| | | | Expiration By Period | Expiration By Period |
| Commitments | 1 Year | | 2 - 3 Years | | 4 - 5 Years | | More than 5 Years | | Total | 1 Year | | 2 - 3 Years | | 4 - 5 Years | | More than 5 Years | | Total |
| | (In millions) | (In millions) |
Lease guarantees(3)(4) | $ | 16.7 |
| | $ | 31.3 |
| | $ | 29.2 |
| | $ | 207.1 |
| | $ | 284.3 |
| $ | 15.5 |
| | $ | 29.7 |
| | $ | 26.9 |
| | $ | 185.1 |
| | $ | 257.2 |
|
Letters of credit(4)(5) | 3.1 |
| | — |
| | — |
| | — |
| | 3.1 |
| 2.8 |
| | — |
| | — |
| | — |
| | 2.8 |
|
Food purchases(5)(6) | 8.4 |
| | — |
| | — |
| | — |
| | 8.4 |
| 2.6 |
| | — |
| | — |
| | — |
| | 2.6 |
|
| Total | $ | 28.2 |
| | $ | 31.3 |
| | $ | 29.2 |
| | $ | 207.1 |
| | $ | 295.8 |
| $ | 20.9 |
| | $ | 29.7 |
| | $ | 26.9 |
| | $ | 185.1 |
| | $ | 262.6 |
|
(3)(4) This amount represents the maximum potential liability for future payment guarantees under leases that have been assigned to third-party buyers of Applebee's company-operated restaurants and expire at the end of the respective lease terms, which range from 20182020 through 2048. See Note 11 - Commitments and Contingencies, of the Notes to Consolidated Financial Statements for additional information.
(4)(5) Primarily used to satisfy insurance-related collateral requirements. These letters of credit expire annually, but typically are typically renewed in the same amount each year unless collateral requirements change.
(5)(6) In some instances, IHOP and Applebee's may be required to guarantee their purchase of any remaining inventory of certain food and other items purchased by CSCS.
Critical Accounting Policies and Estimates
We prepare our consolidated financial statements in accordance with GAAP. Our significant accounting policies are comprehensively described in Note 2 - Basis of Presentation and Significant Accounting Policies, of the Notes to the Consolidated Financial Statements. We believe the accounting policies discussed below are particularly important to the understanding of our consolidated financial statements and require higher degree of judgment and/or complexity in the preparation of those consolidated financial statements. In exercising those judgments, we make estimates and assumptions that affect the carrying values of assets and liabilities at the date of the financial statements and the reported amounts of net revenues and expenses in the reporting periods covered by the financial statements. On an ongoing basis, we evaluate our estimates based on historical experience, current conditions and various other assumptions that we believe to be reasonable under the circumstances. We adjust such estimates and assumptions when facts and circumstances dictate. Accounting assumptions and estimates are inherently uncertain and actual results may differ materially from our estimates. Changes in estimates and judgments could significantly affect our results of operations, financial condition and cash flow in the future.
Revenue Recognition
We recognize revenue from our franchise and company-operated restaurants in accordance with Accounting Standards Codification 606 -Revenue from Contracts with Customers (“ASC 606”). Under ASC 606, revenue is recognized upon transfer of control of promised services or goods to customers in an amount that reflects the consideration we expect to receive for those services or goods. Our rental and financing revenues are recognized in accordance with other U.S. GAAP accounting standards and are not subject to ASC 606.
In determining the amount and timing of revenue from contracts with customers, we make judgments as to whether uncertainty as to collectibility of the consideration that we are owed precludes recognition of the revenue on an accrual basis.
These judgments are based on the facts specific to each circumstance. Primary factors considered include past payment history and our subjective assessment of the likelihood of receiving payment in the future. The timing of recognition does not require significant judgment as it is based on either the term of the franchise agreement, the month of reported sales by the franchisee or the date of product shipment, none of which require estimation.
Significant judgments with respect to rental revenues are discussed below under Leases. We do not have to make significant judgments with respect to revenues from our company-operated restaurants or our financing operations.
Goodwill and Intangible Assets
Goodwill and intangible assets considered to have an indefinite life (primarily the Applebee's tradename) are evaluated throughout the year to determine if indicators of impairment exist. Such indicators include, but are not limited to, events or circumstances such as a significant adverse change in our business, in the business overall climate, unanticipated competition, a loss of key personnel, adverse legal or regulatory developments or a significant decline in the market price of our common stock.
If no indicators of impairment have been noted during these preliminary assessments, we perform an assessment of goodwill and intangible assets annually in the fourth fiscal quarter. We first assess qualitatively whether it is more-likely-than-not that an impairment does not exist. Significant factors considered in this assessment include, but are not limited to, macro-economic conditions, market and industry conditions, cost considerations, the competitive environment, share price fluctuations, overall financial performance and results of past impairment tests. If we do not qualitatively determine that it is more-likely-than-not that an impairment does not exist, we perform a quantitative impairment test.
In performing a quantitative test for impairment of goodwill, we primarily use the income approach method of valuation that includes the discounted cash flow method and the market approach that includes the guideline public company method to determine the fair value of goodwill and intangible assets. Significant assumptions made by management in estimating fair value under the discounted cash flow model include future trends in sales, operating expenses, overhead expenses, depreciation, capital expenditures and changes in working capital, along with an appropriate discount rate based on our estimated cost of equity capital and after-tax cost of debt. Significant assumptions used to determine fair value under the guideline public company method include the selection of guideline companies and the valuation multiples applied.
In the process of a quantitative test, if necessary, of the Applebee's tradename intangible asset, we primarily use the relief of royalty method under the income approach method of valuation. Significant assumptions used to determine fair value under the relief of royalty method include future trends in sales, a royalty rate and a discount rate to be applied to the forecast revenue stream.
There is an inherent degree of uncertainty in preparing any forecast of future results. Future trends in system-wide sales are dependent to a significant extent on national, regional and local economic conditions, and, to a lesser extent, on global economic conditions, particularly those conditions affecting the demographics of the guests that frequently patronize Applebee's restaurants. Accordingly, there are a number of potential events that could reasonably be expected to negatively affect the forecast of system-wide sales, including a decrease in customers' disposable income available for discretionary spending (because of circumstances such as job losses, credit constraints, higher housing costs, increased tax rates, energy costs, interest rates or other costs) or a decrease in the perceived wealth of customers (because of circumstances such as lower residential real estate values, increased foreclosure rates, increased tax rates or other economic disruptions). As a result, our business could experience a decline in sales and/or customer traffic as potential customers choose lower-cost alternatives (such as quick-service restaurants) or other alternatives to dining out. Additionally, negative trends in the availability of credit and in expenses such as interest rates and the cost of construction materials could affect our franchisees' ability to maintain and remodel existing restaurants. Any decreases in customer traffic or average customer check due to these or other reasons could reduce gross sales at franchise restaurants, resulting in lower royalty and other payments from franchisees. This could reduce the profitability of franchise restaurants, potentially impacting the ability of franchisees to make royalty payments owed to us when due (which could adversely impact our current cash flow from franchise operations) and negatively impacting franchisees’ ability to develop new restaurants (which could adversely impact our future cash flows from franchise operations).
Long-Lived Assets
On a regular basis, we assess whether events or changes in circumstances have occurred that potentially indicate the carrying value of long-lived assets (primarily assets related to properties and equipment leased or subleased to franchisees) may not be recoverable. We test impairment using historical cash flows and other relevant facts and circumstances as the primary basis for our estimates of future cash flows. Significant factors considered include, but are not limited to, current and forecast sales, current and forecast cash flows, the number of years the franchisee's restaurant has been in operation, its remaining lease
life, and other factors which apply on a case-by-case basis. The analysis is performed at the individual restaurant level for indicators of permanent impairment. Recoverability of the Company's assets is measured by comparing the assets' carrying
value to the undiscounted cash flows expected to be generated over the assets' remaining useful life or remaining lease term, whichever is less. This process requires the use of estimates and assumptions, which are subject to a high degree of judgment. If these assumptions change in the future, we may be required to record impairment charges for these assets.
On a regular basis, we assess whether events or changes in circumstances have occurred that potentially indicate the carrying value of intangible assets with finite lives, primarily assets related to Applebee's franchise rights. Recoverability of the asset is measured by comparing the assets' carrying value to the discounted future cash flows expected to be generated over the asset's remaining useful life. Significant factors considered include, but are not limited to, current and forecast sales, current and forecast cash flows and a discount rate to be applied to the forecast revenue stream.
Allowance for Credit Losses
The allowance for doubtful accounts is our best estimate of the amount of probable credit losses in our existing receivables; however, changes in circumstances relating to receivables may result in additional allowances in the future. We determine the allowance based on historical experience, current payment patterns, future obligations and our assessment of the ability to pay outstanding balances. The primary indicator of credit quality is delinquency, which is considered to be a receivable balance greater than 90 days past due. We continually review our allowance for doubtful accounts. Past due balances and future obligations are reviewed individually for collectability. Account balances are charged against the allowance after all collection efforts have been exhausted and the potential for recovery is considered remote.
Leases
Our restaurants are located on (i) sites owned by us, (ii) sites leased by us from third parties and (iii) sites owned or leased by franchisees. For sites owned by or leased by us from third parties, we, in turn, sublease to our franchisees. At the inception of the lease, each property is evaluated to determine whether the lease will be accounted for as an operating or capitalfinance lease in accordance with the provisions of U.S. GAAP governing the accounting for leases.
The Company's lease agreements generally do not provide information to determine the implicit interest rate in the agreements. This requires the Company to make significant judgments in determining the incremental borrowing rate to be used in calculating operating lease liabilities as of the adoption date. The Company estimates the incremental borrowing rate primarily by reference to (i) yield rates on debt issuances by companies of a similar credit rating as the Company; (ii) U.S. Treasury rates as of the adoption or commencement date; and (iii) adjustments for differences between these rates and the lease term.
Management also makes judgments regarding the probable term for each restaurant property lease, which can impact the classification and accounting for a lease as capitalfinance or operating, the rent holiday and/or escalations in payment that are taken into consideration when calculating straight-line rent and the term over which leasehold improvements for each restaurant arethe right-of-use asset (for operating leases) or equipment under finance lease is amortized. These judgments may produce materially different amounts of depreciation, amortization and rent expense than would be reported if different assumed lease terms were used.
Stock-Based Compensation
We account for stock-based compensation in accordance with U.S. GAAP governing share-based payments. Accordingly, we measure stock-based compensation expense at the grant date, based on the fair value of the award, and recognize the expense over the employee's requisite service period using the straight-line method. The fair value of each employee stock option and restricted stock award is estimated on the date of grant using an option pricing model that meets certain requirements. We currently use the Black-Scholes option pricing model to estimate the fair value of our stock-based compensation. The Black-Scholes model meets the requirements of U.S. GAAP. The measurement of stock-based compensation expense is based on several criteria including, but not limited to, the valuation model used and associated input factors, such as expected term of the award, stock price volatility, risk free interest rate and forfeiture rate. These inputs are subjective and are determined using management's judgment. If differences arise between the assumptions used in determining stock-based compensation expense and the actual factors which become known over time, we may change the input factors used in determining future stock-based compensation expense. Any such changes could materially impact our operations in the period in which the changes are made and in subsequent periods.
Income Taxes
We provide for income taxes based on our estimate of federal and state income tax liabilities. We make certain estimates and judgments in the calculation of tax expense and the resulting tax liabilities and in the recoverability of deferred tax assets that arise from temporary differences between the tax and financial statement recognition of revenue and expense. Tax laws are
complex and subject to different interpretations by the taxpayers and respective governmental authorities. We review our tax positions quarterly and adjust the balances as new information becomes available.
We recognize deferred tax assets and liabilities using the enacted tax rates for the effect of temporary differences between the financial reporting basis and the tax basis of recorded assets and liabilities. Deferred tax accounting requires that deferred tax assets be reduced by a valuation allowance if it is more likely than not that some portions or all of the net deferred tax assets will not be realized. This test requires projection of our taxable income into future years to determine if there will be taxable income sufficient to realize the tax assets. The preparation of the projections requires considerable judgment and is subject to
change to reflect future events and changes in the tax laws. When we establish or reduce the valuation allowance against our deferred tax assets, our income tax expense will increase or decrease, respectively, in the period such determination is made.
FASB ASC Topic 740-10 requires that a position taken or expected to be taken in a tax return be recognized in the financial statement when it is more likely than not (i.e. a likelihood of more than 50 percent) that the position would be sustained upon examination by taxing authorities including all appeals or litigation processes, based on its technical merits. A recognized tax position is then measured on the largest benefit that has a greater than fifty percent likelihood of being realized upon ultimate resolution. For each reporting period, management applies a consistent methodology to measure and adjust all uncertain tax positions based on the available information.
Legal Contingencies
We are subject to various lawsuits, administrative proceedings, audits, and claims arising in the ordinary course of business. Some of these lawsuits purport to be class actions and/or seek substantial damages. The outcomes of legal proceedings and claims brought against us are subject to significant uncertainty. An estimated loss from a loss contingency such as a legal proceeding or claim is accrued by a charge to income if it is probable that an asset has been impaired or a liability has been incurred and the amount of the loss can be reasonably estimated. In determining whether a loss should be accrued we evaluate, among other factors, the degree of probability of an unfavorable outcome and the ability to make a reasonable estimate of the amount of loss. Changes in these factors could materially impact our consolidated financial statements.
Accounting Standards Adopted in the Current Fiscal Year
See Note 2 - Basis of Presentation and Summary of Significant Accounting Policies, of the Notes to the Consolidated Financial Statements included in this report for a description of accounting standards we adopted in fiscal 2018.2019.
New Accounting Pronouncements
See Note 2 - Basis of Presentation and Summary of Significant Accounting Policies, of the Notes to the Consolidated Financial Statements included in this report, for a description of newly issued accounting standards that may impact us in the future.
Item 7A. Quantitative and Qualitative Disclosures about Market Risk.
We are exposed to financial market risk, including interest rates and commodity prices. We address these risks through controlled risk management that may include the use of derivative financial instruments to economically hedge or reduce these exposures. We do not enter into financial instruments for trading or speculative purposes.
Interest Rate Risk
The significant majority of our long-term debt outstanding at December 31, 20182019 was issued at a fixed interest raterates (see Note 8 - Long-Term Debt, of the Notes to Consolidated Financial Statements). We are only exposed to interest rate risk on borrowings that we may make in the future under our Series 2018-1Variable Funding Senior Notes2019 Class A-1 (the “2018 Variable Funding Notes”).Notes, a revolving credit facility. We had no outstanding borrowings of $25 million as ofunder our 2019 Class A-1 Notes at December 31, 2018. A 1.0%2019 and we did not utilize this revolving credit facility during the year ended December 31, 2019. Accordingly, a 1% increase or decrease in interest rates would increase or decreasenot impact our annual interest expense by $0.25 million.expense.
We do not engage in speculative transactions nor do we hold or issue financial instruments for trading purposes. We had no material amounts of derivative instruments at December 31, 20182019 and did not hold any material amount of derivative instruments during the year ended December 31, 2018.2019.
Investments in instruments earning a fixed rate of interest carry a degree of interest rate risk. Fixed rate securities may have their fair market value adversely impacted due to a rise in interest rates. We currently do not hold any fixed rate investments.
Based on our interest-earning cash, and cash equivalents and restricted cash balances as of 2018December 31, 2019, a 1% increase or decrease in interest rates would increase or decrease our annual interest income by approximately $0.6$1.5 million. A 1% decline in interest rates would decrease our annual interest income by less than $0.6 million as the majority of our cash and cash equivalents and restricted cash are currently yielding less than 1%.
Commodity Prices
Many of the food products purchased by our franchisees and area licensees are affected by commodity pricing and are, therefore, subject to unpredictable price volatility. Extreme increases in commodity prices and/or long-term changes could affect our franchisees, area licensees and company-operated restaurants adversely. We expect that, in most cases, the IHOP and Applebee's systems would be able to pass increased commodity prices through to their customers via increases in menu prices. From time to time, competitive circumstances could limit short-term menu price flexibility, and in those cases, franchisees' margins would be negatively impacted by increased commodity prices. Since allthe significant majority of our restaurants are franchised, we believe that any changes in commodity pricing that cannot be adjusted for by changes in menu pricing or other strategies would not be material to our financial condition, results of operations or cash flows.
The Company and owners of Applebee's and IHOP franchise restaurants are members of CSCS, a Co-op that manages procurement activities for the Applebee's and IHOP restaurants that belong to the Co-op. We believe the larger scale created by combining the supply chain requirements of both brands under one organization can provide cost savings and efficiency in the purchasing function. As of December 31, 20182019, 100% of Applebee's domestic franchise restaurants and 99% of IHOP domestic franchise restaurants are members of CSCS. In some instances, IHOP and Applebee's may be required to guarantee their purchase of any remaining inventory of certain food and other items purchased by CSCS for the purpose of supplying limited time promotions on behalf of the Applebee's and IHOP systems as a whole. None of these food product guarantees is a derivative instrument. At December 31, 2018,2019, our outstanding guarantees for food product purchases were $8.4$2.6 million.
International Currency Exchange Rate Risk
We have minimal exposure to international currency exchange rate fluctuations. Revenue derived from all international country operations comprised less than 3%2% of total consolidated revenue for the year ended December 31, 2018,2019, such that a hypothetical concurrent 10% adverse change in the currency of every international country in which our franchisees operate restaurants would have a negative impact of less than 0.3%0.2% of our consolidated revenue.
Item 8. Financial Statements and Supplementary Data.
Index to Consolidated Financial Statements
Report of Independent Registered Public Accounting Firm
To the ShareholdersStockholders and the Board of Directors of Dine Brands Global, Inc. and Subsidiaries
Opinion on the Financial Statements
We have audited the accompanying consolidated balance sheets of Dine Brands Global, Inc. and Subsidiaries (the Company) as of December 30, 201829, 2019 and December 31, 2017,30, 2018, the related consolidated statements of comprehensive income (loss), stockholders’ (deficit) equity and cash flows for each of the three years in the period ended December 30, 2018,29, 2019, and the related notes (collectively referred to as the “consolidated financial statements”). In our opinion, the consolidated financial statements present fairly, in all material respects, the financial position of the Company at December 30, 201829, 2019 and December 31, 2017,30, 2018, and the results of its operations and its cash flows for each of the three years in the period ended December 30, 2018,29, 2019, in conformity with U.S. generally accepted accounting principles.
We also have audited, in accordance with the standards of the Public Company Accounting Oversight Board (United States) (PCAOB), the Company’s internal control over financial reporting as of December 30, 2018,29, 2019, based on criteria established in Internal Control-Integrated Framework issued by the Committee of Sponsoring Organizations of the Treadway Commission (2013 framework) and our report dated February 21, 201924, 2020 expressed an unqualified opinion thereon.
Adoption of Topic 606Accounting Standards Update No. 2016-02
As discussed in Note 2 to the consolidated financial statements, the Company changed its method for recognizing revenue as a result ofaccounting for leases due to the adoption of Accounting Standards Codification 606, Revenue from ContractsUpdate No. 2016-02, Leases (Topic 842), effective December 31, 2018. As explained below, auditing the Company’s determination of incremental borrowing rates in connection with Customers (Topic 606) effective January 1, 2018.the adoption of Topic 842 was a critical audit matter.
Basis for Opinion
These financial statements are the responsibility of the Company’s management. Our responsibility is to express an opinion on the Company’s financial statements based on our audits. We are a public accounting firm registered with the PCAOB and are required to be independent with respect to the Company in accordance with the U.S. federal securities laws and the applicable rules and regulations of the Securities and Exchange Commission and the PCAOB.
We conducted our audits in accordance with the standards of the PCAOB. Those standards require that we plan and perform the audit to obtain reasonable assurance about whether the financial statements are free of material misstatement, whether due to error or fraud. Our audits included performing procedures to assess the risks of material misstatement of the financial statements, whether due to error or fraud, and performing procedures that respond to those risks. Such procedures included examining, on a test basis, evidence regarding the amounts and disclosures in the financial statements. Our audits also included evaluating the accounting principles used and significant estimates made by management, as well as evaluating the overall presentation of the financial statements. We believe that our audits provide a reasonable basis for our opinion.
Critical Audit Matters
The critical audit matters communicated below are matters arising from the current period audit of the financial statements that were communicated or required to be communicated to the audit committee and that: (1) relate to accounts or disclosures that are material to the financial statements and (2) involved our especially challenging, subjective or complex judgments. The communication of critical audit matters does not alter in any way our opinion on the consolidated financial statements, taken as a whole, and we are not, by communicating the critical audit matters below, providing separate opinions on the critical audit matters or on the accounts or disclosures to which they relate.
|
| |
| Goodwill and Indefinite Lived Intangible Assets Impairment |
| Description of the Matter | At December 31, 2019, the Company’s goodwill and indefinite lived tradename intangible asset (tradename) were $343.8 million and $479.0 million, respectively. The majority of the goodwill and the entirety of the tradename relates to the Applebee's franchised restaurants unit (Applebee’s franchise unit). As discussed in Notes 2, 6 and 7 to the consolidated financial statements, goodwill and tradename are tested for impairment at least annually, and more frequently if the Company believes indicators of impairment exist. During 2019, the Company performed an assessment of indicators of potential impairment, including macro-economic conditions, market and industry conditions, cost considerations, the competitive environment, share price fluctuations, overall financial performance and results of past impairment tests, to determine if the fair value of the Applebee’s franchise unit’s goodwill and tradename were impaired.
Auditing management’s annual goodwill and tradename impairment tests was complex due to the high degree of judgment required to assess management’s evaluation of the indicators of potential impairment, including comparing sales, operating expenses, overhead expenses, depreciation and capital expenditures to the historical and projected amounts that were used in previous impairment tests and assess whether any variances were indicative of potential impairments. |
| How We Addressed the Matter in Our Audit | We obtained an understanding, evaluated the design and tested the operating effectiveness of controls over the Company’s annual goodwill and tradename impairment tests, including controls over the review of the indicators of potential impairment, financial forecasts and the accuracy of the underlying data used.
Our audit procedures also included, among others, assessing the various indicators considered by management by comparing such factors to metrics independently obtained from third-party sources. For example, to assess the macro-economic conditions, we compared the real gross domestic product used in the Company’s analysis to the actual and projected measures which we independently identified. Furthermore, we evaluated the Company's analysis of overall market and industry conditions using industry sales trend data obtained from an independent source. Additionally, we compared the actual financial measures for the year ended December 31, 2019, such as sales, operating expenses, overhead expenses, depreciation and capital expenditures, to those forecasted in the previous impairment analysis in order to assess the historical accuracy of management’s forecasting. We also recalculated the Company’s market capitalization and compared the results to the market capitalization from prior periods. We evaluated whether any variances from the projections or changes in market capitalization were indicative of potential impairment of the goodwill and tradename. |
| Determination of Incremental Borrowing Rates |
| Description of the Matter | As discussed above and in Note 2 to the consolidated financial statements, effective December 31, 2018, the Company adopted Accounting Standards Update No. 2016-02, Leases (Topic 842), which resulted in the recognition of operating lease right-of-use assets of $395.6 million and operating lease liabilities of $453.0 million. The calculation of the right‑of‑use assets and the lease liabilities includes an estimate of the present value of the future lease payments to be made over the remaining lease term, discounted using the Company's incremental borrowing rates. The incremental borrowing rate is the rate of interest that the lessee would have to pay to borrow on a collateralized basis over a similar term an amount equal to the lease payments in a similar economic environment.
Auditing management’s assessment of the incremental borrowing rates in connection with the adoption of Topic 842 was especially challenging due to the complexity of the calculation methodology and the sensitivity of the right-of-use assets and lease liabilities to changes in the incremental borrowing rates. |
| How We Addressed the Matter in Our Audit | We obtained an understanding, evaluated the design and tested the operating effectiveness of controls over the Company’s process for determining the incremental borrowing rates. For example, we tested controls over the review of the methodology and assumptions used to determine the incremental borrowing rates, including the lease terms and the Company’s creditworthiness.
Our audit procedures also included, among others, evaluating the methodology and underlying data used by the Company. With the assistance of our specialists, we independently identified relevant market yields using the Company’s credit rating, current market environment for recent debt transactions, and market data available to support the adjustment required to reflect a collateralized borrowing rate, as well as the lease terms, and compared those rates to the incremental borrowing rates used by management. We also tested the accuracy and completeness of the lease data by comparing lease information used in the incremental borrowing rate calculations to a sample of lease agreements. |
We have served as the Company’s auditor since 2004.
/s/ ERNST & YOUNG LLP
Los Angeles, California
February 21, 201924, 2020
Dine Brands Global, Inc. and Subsidiaries Consolidated Balance Sheets (In thousands, except share amounts) | Dine Brands Global, Inc. and Subsidiaries Consolidated Balance Sheets (In thousands, except share amounts) | Dine Brands Global, Inc. and Subsidiaries Consolidated Balance Sheets (In thousands, except share amounts) |
| | | December 31, | December 31, |
| Assets | 2018 | | 2017 | 2019 | | 2018 |
| | | | (as adjusted) | |
| Current assets: | | | | | | |
| Cash and cash equivalents | $ | 137,164 |
| | $ | 117,010 |
| $ | 116,043 |
| | $ | 137,164 |
|
| Receivables, net | 137,504 |
| | 140,188 |
| 136,869 |
| | 137,504 |
|
| Restricted cash | 48,515 |
| | 31,436 |
| 40,732 |
| | 48,515 |
|
| Prepaid gift card costs | 38,195 |
| | 40,725 |
| 36,077 |
| | 38,195 |
|
| Prepaid income taxes | 17,402 |
| | 43,654 |
| 13,290 |
| | 17,402 |
|
| Other current assets | 3,410 |
| | 12,615 |
| 3,906 |
| | 3,410 |
|
| Total current assets | 382,190 |
| | 385,628 |
| 346,917 |
| | 382,190 |
|
| Long-term receivables, net | 103,102 |
| | 126,570 |
| |
| Other intangible assets, net | 585,889 |
| | 582,787 |
| 575,103 |
| | 585,889 |
|
| Operating lease right-of-use assets | | 366,931 |
| | — |
|
| Goodwill | 345,314 |
| | 339,236 |
| 343,862 |
| | 345,314 |
|
| Property and equipment, net | 240,264 |
| | 199,585 |
| 216,420 |
| | 240,264 |
|
| Long-term receivables, net | | 85,999 |
| | 103,102 |
|
| Deferred rent receivable | 77,069 |
| | 82,971 |
| 70,308 |
| | 77,069 |
|
| Non-current restricted cash | 14,700 |
| | 14,700 |
| 15,700 |
| | 14,700 |
|
| Other non-current assets, net | 26,152 |
| | 4,135 |
| 28,271 |
| | 26,152 |
|
| Total assets | $ | 1,774,680 |
| | $ | 1,735,612 |
| $ | 2,049,511 |
| | $ | 1,774,680 |
|
| | | | | | | |
| Liabilities and Stockholders' Deficit | | | | | | |
| Current liabilities: | | | | | | |
| Current maturities of long-term debt | $ | 25,000 |
| | $ | 12,965 |
| $ | — |
| | $ | 25,000 |
|
| Accounts payable | 43,468 |
| | 55,028 |
| 40,925 |
| | 43,468 |
|
| Gift card liability | 160,438 |
| | 164,441 |
| 159,019 |
| | 160,438 |
|
| Current maturities of operating lease obligations | | 72,815 |
| | — |
|
| Current maturities of finance lease and financing obligations | | 13,669 |
| | 14,031 |
|
| Accrued employee compensation and benefits | | 23,904 |
| | 27,479 |
|
| Dividends payable | 11,389 |
| | 17,748 |
| 11,702 |
| | 11,389 |
|
| Current maturities of capital lease and financing obligations | 14,031 |
| | 14,193 |
| |
| Accrued employee compensation and benefits | 27,479 |
| | 13,547 |
| |
| Deferred franchise revenue, short-term | 10,138 |
| | 11,001 |
| 10,086 |
| | 10,138 |
|
| Other accrued expenses | 24,243 |
| | 16,001 |
| 25,792 |
| | 24,243 |
|
| Total current liabilities | 316,186 |
| | 304,924 |
| 357,912 |
| | 316,186 |
|
| Long-term debt, net, less current maturities | 1,274,087 |
| | 1,269,849 |
| 1,288,248 |
| | 1,274,087 |
|
| Capital lease obligations, less current maturities | 87,762 |
| | 61,895 |
| |
| Operating lease obligations, less current maturities | | 359,025 |
| | — |
|
| Finance lease obligations, less current maturities | | 77,393 |
| | 87,762 |
|
| Financing obligations, less current maturities | 38,482 |
| | 39,200 |
| 37,682 |
| | 38,482 |
|
| Deferred income taxes, net | 105,816 |
| | 117,669 |
| 98,499 |
| | 105,816 |
|
| Deferred franchise revenue, long-term | 64,557 |
| | 70,432 |
| 56,944 |
| | 64,557 |
|
| Deferred rent payable | 62,744 |
| | 69,112 |
| |
| Other non-current liabilities | 27,319 |
| | 18,071 |
| 15,582 |
| | 90,063 |
|
| Total liabilities | 1,976,953 |
| | 1,951,152 |
| 2,291,285 |
| | 1,976,953 |
|
| Commitments and contingencies |
| |
|
| |
|
| Stockholders' deficit: | | | | | | |
| Common stock, $0.01 par value; shares: 40,000,000 authorized; 2018 - 24,984,898 issued, 17,644,267 outstanding; 2017 - 25,022,312 issued, 17,993,124 outstanding | 250 |
| | 250 |
| |
| Preferred stock, $1 par value, 10,000,000 shares authorized, no shares issued and outstanding | | — |
| | — |
|
| Common stock, $0.01 par value; shares: 40,000,000 authorized; 2019 - 24,925,447 issued, 16,521,921 outstanding; 2018 - 24,984,898 issued, 17,644,267 outstanding | | 249 |
| | 250 |
|
| Additional paid-in-capital | 237,726 |
| | 276,408 |
| 246,192 |
| | 237,726 |
|
| Retained earnings (accumulated deficit) | 10,414 |
| | (69,940 | ) | |
| Retained earnings | | 61,653 |
| | 10,414 |
|
| Accumulated other comprehensive loss | (60 | ) | | (105 | ) | (58 | ) | | (60 | ) |
| Treasury stock, at cost; shares: 2018 - 7,340,631; 2017 - 7,029,188 | (450,603 | ) | | (422,153 | ) | |
| Treasury stock, at cost; shares: 2019 - 8,403,526; 2018 - 7,340,631 | | (549,810 | ) | | (450,603 | ) |
| Total stockholders' deficit | (202,273 | ) | | (215,540 | ) | (241,774 | ) | | (202,273 | ) |
| Total liabilities and stockholders' deficit | $ | 1,774,680 |
| | $ | 1,735,612 |
| $ | 2,049,511 |
| | $ | 1,774,680 |
|
See the accompanying notes to the consolidated financial statements.
Dine Brands Global, Inc. and Subsidiaries Consolidated Statements of Comprehensive Income (Loss) (In thousands, except per share amounts) |
| | | | | | | | | | | |
| | Year Ended December 31, |
| | 2018 | | 2017 | | 2016 |
| Revenues: | | | (as adjusted) |
| Franchise revenues: | | | | | |
| Royalties, franchise fees and other | $ | 375,640 |
| | $ | 360,253 |
| | $ | 377,855 |
|
| Advertising revenue | 268,294 |
| | 234,165 |
| | 260,116 |
|
| Total franchise revenues | 643,934 |
| | 594,418 |
| | 637,971 |
|
| Rental revenues | 121,934 |
| | 121,437 |
| | 123,037 |
|
| Financing revenues | 7,979 |
| | 8,352 |
| | 9,191 |
|
| Company restaurant sales | 7,084 |
| | 7,518 |
| | 17,367 |
|
| Total revenues | 780,931 |
| | 731,725 |
| | 787,566 |
|
| Cost of revenues: | | | | | |
| Franchise expenses: | | | | | |
| Advertising expenses | 269,590 |
| | 243,096 |
| | 260,116 |
|
| Other franchise expenses | 61,029 |
| | 50,890 |
| | 33,384 |
|
| Total franchise expenses | 330,619 |
| | 293,986 |
| | 293,500 |
|
| Rental expenses | 90,756 |
| | 90,592 |
| | 91,540 |
|
| Financing expenses | 597 |
| | 598 |
| | 155 |
|
| Company restaurant expenses | 5,872 |
| | 7,838 |
| | 18,224 |
|
| Total cost of revenues | 427,844 |
| | 393,014 |
| | 403,419 |
|
| Gross profit | 353,087 |
| | 338,711 |
| | 384,147 |
|
| General and administrative expenses | 166,683 |
| | 165,679 |
| | 148,935 |
|
| Interest expense | 61,686 |
| | 61,979 |
| | 61,479 |
|
| Amortization of intangible assets | 10,105 |
| | 10,009 |
| | 9,981 |
|
| Closure and other impairment charges | 2,107 |
| | 3,968 |
| | 5,092 |
|
| Debt refinancing costs | 2,523 |
| | — |
| | — |
|
| (Gain) loss on disposition of assets | (625 | ) | | (6,249 | ) | | 809 |
|
| Impairment of goodwill and intangible assets | — |
| | 531,634 |
| | — |
|
| Income (loss) before income tax (provision) benefit | 110,608 |
| | (428,309 | ) | | 157,851 |
|
| Income tax (provision) benefit | (30,254 | ) | | 85,559 |
| | (56,849 | ) |
| Net income (loss) | 80,354 |
| | (342,750 | ) | | 101,002 |
|
| Other comprehensive income (loss), net of tax: | | | | | |
| Adjustment to unrealized loss on available-for-sale investments | 50 |
| | — |
| | — |
|
| Foreign currency translation adjustment | (5 | ) | | 2 |
| | — |
|
| Total comprehensive income (loss) | $ | 80,399 |
| | $ | (342,748 | ) | | $ | 101,002 |
|
| Net income (loss) available to common stockholders: | | | | | |
| Net income (loss) | $ | 80,354 |
| | $ | (342,750 | ) | | $ | 101,002 |
|
| Less: Net (income) loss allocated to unvested participating restricted stock | (2,711 | ) | | 6,768 |
| | (1,430 | ) |
| Net income (loss) available to common stockholders | $ | 77,643 |
| | $ | (335,982 | ) | | $ | 99,572 |
|
| Net income (loss) available to common stockholders per share: | | | | | |
| Basic | $ | 4.43 |
| | $ | (18.96 | ) | | $ | 5.52 |
|
| Diluted | $ | 4.37 |
| | $ | (18.96 | ) | | $ | 5.49 |
|
| Weighted average shares outstanding: | | | | | |
| Basic | 17,533 |
| | 17,725 |
| | 18,030 |
|
| Diluted | 17,789 |
| | 17,740 |
| | 18,125 |
|
| | | | | | |
| Dividends declared per common share | $ | 2.52 |
| | $ | 3.88 |
| | $ | 3.73 |
|
| Dividends paid per common share | $ | 2.86 |
| | $ | 3.88 |
| | $ | 3.68 |
|
Dine Brands Global, Inc. and Subsidiaries Consolidated Statements of Comprehensive Income (Loss) (In thousands, except per share amounts) |
| | | | | | | | | | | |
| | Year Ended December 31, |
| | 2019 | | 2018 | | 2017 |
| Revenues: | | | |
| Franchise revenues: | | | | | |
| Royalties, franchise fees and other | $ | 368,171 |
| | $ | 375,640 |
| | $ | 360,253 |
|
| Advertising revenue | 283,015 |
| | 268,294 |
| | 234,165 |
|
| Total franchise revenues | 651,186 |
| | 643,934 |
| | 594,418 |
|
| Company restaurant sales | 131,214 |
| | 7,084 |
| | 7,518 |
|
| Rental revenues | 120,666 |
| | 121,934 |
| | 121,437 |
|
| Financing revenues | 7,112 |
| | 7,979 |
| | 8,352 |
|
| Total revenues | 910,178 |
| | 780,931 |
| | 731,725 |
|
| Cost of revenues: | | | | | |
| Franchise expenses: | | | | | |
| Advertising expenses | 281,781 |
| | 269,590 |
| | 243,096 |
|
| Other franchise expenses | 30,973 |
| | 61,029 |
| | 50,890 |
|
| Total franchise expenses | 312,754 |
| | 330,619 |
| | 293,986 |
|
| Company restaurant expenses | 123,272 |
| | 5,872 |
| | 7,838 |
|
| Rental expenses: | | | | | |
| Interest expense from finance leases | 5,602 |
| | 6,894 |
| | 8,153 |
|
| Other rental expenses | 85,157 |
| | 83,862 |
| | 82,439 |
|
| Total rental expenses | 90,759 |
| | 90,756 |
| | 90,592 |
|
| Financing expenses | 579 |
| | 597 |
| | 598 |
|
| Total cost of revenues | 527,364 |
| | 427,844 |
| | 393,014 |
|
| Gross profit | 382,814 |
| | 353,087 |
| | 338,711 |
|
| General and administrative expenses | 162,815 |
| | 166,683 |
| | 165,679 |
|
| Interest expense | 60,393 |
| | 61,686 |
| | 61,979 |
|
| Amortization of intangible assets | 11,702 |
| | 10,105 |
| | 10,009 |
|
| Closure and other impairment charges | 1,487 |
| | 2,107 |
| | 3,968 |
|
| Loss on extinguishment of debt | 8,276 |
| | — |
| | — |
|
| Debt refinancing costs | — |
| | 2,523 |
| | — |
|
| Gain on disposition of assets | (332 | ) | | (625 | ) | | (6,249 | ) |
| Impairment of goodwill and intangible assets | — |
| | — |
| | 531,634 |
|
| Income (loss) before income tax (provision) benefit | 138,473 |
| | 110,608 |
| | (428,309 | ) |
| Income tax (provision) benefit | (34,127 | ) | | (30,254 | ) | | 85,559 |
|
| Net income (loss) | 104,346 |
| | 80,354 |
| | (342,750 | ) |
| Other comprehensive income (loss), net of tax: | | | | | |
| Adjustment to unrealized loss on available-for-sale investments | — |
| | 50 |
| | — |
|
| Foreign currency translation adjustment | 2 |
| | (5 | ) | | 2 |
|
| Total comprehensive income (loss) | $ | 104,348 |
| | $ | 80,399 |
| | $ | (342,748 | ) |
| Net income (loss) available to common stockholders: | | | | | |
| Net income (loss) | $ | 104,346 |
| | $ | 80,354 |
| | $ | (342,750 | ) |
| Less: Net (income) loss allocated to unvested participating restricted stock | (3,532 | ) | | (2,711 | ) | | 6,768 |
|
| Net income (loss) available to common stockholders | $ | 100,814 |
| | $ | 77,643 |
| | $ | (335,982 | ) |
| Net income (loss) available to common stockholders per share: | | | | | |
| Basic | $ | 5.95 |
| | $ | 4.43 |
| | $ | (18.96 | ) |
| Diluted | $ | 5.85 |
| | $ | 4.37 |
| | $ | (18.96 | ) |
| Weighted average shares outstanding: | | | | | |
| Basic | 16,934 |
| | 17,533 |
| | 17,725 |
|
| Diluted | 17,245 |
| | 17,789 |
| | 17,740 |
|
Dine Brands Global, Inc. and Subsidiaries Consolidated Statements of Stockholders' (Deficit) Equity (In thousands) | Dine Brands Global, Inc. and Subsidiaries Consolidated Statements of Stockholders' (Deficit) Equity (In thousands) | Dine Brands Global, Inc. and Subsidiaries Consolidated Statements of Stockholders' (Deficit) Equity (In thousands) |
| | | | | | | | | | | | | | | | | | | | | | | | | | | | | | |
| | | Common Stock | | | | | | Accumulated Other Comprehensive Loss | | Treasury Stock | | | | Common Stock | | | | | | Accumulated Other Comprehensive Loss | | Treasury Stock | | |
| | | Shares Outstanding | Amount | | Additional Paid-in Capital | | Retained Earnings (Accumulated Deficit) | | Shares | Cost | | Total | | Shares Outstanding | Amount | | Additional Paid-in Capital | | Retained Earnings (Accumulated Deficit) | | Shares | Cost | | Total |
| Balance at December 31, 2015 | | 18,535 |
| $ | 252 |
| | $ | 286,952 |
| | $ | 351,923 |
| | $ | (107 | ) | | 6,651 |
| $ | (371,797 | ) | | $ | 267,223 |
| |
| Adoption of ASC 606 | | — |
| — |
| | — |
| | (59,641 | ) | | — |
| | — |
| — |
| | (59,641 | ) | |
| Net income (as adjusted) | | — |
| — |
| | — |
| | 101,002 |
| | — |
| | — |
| — |
| | 101,002 |
| |
| Other comprehensive loss | | — |
| — |
| | — |
| | — |
| | — |
| | — |
| — |
| | — |
| |
| Purchase of Company common stock | | (650 | ) | — |
| | — |
| | — |
| | — |
| | 650 |
| (55,343 | ) | | (55,343 | ) | |
| Reissuance of treasury stock | | 137 |
| — |
| | (3,468 | ) | | — |
| | — |
| | (137 | ) | 4,877 |
| | 1,409 |
| |
| Net issuance of shares for stock plans | | (19 | ) | (1 | ) | | 1 |
| | — |
| | — |
| | — |
| — |
| | — |
| |
| Repurchase of restricted shares for taxes | | (33 | ) | | | (2,859 | ) | | — |
| | — |
| | — |
| — |
| | (2,859 | ) | |
| Stock-based compensation | | — |
| — |
| | 10,926 |
| | — |
| | — |
| | — |
| — |
| | 10,926 |
| |
| Tax benefit from stock-based compensation | | — |
| — |
| | 1,132 |
| | — |
| | — |
| | — |
| — |
| | 1,132 |
| |
| Dividends on common stock | | — |
| — |
| | 125 |
| | (67,833 | ) | | — |
| | — |
| — |
| | (67,708 | ) | |
| Balance at December 31, 2016 | | 17,970 |
| 251 |
| | 292,809 |
| | 325,451 |
| | (107 | ) | | 7,165 |
| (422,263 | ) | | 196,141 |
| | 17,970 |
| $ | 251 |
| | $ | 292,809 |
| | $ | 325,451 |
| | $ | (107 | ) | | 7,165 |
| $ | (422,263 | ) | | $ | 196,141 |
|
| Net loss (as adjusted) | | — |
| — |
| | — |
| | (342,750 | ) | | — |
| | — |
| — |
| | (342,750 | ) | |
| Net loss | | | — |
| — |
| | — |
| | (342,750 | ) | | — |
| | — |
| — |
| | (342,750 | ) |
| Other comprehensive gain | | — |
| — |
| | — |
| | — |
| | 2 |
| | — |
| — |
| | 2 |
| | — |
| — |
| | — |
| | — |
| | 2 |
| | — |
| — |
| | 2 |
|
| Purchase of Company common stock | | (146 | ) | — |
| | — |
| | — |
| | — |
| | 146 |
| (10,003 | ) | | (10,003 | ) | | (146 | ) | — |
| | — |
| | — |
| | — |
| | 146 |
| (10,003 | ) | | (10,003 | ) |
| Reissuance of treasury stock | | 281 |
| — |
| | (7,478 | ) | | — |
| | — |
| | (281 | ) | 10,113 |
| | 2,635 |
| | 281 |
| — |
| | (7,478 | ) | | — |
| | — |
| | (281 | ) | 10,113 |
| | 2,635 |
|
| Net issuance of shares for stock plans | | (71 | ) | (1 | ) | | 1 |
| | — |
| | — |
| | — |
| — |
| | — |
| |
| Net use of shares for stock plans | | | (71 | ) | (1 | ) | | 1 |
| | — |
| | — |
| | — |
| — |
| | — |
|
| Repurchase of restricted shares for taxes | | (41 | ) | — |
| | (2,396 | ) | | — |
| | — |
| | — |
| — |
| | (2,396 | ) | | (41 | ) | | | (2,396 | ) | | — |
| | — |
| | — |
| — |
| | (2,396 | ) |
| Stock-based compensation | | — |
| — |
| | 10,783 |
| | — |
| | — |
| | — |
| — |
| | 10,783 |
| | — |
| — |
| | 10,783 |
| | — |
| | — |
| | — |
| — |
| | 10,783 |
|
| Dividends on common stock | | — |
| — |
| | 407 |
| | (52,641 | ) | | — |
| | — |
| — |
| | (52,234 | ) | | — |
| — |
| | 407 |
| | (52,641 | ) | | — |
| | — |
| — |
| | (52,234 | ) |
| Dividends on common stock in excess of retained earnings | | — |
| — |
| | (17,718 | ) | | — |
| | — |
| | — |
| — |
| | (17,718 | ) | | — |
| — |
| | (17,718 | ) | | — |
| | — |
| | — |
| — |
| | (17,718 | ) |
| Balance at December 31, 2017 | | 17,993 |
| 250 |
| | 276,408 |
| | (69,940 | ) | | (105 | ) | | 7,029 |
| (422,153 | ) | | (215,540 | ) | | 17,993 |
| 250 |
| | 276,408 |
| | (69,940 | ) | | (105 | ) | | 7,029 |
| (422,153 | ) | | (215,540 | ) |
| Net income | | — |
| — |
| | — |
| | 80,354 |
| | — |
| | — |
| — |
| | 80,354 |
| | — |
| — |
| | — |
| | 80,354 |
| | — |
| | — |
| — |
| | 80,354 |
|
| Other comprehensive gain | | — |
| — |
| | — |
| | — |
| | 45 |
| | — |
| — |
| | 45 |
| | — |
| — |
| | — |
| | — |
| | 45 |
| | — |
| — |
| | 45 |
|
| Purchase of Company common stock | | (479 | ) | — |
| | — |
| | — |
| | — |
| | 479 |
| (34,929 | ) | | (34,929 | ) | | (479 | ) | — |
| | — |
| | — |
| | — |
| | 479 |
| (34,929 | ) | | (34,929 | ) |
| Reissuance of treasury stock | | 167 |
| — |
| | (2,551 | ) | | — |
| | — |
| | (167 | ) | 6,479 |
| | 3,928 |
| | 167 |
| — |
| | (2,551 | ) | | — |
| | — |
| | (167 | ) | 6,479 |
| | 3,928 |
|
| Net issuance of shares for stock plans | | (11 | ) | — |
| | — |
| | — |
| | — |
| | — |
| — |
| | — |
| |
| Net use of shares for stock plans | | | (11 | ) | — |
| | — |
| | — |
| | — |
| | — |
| — |
| | — |
|
| Repurchase of restricted shares for taxes | | (27 | ) | — |
| | (1,972 | ) | | — |
| | — |
| | — |
| — |
| | (1,972 | ) | | (27 | ) | — |
| | (1,972 | ) | | — |
| | — |
| | — |
| — |
| | (1,972 | ) |
| Stock-based compensation | | — |
| — |
| | 10,546 |
| | — |
| | — |
| | — |
| — |
| | 10,546 |
| | — |
| — |
| | 10,546 |
| | — |
| | — |
| | — |
| — |
| | 10,546 |
|
| Dividends on common stock in excess of retained earnings | | — |
| — |
| | (44,705 | ) | | — |
| | — |
| | — |
| — |
| | (44,705 | ) | | — |
| — |
| | (44,705 | ) | | — |
| | — |
| | — |
| — |
| | (44,705 | ) |
| Balance at December 31, 2018 | | 17,644 |
| $ | 250 |
| | $ | 237,726 |
| | $ | 10,414 |
| | $ | (60 | ) | | 7,341 |
| $ | (450,603 | ) | | $ | (202,273 | ) | | 17,644 |
| 250 |
| | 237,726 |
| | 10,414 |
| | (60 | ) | | 7,341 |
| (450,603 | ) | | (202,273 | ) |
| Adoption of ASC 842 (Note 2) | | | — |
| — |
| | — |
| | (5,030 | ) | | — |
| | — |
| — |
| | (5,030 | ) |
| Net income | | | — |
| — |
| | — |
| | 104,346 |
| | — |
| | — |
| — |
| | 104,346 |
|
| Other comprehensive gain | | | — |
| — |
| | — |
| | — |
| | 2 |
| | — |
| — |
| | 2 |
|
| Purchase of Company common stock | | | (1,348 | ) | — |
| | — |
| | — |
| | — |
| | 1,348 |
| (111,697 | ) | | (111,697 | ) |
| Reissuance of treasury stock | | | 285 |
| (1 | ) | | (520 | ) | | — |
| | — |
| | (285 | ) | 12,490 |
| | 11,969 |
|
| Net use of shares for stock plans | | | (30 | ) | — |
| | — |
| | — |
| | — |
| | — |
| — |
| | — |
|
| Repurchase of restricted shares for taxes | | | (30 | ) | — |
| | (2,728 | ) | | — |
| | — |
| | — |
| — |
| | (2,728 | ) |
| Stock-based compensation | | | — |
| — |
| | 10,808 |
| | — |
| | — |
| | — |
| — |
| | 10,808 |
|
| Dividends on common stock | | | — |
| — |
| | 982 |
| | (48,077 | ) | | — |
| | — |
| — |
| | (47,095 | ) |
| Other | | | — |
| — |
| | (76 | ) | | — |
| | — |
| | — |
| — |
| | (76 | ) |
| Balance at December 31, 2019 | | | 16,522 |
| $ | 249 |
| | $ | 246,192 |
| | $ | 61,653 |
| | $ | (58 | ) | | 8,404 |
| $ | (549,810 | ) | | $ | (241,774 | ) |
See the accompanying notes to the consolidated financial statements.
Dine Brands Global, Inc. and Subsidiaries Consolidated Statements of Cash Flows (In thousands) | Dine Brands Global, Inc. and Subsidiaries Consolidated Statements of Cash Flows (In thousands) | Dine Brands Global, Inc. and Subsidiaries Consolidated Statements of Cash Flows (In thousands) |
| | | Year Ended December 31, | Year Ended December 31, |
| | 2018 | | 2017 | | 2016 | 2019 | | 2018 | | 2017 |
| Cash flows from operating activities | | | | | | | | | | |
| Net income (loss) | $ | 80,354 |
| | $ | (342,750 | ) | | $ | 101,002 |
| $ | 104,346 |
| | $ | 80,354 |
| | $ | (342,750 | ) |
| Adjustments to reconcile net income (loss) to cash flows provided by operating activities: | | | | | | | | | | |
| Impairment of goodwill and intangible assets | — |
| | 531,634 |
| | — |
| — |
| | — |
| | 531,634 |
|
| Depreciation and amortization | | 42,493 |
| | 32,175 |
| | 30,648 |
|
| Non-cash stock-based compensation expense | | 10,808 |
| | 10,546 |
| | 10,752 |
|
| Non-cash interest expense | | 3,369 |
| | 3,792 |
| | 3,364 |
|
| Loss on extinguishment of debt | | 8,276 |
| | — |
| | — |
|
| Closure and impairment charges | | 1,485 |
| | 2,038 |
| | 3,834 |
|
| Deferred income taxes | (11,847 | ) | | (136,127 | ) | | (12,714 | ) | (5,494 | ) | | (11,847 | ) | | (136,127 | ) |
| Depreciation and amortization | 32,175 |
| | 30,648 |
| | 30,606 |
| |
| Non-cash interest expense | 3,792 |
| | 3,364 |
| | 3,218 |
| |
| Closure and other impairment charges | 2,038 |
| | 3,834 |
| | 2,621 |
| |
| Non-cash stock-based compensation expense | 10,546 |
| | 10,752 |
| | 10,926 |
| |
| Tax benefit from stock-based compensation | — |
| | — |
| | 1,132 |
| |
| Excess tax benefit from stock options exercised | — |
| | — |
| | (1,019 | ) | |
| (Gain) loss on disposition of assets | (623 | ) | | (6,285 | ) | | 809 |
| |
| Deferred revenue | | (7,695 | ) | | (5,577 | ) | | — |
|
| Gain on disposition of assets | | (332 | ) | | (623 | ) | | (6,285 | ) |
| Other | (6,526 | ) | | (10,980 | ) | | (6,674 | ) | (5,374 | ) | | (949 | ) | | (10,980 | ) |
| Changes in operating assets and liabilities: | | | | | | | | | | |
| Accounts receivable, net | 3,149 |
| | (8,430 | ) | | 3,820 |
| (396 | ) | | 3,149 |
| | (8,430 | ) |
| Current income tax receivables and payables | 8,119 |
| | (8,490 | ) | | (909 | ) | 8,677 |
| | 8,119 |
| | (8,490 | ) |
| Gift card receivables and payables | (1,488 | ) | | (3,322 | ) | | (4,288 | ) | (1,037 | ) | | (1,488 | ) | | (3,322 | ) |
| Prepaid expenses and other current assets | 10,425 |
| | (8,247 | ) | | (156 | ) | |
| Other current assets | | (498 | ) | | 10,425 |
| | (8,247 | ) |
| Accounts payable | (9,940 | ) | | 7,208 |
| | 89 |
| 583 |
| | (9,940 | ) | | 7,208 |
|
| Accrued employee compensation and benefits | 13,183 |
| | (1,126 | ) | | (10,476 | ) | (3,575 | ) | | 13,183 |
| | (1,126 | ) |
| Other current liabilities | 6,989 |
| | 4,050 |
| | 123 |
| (456 | ) | | 6,989 |
| | 4,050 |
|
| Cash flows provided by operating activities | 140,346 |
| | 65,733 |
| | 118,110 |
| 155,180 |
| | 140,346 |
| | 65,733 |
|
| Cash flows from investing activities | | | | | | | | | | |
| Principal receipts from notes, equipment contracts and other long-term receivables | 25,771 |
| | 20,486 |
| | 18,689 |
| 24,075 |
| | 25,771 |
| | 20,486 |
|
| Proceeds from sale of property and equipment | 655 |
| | 1,100 |
| | — |
| 2,540 |
| | 655 |
| | 1,100 |
|
| Acquisition of business | (20,155 | ) |
| — |
| | — |
| — |
|
| (20,155 | ) | | — |
|
| Additions to property and equipment | (14,279 | ) | | (13,370 | ) | | (5,637 | ) | (19,424 | ) | | (14,279 | ) | | (13,370 | ) |
| Additions to long-term receivables | (6,500 | ) | | — |
| | — |
| (6,955 | ) | | (6,500 | ) | | — |
|
| Other | (293 | ) | | (541 | ) | | (503 | ) | (389 | ) | | (293 | ) | | (541 | ) |
| Cash flows (used in) provided by investing activities | (14,801 | ) | | 7,675 |
| | 12,549 |
| (153 | ) | | (14,801 | ) | | 7,675 |
|
| Cash flows from financing activities | | | | | | | | | | |
| Proceeds from issuance of long-term debt | | 1,300,000 |
| | — |
| | — |
|
| Repayment of long-term debt | | (1,283,750 | ) | | (13,000 | ) | | (3,250 | ) |
| Borrowings from revolving credit facilities | 75,000 |
| | — |
| | — |
| — |
| | 75,000 |
| | — |
|
| Repayments of revolving credit facilities | (50,000 | ) | | — |
| | — |
| (25,000 | ) | | (50,000 | ) | | — |
|
| Repayment of long-term debt | (13,000 | ) | | (3,250 | ) | | — |
| |
| Dividends paid on common stock | (51,125 | ) | | (69,790 | ) | | (67,429 | ) | (46,859 | ) | | (51,125 | ) | | (69,790 | ) |
| Repurchase of Dine Brands Global common stock | (33,603 | ) | | (10,003 | ) | | (55,343 | ) | |
| Principal payments on capital lease and financing obligations | (13,907 | ) | | (12,949 | ) | | (13,978 | ) | |
| Repurchase of Dine Brands common stock | | (109,698 | ) | | (33,603 | ) | | (10,003 | ) |
| Principal payments of finance lease obligations | | (13,639 | ) | | (13,907 | ) | | (12,949 | ) |
| Payment of debt issuance costs | (3,633 | ) | | — |
| | — |
| (13,150 | ) | | (3,633 | ) | | — |
|
| Proceeds from stock options exercised | 3,928 |
| | 2,635 |
| | 1,409 |
| 11,969 |
| | 3,928 |
| | 2,635 |
|
| Tax payments for restricted stock upon vesting | (1,972 | ) | | (2,396 | ) | | (2,859 | ) | (2,728 | ) | | (1,972 | ) | | (2,396 | ) |
| Excess tax benefit from stock options exercised | — |
| | — |
| | 1,019 |
| |
| Other | | (76 | ) | | — |
| | — |
|
| Cash flows used in financing activities | (88,312 | ) | | (95,753 | ) | | (137,181 | ) | (182,931 | ) | | (88,312 | ) | | (95,753 | ) |
| Net change in cash, cash equivalents and restricted cash | 37,233 |
| | (22,345 | ) | | (6,522 | ) | (27,904 | ) | | 37,233 |
| | (22,345 | ) |
| Cash, cash equivalents and restricted cash at beginning of year | 163,146 |
| | 185,491 |
| | 192,013 |
| 200,379 |
| | 163,146 |
| | 185,491 |
|
| Cash, cash equivalents and restricted cash at end of year | $ | 200,379 |
| | $ | 163,146 |
| | $ | 185,491 |
| $ | 172,475 |
| | $ | 200,379 |
| | $ | 163,146 |
|
| Supplemental disclosures | | | | | | | | | | |
| Interest paid | $ | 66,059 |
| | $ | 67,522 |
| | $ | 69,051 |
| $ | 66,104 |
| | $ | 66,059 |
| | $ | 67,522 |
|
| Income taxes paid | $ | 34,246 |
| | $ | 59,528 |
| | $ | 69,812 |
| $ | 44,748 |
| | $ | 34,246 |
| | $ | 59,528 |
|
| Non-cash conversion of accounts receivable to notes receivable | $ | 11,959 |
| | $ | 5,286 |
| | $ | — |
| $ | 185 |
| | $ | 11,959 |
| | $ | 5,286 |
|
See the accompanying notes to the consolidated financial statements.
Dine Brands Global, Inc. and Subsidiaries
Notes to the Consolidated Financial Statements
1. The Company
The first International House of Pancakes® (“IHOP”) restaurant opened in 1958 in Toluca Lake, California. Shortly thereafter, the Company began developing and franchising additional restaurants. The Company was incorporated as IHOP Corp. under the laws of the State of Delaware in 1976. In November 2007, the Company acquired Applebee's International, Inc., which became a wholly-owned subsidiary of the Company. Effective June 2, 2008, the name of the Company was changed to DineEquity, Inc. and on February 20, 2018, the name of the Company was changed to Dine Brands Global, Inc.SM (“Dine Brands Global”). The Company owns, franchises and operates two2 restaurant concepts: Applebee's Neighborhood Grill + Bar® (“Applebee's”), in the bar and grill segment within the casual dining category of the restaurant industry, and IHOP in the family dining category of the restaurant industry.
As of December 31, 20182019, there were 1,8311,841 IHOP® restaurants, of which 1,6691,680 were subject to franchise agreements and 162161 were subject to area license agreements. These IHOP restaurants were located in all 50 states of the United States, the District of Columbia, three3 United States territories and 1213 countries outside the United States. As of December 31, 20182019, there were 1,8371,787 Applebee's® restaurants, of which 1,7681,718 were subject to franchise agreements and 69 were company-operated restaurants. These Applebee's restaurants were located in all 50 states of the United States, two2 United States territories and 1312 countries outside the United States.
References herein to Applebee's and IHOP restaurants are to these restaurant concepts, whether operated by franchisees, area licensees or the Company. Retail sales at restaurants that are owned by franchisees and area licensees are not attributable to the Company.
2. Basis of Presentation and Summary of Significant Accounting Policies
Principles of Consolidation
The consolidated financial statements include the accounts of Dine Brands Global, Inc. and its wholly-owned subsidiaries. All intercompany accounts and transactions have been eliminated in consolidation.
Fiscal Periods
The Company has a 52/53 week fiscal year that ends on the Sunday nearest to December 31 of each year. In a 52-week fiscal year, each fiscal quarter contains 13 weeks, comprised of two, four-week fiscal months followed by a five-week fiscal month. In a 53-week fiscal year, the last month of the fourth fiscal quarter contains six weeks. For convenience, the Company refers to its fiscal years as ending on December 31 and its fiscal quarters as ending on March 31, June 30 and September 30. The 2019 fiscal year ended December 29, 2019 and contained 52 weeks. The 2018 fiscal year ended December 30, 2018 and contained 52 weeks. The 2017 fiscal year ended December 31, 2017 and contained 52 weeks; the 2016 fiscal year ended January 1, 2017 and contained 52 weeks.
Use of Estimates
The preparation of financial statements in conformity with United States generally accepted accounting principles (“U.S. GAAP”) requires the Company's management to make estimates and assumptions that affect the reported amounts of assets and liabilities, disclosures of contingent assets and liabilities, if any, at the date of the consolidated financial statements, and the reported amounts of revenues and expenses during the reporting period. Significant estimates are made in the calculation and assessment of the following: impairment of tangible and intangible assets and goodwill; income taxes; allowance for doubtful accounts and notes receivables; lease accounting estimates; contingencies; and stock-based compensation. On an ongoing basis, the Company evaluates its estimates based on historical experience, current conditions and various other assumptions that are believed to be reasonable under the circumstances. The Company adjusts such estimates and assumptions when facts and circumstances dictate. Actual results could differ from those estimates.
Concentration of Credit Risk
The Company's cash, cash equivalents, restricted cash and accounts receivable are potentially subject to concentration of credit risk. Cash and cash equivalents are placed with financial institutions that management believes are creditworthy. The Company does not believe that it is exposed to any significant credit risk on cash, cash equivalents and cash equivalents.restricted cash. At times, cash, cash equivalents and restricted cash equivalent balances may be in excess of FDIC insurance limits.
Accounts receivable are derived from revenues earned from franchisees and area licensees located primarily in the United States. Financing receivables arise from the financing of restaurant equipment, leases or franchise fees with the Company by IHOP franchisees. The Company is subject to a concentration of credit risk with respect to receivables from franchisees that
Dine Brands Global, Inc. and Subsidiaries
Notes to the Consolidated Financial Statements (Continued)
2. Basis of Presentation and Summary of Significant Accounting Policies (Continued)
own a large number of Applebee's or IHOP restaurants. As of December 31, 2018,2019, there were two2 franchisees that owned 400 or more restaurants each (one(1 Applebee's franchisee and one1 franchisee with cross-brand ownership). These franchisees operated 877874 Applebee's and IHOP restaurants in the United States, which comprised 26.3%26.4% of the total Applebee's and IHOP franchise and area license restaurants in the United States. Revenues from these franchisees represented 19.8%17.4%, 19.3%19.8%, and 18.9%19.3% of total consolidated revenue for the years ended December 31, 2019, 2018 2017 and 2016,2017, respectively. One franchisee represented 10.6% and 11.9% of total consolidated revenue for the yearyears ended December 31, 2018.2019 and 2018, respectively. No single franchisee represented more than 10% of total consolidated revenue for the yearsyear ended December 31, 2017 and 2016.2017. Receivables from these franchisees totaled $17.5$14.4 million and $24.0$17.5 million at December 31, 20182019 and 2017,2018, respectively.
Cash and Cash Equivalents
The Company considers all highly liquid investment securities with remaining maturities at the date of purchase of three months or less to be cash equivalents. These cash equivalents are stated at cost which approximates market value. Cash held related to IHOP advertising funds and the Company's gift card programs is not considered to be restricted cash as there are no restrictions on the use of these funds. Total cash balances related to the IHOP advertising funds and the Company's gift card programs were $52.2$56.6 million and $57.1$52.2 million as of December 31, 20182019 and 2017,2018, respectively.
Restricted Cash
Current
Current restricted cash of $48.5$40.7 million at December 31, 2019 consisted of $38.4 million of funds required to be held in trust in connection with the Company's securitized debt and $2.3 million of funds from Applebee's franchisees pursuant to franchise agreements, usage of which was restricted to advertising activities. Current restricted cash of $48.5 million at December 31, 2018 primarily consisted of $42.3 million of funds required to be held in trust in connection with the Company's securitized debt and $6.2 million of funds from Applebee's franchisees pursuant to franchise agreements, usage of which was restricted to advertising activities. Current restricted cash of $31.4 million at December 31, 2017 primarily consisted of $29.3 million of funds required to be held in trust in connection with the Company's securitized debt and $2.1 million of funds from Applebee's franchisees pursuant to franchise agreements, usage of which was restricted to advertising activities.
Non-current
Non-current restricted cash of $15.7 million and $14.7 million as of at December 31, 20182019 and 20172018, respectively, represents interest reserves required to be set aside for the duration of the securitized debt.
Property and Equipment
Property and equipment are stated at cost, net of accumulated depreciation. Properties under capitalfinance leases are stated at the present value of the minimum lease payments. Depreciation is computed using the straight-line method over the estimated useful lives of the assets or remaining useful lives. Leasehold improvements and properties under capitalfinance leases are amortized on a straight-line basis over their estimated useful lives or the lease term, if less. The Company has capitalized certain costs incurred in connection with the development of internal-use software which are included in equipment and fixtures in Note 5 - Property and Equipment, of the Notes to the Consolidated Financial Statements and are amortized over the expected useful life of the asset. The general ranges of depreciable and amortizable lives are as follows:
|
| | |
| Category | | Depreciable Life |
| Buildings and improvements | | 25 -to 40 years |
| Leaseholds and improvements | | Shorter of primary lease term or between three to 40 years |
| Equipment and fixtures | | Three to five years |
| Internal-use software | | Three to 10 years |
Properties under capitalfinance leases | | Primary lease term or remaining primary lease term |
Long-Lived Assets
On a regular basis, the Company assesses whether events or changes in circumstances have occurred that potentially indicate the carrying value of long-lived assets (primarily assets related to property and equipment leased or subleased to franchisees) may not be recoverable. The Company tests impairment using historical cash flows and other relevant facts and circumstances as the primary basis for estimates of future cash flows. The Company considers factors such as the number of years the franchisee's restaurant has been in operation, sales trends, cash flow trends, remaining lease life and other factors which apply on a case-by-case basis. The analysis is performed at the restaurant level for indicators of permanent impairment.
Dine Brands Global, Inc. and Subsidiaries
Notes to the Consolidated Financial Statements (Continued)
2. Basis of Presentation and Summary of Significant Accounting Policies (Continued)
Recoverability of the Company's assets is measured by comparing the assets' carrying value to the undiscounted future cash flows expected to be generated over the assets' remaining useful life or remaining lease term, whichever is less. If the totalTotal expected undiscounted future cash flows that are less than the carrying amount of the assets this may beis an indicator of impairment. If it is decided that there has been an impairment, the carrying amount of the asset is written down to the estimated fair value as determined in accordance with U.S. GAAP governing fair value measurements. The primary method of estimating fair value is based on a discounted cash flow analysis. Any loss resulting from impairment is recognized as a charge against operations.
See Note 13 - Closure and Other Impairment Charges, of the Notes to the Consolidated Financial Statements for additional information.
Goodwill and Intangible Assets
Goodwill is recorded when the aggregate purchase price of an acquisition exceeds the estimated fair value of the net identified tangible and intangible assets acquired. Intangible assets resulting from an acquisition are accounted for using the purchase method of accounting and are estimated by management based on the fair value of the assets received. The Company's identifiable intangible assets are comprised primarily of the Applebee's tradename and Applebee's franchise agreements. Identifiable intangible assets with finite lives (franchise agreements) are amortized over the period of estimated benefit using the straight-line method and estimated useful lives. Goodwill and intangible assets considered to have an indefinite life (primarily the Applebee's tradename) are not subject to amortization. The determination of indefinite life is subject to reassessment if changes in facts and circumstances indicate the period of benefit has become finite.
Goodwill has been allocated to three3 reporting units. The significant majority of the Company's goodwill resulted from the November 29, 2007 acquisition of Applebee's and was allocated to the Applebee's franchised restaurants unit (“Applebee's franchise unit”). Smaller amounts of goodwill arising from other business combinations have been allocated to the IHOP franchised restaurants unit (“IHOP franchise unit”) and the Applebee's company restaurants unit (“Applebee's company unit”). See Note 6 - Goodwill, of the Notes to the Consolidated Financial Statements for additional information.
The Company evaluates the goodwill of the Applebee's franchise unitand company units and the indefinite-lived Applebee's tradename for impairment as of October 31 of each year and will evaluate the goodwill of the Applebee's company unit as of October 31 of each year. The Company evaluates the goodwill of the IHOP franchise unit for impairment as of December 31 of each year. In addition to the annual evaluation for impairment, goodwill and indefinite-lived intangible assets are evaluated more frequently if the Company believes indicators of impairment exist.
When evaluating goodwill and indefinite-lived intangible assets for impairment, under U.S. GAAP, the Company may first perform an assessment of qualitative factors to determine if the fair value of the reporting unit or the intangible asset is more-likely-than-not greater than the carrying amount. Such qualitative factors include, but are not limited to, macro-economic conditions, market and industry conditions, cost considerations, the competitive environment, share price fluctuations, overall financial performance and results of past impairment tests. If, based on a review of the qualitative factors, the Company determines it is more-likely-than-not that the fair value is greater than the carrying value, the Company may bypass a quantitative test for impairment.
In performing the quantitative test for impairment of goodwill, the Company primarily uses the income approach method of valuation that includes the discounted cash flow method and the market approach that includes the guideline public company method. Significant assumptions used to determine fair value under the discounted cash flow method include expected future trends in sales, operating expenses, overhead expenses, capital expenditures and changes in working capital, along with an appropriate discount rate based on the Company's estimated cost of equity capital and after-tax cost of debt. Significant assumptions used to determine fair value under the guideline public company method include the selection of guideline companies and the valuation multiples applied. The Company adopted the guidance in Accounting Standards Update 2017-04 effective January 1, 2017; accordingly, the Company measures impairment as the excess of a reporting unit's carrying amount over its fair value as determined by the quantitative test described above.
In the process of performing its quantitative impairment review of intangible assets considered to have an indefinite life, the Company primarily uses the relief of royalty method under the income approach method of valuation. Significant assumptions used to determine fair value under the relief of royalty method include future trends in sales, a royalty rate and an appropriate discount rate based on the Company's estimated cost of equity capital and after-tax cost of debt to be applied to the forecast revenue stream.
Dine Brands Global, Inc. and Subsidiaries
Notes to the Consolidated Financial Statements (Continued)
2. Basis of Presentation and Summary of Significant Accounting Policies (Continued)
Revenue Recognition
The Company's revenues are recorded in four4 categories: franchise operations, rental operations, financing operations and company restaurant operations. Franchise revenue (which comprises most of the Company's revenues) and revenue from company-operated restaurants are recognized in accordance with Accounting Standards Codification 606 -Revenue from Contracts with Customers (“ASC 606”). Under ASC 606, revenue is recognized upon transfer of control of promised services or goods to customers in an amount that reflects the consideration the Company expects to receive for those services or goods. The Company's rental and financing revenues are recognized in accordance with other U.S. GAAP accounting standards and are not subject to ASC 606.
Franchise Revenue
The Company owns and franchises the Applebee’s and IHOP restaurant concepts. The franchise arrangement for both brands is documented in the form of a franchise agreement and, in most cases, a development agreement. The franchise arrangement between the Company as the franchisor and the franchisee as the customer requires the Company to perform various activities to support the brand that do not directly transfer goods and services to the franchisee, but instead represent a single performance obligation, which is the transfer of the franchise license. The intellectual property subject to the franchise license is symbolic intellectual property as it does not have significant standalone functionality, and substantially all the utility is derived from its association with the Company’s past or ongoing activities. The nature of the Company’s promise in granting the franchise license is to provide the franchisee with access to the brand’s symbolic intellectual property over the term of the license. The services provided by the Company are highly interrelated with the franchise license and as such are considered to represent a single performance obligation.
The transaction price in a standard franchise arrangement for both brands primarily consists of (a) initial franchise/development fees; (b) continuing franchise fees (royalties); and (c) advertising fees. Since the Company considers the licensing of the franchising right to be a single performance obligation, no allocation of the transaction price is required. Additionally, all domestic IHOP franchise agreements require franchisees to purchase proprietary pancake and waffle dry mix from the Company.
The Company recognizes the primary components of the transaction price as follows:
Franchise and development fees are recognized as revenue ratably on a straight-line basis over the term of the franchise agreement commencing with the restaurant opening date. As these fees are typically received in cash at or near the beginning of the franchise term, the cash received is initially recorded as a contract liability until recognized as revenue over time;
The Company is entitled to royalties and advertising fees based on a percentage of the franchisee's gross sales as defined in the franchise agreement. Royalty and advertising revenue are recognized when the franchisee's reported sales occur. Depending on timing within a fiscal period, the recognition of revenue results in either what is considered a contract asset (unbilled receivable) or, once billed, accounts receivable, on the balance sheet.sheet;
Revenue from the sales of proprietary pancake and waffle dry mix is recognized in the period in which distributors ship the franchisee's order; recognition of revenue results in accounts receivable on the balance sheet.
In determining the amount and timing of revenue from contracts with customers, the Company exercises significant judgment with respect to collectibility of the amount; however, the timing of recognition does not require significant judgment as it is based on either the franchise term, the month of sale as reported sales by the franchisee or the date of product shipment, none of which require estimation.
The Company does not incur a significant amount of contract acquisition costs in conducting its franchising activities. The Company believes its franchising arrangements do not contain a significant financing component.
Any excess or deficiency of advertising fee revenue compared to advertising expenditures, is recognized in the fourth quarter of the Company's fiscal year. Any excess of revenue over expenditures is recognized only to the extent of previously recognized deficits. When advertising revenues exceed the related advertising expenses and there is no recovery of a previously recognized deficit of advertising revenues, advertising costs are accrued up to the amount of revenues.
Dine Brands Global, Inc. and Subsidiaries
Notes to the Consolidated Financial Statements (Continued)
2. Basis of Presentation and Summary of Significant Accounting Policies (Continued)
Company Restaurant Revenue
Company restaurant revenue comprises retail sales at company-operated restaurants. Sales by company-operated restaurants are recognized when food and beverage items are sold. Company restaurant sales are reported net of sales taxes collected from guests that are remitted to the appropriate taxing authorities.authorities, with no significant judgments required.
Dine Brands Global, Inc. and Subsidiaries
Notes to the Consolidated Financial Statements (Continued)
2. Basis of Presentation and Summary of Significant Accounting Policies (Continued)
Rental operations revenue includes revenue from operating leases and interest income from direct financing leases. See Basis of Presentation and Summary of Significant Accounting Policies - Leases.
Financing operations revenue consists primarily of interest income from the financing of franchise fees and equipment leases, as well asother notes receivable from franchisees and sales of equipment associated with refranchised IHOP restaurants.
The Company administers gift card programs for Applebee's and IHOP. The Company records a liability in the period in which a gift card is sold and recognizes costs associated with its administration of the gift card programs as prepaid assets when the costs are incurred. The liability and prepaid asset recorded on the Company's books are relieved when gift cards are redeemed. If redemption occurs at a franchisee-operated restaurant, the gift card revenue, net of costs, is remitted to the franchisee. The Company receives gift card breakage revenue only from gift cards redeemed at company-operated restaurants. Breakage revenue for gift cards redeemed at company-operated restaurants for the years ended December 31, 20182019, 20172018 and 20162017 was not material.
Allowance for Credit Losses
The allowance for doubtful accounts is the Company's best estimate of the amount of probable credit losses inincurred on existing receivables; however, changes in circumstances relating to receivables may result in changes to the allowance in the future. The Company determines the allowance based on historical experience, current payment patterns, future obligations and the Company's assessment of the franchisee's or area licensee's ability to pay outstanding balances. The primary indicator of credit quality is delinquency, which is considered to be a receivable balance greater than 90 days past due. The Company continually reviews the allowance for doubtful accounts. Past due balances and future obligations are reviewed individually for collectability. Account balances are charged against the allowance after all collection efforts have been exhausted and the potential for recovery is considered remote. Credit losses historically have been within management's estimates. See Newly Issued Accounting Standards Not Yet Adopted.
Leases
The Company is the lessor or sub-lessoraccounts for its leasing activities in accordance with accounting guidance for leases, as codified in Accounting Standards Topic 842 (“ASC 842”), adopted as of the properties on which 676 IHOP restaurantsbeginning of its 2019 fiscal year. In adopting ASC 842, the Company utilized expedients that allowed it to retain the classification, as either an operating lease or a finance lease, that was previously determined under prior accounting guidance for leases. See Accounting Standards Adopted Effective January 1, 2019. The Company reassesses this classification upon renewal, extension or the modification of an existing lease agreement. The Company determines the appropriate classification upon entering into a new contract determined to contain a lease.
Operating lease assets and one Applebee's restaurant is located. The restaurantsliabilities are subleased to franchisees or, in a few instances, were operated by the Company. The Company's IHOP leases generally provide for an initial term of 20 to 25 years, with most having one or more five-year renewal optionsrecognized at the lease commencement date, or were recognized upon adoption of ASC 842. Operating lease liabilities represent the present value of lease payments not yet paid. Operating lease assets represent the Company's option. The rental payments or receipts on leases that meetright to use an underlying asset and are based upon the operating lease criterialiabilities adjusted for prepayments or accrued lease payments, initial direct costs, lease incentives, and impairment of operating lease assets.
The Company's lease agreements generally do not provide information to determine the implicit interest rate in the agreements. This requires the Company to make significant judgments in determining the incremental borrowing rate to be used in calculating operating lease liabilities as of the adoption or commencement date. The Company estimates the incremental borrowing rate primarily by reference to (i) yield rates on debt issuances by companies of a similar credit rating as the Company; (ii) U.S. Treasury rates as of the adoption or commencement date; and (iii) adjustments for differences between these rates and the lease term.
The cost of an operating lease is recognized over the lease term on a straight-line basis. The lease term commences on the date the Company has the right to control the use of the leased property. Certain leases may contain provisions for rent holidays and fixed-step escalations in payments over the base lease term, as well as renewal periods. The effects of the holidays and fixed-step escalations are recorded as rentalreflected in rent expense or rental income, respectively. Rental expense and rental income for these operating leases are recognized on thea straight-line basis over the original termsexpected lease term. Differences between amounts paid and amounts expensed are recorded as deferred rent. Certain leases may include rent escalations based on inflation indexes and fair market value adjustments. Certain leases may contain contingent rental provisions that include a fixed
Dine Brands Global, Inc. and Subsidiaries
Notes to the Consolidated Financial Statements (Continued)
2. Basis of Presentation and Summary of Significant Accounting Policies (Continued)
base rent plus an additional percentage of the leases. Any difference between straight-line rent expense or incomerestaurant’s sales. Subsequent escalations subject to such an index and actual amounts paid or received represents deferred rent and is included in the consolidated balance sheetscontingent rental payments are recognized as other assets or other liabilities, as appropriate.variable lease expense.
The rental payments or receipts on those property leases that meet the capitalfinance lease criteria result in the recognition of interest expense or interest income and a reduction of capitalfinance lease obligation or financing lease receivable, respectively. CapitalFinance lease obligations are amortized based on the Company's incremental borrowing rate and direct financing leases are amortized using the implicit interest rate.
The lease term used for straight-line rent expense is calculated from the date the Company obtains possession of the leased premises through the lease termination date. The Company records rent from the possession date through restaurant open date as expense. Once a restaurant opens for business, the Company records straight-line rent over the lease term plus contingent rent to the extent it exceeded the minimum rent obligation per the lease agreement. The Company uses a consistent lease term when calculating depreciation of leasehold improvements, when determining straight-line rent expense and when determining classification of its leases as either operating or capital. For leases that contain rent escalations, the Company records the total rent payable during the lease term, as determined above, on the straight-line basis over the term of the lease (including the rent holiday period beginning upon our possession of the premises), and records the difference between the minimum rents paid and the straight-line rent as a lease obligation. Certain leases contain provisions that require additional rental payments based upon restaurant sales volume (“contingent rent”). Contingent rentals are accrued each period as the liabilities are incurred, in addition to the straight-line rent expense noted above.
There is potential for variability in the rent holiday period, which begins on the possession date and ends on the restaurant open date, during which no cash rent payments are typically due under the terms of the lease. Factors that may affect the length of the rent holiday period generally relate to construction related delays. Extension of the rent holiday period due to delays in restaurant openings will result in greater pre-opening rent expense recognized during the rent holiday period and lesser occupancy expense during the rest of the lease term (post-opening).
Dine Brands Global, Inc. and Subsidiaries
Notes to the Consolidated Financial Statements (Continued)
2. Basis of Presentation and Summary of Significant Accounting Policies (Continued)
For leases that contain rent escalations, we record the total rent payable or receivable during the lease term, as determined above, on the straight-line basis over the term of the lease (including the rent holiday period beginning upon our possession of the premises, if applicable), and record the difference between the minimum rent paid or received and the straight-line rent as a lease obligation or receivable, respectively. Certain leases contain provisions that require additional rental payments or receipts based upon restaurant sales volume (“contingent rent”). Contingent rentals are accrued each period as the liabilities are incurred or receivables are earned, in addition to the straight-line rent expense or revenue, respectively, noted above.
Certain lease agreements contain tenant improvement allowances, rent holidays and lease premiums, which are amortized over the shorter of the estimated useful life or lease term. For tenant improvement allowances, the Company also records a deferred rent liability or an obligation in non-current liabilities on the consolidated balance sheets and amortizes the deferred rent over the term of the lease as a reduction to company restaurant expenses in the consolidated statements of comprehensive income.
Pre-opening Expenses
Expenditures related to the opening of new or relocated restaurants are charged to expense when incurred.
Advertising
Advertising fees included as franchise revenue for the years ended December 31, 2019, 2018 and 2017 were $283.0 million, $268.3 millionand 2016 were $268.3$234.2 million $234.2 million and $260.1 million,, respectively.
Advertising expense reflected in the Consolidated Statements of Comprehensive Income (Loss) includes local marketing advertising costs incurred by company-operated restaurants, contributions to the national advertising fund made by Applebee's and IHOP and certain advertising costs incurred by the Company to benefit future franchise operations. Costs of advertising are typically expensed either as incurred or the first time the advertising takes place. When advertising revenues exceed the related advertising expenses, advertising costs are accrued up to the amount of revenues. Advertising expense included in company restaurant operations for the years ended December 31, 2019, 2018 and 2017 and 2016 was $0.3$6.1 million, $0.3 million, and $0.8$0.3 million, respectively.
Fair Value Measurements
The Company determines the fair market values of its financial assets and liabilities, as well as non-financial assets and liabilities that are recognized or disclosed at fair value on a recurring basis, based on the fair value hierarchy established in U.S. GAAP. As necessary, the Company measures its financial assets and liabilities using inputs from the following three levels of the fair value hierarchy:
Level 1 inputs are quoted prices in active markets for identical assets or liabilities.
Level 2 inputs are observable for the asset or liability, either directly or indirectly, including quoted prices in active markets for similar assets or liabilities.
Level 3 inputs are unobservable and reflect the Company's own assumptions.
The Company does not have a material amount of financial assets or liabilities that are required under U.S. GAAP to be measured at fair value on either a recurring or non-recurring basis. None of the Company's non-financial assets or non-financial liabilities is required to be measured at fair value on a recurring basis. Assets recognized or disclosed at fair value in the consolidated financial statements on a nonrecurring basis include items such as property and equipment, operating lease assets, goodwill and other intangible assets, which are measured at fair value if determined to be impaired. The Company has not elected to use fair value measurement for any assets or liabilities for which fair value measurement is not presently required.
The Company believes the fair values of cash equivalents, restricted cash, accounts receivable and accounts payable approximate their carrying amounts due to their short duration.
The fair values of non-current financial instruments, determined based on Level 2 inputs, are shown in the following table:
|
| | | | | | | | | | | | | | | |
| | December 31, 2018 | | December 31, 2017 |
| | Carrying Amount | | Fair Value | | Carrying Amount | | Fair Value |
| | (In millions) |
| Long-term debt, net of debt issuance costs | $ | 1,299.1 |
| | $ | 1,280.9 |
| | $ | 1,282.8 |
| | $ | 1,265.5 |
|
Dine Brands Global, Inc. and Subsidiaries
Notes to the Consolidated Financial Statements (Continued)
2. Basis of Presentation and Summary of Significant Accounting Policies (Continued)
|
| | | | | | | | | |
| | | December 31, 2019 | December 31, 2018 |
| | | (In millions) |
| Face value of Long-term debt | | $ | 1,300.0 |
| | $ | 1,283.8 |
| |
| Fair value of Long-term debt | | $ | 1,326.3 |
| | $ | 1,280.9 |
| |
Income Taxes
The Company utilizes the liability method of accounting for income taxes. Under the liability method, deferred taxes are determined based on the temporary differences between the financial statement and tax basesbasis of assets and liabilities using enacted tax rates. A valuation allowance is recorded when it is more likely than not that some or all of the deferred tax assets will not be realized. The Company also determines its tax contingencies in accordance with U.S. GAAP governing the accounting for contingencies. The Company records estimated tax liabilities to the extent the contingencies are probable and can be
Dine Brands Global, Inc. and Subsidiaries
Notes to the Consolidated Financial Statements (Continued)
2. Basis of Presentation and Summary of Significant Accounting Policies (Continued)
reasonably estimated. The Company recognizes interest accrued related to unrecognizable tax benefits and penalties as a component of the income tax provision recognized in the Consolidated Statements of Comprehensive Income (Loss).
The Company recognizes the tax benefit from an uncertain tax position only if it is more likely than not that the tax position will be sustained upon examination by taxing authorities based on its technical merits, including all appeals or litigation processes, based on its technical merits.processes. The tax benefits recognized in the financial statements from such a position are measured based on the largest benefit that has a greater than fifty percent likelihood of being realized upon ultimate resolution. For each reporting period, management applies a consistent methodology to measure and adjust all uncertain tax positions based on the available information.
Stock-Based Compensation
Members of the Board of Directors and certain employees are eligible to receive stock options, restricted stock, restricted stock units and performance units pursuant to the Dine Brands Global, Inc. 20162019 Stock Incentive Plan. Shares of unvested restricted stock are subject to restrictions on transfer and forfeiture under certain circumstances. The holder of unvested restricted stock has the right to vote and receive regular cash dividends with respect to the shares of unvested restricted stock.
The Company accounts for all stock-based payments to employees and non-employee directors, including grants of stock options, restricted stock, and restricted stock units and performance units to be recognized in the financial statements, based on their respective grant date fair values. The value of the portion of the award that is ultimately expected to vest is recognized as expense ratably over the requisite service periods. The Company reports the benefits of tax deductions in excess of recognized compensation cost as a financing cash flow.
The grant date fair value of restricted stock and stock-settled restricted stock units is determined based on the Company's stock price on the grant date. The Company estimates the grant date fair value of stock option awards using the Black-Scholes option pricing model, which considers, among other factors, a risk-free interest rate, the expected life of the award and the historical volatility of the Company's stock price. The Company estimates the grant date fair value of awards with performance-based market conditions using a Monte Carlo simulation method which considers, among other factors, the performance-based market condition, a risk-free interest rate, the expected life of the award and the historical volatility of the Company's stock price. Awards of cash-settled restricted stock units are classified as liabilities with the liability and compensation expense related to cash-settled awards adjusted to fair value at each balance sheet date.
Net Income (Loss) Per Share
Net income (loss) per share is calculated using the two-class method prescribed in U.S. GAAP. Basic net income (loss) per share is computed by dividing the net income available to common stockholders for the period by the weighted average number of common shares outstanding during the period. Diluted net income (loss) per share is computed by dividing the net income available to common stockholders for the period by the weighted average number of common shares and potential shares of common stock outstanding during the period if their effect is dilutive. The Company uses the treasury stock method to calculate the weighted average shares used in the diluted earnings per share calculation. Potentially dilutive common shares include the assumed exercise of stock options and assumed vesting of restricted stock.
Other Comprehensive Income (Loss)
For the years ended December 31, 20182019, 20172018 and 2016,2017, the income tax benefit or provision allocated to items of other comprehensive income (loss) was not significant.
Dine Brands Global, Inc. and Subsidiaries
Notes to the Consolidated Financial Statements (Continued)
2. Basis of Presentation and Summary of Significant Accounting Policies (Continued)
Treasury Stock
The Company may from time to time utilize treasury stock when vested stock options are exercised, when restricted stock awards are granted and when restricted stock units settle in stock upon vesting. The cost of treasury stock re-issued is determined using the first-in, first-out method.
Dividends
Dividends declared on common stock are recorded as a reduction of retained earnings to the extent retained earnings are available at the close of the period prior to the date of the declared dividend. Dividends declared in excess of retained earnings are recorded as a reduction of additional paid-in capital.
Dine Brands Global, Inc. and Subsidiaries
Notes to the Consolidated Financial Statements (Continued)
2. Basis of Presentation and Summary of Significant Accounting Policies (Continued)
Reporting Segments
The Company identifies its reporting segments based on the organizational units used by management to monitor performance and make operating decisions. The Company has five5 operating segments: Applebee's franchise operations, IHOP franchise operations, rental operations, financing operations and company-operated restaurant operations. The Company has four reportable4 reporting segments: franchise operations, (an aggregation of Applebee's and IHOP franchise operations), rental operations, financing operations and company-operated restaurant operations. The Company considers these to be its reportable segments, regardless of whether any segment exceeds 10% of consolidated revenues, income before income tax provision or total assets.
Franchise Segment
As of December 31, 20182019, the franchise operations reportable segment consisted of 1,7681,718 restaurants operated by Applebee's franchisees in the United States, two2 United States territories and 1312 countries outside the United States and 1,8311,841 restaurants operated by IHOP franchisees and area licensees in the United States, three3 United States territories and 1213 countries outside the United States. Franchise operations revenue consists primarily of royalties and advertising fees based on a percentage of the franchisee's gross sales, sales of proprietary products (primarily IHOP pancake and waffle dry-mixes)dry mixes) and other franchise fees.
Franchise operations expenses include advertising expense, the cost of proprietary products, pre-opening training expenses and other franchise-related costs.
Rental Segment
Rental operations revenue includes revenue from operating leases and interest income from direct financing leases. Rental operations expenses are costs of operating leases and interest expense of capitalfinance leases on franchisee-operated restaurants. The rental operations revenue and expenses are primarily generated by IHOP. Applebee's has an insignificant amount of rental activity related to one property that was retained after refranchising a company-operated restaurant.activity.
Financing Segment
Financing operations revenue primarily consists of interest income from the financing of IHOP franchise fees and equipment leases, as well asnotes receivable from Applebee's franchisees and sales of equipment associated with refranchised IHOP restaurants. Financing expenses are the cost of restaurant equipment.
Company Segment
As of December 31, 20182019, the Company operated 69 Applebee's restaurants that were acquired from a former franchisee in December 2018. See Note 18 - Acquisition of Business, of the Notes to the Consolidated Financial Statements for additional information. The company segment presented in these financial statements consists of approximately three weeks of operations of these 69 Applebee's restaurants in 2019 and three weeks of 2018 as well as 10 IHOP restaurants operated until Juneby the Company for the first six months of 2017. All company-operated restaurants were located in the United States. Company restaurant sales are retail sales at company-operated restaurants. Company restaurant expenses are operating expenses at company-operated restaurants and include food, beverage, labor, benefits, utilities, rent and other operating costs.
Accounting Standards Adopted Effective January 1, 20182019
On January 1, 2018,
In February 2016, the Company adoptedFinancial Accounting Standards Board (“FASB”) issued guidance with respect to the accounting for leases, as codified in Accounting Standards Topic 842 (“ASC 842”). The guidance is intended to improve financial reporting of ASC 606.leasing transactions by requiring entities that lease assets to recognize assets and liabilities for the rights and obligations created by leases, as well as by requiring additional disclosures related to an entity's leasing activities. The Company adopted this change in accounting principlesprinciple as of the first day of the first fiscal quarter of 2019 using the fullmodified retrospective method. Accordingly, previously reported financial information for periods prior to the date of initial application has not been adjusted to reflect the application of ASC 606 to all comparative periods presented.adjusted. The Company utilized allhas elected the package of practical expedients for adoption that permitted the Company not to reassess its prior conclusions regarding lease identification, lease classification and initial direct costs. The Company also elected a short-term lease exception policy and an accounting policy not to separate non-lease components from lease components. The Company did not elect to use an allowable expedient that permitted the use of hindsight in performing evaluations of its leases.
Dine Brands Global, Inc. and Subsidiaries
Notes to the Consolidated Financial Statements (Continued)
2. Basis of Presentation and Summary of Significant Accounting Policies (Continued)
Upon adoption allowed underof ASC 842, the full retrospective method.Company recognized operating lease obligations of $453.0 million, which represented the present value of the remaining minimum lease payments, discounted using the Company's incremental borrowing rate. The Company believes utilizationrecognized operating lease right-of-use assets of $395.6 million. The Company recognized an adjustment to retained earnings upon adoption of $5.0 million, net of tax of $1.7 million, primarily related to an impairment resulting from an unfavorable differential between lease payments to be made and sublease rentals to be received on certain leases. The remaining difference of $50.7 million between the practical expedients did not have a significant impact onrecognized operating lease obligation and the consolidated financial statementsright-of-use assets related to the derecognition of the periods presented herein.
Priorcertain assets and liabilities recorded in accordance with U.S. GAAP that had been applied prior to the adoption of ASC 606,842, primarily $43.3 million of accrued rent payments. Lease-related reserves for lease incentives, closed restaurants and unfavorable leaseholds were also derecognized.
The accounting for the Company generally recognized the entire franchise and/or development fee as revenue at the restaurant opening date. Prior to theCompany's existing finance leases upon adoption of ASC 606, the Company did not record advertising fees received under Applebee's franchise agreements as franchise revenue. In evaluating advertising activity under the guidance842 remained substantially unchanged. Adoption of ASC 606, the Company considers itself to be primarily responsible for fulfilling the promise to provide all the services specified in the contract, including advertising activities, which are not considered to be distinct services in the context of providing the right to the symbolic intellectual property. Accordingly, under ASC 606, the Company records advertising fees received under Applebee's franchise agreements as franchise revenue. The Company842 had previously recorded advertising fees received under IHOP franchise agreements as franchise revenue. Under previously issued accounting guidance for franchisors, advertising revenue and expense were recognized in the same amount in each period. That guidance was superceded by ASC 606 such that advertising expense may now be different than the advertising revenue recognized as described above. The adoption of ASC 606 had no significant impact on the Company's recordingcash flows from operations or its results of royaltiesoperations and sales of proprietary pancakedid not impact any covenant related to the Company's long-term debt. The Company implemented internal controls necessary to ensure compliance with the accounting and waffle dry mix.
Adoptiondisclosure requirements of ASC 606 impacted our previously reported Consolidated Balance Sheet as follows:
|
| | | | | | | | | | | |
| | Balance at December 31, 2017, as reported | | Adjustments/Reclassifications Due to ASC 606 adoption | | Balance at December 31, 2017, as adjusted |
| | (In thousands) |
| Assets: | | | | | |
| Receivables, net | $ | 150,174 |
| | $ | (9,986 | ) | | $ | 140,188 |
|
| Long-term receivables, net | 131,212 |
| | (4,642 | ) | | 126,570 |
|
| | | | | | |
| Liabilities: | | | | | |
| Deferred franchise revenue (short-term) | — |
| | 11,001 |
| | 11,001 |
|
| Other accrued expenses | 17,780 |
| | (1,779 | ) | | 16,001 |
|
| Deferred franchise revenue (long-term) | — |
| | 70,432 |
| | 70,432 |
|
| Other non-current liabilities | 23,003 |
| | (4,932 | ) | | 18,071 |
|
| Deferred income taxes, net | 138,177 |
| | (20,508 | ) | | 117,669 |
|
| | | | | | |
| Equity: | | | | | |
| Accumulated deficit | $ | (1,098 | ) | | $ | (68,842 | ) | | $ | (69,940 | ) |
In conjunction with its adoption of ASC 606, the Company has separated “franchise and restaurant revenues” and “franchise and restaurant expenses,” previously combined when reported in the Statement of Comprehensive Income (Loss)842. See Note 5 for the years ended December 31, 2017 and 2016, into separate line items for franchise revenues/expense and company restaurant sales/expense as follows:
|
| | | | | | | |
| | Year ended December 31, |
| | 2017 | | 2016 |
| | (in thousands) |
| Franchise and restaurant revenues, as combined | $ | 475,030 |
| | $ | 501,745 |
|
| | | | |
| Franchise revenues | $ | 467,512 |
| | $ | 484,378 |
|
| Company restaurant sales | 7,518 |
| | 17,367 |
|
| | $ | 475,030 |
| | $ | 501,745 |
|
| | | | |
| Franchise and restaurant expenses, as combined | $ | 171,983 |
| | $ | 162,860 |
|
| | | | |
| Franchise expenses | 164,145 |
| | 144,636 |
|
| Company restaurant expenses | 7,838 |
| | $ | 18,224 |
|
| | $ | 171,983 |
| | $ | 162,860 |
|
Dine Brands Global, Inc. and Subsidiaries
Notesrequired disclosures related to the Consolidated Financial Statements (Continued)Company's leasing activities.
2. Basis of Presentation and Summary of Significant Accounting Policies (Continued)
Adoption of ASC 606 impacted our previously reported Consolidated Statement of Comprehensive Income (Loss) for the year ended December 31, 2017, as follows: |
| | | | | | | | | | | |
| | Year ended December 31, 2017, as reported | | Adjustments due to ASC 606 adoption | | Year ended December 31, 2017, as adjusted |
| | (In thousands) |
| Franchise revenues (as shown separately above) | $ | 467,512 |
| | $ | 126,906 |
| | $ | 594,418 |
|
| Franchise expenses (as shown separately above) | 164,145 |
| | 129,841 |
| | 293,986 |
|
| Loss before income tax benefit | (425,374 | ) | | (2,935 | ) | | (428,309 | ) |
| Income tax benefit | 94,835 |
| | (9,276 | ) | | 85,559 |
|
| Net loss | (330,539 | ) | | (12,211 | ) | | (342,750 | ) |
| Net loss per share: | | | | | |
| Basic | $ | (18.28 | ) | | | | $ | (18.96 | ) |
| Diluted | $ | (18.28 | ) | | | | $ | (18.96 | ) |
Recognition of Applebee's advertising revenue and expense comprised $120.9 million of the revenue adjustment and all the expense adjustment. Approximately $6.0 million of the revenue adjustment is due to the change in method of recognizing franchise and development fees.
Adoption of ASC 606 impacted our previously reported Consolidated Statement of Comprehensive Income (Loss) for the year ended December 31, 2016, as follows: |
| | | | | | | | | | | |
| | Year ended December 31, 2016, as reported | | Adjustments due to ASC 606 adoption | | Year ended December 31, 2016, as adjusted |
| | (In thousands) |
| Franchise revenues (as shown separately above) | $ | 484,378 |
| | $ | 153,593 |
| | $ | 637,971 |
|
| Franchise expenses (as shown separately above) | 144,636 |
| | 148,864 |
| | 293,500 |
|
| Income before income tax provision | 153,122 |
| | 4,729 |
| | 157,851 |
|
| Income tax provision | (55,130 | ) | | (1,719 | ) | | (56,849 | ) |
| Net income | 97,992 |
| | 3,010 |
| | 101,002 |
|
| Net income per share: | | | | | |
| Basic | $ | 5.36 |
| | | | $ | 5.52 |
|
| Diluted | $ | 5.33 |
| | | | $ | 5.49 |
|
Recognition of Applebee's advertising revenue and expense comprised $148.9 million of the revenue adjustment and all the expense adjustment. Approximately $4.7 million of the revenue adjustment is due to the change in method of recognizing franchise and development fees.
Additional new accounting guidance became effective for the Company as of January 1, 2018the beginning of fiscal 2019 that the Company reviewed and concluded was either not applicable to the Company'sits operations or had no material effect on the Company'sits consolidated financial statements.statements in the current or future fiscal years.
Newly Issued Accounting Standards Not Yet Adopted
In June 2016, the Financial Accounting Standards Board (“FASB”)FASB issued new guidance on the measurement of credit losses on financial instruments. The new guidance will replace the incurred loss methodology of recognizing credit losses on financial instruments that is currently required with a methodology that estimates the expected credit loss on financial instruments and reflects the net amount expected to be collected on the financial instrument. Application of the new guidance may result in the earlier recognition of credit losses as the new methodology will require entities to consider forward-looking information in addition to historical and current information used in assessing incurred losses. The Company will be required to adopt the new guidance on a modified retrospective basis beginning with its first fiscal quarter of 2020, with early adoption permitted in its first fiscal quarter of 2019. The Company is currently evaluating the impact of the new guidance on its consolidated financial statements and related disclosures and whether early adoption will be elected.
Dine Brands Global, Inc. and Subsidiaries
Notes to the Consolidated Financial Statements (Continued)
2. Basis of Presentation and Summary of Significant Accounting Policies (Continued)
2020. In February 2016, the FASB issued new guidance with respect to the accountingpreparation for leases. The new guidance will require lessees to recognize a right-of-use asset and a lease liability for virtually all leases, other than leases with a term of 12 months or less, and to provide additional disclosures about leasing arrangements. Accounting by lessors is largely unchanged from existing accounting guidance. The Company will be required to adopt the new guidance beginning with its first fiscal quarter of 2019. In July 2018, the FASB modified the new guidance to provide for transition adoption using either 1) a modified retrospective approach with periods prior to the adoption date being recast or 2) a prospective adoption approach with a cumulative-effect adjustment recognized to the opening balance of retained earnings on the adoption date with prior periods not recast. Prior to modification, the first transition adoption method was the only method available. The Company will use the prospective approach to its adoption of the new lease guidance. The Company has elected to use the package of practical expedients available for implementation of the new guidance that will allow it to not reassess as of the adoption date expired or existing contracts with respect to attributes such as lease classification, lease term and initial direct costs.
Upon implementation of the guidance, lease-related liabilities will be recognized at the present value of the remaining contractual fixed lease payments, discounted using the Company’s incremental borrowing rate. Lease-related assets, or right-of-use assets, will be recognized at an amount equal to the respective lease liabilities, adjusted for accrued lease payments, lease incentives and impairment due shortfall of projected amounts to be received compared to projected amounts to be paid in lease/sublease agreements. Operating lease expense will continue to be recognized on a straight-line basis over the lease term, while variable lease payments will continue to be expensed as incurred.
The Company expects adoption of the standard will have the impact of increasing its consolidated assets and liabilities by approximately $400 million. The Company expects adoption of the standard will not have a material impact on its Consolidated Statements of Comprehensive Income (Loss) or Consolidated Statements of Cash Flows. Recognition of the lease liability related to operating leases will not impact any covenants related to the Company's long-term debt because the debt agreements specify that covenant ratios be calculated using U.S. GAAP in effect at the time the debt agreements were entered.
In conjunction with the adoption, the Company implemented internal controlshas established the methodology it will use to properly record and account for its lease portfolio in accordance with the new guidance.
In August 2018, the Securities and Exchange Commission (“SEC”) adopted the final rule under SEC Release No. 33-10532, Disclosure Update and Simplification, amending certain disclosure requirementsestimate expected credit losses. Based on that were redundant, duplicative, overlapping, outdated or superseded. The amendments also expanded the disclosure requirements related to the analysis of stockholders' equity for interim financial statements. Under the amendments, an analysis of changes in each caption of stockholders' equity presented in the balance sheet must be provided in a note or separate statement. The analysis should present a reconciliation of the beginning balance to the ending balance of each period for which a statement of comprehensive income is required to be filed. This final rule is effective on November 5, 2018. Pursuant to guidance issued by the SEC,methodology, the Company estimates that upon adoption, it will provide the required disclosures inrecord an increase to its interim financial statements beginningallowance for credit losses of less than $1 million, with the first fiscal quarteran offsetting decrease to retained earnings, net of 2019.tax impact.
In August 2018, the FASB issued guidance designed to improve the effectiveness of disclosures by removing, modifying and adding disclosures related to fair value measurements. The Company will be required to adopt the new guidance beginning with its first fiscal quarter of 2020; early adoption in any interim period after issuance of the new guidance is permitted. The Company is currently assessing the impact this guidance will have on its consolidated financial statements; the Company does not expect to adopt the new guidance early.statements.
In August 2018, the FASB issued new guidance on the accounting for implementation costs incurred in a cloud computing arrangement that is a service contract. The guidance aligns the requirements for capitalizing implementation costs incurred in a hosting arrangement that is a service contract with existing guidance for capitalizing implementation cost incurred to develop or obtain internal-use software. The guidance also provides presentation and disclosure requirements for such capitalized costs. The Company will be required to adopt the new guidance beginning with its first fiscal quarter of 2020;2020. The Company is currently assessing the impact this guidance will have on its consolidated financial statements.
In December 2019, the FASB issued new guidance intended to simplify the accounting for income taxes, change the accounting for certain income tax transactions, and make other minor changes. The Company will be required to adopt the new guidance beginning with its first fiscal quarter of 2021; early adoption in any interim period after issuance of the new guidance is permitted. The Company is currently assessing the impact this guidance will have on its consolidated financial statements; thestatements, but does not expect this standard to have a material effect on its financial statements. The Company does not expectintend to adopt the new guidancestandard early.
The Company reviewed all other newly issued accounting pronouncements and concluded that they either are not applicable to the Company's operations or that no material effect is expected on the Company's financial statements as a result of future adoption.
Dine Brands Global, Inc. and Subsidiaries
Notes to the Consolidated Financial Statements (Continued)
2. Basis of Presentation and Summary of Significant Accounting Policies (Continued)
3. Revenue Disclosures
The following table disaggregates our franchise revenue by major type for the years ended December 31, 2019, 2018 2017 and 2016:2017:
|
| | | | | | | | | | | | |
| | | Year ended December 31, |
| | | 2019 | | 2018 | | 2017 |
| | | (In thousands) |
| Franchise Revenue: | | |
| | |
| | |
| Royalties | | $ | 302,169 |
| | $ | 311,568 |
| | $ | 297,817 |
|
| Advertising fees | | 283,015 |
| | 268,294 |
| | 234,165 |
|
| Pancake and waffle dry mix sales and other | | 53,973 |
| | 52,108 |
| | 50,538 |
|
| Franchise and development fees | | 12,029 |
| | 11,964 |
| | 11,898 |
|
| Total franchise revenue | | $ | 651,186 |
| | $ | 643,934 |
| | $ | 594,418 |
|
|
| | | | | | | | | | | | |
| | | Year ended December 31, |
| | | 2018 | | 2017 | | 2016 |
| | | (In thousands) |
| Franchise Revenue: | | |
| | |
| | |
| Royalties | | $ | 311,568 |
| | $ | 297,817 |
| | $ | 315,848 |
|
| Advertising fees | | 268,294 |
| | 234,165 |
| | 260,116 |
|
| Pancake and waffle dry mix sales and other | | 52,108 |
| | 50,538 |
| | 52,117 |
|
| Franchise and development fees | | 11,964 |
| | 11,898 |
| | 9,890 |
|
| Total franchise revenue | | $ | 643,934 |
| | $ | 594,418 |
| | $ | 637,971 |
|
Accounts receivableand other receivables from franchisees as of December 31, 2019 and 2018 were $63.5 million (net of allowance of $0.7 million) and 2017 were $62.6 million (net of allowance of $4.6 million) and $66.2 million (net of allowance of $22.2 million), respectively, and were included in receivables, net in the Consolidated Balance Sheets.
Changes in the Company's contract liability for deferred franchise and development feesrevenue during the year ended December 31, 2018 are2019 were as follows:
|
| | | | |
| | | Deferred Franchise Revenue (short- and long-term) |
| | | (In thousands) |
| Balance at December 31, 2018 | | $ | 74,695 |
|
| Recognized as revenue during the year ended December 31, 2019 | | (11,350 | ) |
| Fees deferred during the year ended December 31, 2019 | | 3,685 |
|
| Balance at December 31, 2019 | | $ | 67,030 |
|
|
| | | | |
| | | Deferred Franchise Revenue (short- and long-term) |
| | | (In thousands) |
| Balance at December 31, 2017 | | $ | 81,433 |
|
| Recognized as revenue during the year ended December 31, 2018 | | (11,220 | ) |
| Fees deferred during the year ended December 30, 2018 | | 4,482 |
|
| Balance at December 31, 2018 | | $ | 74,695 |
|
The balance of deferred franchise revenue as of December 31, 20182019 is expected to be recognized as follows:
|
| | | |
| (In thousands) |
| 2020 | $ | 10,086 |
|
| 2021 | 7,862 |
|
| 2022 | 7,337 |
|
| 2023 | 6,765 |
|
| 2024 | 6,074 |
|
| Thereafter | 28,906 |
|
| Total | $ | 67,030 |
|
|
| | | |
| (In thousands) |
| 2019 | $ | 10,138 |
|
| 2020 | 8,227 |
|
| 2021 | 7,682 |
|
| 2022 | 7,156 |
|
| 2023 | 6,585 |
|
| Thereafter | 34,907 |
|
| Total | $ | 74,695 |
|
Dine Brands Global, Inc. and Subsidiaries
Notes to the Consolidated Financial Statements (Continued)
|
| | | | | | | |
| 4. Receivables | 2019 | | 2018 |
| | (In millions) |
| Accounts receivable | $ | 60.8 |
| | $ | 63.0 |
|
| Gift card receivables | 46.7 |
| | 47.9 |
|
| Notes receivable | 28.9 |
| | 28.9 |
|
| Financing receivables: | | | |
| Equipment leases receivable | 56.3 |
| | 65.8 |
|
| Direct financing leases receivable | 34.0 |
| | 44.9 |
|
| Franchise fee notes receivable | 0.2 |
| | 0.2 |
|
| Other | 7.3 |
| | 7.1 |
|
| | 234.2 |
| | 257.8 |
|
| Less: allowance for doubtful accounts and notes receivable | (11.3 | ) | | (17.2 | ) |
| | 222.9 |
| | 240.6 |
|
| Less: current portion | (136.9 | ) | | (137.5 | ) |
| Long-term receivables | $ | 86.0 |
| | $ | 103.1 |
|
|
| | | | | | | |
| 4. Receivables | 2018 | | 2017 |
| | (In millions) |
| Accounts receivable | $ | 63.0 |
| | $ | 84.2 |
|
| Gift card receivables | 47.9 |
| | 51.6 |
|
| Notes receivable | 28.9 |
| | 11.3 |
|
| Financing receivables: | | | |
| Equipment leases receivable | 65.8 |
| | 79.3 |
|
| Direct financing leases receivable | 44.9 |
| | 55.7 |
|
| Franchise fee notes receivable | 0.2 |
| | 0.3 |
|
| Other | 7.1 |
| | 6.5 |
|
| | 257.8 |
| | 288.9 |
|
| Less: allowance for doubtful accounts and notes receivable | (17.2 | ) | | (22.2 | ) |
| | 240.6 |
| | 266.8 |
|
| Less: current portion | (137.5 | ) | | (140.2 | ) |
| Long-term receivables | $ | 103.1 |
| | $ | 126.6 |
|
Accounts receivable primarily includes receivables due from franchisees and distributors. Gift card receivables consist primarily of amounts due from third-party vendors. Interest is not charged on gift card receivables.
Notes receivable primarily relate to the conversion of certain franchisee accounts receivable to notes receivable, cash loans made to franchisees and a note receivable in connection with the sale of IHOP restaurants (See Note 20 - Refranchising of Company-operated Restaurants.Restaurants, of the Notes to Consolidated Financial Statements). The notes have a term from two to ten years, bear interest averaging 4.8%5.1% and 4.6%4.8% per annum at December 31, 20182019 and 2017,2018, respectively, and are collateralized by the franchise.
Financing receivables primarily relate to IHOP franchise development activity prior to 2003 when IHOP typically leased or purchased the restaurant site, built and equipped the restaurant then franchised the restaurant to a franchisee. IHOP provided the financing for the franchise fee, leasing of the equipment and the leasing or subleasing of the site. Equipment lease contracts are due in equal weekly installments, primarily bear interest averaging 9.9% and 9.7%9.9% per annum at December 31, 20182019 and 2017,2018, respectively, and are collateralized by the equipment. The term of an equipment lease contract coincides with the term of the corresponding restaurant building lease. The IHOP franchise fee notes have a term of five to eight years and are due in equal weekly installments, primarily bear interest averaging 5.6%5.0% and 5.9%5.6% per annum at December 31, 20182019 and 2017,2018, respectively, and are collateralized by the franchise. Where applicable, franchise fee notes, equipment contracts and building leases contain cross-default provisions wherein a default under one constitutes a default under all. There is not a disproportionate concentration of credit risk in any geographic area.
The primary indicator of the credit quality of financing receivables is delinquency. As of December 31, 20182019 and 2017,2018, approximately less than $0.1 million and$0.1 million, respectively, of financing receivables were delinquent more than 90 days.
The following table summarizes the activity in the allowance for doubtful accounts and notes receivable:
|
| | | |
| Allowance for Doubtful Accounts | (In millions) |
| Balance at December 31, 2016 | $ | 3.1 |
|
| Provision | 20.3 |
|
| Charge-offs | (1.2 | ) |
| Balance at December 31, 2017 | 22.2 |
|
| Provision | 10.3 |
|
| Charge-offs | (15.3 | ) |
| Balance at December 31, 2018 | 17.2 |
|
| Provision | (0.4 | ) |
| Charge-offs | (5.0 | ) |
| Recoveries | (0.5 | ) |
| Balance at December 31, 2019 | $ | 11.3 |
|
|
| | | |
| Allowance for Doubtful Accounts | (In millions) |
| Balance at December 31, 2015 | $ | 1.2 |
|
| Provision | 2.8 |
|
| Charge-offs | (0.9 | ) |
| Balance at December 31, 2016 | 3.1 |
|
| Provision | 20.3 |
|
| Charge-offs | (1.2 | ) |
| Balance at December 31, 2017 | 22.2 |
|
| Provision | 10.3 |
|
| Charge-offs | (15.3 | ) |
| Balance at December 31, 2018 | $ | 17.2 |
|
As of December 31, 20182019 and 2017,2018, approximately less than $0.1 million and $0.1 million, respectively, of the allowance for doubtful accounts related to financing receivables.
Dine Brands Global, Inc. and Subsidiaries
Notes to the Consolidated Financial Statements (Continued)
5. Property and Equipment
Property and equipment by category is as follows:
|
| | | | | | | |
| | 2019 | | 2018 |
| | (In millions) |
| Leaseholds and improvements | $ | 235.4 |
| | $ | 255.7 |
|
| Equipment and fixtures | 95.4 |
| | 90.1 |
|
| Properties under finance lease | 100.5 |
| | 100.3 |
|
| Buildings and improvements | 56.6 |
| | 57.9 |
|
| Land | 55.9 |
| | 56.4 |
|
| Construction in progress | 4.7 |
| | 3.7 |
|
| Property and equipment, gross | 548.5 |
| | 564.1 |
|
| Less: accumulated depreciation and amortization | (332.1 | ) | | (323.8 | ) |
| Property and equipment, net | $ | 216.4 |
| | $ | 240.3 |
|
|
| | | | | | | |
| | 2018 | | 2017 |
| | (In millions) |
| Leaseholds and improvements | $ | 255.7 |
| | $ | 252.2 |
|
| Equipment and fixtures | 90.1 |
| | 90.1 |
|
| Properties under capital lease | 100.3 |
| | 61.4 |
|
| Buildings and improvements | 57.9 |
| | 57.9 |
|
| Land | 56.4 |
| | 56.4 |
|
| Construction in progress | 3.7 |
| | 1.8 |
|
| Property and equipment, gross | 564.1 |
| | 519.8 |
|
| Less: accumulated depreciation and amortization | (323.8 | ) | | (320.2 | ) |
| Property and equipment, net | $ | 240.3 |
| | $ | 199.6 |
|
The Company recorded depreciation expense on property and equipment of $22.1$30.8 million, $22.1 million and $20.6 million and $20.6 million for the years ended December 31, 20182019, 2018 and 2017, and 2016, respectively.
Accumulated depreciation and amortization includes accumulated amortization for properties under capitalfinance lease in the amount of $46.2$51.1 million and $43.2$46.2 million at December 31, 20182019 and 2017,2018, respectively.
Dine Brands Global, Inc. and Subsidiaries
Notes to the Consolidated Financial Statements (Continued)
6. Goodwill
The significant majority of the Company's goodwill arose from the November 29, 2007 acquisition of Applebee's. Changes in the carrying amount of goodwill for the years ended December 31, 2019, 2018 2017 and 20162017 are as follows:
| | | | Applebee's Franchise Unit | | Applebee's Company Unit | | IHOP Franchise Unit | | Total | Applebee's Franchise Unit | | Applebee's Company Unit | | IHOP Franchise Unit | | Total |
| | (In millions) | (In millions) |
| Balance at December 31, 2015 | $ | 686.6 |
| | $ | — |
| | $ | 10.8 |
| | $ | 697.4 |
| |
| Balance at December 31, 2016 | 686.6 |
| | — |
| | 10.8 |
| | 697.4 |
| $ | 686.6 |
| | $ | — |
| | $ | 10.8 |
| | $ | 697.4 |
|
| Impairment | (358.2 | ) | | — |
| | — |
| | (358.2 | ) | (358.2 | ) | | — |
| | — |
| | (358.2 | ) |
| Balance at December 31, 2017 | 328.4 |
| | — |
| | 10.8 |
| | 339.2 |
| 328.4 |
| | — |
| | 10.8 |
| | 339.2 |
|
| Acquisition of business | — |
| | 6.1 |
| | — |
| | 6.1 |
| |
| Business acquisition | | — |
| | 6.1 |
| | — |
| | 6.1 |
|
| Balance at December 31, 2018 | $ | 328.4 |
| | $ | 6.1 |
| | $ | 10.8 |
| | $ | 345.3 |
| 328.4 |
| | 6.1 |
| | 10.8 |
| | 345.3 |
|
| Purchase price adjustment related to business acquisition | | — |
| | (1.5 | ) | | — |
| | (1.5 | ) |
| Balance at December 31, 2019 | | $ | 328.4 |
| | $ | 4.6 |
| | $ | 10.8 |
| | $ | 343.9 |
|
Gross and net carrying amounts of goodwill at December 31, 20182019 and 20172018 are as follows:
|
| | | | | | | | | | | | | | | | | | | | | | | |
| | December 31, 2019 | | December 31, 2018 |
| | Gross | | Accumulated Amortization | | Net | | Gross | | Accumulated Amortization | | Net |
| | (In millions) |
| Applebee's Franchise Unit | $ | 686.6 |
| | $ | (358.2 | ) | | $ | 328.4 |
| | $ | 686.6 |
| | $ | (358.2 | ) | | $ | 328.4 |
|
| Applebee's Company Unit | 4.6 |
| | — |
| | 4.6 |
| | 6.1 |
| | — |
| | 6.1 |
|
| IHOP Franchise Unit | 10.8 |
| | — |
| | 10.8 |
| | 10.8 |
| | — |
| | 10.8 |
|
| Total | $ | 702.1 |
| | $ | (358.2 | ) | | $ | 343.9 |
| | $ | 703.5 |
| | $ | (358.2 | ) | | $ | 345.3 |
|
In December 2018, the Company acquired 69 Applebee's restaurants. The Company provisionally allocated $6.1 million of resulting goodwill to the Applebee's Company Unit as of December 31, 2018. Upon completion of the purchase price allocation during 2019, the Company revised the goodwill allocated to the Applebee's Company Unit downwards to $4.6 million, the balance at December 31, 2019. See Note 18 - Acquisition of Business, of the Notes to the Consolidated Financial Statements.
Dine Brands Global, Inc. and Subsidiaries
Notes to the Consolidated Financial Statements (Continued)
6. Goodwill (Continued)
|
| | | | | | | | | | | | | | | | | | | | | | | |
| | December 31, 2018 | | December 31, 2017 |
| | Gross | | Accumulated Amortization | | Net | | Gross | | Accumulated Amortization | | Net |
| | (In millions) |
| Applebee's Franchise Unit | $ | 686.6 |
| | $ | (358.2 | ) | | $ | 328.4 |
| | $ | 686.6 |
| | $ | (358.2 | ) | | $ | 328.4 |
|
| Applebee's Company Unit | 6.1 |
| | — |
| | 6.1 |
| | — |
| | — |
| | — |
|
| IHOP Franchise Unit | 10.8 |
| | — |
| | 10.8 |
| | 10.8 |
| | — |
| | 10.8 |
|
| Total | $ | 703.5 |
| | $ | (358.2 | ) | | $ | 345.3 |
| | $ | 697.4 |
| | $ | (358.2 | ) | | $ | 339.2 |
|
The Company assesses goodwill for impairment in accordance with its policy described in Note 2 - Basis of Presentation and Summary of Significant Accounting Policies.
In the fourth quarterquarters of fiscal 2019 and 2018, the Company performed a qualitative assessmentassessments of the goodwill of the Applebee's franchise unit and the IHOP franchise unit and concluded it was more-likely-than-not that the fair values exceeded the respective carrying amounts. In performing that analysis the Company considered, among other things, Applebee's key performance indicators during 2019 and 2018 and what, if any, impact that performance had on the long-term forecast of future trends in sales, operating expenses, overhead expenses, depreciation, capital expenditures and changes in working capital that had been used in performing a quantitative impairment test in the third quarter of 2017. The Company also considered the current market price of its common stock, the favorable impact of the Tax Cuts and Jobs Act (the “Tax Act”) on future cash flows and the impact these changes would have on an appropriate discount rate. As result of the qualitative test, the Company concluded it was not more likely than not that the fair value of the Applebee's franchise reporting unit is less than its carrying amount and therefore, a quantitative test of impairment was not necessary.
In December 2018, the Company acquired 69 Applebee's restaurants. The Company has provisionally completed the purchase price allocation as described in Note 18 - Acquisition of Business, of the Notes to the Consolidated Financial Statements, and has allocated $6.1 million of resulting goodwill to the Applebee's Company Unit.
In the third quarter of 2017, the Company noted that the decline in the market price of the Company's common stock since December 31, 2016, which the Company had believed to be temporary, persisted throughout the first eight months of 2017 and that the favorable trend in Applebee's domestic same-restaurant sales experienced in the second quarter of 2017 did not continue into the first two months of the third quarter of 2017. The Company also noted a continuing increase in Applebee's bad debt expense and in royalties not recognized in income until paid in cash. Additionally, the Company also determined an increasing shortfall in franchisee contributions to the Applebee's national advertising fund could require a larger amount of future subsidization in the form of additional franchisor contributions to the fund than previously estimated. Based on these unfavorable developments, the Company determined that indicators of impairment existed and that an interim quantitative test of goodwill for impairment should be performed in the third quarter of 2017.
In performing the quantitative test of goodwill, the Company primarily used the income approach method of valuation that included the discounted cash flow method and the market approach that included the guideline public company method to determine the fair value of goodwill and intangible assets. Significant assumptions used to determine fair value under the
Dine Brands Global, Inc. and Subsidiaries
Notes to the Consolidated Financial Statements (Continued)
6. Goodwill (Continued)
discounted cash flow model included expected future trends in sales, operating expenses, overhead expenses, capital expenditures and changes in working capital, along with an appropriate discount rate based on the Company's estimated cost of equity capital and after-tax cost of debt.
As a result of performing the quantitative test of impairment, the Company recognized an impairment of Applebee's goodwill of $358.2 million.million in 2017. The Company adopted the guidance in FASB Accounting Standards Update 2017-04 on January 1, 2017; accordingly, the amount of the goodwill impairment was determined as the amount by which the carrying amount of the goodwill exceeded the fair value of the Applebee's franchise reporting unit as estimated in the impairment test. The impairment of goodwill is not deductible for federal income tax purposes and therefore had no associated tax benefit.
In the fourth quarter of fiscal 2017, the Company performed a qualitative assessment of the goodwill of the Applebee's franchise unit and the IHOP franchise unit and concluded it was more-likely-than-not that the fair values exceeded the respective carrying amounts.
In the fourth quarter of fiscal 2016, the Company performed a quantitative test of the goodwill of the Applebee's franchise reporting unit and a qualitative test of the goodwill of the IHOP franchise unit and concluded it was more-likely-than-not that the fair values exceeded the respective carrying amounts.
Dine Brands Global, Inc. and Subsidiaries
Notes to the Consolidated Financial Statements (Continued)
7. Other Intangible Assets
The significant majority of the Company's other intangible assets arose from the November 29, 2007 acquisition of Applebee's. Changes in the carrying amount of intangible assets for the years ended December 31, 2019, 2018 2017 and 20162017 are as follows:
|
| | | | | | | | | | | | | | | | | | | | | | | |
| | Not Subject to Amortization | | Subject to Amortization | | |
| | Tradename | | Other | | Franchising Rights | | Reacquired Franchise Rights | | Leaseholds | | Total |
| | (In millions) |
| Balance at December 31, 2016 | $ | 652.4 |
| | $ | 2.0 |
| | $ | 109.0 |
| | $ | — |
| | $ | — |
| | $ | 763.4 |
|
| Impairment | (173.4 | ) | | — |
| | — |
| | — |
| | — |
| | (173.4 | ) |
| Amortization expense | — |
| | — |
| | (10.0 | ) | | — |
| | — |
| | (10.0 | ) |
| Additions | — |
| | 0.4 |
| | — |
| | — |
| | 2.4 |
| | 2.8 |
|
| Balance at December 31, 2017 | 479.0 |
| | 2.4 |
| | 99.0 |
| | — |
| | 2.4 |
| | 582.8 |
|
| Amortization expense | — |
| | — |
| | (10.0 | ) | | (0.1 | ) | | (0.0 | ) | | (10.1 | ) |
| Additions | — |
| | 0.3 |
| | — |
| | 11.6 |
| | 1.3 |
| | 13.2 |
|
| Balance at December 31, 2018 | 479.0 |
| | 2.7 |
| | 89.0 |
| | 11.5 |
| | 3.7 |
| | 585.9 |
|
| Amortization expense | — |
| | — |
| | (10.0 | ) | | (1.7 | ) | | (0.1 | ) | | (11.8 | ) |
| Additions | — |
| | 0.5 |
| | — |
| | — |
| | 0.5 |
| | 1.0 |
|
| Balance at December 31, 2019 | $ | 479.0 |
| | $ | 3.2 |
| | $ | 79.0 |
| | $ | 9.8 |
| | $ | 4.1 |
| | $ | 575.1 |
|
|
| | | | | | | | | | | | | | | | | | | | | | | |
| | Not Subject to Amortization | | Subject to Amortization | | |
| | Tradename | | Other | | Franchising Rights | | Reacquired Franchise Rights | | Leaseholds | | Total |
| | (In millions) |
| Balance at December 31, 2015 | $ | 652.4 |
| | $ | 1.5 |
| | $ | 119.0 |
| | $ | — |
| | $ | — |
| | $ | 772.9 |
|
| Amortization expense | — |
| | — |
| | (10.0 | ) | | — |
| | — |
| | (10.0 | ) |
| Additions | — |
| | 0.5 |
| | — |
| | — |
| | — |
| | 0.5 |
|
| Balance at December 31, 2016 | 652.4 |
| | 2.0 |
| | 109.0 |
| | — |
| | — |
| | 763.4 |
|
| Impairment | (173.4 | ) | | — |
| | — |
| | | | — |
| | (173.4 | ) |
| Amortization expense | — |
| | — |
| | (10.0 | ) | | — |
| | — |
| | (10.0 | ) |
| Additions | — |
| | 0.4 |
| | — |
| | — |
| | 2.4 |
| | 2.8 |
|
| Balance at December 31, 2017 | 479.0 |
| | 2.4 |
| | 99.0 |
| | — |
| | 2.4 |
| | 582.8 |
|
| Amortization expense | — |
| | — |
| | (10.0 | ) | | (0.1 | ) | | (0.0 | ) | | (10.1 | ) |
| Additions | — |
| | 0.3 |
| | — |
| | 11.6 |
| | 1.3 |
| | 13.2 |
|
| Balance at December 31, 2018 | $ | 479.0 |
| | $ | 2.7 |
| | $ | 89.0 |
| | $ | 11.5 |
| | $ | 3.7 |
| | $ | 585.9 |
|
In December 2018, the Company acquired 69 Applebee's restaurants. The Company has provisionally completed the purchase price allocation as described in Note 18 - Acquisition of Business, of Notes to the Consolidated Financial Statements and has recorded $11.6 million of reacquired franchise rights as an intangible asset. In June 2017, the Company refranchised nine9 IHOP restaurants. As discussed in Note 20 - Refranchising of Company-operated Restaurants, of Notes to the Consolidated Financial Statements, the Company recorded a net intangible asset $2.4 million for below-market leases.
Annual amortization expense for the next five fiscal years is estimated to be approximately $11.1$11.0 million per year. The weighted average life of the intangible assets subject to amortization was 18.5 years and 20 years at December 31, 20182019 and 2017,2018, respectively.
Gross and net carrying amounts of intangible assets subject to amortization at December 31, 20182019 and 20172018 are as follows:
|
| | | | | | | | | | | | | | | | | | | | | | | |
| | December 31, 2019 | | December 31, 2018 |
| | Gross | | Accumulated Amortization | | Net | | Gross | | Accumulated Amortization | | Net |
| | (In millions) |
| Franchising rights | $ | 200.0 |
| | $ | (121.0 | ) | | $ | 79.0 |
| | $ | 200.0 |
| | $ | (111.0 | ) | | $ | 89.0 |
|
| Reacquired Franchise Rights | 11.6 |
| | (1.8 | ) | | 9.8 |
| | 11.6 |
| | (0.1 | ) | | 11.5 |
|
| Leaseholds | 4.2 |
| | (0.1 | ) | | 4.1 |
| | $ | 3.7 |
| | (0.0 | ) | | 3.7 |
|
| Total | $ | 215.8 |
| | $ | (122.9 | ) | | $ | 92.9 |
| | $ | 215.3 |
| | $ | (111.1 | ) | | $ | 104.2 |
|
|
| | | | | | | | | | | | | | | | | | | | | | | |
| | December 31, 2018 | | December 31, 2017 |
| | Gross | | Accumulated Amortization | | Net | | Gross | | Accumulated Amortization | | Net |
| | (In millions) |
| Franchising rights | $ | 200.0 |
| | $ | (111.0 | ) | | $ | 89.0 |
| | $ | 200.0 |
| | $ | (101.0 | ) | | $ | 99.0 |
|
| Reacquired Franchise Rights | 11.6 |
| | (0.1 | ) | | 11.5 |
| | — |
| | — |
| | — |
|
| Leaseholds | 3.7 |
| | (0.0 | ) | | 3.7 |
| | 2.4 |
| | (0.0 | ) | | 2.4 |
|
| Total | $ | 215.3 |
| | $ | (111.1 | ) | | $ | 104.2 |
| | $ | 202.4 |
| | $ | (101.0 | ) | | $ | 101.4 |
|
The Company assessed the Applebee's tradename for impairment in accordance with its policy described in Note 2 - Basis of Presentation and Summary of Significant Accounting Policies. In the fourth quarter of fiscal 2019 and 2018, the Company performed a quantitativequalitative assessment of the Applebee's tradename and concluded the fair value exceeded the carrying amount.
As discussed in Note 6 - Goodwill, the Company determined that indicators of impairment existed prior to the annual test for impairment and performed an interim quantitative test for impairment of Applebee's tradename in the third quarter of 2017. In performing the impairment test of the tradename, the Company used the relief of royalty method under the income approach method of valuation. Significant assumptions used to determine fair value under the relief of royalty method include future trends in sales, a royalty rate and a discount rate applied to the forecast revenue stream. As a result of performing this quantitative test, the Company recognized an impairment of Applebee's tradename of $173.4 million.million in 2017. The Company recognized a tax benefit of $65.1 million related to the impairment.
In the fourth quarter of fiscal 2016, the Company performed a quantitative assessment of the Applebee's tradename and concluded the fair value exceeded the carrying amount.
Dine Brands Global, Inc. and Subsidiaries
Notes to the Consolidated Financial Statements (Continued)
8. Long-Term Debt
Long-term debt consists of the following components:
|
| | | | | | | |
| | 2019 | | 2018 |
| | (In millions) |
| Series 2019-1 4.194% Fixed Rate Senior Secured Notes, Class A-2-I | $ | 700.0 |
| | $ | — |
|
| Series 2019-1 4.723% Fixed Rate Senior Secured Notes, Class A-2-II | 600.0 |
| | — |
|
| Series 2014-1 4.277% Fixed Rate Senior Secured Notes, Class A-2 | — |
| | 1,283.8 |
|
| Series 2018-1 Variable Funding Senior Notes Class A-1, variable interest rate of 4.93% at December 31, 2018 | — |
| | 25.0 |
|
| Class A-2-I and A-2-II (2019) and Class A-2 (2018) Note debt issuance costs | (11.8 | ) | | (9.7 | ) |
| Long-term debt, net of debt issuance costs | 1,288.2 |
| | 1,299.1 |
|
| Current portion of long-term debt | — |
| | (25.0 | ) |
| Long-term debt | $ | 1,288.2 |
| | $ | 1,274.1 |
|
|
| | | | | | | |
| | 2018 | | 2017 |
| | (In millions) |
| Series 2014-1 4.277% Fixed Rate Senior Secured Notes, Class A-2 | $ | 1,283.8 |
| | $ | 1,296.8 |
|
| Series 2018-1 Variable Funding Senior Notes Class A-1, at a variable interest rate of 4.93%as of December 31, 2018 | 25.0 |
| | — |
|
| Class A-2 Note debt issuance costs | (9.7 | ) | | (13.9 | ) |
| Long-term debt, net of debt issuance costs | 1,299.1 |
| | 1,282.8 |
|
| Current portion of long-term debt | (25.0 | ) | | (13.0 | ) |
| Long-term debt | $ | 1,274.1 |
| | $ | 1,269.8 |
|
Long-Term Debt
On September 30, 2014,June 5, 2019, Applebee’s Funding LLC and IHOP Funding LLC (each a “Co-Issuer”(the “Co-Issuers”), each a special purpose, wholly-owned indirect subsidiary of the Company, issued $1.3 billiontwo tranches of fixed rate senior secured notes, the Series 2014-1 4.277%2019-1 4.194% Fixed Rate Senior Secured Notes, Class A-2A-2-I (“Class A-2-I Notes”) in an initial aggregate principal amount of $700 million and the Series 2019-1 4.723% Fixed Rate Senior Secured Notes, Class A-2-II (“Class A-2-II Notes”) in an initial aggregate principal amount of $600 million (the “Class A-2-II Notes” and, together with the Class A-2-I Notes, the “2019 Class A-2 Notes”) in. The 2019 Class A-2 Notes were issued pursuant to an offering exempt from registration under the Securities Act of 1933, as amended.
The Co-Issuers also entered into areplaced their existing revolving financing facility, of Series 2014-1the 2018-1 Variable Funding Senior Notes, Class A-1 (“2018 Class A-1 Notes”), with a new revolving financing facility, the 2019-1 Variable Funding Senior Notes, Class A-1 (the “2014 Variable Funding“2019 Class A-1 Notes”), which allowson substantially the same terms as the 2018 Class A-1 Notes in order to conform the term of the 2019 Class A-1 Notes to the anticipated repayment dates for drawings of up to $100 million of Variable Fundingthe 2019 Class A-2 Notes. The 2019 Class A-1 Notes and the issuance of letters of credit. The2019 Class A-2 Notes and the Variable Funding Notes are referred to collectively herein as the “Notes.“New Notes.”
The New Notes were issued in a securitization transaction pursuant to which substantially all of ourthe domestic revenue-generating assets and our domestic intellectual property, areas further described below, held by the Co-Issuers and certain other special-purpose, wholly-owned indirect subsidiaries of the Company (the “Guarantors”) that actwere pledged as guarantors of the Notes and that have pledged substantially all of their assetscollateral to secure the New Notes.
The Company used the majority of the net proceeds of the offering to repay the entire outstanding balance of approximately $1.28 billion of the Series 2014-1 4.277% Fixed Rate Senior Notes, Class A-2 (the “2014 Class A-2 Notes”). The Company used the remaining proceeds of the offering to pay for transactions costs associated with the securitization refinancing transaction and for general corporate purposes.
2019 Class A-2 Notes
The New Notes were issued under a Base Indenture, dated as of September 30, 2014, amended and restated as of June 5, 2019 (the “Base Indenture”), and the related Series 2014-12019-1 Supplement to the Base Indenture, dated September 30, 2014June 5, 2019 (the “Series 2014-12019-1 Supplement”), among the Co-Issuers and Citibank, N.A., as the trustee (in such capacity, the “Trustee”) and securities intermediary. The Base Indenture and the Series 2014-12019-1 Supplement (collectively, the “Indenture”) will allow the Co-Issuers to issue additional series of notes in the future subject to certain conditions set forth therein.
While the 2019 Class A-2 Notes are outstanding, payment of principal and interest is required to be made on the Class A-2 Notes on a quarterly basis. The quarterly principal payment of $3.25 millionprincipal on the 2019 Class A-2 Notes may be suspended when the leverage ratio for the Company and its subsidiaries is less than or equal to 5.25x. In general, the leverage ratio is our indebtedness divided by adjusted EBITDA for the four preceding quarterly periods. The complete definitions of all calculation elements of the leverage ratio are contained in the Base Indenture filed as Exhibit 4.1 to Form 8-K filed with the SEC on October 3, 2014 (“Base Indenture”). Exceeding the leverage ratio of 5.25x does not violate any covenant related to the New Notes.
The Company's leverage ratio did not exceed 5.25x at any quarterly payment date during 2019; accordingly, the Company was not required to make a principal payment on either the 2019 Class A-2 Notes or the 2014 Class A-2 Notes during the year ended December 31, 2019. As of December 31, 2018,2019, the Company's leverage ratio was 4.90x. 4.57x.
Dine Brands Global, Inc. and Subsidiaries
Notes to the Consolidated Financial Statements (Continued)
8. Long-Term Debt (Continued)
The Company made four principal paymentsmay voluntarily repay the New Notes at any time; however, if the Company repays the New Notes prior to certain dates, it would be required to pay make-whole premiums. As of $3.25 million during 2017.
December 31, 2019, the make-whole premium associated with voluntary prepayment of the Class A-2-I Notes was approximately $35 million; this amount declines progressively each quarter to zero in June 2022. As of December 31, 2019, the make-whole premium associated with voluntary prepayment of the Class A-2-II Notes was approximately $63 million; this amount declines progressively each quarter to zero in June 2024. The Company would also be subject to a make-whole premium in the event of a mandatory prepayment required following a Rapid Amortization Event or certain asset dispositions. The mandatory make-whole premium requirements are considered derivatives embedded in the New Notes that must be bifurcated for separate valuation. The Company estimated the fair value of these derivatives to be immaterial as of December 31, 2019, based on the probability-weighted discounted cash flows associated with either event.
The legal final maturity of the 2019 Class A-2 Notes is in September 2044,June 2049, but it is anticipated that, unless earlier prepaid to the extent permitted under the Indenture, the Class A-2A-2-I Notes will be repaid in September 2021June 2024 (the “Class A-2A-2-I Anticipated Repayment Date”) and the Class A-2-II Notes will be repaid in June 2026 (the “Class A-2-II Anticipated Repayment Date”). If the Co-Issuers have not repaid or refinanced the Class A-2A-2-I Notes prior toby the Class A-2A-2-I Anticipated Repayment Date or the Class A-2-II Notes by the Class A-2-II Anticipated Repayment Date, then additional interest will accrue on the Class A-2A-2-I Notes equal toand the Class A-2-II Notes, as applicable, at the greater of (i) 5.00% per annumof: (A) 5.0% and (ii) a per annum interest rate equal to(B) the amount, if any, by which the sum of the following exceeds the applicable Class A-2 Note interest rate: (A)(x) the yield to maturity (adjusted to a quarterly bond-equivalent basis) on the Class A-2 Anticipated Repayment Dateapplicable anticipated repayment date of the United States Treasury Security having a term closest to 10 years plus (B) 5.00%(y) 5.0%, plus (C) 2.150%. Additionally, the Company's cash flow would become subject to a rapid amortization event as described below under “Covenants and Restrictions.”
The Notes are secured by the collateral described below under “Guarantees and Collateral.”
Dine Brands Global, Inc. and Subsidiaries
Notes to the Consolidated Financial Statements (Continued)
8. Long-Term Debt (Continued)
Variable Funding Notes
In connection with the issuance of(z) 2.15% for the Class A-2A-2-I Notes and 2.64% for the Class A-2-II Notes.
2019 Class A-1 Notes
The Co-Issuers also entered into a revolving financing facility, the 2019 Class A-1 Notes, that allows for the drawings of up to $100$225 million of Variable Funding Notesvariable funding notes and the issuance of letters of credit. The Variable Funding2019 Class A-1 Notes were issued under the Indenture and allow for drawings on a revolving basis. On September 5, 2018 (the “Closing Date”), the Co-Issuers”) entered into a financing facility that allows for drawings of up to $225 million of variable funding notes on a revolving basis and the issuance of letters of credit (the “2018 Variable Funding Notes”). The 2018 Variable Funding Notes were issued under the Base Indenture and the Series 2018-1 Supplement to the Base Indenture, dated September 5, 2018, among the Co-Issuers and Citibank, N.A., as Trustee and the 2018-1 Securities Intermediary (“Series 2018-1 Supplement”). In connection therewith, the Company terminated the corresponding Class A-1 Note Purchase Agreement, dated September 30, 2014, among the Co-Issuers, certain special-purpose, wholly-owned indirect subsidiaries of the Corporation, each as a Guarantor, certain conduit investors, financial institutions and funding agents, and Cooperatieve Centrale Raiffeisen-Boerenleenbank, B.A., “Rabobank Nederland,” New York Branch, as provider of letters of credit, as swingline lender and as administrative agent (the “2014 Purchase Agreement”).
Indenture. Drawings and certain additional terms related to the 2018 Variable Funding2019 Class A-1 Notes are governed by the 2019 Class A-1 Note Purchase Agreement, dated SeptemberJune 5, 2018,2019, among the Co-Issuers, certain special-purpose, wholly-owned indirect subsidiaries of the Company, each as a Guarantor, the Corporation,Company, as manager, certain conduit investors, financial institutions and funding agents, and Barclays Bank PLC, as provider of letters of credit, swingline lender and administrative agent (the “2018 Purchase“Purchase Agreement”).
The 2018 Variable Funding2019 Class A-1 Notes will be governed, in part, by the 2018 Purchase Agreement and by certain generally applicable terms contained in the Base Indenture and the Series 2018-1 Supplement.Indenture. The applicable interest rate under the 2018 Variable Funding2019 Class A-1 Notes depends on the type of borrowing by the Co-Issuers. The applicable interest rate for advances is generally calculated at a per annum rate equal to the commercial paper funding rate or one-, two-, three- or six-month Eurodollar Funding Rate, in either case, plus 2.15%. There is an upfront fee of 1% and a fee of 50 basis points on any unused portion of the 2018 Variable Funding Notes facility. The applicable interest rate for swingline advances and unreimbursed draws on outstanding letters of credit is a per annum base rate equal to the sum of (a) 1.15% plus (b) the greatergreatest of (i) the Prime Rate in effect from time to time, (ii) the Federal Funds Rate in effect from time to time plus 0.50% and (iii) the one-month Eurodollar Funding Rate plus 1.00%. There is no upfront fee for the 2019 Class A-1 Notes. There is a fee of 50 basis points on any unused portion of the 2019 Class A-1 Notes facility. Undrawn face amounts of outstanding letters of credit that are not cash collateralized accrue a fee of 2.15% per annum. It is anticipated that the principal and interest on the 2018 Variable Funding2019 Class A-1 Notes will be repaid in full on or prior to September 7, 2021the quarterly payment date in June 2024 (the “Anticipated“2019 Class A-1 Anticipated Repayment Date”), subject to fourtwo additional one-year extensions at the option of the Company upon the satisfaction of certain conditions. The 2018 Variable Funding Notes and other credit instruments issued under the 2018 Purchase Agreement are secured by the collateral described in the Base Indenture and the
Guarantee and Collateral Agreement dated September 30, 2014, by certain special-purpose, wholly-owned indirect subsidiaries of the Company, each as a Guarantor, in favor of Citibank, N.A., as Trustee (the “Guarantee and Collateral Agreement”).
In connection with the above transaction, the Company also amended and restated the Management Agreement, dated September 30, 2014 (the “Management Agreement”), among the Co-Issuers, other securitization entities party thereto from time to time, the Company, Applebee’s Services, Inc. and International House of Pancakes, LLC as Sub-managers and Citibank, N.A., as Trustee, to revise the calculation of the weekly management fee and to make certain other revisions. The Company also amended the Base Indenture to, among other things, make certain administrative and definitional updates.
Prior to the termination of the 2014 Purchase Agreement referenced above, during fiscal 2018 the Company borrowed and repaid a total of $30.0 million of 2014 Variable Funding Notes, inclusive of $20.0 million repaid September 5, 2018 representing the entire then-outstanding principal amount of the 2014 Variable Funding Notes. The maximum amount of 2014 Variable Funding Notes outstanding during the year ended December 31, 2018 was $30.0 million and the weighted average interest rate on 2014 Variable Funding Notes outstanding during the year ended December 31, 2018 was 4.5%
During the year ended December 31, 2018 the Company borrowed $45.0 million in 2018 Variable Funding Notes and repaid $20.0 million, leaving $25.0 million outstanding at December 31, 2018. The maximum amount of 2018 Variable Funding Notes outstanding during the year ended December 31, 2018 was $25.0 million and the weighted average interest rate on the 2018 Variable Funding Notes for the period outstanding was approximately 4.9%. Additionally, at December 31, 2018, $3.1 million was pledged against the 2018 Variable Funding Notes for outstanding letters of credit, leaving $196.9 million of
Dine Brands Global, Inc. and Subsidiaries
Notes to the Consolidated Financial Statements (Continued)
8. Long-Term Debt (Continued)
2018 Variable Funding Notes available for borrowings. The letters of credit are used primarily to satisfy insurance-related collateral requirements.
Guarantees and Collateral
Under the Guarantee and Collateral Agreement, dated September 30, 2014, (the “Guaranteeas amended and Collateral Agreement”),restated as of June 5, 2019, among the Guarantors in favor of the Trustee, the Guarantors guarantee the obligations of the Co-Issuers under the Indenture and related documents and secure the guarantee by granting a security interest in substantially all of their assets.
The New Notes are secured by a security interest in substantially all of the assets of the Co-Issuers and the Guarantors (collectively, the “Securitization Entities”). On September 30, 2014,the Closing Date, these assets (the “Securitized Assets”) generally included substantially all of the domestic revenue-generating assets of the CorporationCompany and its subsidiaries, which principally consist of franchise agreements, area license agreements, development agreements, franchisee fee notes, equipment leases, agreements related to the domestic production of and the sale of pancake and waffle dry-mixes, owned and leased real property and intellectual property.
The New Notes are the obligations only of the Co-Issuers pursuant to the Indenture and are unconditionally and irrevocably guaranteed by the Guarantors pursuant to the Guarantee and Collateral Agreement. Except as described below, neither wethe Company nor any subsidiary of our subsidiaries,the Company, other than the Securitization Entities, will guarantee or in any way be liable for the obligations of the Co-Issuers under the Indenture or the New Notes.
Dine Brands Global, Inc. and Subsidiaries
Notes to the Consolidated Financial Statements (Continued)
8. Long-Term Debt (Continued)
Management Agreement
Under the terms of the Management Agreement, dated September 30, 2014, as amended and restated as of September 5, 2018, as further amended and restated as of June 5, 2019 and as amended by that certain Amendment No. 1 to Management Agreement dated November 21, 2019, among the Company, the Securitization Entities, Applebee’s Services, Inc., International House of Pancakes, LLC and the Trustee, the Company will act as the manager with respect to the Securitized Assets. The primary responsibilities of the manager will be to perform certain franchising, distribution, intellectual property and operational functions on behalf of the Securitization Entities with respect to the Securitized Assets pursuant to the Management Agreement. The manager will be entitled to the payment of the weekly management fee, as set forth in the Management Agreement and will be subject to the liabilities set forth in the Management Agreement.
The manager will manage and administer the Securitized Assets in accordance with the terms of the Management Agreement and, except as otherwise provided in the Management Agreement, the management standards set forth in the Management Agreement. Subject to limited exceptions set forth in the Management Agreement, the Management Agreement does not require the manager to expend or risk its funds or otherwise incur any financial liability in the performance of any of its rights or powers under the Management Agreement if the manager has reasonable grounds for believing that repayment of such funds or adequate indemnity against such risk or liability is not compensated by payment of the weekly management fee or is otherwise not reasonably assured or provided to it.
Subject to limited exceptions set forth in the Management Agreement, the manager will indemnify each Securitization Entity, the Trustee and certain other parties, and their respective officers, directors, employees and agents for all claims, penalties, fines, forfeitures, losses, liabilities, obligations, damages, actions, suits and related costs and judgments and other costs, fees and reasonable expenses that any of them may incur as a result of (a) failure of the manager to perform or observe its obligations under the Management Agreement, (b) the breach by the manager of any representation, warranty or covenant under the Management Agreement, or (c) the manager’s negligence, bad faith or willful misconduct in the performance of its duties under the Management Agreement.
Covenants and Restrictions
The New Notes are subject to a series of covenants and restrictions customary for transactions of this type, includingincluding: (i) that the Co-Issuers maintain specified reserve accounts to be used to make required payments in respect of the New Notes, (ii) provisions relating to optional and mandatory prepayments, and the related payment of specified amounts, including specified make-whole paymentscall redemption premiums in the case of the Class A-2 Notes under certain circumstances,circumstances; (iii) certain indemnification payments in the event, among other things, the transfers of the assets pledged as collateral for the New Notes are in stated ways defective or ineffective and (iv) covenants relating to recordkeeping, access to information and similar matters. The New Notes are also subject to customary rapid amortization events provided for in the Indenture, including events tied to failure of the Securitization Entities to maintain the stated debt service coverage ratio (“DSCR”) ratio,, the sum of domestic retail sales during the trailing twelve months for all restaurants being below $3.5 billioncertain levels on quarterlycertain measurement dates, certain manager termination events, certain events of default and the failure to repay or refinance the Class A-2 Notes on the Class A-2 Anticipated Repayment Date.anticipated repayment dates. The New Notes are also subject to certain customary events of default, including events relating to non-payment of required interest, principal or other amounts due on or with respect to the New Notes, failure of the Securitization Entities to maintain the stated debt service coverage ratio,DSCR, failure to comply with covenants within certain time frames, certain bankruptcy events, breaches of specified representations and warranties and certain judgments.
The DSCR ratio is Net Cash Flow for the four quarters preceding the calculation date divided by the total debt service payments of the preceding four quarters. Failure to maintain a prescribed DSCR ratio can trigger a Cash TrappingFlow Sweeping Event, A Rapid Amortization Event, a Manager Termination Event or a Default Event as described below. In a Cash TrappingFlow Sweeping Event, the Trustee is required to retain a certain percentage50% of cash flowexcess Cash Flow (as defined in the New Notes) in a restricted account. In a Rapid Amortization Event, all excess Cash Flow is retained and used to retire principal amounts of debt. Key DSCR ratiosDSCRs are as follows:
•DSCR less than 1.75x but equal to or greater than 1.50x - Cash TrappingFlow Sweeping Event 50% of Net Cash Flow
•DSCR less than 1.50x - Cash Trapping Event, 100% of Net Cash Flow
•DSCR less than 1.30x1.20x - Rapid Amortization Event
•Interest-only DSCR less than 1.20x - Manager Termination Event
•Interest-only DSCR less than 1.10x - Default Event
The Company's DSCR for the reporting period ended December 31, 2019 was 4.27x.
Dine Brands Global, Inc. and Subsidiaries
Notes to the Consolidated Financial Statements (Continued)
8. Long-Term Debt (Continued)
Use of Credit Facilities
The Company has not drawn on the 2019 Class A-1 Notes subsequent to their June 5, 2019, issuance. At December 31, 2019, $2.8 million was pledged against the 2019 Class A-1 Notes for outstanding letters of credit, leaving $222.2 million of 2019 Class A-1 Notes available for borrowing. The letters of credit are used primarily to satisfy insurance-related collateral requirements.
During the year ended December 31, 2019, the Company repaid $25.0 million of 2018 Class A-1 Notes, representing the amount outstanding at December 31, 2018; the Company did not draw on the 2018 Class A-1 Notes during 2019 prior to their replacement on June 5, 2019. The maximum amount of 2018 Class A-1 Notes outstanding during the period from January 1, 2019 to June 5, 2019 was 4.58x.$25.0 million and the weighted average interest rate on the 2018 Class A-1 Note for the period outstanding was 4.88%.
Loss on Extinguishment of Debt
In connection with the repayment of the 2014 Class A-2 Notes, the Company recognized a loss on extinguishment of debt of $8.3 million, representing the remaining unamortized costs related to the 2014 Class A-2 Notes. Prior to the extinguishment on June 5, 2019, amortization costs of $1.4 million, $3.4 million and $3.4 million associated with the 2014 Class A-2 Notes was included in interest expense for the years ended December 31, 2019, 2018 and 2017 respectively.
Debt Issuance Costs
The Company incurred costs of approximately $24.3$12.9 million in connection with the issuance of the 2019 Class A-2 Notes. These debt issuance costs are being amortized using the effective interest method over estimated life of each tranche of the 2019 Class A-2 Notes. Amortization costs of $3.4$1.2 million $3.4 million and $3.2 million waswere included in interest expense for the yearsyear ended December 31, 2018, 2017 and 2016
Dine Brands Global, Inc. and Subsidiaries
Notes to the Consolidated Financial Statements (Continued)
8. Long-Term Debt (Continued)
respectively.2019. Unamortized debt issuance costs of $11.8 million are reported as a direct reduction of the Class A-2 Notes in the Consolidated Balance Sheets.
The Company incurred costs of approximately $3.7$0.2 million in connection with the establishmentreplacement of the 2018 Variable Funding2018-1 Class A-1 Notes facility.with the 2019 Class A-1 Notes. These debt issuance costs arehave been added to the remaining unamortized costs of approximately $2.8 million related to the 2018 Class A-1 Notes, the total of which costs is now being amortized using the effective interest method over the estimated three-yearfive-year life of the 2018 Variable Funding2019 Class A-1 Notes. Amortization costs of $0.8 million were included in interest expense for the year ended December 31, 2019.
Unamortized debt issuance costs of $3.3$2.7 million related to the 2018 Variable Funding2019-1 Class A-1 Notes are reported as other long-term assets in the Consolidated Balance Sheets at December 31, 2018.2019.
Debt Refinancing Costs
In connection with the termination referenced above of the 2014 Purchase Agreement, the Company recognized as expense $0.9 million of unamortized debt issuance costs associated with the 2014 Variable Funding Notes.Notes during the year ended December 31, 2018. In addition, the Company incurred costs of $1.6 million associated with the evaluation of various alternatives for refinancing our securitized indebtedness that were also charged to expense.expense during the year ended December 31, 2018. These costs totaling $2.5 million are reported as “Debt refinancing costs” in the Consolidated Statements of Comprehensive Income (Loss). for the year ended December 31, 2018.
Dine Brands Global, Inc. and Subsidiaries
Notes to the Consolidated Financial Statements (Continued)
8. Long-Term Debt (Continued)
Maturities of Long-term Debt
The Class A-2 Anticipated Repayment Date is September 2021. AssumingFace-value maturities of long-term debt for each of the next five years, assuming the Company's leverage ratio remains greaterless than 5.25x, the entire face-value maturity of $1.3 billion of Class A-2 Notes is due in 2021.are as follows:
|
| | | |
| | (In millions) |
| 2020 | $ | — |
|
| 2021 | — |
|
| 2022 | — |
|
| 2023 | — |
|
| 2024 | 700.0 |
|
| Thereafter | 600.0 |
|
| Total | $ | 1,300.0 |
|
9. Financing Obligations
On May 19, 2008, the Company entered into a Purchase and Sale Agreement relating to the sale and leaseback of 181 parcels of real property (the “Sale-Leaseback Transaction”), each of which is improved with a restaurant operating as an Applebee's Neighborhood Grill and Bar (the “Properties”). On June 13, 2008, the closing date of the Sale-Leaseback Transaction, the Company entered into a Master Land and Building Lease (“Master Lease”) for the Properties. The proceeds received from the transaction were $337.2 million. The Master Lease calls for an initial term of twenty years and four4, five-year options to extend the term.
The Company has an ongoing obligation related to the Properties until such timeSale-Leaseback Transaction does not qualify as the lease related to each of the Properties is assigned to a qualified franchisee in a transaction meeting certain parameters set forth in the Master Lease. Due to this continuing involvement,sale under current U.S. GAAP. Accordingly, the Sale-Leaseback Transaction wascontinues to be recorded under the financing method in accordance with U.S. GAAP. Accordingly, themethod. The value of the land and leasehold improvements will remain on the Company's books and the leasehold improvements will continue to be depreciated over their remaining useful lives. The net proceeds received were recorded as a financing obligation. A portion of the lease payments is recorded as a decrease to the financing obligation and a portion is recognized as interest expense. In the event the lease obligation of any individual property or group of properties is assumed by a qualified franchisee, the Company's continuing involvement will cease. At that time, that portion of the transaction related to that property or group of properties is recorded as a sale in accordance with U.S. GAAP and the net book value of those properties will be removed from the Company's books, along with a ratable portion of the remaining financing obligation.
As of December 31, 2018,2019, the Company's continuing involvement withportion of the original Sale-Leaseback Transaction related to 155 of the 181 Properties endedhas qualified as a sale by assignment of the lease obligation to a qualified franchisee or a release from the lessor. In accordance with the accounting described above, the transactions related to these properties have been recorded as a sale with property and equipment and financing obligations have each been cumulatively reduced by approximately $280.0 million.
Dine Brands Global, Inc. and Subsidiaries
Notes to the Consolidated Financial Statements (Continued)
9. Financing Obligations (Continued)
As of December 31, 2018,2019, future minimum lease payments under financing obligations during the initial terms of the leases related to the sale-leaseback transactions are as follows:
| | | Fiscal Years | (In millions) | (In millions) |
| 2019 | $ | 5.1 |
| |
2020(1) | 5.6 |
| $ | 5.6 |
|
| 2021 | 5.1 |
| 5.1 |
|
| 2022 | 5.1 |
| 5.1 |
|
| 2023 | 5.0 |
| 5.0 |
|
2024(1) | | 5.7 |
|
| Thereafter | 50.4 |
| 44.8 |
|
| Total minimum lease payments | 76.3 |
| 71.3 |
|
| Less: interest | (37.2 | ) | (32.8 | ) |
| Total financing obligations | 39.1 |
| 38.5 |
|
Less: current portion(2) | (0.6 | ) | (0.8 | ) |
| Long-term financing obligations | $ | 38.5 |
| $ | 37.7 |
|
| |
(1) | Due to the varying closing date of the Company's fiscal year, 13 monthly payments will be made in 2020.2020 and 2024. |
| |
(2) | Included in current maturities of capitalfinance lease and financing obligations on the consolidated balance sheet. |
Dine Brands Global, Inc. and Subsidiaries
Notes to the Consolidated Financial Statements (Continued)
10. LeasesLease Disclosures
The Company engages in leasing activity as both a lessee and a lessor. The majority of the Company's lease portfolio originated when the Company was actively involved in the development and financing of IHOP restaurants prior to the franchising of the restaurant to the franchisee. This activity included the Company's purchase or leasing of the site on which the restaurant was located and subsequently leasing/subleasing the site to the franchisee. With a few exceptions, the Company ended this practice in 2003 and the Company's current lease activity is predominantly comprised of renewals of existing lease arrangements and exercises of options on existing lease arrangements.
The Company currently leases from third parties the lessor or sub-lessor of propertiesreal property on which approximately 680 domestic600 IHOP franchisefranchisee-operated restaurants and 1 Applebee's franchisee-operated restaurant are located; the Company (as lessor) subleases the property to the franchisees that operate those restaurants. The Company also leases property it owns to the franchisees that operate approximately 60 IHOP restaurants and 1 Applebee's restaurant. The Company leases from third parties the real property on which 69 Applebee's company-operated restaurants are located. The restaurants are subleasedCompany also leases office space for its principal corporate office in Glendale, California and restaurant support centers in Kansas City, Missouri and Raleigh, North Carolina. The Company does not have a significant amount of non-real estate leases.
The Company's existing leases/subleases related to IHOP franchiseesrestaurants generally provide for an initial term of 20 to 25 years, with most having one or more five-year renewal options. Leases related to Applebee's restaurants generally have an initial term of 10 to 20 years, with renewal terms of five to 20 years. Option periods were not included in determining liabilities and right-of-use assets related to operating leases. Approximately 175 of the Company's leases contain provisions requiring additional rent payments to the Company (as lessor) based on a few instances were operatedpercentage of restaurant sales. Approximately 250 of the Company's leases contain provisions requiring additional rent payments by the Company or an Applebee's franchisee. These(as lessee) based on a percentage of restaurant sales.
The individual lease agreements do not provide information to determine the implicit interest rate in the agreements. The Company made significant judgments in determining the incremental borrowing rates that were used in calculating operating lease liabilities as of the adoption date. Due to the large number of leases, the Company applied a portfolio approach by grouping the leases based on the original lease term. The Company estimated the interest rate for each grouping primarily by reference to (i) yield rates on debt issuances by companies of a similar credit rating as the Company; (ii) U.S. Treasury rates as of the adoption date; and (iii) adjustments for differences in years to maturity.
The Company's lease cost for the year ended December 31, 2019 was as follows:
|
| | | | |
| | | Year ended December 31, 2019 |
| Finance lease cost: | (In millions) |
| Amortization of right-of-use assets | | $ | 5.3 |
|
| Interest on lease liabilities | | 7.7 |
|
| Operating lease cost | | 106.2 |
|
| Variable lease cost | | 2.7 |
|
| Short-term lease cost | | 0.0 |
|
| Sublease income | | (110.9 | ) |
| Lease cost | | $ | 11.0 |
|
Dine Brands Global, Inc. and Subsidiaries
Notes to the Consolidated Financial Statements (Continued)
10. Lease Disclosures (Continued)
Future minimum lease payments under noncancelable leases as lessee as of December 31, 2019 were as follows:
|
| | | | | | | |
| | Finance Leases | | Operating Leases |
| | (In millions) |
| 2020 | $ | 19.8 |
| | $ | 97.4 |
|
| 2021 | 16.4 |
| | 81.1 |
|
| 2022 | 14.7 |
| | 73.4 |
|
| 2023 | 11.6 |
| | 60.6 |
|
| 2024 | 9.4 |
| | 54.9 |
|
| Thereafter | 55.7 |
| | 173.0 |
|
| Total minimum lease payments | 127.6 |
| | 540.4 |
|
| Less: interest/imputed interest | (37.3 | ) | | (108.6 | ) |
| Total obligations | 90.3 |
| | 431.8 |
|
| Less: current portion | (12.9 | ) | | (72.8 | ) |
| Long-term lease obligations | $ | 77.4 |
| | $ | 359.0 |
|
The weighted average remaining lease term as of December 31, 2019 was 8.6 years for finance leases and subleases consist primarily7.7 years for operating leases. The weighted average discount rate as of land, buildingsDecember 31, 2019 was 10.4% for finance leases and improvements. 5.7% for operating leases.
During the year ended December 31, 2019, the Company made the following cash payments for leases:
|
| | | | |
| | | Year ended December 31, 2019 |
| | (In millions) |
| Principal payments on finance lease obligations | | $ | 13.6 |
|
| Interest payments on finance lease obligations | | $ | 7.7 |
|
| Payments on operating leases | | $ | 91.9 |
|
| Variable lease payments | | $ | 2.5 |
|
The Company is alsoCompany's income from operating leases for the lesseeyear ended December 31, 2019 was as follows:
|
| | | | |
| | | Year ended December 31, 2019 |
| | (In millions) |
| Minimum lease payments | | $ | 102.8 |
|
| Variable lease income | | 11.5 |
|
| Total operating lease income | | $ | 114.3 |
|
Future minimum payments to be received as lessor under noncancelable operating leases as of properties on which 69 Applebee's restaurantsDecember 31, 2019 were as follows:
|
| | | |
| | (In millions) |
| 2020 | $ | 108.3 |
|
| 2021 | 102.6 |
|
| 2022 | 99.6 |
|
| 2023 | 95.2 |
|
| 2024 | 86.5 |
|
| Thereafter | 214.5 |
|
| Total minimum rents receivable | $ | 706.7 |
|
Dine Brands Global, Inc. and two office facilities are located.Subsidiaries
Notes to the Consolidated Financial Statements (Continued)
10. Lease Disclosures (Continued)
The Company's income from direct financing leases at December 31, 2019 was as follows:
|
| | | | |
| | | Year ended December 31, 2019 |
| | (In millions) |
| Interest income | | $ | 5.0 |
|
| Variable lease income | | 1.3 |
|
| Total operating lease income | | $ | 6.3 |
|
Future minimum payments to be received as lessor under noncancelable direct financing leases as of December 31, 2019 were as follows:
|
| | | |
| | (In millions) |
| 2020 | $ | 14.6 |
|
| 2021 | 11.5 |
|
| 2022 | 8.2 |
|
| 2023 | 3.6 |
|
| 2024 | 1.3 |
|
| Thereafter | 2.5 |
|
| Total minimum rents receivable | 41.7 |
|
| Less: unearned income | (7.7 | ) |
| Total net investment in direct financing leases | 34.0 |
|
| Less: current portion | (11.0 | ) |
| Long-term investment in direct financing leases | $ | 23.0 |
|
The following disclosures for the year ended December 31, 2018 were made in accordance with the accounting guidance for leases in effect at that time.
The following is the Company's net investment in direct financing lease receivables:
|
| | | |
| | December 31, |
| | 2018 |
| | (In millions) |
| Total minimum rents receivable | $ | 57.3 |
|
| Less: unearned income | (12.4 | ) |
| Net investment in direct financing leases receivable | 44.9 |
|
| Less: current portion | (11.2 | ) |
| Long-term direct financing leases receivable | $ | 33.7 |
|
|
| | | | | | | |
| | December 31, |
| | 2018 | | 2017 |
| | (In millions) |
| Total minimum rents receivable | $ | 57.3 |
| | $ | 74.5 |
|
| Less: unearned income | (12.4 | ) | | (18.8 | ) |
| Net investment in direct financing leases receivable | 44.9 |
| | 55.7 |
|
| Less: current portion | (11.2 | ) | | (10.8 | ) |
| Long-term direct financing leases receivable | $ | 33.7 |
| | $ | 44.9 |
|
Contingent rental income, which is the amount above and beyond base rent, for the years ended December 31, 2018, and 2017 and 2016 was $14.3 million, and $14.0 million and $15.4 million, respectively.
The following is the Company's net investment in equipment leases receivable:
|
| | | |
| | December 31, |
| | 2018 |
| | (In millions) |
| Total minimum leases receivable | $ | 89.9 |
|
| Less: unearned income | (24.1 | ) |
| Net investment in equipment leases receivable | 65.8 |
|
| Less: current portion | (8.5 | ) |
| Long-term equipment leases receivable | $ | 57.3 |
|
|
| | | | | | | |
| | December 31, |
| | 2018 | | 2017 |
| | (In millions) |
| Total minimum leases receivable | $ | 89.9 |
| | $ | 106.4 |
|
| Less: unearned income | (24.1 | ) | | (27.1 | ) |
| Net investment in equipment leases receivable | 65.8 |
| | 79.3 |
|
| Less: current portion | (8.5 | ) | | (8.2 | ) |
| Long-term equipment leases receivable | $ | 57.3 |
| | $ | 71.1 |
|
Dine Brands Global, Inc. and Subsidiaries
Notes to the Consolidated Financial Statements (Continued)
10. LeasesLease Disclosures (Continued)
The following are minimum future lease payments on noncancelable leases as lessee at December 31, 2018:2018:
| | | | Capital Leases | | Operating Leases | Capital Leases | | Operating Leases |
| | (In millions) | (In millions) |
| 2019 | $ | 21.0 |
| | $ | 91.2 |
| $ | 21.0 |
| | $ | 91.2 |
|
2020(1) | 19.3 |
| | 92.8 |
| 19.3 |
| | 92.8 |
|
| 2021 | 16.2 |
| | 75.7 |
| 16.2 |
| | 75.7 |
|
| 2022 | 14.3 |
| | 67.6 |
| 14.3 |
| | 67.6 |
|
| 2023 | 11.6 |
| | 55.2 |
| 11.6 |
| | 55.2 |
|
| Thereafter | 63.4 |
| | 210.5 |
| 63.4 |
| | 210.6 |
|
| Total minimum lease payments | 145.8 |
| | $ | 593.0 |
| 145.8 |
| | $ | 593.0 |
|
| Less: interest | (44.6 | ) | | |
| (44.6 | ) | | |
|
| Capital lease obligations | 101.2 |
| | |
| 101.2 |
| | |
|
Less: current portion(2)(1) | (13.4 | ) | | |
| (13.4 | ) | | |
|
| Long-term capital lease obligations | $ | 87.8 |
| | |
| $ | 87.8 |
| | |
|
(1) Due to the varying closing date of the Company's fiscal year, 13 monthly payments will be made in fiscal 2020.
(2) Included in current maturities of capital lease and financing obligations on the consolidated balance sheet.
The asset cost and carrying amount on company-owned property leased at December 31, 2018 was $89.0$89.0 million and $58.8$58.8 million,, respectively. The asset cost and carrying amount on company-owned property leased at December 31, 2017,, was $89.0$89.0 million and $60.0$60.0 million,, respectively. The asset cost and carrying amounts represent the land and building asset values and net book values on sites leased to franchisees.
The minimum future lease payments shown above have not been reduced by the following future minimum rents to be received on noncancelable subleases and leases of owned property at December 31, 2018:
|
| | | | | | | |
| | Direct Financing Leases | | Operating Leases |
| | (In millions) |
| 2019 | $ | 16.2 |
| | $ | 105.9 |
|
2020(1) | 14.8 |
| | 106.3 |
|
| 2021 | 11.7 |
| | 100.2 |
|
| 2022 | 8.2 |
| | 96.2 |
|
| 2023 | 3.5 |
| | 91.8 |
|
| Thereafter | 2.9 |
| | 271.8 |
|
| Total minimum rents receivable | $ | 57.3 |
| | $ | 772.2 |
|
(1) Due to the varying closing date of the Company's fiscal year, 13 monthly payments will be made in fiscal 2020.
The Company has noncancelable leases, expiring at various dates through 2057, which require payment of contingent rents based upon a percentage of sales of the related restaurant as well as property taxes, insurance and other charges. Subleases to franchisees of properties under such leases are generally for the full term of the lease obligation at rents that include the Company's obligations for property taxes, insurance, contingent rents and other charges. Generally, the noncancelable leases include renewal options. Contingent rent expense for all noncancelable leases for the years ended December 31, 2018, and 2017 and 2016 was $2.7 million, $2.6 and $2.6 million, and $3.0 million, respectively. Minimum rent expense for all noncancelable operating leases for the years ended December 31, 2018, and 2017 and 2016 was $80.8 million, $73.0 and $73.0 million, and $76.5 million, respectively.
11. Commitments and Contingencies
Purchase Commitments
In some instances, the Company enters into commitments to purchase advertising and other items. Most of these agreements are fixed price purchase commitments. At December 31, 20182019, the outstanding purchase commitments were $171.3$115.9 million, the majority of which related to advertising.
Dine Brands Global, Inc. and Subsidiaries
Notes to the Consolidated Financial Statements (Continued)
11. Commitments and Contingencies (Continued)
Lease Guarantees
In connection with the sale of Applebee's restaurants to franchisees and other parties, the Company has, in certain cases, guaranteed or had potential continuing liability for lease payments. The Company had outstanding lease guarantees or was contingently liable for approximately $284.3$257.2 million and $313.9284.3 million as of December 31, 20182019 and 20172018 respectively. These amounts represent the maximum potential liability of future payments under these leases. Excluding unexercised option periods, the Company's potential liability for future payments under these leases as of December 31, 20182019 was $44.7$40.4 million. These leases have been assigned to the buyers and expire at the end of the respective lease terms, which range from 20192020 through 2048. In the event of default, the indemnity and default clauses in our sale or assignment agreements govern our ability to pursue and recover damages incurred. No material liabilities for these guarantees have been recorded as of December 31, 20182019.
Litigation, Claims and Disputes
The Company is subject to various lawsuits, governmental inspections, administrative proceedings, audits, and claims arising in the ordinary course of business. Some of these lawsuits purport to be class actions and/or seek substantial damages. The Company is required to record an accrual for litigation loss contingencies that are both probable and reasonably estimable. Legal fees and expenses associated with the defense of all of the Company's litigation are expensed as such fees and expenses are incurred. In the opinion of management, these matters are adequately covered by insurance or, if not so covered, are without merit or are of such a nature or involve amounts that would not have a material adverse impact on the Company's business or consolidated financial statements. Management regularly assesses the Company's insurance deductibles, analyzes litigation information with the Company's attorneys and evaluates its loss experience in connection with pending legal proceedings. While the Company does not presently believe that any of the legal proceedings to which the Company is currently a party will ultimately have a material adverse impact on the Company, there can be no assurance that the Company will prevail in all the proceedings the Company is party to, or that the Company will not incur material losses from them.
Letters of Credit
The Company provides letters of credit, primarily to various insurance carriers to collateralize obligations for outstanding claims. As of December 31, 20182019, the Company had approximately $3.1$2.8 million of unused letters of credit outstanding that reduce the Company's available borrowing under its 2018 Variable Funding2019 Class A-1 Notes. These letters of credit expire on various dates in 20192020 and are automatically renewed for an additional year if no cancellation notice is submitted.
12. Stockholders' Deficit
Stock Repurchase Programs
On October 1, 2015, the Company's Board of Directors approved a stock repurchase program authorizing the Company to repurchase up to $150 million of its common stock (the “2015 Repurchase Program”) on an opportunistic basis from time to time in open market transactions and in privately negotiated transactions based on business, market, applicable legal requirements and other considerations. The Company has repurchased 1,479,496 shares of stock for $117.8 million under the 2015 Repurchase Program. The Company may repurchase up to an additional $32.2 million of common stock under the 2015 Repurchase Program.
Shares repurchased under the 2015 Repurchase Program during the fiscal years ended December 31, 2018, 2017 and 2016 are summarized as follows: |
| | | | | | | | | | | |
| | | Repurchases | | Remaining Value that may be Repurchased |
| Year Ended December 31, | | Shares | | Amount | |
| | | | | (Dollars in millions) |
| 2018 | | 478,839 |
| | $ | 34.9 |
| | $ | 32.2 |
|
| 2017 | | 145,786 |
| | $ | 10.0 |
| | $ | 67.1 |
|
| 2016 | | 650,384 |
| | $ | 55.3 |
| | $ | 77.1 |
|
In February 2019, the Company’s Board of Directors approved a stock repurchase program authorizing the Company to repurchase up to $200 million of the Company’s common stock (“2019(the “2019 Repurchase Program”) on an opportunistic basis from time to time in the open market or in privately negotiated transactions based on business, market, applicable legal requirements and other considerations. The 2019 Repurchase Program, as approved by the Board of Directors, does not require the
Dine Brands Global, Inc. and Subsidiaries
Notes to the Consolidated Financial Statements (Continued)
12. Stockholders' Deficit (Continued)
repurchase of a specific number of shares and can be terminated at any time. In connection with the approval of the 2019 Repurchase Program, the Board of Directors terminated the prior repurchase program approved in October 2015 (the “2015 Repurchase Program”) which had authorized the Company to repurchase up to $150 million of the Company’s common stock.
Dine Brands Global, Inc. and Subsidiaries
Notes to the Consolidated Financial Statements (Continued)
12. Stockholders' Deficit (Continued)
A summary of shares repurchased under the 2019 Repurchase Program and the 2015 Repurchase Program, during the year ended December 31, 2019 and cumulatively for each program, is as follows:
|
| | | | | | |
| | Shares | | Cost of shares |
| | | | (In millions) |
| 2019 Repurchase Program: | | | |
| Repurchased during the year ended December 31, 2019 | 1,237,698 |
| | $ | 103.3 |
|
| Cumulative (life-of-program) repurchases | 1,237,698 |
| | $ | 103.3 |
|
| Remaining dollar value of shares that may be repurchased | n/a | | $ | 96.7 |
|
| | | | |
| 2015 Repurchase Program: | | | |
| Repurchased during the year ended December 31, 2019 | 110,499 |
| | $ | 8.4 |
|
| Cumulative (life-of-program) repurchases | 1,589,995 |
| | $ | 126.2 |
|
| Remaining dollar value of shares that may be repurchased | n/a | | n/a |
Dividends
During the fiscal years ended December 31, 20182019, 20172018 and 2016,2017, the Company declared and paid dividends on common stock as follows:
| | | Year ended December 31, 2018 | Declaration Date | | Payment Date | | Dividends declared per share | | Dividends paid per share | | Total dividends paid(1) | |
| Year ended December 31, 2019 | | Declaration Date | | Payment Date | | Dividends declared per share | | Dividends paid per share | | Total dividends paid(1) |
| | | | | | | (In millions) | | | | | | (In millions) |
| Payment of prior year declaration | (3) | | January 5, 2018 | | — |
| | $ | 0.97 |
| | $ | 17.7 |
| (3) | | January 4, 2019 | | — |
| | $ | 0.63 |
| | $ | 11.4 |
|
| First quarter | February 14, 2018 | | April 6, 2018 | | $ | 0.63 |
| | 0.63 |
| | 11.5 |
| February 20, 2019 | | April 5, 2019 | | $ | 0.69 |
| | 0.69 |
| | 12.5 |
|
| Second quarter | May 14, 2018 | | July 6, 2018 | | 0.63 |
| | 0.63 |
| | 11.4 |
| May 13, 2019 | | July 12, 2019 | | 0.69 |
| | 0.69 |
| | 12.2 |
|
| Third quarter | August 2, 2018 | | October 5, 2018 | | 0.63 |
| | 0.63 |
| | 11.4 |
| August 1, 2019 | | October 4, 2019 | | 0.69 |
| | 0.69 |
| | 11.8 |
|
| Fourth quarter | October 6, 2018 | | (2) | | 0.63 |
| | — |
| | — |
| October 8, 2019 | | (2) | | 0.69 |
| | — |
| | — |
|
| Total | | $ | 2.52 |
| | $ | 2.86 |
| | $ | 52.0 |
| | $ | 2.76 |
| | $ | 2.70 |
| | $ | 47.9 |
|
| | | Year ended December 31, 2017 | | | | | | | |
| Year ended December 31, 2018 | | | | | | | |
| Payment of prior year declaration | (4) | | January 6, 2017 | | — |
| | $ | 0.97 |
| | $ | 17.5 |
| (4) | | January 5, 2018 | | — |
| | $ | 0.97 |
| | $ | 17.7 |
|
| First quarter | February 22, 2017 | | April 7, 2017 | | $ | 0.97 |
| | 0.97 |
| | 17.5 |
| February 14, 2018 | | April 6, 2018 | | $ | 0.63 |
| | 0.63 |
| | 11.5 |
|
| Second quarter | May 15, 2017 | | July 7, 2017 | | 0.97 |
| | 0.97 |
| | 17.5 |
| May 14, 2018 | | July 6, 2018 | | 0.63 |
| | 0.63 |
| | 11.4 |
|
| Third quarter | August 10, 2017 | | October 6, 2017 | | 0.97 |
| | 0.97 |
| | 17.8 |
| August 2, 2018 | | October 5, 2018 | | 0.63 |
| | 0.63 |
| | 11.4 |
|
| Fourth quarter | October 6, 2017 | | (3) | | 0.97 |
| | — |
| | — |
| October 6, 2018 | | (3) | | 0.63 |
| | — |
| | — |
|
| Total | | $ | 3.88 |
| | $ | 3.88 |
| | $ | 70.3 |
| | $ | 2.52 |
| | $ | 2.86 |
| | $ | 52.0 |
|
| | | Year ended December 31, 2016 | | | | | | | |
| Year ended December 31, 2017 | | | | | | | |
| Payment of prior year declaration | (5) | | January 8, 2016 | | $ | — |
| | $ | 0.92 |
| | $ | 17.1 |
| (5) | | January 6, 2017 | | $ | — |
| | $ | 0.97 |
| | $ | 17.5 |
|
| First quarter | February 23, 2016 | | April 8, 2016 | | $ | 0.92 |
| | 0.92 |
| | 17.0 |
| February 22, 2017 | | April 7, 2017 | | $ | 0.97 |
| | 0.97 |
| | 17.5 |
|
| Second quarter | May 16, 2016 | | July 8, 2016 | | 0.92 |
| | 0.92 |
| | 16.8 |
| May 15, 2017 | | July 7, 2017 | | 0.97 |
| | 0.97 |
| | 17.5 |
|
| Third quarter | July 28, 2016 | | October 7, 2016 | | 0.92 |
| | 0.92 |
| | 16.7 |
| August 10, 2017 | | October 6, 2017 | | 0.97 |
| | 0.97 |
| | 17.8 |
|
| Fourth quarter | October 31, 2016 | | (4) | | 0.97 |
| | — |
| | — |
| October 6, 2017 | | (4) | | 0.97 |
| | — |
| | — |
|
| Total | | | $ | 3.73 |
| | $ | 3.68 |
| | $ | 67.6 |
| | | $ | 3.88 |
| | $ | 3.88 |
| | $ | 70.3 |
|
(1) Includes dividend equivalents paid on restricted stock units
(2) The fourth quarter 2019 dividend of $11.7 million was paid on January 10, 2020.
(3) The fourth quarter 2018 dividend of $11.4 million was paid on January 4, 2019.
(3)(4) The fourth quarter 2017 dividend of $17.7 million was paid on January 5, 2018.
(4)(5) The fourth quarter 2016 dividend of $17.5 million was paid on January 6, 2017.
(5) The fourth quarter 2015 dividend of $17.1 million was paid on January 8, 2016.
Dividends declared on common stock are recorded as a reduction of retained earnings to the extent retained earnings are available at the close of the period prior to the date of the declared dividend. Dividends in excess of retained earnings are recorded as a reduction of additional paid-in capital. Dividends recorded during the fiscal years ended December 31, 2018, 2017 and 2016 were as follows:
|
| | | | | | | | | | | |
| | Year Ended December 31, |
| | 2018 | | 2017 | | 2016 |
| | (In millions) |
| Dividends declared from retained earnings | $ | — |
| | $ | (52.6 | ) | | $ | (67.8 | ) |
| Dividends declared from additional paid-in capital | $ | (44.7 | ) | | $ | (17.7 | ) | | $ | — |
|
On February 20, 2019, our Board of Directors approved payment of a cash dividend of $0.69 per share of common stock, payable at the close of business on April 5, 2019 to the stockholders of record as of the close of business on March 20, 2019.
Dine Brands Global, Inc. and Subsidiaries
Notes to the Consolidated Financial Statements (Continued)
12. Stockholders' Deficit (Continued)
Dividends recorded during the fiscal years ended December 31, 2019, 2018 and 2017 were as follows:
|
| | | | | | | | | | | |
| | Year Ended December 31, |
| | 2019 | | 2018 | | 2017 |
| | (In millions) |
| Dividends declared from retained earnings | $ | (48.1 | ) | | $ | — |
| | $ | (52.6 | ) |
| Dividends declared from additional paid-in capital | $ | — |
| | $ | (44.7 | ) | | $ | (17.7 | ) |
On February 20, 2020, our Board of Directors approved payment of a cash dividend of $0.76 per share of common stock, payable at the close of business on April 3, 2020 to the stockholders of record as of the close of business on March 20, 2020.
Treasury Stock
Repurchases of the Company's common stock are included in treasury stock at the cost of shares repurchased plus any transaction costs. Treasury stock may be re-issued when vested stock options are exercised, when restricted stock awards are granted and when restricted stock units settle in stock upon vesting. The cost of treasury stock re-issued is determined on the first-in, first-out (“FIFO”) method. The Company re-issued $167,396285,302 shares, $281,185167,396 shares and $136,818281,185 shares, respectively, during the years ended December 31, 2019, 2018 2017 and 20162017 at a total FIFO cost of $12.5 million, $6.5 million $10.1 million and $4.9$10.1 million, respectively.
13. Closure and Other Impairment Charges
Closure and other impairment charges for the years ended December 31, 2019, 2018 2017 and 20162017 were as follows:
|
| | | | | | | | | | | |
| | Year Ended December 31, |
| | 2019 | | 2018 | | 2017 |
| | (In millions) |
| Closure charges | $ | 1.5 |
| | $ | 2.0 |
| | $ | 3.9 |
|
| Long-lived tangible asset impairment | — |
| | 0.1 |
| | 0.1 |
|
| Total closure and impairment charges | $ | 1.5 |
| | $ | 2.1 |
| | $ | 4.0 |
|
|
| | | | | | | | | | | |
| | Year Ended December 31, |
| | 2018 | | 2017 | | 2016 |
| | (In millions) |
| Closure charges | $ | 2.0 |
| | $ | 3.9 |
| | $ | 1.2 |
|
| Kansas City lease exit costs | — |
| | — |
| | 2.9 |
|
| Long-lived tangible asset impairment | 0.1 |
| | 0.1 |
| | 1.0 |
|
| Total closure and impairment charges | $ | 2.1 |
| | $ | 4.0 |
| | $ | 5.1 |
|
Closure Charges
Approximately $0.5 million of closure charges for the year ended December 31, 2019 related to two IHOP restaurants and one Applebee's restaurant closed during 2019, with the remainder primarily related to adjustments to the reserve for IHOP and Applebee's restaurants closed prior to 2019. Approximately $1.8 million of closure charges for the year ended December 31, 2018 related to one IHOP franchise restaurant closed during 2018, with the remainder primarily related to adjustments to the estimated reserve for IHOP and Applebee's restaurants closed prior to 2017.2018. Approximately $2.2 million of closure charges for the year ended December 31, 2017 related to one IHOP company-operated restaurant closed during 2017, with the remainder primarily related to adjustments to the estimated reserve for IHOP and Applebee's restaurants closed prior to 2017. Approximately $0.7 million of closure
Long-lived Tangible Asset Impairment
There were 0 long-lived tangible asset impairment charges for the year ended December 31, 2016 related to one IHOP franchise restaurant closed during 2016, with the rest of the charges related to adjustments to the estimated reserve for IHOP and Applebee's restaurants closed prior to 2016.
Kansas City Lease Exit Costs
The Company incurred costs of $2.9 million for the year ended December 31, 2016 to exit a facility in connection with a consolidation of the Company's offices. Approximately $2.5 million related to the outright termination of a lease covering two floors of the facility and $0.4 million represents the present value of future lease payments, net of assumed sublease rentals, of one floor of the facility.
Long-lived Tangible Asset Impairment
Long-lived tangible asset impairment charges for the years ended December 31, 2018 and 2017 were not significant.2019. Long-lived tangible asset impairment charges for the year ended December 31, 2016 comprised a charge of $0.6 million for one IHOP company-operated restaurant2018 and charges totaling $0.4 million of individually insignificant charges at eight IHOP company-operated restaurants.2017 were insignificant.
14. Stock-Based Incentive Plans
General Description
Currently, the Company is authorized to grant stock options, stock appreciation rights, restricted stock, cash-settled and stock-settled restricted stock units and performance units to officers, other employees and non-employee directors under the Dine Brands Global, Inc. 2019 Stock Incentive Plan (the “2019 Plan”). The 2019 Plan was approved by stockholders on May 14, 2019 to permit the issuance of up to 2,050,000 shares (subject to adjustment as defined in the 2019 Plan for shares that may become available from prior plans) of the Company’s common stock for incentive stock awards. The 2019 Plan will expire in May 2029.
Dine Brands Global, Inc. and Subsidiaries
Notes to the Consolidated Financial Statements (Continued)
14. Stock-Based Incentive Plans (Continued)
The Dine Brands Global, Inc. 2016 Stock Incentive Plan (the “2016 Plan”). The was adopted in 2016 Plan was approved by stockholders on May 17, 2016 and permitsto permit the issuance of up to 3,750,000 shares of the Company’s common stock for incentive stock awards. The 2016 Plan will expire in May 2026.was terminated upon adoption of the 2019 Plan, but there are stock options (vested and unvested) and unvested restricted stock and restricted stock units issued under the 2016 Plan that are outstanding as of December 31, 2019.
The DineEquity, Inc. 2011 Stock Incentive Plan (the “2011 Plan”) was adopted in 2011 to permit the issuance of up to 1,500,000 shares of the Company’s common stock for incentive stock awards. The 2011 Plan was terminated upon adoption of the 2016 Plan, but there are vested stock options restricted stock and restricted stock units issued under the 2011 Plan that are outstanding as of December 31, 2018.2019.
Dine Brands Global, Inc. and Subsidiaries
Notes to the Consolidated Financial Statements (Continued)
14. Stock-Based Incentive Plans (Continued)
The IHOP Corp. 2001 Stock Incentive Plan (the “2001 Plan”) was adopted in 2001 and amended and restated in 2005 and 2008 to authorize the issuance of up to 4,200,000 shares of common stock. The 2001 Plan has expired but there are vested stock options issued under the 2001 Plan outstanding as of December 31, 20182019.
The 2019 Plan, 2016 Plan, the 2011 Plan and the 2001 Plan are collectively referred to as the “Plans.”
Stock-Based Compensation Expense
From time to time, the Company has granted nonqualified stock options, restricted stock, cash-settled and stock-settled restricted stock units and performance units to officers, other employees and non-employee directors of the Company under the Plans. The nonqualified stock options generally vest ratably over a three-year period in one-third increments and have a maturity of ten years from the grant date. Options vest immediately upon a change in control of the Company, as defined in the Plans. Option exercise prices equal the closing price of the Company's common stock on the New York Stock Exchange on the date of grant. Restricted stock and restricted stock units are issued at no cost to the holder and vest over terms determined by the Compensation Committee of the Company's Board of Directors, generally three years from the date of grant or immediately upon a change in control of the Company, as defined in the Plans. The Company either utilizes treasury stock or issues new shares from its authorized but unissued share pool when vested stock options are exercised, when restricted stock awards are granted and when restricted stock units settle in stock upon vesting.
The following table summarizes the Company's stock-based compensation expense included as a component of general and administrative expenses in the consolidated financial statements:
|
| | | | | | | | | | | |
| | Year Ended December 31, |
| | 2019 | | 2018 | | 2017 |
| | (In millions) |
| Total stock-based compensation expense: | | | | | |
| Equity classified awards expense | $ | 10.9 |
| | $ | 10.6 |
| | $ | 10.9 |
|
| Liability classified awards expense (credit) | 3.2 |
| | 3.1 |
| | (1.0 | ) |
| Total pretax stock-based compensation expense | 14.1 |
| | 13.7 |
| | 9.9 |
|
| Book income tax benefit | (3.5 | ) | | (3.5 | ) | | (3.8 | ) |
| Total stock-based compensation expense, net of tax | $ | 10.6 |
| | $ | 10.2 |
| | $ | 6.1 |
|
|
| | | | | | | | | | | |
| | Year Ended December 31, |
| | 2018 | | 2017 | | 2016 |
| | (In millions) |
| Total stock-based compensation expense: | | | | | |
| Equity classified awards expense | $ | 10.6 |
| | $ | 10.9 |
| | $ | 11.0 |
|
| Liability classified awards (credit) | 3.1 |
| | (1.0 | ) | | (0.5 | ) |
| Total pretax stock-based compensation expense | 13.7 |
| | 9.9 |
| | 10.5 |
|
| Book income tax benefit | (3.5 | ) | | (3.8 | ) | | (3.9 | ) |
| Total stock-based compensation expense, net of tax | $ | 10.2 |
| | $ | 6.1 |
| | $ | 6.6 |
|
As of December 31, 20182019, total unrecognized compensation cost related to restricted stock and restricted stock units of $19.115.9 million and $3.63.0 million related to stock options is expected to be recognized over a weighted average period of approximately 1.71.3 years for restricted stock and restricted stock units and 1.51.3 years for stock options.
Equity Classified Awards - Stock Options
The per share fair values of the stock options granted have been estimated as of the date of grant using the Black-Scholes option pricing model. The Black-Scholes model considers, among other factors, the expected life of the option and the historical volatility of the Company's stock price. The Black-Scholes model meets the requirements of U.S. GAAP, but the fair values generated by the model may not be indicative of the actual fair values of the Company's stock-based awards. The following table summarizes
Dine Brands Global, Inc. and Subsidiaries
Notes to the assumptions used to value options granted in the respective periods:Consolidated Financial Statements (Continued)
14. Stock-Based Incentive Plans (Continued)
The Company granted 223,570132,832 stock options during the year ended December 31, 20182019 for which the fair value was estimated using a Black-Scholes option pricing model. The following table summarizes the assumptions used in the Black-Scholes model:
|
| | | | | | | | | | | |
| | 2019 | | 2018 | | 2017 |
| Risk free interest rate | 2.5 | % | | 2.6 | % | | 1.9 | % |
| Weighted average historical volatility | 30.3 | % | | 26.1 | % | | 22.9 | % |
| Dividend yield | 2.8 | % | | 3.6 | % | | 7.3 | % |
| Expected years until exercise | 4.7 |
| | 4.6 |
| | 4.5 |
|
| Weighted average fair value of options granted | $ | 21.93 |
| | $ | 11.94 |
| | $ | 4.31 |
|
|
| | | | | | | | | | | |
| | 2018 | | 2017 | | 2016 |
| Risk free interest rate | 2.6 | % | | 1.9 | % | | 1.1 | % |
| Weighted average historical volatility | 26.1 | % | | 22.9 | % | | 27.1 | % |
| Dividend yield | 3.6 | % | | 7.3 | % | | 4.0 | % |
| Expected years until exercise | 4.6 |
| | 4.5 |
| | 4.5 |
|
| Weighted average fair value of options granted | $ | 11.94 |
| | $ | 4.31 |
| | $ | 13.55 |
|
Dine Brands Global, Inc. and Subsidiaries
Notes to the Consolidated Financial Statements (Continued)
14. Stock-Based Incentive Plans (Continued)
The Company granted 25,330 performance-based stock options and 55,245 performance-based restricted stock units during the year ended December 31, 2018. The2018, with performance periods ranging from 36 to 40 months. As of December 31, 2019, all of the stock options and 26,670 of the restricted stock units have been forfeited. During the year ended December 31, 2017, the Company granted 350,000 performance-based stock options and 175,000 performance-based restricted stock units duringwith a performance period of approximately 42 months. These performance-based awards can vest from 0% to 100% of the year ended December 31, 2017.award granted depending on the Company's stock price over certain measurement periods. Fair value of these grants was estimated using a Monte Carlo simulation method. The following summarizes the assumptions used in estimating the fair values:
|
| | | | | | |
| | 2018 | 2017 |
| Risk free interest rate | 2.5 | % | 1.6 | % |
| Weighted average historical volatility | 34.4 | % | 30.0 | % |
| Dividend yield | 3.4 | % | 9.6 | % |
| Expected years until exercise | 3.0 |
| 3.4 |
|
| Weighted average fair value of options granted | $ | 9.79 |
| $ | 3.07 |
|
| Weighted average fair value of restricted stock units granted | $ | 53.72 |
| $ | 10.19 |
|
|
| | | | | | |
| | 2018 | 2017 |
| Risk free interest rate | 2.5 | % | 1.6 | % |
| Weighted average historical volatility | 34.4 | % | 30.0 | % |
| Dividend yield | 3.4 | % | 9.6 | % |
| Expected years until exercise | 3.0 |
| 3.4 |
|
| Weighted average fair value of options granted | $ | 9.79 |
| $ | 3.07 |
|
| Weighted average fair value of restricted stock units granted | $ | 53.72 |
| $ | 10.19 |
|
Stock option activity for the years ended December 31, 20182019, 20172018 and 20162017 is summarized as follows:
|
| | | | | | | | | | | | |
| | Number of Shares Under Option | | Weighted Average Exercise Price Per Share | | Weighted Average Remaining Contractual Term (in Years) | | Aggregate Intrinsic Value (in Millions) |
| Outstanding at December 31, 2016 | 701,134 |
| | $ | 80.04 |
| | | | |
|
| Granted | 887,030 |
| | 48.35 |
| | | | |
|
| Exercised | (64,916 | ) | | 40.59 |
| | | | |
|
| Forfeited | (171,847 | ) | | 65.82 |
| | | | |
|
| Expired | (79,353 | ) | | 87.02 |
| | | | |
|
| Outstanding at December 31, 2017 | 1,272,048 |
| | 61.44 |
| | | | |
|
| Granted | 248,899 |
| | 69.12 |
| | | | |
|
| Exercised | (74,930 | ) | | 52.43 |
| | | | |
|
| Forfeited | (6,309 | ) | | 68.80 |
| | | | |
|
| Outstanding at December 31, 2018 | 1,439,708 |
| | 63.21 |
| | | | |
|
| Granted | 132,832 |
| | 98.97 |
| | | | |
|
| Exercised | (211,352 | ) | | 57.36 |
| | | | |
|
| Forfeited | (106,745 | ) | | 72.19 |
| | | | |
|
| Expired | (37,005 | ) | | 93.06 |
| | | | |
|
| Outstanding at December 31, 2019 | 1,217,438 |
| | $ | 66.43 |
| | 5.7 | | $ | 24.1 |
|
| Vested and Expected to Vest at December 31, 2019 | 1,146,329 |
| | $ | 67.06 |
| | 5.6 | | $ | 22.0 |
|
| Exercisable at December 31, 2019 | 561,872 |
| | $ | 77.80 |
| | 3.1 | | $ | 5.9 |
|
|
| | | | | | | | | | | | |
| | Number of Shares Under Option | | Weighted Average Exercise Price Per Share | | Weighted Average Remaining Contractual Term (in Years) | | Aggregate Intrinsic Value (in Millions) |
| Outstanding at December 31, 2015 | 504,462 |
| | $ | 69.99 |
| | | | |
|
| Granted | 255,825 |
| | 90.90 |
| | | | |
|
| Exercised | (48,021 | ) | | 29.33 |
| | | | |
|
| Forfeited | (7,924 | ) | | 94.30 |
| | | | |
|
| Expired | (3,208 | ) | | 89.17 |
| | | | |
|
| Outstanding at December 31, 2016 | 701,134 |
| | 80.04 |
| | | | |
|
| Granted | 887,030 |
| | 48.35 |
| | | | |
|
| Exercised | (64,916 | ) | | 40.59 |
| | | | |
|
| Forfeited | (171,847 | ) | | 65.82 |
| | | | |
|
| Expired | (79,353 | ) | | 87.02 |
| | | | |
|
| Outstanding at December 31, 2017 | 1,272,048 |
| | 61.44 |
| | | | |
|
| Granted | 248,899 |
| | 69.12 |
| | | | |
|
| Exercised | (74,930 | ) | | 52.43 |
| | | | |
|
| Forfeited | (6,309 | ) | | 68.80 |
| | | | |
|
| Expired | — |
| | — |
| | | | |
|
| Outstanding at December 31, 2018 | 1,439,708 |
| | $ | 63.21 |
| | 6.6 | | $ | 15.9 |
|
| Vested and Expected to Vest at December 31, 2018 | 1,301,066 |
| | $ | 64.62 |
| | 6.4 | | $ | 13.4 |
|
| Exercisable at December 31, 2018 | 571,768 |
| | $ | 77.73 |
| | 3.6 | | $ | 2.9 |
|
The total intrinsic value of options exercised during the years ended December 31, 20182019, 2018 and 2017 and 2016 was $6.9 million, $2.4 million and $1.4 million, respectively.
Dine Brands Global, Inc. and $2.7 million, respectively.Subsidiaries
Notes to the Consolidated Financial Statements (Continued)
14. Stock-Based Incentive Plans (Continued)
Cash received from options exercised under all stock-based payment arrangements for the years ended December 31, 20182019, 2018 and 2017 and 2016 was $12.0 million, $3.9 million $2.6 million and $1.4$2.6 million, respectively. The actual tax benefit realized for the tax deduction from option exercises under the stock-based payment arrangements totaled $1.8 million, $0.6 million $0.5 million and $1.0$0.5 million, respectively, for the years ended December 31, 20182019, 20172018 and 2016.
Dine Brands Global, Inc. and Subsidiaries
Notes to the Consolidated Financial Statements (Continued)
14. Stock-Based Incentive Plans (Continued)
2017.
Equity Classified Awards - Restricted Stock and Restricted Stock Units
Activity in equity classified awards of restricted stock and restricted stock units for the years ended December 31, 2019, 2018 2017 and 20162017 is as follows:
|
| | | | | | | | | | | | | |
| |
Shares of Restricted Stock | | Weighted Average Grant-Date Per Share Fair Value | | Restricted Stock Units | | Weighted Average Grant-Date Per Share Fair Value |
| Outstanding at December 31, 2016 | 235,472 |
| | $ | 92.91 |
| | 34,058 |
| | $ | 93.95 |
|
| Granted | 216,269 |
| | 51.89 |
| | 281,973 |
| | 22.37 |
|
| Released | (92,968 | ) | | 88.62 |
| | (12,683 | ) | | 81.63 |
|
| Forfeited | (83,582 | ) | | 79.52 |
| | — |
| | — |
|
| Outstanding at December 31, 2017 | 275,191 |
| | 65.97 |
| | 303,348 |
| | 28.39 |
|
| Granted | 92,466 |
| | 69.20 |
| | 86,990 |
| | 57.21 |
|
| Released | (74,253 | ) | | 81.07 |
| | (15,737 | ) | | 98.54 |
|
| Forfeited | (26,162 | ) | | 61.27 |
| | (72 | ) | | 53.49 |
|
| Outstanding at December 31, 2018 | 267,242 |
| | 64.21 |
| | 374,529 |
| | 31.05 |
|
| Granted | 75,556 |
| | 96.86 |
| | 23,427 |
| | 95.77 |
|
| Released | (76,962 | ) | | 76.25 |
| | (12,347 | ) | | 90.34 |
|
| Forfeited | (41,321 | ) | | 67.20 |
| | (27,802 | ) | | 34.53 |
|
| Outstanding at December 31, 2019 | 224,515 |
| | $ | 70.52 |
| | 357,807 |
| | $ | 30.35 |
|
|
| | | | | | | | | | | | | |
| |
Shares of Restricted Stock | | Weighted Average Grant-Date Per Share Fair Value | | Restricted Stock Units | | Weighted Average Grant-Date Per Share Fair Value |
| Outstanding at December 31, 2015 | 257,594 |
| | $ | 89.99 |
| | 35,116 |
| | $ | 86.30 |
|
| Granted | 88,797 |
| | 88.90 |
| | 13,053 |
| | 90.90 |
|
| Released | (77,712 | ) | | 78.70 |
| | (14,027 | ) | | 72.01 |
|
| Forfeited | (33,207 | ) | | 92.82 |
| | (84 | ) | | 101.25 |
|
| Outstanding at December 31, 2016 | 235,472 |
| | 92.91 |
| | 34,058 |
| | 93.95 |
|
| Granted | 216,269 |
| | 51.89 |
| | 281,973 |
| | 22.37 |
|
| Released | (92,968 | ) | | 88.62 |
| | (12,683 | ) | | 81.63 |
|
| Forfeited | (83,582 | ) | | 79.52 |
| | — |
| | — |
|
| Outstanding at December 31, 2017 | 275,191 |
| | 65.97 |
| | 303,348 |
| | 28.39 |
|
| Granted | 92,466 |
| | 69.20 |
| | 86,990 |
| | 57.21 |
|
| Released | (74,253 | ) | | 81.07 |
| | (15,737 | ) | | 98.54 |
|
| Forfeited | (26,162 | ) | | 61.27 |
| | (72 | ) | | 53.49 |
|
| Outstanding at December 31, 2018 | 267,242 |
| | $ | 63.35 |
| | 374,529 |
| | $ | 31.05 |
|
Liability Classified Awards - Cash-settled Restricted Stock Units
The Company has granted cash-settled restricted stock units to certain employees. These instruments are recorded as liabilities at fair value as of the respective period end.
|
| | | | | | | |
| | | Cash-Settled Restricted Stock Units | | Weighted Average Grant Date Fair Value |
| Outstanding at December 31, 2018 | | 53,766 |
| | $ | 79.07 |
|
| Granted | | 20,989 |
| | 83.58 |
|
| Released | | (462 | ) | | 83.18 |
|
| Forfeited | | (10,441 | ) | | 88.70 |
|
| Outstanding at December 31, 2019 | | 63,852 |
| | $ | 85.63 |
|
For the yearyears ended December 31, 2019 and 2018, 59,686 units were issued, 702 units were vested$1.6 million and 5,218 units were forfeited. At December 31, 2018, there were 53,766 units outstanding. For the year ended December 31, 2018, $0.8 million, respectively, was included as stock-based compensation expense related to cash-settled restricted stock units.
Liability Classified Awards - Long-Term Incentive Awards
The Company has granted cash long-term incentive awards to certain employees (“LTIP awards”). Annual LTIP awards vest over a three-year period and are primarily determined using a multiplier from 0% to 200% of the target award based on (i) the total shareholderstockholder return of the Company's common stock compared to the total shareholderstockholder returns of a peer group of companies.companies and (ii) the percentage increase in the Company's adjusted earnings per share (as defined in the applicable award agreement). Though LTIP awards are only paid in cash, since the multiplier is primarily based on the price of the Company's common stock, the awards are considered stock-based compensation in accordance with U.S. GAAP and are classified as liabilities. For the years ended December 31, 2019 and 2018, expense of $1.7 million and $2.3 million, respectively, was included in stock-based compensation expense related to the LTIP awards. For the yearsyear ended December 31, 2017, and 2016, credits ofa credit $1.0 million and $0.5 million, respectively, werewas included in stock-based compensation expense related to the LTIP awards. At December 31, 20182019 and 2017,2018, liabilities of $2.4$2.9 million and $0.2$2.4 million, respectively, were included as accrued employee compensation and benefits in the Consolidated Balance Sheets.
Dine Brands Global, Inc. and Subsidiaries
Notes to the Consolidated Financial Statements (Continued)
15. Employee Benefit Plans
401(k) Savings and Investment Plan
Effective January 1, 2013, the Company amended the Dine Brands Global, Inc. 401(k) Plan to (i) modify the Company matching formula and (ii) eliminate the one-year completed service requirement that previously had to be met to become eligible for Company matching contributions. As amended, the Company matches 100% of the first four4 percent of the employee's eligible compensation deferral and 50% of the next two2 percent of the employee's eligible compensation deferral. All contributions under this plan vest immediately. Company common stock is not an investment option for employees in the 401(k) Plan, other than shares transferred from a prior employee stock ownership plan. Substantially all of the administrative cost of the 401(k) plan is borne by the Company. The Company's matching contribution expense was $3.0 million, $2.4 million, and $2.3 million and $2.2 million for the years ended December 31, 20182019, 20172018 and 20162017.
Dine Brands Global, Inc. and Subsidiaries
Notes to the Consolidated Financial Statements (Continued)
16. Income Taxes
The provision (benefit) for income taxes for the years ended December 31, 2019, 2018 2017 and 20162017 was as follows: |
| | | | | | | | | | | |
| | Year Ended December 31, |
| | 2019 | | 2018 | | 2017 |
| Provision (benefit) for income taxes: | (In millions) |
| Current | | | | | |
| Federal | $ | 31.2 |
| | $ | 33.6 |
| | $ | 42.6 |
|
| State | 6.5 |
| | 6.4 |
| | 5.1 |
|
| Foreign | 1.9 |
| | 2.1 |
| | 2.9 |
|
| | 39.6 |
| | 42.1 |
| | 50.6 |
|
| Deferred | | | | | |
| Federal | (3.8 | ) | | (7.8 | ) | | (131.0 | ) |
| State | (1.7 | ) | | (4.0 | ) | | (5.1 | ) |
| | (5.5 | ) | | (11.8 | ) | | (136.1 | ) |
| Provision (benefit) for income taxes | $ | 34.1 |
| | $ | 30.3 |
| | $ | (85.6 | ) |
|
| | | | | | | | | | | |
| | Year Ended December 31, |
| | 2018 | | 2017 | | 2016 |
| Provision (benefit) for income taxes: | (In millions) |
| Current | | | | | |
| Federal | $ | 33.6 |
| | $ | 42.6 |
| | $ | 60.8 |
|
| State | 6.4 |
| | 5.1 |
| | 6.4 |
|
| Foreign | 2.1 |
| | 2.9 |
| | 2.3 |
|
| | 42.1 |
| | 50.6 |
| | 69.5 |
|
| Deferred | | | | | |
| Federal | (7.8 | ) | | (131.0 | ) | | (9.5 | ) |
| State | (4.0 | ) | | (5.1 | ) | | (3.2 | ) |
| | (11.8 | ) | | (136.1 | ) | | (12.7 | ) |
| Provision (benefit) for income taxes | $ | 30.3 |
| | $ | (85.6 | ) | | $ | 56.8 |
|
The provision (benefit) for income taxes differs from the expected federal income tax rates as follows:
|
| | | | | | | | |
| | Year Ended December 31, |
| | 2019 | | 2018 | | 2017 |
| Statutory federal income tax rate | 21.0 | % | | 21.0 | % | | 35.0 | % |
| Non-deductibility of goodwill impairment | — |
| | — |
| | (29.3 | ) |
| Change in federal tax rate | — |
| | — |
| | 15.5 |
|
| State and other taxes, net of federal tax benefit | 2.8 |
| | 3.6 |
| | 0.4 |
|
| Change in unrecognized tax benefits | 1.8 |
| | 3.3 |
| | (0.7 | ) |
| Change in valuation allowance | 0.5 |
| | 0.4 |
| | 0.3 |
|
| Domestic production activity deduction | — |
| | — |
| | 0.3 |
|
| Changes in tax rates and state tax laws | (0.5 | ) | | (1.6 | ) | | (0.3 | ) |
| Change in accounting for excess tax deficiencies/benefits | (0.6 | ) | | 0.1 |
| | (0.5 | ) |
| General business credits | (1.3 | ) | | (0.2 | ) | | 0.0 |
|
| Other | 0.9 |
| | 0.8 |
| | (0.7 | ) |
| Effective tax rate | 24.6 | % | | 27.4 | % | | 20.0 | % |
|
| | | | | | | | |
| | Year Ended December 31, |
| | 2018 | | 2017 | | 2016 |
| Statutory federal income tax rate | 21.0 | % | | 35.0 | % | | 35.0 | % |
| Non-deductibility of goodwill impairment | — |
| | (29.3 | ) | | — |
|
| Change in federal tax rate | — |
| | 15.5 |
| | — |
|
| State and other taxes, net of federal tax benefit | 3.6 |
| | 0.4 |
| | 2.7 |
|
| Change in unrecognized tax benefits | 3.3 |
| | (0.7 | ) | | 0.4 |
|
| Change in valuation allowance | 0.4 |
| | 0.3 |
| | — |
|
| Domestic production activity deduction | — |
| | 0.3 |
| | (0.6 | ) |
| Changes in tax rates and state tax laws | (1.6 | ) | | (0.3 | ) | | (1.7 | ) |
| Change in accounting for excess tax deficiencies/benefits | 0.1 |
| | (0.5 | ) | | — |
|
| Other | 0.6 |
| | (0.7 | ) | | 0.2 |
|
| Effective tax rate | 27.4 | % | | 20.0 | % | | 36.0 | % |
The difference in the 2019 overall effective tax rate from the U.S. statutory rate was primarily attributed to state taxes and unrecognized tax benefits offset by benefits associated with an increase in general business credits.
The Company applied a lower state tax rate to the deferred tax balances during fourth quarter of 2018, a result of the state legislative changes and the acquisition of 69 Applebee’s restaurants in December 2018. The change in the state tax rate applied to the deferred tax balances lowered the 2018 effective tax rate by 1.6%.
The Company recognized a $358.2 million impairment of goodwill during the third quarter of 2017 that was not deductible for federal income tax purposes and therefore had no associated tax benefit. The impairment of goodwill lowered the 2017 effective tax rate by 29.3%. Additionally, the Company was required to revalue its deferred taxes at the federal tax rate of 21% in accordance with the Tax Cuts and Jobs Act (the “Tax Act”).Act. The change in the federal tax rate applied to the deferred tax balances increased the 2017 effective tax rate by 15.5%.
The Company applied a lower state tax rate94
Dine Brands Global, Inc. and Subsidiaries
Notes to the deferred tax balances during second quarter of 2016, a result of the consolidation of company offices. The change in the state tax rates applied to the deferred tax balances lowered the 2016 effective tax rate by 1.7%.Consolidated Financial Statements (Continued)
Note 16. Income Taxes (Continued)
The Company files federal income tax returns and the Company or one of its subsidiaries file income tax returns in various state and international jurisdictions. The IRS Examination of tax years 2011 to 2013 concluded during the second quarter of 2019, and the Company received a refund of $13.3 million, inclusive of interest income of $0.9 million. With few exceptions, the Company is no longer subject to federal tax examinations by tax authorities for years before 2014 and state or non-United States tax examinations by tax authorities for years before 2011. The Internal Revenue Service (“IRS”) commenced examination of the Company’s U.S. federal income tax return for the tax years 2011 to 2013 in fiscal year 2016. The examination is anticipated to conclude during fiscal year 2019. The Company continues to believebelieves that adequate reserves have been providedrecorded relating to all matters contained in the tax periods open to examination.
Dine Brands Global, Inc. and Subsidiaries
Notes to the Consolidated Financial Statements (Continued)
Note 16. Income Taxes (Continued)
Net deferred tax assets (liabilities) consisted of the following components:
|
| | | | | | | |
| | 2018 | | 2017 |
| | (In millions) |
| Differences in capitalization and depreciation and amortization of reacquired franchises and equipment | $ | — |
| | $ | — |
|
| Differences in acquisition financing costs | — |
| | 0.1 |
|
| Employee compensation | 9.0 |
| | 7.6 |
|
| Deferred gain on sale of assets | — |
| | 0.7 |
|
| Book/tax difference in revenue recognition | 34.3 |
| | 14.2 |
|
| Other | 16.8 |
| | 42.2 |
|
| Deferred tax assets | 60.1 |
| | 64.8 |
|
| Valuation allowance | (0.4 | ) | | — |
|
| Total deferred tax assets after valuation allowance | 59.7 |
| | 64.8 |
|
| Differences between financial and tax accounting in the recognition of franchise and equipment sales | (16.8 | ) | | (20.7 | ) |
Differences in capitalization and depreciation (1) | (139.2 | ) | | (147.5 | ) |
| Differences in acquisition financing costs | (0.6 | ) | | — |
|
| Book/tax difference in revenue recognition | — |
| | (2.4 | ) |
| Differences between book and tax basis of property and equipment | (8.1 | ) | | (8.5 | ) |
| Other | (0.8 | ) | | (3.5 | ) |
| Deferred tax liabilities | (165.5 | ) | | (182.6 | ) |
| Net deferred tax liabilities | $ | (105.8 | ) | | $ | (117.8 | ) |
|
| | | | | | | |
| | 2019 | | 2018 |
| | (In millions) |
| Employee compensation | $ | 9.2 |
| | $ | 9.0 |
|
| Revenue recognition | 32.8 |
| | 34.3 |
|
| Other | 5.9 |
| | 16.8 |
|
| Deferred tax assets | 47.9 |
| | 60.1 |
|
| Valuation allowance | (1.5 | ) | | (0.4 | ) |
| Total deferred tax assets after valuation allowance | 46.4 |
| | 59.7 |
|
| Recognition of franchise and equipment sales | (13.7 | ) | | (16.8 | ) |
Capitalization and depreciation (1) | (130.8 | ) | | (139.2 | ) |
| Acquisition financing costs | — |
| | (0.6 | ) |
| Basis of property and equipment | — |
| | (8.1 | ) |
| Other | (0.4 | ) | | (0.8 | ) |
| Deferred tax liabilities | (144.9 | ) | | (165.5 | ) |
| Net deferred tax liabilities | $ | (98.5 | ) | | $ | (105.8 | ) |
| |
(1) | Primarily related to the 2007 Applebee's acquisition. |
As of each reporting date, the Company’s management considers new evidence, both positive and negative, that could impact management’s view with regards to future realization of deferred tax assets. As of December 31, 2018,2019, management determined it is more likely than not that the benefit from foreign tax credit carryforward will not be realized. In recognition of this risk, managementthe Company provided a valuation allowance of $0.4$1.5 million on the deferred tax assets related to the foreign tax credit carryforward.
The Company had gross operating loss carryforwards for state tax purposes of $0.4$0.5 million and $0.6$0.4 million as of December 31, 20182019 and 2017,2018, respectively. The net operating loss carryforwards may begin to expire between 2019 and 2035 for state tax purposes.in 2031 if not utilized.
The total gross unrecognized tax benefit as of December 31, 2019 and 2018 and 2017 was $5.2$7.6 million and $5.9$5.2 million, respectively, excluding interest, penalties and related income tax benefits. If recognized, these amounts would affect the Company's effective income tax rates.
The Company estimates the unrecognized tax benefits may decrease over the upcoming 12 months by an amount up to $1.0$1.5 million related to settlements with taxing authorities, and the lapse of statutes of limitations.limitations expirations and method changes. A reconciliation of the beginning and ending amount of unrecognized tax benefits is as follows:
|
| | | | | | | | | | | |
| | Year Ended December 31, |
| | 2019 | | 2018 | | 2017 |
| Unrecognized tax benefit as of January 1 | $ | 5.2 |
| | $ | 5.9 |
| | $ | 3.9 |
|
| Changes for tax positions of prior years | 2.1 |
| | 3.8 |
| | 2.8 |
|
| Increases for tax positions related to the current year | 0.5 |
| | 0.4 |
| | 0.6 |
|
| Decreases relating to settlements and lapsing of statutes of limitations | (0.2 | ) | | (4.9 | ) | | (1.4 | ) |
| Unrecognized tax benefit as of December 31 | $ | 7.6 |
| | $ | 5.2 |
| | $ | 5.9 |
|
|
| | | | | | | | | | | |
| | Year Ended December 31, |
| | 2018 | | 2017 | | 2016 |
| Unrecognized tax benefit as of January 1 | $ | 5.9 |
| | $ | 3.9 |
| | $ | 3.9 |
|
| Changes for tax positions of prior years | 3.8 |
| | 2.8 |
| | 0.6 |
|
| Increases for tax positions related to the current year | 0.4 |
| | 0.6 |
| | 0.1 |
|
| Decreases relating to settlements and lapsing of statutes of limitations | (4.9 | ) | | (1.4 | ) | | (0.7 | ) |
| Unrecognized tax benefit as of December 31 | $ | 5.2 |
| | $ | 5.9 |
| | $ | 3.9 |
|
As of December 31, 2018,2019, the accrued interest was $1.1$2.5 million and accrued penalties were less than $0.1 million, excluding any related income tax benefits. As of December 31, 2017,2018, the accrued interest and penalties were $1.1 million and less than $0.1 million, respectively, excluding any related income tax benefits. The Company recognizes interest accrued related to unrecognized tax benefits and penalties as a component of the income tax provision recognized in the Consolidated Statements of Comprehensive Income (Loss) Income..
Dine Brands Global, Inc. and Subsidiaries
Notes to the Consolidated Financial Statements (Continued)
17. Net Income (Loss) Per Share
The computation of the Company's basic and diluted net income (loss) per share is as follows:
|
| | | | | | | | | | | |
| | Year Ended December 31, |
| | 2019 | | 2018 | | 2017 |
| | (In thousands, except per share data) |
| Numerator for basic and diluted income (loss) per common share: | | | | | |
| Net income (loss) | $ | 104,346 |
| | $ | 80,354 |
| | $ | (342,750 | ) |
| Less: Net (income) loss allocated to unvested participating restricted stock | (3,532 | ) | | (2,711 | ) | | 6,768 |
|
| Net income (loss) available to common stockholders - basic | 100,814 |
| | 77,643 |
| | (335,982 | ) |
| Effect of unvested participating restricted stock | 33 |
| | 16 |
| | — |
|
| Numerator - net income (loss) available to common shareholders - diluted | $ | 100,847 |
| | $ | 77,659 |
| | $ | (335,982 | ) |
| Denominator: | | | | | |
| Weighted average outstanding shares of common stock - basic | 16,934 |
| | 17,533 |
| | 17,725 |
|
| Effect of dilutive securities: | | | | | |
Stock options(1) | 311 |
| | 256 |
| | 15 |
|
| Weighted average outstanding shares of common stock - diluted | 17,245 |
| | 17,789 |
| | 17,740 |
|
| Net income (loss) per common share: | | | | | |
| Basic | $ | 5.95 |
| | $ | 4.43 |
| | $ | (18.96 | ) |
| Diluted | $ | 5.85 |
| | $ | 4.37 |
| | $ | (18.96 | ) |
|
| | | | | | | | | | | |
| | Year Ended December 31, |
| | 2018 | | 2017 | | 2016 |
| | (In thousands, except per share data) |
| Numerator for basic and diluted income per common share: | | | | | |
| Net income (loss) | $ | 80,354 |
| | $ | (342,750 | ) | | $ | 101,002 |
|
| Less: Net (income) loss allocated to unvested participating restricted stock | (2,711 | ) | | 6,768 |
| | (1,430 | ) |
| Net income (loss) available to common stockholders - basic | 77,643 |
| | (335,982 | ) | | 99,572 |
|
| Effect of unvested participating restricted stock | 16 |
| | — |
| | 2 |
|
| Numerator - net income (loss) available to common shareholders - diluted | $ | 77,659 |
| | $ | (335,982 | ) | | $ | 99,574 |
|
| | | | | | |
| Denominator: | | | | | |
| Weighted average outstanding shares of common stock - basic | 17,533 |
| | 17,725 |
| | 18,030 |
|
| Effect of dilutive securities: | | | | | |
| Stock options | 256 |
| | 15 |
| | 95 |
|
| Weighted average outstanding shares of common stock - diluted | 17,789 |
| | 17,740 |
| | 18,125 |
|
| Net income (loss) per common share: | | | | | |
| Basic | $ | 4.43 |
| | $ | (18.96 | ) | | $ | 5.52 |
|
| Diluted | $ | 4.37 |
| | $ | (18.96 | ) | | $ | 5.49 |
|
(1) Stock options were not included in the calculation for the year ended December 31, 2017 as they were antidilutive.
18. Acquisition of Business
In December 2018, the Company acquired 69 Applebee's restaurants in North Carolina and South Carolina from an Applebee's franchisee for a total purchase price of $21.6 million. The Company entered into the transaction to resolve certain franchisee health issues in what the Company believes was the most expedient and favorable wasmanner for the Company. Indirect costs of $1.1 million related to the transaction were charged as general and administrative expenses.
The following table summarizesA preliminary purchase price allocation was made as of December 31, 2018. During 2019, the Company completed the calculation of deferred income taxes related to the transaction and adjusted the preliminary estimated fair values of the assets acquired and liabilities assumed at the acquisition date:purchase price allocation as follows:
| | | | 2018 | Preliminary Allocation | | Adjustments | | Final Allocation |
| | (In millions) | (In millions) |
| Reacquired franchise rights | $ | 11.6 |
| $ | 11.6 |
| | $ | — |
| | $ | 11.6 |
|
| Equipment and fixtures | 10.0 |
| 10.0 |
| | — |
| | 10.0 |
|
| Inventory | 1.4 |
| 1.4 |
| | — |
| | 1.4 |
|
| Deferred income taxes | | — |
| | 1.5 |
| | 1.5 |
|
| Total identifiable assets acquired | 23.0 |
| 23.0 |
| | 1.5 |
| | 24.5 |
|
| | | | | | | |
| Above-market leaseholds, net | (6.5 | ) | (6.5 | ) | | — |
| | (6.5 | ) |
| Other liabilities | (1.0 | ) | (1.0 | ) | | — |
| | (1.0 | ) |
| Net identifiable assets acquired | 15.5 |
| 15.5 |
| | 1.5 |
| | 17.0 |
|
| Goodwill | 6.1 |
| 6.1 |
| | (1.5 | ) | | 4.6 |
|
| Consideration transferred | $ | 21.6 |
| $ | 21.6 |
| | $ | — |
| | $ | 21.6 |
|
In conjunction with the acquisition, the Company assumed finance lease obligations and related property under finance leases of $9.1 million. The Company also entered into new finance leases totaling $28.1 million of property under finance leases and finance lease obligations. The net liability for above-market leaseholds in included in other non-current liabilities in the Consolidated Balance Sheet and will beis being amortized over a weighted average life of 11 years.
The purchase price allocation is preliminary, subject to finalization of certain transition cut-off adjustments typical with transactions of this nature. There are no significant unresolved contingencies. The Company does not expect there will be material adjustments to the preliminary purchase price allocation.
The results of operation of these restaurants are included in the Company's consolidated results from the acquisition date. The Company has not presented pro forma results of the restaurants for periods prior to the acquisition because the business is not considered significant as measured by the amount of the Company's investment in and assets of the business relative to the Company's consolidated balance sheetConsolidated Balance Sheet and by the income before income taxes of the business relative to the Company's average income before income taxes for the most recent five-year period excluding loss years.
Dine Brands Global, Inc. and Subsidiaries
Notes to the Consolidated Financial Statements (Continued)
19. Segment Reporting
Information on segments and a reconciliation of gross profit to income before income tax provision is as follows:
|
| | | | | | | | | | | |
| | Year Ended December 31, |
| | 2019 | | 2018 | | 2017 |
| Revenues | | | (In millions) | | |
| Franchise operations | $ | 651.2 |
| | $ | 643.9 |
| | $ | 594.4 |
|
| Rental operations | 120.7 |
| | 121.9 |
| | 121.4 |
|
| Company restaurants | 131.2 |
| | 7.1 |
| | 7.5 |
|
| Financing operations | 7.1 |
| | 8.0 |
| | 8.4 |
|
| Total | $ | 910.2 |
| | $ | 780.9 |
| | $ | 731.7 |
|
| | | | | | |
| Gross profit (loss), by segment | | | | | |
| Franchise operations | $ | 338.4 |
| | $ | 313.3 |
| | $ | 300.4 |
|
| Rental operations | 29.9 |
| | 31.2 |
| | 30.8 |
|
| Company restaurants | 8.0 |
| | 1.2 |
| | (0.3 | ) |
| Financing operations | 6.5 |
| | 7.4 |
| | 7.8 |
|
| Total gross profit | 382.8 |
| | 353.1 |
| | 338.7 |
|
| Corporate and unallocated expenses, net | (244.3 | ) | | (242.5 | ) | | (767.0 | ) |
| Income (loss) before income taxes | $ | 138.5 |
| | $ | 110.6 |
| | $ | (428.3 | ) |
| | | | | | |
| Interest expense | | | | | |
| Rental operations | $ | 7.7 |
| | $ | 9.2 |
| | $ | 10.5 |
|
| Company restaurants | 2.1 |
| | 0.1 |
| | 0.2 |
|
| Corporate | 60.4 |
| | 61.7 |
| | 62.0 |
|
| Total | $ | 70.2 |
| | $ | 71.0 |
| | $ | 72.7 |
|
| | | | | | |
| Depreciation and amortization | | | | | |
| Franchise operations | $ | 10.3 |
| | $ | 10.5 |
| | $ | 10.8 |
|
| Rental operations | 13.4 |
| | 11.7 |
| | 12.0 |
|
| Company restaurants | 6.4 |
| | 0.4 |
| | 0.1 |
|
| Corporate | 12.4 |
| | 9.6 |
| | 7.7 |
|
| Total | $ | 42.5 |
| | $ | 32.2 |
| | $ | 30.6 |
|
| | | | | | |
| Impairment of goodwill and intangible assets, closure and other impairment charges | | | | | |
| Franchise operations | $ | — |
| | $ | — |
| | $ | 531.6 |
|
| Company restaurants | 1.5 |
| | 2.1 |
| | 4.0 |
|
| Total | $ | 1.5 |
| | $ | 2.1 |
| | $ | 535.6 |
|
| | | | | | |
| Capital expenditures | | | | | |
| Franchise operations | $ | 0.6 |
| | $ | — |
| | $ | — |
|
| Company restaurants | $ | 3.2 |
| | $ | — |
| | $ | 0.1 |
|
| Corporate | 15.6 |
| | 14.3 |
| | 13.3 |
|
| Total | $ | 19.4 |
| | $ | 14.3 |
| | $ | 13.4 |
|
| | | | | | |
Goodwill (franchise segment) | $ | 343.9 |
| | $ | 345.3 |
| | $ | 339.2 |
|
| | | | | | |
| Total assets | | | | | |
| Franchise operations | $ | 1,116.2 |
| | $ | 1,152.1 |
| | $ | 1,188.0 |
|
| Rental operations | 503.8 |
| | 255.6 |
| | 278.8 |
|
| Company restaurants | 134.3 |
| | 66.5 |
| | — |
|
| Financing operations | 72.0 |
| | 73.7 |
| | 87.5 |
|
| Corporate | 223.2 |
| | 226.8 |
| | 181.3 |
|
| Total | $ | 2,049.5 |
| | $ | 1,774.7 |
| | $ | 1,735.6 |
|
|
| | | | | | | | | | | |
| | Year Ended December 31, |
| | 2018 | | 2017 | | 2016 |
| | | | (as adjusted) |
| Revenues | | | (In millions) | | |
| Franchise operations | $ | 643.9 |
| | $ | 594.4 |
| | $ | 638.0 |
|
| Rental operations | 121.9 |
| | 121.4 |
| | 123.0 |
|
| Company restaurants | 7.1 |
| | 7.5 |
| | 17.4 |
|
| Financing operations | 8.0 |
| | 8.4 |
| | 9.2 |
|
| Total | $ | 780.9 |
| | $ | 731.7 |
| | $ | 787.6 |
|
| | | | | | |
| Gross profit (loss), by segment | | | | | |
| Franchise operations | $ | 313.3 |
| | $ | 300.4 |
| | $ | 344.5 |
|
| Rental operations | 31.2 |
| | 30.8 |
| | 31.5 |
|
| Company restaurants | 1.2 |
| | (0.3 | ) | | (0.8 | ) |
| Financing operations | 7.4 |
| | 7.8 |
| | 9.0 |
|
| Total gross profit | 353.1 |
| | 338.7 |
| | 384.2 |
|
| Corporate and unallocated expenses, net | (242.5 | ) | | (767.0 | ) | | (226.3 | ) |
| Income (loss) before income taxes | $ | 110.6 |
| | $ | (428.3 | ) | | $ | 157.9 |
|
| | | | | | |
| Interest expense | | | | | |
| Rental operations | $ | 9.2 |
| | $ | 10.5 |
| | $ | 11.8 |
|
| Company restaurants | 0.1 |
| | 0.2 |
| | 0.4 |
|
| Corporate | 61.7 |
| | 62.0 |
| | 61.5 |
|
| Total | $ | 71.0 |
| | $ | 72.7 |
| | $ | 73.7 |
|
| | | | | | |
| Depreciation and amortization | | | | | |
| Franchise operations | $ | 10.5 |
| | $ | 10.8 |
| | $ | 10.6 |
|
| Rental operations | 11.7 |
| | 12.0 |
| | 12.4 |
|
| Company restaurants | 0.4 |
| | 0.1 |
| | 0.4 |
|
| Corporate | 9.6 |
| | 7.7 |
| | 7.2 |
|
| Total | $ | 32.2 |
| | $ | 30.6 |
| | $ | 30.6 |
|
| | | | | | |
| Impairment of goodwill and intangible assets, closure and other impairment charges | | | | | |
| Franchise operations | $ | — |
| | $ | 531.6 |
| | $ | — |
|
| Company restaurants | 2.1 |
| | 4.0 |
| | 2.2 |
|
| Corporate | — |
| | — |
| | 2.9 |
|
| Total | $ | 2.1 |
| | $ | 535.6 |
| | $ | 5.1 |
|
| | | | | | |
| Capital expenditures | | | | | |
| Company restaurants | $ | — |
| | $ | 0.1 |
| | $ | 0.3 |
|
| Corporate | 14.3 |
| | 13.3 |
| | 5.3 |
|
| Total | $ | 14.3 |
| | $ | 13.4 |
| | $ | 5.6 |
|
| | | | | | |
Goodwill (franchise segment) | $ | 345.3 |
| | $ | 339.2 |
| | $ | 697.4 |
|
| | | | | | |
| Total assets | | | | | |
| Franchise operations | $ | 1,152.1 |
| | $ | 1,188.0 |
| | $ | 1,608.7 |
|
| Rental operations | 255.6 |
| | 278.8 |
| | 339.5 |
|
| Company restaurants | 66.5 |
| | — |
| | 126.8 |
|
| Financing operations | 73.7 |
| | 87.5 |
| | 88.2 |
|
| Corporate | 226.8 |
| | 181.3 |
| | 115.4 |
|
| Total | $ | 1,774.7 |
| | $ | 1,735.6 |
| | $ | 2,278.6 |
|
Dine Brands Global, Inc. and Subsidiaries
Notes to the Consolidated Financial Statements (Continued)
20. Refranchising of Company-operated Restaurants
In June 2017, the Company completed the refranchising and sale of related restaurant assets of nine9 company-operated IHOP restaurants in the Cincinnati, Ohio market area. As part of the transaction, the Company entered into an asset purchase agreement, nine9 franchise agreements and nine9 sublease agreements for land and buildings. The Company compared the stated rent under the sublease agreements with comparable market rents and recorded net favorable lease assets of $2.4$2.3 million in connection with the transaction. The Company also received cash of $1.1 million and a note receivable for $4.8 million. After allocating a portion of the consideration to franchise fees and derecognizing the assets sold, the Company recognized a gain of $6.2 million on the refranchising and sale of related restaurant assets during the year ended December 31, 2017.
21. Selected Quarterly Financial Data (Unaudited)
| | | | Revenues | | Gross Profit | | Net Income (Loss) | | Net Income (Loss) Per Share— Basic(3) | | Net Income (Loss) Per Share— Diluted(3) | Revenues | | Gross Profit | | Net Income (Loss) | | Net Income Per Share— Basic(1) | | Net Income Per Share— Diluted(1) |
| | (In thousands, except per share amounts) | (In thousands, except per share amounts) |
| 2018 | | | | | | | | | | |
| 2019 | | | | | | | | | | |
1st Quarter | $ | 188,163 |
| | $ | 83,500 |
| | $ | 17,073 |
| | $ | 0.93 |
| | $ | 0.92 |
| $ | 237,182 |
| | $ | 102,571 |
| | $ | 31,643 |
| | $ | 1.76 |
| | $ | 1.73 |
|
2nd Quarter | 184,471 |
| | 78,590 |
| | 12,713 |
| | 0.70 |
| | 0.69 |
| 228,080 |
| | 94,855 |
| | 21,390 |
| | 1.20 |
| | 1.18 |
|
3rd Quarter(1) | 194,099 |
| | 92,626 |
| | 23,587 |
| | 1.31 |
| | 1.29 |
| 217,405 |
| | 89,720 |
| | 23,917 |
| | 1.38 |
| | 1.36 |
|
4th Quarter | 214,198 |
| | 98,371 |
| | 26,981 |
| | 1.49 |
| | 1.47 |
| 227,511 |
| | 95,668 |
| | 27,396 |
| | 1.61 |
| | 1.59 |
|
| 2017 | | | | | | | | | | |
| 2018 | | | | | | | | | | |
1st Quarter (1) | $ | 191,461 |
| | $ | 94,285 |
| | $ | 15,595 |
| | $ | 0.87 |
| | $ | 0.86 |
| $ | 188,163 |
| | $ | 83,500 |
| | $ | 17,073 |
| | $ | 0.93 |
| | $ | 0.92 |
|
2nd Quarter (1) | 188,654 |
| | 93,004 |
| | 22,107 |
| | 1.23 |
| | 1.23 |
| 184,471 |
| | 78,590 |
| | 12,713 |
| | 0.70 |
| | 0.69 |
|
3rd Quarter (1) (2) | 174,903 |
| | 82,086 |
| | (450,352 | ) | | (24.91 | ) | | (24.91 | ) | |
3rd Quarter | | 194,099 |
| | 92,626 |
| | 23,587 |
| | 1.31 |
| | 1.29 |
|
4th Quarter (1) | 176,708 |
| | 69,336 |
| | 69,900 |
| | 3.82 |
| | 3.82 |
| 214,198 |
| | 98,371 |
| | 26,981 |
| | 1.49 |
| | 1.47 |
|
(1) 2017 amounts restated for the adoption of ASC 606 on a full retrospective basis. See Note 2 - Basis of Presentation and Summary of Significant Accounting Policies, of Notes to the Consolidated Financial Statements.
(2)The Company recognized a pretax charge of $531.6 million for impairment of goodwill and intangible assets in the third quarter of 2017. See Note 6 - Goodwill and Note 7 - Other Intangible Assets, of Notes to the Consolidated Financial Statements.
(3)The quarterly amounts of earnings per share may not add to the full year amount as each quarterly calculation is discrete from the full-year calculation.
Item 9. Changes in and Disagreements with Accountants on Accounting and Financial Disclosure.
None.
Item 9A. Controls and Procedures.
Evaluation of Disclosure Controls and Procedures
We maintain “disclosure controls and procedures,” as such terms are defined in Rule 13a-15(e) and 15d-15(e) promulgated under the Exchange Act of 1934, as amended, that are designed to ensure that information required to be disclosed by us in reports that we file or submit under the Exchange Act is recorded, processed, summarized and reported within the time periods specified in SEC rules and forms, and that such information is accumulated and communicated to our management, including our Chief Executive Officer and Chief Financial Officer, as appropriate to allow timely decisions regarding required disclosure. In designing and evaluating our disclosure controls and procedures, management recognized that disclosure controls and procedures, no matter how well conceived and operated, can provide only reasonable, not absolute, assurance that the objectives of the disclosure controls and procedures are met. Additionally, in designing disclosure controls and procedures, our management necessarily was required to apply its judgment in evaluating the cost-benefit relationship of possible disclosure controls and procedures. The design of any disclosure controls and procedures also is based in part upon certain assumptions about the likelihood of future events, and there can be no assurance that any design will succeed in achieving its stated goals under all potential future conditions.
Based on their assessment as of the end of the period covered by this report, our Chief Executive Officer and Chief Financial Officer have concluded that our disclosure controls and procedures were effective at the reasonable assurance level.
Management's Report on Internal Control Over Financial Reporting
Our management is responsible for establishing and maintaining adequate internal control over financial reporting, as defined in Exchange Act Rules 13a-15(f) and 15d-15(f). All internal control systems, no matter how well designed, have inherent limitations. Therefore, even those systems determined to be effective can provide only reasonable assurance with respect to financial statement preparation and presentation.
Under the supervision and with the participation of our management, including our Chief Executive Officer and Chief Financial Officer, we conducted an evaluation of the effectiveness of our internal control over financial reporting as of December 30, 201829, 2019 based on the framework in Internal Control—Integrated Framework (2013) issued by the Committee of Sponsoring Organizations of the Treadway Commission (“COSO”). Based on that evaluation, our management concluded that our internal control over financial reporting was effective as of December 30, 2018.29, 2019.
The effectiveness of our internal control over financial reporting as of December 30, 201829, 2019 has been audited by Ernst & Young LLP, an independent registered public accounting firm, as stated in their report that appears herein.
Report of Independent Registered Public Accounting Firm
To the ShareholdersStockholders and the Board of Directors of Dine Brands Global, Inc. and Subsidiaries
Opinion on Internal Control over Financial Reporting
We have audited Dine Brands Global, Inc. and Subsidiaries’ internal control over financial reporting as of December 30, 2018,29, 2019, based on criteria established in Internal Control-Integrated Framework issued by the Committee of Sponsoring Organizations of the Treadway Commission (2013 framework) (the COSO criteria). In our opinion, Dine Brands Global, Inc. and Subsidiaries (the Company) maintained, in all material respects, effective internal control over financial reporting as of December 30, 2018,29, 2019, based onthe COSO criteria.criteria.
We also have audited, in accordance with the standards of the Public Company Accounting Oversight Board (United States) (PCAOB), the 20182019 consolidated financial statements of the Company and our report dated February 21, 201924, 2020 expressed an unqualified opinion thereon.
Basis for Opinion
The Company’s management is responsible for maintaining effective internal control over financial reporting and for its assessment of the effectiveness of internal control over financial reporting included in the accompanying ManagementManagement’s Report on Internal Control over Financial Reporting. Our responsibility is to express an opinion on the Company’s internal control over financial reporting based on our audit. We are a public accounting firm registered with the PCAOB and are required to be independent with respect to the Company in accordance with the U.S. federal securities laws and the applicable rules and regulations of the Securities and Exchange Commission and the PCAOB.
We conducted our audit in accordance with the standards of the PCAOB. Those standards require that we plan and perform the audit to obtain reasonable assurance about whether effective internal control over financial reporting was maintained in all material respects.
Our audit included obtaining an understanding of internal control over financial reporting, assessing the risk that a material weakness exists, testing and evaluating the design and operating effectiveness of internal control based on the assessed risk, and performing such other procedures as we considered necessary in the circumstances. We believe that our audit provides a reasonable basis for our opinion.
Definition and Limitations of Internal Control Over Financial Reporting
A company’s internal control over financial reporting is a process designed to provide reasonable assurance regarding the reliability of financial reporting and the preparation of financial statements for external purposes in accordance with generally accepted accounting principles. A company’s internal control over financial reporting includes those policies and procedures that (1) pertain to the maintenance of records that, in reasonable detail, accurately and fairly reflect the transactions and dispositions of the assets of the company; (2) provide reasonable assurance that transactions are recorded as necessary to permit preparation of financial statements in accordance with generally accepted accounting principles, and that receipts and expenditures of the company are being made only in accordance with authorizations of management and directors of the company; and (3) provide reasonable assurance regarding prevention or timely detection of unauthorized acquisition, use, or disposition of the company’s assets that could have a material effect on the financial statements.
Because of its inherent limitations, internal control over financial reporting may not prevent or detect misstatements. Also, projections of any evaluation of effectiveness to future periods are subject to the risk that controls may become inadequate because of changes in conditions, or that the degree of compliance with the policies or procedures may deteriorate.
/s/ ERNST & YOUNG LLP
Los Angeles, California
February 21, 201924, 2020
Changes in Internal Control Over Financial Reporting
There was no change in our internal control over financial reporting that occurred during the fourth quarter of fiscal 20182019 that has materially affected, or is reasonably likely to materially affect, our internal control over financial reporting.
Item 9B. Other Information.
None.
PART III
Item 10. Directors, Executive Officers and Corporate Governance.
The information included in the sections entitled “Corporate Governance” and “Executive Compensation-Executive Officers of the Corporation” and “Section 16(a) Beneficial Ownership Reporting Compliance” to be set forth in our Proxy Statement for the 20192020 Annual Meeting of Shareholders (“20192020 Proxy Statement”) is hereby incorporated by reference into this Item.
Item 11. Executive Compensation.
The information required included in the sections entitled “Executive Compensation” and “Director Compensation” to be set forth in our 20192020 Proxy Statement is hereby incorporated by reference into this item.Item.
Item 12. Security Ownership of Certain Beneficial Owners and Management and Related Stockholder Matters.
The information required by Item 12 with respect to securities authorized for issuance under our equity compensation plans is provided under the caption “Equity Compensation Plan Information” in Part II, Item 5 hereof and incorporated herein by reference. The information included in the section entitled “Security Ownership of Certain Beneficial Owners and
Management” to be set forth in our 20192020 Proxy Statement is also hereby incorporated by reference into this Item,Item.
.
Securities Authorized for Issuance Under Equity Compensation Plans
The following table provides information as of December 31, 2019, regarding shares outstanding and available for issuance under the Dine Brands Global, Inc. 2019 Stock Incentive Plan (the “2019 Plan”): |
| | | | | | | | | |
| Plan Category | Number of securities to be issued upon exercise of outstanding options, warrants and rights | | Weighted average exercise price of outstanding options, warrants and rights | | Number of securities remaining available for future issuance under equity compensation plans (excluding securities reflected in column (a)) |
| (a) | | (b) | | (c) |
| Equity compensation plans approved by security holders | 1,217,438 |
| | $ | 66.43 |
| | 2,427,518 |
|
| Equity compensation plans not approved by security holders | — |
| | — |
| | — |
|
| Total | 1,217,438 |
| | $ | 66.43 |
| | 2,427,518 |
|
The number of securities remaining available for future issuance represents shares under the 2019 Plan. Please refer to Note 14 - Stock-Based Incentive Plans, of the Notes to the Consolidated Financial Statements for a description of the 2019 Plan.
Item 13. Certain Relationships and Related Transactions, and Director Independence.
The information included in the sections entitled “Corporate Governance—Certain Relationships and Related Transactions” and “Corporate Governance—Director Independence” to be set forth in our 20192020 Proxy Statement is hereby incorporated by reference into this item.
Item 14. Principal Accountant Fees and Services.
The information included in the section entitled “Audit-Related Matters” to be set forth in our 20192020 Proxy Statement is hereby incorporated by reference into this item.
PART IV
Item 15. Exhibits and Financial Statement Schedules.
(a)(1) Consolidated Financial Statements
The following documents are contained in Part II, Item 8 of this Annual Report on Form 10-K:
Reports of Independent Registered Public Accounting Firm.
Consolidated Balance Sheets as of December 31, 2018 and December 31, 2017.
| |
| • | Consolidated Balance Sheets as of December 31, 2019 and December 31, 2018. |
Consolidated Statements of Comprehensive Income (Loss) for each of the three years in the period ended
December 31, 20182019.
Consolidated Statements of Stockholders' (Deficit) Equity for each of the three years in the period ended
December 31, 20182019.
Consolidated Statements of Cash Flows for each of the three years in the period ended December 31, 2018.
| |
| • | Consolidated Statements of Cash Flows for each of the three years in the period ended December 31, 2019. |
Notes to the Consolidated Financial Statements.
(a)(2) Financial Statement Schedules
All schedules are omitted because they are not applicable or the required information is shown in the consolidated financial statements or notes thereto.
(a)(3) Exhibits
Exhibits that are not filed herewith have been previously filed with the Securities and Exchange Commission and are incorporated herein by reference.
|
| | |
| 3.1 |
| |
| 3.2 |
| |
| 3.3 |
| |
| 4.1 |
| Base Indenture, dated as of September 30, 2014, and amended and restated as of June 5, 2019, among Applebee’s Funding LLC and IHOP Funding LLC, each as Co-Issuer, and Citibank, N.A., as Trustee and Securities Intermediary (Exhibit 4.1 to Registrant's Form 8-K filed on October 3, 2014June 5, 2019 is incorporated herein by reference). |
| 4.2 |
| SupplementalSeries 2019-1 Supplement to Base Indenture, dated as of September 30, 2014,June 5, 2019, among Applebee’s Funding LLC and IHOP Funding LLC, each as Co-Issuer, and Citibank, N.A., as Trustee and Series 2014-1 Securities Intermediary (Exhibit 4.2 to Registrant’s Form 8-K filed on October 3, 2014June 5, 2019 is incorporated herein by reference). |
| *4.3 |
| |
| †#10.1 |
| |
| †#10.2 |
| |
| †#10.3 |
| |
| †10.4 |
| |
| †10.5 |
| |
| †10.6 |
| |
|
| | |
| †10.7 |
| |
| †10.8 |
| |
| †10.9 |
| |
†10.910.10 |
| |
| †10.11 |
| |
| †10.12 |
| |
| †10.13 |
| |
| †10.14 |
| |
| †10.15 |
| |
| †10.16 |
| |
| †10.17 |
| |
| †10.18 |
| |
| †10.19 |
| |
| †10.20 |
| |
| †10.21 |
| |
| †10.22 |
| |
†10.1010.23 |
| |
†10.1110.24 |
| |
†10.1210.25 |
| |
†10.1310.26 |
| |
|
| | |
†10.1410.27 |
| |
†10.1510.28 |
| |
†10.1610.29 |
| |
†10.1710.30 |
| |
†10.1810.31 |
| |
†10.1910.32 |
| |
†10.2010.33 |
| |
*†10.2110.34 |
| |
†10.2210.35 |
| |
†10.2310.36 |
| |
���10.24†10.37 |
| |
†10.2510.38 |
| |
†10.2610.39 |
| |
†10.2710.40 |
| |
|
| | |
†10.2810.41 |
| |
*†10.2910.42 |
| |
†10.3010.43 |
| |
†10.3110.44 |
| |
*†10.3210.45 |
| |
†10.3310.46 |
| |
†10.3410.47 |
| |
|
| | |
†10.3510.48 |
| |
†10.3610.49 |
| |
†10.3710.50 |
| |
*†10.3810.51 |
| |
†10.3910.52 |
| |
†10.4010.53 |
| |
| †10.54 |
| |
†10.4110.55 |
| |
†10.4210.56 |
| |
†10.4310.57 |
| |
†10.4410.58 |
| |
†10.4510.59 |
| |
†10.4610.60 |
| |
†10.4710.61 |
| |
†10.4810.62 |
| |
†10.4910.63 |
| |
|
| | |
†10.5010.64 |
| |
*†10.5110.65 |
| |
†10.5210.66 |
| |
*†10.5310.67 |
| |
*†10.5410.68 |
| |
10.5510.69 |
| |
10.56 |
|
| |
| 10.70 |
| Class A-1 Note Purchase Agreement, dated SeptemberJune 5, 2018,2019, among Applebee’s Funding LLC and IHOP Funding LLC, each a Co-Issuer, certain special-purpose, wholly-owned indirect subsidiaries of the Corporation,Registrant, each as a Guarantor, the Corporation,Registrant, as manager, certain conduit investors, financial institutions and funding agents, Barclays Bank PLC as provider of letters credit and swingline lender and as administrative agent (Exhibit 10.1 to Registrant’s Form 8-K filed on September 6, 2018June 5, 2019 is incorporated herein by reference). |
10.5710.71 |
| Guarantee and Collateral Agreement, dated September 30, 2014, and amended and restated as of June 5, 2019, among certain special-purpose, wholly-owned indirect subsidiaries of the Registrant, each as guarantor, in favor of Citibank, N.A., as Trustee (Exhibit 10.2 to Registrant’s Form 8-K filed on October 3, 2014June 5, 2019 is incorporated herein by reference.)reference). |
10.5810.72 |
| Amended and Restated Management Agreement, dated September 30, 2014, and amended and restated as of September 5, 2018, and further amended and restated as of June 5, 2019, among Applebee’s Funding LLC and IHOP Funding LLC, each a Co-Issuer, other securitization entities party thereto from time to time, the Corporation,Registrant, Applebee’s Services, Inc. and International House of Pancakes, LLC as Sub-managers and Citibank, N.A., as Trustee (Exhibit 10.210.3 to Registrant’s Form 8-K filed on September 6, 2018June 5, 2019 is incorporated herein by reference). |
| *10.73 |
| |
| †10.74 |
| |
| *†10.75 |
| |
| *21 |
| |
| *23.1 |
| |
| *31.1 |
| |
| *31.2 |
| |
| *32.1 |
| |
| *32.2 |
| |
| 101.INS |
| XBRL Instance Document - the instance document does not appear in the Interactive Data File because its XBRL tags are embedded within the Inline XBRL document. |
| 101.SCH |
| Inline XBRL Schema Document.*** |
| 101.CAL |
| Inline XBRL Calculation Linkbase Document.*** |
| 101.DEF |
| Inline XBRL Definition Linkbase Document.*** |
| 101.LAB |
| Inline XBRL Label Linkbase Document.*** |
| 101.PRE |
| Inline XBRL Presentation Linkbase Document.*** |
| 104 |
| Cover page Interactive Data File (formatted as Inline XBRL and contained in Exhibit 101) |
| |
| ** | The certifications attached as Exhibits 32.1 and 32.2 accompany this Quarterly Report pursuant to Section 906 of the Sarbanes-Oxley Act of 2002 and shall not, except to the extent required by the Sarbanes-Oxley Act of 2002, be deemed filed by the Company for purposes of Section 18 of the Securities Exchange Act of 1934, as amended. |
| |
*** | Pursuant to Rule 406T of Regulation S-T, the interactive data files on Exhibit 101 and 104 hereto are deemed not filed or part of a registration statement or prospectus for purposes of Section 11 or 12 of the Securities Act of 1933, as amended, are deemed not filed for purposes of Section 18 of the Securities and Exchange Act of 1934, as amended, and otherwise are not subject to liability under those sections. |
| |
| † | A contract, compensatory plan or arrangement in which directors or executive officers are eligible to participate. |
| |
| # | Portions of this exhibit have been omitted per an Order Granting Confidential Treatment Under the Securities Exchange Act of 1934 issued by the Securities and Exchange Commission on January 3, 2018. |
Item 16. Form 10-K Summary
None.
SIGNATURES
Pursuant to the requirements of Section 13 or 15(d) of the Securities Exchange Act of 1934, the registrant has duly caused this report to be signed on its behalf by the undersigned, thereunto duly authorized, on this 21st24th day of February, 20192020.
|
| | |
| | DINE BRANDS GLOBAL, INC. |
| | By: | /s/ STEPHEN P. JOYCE |
| | | Stephen P. Joyce Chief Executive Officer |
Pursuant to the requirements of the Securities Exchange Act of 1934, this report has been signed below by the following persons on behalf of the registrant, and in the capacities indicated, on this 21st24th day of February, 2019.2020.
|
| | |
| Name | | Title |
| | | |
| /s/ STEPHEN P. JOYCE | | Chief Executive Officer (Principal Executive Officer), Director |
| Stephen P. Joyce | | |
| | | |
| /s/ THOMAS H. SONG | | Chief Financial Officer (Principal Financial Officer) |
| Thomas H. Song | | |
| | | |
| /s/ RICHARD J. DAHL | | Director |
| Richard J. Dahl | | |
| | | |
| /s/ HOWARD M. BERK | | Director |
| Howard M. Berk | | |
| | | |
| /s/ DANIEL J. BRESTLE | | Director |
| Daniel J. Brestle | | |
| | | |
| /s/ SUSAN M. COLLYNS | | Director |
| Susan M. Collyns | | |
| | |
| /s/ LARRY A. KAY | | Director |
| Larry A. Kay | | |
| | | |
| /s/ CAROLINE W. NAHAS | | Director |
| Caroline W. Nahas | | |
| | | |
| /s/ DOUGLAS M. PASQUALE | | Director |
| Douglas M. Pasquale | | |
| | | |
| /s/ GILBERT T. RAY | | Director |
| Gilbert T. Ray | | |
| | | |
| /s/ LILIAN C. TOMOVICH | | Director |
| Lilian C.Tomovich | | |