Indicate by check mark whether the registrant is a large accelerated filer, an accelerated filer, a non-accelerated filer, a smaller reporting company or an emerging growth company. See the definitions of "large“large accelerated filer," "accelerated” “accelerated filer," "smaller” “smaller reporting company"company” and "emerging“emerging growth company"company” in Rule 12b-2 of the Exchange Act.
The aggregate market value of the shares of registrant’s Common Stock, $1 par value, held by nonaffiliates of the registrant was approximately $1,810,436,970$1,810,436,970 as of June 28, 2019.
Our growth strategy is driven by constant refresh and expansionoutstanding shares of our
product and solution offerings to meet marketplace needs. This organic growth approach extends to a constantly evolving set of supply chain services that are designed to lower the customer’s total cost of procuring, owning and deploying the products we sell. We have identified security, professional audio/visual, wireless, industrial automation, electrical grid upgrades, as well as emerging technologies such as 5G and IoT as growth opportunities we are pursuing. Organic growth will periodically be supplemented with acquisitions where the benefits associated with geographic expansion, market penetration or new product line additions are weighted in favor of "buying versus building."common stock.| | | | | Amount and Nature of | | | | |
| Title of Class | | Name and Address of Beneficial Owner | | Beneficial Ownership | | | Percent of Class | |
| Common | | BlackRock, Inc. | | | 4,758,853 | (1) | | | 14.0 | % |
| | | 55 East 52nd Street | | | | | | | | |
| | | New York, NY 10055 | | | | | | | | |
| | | | | | | | | | | |
| Common | | Samstock/SZRT, L.L.C. | | | 1,329,432 | (2) | | | 10.7 | % |
| | | Samstock/SIT, L.L.C. | | | 362,147 | | | | | |
| | | KMJZ Investments L.L.C. | | | 526,277 | | | | | |
| | | Samstock/ZFT, L.L.C. | | | 55,588 | | | | | |
| | | Samstock/Alpha, L.L.C. | | | 55,587 | | | | | |
| | | KZ 2007 Holdings, LLC | | | 40,000 | | | | | |
| | | MZ 2007 Holdings, LLC | | | 40,000 | | | | | |
| | | JZ 2007 Holdings, LLC | | | 40,000 | | | | | |
| | | SZ Intervivos QTIP Trust | | | 28,700 | | | | | |
| | | Samuel Zell | | | 15,666 | | | | | |
| | | Zell Family Foundation | | | 1,147,940 | | | | | |
| | | Two North Riverside Plaza | | | | | | | | |
| | | Chicago, IL 60606 | | | | | | | | |
| | | | | | | | | | | |
| Common | | The Vanguard Group, Inc. | | | 3,098,946 | (3) | | | 9.1 | % |
| | | 100 Vanguard Blvd. | | | | | | | | |
| | | Malvern, PA | | | | | | | | |
| | | 19355 | | | | | | | | |
| | | | | | | | | | | |
| Common | | Dimensional Fund Advisors LP | | | 2,318,912 | (4) | | | 6.9 | % |
| | | Building One | | | | | | | | |
| | | 6300 Bee Cave Road | | | | | | | | |
| | | Austin, Texas 78746 | | | | | | | | |
| (1) | According to Schedule 13G, dated February 3, 2020, BlackRock, Inc. has sole power to vote 4,665,900 shares and sole power to dispose of 4,758,853 shares. |
| (2) | Samstock/SZRT, L.L.C. is a limited liability company whose sole member is Samuel Zell Revocable Trust. The trustee of Samuel Zell Revocable Trust is Mr. Zell. Samstock/SIT, L.L.C. is a limited liability company whose sole member is Sam Investment Trust, whose trustee is Chai Trust, a limited liability company. The beneficiaries of Sam Investment Trust are Samuel Zell and members of his family. Samstock/ZFT, L.L.C. is a limited liability company whose sole member is ZFT Partnership, an Illinois general partnership, whose sole partners are the Zell Trusts. Samstock/Alpha, L.L.C. is a limited liability company whose sole member is Alphabet Partners, an Illinois general partnership, whose sole partners are the Zell Trusts. KMJZ Investments L.L.C. is a limited liability company whose sole members are the Zell Trusts. KZ 2007 Holdings, LLC, is a limited liability company, whose sole member is KZ 2007 Trust. MZ 2007 Holdings, LLC, is a limited liability company, whose sole member is MZ 2007 Trust. JZ 2007 Holdings, LLC, is a limited liability company, whose sole member is JZ 2007 Trust. The trustee of all of the Zell Trusts, the SZ Intervivos QTIP Trust, the KZ 2007 Trust, the MZ 2007 Trust, and the JZ 2007 Trust is Chai Trust. Mr. Zell is neither a director nor an officer of Chai Trust and does not have voting or dispositive power over such shares indirectly held by such trusts, and accordingly, Mr. Zell has disclaimed beneficial ownership of such shares, except to the extent of any pecuniary interest therein. The amounts shown for Mr. Zell include (i) 14,666 of such shares held by Samuel Zell Revocable Trust, the trustee of which is Mr. Zell, and (ii) 1,000 shares held by Helen Zell Revocable Trust, the trustee of which is Helen Zell, spouse of Mr. Zell, and to which Mr. Zell disclaims beneficial ownership. Also includes 1,147,940 shares held by the Zell Family Foundation to which Mr. Zell disclaims beneficial ownership. The total does not include 95,374 restricted stock units owned by Mr. Zell. |
| (3) | According to Schedule 13G, dated February 10, 2020, The Vanguard Group Inc. has sole power to vote 29,459 shares, shared power to vote 4,603 shares, sole power to dispose of 3,068,876 shares and shared power to dispose of 30,070 shares. |
| (4) | According to Schedule 13G, dated February 12, 2020, Dimensional Fund Advisors LP has sole power to vote 2,238,978 shares and sole power to dispose of 2,318,912 shares. |
Business Segments and Products
We have identified Network & Security Solutions ("NSS"), Electrical & Electronic Solutions ("EES") and Utility Power Solutions ("UPS") as reportable segments. Equity Compensation Plan Information
The following is a brief descriptiontable summarizes information, as of each of our reportable segments and business activities.
Within our segments, we are also organized by geographies. Our geographies consist of North America, which includes the U.S. and Canada, EMEA, which includes Europe, the Middle East and Africa, and Emerging Markets, which includes Asia Pacific and Central and Latin America ("CALA").
Network & Security Solutions ("NSS")
The Network & Security Solutions segment, with sales in approximately 55 countries, supplies products and customized Supply Chain Solutions to customers in a diverse range of industries including technology, finance, telecommunications service providers, transportation, education, government, healthcare and retail. NSS sells these products directly to end users or through various channels including data communications contractors, security, network, professional audio/visual and systems integrators. NSS has a broad product portfolio that includes copper and fiber optic cable and connectivity, access control, video surveillance, intrusion and fire/life safety, cabinets, power, cable management, wireless, professional audio/video, voice and networking switches and other ancillary products. The NSS segment includes over 2,300 technically trained salespeople, approximately 70 Supply Chain Solutions specialists and a global technical support organization that provides support across all three reportable segments to aid in design, product specification and complete bills of materials inclusive of all Anixter solutions.
Through a variety of value-added supply chain solutions, including inventory management, product packaging and enhancement, and customized supply chain services, NSS helps customers reduce the risk, complexity and cost associated with their IT infrastructure and physical security deployments. The NSS commitment to quality products and services and technical leadership is demonstrated by its participation in many global standards organizations. NSS technical expertise extends to performance and interoperability testing at our Infrastructure Solutions LabSM, which provides NSS the opportunity to demonstrate solutions and proofs-of-concept to customers. Anixter's Infrastructure as a Platform and ipAssuredSM programs help customers make intelligent buying decisions around network and security infrastructure and improve efficiency to meet their sustainability goals.
Electrical & Electronic Solutions ("EES")
The Electrical & Electronic Solutions segment, with sales in approximately 40 countries, supplies a broad range of wire and cable, control, power/gear, lighting and core electrical products and customized supply chain solutions to the Commercial and Industrial ("C&I") and Original Equipment Manufacturer ("OEM") markets. The C&I group supplies products for the transmission of power and signals in industrial applications to customers in key markets including oil, gas and petrochemical, alternative energy, utility, power generation and distribution, transportation, commercial, industrial, natural resource and water and wastewater treatment. It sells directly to end users or through channels including electrical contractors, security and automation integrators, and engineering, procurement and construction firms. The OEM group supplies products used in the manufacturing of automotive, industrial, medical, transportation, marine, military and communications equipment, selling to OEM and panel, cable and harness shops. The product portfolio in this global business includes electrical and electronic wire and cable, shipboard cable, support and supply products, low-voltage cable, instrumentation cable, industrial communication and control products, security cable, connectors, and industrial Ethernet switches. Value-added services, including supply chain management services and technical support, are tailored to position us as a specialist in fast growing emerging markets, OEMs and industrial verticals. EES helps customers achieve their sustainability goals by using its value-added services to minimize scrap, reduce lead times and improve operational efficiency.
The EES team of nearly 1,200 technically trained sales personnel, supply chain specialists, industrial communication specialists and engineers. EES provides world-class technical assistance, products and support through code and standards interpretation, product selection assistance, on-site customer training and customer specification reviews. EES brings value to its customers through its global reach, ability to provide global infrastructure project coordination, technical and engineering support, financial strength, and sourcing and supplier relationships. These capabilities help customers reduce costs and risks and gain competitive advantage in their marketplace.
Utility Power Solutions ("UPS")
The Utility Power Solutions segment, with primary operations in the U.S. and Canada, supplies electrical transmission and distribution products, power plant maintenance, repair and operations supplies and smart-grid products, and arranges materials management and procurement outsourcing for the power generation, power transmission and electricity distribution industries. The UPS segment serves the electric utility markets. Products include conductors such as wire and cable, transformers, overhead transmission and distribution hardware, switches, protective devices and underground distribution, connectors used in the construction or maintenance and repair of electricity transmission and substation distribution infrastructure and supplies, lighting and conduit used in non-residential and residential construction. UPS also provides materials management and procurement outsourcing services. Its capabilities allow us to integrate with our customers and perform part of our customers' sourcing and procurement function. The UPS segment includes nearly 300 technically trained salespeople and approximately 40 Supply Chain Solutions specialists.
For more information concerning our business segments, foreign and domestic operations and export sales, see Note 7. "Income Taxes" and Note 10. "Business Segments" in the Notes to the Consolidated Financial Statements.
Suppliers
We source products from thousands of suppliers, with approximately one-quarter of our annual dollar volume purchases sourced from our five largest suppliers. An important element of our overall business strategy is to develop and maintain close relationships with our key suppliers, which include the world’s leading manufacturers of communication cabling, connectivity, support and supply products, electrical wire and cable, and utility products. Such relationships emphasize joint product planning, inventory management, technical support, advertising and marketing. In support of this strategy, we generally do not compete with our suppliers in product design or manufacturing activities. We do, however, sell a small amount of private label products that carry a brand name exclusive to us.
Our typical distribution agreement generally includes the following significant terms:
•a non-exclusive right to resell products to any customer in a geographical area (typically defined as a country, with the exception of our UPS business which is typically defined as a county or state);
•cancelable upon 60 to 90 days notice by either party for any reason;
•no minimum purchase requirements, although pricing may change with volume on a prospective basis; and
•the right to pass through the manufacturer’s warranty to our customers.
Distribution and Service Platform
We cost-effectively serve our customers’ needs through our computer systems, which connect the majority of our warehouses and sales offices throughout the world. The systems are designed for sales support, order entry, inventory status, order tracking, credit review and material management. Customers may also conduct business through our e-commerce platform.
We operate a series of large, modern, regional distribution centers in key geographic locations in North America, EMEA and Emerging Markets that provide for cost-effective, reliable storage and delivery of products to our customers. We have designated 20 warehouses as regional distribution centers. Collectively, these facilities store approximately 35% of our inventory. In certain cities, some smaller warehouses are also maintained to maximize transportation efficiency and to provide for the local needs of customers. Our network of regional distribution centers, local distribution centers, service centers, branch locations and sales offices consists of 245 locations in the United States, 30 in Canada, 24 in the United Kingdom, 23 in Continental Europe and the Middle East, 28 in Latin America, 12 in Asia and 18 in Australia and New Zealand.
We have developed close relationships with certain freight, package delivery and courier services to minimize transit times between our facilities and customer locations, as well as a dedicated delivery fleet of over 500 vehicles in our UPS segment. The combination of our information systems, distribution network and delivery partnerships allows us to provide a high level of customer service while maintaining a reasonable level of investment in inventory and facilities.
Employees
At January 3, 2020, we employed over 9,400 people. Approximately 50% of the employees are engaged in sales or sales-related activities, approximately 35% are engaged in warehousing and distribution operations, and approximately 15% are engaged in support activities, including inventory management, information services, finance, human resources and general management. We do not have any significant concentrations of employees subject to collective bargaining agreements within any of our segments.
Competition
Given our role as an aggregator of many different types of products from many different sources and because these products are sold to many different industry groups, there is no well-defined industry group against which we compete. We view the competitive environment as highly fragmented with hundreds of distributors and manufacturers that sell products directly or through multiple distribution channels to end users or other resellers. There is significant competition within each end market and geography served that creates pricing pressure and the need for excellent service. Competition is based primarily on breadth of products, quality, services, relationships, price and geographic proximity. We believe that we have a significant competitive advantage duerelating to our comprehensive product and service offerings, global distribution network, technically-trained sales team and customized supply chain solutions. We believeequity compensation plans under which our global distribution platform provides a competitive advantage to serving multinational customers’ needs. Our operations and logistics platform gives us the ability to ship orders from inventorycommon stock is authorized for delivery within 24 to 48 hours to all major global markets.
We enhance our value proposition to both key suppliers and customers through our technical expertise, global standards participation testing and demonstration facilities and numerous quality assurance certification programs such as ISO 9001:2015 and ISO/TS 16949:2009. Our NSS, EES and UPS segments leverage our certified Infrastructure Solutions Lab located at our suburban Chicago headquarters to support customers with technology needs related to enterprise networks, data centers, physical security, building technologies and industrial communications and control. At this lab, we evaluate performance and interoperability to help customers reduce risk through informed purchasing decisions. Our Solutions Briefing Centers, premier technology education and demonstration facilities locatedissuance.| | | Number of
securities to be
issued upon exercise
of outstanding
options, warrants
and rights(1) | | | Weighted-average
exercise price of
outstanding options,
warrants and
rights(2) | | | Number of securities
remaining available for
future issuance under
equity compensation
plans (excluding
securities
reflected in the first
column)(3) | |
| Equity compensation plans approved by security holders | | | 1,270,420 | | | | 62.27 | | | | 1,302,182 | |
| (1) | The number shown is the number of shares that, as of January 3, 2020, may be issued upon exercise of 200,738 outstanding options and vesting of 1,069,682 restricted stock units. |
| (2) | Weighted-average exercise price of outstanding stock options (excludes restricted stock units, which vest at no cost to participants). |
| (3) | The number shown is the number of shares that, as of January 3, 2020, may be issued upon exercise of options and other equity awards that may be granted in the future under the plans. |
Change in various regions around the globe, focus Control
As previously disclosed, on providing our customers with the necessary information to make informed decisions around complex, end-to-end technology solutions.
Contract Sales and Backlog
We have a number of customers who purchase products under long-term contractual arrangements. In such circumstances, the relationship with the customer may involve a high degree of material requirements planning and information systems interfaces and, in some cases, may require the maintenance of a dedicated distribution facility or dedicated personnel and inventory at, or in close proximity to, the customer site to meet the needs of the customer. Such contracts do not generally require the customer to purchase any minimum amount of goods from us, but could require that materials acquired by us, as a result of joint material requirements planning between us and the customer, be purchased by the customer. Backlog orders represent approximately five to six weeks of sales and the majority of these orders ship to customers within 30 to 60 days from order date.
Seasonality
The operating results are not significantly affected by seasonal fluctuations except for the impact resulting from variations in the number of billing days from quarter to quarter. Our EES and UPS segments experience some seasonality as weather can restrict project work. Consecutive quarter sales from the third to fourth quarters are generally lower due to the holidays and lower number of billing days as compared to other consecutive quarter comparisons. There were 257 billing days in 2019 and 253 billing days in both 2018 and 2017.
Available Information
Our Annual Report on Form 10-K, Quarterly Reports on Form 10-Q, Current Reports on Form 8-K and all amendments to these reports can be found at the Investor Relations section of our company website at http://www.anixter.com. These forms are available without charge as soon as reasonably practical following the time they are filed with or furnished to the Securities and Exchange Commission ("SEC"). Shareholders and other interested parties may request email notifications of the posting of these documents through the Investor Relations section of our website. In addition, copies of our reports will be made available, free of charge, upon written request.
Our website also contains corporate governance information including corporate governance guidelines; audit, compensation and nominating and governance committee charters; nomination process for directors; and our business ethics and conduct policy.
ITEM 1A. RISK FACTORS.
The following factors could materially adversely affect our operating results and financial condition. Although we have tried to discuss key factors, please be aware that other risks may prove to be important in the future. New risks may emerge at any time, and we cannot predict those risks or estimate the extent to which they may affect our financial performance.
The pendency of our agreement to be acquired by WESCO International, Inc. could have an adverse effect on our business.
On January 10, 2020,
wethe Company, WESCO International, Inc., a Delaware corporation (“WESCO”) and Warrior Merger Sub, Inc., a Delaware corporation and a wholly owned subsidiary of WESCO (“Merger Sub”), entered into
a definitivean Agreement and Plan of Merger (as it may be amended, modified or supplemented from time to time, the “merger agreement”). On the terms and subject to the conditions of the merger agreement,
under which we agreedMerger Sub will be merged with and into the Company (the “merger”), with the Company surviving the merger (the “surviving corporation”) as a wholly owned subsidiary of WESCO. Following the completion of the merger, the Company will cease to be
acquireda publicly traded company.If the merger contemplated by WESCO International, Inc. ("WESCO"). Underthe merger agreement is completed, the Company’s stockholders will be entitled to receive for each share of the Company’s common stock (i) $70.00 in cash, without interest, subject to adjustment pursuant to the terms of the merger agreement, at closing, each share of Anixter common stock will be converted into the right to receive (i) $70.00 in cash, without interest (subject to adjustment as set forth in the merger agreement), (ii) 0.2397 shares of WESCO common stock, (subjectsubject to adjustment as set forth inpursuant to the terms of the merger agreement)agreement, and (iii) 0.6356 depositary shares, each representing a 1/1,000th interest in a share of newly issued WESCO Series A fixed-rate reset cumulative perpetual WESCO preferred stock, $25,000 stated amount per whole preferred (subjectshare, subject to adjustment as set forth inpursuant to the terms of the merger agreement),agreement, in each case, less any applicable withholding taxes. See Note 13. “Subsequent Event” in the notesEach Company stockholder who would otherwise have been entitled to the Consolidated Financial Statements. Because the exchange ratio is fixed for the common stock portion of the merger consideration and the market pricereceive a fractional share of WESCO common stock has fluctuated and will continue to fluctuate, at the time of the special meeting of stockholders to approveor a fractional depositary share in the merger our stockholders will not know or be able to determine the market valueinstead receive a cash payment in lieu of the merger consideration they would receive upon completion of the merger. After the merger, our stockholders will have lower ownership and voting interest in WESCO than they currently have in Anixter and will exercise less influence over management.
The announcement and pendency of the merger could cause disruption in our business, including the potential loss or disruption of commercial relationships prior to the completion of the merger.For example, parties with which we do business may be uncertain as to the effects on them of the merger, including with respect to their current or future business relationships with us. These relationships may be subject to disruption as customers, suppliers and other persons with whom we have a business relationship may delay or defer certain business decisions or might decide to terminate, change or renegotiate their relationships with us or consider entering into business relationships with other parties. These disruptions could have an adverse effect on the results of our operations, cash flows and financial position.The announcement and pendency of the merger could also have a potential negative effect on our ability to retain management, sales and other key personnel.
The merger agreement generally requires us to operate our business in the ordinary course of business pending consummation of the merger, but includes certain contractual restrictions on the conduct of our business prior to completion of the merger.These restrictions may prevent us from taking certain specified actions or otherwise pursuing business opportunities during the pendency of the merger that may be beneficial to us. The merger agreement also contains provisions that limit our ability to pursue alternatives to the merger and that could discourage a potential competing acquirer of Anixter form making a favorable alternative transaction proposal. In addition, matters relating to the merger (including integration planning) will require substantial commitments of time and resources by our management, which could divert their time and attention.We have also incurred, and will continue to incur, significant non-recurring costs in connection with the merger that we may be unable to recover. Further, the merger agreement requires us to pay a substantial termination fee to WESCO in certain circumstances.
The risk, and adverse effect, of any disruption could be exacerbated by a delay in completion of the merger or termination of the merger agreement. Completion of the merger is subject to the satisfaction or waiver of a number of conditions, many of which are not within our control. The failure to satisfy all of the required conditions could delay the completion of the merger for a significant period of time or prevent it from occurring. We cannot provide assurance that our pending merger with WESCO will be completed. Failure to complete the merger could also negatively affect our stock price and our future business and financial results.
Transactions like the merger are frequently the subject of litigation or other legal proceedings, including actions alleging that either our board of directors breached their respective fiduciary duties to their stockholders by entering into the merger agreement, by failing to obtain a greater value in the transaction for their stockholders or otherwise. We believe that any such litigation or proceedings would be without merit, but there can be no assurance that they will not be brought. Indeed, between December 9, 2019 and December 19, 2019, four lawsuits were filed by purported stockholders of Anixter in connection with the now-terminated merger agreement with Clayton, Dubilier & Rice, LLC. If litigation or other legal proceedings are brought against us or against our board in connection with the merger agreement, we will defend against it, but we might not be successful in doing so. An adverse outcome in such matters, as well as the costs and efforts of a defense even if successful, could have a material adverse effect on our business, results of operation or financial position, including through the possible diversion of either company’s resources or distraction of key personnel.
All of the matters described above, alone or in combination, could materially and adversely affect our business, financial condition, results of operations and stock price. fractional share.The foregoing description of our pending acquisition by WESCO isthe merger and the merger agreement does not purport to be complete and is qualified in its entirety by reference to the registration statement on Form S-4,merger agreement, which contains a preliminary proxy statement/prospectus with respectis filed as Exhibit 2.1 to the merger, filed by WESCO with the SEC on February 7, 2020. We urge you to read the registration statement on Form S-4 because it contains important information about the merger, including relevant risk factors.
A change in sales strategy or financial viability of our suppliers could adversely affect our sales or earnings.
Most of our agreements with suppliers are terminable by either party on short notice for any reason. We currently source products from thousands of suppliers. However, approximately one-quarter of our annual dollar volume purchases are sourced from our five largest suppliers. If any of these suppliers changes its sales strategy to reduce its reliance on distribution channels, or decides to terminate its business relationship with us, our sales and earnings could be adversely affected until we are able to establish relationships with suppliers of comparable products. Although we believe our relationships with these key suppliers are good, they could change their strategies as a result of a change in control, expansion of their direct sales force, changes in the marketplace or other factors beyond our control, including a key supplier becoming financially distressed.
We have risks associated with the sale of nonconforming products and services.
Historically, we have experienced a small number of cases in which our vendors supplied us with products that did not conform to the agreed upon specifications without our knowledge. Additionally, we may inadvertently sell a product not suitable for a customer’s application. We address this risk through our quality control processes, by seeking to limit liability and our warranty in our customer contracts, by obtaining indemnification rights from vendors and by maintaining insurance responsive to these risks. However, there can be no assurance that we will be able to include protective provisions in all of our contracts, that vendors will have the financial capability to fulfill their indemnification obligations to us, or that insurance can be obtained with sufficiently broad coverage or in amounts sufficient to fully protect us.
Our foreign operations are subject to political, economic, currency and other risks.
We derive approximately one quarter of our revenues from sales outside of the U.S. Economic and political conditions in some of these foreign markets may adversely affect our results of operations, cash flows and financial condition in these foreign markets. Our results of operations and the value of our foreign assets are affected by fluctuations in foreign currency exchange rates (as further discussed in "Item 7A. Quantitative and Qualitative Disclosures About Market Risk") and different legal, tax, accounting and regulatory requirements. In addition, some of the products that we distribute are produced in foreign countries, which involve longer and more complex supply chains that are vulnerable to numerous risks that could cause significant interruptions or delays in delivery of such products. Many of these factors are beyond our control and include risks, such as political instability, financial instability of suppliers, suppliers' noncompliance with applicable laws, trade restrictions, labor disputes, currency fluctuations, changes in tariff or import policies, severe weather, public health crises, terrorist attacks and transport capacity and cost. For example, the recent outbreak of a novel strain of coronavirus, a respiratory illness, in China, could adversely affect our supply chains involving China and other affected regions. The extent to which the coronavirus will impact our business, results of operation or financial condition is difficult to assess at this stage as much depends on future developments, which are uncertain, including information concerning the severity of the coronavirus and the methods to contain and treat the virus. A significant interruption in our supply chains caused by any of the above factors could result in increased costs or delivery delays and result in a decrease in our net sales and profitability.
We have risks associated with inventory.
We must identify the right product mix and maintain sufficient inventory on hand to meet customer orders. Failure to do so could adversely affect our sales and earnings. However, if circumstances change (for example, an unexpected shift in market demand, pricing or customer defaults) there could be a material impact on the net realizable value of our inventory. To guard against inventory obsolescence, we have negotiated various return rights and price protection agreements with certain key suppliers. We also maintain an inventory valuation reserve account against declines in the value or salability of our inventory. However, there is no guaranty that these arrangements will be sufficient to avoid write-offs in excess of our reserves in all circumstances.
Our operating results are affected by copper prices.
Our operating results have been affected by changes in prices of copper, which is a major component in a portion of the electrical wire and cable products we sell. As our purchase costs with suppliers change to reflect the changing copper prices, our percent mark-up to customers remains relatively constant, resulting in higher or lower sales revenue and gross profit depending upon whether copper prices are increasing or decreasing.
We have risks associated with the integration of acquired businesses.
In connection with recent and future acquisitions, it is necessary for us to continue to create an integrated business from the various acquired entities. This requires the establishment of a common management team to guide the acquired businesses, the conversion of numerous information systems to a common operating system, the establishment of a brand identity for the acquired businesses, the streamlining of the operating structure to optimize efficiency and customer service and a reassessment of the inventory and supplier base to ensure the availability of products at competitive prices. No assurance can be given that these various actions can be completed without disruption to the business, in a short period of time or that anticipated improvements in operating performance can be achieved. Any inability on our part to successfully implement strategic transactions could have an adverse impact on our reputation, business, financial condition, operating results and cash flows. There can be no assurance that any businesses acquired will meet performance expectations or that business judgments concerning the value, strengths and weaknesses of businesses acquired will prove to be correct. In addition, any acquisition that we make may not deliver the synergies and other benefits that were anticipated when entering into such acquisition.
Our debt agreements could impose restrictions on our business.
Our debt agreements contain certain financial and operating covenants that limit our discretion with respect to certain business matters. These covenants restrict our ability to, among other things:
•incur additional indebtedness;
•create liens on assets;
•make certain investments;
•transfer, lease or dispose of assets; and
•engage in certain mergers, acquisitions, consolidations or other fundamental changes.
These covenants also limit the amount of dividends or share repurchases we may make. As a result of these restrictions, we are limited in how we may conduct business and may be unable to compete effectively or take advantage of new business opportunities. Our ability to comply with the covenants and restrictions contained in our debt agreements may be affected by economic, financial and industry conditions or regulatory changes beyond our control. The breach of any of these covenants or restrictions could result in a default under our revolving lines of credit or the indentures governing our outstanding notes that would permit the applicable lenders or noteholders, as the case may be, to declare all outstanding amounts to be due and payable, together with accrued and unpaid interest. If we are unable to repay indebtedness, lenders having secured obligations, such as the lenders under our revolving lines of credit, could proceed against the collateral securing these obligations. This could have a significant negative impact on our financial condition and operating results.
We have substantial debt which could adversely affect our profitability, limit our ability to obtain financing in the future and pursue certain business opportunities.
As of January 3, 2020, we had an aggregate principal amount of $1.06 billion of outstanding debt. As a result, a substantial portion of our cash flow from operations must be dedicated to the payment of principal and interest on our indebtedness, thereby reducing the funds available to us for other purposes. This may also limit our ability to obtain additional financing for working capital, capital expenditures, acquisitions, debt service requirements, and general corporate purposes in the future. Our indebtedness also reduces our flexibility to adjust to changing market conditions or may prevent us from making capital investments that are necessary or important to our operations and strategic growth.
If our cash flow and capital resources are not sufficient to fund our debt service obligations, we could face liquidity problems and may be required to reduce or delay capital expenditures, sell assets, seek to obtain additional equity capital or refinance our debt. We cannot make assurances that we will be able to refinance our debt on terms acceptable to us, or at all. Our debt agreements and the indentures governing our outstanding notes restrict our ability to dispose of assets and how we use the proceeds from any such dispositions. We cannot make assurances that we will be able to consummate those dispositions, or if we do, what the timing of the dispositions will be or whether the proceeds that we realize will be adequate to meet our debt service obligations when due.
We have risks associated with accounts receivable.
A significant portion of our working capital consists of accounts receivable. Although no single customer accounts for more than 3% of our sales, a payment default by one of our larger customers could have a negative short-term impact on earnings or liquidity. A financial or industry downturn could have an adverse effect on the collectability of our accounts receivable, which could result in longer payment cycles, increased collection costs and defaults.
A decline in project volume could adversely affect our sales and earnings.
While much of our sales and earnings are generated by comparatively smaller and more frequent orders, the fulfillment of large orders for capital projects generates significant sales and earnings. Slow macro-economic growth rates, difficult credit market conditions for our customers, weak demand for our customers’ products or other customer spending constraints can result in project delays or cancellations, potentially having a material adverse effect on our financial results.
The level of returns on pension plan assets and the actuarial assumptions used for valuation purposes could affect our earnings and cash flows in future periods. Changes in government regulations could also affect our pension plan expenses and funding requirements.
The funding obligations for our pension plans are impacted by the performance of the financial markets, particularly the equity markets, and interest rates. Funding obligations are determined under government regulations and are measured each year based on the value of assets and liabilities on a specific date. If the financial markets do not provide the long-term returns that are expected under the governmental funding calculations, we could be required to make larger contributions. The equity markets can be very volatile, and therefore our estimate of future contribution requirements can change dramatically in relatively short periods of time. Similarly, changes in interest rates and legislation enacted by governmental authorities can impact the timing and amounts of contribution requirements. An adverse change in the funded status of the plans could significantly increase our required contributions in the future and adversely impact our liquidity. At January 3, 2020, our projected benefit obligations exceeded the fair value of plan assets by $71.0 million.
Assumptions used in determining projected benefit obligations and the fair value of plan assets for our pension plans are determined by us in consultation with outside actuaries. In the event that we determine that changes are warranted in the assumptions used, such as the discount rate, expected long-term rate of return on assets, or mortality rates, our future pension benefit expenses could increase or decrease. Due to changing market conditions, the assumptions that we use may differ from actual results, which could have a significant impact on our pension liabilities and related costs and funding requirements.
Any significant disruption, interruption or failure of our information systems could disrupt our business, result in increased costs and decreased revenues, harm our reputation, and expose us to liability.
We rely on the proper functioning and availability of our information systems to successfully operate our business, including managing inventory, processing customer orders, shipping products and providing service to customers, and compiling financial results. Our information systems may be disrupted due to natural disasters, power or telecommunications outages, unauthorized access, or other causes. Any significant or prolonged unavailability or failure of our critical information systems could materially impair our ability to maintain proper levels of inventories, process orders, meet the demands of our customers in a timely manner, and other harmful effects. We seek to continually enhance our information systems, and such changes could potentially create a disruption or failure of our existing information technology. Additionally, efforts to align portions of our business on common platforms, systems and processes could result in unforeseen interruptions, increased costs or liability, and other negative effects.
We may experience a failure in or breach of our operational or information security systems, or those of our third-party service providers, as a result of cyber attacks or information security breaches.
Information security risks have generally increased in recent years because of the proliferation of new technologies and the increased sophistication and activities of perpetrators of cyber attacks. A failure in or breach of our operational or information security systems, or those of our third-party service providers, as a result of cyber attacks, mailicious intrusions or information security breaches could disrupt our business, result in the disclosure or misuse of confidential or proprietary information, damage our reputation, increase our costs and/or cause losses. As a result, cyber security and the continued development and enhancement of the controls and processes designed to protect our systems, computers, software, data and networks from attack, damage or unauthorized access remain a priority for us. Although we believe that we have robust information security procedures and other safeguards in place, as cyber threats continue to evolve, we may be required to expend additional resources to continue to enhance our information security measures and/or investigate and remediate any information security vulnerabilities. If our information systems are compromised, we may face regulatory sanctions or penalties under applicable laws, experience increases in operating expenses or an impairment in our ability to conduct our operations, incur expenses or lose revenues as a result of a data privacy breach, information technology outages or disruptions, or suffer other adverse consequences including lawsuits or other legal action and damage to our reputation.
Disruptions to our logistics capability or supply chain may have an adverse impact on our operations.
Our global logistics services are operated through distribution centers around the world. We also depend on transportation service providers for the delivery of products to our customers. Any significant interruption or disruption in service at one or more of our distribution centers due to severe weather, natural disasters, information technology upgrades, operating issues, disruptions to our transportation network, public heath crises (such as the recent outbreak of a novel strain of coronavirus) or other unanticipated events, could impair our ability to obtain or deliver inventory in a timely manner, cause cancellations or delays in shipments to customers or otherwise disrupt our normal business operations.
We are subject to various laws and regulations globally and any failure to comply could adversely affect our business.
We are subject to a broad range of laws and regulations in the jurisdictions where we operate globally, including, among others, those relating to data privacy and protection, cyber security, import and export requirements, anti-bribery and corruption, product compliance, supplier regulations regarding the sources of supplies or products, environmental protection, health and safety requirements, intellectual property, foreign exchange controls and cash repatriation restrictions, labor and employment, e-commerce, advertising and marketing, anti-competition and tax. Compliance with these domestic and foreign laws, regulations and requirements may be burdensome, increasing our cost of compliance and doing business. In addition, as a supplier to federal, state, and local government agencies, we must comply with certain laws and regulations relating specifically to our governmental contracts. Although we have implemented policies and procedures designed to facilitate compliance with these laws, we cannot assure you that our employees, contractors, or agents will not violate such laws and regulations, or our policies and procedures. Any such violations could result in the imposition of fines and penalties, damage to our reputation, and, in the case of laws and regulations relating to governmental contracts, the loss of those contracts.
We may be adversely affected by the United Kingdom's withdrawal from the European Union (Brexit) and their future relationship with other countries.
On January 31, 2020, the United Kingdom formally withdrew from the European Union (“Brexit”). This started a transition period that will last until at least December 31, 2020 during which time the United Kingdom remains in the European Economic Area, single market and customs union, and European Union laws continues to apply in the United Kingdom. The United Kingdom and European Union have made a non-binding political declaration setting out a framework for the future relationship between the United Kingdom and the European Union after the transition period. Negotiations on the future relationship between the United Kingdom and the European Union have been and will likely continue to be complex and protracted. The United Kingdom will also negotiate its future trading relationship with other countries.
We have significant operations in the United Kingdom and other member countries of the European Union. The withdrawal by the United Kingdom and its future trading relationships could have an adverse effect on the tax, tax treaty, currency, operational, legal and regulatory regimes to which our businesses in the region are subject. The end of the transition period and the future trading relationship between the United Kingdom and European Union could also, among other potential outcomes, disrupt the free movement of goods, services and people between the United Kingdom and the European Union and significantly disrupt trade between the United Kingdom and the European Union and other parties. The uncertainty concerning the timing could also have a negative impact on the business activity, political stability and economic conditions in the United Kingdom, the European Union and the other economies in which we operate, which could result in customers reducing or delaying spending decisions on our products. Our United Kingdom business has deferred tax assets totaling $6.8 million. A downturn in our United Kingdom business caused by a material adverse effect could require us to record a valuation allowance against those deferred tax assets. Any of these developments could have a material adverse effect on our business, financial condition, operating results and cash flows.
We may be adversely affected by unanticipated changes in our tax provisions.
We are a U.S.-owned multinational company subject to income and other taxes in the U.S. and jurisdictions abroad. Tax laws are subject to change as new laws are passed and new interpretations of laws are issued or applied. Such changes in U.S. or foreign tax laws, regulations, other administrative guidance and common law interpretation could affect our tax expense and profitability as evidenced by the enactment of the Tax Cuts and Jobs Act on December 22, 2017. Further, the final determination of tax audits or litigation could ultimately be materially different from our historical income tax provisions and accruals. Changes in our tax provision and tax liabilities, whether due to changes in law, the interpretation, or a final determination of audits or litigation, could have a material adverse impact on our financial condition, operating results and cash flows.
ITEM 1B. UNRESOLVED STAFF COMMENTS.
None.
ITEM 2. PROPERTIES.
Our distribution network consists of 309 warehouses/branch locations in approximately 50 countries with approximately 9 million square feet of space. This includes 20 regional distribution centers (100,000 — 500,000 square feet), 44 local distribution centers (35,000 — 100,000 square feet), 187 service centers and 58 branch locations. Additionally, we have 71 sales offices throughout the world. All but five of these facilities are leased. No one facility is material to our overall operations, and we believe there is ample supply of alternative warehousing space available on similar terms and conditions in each of our markets.
ITEM 3. LEGAL PROCEEDINGS.
Incorporated by reference to Note 6. "Commitments and Contingencies" in the notes to the Consolidated Financial Statements of this AnnualCurrent Report on Form 10-K.
ITEM 4. MINE SAFETY DISCLOSURES.
Not applicable.
EXECUTIVE OFFICERS OF THE REGISTRANT
The following table lists the name, age as of February 20, 2020, position, offices and certain other information with respect to our executive officers. The term of office of each executive officer will expire upon the appointment of his successor by the Board of Directors.
| | | | | | | | | | | | | | |
William A. Galvin, 57 | | President and Chief Executive Officer since July 2018; President and Chief Operating Officer from July 2017 to June 2018; Executive Vice President - Network & Security Solutions of the Company from 2012 to June 2017; Executive Vice President - North America and EMEA Enterprise Cabling and Security Solutions from 2007 to 2012. Mr. Galvin has held several sales and marketing management roles over his 30 years of experience with the Company. | | |
| | | | |
Theodore A. Dosch, 60 | | Executive Vice President - Finance and Chief Financial Officer of the Company since July 2011; Senior Vice President - Global Finance of the Company from January 2009 to June 2011; CFO - North America and Vice President - Maytag Integration at Whirlpool Corporation from 2006 to 2008; Corporate Controller at Whirlpool Corporation from 2004 to 2006; CFO - North America at Whirlpool Corporation from 1999 to 2004. Mr. Dosch has also been a Director of UGI Corporation since 2017. | | |
| | | | |
Justin C. Choi, 54 | | Executive Vice President - General Counsel & Corporate Secretary of the Company since May 2013; Vice President - General Counsel & Corporate Secretary of the Company from June 2012 to May 2013; Executive Vice President, General Counsel and Secretary -Trustwave Holdings from January 2011 to June 2012; Senior Vice President, General Counsel & Secretary - Andrew Corporation from March 2006 to December 2007; Vice President of Law - Avaya Inc. from September 2000 to February 2006. | | |
| | | | |
William C. Geary II, 49 | | Executive Vice President - Network & Security Solutions of the Company since July 2017; Senior Vice President - Global Markets - Network & Security Solutions from January 2017 to June 2017. Before moving to Anixter, Mr. Geary served 22 years and held a variety of senior management roles at the U.S. based communications distributor Accu-Tech. | | |
| | | | |
Robert M. Graham, 52 | | Executive Vice President - Electrical & Electronic Solutions of the Company since July 2015; Senior Vice President - U.S. Electrical and Electronic Wire and Cable from 2011 to 2015. Mr. Graham came to Anixter with the acquisition of the Pentacon business in September 2002, and since then, he has held various senior leadership roles for Anixter’s former OEM Fastener business with his most recent position before joining the Wire & Cable division being Senior Vice President for the North American business. | | |
| | | | |
Steve M. Dean, 50 | | Executive Vice President - Utility Power Solutions since January 2020; Senior Vice President - Sales, Utility Power Solutions from July 2019 to January 2020; Senior Vice President - Sales, Public Power, Utility Power Solutions from October 2018 to July 2019; Senior Vice President - Global EPC and Capital Projects, Electrical & Electronic Solutions from January 2017 to October 2018; Senior Vice President - Strategic Sales Solutions, Electrical & Electronic Solution from March 2016 to January 2017; Vice President - Industrial Automation, Wire & Cable division from May 2011 to March 2016. Mr. Dean held various roles in business development and marketing since joining the Company in 1999. | | |
| | | | |
Scott Ramsbottom, 46 | | Executive Vice President - Chief Information Officer since February 2015; Senior Vice President Global Information Services from February 2014 to February 2015. Mr. Ramsbottom held various roles in the information services group since joining the Company in 1999. | | |
| | | | |
Rodney A. Smith, 62 | | Executive Vice President - Human Resources of the Company since May 2013; Vice President - Human Resources from August 2006 to May 2013. Prior to Anixter, Mr. Smith was the Vice President of Human Resources at UOP, LLC, and also held various human resources roles with Union Carbide and Exxon Corporation. | | |
| | | | |
Orlando McGee, 58 | | Executive Vice President - Operations of the Company since January 2018; Senior Vice President - Strategic and EMEA Operations from August 2017 to January 2018; Senior Vice President - Strategic Operations from June 2016 to August 2017. Prior to joining the Company, Mr. McGee served in a number of management positions at Cintas Corporation from 2012 to 2016, most recently as Vice President Distribution & Logistics. | | |
PART II
ITEM 5. MARKET FOR REGISTRANT’S COMMON EQUITY, RELATED STOCKHOLDER MATTERS AND ISSUER PURCHASES OF EQUITY SECURITIES.
Anixter International Inc.’s Common Stock is traded on the New York Stock Exchange under the symbol AXE. Shareholders of record are set forth in Note 12. "Selected Quarterly Financial Data (Unaudited)" in the Notes to the Consolidated Financial Statements. There have been no sales of unregistered securities.
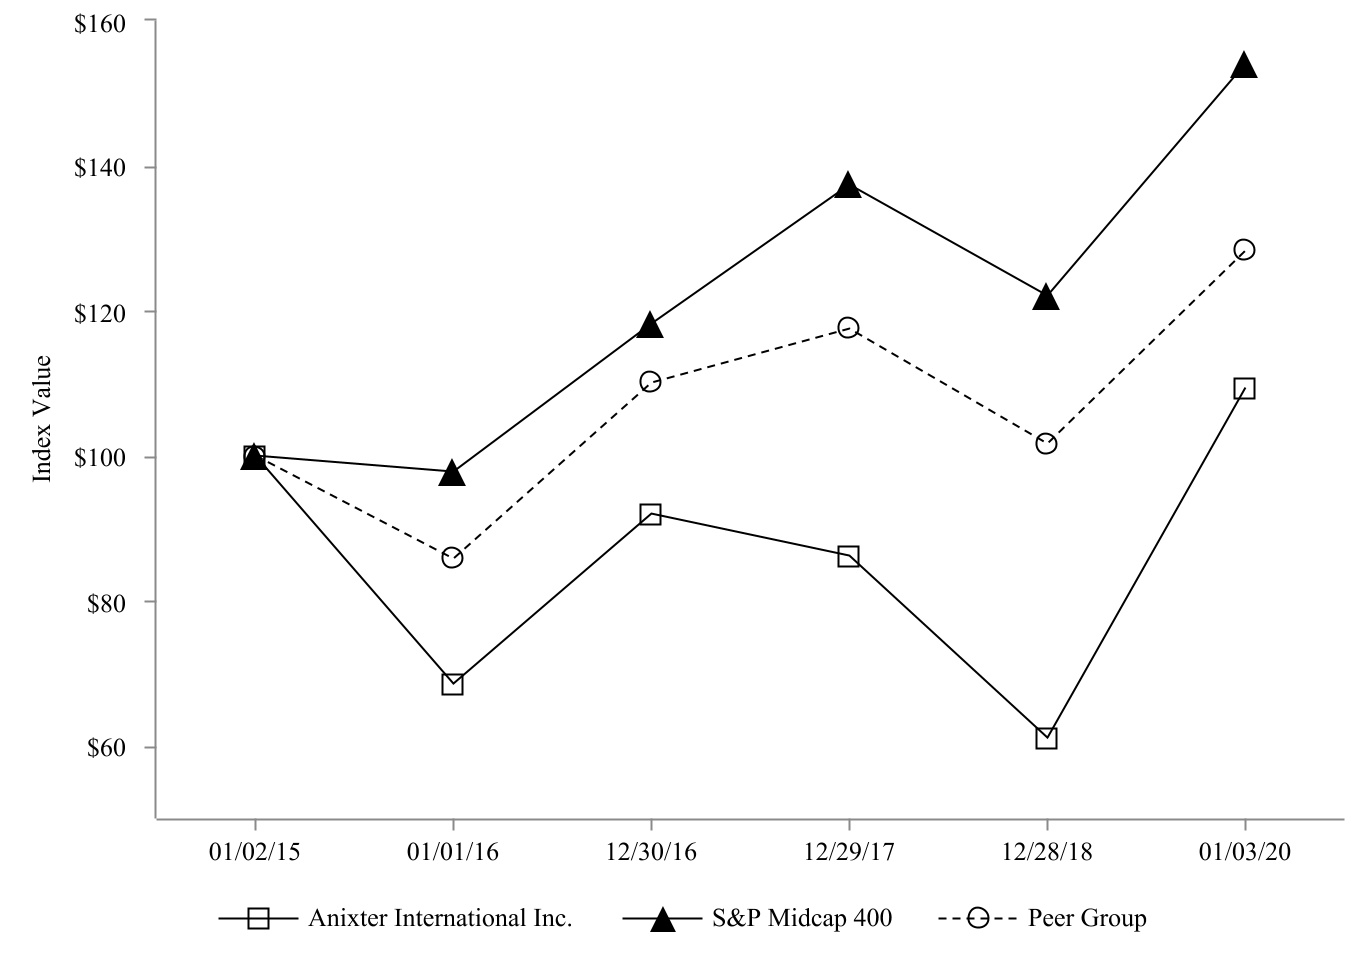
PERFORMANCE GRAPH
The following graphs set forth the annual changes for the five-year period indicated in a theoretical cumulative total shareholder return of an investment of $100 in our common stock and each comparison index, assuming reinvestment of dividends. These graphs reflect the comparison of shareholder return on our common stock with that of a broad market index and a peer group index. Our Peer Group Index for 2019 consists of the following companies: Arrow Electronics Inc., Avnet Inc., Belden Inc., CommScope Inc., Fastenal Company, MRC Global, MSC Industrial Direct Co. Inc., Rexel, Scansource Inc., Watsco, Inc., WESCO International, Inc., and W.W. Grainger Inc. This peer group was selected based on a review of publicly available information about these companies and our determination that they are engaged in businesses similar to ours.
ITEM 6. SELECTED FINANCIAL DATA.
| | | | | | | | | | | | | | | | | | | | | | | | | | | | | | | | |
| (In millions, except per share amounts) | | Fiscal Year | | | | | | | | |
| | | 2019 | | 2018 | | 2017 | | 2016 | | 2015 |
| Selected Income Statement Data: | | | | | | | | | | |
| Net sales | | $ | 8,845.6 | | | $ | 8,400.2 | | | $ | 7,927.4 | | | $ | 7,622.8 | | | $ | 6,190.5 | |
| Operating income | | 367.5 | | | 309.7 | | | 312.9 | | | 295.5 | | | 267.1 | |
Interest expense and other, net (a) | | (74.1) | | | (86.5) | | | (75.3) | | | (98.0) | | | (84.2) | |
| Net income from continuing operations | | 262.9 | | | 156.3 | | | 109.0 | | | 121.1 | | | 96.9 | |
| Net (loss) income from discontinued operations | | — | | | — | | | — | | | (0.6) | | | 30.7 | |
| Net income | | $ | 262.9 | | | $ | 156.3 | | | $ | 109.0 | | | $ | 120.5 | | | $ | 127.6 | |
| Diluted Income (Loss) Per Share: | | | | | | | | | | |
| Continuing operations | | $ | 7.67 | | | $ | 4.58 | | | $ | 3.21 | | | $ | 3.61 | | | $ | 2.90 | |
| Discontinued operations | | $ | — | | | $ | — | | | $ | — | | | $ | (0.02) | | | $ | 0.91 | |
| Net income | | $ | 7.67 | | | $ | 4.58 | | | $ | 3.21 | | | $ | 3.59 | | | $ | 3.81 | |
| Dividend declared per common share | | $ | — | | | $ | — | | | $ | — | | | $ | — | | | $ | — | |
| Selected Balance Sheet Data: | | | | | | | | | | |
| Total assets | | $ | 4,808.9 | | | $ | 4,653.1 | | | $ | 4,252.2 | | | $ | 4,093.6 | | | $ | 4,142.0 | |
| Total long-term debt | | $ | 1,059.7 | | | $ | 1,252.7 | | | $ | 1,247.9 | | | $ | 1,378.8 | | | $ | 1,642.9 | |
| Stockholders’ equity | | $ | 1,860.9 | | | $ | 1,570.4 | | | $ | 1,459.0 | | | $ | 1,292.2 | | | $ | 1,179.4 | |
| Book value per diluted share | | $ | 54.25 | | | $ | 46.05 | | | $ | 42.95 | | | $ | 38.51 | | | $ | 35.26 | |
| Weighted-average diluted shares | | 34.3 | | | 34.1 | | | 34.0 | | | 33.6 | | | 33.4 | |
| Year-end outstanding shares | | 34.2 | | | 33.9 | | | 33.7 | | | 33.4 | | | 33.3 | |
| Other Financial Data: | | | | | | | | | | |
| Working capital | | $ | 1,544.4 | | | $ | 1,543.0 | | | $ | 1,483.0 | | | $ | 1,424.6 | | | $ | 1,571.6 | |
| Capital expenditures | | $ | 40.0 | | | $ | 42.4 | | | $ | 41.1 | | | $ | 32.6 | | | $ | 26.7 | |
| Depreciation | | $ | 37.2 | | | $ | 31.7 | | | $ | 28.2 | | | $ | 27.9 | | | $ | 22.2 | |
| Amortization of intangible assets | | $ | 35.0 | | | $ | 37.3 | | | $ | 36.1 | | | $ | 37.6 | | | $ | 24.9 | |
(a) Interest expense and other, net in 2018 includes $4.6 million of loss on the extinguishment of debt on the retirement of our $350.0 million 5.625% Senior Notes due 2019.
Items Impacting Comparability of Results
Over the last five years, we have completed two material acquisitions and the respective sales and operating income have impacted the comparability of the results as reflected below. The acquisitions were accounted for as purchases and the results of operations of the acquired businesses are included in the Consolidated Financial Statements from the dates of acquisition. The following represents the incremental impact of the results for the one year period following the acquisitions:
| | | | | | | | | | | | | | |
| (In millions) | | Years Ended | | |
| | | December 30,
2016 | | January 1,
2016 |
| | (a) | | (a)(b) |
| Net sales | | $ | 1,501.9 | | | $ | 921.2 | |
| Operating income | | 43.3 | | | 29.3 | |
(a)October 2015 acquisition of Power Solutions for $829.4 million.
(b)September 2014 acquisition of Tri-Ed for $418.4 million.
In 2015, we sold our Fasteners business for $371.8 million in cash, resulting in a pre-tax gain of $40.3 million ($23.3 million, net of tax). As a result of this divestiture, results of this business are reflected as "Discontinued operations".
The following reflects various items that impact the comparability of the results for the last five fiscal years:
| | | | | | | | | | | | | | | | | | | | | | | | | | | | | | | | |
| Items Impacting Comparability of Results from Continuing Operations: | | | | | | | | | | |
| (In millions, except per share amounts) | | Years Ended | | | | | | | | |
| | January 3,
2020 | | December 28,
2018 | | December 29,
2017 | | December 30,
2016 | | January 1,
2016 |
| Items impacting operating expense and operating income: | | Favorable / (Unfavorable) | | | | | | | | |
| Amortization of intangible assets | | $ | (35.0) | | | $ | (37.3) | | | $ | (36.1) | | | $ | (37.6) | | | $ | (24.9) | |
| Merger costs | | (12.8) | | | — | | | — | | | — | | | — | |
| Restructuring charge | | — | | | (9.4) | | | — | | | (5.4) | | | (8.2) | |
| Acquisition and integration costs | | 0.3 | | | (2.9) | | | (2.3) | | | (5.1) | | | (13.2) | |
| CEO retirement agreement expense | | — | | | (2.6) | | | — | | | — | | | — | |
| U.K. facility relocation costs | | — | | | (1.0) | | | — | | | — | | | — | |
| Impairment of intangible assets | | — | | | — | | | (5.7) | | | — | | | — | |
| U.K. pension settlement | | — | | | — | | | — | | | (9.6) | | | (0.4) | |
| Latin America bad debt provision | | — | | | — | | | — | | | (7.6) | | | (11.7) | |
| Write-off of capitalized software | | — | | | — | | | — | | | — | | | (3.1) | |
| Dilapidation provision | | — | | | — | | | — | | | — | | | (1.7) | |
| Total of items impacting operating expense and operating income | | $ | (47.5) | | | $ | (53.2) | | | $ | (44.1) | | | $ | (65.3) | | | $ | (63.2) | |
| Items impacting interest expense: | | | | | | | | | | |
| Write-off of deferred financing costs | | — | | | — | | | — | | | — | | | (0.3) | |
| Total of items impacting interest expense | | $ | — | | | $ | — | | | $ | — | | | $ | — | | | $ | (0.3) | |
| Items impacting other expenses: | | | | | | | | | | |
| Loss on extinguishment of debt | | — | | | (4.6) | | | — | | | — | | | (0.9) | |
| Foreign exchange loss | | — | | | — | | | — | | | — | | | (3.6) | |
| Total of items impacting other expenses | | $ | — | | | $ | (4.6) | | | $ | — | | | $ | — | | | $ | (4.5) | |
| Total of items impacting pre-tax income | | $ | (47.5) | | | $ | (57.8) | | | $ | (44.1) | | | $ | (65.3) | | | $ | (68.0) | |
| Items impacting income taxes: | | | | | | | | | | |
| Tax impact of items above impacting pre-tax income | | 8.8 | | | 12.6 | | | 14.8 | | | 18.8 | | | 27.4 | |
| Transition tax on deferred foreign income | | — | | | 2.8 | | | (50.0) | | | — | | | — | |
| Rate change impact of net deferred tax liability | | — | | | (0.7) | | | 14.4 | | | — | | | — | |
| Reversal/(establishment) of deferred income tax valuation allowances | | 45.9 | | | 1.4 | | | — | | | (1.1) | | | (11.3) | |
| Tax expense related to domestic permanent tax differences | | — | | | (0.7) | | | — | | | — | | | — | |
| Tax (expense) benefit related to prior year tax positions | | (0.8) | | | (0.1) | | | (1.3) | | | 3.2 | | | — | |
| Other tax items | | — | | | — | | | — | | | — | | | (0.5) | |
| Total of items impacting income taxes | | $ | 53.9 | | | $ | 15.3 | | | $ | (22.1) | | | $ | 20.9 | | | $ | 15.6 | |
| Net income impact of these items | | $ | 6.4 | | | $ | (42.5) | | | $ | (66.2) | | | $ | (44.4) | | | $ | (52.4) | |
| Diluted EPS impact of these items | | $ | 0.19 | | | $ | (1.25) | | | $ | (1.95) | | | $ | (1.32) | | | $ | (1.56) | |
The following table presents a reconciliation from net income from continuing operations to EBITDA and Adjusted EBITDA:
| | | | | | | | | | | | | | | | | | | | | | | | | | | | | | | | |
| | Fiscal Year | | | | | | | | |
| (In millions) | | 2019 | | 2018 | | 2017 | | 2016 | | 2015 |
| Net income from continuing operations | | $ | 262.9 | | | $ | 156.3 | | | $ | 109.0 | | | $ | 121.1 | | | $ | 96.9 | |
| Interest expense | | 77.1 | | | 76.3 | | | 74.7 | | | 78.7 | | | 63.8 | |
| Income taxes | | 30.5 | | | 66.9 | | | 128.6 | | | 76.4 | | | 86.0 | |
| Depreciation | | 37.2 | | | 31.7 | | | 28.2 | | | 27.9 | | | 22.2 | |
| Amortization of intangible assets | | 35.0 | | | 37.3 | | | 36.1 | | | 37.6 | | | 24.9 | |
| EBITDA | | $ | 442.7 | | | $ | 368.5 | | | $ | 376.6 | | | $ | 341.7 | | | $ | 293.8 | |
Total of items impacting operating income (a) | | 12.5 | | | 13.3 | | | 8.0 | | | 27.7 | | | 38.3 | |
| Foreign exchange and other non-operating (income) expense | | (3.0) | | | 10.2 | | | 0.6 | | | 19.3 | | | 20.4 | |
| Stock-based compensation | | 20.0 | | | 18.9 | | | 18.1 | | | 16.5 | | | 13.9 | |
| Adjusted EBITDA | | $ | 472.2 | | | $ | 410.9 | | | $ | 403.3 | | | $ | 405.2 | | | $ | 366.4 | |
(a) Items impacting operating income excludes amortization of intangible assets and CEO retirement agreement expense in the calculation of adjusted EBITDA as amortization is already added back in the EBITDA calculation and CEO retirement agreement expense is added back as part of stock-based compensation.
ANIXTER INTERNATIONAL INC.
ITEM 7. MANAGEMENT’S DISCUSSION AND ANALYSIS OF FINANCIAL CONDITION AND RESULTS OF OPERATIONS.
Executive Overview
Total company sales increased 5.3% to $8,845.6 million in 2019. Excluding the unfavorable impacts from foreign exchange and copper and the favorable impact from acquisitions, we delivered organic sales growth of 5.6%, as summarized in the table below. The current year had 257 billing days compared to 253 billing days in the prior year period. However, due to the timing of holidays, it is estimated that there were 2 1/2 more effective selling days in 2019 compared to 2018. Excluding the favorable impact from these extra selling days, adjusted daily sales increased 4.6%. Additional highlights of the year included:
•$227.9 million of cash flow from operations; and
•Earnings per diluted share of $7.67.
Organic sales growth from 2018 to 2019 excludes the impact of the following items and is summarized by segment and geography below:
•$64.3 million unfavorable impact from the fluctuation in foreign exchange;
•$15.1 million unfavorable impact from the lower average price of copper; and
•$48.4 million favorable impact from acquisitions.
Adjusted daily sales growth further excludes the favorable impact from 2 1/2 more effective selling days in 2019.
| | | | | | | | | | | | | | | | | | | | | | | | | | | | | | | | | | | | | | | | | | | | | | | | | | | | | | | | | | | | | | | | | | | | |
| Sales Growth Trends | | | | | | | | | | | | | | | | | | | | | | |
| | Twelve Months Ended January 3, 2020 | | | | | | | | Twelve Months Ended December 28, 2018 | | | | | | Growth/(Decline) | | | | | | |
| ($ millions) | | As Reported | | Foreign Exchange Impact | | Copper Impact | | As Adjusted | | As Reported | | Acquisitions Impact | | Adjusted for Acquisitions | | | | | | Adjusted 2018 for Effective Selling Days | | Adjusted Daily Sales |
| | | | | | | | | | | | | | | | Actual | | Organic | | | | |
| Network & Security Solutions (NSS) | | | | | | | | | | | | | | | | | | | | | | |
| North America | | $ | 3,484.6 | | | $ | 9.1 | | | $ | — | | | $ | 3,493.7 | | | $ | 3,295.4 | | | $ | — | | | $ | 3,295.4 | | | 5.7 | % | | 6.0 | % | | $ | 3,327.9 | | | 5.0 | % |
| EMEA | | 387.3 | | | 15.3 | | | — | | | 402.6 | | | 403.3 | | | 1.7 | | | 405.0 | | | (4.0) | % | | (0.6) | % | | 409.0 | | | (1.6) | % |
| Emerging Markets | | 824.3 | | | 16.3 | | | — | | | 840.6 | | | 648.3 | | | 46.7 | | | 695.0 | | | 27.2 | % | | 21.0 | % | | 701.8 | | | 19.8 | % |
| NSS | | $ | 4,696.2 | | | $ | 40.7 | | | $ | — | | | $ | 4,736.9 | | | $ | 4,347.0 | | | $ | 48.4 | | | $ | 4,395.4 | | | 8.0 | % | | 7.8 | % | | $ | 4,438.7 | | | 6.7 | % |
| | | | | | | | | | | | | | | | | | | | | | | |
| Electrical & Electronic Solutions (EES) | | | | | | | | | | | | | | | | | | | | | | | | |
| North America | | $ | 1,870.6 | | | $ | 7.3 | | | $ | 11.2 | | | $ | 1,889.1 | | | $ | 1,836.2 | | | $ | — | | | $ | 1,836.2 | | | 1.9 | % | | 2.9 | % | | $ | 1,854.5 | | | 1.9 | % |
| EMEA | | 238.2 | | | 10.3 | | | 1.3 | | | 249.8 | | | 257.0 | | | — | | | 257.0 | | | (7.3) | % | | (2.8) | % | | 259.5 | | | (3.8) | % |
| Emerging Markets | | 243.2 | | | 1.6 | | | 2.1 | | | 246.9 | | | 249.5 | | | — | | | 249.5 | | | (2.6) | % | | (1.1) | % | | 252.0 | | | (2.0) | % |
| EES | | $ | 2,352.0 | | | $ | 19.2 | | | $ | 14.6 | | | $ | 2,385.8 | | | $ | 2,342.7 | | | $ | — | | | $ | 2,342.7 | | | 0.4 | % | | 1.8 | % | | $ | 2,366.0 | | | 0.8 | % |
| | | | | | | | | | | | | | | | | | | | | | | |
| Utility Power Solutions (UPS) | | | | | | | | | | | | | | | | | | | | | | | | |
| North America | | $ | 1,797.4 | | | $ | 4.4 | | | $ | 0.5 | | | $ | 1,802.3 | | | $ | 1,710.5 | | | $ | — | | | $ | 1,710.5 | | | 5.1 | % | | 5.4 | % | | $ | 1,727.5 | | | 4.3 | % |
| UPS | | $ | 1,797.4 | | | $ | 4.4 | | | $ | 0.5 | | | $ | 1,802.3 | | | $ | 1,710.5 | | | $ | — | | | $ | 1,710.5 | | | 5.1 | % | | 5.4 | % | | $ | 1,727.5 | | | 4.3 | % |
| | | | | | | | | | | | | | | | | | | | | | | |
| Total | | $ | 8,845.6 | | | $ | 64.3 | | | $ | 15.1 | | | $ | 8,925.0 | | | $ | 8,400.2 | | | $ | 48.4 | | | $ | 8,448.6 | | | 5.3 | % | | 5.6 | % | | $ | 8,532.2 | | | 4.6 | % |
| | | | | | | | | | | | | | | | | | | | | | | |
| Geographic Sales | | | | | | | | | | | | | | | | | | | | | | | |
| North America | | $ | 7,152.6 | | | $ | 20.8 | | | $ | 11.7 | | | $ | 7,185.1 | | | $ | 6,842.1 | | | $ | — | | | $ | 6,842.1 | | | 4.5 | % | | 5.0 | % | | $ | 6,909.9 | | | 4.0 | % |
| EMEA | | 625.5 | | | 25.6 | | | 1.3 | | | 652.4 | | | 660.3 | | | 1.7 | | | 662.0 | | | (5.3) | % | | (1.5) | % | | 668.5 | | | (2.4) | % |
| Emerging Markets | | 1,067.5 | | | 17.9 | | | 2.1 | | | 1,087.5 | | | 897.8 | | | 46.7 | | | 944.5 | | | 18.9 | % | | 15.2 | % | | 953.8 | | | 14.0 | % |
| Total | | $ | 8,845.6 | | | $ | 64.3 | | | $ | 15.1 | | | $ | 8,925.0 | | | $ | 8,400.2 | | | $ | 48.4 | | | $ | 8,448.6 | | | 5.3 | % | | 5.6 | % | | $ | 8,532.2 | | | 4.6 | % |
| | | | | | | | | | | | | | | | | | | | | | |
Note: There were 257 billing days in 2019 compared to 253 billing days in 2018. However, due to the timing of holidays, it is estimated that there were 2 1/2 more effective selling days in 2019 compared to 2018, resulting in 255 1/2 and 253 effective selling days in 2019 and 2018, respectively. | | | | | | | | | | | | | | | | | | | | | | |
ANIXTER INTERNATIONAL INC.
As we enter 2020, we remain focused on delivering strong organic growth, continued gross margin improvement and strong expense discipline. We are also beginning to benefit from our movement to a U.S.-center-led business model where we drive strategies to achieve global network synergies. We continue to see generally positive sales trends in the business, based on our solid backlog and pipeline, and discussions with our customers and suppliers. Overall we expect full year 2020 organic sales growth in the 1 - 5% range.
Acquisition of Businesses
During the second quarter of 2018, we completed the acquisition of security businesses in Australia and New Zealand. These acquisitions have been accretive to earnings in the first full year of operation, exclusive of transaction and integration costs.
Consolidated Results of Operations
| | | | | | | | | | | | | | | | | | | | |
| (In millions, except per share amounts) | | Years Ended | | | | |
| | | January 3,
2020 | | December 28,
2018 | | December 29,
2017 |
| Net sales | | $ | 8,845.6 | | | $ | 8,400.2 | | | $ | 7,927.4 | |
| Gross profit | | 1,775.8 | | | 1,658.0 | | | 1,571.0 | |
| Operating expenses | | 1,408.3 | | | 1,348.3 | | | 1,258.1 | |
| Operating income | | 367.5 | | | 309.7 | | | 312.9 | |
| Other expense: | | | | | | |
| Interest expense | | (77.1) | | | (76.3) | | | (74.7) | |
| Other, net | | 3.0 | | | (10.2) | | | (0.6) | |
| Income before income taxes | | 293.4 | | | 223.2 | | | 237.6 | |
| Income tax expense | | 30.5 | | | 66.9 | | | 128.6 | |
| Net income | | $ | 262.9 | | | $ | 156.3 | | | $ | 109.0 | |
| Diluted income per share | | $ | 7.67 | | | $ | 4.58 | | | $ | 3.21 | |
ANIXTER INTERNATIONAL INC.
Items Impacting Comparability of Results
In addition to the results provided in accordance with U.S. Generally Accepted Accounting Principles ("U.S. GAAP") above, this report includes certain non-GAAP financial measures as defined by the Securities and Exchange Commission. Specifically, net sales comparisons to the prior corresponding period, both worldwide and in relevant segments, are discussed in this report both on a U.S. GAAP and non-GAAP basis. We believe that by providing non-GAAP organic growth, which adjusts for the impact of acquisitions (when applicable), foreign exchange fluctuations, copper prices and the number of billing days, both management and investors are provided with meaningful supplemental sales information to understand and analyze our underlying trends and other aspects of our financial performance. We calculate the year-over-year organic sales growth impact related to acquisitions by including their comparable period results prior to the acquisitions with our results, as we believe this represents the most accurate representation of organic growth, considering the nature of the companies we acquired and the synergistic revenues that have been or will be achieved. Historically, and from time to time, we may also exclude other items from reported financial results (e.g., impairment charges, inventory adjustments, restructuring charges, tax items, currency devaluations, pension settlements, etc.) in presenting adjusted operating expense, adjusted operating income, adjusted income taxes and adjusted net income so that both management and financial statement users can use these non-GAAP financial measures to better understand and evaluate our performance period over period and to analyze the underlying trends of our business. We have also excluded amortization of intangible assets associated with purchase accounting from acquisitions from the adjusted amounts for comparison of the non-GAAP financial measures period over period.
EBITDA is defined as net income from continuing operations before interest, income taxes, depreciation and amortization. Adjusted EBITDA is defined as EBITDA before foreign exchange and other non-operating expense and non-cash stock-based compensation, excluding the other items from reported financial results, as defined above. We believe that adjusted operating income, EBITDA and Adjusted EBITDA provide relevant and useful information, which is widely used by analysts, investors and competitors in our industry as well as by our management in assessing both consolidated and business segment performance. Adjusted operating income provides an understanding of the results from the primary operations of our business by excluding the effects of certain items that do not reflect the ordinary earnings of our operations. We use adjusted operating income to evaluate our period over period operating performance because we believe this provides a more comparable measure of our continuing business excluding certain items that are not reflective of expected ongoing operations. This measure may be useful to an investor in evaluating the underlying performance of our business. EBITDA provides us with an understanding of earnings before the impact of investing and financing charges and income taxes. Adjusted EBITDA further excludes the effects of foreign exchange and other non-cash stock-based compensation, and certain items that do not reflect the ordinary earnings of our operations and that are also excluded for purposes of calculating adjusted net income, adjusted earnings per share and adjusted operating income. EBITDA and Adjusted EBITDA are used by our management for various purposes including as measures of performance of our operating entities and as a basis for strategic planning and forecasting. Adjusted EBITDA may be useful to an investor because this measure is widely used to evaluate a company’s operating performance without regard to items excluded from the calculation of such measure, which can vary substantially from company to company depending on the accounting methods, book value of assets, capital structure and the method by which the assets were acquired, among other factors. They are not, however, intended as an alternative measure of operating results or cash flow from operations as determined in accordance with U.S. GAAP.
Non-GAAP financial measures provide insight into selected financial information and should be evaluated in the context in which they are presented. These non-GAAP financial measures have limitations as analytical tools, and should not be considered in isolation from, or as a substitute for, financial information presented in compliance with U.S. GAAP, and non-GAAP financial measures as reported by us may not be comparable to similarly titled amounts reported by other companies. The non-GAAP financial measures should be considered in conjunction with the Consolidated Financial Statements, including the related notes, and Management’s Discussion and Analysis of Financial Condition and Results of Operations included in this report. Management does not use these non-GAAP financial measures for any purpose other than the reasons stated above.
Our operating results can be affected by changes in prices of commodities, primarily copper, which are components in some of the electrical wire and cable products sold. Generally, as the costs of inventory purchases increase due to higher commodity prices, our mark-up percentage to customers remains relatively constant, resulting in higher sales revenue and gross profit. In addition, existing inventory purchased at previously lower prices and sold as prices increase may result in a higher gross profit margin. Conversely, a decrease in commodity prices in a short period of time would have the opposite effect, negatively affecting financial results. The degree to which spot market copper prices change affects product prices and the amount of gross profit earned will be affected by end market demand and overall economic conditions. Importantly, however, there is no exact measure of the impact of changes in copper prices, as there are thousands of transactions in any given year, each of which has various factors involved in the individual pricing decisions. Therefore, all references to the effect of copper prices are estimates.
ANIXTER INTERNATIONAL INC.
We recorded the following items that impacted the comparability of the results for the last three fiscal years:
| | | | | | | | | | | | | | | | | | | | |
| Items Impacting Comparability of Results: | | | | | | |
| (In millions, except per share amounts) | | Years Ended | | | | |
| | January 3,
2020 | | December 28,
2018 | | December 29,
2017 |
| Items impacting operating expense and operating income: | | Favorable / (Unfavorable) | | | | |
| Amortization of intangible assets | | $ | (35.0) | | | $ | (37.3) | | | $ | (36.1) | |
| Merger costs | | (12.8) | | | — | | | — | |
| Restructuring charge | | — | | | (9.4) | | | — | |
| Acquisition and integration costs | | 0.3 | | | (2.9) | | | (2.3) | |
| CEO retirement agreement expense | | — | | | (2.6) | | | — | |
| U.K. facility relocation costs | | — | | | (1.0) | | | — | |
| Impairment of intangible assets | | — | | | — | | | (5.7) | |
| Total of items impacting operating expense and operating income | | $ | (47.5) | | | $ | (53.2) | | | $ | (44.1) | |
| Items impacting other expenses: | | | | | | |
| Loss on extinguishment of debt | | — | | | (4.6) | | | — | |
| Total of items impacting other expenses | | $ | — | | | $ | (4.6) | | | $ | — | |
| Total of items impacting pre-tax income | | $ | (47.5) | | | $ | (57.8) | | | $ | (44.1) | |
| Items impacting income taxes: | | | | | | |
| Tax impact of items impacting pre-tax income above | | 8.8 | | | 12.6 | | | 14.8 | |
| Transition tax on deferred foreign income | | — | | | 2.8 | | | (50.0) | |
| Rate change impact of net deferred tax liability | | — | | | (0.7) | | | 14.4 | |
| Reversal of deferred income tax valuation allowances | | 45.9 | | | 1.4 | | | — | |
| Tax expense related to domestic permanent tax differences | | — | | | (0.7) | | | — | |
| Tax expense related to prior year tax positions | | (0.8) | | | (0.1) | | | (1.3) | |
| Total of items impacting income taxes | | $ | 53.9 | | | $ | 15.3 | | | $ | (22.1) | |
| Net income impact of these items | | $ | 6.4 | | | $ | (42.5) | | | $ | (66.2) | |
| Diluted EPS impact of these items | | $ | 0.19 | | | $ | (1.25) | | | $ | (1.95) | |
The items impacting operating income by segment are reflected in the tables below.
| | | | | | | | | | | | | | | | | | | | | | | | | | | | | | | | |
| Items Impacting Comparability of Operating Expense and Operating Income by Segment: | | | | | | | | | | |
| | | | | | | | | | |
| | Year Ended January 3, 2020 | | | | | | | | |
| (In millions) | | NSS | | EES | | UPS | | Corporate | | Total |
| Amortization of intangible assets | | | $ | (16.4) | | | $ | (5.4) | | | $ | (13.2) | | | $ | — | | | $ | (35.0) | |
| Merger costs | | — | | | — | | | — | | | (12.8) | | | (12.8) | |
| Restructuring charge | | — | | | (0.5) | | | 0.1 | | | 0.4 | | | — | |
| Acquisition and integration costs | | — | | | — | | | — | | | 0.3 | | | 0.3 | |
| Total of items impacting operating expense and operating income | | $ | (16.4) | | | $ | (5.9) | | | $ | (13.1) | | | $ | (12.1) | | | $ | (47.5) | |
ANIXTER INTERNATIONAL INC.
| | | | | | | | | | | | | | | | | | | | | | | | | | | | | | | | |
| | Year Ended December 28, 2018 | | | | | | | | |
| (In millions) | | NSS | | EES | | UPS | | Corporate | | Total |
| Amortization of intangible assets | | | $ | (17.0) | | | $ | (7.0) | | | $ | (13.3) | | | $ | — | | | $ | (37.3) | |
| Restructuring charge | | (2.1) | | | (1.3) | | | (0.7) | | | (5.3) | | | (9.4) | |
| Acquisition and integration costs | | (2.6) | | | — | | | — | | | (0.3) | | | (2.9) | |
| CEO retirement agreement expense | | — | | | — | | | — | | | (2.6) | | | (2.6) | |
| U.K. facility relocation costs | | (0.2) | | | (0.8) | | | — | | | — | | | (1.0) | |
| Total of items impacting operating expense and operating income | | $ | (21.9) | | | $ | (9.1) | | | $ | (14.0) | | | $ | (8.2) | | | $ | (53.2) | |
| | | | | | | | | | | | | | | | | | | | | | | | | | | | | | | | |
| | Year Ended December 29, 2017 | | | | | | | | |
| (In millions) | | NSS | | EES | | UPS | | Corporate | | Total |
| Amortization of intangible assets | | $ | (14.4) | | | $ | (8.4) | | | $ | (13.3) | | | $ | — | | | $ | (36.1) | |
| Restructuring charge | | — | | | 0.5 | | | (0.1) | | | (0.4) | | | — | |
| Acquisition and integration costs | | — | | | — | | | — | | | (2.3) | | | (2.3) | |
| Impairment of intangible assets | | (5.7) | | | — | | | — | | | — | | | (5.7) | |
| Total of items impacting operating expense and operating income | | $ | (20.1) | | | $ | (7.9) | | | $ | (13.4) | | | $ | (2.7) | | | $ | (44.1) | |
| | | | | | | | | | | | | | | | | |
| U.S. GAAP to Non-GAAP Net Income and EPS Reconciliation: | | | | | |
| (In millions, except per share amounts) | Years Ended | | | | |
| January 3,
2020 | | December 28,
2018 | | December 29,
2017 |
| Reconciliation to most directly comparable U.S. GAAP financial measure: | | | | | |
| Net income - U.S. GAAP | $ | 262.9 | | | $ | 156.3 | | | $ | 109.0 | |
| Items impacting net income | (6.4) | | | 42.5 | | | 66.2 | |
| Net income - Non-GAAP | $ | 256.5 | | | $ | 198.8 | | | $ | 175.2 | |
| | | | | |
| Diluted EPS – U.S. GAAP | $ | 7.67 | | | $ | 4.58 | | | $ | 3.21 | |
| Diluted EPS impact of these items | (0.19) | | | 1.25 | | | 1.95 | |
| Diluted EPS – Non-GAAP | $ | 7.48 | | | $ | 5.83 | | | $ | 5.16 | |
ANIXTER INTERNATIONAL INC.
Net Sales
2019 vs. 2018
| | | | | | | | | | | | | | | | | | | | | | | | | | |
| (In millions) | | NSS | | EES | | UPS | | Total |
| Net sales, 2019 | | $ | 4,696.2 | | | $ | 2,352.0 | | | $ | 1,797.4 | | | $ | 8,845.6 | |
| Net sales, 2018 | | 4,347.0 | | | 2,342.7 | | | 1,710.5 | | | 8,400.2 | |
| $ Change | | $ | 349.2 | | | $ | 9.3 | | | $ | 86.9 | | | $ | 445.4 | |
| % Change | | 8.0 | % | | 0.4 | % | | 5.1 | % | | 5.3 | % |
| | | | | | | | |
| Impact of Acquisitions | | $ | 48.4 | | | $ | — | | | $ | — | | | $ | 48.4 | |
| Net sales, 2018 (Adjusted for Acquisitions) | | $ | 4,395.4 | | | $ | 2,342.7 | | | $ | 1,710.5 | | | $ | 8,448.6 | |
| | | | | | | | |
| Adjusted % Change (Adjusted for Acquisitions) | | 6.9 | % | | | 0.4 | % | | 5.1 | % | | 4.6 | % |
| Plus the % impact of: | | | | | | | | |
| Foreign exchange | | 0.9 | % | | 0.8 | % | | 0.3 | % | | 0.8 | % |
| Copper pricing | | — | % | | 0.6 | % | | — | % | | 0.2 | % |
| Organic (Non-GAAP) | | 7.8 | % | | 1.8 | % | | 5.4 | % | | 5.6 | % |
| | | | | | | | |
| Adjusted 2018 for Effective Selling Days | | $ | 4,438.7 | | | $ | 2,366.0 | | | $ | 1,727.5 | | | $ | 8,532.2 | |
| Adjusted Daily Sales (Non-GAAP) | | 6.7 | % | | 0.8 | % | | 4.3 | % | | 4.6 | % |
There were 257 billing days in 2019 compared to 253 billing days in 2018. However, due to the timing of holidays, it is estimated that there were 2 1/2 more effective selling days in 2019 compared to 2018, resulting in 255 1/2 and 253 effective selling days in 2019 and 2018, respectively.
NSS – Sales of $4,696.2 million increased 8.0% from $4,347.0 million in the prior year period. Adjusting for the unfavorable impact from foreign exchange and favorable impact from acquisitions, NSS organic sales increased 7.8%, a 6.7% increase on a per day basis. The increase reflects growth in both the network infrastructure and security portions of the business and in the North America and Emerging Markets geographies. NSS security sales in the twelve months ended January 3, 2020 of $2,053.8 million, which represents 43.7% of total segment sales, increased 11.3% from the prior year period. Adjusted for the $48.1 million favorable impact from acquisitions and $3.6 million unfavorable currency impact, organic security sales growth was 8.6% compared to the twelve months ended December 28, 2018.
EES – Sales of $2,352.0 million increased 0.4% from $2,342.7 million in the prior year period, with growth in the commercial and industrial business offset by a decline in the original equipment manufacturer ("OEM") portion of the business. Adjusting for the unfavorable impacts from foreign exchange and copper, EES organic sales increased by 1.8%, a 0.8% increase on a per day basis.
UPS– Sales of $1,797.4 million increased 5.1% from $1,710.5 million in the prior year period, reflecting broad-based growth with both investor-owned utility and public power customers. Adjusting for the unfavorable impacts from foreign exchange and copper, UPS organic sales increased 5.4%, a 4.3% increase on a per day basis.
ANIXTER INTERNATIONAL INC.
2018 vs. 2017
| | | | | | | | | | | | | | | | | | | | | | | | | | |
| (In millions) | | NSS | | EES | | UPS | | Total |
| Net sales, 2018 | | $ | 4,347.0 | | | $ | 2,342.7 | | | $ | 1,710.5 | | | $ | 8,400.2 | |
| Net sales, 2017 | | 4,114.4 | | | 2,225.5 | | | 1,587.5 | | | 7,927.4 | |
| $ Change | | $ | 232.6 | | | $ | 117.2 | | | $ | 123.0 | | | $ | 472.8 | |
| % Change | | 5.7 | % | | 5.3 | % | | 7.8 | % | | 6.0 | % |
| | | | | | | | |
| Impact of Acquisitions | | $ | 70.8 | | | $ | — | | | $ | — | | | $ | 70.8 | |
| Net sales, 2017 (Adjusted for Acquisitions) | | $ | 4,185.2 | | | $ | 2,225.5 | | | $ | 1,587.5 | | | $ | 7,998.2 | |
| | | | | | | | |
| Adjusted % Change (Adjusted for Acquisitions) | | 3.9 | % | | 5.3 | % | | 7.8 | % | | 5.0 | % |
| Plus the % impact of: | | | | | | | | |
| Foreign exchange | | — | % | | (0.3) | % | | — | % | | (0.1) | % |
| Copper pricing | | — | % | | (0.5) | % | | — | % | | (0.1) | % |
| Organic (Non-GAAP) | | 3.9 | % | | 4.5 | % | | 7.8 | % | | 4.8 | % |
There were 253 billing days in both 2018 and 2017.
NSS – Sales of $4,347.0 million increased 5.7% from $4,114.4 million in the prior year period. NSS organic sales increased 3.9%, adjusting for the unfavorable impact from foreign exchange and favorable impact from acquisitions, reflecting growth in both the network infrastructure and security portions of the business and in all geographies. NSS security sales in the twelve months ended December 28, 2018 of $1,882.0 million, which represents 43.3% of total segment sales, increased 12.0% from the prior year period. Adjusted for the $69.1 million favorable impact from acquisitions and $8.2 million unfavorable currency impact, organic security sales growth was 8.0% compared to the twelve months ended December 29, 2017.
EES – Sales of $2,342.7 million increased 5.3% from $2,225.5 million in the prior year period, strengthened by the favorable impacts from copper and foreign exchange. EES organic sales increased by 4.5%, with growth driven by strength in the commercial and industrial business and strong growth with OEM customers.
UPS– Sales were $1,710.5 million increased 7.8% from $1,587.5 million in the prior year period, reflecting broad-based growth with both investor-owned utility and public power customers. UPS organic sales increased 7.8%, with the unfavorable impact from foreign exchange offset by the favorable impact from copper.
Gross Margin
Gross margin of 20.1% in 2019 increased from 19.7% in 2018 and 19.8% in 2017. The year-over-year higher gross margin in 2019 was primarily driven by margin initiatives implemented across the business. The lower gross margin in 2018 compared to 2017 was caused by competitive pressure, customer and product mix and cost inflation.
Operating Expenses
Operating expenses were $1,408.3 million, $1,348.3 million and $1,258.1 million in 2019, 2018 and 2017, respectively. Operating expense in 2019 includes $35.0 million of intangible asset amortization, $12.8 million of merger costs and a reversal of acquisition and integration costs of $0.3 million. The merger costs relate to expenses leading up to and associated with the merger agreement announced8-K filed on January 13, 2020. Operating expense in 2018 includes $37.3 million of intangible asset amortization, a restructuring charge of $9.4 million, $2.9 million of acquisition and integration costs, $2.6 million of CEO retirement agreement expense and $1.0 million of U.K. facility relocation costs. The CEO retirement agreement expense relates to additional stock compensation for a retirement agreement with the previous CEO, which extended the terms of his non-competition and non-solicitation restrictions in exchange for extended vesting and termination provisions of previously granted equity awards. The U.K. facility relocation costs relate to expenses we incurred to move our largest warehouse in EMEA. We were forced to move this location due to a government-backed rail line that will run through our legacy facility. Excluding these items from their related periods, adjusted operating expenses in 2019 increased 5.1% to $1,360.8 million, or 15.4% of sales, which compares to prior year adjusted operating expense of $1,295.1 million, or 15.4% of sales. Further adjusting operating expenses for a favorable $11.3 million impact of foreign currency in the twelve months ended 2019, adjusted operating expenses would have increased by 5.9%.
ANIXTER INTERNATIONAL INC.
Operating Income
2019 vs. 2018
| | | | | | | | | | | | | | | | | | | | | | | | | | | | | | | | |
| (In millions) | | NSS | | EES | | UPS | | Corporate | | Total |
| Operating income (loss), 2019 | | $ | 325.5 | | | $ | 139.5 | | | $ | 83.5 | | | $ | (181.0) | | | $ | 367.5 | |
| Operating income (loss), 2018 | | 272.2 | | | 132.3 | | | 75.4 | | | (170.2) | | | 309.7 | |
| $ Change | | $ | 53.3 | | | $ | 7.2 | | | $ | 8.1 | | | $ | (10.8) | | | $ | 57.8 | |
| % Change | | 19.6 | % | | 5.4 | % | | 10.7 | % | | (6.3) | % | | 18.7 | % |
| | | | | | | | | | |
| Items impacting operating income in 2019 | | $ | 16.4 | | | $ | 5.9 | | | $ | 13.1 | | | $ | 12.1 | | | $ | 47.5 | |
| Adjusted operating income, 2019 (Non-GAAP) | | $ | 341.9 | | | $ | 145.4 | | | $ | 96.6 | | | $ | (168.9) | | | $ | 415.0 | |
| | | | | | | | | | |
| Items impacting operating income in 2018 | | $ | 21.9 | | | $ | 9.1 | | | $ | 14.0 | | | $ | 8.2 | | | $ | 53.2 | |
| Adjusted operating income, 2018 (Non-GAAP) | | $ | 294.1 | | | $ | 141.4 | | | $ | 89.4 | | | $ | (162.0) | | | $ | 362.9 | |
| | | | | | | | | | |
| Adjusted % Change (Non-GAAP) | | 16.3 | % | | 2.8 | % | | 8.1 | % | | (4.3) | % | | 14.4 | % |
| | | | | | | | | | |
| Plus the % impact of: | | | | | | | | | | |
| Foreign exchange | | 1.4 | % | | 0.7 | % | | 0.5 | % | | (0.5) | % | | 1.4 | % |
| Copper pricing | | — | % | | 2.4 | % | | 0.1 | % | | — | % | | 1.0 | % |
| Organic (Non-GAAP) | | 21.0 | % | | 8.5 | % | | 11.3 | % | | (6.8) | % | | 21.1 | % |
2018 vs. 2017
| | | | | | | | | | | | | | | | | | | | | | | | | | | | | | | | |
| (In millions) | | NSS | | EES | | UPS | | Corporate | | Total |
| Operating income (loss), 2018 | | $ | 272.2 | | | $ | 132.3 | | | $ | 75.4 | | | $ | (170.2) | | | $ | 309.7 | |
| Operating income (loss), 2017 | | 262.6 | | | 114.3 | | | 73.1 | | | (137.1) | | | 312.9 | |
| $ Change | | $ | 9.6 | | | $ | 18.0 | | | $ | 2.3 | | | $ | (33.1) | | | $ | (3.2) | |
| % Change | | 3.6 | % | | 15.8 | % | | 3.2 | % | | (24.1) | % | | (1.0) | % |
| | | | | | | | | | |
| Items impacting operating income in 2018 | | $ | 21.9 | | | $ | 9.1 | | | $ | 14.0 | | | $ | 8.2 | | | $ | 53.2 | |
| Adjusted operating income, 2018 (Non-GAAP) | | $ | 294.1 | | | $ | 141.4 | | | $ | 89.4 | | | $ | (162.0) | | | $ | 362.9 | |
| | | | | | | | | | |
| Items impacting operating income in 2017 | | $ | 20.1 | | | $ | 7.9 | | | $ | 13.4 | | | $ | 2.7 | | | $ | 44.1 | |
| Adjusted operating income, 2017 (Non-GAAP) | | $ | 282.7 | | | $ | 122.2 | | | $ | 86.5 | | | $ | (134.4) | | | $ | 357.0 | |
| | | | | | | | | | |
| Adjusted % Change (Non-GAAP) | | 4.0 | % | | 15.7 | % | | 3.4 | % | | (20.5) | % | | 1.7 | % |
| | | | | | | | | | |
| Plus the % impact of: | | | | | | | | | | |
| Foreign exchange | | 0.3 | % | | (0.2) | % | | 0.1 | % | | 0.3 | % | | 0.4 | % |
| Copper pricing | | — | % | | (2.0) | % | | — | % | | — | % | | (0.7) | % |
| Organic (Non-GAAP) | | 3.9 | % | | 13.6 | % | | 3.3 | % | | (23.8) | % | | (1.3) | % |
NSS – Operating income was $325.5 million, or 6.9% of sales, in 2019, compared to $272.2 million, or 6.3% of sales, in 2018 and $262.6 million, or 6.4% of sales, in 2017. The increase in operating income in 2019 was driven by gross margin improvement and the favorable impact from acquisitions. The increase in operating income in 2018 compared to 2017 was due to sales growth in both the network infrastructure and security portions of the business and gross margin improvement. NSS delivered adjusted operating income of $341.9 million, $294.1 million, and $282.7 million in 2019, 2018 and 2017, respectively, resulting in adjusted operating margin of 7.3%, 6.8% and 6.9% in 2019, 2018 and 2017.
ANIXTER INTERNATIONAL INC.
EES – Operating income was $139.5 million, or 5.9% of sales, in 2019, compared to $132.3 million, or 5.6% of sales, in 2018 and $114.3 million, or 5.1% of sales, in 2017. The increase in operating income in 2019 was driven by gross margin improvement and expense leverage. The increase in operating income in 2018 compared to 2017 was driven by the favorable impacts of higher copper prices combined with sales growth and gross margin improvement. EES adjusted operating income of $145.4 million in 2019 compares to adjusted operating income of $141.4 million in 2018 and $122.2 million in 2017, resulting in adjusted operating margin of 6.2%, 6.0% and 5.5% in 2019, 2018 and 2017, respectively.
UPS– Operating income was $83.5 million, or 4.6% of sales in 2019, compared to $75.4 million, or 4.4%, in 2018 and $73.1 million, or 4.6% of sales, in 2017. The increase in operating income in 2019 was driven by sales growth and gross margin improvement. The increase in operating income in 2018 compared to 2017 was driven by sales growth and expense discipline. UPS adjusted operating income of $96.6 million in 2019 compares to adjusted operating income of $89.4 million in 2018 and $86.5 million in 2017, resulting in adjusted operating margin of 5.4%, 5.2% and 5.4% in 2019, 2018 and 2017, respectively.
Interest Expense
Interest expense was $77.1 million, $76.3 million and $74.7 million in 2019, 2018 and 2017, respectively. Our weighted-average cost of borrowings was 5.5% in 2019 and 5.3% in 2018 and 2017, respectively.
Other, Net
Other, net income of $3.0 million in 2019 compares to expense of $10.2 million and $0.6 million in 2018 and 2017, respectively. The components of other, net are further described below.
Due to fluctuations in the U.S. dollar ("USD") against certain foreign currencies, primarily in Europe, Canada and Latin America, we recorded foreign exchange losses of $2.2 million, $8.2 million and $3.4 million in 2019, 2018 and 2017, respectively.
The combined effect of changes in both the equity and bond markets resulted in changes in the cash surrender value of our company owned life insurance policies associated with our sponsored deferred compensation program. We recorded a gain on the cash surrender value of life insurance policies of $4.4 million in 2019, a loss of $1.3 million in 2018 and a gain of $2.4 million in 2017.
We recognized net periodic pension benefit of $2.4 million, $5.1 million and $0.2 million in 2019, 2018 and 2017 respectively.
In the fourth quarter of 2018, we retired our 5.625% Senior notes due 2019 and recognized a loss on extinguishment of debt of $4.6 million.
Income Taxes
The income tax provision for 2019 was $30.5 million compared to $66.9 million in 2018 and $128.6 million in 2017. Our effective tax rate was 10.4%, 30.0% and 54.1% in 2019, 2018 and 2017, respectively. Our effective tax rate for 2019 included a $45.9 million tax benefit related to the reversal of deferred income tax valuation allowances, partially offset by $0.8 million of tax expense related to prior year tax positions. Our effective tax rate for 2018 included $2.1 million of tax benefit related to the impact of tax legislation and a $1.4 million tax benefit related to the reversal of deferred income tax valuation allowances, partially offset by $0.7 million of tax expense related to domestic permanent tax differences and $0.1 million of tax expense related to prior year tax positions. Our effective tax rate for 2017 included $35.6 million of tax expense related to the impact of tax legislation and $1.3 million of tax expense related to prior year tax positions. Excluding the impact of these items as well as the other items impacting the comparability of results discussed above, the adjusted effective tax rate in 2019 was24.8% compared to 29.2% in 2018 and 37.8% in 2017. The decrease in our adjusted effective tax rate in 2019 was due to a change in the country mix of earnings and associated tax benefits from our continued movement to a U.S.-center-led business model, with the major impact coming from a lower U.S. tax rate on foreign derived income and the ability to utilize foreign tax credits, previously fully reserved. The decrease in our adjusted effective tax rate in 2018 compared to 2017 was primarily due to a favorable tax impact from the December 22, 2017 Tax Cuts and Jobs Act (the "Act"). Under the Act, the statutory U.S. federal tax rate was reduced from 35% to 21% effective January 1, 2018. The benefit from this rate reduction was partially offset by other newly enacted tax provisions.
ANIXTER INTERNATIONAL INC.
Undistributed earnings of our foreign subsidiaries amounted to approximately $680.0 million at January 3, 2020. The Act converted the U.S. system of taxing foreign earnings from a worldwide system to a territorial system. Future distributions of foreign earnings by our affiliates abroad will no longer result in U.S. taxation. In converting to a territorial system, the Act levied a one-time transition tax on deferred foreign earnings as of 2017. We have calculated the net combined U.S. tax impact on this deemed repatriation to be approximately $47.2 million and plan to elect to pay the federal portion of this tax liability in installments over 8 years. Despite the conversion to a territorial system, we consider the undistributed earnings of our foreign subsidiaries to be indefinitely reinvested. Upon distribution of those earnings in the form of dividends or otherwise, we may be subject to withholding taxes payable to the various foreign countries. With respect to the countries that have undistributed earnings as of January 3, 2020, according to the foreign laws and treaties in place at that time, estimated foreign jurisdiction withholding taxes of approximately $37.6 million would be payable upon the remittance of all earnings at January 3, 2020.
The Act reduced the U.S. corporate tax rate to 21%, which resulted in an adjustment to our U.S. deferred tax assets and liabilities. This adjustment increased our earnings for 2017 by $14.4 million. The impact was revised and a deferred tax adjustment of $0.7 million was recorded as a decrease in earnings for the quarter ending December 28, 2018.
EBITDA and Adjusted EBITDA
| | | | | | | | | | | | | | | | | | | | | | | | | | | | | | | | |
| 2019 EBITDA and Adjusted EBITDA by Segment: | | | | | | | | | | |
| | Year Ended January 3, 2020 | | | | | | | | |
| (In millions) | | NSS | | EES | | UPS | | Corporate | | Total |
| Net income (loss) | | $ | 325.5 | | | | $ | 139.5 | | | | $ | 83.5 | | | | $ | (285.6) | | | $ | 262.9 | |
| Interest expense | | — | | | — | | | — | | | 77.1 | | | 77.1 | |
| Income taxes | | — | | | — | | | — | | | 30.5 | | | 30.5 | |
| Depreciation | | 9.4 | | | 7.3 | | | 3.7 | | | 16.8 | | | 37.2 | |
| Amortization of intangible assets | | 16.4 | | | 5.4 | | | 13.2 | | | — | | | 35.0 | |
| EBITDA | | $ | 351.3 | | | $ | 152.2 | | | $ | 100.4 | | | $ | (161.2) | | | $ | 442.7 | |
| | | | | | | | | | |
Total of items impacting operating income (a) | | $ | — | | | $ | 0.5 | | | $ | (0.1) | | | $ | 12.1 | | | $ | 12.5 | |
| Foreign exchange and other non-operating (income) | | — | | | — | | | — | | | (3.0) | | | (3.0) | |
| Stock-based compensation | | 2.7 | | | 1.8 | | | 0.6 | | | 14.9 | | | 20.0 | |
| Adjusted EBITDA | | $ | 354.0 | | | $ | 154.5 | | | $ | 100.9 | | | $ | (137.2) | | | $ | 472.2 | |
| | | | | | | | | | |
(a) Items impacting operating income excludes amortization of intangible assets in the calculation of adjusted EBITDA as amortization is already added back in the EBITDA calculation.
| | | | | | | | | | | | | | | | | | | | | | | | | | | | | | | | |
| 2018 EBITDA and Adjusted EBITDA by Segment: | | | | | | | | | | |
| | Year Ended December 28, 2018 | | | | | | | | |
| (In millions) | | NSS | | EES | | UPS | | Corporate | | Total |
| Net income (loss) | | $ | 272.2 | | | $ | 132.3 | | | $ | 75.4 | | | $ | (323.6) | | | $ | 156.3 | |
| Interest expense | | — | | | — | | | — | | | 76.3 | | | 76.3 | |
| Income taxes | | — | | | — | | | — | | | 66.9 | | | 66.9 | |
| Depreciation | | 3.8 | | | 2.4 | | | 3.6 | | | 21.9 | | | 31.7 | |
| Amortization of intangible assets | | 17.0 | | | 7.0 | | | 13.3 | | | — | | | 37.3 | |
| EBITDA | | $ | 293.0 | | | $ | 141.7 | | | $ | 92.3 | | | $ | (158.5) | | | $ | 368.5 | |
| | | | | | | | | | |
Total of items impacting operating income (a) | | $ | 4.9 | | | $ | 2.1 | | | $ | 0.7 | | | $ | 5.6 | | | $ | 13.3 | |
| Foreign exchange and other non-operating expense | | — | | | — | | | — | | | 10.2 | | | 10.2 | |
| Stock-based compensation | | 1.8 | | | 1.4 | | | 0.6 | | | 15.1 | | | 18.9 | |
| Adjusted EBITDA | | $ | 299.7 | | | $ | 145.2 | | | $ | 93.6 | | | $ | (127.6) | | | $ | 410.9 | |
| | | | | | | | | | |
(a) Items impacting operating income excludes amortization of intangible assets and CEO retirement agreement expense in the calculation of adjusted EBITDA as amortization is already added back in the EBITDA calculation and CEO retirement agreement expense is added back as part of stock-based compensation.
ANIXTER INTERNATIONAL INC.
| | | | | | | | | | | | | | | | | | | | | | | | | | | | | | | | |
| 2017 EBITDA and Adjusted EBITDA by Segment: | | | | | | | | | | |
| | Year Ended December 29, 2017 | | | | | | | | |
| (In millions) | | NSS | | EES | | UPS | | Corporate | | Total |
| Net income (loss) | | $ | 262.6 | | | $ | 114.3 | | | $ | 73.1 | | | $ | (341.0) | | | $ | 109.0 | |
| Interest expense | | — | | | — | | | — | | | 74.7 | | | 74.7 | |
| Income taxes | | — | | | — | | | — | | | 128.6 | | | 128.6 | |
| Depreciation | | 3.1 | | | 2.4 | | | 3.9 | | | 18.8 | | | 28.2 | |
| Amortization of intangible assets | | 14.4 | | | 8.4 | | | 13.3 | | | — | | | 36.1 | |
| EBITDA | | $ | 280.1 | | | $ | 125.1 | | | $ | 90.3 | | | $ | (118.9) | | | $ | 376.6 | |
| | | | | | | | | | |
Total of items impacting operating income (a) | | $ | 5.7 | | | $ | (0.5) | | | $ | 0.1 | | | $ | 2.7 | | | $ | 8.0 | |
| Foreign exchange and other non-operating expense | | — | | | — | | | — | | | 0.6 | | | 0.6 | |
| Stock-based compensation | | 2.3 | | | 1.3 | | | 1.7 | | | 12.8 | | | 18.1 | |
| Adjusted EBITDA | | $ | 288.1 | | | $ | 125.9 | | | $ | 92.1 | | | $ | (102.8) | | | $ | 403.3 | |
| | | | | | | | | | |
(a) Items impacting operating income excludes amortization of intangible assets in the calculation of adjusted EBITDA as amortization is already added back in the EBITDA calculation above.
NSS – NSS adjusted EBITDA of $354.0 million in 2019 compares to $299.7 million in 2018 and $288.1 million in 2017. The increases in adjusted EBITDA in 2019 compared to 2018 and 2018 compared 2017 were due to gross margin improvement and the favorable impact from acquisitions.
EES– EES adjusted EBITDA of $154.5 million in 2019 compares to $145.2 million in 2018 and $125.9 million in 2017. The increase in adjusted EBITDA in 2019 compared to 2018 was driven by gross margin improvement. The year-over year increase in 2018 adjusted EBITDA was driven by gross margin improvement, strong expense leverage associated with the sales growth and the benefit of higher copper prices.
UPS– UPS adjusted EBITDA of $100.9 million in 2019 compares to $93.6 million in 2018 and $92.1 million in 2017. The increase in adjusted EBITDA in 2019 compared to 2018 was driven by sales growth and gross margin improvement. The year-over-year increase in 2018 adjusted EBITDA was driven by sales growth and expense discipline.
ANIXTER INTERNATIONAL INC.
Financial Liquidity and Capital Resources
Cash Flow
As a distributor, our use of capital is largely for working capital to support our revenue growth. Capital commitments for property and equipment are limited to information technology assets, warehouse equipment, office furniture and fixtures and leasehold improvements, because we operate almost entirely from leased facilities. Therefore, in any given reporting period, the amount of cash consumed or generated by operations other than from net earnings will primarily be due to changes in working capital.
In periods when sales are increasing, the expanded working capital needs will be funded first by cash from operations and then from additional borrowings. In periods when sales are decreasing, we will have improved cash flows due to reduced working capital requirements. During such periods, we will use the expanded cash flow to reduce the amount of leverage in our capital structure until such time as economic conditions improve and growth resumes. Also, we will, from time to time, issue or retire borrowings or equity in an effort to maintain a cost-effective capital structure consistent with our anticipated capital requirements.
Net cash provided by operations was $227.9 million in 2019, which compares to $137.7 million of cash provided by operations in 2018. Net cash provided by operations in 2018 of $137.7 million compares to $183.8 million in 2017. The increase in net cash provided by operations in 2019 compared to 2018 reflects growth in net income and an improvement in working capital efficiencies. The decrease in 2018 compared to 2017 was primarily due to higher investment in working capital to support growth in the business.
Net cash used in investing activities was $37.1 million in 2019, which primarily related to capital expenditures. This compares to net cash used in investing activities of $183.4 million in 2018, which included $150.1 million for the acquisition of security businesses in Australia and New Zealand and $42.4 million for capital expenditures. Net cash used in investing activities was $41.1 million in 2017, which related to capital expenditures.
Net cash used in financing activities was $195.9 million in 2019 compared to net cash provided by financing activities of $1.6 million in 2018 and net cash used in financing activities of $136.1 million in 2017. During 2019, we had net repayments on our long-term debt of $198.5 million. During 2018, we had net borrowings on our revolving lines of credit of $110.0 million and $246.9 million from the issuance of Notes due 2025, offset by the repayment of our Notes due 2019, which had a maturity value of $350.0 million and a make whole premium of $3.9 million. During 2017, we had net repayments on our revolving lines of credit of $40.7 million and a repayment of our Canadian Term Loan of $100.2 million.
Liquidity and Capital Resources
Our capital structure liquidity position provides us with the flexibility to invest in the growth of the business. We will continue to balance our focus on sales and earnings growth with continuing efforts in cost control and working capital management. Maintaining a strong and flexible financial position continues to be vital to funding investment in strategic long-term growth initiatives.
Certain debt agreements entered into by our operating subsidiaries contain various restrictions, including restrictions on payments to the Company. These restrictions have not had, nor are expected to have, an adverse impact on our ability to meet cash obligations.
At January 3, 2020, our primary liquidity source was the U.S. accounts receivable asset based revolving credit facility in an aggregate committed amount of $600.0 million ("Receivables Facility") and the U.S. inventory asset based revolving credit facility in an aggregate committed amount of $150.0 million ("Inventory Facility"). At January 3, 2020, there was $56.0 million of borrowings under the Receivables Facility, and there were no borrowings under the Inventory Facility.
Receivables Facility
On October 5, 2015, we, through our wholly-owned subsidiary, Anixter Receivables Corporation ("ARC"), entered into a Receivables Facility, which is a receivables based revolving credit facility in an aggregate committed amount of $600.0 million. Borrowings under the Receivables Facility are secured by a first lien on all assets of ARC and supported by an unsecured guarantee by Anixter International.
The Receivables Facility has a borrowing base of 85% of eligible receivables, subject to certain reserves.
ANIXTER INTERNATIONAL INC.
In connection with the entry into the Receivables Facility, on October 5, 2015, Anixter Inc. and ARC entered into a Third Amended and Restated Receivables Sale Agreement (the "Amended and Restated RSA"), which amended and restated the existing Second Amended and Restated Sales Agreement. The purpose of the Amended and Restated RSA is (i) to reflect the entry into the Receivables Facility and the termination of the Second Amended and Restated Receivables Purchase Agreement; and (ii) to include in the receivables sold by Anixter Inc. to ARC receivables originated by Tri-Northern Holdings, Inc. and its subsidiaries (collectively, the "Tri-Ed Subsidiaries") and subsidiaries acquired in the Power Solutions acquisition (the "Power Solutions Subsidiaries").
On November 16, 2018, Anixter amended the Receivables Facility to extend the maturity date from October 5, 2020 to November 16, 2023.
Inventory Facility
On October 5, 2015, we and certain of our wholly-owned subsidiaries, including the Tri-Ed Subsidiaries and Power Solutions Subsidiaries, entered into the Inventory Facility, an asset based lending revolving credit facility, in an aggregate committed amount of $150.0 million. Borrowings under the Inventory Facility are secured by a first lien on Anixter Inc.'s and certain of its subsidiaries' personal property and supported by a guarantee by Anixter International.
The Inventory Facility has a borrowing base, (a) with respect to appraised eligible domestic inventory, of the lesser of (i) 85% of the net orderly liquidation value of such inventory and (ii) 75% of book value of such inventory, plus, (b) with respect to eligible domestic inventory not appraised, 40% of the net orderly liquidation value of such inventory, less (c) certain reserves.
On November 16, 2018, Anixter amended the Inventory Facility to extend the maturity date from October 5, 2020 to November 16, 2023.
The Receivables Facility and the Inventory Facility (collectively, the "Combined Facilities")
The Combined Facilities drawn pricing will range from LIBOR plus 125 basis points when the combined unused availability (the "Combined Availability") under the Combined Facilities is greater than $500.0 million or LIBOR plus 150 basis points when Combined Availability is less than $500.0 million. Undrawn fees are 25 basis points.
Acquisitions and restricted payments will be permitted, subject to, among other things, (i) Combined Availability of at least $131.3 million after giving pro forma effect to any acquisition or restricted payment or (ii) (a) Combined Availability of at least $93.8 million and (b) maintenance of a minimum fixed charge coverage ratio of at least 1.1x, after giving pro forma effect to the acquisition or restricted payment.
The Combined Facilities provides for customary representations and warranties and customary events of default, generally with corresponding grace periods, including, without limitation, payment defaults with respect to the facility, covenant defaults, cross-defaults to other agreements evidencing material indebtedness, certain judgments and events of bankruptcy.
Canadian Term Loan
On October 5, 2015, we, through our wholly-owned subsidiaries, Anixter Canada Inc. and Tri-Ed ULC, entered into a $300.0 million Canadian dollars (equivalent to approximately $225.0 million USD) Canadian Term Loan. The Canadian Term Loan was guaranteed by all present and future material Canadian subsidiaries of Anixter Canada Inc. and Tri-Ed ULC as well as Anixter Mid Holdings BV. The Canadian Term Loan was secured by a first priority security interest in all of the assets of Anixter Canada Inc. and each of its Canadian subsidiaries, which comprise the borrowing group.
In the fourth quarter of 2017, the Company paid off the Canadian Term Loan in full.
Our debt-to-capital ratio decreased from 44.4% at December 28, 2018 to 36.3% at January 3, 2020, below our targeted range of 45-50%.
We are in compliance with all of our covenants and believe that there is adequate margin between the covenant ratios and the actual ratios given the current trends of the business. For further information, including information regarding our credit arrangements, see Note 5. "Debt" in the Notes to the Consolidated Financial Statements.
ANIXTER INTERNATIONAL INC.
Contractual Cash Obligations and Commitments
At the end of fiscal 2019, we have various contractual cash obligations and commitments and the following table represents the associated payments due by period. The amounts due by period will not necessarily correlate to amounts reflected as short-term and long-term liabilities on our Consolidated Balance Sheets at the end of any given period. This is due to the difference in the recognition of liabilities of non-cancellable obligations for accounting purposes at the end of a given period as well giving consideration to our intent and ability to settle such contractual commitments that might be considered short term.
| | | | | | | | | | | | | | | | | | | | | | | | | | | | | | | | | | | | | | | | | | | | |
| (In millions) | | Payments due by period | | | | | | | | | | | | |
| | | 2020 | | 2021 | | 2022 | | 2023 | | 2024 | | Beyond 2024 | | Total |
Debt (a) | | $ | 8.8 | | | $ | 398.3 | | | $ | — | | | $ | 403.9 | | | $ | — | | | $ | 247.3 | | | $ | 1,058.3 | |
Contractual Interest (b) | | 58.1 | | | 53.0 | | | 37.6 | | | 21.0 | | | 15.0 | | | 13.8 | | | 198.5 | |
Purchase Obligations (c) | | 685.3 | | | 40.8 | | | 37.2 | | | 38.6 | | | 26.2 | | | 19.5 | | | 847.6 | |
| Operating Leases | | 75.4 | | | 59.2 | | | 54.4 | | | 40.8 | | | 32.0 | | | 81.6 | | | 343.4 | |
Deferred Compensation Liability (d) | | 3.8 | | | 4.7 | | | 4.2 | | | 3.2 | | | 3.1 | | | 26.6 | | | 45.6 | |
Pension Plans (e) | | 7.7 | | | — | | | — | | | — | | | — | | | — | | | 7.7 | |
| Total Obligations | | $ | 839.1 | | | $ | 556.0 | | | $ | 133.4 | | | $ | 507.5 | | | $ | 76.3 | | | $ | 388.8 | | | $ | 2,501.1 | |
Liabilities related to unrecognized tax benefits of $2.2 million were excluded from the table above, as we cannot reasonably estimate the timing of cash settlements with taxing authorities. Various of our foreign subsidiaries had aggregate cumulative net operating loss ("NOL") carryforwards for foreign income tax purposes of approximately $89.7 million at January 3, 2020, which are subject to various provisions of each respective country. Approximately $71.9 million of the NOL carryforwards may be carried forward indefinitely. The remaining NOL carryforwards expire at various times between 2020, and 2028. See Note 7. "Income Taxes" in the Notes to the Consolidated Financial Statements for further information related to unrecognized tax benefits.
(a)The Notes due 2021, the Notes due 2023 and the Notes due 2025 require payments upon retirement of $400.0 million in 2021, $350.0 million in 2023 and $250.0 million in 2025, respectively. The $56.0 million outstanding on our revolving lines of credit requires payment in 2023.
(b)Interest payments on debt outstanding at January 3, 2020 through maturity. For variable rate debt, we computed contractual interest payments based on the borrowing rate at January 3, 2020.
(c)Purchase obligations primarily consist of purchase orders for products sourced from unaffiliated third party suppliers, in addition to commitments related to various capital expenditures. Many of these obligations may be canceled with limited or no financial penalties.
(d)A non-qualified deferred compensation plan was implemented on January 1, 1995. The plan provides for benefit payments upon retirement, death, disability, termination or other scheduled dates determined by the participant. At January 3, 2020, the deferred compensation liability was $45.6 million. In an effort to ensure that adequate resources are available to fund the deferred compensation liability, we have purchased variable, separate account life insurance policies on the plan participants with benefits accruing to us. At January 3, 2020, the cash surrender value of these company-owned life insurance policies was $41.4 million.
(e)The majority of our various pension plans are non-contributory and, with the exception of the U.S. and Canada, cover substantially all full-time domestic employees and certain employees in other countries. Retirement benefits are provided based on compensation as defined in the plans. Our policy is to fund these plans as required by the Employee Retirement Income Security Act, the Internal Revenue Service and local statutory law. At January 3, 2020, the current portion of our net pension liability of $71.0 million was $1.1 million. We currently estimate that we will contribute $7.7 million to our foreign and domestic pension plans in 2020, which includes $1.1 million of benefit payments directly to participants of our two domestic unfunded non-qualified pension plans. Due to the future impact of various market conditions, rates of return and changes in plan participants, we cannot provide a meaningful estimate of our future contributions beyond 2020.
Critical Accounting Policies and Estimates
We believe that the following are critical areas of accounting that either require significant judgment by management or may be affected by changes in general market conditions outside the control of management. As a result, changes in estimates and general market conditions could cause actual results to differ materially from future expected results. Historically, with the exception of any goodwill and related long-lived asset impairment charges, our estimates in these critical areas have not differed materially from actual results.
ANIXTER INTERNATIONAL INC.
Acquisitions
We account for acquired businesses using the acquisition method of accounting. This method requires that most assets acquired and liabilities assumed be recognized as of the acquisition date. We allocate the purchase price of acquired businesses to the tangible and intangible assets acquired and liabilities assumed based on estimated fair values. The excess of the purchase price over the identifiable assets acquired and liabilities assumed is recorded as goodwill. We engage a third party professional service provider to assist us in determining the fair values of the assets acquired and liabilities assumed. Such valuations require management to make significant estimates and assumptions, especially with respect to intangible assets. Critical estimates in valuing certain intangible assets include, but are not limited to, future expected cash flows from customer relationships, customer attrition rates and discount rates. Management's estimates of fair value are based upon assumptions believed to be reasonable, but which are inherently uncertain and unpredictable.
Allowance for Doubtful Accounts
At January 3, 2020 and December 28, 2018, we reported net accounts receivable of $1,540.3 million and $1,600.0 million, respectively. We carry our accounts receivable at their face amounts less an allowance for doubtful accounts which was $30.4 million and $39.9 million at the end of 2019 and 2018, respectively. On a regular basis, we evaluate our accounts receivable and establish the allowance for doubtful accounts based on a combination of specific customer circumstances, as well as credit conditions and history of write-offs and collections. Each quarter we segregate the doubtful receivable balances into the following major categories and determine the bad debt reserve required as outlined below:
•Customers that are no longer paying their balances are reserved based on the historical write-off percentages;
•Risk accounts are individually reviewed and the reserve is based on the probability of potential default. We continually monitor payment patterns of customers, investigate past due accounts to assess the likelihood of collection, and monitor industry and economic trends to estimate required allowances; and
•The outstanding balance for customers who have declared bankruptcy is reserved at the outstanding balance less the estimated net realizable value.
If circumstances related to the above factors change, our estimates of the recoverability of amounts due to us could be reduced or increased by a material amount.
Inventory Obsolescence
At January 3, 2020 and December 28, 2018, we reported inventory of $1,354.7 million and $1,440.4 million, respectively (net of inventory reserves of $50.0 million and $51.5 million, respectively). Each quarter we review for excess inventories and make an assessment of the net realizable value. There are many factors that management considers in determining whether or not the amount by which a reserve should be established. These factors include the following:
•Return or rotation privileges with vendors
•Price protection from vendors
•Expected future usage
•Whether or not a customer is obligated by contract to purchase the inventory
•Current market pricing
•Historical consumption experience
•Risk of obsolescence
If circumstances related to the above factors change, there could be a material impact on the net realizable value of the inventories.
Pension Expense
Accounting rules related to pensions generally reduce the recognition of actuarial gains and losses in the net benefit cost, as any significant actuarial gains/losses are amortized over the remaining service lives of the plan participants. These actuarial gains and losses are mainly attributable to the return on plan assets that differ from that assumed and differences in the obligation due to changes in the discount rate, plan demographic changes and other assumptions.
ANIXTER INTERNATIONAL INC.
The measurement date for all of our plans is December 31st. Accordingly, at the end of each fiscal year, we determine the discount rate to be used to discount the plan liabilities to their present value. The discount rate reflects the current rate at which the pension liabilities could be effectively settled at the end of the year. In estimating this rate at the end of 2019 and 2018, we reviewed rates of return on relevant market indicies and concluded the Willis Towers Watson Global Rate Link Model was consistent with observable market conditions and industry standards for developing spot rate curves. These rates are adjusted to match the duration of the liabilities associated with the pension plans.
In 2019 and 2018, the Society of Actuaries released new mortality tables and improvement projection scales. After reviewing the new information as well as the defined benefit plan’s population, the Company updated U.S. mortality improvement assumptions in 2019 and 2018 for purposes of determining its mortality assumption used in the U.S. defined benefit plans' liability calculation. In 2019, the Company selected the white collar version of the Pri-2012 tables projected generationally using the Society of Actuaries’ MP-2019 projection scale. The updated U.S. mortality assumptions resulted in an increase of $5.2 million to the benefit obligation as of the end of 2019, prior to reflecting the discount rate change. In 2018, the Company adjusted the long term mortality improvement projection assumption to 80% of the Society of Actuaries’ mortality improvement scale to reflect the Company’s long-term expectations. The updated U.S. mortality assumptions resulted in a decrease of $2.8 million to the benefit obligation as of the end of 2018, prior to reflecting the discount rate change.
We recognized net periodic cost of $6.4 million in 2019, $4.3 million in 2018 and $10.4 million in 2017.
A significant element in determining our net periodic benefit cost in accordance with U.S. GAAP is the expected return on plan assets. For 2019, we had assumed that the weighted-average expected long-term rate of return on plan assets would be 6.01%. This expected return on plan assets is included in the net periodic benefit cost for the fiscal year ended 2019. As a result of the combined effect of valuation changes in both the equity and bond markets, the plan assets produced an actual gain of approximately 16.8% in 2019 and an actual loss of approximately 4.2% in 2018. The fair value of plan assets is $515.5 million at the end of fiscal 2019, compared to $448.9 million at the end of fiscal 2018. The difference between the expected return and the actual return on plan assets is amortized into expense over the service lives of the plan participants. These amounts are reflected on our balance sheet through charges to "Accumulated other comprehensive loss," a component of "Stockholders’ Equity" in the Consolidated Balance Sheets.
At January 3, 2020 and December 28, 2018, we determined the consolidated weighted-average discount rate of all plans to be 2.75% and 3.59%, respectively, and used these rates to measure the pension benefit obligation ("PBO") at the end of each respective fiscal year end. Due primarily to actuarial losses, the PBO increased to $586.5 million at the end of fiscal 2019 from $504.1 million at the end of fiscal 2018. Our consolidated net unfunded status was $71.0 million at the end of fiscal 2019 compared to $55.2 million at the end of 2018.
The assets of the various defined benefit plans are held in separate independent trusts and managed by independent third party advisors. The investment objective of both the Domestic and Foreign Plans is to ensure, over the long-term life of the plans, an adequate level of assets to fund the benefits to employees and their beneficiaries at the time they are payable. In meeting this objective, we seek to achieve a level of absolute investment return consistent with a prudent level of portfolio risk. Our risk preference is to refrain from exposing the plans to higher volatility in pursuit of potential higher returns.
Due to its long duration, the pension liability is very sensitive to changes in the discount rate. As a sensitivity measure, the effect of a 50-basis-point decline in the assumed discount rate would result in an increase in the 2020 pension expense of approximately $4.0 million, and an increase in the projected benefit obligations at January 3, 2020 of $54.0 million. A 50-basis-point decline in the assumed rate of return on assets would result in an increase in the 2020 expense of approximately $2.0 million.
ANIXTER INTERNATIONAL INC.
Goodwill and Indefinite-Lived Intangible Assets
We evaluate goodwill for impairment annually in the third quarter and when events or changes in circumstances indicate the carrying value of reporting units might exceed their current fair values. We assess goodwill for impairment by first performing a qualitative assessment, which considers specific factors, based on the weight of evidence, and the significance of all identified events and circumstances in the context of determining whether it is more likely than not that the fair value of a reporting unit is less than its carrying amount. If it is determined that it is more likely than not that the fair value of a reporting unit is less than its carrying amount using the qualitative assessment, we perform the two-step impairment test. From time to time, we may also bypass the qualitative assessment and proceed directly to the two-step impairment test. The first step of the impairment test is to identify a potential impairment by comparing the fair value of a reporting unit with its carrying amount. The estimates of fair value of a reporting unit are determined using the income approach and the market approach as described below. If step one of the test indicates a carrying value above the estimated fair value, the second step of the goodwill impairment test is performed by comparing the implied fair value of the reporting unit’s goodwill with the carrying amount of that goodwill. The implied residual value of goodwill is determined in the same manner as the amount of goodwill recognized in a business combination.
The income approach is a quantitative evaluation to determine the fair value of the reporting unit. Under the income approach we determine the fair value based on estimated future cash flows discounted by an estimated weighted-average cost of capital, which reflects the overall level of inherent risk of the reporting unit and the rate of return a market participant would expect to earn. The inputs used for the income approach were significant unobservable inputs, or Level 3 inputs, as described in the accounting fair value hierarchy. Estimated future cash flows were based on our internal projection models, industry projections and other assumptions deemed reasonable by management.
The market approach measures the fair value of a reporting unit through the analysis of recent sales, offerings, and financial multiples (sales or earnings before interest, tax, depreciation and amortization ("EBITDA")) of comparable businesses, which would be considered Level 2 in the fair value hierarchy. Consideration is given to the financial conditions and operating performance of the reporting unit being valued relative to those publicly-traded companies operating in the same or similar lines of business.
In connection with our annual assessment of goodwill at the beginning of the third quarter of 2019, we bypassed the qualitative assessment and performed a quantitative test for all reporting units and utilized a combination of the income and market approaches. As a result of this assessment, we concluded that no impairment existed and the carrying amount of goodwill to be fully recoverable.
A possible indicator of goodwill impairment is the relationship of a company’s market capitalization to its book value. During the third quarter, our market capitalization exceeded our book value and there were no impairment losses identified as a result of our annual test. Fair value determinations require considerable judgment and are sensitive to changes in underlying assumptions and factors. As a result, there can be no assurance that the estimates and assumptions made for purposes of the goodwill and indefinite-lived intangible impairment test will prove to be an accurate prediction of future results.
Other than goodwill, our only indefinite-lived intangible assets are trade names. In 2017, we recorded an impairment charge of $5.7 million related to certain indefinite-lived trade names in our NSS reporting unit. This impairment charge is included in "Operating expenses" on our Consolidated Statement of Income. The impairment charge was recorded as we no longer plan to use certain trade names on certain products. All remaining indefinite-lived trade names are expected to be used on existing products for the foreseeable future.
Our long-lived assets consist of definite-lived intangible assets which are primarily related to customer relationships, as well as property and equipment which consists of office furniture and equipment, buildings, computer software and hardware, warehouse equipment and leasehold improvements. We evaluate the recoverability of the carrying amount of our long-lived assets whenever events or circumstances indicate that the carrying amount of an asset may not be fully recoverable. If impairment indicators are present, we assess whether the future estimated undiscounted cash flows attributable to the assets in question are greater than their carrying amounts. If these future estimated cash flows are less than carrying value, we then measure an impairment loss for the amount that carrying value exceeds fair value of the assets.
ANIXTER INTERNATIONAL INC.
Deferred Tax Assets
At January 3, 2020 and December 28, 2018, our valuation allowance for deferred tax assets was $38.3 million and $79.1 million, respectively. We maintain valuation allowances to reduce deferred tax assets if it is more likely than not that some portion or all of the deferred tax asset will not be realized. Changes in valuation allowances are included in our tax provision in the period of change. In determining whether a valuation allowance is warranted, management evaluates factors such as prior earnings history, expected future earnings, carryback and carryforward periods and tax strategies that could potentially enhance the likelihood of realization of a deferred tax asset. Assessments are made at each balance sheet date to determine how much of each deferred tax asset is realizable. These estimates are subject to change in the future, particularly if earnings of a particular subsidiary are significantly higher or lower than expected, or if management takes operational or tax planning actions that could impact the future taxable earnings of a subsidiary.
Uncertain Tax Positions
In the normal course of business, we are audited by federal, state and foreign tax authorities, and are periodically challenged regarding the amount of taxes due. These challenges relate primarily to the timing and amount of deductions and the allocation of income among various tax jurisdictions. Management believes our tax positions comply with applicable tax law and we intend to defend our positions. We recognize the benefit of tax positions when a benefit is more likely than not (i.e., greater than 50% likely) to be sustained on its technical merits. Recognized tax benefits are measured at the largest amount that is more likely than not to be sustained, based on cumulative probability, in final settlement of the position. Our effective tax rate in a given period could be impacted if, upon final resolution with taxing authorities, we prevail on positions for which unrecognized tax benefits have been accrued, or are required to pay amounts in excess of accrued unrecognized tax benefits.
As of January 3, 2020, the aggregate amount of global uncertain unrecognized tax benefits and related interest and penalties recorded was approximately $3.0 million. The uncertain tax positions cover a range of issues, including intercompany charges and withholding taxes, and involve various taxing jurisdictions.
New Accounting Pronouncements
For information about recently issued accounting pronouncements, see Note 1. "Summary of Significant Accounting Policies" in the Notes to our Consolidated Financial Statements.
ANIXTER INTERNATIONAL INC.
ITEM 7A. QUANTITATIVE AND QUALITATIVE DISCLOSURES ABOUT MARKET RISK.
We are exposed to the impact of fluctuations in foreign currencies and interest rate changes, as well as changes in the market value of our financial instruments. We periodically enter into derivatives in order to minimize these risks, but not for trading purposes. Our strategy is to negotiate terms for our derivatives and other financial instruments to be highly effective, such that the change in the value of the derivative offsets the impact of the underlying hedged item (e.g., various foreign currency denominated accounts). The counterparties to our derivative contracts have investment-grade credit ratings. We expect the creditworthiness of our counterparties to remain intact through the term of the transactions. We regularly monitor the creditworthiness of our counterparties to ensure no issues exist which could affect the value of the derivatives. Any resulting gains or losses from hedge ineffectiveness are reflected directly in "Other, net" in our Consolidated Statements of Income. During periods of volatility in foreign exchange rates, we can be subject to significant foreign exchange gains and losses since there is a time lag between when we incur the foreign exchange exposure and when we have the information to properly hedge the exposure.
Foreign Exchange Risk
Historically, our foreign currency-denominated sales have been approximately one quarter of consolidated sales. Our exposure to currency rate fluctuations primarily relate to Europe (euro, British pound, Swedish krona and Swiss franc), Canada (Canadian dollar) and Australia (dollar). We also have exposure to currency rate fluctuations related to more volatile markets including Argentina (peso), Brazil (real), Chile (peso), Colombia (peso), Mexico (peso), and Turkey (lira).
Our investments in several subsidiaries are recorded in currencies other than the USD. As these foreign currency denominated investments are translated at the end of each period during consolidation using period-end exchange rates, fluctuations of exchange rates between the foreign currency and the USD increase or decrease the value of those investments. These fluctuations and the results of operations for foreign subsidiaries, where the functional currency is not the USD, are translated into USD using the average exchange rates during the year, while the assets and liabilities are translated using period end exchange rates. The assets and liabilities-related translation adjustments are recorded as a separate component of Stockholders’ Equity, "Foreign currency translation," which is a component of "Accumulated other comprehensive loss" in our Consolidated Balance Sheets. In addition, as our subsidiaries maintain investments denominated in currencies other than local currencies, exchange rate fluctuations will occur. Borrowings are raised in certain foreign currencies to minimize the exchange rate translation adjustment risk.
Certain subsidiaries of Anixter conduct business in a currency other than the legal entity’s functional currency. Transactions may produce receivables or payables that are fixed in terms of the amount of foreign currency that will be received or paid. A change in exchange rates between the functional currency and the currency in which a transaction is denominated increases or decreases the expected amount of functional currency cash flows upon settlement of the transaction. That increase or decrease in expected functional currency cash flows is a foreign exchange transaction gain or loss that is included in "Other, net" in our Consolidated Statements of Income.
We purchase foreign currency forward contracts to minimize the effect of fluctuating foreign currency-denominated accounts on our reported income. The foreign currency forward contracts are not designated as hedges for accounting purposes. At January 3, 2020 and December 28, 2018, the gross notional amount of the foreign currency forward contracts outstanding was approximately $130.2 million and $96.3 million, respectively. All of our foreign currency forward contracts are subject to master netting arrangements with our counterparties. As a result, at January 3, 2020 and December 28, 2018, the net notional amount of the foreign currency forward contracts outstanding was approximately $95.4 million and $75.7 million, respectively. We prepared a sensitivity analysis of our foreign currency forward contracts assuming a 10% adverse change in the value of foreign currency contracts outstanding. The hypothetical adverse changes would have resulted in us recording a $12.0 million and $23.8 million loss in fiscal 2019 and 2018, respectively. However, as these forward contracts are intended to be effective economic hedges, we would record offsetting gains as a result of the remeasurement of the underlying foreign currency denominated monetary accounts being hedged.
ANIXTER INTERNATIONAL INC.
Fair Market Value of Debt Instruments
The fair value of our debt instruments is measured using observable market information which is considered Level 2 in the fair value hierarchy.
The carrying value of our fixed-rate debt (specifically, Notes due 2025, Notes due 2023 and Notes due 2021) was $993.5 million and $991.7 million at January 3, 2020 and December 28, 2018, respectively. The fair value of the fixed-rate debt instruments was $1,055.9 million and $1,000.7 million at January 3, 2020 and December 28, 2018, respectively. Our Notes due 2025, Notes due 2023 and Notes due 2021 bear interest at fixed rates of 6.00%, 5.50% and 5.125%, respectively. Therefore, changes in interest rates do not affect interest expense incurred on the fixed-rate debt but interest rates do affect the fair value. If interest rates were to increase by 10.0%, the fair market value of the fixed-rate debt would decrease by 1.0% and 2.1% at January 3, 2020 and December 28, 2018, respectively. If interest rates were to decrease by 10.0%, the fair market value of the fixed-rate debt would increase by 1.2% and 2.0% at January 3, 2020 and December 28, 2018, respectively.
Changes in the fair market value of our debt do not affect the reported results of operations unless we are retiring such obligations prior to their maturity. This analysis did not consider the effects of a changed level of economic activity that could exist in such an environment and certain other factors. Further, in the event of a change of this magnitude, management would likely take actions to further mitigate its exposure to possible changes. However, due to the uncertainty of the specific actions that would be taken and their possible effects, this sensitivity analysis assumes no changes in our financial structure.
See Note 5. "Debt" in the Notes to our Consolidated Financial Statements for further detail on outstanding debt obligations.
FORWARD-LOOKING INFORMATION
The Management’s Discussion and Analysis of Financial Condition and Results of Operations may contain various "forward-looking statements" within the meaning of Section 27A of the Securities Act of 1933, as amended, and Section 21E of the Securities Exchange Act of 1934, as amended. These statements can be identified by the use of forward-looking terminology such as "believe," "expect," "intend," "anticipate," "contemplate," "estimate," "plan," "project," "should," "may," "will," or the negative thereof or other variations thereon or comparable terminology indicating our expectations or beliefs concerning future events. We caution that such statements are qualified by important factors that could cause actual results to differ materially from those in the forward-looking statements, a number of which are identified in this report under Item 1A. "Risk Factors." The information contained in this financial review should be read in conjunction with the Consolidated Financial Statements, including the notes thereto, on pages 36 to 77 of this Report.
ITEM 8. FINANCIAL STATEMENTS AND SUPPLEMENTARY DATA.
REPORT OF INDEPENDENT REGISTERED PUBLIC ACCOUNTING FIRM
To the Shareholders and the Board of Directors of Anixter International Inc.
Opinion on the Financial Statements
We have audited the accompanying consolidated balance sheets of Anixter International Inc. (the Company) as of January 3, 2020 and December 28, 2018, the related consolidated statements of income, comprehensive income, stockholders’ equity and cash flows for each of the three years in the period ended January 3, 2020, and the related notes and financial statement schedules listed in the Index at Item 15(a)(2) (collectively referred to as the “consolidated financial statements”). In our opinion, the consolidated financial statements present fairly, in all material respects, the financial position of the Company at January 3, 2020 and December 28, 2018, and the results of its operations and its cash flows for each of the three years in the period ended January 3, 2020, in conformity with U.S. generally accepted accounting principles.
We also have audited, in accordance with the standards of the Public Company Accounting Oversight Board (United States) (PCAOB), the Company’s internal control over financial reporting as of January 3, 2020, based on criteria established in Internal Control-Integrated Framework issued by the Committee of Sponsoring Organizations of the Treadway Commission (2013 framework) and our report dated February 20, 2020 expressed an unqualified opinion thereon.
Adoption of New Accounting Standard
As discussed in Note 1 to the consolidated financial statements, the Company changed its method for accounting for leases as of December 29, 2018 due to the adoption of the ASU 2016-02, Leases.
Basis for Opinion
These financial statements are the responsibility of the Company’s management. Our responsibility is to express an opinion on the Company’s financial statements based on our audits. We are a public accounting firm registered with the PCAOB and are required to be independent with respect to the Company in accordance with the U.S. federal securities laws and the applicable rules and regulations of the Securities and Exchange Commission and the PCAOB.
We conducted our audits in accordance with the standards of the PCAOB. Those standards require that we plan and perform the audit to obtain reasonable assurance about whether the financial statements are free of material misstatement, whether due to error or fraud. Our audits included performing procedures to assess the risks of material misstatement of the financial statements, whether due to error or fraud, and performing procedures that respond to those risks. Such procedures included examining, on a test basis, evidence regarding the amounts and disclosures in the financial statements. Our audits also included evaluating the accounting principles used and significant estimates made by management, as well as evaluating the overall presentation of the financial statements. We believe that our audits provide a reasonable basis for our opinion.
Critical Audit Matters
The critical audit matters communicated below are matters arising from the current period audit of the financial statements that were communicated or required to be communicated to the audit committee and that: (1) relate to accounts or disclosures that are material to the financial statements and (2) involved our especially challenging, subjective or complex judgments. The communication of critical audit matters does not alter in any way our opinion on the consolidated financial statements, taken as a whole, and we are not, by communicating the critical audit matters below, providing separate opinions on the critical audit matters or on the accounts or disclosures to which they relate.
| | | | | | | | | | | | | | |
| Goodwill Impairment | | | |
Description of the Matter | At January 3, 2020, the Company’s goodwill was $828.7 million. As discussed in Note 1 to the consolidated financial statements, goodwill is tested for impairment annually at the beginning of the third quarter and when events or changes in circumstances indicate the carrying value of reporting units might exceed their current fair values. In connection with the annual assessment of goodwill at the beginning of the third quarter of 2019, the Company performed a quantitative test for all reporting units and utilized a combination of the income and market approaches. | | | |
| | | | |
| Auditing management’s annual goodwill impairment test was complex and highly judgmental due to the significant estimation required to determine the fair value of the reporting units. In particular, the fair value estimate was sensitive to changes in significant assumptions, such as the weighted average cost of capital, and assumptions in the prospective financial information (including revenue growth rate, operating margin and working capital), which are affected by expectations about future market or economic conditions. | | | |
| | | | |
| | | | | | | | | | | | | | |
| | | | |
How We Addressed the Matter in Our Audit
| We obtained an understanding, evaluated the design and tested the operating effectiveness of controls over the Company’s goodwill impairment review process, including controls over management’s review of the significant assumptions described above. | | | |
| To test the estimated fair value of the Company’s reporting units, we performed audit procedures that included, among others, assessing the methodology and testing the significant assumptions discussed above and the underlying data used by the Company in its analysis. For example, we compared the significant assumptions used by management in the prospective financial information to current industry and economic trends and to historical results. We also assessed the historical accuracy of management’s prospective financial information by comparing management’s past projections to actual performance. We evaluated the weighted average cost of capital by comparing it to a weighted average cost of capital range that was independently developed using publicly available market data for comparable entities. We performed sensitivity analyses of the significant assumptions discussed above to evaluate the changes in the fair value of the reporting units that would result from changes in the assumptions. In addition, we tested management’s reconciliation of the fair value of the reporting units to the market capitalization of the Company. We also involved a valuation specialist to assist in our evaluation of the Company's valuation methodology and certain significant assumptions, such as the weighted average cost of capital. | | | |
| | | | |
| | | | |
| Realizability of deferred tax assets | | | |
Description of the Matter | As more fully described in Note 7 to the consolidated financial statements, for the year ended January 3, 2020, the Company reversed a valuation allowance on deferred tax assets related to foreign tax credit carryforwards in the amount of $41.7 million. As discussed in Note 1 to the consolidated financial statements, deferred tax assets are reduced by a valuation allowance if, based on available evidence, it is more likely than not that some portion, or all, of the deferred tax assets will not be realized. | | | |
| | | | |
| Auditing management’s assessment of recoverability of deferred tax assets related to foreign tax credit carryforwards involved subjective estimation and complex auditor judgment in determining whether sufficient future taxable income will be generated to support the realization of the existing deferred tax assets before expiration. These projections are sensitive because they can be affected by future market or economic conditions. | | | |
| | | | |
How We Addressed the Matter in Our Audit | We obtained an understanding, evaluated the design and tested the operating effectiveness of controls over the Company’s income tax review process, including controls over management’s review of projections of future taxable income and the future reversal of existing taxable temporary differences to support the realizability of the deferred tax assets related to foreign tax credit carryforwards. | | | |
| | | | |
| To test the realizability of the foreign tax credit carryforwards, with the assistance of our income tax professionals, we performed audit procedures that included, among others, evaluating the assumptions used by the Company to develop projections of future taxable income by income tax jurisdiction and testing the completeness and accuracy of the underlying data used in the projections. For example, we compared the projections of future taxable income with the actual results of prior periods and evaluated the effect of current industry and economic trends. We also compared the projections of future taxable income with other forecasted financial information prepared by the Company. | | | |
| | | | | |
/s/ ERNST & YOUNG LLP | |
| |
We have served as the Company's auditor since 1980. | |
Chicago, Illinois | |
February 20, 2020 | |
ANIXTER INTERNATIONAL INC.
CONSOLIDATED STATEMENTS OF INCOME
| | | | | | | | | | | | | | | | | | | | |
| | | Years Ended | | | | |
| | January 3,
2020 | | December 28,
2018 | | December 29,
2017 |
| (In millions, except per share amounts) | | | | | | | |
| Net sales | | $ | 8,845.6 | | | $ | 8,400.2 | | | $ | 7,927.4 | |
| Cost of goods sold | | 7,069.8 | | | 6,742.2 | | | 6,356.4 | |
| Gross profit | | 1,775.8 | | | 1,658.0 | | | 1,571.0 | |
| Operating expenses | | 1,408.3 | | | 1,348.3 | | | 1,258.1 | |
| Operating income | | 367.5 | | | 309.7 | | | 312.9 | |
| Other expense: | | | | | | |
| Interest expense | | (77.1) | | | (76.3) | | | (74.7) | |
| Other, net | | 3.0 | | | (10.2) | | | (0.6) | |
| Income before income taxes | | 293.4 | | | 223.2 | | | 237.6 | |
| Income tax expense | | 30.5 | | | 66.9 | | | 128.6 | |
| Net income | | $ | 262.9 | | | $ | 156.3 | | | $ | 109.0 | |
| Income per share: | | | | | | |
| Basic | | $ | 7.71 | | | $ | 4.62 | | | $ | 3.24 | |
| Diluted | | $ | 7.67 | | | $ | 4.58 | | | $ | 3.21 | |
| | | | | | |
| Basic weighted-average common shares outstanding | | 34.1 | | | 33.8 | | | 33.6 | |
| Effect of dilutive securities: | | | | | | |
| Stock options and units | | 0.2 | | | 0.3 | | | 0.4 | |
| Diluted weighted-average common shares outstanding | | 34.3 | | | 34.1 | | | 34.0 | |
See accompanying notes to the Consolidated Financial Statements.
ANIXTER INTERNATIONAL INC.
CONSOLIDATED STATEMENTS OF COMPREHENSIVE INCOME
| | | | | | | | | | | | | | | | | | | | |
| | Years Ended | | | | |
| | | January 3,
2020 | | December 28,
2018 | | December 29,
2017 |
| (In millions) | | | | | | |
| Net income | | $ | 262.9 | | | $ | 156.3 | | | $ | 109.0 | |
Other comprehensive income (loss): | | | | | | |
| Foreign currency translation | | 23.1 | | | (45.4) | | | 30.7 | |
| Changes in unrealized pension cost, net of tax | | (13.3) | | | (13.7) | | | 9.9 | |
| Other comprehensive income (loss) | | 9.8 | | | (59.1) | | | 40.6 | |
| Comprehensive income | | $ | 272.7 | | | $ | 97.2 | | | $ | 149.6 | |
See accompanying notes to the Consolidated Financial Statements.
ANIXTER INTERNATIONAL INC.
CONSOLIDATED BALANCE SHEETS
| | | | | | | | | | | | | | |
| | January 3,
2020 | | December 28,
2018 |
| (In millions, except share and per share amounts) | | | | |
| ASSETS | | | | |
| Current assets: | | | | |
| Cash and cash equivalents | | $ | 79.6 | | | $ | 81.0 | |
| Accounts receivable, net | | 1,540.3 | | | 1,600.0 | |
| Inventories | | 1,354.7 | | | 1,440.4 | |
| Other current assets | | 63.3 | | | 50.6 | |
| Total current assets | | 3,037.9 | | | 3,172.0 | |
| Property and equipment, at cost | | 432.3 | | | 398.4 | |
| Accumulated depreciation | | (257.4) | | | (235.1) | |
| Property and equipment, net | | 174.9 | | | 163.3 | |
| Operating leases | | 273.3 | | | — | |
| Goodwill | | 828.7 | | | 832.0 | |
| Intangible assets, net | | 361.2 | | | 392.9 | |
| Other assets | | 132.9 | | | 92.9 | |
| Total assets | | $ | 4,808.9 | | | $ | 4,653.1 | |
| LIABILITIES AND STOCKHOLDERS’ EQUITY | | | | |
| Current liabilities: | | | | |
| Accounts payable | | $ | 1,100.3 | | | $ | 1,320.0 | |
| Accrued expenses | | 330.3 | | | 309.0 | |
| Current operating lease obligations | | 62.9 | | | — | |
| Total current liabilities | | 1,493.5 | | | 1,629.0 | |
| Long-term debt | | 1,059.7 | | | 1,252.7 | |
| Operating lease obligations | | 219.1 | | | — | |
| Other liabilities | | 175.7 | | | 201.0 | |
| Total liabilities | | 2,948.0 | | | 3,082.7 | |
| Stockholders’ equity: | | | | |
| Common stock - $1.00 par value, 100,000,000 shares authorized, 34,214,795 and 33,862,704 shares issued and outstanding at January 3, 2020 and December 28, 2018, respectively | | 34.2 | | | 33.9 | |
| Capital surplus | | 310.2 | | | 292.7 | |
| Retained earnings | | 1,783.8 | | | 1,513.2 | |
| Accumulated other comprehensive loss: | | | | |
| Foreign currency translation | | (145.5) | | | (168.6) | |
| Unrecognized pension liability, net | | (121.8) | | | (100.8) | |
| Total accumulated other comprehensive loss | | (267.3) | | | (269.4) | |
| Total stockholders’ equity | | 1,860.9 | | | 1,570.4 | |
| Total liabilities and stockholders’ equity | | $ | 4,808.9 | | | $ | 4,653.1 | |
See accompanying notes to the Consolidated Financial Statements.
ANIXTER INTERNATIONAL INC.
CONSOLIDATED STATEMENTS OF CASH FLOWS
| | | | | | | | | | | | | | | | | | | | |
| | | Years Ended | | | | |
| | January 3,
2020 | | December 28,
2018 | | December 29,
2017 |
| (In millions) | | | | | | |
| Operating activities: | | | | | | |
| Net income | | $ | 262.9 | | | $ | 156.3 | | | $ | 109.0 | |
| Adjustments to reconcile net income to net cash provided by operating activities: | | | | | | |
| Loss on extinguishment of debt | | — | | | 4.6 | | | — | |
| Depreciation | | 37.2 | | | 31.7 | | | 28.2 | |
| Amortization of intangible assets | | 35.0 | | | 37.3 | | | 36.1 | |
| Stock-based compensation | | 20.0 | | | 18.9 | | | 18.1 | |
| Deferred income taxes | | (41.4) | | | (1.6) | | | 13.6 | |
| Pension plan contributions | | (6.3) | | | (7.4) | | | (27.4) | |
| Pension plan expenses | | 6.4 | | | 4.3 | | | 10.5 | |
| Impact of tax legislation | | — | | | (2.1) | | | 35.6 | |
| Impairment of intangible assets | | — | | | — | | | 5.7 | |
| Changes in current assets and liabilities, net | | | | | | |
| Accounts receivable | | 66.6 | | | (170.6) | | | (54.2) | |
| Inventories | | 91.4 | | | (204.7) | | | (39.8) | |
| Accounts payable | | (224.2) | | | 245.3 | | | 58.5 | |
| Other current assets and liabilities, net | | (7.1) | | | 28.0 | | | (10.0) | |
| Other, net | | (12.6) | | | (2.3) | | | (0.1) | |
| Net cash provided by operating activities | | 227.9 | | | 137.7 | | | 183.8 | |
| Investing activities: | | | | | | |
| Acquisitions of businesses, net of cash acquired | | — | | | (150.1) | | | — | |
| Capital expenditures, net | | (40.0) | | | (42.4) | | | (41.1) | |
| Other | | 2.9 | | | 9.1 | | | — | |
| Net cash used in investing activities | | (37.1) | | | (183.4) | | | (41.1) | |
| Financing activities: | | | | | | |
| Proceeds from borrowings | | 4,226.5 | | | 3,192.4 | | | 1,843.3 | |
| Repayments of borrowings | | (4,425.0) | | | (3,082.4) | | | (1,884.0) | |
| Retirement of Notes due 2019 | | — | | | (353.9) | | | — | |
| Proceeds from issuance of Notes due 2025 | | — | | | 246.9 | | | — | |
| Repayments of Canadian term loan | | — | | | — | | | (100.2) | |
| Deferred financing costs | | — | | | (2.9) | | | — | |
| Proceeds from stock options exercised | | 4.7 | | | 1.5 | | | 5.0 | |
| Other, net | | (2.1) | | | — | | | (0.2) | |
| Net cash (used in) provided by financing activities | | (195.9) | | | 1.6 | | | (136.1) | |
| (Decrease) increase in cash and cash equivalents | | (5.1) | | | (44.1) | | | 6.6 | |
| Effect of exchange rate changes on cash balances | | 3.7 | | | 9.1 | | | (5.7) | |
| Cash and cash equivalents at beginning of period | | 81.0 | | | 116.0 | | | 115.1 | |
| Cash and cash equivalents at end of period | | $ | 79.6 | | | $ | 81.0 | | | $ | 116.0 | |
| Cash paid for interest | | $ | 74.3 | | | $ | 73.9 | | | $ | 70.6 | |
| Cash paid for taxes | | $ | 87.1 | | | $ | 88.4 | | | $ | 76.4 | |
See accompanying notes to the Consolidated Financial Statements.
ANIXTER INTERNATIONAL INC.
CONSOLIDATED STATEMENTS OF STOCKHOLDERS’ EQUITY
| | | | | | | | | | | | | | | | | | | | | | | | | | | | | | | | | | | | | | |
| | | Common Stock | | | | Capital Surplus | | Retained Earnings | | Accumulated Other Comprehensive Loss | | |
| | | Shares | | Amount | | | | | | | | Total |
| (In millions) | | | | | | | | | | | | |
| Balance at December 30, 2016 | | 33.4 | | | $ | 33.4 | | | $ | 261.8 | | | $ | 1,247.9 | | | $ | (250.9) | | | $ | 1,292.2 | |
| Net income | | — | | | — | | | — | | | 109.0 | | | — | | | 109.0 | |
| Other comprehensive income: | | | | | | | | | | | | |
| Foreign currency translation | | — | | | — | | | — | | | — | | | 30.7 | | | 30.7 | |
| Changes in unrealized pension cost, net of tax benefit of $10.4 | | — | | | — | | | — | | | — | | | 9.9 | | | 9.9 | |
| Stock-based compensation | | — | | | — | | | 18.1 | | | — | | | — | | | 18.1 | |
| Issuance of common stock and related taxes | | 0.3 | | | 0.3 | | | (1.2) | | | — | | | — | | | (0.9) | |
| Balance at December 29, 2017 | | 33.7 | | | $ | 33.7 | | | $ | 278.7 | | | $ | 1,356.9 | | | $ | (210.3) | | | $ | 1,459.0 | |
| Net income | | — | | | — | | | — | | | 156.3 | | | — | | | 156.3 | |
| Other comprehensive loss: | | | | | | | | | | | | |
| Foreign currency translation | | — | | | — | | | — | | | — | | | (45.4) | | | (45.4) | |
| Changes in unrealized pension cost, net of tax of $4.7 | | — | | | — | | | — | | | — | | | (13.7) | | | (13.7) | |
| Stock-based compensation | | — | | | — | | | 18.9 | | | — | | | — | | | 18.9 | |
| Issuance of common stock and related taxes | | 0.2 | | | 0.2 | | | (4.9) | | | — | | | — | | | (4.7) | |
| Balance at December 28, 2018 | | 33.9 | | | $ | 33.9 | | | $ | 292.7 | | | $ | 1,513.2 | | | $ | (269.4) | | | $ | 1,570.4 | |
| Net income | | — | | | — | | | — | | | 262.9 | | | — | | | 262.9 | |
| Other comprehensive income: | | | | | | | | | | | | |
| Foreign currency translation | | — | | | — | | | — | | | — | | | 23.1 | | | 23.1 | |
| Changes in unrealized pension cost, net of tax of $2.4 | | — | | | — | | | — | | | — | | | (13.3) | | | (13.3) | |
Reclassification of tax effects (a) | | — | | | — | | | — | | | 7.7 | | | (7.7) | | | — | |
| Stock-based compensation | | — | | | — | | | 20.0 | | | — | | | — | | | 20.0 | |
| Issuance of common stock and related taxes | | 0.3 | | | 0.3 | | | (2.5) | | | — | | | — | | | (2.2) | |
| Balance at January 3, 2020 | | 34.2 | | | $ | 34.2 | | | $ | 310.2 | | | $ | 1,783.8 | | | $ | (267.3) | | | $ | 1,860.9 | |
(a)The Company reclassified $7.7 million of tax benefits from "Accumulated other comprehensive loss" to "Retained earnings" for the tax effects resulting from the December 22, 2017 enactment of the Tax Cuts and Jobs Act in accordance with the adoption of Accounting Standards Update 2018-02, "Income Statement - Reporting Comprehensive Income: Reclassification of Certain Tax Effects from Accumulated Other Comprehensive Income" in the first quarter of 2019.
See accompanying notes to the Consolidated Financial Statements.
ANIXTER INTERNATIONAL INC.
NOTES TO THE CONSOLIDATED FINANCIAL STATEMENTS
NOTE 1. SUMMARY OF SIGNIFICANT ACCOUNTING POLICIES
Organization: Anixter International Inc. and its subsidiaries (collectively referred to as "Anixter" or the "Company"), formerly known as Itel Corporation, which was incorporated in Delaware in 1967, is a leading distributor of enterprise cabling and security solutions, electrical and electronic wire and cable solutions and utility power solutions through Anixter Inc. and its subsidiaries.
Basis of presentation: The Consolidated Financial Statements include the accounts of Anixter International Inc. and its subsidiaries. The Company's fiscal year ends on the Friday nearest December 31 and includes 53 weeks in 2019 and 52 weeks in 2018 and 2017. Certain prior period amounts have been reclassified to conform to the current year presentation.
Use of estimates: The preparation of financial statements in conformity with generally accepted accounting principles ("U.S. GAAP") requires management to make estimates and assumptions that affect the amounts reported in the financial statements and accompanying notes. Actual results could differ from those estimates. Anixter's significant estimates include allowance for doubtful accounts, inventory obsolescence, pension obligations, goodwill and indefinite-lived intangible assets, deferred tax assets and uncertain tax positions.
Cash and cash equivalents: Cash equivalents consist of short-term, highly liquid investments with an original maturity three months or less. Such investments are stated at cost, which approximates fair value.
Receivables and allowance for doubtful accounts: The Company carries its accounts receivable at their face amounts less an allowance for doubtful accounts, which was $30.4 million and $39.9 million at the end of 2019 and 2018, respectively. On a regular basis, Anixter evaluates its accounts receivable and establishes the allowance for doubtful accounts based on a combination of specific customer circumstances, as well as credit conditions and history of write-offs and collections. The amounts charged to income for doubtful accounts were $10.1 million, $8.5 million and $10.0 million in 2019, 2018 and 2017, respectively. A receivable is considered past due if payments have not been received within the agreed upon invoice terms. Receivables are written off and deducted from the allowance account when the receivables are deemed uncollectible.
Inventories: Inventories, consisting primarily of purchased finished goods, are stated at the lower of cost or market. Cost is determined using the average-cost method. The Company has agreements with some vendors that provide a right to return products. This right is typically limited to a small percentage of total purchases from that vendor. Such rights provide that Anixter can return slow-moving product and the vendor will replace it with faster-moving product chosen by the Company. Some vendor agreements contain price protection provisions that require the manufacturer to issue a credit in an amount sufficient to reduce Anixter's current inventory carrying cost down to the manufacturer’s current price. The Company considers these agreements in determining the reserve for obsolescence.
At January 3, 2020 and December 28, 2018, the Company reported inventory of $1,354.7 million and $1,440.4 million, respectively (net of inventory reserves of $50.0 million and $51.5 million, respectively). Each quarter the Company reviews for excess inventories and makes an assessment of the net realizable value. There are many factors that management considers in determining whether or not the amount by which a reserve should be established. These factors include the following:
•Return or rotation privileges with vendors
•Price protection from vendors
•Expected future usage
•Whether or not a customer is obligated by contract to purchase the inventory
•Current market pricing
•Historical consumption experience
•Risk of obsolescence
If circumstances related to the above factors change, there could be a material impact on the net realizable value of the inventories.
ANIXTER INTERNATIONAL INC.
NOTES TO THE CONSOLIDATED FINANCIAL STATEMENTS – (Continued)
Property and equipment: At January 3, 2020, net property and equipment consisted of $126.0 million of equipment and computer software, $39.5 million of buildings and leasehold improvements, $8.4 million of finance leases and $1.0 million of land. At December 28, 2018, net property and equipment consisted of $125.8 million of equipment and computer software, $36.5 million of buildings and leasehold improvements and $1.0 million of land. Equipment and computer software are recorded at cost and depreciated by applying the straight-line method over their estimated useful lives, which range from 2 to 20 years. Buildings are recorded at cost and depreciated by applying the straight-line method over their estimated useful lives, which are up to 40 years. Leasehold improvements are depreciated over their useful life or over the term of the related lease, whichever is shorter. Upon sale or retirement, the cost and related depreciation are removed from the respective accounts and any gain or loss is included in income. Maintenance and repair costs are expensed as incurred. Depreciation expense, including an immaterial amount of finance lease depreciation, was $37.2 million, $31.7 million and $28.2 million in 2019, 2018 and 2017, respectively.
The Company evaluates the recoverability of the carrying amount of its property and equipment whenever events or circumstances indicate that the carrying amount of an asset may not be fully recoverable. In order to measure an impairment loss of property and equipment, the Company estimates the fair value by using an orderly liquidation valuation. An orderly liquidation value is the amount that could be realized from a liquidation sale, given a reasonable period of time to find a purchaser (or purchasers), with the seller being compelled to sell the asset in the existing condition where it is located, as of a specific date, assuming the highest and best use of the asset by market participants. The valuation method also considers that it is physically possible, legally permissible and financially feasible to use the asset at the measurement date. The inputs used for the valuation include significant unobservable inputs, or Level 3 inputs, as described in the accounting fair value hierarchy, based on assumptions that market participants would use. A second step of the analysis is performed by comparing the orderly liquidation value to the carrying amount of that asset. The orderly liquidation values are applied against the original cost of the assets and the impairment loss measured as the difference between the liquidation value of the assets and the net book value of the assets.
Costs for software developed for internal use are capitalized when the preliminary project stage is complete and Anixter has committed funding for projects that are likely to be completed. Costs that are incurred during the preliminary project stage are expensed as incurred. Once the capitalization criteria has been met, external direct costs of materials and services consumed in developing internal-use computer software, payroll and payroll-related costs for employees who are directly associated with and who devote time to the internal-use computer software project (to the extent of their time spent directly on the project) and interest costs incurred when developing computer software for internal use are capitalized. At January 3, 2020 and December 28, 2018, capitalized costs, net of accumulated amortization, for software developed for internal use were approximately $60.8 million and $64.7 million, respectively. Amortization expense charged to operations for capitalized costs was $7.2 million, $6.6 million and $5.5 million in 2019, 2018 and 2017, respectively. Interest expense incurred in connection with the development of internal use software is capitalized based on the amounts of accumulated expenditures and the weighted-average cost of borrowings for the period. Interest costs capitalized for fiscal 2019, 2018 and 2017 were $0.9 million, $0.1 million and $0.3 million, respectively.
Leases: The Company adopted Accounting Standards Update ("ASU") 2016-02, Leases, as of December 29, 2018. The adoption of this standard is discussed below within the section titled "Recently issued and adopted accounting pronouncements." At contract inception the Company determines if an arrangement is a lease. Operating leases are included in "Operating leases", "Current operating lease obligations" and "Operating lease obligations" on the Consolidated Balance Sheets. Finance leases are included in "Property and equipment, net", "Accrued expenses" and "Long-term debt" on the Consolidated Balance Sheets. The gross amount of the balances recorded related to finance leases was immaterial as of January 3, 2020, and December 28, 2018. Leases with an initial term of 12 months or less are not recorded on the Consolidated Balance Sheets. Operating lease expense is recognized on a straight-line basis over the lease term. The Company has lease agreements with lease and non-lease components and has elected to account for these components as a single lease component.
ANIXTER INTERNATIONAL INC.
NOTES TO THE CONSOLIDATED FINANCIAL STATEMENTS – (Continued)
Operating lease assets and liabilities are recognized at the commencement date, based on the present value of the future minimum lease payments. A certain number of these leases contain rent escalation clauses either fixed or adjusted periodically for inflation or market rates that are factored into the Company's determination of lease payments. Anixter also has variable lease payments that do not depend on a rate or index, primarily for items such as common area maintenance and real estate taxes, which are recorded as variable expense when incurred. The operating lease asset includes advance payments and excludes incentives and initial direct costs incurred. As most of Anixter’s leases do not provide an implicit rate, the Company uses its incremental borrowing rate based on the information available at the lease commencement date to discount payments to the present value. Most operating leases contain renewal options, some of which also include options to early terminate the leases. The exercise of these options is at the Company's discretion. Lease terms include these options to extend or terminate the lease when it is reasonably certain that the Company will exercise that option.
Goodwill: The Company evaluates goodwill for impairment annually at the beginning of the third quarter and when events or changes in circumstances indicate the carrying value of reporting units might exceed their current fair values. The Company assesses goodwill for impairment by first performing a qualitative assessment, which considers specific factors, based on the weight of evidence, and the significance of all identified events and circumstances in the context of determining whether it is more likely than not that the fair value of a reporting unit is less than its carrying amount. If it is determined that it is more likely than not that the fair value of a reporting unit is less than its carrying amount using the qualitative assessment, Anixter performs the two-step impairment test. The Company may also bypass the qualitative assessment and proceed directly to the two-step impairment test. The first step of the impairment test is to identify a potential impairment by comparing the fair value of a reporting unit with its carrying amount. The estimates of fair value of a reporting unit are determined using the income approach and the market approach as described below. If step one of the test indicates a carrying value above the estimated fair value, the second step of the goodwill impairment test is performed by comparing the implied fair value of the reporting unit’s goodwill with the carrying amount of that goodwill. The implied residual value of goodwill is determined in the same manner as the amount of goodwill recognized in a business combination.
The income approach is a quantitative evaluation to determine the fair value of the reporting unit. Under the income approach fair value is determined based on estimated future cash flows discounted by an estimated weighted-average cost of capital, which reflects the overall level of inherent risk of the reporting unit and the rate of return a market participant would expect to earn. The inputs used for the income approach are significant unobservable inputs, or Level 3 inputs, as described in the accounting fair value hierarchy. Estimated future cash flows are based on internal projection models, industry projections and other assumptions deemed reasonable by management.
The market approach measures the fair value of a reporting unit through the analysis of recent sales, offerings, and financial multiples (earnings before interest, tax, depreciation and amortization ("EBITDA")) of comparable businesses, which would be considered Level 2 in the fair value hierarchy. Consideration is given to the financial conditions and operating performance of the reporting unit being valued relative to those publicly-traded companies operating in the same or similar lines of business.
In connection with the annual assessment of goodwill at the beginning of the third quarter of 2019, the Company bypassed the qualitative assessment and performed a quantitative test for all reporting units and utilized a combination of the income and market approaches. As a result of this assessment, the Company concluded that no impairment existed and the carrying amount of goodwill to be fully recoverable.
ANIXTER INTERNATIONAL INC.
NOTES TO THE CONSOLIDATED FINANCIAL STATEMENTS – (Continued)
Intangible assets: As of January 3, 2020 and December 28, 2018, the Company's intangible asset balances are as follows:
| | | | | | | | | | | | | | | | | | | | | | | | | | | | | | | | |
| | | | January 3, 2020 | | | | December 28, 2018 | | |
| (In millions) | | Average useful life (in years) | | Gross carrying amount | | Accumulated amortization | | Gross carrying amount | | Accumulated amortization |
| Customer relationships | | 6-20 | | $ | 503.6 | | | $ | (176.4) | | | $ | 500.1 | | | $ | (143.7) | |
| Exclusive supplier agreement | | 21 | | 22.3 | | | (5.6) | | | 22.1 | | | (4.5) | |
| Trade names | | 3-10 | | 22.6 | | | (13.5) | | | 21.8 | | | (12.6) | |
| Trade names | | Indefinite | | 4.9 | | | — | | | 4.9 | | | — | |
| Non-compete agreements | | 1-5 | | 9.2 | | | (7.9) | | | 9.2 | | | (6.5) | |
| Intellectual property | | 8 | | 2.5 | | | (0.5) | | | 2.3 | | | (0.2) | |
| Total | | | | $ | 565.1 | | | $ | (203.9) | | | $ | 560.4 | | | $ | (167.5) | |
Anixter continually evaluates whether events or circumstances have occurred that would indicate the remaining estimated useful lives of intangible assets warrant revision or that the remaining balance of such assets may not be recoverable. Trade names that have been identified to have indefinite lives are not being amortized based on the expectation that the trade name products will generate future cash flows for the foreseeable future. In 2017, the Company recorded an impairment charge of $5.7 million related to certain indefinite-lived trade names in its NSS reporting unit. This impairment charge is included in "Operating expenses" in the Consolidated Statement of Income. The impairment charge was recorded as Anixter no longer plans to use certain trade names on certain products. All remaining indefinite-lived trade names are expected to be used on existing products for the foreseeable future.
For definite-lived intangible assets, the Company uses an estimate of the related undiscounted cash flows over the remaining life of the asset in measuring whether the asset is recoverable. The Company's definite-lived intangible assets are primarily related to customer relationships. In order to measure an impairment loss of customer relationships, Anixter estimates the fair value by using an excess earnings model, a form of the income approach. The analysis requires making various judgments, including assumptions about future cash flows based on projected growth rates of revenue and expense, rates of customer attrition and working capital needs. The assumptions about future cash flows and growth rates are based on management’s forecast of the asset group. The key inputs utilized in determining the fair value of customer relationships include significant unobservable inputs, or Level 3 inputs, as described in the accounting fair value hierarchy. Inputs included discount rates derived from an estimated weighted-average cost of capital, which reflected the overall level of inherent risk of the asset group and the rate of return a market participant would expect to earn, as well as customer attrition rates.
Intangible amortization expense is expected to average $33.6 million per year for the next five years. The Company's definite lived intangible assets are amortized over a straight line basis as it approximates the customer attrition patterns and best estimates the use pattern of the assets.
Other, net: The following represents the components of "Other, net" as reflected in the Consolidated Statements of Income:
| | | | | | | | | | | | | | | | | | | | |
| | Years Ended | | | | |
| (In millions) | | January 3,
2020 | | December 28,
2018 | | December 29,
2017 |
| Other, net: | | | | | | |
| Foreign exchange loss | | $ | (2.2) | | | $ | (8.2) | | | $ | (3.4) | |
| Cash surrender value of life insurance policies | | 4.4 | | | (1.3) | | | 2.4 | |
| Net periodic pension benefit | | 2.4 | | | 5.1 | | | 0.2 | |
| Loss on extinguishment of debt | | — | | | (4.6) | | | — | |
| Other | | (1.6) | | | (1.2) | | | 0.2 | |
| Total other, net | | $ | 3.0 | | | $ | (10.2) | | | $ | (0.6) | |
Certain subsidiaries of Anixter conduct business in a currency other than the legal entity’s functional currency. Transactions may produce receivables or payables that are fixed in terms of the amount of foreign currency that will be received or paid. A change in exchange rates between the functional currency and the currency in which a transaction is denominated increases or decreases the expected amount of functional currency cash flows upon settlement of the transaction. The increase or decrease in expected functional currency cash flows is a foreign currency transaction gain or loss that is included in "Other, net" in the Consolidated Statements of Income.
ANIXTER INTERNATIONAL INC.
NOTES TO THE CONSOLIDATED FINANCIAL STATEMENTS – (Continued)
The Company purchases foreign currency forward contracts to minimize the effect of fluctuating foreign currency-denominated accounts on its reported income. The foreign currency forward contracts are not designated as hedges for accounting purposes. The Company's strategy is to negotiate terms for its derivatives and other financial instruments to be highly effective, such that the change in the value of the derivative offsets the impact of the underlying hedged item (e.g., various foreign currency-denominated accounts). Its counterparties to foreign currency forward contracts have investment-grade credit ratings. Anixter expects the creditworthiness of its counterparties to remain intact through the term of the transactions. The Company regularly monitors the creditworthiness of its counterparties to ensure no issues exist which could affect the value of the derivatives.
The Company does not hedge 100% of its foreign currency-denominated accounts. In addition, the results of hedging can vary significantly based on various factors, such as the timing of executing the foreign currency forward contracts versus the movement of the currencies as well as the fluctuations in the account balances throughout each reporting period. The fair value of the foreign currency forward contracts is based on the difference between the contract rate and the current exchange rate. The fair value of the foreign currency forward contracts is measured using observable market information. These inputs would be considered Level 2 in the fair value hierarchy. At January 3, 2020 and December 28, 2018, foreign currency forward contracts were revalued at then-current foreign exchange rates with the changes in valuation reflected directly in "Other, net" in the Consolidated Statements of Income offsetting the transaction gain/loss recorded on the foreign currency-denominated accounts. At January 3, 2020 and December 28, 2018, the gross notional amount of the foreign currency forward contracts outstanding was approximately $130.2 million and $96.3 million, respectively. At January 3, 2020 and December 28, 2018, the net notional amount of the foreign currency forward contracts outstanding was approximately $95.4 million and $75.7 million, respectively. While all of the Company's foreign currency forward contracts are subject to master netting arrangements with its counterparties, assets and liabilities related to these contracts are presented on a gross basis within the Consolidated Balance Sheets. The gross fair value of assets and liabilities related to foreign currency forward contracts are immaterial.
The combined effect of changes in both the equity and bond markets resulted in changes in the cash surrender value of the Company's company owned life insurance policies associated with the sponsored deferred compensation program.
Fair value measurement: Assets and liabilities measured at fair value on a recurring basis consist of foreign currency forward contracts and the assets of Anixter's defined benefit plans. The fair value of the foreign currency forward contracts is discussed above in the section titled "Other, net." The fair value of the assets of Anixter's defined benefit plans is discussed in Note 8. "Pension Plans, Post-Retirement Benefits and Other Benefits". Fair value disclosures of debt are discussed in Note 5. "Debt".
The Company measure the fair values of goodwill, intangible assets and property and equipment on a nonrecurring basis if required by impairment tests applicable to these assets. The fair value measurements of goodwill, intangible assets and property and equipment are discussed above.
The inputs used in the determination of fair values are categorized according to the fair value hierarchy as being Level 1, Level 2 or Level 3. In general, fair values determined by Level 1 inputs use quoted prices in active markets for identical assets or liabilities. Fair values determined by Level 2 inputs use other inputs that are observable, either directly or indirectly. These Level 2 inputs include quoted prices for similar assets or liabilities in active markets, and other inputs such as interest rates and yield curves that are observable at commonly quoted intervals. Level 3 inputs are unobservable inputs, including inputs that are available in situations where there is little, if any, market activity for the related asset or liability. In instances where inputs used to measure fair value fall into different levels in the above fair value hierarchy, fair value measurements in their entirety are categorized based on the lowest level input that is significant to the valuation. The assessment of the significance of particular inputs to these fair value measurements requires judgment and considers factors specific to each asset or liability.
Revenue recognition: Anixter is a leading global distributor of network and security solutions, electrical and electronic solutions and utility power solutions. Through a global distribution network along with supply chain and technical expertise, Anixter helps customers reduce the risk, cost and complexity of their supply chains. Anixter is a leader in providing advanced inventory management services including procurement, just-in-time delivery, material management programs, turn-key yard layout and management, quality assurance testing, component kit production, storm/event kitting, small component assembly and e-commerce and electronic data interchange to a broad spectrum of customers with nearly 600,000 products. Revenue arrangements primarily consist of a single performance obligation to transfer promised goods or services. See Note 10. "Business Segments" for revenue disaggregated by geography.
ANIXTER INTERNATIONAL INC.
NOTES TO THE CONSOLIDATED FINANCIAL STATEMENTS – (Continued)
Sales to customers and related cost of sales are primarily recognized at the point in time when control of goods transfers to the customer. For product sales, this generally occurs upon shipment of the products, however, this may occur at a later date depending on the agreed upon sales terms, such as delivery at the customer's designated location, or based on consignment terms. In instances where goods are not stocked by Anixter and delivery times are critical, product is purchased from the manufacturer and drop-shipped to the customer. Anixter generally takes control of the goods when shipped by the manufacturer and then recognizes revenue when control of the product transfers to the customer. When providing services, sales are recognized over time as control transfers to the customer, which occurs as services are rendered.
Revenue is measured as the amount of consideration the Company expects to receive in exchange for transferring goods or providing services. The Company estimates different forms of variable consideration at the time of sale based on historical experience, current conditions and contractual obligations. Revenue is recorded net of customer discounts, rebates and similar charges. When Anixter offers the right to return product, historical experience is utilized to establish a liability for the estimate of expected returns, which was $36.7 million and $35.0 million at January 3, 2020 and December 28, 2018, respectively. Sales and other tax amounts collected from customers for remittance to governmental authorities are excluded from revenue. The Company has elected to treat shipping and handling as a fulfillment activity. The practical expedient not to disclose information about remaining performance obligations has also been elected as these contacts have an original duration of one year or less or are contracts where the Company has applied the practical expedient to recognize service revenue in proportion to the amount Anixter has the right to invoice. The Company typically receives payment 30 to 60 days from the point it has satisfied the related performance obligation.
At December 28, 2018, $17.2 million of deferred revenue related to outstanding contracts was reported in "Accrued expenses" in the Company's Consolidated Balance Sheet. This balance primarily represents prepayments from customers. During the year ended January 3, 2020, $14.9 million of this deferred revenue was recognized. At January 3, 2020, deferred revenue was $11.6 million. The Company expects to recognize this balance as revenue within the next twelve months.
Advertising and sales promotion: Advertising and sales promotion costs are expensed as incurred. Advertising and promotion costs included in operating expenses on the Consolidated Statements of Income were $15.6 million, $15.8 million and $10.6 million in 2019, 2018 and 2017, respectively. The majority of the advertising and sales promotion costs are recouped through various cooperative advertising programs with vendors.
Shipping and handling fees and costs: Shipping and handling fees billed to customers are included in net sales. Shipping and handling costs associated with outbound freight are included in "Operating expenses" on the Consolidated Statements of Income, which were $133.1 million, $139.7 million and $119.1 million in 2019, 2018 and 2017, respectively.
Stock-based compensation: The Company measures the cost of all share-based payments to employees, including grants of employee stock options, using a fair-value-based method. Compensation costs are determined based on the fair value at the grant date and amortized over the respective vesting period representing the requisite service period. The Company accounts for forfeitures of share-based payments as they occur.
Accumulated other comprehensive loss: Unrealized gains and losses are accumulated in "Accumulated other comprehensive loss" ("AOCI"). These changes are also reported in "Other comprehensive income (loss)" on the Consolidated Statements of Comprehensive Income. These include unrealized gains and losses related to the Company's defined benefit obligations and foreign currency translation. See Note 8. "Pension Plans, Post-Retirement Benefits and Other Benefits" for pension related amounts reclassified into net income.
Investments in several subsidiaries are recorded in currencies other than the U.S. dollar ("USD"). As these foreign currency denominated investments are translated at the end of each period during consolidation using period-end exchange rates, fluctuations of exchange rates between the foreign currency and the USD increase or decrease the value of those investments. The results of operations for foreign subsidiaries, where the functional currency is not the USD, are translated into USD using the average exchange rates during the periods reported, while the assets and liabilities are translated using period-end exchange rates. The assets and liabilities related translation adjustments are recorded as a separate component of AOCI, "Foreign currency translation." In addition, as Anixter's subsidiaries maintain investments denominated in currencies other than local currencies, exchange rate fluctuations will occur. Borrowings are raised in certain foreign currencies to minimize the exchange rate translation adjustment risk.
ANIXTER INTERNATIONAL INC.
NOTES TO THE CONSOLIDATED FINANCIAL STATEMENTS – (Continued)
Income taxes: Deferred taxes are recognized for the future tax effects of temporary differences between financial and income tax reporting based upon enacted tax laws and rates. The Company maintains valuation allowances to reduce deferred tax assets if it is more likely than not that some portion or all of the deferred tax asset will not be realized based on available evidence. Anixter recognizes the benefit of tax positions when a benefit is more likely than not (i.e., greater than 50% likely) to be sustained on its technical merits. Recognized tax benefits are measured at the largest amount that is more likely than not to be sustained, based on cumulative probability, in final settlement of the position.
Net income per share: Diluted net income per share reflects the potential dilution that would occur if securities or other contracts to issue common stock were exercised or converted into common stock.
The Company had 0.2 million, 0.3 million, and 0.4 million in 2019, 2018 and 2017, respectively, of additional shares related to stock options and stock units included in the computation of diluted earnings per share because the effect of those common stock equivalents were dilutive during these periods. Antidilutive stock options and units are excluded from the calculation of weighted-average shares for diluted earnings per share. For 2019, 2018 and 2017, the antidilutive stock options and units were immaterial.
Recently issued and adopted accounting pronouncements: In February 2016, the Financial Accounting Standards Board ("FASB") issued ASU 2016-02, Leases, which requires lessees to recognize assets and liabilities on the balance sheet for the rights and obligations created by all leases with terms of more than 12 months. The standard is effective for Anixter's financial statements issued for fiscal years beginning after December 15, 2018, and interim periods within those fiscal years. In July 2018, the FASB issued additional authoritative guidance providing companies with an optional transition method to use the effective date of ASU 2016-02 as the date of initial application of transition and not restate comparative periods. The Company adopted the standard in the first quarter of 2019 using this optional transition method. The Company elected the package of practical expedients, which allows it to carry forward historical lease classification, the practical expedient to not separate non-lease components from lease components, and the short-term lease accounting policy election as defined in ASU 2016-02. The Company implemented internal controls and a lease accounting information system to enable the preparation of financial information on adoption. The standard had a material impact on the Company's Consolidated Balance Sheet, but did not have an impact on the Consolidated Statements of Income. The most significant impact was the recognition of right-of-use assets of $244.1 million and lease liabilities of $249.6 million for operating leases, while accounting for finance leases remained substantially unchanged.
In February 2018, the FASB issued ASU 2018-02, Income Statement - Reporting Comprehensive Income: Reclassification of Certain Tax Effects from Accumulated Other Comprehensive Income, which will allow a reclassification from accumulated other comprehensive income to retained earnings for the tax effects resulting from the December 22, 2017 enactment of the Tax Cuts and Jobs Act (the "Act") that are stranded in accumulated other comprehensive income. The standard is effective for Anixter's financial statements issued for fiscal years beginning after December 15, 2018, and interim periods within those fiscal years. The Company adopted this standard effective the first quarter of fiscal year 2019 and elected to reclassify $7.7 million of tax benefits from "Accumulated other comprehensive loss" to "Retained earnings" within its Consolidated Financial Statements.
In June 2018, the FASB issued ASU 2018-07, Compensation - Stock Compensation: Improvements to Nonemployee Share-Based Payment Accounting, which will expand the scope of Topic 718 to include share-based payment transactions for acquiring goods and services from nonemployees. The standard is effective for Anixter's financial statements issued for fiscal years beginning after December 15, 2018, and interim periods within those fiscal years. The Company adopted this standard effective the first quarter of fiscal year 2019. The result of this adoption did not have a material impact on the Consolidated Financial Statements.
Recently issued accounting pronouncements not yet adopted: In June 2016, the FASB issued ASU 2016-13, Financial Instruments - Credit Losses, which requires the measurement of expected credit losses for financial instruments held at the reporting date based on historical experience, current conditions and reasonable forecasts. The main objective of this ASU is to provide financial statement users with more decision-useful information about the expected credit losses on financial instruments and other commitments to extend credit held by a reporting entity at each reporting date. The standard is effective for Anixter's financial statements issued for fiscal years beginning after December 15, 2019, and interim periods within those fiscal years. Early adoption is permitted for fiscal years beginning after December 15, 2018, and interim periods within those fiscal years. The Company is currently evaluating the impact of adoption of this ASU, but it is not expected to have a material effect on the Company's Consolidated Financial Statements.
ANIXTER INTERNATIONAL INC.
NOTES TO THE CONSOLIDATED FINANCIAL STATEMENTS – (Continued)
In January 2017, the FASB issued ASU 2017-04, Intangibles - Goodwill and Other: Simplifying the Test for Goodwill Impairment, which removes step two from the goodwill impairment test. Step two measures a goodwill impairment loss by comparing the implied fair value of a reporting unit's goodwill with the carrying amount of that goodwill. The new guidance requires an entity to perform its goodwill impairment test by comparing the fair value of a reporting unit with its carrying amount, including goodwill. The standard is effective for Anixter's financial statements issued for fiscal years beginning after December 15, 2019. Early adoption is permitted for interim or annual goodwill impairment tests performed on testing dates after January 1, 2017. The Company is currently assessing the impact the adoption of this ASU will have on its methodology for evaluating goodwill for impairment subsequent to adoption of this standard.
In August 2018, the FASB issued ASU 2018-13, Fair Value Measurement: Changes to the Disclosure Requirements for Fair Value Measurement, which changes the disclosure requirements for fair value measurements by removing, adding and modifying certain disclosures. The standard is effective for Anixter's financial statements issued for fiscal years beginning after December 15, 2019. Early adoption is permitted. The Company is currently evaluating the impact of adoption of this ASU on its related disclosures.
In August 2018, the FASB issued ASU 2018-14, Compensation - Retirement Benefits - Defined Benefit Plans - General: Changes to the Disclosure Requirements for Defined Benefit Plans, which modifies the disclosure requirements for employers that sponsor defined benefit pension or other postretirement plans by removing and adding certain disclosures for these plans. The standard is effective for Anixter's financial statements issued for fiscal years ending after December 15, 2020. Early adoption is permitted. The Company is currently evaluating the impact of adoption of this ASU on its related disclosures.
In December 2019, the FASB issued ASU 2019-12, Income Taxes - Simplifying the Accounting for Income Taxes, which clarifies existing guidance and removes certain exceptions to the general principles for income taxes. The standard is effective for Anixter's financial statements issued for fiscal years beginning after December 15, 2020. Early adoption is permitted. The Company is currently evaluating the impact of adoption of this ASU on its Consolidated Financial Statements.
The Company does not believe that any other recently issued, but not yet effective, accounting pronouncements, if adopted, would have a material impact on its Consolidated Financial Statements or disclosures.
NOTE 2. ACCRUED EXPENSES
Accrued expenses consisted of the following:
| | | | | | | | | | | | | | |
| | January 3,
2020 | | December 28,
2018 |
| (In millions) | | | | |
| Salaries and fringe benefits | | $ | 136.2 | | | $ | 109.7 | |
| Other accrued expenses | | 194.1 | | | 199.3 | |
| Total accrued expenses | | $ | 330.3 | | | $ | 309.0 | |
ANIXTER INTERNATIONAL INC.
NOTES TO THE CONSOLIDATED FINANCIAL STATEMENTS – (Continued)
NOTE 3. RESTRUCTURING CHARGES
The Company considers restructuring activities to be programs whereby Anixter fundamentally changes its operations, such as closing and consolidating facilities, reducing headcount and realigning operations in response to changing market conditions. The following table summarizes activity related to liabilities associated with restructuring activities:
| | | | | | | | | | | | | | | | | |
| Restructuring Activity | | | | |
| Q2 2018
Plan | | | | |
| Employee-Related Costs (a) | | Facility Exit and Other Costs (b) | | Total |
| Balance at December 29, 2017 | $ | — | | | $ | — | | | $ | — | |
| Charges | 9.6 | | | 0.5 | | | $ | 10.1 | |
| Payments and other | (2.9) | | | (0.3) | | | (3.2) | |
| Balance at December 28, 2018 | $ | 6.7 | | | $ | 0.2 | | | $ | 6.9 | |
| Payments and other | (4.9) | | | (0.1) | | | (5.0) | |
| Balance at January 3, 2020 | $ | 1.8 | | | $ | 0.1 | | | $ | 1.9 | |
(a)Employee-related costs primarily consist of severance benefits provided to employees who have been involuntarily terminated.
(b)Facility exit and other costs primarily consist of lease termination costs.
Q2 2018 Restructuring Plan
In the second quarter of 2018, the Company recorded a pre-tax charge of $2.1 million, $1.3 million and $1.1 million in its Network & Security Solutions ("NSS"), Electrical & Electronic Solutions ("EES") and Utility Power Solutions ("UPS") segments, respectively, and an additional $5.4 million at its corporate headquarters, primarily for severance-related expenses associated with a reduction of approximately 260 positions. In the third quarter of 2018, the Company recorded an additional $0.2 million charge at its corporate headquarters. The $10.1 million charge related to the second quarter 2018 plan primarily reflects actions related to facilities consolidation, systems integration and back office functions. This charge was included in "Operating expenses" in the Company's Consolidated Statement of Income for fiscal year 2018. The majority of the balance included in accrued expenses of $1.9 million as of January 3, 2020 is expected to be paid by the first half of 2020.
NOTE 4. LEASES
The Company adopted ASU 2016-02, Leases, as of December 29, 2018, using the modified retrospective approach. Prior year financial statements were not recast under the new standard and, therefore, certain prior period amounts have been disclosed in conformity with prior year presentation.
Substantially all of Anixter's office and warehouse facilities are leased under operating leases. The Company also leases certain equipment and vehicles primarily as operating leases. A certain number of Anixter's leases are long-term operating leases and expire at various dates through 2038. Lease costs are included within "Operating expenses" in the Company's Consolidated Statements of Income and were as follows:
| | | | | | | | |
| | Year Ended |
(In millions) | | January 3, 2020 |
Lease cost | | |
Operating lease cost | | $ | 79.0 | |
Variable lease cost | | 22.2 | |
Short-term lease cost | | 1.2 | |
Total lease cost | | $ | 102.4 | |
ANIXTER INTERNATIONAL INC.
NOTES TO THE CONSOLIDATED FINANCIAL STATEMENTS – (Continued)
Total rental expense was $107.3 million and $100.9 million in 2018 and 2017, respectively.
The weighted-average remaining lease term and weighted-average discount rate under operating leases were as follows:
| | | | | | | | |
| | January 3, 2020 |
Lease term and discount rate | | |
Weighted-average remaining lease term | | 6.5 years |
Weighted-average discount rate (a)
| | 5.9 | % |
(a)Upon adoption of ASU 2016-02, the discount rate used for existing leases was established as of December 29, 2018.
Maturities of operating lease liabilities at January 3, 2020 were as follows:
| | | | | | | | |
| (In millions) | | |
| 2020 | | $ | 75.4 | |
| 2021 | | 59.2 | |
| 2022 | | 54.4 | |
| 2023 | | 40.8 | |
| 2024 | | 32.0 | |
| 2025 and thereafter | | 81.6 | |
| Total lease payments | | $ | 343.4 | |
| Less imputed interest | | 61.4 | |
| Present value of lease liabilities | | $ | 282.0 | |
Operating lease payments include $17.4 million related to options to extend lease terms that are reasonably certain of being exercised. As of January 3, 2020, the Company has additional leases related to facilities that have not yet commenced of $7.5 million. These operating leases will commence in fiscal year 2020 with lease terms of three to eleven years. Anixter subleases certain real estate to third parties. During the year ended January 3, 2020, the Company recognized income of $1.1 million, which was included within "Operating expenses" in the Company's Consolidated Statements of Income. Aggregate future minimum rentals to be received under non-cancelable subleases at January 3, 2020 were $3.7 million.
During the year ended January 3, 2020, leased assets obtained in exchange for operating lease obligations were $348.3 million. The operating cash outflow for amounts included in the measurement of operating lease obligations was $63.5 million.
NOTE 5.DEBT
Debt is summarized below:
| | | | | | | | | | | | | | |
| (In millions) | | January 3,
2020 | | December 28,
2018 |
| Long-term debt: | | | | |
| 6.00% Senior notes due 2025 | | $ | 247.3 | | | $ | 246.9 | |
| 5.50% Senior notes due 2023 | | 347.9 | | | 347.4 | |
| 5.125% Senior notes due 2021 | | 398.3 | | | 397.4 | |
| Revolving lines of credit | | 56.0 | | | 260.0 | |
| Finance lease obligations | | 6.0 | | | 0.9 | |
| Other | | 8.8 | | | 6.1 | |
| Unamortized deferred financing costs | | (4.6) | | | (6.0) | |
| Total long-term debt | | $ | 1,059.7 | | | $ | 1,252.7 | |
Certain debt agreements entered into by Anixter's operating subsidiaries contain various restrictions, including restrictions on payments to the Company. These restrictions have not had, nor are expected to have, an adverse impact on the Company's ability to meet cash obligations. Anixter International Inc. has guaranteed substantially all of the debt of its subsidiaries.
ANIXTER INTERNATIONAL INC.
NOTES TO THE CONSOLIDATED FINANCIAL STATEMENTS – (Continued)
Aggregate annual maturities of debt before accretion of debt discount as reflected on the Consolidated Balance Sheet at January 3, 2020 are as follows: 2020 - $8.8 million, 2021 - $398.3 million, 2022 - $0.0 million, 2023 - $403.9 million, 2024 - $0.0 million and $247.3 million thereafter.
The Company's average borrowings outstanding was $1,406.6 million and $1,433.8 million for the fiscal years ending January 3, 2020 and December 28, 2018, respectively. The Company's weighted-average cost of borrowings was 5.5% for the year ended January 3, 2020 and 5.3% for the years ended December 28, 2018 and December 29, 2017, respectively. Interest paid in 2019, 2018 and 2017 was $74.3 million, $73.9 million and $70.6 million, respectively.
At the end of fiscal 2019, Anixter had approximately $524.7 million and $134.3 million in available, committed, unused borrowings under the $600.0 million U.S. accounts receivable asset based revolving credit facility and $150.0 million U.S. inventory asset based revolving credit facility, respectively. All credit lines are with financial institutions with investment grade credit ratings. Borrowings under these facilities are limited based on the borrowing base criteria as described below.
The Company is in compliance with all of its covenants and believes that there is adequate margin between the covenant ratios and the actual ratios given the current trends of the business.
Revolving Lines of Credit and Canadian Term Loan
On October 5, 2015, Anixter, through its wholly-owned subsidiaries, Anixter Inc., Anixter Receivables Corporation ("ARC") and Anixter Canada Inc., entered into certain financing transactions in connection with the consummation of the acquisition of Power Solutions, including a U.S. accounts receivable asset based revolving credit facility in an aggregate committed amount of $600.0 million ("Receivables Facility"), a U.S. inventory asset based revolving credit facility in an aggregate committed amount of $150.0 million ("Inventory Facility") for a U.S. combined commitment of $750.0 million ("Combined Commitment"). Additionally, the Company entered into a Canadian term loan facility in Canada in an aggregate principal amount of $300.0 million Canadian dollars, the equivalent to approximately $225.0 million USD, with a five-year maturity ("Canadian Term Loan"). In connection with these financing transactions, the Company incurred approximately $6.7 million in financing transaction costs, of which approximately $5.4 million was capitalized as deferred financing costs and will be amortized through maturity using the straight-line method, and approximately $1.3 million was expensed as incurred.
On November 16, 2018, Anixter amended the Receivables and Inventory Facilities to extend the maturity date from October 5, 2020 to November 16, 2023. An additional $2.1 million of deferred financing costs were capitalized and will be amortized through maturity.
Receivables Facility
On October 5, 2015, Anixter, through its wholly-owned subsidiary, ARC, entered into a Receivables Facility, which is a receivables based revolving credit facility in an aggregate committed amount of $600.0 million. Borrowings under the Receivables Facility are secured by a first lien on all assets of ARC and supported by an unsecured guarantee by Anixter International, Inc.
The Receivables Facility has a borrowing base of 85% of eligible receivables, subject to certain reserves.
In connection with the entry into the Receivables Facility, on October 5, 2015, Anixter Inc. and ARC entered into a Third Amended and Restated Receivables Sale Agreement (the "Amended and Restated RSA"), which amended and restated the existing Second Amended and Restated Sales Agreement. The purpose of the Amended and Restated RSA is (i) to reflect the entry into the Receivables Facility and the termination of the Second Amended and Restated Receivables Purchase Agreement, and (ii) to include in the receivables sold by Anixter Inc. to ARC receivables originated by Tri-Northern Holdings, Inc. and its subsidiaries (collectively, the "Tri-Ed Subsidiaries") and subsidiaries acquired in the Power Solutions acquisition (the "Power Solutions Subsidiaries").
ANIXTER INTERNATIONAL INC.
NOTES TO THE CONSOLIDATED FINANCIAL STATEMENTS – (Continued)
Inventory Facility
On October 5, 2015, Anixter and certain of its wholly-owned subsidiaries, including the Tri-Ed Subsidiaries and Power Solutions Subsidiaries, entered into the Inventory Facility, an asset based lending revolving credit facility, in an aggregate committed amount of $150.0 million. Borrowings under the Inventory Facility are secured by a first lien on Anixter Inc.'s and certain of its subsidiaries' personal property and supported by a guarantee by Anixter International Inc.
The Inventory Facility has a borrowing base, (a) with respect to appraised eligible domestic inventory, of the lesser of (i) 85% of the net orderly liquidation value of such inventory; and (ii) 75% of book value of such inventory, plus, (b) with respect to eligible domestic inventory not appraised, 40% of the net orderly liquidation value of such inventory, less (c) certain reserves.
The Receivables Facility and the Inventory Facility (collectively, the "Combined Facilities")
The Combined Facilities drawn pricing will range from LIBOR plus 125 basis points when the combined unused availability (the "Combined Availability") under the Combined Facilities is greater than $500.0 million or LIBOR plus 150 basis points when Combined Availability is less than $500.0 million. Undrawn fees are 25 basis points.
Acquisitions and restricted payments will be permitted, subject to, among other things, (i) Combined Availability of at least $131.3 million after giving pro forma effect to any acquisition or restricted payment or (ii) (a) Combined Availability of at least $93.8 million and (b) maintenance of a minimum fixed charge coverage ratio of at least 1.1x, after giving pro forma effect to the acquisition or restricted payment.
The Combined Facilities provides for customary representations and warranties and customary events of default, generally with corresponding grace periods, including, without limitation, payment defaults with respect to the facility, covenant defaults, cross-defaults to other agreements evidencing material indebtedness, certain judgments and events of bankruptcy.
Canadian Term Loan
On October 5, 2015, Anixter, through its wholly-owned subsidiaries, Anixter Canada Inc. and Tri-Ed ULC, entered into a $300.0 million Canadian dollars (equivalent to approximately $225.0 million USD) Canadian Term Loan. During 2017, the Company repaid $100.2 million of the outstanding balance. The Company incurred $0.2 million of additional interest expense in 2017 due to the write-off of deferred financing costs on the early payment of debt. The Canadian Term Loan was guaranteed by all present and future material Canadian subsidiaries of Anixter Canada Inc. and Tri-Ed ULC as well as Anixter Mid Holdings BV. The Canadian Term Loan was secured by a first priority security interest in all of the assets of Anixter Canada Inc. and each of its Canadian subsidiaries, which comprised the borrowing group.
In the fourth quarter of 2017, the Company paid off the Canadian Term Loan in full.
6.00% Senior Notes Due 2025
On November 13, 2018, the Company's primary operating subsidiary, Anixter Inc., completed the issuance of $250.0 million principal amount of Senior notes due 2025 ("Notes due 2025"). The Notes due 2025 were issued at a price that was 98.75% of par, which resulted in a discount related to underwriting fees of $3.1 million. The discount is reported on the Consolidated Balance Sheet as a reduction to the face amount of the Notes due 2025 and is being amortized to interest expense over the term of the related debt, using the effective interest method. In addition, $0.8 million of deferred financing costs were paid, which are being amortized through maturity using the straight-line method. The Notes due 2025 pay interest semi-annually at a rate of 6.00% per annum and will mature on December 1, 2025. In addition, Anixter Inc. may at any time prior to September 1, 2025, redeem some or all of the Notes due 2025 at a price equal to 100% of the principal amount plus a "make whole" premium. At any time on or after September 1, 2025, Anixter Inc. may redeem some or all of the Notes due 2025 at a price equal to 100% of the principal amount, plus accrued and unpaid interest. If the Company experiences certain kinds of changes of control, Anixter Inc. must offer to repurchase all of the Notes due 2025 outstanding at 101% of the aggregate principal amount repurchased, plus accrued and unpaid interest. The proceeds were used along with available borrowings under Anixter's revolving lines of credit to retire the Company's Senior notes due 2019. Anixter International Inc. fully and unconditionally guarantees the Notes due 2025, which are unsecured obligations of Anixter Inc.
ANIXTER INTERNATIONAL INC.
NOTES TO THE CONSOLIDATED FINANCIAL STATEMENTS – (Continued)
5.50% Senior Notes Due 2023
On August 18, 2015, the Company's primary operating subsidiary, Anixter Inc., completed the issuance of $350.0 million principal amount of Senior notes due 2023 ("Notes due 2023"). The Notes due 2023 were issued at a price that was 98.75% of par, which resulted in a discount related to underwriting fees of $4.4 million. The discount is reported on the Consolidated Balance Sheet as a reduction to the face amount of the Notes due 2023 and is being amortized to interest expense over the term of the related debt, using the effective interest method. In addition, $1.7 million of deferred financing costs were paid, which are being amortized through maturity using the straight-line method. The Notes due 2023 pay interest semi-annually at a rate of 5.50% per annum and will mature on March 1, 2023. In addition, Anixter Inc. may at any time redeem some or all of the Notes due 2023 at a price equal to 100% of the principal amount plus a "make whole" premium. If the Company experiences certain kinds of changes of control, Anixter Inc. must offer to repurchase all of the Notes due 2023 outstanding at 101% of the aggregate principal amount repurchased, plus accrued and unpaid interest. The proceeds were used to partially finance the Power Solutions acquisition. Anixter International Inc. fully and unconditionally guarantees the Notes due 2023, which are unsecured obligations of Anixter Inc.
5.125% Senior Notes Due 2021
On September 23, 2014, the Company's primary operating subsidiary, Anixter Inc., completed the issuance of $400.0 million principal amount of Senior notes due 2021 ("Notes due 2021"). The Notes due 2021 were issued at a price that was 98.50% of par, which resulted in a discount related to underwriting fees of $6.0 million. Net proceeds from this offering were approximately $393.1 million after also deducting for approximately $0.9 million of deferred financing costs paid that are being amortized through maturity using the straight-line method. The discount is reported on the Consolidated Balance Sheet as a reduction to the face amount of the Notes due 2021 and is being amortized to interest expense over the term of the related debt, using the effective interest method. The Notes due 2021 pay interest semi-annually at a rate of 5.125% per annum and will mature on October 1, 2021. In addition, Anixter Inc. may at any time redeem some or all of the Notes due 2021 at a price equal to 100% of the principal amount plus a "make whole" premium. If Anixter Inc. and/or the Company experience certain kinds of changes of control, it must offer to repurchase all of the Notes due 2021 outstanding at 101% of the aggregate principal amount repurchased, plus accrued and unpaid interest. The proceeds were used by Anixter Inc. to repay amounts outstanding under the accounts receivable credit facility, to repay certain additional borrowings under the 5-year senior unsecured revolving credit agreement that had been incurred for the specific purpose of funding the Tri-Ed acquisition, to provide additional liquidity for maturing indebtedness and for general corporate purposes. Anixter International Inc. fully and unconditionally guarantees the Notes due 2021, which are unsecured obligations of Anixter Inc.
Short-term borrowings
Anixter has borrowings under other bank revolving lines of credit totaling $8.8 million and $6.1 million at the end of fiscal 2019 and 2018, respectively. The Company's short-term borrowings have maturity dates within the next fiscal year. However, all of the borrowings at the end of fiscal 2019 have been classified as long-term at January 3, 2020, as the Company has the intent and ability to refinance the debt under existing long-term financing agreements.
Retirement of Debt
In the fourth quarter of 2018, Anixter retired the below described 5.625% Senior notes due 2019, which had a maturity value of $350.0 million. The proceeds from the issuance of Notes due 2025 and available borrowings under Anixter's revolving lines of credit were used to settle the maturity value. The Company paid a $3.9 million make whole premium and incurred $0.7 million of additional expense due to the write-off of discounts and deferred financing costs on the early payment of debt.
On April 30, 2012, the Company's primary operating subsidiary, Anixter Inc., completed the issuance of $350.0 million principal amount of Senior notes due 2019 ("Notes due 2019"). The Notes due 2019 were issued at a price that was 98.25% of par, which resulted in a discount related to underwriting fees of $6.1 million. Net proceeds from this offering were approximately $342.9 million after also deducting for approximately $1.0 million of deferred financing costs paid that were amortized through maturity using the straight-line method. The discounts were reported on the Consolidated Balance Sheet as a reduction to the face amount of the Notes due 2019 and were amortized to interest expense over the term of the related debt, using the effective interest method. The Notes due 2019 paid interest semi-annually at a rate of 5.625% per annum and were scheduled to mature on May 1, 2019.
ANIXTER INTERNATIONAL INC.
NOTES TO THE CONSOLIDATED FINANCIAL STATEMENTS – (Continued)
In the fourth quarter of 2017, the Company paid off the Canadian Term Loan in full.
The retirement of debt did not have a significant impact on the Company's Consolidated Statements of Income.
Fair Value of Debt
The fair value of Anixter's debt instruments is measured using observable market information which would be considered Level 2 in the fair value hierarchy described in accounting guidance on fair value measurements. The Company's fixed-rate debt consists of Senior notes due 2025, Senior notes due 2023 and Senior notes due 2021.
At January 3, 2020, the Company's total carrying value and estimated fair value of debt outstanding was $1,059.7 million and $1,122.1 million, respectively. This compares to a carrying value and estimated fair value of debt outstanding at December 28, 2018 of $1,252.7 million and $1,261.7 million, respectively. The decrease in the carrying value and estimated fair value is primarily due to lower outstanding borrowings under Anixter's revolving lines of credit.
NOTE 6. COMMITMENTS AND CONTINGENCIES
As of January 3, 2020, the Company had $56.1 million in outstanding letters of credit and guarantees.
From time to time, Anixter is party to legal proceedings and matters that arise in the ordinary course of business. As of January 3, 2020, the Company does not believe there is a reasonable possibility that any material loss exceeding the amounts already recognized for these proceedings and matters has been incurred. However, the ultimate resolutions of these proceedings and matters are inherently unpredictable. As such, the Company's financial condition and results of operations could be adversely affected in any particular period by the unfavorable resolution of one or more of these proceedings or matters.
NOTE 7. INCOME TAXES
Income Before Tax Expense: Domestic income before income taxes was $244.2 million, $167.8 million and $178.1 million for 2019, 2018 and 2017, respectively. Foreign income before income taxes was $49.2 million, $55.4 million and $59.5 million for 2019, 2018 and 2017, respectively.
Tax Provisions and Reconciliation to the Statutory Rate: The components of Anixter's tax expense and the reconciliation to the statutory federal rate are identified below. Income tax expense was comprised of:
| | | | | | | | | | | | | | | | | | | | |
| | Years Ended | | | | |
| (In millions) | | January 3,
2020 | | December 28,
2018 | | December 29,
2017 |
| Current: | | | | | | |
| Foreign | | $ | 21.7 | | | $ | 24.2 | | | $ | 21.7 | |
| State | | 10.3 | | | 9.4 | | | 8.3 | |
| Federal | | 39.9 | | | 34.2 | | | 99.4 | |
| | 71.9 | | | 67.8 | | | 129.4 | |
| Deferred: | | | | | | |
| Foreign | | (3.5) | | | (2.5) | | | 0.2 | |
| State | | 0.5 | | | 0.2 | | | 2.0 | |
| Federal | | (38.4) | | | 1.4 | | | (3.0) | |
| | (41.4) | | | (0.9) | | | (0.8) | |
| Income tax expense | | $ | 30.5 | | | $ | 66.9 | | | $ | 128.6 | |
ANIXTER INTERNATIONAL INC.
NOTES TO THE CONSOLIDATED FINANCIAL STATEMENTS – (Continued)
Reconciliations of income tax expense to the statutory corporate federal tax rate of 21% were as follows:
| | | | | | | | | | | | | | | | | | | | |
| | Years Ended | | | | |
| (In millions) | | January 3,
2020 | | December 28,
2018 | | December 29,
2017 |
| Statutory tax expense | | $ | 61.6 | | | $ | 46.9 | | | $ | 83.2 | |
| Increase (reduction) in taxes resulting from: | | | | | | |
| State income taxes, net | | 9.7 | | | 7.9 | | | 4.4 | |
| Foreign tax effects | | 3.5 | | | 11.9 | | | 2.0 | |
| Change in valuation allowance | | (42.3) | | | (0.6) | | | (0.3) | |
| Impact of tax legislation | | — | | | (2.1) | | | 35.6 | |
| Foreign derived intangible income deduction | | (4.5) | | | — | | | — | |
| Other, net | | 2.5 | | | 2.9 | | | 3.7 | |
| Income tax expense | | $ | 30.5 | | | $ | 66.9 | | | $ | 128.6 | |
Impact of Tax Legislation: On December 22, 2017, the Tax Cuts and Jobs Act (the “Act”) was signed into law. The Act made significant changes to the U.S. tax code. The changes impacting the Company beginning in the fourth quarter of 2017, the period of enactment, include:
•The reduction of the U.S. corporate tax rate to 21% results in an adjustment to the Company's U.S. deferred tax assets and liabilities to the lower rate. The impact of the deferred tax adjustment was measured and recorded as an increase in earnings for the quarter ending December 29, 2017, of $14.4 million. The impact was revised and a deferred tax adjustment of $0.7 million was recorded as a decrease in earnings for the quarter ending December 28, 2018; and
•The tax reform legislation will subject the earnings of the Company's cumulative foreign earnings and profits to U.S. income taxes as a deemed repatriation. The estimated provisional impact of the deemed repatriation decreased earnings for the quarter ending December 29, 2017 by $50.0 million. The tax impact was revised to $47.2 million and finalized in 2018.
The Act subjects U.S. shareholders to tax on Global Intangible Low-Taxed Income ("GILTI") earned by certain foreign subsidiaries. The Company is electing to recognize the tax on GILTI as a period expense in the period tax is incurred. Under this policy, the Company has not provided deferred taxes related to temporary differences that upon their reversal will affect the amount of income subject to GILTI in the period.
Tax Payments: The Company made net payments for income taxes in 2019, 2018 and 2017 of $87.1 million, $88.4 million and $76.4 million, respectively.
Net Operating Losses: Anixter International Inc. and its U.S. subsidiaries file a U.S. federal corporate income tax return on a consolidated basis. At January 3, 2020, various of Anixter's foreign subsidiaries had aggregate cumulative net operating loss ("NOL") carryforwards for foreign income tax purposes of approximately $89.7 million which are subject to various provisions of each respective country. Approximately $71.9 million of the NOL carryforwards may be carried forward indefinitely. The remaining NOL carryforwards expire at various times between 2020 and 2028.
Foreign Tax Credit Carryforwards: At January 3, 2020, the Company estimated and accrued provisional transition taxes. As a result of the transition tax, the Company estimates that it will also have foreign tax credit carryforwards of $41.7 million. At December 28, 2018, a full valuation allowance was recorded against the deferred tax asset related to foreign tax credits as there was not sufficient foreign-source income projected to utilize the foreign tax credits. After considering the relevant evidence in assessing the realizability of the deferred tax asset related to foreign tax credits, in particular the effects of changing to a U.S.-center-led business model during 2019, the Company reversed its valuation allowance in the amount of $41.7 million in 2019.
ANIXTER INTERNATIONAL INC.
NOTES TO THE CONSOLIDATED FINANCIAL STATEMENTS – (Continued)
Undistributed Earnings: Undistributed earnings of Anixter's foreign subsidiaries amounted to approximately $680.0 million at January 3, 2020. The Act converted the U.S. system of taxing foreign earnings from a worldwide system to a territorial system. Future distributions of foreign earnings by Anixter affiliates abroad will no longer result in U.S. taxation. In converting to a territorial system the Act levied a one-time transition tax on deferred foreign earnings as of 2017. Anixter has calculated the net combined U.S. tax impact on this deemed repatriation to be approximately $47.2 million and plans to elect to pay the federal portion of this tax liability in installments over eight years. Despite the conversion to a territorial system, Anixter considers the undistributed earnings of its foreign subsidiaries to be indefinitely reinvested. Upon distribution of those earnings in the form of dividends or otherwise, Anixter may be subject to withholding taxes payable to the various foreign countries. With respect to the countries that have undistributed earnings as of January 3, 2020, according to the foreign laws and treaties in place at that time, estimated foreign jurisdiction withholding taxes of approximately $37.6 million would be payable upon the remittance of all earnings at January 3, 2020.
Deferred Income Taxes: Significant components of the Company's deferred tax assets (liabilities) included in "Other assets" and "Other liabilities" on the Consolidated Balance Sheets were as follows:
| | | | | | | | | | | | | | |
| (In millions) | | January 3,
2020 | | December 28,
2018 |
| Deferred compensation and other postretirement benefits | | $ | 38.4 | | | $ | 36.0 | |
| Foreign NOL carryforwards and other | | 26.1 | | | 28.1 | |
| Operating lease obligations | | 67.6 | | | 1.6 | |
| Accrued expenses and other | | 9.1 | | | 8.4 | |
| Inventory reserves | | 8.7 | | | 8.5 | |
| Unrealized foreign exchange | | 0.5 | | | 2.7 | |
| Allowance for doubtful accounts | | 6.5 | | | 7.9 | |
| Federal and state credits | | 54.5 | | | 50.6 | |
| Gross deferred tax assets | | $ | 211.4 | | | $ | 143.8 | |
| Property, equipment, intangibles and other | | (74.8) | | | (90.1) | |
| Operating lease assets | | (66.5) | | | | — | |
| Gross deferred tax liabilities | | $ | (141.3) | | | $ | (90.1) | |
| Deferred tax assets, net of deferred tax liabilities | | 70.1 | | | 53.7 | |
| Valuation allowance | | (38.3) | | | (79.1) | |
| Net deferred tax assets (liabilities) | | $ | 31.8 | | | $ | (25.4) | |
Uncertain Tax Positions and Jurisdictions Subject to Examinations: A reconciliation of the beginning and ending amount of unrecognized tax benefits for fiscal 2017, 2018 and 2019 is as follows:
| | | | | |
(In millions) | |
Balance at December 30, 2016 | $ | 5.0 | |
Reductions for tax positions of prior years | (0.3) | |
Balance at December 29, 2017 | $ | 4.7 | |
Additions for tax positions of prior years | 0.6 | |
Reductions for tax positions of prior years | (0.6) | |
Balance at December 28, 2018 | $ | 4.7 | |
Additions for tax positions of prior years | 0.1 | |
Reductions for tax positions of prior years | (2.6) | |
Balance at January 3, 2020 | $ | 2.2 | |
Interest and penalties accrued for unrecognized tax benefits were $0.2 million in 2019, 2018 and 2017. The Company estimates that of the unrecognized tax benefit balance of $2.2 million, all of which would affect the effective tax rate, $0.2 million may be resolved in a manner that would impact the effective rate within the next twelve months. The reserves for uncertain tax positions, including interest and penalties, of $3.0 million cover a range of issues, including intercompany charges and withholding taxes, and involve various taxing jurisdictions.
ANIXTER INTERNATIONAL INC.
NOTES TO THE CONSOLIDATED FINANCIAL STATEMENTS – (Continued)
Only the returns for fiscal tax years 2014 and later remain open to examination by the Internal Revenue Service ("IRS") in the U.S., which is Anixter's most significant tax jurisdiction. For most states, fiscal tax years 2015 and later remain subject to examination. In Canada, the fiscal tax years 2015 and later are still subject to examination, while in the United Kingdom, the fiscal tax years 2018 and later remain subject to examination.
NOTE 8. PENSION PLANS, POST-RETIREMENT BENEFITS AND OTHER BENEFITS
The Company's defined benefit pension plans are the plans in the U.S., which consist of the Anixter Inc. Pension Plan, the Executive Benefit Plan and the Supplemental Executive Retirement Plan ("SERP") (together the "Domestic Plans") and various defined benefit pension plans covering employees of foreign subsidiaries in Canada and Europe (together the "Foreign Plans"). The majority of these defined benefit pension plans are non-contributory and, with the exception of the U.S. and Canada, cover substantially all full-time domestic employees and certain employees in other countries. Retirement benefits are provided based on compensation as defined in both the Domestic Plans and the Foreign Plans. The Company's policy is to fund all Domestic Plans as required by the Employee Retirement Income Security Act of 1974 ("ERISA") and the IRS and all Foreign Plans as required by applicable foreign laws. The Executive Benefit Plan and SERP are the only two plans that are unfunded. Assets in the various plans consist primarily of equity securities and debt securities.
Accounting rules related to pensions generally reduce the recognition of actuarial gains and losses in the net benefit cost, as any significant actuarial gains/losses are amortized over the remaining service lives of the plan participants. These actuarial gains and losses are mainly attributable to the return on plan assets that differ from that assumed and differences in the obligation due to changes in the discount rate, plan demographic changes and other assumptions.
The measurement date for all plans is December 31st. Accordingly, at the end of each fiscal year, the Company determines the discount rate to be used to discount the plan liabilities to their present value. The discount rate reflects the current rate at which the pension liabilities could be effectively settled at the end of the year. In estimating this rate at the end of 2019 and 2018, the Company reviewed rates of return on relevant market indices and concluded the Willis Towers Watson Global Rate Link Model was consistent with observable market conditions and industry standards for developing spot rate curves. These rates are adjusted to match the duration of the liabilities associated with the pension plans.
At January 3, 2020 and December 28, 2018, the Company determined the consolidated weighted-average discount rate of all plans to be 2.75% and 3.59%, respectively, and used these rates to measure the projected benefit obligation ("PBO") at the end of each respective fiscal year end. Due primarily to actuarial losses, the PBO increased to $586.5 million at the end of fiscal 2019 from $504.1 million at the end of fiscal 2018. The consolidated net unfunded status was $71.0 million at the end of fiscal 2019 compared to $55.2 million at the end of 2018.
A significant element in determining net periodic benefit cost in accordance with U.S. GAAP is the expected return on plan assets. For 2019, the Company had assumed that the weighted-average expected long-term rate of return on plan assets would be 6.01%. This expected return on plan assets is included in the net periodic benefit cost for the fiscal year ended 2019. As a result of the combined effect of valuation changes in both the equity and bond markets, the plan assets produced an actual gain of approximately 16.8% in 2019 and an actual loss of approximately 4.2% in 2018. The fair value of plan assets is $515.5 million at the end of fiscal 2019, compared to $448.9 million at the end of fiscal 2018. The difference between the expected return and the actual return on plan assets is amortized into expense over the service lives of the plan participants. These amounts are reflected on the balance sheet through charges to "Accumulated other comprehensive loss," a component of "Stockholders’ Equity" in the Consolidated Balance Sheets.
In the fourth quarter of 2019, the Company amended the Anixter Inc. Pension Plan in the U.S. to allow for terminated employees a one-time option to receive a cash payout of their vested benefits if the present value of the benefit was under $125,000. This resulted in an additional $10.9 million of lump sum payments. The cash payout did not result in a settlement charge as the amount did not exceed the service and interest costs of the plan in 2019.
In the fourth quarter of 2017, the Company transferred the benefits of certain retirees or beneficiaries to a third-party annuity provider. The Company paid $11.3 million of additional contributions into the plan using excess cash from operations to fund the contributions. The plan purchased an $11.3 million annuity contract with a third-party insurance carrier and transferred the related pension obligations to the carrier. The funding of the premiums did not result in a settlement charge as the amount did not exceed the service and interest costs of the plan in 2017.
ANIXTER INTERNATIONAL INC.
NOTES TO THE CONSOLIDATED FINANCIAL STATEMENTS – (Continued)
In the third quarter of 2015, the plan was frozen to entrants first hired or rehired on or after July 1, 2015. Anixter Inc. makes an annual contribution to the Employee Savings Plan on behalf of each active participant who is first hired or rehired on or after July 1, 2015, or is not participating in the Anixter Inc. Pension Plan. The amount of the employer annual contribution to each active participant's account will be an amount determined by multiplying the participant's salary for the Plan year by either: (1) 2% if such participant's years of service as of August 1 of the Plan year is fewer than five, or (2) 2.5% if such participant's years of service as of August 1 of the Plan year is five or greater. This contribution is in lieu of being eligible for the Anixter Inc. Pension Plan.
All non-union domestic employees hired or rehired before July 1, 2015, earn a benefit under a personal retirement account (hypothetical account balance). Each year, a participant’s account receives a credit equal to 2% of the participant’s salary (2.5% if the participant’s years of service at August 1 of the plan year are five years or more). Active participants become fully vested in their hypothetical personal retirement account after three years of service. Interest earned on the credited amount is not credited to the personal retirement account but is contributed to the participant’s account in the Anixter Inc. Employee Savings Plan. The interest contribution equals the interest earned on the personal retirement account balance as of January 1st in the Domestic Plan and is based on the 10-year Treasury note rate as of the last business day of December.
In 2019 and 2018, the Society of Actuaries released new mortality tables and improvement projection scales. After reviewing the new information as well as the defined benefit plan’s population, the Company updated U.S. mortality improvement assumptions in 2019 and 2018 for purposes of determining its mortality assumption used in the U.S. defined benefit plans' liability calculation. In 2019, the Company selected the white collar version of the Pri-2012 tables projected generationally using the Society of Actuaries’ MP-2019 projection scale. The updated U.S. mortality assumptions resulted in an increase of $5.2 million to the benefit obligation as of the end of 2019, prior to reflecting the discount rate change. In 2018, the Company adjusted the long term mortality improvement projection assumption to 80% of the Society of Actuaries’ mortality improvement scale to reflect the Company’s long-term expectations. The updated U.S. mortality assumptions resulted in a decrease of $2.8 million to the benefit obligation as of the end of 2018, prior to reflecting the discount rate change.
The assets of the various defined benefit plans are held in separate independent trusts and managed by independent third party advisors. The investment objective of both the Domestic and Foreign Plans is to ensure, over the long-term life of the plans, an adequate level of assets to fund the benefits to employees and their beneficiaries at the time they are payable. In meeting this objective, the Company seeks to achieve a level of absolute investment return consistent with a prudent level of portfolio risk. Anixter's risk preference is to refrain from exposing the plans to higher volatility in pursuit of potential higher returns.
The Domestic Plans’ and Foreign Plans’ asset mixes as of January 3, 2020 and December 28, 2018 and the asset allocation guidelines for such plans are summarized as follows.
| | | | | | | | | | | | | | | | | | | | | | | | | | |
| | Domestic Plans | | | | | | |
| | | January 3, 2020 | | Allocation Guidelines | | | | |
| | | | | Min | | Target | | Max |
| Global equities | | 42.5 | % | | 30 | % | | 37 | % | | 45 | % |
| Debt securities: | | | | | | | | |
| Domestic treasuries | | 20.9 | | | — | | | 24 | | | 40 | |
| Corporate bonds | | 7.0 | | | — | | | 8 | | | 40 | |
| Other | | 14.4 | | | 9 | | | 14 | | | 19 | |
| Total debt securities | | 42.3 | | | 9 | | | 46 | | | 99 | |
| Property/real estate | | 15.2 | | | 9 | | | 16 | | | 23 | |
| Other | | — | | | — | | | 1 | | | 5 | |
| | 100.0 | % | | | | 100 | % | | |
ANIXTER INTERNATIONAL INC.
NOTES TO THE CONSOLIDATED FINANCIAL STATEMENTS – (Continued)
| | | | | | | | | | | | | | | | | | | | | | | |
| Domestic Plans | | | | | | |
| December 28,
2018 | | Allocation Guidelines | | | | |
| | | Min | | Target | | Max |
| Global equities | 40.1 | % | | 37 | % | | | 46 | % | | | 66 | % |
| Debt securities: | | | | | | | |
| Domestic treasuries | 15.6 | | | — | | | | 12 | | | | 34 | |
| Corporate bonds | 16.3 | | | — | | | | 17 | | | | 34 | |
| Other | 14.5 | | | 9 | | | | 14 | | | | 19 | |
| Total debt securities | 46.4 | | | 9 | | | 43 | | | 87 | |
| Property/real estate | 12.6 | | | — | | | | 10 | | | | 19 | |
| Other | 0.9 | | | — | | | | 1 | | | | 5 | |
| 100.0 | % | | | | 100 | % | | |
| | | | | | | | | | | | | | | | | | | | | | | |
| Foreign Plans | | | | | | |
| January 3, 2020 | | Allocation Guidelines | | | | |
| | | Min | | Target | | Max |
| Equities: | | | | | | | |
| Domestic equities | 0.4 | % | | — | % | | | — | % | | | — | % |
| International equities | — | | | 2 | | | | 2 | | | | 2 | |
| Global equities | 39.3 | | | 14 | | | | 34 | | | | 39 | |
| Total equities | 39.7 | | | 16 | | | 36 | | | 41 | |
| Debt securities: | | | | | | | |
| Domestic treasuries | 0.4 | | | — | | | | — | | | | — | |
| Corporate bonds | 8.1 | | | — | | | | — | | | | — | |
| Other | 37.1 | | | 16 | | | | 42 | | | | 73 | |
| Total debt securities | 45.6 | | | 16 | | | 42 | | | 73 | |
| Property/real estate | 6.3 | | | — | | | | 14 | | | | 22 | |
| Insurance products | 8.3 | | | 8 | | | | 8 | | | | 8 | |
| Other | 0.1 | | | — | | | | — | | | | 14 | |
| 100.0 | % | | | | 100 | % | | |
| | | | | | | | | | | | | | |
| | Foreign Plans | | |
| | | December 28,
2018 | | Allocation |
| | | | Guidelines |
| | | | | Target |
| Equity securities | | 60 | % | | 60 | % |
| Debt securities | | 30 | | | 30 | |
| Other investments | | 10 | | | 10 | |
| | 100 | % | | 100 | % |
ANIXTER INTERNATIONAL INC.
NOTES TO THE CONSOLIDATED FINANCIAL STATEMENTS – (Continued)
The pension committees meet regularly to assess investment performance and reallocate assets that fall outside of its allocation guidelines. The variations between the allocation guidelines and actual asset allocations reflect relative performance differences in asset classes. From time to time, the Company periodically rebalances its asset portfolios to be in line with its allocation guidelines.
For 2019, the U.S. investment policy guidelines were as follows:
•Each asset class is managed by one or more active and passive investment managers
•Each asset class may be invested in a commingled fund, mutual fund, or separately managed account
•Investment in Exchange Traded Funds ("ETFs") is permissible
•Each manager is expected to be "fully invested" with minimal cash holdings
•Derivative instruments such as futures, swaps and options may be used on a limited basis; For funds that employ derivatives, the loss of invested capital to the Trust should be limited to the amount invested in the fund
•The equity portfolio is diversified by sector and geography
•The real assets portfolio is invested Real Estate Investment Trusts ("REITs") and private real estate
•The fixed income is invested in U.S. Treasuries, investment grade corporate debt (denominated in U.S. dollars), and other credit investments including below investment grade rated bonds and loans, securitized credit, and emerging market debt
The investment policies for the Foreign plans are the responsibility of the various trustees. Generally, the investment policy guidelines are as follows:
•Make sure that the obligations to the beneficiaries of the Plan can be met
•Maintain funds at a level to meet the minimum funding requirements
•The investment managers are expected to provide a return, within certain tracking tolerances, close to that of the relevant market’s indices
The expected long-term rate of return on both the Domestic and Foreign Plans’ assets reflects the average rate of earnings expected on the invested assets and future assets to be invested to provide for the benefits included in the projected benefit obligation. The Company uses historic plan asset returns combined with current market conditions to estimate the rate of return. The expected rate of return on plan assets is a long-term assumption based on an analysis of historical and forward looking returns considering the respective plan’s actual and target asset mix. The weighted-average expected rate of return on plan assets used in the determination of net periodic pension cost for 2019 is 6.01%.
ANIXTER INTERNATIONAL INC.
NOTES TO THE CONSOLIDATED FINANCIAL STATEMENTS – (Continued)
The following table sets forth the changes and the end of year components of "Accumulated other comprehensive loss" for the defined benefit plans:
| | | | | | | | | | | | | | |
| (In millions) | | January 3,
2020 | | December 28,
2018 |
| Changes to Balance: | | | | |
| Beginning balance | | $ | 126.7 | | | $ | 112.2 | |
| Recognized prior service cost | | 3.8 | | | 4.0 | |
| Recognized net actuarial gain | | (8.5) | | | (7.5) | |
| Settlement | | (0.4) | | | — | |
| Prior service cost arising in current year | | — | | | 0.4 | |
| Net actuarial loss arising in current year | | 20.4 | | | 21.8 | |
| Foreign currency exchange rate changes | | 2.5 | | | (4.2) | |
| Ending balance | | $ | 144.5 | | | $ | 126.7 | |
| | | | | | | | | | | | | | |
| Components of Balance: | | | | |
| Prior service credit | | $ | (9.0) | | | $ | (12.8) | |
| Net actuarial loss | | 153.5 | | | 139.5 | |
| | $ | 144.5 | | | $ | 126.7 | |
Amounts in "Accumulated other comprehensive loss" expected to be recognized as components of net period pension cost in 2020 are as follows:
| | | | | |
(In millions) | |
Amortization of prior service credit | $ | (3.4) | |
Amortization of actuarial loss | 9.4 | |
Total amortization expected | $ | 6.0 | |
ANIXTER INTERNATIONAL INC.
NOTES TO THE CONSOLIDATED FINANCIAL STATEMENTS – (Continued)
The following represents a reconciliation of the funded status of the Company's pension plans for fiscal years 2019 and 2018:
| | | | | | | | | | | | | | | | | | | | | | | | | | | | | | | | | | | | | | |
| | Pension Benefits | | | | | | | | | | |
| | | Domestic Plans | | | | Foreign Plans | | | | Total | | |
| (In millions) | | 2019 | | 2018 | | 2019 | | 2018 | | 2019 | | 2018 |
| Change in projected benefit obligation: | | | | | | | | | | | | |
| Beginning balance | | $ | 261.5 | | | $ | 275.8 | | | $ | 242.6 | | | $ | 257.6 | | | $ | 504.1 | | | $ | 533.4 | |
| Service cost | | 3.1 | | | 3.5 | | | 5.7 | | | 5.9 | | | 8.8 | | | 9.4 | |
| Interest cost | | 10.9 | | | 10.3 | | | 6.9 | | | 6.8 | | | 17.8 | | | 17.1 | |
| Actuarial loss (gain) | | 41.4 | | | (19.9) | | | 34.8 | | | (4.0) | | | 76.2 | | | (23.9) | |
| Benefits paid from plan assets | | (18.5) | | | (7.4) | | | (7.9) | | | (8.1) | | | (26.4) | | | (15.5) | |
| Benefits paid from Company assets | | (1.2) | | | (0.8) | | | — | | | — | | | (1.2) | | | (0.8) | |
| Plan amendment | | — | | | — | | | — | | | 0.5 | | | — | | | 0.5 | |
| Settlement | | — | | | — | | | (1.5) | | | (0.5) | | | (1.5) | | | (0.5) | |
| Plan participants contributions | | — | | | — | | | 0.1 | | | 0.1 | | | 0.1 | | | 0.1 | |
| Foreign currency exchange rate changes | | — | | | — | | | 8.7 | | | (15.7) | | | 8.7 | | | (15.7) | |
| Other | | — | | | — | | | (0.1) | | | — | | | (0.1) | | | — | |
| Ending balance | | $ | 297.2 | | | $ | 261.5 | | | $ | 289.3 | | | $ | 242.6 | | | $ | 586.5 | | | $ | 504.1 | |
| Change in plan assets at fair value: | | | | | | | | | | | | |
| Beginning balance | | $ | 260.4 | | | $ | 280.8 | | | $ | 188.5 | | | $ | 209.1 | | | $ | 448.9 | | | $ | 489.9 | |
| Actual return on plan assets | | 55.6 | | | (13.0) | | | 25.5 | | | (6.9) | | | 81.1 | | | (19.9) | |
| Company contributions to plan assets | | — | | | — | | | 6.3 | | | 7.4 | | | 6.3 | | | 7.4 | |
| Benefits paid from plan assets | | (18.5) | | | (7.4) | | | (7.9) | | | (8.1) | | | (26.4) | | | (15.5) | |
| Settlement | | — | | | — | | | (1.5) | | | (0.5) | | | (1.5) | | | (0.5) | |
| Plan participants contributions | | — | | | — | | | 0.1 | | | 0.1 | | | 0.1 | | | 0.1 | |
| Foreign currency exchange rate changes | | — | | | — | | | 7.1 | | | (12.6) | | | 7.1 | | | (12.6) | |
| Other | | — | | | — | | | (0.1) | | | — | | | (0.1) | | | — | |
| Ending balance | | $ | 297.5 | | | $ | 260.4 | | | $ | 218.0 | | | $ | 188.5 | | | $ | 515.5 | | | $ | 448.9 | |
| Reconciliation of funded status: | | | | | | | | | | | | |
| Projected benefit obligation | | $ | (297.2) | | | $ | (261.5) | | | $ | (289.3) | | | $ | (242.6) | | | $ | (586.5) | | | $ | (504.1) | |
| Plan assets at fair value | | 297.5 | | | 260.4 | | | 218.0 | | | 188.5 | | | 515.5 | | | 448.9 | |
| Funded status | | $ | 0.3 | | | $ | (1.1) | | | $ | (71.3) | | | $ | (54.1) | | | $ | (71.0) | | | $ | (55.2) | |
| Included in the 2019 and 2018 funded status is accrued benefit cost of approximately $17.5 million and $16.5 million, respectively, related to two non-qualified plans, which cannot be funded pursuant to tax regulations. | | | | | | | | | | | | |
| Noncurrent asset | | $ | 17.8 | | | $ | 15.4 | | | $ | 0.2 | | | $ | 0.2 | | | $ | 18.0 | | | $ | 15.6 | |
| Current liability | | (1.1) | | | (1.2) | | | — | | | — | | | (1.1) | | | (1.2) | |
| Noncurrent liability | | (16.4) | | | (15.3) | | | (71.5) | | | (54.3) | | | (87.9) | | | (69.6) | |
| Funded status | | $ | 0.3 | | | $ | (1.1) | | | $ | (71.3) | | | $ | (54.1) | | | $ | (71.0) | | | $ | (55.2) | |
| Weighted-average assumptions used for measurement of the projected benefit obligation: | | | | | | | | | | | | |
| Discount rate | | 3.33 | % | | 4.28 | % | | 2.15 | % | | 2.84 | % | | 2.75 | % | | 3.59 | % |
| Salary growth rate | | 3.75 | % | | 3.75 | % | | 3.28 | % | | 3.26 | % | | 3.51 | % | | 3.51 | % |
ANIXTER INTERNATIONAL INC.
NOTES TO THE CONSOLIDATED FINANCIAL STATEMENTS – (Continued)
The following represents the funded components of net periodic pension cost (benefit) as reflected in the Company's Consolidated Statements of Income and the weighted-average assumptions used to measure net periodic pension cost for the years ended January 3, 2020, December 28, 2018 and December 29, 2017:
| | | | | | | | | | | | | | | | | | | | | | | | | | | | | | | | | | | | | | | | | | | | | | | | | | | | | | | | |
| | | Pension Benefits | | | | | | | | | | | | | | | | |
| | | Domestic Plans | | | | | | Foreign Plans | | | | | | Total | | | | |
| (In millions) | | 2019 | | 2018 | | 2017 | | 2019 | | 2018 | | 2017 | | 2019 | | 2018 | | 2017 |
| Recorded in operating expenses: | | | | | | | | | | | | | | | | | | |
| Service cost | | $ | 3.1 | | | $ | 3.5 | | | $ | 4.7 | | | $ | 5.7 | | | $ | 5.9 | | | $ | 5.9 | | | $ | 8.8 | | | $ | 9.4 | | | $ | 10.6 | |
| | | | | | | | | | | | | | | | | | |
| Recorded in other, net: | | | | | | | | | | | | | | | | | | |
| Interest cost | | 10.9 | | | 10.3 | | | 11.1 | | | 6.9 | | | 6.8 | | | 6.9 | | | 17.8 | | | 17.1 | | | 18.0 | |
| Expected return on plan assets | | (14.4) | | | (16.0) | | | (14.9) | | | (11.0) | | | (9.8) | | | (8.8) | | | (25.4) | | | (25.8) | | | (23.7) | |
| Net amortization | | 1.6 | | | 0.6 | | | 2.5 | | | 3.2 | | | 2.9 | | | 3.0 | | | 4.8 | | | 3.5 | | | 5.5 | |
| Settlement charge | | — | | | — | | | — | | | 0.4 | | | 0.1 | | | — | | | 0.4 | | | 0.1 | | | — | |
| Total recorded in other, net | | $ | (1.9) | | | (5.1) | | | (1.3) | | | (0.5) | | | — | | | 1.1 | | | (2.4) | | | (5.1) | | | (0.2) | |
| | | | | | | | | | | | | | | | | | |
| Total net periodic pension cost (benefit) | | $ | 1.2 | | | $ | (1.6) | | | $ | 3.4 | | | $ | 5.2 | | | $ | 5.9 | | | $ | 7.0 | | | $ | 6.4 | | | $ | 4.3 | | | $ | 10.4 | |
| | | | | | | | | | | | | | | | | | | | | | | | | | | | | | | | | | | | | | | | | | | | | | | | | | | | | | | | |
| Weighted-average assumption used to measure net periodic pension (benefit) cost: | | | | | | | | | | | | | | | | | | |
| Discount rate | | 4.28 | % | | 3.78 | % | | 4.36 | % | | 2.84 | % | | 2.70 | % | | 2.99 | % | | 3.59 | % | | 3.26 | % | | 3.73 | % |
| Expected return on plan assets | | 6.25 | % | | 6.25 | % | | 6.25 | % | | 5.68 | % | | 4.81 | % | | 4.79 | % | | 6.01 | % | | 5.63 | % | | 5.59 | % |
| Salary growth rate | | 3.75 | % | | 3.76 | % | | 4.63 | % | | 3.26 | % | | 3.04 | % | | 3.01 | % | | 3.51 | % | | 3.36 | % | | 3.73 | % |
Fair Value Measurements
The following presents information about the Plan’s assets measured at fair value on a recurring basis at the end of fiscal 2019, and the valuation techniques used by the Plan to determine those fair values. The inputs used in the determination of these fair values are categorized according to the fair value hierarchy as being Level 1, Level 2 or Level 3.
In general, fair values determined by Level 1 inputs use quoted prices in active markets for identical assets that the Plan has the ability to access. The majority of pension assets valued by Level 1 inputs are comprised of global equity securities.
Fair values determined by Level 2 inputs use other inputs that are observable, either directly or indirectly. These Level 2 inputs include quoted prices for similar assets in active markets, and other inputs such as interest rates and yield curves that are observable at commonly quoted intervals. The majority of pension assets valued by Level 2 inputs are comprised of common/collective/pool funds (i.e., mutual funds). These assets are valued at their net asset values and considered observable inputs, or Level 2.
Level 3 inputs are unobservable inputs, including inputs that are available in situations where there is little, if any, market activity for the related asset. The only pension assets valued by Level 3 inputs relate to property and real estate funds.
In instances where inputs used to measure fair value fall into different levels in the above fair value hierarchy, fair value measurements in their entirety are categorized based on the lowest level input that is significant to the valuation. The Plan’s assessment of the significance of particular inputs to these fair value measurements requires judgment and considers factors specific to each asset.
ANIXTER INTERNATIONAL INC.
NOTES TO THE CONSOLIDATED FINANCIAL STATEMENTS – (Continued)
Disclosures concerning assets measured at fair value on a recurring basis at January 3, 2020 and December 28, 2018, which have been categorized under the fair value hierarchy for the Domestic and Foreign Plans by the Company are as follows:
| | | | | | | | | | | | | | | | | | | | | | | | | | | | | | | | | | | | | | | | | | | | | | | | | | | | | | | | | | | | | | | | | | | | | | | |
| As of January 3, 2020 | | | | | | | | | | | | | | | | | | | | | | |
| | Domestic Plans | | | | | | | | Foreign Plans | | | | | | | | Total | | | | | | |
| (In millions) | Level 1 | | Level 2 | | Level 3 | | Total | | Level 1 | | Level 2 | | Level 3 | | Total | | Level 1 | | Level 2 | | Level 3 | | Total |
| Asset Categories: | | | | | | | | | | | | | | | | | | | | | | | |
| Equity securities: | | | | | | | | | | | | | | | | | | | | | | | |
| Domestic | $ | — | | | $ | — | | | $ | — | | | $ | — | | | $ | — | | | $ | 0.8 | | | $ | — | | | $ | 0.8 | | | $ | — | | | $ | 0.8 | | | $ | — | | | $ | 0.8 | |
International (a) | — | | | — | | | — | | | — | | | — | | | — | | | — | | | — | | | — | | | — | | | — | | | — | |
| Global | — | | | 126.3 | | | — | | | 126.3 | | | 39.8 | | | 45.9 | | | — | | | 85.7 | | | 39.8 | | | 172.2 | | | — | | | 212.0 | |
| Debt securities: | | | | | | | | | | | | | | | | | | | | | | | |
| Domestic treasuries | — | | | 62.2 | | | — | | | 62.2 | | | — | | | 0.8 | | | — | | | 0.8 | | | — | | | 63.0 | | | — | | | 63.0 | |
| Corporate bonds | — | | | 20.7 | | | — | | | 20.7 | | | — | | | 17.8 | | | — | | | 17.8 | | | — | | | 38.5 | | | — | | | 38.5 | |
| Other | — | | | 43.0 | | | — | | | 43.0 | | | — | | | 80.8 | | | — | | | 80.8 | | | — | | | 123.8 | | | — | | | 123.8 | |
| Property/real estate | — | | | — | | | 45.3 | | | 45.3 | | | — | | | 13.7 | | | — | | | 13.7 | | | — | | | 13.7 | | | 45.3 | | | 59.0 | |
| Insurance products | — | | | — | | | — | | | — | | | — | | | 18.1 | | | — | | | 18.1 | | | — | | | 18.1 | | | — | | | 18.1 | |
| Other | — | | | — | | | — | | | — | | | 0.3 | | | — | | | — | | | 0.3 | | | 0.3 | | | — | | | — | | | 0.3 | |
| Total at January 3, 2020 | $ | — | | | $ | 252.2 | | | $ | 45.3 | | | $ | 297.5 | | | $ | 40.1 | | | $ | 177.9 | | | $ | — | | | $ | 218.0 | | | $ | 40.1 | | | $ | 430.1 | | | $ | 45.3 | | | $ | 515.5 | |
(a)Investment in funds outside the country where the pension plan originates is considered International.
| | | | | | | | | | | | | | | | | | | | | | | | | | | | | | | | | | | | | | | | | | | | | | | | | | | | | | | | | | | | | | | | | | | | | | | |
| | As of December 28, 2018 | | | | | | | | | | | | | | | | | | | | | | |
| | Domestic Plans | | | | | | | | Foreign Plans | | | | | | | | Total | | | | | | |
| (In millions) | Level 1 | | Level 2 | | Level 3 | | Total | | Level 1 | | Level 2 | | Level 3 | | Total | | Level 1 | | Level 2 | | Level 3 | | Total |
| Asset Categories: | | | | | | | | | | | | | | | | | | | | | | | |
| Equity securities: | | | | | | | | | | | | | | | | | | | | | | | |
| Domestic | $ | — | | | $ | — | | | $ | — | | | $ | — | | | $ | — | | | $ | 44.1 | | | $ | — | | | $ | 44.1 | | | $ | — | | | $ | 44.1 | | | $ | — | | | $ | 44.1 | |
International (a) | — | | | — | | | — | | | — | | | — | | | 68.2 | | | — | | | 68.2 | | | — | | | 68.2 | | | — | | | 68.2 | |
| Global | — | | | 104.3 | | | — | | | 104.3 | | | — | | | — | | | — | | | — | | | — | | | 104.3 | | | — | | | 104.3 | |
| Debt securities: | | | | | | | | | | | | | | | | | | | | | | | |
| Domestic treasuries | — | | | 40.5 | | | — | | | 40.5 | | | — | | | 44.2 | | | — | | | 44.2 | | | — | | | 84.7 | | | — | | | 84.7 | |
| Corporate bonds | — | | | 42.4 | | | — | | | 42.4 | | | — | | | 12.3 | | | — | | | 12.3 | | | — | | | 54.7 | | | — | | | 54.7 | |
| Other | — | | | 38.0 | | | — | | | 38.0 | | | — | | | — | | | — | | | — | | | — | | | 38.0 | | | — | | | 38.0 | |
| Property/real estate | — | | | — | | | 32.7 | | | 32.7 | | | — | | | 0.3 | | | — | | | 0.3 | | | — | | | 0.3 | | | 32.7 | | | 33.0 | |
| Insurance products | — | | | — | | | — | | | — | | | — | | | 18.6 | | | — | | | 18.6 | | | — | | | 18.6 | | | — | | | 18.6 | |
| Other | 2.5 | | | — | | | — | | | 2.5 | | | 0.8 | | | — | | | — | | | 0.8 | | | 3.3 | | | — | | | — | | | 3.3 | |
| Total at December 28, 2018 | $ | 2.5 | | | $ | 225.2 | | | $ | 32.7 | | | $ | 260.4 | | | $ | 0.8 | | | $ | 187.7 | | | $ | — | | | $ | 188.5 | | | $ | 3.3 | | | $ | 412.9 | | | $ | 32.7 | | | $ | 448.9 | |
(a)Investment in funds outside the country where the pension plan originates is considered International.
Changes in Anixter's Level 3 plan assets, which are included in operations, for the years ended January 3, 2020 and December 28, 2018 included:
| | | | | | | | | | | | | | | | | | | | | | | |
| (In millions) | December 28, 2018 Balance | | Actual return on plan assets | | Purchases, sales and settlements | | January 3, 2020 Balance |
| Asset Categories: | | | | | | | |
| Property/real estate | $ | 32.7 | | | $ | 3.1 | | | $ | 9.5 | | | $ | 45.3 | |
| Total Level 3 investments | $ | 32.7 | | | $ | 3.1 | | | $ | 9.5 | | | $ | 45.3 | |
ANIXTER INTERNATIONAL INC.
NOTES TO THE CONSOLIDATED FINANCIAL STATEMENTS – (Continued)
| | | | | | | | | | | | | | | | | |
| (In millions) | December 29, 2017 Balance | | Purchases, sales and settlements | | December 28, 2018 Balance |
| Asset Categories: | | | | | |
| Property/real estate | $ | — | | | $ | 32.7 | | | $ | 32.7 | |
| Total Level 3 investments | $ | — | | | $ | 32.7 | | | $ | 32.7 | |
The Company estimated future benefits payments are as follows at the end of 2019:
| | | | | | | | | | | | | | | | | | | | |
| | | Estimated Future Benefit Payments | | | | |
| (In millions) | | Domestic | | Foreign | | Total |
| 2020 | | $ | 10.9 | | | $ | 5.6 | | | $ | 16.5 | |
| 2021 | | 11.6 | | | 5.6 | | | 17.2 | |
| 2022 | | 12.4 | | | 6.1 | | | 18.5 | |
| 2023 | | 13.2 | | | 6.6 | | | 19.8 | |
| 2024 | | 14.2 | | | 7.2 | | | 21.4 | |
| 2025-2029 | | 80.6 | | | 53.2 | | | 133.8 | |
| Total | | $ | 142.9 | | | $ | 84.3 | | | $ | 227.2 | |
The accumulated benefit obligation in 2019 and 2018 was $293.2 million and $258.2 million, respectively, for the Domestic Plans and $253.3 million and $212.6 million, respectively, for the Foreign Plans. The Company had 9 plans in 2019 and 10 plans in 2018 where the accumulated benefit obligation was in excess of the fair value of plan assets. For pension plans with accumulated benefit obligations in excess of plan assets the aggregate pension accumulated benefit obligation was $261.8 million and $220.3 million for 2019 and 2018, respectively, and aggregate fair value of plan assets was $208.3 million and $179.0 million for 2019 and 2018, respectively.
The Company currently estimates that it will make contributions of approximately $6.6 million to its Foreign Plans in 2020. In addition, the Company estimates that it will make $1.1 million of benefit payments directly to participants of its two domestic unfunded non-qualified pension plans. The Company does not expect to make a contribution to its domestic qualified pension pension plan in 2020 due to its overfunded status.
Defined Contribution Plan
Anixter Inc. adopted the Anixter Inc. Employee Savings Plan effective January 1, 1994. The Plan is a defined-contribution plan covering all non-union domestic employees. Participants are eligible and encouraged to enroll in the tax-deferred plan on their date of hire and are automatically enrolled approximately 60 days after their date of hire unless they opt out. The savings plan is subject to the provisions of ERISA.
In the third quarter of 2015, Anixter Inc. amended the Anixter Inc. Pension Plan in the U.S. whereby employees first hired or rehired on or after July 1, 2015 are no longer eligible to participate in the Anixter Inc. Pension Plan. Anixter Inc. will make an annual contribution to the Employee Savings Plan on behalf of each active participant who is first hired or rehired on or after July 1, 2015, or is not participating in the Anixter Inc. Pension Plan. The amount of the employer annual contribution to each active participant's account will be an amount determined by multiplying the participant's salary for the Plan year by either: (1) 2% if such participant's years of service as of August 1 of the Plan year is fewer than five, or (2) 2.5% if such participant's years of service as of August 1 of the Plan year is five years or greater. This contribution is in lieu of being eligible for the Anixter Inc. Pension Plan.
Effective January 1, 2014, Anixter began matching contributions to equal 50% of a participant's contribution up to 5% of the participant's compensation. The Company also has certain foreign defined contribution plans. Contributions to these plans are based upon various levels of employee participation and legal requirements. The total expense related to defined contribution plans was $14.4 million, $13.8 million and $13.3 million in 2019, 2018 and 2017, respectively.
ANIXTER INTERNATIONAL INC.
NOTES TO THE CONSOLIDATED FINANCIAL STATEMENTS – (Continued)
Deferred Compensation Plan
A non-qualified deferred compensation plan was implemented on January 1, 1995. The plan permits selected employees to make pre-tax deferrals of salary and bonus. Interest is accrued monthly on the deferred compensation balances based on the average ten-year Treasury note rate for the previous three months times a factor of 1.4, and the rate is further adjusted if certain financial goals are achieved. The plan provides for benefit payments upon retirement, death, disability, termination or other scheduled dates determined by the participant. At January 3, 2020, the deferred compensation liability included in "Accrued expenses" and "Other liabilities" on the Consolidated Balance Sheet was $3.4 million and $42.2 million, respectively. At December 28, 2018, the deferred compensation liability included in "Accrued expenses" and "Other liabilities" on the Consolidated Balance Sheet was $3.4 million and $42.0 million, respectively.
Concurrent with the implementation of the deferred compensation plan, the Company purchased variable, separate account life insurance policies on the plan participants with benefits accruing to Anixter. To provide for the liabilities associated with the deferred compensation plan and an executive non-qualified defined benefit plan, fixed general account "increasing whole life" insurance policies were purchased on the lives of certain participants. Prior to 2006, the Company paid annual premiums on the above company-owned policies. The last premium was paid in 2005. Policy proceeds are payable to Anixter upon the insured participant’s death. At January 3, 2020 and December 28, 2018, the cash surrender value of $41.4 million and $37.0 million, respectively, was recorded under this program and reflected in "Other assets" on the Consolidated Balance Sheets.
NOTE 9. STOCKHOLDERS' EQUITY
Preferred Stock
Anixter has the authority to issue 15.0 million shares of preferred stock, par value $1.00 per share, NaN of which were outstanding at the end of fiscal 2019 and 2018.
Common Stock
Anixter has the authority to issue 100.0 million shares of common stock, par value $1.00 per share, of which 34.2 million shares and 33.9 million shares were outstanding at the end of fiscal 2019 and 2018, respectively.
Share Repurchases
Anixter did not repurchase any shares during any of the periods presented in these Consolidated Financial Statements.
Stock-Based Compensation
During the second quarter of 2017, the Company's shareholders approved the 2017 Stock Incentive Plan consisting of 2.0 million shares of the Company's common stock. Prior approved stock incentive plans have been closed and will not be allowed to issue future stock grants. At January 3, 2020, there were approximately 1.3 million shares reserved for issuance under the 2017 incentive plan.
Restricted Stock Units and Performance Units
The grant-date value of the stock units is amortized and converted to outstanding shares of common stock on a one-for-one basis over a three, four or six-year vesting period from the date of grant based on the specific terms of the grant. Compensation expense, net of the reversal of costs associated with forfeitures, associated with the stock units was $17.2 million, $15.7 million and $15.5 million in 2019, 2018 and 2017, respectively.
During the first quarter of 2016, Anixter initiated a performance-based restricted stock unit ("performance units") program. For 2016, 2017 and 2018, performance units will vest in one-third tranches to be evaluated on the anniversary of the first, second and third performance cycles. Each evaluation period will be based on the achievement of the Company's total shareholder return ("TSR") relative to the TSR of the S&P Mid Cap 400 index. The issuance of the vested shares will be on the final vesting date of year three. The granted units will be adjusted based on the specific payout percentage of the grant agreement. For 2019 performance units, each evaluation period will be based on the Company's adjusted EBITDA margin for each of the performance periods with a three year overall TSR modifier relative to the TSR of the peer group companies determined by the Company's compensation committee calculated at the end of the three performance cycles. The fair value of each performance unit tranche is estimated using the Monte Carlo Simulation pricing model at the date of grant.
ANIXTER INTERNATIONAL INC.
NOTES TO THE CONSOLIDATED FINANCIAL STATEMENTS – (Continued)
Under the current stock incentive plan, the Company pays its non-employee directors annual retainer fees and, at their election, meeting fees in the form of stock units. Currently, these units are granted quarterly and vest immediately. Therefore, the Company includes these units in its common stock outstanding on the date of vesting as the conditions for conversion are met. However, the actual issuance of shares related to all director units are deferred until a pre-arranged time selected by each director. Compensation expense associated with the director stock units was $2.8 million, $2.4 million and $2.5 million in 2019, 2018 and 2017, respectively.
The total fair value of stock units that vested was $16.7 million, $14.8 million and $14.4 million in 2019, 2018 and 2017, respectively.
The following table summarizes the activity under the director and employee stock unit plans:
| | | | | | | | | | | | | | | | | | | | | | | | | | |
| (units in thousands) | | Director Stock Units (a) | | Weighted Average Grant Date Fair Value (b) | | Employee Stock Units (c) | | Weighted Average Grant Date Fair Value (b) |
| Outstanding balance at December 30, 2016 | | 341.1 | | | $ | 52.90 | | | 727.4 | | | $ | 56.25 | |
| Granted | | 31.3 | | | 80.81 | | | 222.4 | | | 85.65 | |
| Converted | | — | | | — | | | (155.4) | | | 76.51 | |
| Canceled | | — | | | — | | | (50.7) | | | 59.25 | |
| Outstanding balance at December 29, 2017 | | 372.4 | | | 55.25 | | | 743.7 | | | 60.61 | |
| Granted | | 34.5 | | | 70.92 | | | 237.9 | | | 74.98 | |
| Converted | | (26.0) | | | 60.95 | | | (192.6) | | | 64.15 | |
Performance unit adjustments(d) | | — | | | — | | | (12.6) | | | 89.00 | |
| Canceled | | — | | | — | | | (52.0) | | | 70.80 | |
| Outstanding balance at December 28, 2018 | | 380.9 | | | 56.28 | | | 724.4 | | | 63.16 | |
| Granted | | 46.7 | | | 59.26 | | | 287.8 | | | 59.88 | |
| Converted | | (43.4) | | | 60.76 | | | (259.9) | | | 53.63 | |
Performance unit adjustments(d) | | — | | | — | | | (44.2) | | | 48.61 | |
| Canceled | | — | | | — | | | (22.6) | | | 67.34 | |
| Outstanding balance at January 3, 2020 | | 384.2 | | | $ | 56.13 | | | 685.5 | | | $ | 66.20 | |
(a)All director units are considered convertible although each individual has elected to defer conversion until a pre-arranged time.
(b)Director and employee stock units are granted at no cost to the participants.
(c)All employee stock units outstanding are not vested at year end and are expected to vest.
(d)Adjustments based on final evaluations for non-vested performance stock units.
The weighted-average remaining contractual term for outstanding employee units is 1.9 years.
The aggregate intrinsic value of units converted into stock represents the total pre-tax intrinsic value (calculated using Anixter's stock price on the date of conversion multiplied by the number of units converted) that was received by unit holders. The aggregate intrinsic value of units converted into stock for 2019, 2018 and 2017 was $17.8 million, $16.1 million and $13.2 million, respectively.
The aggregate intrinsic value of units outstanding represents the total pre-tax intrinsic value (calculated using Anixter's closing stock price on the last trading day of the fiscal year multiplied by the number of units outstanding) that will be received by the unit recipients upon vesting. The aggregate intrinsic value of units outstanding for 2019, 2018 and 2017 was $103.1 million, $59.5 million and $84.8 million, respectively.
The aggregate intrinsic value of units convertible represents the total pre-tax intrinsic value (calculated using Anixter's closing stock price on the last trading day of the fiscal year multiplied by the number of units convertible) that would have been received by the unit holders. The aggregate intrinsic value of units convertible for 2019, 2018 and 2017 was $37.0 million, $20.5 million and $28.3 million, respectively.
ANIXTER INTERNATIONAL INC.
NOTES TO THE CONSOLIDATED FINANCIAL STATEMENTS – (Continued)
Stock Options
Options previously granted under these plans have been granted with exercise prices at the fair market value of the common stock on the date of grant. All options expire ten years after the date of grant. These options were granted with vesting periods of four years representing the requisite service period based on the specific terms of the grant. The Company generally issues new shares to satisfy stock option exercises as opposed to adjusting treasury shares. The fair value of stock option grants is amortized over the respective vesting period representing the requisite service period. The Company did not grant any stock options to employees during 2019, 2018 or 2017.
There was no compensation expense associated with the stock options in 2019. Compensation expense associated with the stock options in 2018 and 2017 was $0.8 million and $0.1 million, respectively. There were no unvested stock options in 2019 and 2018. The total fair value of stock options that vested was $0.5 million in 2017.
The following table summarizes the activity under the employee option plans:
| | | | | | | | | | | | | | |
| (options in thousands) | | Employee Options | | Weighted Average Exercise Price |
| Balance at December 30, 2016 | | 488.2 | | | $ | 48.68 | |
| Exercised | | (88.7) | | | 56.43 | |
| Balance at December 29, 2017 | | 399.5 | | | 46.96 | |
| Exercised | | (51.8) | | | 29.64 | |
| Balance at December 28, 2018 | | 347.7 | | | 49.54 | |
| Exercised | | (147.0) | | | 32.14 | |
| Balance at January 3, 2020 | | 200.7 | | | $ | 62.27 | |
| Options exercisable at year-end: | | | | |
| 2017 | | 399.5 | | | $ | 46.96 | |
| 2018 | | 347.7 | | | $ | 49.54 | |
| 2019 | | 200.7 | | | $ | 62.27 | |
The weighted-average remaining contractual term for options exercisable and outstanding for 2019 was 2.9 years.
The aggregate intrinsic value of options exercised represents the total pre-tax intrinsic value (calculated as the difference between Anixter's stock price on the date of exercise and the exercise price, multiplied by the number of options exercised) that was received by the option holders. The aggregate intrinsic value of options exercised for 2019, 2018 and 2017 was $4.6 million, $2.4 million and $2.2 million, respectively.
The aggregate intrinsic value of options outstanding represents the total pre-tax intrinsic value (calculated as the difference between Anixter's closing stock price on the last trading day of each fiscal year and the weighted-average exercise price, multiplied by the number of options outstanding at the end of the fiscal year) that could be received by the option holders if such option holders exercised all options outstanding at fiscal year-end. The aggregate intrinsic value of options outstanding for 2019, 2018 and 2017 was $6.9 million, $1.5 million and $11.6 million, respectively.
The aggregate intrinsic value of options exercisable represents the total pre-tax intrinsic value (calculated as the difference between Anixter's closing stock price on the last trading day of each fiscal year and the weighted-average exercise price, multiplied by the number of options exercisable at the end of the fiscal year) that would have been received by the option holders had all option holders elected to exercise the options at fiscal year-end. The aggregate intrinsic value of options exercisable for 2019, 2018 and 2017 was $6.9 million, $1.5 million and $11.6 million, respectively.
ANIXTER INTERNATIONAL INC.
NOTES TO THE CONSOLIDATED FINANCIAL STATEMENTS – (Continued)
Summary of Non-Vested Shares
The following table summarizes the changes to the non-vested shares:
| | | | | | | | | | | | | | |
| (shares in thousands) | | Non-vested Performance Shares (a) | | Weighted-average Grant Date Fair Value |
| Balance at December 28, 2018 | | 147.9 | | | $ | 47.73 | |
| Granted | | 58.1 | | | 62.00 | |
| Vested | | (55.2) | | | 17.40 | |
Performance unit adjustments(b) | | (44.2) | | | 48.61 | |
| Canceled | | — | | | — | |
| Balance at January 3, 2020 | | 106.6 | | | $ | 70.84 | |
(a)All non-vested stock performance units are expected to vest.
(b)Adjustments based on final evaluations for non-vested performance stock units.
As of January 3, 2020, there was $13.6 million of total unrecognized compensation cost related to non-vested stock units which is expected to be recognized over a weighted-average period of 1.4 years. As of January 3, 2020, all compensation cost related to options granted to employees has been fully recognized.
NOTE 10. BUSINESS SEGMENTS
Anixter is a leading distributor of network and security solutions, electrical and electronic wire and cable solutions and utility power solutions. The Company has identified NSS, EES and UPS as reportable segments. Within its segments, the Company is also organized by geographies. Anixter's geographies consist of North America, which includes the U.S. and Canada, EMEA, which includes Europe, the Middle East and Africa, and Emerging Markets, which includes Asia Pacific and Central and Latin America.
Corporate expenses are incurred to obtain and coordinate financing, tax, information technology, legal and other related services, certain of which were rebilled to subsidiaries. The Company also has various corporate assets which are reported in corporate. Segment assets may not include jointly used assets, but segment results include depreciation expense or other allocations related to those assets as such allocation is made for internal reporting. Interest expense and other non-operating items are not allocated to the segments or reviewed on a segment basis. Intercompany transactions are not significant. No customer accounted for more than 3% of sales in 2019.
The categorization of net sales by end market is determined using a variety of data points including the technical characteristic of the product, the "sold to" customer information, the "ship to" customer information and the end customer product or application into which product will be incorporated. Anixter also has largely specialized its sales organization by segment. As data systems for capturing and tracking this data evolve and improve, the categorization of products by end market can vary over time. When this occurs, the Company reclassifies net sales by end market for prior periods. Such reclassifications typically do not materially change the sizing of, or the underlying trends of results within, each end market.
Segment Financial Information
Segment information for 2019, 2018 and 2017 are as follows:
| | | | | | | | | | | | | | | | | | | | | | | | | | | | | | | | |
| (In millions) | | | | | | | | | | |
| 2019 | | NSS | | EES | | UPS | | Corporate (a) | | Total |
| Net sales | | $ | 4,696.2 | | | $ | 2,352.0 | | | $ | 1,797.4 | | | $ | — | | | $ | 8,845.6 | |
| Operating income (loss) | | 325.5 | | | 139.5 | | | 83.5 | | | (181.0) | | | 367.5 | |
| Depreciation | | 9.4 | | | 7.3 | | | 3.7 | | | 16.8 | | | 37.2 | |
| Amortization of intangible assets | | 16.4 | | | 5.4 | | | 13.2 | | | — | | | 35.0 | |
| Total assets | | 2,224.8 | | | 1,085.2 | | | 943.6 | | | 555.2 | | | 4,808.9 | |
| Capital expenditures | | 3.1 | | | 1.7 | | | 14.6 | | | 20.6 | | | 40.0 | |
ANIXTER INTERNATIONAL INC.
NOTES TO THE CONSOLIDATED FINANCIAL STATEMENTS – (Continued)
| | | | | | | | | | | | | | | | | | | | | | | | | | | | | | | | |
| 2018 | | NSS | | EES | | UPS | | Corporate (a) | | Total |
| Net sales | | $ | 4,347.0 | | | $ | 2,342.7 | | | $ | 1,710.5 | | | $ | — | | | $ | 8,400.2 | |
| Operating income (loss) | | 272.2 | | | 132.3 | | | 75.4 | | | (170.2) | | | 309.7 | |
| Depreciation | | 3.8 | | | 2.4 | | | 3.6 | | | 21.9 | | | 31.7 | |
| Amortization of intangible assets | | 17.0 | | | 7.0 | | | 13.3 | | | — | | | 37.3 | |
| Total assets | | 2,319.3 | | | 1,097.4 | | | 905.5 | | | 330.9 | | | 4,653.1 | |
| Capital expenditures | | 8.7 | | | 2.0 | | | 6.7 | | | 25.0 | | | 42.4 | |
| | | | | | | | | | | | | | | | | | | | | | | | | | | | | | | | |
| 2017 | | NSS | | EES | | UPS | | Corporate (a) | | Total |
| Net sales | | $ | 4,114.4 | | | $ | 2,225.5 | | | $ | 1,587.5 | | | $ | — | | | $ | 7,927.4 | |
| Operating income (loss) | | 262.6 | | | 114.3 | | | 73.1 | | | (137.1) | | | 312.9 | |
| Depreciation | | 3.1 | | | 2.4 | | | 3.9 | | | 18.8 | | | 28.2 | |
| Amortization of intangible assets | | 14.4 | | | 8.4 | | | 13.3 | | | — | | | 36.1 | |
| Total assets | | 1,947.1 | | | 1,068.3 | | | 871.4 | | | 365.4 | | | 4,252.2 | |
| Capital expenditures | | 3.7 | | | 1.9 | | | 1.7 | | | 33.8 | | | 41.1 | |
(a)Corporate "Total assets" primarily consists of cash and cash equivalents, deferred tax assets, and corporate fixed assets. Total assets in 2019 include the impact of the Company's adoption of ASU 2016-02, Leases, which resulted in the recognition of right-of-use assets for all leases with terms of more than 12 months.
The items impacting operating expense and operating income by segment in 2019, 2018 and 2017 are reflected in the tables below. All other items impacted consolidated results only and were not allocated to segments.
| | | | | | | | | | | | | | | | | | | | | | | | | | | | | | | | |
| | Year Ended January 3, 2020 | | | | | | | | |
| (In millions) | | NSS | | EES | | UPS | | Corporate | | Total |
| Amortization of intangible assets | | | $ | (16.4) | | | $ | (5.4) | | | $ | (13.2) | | | $ | — | | | $ | (35.0) | |
| Merger costs | | — | | | — | | | — | | | (12.8) | | | (12.8) | |
| Restructuring charge | | — | | | (0.5) | | | 0.1 | | | 0.4 | | | — | |
| Acquisition and integration costs | | — | | | — | | | — | | | 0.3 | | | 0.3 | |
| Total of items impacting operating expense and operating income | | $ | (16.4) | | | $ | (5.9) | | | $ | (13.1) | | | $ | (12.1) | | | $ | (47.5) | |
| | | | | | | | | | | | | | | | | | | | | | | | | | | | | | | | |
| | Year Ended December 28, 2018 | | | | | | | | |
| (In millions) | | NSS | | EES | | UPS | | Corporate | | Total |
| Amortization of intangible assets | | | $ | (17.0) | | | $ | (7.0) | | | $ | (13.3) | | | $ | — | | | $ | (37.3) | |
| Restructuring charge | | (2.1) | | | (1.3) | | | (0.7) | | | (5.3) | | | (9.4) | |
| Acquisition and integration costs | | (2.6) | | | — | | | — | | | (0.3) | | | (2.9) | |
| CEO retirement agreement expense | | — | | | — | | | — | | | (2.6) | | | (2.6) | |
| U.K. facility relocation costs | | (0.2) | | | (0.8) | | | — | | | — | | | (1.0) | |
| Total of items impacting operating expense and operating income | | $ | (21.9) | | | $ | (9.1) | | | $ | (14.0) | | | $ | (8.2) | | | $ | (53.2) | |
ANIXTER INTERNATIONAL INC.
NOTES TO THE CONSOLIDATED FINANCIAL STATEMENTS – (Continued)
| | | | | | | | | | | | | | | | | | | | | | | | | | | | | | | | |
| | Year Ended December 29, 2017 | | | | | | | | |
| (In millions) | | NSS | | EES | | UPS | | Corporate | | Total |
| Amortization of intangible assets | | $ | (14.4) | | | $ | (8.4) | | | $ | (13.3) | | | $ | — | | | $ | (36.1) | |
| Restructuring charge | | — | | | 0.5 | | | (0.1) | | | (0.4) | | | — | |
| Acquisition and integration costs | | — | | | — | | | — | | | (2.3) | | | (2.3) | |
| Impairment of intangible assets | | (5.7) | | | — | | | — | | | — | | | (5.7) | |
| Total of items impacting operating expense and operating income | | $ | (20.1) | | | $ | (7.9) | | | $ | (13.4) | | | $ | (2.7) | | | $ | (44.1) | |
Geographic Information
The Company attributes foreign sales based on the location of the customer purchasing the product. In North America (U.S. and Canada), sales in the U.S. were $6,294.6 million, $6,004.7 million and $5,771.5 million in 2019, 2018 and 2017, respectively. Canadian sales were $858.0 million, $837.4 million and $772.5 million in 2019, 2018 and 2017 respectively. No other individual foreign country’s net sales within EMEA or the Emerging Markets were material in 2019, 2018 and 2017. The Company's tangible long-lived assets primarily consist of $147.9 million of property and equipment in the U.S. No other individual foreign country’s tangible long-lived assets are material.
The following table summarizes net sales by geographic areas for the years ended January 3, 2020, December 28, 2018 and December 29, 2017:
| | | | | | | | | | | | | | | | | | | | | | | | | | | | | | | | | | | | | | |
| | | Years Ended | | | | | | | | | | |
| (In millions) | | January 3, 2020 | | | | December 28, 2018 | | | | December 29, 2017 | | |
| Sales | | Net Sales | | % of Total Net Sales | | Net Sales | | % of Total Net Sales | | Net Sales | | % of Total Net Sales |
| North America | | $ | 7,152.6 | | | 80.9 | % | | $ | 6,842.1 | | | 81.5 | % | | $ | 6,544.0 | | | 82.5 | % |
| EMEA | | 625.5 | | | 7.0 | % | | 660.3 | | | 7.8 | % | | 626.3 | | | 7.9 | % |
| Emerging Markets | | 1,067.5 | | | 12.1 | % | | 897.8 | | | 10.7 | % | | 757.1 | | | 9.6 | % |
| Net sales | | $ | 8,845.6 | | | 100.0 | % | | $ | 8,400.2 | | | 100.0 | % | | $ | 7,927.4 | | | 100.0 | % |
The following table summarizes total assets and net property and equipment by geographic areas for the years ended January 3, 2020 and December 28, 2018:
| | | | | | | | | | | | | | |
| (In millions) | | January 3, 2020 | | December 28, 2018 |
| Total assets | | | | |
| North America | | $ | 3,861.1 | | | $ | 3,709.4 | |
| EMEA | | 299.2 | | | 302.2 | |
| Emerging Markets | | 648.6 | | | 641.5 | |
| Total assets | | $ | 4,808.9 | | | $ | 4,653.1 | |
| | | | | | | | | | | | | | |
| (In millions) | | January 3, 2020 | | December 28, 2018 |
| Net property and equipment | | | | |
| North America | | $ | 156.2 | | | $ | 144.2 | |
| EMEA | | 9.5 | | | 9.7 | |
| Emerging Markets | | 9.2 | | | 9.4 | |
| Net property and equipment | | $ | 174.9 | | | $ | 163.3 | |
ANIXTER INTERNATIONAL INC.
NOTES TO THE CONSOLIDATED FINANCIAL STATEMENTS – (Continued)
Goodwill Assigned to Segments
The following table presents the changes in goodwill allocated to the Company's reporting units from December 29, 2017 to January 3, 2020:
| | | | | | | | | | | | | | | | | | | | | | | | | | |
| (In millions) | | NSS | | EES | | UPS | | Total |
| Balance as of December 29, 2017 | | $ | 408.8 | | | $ | 181.7 | | | $ | 187.6 | | | $ | 778.1 | |
Acquisition related (a) | | 73.2 | | | — | | | — | | | 73.2 | |
| Foreign currency translation and other | | (9.3) | | | (0.8) | | | (9.2) | | | (19.3) | |
| Balance as of December 28, 2018 | | $ | 472.7 | | | $ | 180.9 | | | $ | 178.4 | | | $ | 832.0 | |
Acquisition related (a) | | 0.2 | | | — | | | — | | | 0.2 | |
| Foreign currency translation and other | | (9.3) | | | 0.4 | | | 5.4 | | | (3.5) | |
| Balance as of January 3, 2020 | | $ | 463.6 | | | $ | 181.3 | | | $ | 183.8 | | | $ | 828.7 | |
(a) In the second quarter of 2018, the Company completed the acquisition of security businesses in Australia and New Zealand for $150.1 million, including a preliminary net working capital adjustment of $4.6 million. The transaction was financed primarily from borrowings under the revolving lines of credit. The purchase price was preliminarily allocated to $32.6 million of working capital and $60.6 million of intangible assets during the year ended 2018. Acquisition costs were $2.6 million. The year ended 2018 results include approximately $71.9 million of sales from the acquired entities. The purchase price allocation was finalized in 2019.
NOTE 11. SUMMARIZED FINANCIAL INFORMATION OF ANIXTER INC.
Anixter International Inc. guarantees, fully and unconditionally, substantially all of the debt of its subsidiaries, which include Anixter Inc., its 100% owned primary operating subsidiary. Anixter International Inc. has no independent assets or operations and all subsidiaries other than Anixter Inc. are minor. The following summarizes the financial information for Anixter Inc.:
ANIXTER INC.
CONDENSED CONSOLIDATED BALANCE SHEETS
| | | | | | | | | | | | | | |
| (In millions) | | January 3,
2020 | | December 28,
2018 |
| Assets: | | | | |
| Current assets | | $ | 3,035.3 | | | $ | 3,171.6 | |
| Property and equipment, net | | 179.5 | | | 169.1 | |
| Operating leases | | 265.1 | | | — | |
| Goodwill | | 828.7 | | | 832.0 | |
| Intangible assets, net | | 361.2 | | | 392.9 | |
| Other assets | | 132.9 | | | 92.9 | |
| | $ | 4,802.7 | | | $ | 4,658.5 | |
| Liabilities and Stockholder's Equity: | | | | |
| Current liabilities | | $ | 1,492.8 | | | $ | 1,630.3 | |
| Long-term debt | | 1,065.9 | | | 1,260.7 | |
| Operating lease obligations | | 213.0 | | | — | |
| Other liabilities | | 172.6 | | | 199.6 | |
| Stockholder’s equity | | 1,858.4 | | | 1,567.9 | |
| | $ | 4,802.7 | | | $ | 4,658.5 | |
ANIXTER INTERNATIONAL INC.
NOTES TO THE CONSOLIDATED FINANCIAL STATEMENTS – (Continued)
ANIXTER INC.
CONDENSED CONSOLIDATED STATEMENTS OF INCOME AND COMPREHENSIVE INCOME
| | | | | | | | | | | | | | | | | | | | |
| | Years Ended | | | | |
(In millions) | | January 3,
2020 | | December 28,
2018 | | December 29,
2017 |
| Net sales | | $ | 8,845.6 | | | $ | 8,400.2 | | | $ | 7,927.4 | |
| Operating income | | $ | 374.9 | | | $ | 316.4 | | | $ | 319.4 | |
| Income before income taxes | | $ | 300.1 | | | $ | 229.1 | | | $ | 243.2 | |
| Net income | | $ | 268.1 | | | $ | 160.9 | | | $ | 112.6 | |
| Comprehensive income | | $ | 277.9 | | | $ | 101.8 | | | $ | 153.2 | |
NOTE 12. SELECTED QUARTERLY FINANCIAL DATA (UNAUDITED)
The following is a summary of the unaudited interim results of operations for each quarter in the years ended January 3, 2020 and December 28, 2018. The Company's fiscal year includes 53 weeks in 2019 and 52 weeks in 2018, with the extra week in 2019 in the fourth quarter. As of February 12, 2020, Anixter had 1,597 shareholders of record.
| | | | | | | | | | | | | | | | | | | | | | | | | | |
| (In millions, except per share amounts) | | | | | | | | |
| Year ended January 3, 2020 | | First Quarter(a) | | Second Quarter(b) | | Third Quarter(c) | | Fourth Quarter(d) |
| Net sales | | $ | 2,108.5 | | | $ | 2,262.6 | | | $ | 2,222.2 | | | $ | 2,252.3 | |
| Cost of goods sold | | 1,689.6 | | | 1,812.6 | | | 1,775.8 | | | 1,791.8 | |
| Operating income | | 74.6 | | | 105.7 | | | 101.8 | | | 85.4 | |
| Income before income taxes | | 56.0 | | | 85.6 | | | 82.1 | | | 69.7 | |
| Net income | | $ | 39.1 | | | $ | 63.5 | | | $ | 59.3 | | | $ | 101.0 | |
| Income per share: | | | | | | | | |
| Basic | | $ | 1.15 | | | $ | 1.86 | | | $ | 1.74 | | | $ | 2.95 | |
| Diluted | | $ | 1.14 | | | $ | 1.86 | | | $ | 1.73 | | | $ | 2.93 | |
(a)In the first quarter of 2019, "Operating income" includes $8.8 million of intangible asset amortization and a reversal of acquisition and integration costs of $0.3 million.
(b)In the second quarter of 2019, "Operating income" includes $8.8 million of intangible asset amortization.
(c)In the third quarter of 2019, "Operating income" includes $8.8 million of intangible asset amortization.
(d)In the fourth quarter of 2019, "Operating income" includes $8.6 million of intangible asset amortization and $12.8 million of merger costs. "Net income" includes a $45.9 million tax benefit related to the reversal of deferred income tax valuation allowances, partially offset by $0.8 million of tax expense related to prior year tax positions.
ANIXTER INTERNATIONAL INC.
NOTES TO THE CONSOLIDATED FINANCIAL STATEMENTS – (Continued)
| | | | | | | | | | | | | | | | | | | | | | | | | | |
| (In millions, except per share amounts) | | | | | | | | |
| Year ended December 28, 2018 | | | First Quarter(a) | | Second Quarter(b) | | Third Quarter(c) | | Fourth Quarter(d) |
| Net sales | | $ | 1,964.2 | | | $ | 2,137.9 | | | $ | 2,179.0 | | | $ | 2,119.1 | |
| Cost of goods sold | | 1,579.4 | | | 1,718.8 | | | 1,754.9 | | | 1,689.1 | |
| Operating income | | 61.6 | | | 71.3 | | | 89.5 | | | 87.3 | |
| Income before income taxes | | 45.7 | | | 49.0 | | | 68.6 | | | 59.9 | |
| Net income | | $ | 32.1 | | | $ | 34.8 | | | $ | 47.6 | | | $ | 41.8 | |
| Income per share: | | | | | | | | |
| Basic | | $ | 0.95 | | | $ | 1.03 | | | $ | 1.41 | | | $ | 1.23 | |
| Diluted | | $ | 0.94 | | | $ | 1.02 | | | $ | 1.40 | | | $ | 1.22 | |
(a)In the first quarter of 2018, "Operating income" includes $9.3 million of intangible asset amortization, $0.3 million of acquisition and integration costs and $0.2 million of U.K. facility relocation costs.
(b)In the second quarter of 2018, "Operating income" includes $9.7 million of intangible asset amortization, a restructuring charge of $9.2 million, $2.3 million of acquisition and integration costs, $2.6 million of CEO retirement agreement expense and $0.4 million of U.K. facility relocation costs.
(c)In the third quarter of 2018, "Operating income" includes $9.6 million of intangible asset amortization, a restructuring charge of $0.2 million, $0.3 million of acquisition and integration costs and $0.2 million of U.K. facility relocation costs.
(d)In the fourth quarter of 2018, "Operating income" includes $8.7 million of intangible asset amortization and $0.2 million of U.K. facility relocation costs. "Income before income taxes" includes a $4.6 million loss on extinguishment of debt.
NOTE 13. SUBSEQUENT EVENT
On January 13, 2020, Anixter and WESCO International, Inc. ("WESCO") announced that their boards of directors have unanimously approved a definitive merger agreement under which WESCO will acquire Anixter in a transaction valued at approximately $4.5 billion. Under the terms of the agreement, each share of Anixter common stock will be converted into the right to receive $70.00 in cash (subject to increase), 0.2397 shares of WESCO common stock and preferred stock consideration valued at $15.89, based on the value of its liquidation preference. Based on the closing price of WESCO's common stock on January 10, 2020 and the liquidation preference of the WESCO preferred stock consideration, the total consideration represents approximately $100 per Anixter share, giving effect to the downside protection. Based on the transaction structure and the number of shares of WESCO and Anixter common stock currently outstanding, it is anticipated that WESCO stockholders will own 84% and Anixter stockholders will own 16% of the combined company. The transaction is subject to Anixter stockholder approval, receipt of regulatory approval in the United States, Canada and certain other foreign jurisdictions, as well as other customary closing conditions.
ITEM 9. CHANGES IN AND DISAGREEMENTS WITH ACCOUNTANTS ON ACCOUNTING AND FINANCIAL DISCLOSURE.
None.
ITEM 9A. CONTROLS AND PROCEDURES.
Conclusion Regarding the Effectiveness of Disclosure Controls and Procedures
Under the supervision and the participation of our management, including our principal executive officer and principal financial officer, we conducted an evaluation as of January 3, 2020 of the effectiveness of the design and operation of our disclosure controls and procedures, as such term is defined under Rule 13a-15(e) promulgated under the Securities Exchange Act of 1934, as amended ("Exchange Act"). Based on this evaluation, the principal executive officer and the principal financial officer concluded that our disclosure controls and procedures were effective as of the end of the period covered by this annual report.
Management’s Report on Internal Control Over Financial Reporting
Our management is responsible for establishing and maintaining adequate internal control over financial reporting, as such term is defined in Exchange Act Rule 13a-15(f). Our internal control over financial reporting is designed to provide reasonable assurance to our management and board of directors regarding the preparation and fair presentation of published financial statements. Because of its inherent limitations, internal control over financial reporting may not prevent or detect misstatements. Therefore, even those systems determined to be effective can provide only reasonable assurance with respect to financial statement preparation and presentation. Under the supervision and with the participation of our management, including our principal executive officer and principal financial officer, we conducted an evaluation of the effectiveness of our internal control over financial reporting based on the framework in Internal Control — Integrated Framework, issued by the Committee of Sponsoring Organizations of the Treadway Commission (2013 framework). Based on the evaluation under the framework in Internal Control — Integrated Framework, our management concluded that our internal control over financial reporting was effective as of January 3, 2020.
Ernst & Young LLP, an independent registered public accounting firm, has audited our Consolidated Financial Statements and our internal control over financial reporting. The Ernst & Young LLP reports are included herein.
REPORT OF INDEPENDENT REGISTERED PUBLIC ACCOUNTING FIRM
To the Shareholders and the Board of Directors of Anixter International Inc.
Opinion on Internal Control Over Financial Reporting
We have audited Anixter International Inc.’s internal control over financial reporting as of January 3, 2020, based on criteria established in Internal Control-Integrated Framework issued by the Committee of Sponsoring Organizations of the Treadway Commission (2013 framework) (the COSO criteria). In our opinion, Anixter International Inc. (the Company) maintained, in all material respects, effective internal control over financial reporting as of January 3, 2020, based on the COSO criteria.
We also have audited, in accordance with the standards of the Public Company Accounting Oversight Board (United States) (PCAOB), the 2019 consolidated financial statements of the Company, and our report dated February 20, 2020 expressed an unqualified opinion thereon.
Basis for Opinion
The Company’s management is responsible for maintaining effective internal control over financial reporting, and for its assessment of the effectiveness of internal control over financial reporting included in the accompanying Management’s Report on Internal Control over Financial Reporting. Our responsibility is to express an opinion on the Company’s internal control over financial reporting based on our audit. We are a public accounting firm registered with the PCAOB and are required to be independent with respect to the Company in accordance with the U.S. federal securities laws and the applicable rules and regulations of the Securities and Exchange Commission and the PCAOB.
We conducted our audit in accordance with the standards of the PCAOB. Those standards require that we plan and perform the audit to obtain reasonable assurance about whether effective internal control over financial reporting was maintained in all material respects.
Our audit included obtaining an understanding of internal control over financial reporting, assessing the risk that a material weakness exists, testing and evaluating the design and operating effectiveness of internal control based on the assessed risk, and performing such other procedures as we considered necessary in the circumstances. We believe that our audit provides a reasonable basis for our opinion.
Definition and Limitations of Internal Control Over Financial Reporting
A company’s internal control over financial reporting is a process designed to provide reasonable assurance regarding the reliability of financial reporting and the preparation of financial statements for external purposes in accordance with generally accepted accounting principles. A company’s internal control over financial reporting includes those policies and procedures that (1) pertain to the maintenance of records that, in reasonable detail, accurately and fairly reflect the transactions and dispositions of the assets of the company; (2) provide reasonable assurance that transactions are recorded as necessary to permit preparation of financial statements in accordance with generally accepted accounting principles, and that receipts and expenditures of the company are being made only in accordance with authorizations of management and directors of the company; and (3) provide reasonable assurance regarding prevention or timely detection of unauthorized acquisition, use or disposition of the company’s assets that could have a material effect on the financial statements.
Because of its inherent limitations, internal control over financial reporting may not prevent or detect misstatements. Also, projections of any evaluation of effectiveness to future periods are subject to the risk that controls may become inadequate because of changes in conditions, or that the degree of compliance with the policies or procedures may deteriorate.
| | | | | |
/s/ ERNST & YOUNG LLP | |
| |
Chicago, Illinois | |
February 20, 2020 | |
ITEM 9B. OTHER INFORMATION.
None.
PART III
ITEM 10. DIRECTORS, EXECUTIVE OFFICERS AND CORPORATE GOVERNANCE.
The information required by Item 10 is incorporated herein by
reference to our definitive proxy statement or amendment to this Form 10-K to be filed with the SEC no later than May 2, 2020. Our Global Business Ethics and Conduct Policy and changes or waivers, if any, related thereto are located on our website at http://www.anixter.com/ethics.reference.Information regarding executive officers is included as a supplemental item at the end of Part I of this Form 10-K.
ITEM 11. EXECUTIVE COMPENSATION.
The information required by Item 11 is incorporated herein by reference to our definitive proxy statement or amendment to this Form 10-K to be filed with the SEC no later than May 2, 2020.
ITEM 12. SECURITY OWNERSHIP OF CERTAIN BENEFICIAL OWNERS AND MANAGEMENT AND RELATED STOCKHOLDER MATTERS.
The information required by Item 12 relating to the security ownership of certain beneficial owners and management is incorporated herein by reference to our definitive proxy statement or amendment to this Form 10-K to be filed with the SEC no later than May 2, 2020.
ITEM 13. CERTAIN RELATIONSHIPS AND RELATED TRANSACTIONS, AND DIRECTOR INDEPENDENCE.
Certain Relationships and Related Transactions
There have been no transactions of $120,000 or greater between the Company and any of its related persons since the Company’s last fiscal year, and no such transaction is currently proposed.
Various Company policies and procedures, which include the Global Business Ethics and Conduct Policy (applicable to all directors and executive officers) and annual questionnaires completed by all of our directors and executive officers, require disclosure of transactions or relationships that may constitute conflicts of interest or otherwise require disclosure under applicable SEC rules. The Audit Committee reviews and, where necessary, approves transactions throughout the year, as they arise.
Director Independence
The Board of Directors determines the independence of its directors and nominees by requiring each of them to complete and return a questionnaire which solicits information requiredrelevant to a determination of independence under applicable NYSE and SEC rules, as well as any other direct or indirect relationship that the director may have with the Company. Independence is determined by Item 13the Board after presentation and discussion of questionnaire responses. The Board considers all relevant facts and circumstances in making an independence determination. To be considered independent, an outside director must meet the bright line independence tests established by the NYSE and the Board must affirmatively determine that the director has no direct or indirect material relationship with the Company. A material relationship is incorporated herein by referenceone which impairs or inhibits — or has the potential to our definitive proxy statementimpair or amendment toinhibit — a director’s exercise of critical and disinterested judgment on behalf of the Company and its stockholders. Based on this Form 10-Kprocedure, each of the directors, except for Mr. Eck and Mr. Galvin, were found to be filed with the SEC no later than May 2, 2020.
ITEM 14. PRINCIPAL ACCOUNTANT FEES AND SERVICES.
Fees for professional services rendered by Ernst & Young LLP with respect to fiscal years 2019 and 2018 are set forth below.
Audit Fees
Fees for audit services totalled approximately $5,631,000 in 2019 and approximately $5,710,100 in 2018, including fees associated with the annual audit, reviews of our quarterly reports on Form 10-Q, other SEC filings and statutory audits of foreign subsidiaries.
Audit-Related Fees
Fees for audit-related services totalled $2,000 in each of 2019 and 2018 for the use of EY’s online reference tool.
Tax Fees
Fees for tax services, including tax compliance, tax advice and tax planning, totalled approximately $394,000 in 2019 and approximately $673,200 in 2018.
All Other Fees
There were no fees for other services in 2019 and 2018.
Pre-Approval Policies and Procedures
The information requiredAudit Committee’s current practice is to consider for pre-approval annually all audit and non-audit services (including tax services) proposed to be provided by Item 14the independent registered public accounting firm each year. The pre-approval policy is incorporated herein by referenceset forth in an Audit Committee position statement. In setting forth pre-approved services in its position statement, the Audit Committee details the particular services that may be provided and the policy reason why it is logical to our definitive proxyuse Ernst & Young instead of another service provider. Should the need arise to consider engaging Ernst & Young to provide non-audit services beyond the scope of what is outlined in the position statement or amendmentin an amount in excess of the amounts pre-approved by the Audit Committee, management will bring such proposals to this Form 10-Kthe Audit Committee Chairman for consideration. The Audit Committee Chairman has the authority to be filedeither act on behalf of the Audit Committee or to call a special meeting of the Audit Committee to consider any such proposal. In the event that the Audit Committee Chairman acts on behalf of the Audit Committee and pre-approves such service, the decision is reported at the next meeting of the full Audit Committee. In considering whether to approve non-audit services, the Audit Committee considers whether the provision of such services by Ernst & Young is compatible with the SEC no later than May 2, 2020.maintenance of that firm’s independence. During the 2019 fiscal year, 100% of the services described under Audit-Related Fees and Tax Fees were pre-approved by the Audit Committee. During the 2018 fiscal year, 100% of the services described under Audit-Related Fees and Tax Fees were pre-approved by the Audit Committee.
PART IV
ITEM 15. EXHIBITS AND FINANCIAL STATEMENT SCHEDULES.
(a) Index to Consolidated Financial Statements, Financial Statement Schedules and Exhibits.
(1) Financial Statements.
The following Consolidated Financial Statements of Anixter International Inc. and Report of Independent Registered Public Accounting FirmNo financial statements are filed as part ofwith this report.
| | | | | | | | |
| | Page |
Report of Independent Registered Public Accounting Firm | | |
Consolidated Statements of Income for the years ended January 3, 2020, December 28, 2018 and December 29, 2017 | | |
Consolidated Statements of Comprehensive Income for the years ended January 3, 2020, December 28, 2018 and December 29, 2017 | | |
Consolidated Balance Sheets at January 3, 2020 and December 28, 2018 | | |
Consolidated Statements of Cash Flows for the years ended January 3, 2020, December 28, 2018 and December 29, 2017 | | |
Consolidated Statements of Stockholders’ Equity for the years ended January 3, 2020, December 28, 2018 and December 29, 2017 | | |
Notes to the Consolidated Financial Statements | | |
report on Form 10-K/A.
(2) Financial Statement Schedules.
The followingNo financial statement schedules of Anixter International Inc. are filed as part ofwith this report and should be read in conjunction with the Consolidated Financial Statements of Anixter International Inc.:
All other schedules are omitted because they are not required, are not applicable, or the required information is shown in the Consolidated Financial Statements or notes thereto.
on Form 10-K/A.
(3) Exhibit List.
Each management contract or compensation plan required to be filed as an exhibit to the Form 10-K filed on February 20, 2020 is identified by an asterisk (*).
The exhibits listed on the accompanying Exhibit Index are filed or incorporated by reference as part of this report. | | | | | | | | |
| Exhibit No. | | Description of Exhibit |
| (2) Plan of acquisition, reorganization, arrangement, liquidation or succession. | | |
| | |
| 2.1 | | | Purchase Agreement, dated July 15, 2015, by and among HD Supply, Inc., HD Supply Holdings, LLC, HD Supply GP & Management, Inc., HD Supply Power Solutions Group, Inc., Brafasco Holdings II, Inc. and Anixter Inc. (Incorporated by reference from Anixter International Inc. Current Report on Form 8-K filed on July 17, 2015, Exhibit 2.1). |
| | |
| 2.2 | | | |
| | |
| 2.3 | | | |
| | | | | | | | |
| Exhibit No. | | Description of Exhibit |
| 2.4 | | | |
| | |
| 2.5 | | | |
| | |
| 2.6 | | | |
| | |
| (3) Articles of Incorporation and by-laws. | | |
| | |
| 3.1 | | | |
| | |
| 3.2 | | | |
| | |
| 3.3 | | | |
| | |
| 3.4 | | | |
| | |
| (4) Instruments defining the rights of security holders, including indentures. | | |
| | |
| 4.1 | | | |
| | |
| 4.2 | | | |
| | |
| 4.3 | | | |
| | |
| 4.4 | | | |
| | |
| 4.5 | | | |
| | | | | | | | |
| Exhibit No. | | Description of Exhibit |
| 4.6 | | | |
| | |
| 4.7 | | | |
| | |
| 4.8 | | | |
| | |
| 4.9 | | | |
| | |
| 4.10 | | | |
| | |
| (10) Material contracts. | | |
| | |
| 10.1 | | | |
| | | |
| 10.2* | | | Anixter International Inc. 1989 Employee Stock Incentive Plan. (Incorporated by reference from Anixter International Inc. Registration Statement on Form S-8, file number 33-38364). |
| | |
| 10.3* | | | |
| | |
| 10.4* | | | Company’s Key Executive Equity Plan, as amended and restated July 16, 1992. (Incorporated by reference from Itel Corporation’s Annual Report on Form 10-K for the fiscal year ended December 31, 1992, Exhibit 10.8). |
| | |
| 10.5* | | | Company’s Director Stock Option Plan. (Incorporated by reference from Itel Corporation’s Annual Report on Form 10-K for the fiscal year ended December 31, 1991, Exhibit 10.24). |
| | |
| 10.6* | | | Form of Stock Option Agreement. (Incorporated by reference from Itel Corporation’s Annual Report on Form 10-K for the fiscal year ended December 31, 1992, Exhibit 10.24). |
| | |
| 10.7* | | | |
| | |
| 10.8* | | | |
| | |
| 10.9* | | | |
| | | | | | | | |
| Exhibit No. | | Description of Exhibit |
| 10.10* | | |
| | |
| 10.11* | | |
| | |
| 10.12* | | |
| | |
| 10.13* | | |
| | |
| 10.14* | | |
| | |
| 10.15* | | |
| | |
| | |
| | |
| 10.16* | | |
| | |
| | |
| | |
| | |
| | |
| 10.17* | | |
| | |
| 10.18* | | |
| | |
| | |
| | |
| 10.19* | | |
| | |
| 10.20* | | |
| | | | | | | | |
| Exhibit No. | | Description of Exhibit |
| 10.21* | | | |
| | |
| 10.22* | | | |
| | |
| 10.23* | | | |
| | |
| 10.24 | | | |
| | |
| | (b) First Amendment, dated as of November 7, 2013, to its Five-Year Revolving Credit Agreement, dated as of April 8, 2011, among Anixter Inc., the Borrowing Subsidiaries party thereto, the Guarantors party thereto, the Lenders party thereto and Wells Fargo Bank, National Association, as Administrative Agent. (Incorporated by reference from Anixter International Inc. Current Report on Form 8-K filed on November 8, 2013, Exhibit 10.1). |
| | |
| | |
| | |
| | (d) Fourth Amendment, dated as of August 4, 2015, to the Five-Year Revolving Credit Agreement, dated as of April 8, 2011, among Anixter Inc., the Borrowing Subsidiaries party thereto, the Guarantors party thereto, the Lenders party thereto and Wells Fargo Bank, National Association, as Administrative Agent. (Incorporated by reference from Anixter International Inc. Current Report on Form 8-K filed on August 6, 2015, Exhibit 10.3). |
| | |
| 10.25 | | | |
| | |
| | |
| | |
| 10.26 | | | |
| | |
| 10.27 | | | (a) Second Amended and Restated Receivable Purchase Agreement dated May 31, 2011 among Anixter Receivables Corporation, as Seller, Anixter Inc., as Servicer, Falcon Asset Securitization Company LLC and Three Pillars Funding LLC, as Conduits, the Financial Institution party thereto, JPMorgan Chase Bank, N.A. and SunTrust Robinson Humphrey, Inc., as Managing Agents and JPMorgan Chase, N.A., as Agent. (Incorporated by reference from Anixter International Inc. Current Report on Form 8-K filed on June 2, 2011, Exhibit 10.2). |
| | | | | | | | |
| Exhibit No. | | Description of Exhibit |
| | (b) Amendment No. 1 to Second Amended and Restated Receivable Purchase Agreement dated May 31, 2012 among Anixter Receivables Corporation, as Seller, Anixter Inc., as the initial Servicer, each financial institution party thereto as a Financial Institution, Chariot Funding LLC (successor by merger to Falcon Asset Securitization Company LLC) and Three Pillars Funding LLC, as Conduits, SunTrust Robinson Humphrey, Inc. and JPMorgan Chase Bank, N.A. ("(“J.P. Morgan"Morgan”), as Managing Agents, and J.P. Morgan, as Agent for the Purchasers. (Incorporated by reference from Anixter International Inc. Current Report on Form 8-K filed on June 1, 2012, Exhibit 10.2). |
| | |
| | (c) Amendment No. 2 to Second Amended and Restated Receivables Purchase Agreement, dated as of May 30, 2014, among Anixter Receivables Corporation, as Seller, Anixter Inc., as the initial Servicer, each financial institution party thereto as a Financial Institution, Chariot Funding LLC (successor by merger to Falcon Asset Securitization Company LLC), as a conduit, SunTrust Robinson Humphrey, Inc. and JPMorgan Chase Bank, N.A. ("(“J.P. Morgan"Morgan”), as managing agents, and J.P. Morgan, as agent for the Purchasers. (Incorporated by reference from Anixter International Inc. Current Report on Form 8-K filed on June 5, 2014, Exhibit 10.1). |
| | |
| | (d) Amendment No. 3 to Second Amended and Restated Receivables Purchase Agreement, dated as of August 27, 2014, among Anixter Receivables Corporation, as Seller, Anixter Inc., as the initial Servicer, each financial institution party thereto as a Financial Institution, Chariot Funding LLC (successor by merger to Falcon Asset Securitization Company LLC), as a conduit, SunTrust Robinson Humphrey, Inc. and JPMorgan Chase Bank, N.A. ("(“J.P. Morgan"Morgan”), as managing agents, and J.P. Morgan, as agent for the Purchasers. (Incorporated by reference from Anixter International Inc. Current Report on Form 8-K filed on August 28, 2014, Exhibit 10.2). |
| | |
| | (e) Amendment No. 5, dated as of August 4, 2015, to the Second Amended and Restated Receivables Purchase Agreement, among Anixter Receivables Corporation, as Seller, Anixter Inc., as Servicer, the Financial Institutions party thereto, Chariot Funding LLC (successor by merger to Falcon Asset Securitization Company LLC), as a conduit, SunTrust Robinson Humphrey, Inc. and JPMorgan Chase Bank, N.A. (“J.P. Morgan”), as Managing Agents, and J.P. Morgan, as Agent for the Purchasers. (Incorporated by reference from Anixter International Inc. Current Report on Form 8-K filed on August 6, 2015, Exhibit 10.2). |
| | |
| 10.28* | | | |
| | |
| 10.29* | | | |
| | | | | | | | |
| Exhibit No. | | Description of Exhibit |
| 10.33 | | | |
| | |
| 10.34 | | | |
| | |
| | |
| | |
| 10.35 | | | |
| | |
| | |
| | |
| 10.36 | | | Credit Agreement, dated as of October 5, 2015, by and among Anixter Canada, Inc. and Tri-Ed ULC, as borrowers, Anixter Mid Holdings B.V., as guarantor, The Bank of Nova Scotia, as Administrative Agent, and The Bank of Nova Scotia and Bank of America, N.A., Canada Branch, as lenders. (Incorporated by reference from Anixter International Inc. Current Report on Form 8-K filed on October 8, 2015, Exhibit 10.4). |
| | |
| 10.37 | | | |
| | |
| 10.38* | | | |
| | |
| 10.39 | | | |
| | |
| 10.40 | | | |
| | |
| 10.41 | | | Purchase Agreement, dated October 29, 2018, by an between Anixter Inc., and Anixter International Inc., as guarantor, and Wells Fargo Securities, LLC, as representative of the initial purchasers named therein. (Incorporated by reference from Anixter International Inc. Current Report on Form 8-K filed October 30, 2018, Exhibit 10.1). |
| | |
| 10.42 | | | Second Amendment to Receivables Facility Credit Agreement, dated October 29, 2018, by and between Anixter Inc., and Anixter Receivables Corporation, the financial institutions party thereto, as lenders, and JPMorgan Chase Bank. N.A., as administrative agent. (Incorporated by reference from Anixter International Inc. Current Report on Form 8-K filed October 30, 2018, Exhibit 10.2). |
| | |
| 10.43 | | | Second Amendment to the Credit Agreement (Receivables Facility), dated October 29, 2018, by and between Anixter Inc., Anixter International Inc., certain wholly-owned subsidiaries names as loan parties therein, the financial institutions party thereto, as lenders, and Wells Fargo Bank, National Association, as administrative agent. (Incorporated by reference from Anixter International Inc. Current Report on Form 8-K filed October 30, 2018, Exhibit 10.3). |
| | | | | | | | |
32.2 32.2† | | | |
| | |
| (101) Extensible Business Reporting Language. | | |
| | |
| 101.INS***† | | Inline XBRL Instance Document - The instance document does not appear in the interactive data file because its XBRL tags are embedded within the Inline XBRL document. |
| 101.SCH***† | | Inline XBRL Taxonomy Extension Schema Document |
| 101.CAL***† | | Inline XBRL Taxonomy Extension Calculation Linkbase Document |
| 101.DEF***† | | Inline XBRL Taxonomy Extension Definition Linkbase |
| 101.LAB***† | | Inline XBRL Taxonomy Extension Label Linkbase Document |
| 101.PRE***† | | Inline XBRL Taxonomy Extension Presentation Linkbase Document |
| 104 | | Cover Page Interactive Data File (embedded within the Inline XBRL document) |
** Attached as Exhibit 101 to this report are the following documents formatted in Inline XBRL (Extensible Business Reporting Language): (i) the Consolidated Statements of Income and Consolidated Statements of Comprehensive Income for fiscal years ended January 3, 2020, December 28, 2018 and December 29, 2017, (ii) the Consolidated Balance Sheets at January 3, 2020 and December 28, 2018, (iii) the Consolidated Statements of Cash Flows for fiscal years ended January 3, 2020, December 28, 2018 and December 29, 2017, (iv) the Consolidated Statements of Stockholders’ Equity for fiscal years ended January 3, 2020, December 28, 2018 and December 29, 2017, and (v) Notes to Consolidated Financial Statements for fiscal year ended January 3, 2020.
| † | Filed as an exhibit to the Anixter International Inc. Annual Report on Form 10-K for the year ended January 3, 2020, filed on February 20, 2020. |
| |
| ** | Filed herewith. |
| |
| *** | The following documents formatted in Inline XBRL (Extensible Business Reporting Language) were attached as Exhibit 101 to the Form 10-K filed on February 20, 2020: (i) the Consolidated Statements of Income and Consolidated Statements of Comprehensive Income for fiscal years ended January 3, 2020, December 28, 2018 and December 29, 2017, (ii) the Consolidated Balance Sheets at January 3, 2020 and December 28, 2018, (iii) the Consolidated Statements of Cash Flows for fiscal years ended January 3, 2020, December 28, 2018 and December 29, 2017, (iv) the Consolidated Statements of Stockholders’ Equity for fiscal years ended January 3, 2020, December 28, 2018 and December 29, 2017, and (v) Notes to Consolidated Financial Statements for fiscal year ended January 3, 2020. |
Copies of other instruments defining the rights of holders of our long-term debt and our subsidiaries not filed pursuant to Item 601(b)(4)(iii) of Regulation S-K and omitted copies of attachments to plans and material contracts will be furnished to the Securities and Exchange Commission upon request.
References made to Anixter International Inc. and Itel Corporation filings can be found at Commission File Number 001-10212.
ANIXTER INTERNATIONAL INC.
SCHEDULE I - CONDENSED FINANCIAL INFORMATION OF REGISTRANT
ANIXTER INTERNATIONAL INC. (PARENT COMPANY)
STATEMENTS OF INCOME AND COMPREHENSIVE INCOME
| | | | | | | | | | | | | | | | | | | | |
| | | Years Ended | | | | |
| (In millions) | | January 3,
2020 | | December 28,
2018 | | December 29,
2017 |
| Operating loss | | $ | (6.1) | | | $ | (5.4) | | | $ | (5.2) | |
| Other income: | | | | | | |
| Interest income, including intercompany | | 9.5 | | | 8.3 | | | 6.8 | |
| Income before income taxes and equity in earnings of subsidiaries | | 3.4 | | | 2.9 | | | 1.6 | |
| Income tax expense | | 0.7 | | | 0.7 | | | 0.6 | |
| Income before equity in earnings of subsidiaries | | 2.7 | | | 2.2 | | | 1.0 | |
| Equity in earnings of subsidiaries | | 260.2 | | | 154.1 | | | 108.0 | |
| Net income | | $ | 262.9 | | | $ | 156.3 | | | $ | 109.0 | |
| Comprehensive income | | $ | 272.7 | | | $ | 97.2 | | | $ | 149.6 | |
See accompanying note to the condensed financial information of registrant.
ANIXTER INTERNATIONAL INC.
SCHEDULE I — CONDENSED FINANCIAL INFORMATION OF REGISTRANT
ANIXTER INTERNATIONAL INC. (PARENT COMPANY)
BALANCE SHEETS
| | | | | | | | | | | | | | |
| (In millions) | | January 3,
2020 | | December 28,
2018 |
| ASSETS | | | | |
| Current assets: | | | | |
| Cash and cash equivalents | | $ | 0.5 | | | $ | 0.2 | |
| Other assets | | 0.2 | | | 0.1 | |
| Total current assets | | 0.7 | | | 0.3 | |
| Other assets (primarily investment in and advances to subsidiaries) | | 1,861.8 | | | 1,571.9 | |
| | $ | 1,862.5 | | | $ | 1,572.2 | |
| LIABILITIES AND STOCKHOLDERS’ EQUITY | | | | |
| Liabilities: | | | | |
| Accounts payable and accrued expenses, due currently | | $ | 0.2 | | | $ | 0.2 | |
| Other non-current liabilities | | 1.4 | | | 1.6 | |
| Total liabilities | | 1.6 | | | 1.8 | |
| Stockholders’ equity: | | | | |
| Common stock | | 34.2 | | | 33.9 | |
| Capital surplus | | 310.2 | | | 292.7 | |
| Retained earnings | | 1,783.8 | | | 1,513.2 | |
| Accumulated other comprehensive loss | | (267.3) | | | (269.4) | |
| Total stockholders’ equity | | 1,860.9 | | | 1,570.4 | |
| | $ | 1,862.5 | | | $ | 1,572.2 | |
See accompanying note to the condensed financial information of registrant.
ANIXTER INTERNATIONAL INC.
SCHEDULE I — CONDENSED FINANCIAL INFORMATION OF REGISTRANT
ANIXTER INTERNATIONAL INC. (PARENT COMPANY)
STATEMENTS OF CASH FLOWS
| | | | | | | | | | | | | | | | | | | | |
| | Years Ended | | | | |
| | | January 3,
2020 | | December 28,
2018 | | December 29,
2017 |
| (In millions) | | | | | | |
| Operating activities: | | | | | | |
| Net income | | $ | 262.9 | | | $ | 156.3 | | | $ | 109.0 | |
| Adjustments to reconcile net income to net cash used in operating activities: | | | | | | |
| Equity in earnings of subsidiaries | | (260.2) | | | (154.1) | | | (108.0) | |
| Dividend from subsidiary | | 7.8 | | | 8.0 | | | 3.7 | |
| Stock-based compensation | | 2.8 | | | 2.4 | | | 2.5 | |
| Income tax expense | | 0.7 | | | 0.7 | | | 0.6 | |
| Intercompany transactions | | (17.3) | | | (14.7) | | | (13.2) | |
| Changes in assets and liabilities, net | | (0.1) | | | (0.1) | | | (0.1) | |
| Net cash used in operating activities | | (3.4) | | | (1.5) | | | (5.5) | |
| Investing activities: | | | | | | | | | |
| Other | | (1.0) | | | — | | | — | |
| Net cash used in investing activities | | (1.0) | | | — | | | — | |
| Financing activities: | | | | | | |
| Proceeds from stock options exercised | | 4.7 | | | 1.5 | | | 5.0 | |
| Loans from subsidiaries, net | | — | | | — | | | 0.7 | |
| Other, net | | — | | | — | | | (0.2) | |
| Net cash provided by financing activities | | 4.7 | | | 1.5 | | | 5.5 | |
| Increase in cash and cash equivalents | | 0.3 | | | — | | | — | |
| Cash and cash equivalents at beginning of period | | 0.2 | | | 0.2 | | | 0.2 | |
| Cash and cash equivalents at end of period | | $ | 0.5 | | | $ | 0.2 | | | $ | 0.2 | |
See accompanying note to the condensed financial information of registrant.
Note A — Basis of Presentation
In the parent company condensed financial statements, our investment in subsidiaries is stated at cost plus equity in undistributed earnings of subsidiaries since the date of acquisition. Our share of net income of our unconsolidated subsidiaries is included in consolidated income using the equity method. The parent company financial statements should be read in conjunction with our Consolidated Financial Statements. See Note 5. "Debt" in the notes to the Consolidated Financial Statements for details on dividend restrictions from Anixter Inc. to the parent company.
ANIXTER INTERNATIONAL INC.
SCHEDULE II — VALUATION AND QUALIFYING ACCOUNTS AND RESERVES
Years ended January 3, 2020, December 28, 2018 and December 29, 2017
| | | | | | | | | | | | | | | | | | | | | | | | | | | | | | | | |
| (In millions) | | Balance at beginning of the period | | Charged to income | | Charged to other accounts | | Deductions | | Balance at end of the period |
| Description | | | | | | | | | | |
| Year ended January 3, 2020: | | | | | | | | | | |
| Allowance for doubtful accounts | | $ | 39.9 | | | $ | 10.1 | | | $ | (1.0) | | | $ | (18.6) | | | $ | 30.4 | |
| Allowance for deferred tax asset | | $ | 79.1 | | | $ | 0.9 | | | $ | — | | | $ | (41.7) | | | $ | 38.3 | |
| Year ended December 28, 2018: | | | | | | | | | | |
| Allowance for doubtful accounts | | $ | 43.8 | | | $ | 8.5 | | | $ | (9.0) | | | $ | (3.4) | | | $ | 39.9 | |
| Allowance for deferred tax asset | | $ | 79.9 | | | $ | (0.6) | | | $ | (0.2) | | | $ | — | | | $ | 79.1 | |
| Year ended December 29, 2017: | | | | | | | | | | |
| Allowance for doubtful accounts | | $ | 43.6 | | | $ | 10.0 | | | $ | (1.3) | | | $ | (8.5) | | | $ | 43.8 | |
| Allowance for deferred tax asset | | $ | 20.7 | | | $ | 60.7 | | | $ | (1.5) | | | $ | — | | | $ | 79.9 | |
ANIXTER INTERNATIONAL INC.
SIGNATURES
Pursuant to the requirements of Section 13 or 15(d) of the Securities Exchange Act of 1934, the Registrant has duly caused this report to be signed on its behalf by the undersigned, thereunto duly authorized, in the City of Glenview, State of Illinois, on February 20,March 9, 2020.
| | | | | | | | |
| ANIXTER INTERNATIONAL INC. |
| |
| By: | /s/ Theodore A. Dosch |
| | Theodore A. Dosch |
| | Executive Vice President-Finance |
| | and Chief Financial Officer |
Pursuant to the requirements of the Securities Exchange Act of 1934, this report has been signed below by the following persons on behalf of the Registrant and in the capacities and on the dates indicated.
| | | | | | | | | | | | | | |
/s/ William A. Galvin | | President and Chief Executive Officer
(Principal Executive Officer)
| | February 20, 2020 |
William A. Galvin | | | | |
| | | | |
/s/ Theodore A. Dosch | | Executive Vice President — Finance
(Principal Financial Officer)
| | February 20, 2020 |
Theodore A. Dosch | | | | |
| | | | |
/s/ Ilaria Mocciaro | | Senior Vice President — Controller
(Principal Accounting Officer)
| | February 20, 2020 |
Ilaria Mocciaro | | | | |
| | | | |
/s/ Lord James Blyth* | | Director | | February 20, 2020 |
Lord James Blyth | | | | |
| | | | |
/s/ Frederic F. Brace* | | Director | | February 20, 2020 |
Frederic F. Brace | | | | |
| | | | |
/s/ Linda Walker Bynoe* | | Director | | February 20, 2020 |
Linda Walker Bynoe | | | | |
| | | | |
/s/ Robert J. Eck* | | Director | | February 20, 2020 |
Robert J. Eck | | | | |
| | | | |
/s/ F. Philip Handy* | | Director | | February 20, 2020 |
F. Philip Handy | | | | |
| | | | |
/s/ Melvyn N. Klein* | | Director | | February 20, 2020 |
Melvyn N. Klein | | | | |
| | | | |
/s/ Jamie Henikoff Moffitt* | | Director | | February 20, 2020 |
Jamie Henikoff Moffitt | | | | |
| | | | |
/s/ George Muñoz* | | Director | | February 20, 2020 |
George Muñoz | | | | |
| | | | |
/s/ Scott R. Peppet* | | Director | | February 20, 2020 |
Scott R. Peppet | | | | |
| | | | |
/s/ Valarie L. Sheppard* | | Director | | February 20, 2020 |
Valarie L. Sheppard | | | | |
| | | | |
/s/ William S. Simon* | | Director | | February 20, 2020 |
William S. Simon | | | | |
| | | | |
/s/ Charles M. Swoboda* | | Director | | February 20, 2020 |
Charles M. Swoboda | | | | |
| | | | |
/s/ Samuel Zell* | | Director | | February 20, 2020 |
Samuel Zell | | | | |
| | | | | | | | |
*By | /s/ Theodore A. Dosch | |
| Theodore A. Dosch (Attorney in fact)
Theodore A. Dosch, as attorney in fact for each person indicated
| |