
| 10-K | |||||
| ☒ | ANNUAL REPORT PURSUANT TO SECTION 13 OR 15(d) OF THE SECURITIES EXCHANGE ACT OF 1934 | |||||||
| For the fiscal year ended | December 31, | |||||||
| Commission File No. | 001-35419 | |||||
| KAMAN CORPORATION | ||||||
| (Exact name of registrant as specified in its charter) | ||||||
| Connecticut | 06-0613548 | |||||||
| (State or other jurisdiction of incorporation or organization) | (I.R.S. Employer Identification No.) | |||||||
| 1332 Blue Hills Avenue, | Bloomfield, | Connecticut | 06002 | ||||||||||||||
| (Address of principal executive offices) | (Zip Code) | ||||||||||||||||
| Registrant's telephone number, including area code | (860) | |||||||
| Securities registered pursuant to Section 12(b) of the Act: | ||||||||||||||
| Title of each class | Trading | Name of each exchange on which registered | ||||||||||||
| Common Stock ($1 par value) | KAMN | New York Stock Exchange LLC | ||||||||||||
| ☐ | ||||||||||
| Yes | ☒ | No | ☐ | ||||||||
| Large accelerated filer | ☒ | Accelerated filer | ☐ | Non-accelerated filer | ☐ | ||||||||||||
| Smaller reporting company | ☐ | Emerging growth company | ☐ | ||||||||||||||
| ☐ | |||||||
| ☒ | |||||
| The aggregate market value on June 28, 2019, (the last business day of the Company’s most recently completed second quarter) | ||||
| of the voting and non-voting common stock held by non-affiliates of the registrant, computed by reference to the closing price | ||||
| of the stock, was approximately | $ | 1,743,603,171 | . | |
| $1,376,988,159 | . | ||||
| 27,875,575 | ||
| Part I | ||||||||||
| Item 1 | ||||||||||
| Item 1A | ||||||||||
| Item 1B | ||||||||||
| Item 2 | ||||||||||
| Item 3 | ||||||||||
| Item 4 | ||||||||||
| Part II | ||||||||||
| Item 5 | ||||||||||
| Item 6 | ||||||||||
| Item 7 | ||||||||||
| Item 7A | ||||||||||
| Item 8 | ||||||||||
| Item 9 | ||||||||||
| Item 9A | ||||||||||
| Item 9B | ||||||||||
| Item 9C | ||||||||||
| Part III | ||||||||||
| Item 10 | ||||||||||
| Item 11 | ||||||||||
| Item 12 | ||||||||||
| Item 13 | ||||||||||
| Item 14 | ||||||||||
| Part IV | ||||||||||
| Item 15 | ||||||||||
| Item 16 | ||||||||||
| Years Ended December 31, | |||||||||
| 2019 | 2018 | 2017 | |||||||
| Sales | |||||||||
| Military and Defense, excluding safe and arm devices | 23.4 | % | 25.9 | % | 27.8 | % | |||
| Safe and Arm Devices | 29.9 | % | 26.6 | % | 25.5 | % | |||
| Commercial Aerospace and Other | 46.7 | % | 47.5 | % | 46.7 | % | |||
| Total | 100.0 | % | 100.0 | % | 100.0 | % | |||
| Years Ended December 31, | ||||||||||||||||||||
| 2021 | 2020 | 2019 | ||||||||||||||||||
| Sales | ||||||||||||||||||||
| Defense | 23.8 | % | 23.0 | % | 23.4 | % | ||||||||||||||
| Safe and Arm Devices | 27.0 | % | 31.7 | % | 29.9 | % | ||||||||||||||
| Commercial, Business, & General Aviation | 26.1 | % | 28.1 | % | 36.9 | % | ||||||||||||||
| Medical | 12.2 | % | 8.9 | % | 3.8 | % | ||||||||||||||
| Industrial & Other | 10.9 | % | 8.3 | % | 6.0 | % | ||||||||||||||
| Total | 100.0 | % | 100.0 | % | 100.0 | % | ||||||||||||||
Total Backlog at December 31, 2021 | 2021 Backlog to be completed in 2022 | Total Backlog at December 31, 2020 | Total Backlog at December 31, 2019 | |||||||||||||||||||||||
| In thousands | ||||||||||||||||||||||||||
| Engineered Products | $ | 169,144 | $ | 150,647 | $ | 134,257 | $ | 134,532 | ||||||||||||||||||
| Precision Products | 180,082 | 138,382 | 293,261 | 439,336 | ||||||||||||||||||||||
| Structures | 351,697 | 120,304 | 203,718 | 233,002 | ||||||||||||||||||||||
| Total | $ | 700,923 | $ | 409,333 | $ | 631,236 | $ | 806,870 | ||||||||||||||||||
Total Backlog at December 31, 2019 | 2019 Backlog to be completed in 2020 | Total Backlog at December 31, 2018 | Total Backlog at December 31, 2017 | |||||||||||||
| In thousands | ||||||||||||||||
| Backlog | $ | 806,870 | $ | 511,765 | $ | 851,814 | $ | 616,090 | ||||||||
| Name | Age | Position | Prior Experience | |||||||||
| Chairman, President, Chief Executive Officer and Director | Mr. | |||||||||||
| Mr. Bartlett was named segment lead of both the Engineered Products segment and Structures segment, effective December 31, 2021, and has served as Senior Vice President and Chief Operating Officer since January 4, 2021. Prior to joining Kaman, | Mr. | |||||||||||
| Mr. Coogan was appointed Senior Vice President | ||||||||||||
| Shawn G. Lisle | Senior Vice President and General Counsel | Mr. Lisle joined the | |||||||
| Position | Prior Experience | ||||||||||
| Rafael Z. Cohen | 64 | Vice President | Mr. | ||||||||
| Kristen M. Samson | 48 | Vice President and Chief | Ms. Samson joined Kaman in 2021 and was | ||||||||
| Darlene R. Smith | 61 | President, Kaman Air Vehicles and Kaman Precision Products | Ms. Smith was appointed segment lead of Precision Products effective December 31, 2021 and has served as President, Kaman Air Vehicles and Kaman Precision Products since January 2021. Ms. Smith has served in various roles since joining the Company in 2001, most recently as Vice President and | ||||||||
| Segment | Location | Property Type (1) | ||||||||||||
| Engineered Products | Bloomfield, Connecticut | Owned - Manufacturing & Office | ||||||||||||
| Rimpar, Germany | Owned - Manufacturing & Office | |||||||||||||
| Prachatice, Czech Republic | Owned - Assembly & Office | |||||||||||||
| Höchstadt, Germany | Owned - Manufacturing & Office | |||||||||||||
| Foothills Ranch, California | Owned - Manufacturing & Office | |||||||||||||
| Colorado Springs, Colorado | Owned - Manufacturing & Office | |||||||||||||
| Gilbert, Arizona | Leased - Office & Service Center | |||||||||||||
| Owned - Manufacturing & Office | ||||||||||||||
| Owned - Manufacturing & Office | ||||||||||||||
| Bloomfield, Connecticut | Owned - Manufacturing, Office & Service Center | |||||||||||||
| Structures | Jacksonville, Florida | Leased - Manufacturing & Office | ||||||||||||
| Chihuahua, Mexico | Leased - Manufacturing & Office | |||||||||||||
| Wichita, Kansas | Leased - Manufacturing & Office | |||||||||||||
| Bennington, Vermont | Owned - Manufacturing & Office | |||||||||||||
| Corporate | ||||||||||||||
| Bloomfield, Connecticut | Owned - Office & Information Technology Back-Up Data Center | |||||||||||||
| Orlando, Florida | Leased - Office | |||||||||||||
| Square Feet | |||||
| Precision Products | 606,611 | ||||
| Structures | 587,172 | ||||
Corporate (2) | |||||
| 126,941 | ||||
| 2,281,790 | |
| Period | Total Number of Shares Purchased (a) | Average Price Paid per Share | Total Number of Shares Purchased as Part of a Publicly Announced Plan (b) | Approximate Dollar Value of Shares That May Yet Be Purchased Under the Plan (in thousands) | ||||||||||
| September 28, 2019 – October 25, 2019 | 99,000 | $ | 58.51 | 99,000 | $ | 29,579 | ||||||||
| October 26, 2019 – November 22, 2019 | 64,676 | $ | 60.15 | 63,000 | $ | 25,797 | ||||||||
| November 23, 2019 – December 31, 2019 | 150,569 | $ | 67.05 | 150,569 | $ | 15,701 | ||||||||
| Total | 314,245 | 312,569 | ||||||||||||
| Period | Total Number of Shares Purchased (a) | Average Price Paid per Share | Total Number of Shares Purchased as Part of a Publicly Announced Plan | Approximate Dollar Value of Shares That May Yet Be Purchased Under the Plan (in thousands) | ||||||||||||||||||||||
| October 2, 2021 – October 29, 2021 | — | $ | — | — | $ | 2,168 | ||||||||||||||||||||
| October 30, 2021 – November 26, 2021 | 1,668 | $ | 39.37 | — | $ | 2,168 | ||||||||||||||||||||
| November 27, 2021 – December 31, 2021 | — | $ | — | — | $ | 2,168 | ||||||||||||||||||||
| Total | 1,668 | — | ||||||||||||||||||||||||
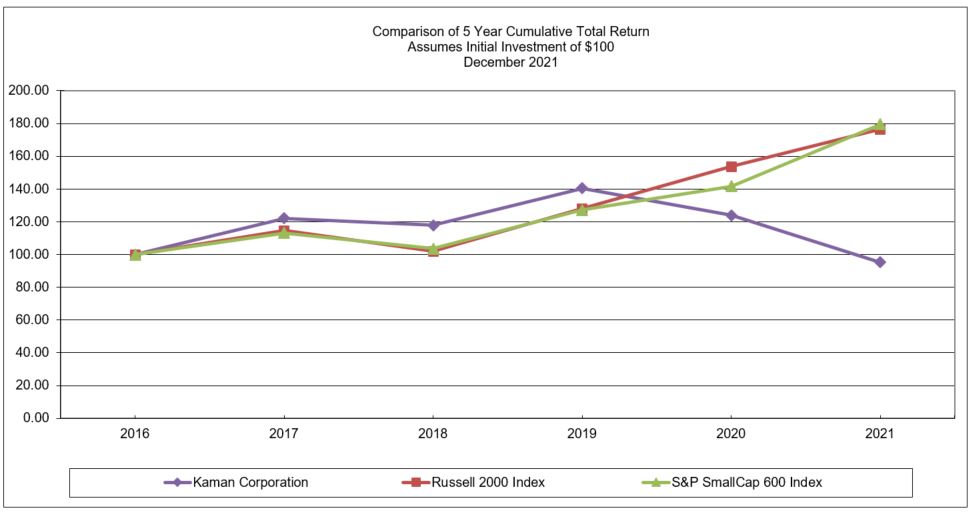
| 2016 | 2017 | 2018 | 2019 | 2020(1) | 2021(1) | |||||||||||||||||||||||||||||||||
| Kaman Corporation | 100.00 | 122.11 | 117.89 | 140.36 | 123.95 | 95.34 | ||||||||||||||||||||||||||||||||
| S&P Small Cap 600 | 100.00 | 113.23 | 103.63 | 127.24 | 141.60 | 179.58 | ||||||||||||||||||||||||||||||||
| Russell 2000 | 100.00 | 114.65 | 102.02 | 128.06 | 153.62 | 176.39 | ||||||||||||||||||||||||||||||||
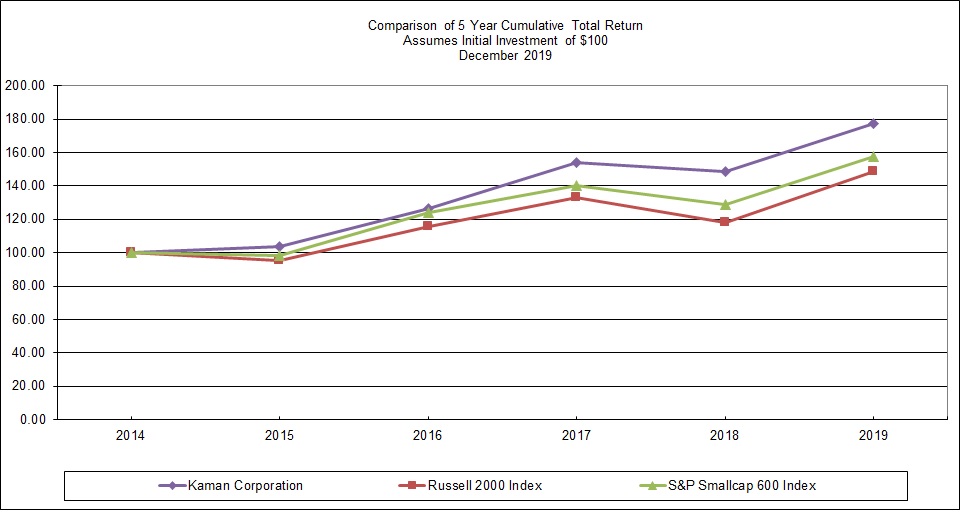
| 2014 | 2015 | 2016 | 2017 | 2018 | 2019 | |||||||||||||
| Kaman Corporation | 100.00 | 103.62 | 126.29 | 154.21 | 148.89 | 177.26 | ||||||||||||
| S&P Small Cap 600 | 100.00 | 98.03 | 124.06 | 140.48 | 128.56 | 157.85 | ||||||||||||
| Russell 2000 | 100.00 | 95.59 | 115.95 | 132.94 | 118.30 | 148.49 | ||||||||||||
2019 1,6,8,9 | 2018 2,6,7,8,9 | 2017 3,6,7,8,9 | 2016 4,6,7,8,9 | 2015 5,6,7,8,9 | ||||||||||||||||
| OPERATIONS | ||||||||||||||||||||
| Net sales from continuing operations | $ | 761,608 | $ | 735,994 | $ | 724,944 | $ | 702,054 | $ | 597,586 | ||||||||||
| Operating income from continuing operations | 53,411 | 32,963 | 61,716 | 64,955 | 50,342 | |||||||||||||||
| Earnings from continuing operations before income taxes | 40,587 | 25,136 | 44,922 | 51,921 | 40,103 | |||||||||||||||
| Income tax (benefit) expense | (15,859 | ) | 9,259 | 25,214 | 15,294 | 9,612 | ||||||||||||||
| Earnings from continuing operations | 56,446 | 15,877 | 19,708 | 36,627 | 30,491 | |||||||||||||||
| Earnings from discontinued operations, net of taxes | 29,027 | 38,292 | 30,118 | 22,227 | 29,947 | |||||||||||||||
| Gain on disposal of discontinued operations, net of taxes | 124,356 | — | — | — | — | |||||||||||||||
| Net earnings | $ | 209,829 | $ | 54,169 | $ | 49,826 | $ | 58,854 | $ | 60,438 | ||||||||||
| FINANCIAL POSITION | ||||||||||||||||||||
| Current assets | $ | 936,488 | $ | 773,105 | $ | 747,869 | $ | 698,553 | $ | 676,035 | ||||||||||
| Current liabilities | 203,992 | 298,476 | 246,299 | 353,886 | 236,689 | |||||||||||||||
| Working capital | 732,496 | 474,629 | 501,570 | 344,667 | 439,346 | |||||||||||||||
| Property, plant and equipment, net | 140,450 | 137,112 | 139,313 | 131,705 | 131,563 | |||||||||||||||
| Total assets | 1,418,943 | 1,474,062 | 1,466,396 | 1,439,476 | 1,451,186 | |||||||||||||||
| Long-term debt, excluding current portion | 181,622 | 284,256 | 391,651 | 296,598 | 434,227 | |||||||||||||||
| Shareholders’ equity | 823,202 | 633,157 | 635,656 | 565,787 | 543,077 | |||||||||||||||
| PER SHARE AMOUNTS | ||||||||||||||||||||
| Basic earnings per share from continuing operations | $ | 2.02 | $ | 0.57 | $ | 0.71 | $ | 1.35 | $ | 1.12 | ||||||||||
| Basic earnings per share from discontinued operations | 5.49 | 1.37 | 1.09 | 0.82 | 1.10 | |||||||||||||||
| Basic earnings per share | $ | 7.51 | $ | 1.94 | $ | 1.80 | $ | 2.17 | $ | 2.22 | ||||||||||
| Diluted earnings per share from continuing operations | $ | 2.01 | $ | 0.56 | $ | 0.69 | $ | 1.31 | $ | 1.09 | ||||||||||
| Diluted earnings per share from discontinued operations | 5.46 | 1.36 | 1.06 | 0.79 | 1.08 | |||||||||||||||
| Diluted earnings per share | $ | 7.47 | $ | 1.92 | $ | 1.75 | $ | 2.10 | $ | 2.17 | ||||||||||
| Dividends declared | $ | 0.80 | $ | 0.80 | $ | 0.80 | $ | 0.72 | $ | 0.72 | ||||||||||
| Shareholders’ equity | 29.57 | 22.72 | 22.85 | 20.87 | 20.09 | |||||||||||||||
| AVERAGE SHARES OUTSTANDING | ||||||||||||||||||||
| Basic | 27,936 | 27,945 | 27,611 | 27,107 | 27,177 | |||||||||||||||
| Diluted | 28,092 | 28,223 | 28,418 | 28,072 | 27,868 | |||||||||||||||
| GENERAL STATISTICS | ||||||||||||||||||||
| Registered shareholders | 3,528 | 3,085 | 3,142 | 3,261 | 3,402 | |||||||||||||||
| Employees | 2,935 | 2,900 | 3,095 | 3,072 | 2,991 | |||||||||||||||
| 2021 | 2020 | 2019 | ||||||||||||||||||
| In thousands | ||||||||||||||||||||
| Net sales | $ | 708,993 | $ | 784,459 | $ | 761,608 | ||||||||||||||
| $ change | (75,466) | 22,851 | 25,614 | |||||||||||||||||
| % change | (9.6) | % | 3.0 | % | 3.5 | % | ||||||||||||||
| Sales of disposed businesses that did not qualify for discontinued operations | 1,704 | 21,490 | 32,049 | |||||||||||||||||
| Organic sales | $ | 707,289 | $ | 762,969 | $ | 729,559 | ||||||||||||||
| $ change | (55,680) | 33,410 | ||||||||||||||||||
| % change | (7.3) | % | 4.6 | % | ||||||||||||||||
| 2019 | 2018 | 2017 | ||||||||||
| In thousands | ||||||||||||
| Net sales | $ | 761,608 | $ | 735,994 | $ | 724,944 | ||||||
| $ change | 25,614 | 11,050 | 22,890 | |||||||||
| % change | 3.5 | % | 1.5 | % | 3.3 | % | ||||||
| Product Line | Increase (Decrease) | $ (in millions) | % | |||||||||||||||||
| Defense | ↑ | $ | 1.1 | 0.7 | % | |||||||||||||||
| Safe and Arm Devices | ↓ | $ | (57.0) | (22.9) | % | |||||||||||||||
| Commercial, Business and General Aviation | ↓ | $ | (28.7) | (13.5) | % | |||||||||||||||
| Medical | ↑ | $ | 16.7 | 23.9 | % | |||||||||||||||
| Industrial | ↑ | $ | 12.1 | 18.5 | % | |||||||||||||||
| 2021 | 2020 | 2019 | ||||||||||||||||||
| In thousands | ||||||||||||||||||||
| Gross profit | $ | 236,618 | $ | 245,582 | $ | 240,805 | ||||||||||||||
| $ change | (8,964) | 4,777 | 13,488 | |||||||||||||||||
| % change | (3.7) | % | 2.0 | % | 5.9 | % | ||||||||||||||
| % of net sales | 33.4 | % | 31.3 | % | 31.6 | % | ||||||||||||||
| 2019 | 2018 | 2017 | ||||||||||
| In thousands | ||||||||||||
| Gross profit | $ | 240,805 | $ | 227,317 | $ | 234,029 | ||||||
| $ change | 13,488 | (6,712 | ) | 6,962 | ||||||||
| % change | 5.9 | % | (2.9 | )% | 3.1 | % | ||||||
| % of net sales | 31.6 | % | 30.9 | % | 32.3 | % | ||||||
| 2021 | 2020 | 2019 | ||||||||||||||||||
| In thousands | ||||||||||||||||||||
| S,G&A | $ | 152,474 | $ | 169,485 | $ | 160,768 | ||||||||||||||
| $ change | (17,011) | 8,717 | 4,567 | |||||||||||||||||
| % change | (10.0) | % | 5.4 | % | 2.9 | % | ||||||||||||||
| % of net sales | 21.5 | % | 21.6 | % | 21.1 | % | ||||||||||||||
| 2019 | 2018 | 2017 | ||||||||||
| In thousands | ||||||||||||
| S,G&A | $ | 177,187 | $ | 172,271 | $ | 169,683 | ||||||
| $ change | 4,916 | 2,588 | 7,572 | |||||||||
| % change | 2.9 | % | 1.5 | % | 4.7 | % | ||||||
| % of net sales | 23.3 | % | 23.4 | % | 23.4 | % | ||||||
| 2019 | 2018 | 2017 | |||||||
| Organic S,G&A: | |||||||||
| Aerospace | (4.1 | )% | 1.3 | % | (0.3 | )% | |||
| Corporate | 7.0 | % | 0.2 | % | 5.0 | % | |||
| Total Organic S,G&A | 2.9 | % | 1.5 | % | 4.7 | % | |||
| 2021 | 2020 | 2019 | ||||||||||||||||||
| In thousands | ||||||||||||||||||||
| Costs from transition services agreement | $ | 1,728 | $ | 12,515 | $ | 4,673 | ||||||||||||||
| 2019 | 2018 | 2017 | ||||||||||
| In thousands | ||||||||||||
| Costs from transition services agreement | $ | 4,673 | $ | — | $ | — | ||||||
| 2021 | 2020 | 2019 | ||||||||||||||||||
| In thousands | ||||||||||||||||||||
| Costs of acquired retention plans | $ | — | $ | 22,814 | $ | — | ||||||||||||||
| 2021 | 2020 | 2019 | ||||||||||||||||||
| In thousands | ||||||||||||||||||||
| Goodwill and other intangibles impairment | $ | — | $ | 50,307 | $ | — | ||||||||||||||
| 2019 | 2018 | 2017 | ||||||||||
| In thousands | ||||||||||||
| Other intangible assets impairment | $ | — | $ | 10,039 | $ | — | ||||||
| 2021 | 2020 | 2019 | ||||||||||||||||||
| In thousands | ||||||||||||||||||||
| Impairment of assets held for sale | $ | — | $ | 36,285 | $ | — | ||||||||||||||
| 2021 | 2020 | 2019 | ||||||||||||||||||
| In thousands | ||||||||||||||||||||
| Restructuring and severance costs | $ | 6,154 | $ | 8,359 | $ | 1,558 | ||||||||||||||
| 2021 | 2020 | 2019 | ||||||||||||||||||
| In thousands | ||||||||||||||||||||
| Cost reduction initiative | $ | 6,154 | $ | 3,970 | $ | 927 | ||||||||||||||
| Integration of Bal Seal acquisition | — | 524 | — | |||||||||||||||||
| Workforce reductions in response to COVID-19 | — | 3,549 | — | |||||||||||||||||
| Composites business restructuring | — | 316 | 631 | |||||||||||||||||
| Total restructuring and severance costs | $ | 6,154 | $ | 8,359 | $ | 1,558 | ||||||||||||||
| 2021 | 2020 | 2019 | ||||||||||||||||||
| In thousands | ||||||||||||||||||||
| Loss (gain) on sale of business | $ | 234 | $ | (493) | $ | 3,739 | ||||||||||||||
| 2019 | 2018 | 2017 | ||||||||||
| In thousands | ||||||||||||
| Restructuring costs | $ | 1,558 | $ | 7,353 | $ | 2,661 | ||||||
| 2019 | 2018 | 2017 | ||||||||||
| In thousands | ||||||||||||
| Loss on sale of business | $ | 3,739 | $ | 5,722 | $ | — | ||||||
| 2021 | 2020 | 2019 | ||||||||||||||||||
| In thousands | ||||||||||||||||||||
| Operating income (loss) | $ | 49,496 | $ | (84,311) | $ | 53,411 | ||||||||||||||
| $ change | 133,807 | (137,722) | 20,448 | |||||||||||||||||
| % change | 158.7 | % | (257.9) | % | 62.0 | % | ||||||||||||||
| % of net sales | 7.0 | % | (10.7) | % | 7.0 | % | ||||||||||||||
| 2019 | 2018 | 2017 | ||||||||||
| In thousands | ||||||||||||
| Aerospace | $ | 130,393 | $ | 94,357 | $ | 117,654 | ||||||
| Loss on sale of business | (3,739 | ) | (5,722 | ) | — | |||||||
| Net (loss) gain on sale of assets | (237 | ) | 1,031 | 31 | ||||||||
| Corporate expense | (73,006 | ) | (56,703 | ) | (55,969 | ) | ||||||
| Operating income | $ | 53,411 | $ | 32,963 | $ | 61,716 | ||||||
| $ change | 20,448 | (28,753 | ) | (3,239 | ) | |||||||
| % change | 62.0 | % | (46.6 | )% | (5.0 | )% | ||||||
| % of net sales | 7.0 | % | 4.5 | % | 8.5 | % | ||||||
| 2021 | 2020 | 2019 | ||||||||||||||||||
| In thousands | ||||||||||||||||||||
| Interest expense, net | $ | 16,290 | $ | 19,270 | $ | 17,202 | ||||||||||||||
| 2019 | 2018 | 2017 | ||||||||||
| In thousands | ||||||||||||
| Interest expense, net | $ | 17,202 | $ | 20,046 | $ | 20,578 | ||||||
| 2021 | 2020 | 2019 | ||||||||||||||||||
| Effective income tax rate | 27.8 | % | 9.9 | % | (39.1) | % | ||||||||||||||
| 2019 | 2018 | 2017 | |||||||
| Effective income tax rate | (39.1 | )% | 36.8 | % | 56.1 | % | |||
| 2021 | 2020 | 2019 | ||||||||||||||||||
| In thousands | ||||||||||||||||||||
| Backlog | $ | 700,923 | $ | 631,236 | $ | 806,870 | ||||||||||||||
| 2019 | 2018 | 2017 | ||||||||||
| In thousands | ||||||||||||
| Backlog | $ | 806,870 | $ | 851,814 | $ | 616,090 | ||||||
| 2021 | 2020 | 2019 | ||||||||||||||||||
| In thousands | ||||||||||||||||||||
| Net sales | $ | 317,683 | $ | 315,063 | $ | 270,335 | ||||||||||||||
| $ change | 2,620 | 44,728 | 6,416 | |||||||||||||||||
| % change | 0.8 | % | 16.5 | % | 2.4 | % | ||||||||||||||
| Operating income | $ | 43,097 | $ | 33,561 | $ | 64,195 | ||||||||||||||
| $ change | 9,536 | (30,634) | 1,181 | |||||||||||||||||
| % change | 28.4 | % | (47.7) | % | 1.9 | % | ||||||||||||||
| % of net sales | 13.6 | % | 10.7 | % | 23.7 | % | ||||||||||||||
| 2021 | 2020 | 2019 | ||||||||||||||||||
| In thousands | ||||||||||||||||||||
| Net sales | $ | 256,329 | $ | 302,509 | $ | 307,312 | ||||||||||||||
| $ change | (46,180) | (4,803) | 16,700 | |||||||||||||||||
| % change | (15.3) | % | (1.6) | % | 5.7 | % | ||||||||||||||
| Operating income | $ | 55,366 | $ | 74,033 | $ | 59,573 | ||||||||||||||
| $ change | (18,667) | 14,460 | 3,151 | |||||||||||||||||
| % change | (25.2) | % | 24.3 | % | 5.6 | % | ||||||||||||||
| % of net sales | 21.6 | % | 24.5 | % | 19.4 | % | ||||||||||||||
| 2021 | 2020 | 2019 | ||||||||||||||||||
| In thousands | ||||||||||||||||||||
| Net sales | $ | 134,981 | $ | 166,887 | $ | 183,961 | ||||||||||||||
| $ change | (31,906) | (17,074) | 2,498 | |||||||||||||||||
| % change | (19.1) | % | (9.3) | % | 1.4 | % | ||||||||||||||
| Operating (loss) income | $ | (340) | $ | (8,858) | $ | 1,194 | ||||||||||||||
| $ change | 8,518 | (10,052) | 12,516 | |||||||||||||||||
| % change | 96.2 | % | (841.9) | % | 110.5 | % | ||||||||||||||
| % of net sales | (0.3) | % | (5.3) | % | 0.6 | % | ||||||||||||||
| 2019 | 2018 | 2017 | 19 vs. 18 | 18 vs. 17 | ||||||||||||||||
| (in thousands) | ||||||||||||||||||||
| Total cash provided by (used in): | ||||||||||||||||||||
| Operating activities | $ | 42,488 | $ | 118,714 | $ | 38,272 | $ | (76,226 | ) | $ | 80,442 | |||||||||
| Investing activities | 628,316 | (22,538 | ) | (22,840 | ) | 650,854 | 302 | |||||||||||||
| Financing activities | (152,713 | ) | (141,145 | ) | (53,627 | ) | (11,568 | ) | (87,518 | ) | ||||||||||
Free Cash Flow(1) : | ||||||||||||||||||||
| Net cash provided by operating activities | $ | 42,488 | $ | 118,714 | $ | 38,272 | $ | (76,226 | ) | $ | 80,442 | |||||||||
| Expenditures for property, plant and equipment | (22,447 | ) | (21,504 | ) | (18,010 | ) | (943 | ) | (3,494 | ) | ||||||||||
| Free cash flow | $ | 20,041 | $ | 97,210 | $ | 20,262 | $ | (77,169 | ) | $ | 76,948 | |||||||||
| 2021 | 2020 | 2019 | 21 vs. 20 | 20 vs. 19 | ||||||||||||||||||||||||||||
| (in thousands) | ||||||||||||||||||||||||||||||||
| Total cash provided by (used in): | ||||||||||||||||||||||||||||||||
| Operating activities | $ | 48,698 | $ | 16,469 | $ | 42,488 | $ | 32,229 | $ | (26,019) | ||||||||||||||||||||||
| Investing activities | (21,112) | (318,722) | 628,316 | 297,610 | (947,038) | |||||||||||||||||||||||||||
| Financing activities | (22,233) | (33,535) | (152,713) | 11,302 | 119,178 | |||||||||||||||||||||||||||
Free Cash Flow(1) : | ||||||||||||||||||||||||||||||||
| Net cash provided by operating activities | $ | 48,698 | $ | 16,469 | $ | 42,488 | $ | 32,229 | $ | (26,019) | ||||||||||||||||||||||
| Expenditures for property, plant and equipment | (17,530) | (17,783) | (22,447) | 253 | 4,664 | |||||||||||||||||||||||||||
| Free cash flow | $ | 31,168 | $ | (1,314) | $ | 20,041 | $ | 32,482 | $ | (21,355) | ||||||||||||||||||||||
| Theoretical Average Share Price of Kaman Stock | ||||||||||||||||||||||||||||||||
| $65.26 | $70.00 | $75.00 | $80.00 | $84.84 | ||||||||||||||||||||||||||||
| Dilutive Shares associated with: | ||||||||||||||||||||||||||||||||
| Convertible Debt | — | 206,879 | 396,879 | 563,129 | 705,394 | |||||||||||||||||||||||||||
| December 31, 2021 | December 31, 2020 | |||||||||||||
| In thousands | ||||||||||||||
| Total facility | $ | 800,000 | $ | 800,000 | ||||||||||
| Amounts outstanding, excluding letters of credit | — | — | ||||||||||||
| Amounts available for borrowing, excluding letters of credit | 800,000 | 800,000 | ||||||||||||
Letters of credit under the credit facility(1)(2) | 92,646 | 165,373 | ||||||||||||
| Amounts available for borrowing | $ | 707,354 | $ | 634,627 | ||||||||||
Amounts available for borrowing subject to EBITDA, as defined by the Credit Agreement(3) | $ | 409,914 | $ | 363,997 | ||||||||||
| Theoretical Average Share Price of Kaman Stock | ||||||||||||||||||||||||||||||||
| $65.26 | $70.00 | $75.00 | $80.00 | $84.84 | ||||||||||||||||||||||||||||
| Dilutive Shares associated with: | ||||||||||||||||||||||||||||||||
| Convertible Debt | — | 206,879 | 396,879 | 563,129 | 705,394 | |||||||||||||||||||||||||||
| Organic Sales (in thousands) | ||||||||||||
| 2019 | 2018 | 2017 | ||||||||||
| Net sales | $ | 761,608 | $ | 735,994 | $ | 724,944 | ||||||
| Less: Acquisition Sales | — | — | — | |||||||||
| Organic Sales | $ | 761,608 | $ | 735,994 | $ | 724,944 | ||||||
| December 31, 2021 | December 31, 2020 | |||||||||||||
| In thousands | ||||||||||||||
| Total facility | $ | 800,000 | $ | 800,000 | ||||||||||
| Amounts outstanding, excluding letters of credit | — | — | ||||||||||||
| Amounts available for borrowing, excluding letters of credit | 800,000 | 800,000 | ||||||||||||
Letters of credit under the credit facility(1)(2) | 92,646 | 165,373 | ||||||||||||
| Amounts available for borrowing | $ | 707,354 | $ | 634,627 | ||||||||||
Amounts available for borrowing subject to EBITDA, as defined by the Credit Agreement(3) | $ | 409,914 | $ | 363,997 | ||||||||||
| Payments due by period (in millions) | ||||||||||||||||||||
| Contractual Obligations | Total | Within 1 year | 1-3 years | 3-5 years | More than 5 years | |||||||||||||||
| Long-term debt (including convertible notes) | $ | 199.5 | $ | — | $ | — | $ | 199.5 | $ | — | ||||||||||
Interest payments on debt (a) | 70.0 | 14.3 | 29.3 | 23.1 | 3.3 | |||||||||||||||
| Operating leases | 15.9 | 4.3 | 6.7 | 4.9 | — | |||||||||||||||
| Finance leases | 7.4 | 1.9 | 3.6 | 1.9 | — | |||||||||||||||
Purchase obligations (b) | 203.4 | 177.6 | 25.5 | 0.3 | — | |||||||||||||||
Transition services agreement (c) | 8.8 | 8.8 | — | — | — | |||||||||||||||
Other long-term obligations (d) | 57.3 | 14.0 | 16.5 | 4.1 | 22.7 | |||||||||||||||
Planned funding of pension and SERP (e) | 16.3 | 10.5 | 3.0 | 0.9 | 1.9 | |||||||||||||||
| Total | $ | 578.6 | $ | 231.4 | $ | 84.6 | $ | 234.7 | $ | 27.9 | ||||||||||
| Theoretical Average Share Price of Kaman Stock | ||||||||||||||||||||||||||||||||
| $65.26 | $70.00 | $75.00 | $80.00 | $84.84 | ||||||||||||||||||||||||||||
| Dilutive Shares associated with: | ||||||||||||||||||||||||||||||||
| Convertible Debt | — | 206,879 | 396,879 | 563,129 | 705,394 | |||||||||||||||||||||||||||
| December 31, 2021 | December 31, 2020 | |||||||||||||
| In thousands | ||||||||||||||
| Total facility | $ | 800,000 | $ | 800,000 | ||||||||||
| Amounts outstanding, excluding letters of credit | — | — | ||||||||||||
| Amounts available for borrowing, excluding letters of credit | 800,000 | 800,000 | ||||||||||||
Letters of credit under the credit facility(1)(2) | 92,646 | 165,373 | ||||||||||||
| Amounts available for borrowing | $ | 707,354 | $ | 634,627 | ||||||||||
Amounts available for borrowing subject to EBITDA, as defined by the Credit Agreement(3) | $ | 409,914 | $ | 363,997 | ||||||||||
| Organic Sales (in thousands) | ||||||||||||||||||||
| 2021 | 2020 | 2019 | ||||||||||||||||||
| Net sales | $ | 708,993 | $ | 784,459 | $ | 761,608 | ||||||||||||||
| Acquisition Sales | — | — | — | |||||||||||||||||
| Sales of disposed businesses that did not qualify for discontinued operations | 1,704 | 21,490 | 32,049 | |||||||||||||||||
| Organic Sales | $ | 707,289 | $ | 762,969 | $ | 729,559 | ||||||||||||||
| 2019 | 2018 | 2017 | ||||||||||
| In thousands | ||||||||||||
| ASC 606 | ||||||||||||
| Revenue recognized for performance obligations satisfied | ||||||||||||
| Point-in-time | $ | 466,866 | $ | 383,109 | $ | — | ||||||
| Over time | 294,742 | 352,885 | — | |||||||||
| Total revenue recognized for performance obligations satisfied | $ | 761,608 | $ | 735,994 | $ | — | ||||||
| % of Net sales - Point-in-time | 61.3 | % | 52.1 | % | — | % | ||||||
| % of Net sales - Over time | 38.7 | % | 47.9 | % | — | % | ||||||
| % of Net sales - Performance obligations satisfied | 100.0 | % | 100.0 | % | — | % | ||||||
| 2019 | 2018 | 2017 | ||||||||||
| In thousands | ||||||||||||
| ASC 605 | ||||||||||||
| Revenue recognized under percentage of completion method | ||||||||||||
| Units-of-delivery | $ | — | $ | — | $ | 317,906 | ||||||
| Cost-to-cost | — | — | 55,119 | |||||||||
| Total revenue recognized under percentage of completion method | $ | — | $ | — | $ | 373,025 | ||||||
| % of Net sales - Units-of-delivery | — | — | 43.9 | % | ||||||||
| % of Net sales - Cost-to-cost | — | — | 7.6 | % | ||||||||
| % of Net sales - Percentage-of-completion method | — | % | — | % | 51.5 | % | ||||||
| First | Second | Third | Fourth | Total | ||||||||||||||||
| 2019 | Quarter | Quarter | Quarter | Quarter | Year | |||||||||||||||
| (in thousands, except per share amounts) | ||||||||||||||||||||
| Net sales | $ | 166,434 | $ | 174,712 | $ | 182,670 | $ | 237,792 | $ | 761,608 | ||||||||||
| Gross profit | $ | 54,521 | $ | 52,589 | $ | 61,133 | $ | 72,562 | $ | 240,805 | ||||||||||
| Earnings from continuing operations, net of tax | $ | 5,822 | $ | 6,389 | $ | 10,130 | $ | 34,105 | $ | 56,446 | ||||||||||
| Earnings from discontinued operations before gain on disposal, net of tax | 8,303 | 7,077 | 9,860 | 3,787 | 29,027 | |||||||||||||||
| Gain on disposal of discontinued operations, net of tax | — | — | 122,786 | 1,570 | 124,356 | |||||||||||||||
| Net earnings | $ | 14,125 | $ | 13,466 | $ | 142,776 | $ | 39,462 | $ | 209,829 | ||||||||||
| Basic earnings per share | ||||||||||||||||||||
| From continuing operations | $ | 0.21 | $ | 0.23 | $ | 0.36 | $ | 1.22 | $ | 2.02 | ||||||||||
| From discontinued operations | 0.30 | 0.25 | 4.75 | 0.19 | 5.49 | |||||||||||||||
| Basic earnings per share | $ | 0.51 | $ | 0.48 | $ | 5.11 | $ | 1.41 | $ | 7.51 | ||||||||||
| Diluted earnings per share | ||||||||||||||||||||
| From continuing operations | $ | 0.20 | $ | 0.23 | $ | 0.36 | $ | 1.22 | $ | 2.01 | ||||||||||
| From discontinued operations | 0.30 | 0.25 | 4.72 | 0.19 | 5.46 | |||||||||||||||
| Diluted earnings per share | $ | 0.50 | $ | 0.48 | $ | 5.08 | $ | 1.41 | $ | 7.47 | ||||||||||
| First | Second | Third | Fourth | Total | ||||||||||||||||
| 2018 | Quarter | Quarter | Quarter | Quarter | Year | |||||||||||||||
| (in thousands, except per share amounts) | ||||||||||||||||||||
| Net sales | $ | 179,395 | $ | 178,606 | $ | 157,134 | $ | 220,859 | $ | 735,994 | ||||||||||
| Gross profit | $ | 53,180 | $ | 53,441 | $ | 47,688 | $ | 73,008 | $ | 227,317 | ||||||||||
| Earnings from continuing operations, net of tax | $ | 4,970 | $ | 4,778 | $ | (9,503 | ) | $ | 15,632 | $ | 15,877 | |||||||||
| Earnings from discontinued operations before gain on disposal, net of tax | 9,096 | 10,316 | 10,935 | 7,945 | 38,292 | |||||||||||||||
| Net earnings | $ | 14,066 | $ | 15,094 | $ | 1,432 | $ | 23,577 | $ | 54,169 | ||||||||||
| Basic earnings per share | ||||||||||||||||||||
| From continuing operations | $ | 0.18 | $ | 0.17 | $ | (0.34 | ) | $ | 0.56 | $ | 0.57 | |||||||||
| From discontinued operations | 0.33 | 0.37 | 0.39 | 0.28 | 1.37 | |||||||||||||||
| Basic earnings per share | $ | 0.51 | $ | 0.54 | $ | 0.05 | $ | 0.84 | $ | 1.94 | ||||||||||
| Diluted earnings per share | ||||||||||||||||||||
| From continuing operations | $ | 0.18 | $ | 0.17 | $ | (0.34 | ) | $ | 0.56 | $ | 0.56 | |||||||||
| From discontinued operations | 0.32 | 0.36 | 0.39 | 0.28 | 1.36 | |||||||||||||||
| Diluted earnings per share | $ | 0.50 | $ | 0.53 | $ | 0.05 | $ | 0.84 | $ | 1.92 | ||||||||||
| First | Second | Third | Fourth | Total | ||||||||||||||||
| 2019 | Quarter | Quarter | Quarter | Quarter | Year | |||||||||||||||
| (in thousands) | ||||||||||||||||||||
| Tax benefit associated with entity classification for investment in U.K. business | $ | — | $ | — | $ | — | $ | (25,710 | ) | $ | (25,710 | ) | ||||||||
| (Reductions) additions in revenue associated with changes in profit estimates for over time contracts | $ | (781 | ) | $ | 467 | $ | (1,243 | ) | $ | (3,067 | ) | $ | (4,624 | ) | ||||||
| Cost associated with corporate development activities | $ | — | $ | — | $ | 2,993 | $ | 7,097 | $ | 10,090 | ||||||||||
| Restructuring and severance costs | $ | 266 | $ | 206 | $ | 81 | $ | 1,005 | $ | 1,558 | ||||||||||
| Costs from transition services agreement | $ | — | $ | — | $ | 1,154 | $ | 3,519 | $ | 4,673 | ||||||||||
| Income from transition services agreement | $ | — | $ | — | $ | (944 | ) | $ | (2,729 | ) | $ | (3,673 | ) | |||||||
| Loss on sale of U.K. Tooling business | $ | — | $ | — | $ | — | $ | 3,739 | $ | 3,739 | ||||||||||
| First | Second | Third | Fourth | Total | ||||||||||||||||
| 2018 | Quarter | Quarter | Quarter | Quarter | Year | |||||||||||||||
| (in thousands) | ||||||||||||||||||||
| Additions in revenue associated with changes in profit estimates for over time contracts | $ | 1,556 | $ | 1,513 | $ | 1,736 | $ | 1,871 | $ | 6,676 | ||||||||||
| Non-cash intangible asset impairment charge | $ | — | $ | — | $ | 10,039 | $ | — | $ | 10,039 | ||||||||||
| Non-cash write-off of inventory | $ | — | $ | — | $ | 709 | $ | — | $ | 709 | ||||||||||
| Employee tax-related matters in foreign operations | $ | — | $ | — | $ | 1,279 | $ | 1,761 | $ | 3,040 | ||||||||||
| Cost associated with corporate development activities | $ | — | $ | — | $ | 1,051 | $ | 30 | $ | 1,081 | ||||||||||
| Gain on the sale of land | $ | — | $ | (1,520 | ) | $ | — | $ | — | $ | (1,520 | ) | ||||||||
| Restructuring and severance costs | $ | 1,693 | $ | 1,804 | $ | 1,214 | $ | 2,642 | $ | 7,353 | ||||||||||
| Loss on sale of U.K. Tooling business | $ | — | $ | — | $ | — | $ | 5,722 | $ | 5,722 | ||||||||||
| Loss on sale of assets and liabilities of Engineering Services business | $ | — | $ | — | $ | — | $ | 661 | $ | 661 | ||||||||||
CONSOLIDATED BALANCE SHEETS KAMAN CORPORATION AND SUBSIDIARIES (In thousands, except share and per share amounts) | ||||||||
| December 31, 2019 | December 31, 2018 | |||||||
| Assets | ||||||||
| Current assets: | ||||||||
| Cash and cash equivalents | $ | 471,540 | $ | 25,895 | ||||
| Accounts receivable, net | 156,492 | 149,338 | ||||||
| Contract assets | 121,614 | 99,261 | ||||||
| Contract costs, current portion | 6,052 | 5,993 | ||||||
| Inventories | 156,353 | 131,569 | ||||||
| Income tax refunds receivable | 8,069 | 1,752 | ||||||
| Assets held for sale, current portion | — | 351,261 | ||||||
| Other current assets | 16,368 | 8,036 | ||||||
| Total current assets | 936,488 | 773,105 | ||||||
| Property, plant and equipment, net of accumulated depreciation of $210,549 and $192,285, respectively | 140,450 | 137,112 | ||||||
| Operating right-of-use asset, net | 15,159 | — | ||||||
| Goodwill | 195,314 | 196,161 | ||||||
| Other intangible assets, net | 53,439 | 58,567 | ||||||
| Deferred income taxes | 35,240 | 38,040 | ||||||
| Contract costs, noncurrent portion | 6,099 | 10,666 | ||||||
| Assets held for sale, noncurrent portion | — | 229,238 | ||||||
| Other assets | 36,754 | 31,173 | ||||||
| Total assets | $ | 1,418,943 | $ | 1,474,062 | ||||
| December 31, 2019 | December 31, 2018 | |||||||
| Liabilities and Shareholders’ Equity | ||||||||
| Current liabilities: | ||||||||
| Current portion of long-term debt, net of debt issuance costs | $ | — | $ | 9,375 | ||||
| Accounts payable – trade | 70,884 | 56,826 | ||||||
| Accrued salaries and wages | 43,220 | 32,795 | ||||||
| Contract liabilities, current portion | 42,942 | 28,865 | ||||||
| Operating lease liabilities, current portion | 4,306 | — | ||||||
| Income taxes payable | 4,722 | 139 | ||||||
| Liabilities held for sale, current portion | — | 131,047 | ||||||
| Other current liabilities | 37,918 | 39,429 | ||||||
| Total current liabilities | 203,992 | 298,476 | ||||||
| Long-term debt, excluding current portion, net of debt issuance costs | 181,622 | 284,256 | ||||||
| Deferred income taxes | 6,994 | 7,146 | ||||||
| Underfunded pension | 97,246 | 104,988 | ||||||
| Contract liabilities, noncurrent portion | 37,855 | 78,562 | ||||||
| Operating lease liabilities, noncurrent portion | 11,617 | — | ||||||
| Liabilities held for sale, noncurrent portion | — | 15,602 | ||||||
| Other long-term liabilities | 56,415 | 51,875 | ||||||
| Commitments and contingencies (Note 19) | ||||||||
Shareholders’ equity: | ||||||||
| Preferred stock, $1 par value, 200,000 shares authorized; none outstanding | — | — | ||||||
| Common stock, $1 par value, 50,000,000 shares authorized; voting; 30,058,455 and 29,544,714 shares issued, respectively | 30,058 | 29,545 | ||||||
| Additional paid-in capital | 228,153 | 200,474 | ||||||
| Retained earnings | 820,666 | 610,103 | ||||||
| Accumulated other comprehensive income (loss) | (150,893 | ) | (134,898 | ) | ||||
| Less 2,219,332 and 1,672,917 shares of common stock, respectively, held in treasury, at cost | (104,782 | ) | (72,067 | ) | ||||
| Total shareholders’ equity | 823,202 | 633,157 | ||||||
| Total liabilities and shareholders’ equity | $ | 1,418,943 | $ | 1,474,062 | ||||
| December 31, 2021 | December 31, 2020 | |||||||||||||
| Assets | ||||||||||||||
| Current assets: | ||||||||||||||
| Cash and cash equivalents | $ | 140,800 | $ | 104,377 | ||||||||||
| Restricted cash | — | 25,121 | ||||||||||||
| Accounts receivable, net | 73,524 | 153,806 | ||||||||||||
| Contract assets | 112,354 | 108,645 | ||||||||||||
| Contract costs, current portion | 850 | 3,511 | ||||||||||||
| Inventories | 193,100 | 185,072 | ||||||||||||
| Income tax refunds receivable | 13,832 | 5,269 | ||||||||||||
| Other current assets | 12,083 | 12,173 | ||||||||||||
| Total current assets | 546,543 | 597,974 | ||||||||||||
| Property, plant and equipment, net of accumulated depreciation of $251,888 and $228,984, respectively | 197,822 | 210,852 | ||||||||||||
| Operating right-of-use asset, net | 11,011 | 12,880 | ||||||||||||
| Goodwill | 240,681 | 247,244 | ||||||||||||
| Other intangible assets, net | 138,074 | 150,198 | ||||||||||||
| Deferred income taxes | 15,717 | 39,809 | ||||||||||||
| Contract costs, noncurrent portion | 10,249 | 8,311 | ||||||||||||
| Other assets | 38,385 | 39,125 | ||||||||||||
| Total assets | $ | 1,198,482 | $ | 1,306,393 | ||||||||||
| Liabilities and Shareholders’ Equity | ||||||||||||||
| Current liabilities: | ||||||||||||||
| Accounts payable – trade | $ | 42,134 | $ | 60,200 | ||||||||||
| Accrued salaries and wages | 38,892 | 70,552 | ||||||||||||
| Contract liabilities, current portion | 2,945 | 39,073 | ||||||||||||
| Operating lease liabilities, current portion | 4,502 | 4,305 | ||||||||||||
| Income taxes payable | 386 | 19 | ||||||||||||
| Liabilities held for sale, current portion | — | 18,086 | ||||||||||||
| Other current liabilities | 32,076 | 36,177 | ||||||||||||
| Total current liabilities | 120,935 | 228,412 | ||||||||||||
| Long-term debt, excluding current portion, net of debt issuance costs | 189,421 | 185,401 | ||||||||||||
| Deferred income taxes | 6,506 | 7,381 | ||||||||||||
| Underfunded pension | 21,786 | 69,610 | ||||||||||||
| Contract liabilities, noncurrent portion | 16,528 | 11,019 | ||||||||||||
| Operating lease liabilities, noncurrent portion | 7,140 | 9,325 | ||||||||||||
| Liabilities held for sale, noncurrent portion | — | 1,171 | ||||||||||||
| Other long-term liabilities | 39,837 | 47,636 | ||||||||||||
| Commitments and contingencies (Note 19) | 0 | 0 | ||||||||||||
Shareholders’ equity: | ||||||||||||||
| Preferred stock, $1 par value, 200,000 shares authorized; none outstanding | — | — | ||||||||||||
| Common stock, $1 par value, 50,000,000 shares authorized; voting; 30,434,269 and 30,278,668 shares issued, respectively | 30,434 | 30,279 | ||||||||||||
| Additional paid-in capital | 248,153 | 238,829 | ||||||||||||
| Retained earnings | 750,445 | 728,764 | ||||||||||||
| Accumulated other comprehensive income (loss) | (111,385) | (130,821) | ||||||||||||
| Less 2,573,896 and 2,555,785 shares of common stock, respectively, held in treasury, at cost | (121,318) | (120,613) | ||||||||||||
| Total shareholders’ equity | 796,329 | 746,438 | ||||||||||||
| Total liabilities and shareholders’ equity | $ | 1,198,482 | $ | 1,306,393 | ||||||||||
| For the Year Ended December 31, | ||||||||||||||||||||
| 2021 | 2020 | 2019 | ||||||||||||||||||
| Net sales | $ | 708,993 | $ | 784,459 | $ | 761,608 | ||||||||||||||
| Cost of sales | 472,375 | 538,877 | 520,803 | |||||||||||||||||
| Gross profit | 236,618 | 245,582 | 240,805 | |||||||||||||||||
| Selling, general and administrative expenses | 152,474 | 169,485 | 160,768 | |||||||||||||||||
| Goodwill and other intangibles impairment (Note 12) | — | 50,307 | — | |||||||||||||||||
| Impairment on assets held for sale (Note 2) | — | 36,285 | — | |||||||||||||||||
| Research and development costs | 16,072 | 14,755 | 11,896 | |||||||||||||||||
| Intangible asset amortization expense | 10,468 | 15,666 | 4,523 | |||||||||||||||||
| Costs from transition services agreement (Note 2) | 1,728 | 12,515 | 4,673 | |||||||||||||||||
| Cost of acquired retention plans (Note 3) | — | 22,814 | — | |||||||||||||||||
| Restructuring and severance costs (Note 5) | 6,154 | 8,359 | 1,558 | |||||||||||||||||
| Loss (gain) on sale of business (Note 5) | 234 | (493) | 3,739 | |||||||||||||||||
| Net (gain) loss on sale of assets | (8) | 200 | 237 | |||||||||||||||||
| Operating income (loss) | 49,496 | (84,311) | 53,411 | |||||||||||||||||
| Interest expense, net | 16,290 | 19,270 | 17,202 | |||||||||||||||||
| Non-service pension and post retirement benefit income, net | (26,229) | (16,250) | (396) | |||||||||||||||||
| Income from transition services agreement (Note 2) | (931) | (8,439) | (3,673) | |||||||||||||||||
| Other income, net | (142) | (728) | (309) | |||||||||||||||||
| Earnings (loss) from continuing operations before income taxes | 60,508 | (78,164) | 40,587 | |||||||||||||||||
| Income tax expense (benefit) | 16,832 | (7,730) | (15,859) | |||||||||||||||||
| Earnings (loss) from continuing operations, net of tax | 43,676 | (70,434) | 56,446 | |||||||||||||||||
| Earnings from discontinued operations before gain on disposal, net of tax | — | — | 29,027 | |||||||||||||||||
| Gain on disposal of discontinued operations, net of tax | — | 692 | 124,356 | |||||||||||||||||
| Total earnings from discontinued operations, net of tax | — | 692 | 153,383 | |||||||||||||||||
| Net earnings (loss) | $ | 43,676 | $ | (69,742) | $ | 209,829 | ||||||||||||||
| Earnings per share: | ||||||||||||||||||||
| Basic earnings (loss) per share from continuing operations | $ | 1.57 | $ | (2.54) | $ | 2.02 | ||||||||||||||
| Basic earnings per share from discontinued operations | — | 0.02 | 5.49 | |||||||||||||||||
| Basic earnings (loss) per share | $ | 1.57 | $ | (2.52) | $ | 7.51 | ||||||||||||||
| Diluted earnings (loss) per share from continuing operations | $ | 1.57 | $ | (2.54) | $ | 2.01 | ||||||||||||||
| Diluted earnings per share from discontinued operations | — | 0.02 | 5.46 | |||||||||||||||||
| Diluted earnings (loss) per share | $ | 1.57 | $ | (2.52) | $ | 7.47 | ||||||||||||||
| Weighted average shares outstanding: | ||||||||||||||||||||
| Basic | 27,865 | 27,723 | 27,936 | |||||||||||||||||
| Diluted | 27,891 | 27,723 | 28,092 | |||||||||||||||||
| For the Year Ended December 31, | ||||||||||||
| 2019 | 2018 | 2017 | ||||||||||
| Net sales | $ | 761,608 | $ | 735,994 | $ | 724,944 | ||||||
| Cost of sales | 520,803 | 508,677 | 490,915 | |||||||||
| Gross profit | 240,805 | 227,317 | 234,029 | |||||||||
| Selling, general and administrative expenses | 177,187 | 172,271 | 169,683 | |||||||||
| Other intangible assets impairment (Note 12) | — | 10,039 | — | |||||||||
| Costs from transition services agreement (Note 3) | 4,673 | — | — | |||||||||
| Restructuring costs (Note 5) | 1,558 | 7,353 | 2,661 | |||||||||
| Loss on sale of business (Note 5) | 3,739 | 5,722 | — | |||||||||
| Net loss (gain) on sale of assets | 237 | (1,031 | ) | (31 | ) | |||||||
| Operating income | 53,411 | 32,963 | 61,716 | |||||||||
| Interest expense, net | 17,202 | 20,046 | 20,578 | |||||||||
| Non-service pension and post retirement benefit income | (396 | ) | (12,127 | ) | (3,056 | ) | ||||||
| Income from transition services agreement (Note 3) | (3,673 | ) | — | — | ||||||||
| Other income, net | (309 | ) | (92 | ) | (728 | ) | ||||||
| Earnings from continuing operations before income taxes | 40,587 | 25,136 | 44,922 | |||||||||
| Income tax (benefit) expense | (15,859 | ) | 9,259 | 25,214 | ||||||||
| Earnings from continuing operations, net of tax | 56,446 | 15,877 | 19,708 | |||||||||
| Earnings from discontinued operations before gain on disposal, net of tax | 29,027 | 38,292 | 30,118 | |||||||||
| Gain on disposal of discontinued operations, net of tax | 124,356 | — | — | |||||||||
| Total earnings from discontinued operations, net of tax | 153,383 | 38,292 | 30,118 | |||||||||
| Net earnings | $ | 209,829 | $ | 54,169 | $ | 49,826 | ||||||
| Earnings per share: | ||||||||||||
| Basic earnings per share from continuing operations | $ | 2.02 | $ | 0.57 | $ | 0.71 | ||||||
| Basic earnings per share from discontinued operations | 5.49 | 1.37 | 1.09 | |||||||||
| Basic earnings per share | $ | 7.51 | $ | 1.94 | $ | 1.80 | ||||||
| Diluted earnings per share from continuing operations | $ | 2.01 | $ | 0.56 | $ | 0.69 | ||||||
| Diluted earnings per share from discontinued operations | 5.46 | 1.36 | 1.06 | |||||||||
| Diluted earnings per share | $ | 7.47 | $ | 1.92 | $ | 1.75 | ||||||
| Weighted average shares outstanding: | ||||||||||||
| Basic | 27,936 | 27,945 | 27,611 | |||||||||
| Diluted | 28,092 | 28,223 | 28,418 | |||||||||
| For the Year Ended December 31, | ||||||||||||
| 2019 | 2018 | 2017 | ||||||||||
| Net earnings | $ | 209,829 | $ | 54,169 | $ | 49,826 | ||||||
| Other comprehensive income, net of tax: | ||||||||||||
| Foreign currency translation adjustments and other | (1,772 | ) | (7,525 | ) | 27,891 | |||||||
| Pension plan adjustments, net of tax expense (benefit) of $2,619, ($3,701), and $7,661, respectively | 8,871 | (11,559 | ) | 12,688 | ||||||||
| Other comprehensive income (loss) | $ | 7,099 | $ | (19,084 | ) | $ | 40,579 | |||||
| Total comprehensive income | $ | 216,928 | $ | 35,085 | $ | 90,405 | ||||||
| For the Year Ended December 31, | ||||||||||||||||||||
| 2021 | 2020 | 2019 | ||||||||||||||||||
| Net earnings (loss) | $ | 43,676 | $ | (69,742) | $ | 209,829 | ||||||||||||||
| Other comprehensive income, net of tax: | ||||||||||||||||||||
| Foreign currency translation adjustments and other | 9,489 | 15,634 | (1,772) | |||||||||||||||||
| Pension plan adjustments, net of tax expense of $2,949, $1,315, and $2,619, respectively | 9,947 | 4,438 | 8,871 | |||||||||||||||||
| Other comprehensive income | $ | 19,436 | $ | 20,072 | $ | 7,099 | ||||||||||||||
| Total comprehensive income (loss) | $ | 63,112 | $ | (49,670) | $ | 216,928 | ||||||||||||||
| Common Stock | Additional Paid-In | Retained | Accumulated Other Comprehensive | Treasury Stock | Total Shareholders' | |||||||||||||||||||||||||
| Shares | $ | Capital | Earnings | Income (Loss) | Shares | $ | Equity | |||||||||||||||||||||||
| Balance at December 31, 2016 | 28,162,497 | $ | 28,162 | $ | 171,162 | $ | 560,200 | $ | (156,393 | ) | 1,054,364 | $ | (37,344 | ) | $ | 565,787 | ||||||||||||||
| Net earnings | — | — | — | 49,826 | — | — | — | 49,826 | ||||||||||||||||||||||
| Other comprehensive income | — | — | — | — | 40,579 | — | — | 40,579 | ||||||||||||||||||||||
| Dividends (per share of common stock, $0.80) | — | — | — | (22,149 | ) | — | — | — | (22,149 | ) | ||||||||||||||||||||
| Amounts reclassified to temporary equity | — | — | 1,797 | — | — | — | — | 1,797 | ||||||||||||||||||||||
| Changes due to convertible notes transactions | 624,044 | 624 | (2,582 | ) | — | — | — | — | (1,958 | ) | ||||||||||||||||||||
| Purchase of treasury shares | — | — | — | — | — | 218,235 | (11,552 | ) | (11,552 | ) | ||||||||||||||||||||
| Employee stock plans | 265,886 | 266 | 9,074 | — | — | 39,647 | (1,970 | ) | 7,370 | |||||||||||||||||||||
| Share-based compensation expense | 89,040 | 89 | 5,881 | — | — | 13,729 | (14 | ) | 5,956 | |||||||||||||||||||||
| Balance at December 31, 2017 | 29,141,467 | $ | 29,141 | $ | 185,332 | $ | 587,877 | $ | (115,814 | ) | 1,325,975 | $ | (50,880 | ) | $ | 635,656 | ||||||||||||||
| Net earnings | — | — | — | 54,169 | — | — | — | 54,169 | ||||||||||||||||||||||
| Impact of change in revenue accounting standard | — | — | — | (9,584 | ) | — | — | — | (9,584 | ) | ||||||||||||||||||||
| Other comprehensive income | — | — | — | — | (19,084 | ) | — | — | (19,084 | ) | ||||||||||||||||||||
| Dividends (per share of common stock, $0.80) | — | — | — | (22,359 | ) | — | — | — | (22,359 | ) | ||||||||||||||||||||
| Changes due to convertible notes transactions | 114,778 | 115 | (123 | ) | — | — | — | — | (8 | ) | ||||||||||||||||||||
| Purchase of treasury shares | — | — | — | — | — | 313,330 | (19,489 | ) | (19,489 | ) | ||||||||||||||||||||
| Employee stock plans | 226,722 | 227 | 8,813 | — | — | 25,069 | (1,689 | ) | 7,351 | |||||||||||||||||||||
| Share-based compensation expense | 61,747 | 62 | 6,452 | — | — | 8,543 | (9 | ) | 6,505 | |||||||||||||||||||||
| Balance at December 31, 2018 | 29,544,714 | $ | 29,545 | $ | 200,474 | $ | 610,103 | $ | (134,898 | ) | 1,672,917 | $ | (72,067 | ) | $ | 633,157 | ||||||||||||||
| Net earnings | — | — | — | 209,829 | — | — | — | 209,829 | ||||||||||||||||||||||
| Other comprehensive income | — | — | — | — | 7,099 | — | — | 7,099 | ||||||||||||||||||||||
| Reclassification of stranded tax effects resulting from Tax Reform | — | — | — | 23,094 | (23,094 | ) | — | — | — | |||||||||||||||||||||
| Dividends (per share of common stock, $0.80) | — | — | — | (22,360 | ) | — | — | — | (22,360 | ) | ||||||||||||||||||||
| Changes due to convertible notes transactions | — | — | (18 | ) | — | — | — | — | (18 | ) | ||||||||||||||||||||
| Purchase of treasury shares | — | — | — | — | — | 522,622 | (31,785 | ) | (31,785 | ) | ||||||||||||||||||||
| Employee stock plans | 449,937 | 449 | 20,151 | — | — | 17,609 | (924 | ) | 19,676 | |||||||||||||||||||||
| Share-based compensation expense | 63,804 | 64 | 7,546 | — | — | 6,184 | (6 | ) | 7,604 | |||||||||||||||||||||
| Balance at December 31, 2019 | 30,058,455 | $ | 30,058 | $ | 228,153 | $ | 820,666 | $ | (150,893 | ) | 2,219,332 | $ | (104,782 | ) | $ | 823,202 | ||||||||||||||
| Common Stock | Additional Paid-In | Retained | Accumulated Other Comprehensive | Treasury Stock | Total Shareholders' | |||||||||||||||||||||||||||||||||||||||||||||
| Shares | $ | Capital | Earnings | Income (Loss) | Shares | $ | Equity | |||||||||||||||||||||||||||||||||||||||||||
| Balance at December 31, 2018 | 29,544,714 | $ | 29,545 | $ | 200,474 | $ | 610,103 | $ | (134,898) | 1,672,917 | $ | (72,067) | $ | 633,157 | ||||||||||||||||||||||||||||||||||||
| Net earnings | — | — | — | 209,829 | — | — | — | 209,829 | ||||||||||||||||||||||||||||||||||||||||||
| Other comprehensive income | — | — | — | — | 7,099 | — | — | 7,099 | ||||||||||||||||||||||||||||||||||||||||||
| Reclassification of stranded tax effects resulting from Tax Reform | — | — | — | 23,094 | (23,094) | — | — | — | ||||||||||||||||||||||||||||||||||||||||||
| Dividends (per share of common stock, $0.80) | — | — | — | (22,360) | — | — | — | (22,360) | ||||||||||||||||||||||||||||||||||||||||||
| Changes due to convertible notes transactions | — | — | (18) | — | — | — | — | (18) | ||||||||||||||||||||||||||||||||||||||||||
| Purchase of treasury shares | — | — | — | — | — | 522,622 | (31,785) | (31,785) | ||||||||||||||||||||||||||||||||||||||||||
| Employee stock plans | 449,937 | 449 | 20,151 | — | — | 17,609 | (924) | 19,676 | ||||||||||||||||||||||||||||||||||||||||||
| Share-based compensation expense | 63,804 | 64 | 7,546 | — | — | 6,184 | (6) | 7,604 | ||||||||||||||||||||||||||||||||||||||||||
| Balance at December 31, 2019 | 30,058,455 | $ | 30,058 | $ | 228,153 | $ | 820,666 | $ | (150,893) | 2,219,332 | $ | (104,782) | $ | 823,202 | ||||||||||||||||||||||||||||||||||||
| Net loss | — | — | — | (69,742) | — | — | — | (69,742) | ||||||||||||||||||||||||||||||||||||||||||
| Other comprehensive income | — | — | — | — | 20,072 | — | — | 20,072 | ||||||||||||||||||||||||||||||||||||||||||
| Dividends (per share of common stock, $0.80) | — | — | — | (22,160) | — | — | — | (22,160) | ||||||||||||||||||||||||||||||||||||||||||
| Purchase of treasury shares | — | — | — | — | — | 302,778 | (14,209) | (14,209) | ||||||||||||||||||||||||||||||||||||||||||
| Employee stock plans | 164,149 | 164 | 5,752 | — | — | 32,150 | (1,620) | 4,296 | ||||||||||||||||||||||||||||||||||||||||||
| Share-based compensation expense | 56,064 | 57 | 4,924 | — | — | 1,525 | (2) | 4,979 | ||||||||||||||||||||||||||||||||||||||||||
| Balance at December 31, 2020 | 30,278,668 | $ | 30,279 | $ | 238,829 | $ | 728,764 | $ | (130,821) | 2,555,785 | $ | (120,613) | $ | 746,438 | ||||||||||||||||||||||||||||||||||||
| Net earnings | — | — | — | 43,676 | — | — | — | 43,676 | ||||||||||||||||||||||||||||||||||||||||||
| Other comprehensive income | — | — | — | — | 19,436 | — | — | 19,436 | ||||||||||||||||||||||||||||||||||||||||||
| Dividends (per share of common stock, $0.80) | — | — | — | (22,269) | — | — | — | (22,269) | ||||||||||||||||||||||||||||||||||||||||||
| Impact of change in tax accounting standard | — | — | — | 274 | — | — | — | 274 | ||||||||||||||||||||||||||||||||||||||||||
| Purchase of treasury shares | — | — | — | — | — | 12,992 | (618) | (618) | ||||||||||||||||||||||||||||||||||||||||||
| Employee stock plans | 71,945 | 72 | 2,716 | — | — | 1,416 | (83) | 2,705 | ||||||||||||||||||||||||||||||||||||||||||
| Share-based compensation expense | 83,656 | 83 | 6,608 | — | — | 3,703 | (4) | 6,687 | ||||||||||||||||||||||||||||||||||||||||||
| Balance at December 31, 2021 | 30,434,269 | $ | 30,434 | $ | 248,153 | $ | 750,445 | $ | (111,385) | 2,573,896 | $ | (121,318) | $ | 796,329 | ||||||||||||||||||||||||||||||||||||
CONSOLIDATED STATEMENTS OF CASH FLOWS KAMAN CORPORATION AND SUBSIDIARIES (In thousands) | ||||||||||||
| For the Year Ended December 31, | ||||||||||||
| 2019 | 2018 | 2017 | ||||||||||
| Cash flows from operating activities: | ||||||||||||
| Net earnings | $ | 209,829 | $ | 54,169 | $ | 49,826 | ||||||
| Less: Total earnings from discontinued operations, net of tax | 153,383 | 38,292 | 30,118 | |||||||||
| Earnings from continuing operations, net of tax | 56,446 | 15,877 | 19,708 | |||||||||
| Adjustments to reconcile earnings from continuing operations, net of tax to net cash provided by operating activities: | ||||||||||||
| Depreciation and amortization | 25,854 | 27,875 | 27,388 | |||||||||
| Amortization of debt issuance costs | 1,996 | 1,806 | 2,014 | |||||||||
| Accretion of convertible notes discount | 2,760 | 2,596 | 3,410 | |||||||||
| Provision for doubtful accounts | 788 | 767 | 746 | |||||||||
| Loss on sale of business | 3,971 | 5,722 | — | |||||||||
| Net loss (gain) on sale of assets | 237 | (1,031 | ) | (31 | ) | |||||||
| Other intangible assets impairment | — | 10,039 | — | |||||||||
| Loss on debt extinguishment | — | — | 137 | |||||||||
| Net loss (gain) on derivative instruments | 302 | 829 | (1,126 | ) | ||||||||
| Stock compensation expense | 4,669 | 5,484 | 4,902 | |||||||||
| Non-cash consideration received for aircraft sale | (3,100 | ) | — | — | ||||||||
| Deferred income taxes | 182 | 7,834 | 27,718 | |||||||||
| Changes in assets and liabilities, excluding effects of acquisitions/divestitures: | ||||||||||||
| Accounts receivable | (8,173 | ) | (6,020 | ) | (69,431 | ) | ||||||
| Contract assets | (21,994 | ) | (24,294 | ) | — | |||||||
| Contract costs | 4,506 | (5,834 | ) | — | ||||||||
| Inventories | (25,129 | ) | 7,135 | 22,363 | ||||||||
| Income tax refunds receivable | (6,296 | ) | 1,136 | 3,180 | ||||||||
| Operating right-of-use assets | 3,390 | — | — | |||||||||
| Other assets | (6,108 | ) | (2,944 | ) | 3,458 | |||||||
| Accounts payable - trade | 14,034 | 10,807 | 7,432 | |||||||||
| Contract liabilities | (26,638 | ) | 96,430 | — | ||||||||
| Advances on contracts | — | — | (4,829 | ) | ||||||||
| Operating lease liabilities | (3,423 | ) | — | — | ||||||||
| Other current liabilities | 6,085 | (374 | ) | 2,967 | ||||||||
| Income taxes payable | 7,888 | (2,393 | ) | 212 | ||||||||
| Pension liabilities | 4,170 | (38,179 | ) | (11,318 | ) | |||||||
| Other long-term liabilities | 6,071 | 5,446 | (628 | ) | ||||||||
| Net cash provided by operating activities from continuing operations | 42,488 | 118,714 | 38,272 | |||||||||
| Net cash (used in) provided by operating activities of discontinued operations | (50,288 | ) | 43,654 | 41,613 | ||||||||
| Net cash (used in) provided by operating activities | (7,800 | ) | 162,368 | 79,885 | ||||||||
| Cash flows from investing activities: | ||||||||||||
| Proceeds from sale of assets | 196 | 2,138 | 191 | |||||||||
| Proceeds from sale of discontinued operations | 655,030 | — | — | |||||||||
| Expenditures for property, plant & equipment | (22,447 | ) | (21,504 | ) | (18,010 | ) | ||||||
| Acquisition of businesses including earn out adjustments, net of cash acquired | — | — | (1,365 | ) | ||||||||
| Other, net | (4,463 | ) | (3,172 | ) | (3,656 | ) | ||||||
| Net cash provided by (used in) investing activities of continuing operations | 628,316 | (22,538 | ) | (22,840 | ) | |||||||
| Net cash used in investing activities of discontinued operations | (9,838 | ) | (7,423 | ) | (8,995 | ) | ||||||
| Net cash provided by (used in) investing activities | 618,478 | (29,961 | ) | (31,835 | ) | |||||||
| Cash flows from financing activities: | ||||||||||||
| Net repayments under revolving credit agreements | (38,500 | ) | (98,087 | ) | (75,988 | ) | ||||||
| Debt repayment | (76,875 | ) | (7,500 | ) | (6,875 | ) | ||||||
| Proceeds from issuance of 2024 convertible notes | — | — | 200,000 | |||||||||
| Repayment of convertible notes | (500 | ) | — | (175,151 | ) | |||||||
| Purchase of capped call - 2024 convertible notes | — | — | (20,500 | ) | ||||||||
| Proceeds from bond hedge settlement - 2017 convertible notes | — | — | 58,564 | |||||||||
| Net change in bank overdraft | 886 | (279 | ) | (37 | ) | |||||||
| Proceeds from exercise of employee stock awards | 19,676 | 7,351 | 7,370 | |||||||||
| Purchase of treasury shares | (30,060 | ) | (19,278 | ) | (11,552 | ) | ||||||
| Dividends paid | (22,343 | ) | (22,349 | ) | (21,462 | ) | ||||||
| Debt and equity issuance costs | (3,584 | ) | — | (7,473 | ) | |||||||
| Other | (1,413 | ) | (1,003 | ) | (523 | ) | ||||||
| Net cash used in financing activities of continuing operations | (152,713 | ) | (141,145 | ) | (53,627 | ) | ||||||
| Net cash provided by (used in) financing activities of discontinued operations | 7,967 | (217 | ) | (1,109 | ) | |||||||
| Net cash used in financing activities | (144,746 | ) | (141,362 | ) | (54,736 | ) | ||||||
| Net increase (decrease) in cash and cash equivalents | 465,932 | (8,955 | ) | (6,686 | ) | |||||||
| Cash and cash equivalents of discontinued operations | (21,834 | ) | (1,816 | ) | (1,667 | ) | ||||||
| Effect of exchange rate changes on cash and cash equivalents | (269 | ) | (238 | ) | 2,385 | |||||||
| Cash and cash equivalents at beginning of period | 27,711 | 36,904 | 41,205 | |||||||||
| Cash and cash equivalents at end of period | $ | 471,540 | $ | 25,895 | $ | 35,237 | ||||||
| For the Year Ended December 31, | ||||||||||||||||||||
| 2021 | 2020 | 2019 | ||||||||||||||||||
| Cash flows from operating activities: | ||||||||||||||||||||
| Net earnings (loss) | $ | 43,676 | $ | (69,742) | $ | 209,829 | ||||||||||||||
| Less: Total earnings from discontinued operations, net of tax | — | 692 | 153,383 | |||||||||||||||||
| Earnings (loss) from continuing operations, net of tax | 43,676 | (70,434) | 56,446 | |||||||||||||||||
| Adjustments to reconcile earnings from continuing operations, net of tax to net cash provided by operating activities: | ||||||||||||||||||||
| Depreciation and amortization | 36,654 | 43,899 | 25,854 | |||||||||||||||||
| Amortization of debt issuance costs | 1,836 | 1,746 | 1,996 | |||||||||||||||||
| Accretion of convertible notes discount | 2,957 | 2,860 | 2,760 | |||||||||||||||||
| Provision for doubtful accounts | 575 | 1,381 | 788 | |||||||||||||||||
| Impairment on assets held for sale | — | 36,285 | — | |||||||||||||||||
| Loss (gain) on sale of business | 234 | (493) | 3,971 | |||||||||||||||||
| Net (gain) loss on sale of assets | (8) | 200 | 237 | |||||||||||||||||
| Goodwill and other intangible assets impairment | — | 50,307 | — | |||||||||||||||||
| Net loss (gain) on derivative instruments | 1,025 | (466) | 302 | |||||||||||||||||
| Stock compensation expense | 6,687 | 4,979 | 4,669 | |||||||||||||||||
| Non-cash consideration received for aircraft sale | — | — | (3,100) | |||||||||||||||||
| Deferred income taxes | 20,998 | (6,055) | 182 | |||||||||||||||||
| Changes in assets and liabilities, excluding effects of acquisitions/divestitures: | ||||||||||||||||||||
| Accounts receivable | 78,367 | 7,042 | (8,173) | |||||||||||||||||
| Contract assets | (3,482) | 12,629 | (21,994) | |||||||||||||||||
| Contract costs | 725 | 294 | 4,506 | |||||||||||||||||
| Inventories | (10,357) | (18,485) | (25,129) | |||||||||||||||||
| Income tax refunds receivable | (8,565) | 2,763 | (6,296) | |||||||||||||||||
| Operating right-of-use assets | 1,798 | 1,513 | 3,390 | |||||||||||||||||
| Other assets | 3,450 | 2,490 | (6,108) | |||||||||||||||||
| Accounts payable - trade | (18,398) | (9,227) | 14,034 | |||||||||||||||||
| Contract liabilities | (30,708) | (29,555) | (26,638) | |||||||||||||||||
| Operating lease liabilities | (1,918) | (1,560) | (3,423) | |||||||||||||||||
| Acquired retention plan payments | (25,108) | — | — | |||||||||||||||||
| Other current liabilities | (8,880) | 16,955 | 6,085 | |||||||||||||||||
| Income taxes payable | 295 | (4,885) | 7,888 | |||||||||||||||||
| Pension liabilities | (37,580) | (21,550) | 4,170 | |||||||||||||||||
| Other long-term liabilities | (5,575) | (6,164) | 6,071 | |||||||||||||||||
| Net cash provided by operating activities from continuing operations | 48,698 | 16,469 | 42,488 | |||||||||||||||||
| Net cash used in operating activities of discontinued operations | — | — | (50,288) | |||||||||||||||||
| Net cash provided by (used in) operating activities | 48,698 | 16,469 | (7,800) | |||||||||||||||||
CONSOLIDATED STATEMENTS OF CASH FLOWS (CONTINUED) KAMAN CORPORATION AND SUBSIDIARIES (In thousands) | ||||||||||||||||||||
| For the Year Ended December 31, | ||||||||||||||||||||
| 2021 | 2020 | 2019 | ||||||||||||||||||
| Cash flows from investing activities: | ||||||||||||||||||||
| Proceeds from sale of discontinued operations | — | 5,223 | 655,030 | |||||||||||||||||
| Proceeds from sale of business, net of cash on hand | (3,428) | 493 | — | |||||||||||||||||
| Expenditures for property, plant & equipment | (17,530) | (17,783) | (22,447) | |||||||||||||||||
| Acquisition of businesses including earn out adjustments, net of cash acquired | — | (304,661) | — | |||||||||||||||||
| Other, net | (154) | (1,994) | (4,267) | |||||||||||||||||
| Net cash (used in) provided by investing activities of continuing operations | (21,112) | (318,722) | 628,316 | |||||||||||||||||
| Net cash used in investing activities of discontinued operations | — | — | (9,838) | |||||||||||||||||
| Net cash (used in) provided by investing activities | (21,112) | (318,722) | 618,478 | |||||||||||||||||
| Cash flows from financing activities: | ||||||||||||||||||||
| Net repayments under revolving credit agreements | — | — | (38,500) | |||||||||||||||||
| Debt repayment | — | — | (76,875) | |||||||||||||||||
| Repayment of convertible notes | — | — | (500) | |||||||||||||||||
| Proceeds from exercise of employee stock awards | 2,705 | 4,296 | 19,676 | |||||||||||||||||
| Purchase of treasury shares | (618) | (14,210) | (30,060) | |||||||||||||||||
| Dividends paid | (22,241) | (22,210) | (22,343) | |||||||||||||||||
| Debt and equity issuance costs | — | — | (3,584) | |||||||||||||||||
| Other | (2,079) | (1,411) | (527) | |||||||||||||||||
| Net cash used in financing activities of continuing operations | (22,233) | (33,535) | (152,713) | |||||||||||||||||
| Net cash provided by financing activities of discontinued operations | — | — | 7,967 | |||||||||||||||||
| Net cash used in financing activities | (22,233) | (33,535) | (144,746) | |||||||||||||||||
| Net increase (decrease) in cash and cash equivalents | 5,353 | (335,788) | 465,932 | |||||||||||||||||
| Cash and cash equivalents of discontinued operations and liabilities held for sale | — | — | (21,834) | |||||||||||||||||
| Effect of exchange rate changes on cash and cash equivalents | (642) | 337 | (269) | |||||||||||||||||
| Cash and cash equivalents and restricted cash at beginning of period | 136,089 | 471,540 | 27,711 | |||||||||||||||||
| Cash and cash equivalents and restricted cash at end of period (See Note 2) | $ | 140,800 | $ | 136,089 | $ | 471,540 | ||||||||||||||
| For the year ended December 31, 2018 | ||||||||||||
| As reported | Adjustments | Balances without adoption of ASC 606 | ||||||||||
| In thousands | ||||||||||||
| Net sales | $ | 735,994 | $ | (59,683 | ) | $ | 676,311 | |||||
| Cost of sales | 508,677 | (42,036 | ) | 466,641 | ||||||||
| Gross profit | 227,317 | (17,647 | ) | 209,670 | ||||||||
| Selling, general and administrative expenses | 172,271 | (2,281 | ) | 169,990 | ||||||||
| Other intangibles asset impairment (Note 12) | 10,039 | — | 10,039 | |||||||||
| Restructuring costs (Note 5) | 7,353 | — | 7,353 | |||||||||
| Loss on sale of business (Note 5) | 5,722 | 539 | 6,261 | |||||||||
| Net gain on sale of assets | (1,031 | ) | — | (1,031 | ) | |||||||
| Operating income | 32,963 | (15,905 | ) | 17,058 | ||||||||
| Interest expense, net | 20,046 | — | 20,046 | |||||||||
| Non-service pension and post retirement benefit income | (12,127 | ) | — | (12,127 | ) | |||||||
| Other income, net | (92 | ) | — | (92 | ) | |||||||
| Earnings from continuing operations before income taxes | 25,136 | (15,905 | ) | 9,231 | ||||||||
| Income tax expense | 9,259 | (2,486 | ) | 6,773 | ||||||||
| Earnings from continuing operations, net of tax | $ | 15,877 | $ | (13,419 | ) | $ | 2,458 | |||||
| December 31, 2018 | ||||
| In thousands | ||||
| Assets | ||||
| Cash and cash equivalents | $ | 1,816 | ||
| Accounts receivable, net | 151,756 | |||
| Contract assets | 9,600 | |||
| Inventories | 163,343 | |||
| Other current assets | 24,746 | |||
| Total assets held for sale, current portion | 351,261 | |||
| Property, plant and equipment, net of accumulated depreciation of $70,021 | 47,112 | |||
| Goodwill | 149,204 | |||
| Other intangible assets, net | 32,440 | |||
| Deferred income taxes | 146 | |||
| Other assets | 336 | |||
| Total assets held for sale | $ | 580,499 | ||
| Liabilities | ||||
| Accounts payable – trade | $ | 101,801 | ||
| Accrued salaries and wages | 13,839 | |||
| Other current liabilities | 15,407 | |||
| Total liabilities held for sale, current portion | 131,047 | |||
| Deferred income taxes | 13,630 | |||
| Other long-term liabilities | 1,972 | |||
| Total liabilities held for sale | $ | 146,649 | ||
| For the Year Ended December 31, | ||||||||||||
| 2019 | 2018 | 2017 | ||||||||||
| In thousands | ||||||||||||
| Net sales from discontinued operations | $ | 748,451 | $ | 1,139,431 | $ | 1,080,965 | ||||||
| Cost of sales from discontinued operations | 536,749 | 816,711 | 769,403 | |||||||||
| Gross profit from discontinued operations | 211,702 | 322,720 | 311,562 | |||||||||
| Selling, general and administrative expenses from discontinued operations | 177,475 | 272,633 | 262,384 | |||||||||
| Restructuring costs from discontinued operations | — | 655 | — | |||||||||
| Net loss (gain) on sale of assets from discontinued operations | 8 | (669 | ) | (225 | ) | |||||||
| Operating income from discontinued operations | 34,219 | 50,101 | 49,403 | |||||||||
| Interest expense, net from discontinued operations | 25 | 51 | 3 | |||||||||
| Other income, net from discontinued operations | (12 | ) | (51 | ) | (56 | ) | ||||||
| Earnings from discontinued operations before income taxes | 34,206 | 50,101 | 49,456 | |||||||||
| Income tax expense | 5,179 | 11,809 | 19,338 | |||||||||
| Earnings from discontinued operations before gain on disposal | 29,027 | 38,292 | 30,118 | |||||||||
| Gain on disposal of discontinued operations, pretax | 167,757 | — | — | |||||||||
| Income tax expense on gain on disposal | 43,401 | — | — | |||||||||
| Gain on disposal of discontinued operations, net of tax | 124,356 | — | — | |||||||||
| Earnings from discontinued operations, net of tax | $ | 153,383 | $ | 38,292 | $ | 30,118 | ||||||
Net proceeds received from sale of Distribution(1) | $ | 659,009 | ||
| Distribution assets | ||||
| Cash and cash equivalents | $ | 21,834 | ||
| Accounts receivable, net | 150,317 | |||
| Contract assets | 9,128 | |||
| Inventories | 163,995 | |||
| Other current assets | 20,289 | |||
| Property plant and equipment, net of accumulated depreciation of $73,795 | 51,039 | |||
| Operating right-of-use assets, net | 68,049 | |||
| Goodwill | 149,204 | |||
| Other intangible assets, net | 28,361 | |||
| Deferred income taxes | 133 | |||
| Other assets | 195 | |||
| Total Distribution assets | $ | 662,544 | ||
| Distribution liabilities | ||||
| Accounts payable - trade | $ | 67,975 | ||
| Accrued salaries and wages | 12,916 | |||
| Operating lease liabilities, current portion | 19,981 | |||
| Other current liabilities | 22,024 | |||
| Deferred income taxes | 78 | |||
| Operating lease liabilities, noncurrent portion | 48,130 | |||
| Other long-term liabilities | 188 | |||
| Total Distribution liabilities | $ | 171,292 | ||
| Gain on sale of Distribution before income taxes | $ | 167,757 | ||
| For the year ended December 31, | ||||||||||||
| 2019 | 2018 | 2017 | ||||||||||
| In thousands | ||||||||||||
| Military and Defense, excluding safe and arm devices | $ | 178,289 | $ | 190,264 | $ | 201,760 | ||||||
| Safe and Arm Devices | 227,846 | 195,751 | 184,640 | |||||||||
| Commercial Aerospace and Other | 355,473 | 349,979 | 338,544 | |||||||||
Total revenue(1)(2)(3) | $ | 761,608 | $ | 735,994 | $ | 724,944 | ||||||
| For the year ended December 31, | |||||||||
| 2019 | 2018 | 2017 | |||||||
| In thousands | |||||||||
| Original Equipment Manufacturer | 58 | % | 56 | % | 57 | % | |||
| Aftermarket | 12 | % | 17 | % | 18 | % | |||
| Safe and Arm Devices | 30 | % | 27 | % | 25 | % | |||
| Total revenue | 100 | % | 100 | % | 100 | % | |||
| 2019 | 2018 | |||||
| Revenue recognized for performance obligations satisfied: | ||||||
| Over time | 39 | % | 48 | % | ||
| Point-in-time | 61 | % | 52 | % | ||
| Total revenue | 100 | % | 100 | % | ||
| For the year ended December 31, | ||||||||||||
| 2019 | 2018 | 2017 | ||||||||||
| In thousands | ||||||||||||
| North America | $ | 438,638 | $ | 485,856 | $ | 437,326 | ||||||
| Europe | 164,921 | 167,176 | 168,236 | |||||||||
| Middle East | 114,110 | 51,565 | 81,197 | |||||||||
| Asia | 19,326 | 16,998 | 24,614 | |||||||||
| Oceania | 14,598 | 8,739 | 10,837 | |||||||||
| Other | 10,015 | 5,660 | 2,734 | |||||||||
| Total revenue | $ | 761,608 | $ | 735,994 | $ | 724,944 | ||||||
| At December 31, | ||||||||
| 2019 | 2018 | |||||||
| In thousands | ||||||||
United States(1) | $ | 249,935 | $ | 463,114 | ||||
| Germany | 157,504 | 160,257 | ||||||
| United Kingdom | 32,834 | 32,378 | ||||||
| Czech Republic | 5,753 | 6,077 | ||||||
| Mexico | 1,189 | 1,091 | ||||||
Total long-lived assets(2) | $ | 447,215 | $ | 662,917 | ||||
| Severance | Other (1) | Total | ||||||||||
| In thousands | ||||||||||||
| Restructuring accrual balance at December 31, 2018 | $ | 1,022 | $ | 558 | $ | 1,580 | ||||||
| Provision | (15 | ) | 198 | 183 | ||||||||
| Cash payments | (999 | ) | (380 | ) | (1,379 | ) | ||||||
| Changes in foreign currency exchange rates | (8 | ) | 1 | (7 | ) | |||||||
| Restructuring accrual balance at December 31, 2019 | $ | — | $ | 377 | $ | 377 | ||||||
| At December 31, | ||||||||
| 2019 | 2018 | |||||||
| In thousands | ||||||||
| Trade receivables | $ | 13,794 | $ | 11,380 | ||||
| U.S. Government contracts: | ||||||||
| Billed | 15,136 | 38,173 | ||||||
| Costs and accrued profit – not billed | 894 | 780 | ||||||
| Commercial and other government contracts: | ||||||||
| Billed | 120,427 | 100,603 | ||||||
| Costs and accrued profit – not billed | 7,487 | 900 | ||||||
| Less allowance for doubtful accounts | (1,246 | ) | (2,498 | ) | ||||
Accounts receivable, net(1) | $ | 156,492 | $ | 149,338 | ||||
| At December 31, | ||||||||
| 2019 | 2018 | |||||||
| In thousands | ||||||||
| Contract changes, negotiated settlements and claims for unanticipated contract costs | $ | 900 | $ | 900 | ||||
| Total | $ | 900 | $ | 900 | ||||
| December 31, 2019 | December 31, 2018 | $ Change | % Change | ||||||||||||
| In thousands | |||||||||||||||
Contract assets(1)(2) | $ | 121,614 | $ | 99,261 | $ | 22,353 | 22.5 | % | |||||||
| Contract costs, current portion | $ | 6,052 | $ | 5,993 | $ | 59 | 1.0 | % | |||||||
| Contract costs, noncurrent portion | $ | 6,099 | $ | 10,666 | $ | (4,567 | ) | (42.8 | )% | ||||||
Contract liabilities, current portion(2) | $ | 42,942 | $ | 28,865 | $ | 14,077 | 48.8 | % | |||||||
Contract liabilities, noncurrent portion(2) | $ | 37,855 | $ | 78,562 | $ | (40,707 | ) | (51.8 | )% | ||||||
| Estimated fair value | $ | 3,600 | ||||||
| Assets, including cash on hand | 23,460 | |||||||
| Liabilities | 6,618 | |||||||
| Net book value of business | 16,842 | |||||||
| UK cumulative foreign currency translation adjustment balance | 22,835 | |||||||
| Transaction costs | 442 | |||||||
| Loss on the sale of the UK Composites business | $ | 36,519 | ||||||
| For the Year Ended December 31, | ||||||||||||||||||||
| 2021 | 2020 | 2019 | ||||||||||||||||||
| In thousands | ||||||||||||||||||||
| Net sales from discontinued operations | $ | — | $ | — | $ | 748,451 | ||||||||||||||
| Cost of sales from discontinued operations | — | — | 536,749 | |||||||||||||||||
| Gross profit from discontinued operations | — | — | 211,702 | |||||||||||||||||
| Selling, general and administrative expenses from discontinued operations | — | — | 177,475 | |||||||||||||||||
| Net loss on sale of assets from discontinued operations | — | — | 8 | |||||||||||||||||
| Operating income from discontinued operations | — | — | 34,219 | |||||||||||||||||
| Interest expense, net from discontinued operations | — | — | 25 | |||||||||||||||||
| Other income, net from discontinued operations | — | — | (12) | |||||||||||||||||
| Earnings from discontinued operations before income taxes | — | — | 34,206 | |||||||||||||||||
| Income tax expense | — | — | 5,179 | |||||||||||||||||
| Earnings from discontinued operations before gain on disposal | — | — | 29,027 | |||||||||||||||||
| Gain on disposal of discontinued operations, pretax | — | 925 | 167,757 | |||||||||||||||||
| Income tax expense on gain on disposal | — | 233 | 43,401 | |||||||||||||||||
| Gain on disposal of discontinued operations, net of tax | — | 692 | 124,356 | |||||||||||||||||
| Earnings from discontinued operations, net of tax | $ | — | $ | 692 | $ | 153,383 | ||||||||||||||
Net proceeds received from sale of Distribution(1) | $ | 659,934 | ||||||
| Distribution assets | ||||||||
| Cash and cash equivalents | $ | 21,834 | ||||||
| Accounts receivable, net | 150,317 | |||||||
| Contract assets | 9,128 | |||||||
| Inventories | 163,995 | |||||||
| Other current assets | 20,289�� | |||||||
| Property plant and equipment, net of accumulated depreciation of $73,795 | 51,039 | |||||||
| Operating right-of-use assets, net | 68,049 | |||||||
| Goodwill | 149,204 | |||||||
| Other intangible assets, net | 28,361 | |||||||
| Deferred income taxes | 133 | |||||||
| Other assets | 195 | |||||||
| Total Distribution assets | $ | 662,544 | ||||||
| Distribution liabilities | ||||||||
| Accounts payable - trade | $ | 67,975 | ||||||
| Accrued salaries and wages | 12,916 | |||||||
| Operating lease liabilities, current portion | 19,981 | |||||||
| Other current liabilities | 22,024 | |||||||
| Deferred income taxes | 78 | |||||||
| Operating lease liabilities, noncurrent portion | 48,130 | |||||||
| Other long-term liabilities | 188 | |||||||
| Total Distribution liabilities | $ | 171,292 | ||||||
| Gain on sale of Distribution before income taxes | $ | 168,682 | ||||||
| Cash | $ | 10,953 | ||||||
| Restricted cash | 1,932 | |||||||
| Accounts receivable | 9,525 | |||||||
| Contract assets | 784 | |||||||
| Inventories | 13,500 | |||||||
| Property, plant and equipment | 81,997 | |||||||
| Operating right-of-use asset | 653 | |||||||
| Other tangible assets | 2,492 | |||||||
| Goodwill | 95,089 | |||||||
| Other intangible assets | 110,300 | |||||||
| Liabilities | (9,679) | |||||||
| Net assets acquired | 317,546 | |||||||
| Less cash received | (12,885) | |||||||
| Net consideration | $ | 304,661 | ||||||
| For the year ended December 31, | ||||||||||||||
| 2020 | 2019 | |||||||||||||
| In thousands | ||||||||||||||
| Net sales | $ | 784,459 | $ | 853,192 | ||||||||||
| (Loss) earnings from continuing operations | $ | (35,681) | $ | 27,126 | ||||||||||
| Net (loss) earnings | $ | (34,989) | $ | 180,509 | ||||||||||
| For the year ended December 31, | ||||||||||||||||||||
| 2021 | 2020 | 2019 | ||||||||||||||||||
| In thousands | ||||||||||||||||||||
| Net sales: | ||||||||||||||||||||
| Engineered Products | $ | 317,683 | $ | 315,063 | $ | 270,335 | ||||||||||||||
| Precision Products | 256,329 | 302,509 | 307,312 | |||||||||||||||||
| Structures | 134,981 | 166,887 | 183,961 | |||||||||||||||||
Net sales(1)(2) | $ | 708,993 | $ | 784,459 | $ | 761,608 | ||||||||||||||
| Operating income (loss): | ||||||||||||||||||||
| Engineered Products | $ | 43,097 | $ | 33,561 | $ | 64,195 | ||||||||||||||
| Precision Products | 55,366 | 74,033 | 59,573 | |||||||||||||||||
| Structures | (340) | (8,858) | 1,194 | |||||||||||||||||
| Corporate expense | (40,519) | (53,059) | (61,344) | |||||||||||||||||
Other unallocated expenses, net(3) | (8,108) | (129,988) | (10,207) | |||||||||||||||||
| Operating income (loss) | $ | 49,496 | $ | (84,311) | $ | 53,411 | ||||||||||||||
| In thousands | ||||||||||||||||||||||||||
| 2021 | ||||||||||||||||||||||||||
| Engineered Products | Precision Products | Structures | Total | |||||||||||||||||||||||
| Defense | $ | 51,033 | $ | 30,062 | $ | 87,575 | $ | 168,670 | ||||||||||||||||||
| Safe and Arm Devices | — | 191,524 | — | 191,524 | ||||||||||||||||||||||
| Commercial, Business, & General Aviation | 115,576 | 28,995 | 40,115 | 184,686 | ||||||||||||||||||||||
| Medical | 79,424 | — | 7,291 | 86,715 | ||||||||||||||||||||||
| Industrial & Other | 71,650 | 5,748 | — | 77,398 | ||||||||||||||||||||||
| Total revenue | $ | 317,683 | $ | 256,329 | $ | 134,981 | $ | 708,993 | ||||||||||||||||||
| 2020 | ||||||||||||||||||||||||||
| Engineered Products | Precision Products | Structures | Total | |||||||||||||||||||||||
| Defense | $ | 55,380 | $ | 22,523 | $ | 102,497 | $ | 180,400 | ||||||||||||||||||
| Safe and Arm Devices | — | 248,482 | — | 248,482 | ||||||||||||||||||||||
| Commercial, Business, & General Aviation | 135,289 | 26,803 | 58,171 | 220,263 | ||||||||||||||||||||||
| Medical | 63,791 | — | 6,219 | 70,010 | ||||||||||||||||||||||
| Industrial & Other | 60,603 | 4,701 | — | 65,304 | ||||||||||||||||||||||
| Total revenue | $ | 315,063 | $ | 302,509 | $ | 166,887 | $ | 784,459 | ||||||||||||||||||
| 2019 | ||||||||||||||||||||||||||
| Engineered Products | Precision Products | Structures | Total | |||||||||||||||||||||||
| Defense | $ | 36,125 | $ | 36,078 | $ | 106,086 | $ | 178,289 | ||||||||||||||||||
| Safe and Arm Devices | — | 227,846 | — | 227,846 | ||||||||||||||||||||||
| Commercial, Business, & General Aviation | 173,786 | 37,541 | 69,660 | 280,987 | ||||||||||||||||||||||
| Medical | 20,437 | — | 8,215 | 28,652 | ||||||||||||||||||||||
| Industrial & Other | 39,987 | 5,847 | — | 45,834 | ||||||||||||||||||||||
| Total revenue | $ | 270,335 | $ | 307,312 | $ | 183,961 | $ | 761,608 | ||||||||||||||||||
| 2021 | ||||||||||||||||||||||||||
| Engineered Products | Precision Products | Structures | Total | |||||||||||||||||||||||
| Original Equipment Manufacturer | 35 | % | 5 | % | 19 | % | 59 | % | ||||||||||||||||||
| Aftermarket | 10 | % | 4 | % | — | % | 14 | % | ||||||||||||||||||
| Safe and Arm Devices | — | % | 27 | % | — | % | 27 | % | ||||||||||||||||||
| Total revenue | 45 | % | 36 | % | 19 | % | 100 | % | ||||||||||||||||||
| 2020 | ||||||||||||||||||||||||||
| Engineered Products | Precision Products | Structures | Total | |||||||||||||||||||||||
| Original Equipment Manufacturer | 31 | % | 4 | % | 21 | % | 56 | % | ||||||||||||||||||
| Aftermarket | 9 | % | 3 | % | — | % | 12 | % | ||||||||||||||||||
| Safe and Arm Devices | — | % | 32 | % | — | % | 32 | % | ||||||||||||||||||
| Total revenue | 40 | % | 39 | % | 21 | % | 100 | % | ||||||||||||||||||
| 2019 | ||||||||||||||||||||||||||
| Engineered Products | Precision Products | Structures | Total | |||||||||||||||||||||||
| Original Equipment Manufacturer | 25 | % | 9 | % | 24 | % | 58 | % | ||||||||||||||||||
| Aftermarket | 10 | % | 2 | % | — | % | 12 | % | ||||||||||||||||||
| Safe and Arm Devices | — | % | 30 | % | — | % | 30 | % | ||||||||||||||||||
| Total revenue | 35 | % | 41 | % | 24 | % | 100 | % | ||||||||||||||||||
| For the year ended December 31, | ||||||||||||||||||||
| 2021 | 2020 | 2019 | ||||||||||||||||||
| In thousands | ||||||||||||||||||||
| Engineered Products | $ | 8,399 | $ | 8,806 | $ | 5,504 | ||||||||||||||
| Precision Products | 7,443 | 5,211 | 5,995 | |||||||||||||||||
| Structures | 230 | 738 | 397 | |||||||||||||||||
| Total research and development costs | $ | 16,072 | $ | 14,755 | $ | 11,896 | ||||||||||||||
| For the year ended December 31, | ||||||||||||||||||||
| 2021 | 2020 | 2019 | ||||||||||||||||||
| In thousands | ||||||||||||||||||||
Identifiable assets(1): | ||||||||||||||||||||
| Engineered Products | $ | 623,899 | $ | 681,097 | $ | 359,423 | ||||||||||||||
| Precision Products | 250,146 | 315,439 | 287,192 | |||||||||||||||||
| Structures | 125,027 | 135,021 | 221,098 | |||||||||||||||||
Corporate(2) | 199,410 | 174,836 | 551,230 | |||||||||||||||||
| Total assets | $ | 1,198,482 | $ | 1,306,393 | $ | 1,418,943 | ||||||||||||||
| Capital expenditures: | ||||||||||||||||||||
| Engineered Products | $ | 9,537 | $ | 11,496 | $ | 13,668 | ||||||||||||||
| Precision Products | 3,554 | 2,545 | 3,532 | |||||||||||||||||
| Structures | 2,075 | 2,650 | 2,470 | |||||||||||||||||
| Corporate | 2,364 | 1,092 | 2,777 | |||||||||||||||||
| Total capital expenditures | $ | 17,530 | $ | 17,783 | $ | 22,447 | ||||||||||||||
Depreciation and amortization(3): | ||||||||||||||||||||
| Engineered Products | $ | 26,306 | $ | 31,574 | $ | 13,753 | ||||||||||||||
| Precision Products | 4,148 | 3,706 | 4,035 | |||||||||||||||||
| Structures | 3,462 | 5,201 | 4,909 | |||||||||||||||||
| Corporate | 2,738 | 3,418 | 3,157 | |||||||||||||||||
| Total depreciation and amortization | $ | 36,654 | $ | 43,899 | $ | 25,854 | ||||||||||||||
| For the year ended December 31, | ||||||||||||||||||||
| 2021 | 2020 | 2019 | ||||||||||||||||||
| In thousands | ||||||||||||||||||||
| North America | $ | 442,432 | $ | 412,025 | $ | 438,638 | ||||||||||||||
| Europe | 113,811 | 148,473 | 164,921 | |||||||||||||||||
| Middle East | 107,408 | 170,835 | 114,110 | |||||||||||||||||
| Asia | 27,638 | 34,424 | 19,326 | |||||||||||||||||
| Oceania | 14,160 | 11,156 | 14,598 | |||||||||||||||||
| Other | 3,544 | 7,546 | 10,015 | |||||||||||||||||
| Total revenue | $ | 708,993 | $ | 784,459 | $ | 761,608 | ||||||||||||||
| At December 31, | ||||||||||||||
| 2021 | 2020 | |||||||||||||
| In thousands | ||||||||||||||
| United States | $ | 476,546 | $ | 493,490 | ||||||||||
| Germany | 152,061 | 167,939 | ||||||||||||
| Czech Republic | 5,354 | 5,747 | ||||||||||||
| Mexico | 1,291 | 796 | ||||||||||||
| Netherlands | 593 | 339 | ||||||||||||
| Switzerland | 245 | 235 | ||||||||||||
| Hong Kong | 132 | 64 | ||||||||||||
Total long-lived assets(1) | $ | 636,222 | $ | 668,610 | ||||||||||
| 2021 | 2020 | 2019 | ||||||||||||||||||
| In thousands | ||||||||||||||||||||
| Cost reduction initiative | $ | 6,154 | $ | 3,970 | $ | 927 | ||||||||||||||
| Integration of Bal Seal acquisition | — | 524 | — | |||||||||||||||||
| Workforce reductions in response to COVID-19 | — | 3,549 | — | |||||||||||||||||
| Composites business restructuring | — | 316 | 631 | |||||||||||||||||
| Total restructuring and severance costs | $ | 6,154 | $ | 8,359 | $ | 1,558 | ||||||||||||||
| At December 31, | ||||||||||||||
| 2021 | 2020 | |||||||||||||
| In thousands | ||||||||||||||
| Trade receivables | $ | 19,228 | $ | 19,945 | ||||||||||
| U.S. Government contracts: | ||||||||||||||
| Billed | 14,748 | 18,854 | ||||||||||||
| Costs and accrued profit – not billed | 167 | 1,080 | ||||||||||||
| Commercial and other government contracts: | ||||||||||||||
| Billed | 36,787 | 111,794 | ||||||||||||
| Costs and accrued profit – not billed | 4,141 | 4,141 | ||||||||||||
| Less allowance for doubtful accounts | (1,547) | (2,008) | ||||||||||||
| Accounts receivable, net | $ | 73,524 | $ | 153,806 | ||||||||||
| In thousands | ||||||||
| Balance at December 31, 2020 | $ | (2,008) | ||||||
| Provision | (575) | |||||||
| Amounts written off | 648 | |||||||
| Recoveries | 385 | |||||||
| Changes in foreign currency exchange rates | 3 | |||||||
| Balance at December 31, 2021 | $ | (1,547) | ||||||
| At December 31, | ||||||||||||||
| 2021 | 2020 | |||||||||||||
| In thousands | ||||||||||||||
| Contract changes, negotiated settlements and claims for unanticipated contract costs | $ | 900 | $ | 900 | ||||||||||
| Total | $ | 900 | $ | 900 | ||||||||||
| December 31, 2021 | December 31, 2020 | $ Change | % Change | |||||||||||||||||||||||
| In thousands | ||||||||||||||||||||||||||
Contract assets(1) | $ | 112,354 | $ | 108,645 | $ | 3,709 | 3.4 | % | ||||||||||||||||||
| Contract costs, current portion | $ | 850 | $ | 3,511 | $ | (2,661) | (75.8) | % | ||||||||||||||||||
| Contract costs, noncurrent portion | $ | 10,249 | $ | 8,311 | $ | 1,938 | 23.3 | % | ||||||||||||||||||
| Contract liabilities, current portion | $ | 2,945 | $ | 39,073 | $ | (36,128) | (92.5) | % | ||||||||||||||||||
| Contract liabilities, noncurrent portion | $ | 16,528 | $ | 11,019 | $ | 5,509 | 50.0 | % | ||||||||||||||||||
| At December 31, | ||||||||||||||
| 2021 | 2020 | |||||||||||||
| In thousands | ||||||||||||||
| Contract changes, negotiated settlements and claims for unanticipated contract costs | $ | 682 | $ | 3,178 | ||||||||||
| December 31, 2019 | December 31, 2018 | |||||||
| In thousands | ||||||||
| Contract changes, negotiated settlements and claims for unanticipated contract costs | $ | 3,745 | $ | 2,909 | ||||
| 2019 | 2018 | |||||||||||||||
| Carrying Value | Fair Value | Carrying Value | Fair Value | |||||||||||||
| In thousands | ||||||||||||||||
Debt(1) | $ | 186,060 | $ | 237,381 | $ | 299,124 | $ | 325,251 | ||||||||
| 2021 | 2020 | |||||||||||||||||||||||||
| Carrying Value | Fair Value | Carrying Value | Fair Value | |||||||||||||||||||||||
| In thousands | ||||||||||||||||||||||||||
Debt(1) | $ | 191,876 | $ | 213,222 | $ | 188,919 | $ | 230,093 | ||||||||||||||||||
| At December 31, | ||||||||||||||
| 2021 | 2020 | |||||||||||||
| In thousands | ||||||||||||||
| Raw materials | $ | 19,123 | $ | 19,502 | ||||||||||
| Contracts in process: | ||||||||||||||
| US Government | 1,985 | 5,439 | ||||||||||||
| Commercial and other government contracts | 61,637 | 59,565 | ||||||||||||
| Contracts and other work in process (including certain general stock materials) | 75,115 | 64,237 | ||||||||||||
| Finished goods | 35,240 | 36,329 | ||||||||||||
| Inventories | $ | 193,100 | $ | 185,072 | ||||||||||
| At December 31, | ||||||||
| 2019 | 2018 | |||||||
| In thousands | ||||||||
| Raw materials | $ | 15,012 | $ | 15,939 | ||||
| Contracts in process: | ||||||||
| US Government | 6,217 | 6,030 | ||||||
| Commercial and other government contracts | 74,035 | 49,471 | ||||||
| Contracts and other work in process (including certain general stock materials) | 36,130 | 41,166 | ||||||
| Finished goods | 24,959 | 18,963 | ||||||
Inventories(1) | $ | 156,353 | $ | 131,569 | ||||
| At December 31, | ||||||||||||||
| 2021 | 2020 | |||||||||||||
| In thousands | ||||||||||||||
| Land | $ | 36,367 | $ | 36,683 | ||||||||||
| Buildings | 135,887 | 134,995 | ||||||||||||
| Leasehold improvements | 16,151 | 15,590 | ||||||||||||
| Machinery, office furniture and equipment | 249,527 | 241,027 | ||||||||||||
| Construction in process | 11,778 | 11,541 | ||||||||||||
| Total | 449,710 | 439,836 | ||||||||||||
| Less accumulated depreciation | (251,888) | (228,984) | ||||||||||||
| Property, plant and equipment, net | $ | 197,822 | $ | 210,852 | ||||||||||
| At December 31, | ||||||||
| 2019 | 2018 | |||||||
| In thousands | ||||||||
| Land | $ | 16,319 | $ | 14,408 | ||||
| Buildings | 101,562 | 100,005 | ||||||
| Leasehold improvements | 14,904 | 14,626 | ||||||
| Machinery, office furniture and equipment | 200,466 | 188,081 | ||||||
| Construction in process | 17,748 | 12,277 | ||||||
| Total | 350,999 | 329,397 | ||||||
| Less accumulated depreciation | (210,549 | ) | (192,285 | ) | ||||
Property, plant and equipment, net(1) | $ | 140,450 | $ | 137,112 | ||||
| 2021 | ||||||||||||||||||||||||||
| Engineered Products | Precision Products | Structures | Total | |||||||||||||||||||||||
| In thousands | ||||||||||||||||||||||||||
| Gross balance at beginning of period | $ | 205,869 | $ | 41,375 | $ | 66,559 | $ | 313,803 | ||||||||||||||||||
| Accumulated impairment | — | — | (66,559) | (66,559) | ||||||||||||||||||||||
| Net balance at beginning of period | 205,869 | 41,375 | — | 247,244 | ||||||||||||||||||||||
| Additions | — | — | — | — | ||||||||||||||||||||||
| Impairments | — | — | — | — | ||||||||||||||||||||||
| Foreign currency translation | (6,563) | — | — | (6,563) | ||||||||||||||||||||||
| Net balance at end of period | $ | 199,306 | $ | 41,375 | $ | — | $ | 240,681 | ||||||||||||||||||
| Accumulated impairment at end of period | $ | — | $ | — | $ | (66,559) | $ | (66,559) | ||||||||||||||||||
| At December 31, | ||||||||
| 2019 | 2018 | |||||||
| In thousands | ||||||||
| Gross balance at beginning of period | $ | 212,413 | $ | 218,765 | ||||
| Accumulated impairment | (16,252 | ) | (16,252 | ) | ||||
| Net balance at beginning of period | 196,161 | 202,513 | ||||||
Change in goodwill due to disposals(1) | — | (447 | ) | |||||
| Foreign currency translation | (847 | ) | (5,905 | ) | ||||
Net balance at end of period(2) | $ | 195,314 | $ | 196,161 | ||||
| Accumulated impairment at end of period | $ | (16,252 | ) | $ | (16,252 | ) | ||
| 2020 | ||||||||||||||||||||||||||
| Engineered Products | Precision Products | Structures | Total | |||||||||||||||||||||||
| In thousands | ||||||||||||||||||||||||||
| Gross balance at beginning of period | $ | 102,979 | $ | 41,375 | $ | 67,212 | $ | 211,566 | ||||||||||||||||||
| Accumulated impairment | — | — | (16,252) | (16,252) | ||||||||||||||||||||||
| Net balance at beginning of period | 102,979 | 41,375 | 50,960 | 195,314 | ||||||||||||||||||||||
Additions(1) | 95,089 | — | — | 95,089 | ||||||||||||||||||||||
| Impairments | — | — | (50,307) | (50,307) | ||||||||||||||||||||||
| Foreign currency translation | 7,801 | — | (653) | 7,148 | ||||||||||||||||||||||
| Net balance at end of period | $ | 205,869 | $ | 41,375 | $ | — | $ | 247,244 | ||||||||||||||||||
| Accumulated impairment at end of period | $ | — | $ | — | $ | (66,559) | $ | (66,559) | ||||||||||||||||||
| At December 31, | At December 31, | |||||||||||||||||
| 2019 | 2018 | |||||||||||||||||
Amortization Period | Gross Amount | Accumulated Amortization | Gross Amount | Accumulated Amortization | ||||||||||||||
| In thousands | ||||||||||||||||||
| Customer lists / relationships | 6-26 years | $ | 56,789 | $ | (21,415 | ) | $ | 57,263 | $ | (18,587 | ) | |||||||
| Developed technologies | 10-20 years | 19,552 | (5,217 | ) | 19,729 | (3,998 | ) | |||||||||||
| Trademarks / trade names | 15-17 years | 5,012 | (1,368 | ) | 5,117 | (1,055 | ) | |||||||||||
| Non-compete agreements and other | 1-15 years | 2,338 | (2,321 | ) | 2,350 | (2,330 | ) | |||||||||||
| Patents | 17 years | 523 | (454 | ) | 523 | (445 | ) | |||||||||||
Total(1) | $ | 84,214 | $ | (30,775 | ) | $ | 84,982 | $ | (26,415 | ) | ||||||||
| At December 31, | At December 31, | |||||||||||||||||||||||||||||||
| 2021 | 2020 | |||||||||||||||||||||||||||||||
| Amortization Period | Gross Amount | Accumulated Amortization | Gross Amount | Accumulated Amortization | ||||||||||||||||||||||||||||
| In thousands | ||||||||||||||||||||||||||||||||
| Customer lists / relationships | 6-38 years | $ | 127,206 | $ | (35,096) | $ | 128,882 | $ | (30,094) | |||||||||||||||||||||||
| Developed technologies | 7-20 years | 45,170 | (13,591) | 45,798 | (9,665) | |||||||||||||||||||||||||||
| Trademarks / trade names | 15-40 years | 16,982 | (2,659) | 17,353 | (2,149) | |||||||||||||||||||||||||||
| Non-compete agreements and other | 1-15 years | 4,629 | (4,617) | 5,290 | (5,276) | |||||||||||||||||||||||||||
| Patents | 17 years | 523 | (473) | 523 | (464) | |||||||||||||||||||||||||||
| Total | $ | 194,510 | $ | (56,436) | $ | 197,846 | $ | (47,648) | ||||||||||||||||||||||||
| In thousands | |||||
| 2022 | $ | 9,963 | |||
| 2023 | $ | 9,681 | |||
| 2024 | $ | 9,329 | |||
| 2025 | $ | 9,271 | |||
| 2026 | $ | 8,858 | |||
| In thousands | |||
| 2020 | $ | 4,559 | |
| 2021 | $ | 4,524 | |
| 2022 | $ | 4,137 | |
| 2023 | $ | 4,118 | |
| 2024 | $ | 3,908 | |
| 2021 | 2020 | |||||||||||||
| In thousands | ||||||||||||||
| Balance at January 1 | $ | 6,049 | $ | 6,078 | ||||||||||
| Net additions to accrual | 391 | 141 | ||||||||||||
| Payments | (482) | (165) | ||||||||||||
| Changes in foreign currency exchange rates | — | (5) | ||||||||||||
| Balance at December 31 | $ | 5,958 | $ | 6,049 | ||||||||||
| 2019 | 2018 | |||||||
| In thousands | ||||||||
| Balance at January 1 | $ | 5,531 | $ | 6,057 | ||||
| Additions to accrual | 1,122 | — | ||||||
| Payments | (569 | ) | (944 | ) | ||||
| Changes in foreign currency exchange rates | (6 | ) | 418 | |||||
| Balance at December 31 | $ | 6,078 | $ | 5,531 | ||||
| In thousands | |||
| 2020 | $ | 172 | |
| 2021 | 653 | ||
| 2022 | 151 | ||
| 2023 | 184 | ||
| 2024 | 387 | ||
| Thereafter | 4,956 | ||
| Total | $ | 6,503 | |
| In thousands | |||||
| 2022 | $ | 318 | |||
| 2023 | 184 | ||||
| 2024 | 387 | ||||
| 2025 | — | ||||
| 2026 | 132 | ||||
| Thereafter | 3,760 | ||||
| Total | $ | 4,781 | |||
| At December 31, | ||||||||||||||
| 2021 | 2020 | |||||||||||||
| In thousands | ||||||||||||||
| Revolving credit agreement | $ | — | $ | — | ||||||||||
| Convertible notes | 191,876 | 188,919 | ||||||||||||
| Total | 191,876 | 188,919 | ||||||||||||
| Less current portion | — | — | ||||||||||||
| Total excluding current portion | $ | 191,876 | $ | 188,919 | ||||||||||
| At December 31, | ||||||||
| 2019 | 2018 | |||||||
| In thousands | ||||||||
| Revolving credit agreement | $ | — | $ | 38,500 | ||||
| Term loan | — | 76,875 | ||||||
| Convertible notes | 186,060 | 183,749 | ||||||
| Total | 186,060 | 299,124 | ||||||
| Less current portion | — | 9,375 | ||||||
| Total excluding current portion | $ | 186,060 | $ | 289,749 | ||||
| In thousands | |||
| 2020 | $ | — | |
| 2021 | $ | — | |
| 2022 | $ | — | |
| 2023 | $ | — | |
| 2024 | $ | 199,500 | |
| In thousands | |||||
| 2022 | $ | — | |||
| 2023 | $ | — | |||
| 2024 | $ | 199,500 | |||
| 2025 | $ | — | |||
| 2026 | $ | — | |||
| 2024 Notes | ||||
Conversion Rate per $1,000 principal amount (1) | 15.3227 | |||
Conversion Price (2) | $ | 65.2626 | ||
Contingent Conversion Price (3) | $ | 84.8413 | ||
Aggregate shares to be issued upon conversion (4) | 3,056,879 | |||
| 2024 Notes | ||||||||
Conversion Rate per $1,000 principal amount (1) | 15.3227 | |||||||
Conversion Price (2) | $ | 65.2626 | ||||||
Contingent Conversion Price (3) | $ | 84.8413 | ||||||
Aggregate shares to be issued upon conversion (4) | 3,056,879 | |||||||
| 2024 Notes | ||||||||||||||
| December 31, 2021 | December 31, 2020 | |||||||||||||
| In thousands | ||||||||||||||
| Principal amount of liability | $ | 199,500 | $ | 199,500 | ||||||||||
| Unamortized discount | 7,624 | 10,581 | ||||||||||||
| Carrying value of liability | $ | 191,876 | $ | 188,919 | ||||||||||
| Equity component | $ | 20,408 | $ | 20,408 | ||||||||||
| 2024 Notes | ||||||||
| December 31, 2019 | December 31, 2018 | |||||||
| In thousands | ||||||||
| Principal amount of liability | $ | 199,500 | $ | 200,000 | ||||
| Unamortized discount | 13,440 | 16,251 | ||||||
| Carrying value of liability | $ | 186,060 | $ | 183,749 | ||||
| Equity component | $ | 20,408 | $ | 20,459 | ||||
| For the year ended December 31, | |||||||||||
| 2019 | 2018 | 2017 | |||||||||
| In thousands | |||||||||||
| Contractual coupon rate of interest | $ | 6,503 | $ | 6,500 | $ | 4,207 | |||||
| Accretion of convertible notes discount | 2,753 | 2,596 | 1,612 | ||||||||
| Interest expense - convertible notes | $ | 9,256 | $ | 9,096 | $ | 5,819 | |||||
| In thousands | ||||
| Carrying value of 2017 Notes | $ | 113,943 | ||
| Carrying value of Redeemed Debt | $ | 102,548 | ||
Fair value of consideration transferred allocated to debt component(1) | 103,637 | |||
Loss on extinguishment of 2017 Notes(2) | $ | (1,089 | ) | |
Acceleration of the related portion of debt issuance cost(3) | (297 | ) | ||
Total loss on extinguishment of 2017 Notes(4) | $ | (1,386 | ) | |
| For the year ended December 31, | |||||||||||||||||
| 2021 | 2020 | 2019 | |||||||||||||||
| In thousands | |||||||||||||||||
| Contractual coupon rate of interest | $ | 6,484 | $ | 6,484 | $ | 6,503 | |||||||||||
| Accretion of convertible notes discount | 2,957 | 2,860 | 2,753 | ||||||||||||||
| Interest expense - convertible notes | $ | 9,441 | $ | 9,344 | $ | 9,256 | |||||||||||
| At December 31, | ||||||||
| 2019 | 2018 | |||||||
| In thousands | ||||||||
| Total facility | $ | 800,000 | $ | 600,000 | ||||
| Amounts outstanding, excluding letters of credit | — | 38,500 | ||||||
| Amounts available for borrowing, excluding letters of credit | 800,000 | 561,500 | ||||||
Letters of credit under the credit facility(1) | 152,614 | 152,613 | ||||||
| Amounts available for borrowing | $ | 647,386 | $ | 408,887 | ||||
Amounts available for borrowing subject to EBITDA, as defined by the Credit Agreement(2) | $ | 322,900 | $ | 323,532 | ||||
| At December 31, | ||||||||||||||
| 2021 | 2020 | |||||||||||||
| In thousands | ||||||||||||||
| Total facility | $ | 800,000 | $ | 800,000 | ||||||||||
| Amounts outstanding, excluding letters of credit | — | — | ||||||||||||
| Amounts available for borrowing, excluding letters of credit | 800,000 | 800,000 | ||||||||||||
Letters of credit under the credit facility(1)(2) | 92,646 | 165,373 | ||||||||||||
| Amounts available for borrowing | $ | 707,354 | $ | 634,627 | ||||||||||
Amounts available for borrowing subject to EBITDA, as defined by the Credit Agreement(3) | $ | 409,914 | $ | 363,997 | ||||||||||
| At December 31, | ||||||
| 2019 | 2018 | |||||
Interest rate (1) | — | 3.74 | % | |||
| 2019 | 2018 | |||||||
| In thousands | ||||||||
| Foreign currency translation and other: | ||||||||
| Beginning balance | $ | (14,579 | ) | $ | (7,054 | ) | ||
| Net (loss) gain on foreign currency translation | (1,772 | ) | (9,255 | ) | ||||
Reclassification to net income(1) | — | 1,730 | ||||||
| Other comprehensive loss, net of tax | (1,772 | ) | (7,525 | ) | ||||
| Ending balance | $ | (16,351 | ) | $ | (14,579 | ) | ||
Pension and other post-retirement benefits (2): | ||||||||
| Beginning balance | $ | (120,319 | ) | $ | (108,760 | ) | ||
| Reclassification to net income | ||||||||
| Amortization of net loss, net of tax expense of $3,534 and $2,818, respectively | 11,971 | 8,800 | ||||||
| Change in net gain, net of tax benefit of $915 and $6,519, respectively | (3,100 | ) | (20,359 | ) | ||||
| Other comprehensive (loss) gain, net of tax | 8,871 | (11,559 | ) | |||||
Reclassification of stranded tax effects resulting from Tax Reform to retained earnings balance(3) | (23,094 | ) | — | |||||
| Ending balance | $ | (134,542 | ) | $ | (120,319 | ) | ||
| Total accumulated other comprehensive income (loss) | $ | (150,893 | ) | $ | (134,898 | ) | ||
| 2021 | 2020 | |||||||||||||
| In thousands | ||||||||||||||
| Foreign currency translation and other: | ||||||||||||||
| Beginning balance | $ | (717) | $ | (16,351) | ||||||||||
| Net (loss) gain on foreign currency translation | (13,346) | 15,634 | ||||||||||||
Reclassification to net income (1) | 22,835 | — | ||||||||||||
| Other comprehensive loss, net of tax | 9,489 | 15,634 | ||||||||||||
| Ending balance | $ | 8,772 | $ | (717) | ||||||||||
Pension and other post-retirement benefits (2): | ||||||||||||||
| Beginning balance | $ | (130,104) | $ | (134,542) | ||||||||||
| Reclassification to net income | ||||||||||||||
| Amortization of net loss, net of tax expense of $1,031 and $1,314, respectively | 3,478 | 4,434 | ||||||||||||
| Change in net loss, net of tax expense of $1,918 and $1, respectively | 6,469 | 4 | ||||||||||||
| Other comprehensive loss, net of tax | 9,947 | 4,438 | ||||||||||||
| Ending balance | $ | (120,157) | $ | (130,104) | ||||||||||
| Total accumulated other comprehensive income (loss) | $ | (111,385) | $ | (130,821) | ||||||||||
| For the twelve months ended December 31, | ||||||||||||||||||||
| 2021 | 2020 | 2019 | ||||||||||||||||||
| In thousands | ||||||||||||||||||||
| Current: | ||||||||||||||||||||
| Federal | $ | (5,613) | $ | 1,693 | $ | (19,432) | ||||||||||||||
| State | 1,061 | (3,143) | 1,996 | |||||||||||||||||
| Foreign | 266 | 168 | 585 | |||||||||||||||||
| (4,286) | (1,282) | (16,851) | ||||||||||||||||||
| Deferred: | ||||||||||||||||||||
| Federal | 17,533 | (5,650) | 719 | |||||||||||||||||
| State | 2,526 | 899 | 277 | |||||||||||||||||
| Foreign | 1,059 | (1,697) | (4) | |||||||||||||||||
| 21,118 | (6,448) | 992 | ||||||||||||||||||
| Income tax expense (benefit) | $ | 16,832 | $ | (7,730) | $ | (15,859) | ||||||||||||||
| For the twelve months ended December 31, | ||||||||||||
| 2019 | 2018 | 2017 | ||||||||||
| In thousands | ||||||||||||
| Current: | ||||||||||||
| Federal | $ | (19,432 | ) | $ | 351 | $ | 2,841 | |||||
| State | 1,996 | 104 | (626 | ) | ||||||||
| Foreign | 585 | 1,191 | 2,341 | |||||||||
| (16,851 | ) | 1,646 | 4,556 | |||||||||
| Deferred: | ||||||||||||
| Federal | 719 | 7,145 | 20,531 | |||||||||
| State | 277 | 841 | (60 | ) | ||||||||
| Foreign | (4 | ) | (373 | ) | 187 | |||||||
| 992 | 7,613 | 20,658 | ||||||||||
| Total | $ | (15,859 | ) | $ | 9,259 | $ | 25,214 | |||||
| For the twelve months ended December 31, | ||||||||||||||||||||
| 2021 | 2020 | 2019 | ||||||||||||||||||
| In thousands | ||||||||||||||||||||
| Federal tax at 21% statutory rate | $ | 12,707 | $ | (16,415) | $ | 8,523 | ||||||||||||||
State income taxes, net of federal benefit(1) | 1,459 | (2,208) | 1,839 | |||||||||||||||||
| Tax effect: | ||||||||||||||||||||
| Goodwill impairment charge | — | 8,297 | — | |||||||||||||||||
| Impairment on business | — | 7,620 | — | |||||||||||||||||
| Research and development credits | (1,995) | (821) | (3,480) | |||||||||||||||||
| Impact of entity classification election | 894 | — | (24,813) | |||||||||||||||||
| Foreign derived intangible income benefit | (494) | — | — | |||||||||||||||||
| Provision to return adjustments | 66 | 610 | (1,466) | |||||||||||||||||
| Foreign losses for which no tax benefit has been recorded | 308 | 41 | 1,282 | |||||||||||||||||
| Change in valuation allowance | 2,697 | 1,449 | 976 | |||||||||||||||||
| Equity compensation benefit | 77 | (209) | (482) | |||||||||||||||||
| Nondeductible compensation | 1,372 | 215 | 891 | |||||||||||||||||
| Nondeductible acquisition costs | — | — | 546 | |||||||||||||||||
| Federal benefit of NOL Carryback | — | (3,885) | — | |||||||||||||||||
| Other, net | (259) | (2,424) | 325 | |||||||||||||||||
| Income tax expense (benefit) | $ | 16,832 | $ | (7,730) | $ | (15,859) | ||||||||||||||
| At December 31, | ||||||||||||||
| 2021 | 2020 | |||||||||||||
| In thousands | ||||||||||||||
| Deferred tax assets: | ||||||||||||||
| Deferred employee benefits | $ | 18,380 | $ | 30,701 | ||||||||||
| Tax loss and credit carryforwards | 17,057 | 33,065 | ||||||||||||
| Accrued liabilities and other | 3,553 | 7,307 | ||||||||||||
| Contract accounting differences | 3,693 | 3,553 | ||||||||||||
| Environmental liabilities | 3,266 | 3,122 | ||||||||||||
| Lease obligations | 2,450 | 3,438 | ||||||||||||
| Total deferred tax assets | 48,399 | 81,186 | ||||||||||||
| Deferred tax liabilities: | ||||||||||||||
| Property, plant and equipment | (11,680) | (5,379) | ||||||||||||
| Intangibles | (21,282) | (32,398) | ||||||||||||
| Other items | (205) | (765) | ||||||||||||
| Total deferred tax liabilities | (33,167) | (38,542) | ||||||||||||
| Net deferred tax assets before valuation allowance | 15,232 | 42,644 | ||||||||||||
| Valuation allowance | (6,022) | (10,216) | ||||||||||||
| Net deferred tax assets after valuation allowance | $ | 9,210 | $ | 32,428 | ||||||||||
| At December 31, | ||||||||
| 2019 | 2018 | |||||||
| In thousands | ||||||||
| Deferred tax assets: | ||||||||
| Deferred employee benefits | $ | 36,678 | $ | 43,118 | ||||
| Tax loss and credit carryforwards | 19,449 | 17,610 | ||||||
| Accrued liabilities and other items | 14,044 | 9,036 | ||||||
| Total deferred tax assets | 70,171 | 69,764 | ||||||
| Deferred tax liabilities: | ||||||||
| Property, plant and equipment | (6,410 | ) | (2,677 | ) | ||||
| Intangibles | (27,147 | ) | (27,732 | ) | ||||
| Other items | (226 | ) | (218 | ) | ||||
| Total deferred tax liabilities | (33,783 | ) | (30,627 | ) | ||||
| Net deferred tax assets before valuation allowance | 36,388 | 39,137 | ||||||
| Valuation allowance | (8,142 | ) | (8,243 | ) | ||||
| Net deferred tax assets after valuation allowance | $ | 28,246 | $ | 30,894 | ||||
| For the twelve months ended December 31, | ||||||||||||
| 2019 | 2018 | 2017 | ||||||||||
| In thousands | ||||||||||||
Federal tax at statutory rate(1) | $ | 8,523 | $ | 5,279 | $ | 15,722 | ||||||
State income taxes, net of federal benefit(2) | 1,839 | 773 | (584 | ) | ||||||||
| Tax effect: | ||||||||||||
| Section 199 Manufacturing deduction | — | — | (1,616 | ) | ||||||||
| Research and development credits | (3,480 | ) | (100 | ) | (100 | ) | ||||||
| Impact of entity classification election | (24,813 | ) | — | — | ||||||||
| Foreign derived intangible income benefit | — | (2,186 | ) | — | ||||||||
| Provision to return adjustments | (1,466 | ) | (1,612 | ) | 366 | |||||||
| Foreign losses for which no tax benefit has been recorded | 1,282 | 2,685 | — | |||||||||
| Change in valuation allowance | 976 | 3,161 | 861 | |||||||||
| Equity compensation benefit | (482 | ) | (910 | ) | (851 | ) | ||||||
| Nondeductible compensation | 891 | 347 | 11 | |||||||||
| Nondeductible acquisition costs | 546 | — | — | |||||||||
| Impact of tax rate changes, including Tax Reform | 68 | 193 | 10,032 | |||||||||
| Other, net | 257 | 1,629 | 1,373 | |||||||||
| Income tax (benefit) expense | $ | (15,859 | ) | $ | 9,259 | $ | 25,214 | |||||
| 2021 | 2020 | 2019 | ||||||||||||||||||
| In thousands | ||||||||||||||||||||
| Balance at January 1 | $ | 3,612 | $ | 3,214 | $ | 3,457 | ||||||||||||||
| Additions (reductions) based on current year tax positions | 32 | 481 | (378) | |||||||||||||||||
| Changes for tax positions of prior years | (52) | 3 | 135 | |||||||||||||||||
| Settlements | — | (86) | — | |||||||||||||||||
Balance at December 31(1) | $ | 3,592 | $ | 3,612 | $ | 3,214 | ||||||||||||||
| 2019 | 2018 | 2017 | ||||||||||
| In thousands | ||||||||||||
| Balance at January 1 | $ | 3,457 | $ | 3,423 | $ | 2,832 | ||||||
| (Reductions) additions based on current year tax positions | (378 | ) | 162 | 381 | ||||||||
| Changes for tax positions of prior years | 135 | (128 | ) | 152 | ||||||||
| Settlements | — | — | 58 | |||||||||
| Balance at December 31 | $ | 3,214 | $ | 3,457 | $ | 3,423 | ||||||
| For the twelve months ended December 31, | ||||||||||||||||||||||||||
| Qualified Pension Plan | SERP | |||||||||||||||||||||||||
| 2021 | 2020 | 2021 | 2020 | |||||||||||||||||||||||
| In thousands | ||||||||||||||||||||||||||
| Projected benefit obligation at beginning of year | $ | 836,531 | $ | 777,388 | $ | 7,669 | $ | 7,336 | ||||||||||||||||||
| Service cost | 1,301 | 5,234 | — | — | ||||||||||||||||||||||
| Interest cost | 14,165 | 21,020 | 63 | 165 | ||||||||||||||||||||||
Actuarial liability (gain) loss (1) | (29,590) | 72,145 | (63) | 702 | ||||||||||||||||||||||
| Benefit payments | (36,612) | (39,256) | (2,652) | (534) | ||||||||||||||||||||||
| Projected benefit obligation at end of year | $ | 785,795 | $ | 836,531 | $ | 5,017 | $ | 7,669 | ||||||||||||||||||
| Fair value of plan assets at beginning of year | $ | 766,921 | $ | 680,142 | $ | — | $ | — | ||||||||||||||||||
| Actual return on plan assets | 23,700 | 116,035 | — | — | ||||||||||||||||||||||
| Employer contributions | 10,000 | 10,000 | 2,652 | 534 | ||||||||||||||||||||||
| Benefit payments | (36,612) | (39,256) | (2,652) | (534) | ||||||||||||||||||||||
| Fair value of plan assets at end of year | $ | 764,009 | $ | 766,921 | $ | — | $ | — | ||||||||||||||||||
| Funded status at end of year | $ | (21,786) | $ | (69,610) | $ | (5,017) | $ | (7,669) | ||||||||||||||||||
| Accumulated benefit obligation | $ | 785,795 | $ | 836,531 | $ | 5,017 | $ | 7,669 | ||||||||||||||||||
| For the twelve months ended December 31, | ||||||||||||||||
| Qualified Pension Plan | SERP | |||||||||||||||
| 2019 | 2018 | 2019 | 2018 | |||||||||||||
| In thousands | ||||||||||||||||
| Projected benefit obligation at beginning of year | $ | 695,375 | $ | 770,316 | $ | 6,913 | $ | 7,896 | ||||||||
| Service cost | 5,100 | 4,897 | — | — | ||||||||||||
| Interest cost | 26,422 | 23,804 | 237 | 246 | ||||||||||||
Actuarial liability loss (gain) (1) | 88,271 | (67,157 | ) | 720 | (280 | ) | ||||||||||
| Benefit payments | (37,780 | ) | (36,485 | ) | (534 | ) | (949 | ) | ||||||||
| Projected benefit obligation at end of year | $ | 777,388 | $ | 695,375 | $ | 7,336 | $ | 6,913 | ||||||||
| Fair value of plan assets at beginning of year | $ | 590,387 | $ | 643,392 | $ | — | $ | — | ||||||||
| Actual return on plan assets | 127,535 | (46,520 | ) | — | — | |||||||||||
| Employer contributions | — | 30,000 | 534 | 949 | ||||||||||||
| Benefit payments | (37,780 | ) | (36,485 | ) | (534 | ) | (949 | ) | ||||||||
| Fair value of plan assets at end of year | $ | 680,142 | $ | 590,387 | $ | — | $ | — | ||||||||
| Funded status at end of year | $ | (97,246 | ) | $ | (104,988 | ) | $ | (7,336 | ) | $ | (6,913 | ) | ||||
| Accumulated benefit obligation | $ | 777,388 | $ | 695,375 | $ | 7,336 | $ | 6,913 | ||||||||
| At December 31, | ||||||||||||||||
| Qualified Pension Plan | SERP | |||||||||||||||
| 2019 | 2018 | 2019 | 2018 | |||||||||||||
| In thousands | ||||||||||||||||
Current liabilities (1) | $ | — | $ | — | $ | (528 | ) | $ | (529 | ) | ||||||
| Noncurrent liabilities | (97,246 | ) | (104,988 | ) | (6,808 | ) | (6,384 | ) | ||||||||
| Total | $ | (97,246 | ) | $ | (104,988 | ) | $ | (7,336 | ) | $ | (6,913 | ) | ||||
| At December 31, | ||||||||||||||||||||||||||
| Qualified Pension Plan | SERP | |||||||||||||||||||||||||
| 2021 | 2020 | 2021 | 2020 | |||||||||||||||||||||||
| In thousands | ||||||||||||||||||||||||||
Current liabilities (1) | $ | — | $ | — | $ | (526) | $ | (2,771) | ||||||||||||||||||
| Noncurrent liabilities | (21,786) | (69,610) | (4,491) | (4,898) | ||||||||||||||||||||||
| Total | $ | (21,786) | $ | (69,610) | $ | (5,017) | $ | (7,669) | ||||||||||||||||||
| At December 31, | ||||||||||||||||||||||||||
| Qualified Pension Plan | SERP | |||||||||||||||||||||||||
| 2021 | 2020 | 2021 | 2020 | |||||||||||||||||||||||
| In thousands | ||||||||||||||||||||||||||
| Unrecognized loss | $ | 159,015 | $ | 171,571 | $ | 730 | $ | 1,069 | ||||||||||||||||||
| Amount included in accumulated other comprehensive income | $ | 159,015 | $ | 171,571 | $ | 730 | $ | 1,069 | ||||||||||||||||||
| At December 31, | ||||||||||||||||
| Qualified Pension Plan | SERP | |||||||||||||||
| 2019 | 2018 | 2019 | 2018 | |||||||||||||
| In thousands | ||||||||||||||||
| Unrecognized loss | $ | 177,083 | $ | 189,047 | $ | 1,311 | $ | 837 | ||||||||
| Amount included in accumulated other comprehensive income | $ | 177,083 | $ | 189,047 | $ | 1,311 | $ | 837 | ||||||||
| For the twelve months ended December 31, | ||||||||||||||||||||||||||||||||||||||
| Qualified Pension Plan | SERP | |||||||||||||||||||||||||||||||||||||
| 2021 | 2020 | 2019 | 2021 | 2020 | 2019 | |||||||||||||||||||||||||||||||||
| In thousands | ||||||||||||||||||||||||||||||||||||||
| Service cost for benefits earned during the year | $ | 1,301 | $ | 5,234 | $ | 5,100 | $ | — | $ | — | $ | — | ||||||||||||||||||||||||||
| Interest cost on projected benefit obligation | 14,165 | 21,020 | 26,422 | 63 | 165 | 237 | ||||||||||||||||||||||||||||||||
| Expected return on plan assets | (45,177) | (43,183) | (42,560) | — | — | — | ||||||||||||||||||||||||||||||||
| Recognized net loss | 4,444 | 4,804 | 15,260 | 65 | 944 | 245 | ||||||||||||||||||||||||||||||||
| Additional amount recognized due to curtailment/settlement | — | — | — | 211 | — | — | ||||||||||||||||||||||||||||||||
| Net pension benefit (income) cost | $ | (25,267) | $ | (12,125) | $ | 4,222 | $ | 339 | $ | 1,109 | $ | 482 | ||||||||||||||||||||||||||
| Change in net (loss) or gain | (8,113) | (708) | 3,295 | (274) | 703 | 720 | ||||||||||||||||||||||||||||||||
| Amortization of net loss | (4,444) | (4,804) | (15,260) | (65) | (944) | (245) | ||||||||||||||||||||||||||||||||
| Total recognized in other comprehensive (loss) income | $ | (12,557) | $ | (5,512) | $ | (11,965) | $ | (339) | $ | (241) | $ | 475 | ||||||||||||||||||||||||||
| Total recognized in net periodic benefit cost and other comprehensive (income) loss | $ | (37,824) | $ | (17,637) | $ | (7,743) | $ | — | $ | 868 | $ | 957 | ||||||||||||||||||||||||||
| For the twelve months ended December 31, | ||||||||||||||||||||||||
| Qualified Pension Plan | SERP | |||||||||||||||||||||||
| 2019 | 2018 | 2017 | 2019 | 2018 | 2017 | |||||||||||||||||||
| In thousands | ||||||||||||||||||||||||
| Service cost for benefits earned during the year | $ | 5,100 | $ | 4,897 | $ | 4,794 | $ | — | $ | — | $ | — | ||||||||||||
| Interest cost on projected benefit obligation | 26,422 | 23,804 | 24,358 | 237 | 246 | 241 | ||||||||||||||||||
| Expected return on plan assets | (42,560 | ) | (47,841 | ) | (42,049 | ) | — | — | — | |||||||||||||||
| Recognized net loss | 15,260 | 11,370 | 13,943 | 245 | 248 | 146 | ||||||||||||||||||
| Additional amount recognized due to curtailment/settlement | — | — | — | — | 46 | 305 | ||||||||||||||||||
| Net pension benefit cost (income) | $ | 4,222 | $ | (7,770 | ) | $ | 1,046 | $ | 482 | $ | 540 | $ | 692 | |||||||||||
| Change in net gain or (loss) | 3,295 | 27,203 | (6,607 | ) | 720 | (325 | ) | 347 | ||||||||||||||||
| Amortization of net loss | (15,260 | ) | (11,370 | ) | (13,943 | ) | (245 | ) | (248 | ) | (146 | ) | ||||||||||||
| Total recognized in other comprehensive (loss) income | $ | (11,965 | ) | $ | 15,833 | $ | (20,550 | ) | $ | 475 | $ | (573 | ) | $ | 201 | |||||||||
| Total recognized in net periodic benefit cost and other comprehensive (loss) income | $ | (7,743 | ) | $ | 8,063 | $ | (19,504 | ) | $ | 957 | $ | (33 | ) | $ | 893 | |||||||||
| Qualified Pension Plan | SERP | |||||||||||||||||||||||||
| 2021 | 2020 | 2021 | 2020 | |||||||||||||||||||||||
| In thousands | ||||||||||||||||||||||||||
| Contributions | $ | 10,000 | $ | 10,000 | $ | 2,652 | $ | 534 | ||||||||||||||||||
| Qualified Pension Plan | SERP | |||||||||||||||
| 2019 | 2018 | 2019 | 2018 | |||||||||||||
| In thousands | ||||||||||||||||
| Contributions | $ | — | $ | 30,000 | $ | 534 | $ | 949 | ||||||||
| Qualified Pension Plan | SERP | |||||||||||||
| In thousands | ||||||||||||||
| Expected contributions during 2022 | $ | — | $ | 526 | ||||||||||
| Qualified Pension Plan | SERP | |||||||
| In thousands | ||||||||
Expected contributions during 2020(1) | $ | 10,000 | $ | 528 | ||||
| Qualified Pension Plan | SERP | |||||||||||||
| In thousands | ||||||||||||||
| 2022 | $ | 41,871 | $ | 526 | ||||||||||
| 2023 | $ | 43,100 | $ | 507 | ||||||||||
| 2024 | $ | 44,156 | $ | 485 | ||||||||||
| 2025 | $ | 44,839 | $ | 460 | ||||||||||
| 2026 | $ | 45,378 | $ | 432 | ||||||||||
| 2027-2031 | $ | 224,835 | $ | 1,710 | ||||||||||
Qualified Pension Plan | SERP | |||||||
| In thousands | ||||||||
| 2020 | $ | 39,368 | $ | 528 | ||||
| 2021 | $ | 40,664 | $ | 2,554 | ||||
| 2022 | $ | 41,966 | $ | 494 | ||||
| 2023 | $ | 43,107 | $ | 474 | ||||
| 2024 | $ | 44,127 | $ | 451 | ||||
| 2025-2029 | $ | 225,251 | $ | 1,863 | ||||
| At December 31, | ||||||||||||||||||||||||||
| Qualified Pension Plan | SERP | |||||||||||||||||||||||||
| 2021 | 2020 | 2021 | 2020 | |||||||||||||||||||||||
| Discount rate | 2.71 | % | 2.34 | % | 2.33 | % | 1.78 | % | ||||||||||||||||||
| At December 31, | ||||||||||||
| Qualified Pension Plan | SERP | |||||||||||
| 2019 | 2018 | 2019 | 2018 | |||||||||
| Discount rate | 3.14 | % | 4.17 | % | 2.76 | % | 3.88 | % | ||||
| For the twelve months ended December 31, | ||||||||||||||||||||||||||||||||
| Qualified Pension Plan | SERP | |||||||||||||||||||||||||||||||
| 2021 | 2020 | 2021 | 2020 | |||||||||||||||||||||||||||||
Discount rate(1) | 2.34 | % | 3.14 | % | 1.78% | / | 2.29 | % | 2.76 | % | ||||||||||||||||||||||
| Expected return on plan assets | 6.00 | % | 6.50 | % | N/A | N/A | ||||||||||||||||||||||||||
| Average rate of increase in compensation levels | N/A | N/A | N/A | N/A | ||||||||||||||||||||||||||||
| For the twelve months ended December 31, | ||||||||||||
| Qualified Pension Plan | SERP | |||||||||||
| 2019 | 2018 | 2019 | 2018 | |||||||||
| Discount rate | 4.17 | % | 3.50 | % | 3.88 | % | 3.15 | % | ||||
| Expected return on plan assets | 7.50 | % | 7.50 | % | N/A | N/A | ||||||
| Average rate of increase in compensation levels | N/A | N/A | N/A | N/A | ||||||||
Total Carrying Value at December 31, 2021 | Quoted prices in active markets (Level 1) | Significant other observable inputs (Level 2) | Significant unobservable inputs (Level 3) | Not subject to leveling | ||||||||||||||||||||||||||||
| In thousands | ||||||||||||||||||||||||||||||||
| Short-term investments: | ||||||||||||||||||||||||||||||||
| Cash and cash equivalents | $ | 19,033 | $ | 19,033 | $ | — | $ | — | $ | — | ||||||||||||||||||||||
| Futures contracts - assets | 2,014 | — | 2,014 | — | — | |||||||||||||||||||||||||||
| Futures contracts - liabilities | (372) | — | (372) | — | — | |||||||||||||||||||||||||||
| Fixed income securities | 231,433 | — | 231,433 | — | — | |||||||||||||||||||||||||||
| Mutual funds | 72,834 | 72,834 | — | — | — | |||||||||||||||||||||||||||
Common trust funds(1) | 417,022 | — | — | — | 417,022 | |||||||||||||||||||||||||||
| Corporate stock | 20,222 | 20,222 | — | — | — | |||||||||||||||||||||||||||
| Subtotal | $ | 762,186 | $ | 112,089 | $ | 233,075 | $ | — | $ | 417,022 | ||||||||||||||||||||||
| Accrued income/expense | 1,823 | (33) | 1,856 | — | — | |||||||||||||||||||||||||||
| Total | $ | 764,009 | $ | 112,056 | $ | 234,931 | $ | — | $ | 417,022 | ||||||||||||||||||||||
Total Carrying Value at December 31, 2019 | Quoted prices in active markets (Level 1) | Significant other observable inputs (Level 2) | Significant unobservable inputs (Level 3) | Not subject to leveling | ||||||||||||||||
| In thousands | ||||||||||||||||||||
| Short-term investments: | ||||||||||||||||||||
| Cash and cash equivalents | $ | 17,597 | $ | 17,597 | $ | — | $ | — | $ | — | ||||||||||
| Futures contracts - assets | — | — | — | — | — | |||||||||||||||
| Futures contracts - liabilities | (1,210 | ) | — | (1,210 | ) | — | — | |||||||||||||
| Fixed income securities | 195,133 | — | 195,133 | — | — | |||||||||||||||
| Mutual funds | 102,423 | 102,423 | — | — | — | |||||||||||||||
Common trust funds(1) | 319,932 | — | — | — | 319,932 | |||||||||||||||
| Corporate stock | 44,124 | 44,124 | — | — | — | |||||||||||||||
| Subtotal | $ | 677,999 | $ | 164,144 | $ | 193,923 | $ | — | $ | 319,932 | ||||||||||
| Accrued income/expense | 2,143 | 67 | 2,021 | — | 55 | |||||||||||||||
| Total | $ | 680,142 | $ | 164,211 | $ | 195,944 | $ | — | $ | 319,987 | ||||||||||
Total Carrying Value at December 31, 2018 | Quoted prices in active markets (Level 1) | Significant other observable inputs (Level 2) | Significant unobservable inputs (Level 3) | Not subject to leveling | ||||||||||||||||
| In thousands | ||||||||||||||||||||
| Short term investments: | ||||||||||||||||||||
| Cash and cash equivalents | $ | 17,752 | $ | 17,752 | $ | — | $ | — | $ | — | ||||||||||
| Futures contracts - assets | 4,023 | — | 4,023 | — | — | |||||||||||||||
| Futures contracts - liabilities | — | — | — | — | — | |||||||||||||||
| Fixed income securities | 151,895 | — | 151,895 | — | — | |||||||||||||||
| Mutual funds | 99,584 | 99,584 | — | — | — | |||||||||||||||
Common trust funds(1) | 281,064 | — | — | — | 281,064 | |||||||||||||||
| Corporate stock | 34,164 | 34,164 | — | — | — | |||||||||||||||
| Subtotal | $ | 588,482 | $ | 151,500 | $ | 155,918 | $ | — | $ | 281,064 | ||||||||||
| Accrued income/expense | 1,905 | 113 | 1,740 | — | 52 | |||||||||||||||
| Total | $ | 590,387 | $ | 151,613 | $ | 157,658 | $ | — | $ | 281,116 | ||||||||||
Total Carrying Value at December 31, 2020 | Quoted prices in active markets (Level 1) | Significant other observable inputs (Level 2) | Significant unobservable inputs (Level 3) | Not subject to leveling | ||||||||||||||||||||||||||||
| In thousands | ||||||||||||||||||||||||||||||||
| Short term investments: | ||||||||||||||||||||||||||||||||
| Cash and cash equivalents | $ | 26,951 | $ | 26,951 | $ | — | $ | — | $ | — | ||||||||||||||||||||||
| Futures contracts - assets | 285 | — | 285 | — | — | |||||||||||||||||||||||||||
| Futures contracts - liabilities | (15) | — | (15) | — | — | |||||||||||||||||||||||||||
| Fixed income securities | 214,961 | — | 214,961 | — | — | |||||||||||||||||||||||||||
| Mutual funds | 130,490 | 130,490 | — | — | — | |||||||||||||||||||||||||||
Common trust funds(1) | 362,288 | — | — | — | 362,288 | |||||||||||||||||||||||||||
| Corporate stock | 30,222 | 30,222 | — | — | — | |||||||||||||||||||||||||||
| Subtotal | $ | 765,182 | $ | 187,663 | $ | 215,231 | $ | — | $ | 362,288 | ||||||||||||||||||||||
| Accrued income/expense | 1,739 | 17 | 1,722 | — | — | |||||||||||||||||||||||||||
| Total | $ | 766,921 | $ | 187,680 | $ | 216,953 | $ | — | $ | 362,288 | ||||||||||||||||||||||
| At December 31, | ||||||||||||||
| 2021 | 2020 | |||||||||||||
| In thousands | ||||||||||||||
| Supplemental employees' retirement plan ("SERP") | $ | 4,491 | $ | 4,898 | ||||||||||
| Deferred compensation | 20,618 | 21,968 | ||||||||||||
| Long-term incentive plan | 1,016 | 3,448 | ||||||||||||
| Noncurrent income taxes payable | 3,365 | 3,625 | ||||||||||||
| Environmental remediation liability | 5,548 | 5,313 | ||||||||||||
| Finance leases | 2,629 | 4,315 | ||||||||||||
| Other | 2,170 | 4,069 | ||||||||||||
| Total other long-term liabilities | $ | 39,837 | $ | 47,636 | ||||||||||
| At December 31, | ||||||||
| 2019 | 2018 | |||||||
| In thousands | ||||||||
| Supplemental employees' retirement plan ("SERP") | $ | 6,808 | $ | 6,384 | ||||
| Deferred compensation | 20,768 | 17,885 | ||||||
| Long-term incentive plan | 10,527 | 9,821 | ||||||
| Noncurrent income taxes payable | 3,390 | 3,371 | ||||||
| Environmental remediation liability | 5,525 | 4,610 | ||||||
| Finance leases | 5,559 | 6,261 | ||||||
| Other | 3,838 | 3,543 | ||||||
Total other long-term liabilities(1) | $ | 56,415 | $ | 51,875 | ||||
| Classification | December 31, 2019(1) | |||||
| In thousands | ||||||
| Assets | ||||||
| Operating lease right of use assets | Operating lease right-of-use assets, net | $ | 15,159 | |||
| Finance lease right of use assets | Property, plant and equipment, net of accumulated depreciation | 5,840 | ||||
| Total leased assets | $ | 20,999 | ||||
| Classification | December 31, 2021 | December 31, 2020 | ||||||||||||||||||
| In thousands | ||||||||||||||||||||
| Assets | ||||||||||||||||||||
| Operating lease right of use assets | Operating lease right-of-use assets, net | $ | 11,011 | $ | 12,880 | |||||||||||||||
| Finance lease right of use assets | Property, plant and equipment, net of accumulated depreciation | 3,830 | 4,618 | |||||||||||||||||
| Total leased assets | $ | 14,841 | $ | 17,498 | ||||||||||||||||
| Classification | December 31, 2019 | December 31, 2018 | Classification | December 31, 2021 | December 31, 2020 | |||||||||||||||||||||||||
| In thousands | In thousands | |||||||||||||||||||||||||||||
| Liabilities | Liabilities | |||||||||||||||||||||||||||||
| Current | Current | |||||||||||||||||||||||||||||
| Operating lease liability, current portion | Operating lease liabilities, current portion | $ | 4,306 | $ | — | Operating lease liability, current portion | Operating lease liabilities, current portion | $ | 4,502 | $ | 4,305 | |||||||||||||||||||
| Finance lease liability, current portion | Other current liabilities | 1,838 | 1,803 | Finance lease liability, current portion | Other current liabilities | 1,697 | 1,899 | |||||||||||||||||||||||
| Noncurrent | Noncurrent | |||||||||||||||||||||||||||||
| Operating lease liability, noncurrent portion | Operating lease liabilities, noncurrent portion | 11,617 | — | Operating lease liability, noncurrent portion | Operating lease liabilities, noncurrent portion | 7,140 | 9,325 | |||||||||||||||||||||||
| Finance lease liability, noncurrent portion | Other long-term liabilities | 5,559 | 6,260 | Finance lease liability, noncurrent portion | Other long-term liabilities | 2,629 | 4,315 | |||||||||||||||||||||||
Total lease liabilities(1) | $ | 23,320 | $ | 8,063 | ||||||||||||||||||||||||||
| Total lease liabilities | Total lease liabilities | $ | 15,968 | $ | 19,844 | |||||||||||||||||||||||||
| December 31, 2021 | ||||||||
| In thousands | ||||||||
| Operating leases | ||||||||
| 2022 | $ | 4,824 | ||||||
| 2023 | 3,643 | |||||||
| 2024 | 2,547 | |||||||
| 2025 | 673 | |||||||
| 2026 | 315 | |||||||
| Thereafter | 246 | |||||||
| Total future operating lease payments | $ | 12,248 | ||||||
| Interest | (606) | |||||||
| Present value of future operating lease payments | $ | 11,642 | ||||||
| Finance leases | ||||||||
| 2022 | 1,771 | |||||||
| 2023 | 1,253 | |||||||
| 2024 | 775 | |||||||
| 2025 | 669 | |||||||
| 2026 | — | |||||||
| Thereafter | — | |||||||
| Total future finance lease payments | $ | 4,468 | ||||||
| Interest | (142) | |||||||
| Present value of future finance lease payments | $ | 4,326 | ||||||
| Present value of total future lease payments | $ | 15,968 | ||||||
| December 31, 2019 | ||||
| In thousands | ||||
| Operating leases | ||||
| 2020 | $ | 5,164 | ||
| 2021 | 4,095 | |||
| 2022 | 3,285 | |||
| 2023 | 2,728 | |||
| 2024 | 2,059 | |||
| Thereafter | — | |||
| Total future operating lease payments | $ | 17,331 | ||
| Interest | (1,408 | ) | ||
| Present value of future operating lease payments | $ | 15,923 | ||
| Finance leases | ||||
| 2020 | 2,114 | |||
| 2021 | 1,965 | |||
| 2022 | 1,705 | |||
| 2023 | 1,189 | |||
| 2024 | 703 | |||
| Thereafter | — | |||
| Total future finance lease payments | $ | 7,676 | ||
| Interest | (279 | ) | ||
| Present value of future finance lease payments | $ | 7,397 | ||
| Present value of total future lease payments | $ | 23,320 | ||
| For the Years Ended December 31, | ||||||||||||||
| 2021 | 2020 | |||||||||||||
| In thousands | ||||||||||||||
| Finance lease cost | ||||||||||||||
| Amortization of right-of-use assets | $ | 758 | $ | 880 | ||||||||||
| Interest on lease liabilities | 139 | 196 | ||||||||||||
| Operating lease cost | 5,245 | 5,465 | ||||||||||||
| Short-term lease cost | 242 | 443 | ||||||||||||
| Variable lease cost | 79 | 96 | ||||||||||||
| Total lease expense | $ | 6,463 | $ | 7,080 | ||||||||||
| For the Year Ended | ||||
| December 31, 2019 | ||||
| In thousands | ||||
| Finance lease cost | ||||
| Amortization of right-of-use assets | $ | 941 | ||
| Interest on lease liabilities | 297 | |||
| Operating lease cost | 5,064 | |||
| Short-term lease cost | 177 | |||
| Variable lease cost | 83 | |||
Total lease expense(1) | $ | 6,562 | ||
| December 31, 2019 | ||||
| In thousands | ||||
| Operating cash flows from operating leases | $ | (4,950 | ) | |
| Operating cash flows from finance leases | (1,609 | ) | ||
| Financing cash flows from finance leases | (297 | ) | ||
Total cash flows from leasing activities(1) | $ | (6,856 | ) | |
| For the Years Ended December 31, | ||||||||||||||
| 2021 | 2020 | |||||||||||||
| In thousands | ||||||||||||||
| Operating cash flows from operating leases | $ | (6,294) | $ | (5,556) | ||||||||||
| Operating cash flows from finance leases | (2,028) | (1,533) | ||||||||||||
| Financing cash flows from finance leases | (139) | (196) | ||||||||||||
| Total cash flows from leasing activities | $ | (8,461) | $ | (7,285) | ||||||||||
| December 31, | |||||||||
| Weighted-average remaining lease term (years) | |||||||||
| Operating leases | |||||||||
| Finance leases | |||||||||
| Weighted-average discount rate | |||||||||
| Operating leases | % | ||||||||
| Finance leases | % | ||||||||
| For the Year Ended December 31, | ||||||||||||
| 2019 | 2018 | 2017 | ||||||||||
| In thousands, except per share amounts | ||||||||||||
| Earnings from continuing operations | $ | 56,446 | $ | 15,877 | $ | 19,708 | ||||||
| Total earnings from discontinued operations | 153,383 | 38,292 | 30,118 | |||||||||
| Net earnings | $ | 209,829 | $ | 54,169 | $ | 49,826 | ||||||
| Basic: | ||||||||||||
| Weighted average number of shares outstanding | 27,936 | 27,945 | 27,611 | |||||||||
| Earnings per share from continuing operations | $ | 2.02 | $ | 0.57 | $ | 0.71 | ||||||
| Earnings per share from discontinued operations | 5.49 | 1.37 | 1.09 | |||||||||
| Basic earnings per share | $ | 7.51 | $ | 1.94 | $ | 1.80 | ||||||
| Diluted: | ||||||||||||
| Weighted average number of shares outstanding | 27,936 | 27,945 | 27,611 | |||||||||
| Weighted average shares issuable on exercise of dilutive stock options | 156 | 208 | 160 | |||||||||
| Weighted average shares issuable on exercise of convertible notes | — | 37 | 466 | |||||||||
| Weighted average shares issuable on redemption of warrants related to 2017 Notes | — | 33 | 181 | |||||||||
| Total | 28,092 | 28,223 | 28,418 | |||||||||
| Earnings per share from continuing operations | $ | 2.01 | $ | 0.56 | $ | 0.69 | ||||||
| Earnings per share from discontinued operations | 5.46 | 1.36 | 1.06 | |||||||||
| Diluted earnings per share | $ | 7.47 | $ | 1.92 | $ | 1.75 | ||||||
| For the Year Ended December 31, | ||||||||||||||||||||
| 2021 | 2020 | 2019 | ||||||||||||||||||
| In thousands, except per share amounts | ||||||||||||||||||||
| Earnings (loss) from continuing operations | $ | 43,676 | $ | (70,434) | $ | 56,446 | ||||||||||||||
| Total earnings from discontinued operations | — | 692 | 153,383 | |||||||||||||||||
| Net earnings (loss) | $ | 43,676 | $ | (69,742) | $ | 209,829 | ||||||||||||||
| Basic: | ||||||||||||||||||||
| Weighted average number of shares outstanding | 27,865 | 27,723 | 27,936 | |||||||||||||||||
| Earnings (loss) per share from continuing operations | $ | 1.57 | $ | (2.54) | $ | 2.02 | ||||||||||||||
| Earnings per share from discontinued operations | — | 0.02 | 5.49 | |||||||||||||||||
| Basic earnings (loss) per share | $ | 1.57 | $ | (2.52) | $ | 7.51 | ||||||||||||||
| Diluted: | ||||||||||||||||||||
| Weighted average number of shares outstanding | 27,865 | 27,723 | 27,936 | |||||||||||||||||
| Weighted average shares issuable on exercise of dilutive stock options | 26 | — | 156 | |||||||||||||||||
| Weighted average shares issuable on exercise of convertible notes | — | — | — | |||||||||||||||||
| Weighted average shares issuable on redemption of warrants related to 2017 Notes | — | — | — | |||||||||||||||||
| Total | 27,891 | 27,723 | 28,092 | |||||||||||||||||
| Earnings (loss) per share from continuing operations | $ | 1.57 | $ | (2.54) | $ | 2.01 | ||||||||||||||
| Earnings per share from discontinued operations | — | 0.02 | 5.46 | |||||||||||||||||
| Diluted earnings (loss) per share | $ | 1.57 | $ | (2.52) | $ | 7.47 | ||||||||||||||
| Options | Weighted average- exercise price | ||||||
| Options outstanding at December 31, 2018 | 935,252 | $ | 45.91 | ||||
| Granted | 194,470 | 61.02 | |||||
| Exercised | (373,015 | ) | 45.68 | ||||
| Forfeited or expired | (20,343 | ) | 58.41 | ||||
| Options outstanding at December 31, 2019 | 736,364 | $ | 49.67 | ||||
| Options | Weighted average- exercise price | |||||||||||||
| Options outstanding at December 31, 2020 | 772,625 | $ | 54.87 | |||||||||||
| Granted | 4,990 | 55.85 | ||||||||||||
| Exercised | (18,669) | 38.54 | ||||||||||||
| Forfeited or expired | (12,706) | 63.68 | ||||||||||||
| Options outstanding at December 31, 2021 | 746,240 | $ | 55.14 | |||||||||||
| Weighted-average remaining contractual term - options outstanding (years) | 4.6 | ||||
| Aggregate intrinsic value - options outstanding (in thousands) | $ | 423 | |||
| Weighted-average exercise price - options outstanding | $ | 55.14 | |||
| Options exercisable | 509,156 | ||||
| Weighted-average remaining contractual term - options exercisable (years) | 3.9 | ||||
| Aggregate intrinsic value - options exercisable (in thousands) | $ | 423 | |||
| Weighted-average exercise price - options exercisable | $ | 52.16 | |||
| Weighted-average remaining contractual term - options outstanding (years) | 6.2 | ||
| Aggregate intrinsic value - options outstanding (in thousands) | $ | 12,171 | |
| Weighted-average exercise price - options outstanding | $ | 49.67 | |
| Options exercisable | 312,121 | ||
| Weighted-average remaining contractual term - options exercisable (years) | 4.5 | ||
| Aggregate intrinsic value - options exercisable (in thousands) | $ | 7,672 | |
| Weighted-average exercise price - options exercisable | $ | 41.62 | |
| 2021 | 2020 | 2019 | ||||||||||||||||||
| Expected option term (years) | 4.9 | 4.9 | 4.9 | |||||||||||||||||
| Expected volatility | 35.7 | % | 20.2 | % | 19.4 | % | ||||||||||||||
| Risk-free interest rate | 0.5 | % | 1.4 | % | 2.5 | % | ||||||||||||||
| Expected dividend yield | 1.6 | % | 1.3 | % | 1.3 | % | ||||||||||||||
| Per share fair value of options granted | $ | 14.89 | $ | 10.74 | $ | 11.18 | ||||||||||||||
| 2019 | 2018 | 2017 | ||||||||||
| Expected option term (years) | 4.9 | 4.9 | 5.0 | |||||||||
| Expected volatility | 19.4 | % | 18.1 | % | 19.9 | % | ||||||
| Risk-free interest rate | 2.5 | % | 2.6 | % | 1.9 | % | ||||||
| Expected dividend yield | 1.3 | % | 1.5 | % | 1.6 | % | ||||||
| Per share fair value of options granted | $ | 11.18 | $ | 10.65 | $ | 8.61 | ||||||
Restricted Stock Awards | Weighted- average grant date fair value | ||||||
| Restricted Stock outstanding at December 31, 2018 | 143,697 | $ | 49.97 | ||||
| Granted | 63,804 | 60.86 | |||||
| Vested | (108,517 | ) | 52.81 | ||||
| Forfeited or expired | (6,184 | ) | 57.62 | ||||
| Restricted Stock outstanding at December 31, 2019 | 92,800 | $ | 53.63 | ||||
| Restricted Stock Awards | Weighted- average grant date fair value | |||||||||||||
| Restricted Stock outstanding at December 31, 2020 | 109,514 | $ | 53.66 | |||||||||||
| Granted | 83,656 | 55.20 | ||||||||||||
| Vested | (54,481) | 56.02 | ||||||||||||
| Forfeited or expired | (3,338) | 58.56 | ||||||||||||
| Restricted Stock outstanding at December 31, 2021 | 135,351 | $ | 53.53 | |||||||||||
| Performance Stock | Weighted- average grant date fair value | |||||||||||||
| Performance Stock outstanding at December 31, 2020 | — | $ | — | |||||||||||
Granted(1) | 82,460 | 70.17 | ||||||||||||
| Vested | — | — | ||||||||||||
| Forfeited or expired | (12,297) | 70.16 | ||||||||||||
| Performance Stock outstanding at December 31, 2021 | 70,163 | $ | 70.17 | |||||||||||
| 2021 | ||||||||
| Expected term (years) | 2.9 | |||||||
| Expected volatility | 41.3 | % | ||||||
| Risk-free interest rate | 0.2 | % | ||||||
| Expected dividend yield | 1.4 | % | ||||||
| Per share fair value of performance stock granted | $ | 84.49 | ||||||
| Plan Category | (a) Number of securities to be issued upon exercise of outstanding options, warrants and rights | (b) Weighted- average exercise price of outstanding options, warrants and rights | (c) Number of securities remaining available for future issuance under equity compensation plans (excluding securities reflected in column (a)) | |||||||||||||||||
| Equity compensation plans approved by security holders: | ||||||||||||||||||||
| 2003 Stock Incentive Plan | 19,249 | $ | 36.12 | — | ||||||||||||||||
| 2013 Management Incentive Plan | 726,991 | 55.64 | 1,437,368 | |||||||||||||||||
| Employees Stock Purchase Plan | — | — | 452,363 | |||||||||||||||||
| Equity compensation plans not approved by security holders | — | — | — | |||||||||||||||||
| Total | 746,240 | $ | 55.14 | 1,889,731 | ||||||||||||||||
| Plan Category | (a) Number of securities to be issued upon exercise of outstanding options, warrants and rights | (b) Weighted- average exercise price of outstanding options, warrants and rights | (c) Number of securities remaining available for future issuance under equity compensation plans (excluding securities reflected in column (a)) | |||||||
| Equity compensation plans approved by security holders: | ||||||||||
| 2003 Stock Incentive Plan | 86,669 | $ | 31.98 | — | ||||||
| 2013 Management Incentive Plan | 649,695 | 52.03 | 2,199,160 | |||||||
| Employees Stock Purchase Plan | — | — | 551,112 | |||||||
| Equity compensation plans not approved by security holders | — | — | — | |||||||
| Total | 736,364 | $ | 49.67 | 2,750,272 | ||||||
| (a)(1) | FINANCIAL STATEMENTS. | Page Number in Form 10-K | ||||||
| See Item 8 of this Form 10-K setting forth the Report of Independent Registered Public Accounting Firm (PCAOB ID 238) and our Consolidated Financial Statements. | ||||||||
| (a)(2) | FINANCIAL STATEMENT SCHEDULE. | |||||||
| Additions | ||||||||||||||||||||||||||||||||
| DESCRIPTION | Balance Beginning of Period | Charged to Costs and Expenses | Others (A) | Deductions (B) | Balance End of Period | |||||||||||||||||||||||||||
| 2021 | ||||||||||||||||||||||||||||||||
| Allowance for doubtful accounts | $ | 2,008 | $ | 575 | $ | — | $ | 1,036 | $ | 1,547 | ||||||||||||||||||||||
| 2020 | ||||||||||||||||||||||||||||||||
| Allowance for doubtful accounts | $ | 1,246 | $ | 1,391 | $ | 82 | $ | 711 | $ | 2,008 | ||||||||||||||||||||||
| 2019 | ||||||||||||||||||||||||||||||||
| Allowance for doubtful accounts | $ | 2,498 | $ | 788 | $ | — | $ | 2,040 | $ | 1,246 | ||||||||||||||||||||||
| Additions | ||||||||||||||||||||
| DESCRIPTION | Balance Beginning of Period | Charged to Costs and Expenses | Others (A) | Deductions (B) | Balance End of Period | |||||||||||||||
| 2019 | ||||||||||||||||||||
| Allowance for doubtful accounts | $ | 2,498 | $ | 788 | $ | — | $ | 2,040 | $ | 1,246 | ||||||||||
| 2018 | ||||||||||||||||||||
| Allowance for doubtful accounts | $ | 2,181 | $ | 767 | $ | — | $ | 450 | $ | 2,498 | ||||||||||
| 2017 | ||||||||||||||||||||
| Allowance for doubtful accounts | $ | 2,282 | $ | 746 | $ | — | $ | 847 | $ | 2,181 | ||||||||||
| Additions (Reductions) | ||||||||||||||||||||||||||
| DESCRIPTION | Balance Beginning of Period | Current Year Provision (Benefit) | Others | Balance End of Period | ||||||||||||||||||||||
| 2021 | ||||||||||||||||||||||||||
| Valuation allowance on deferred tax assets | $ | 10,216 | $ | 910 | $ | (5,104) | $ | 6,022 | ||||||||||||||||||
| 2020 | ||||||||||||||||||||||||||
| Valuation allowance on deferred tax assets | $ | 8,142 | $ | 1,166 | $ | 908 | $ | 10,216 | ||||||||||||||||||
| 2019 | ||||||||||||||||||||||||||
| Valuation allowance on deferred tax assets | $ | 8,243 | $ | 2,046 | $ | (2,147) | $ | 8,142 | ||||||||||||||||||
| Additions (Reductions) | ||||||||||||||||
| DESCRIPTION | Balance Beginning of Period | Current Year Provision (Benefit) | Others | Balance End of Period | ||||||||||||
| 2019 | ||||||||||||||||
| Valuation allowance on deferred tax assets | $ | 8,243 | $ | 2,046 | $ | (2,147 | ) | $ | 8,142 | |||||||
| 2018 | ||||||||||||||||
| Valuation allowance on deferred tax assets | $ | 4,944 | $ | 3,472 | $ | (173 | ) | $ | 8,243 | |||||||
| 2017 | ||||||||||||||||
| Valuation allowance on deferred tax assets | $ | 3,831 | $ | 772 | $ | 341 | $ | 4,944 | ||||||||
| (a)(3) | EXHIBITS. | Page Number in Form 10-K | ||||||
| An index to the exhibits filed or incorporated by reference immediately precedes such exhibits. | ||||||||
KAMAN CORPORATION (Registrant) | ||||||||
| By: | /s/ | |||||||
| Chairman, President and | ||||||||
| Chief Executive Officer | ||||||||
| Signature | Title: | Date: | ||||||||||||
| /s/ | Chairman, President, | February 24, | ||||||||||||
| Chief Executive Officer and Director | ||||||||||||||
| (Principal Executive Officer) | ||||||||||||||
| /s/ | February 24, | |||||||||||||
| and Chief Financial Officer | ||||||||||||||
| (Principal Financial Officer) | ||||||||||||||
| /s/ | Vice President | February 24, | ||||||||||||
| (Principal Accounting Officer) | ||||||||||||||
| /s/ | February 24, | |||||||||||||
| Attorney-in-Fact for: | ||||||||||||||
| Director | ||||||||||||||
| E. Reeves Callaway III | Director | |||||||||||||
| A. William Higgins | Director | |||||||||||||
| Scott E. Kuechle | Director | |||||||||||||
| Michelle J. Lohmeier | Director | |||||||||||||
| George E. Minnich | Director | |||||||||||||
| Jennifer M. Pollino | Director | |||||||||||||
| Exhibit 2.1 | Share Purchase Agreement, dated as of June 25, 2019, by and between Kaman Corporation and LJ KAI Blocker, Inc., LJ KFP Blocker, Inc. and LJ KIT Blocker, Inc. (incorporated by reference to Exhibit 2.1 to the Company's Current Report on Form 8-K dated June 26, 2019, File No. 001-35419). | Previously Filed | ||||||
| Exhibit 2.2 | Securities and Asset Purchase Agreement, dated November 4, 2019, by and among Kaman Aerospace Group, Inc., Kaman Corporation, as guarantor, Peter J. Balsells, in his capacity as trustee of the BF Trust, 19650 Pauling, LLC, Pauling Properties LLC and Bal Seal Engineering, Inc. (incorporated by reference to Exhibit 2.1 to the Company's Current Report on Form 8-K dated November 5, 2019, File No. 001-35419). | Previously Filed | ||||||
| Exhibit 2.3 | First Amendment to Securities and Asset Purchase Agreement, dated as of December 26, 2019, by and among Kaman Aerospace Group, Inc., Kaman Corporation, as guarantor, Peter J. Balsells, in his capacity as trustee of The Balsells Family Trust Dated October 1, 1985 - Trust A, as Wholly Amended And Restated June 5, 2019, 19650 Pauling, LLC, Pauling Properties LLC and Bal Seal Engineering, Inc. (incorporated by reference to Exhibit 2.1 to the Company's Current Report on Form 8-K/A dated December 27, 2019, File No. 001-35419). | Previously Filed | ||||||
| Exhibit 3.1 | Amended and Restated Certificate of Incorporation of the Company (incorporated by reference to Exhibit 3.1 to the Company's Current Report on Form 8-K dated November 4, 2005, File No. 333-66179), as amended by the Certificate of Amendment thereto (incorporated by reference to Exhibit 3.1 to the Company's Current Report on Form 8-K dated April, 22 2019). | Previously Filed | ||||||
| Exhibit 3.2 | Amended and Restated Bylaws of the Company (incorporated by reference to Exhibit 3.1 to the Company's Current Report on Form 8-K dated December | Previously Filed | ||||||
| Exhibit 4.1 | Description of Registrant’s Securities Registered Pursuant to Section 12 of the Securities Exchange Act of 1934. (incorporated by reference to Exhibit 4.1 to the Company's Annual Report on Form 10-K for the fiscal year ended December 31, 2019, File No. 001-35419). | Previously Filed | ||||||
| Exhibit 4.2 | Indenture, dated as of May 12, 2017, by and between Kaman Corporation and U.S. Bank National Association, as trustee (incorporated by reference to Exhibit 4.1 to the Company's Current Report on Form 8-K dated May 12, 2017, File No. 001-35419). | Previously Filed | ||||||
| Exhibit 4.3 | First Supplemental Indenture, dated as of July 15, 2019, by and between Kaman Corporation and U.S. Bank National Association, as trustee (incorporated by reference to Exhibit 4.1 to the Company's Current Report on Form 8-K dated July 16, 2019, File No. 001-35419). | Previously Filed | ||||||
| Exhibit 10.1 | Kaman Corporation 2013 Management Incentive Plan (incorporated by reference to Annex A to the Company's Definitive Proxy Statement on Schedule 14A filed with the Securities and Exchange Commission on March 1, 2013, File No. 001-35419).* | Previously Filed | ||||||
| Exhibit 10.2 | First Amendment to the Kaman Corporation 2013 Management Incentive Plan (incorporated by reference to Exhibit 10.1 to the Company's Current Report on Form 8-K dated February 23, 2015, File No. 001-35419).* | Previously Filed | ||||||
| Exhibit 10.3 | Kaman Corporation Amended and Restated 2013 Management Incentive Plan. (incorporated by reference to Exhibit 10.1 to the Company's Current Report on Form 8-K filed on April 23, 2018, File No. 001-35419).* | Previously Filed | ||||||
| Exhibit 10.4 | Form of Nonqualified Stock Option Agreement under the Kaman Corporation 2013 Management Incentive Plan (incorporated by reference to Exhibit 10.1 to the Company's Current Report on Form 8-K dated February 24, 2014, File No. 001-35419).* | Previously Filed | ||||||
| Exhibit 10.5 | Form of Restricted Share Agreement under the Kaman Corporation 2013 Management Incentive Plan (incorporated by reference to Exhibit 10.2 to the Company's Current Report on Form 8-K dated February 24, 2014, File No. 001-35419).* | Previously Filed | ||||||
| Exhibit 10.6 | Form of Restricted Share Agreement under the Amended and Restated Kaman Corporation 2013 Management Incentive Plan, for awards granted on or after February 22, 2021 (incorporated by reference to Exhibit 10.1 to the Company’s Current Report on Form 8-K dated February 26, 2021, File No 001-35419).* | Previously Filed | ||||||
| Exhibit 10.7 | Form of Restricted Share Agreement under the Amended and Restated Kaman Corporation 2013 Management Incentive Plan, for awards granted on or after February 22, 2022.* | Filed Herewith | ||||||
| Exhibit 10.8 | Form of Performance Stock Unit Award Agreement under the Amended and Restated Kaman Corporation 2013 Management Incentive Plan (incorporated by reference to Exhibit 10.2 to the Company’s Current Report on Form 8-K dated February 26, 2021, File No 001-35419).* | Previously Filed | ||||||
| Exhibit 10.9 | Form of Performance Stock Unit Award Agreement under the Amended and Restated Kaman Corporation 2013 Management Incentive Plan, for awards granted on or after February 22, 2022.* | Filed Herewith | ||||||
| Exhibit 10.10 | Form of Restricted Stock Unit Agreement under the Kaman Corporation 2013 Management Incentive Plan (incorporated by reference to Exhibit 10.1 to the Company’s Current Report on Form 8-K dated June 6, 2014, File No 001-35419).* | Previously Filed | ||||||
| Exhibit | Form of Long-Term Performance Award Agreement (Payable in Cash) under the Kaman Corporation 2013 Management Incentive Plan (incorporated by reference to Exhibit 10.3 to the Company's Current Report on Form 8-K dated February 24, 2014, File No. 001-35419).* | Previously Filed | ||||||
| Exhibit | Form of Long-Term Performance Award Agreement (Payable in Cash) granted under the Kaman Corporation 2013 Management Incentive Plan, for awards granted on or after February 17, 2017 (incorporated by reference to Exhibit 10.1 to the Company's Form 10-Q for the fiscal quarter ended March 31, 2017, File No. 001-35419).* | Previously Filed | ||||||
| Exhibit | Form of Long-Term Performance Award Agreement (Payable in Shares) granted under the Kaman Corporation 2013 Management Incentive Plan (incorporated by reference to Exhibit 10.4 to the Company's Current Report on Form 8-K dated February 24, 2014, File No. 001-35419).* | Previously Filed | ||||||
| Exhibit | Form of Award Agreement for Non-Employee Directors under the Kaman Corporation 2013 Management Incentive Plan (incorporated by reference to Exhibit 10.6 to the Company’s Annual Report on Form 10-K for the fiscal year ended December 31, 2013, File No. 001-35419).* | Previously Filed | ||||||
| Exhibit | Kaman Corporation 2003 Stock Incentive Plan (incorporated by reference to Exhibit 10(a)(i) to the Company's Quarterly Report on Form 10-Q for the fiscal quarter ended October 2, 2009, File No. 000-01093), as amended by amendments thereto filed with the SEC on April 7, 2010 (incorporated by reference to Exhibit 99.1 to the Company's Current Report on Form 8-K dated April 7, 2010, File No. 000-01093) and November 1, 2010 (incorporated by reference to Exhibit 10(b) to the Company's Quarterly Report on Form 10-Q for the fiscal quarter ended October 1, 2010, File No. 000-01093), and February 22, 2012 (incorporated by reference to Exhibit 99.2 to the Company's Current Report on Form 8-K, dated February 22, 2012, File No. 000-01093).* | Previously Filed | ||||||
| Exhibit | Form of Incentive Stock Option Agreement under the Kaman Corporation 2003 Stock Incentive Plan (incorporated by reference to Exhibit 10h(i) to the Company's Annual Report on Form 10-K for the fiscal year ended December 31, 2008, File No. 000-01093).* | Previously Filed | ||||||
| Exhibit | Form of Non-Statutory Stock Option Agreement under the Kaman Corporation 2003 Stock Incentive Plan (incorporated by reference to Exhibit 10h(ii) to the Company's Annual Report on Form 10-K for the fiscal year ended December 31, 2008, File No. 000-01093).* | Previously Filed | ||||||
| Exhibit | Form of Stock Appreciation Rights Agreement under the Kaman Corporation 2003 Stock Incentive Plan (incorporated by reference to Exhibit 10h(iii) to the Company's Annual Report on Form 10-K for the fiscal year ended December 31, 2008, File No. 000-01093).* | Previously Filed | ||||||
| Exhibit | Form of Restricted Stock Agreement under the Kaman Corporation 2003 Stock Incentive Plan (incorporated by reference to Exhibit 10h(iv) to the Company's Form 10-Q for the fiscal quarter ended June 29, 2007, File No. 000-01093).* | Previously Filed | ||||||
| Exhibit | Form of Long Term Performance Award Agreement under the Kaman Corporation 2003 Stock Incentive Plan (incorporated by reference to Exhibit 10h(v) to the Company's Annual Report on Form 10-K for the fiscal year ended December 31, 2011, File No. 001-35419).* | Previously Filed | ||||||
| Exhibit | Form of Restricted Stock Unit Agreement under the Kaman Corporation 2003 Stock Incentive Plan (incorporated by reference to Exhibit 10h(vi) to the Company's Annual Report on Form 10-K for the fiscal year ended December 31, 2009, File No. 000-10093).* | Previously Filed | ||||||
| Exhibit | Kaman Corporation Employees Stock Purchase Plan (incorporated by reference to Exhibit 10(a) to the Company's Quarterly Report on Form 10-Q for the fiscal quarter ended October 1, 2010, File No. 000-01093), as amended by the First Amendment thereto filed with the SEC on February 27, 2012 (incorporated by reference to Exhibit 10b to the Company's Annual Report on Form 10-K for the fiscal year ended December 31, 2011, File No. 001-35419), the Second Amendment thereto filed with the SEC on February 25, 2013 (incorporated by reference to Exhibit 10.3 to the Company's Annual Report on Form 10-K for the fiscal year ended December 31, 2012, File No. 001-35419) and the Third Amendment thereto filed with the SEC on February 27, 2014 by reference to Exhibit 10.15 to the Company's Annual Report on Form 10-K for the fiscal year ended December 31, 2013, File No. 001-35419).* | Previously Filed | ||||||
| Exhibit | Kaman Corporation Amended and Restated Employee Stock Purchase Plan. (incorporated by reference to Exhibit 10.2 to the Company's Current Report on Form 8-K filed on April 23, 2018, File No. 001-35419), as amended by the First Amendment thereto (incorporated by reference to Exhibit 10.1 to the Company's Current Report on Form 8-K dated November 15, 2018, File No. 001-35419) and the Second Amendment thereto (incorporated by reference to Exhibit 10.1 to the Company's Current Report on Form 8-K dated November 16, 2021, File No. 001-35419).* | Previously Filed | ||||||
| Exhibit | Kaman Corporation Supplemental Employees' Retirement Plan (incorporated by reference to Exhibit 10c to the Company's Annual Report on Form 10-K for the fiscal year ended December 31, 2000, File No. 333-66179), as amended by an amendment thereto filed with the SEC on March 5, 2004 (incorporated by reference to Exhibit 10c to the Company's Annual Report on Form 10-K for the fiscal year ended December 31, 2003, File No. 333-66179), and an amendment thereto filed with the SEC on February 26, 2007 (incorporated by reference to Exhibit 10.10 to the Company's Current Report on Form 8-K, dated February 26, 2007, File No. 000-01093).* | Previously Filed | ||||||
| Exhibit | Post-2004 Supplemental Employees' Retirement Plan (incorporated by reference to Exhibit 10.11 to the Company's Current Report on Form 8-K, dated February 26, 2007, File No. 000-01093), as amended by the First Amendment thereto filed with the SEC on February 28, 2008 (incorporated by reference to Exhibit 10.1 to the Company's Current Report on Form 8-K, dated February 28, 2008, File No. 000-01093) and the Second Amendment thereto filed with the SEC on February 25, 2010 (incorporated by reference to Exhibit 10(c)(iii) to the Company's Annual Report on Form 10-K for the fiscal year ended December 31, 2009, File No. 000-01093).* | Previously Filed | ||||||
| Exhibit | Kaman Corporation Amended and Restated Deferred Compensation Plan (incorporated by reference to Exhibit 10d to the Company's Annual Report on Form 10-K for the fiscal year ended December 31, 2002, File No. 333-66179), as amended by an amendment thereto filed with the SEC on March 5, 2004 (incorporated by reference to Exhibit 10d to the Company's Annual report on Form 10-K for the fiscal year ended December 31, 2003 File No. 333-66179), and an amendment thereto filed with the SEC on August 3, 2004 (incorporated by reference to Exhibit 10(a) to the Company's Quarterly Report on Form 10-Q for the fiscal quarter ended June 30, 2004, File No. 333-66179).* | Previously Filed | ||||||
| Exhibit | Kaman Corporation Post-2004 Deferred Compensation Plan (incorporated by reference to Exhibit 10.2 to the Company's Current Report on Form 8-K, dated February 28, 2008, File No. 000-01093), as amended by the First Amendment thereto filed with the SEC on February 27, 2012 (incorporated by reference to Exhibit 10d(ii) to the Company's Annual Report on Form 10-K for the fiscal year ended December 31, 2011, File No. 001-35419), the Second Amendment thereto (incorporated by reference to Exhibit 10.20 to the Company’s Annual Report on Form 10-K for the fiscal year ended December 31, 2013, File No. 001-35419), the Third Amendment thereto (incorporated by reference to Exhibit 10.3 to the Company’s Current Report on Form 8-K dated November 21, 2014, File No. 001-35419) and the Fourth Amendment thereto (incorporated by reference to Exhibit 10.1 to the Company's Current Report on Form 8-K dated June 13, 2016, File No. 001-35419) and the Fifth Amendment thereto (incorporated by reference to Exhibit 10.2 to the Company's Current Report on Form 8-K dated November 16, 2021, File No. 001-35419).* | Previously Filed | ||||||
| Exhibit | Amended and Restated Executive Employment Agreement between Kaman Corporation and Neal J. Keating, originally dated as of August 7, 2007 and amended and restated as of November 11, 2008 (incorporated by reference to Exhibit 10g(xviii) to the Company's Annual Report on Form 10-K for the fiscal year ended December 31, 2008, File No. 000-01093), as amended by Amendment No. 1 thereto dated January 1, 2010 (incorporated by reference to Exhibit 10.1 to the Company's Current Report on Form 8-K, dated February 23, 2010, File No. 000-01093), Amendment No. 2 thereto dated September 17, 2010 (incorporated by reference to Exhibit 10.1 to the Company's Current Report on Form 8-K, dated September 20, 2010, File No. 000-01093), and Amendment No. 3 thereto dated November 18, 2014 (incorporated by reference to Exhibit 10.2 to the Company's Current Report on Form 8-K, dated November 21, 2014, File No. 000-01093), and Amendment No. 4 thereto dated April 14, 2021 (incorporated by reference to Exhibit 10.1 to the Company's Current Report on Form 8-K dated April 16, 2021, File No. 001-35419).** | Previously Filed | ||||||
| Exhibit 10.29 | Transition and Retirement Agreement, dated as of August 20, 2020 by and between Neal J. Keating and the Company (incorporated by reference to Exhibit 10.2 to the Company's current Report on Form 8-K, dated August 21, 2020, File No. 000-35419).* | Previously Filed | ||||||
| Exhibit | Executive Employment Agreement, dated as of August 20, 2020, by and between Ian K. Walsh and the Company (incorporated by reference to Exhibit 10.1 to the Company's Current Report on Form 8-K, dated August 21, 2020, File No. 000-35419).* | Previously Filed | ||||||
| Exhibit 10.31 | Executive Employment Agreement between Kaman Corporation and Robert D. Starr, dated as of November 18, 2014 (incorporated by reference to Exhibit 10.1 to the Company's Current Report on Form 8-K dated November 21, 2014, File No. 001-35419) | |||||||
| Previously Filed | ||||||||
| Exhibit 10.32 | Retirement and Consulting Letter Agreement, dated as of August 20, 2020, by and between Richard R. Barnhart and the Company (incorporated by reference to Exhibit 10.3 to the Company's Current Report on Form 8-K, dated August 21, | Previously Filed | ||||||
| Exhibit | Form of Amended and Restated Change in Control Agreement by and between the Company and certain of its executive officers (to wit: Messrs. | Previously Filed | ||||||
| Exhibit | ||||||||
Garden Leave and General Release Agreement, effective as of October 31, 2019, by and between Kaman Corporation and Paul M. Villani. (incorporated by reference to Exhibit 10.30 to the Company's Annual Report on Form 10-K for the fiscal year ended December 31, 2019, File No. 001-35419).* | Previously Filed | |||||||
| Exhibit | Retention and Special Assistance Agreement, effective April 10, 2020, by and between the Company and John J. Tedone (incorporated by reference to Exhibit 10.1 to the Company's Current Report on Form 8-K dated April 16, 2020, File No. 001-35419)* | Previously Filed | ||||||
| Exhibit 10.36 | Retirement and Consulting Agreement, dated as of November 16, 2020, by and between Gregory T. Troy and the Company (incorporated by reference to Exhibit 10.1 to the Company's Current Report on Form 8-K dated November 18, 2020, File No. 001-35419).* | Previously Filed | ||||||
| Exhibit 10.37 | Letter Agreement, dated May 8, 2017, between Bank of America, N.A. and Kaman Corporation, regarding the Capped Call Transaction (incorporated by reference to Exhibit 10.3 to the Company's Current Report on Form 8-K dated May 12, 2017, File No. 001-35419). | Previously Filed | ||||||
| Exhibit | Letter Agreement, dated May 8, 2017, between JPMorgan Chase Bank, National Association, London Branch and Kaman Corporation, regarding the Capped Call Transaction (incorporated by reference to Exhibit 10.4 to the Company's Current Report on Form 8-K dated May 12, 2017, File No. 001-35419). | Previously Filed | ||||||
| Exhibit | Letter Agreement, dated May 8, 2017 between UBS AG, London Branch and Kaman Corporation, regarding the Capped Call Transaction (incorporated by reference to Exhibit 10.5 to the Company's Current Report on Form 8-K dated May 12, 2017, File No. 001-35419). | Previously Filed | ||||||
| Exhibit | Letter Agreement, dated May 22, 2017, between Bank of America, N.A. and Kaman Corporation, regarding the Additional Capped Call Transaction (incorporated by reference to Exhibit 10.1 to the Company's Current Report on Form 8-K dated May 25, 2017, File No. 001-35419). | Previously Filed | ||||||
| Exhibit | Letter Agreement, dated May 22, 2017, between JPMorgan Chase Bank, National Association, London Branch and Kaman Corporation, regarding the Additional Capped Call Transaction (incorporated by reference to Exhibit 10.2 to the Company's Current Report on Form 8-K dated May 25, 2017, File No. 001-35419). | Previously Filed | ||||||
| Exhibit | Letter Agreement, dated May 22, 2017, between UBS AG, London Branch and Kaman Corporation, regarding the Additional Capped Call Transaction (incorporated by reference to Exhibit 10.3 to the Company's Current Report on Form 8-K dated May 25, 2017, File No. 001-35419). | Previously Filed | ||||||
| Exhibit | Second Amended and Restated Credit and Guaranty Agreement, dated as of December 13, 2019, by and among Kaman Corporation, RWG Germany GmbH, Kaman Lux Holding, S.à r.l and the other subsidiary borrowers from time to time party thereto, the Lenders from time to time party thereto and JPMorgan Chase Bank, N.A., as Administrative Agent and as Collateral Agent (incorporated by reference to Exhibit 10.1 to the Company's Current Report on Form 8-K dated December 18, 2019, File No. 001-35419) | Previously Filed | ||||||
| Exhibit | Transition Services Agreement, dated as of August 26, 2019, by and among Kaman Corporation, LJ KAI Blocker, Inc., LJ KFP Blocker, Inc. and LJ KIT Blocker, Inc., and Kaman Industrial Technologies Corporation (incorporated by reference to Exhibit 10.1 to the Company's Current Report on Form 8-K dated August 26, 2019, File No. 001-35419). | Previously Filed | ||||||
| Exhibit | Form of Trademark, Trade Name and Domain Name License Agreement, dated as of August 26, 2019, between Kaman Corporation and certain Licensees (incorporated by reference to Exhibit 10.2 to the Company's Current Report on Form 8-K dated August 26, 2019, File No. 001-35419); and Schedule identifying agreements substantially identical to the form of Trademark, Trade Name and Domain Name License Agreement filed as Exhibit 10.39 hereto (incorporated by reference to Exhibit 10.2(a) to the Company's Current Report on Form 8-K dated August 26, 2019, File No. 001-35419). | Previously Filed | ||||||
| Exhibit 21 | Filed Herewith | |||||||
| Exhibit 23 | Filed Herewith | |||||||
| Exhibit 24 | Filed Herewith | |||||||
| Exhibit 31.1 | Filed Herewith | |||||||
| Exhibit 31.2 | Filed Herewith | |||||||
| Exhibit 32.1 | Filed Herewith | |||||||
| Exhibit 32.2 | Filed Herewith | |||||||
| 101.INS | XBRL Instance Document - the instance document does not appear in the Interactive Data File because its XBRL tags are embedded within the Inline XBRL document | Filed Herewith | ||||||
| 101.SCH | Inline XBRL Taxonomy Extension Schema | Filed Herewith | ||||||
| 101.CAL | Inline XBRL Taxonomy Extension Calculation Linkbase | Filed Herewith | ||||||
| 101.DEF | Inline XBRL Taxonomy Extension Definition Linkbase | Filed Herewith | ||||||
| 101.LAB | Inline XBRL Taxonomy Extension Label Linkbase | Filed Herewith | ||||||
| 101.PRE | Inline XBRL Taxonomy Extension Presentation Linkbase | Filed Herewith | ||||||
| 104 | Cover Page Interactive Data File, formatted in iXBRL and contained in Exhibit 101 | Filed Herewith | ||||||