UNITED STATES
SECURITIES AND EXCHANGE COMMISSION
Washington, D.C. 20549
Form 10-K
|
| |
| ý | ANNUAL REPORT PURSUANT TO SECTION 13 OR 15(d) OF THE SECURITIES EXCHANGE ACT OF 1934 |
For the fiscal year ended December 31, 20162018
or
|
| |
| ¨ | TRANSITION REPORT PURSUANT TO SECTION 13 OR 15(d) OF THE SECURITIES EXCHANGE ACT OF 1934 |
For the transition period from to
Commission file number: 1-4717
KANSAS CITY SOUTHERN
(Exact name of registrant as specified in its charter)
|
| | |
Delaware (State or other jurisdiction of incorporation or organization) | | 44-0663509 (I.R.S. Employer Identification No.) |
427 West 12th Street, Kansas City, Missouri | 64105 |
| (Address of principal executive offices) | (Zip Code) |
816.983.1303
(Registrant’s telephone number, including area code)
None
(Former name, former address and former fiscal year, if changed since last report)
Securities registered pursuant to Section 12(b) of the Act:
|
| | |
| Title of Each Class | | Name of Each Exchange on Which Registered |
| Preferred Stock, Par Value $25 Per Share, 4%, Noncumulative | | New York Stock Exchange |
| Common Stock, $.01 Per Share Par Value | | New York Stock Exchange |
Securities registered pursuant to Section 12(g) of the Act:
None
Indicate by check mark if the registrant is a well-known seasoned issuer, as defined in Rule 405 of the Securities Act. Yes ý No ¨
Indicate by check mark if the registrant is not required to file reports pursuant to Section 13 or Section 15(d) of the Exchange Act. Yes ¨ No ý
Indicate by check mark whether the registrant (1) has filed all reports required to be filed by Section 13 or 15(d) of the Securities Exchange Act of 1934 during the preceding 12 months (or for such shorter period that the registrant was required to file such reports), and (2) has been subject to such filing requirements for the past 90 days. Yes ý No ¨
Indicate by check mark whether the registrant has submitted electronically, and posted on its corporate Web site, if any, every Interactive Data File required to be submitted and posted pursuant to Rule 405 of Regulation S-T during the preceding 12 months (or for such shorter period that the registrant was required to submit and post such files). Yes ý No ¨
Indicate by check mark if disclosure of delinquent filers pursuant to Item 405 of Regulation S-K is not contained herein, and will not be contained, to the best of registrant’s knowledge, in definitive proxy or information statements incorporated by reference in Part III of this Form 10-K or any amendment to this Form 10-K. ¨ý
Indicate by check mark whether the registrant is a large accelerated filer, an accelerated filer, a non-accelerated filer, or a smaller reporting company. See the definitions of “large accelerated filer,” “accelerated filer” and “smaller reporting company” in Rule 12b-2 of the Exchange Act. (Check one):
|
| | | | |
Large accelerated filer ý | Accelerated filer o | Non-accelerated filer o | Smaller reporting company o | |
| (Do not check if a smaller reporting company) |
Indicate by check mark whether the registrant is a shell company (as defined in Rule 12b-2 of the Exchange Act). Yes ¨ No ý
The aggregate market value of common stock held by non-affiliates of the registrant was $9.66$10.77 billion at June 30, 20162018. There were 106,643,666100,941,555 shares of $.01 par common stock outstanding at January 20, 2017.18, 2019.
DOCUMENTS INCORPORATED BY REFERENCE
Kansas City Southern’s Definitive Proxy Statement for the 20172019 Annual Meeting of Stockholders which will be filed no later than 120 days after December 31, 20162018, is incorporated by reference in Part III.
KANSAS CITY SOUTHERN
20162018 FORM 10-K ANNUAL REPORT
Table of Contents
|
| | |
| | | Page |
| | |
| PART I | |
| | | |
| Item 1. | | |
| Item 1A. | | |
| Item 1B. | | |
| Item 2. | | |
| Item 3. | | |
| Item 4. | | |
| | |
| PART II | |
| | | |
| Item 5. | | |
| Item 6. | | |
| Item 7. | | |
| Item 7A. | | |
| Item 8. | | |
| Item 9. | | |
| Item 9A. | | |
| Item 9B. | | |
| | |
| PART III | |
| | | |
| Item 10. | | |
| Item 11. | | |
| Item 12. | | |
| Item 13. | | |
| Item 14. | | |
| | |
| PART IV | |
| | | |
| Item 15. | | |
| Item 16. | | |
| |
COMPANY OVERVIEW
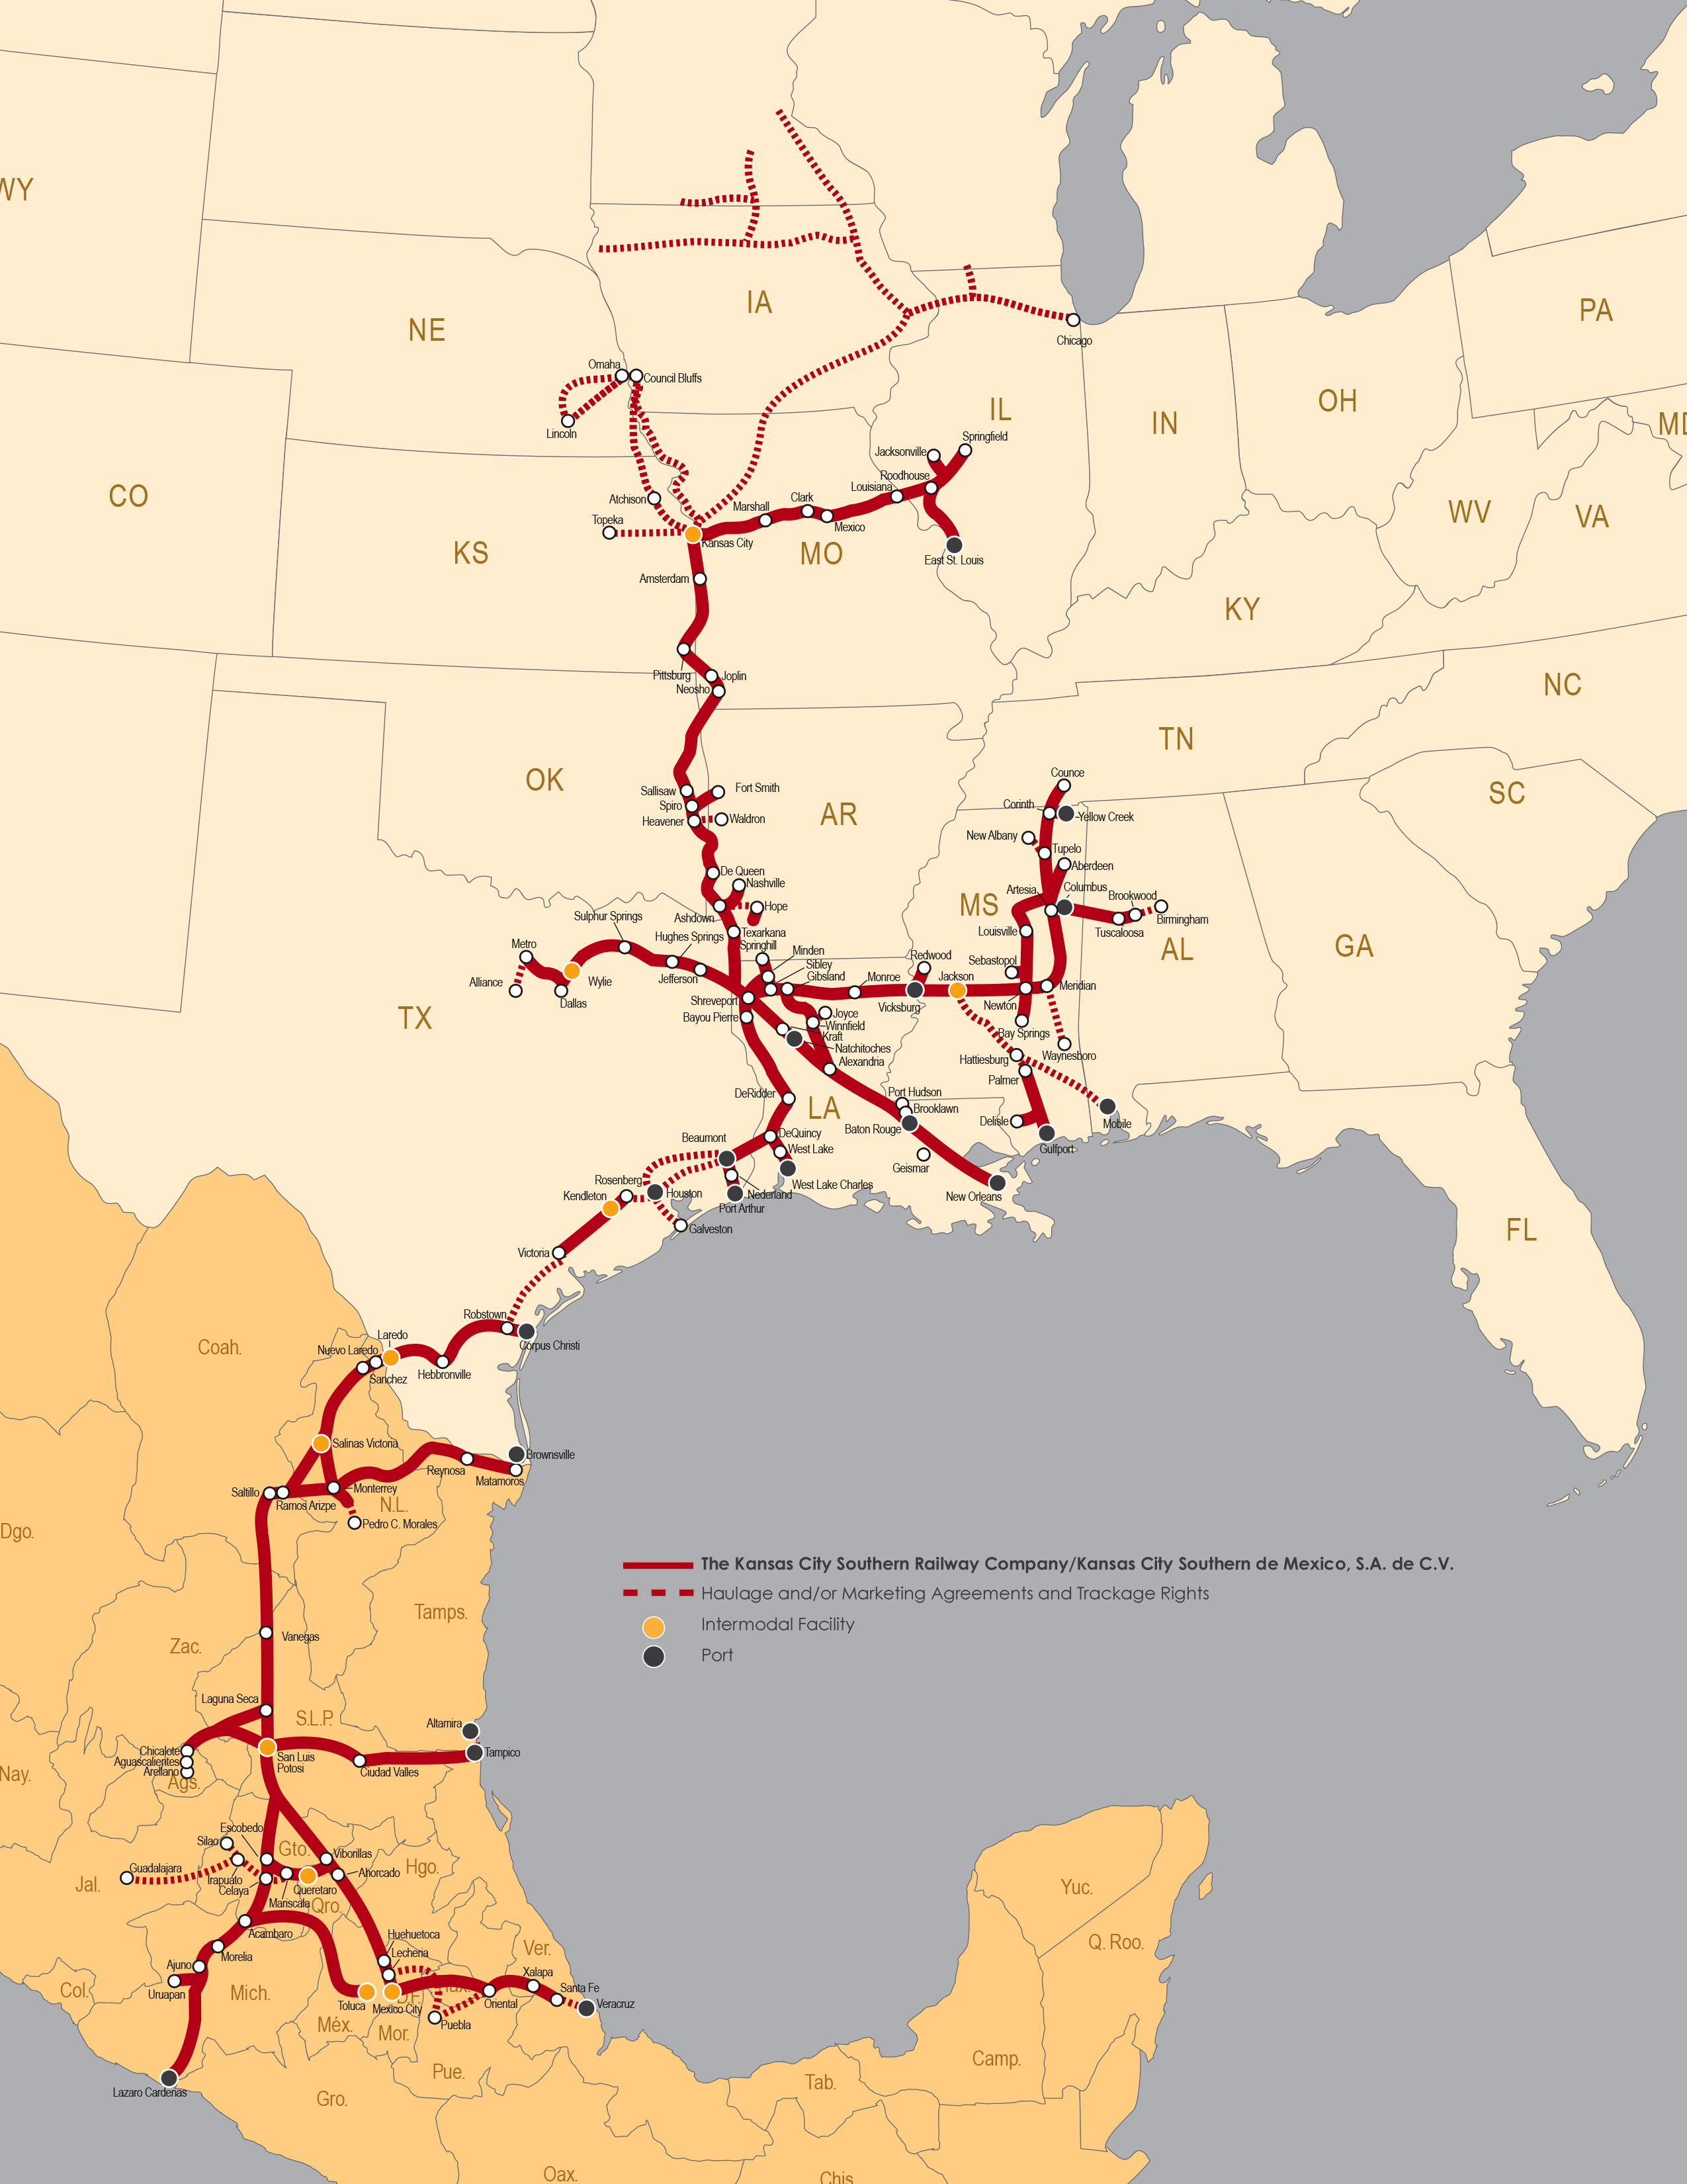
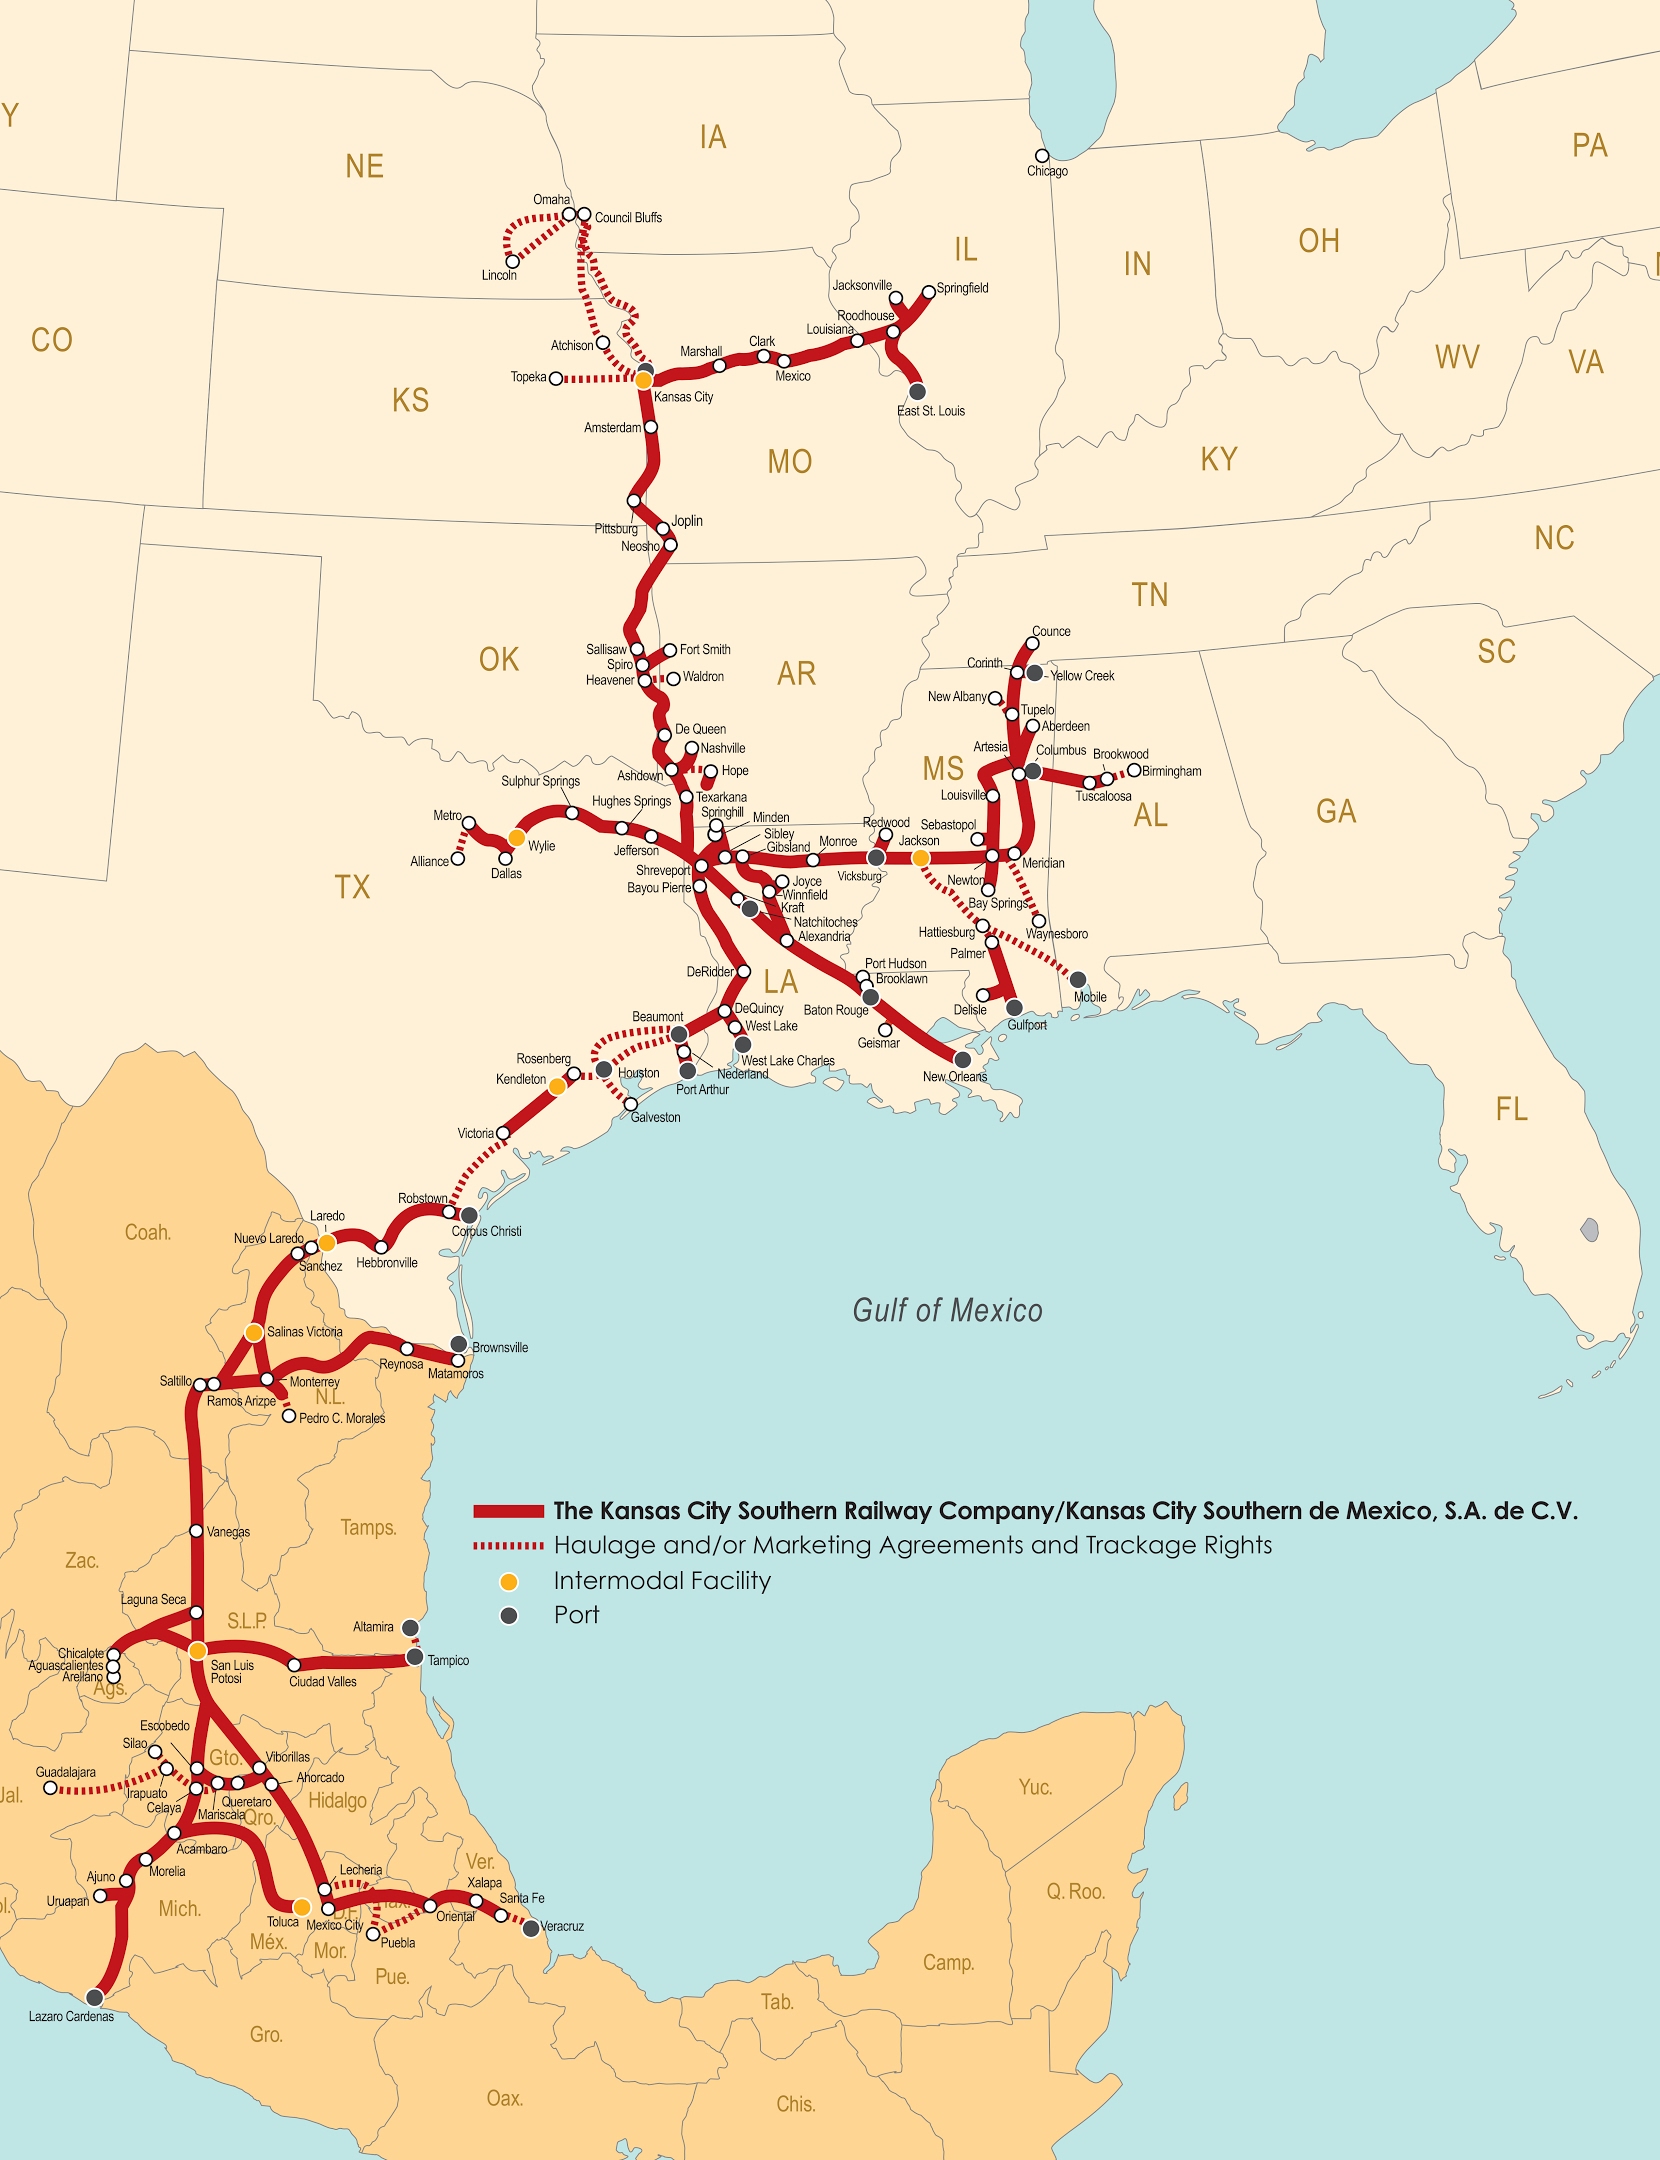
Kansas City Southern, a Delaware corporation, is a holding company with domestic and international rail operations in North America that are strategically focused on the growing north/south freight corridor connecting key commercial and industrial markets in the central United States with major industrial cities in Mexico. As used herein, “KCS” or the “Company” may refer to Kansas City Southern or, as the context requires, to one or more subsidiaries of Kansas City Southern. KCS and its subsidiaries had approximately 6,8207,200 employees on December 31, 20162018.
KCS controls and owns all of the stock of The Kansas City Southern Railway Company (“KCSR”), a U.S. Class I railroad founded in 1887. KCSR serves a ten-state region in the midwest and southeast regions of the United States and has the shortest north/south rail route between Kansas City, Missouri and several key ports along the Gulf of Mexico in Alabama, Louisiana, Mississippi and Texas.
KCS controls and owns all of the stock of Kansas City Southern de México, S.A. de C.V. (“KCSM”). Through its 50-year concession from the Mexican government (the “Concession”), which could expire in 2047 unless extended, KCSM operates a key commercial corridor of the Mexican railroad system and has as its core route the most strategic portion of the shortest, most direct rail passageway between Mexico City and Laredo, Texas. Laredo is a principal international gateway through which a substantial portion of rail and truck traffic between the United States and Mexico crosses the border. KCSM serves most of Mexico’s principal industrial cities and three of its major seaports. KCSM’s rail lines provide exclusive rail access to the United States and Mexico border crossing at Nuevo Laredo, Tamaulipas, the largest rail freight interchange point between the United States and Mexico.Tamaulipas. Under the Concession, KCSM has the right to controluse and operate the southern half of the rail bridge at Laredo, Texas, which spans the Rio Grande River between the United States and Mexico. The Company also controlsowns the northern half of this bridge through its ownership of Mexrail, Inc. (“Mexrail”).
KCSM also provides exclusive rail access to the Portport of Lazaro Cardenas on the Pacific Ocean. The Mexican government is developingdeveloped the port at Lazaro Cardenas principally to serve Mexican markets and as an alternative to the U.S. west coast ports for Asian and South American traffic bound for North America.
The Company wholly owns Mexrail which, in turn, wholly owns The Texas Mexican Railway Company (“Tex-Mex”). Tex-Mex owns a 157-mile rail line extending from Laredo, Texas to the port city of Corpus Christi, Texas, which connects the operations of KCSR with KCSM.
The KCS coordinated rail network (KCSR, KCSM and Tex-Mex) comprises approximately 6,6006,700 route miles extending from the midwest and southeast portions of the United States south into Mexico and connects with all other Class I railroads, providing shippers with an effective alternative to other railroad routes and giving direct access to Mexico and the southeast and southwest United States through alternate interchange hubs.
Panama Canal Railway Company (“PCRC”), an unconsolidated joint venture company owned equally by KCS and Mi-Jack Products, Inc. (“Mi-Jack”), was awarded a concession from the Republic of Panama to reconstruct and operate the Panama Canal Railway, a 47-mile railroad located adjacent to the Panama Canal that provides international container shipping companies with a railway transportation alternative to the Panama Canal. The Concessionconcession was awarded in 1998 for an initial term of 25 years with an automatic renewal for an additional 25 year25-year term. The Panama Canal Railway is a north-south railroad traversing the Isthmusisthmus of Panama between the Atlantic and Pacific Oceans.oceans.
Other subsidiaries and affiliates of KCS include the following:
KCSM Servicios, S.A. de C.V. (“KCSM Servicios”), a wholly-owned and consolidated subsidiary that provides employee services to KCSM;
Meridian Speedway, LLC (“MSLLC”), a seventy percent-owned consolidated affiliate that owns the former KCSR rail line between Meridian, Mississippi and Shreveport, Louisiana, which is the portion of the rail line between Dallas, Texas and Meridian known as the “Meridian Speedway.” Norfolk Southern Corporation, through its wholly-owned subsidiary, The Alabama Great Southern Railroad Company, owns the remaining thirty percent of MSLLC.MSLLC;
TFCM, S. de R.L. de C.V. (“TCM”), a forty-five percent-owned unconsolidated affiliate that operates a bulk liquid terminal in San Luis Potosí, Mexico;
Ferrocarril y Terminal del Valle de México, S.A. de C.V. (“FTVM”), a twenty-five percent-owned unconsolidated affiliate that provides railroad services as well as ancillary services in the greater Mexico City area; and
PTC-220, LLC (“PTC-220”), a fourteen percent-owned unconsolidated affiliate that holds the licenses to large blocks of radio spectrum and other assets for the deployment of positive train controlPositive Train Control (“PTC”). See Government Regulation section for further information regarding PTC.
MARKETS SERVED
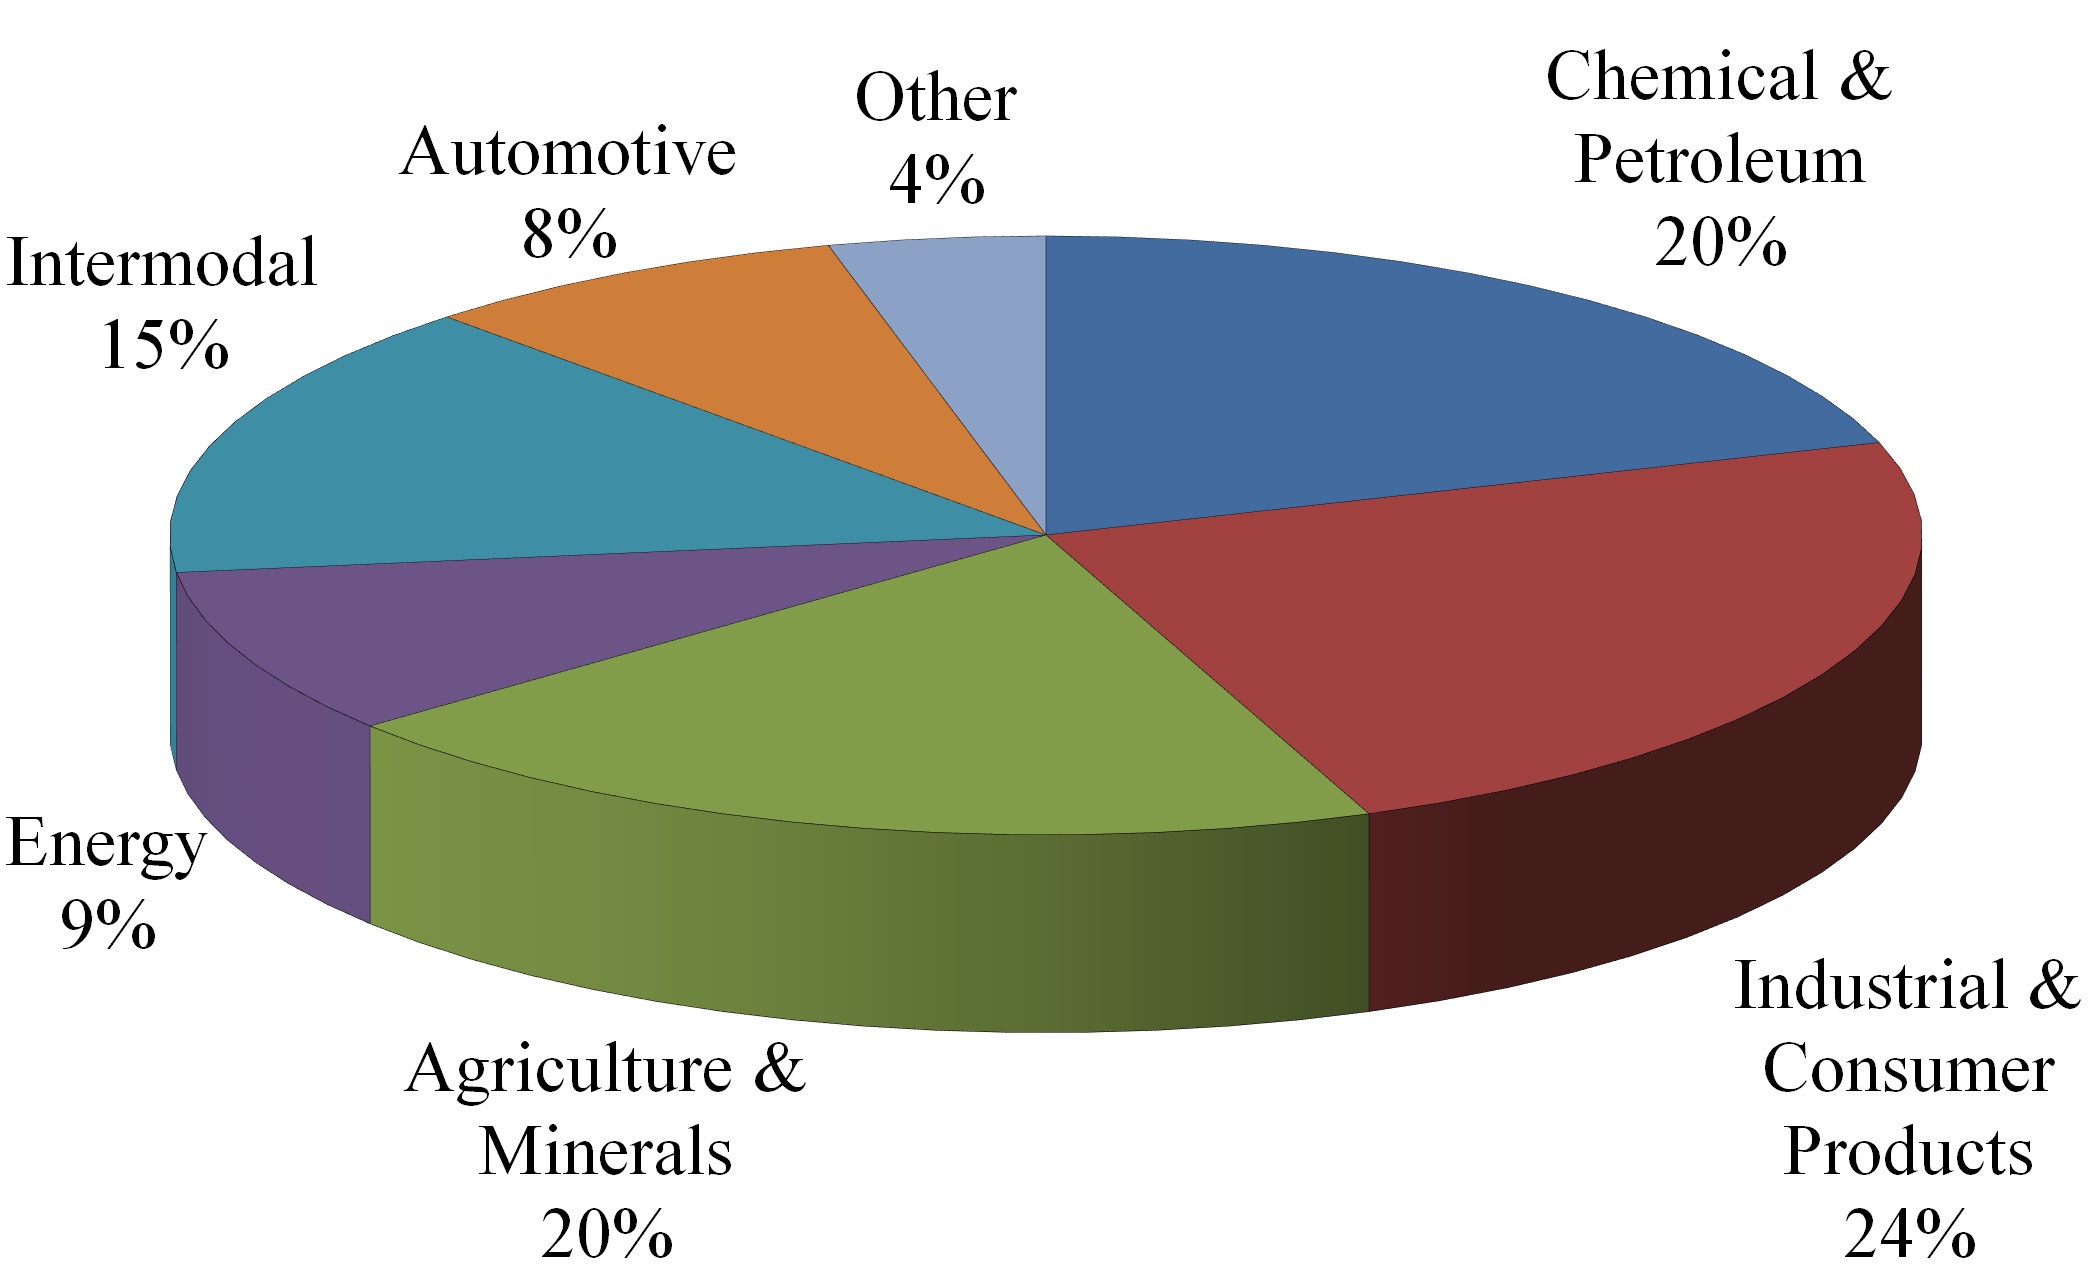
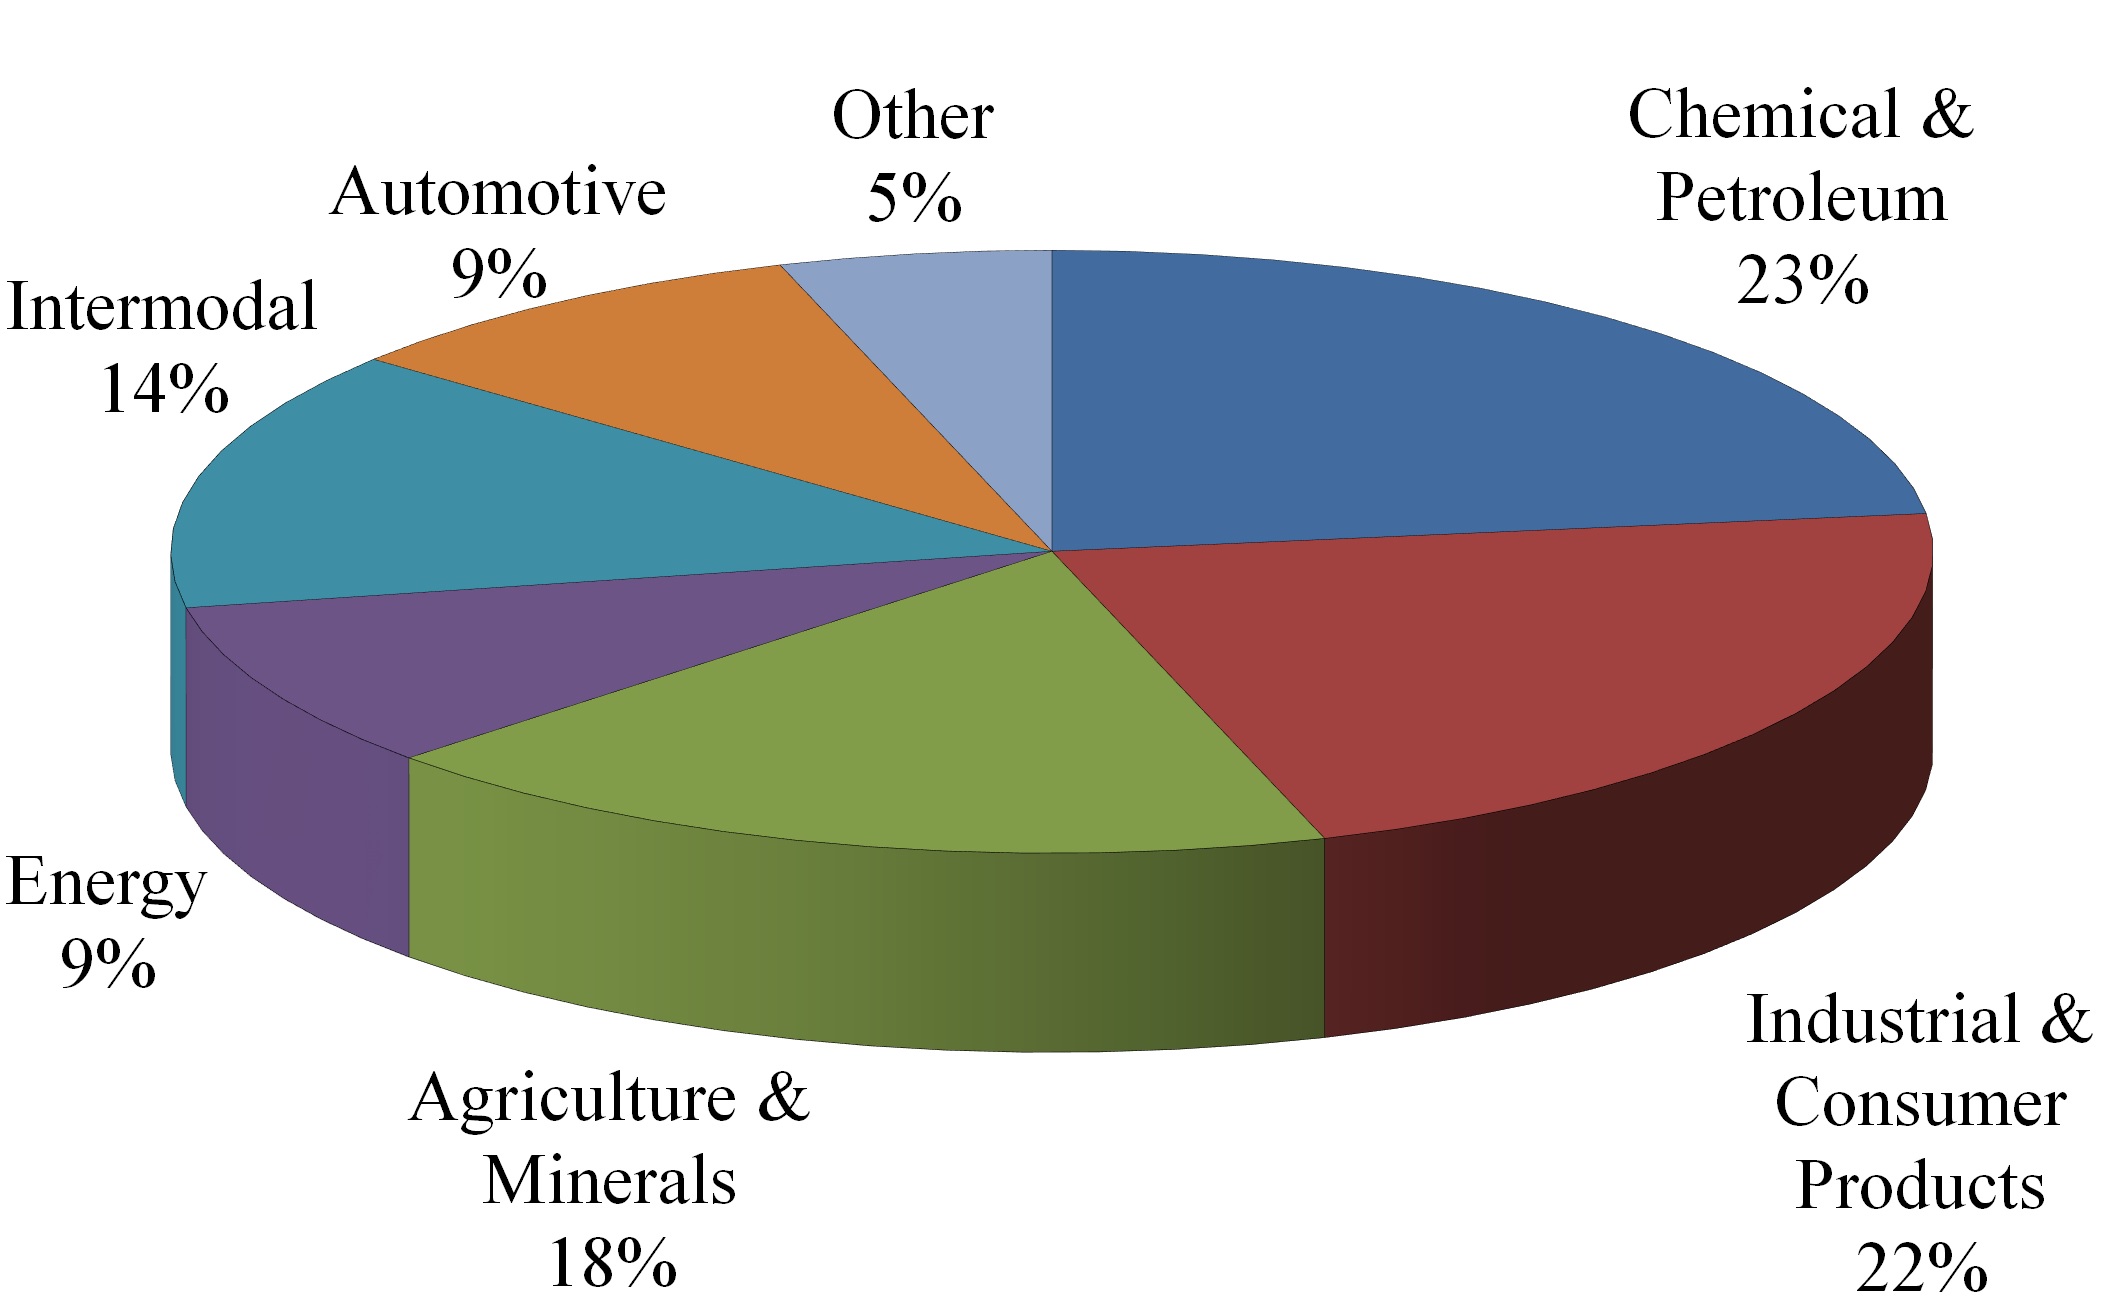
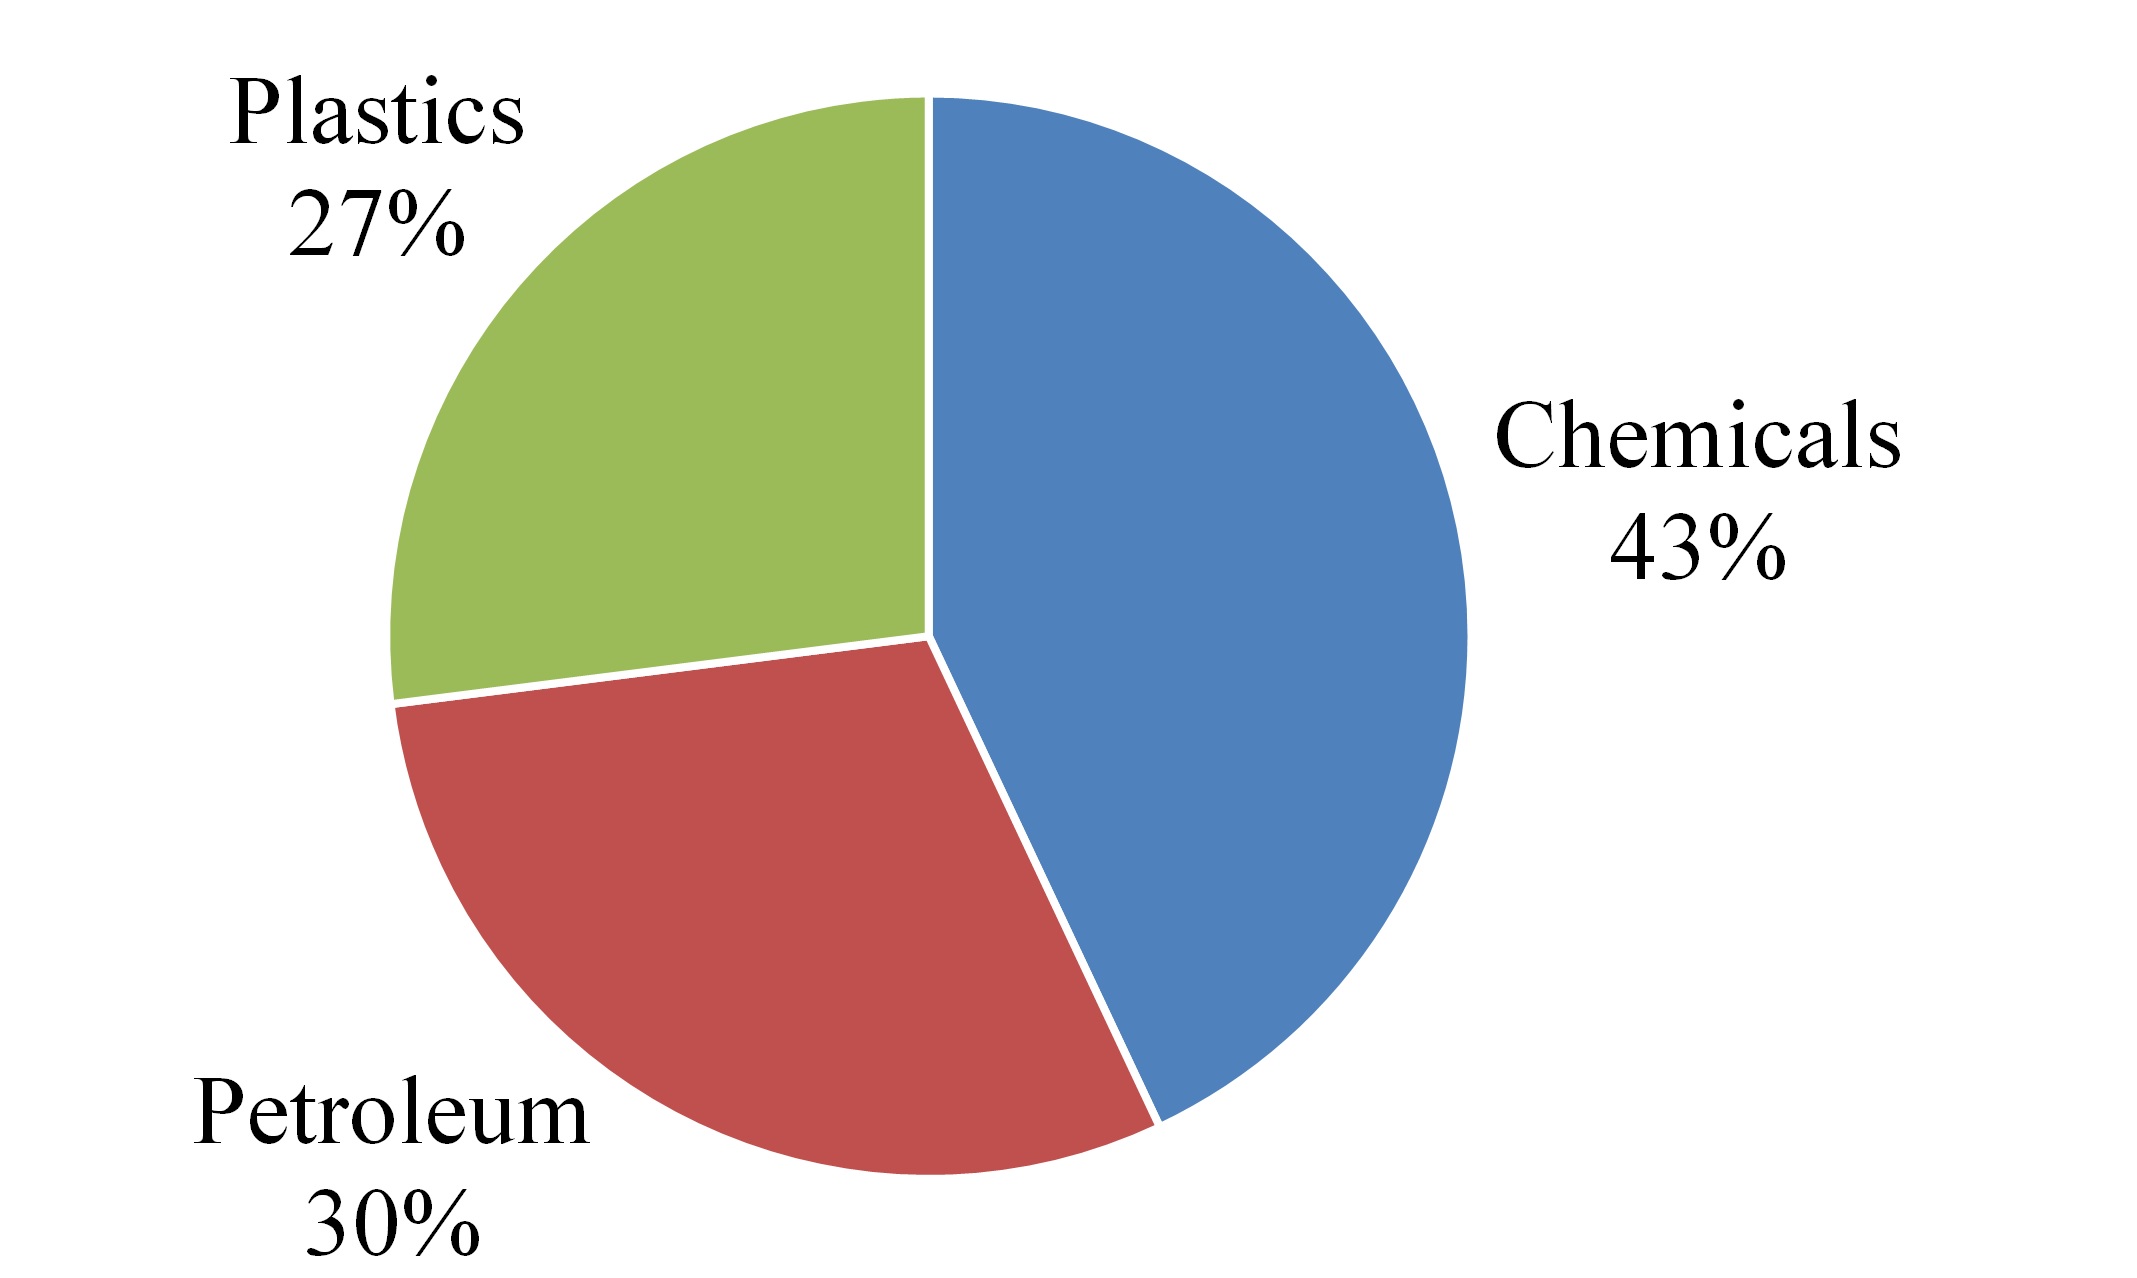
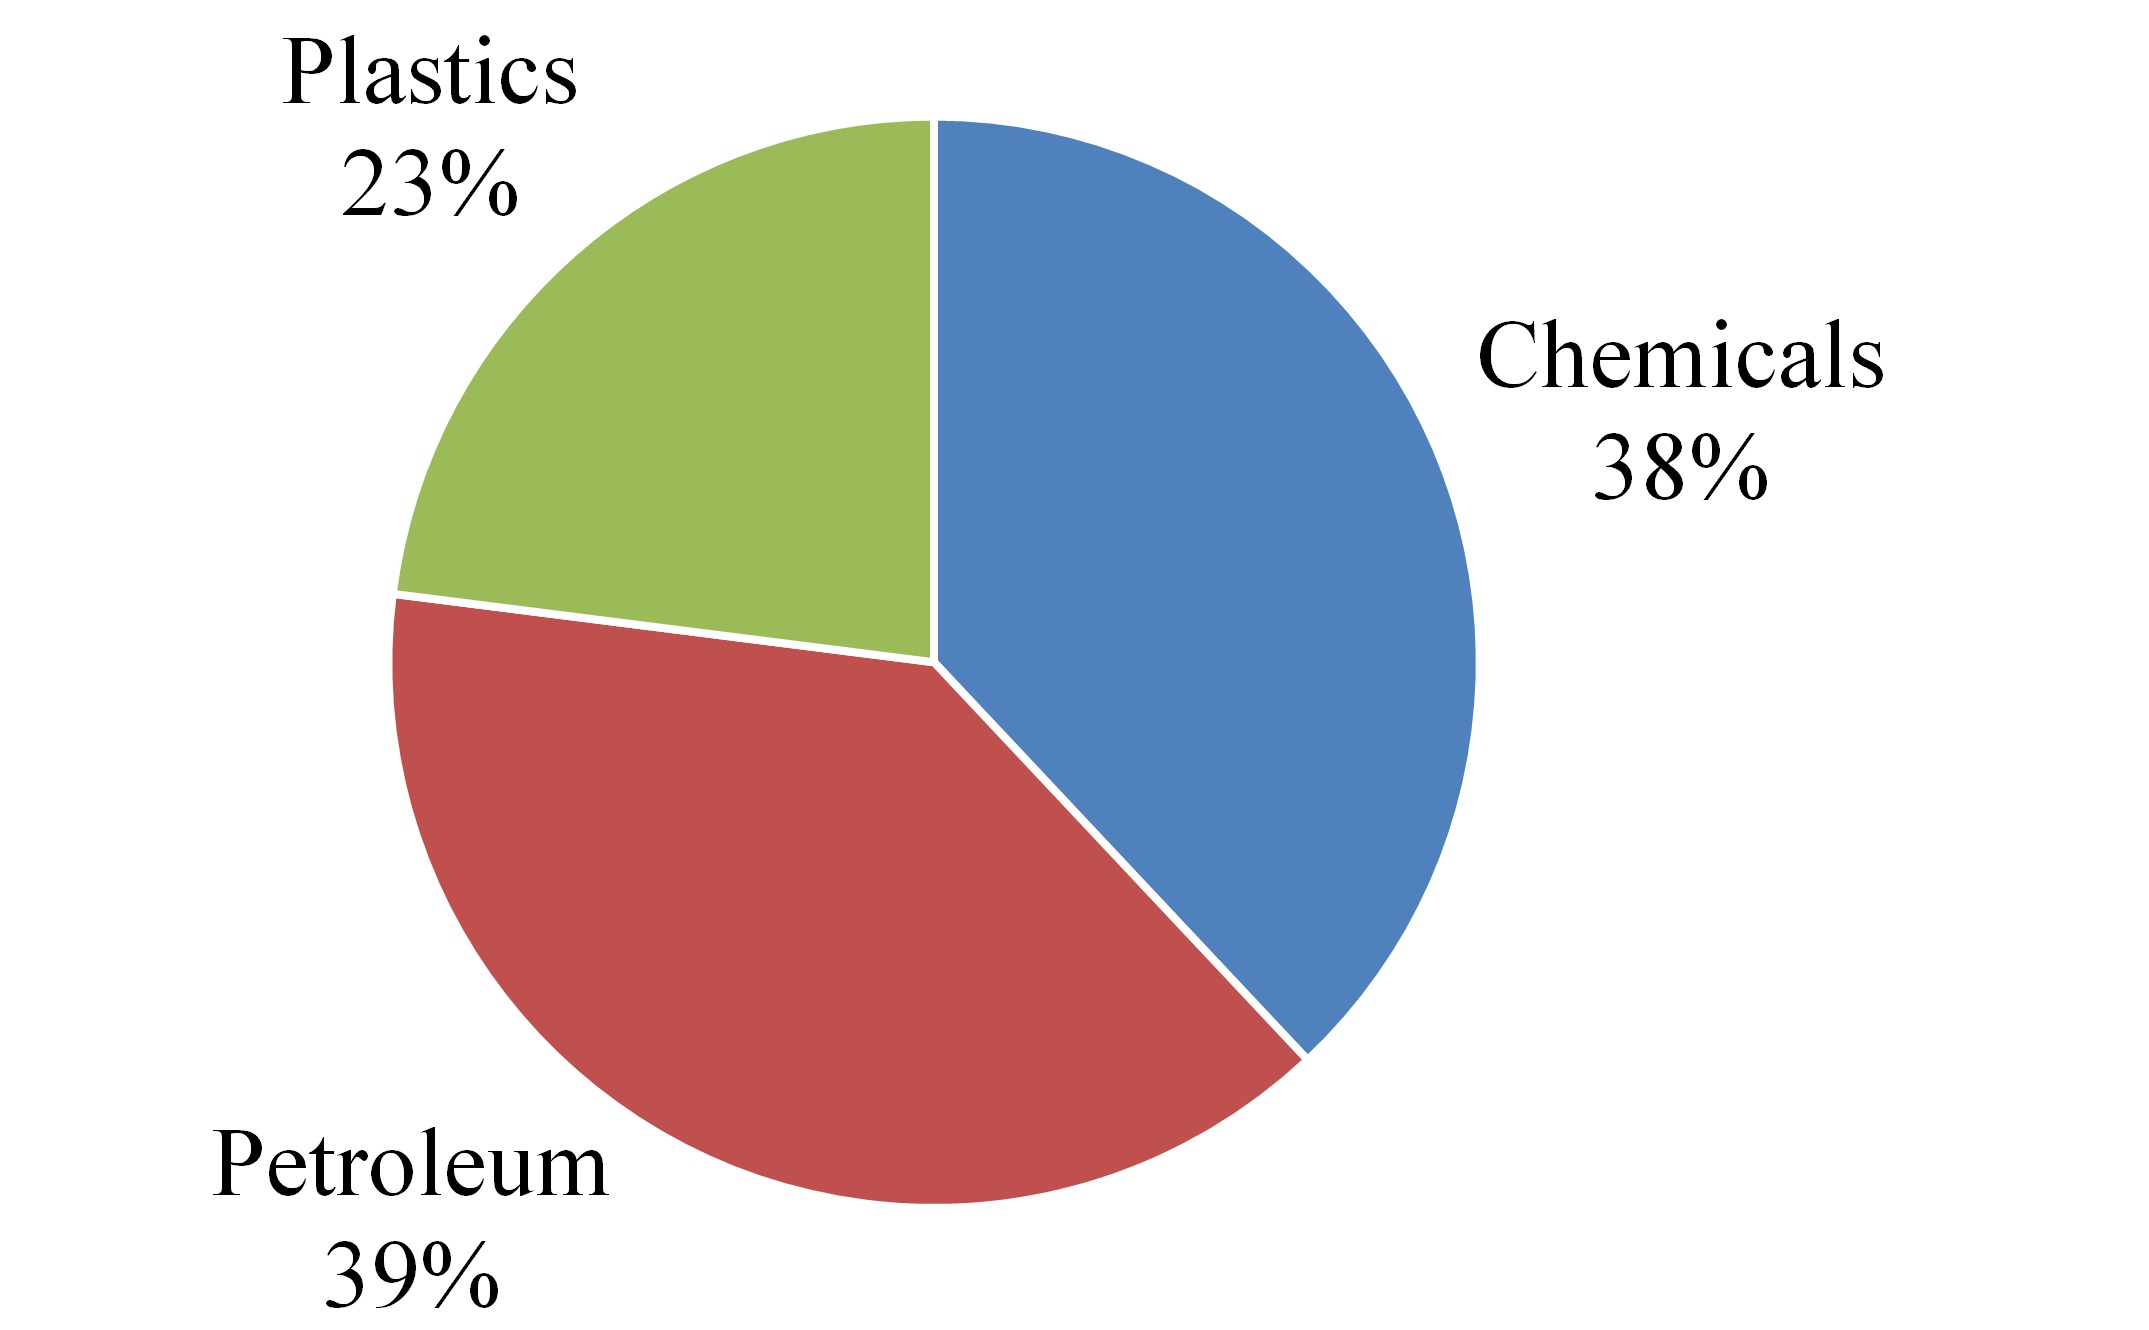
|
| |
| | 20162018 Revenues
Business Mix |
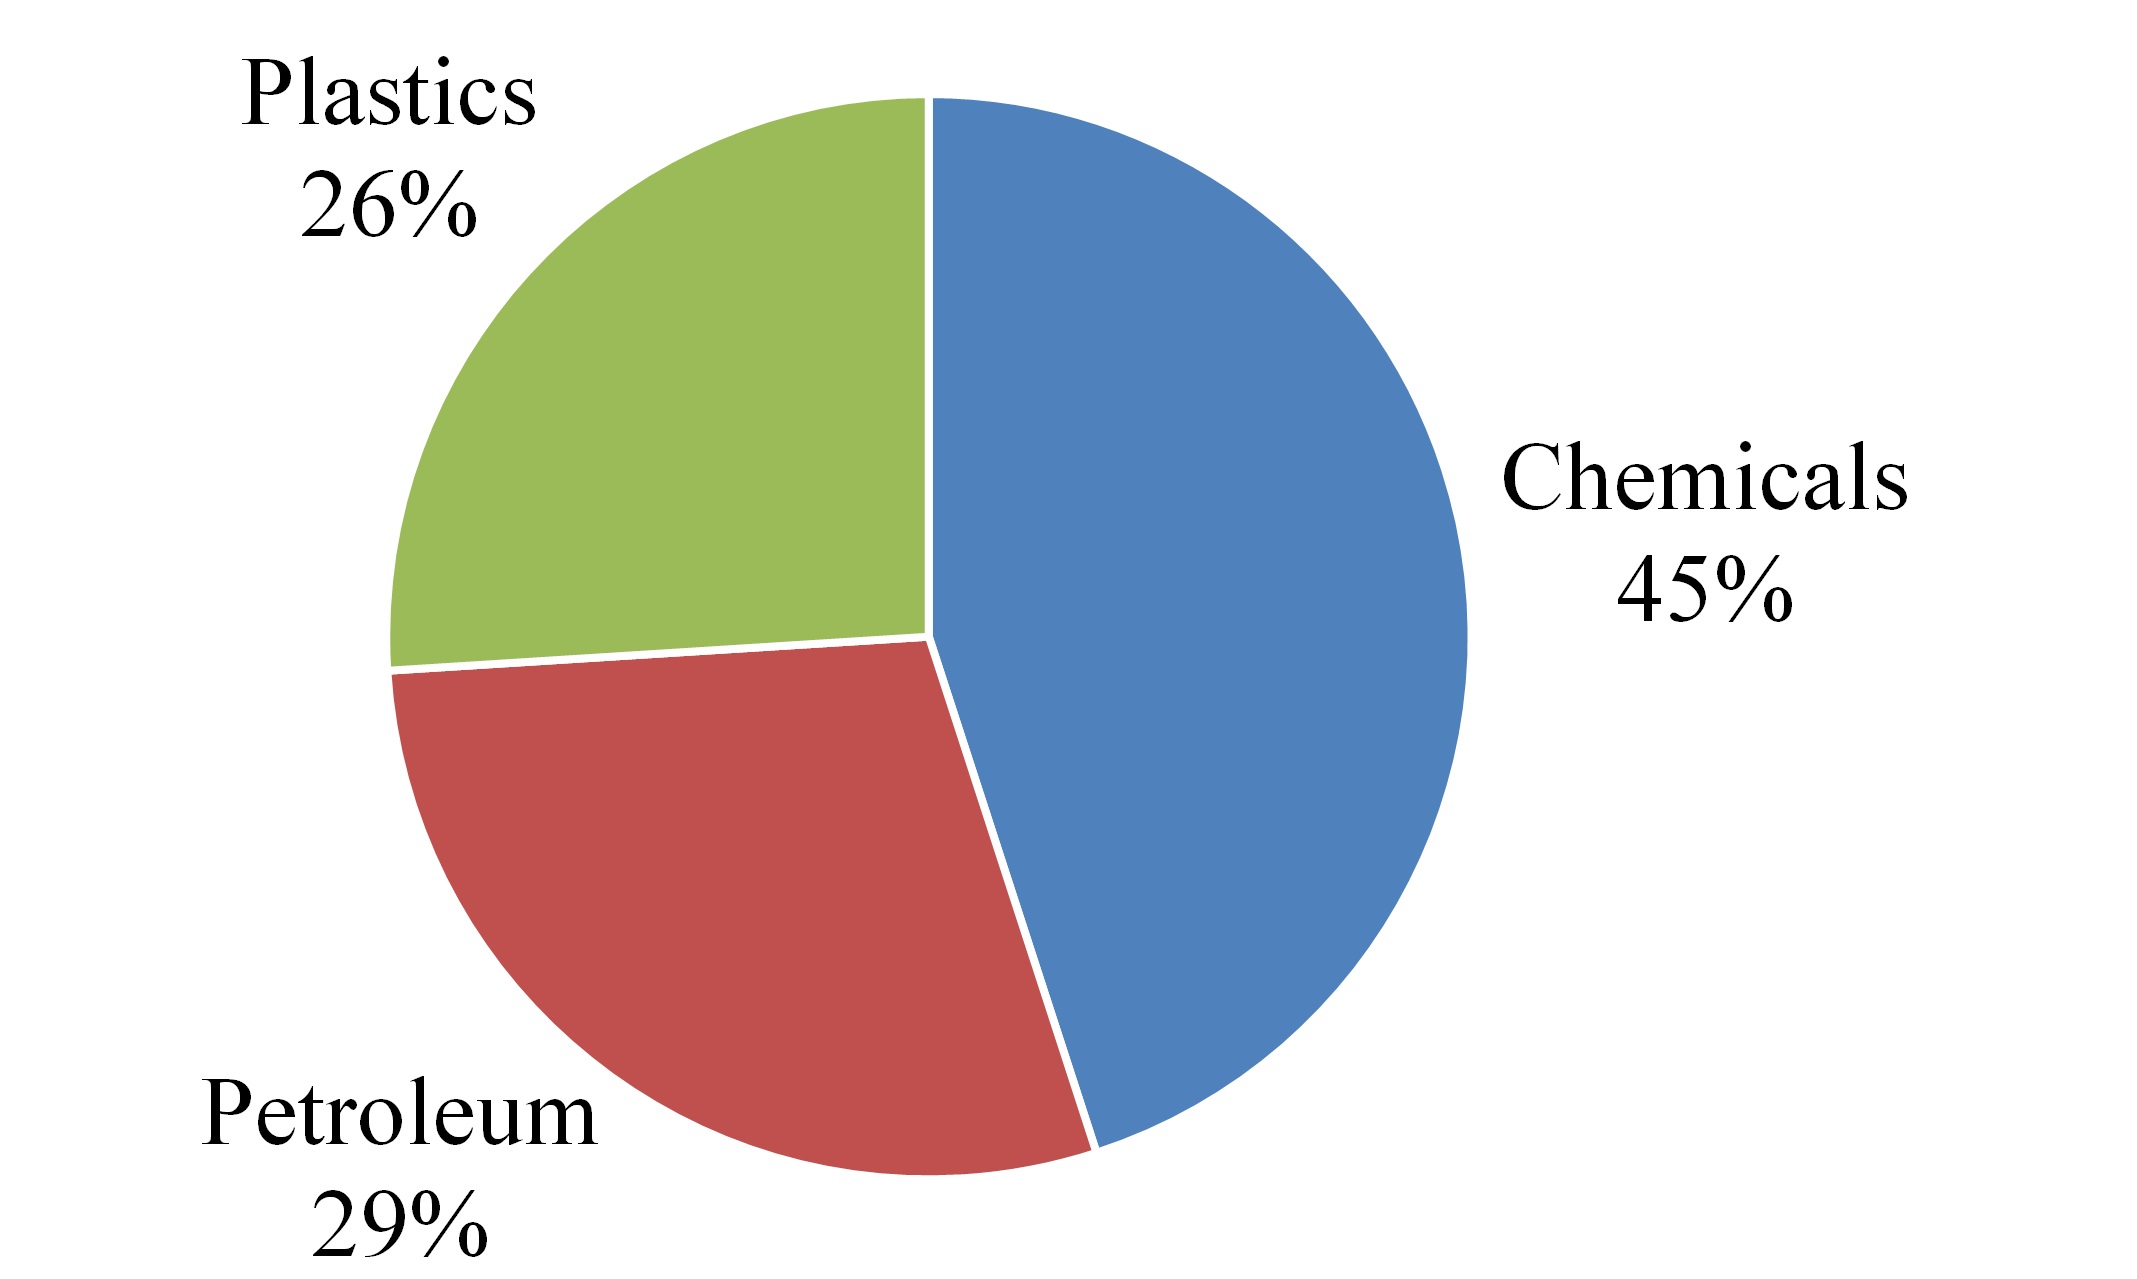
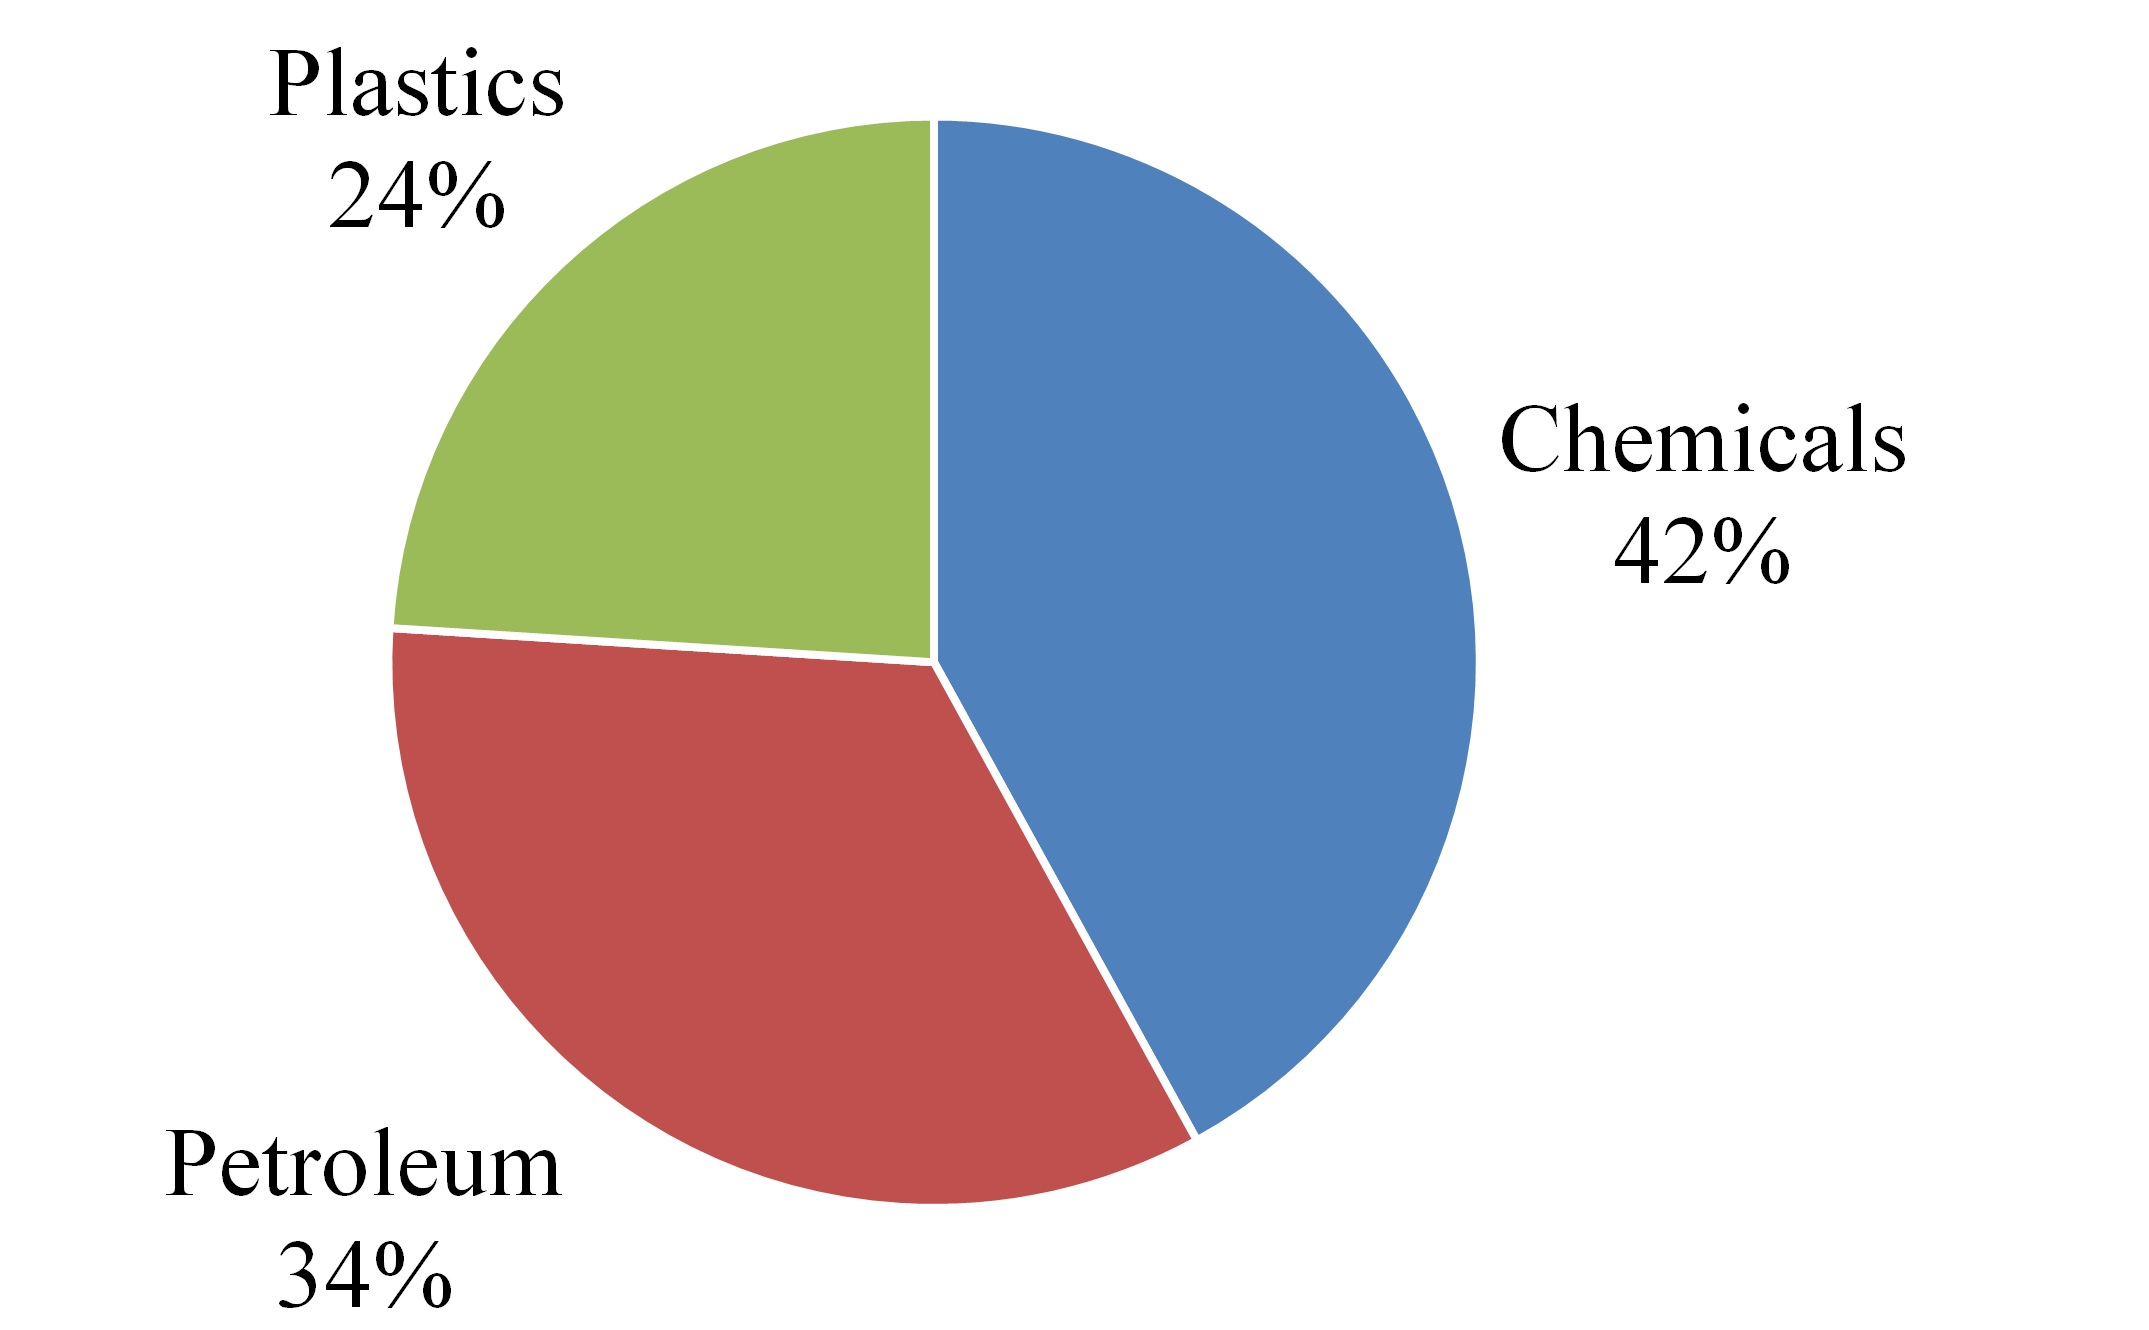
Chemical and petroleum. This sectorcommodity group includes products such as chemicals, plastics, otherpetroleum, liquefied petroleum gas, and petroleum refined products, such as gasoline and miscellaneous chemicals.diesel. KCS transports these products to markets in the midwest, southeast and northeast United States and throughout Mexico through interchanges with other rail carriers. The products within the chemicalschemical and plastics channelsplastic products are used in the automotive, housing and packaging industries as well as in general manufacturing. KCS hauls petroleum products across its network and as U.S. petroleum refineries have continued to increase their refining capacity, they have coordinated with KCS to develop additional long-term storage opportunities which complement a fluid freight railroad operation. | |
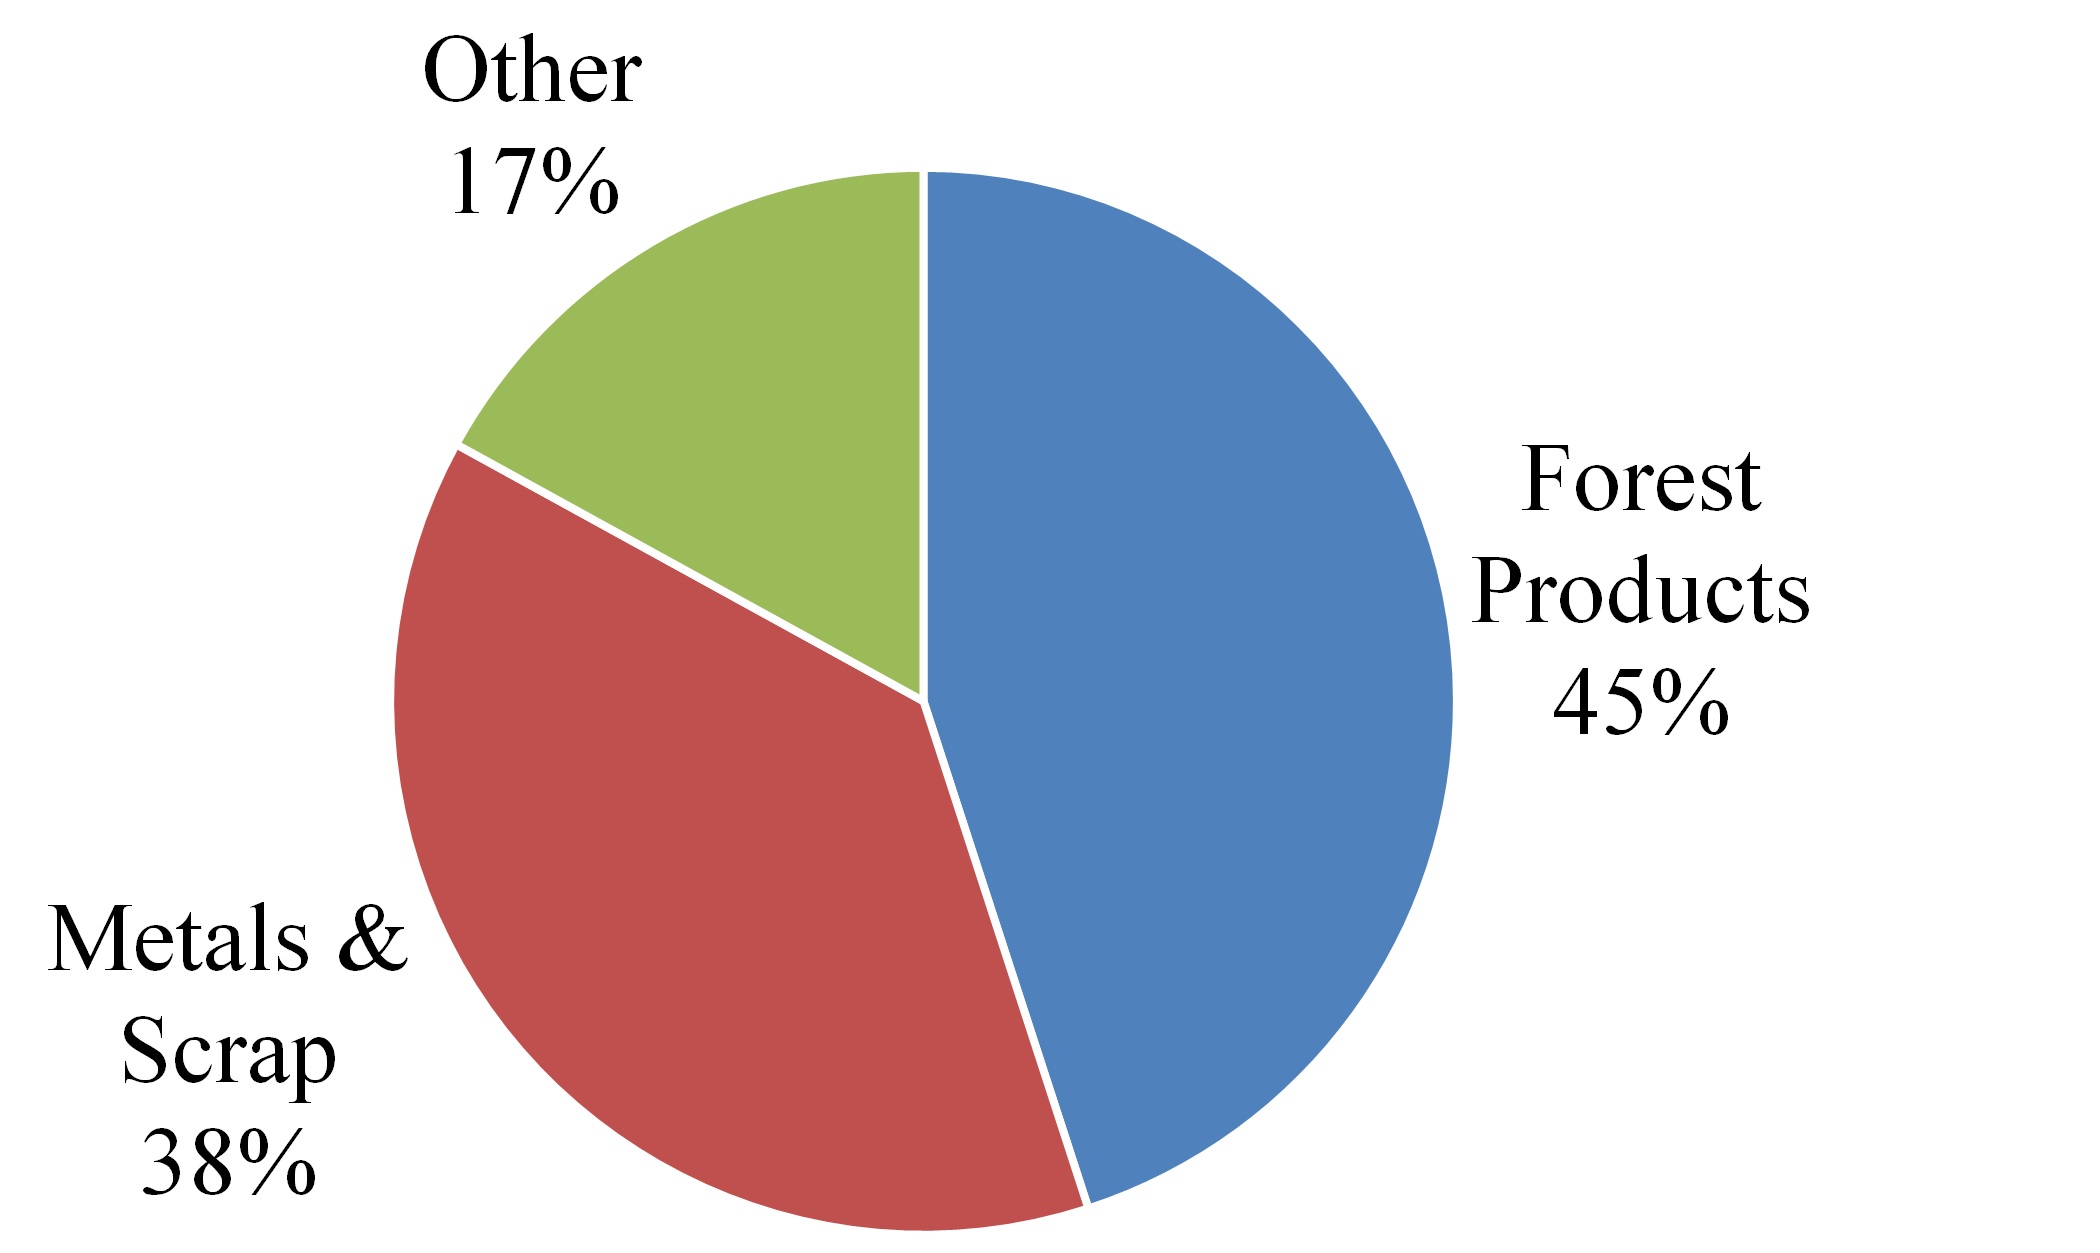
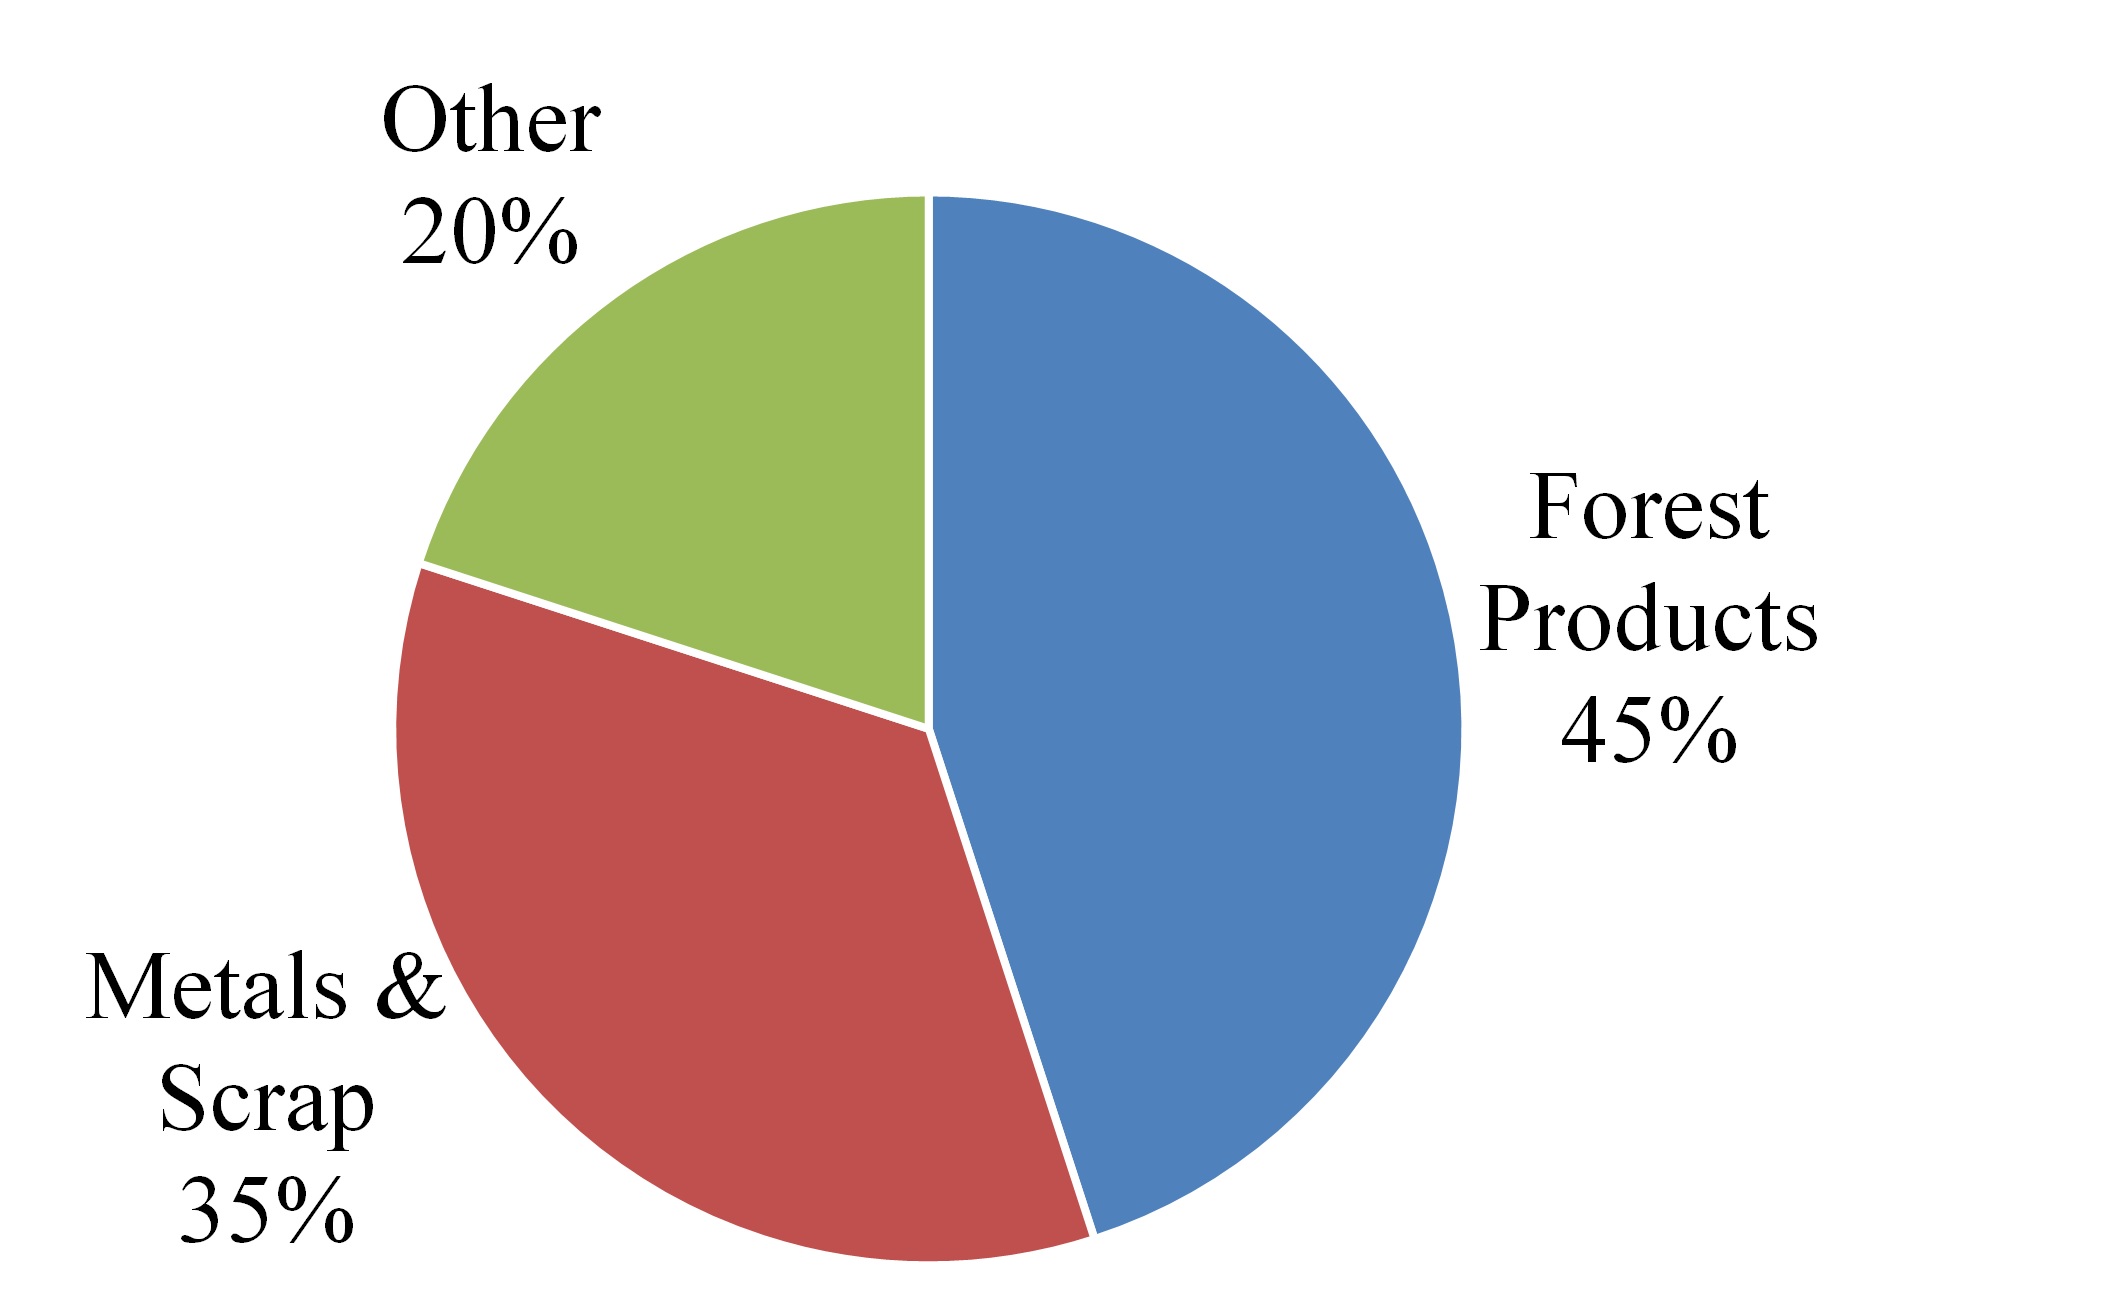
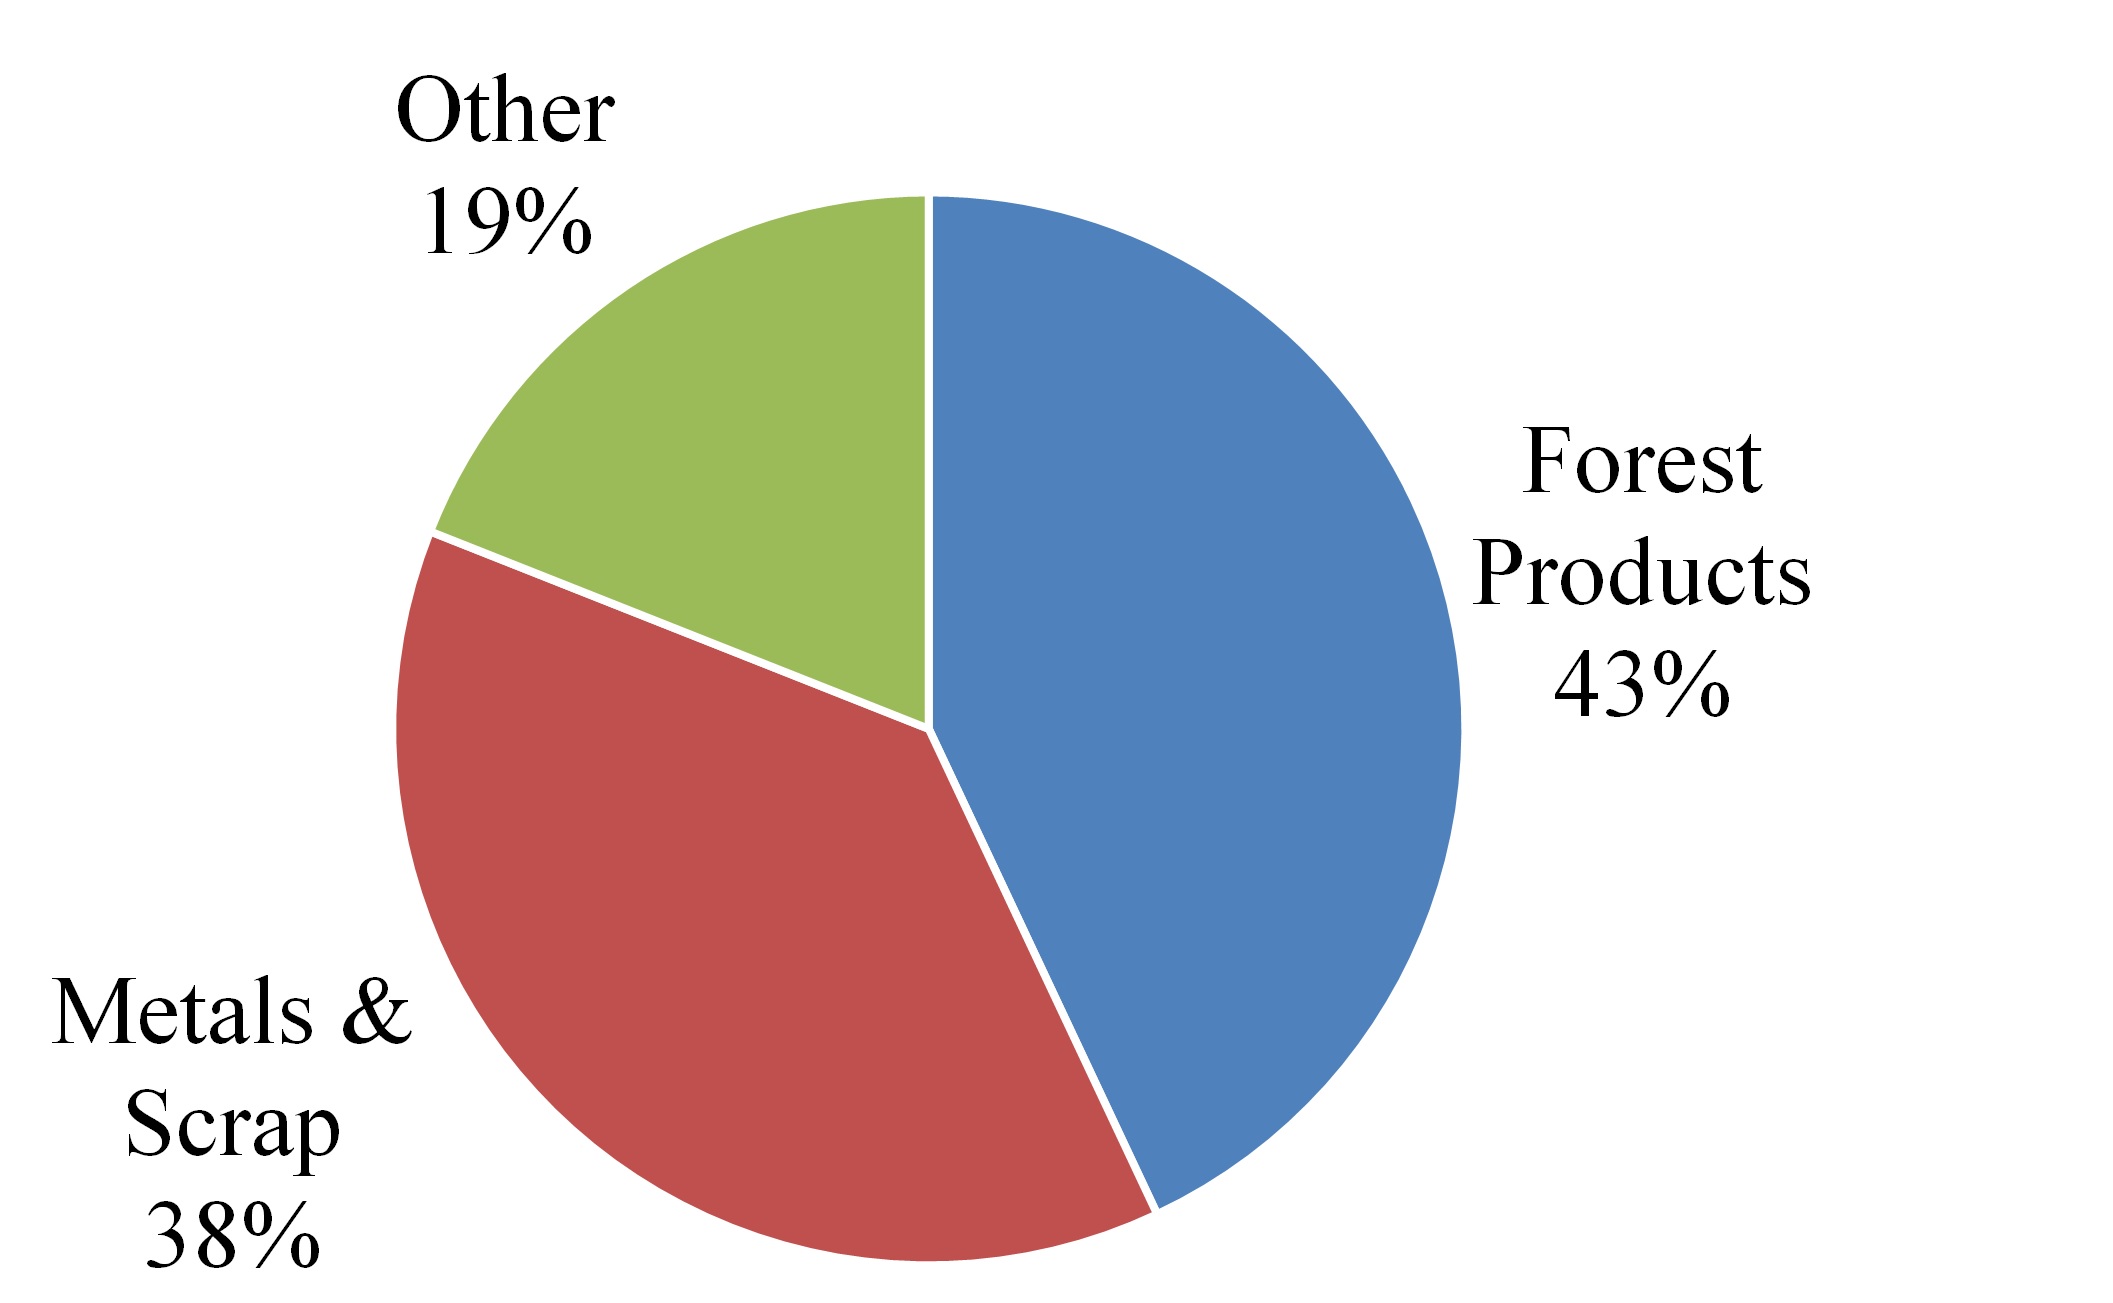
Industrial and consumer products. This sectorcommodity group includes forest products as well as metals and scrap. Forest products consist of shipments to and from paper and lumber mills in the southeast United States timber-producing region that KCS serves directly and indirectly through its various short-line connections. Metals and scrap consist of shipments of steel and metallic ores such as iron, steel, zinc and copper. The majority of metals, mineralssteel produced and metallic ores mined and steel produced in Mexico are consumed within Mexico. The volume of Mexican steel domestic consumption and exports fluctuates based on global market prices. Higher-end finished products such as steel coils are used by Mexican manufacturers in automobiles, household appliances, the oil and gas industry, and other consumer goods which are imported from the United States through land borders and through the seaports served by KCS’s rail network. KCS also transports steel coils, plates and pipe from U.S. and Mexican basedMexican-based mini-mills to locations in the U.S. and Mexico for oil drilling, appliance and automotive applications.
This sectorcommodity group also serves paper mills directlyincludes U.S. military transports, Mexico and indirectly through its various short-line connections. KCS’s rail lines run throughU.S. domestic cement shipments and appliances manufactured in Mexico that are imported into the heart of the southeast United States timber-producing region. Additionally, KCS is uniquely positioned to serve many paper mills in the southeast United States whose products are increasing in demand due to a general growth of consumer goods and industrial production in central Mexico.States.
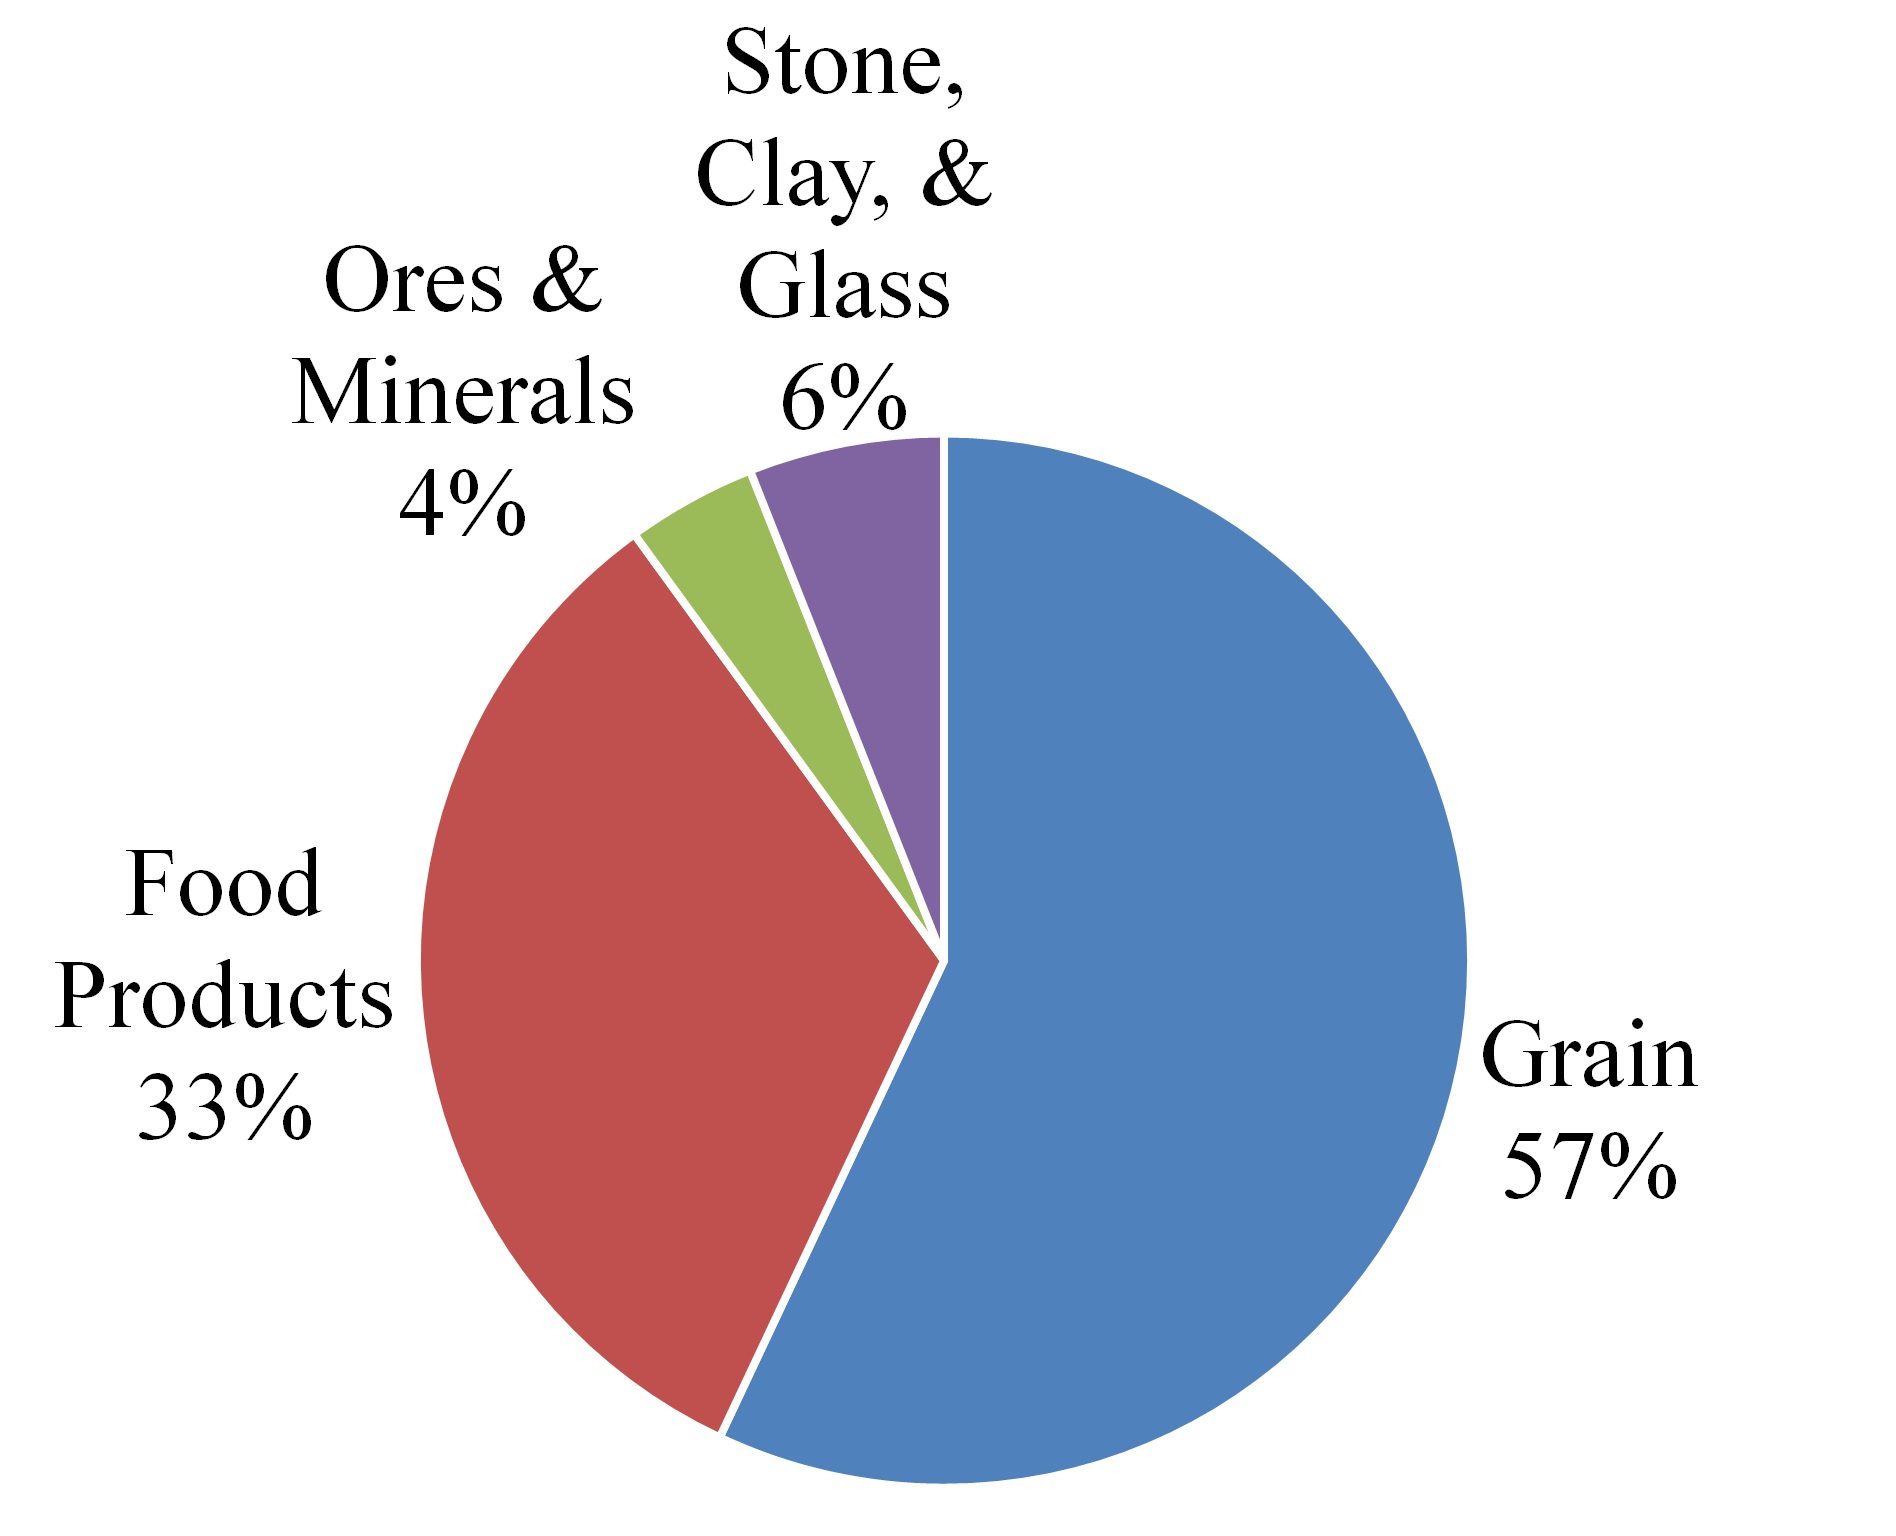
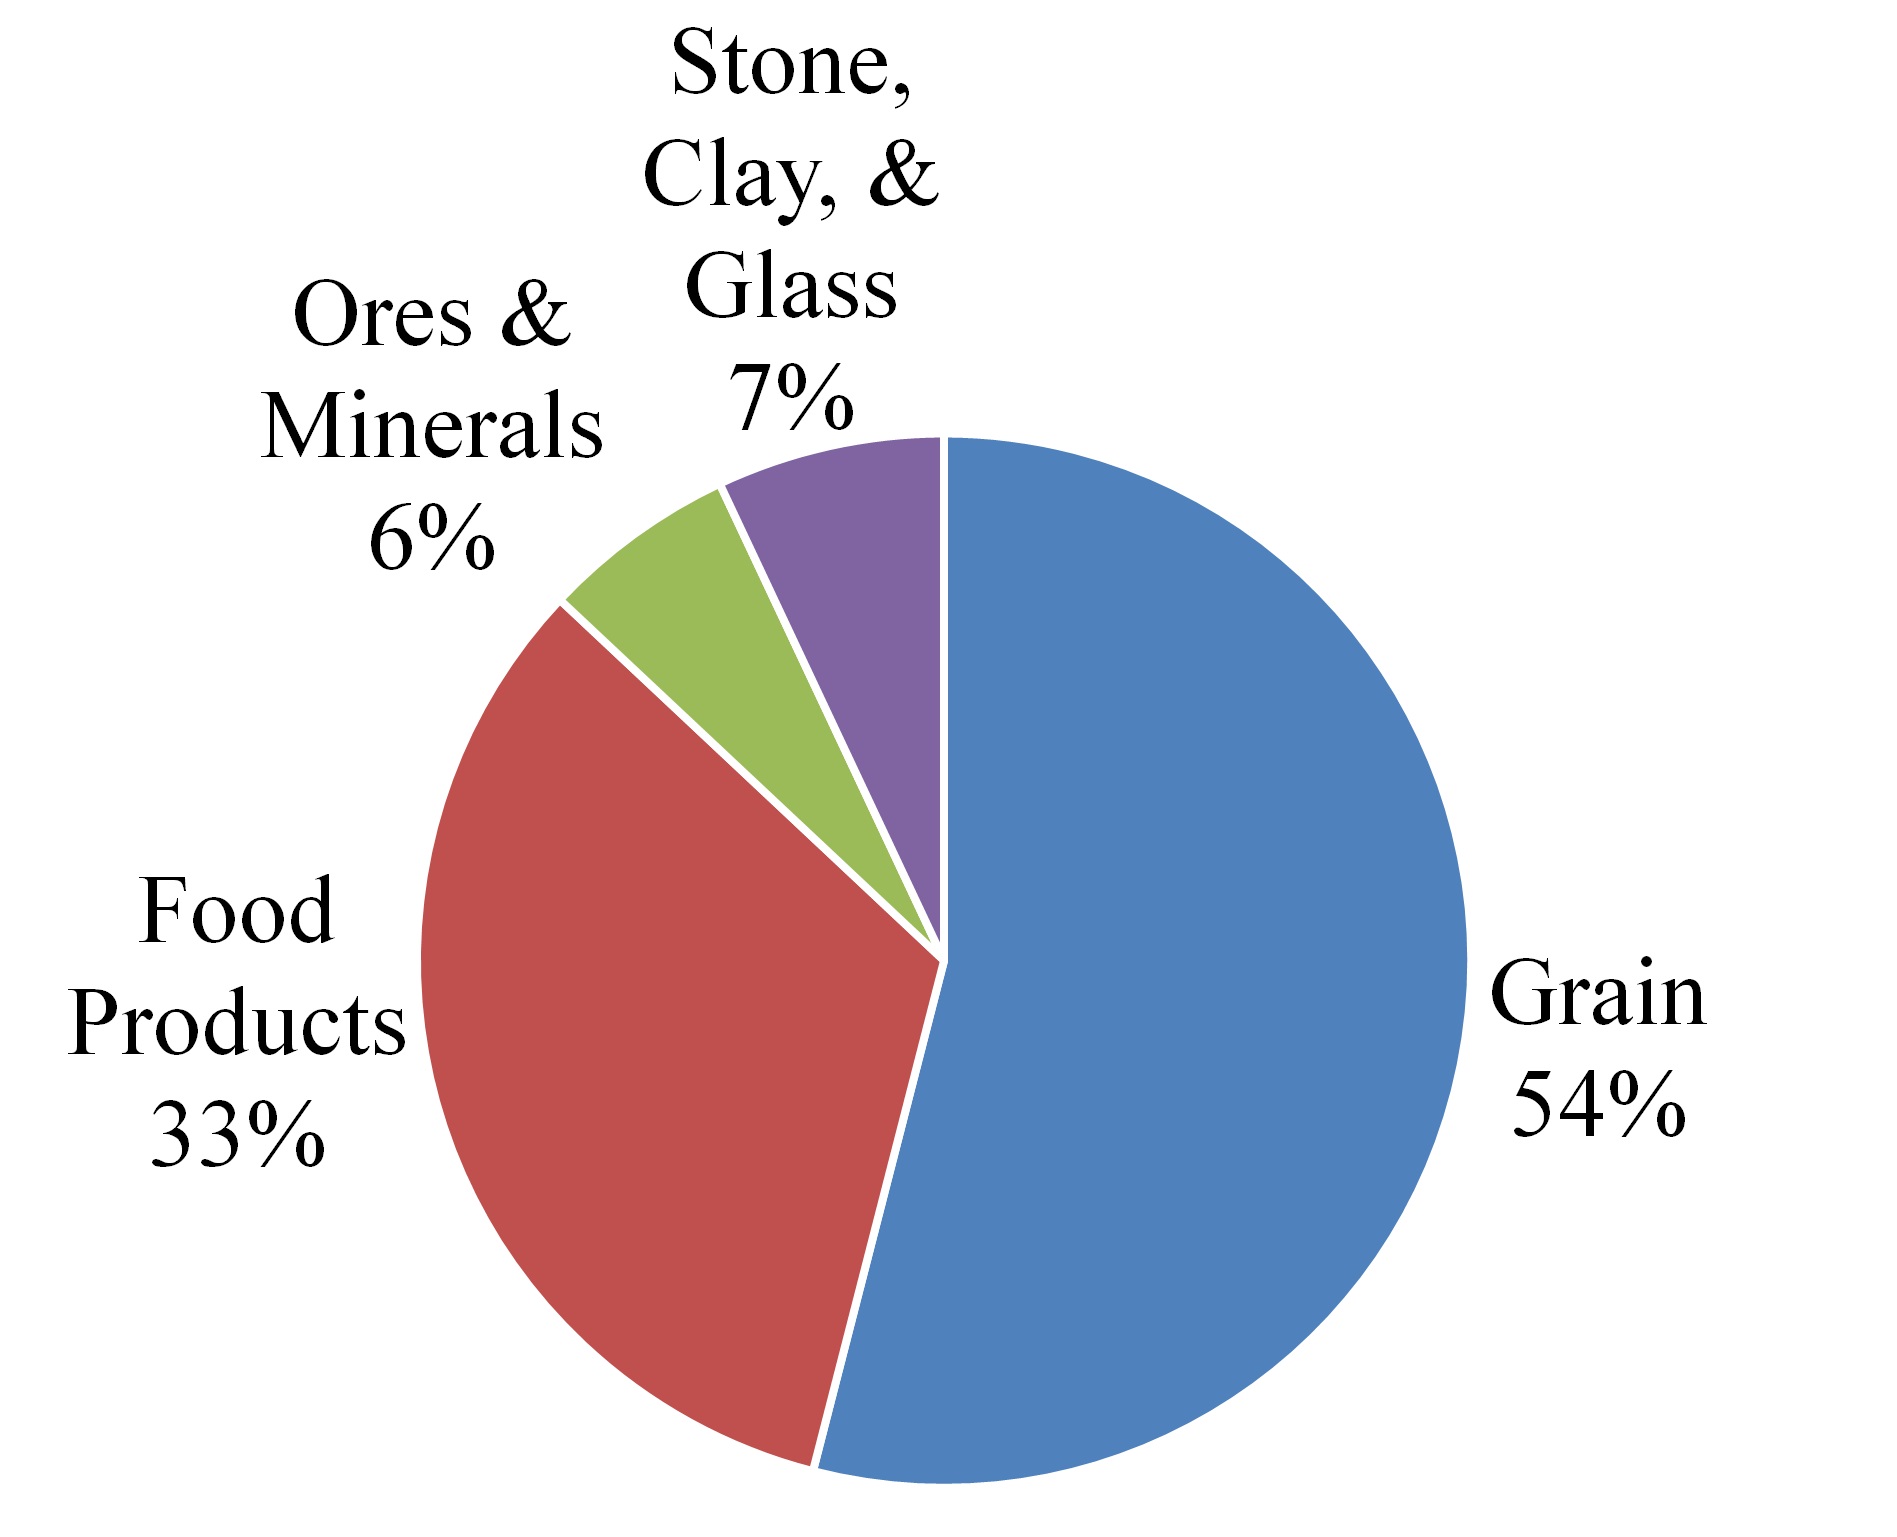
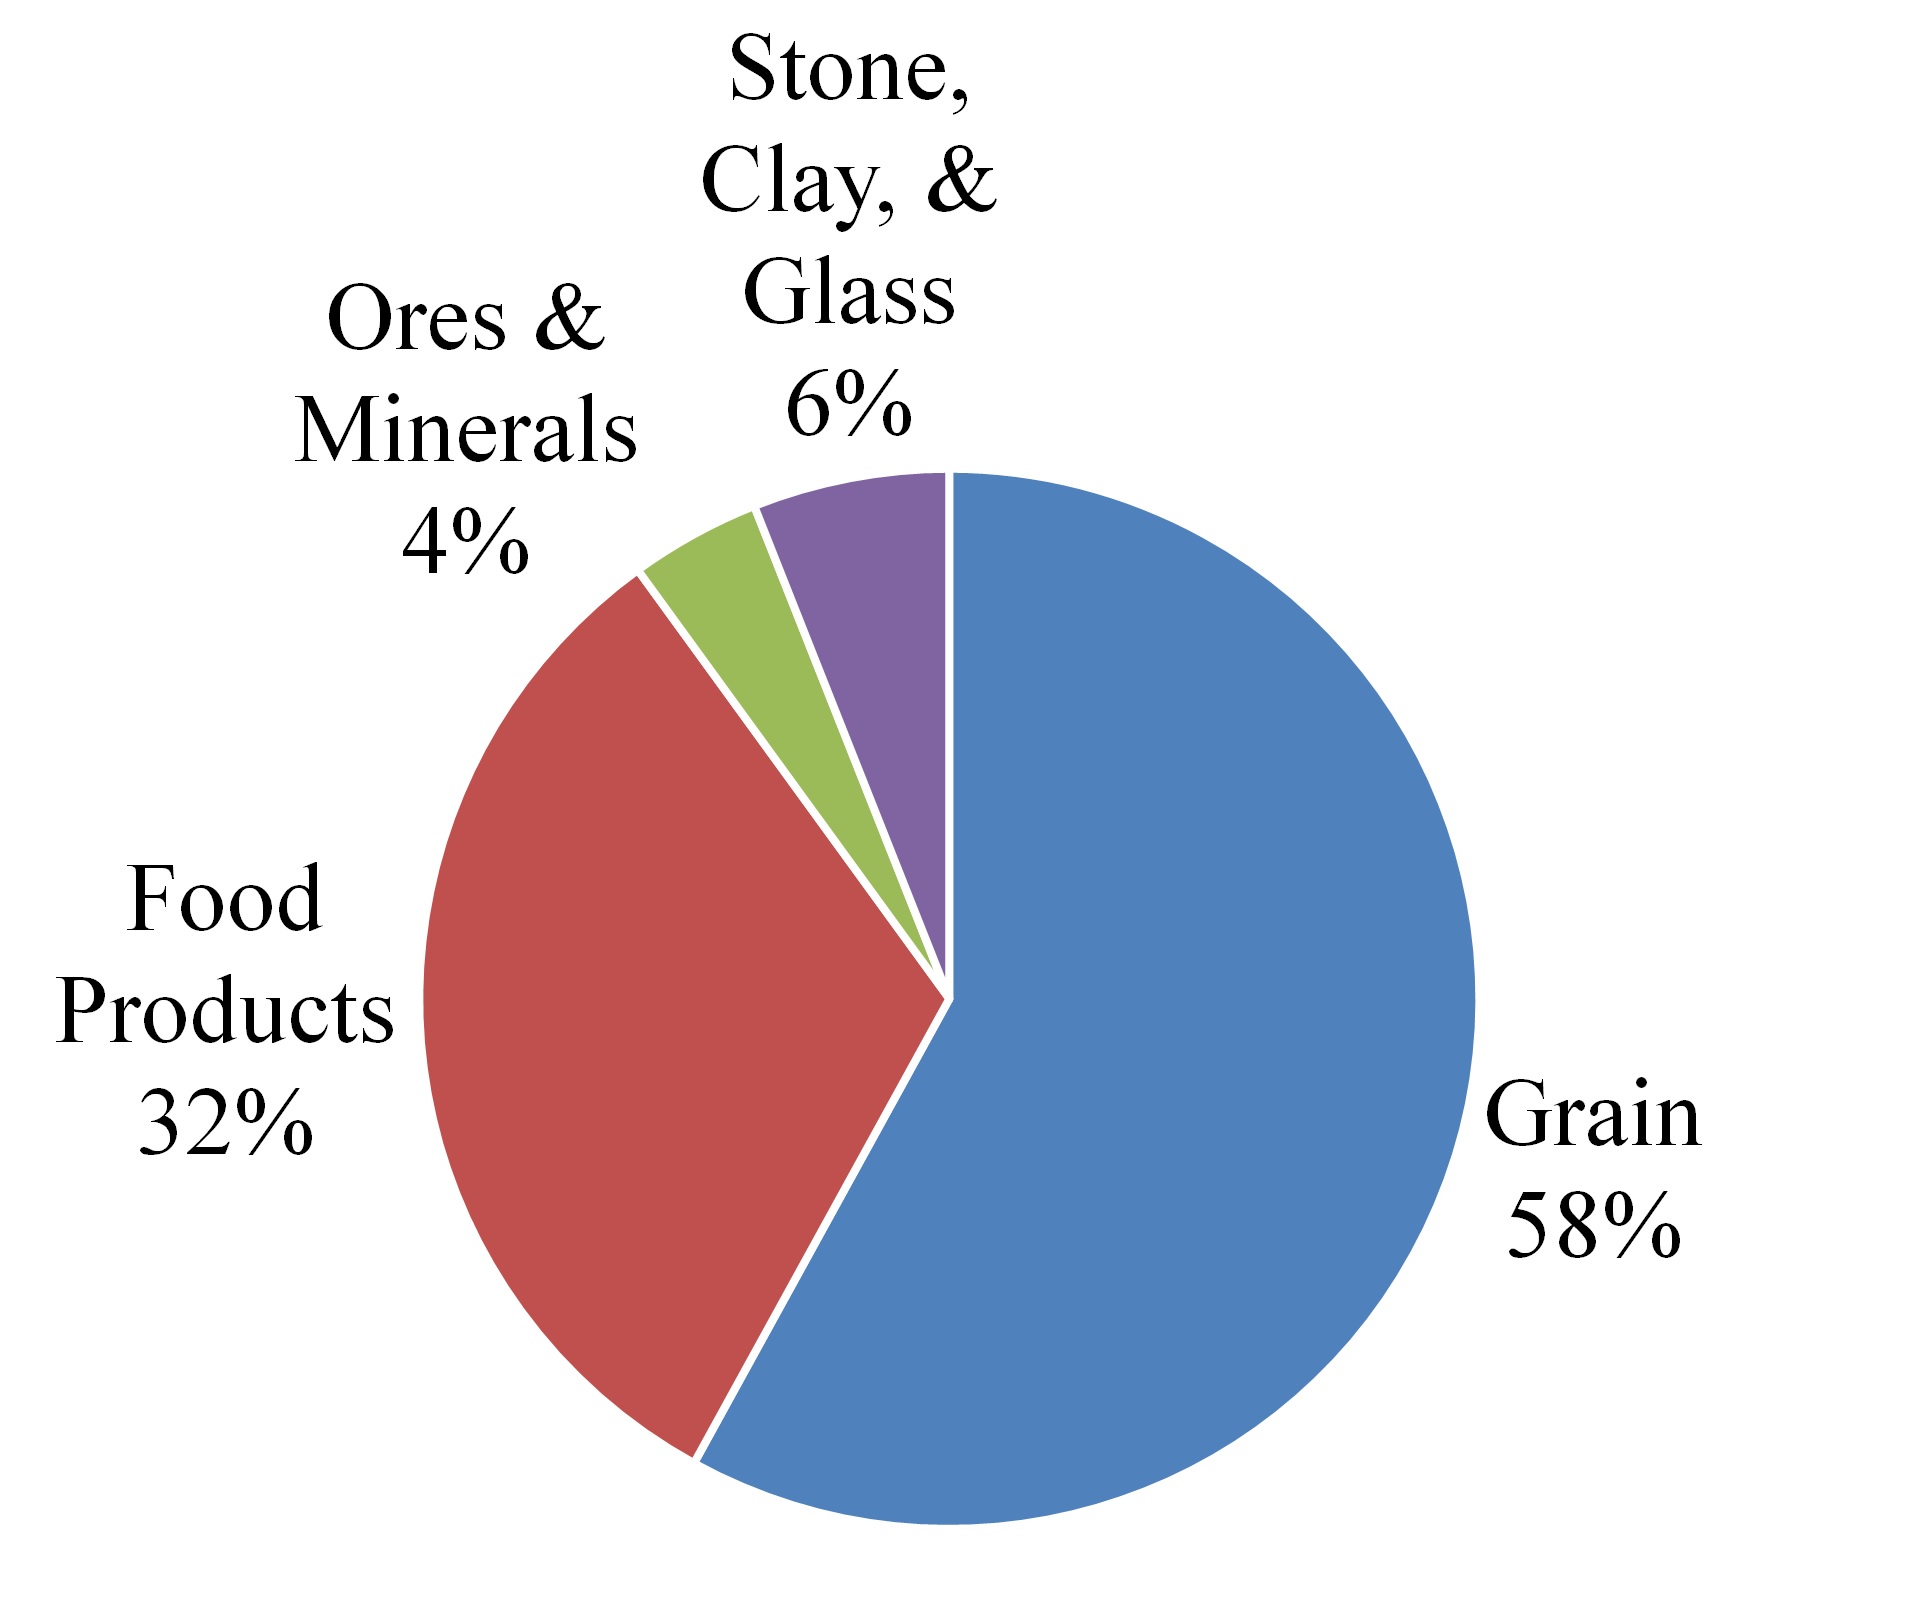
Agriculture and minerals. The agriculture and minerals sectorcommodity group consists primarily of grain and food products. Shipper demand for agriculture products is affected by competition among sources of grain and grain products, as well as price fluctuations in international markets for key commodities. In the United States, KCS’s rail lines receive and originate shipments of grain and grain products for delivery to feed mills, food and industrial consumers in the U.S. and Mexico. United States export grain shipments and Mexico import grain shipments include primarily corn, wheat, and soybeans. Over the long term, export grain shipments to Mexico are expected to increase as a result of Mexico’s reliance on grain imports and KCS’s coordinated rail network is well positioned to meet these increases in demand. Food products consist mainly of soybean meal, grain meal, oils, canned goods, distillers dried grains, corn syrup and sugar. Other shipments consist of a variety of products including ores, minerals, clay and glass used across North America.
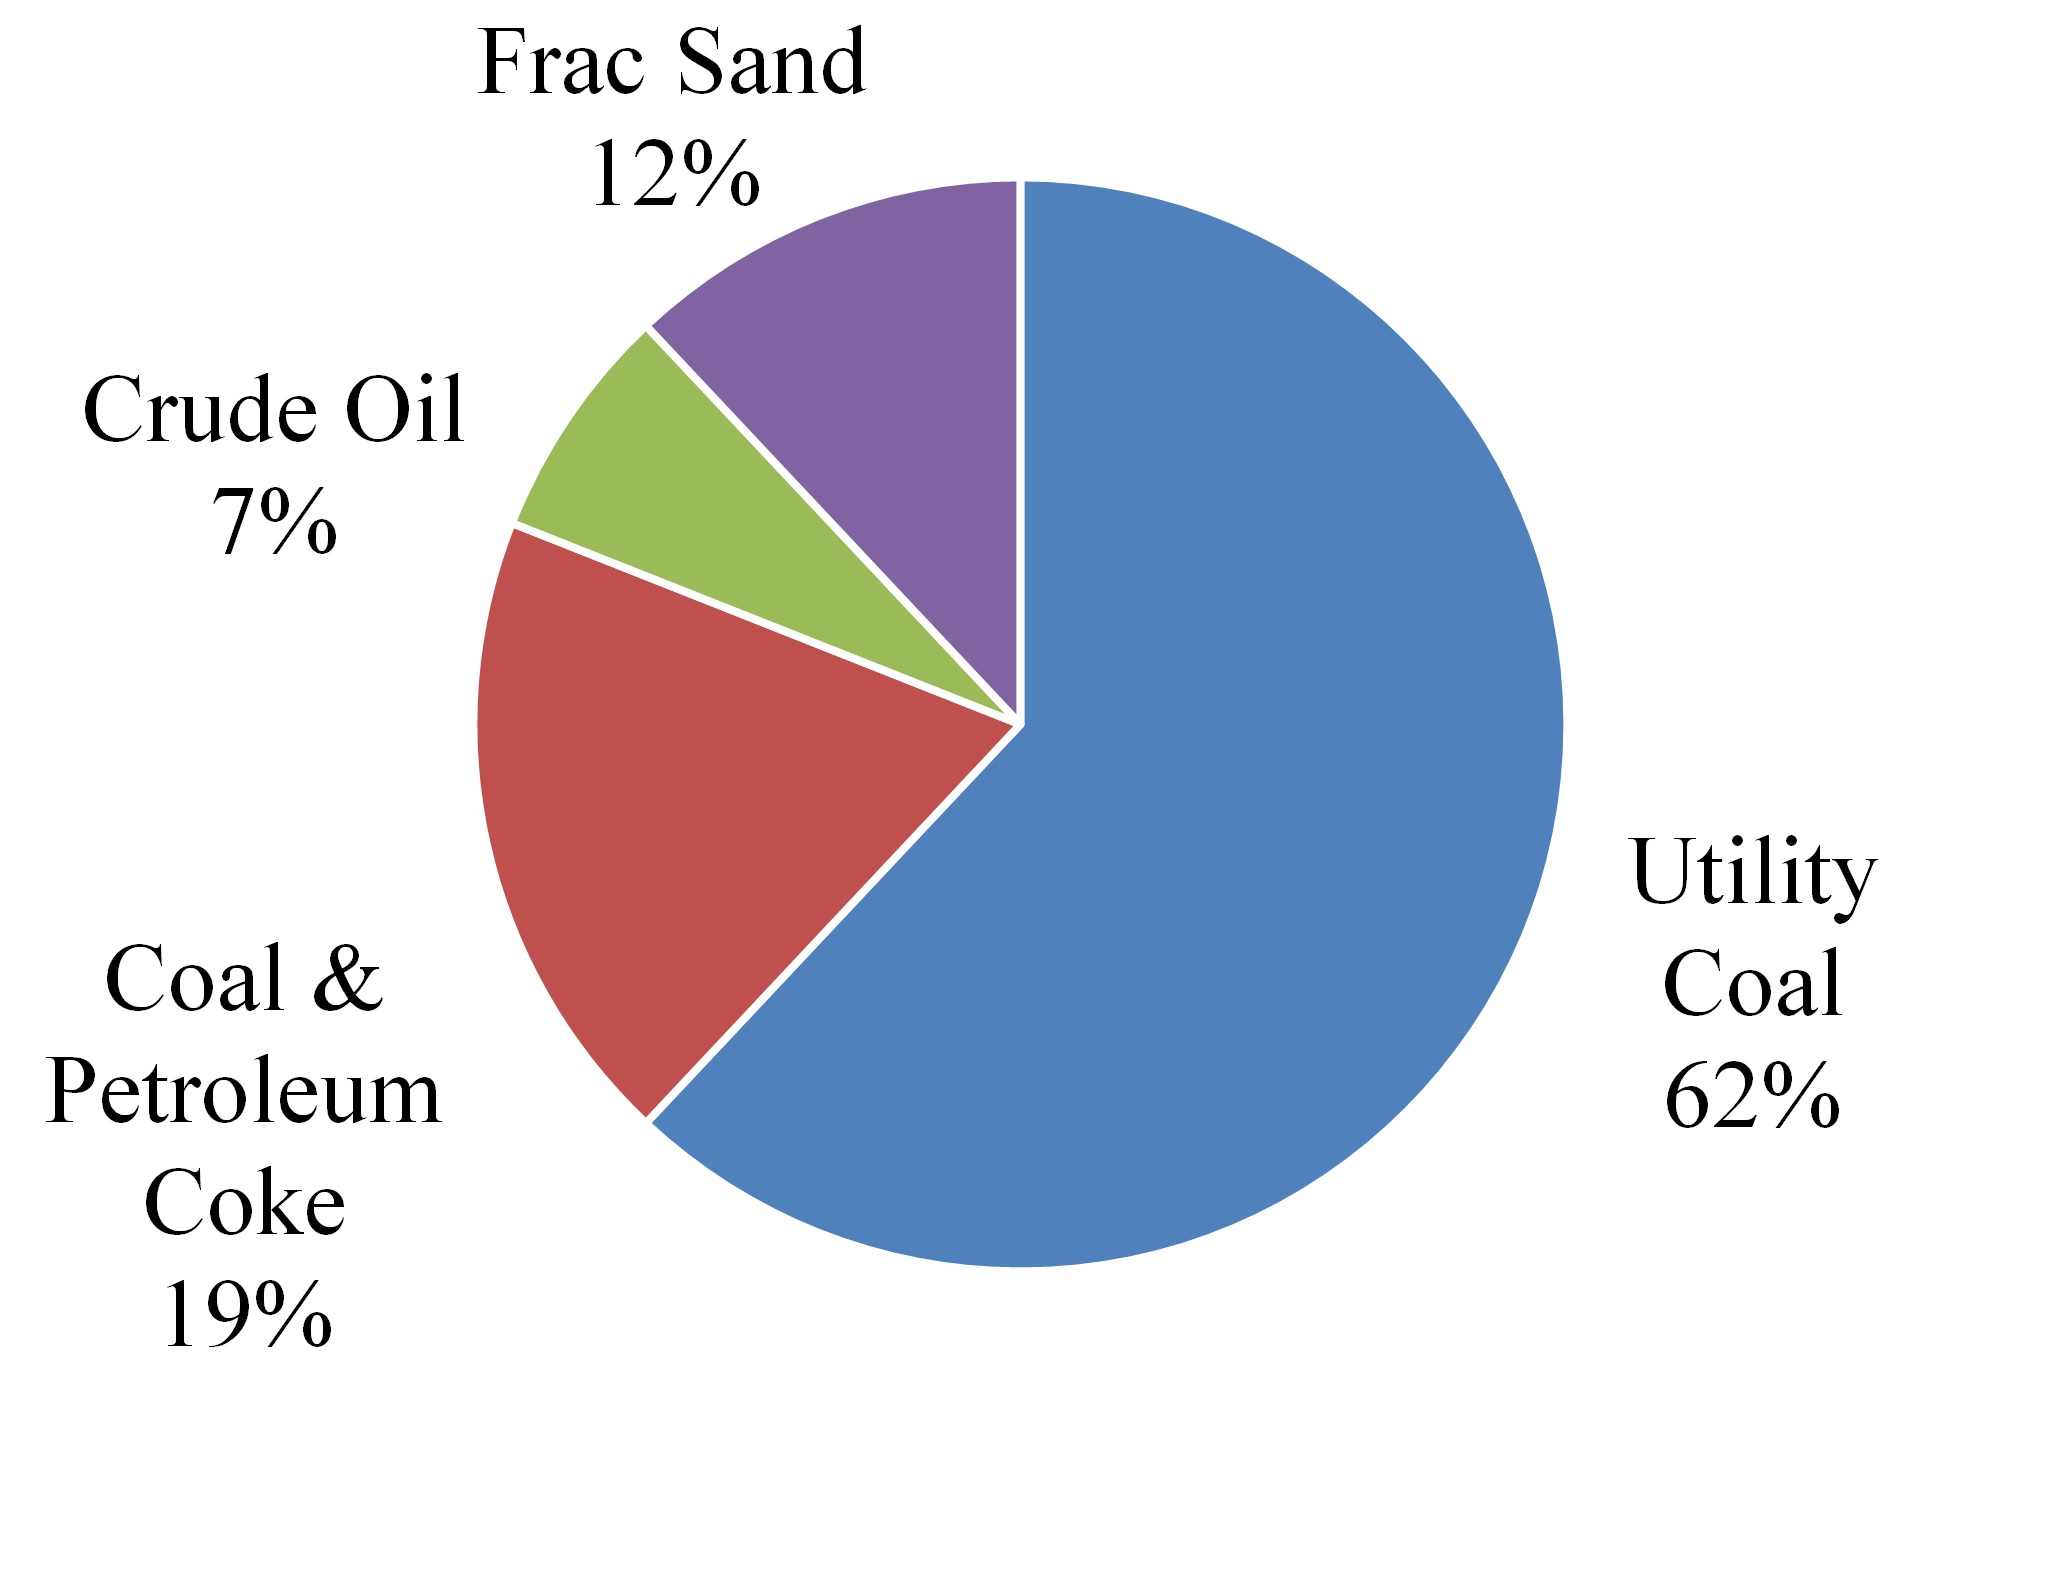
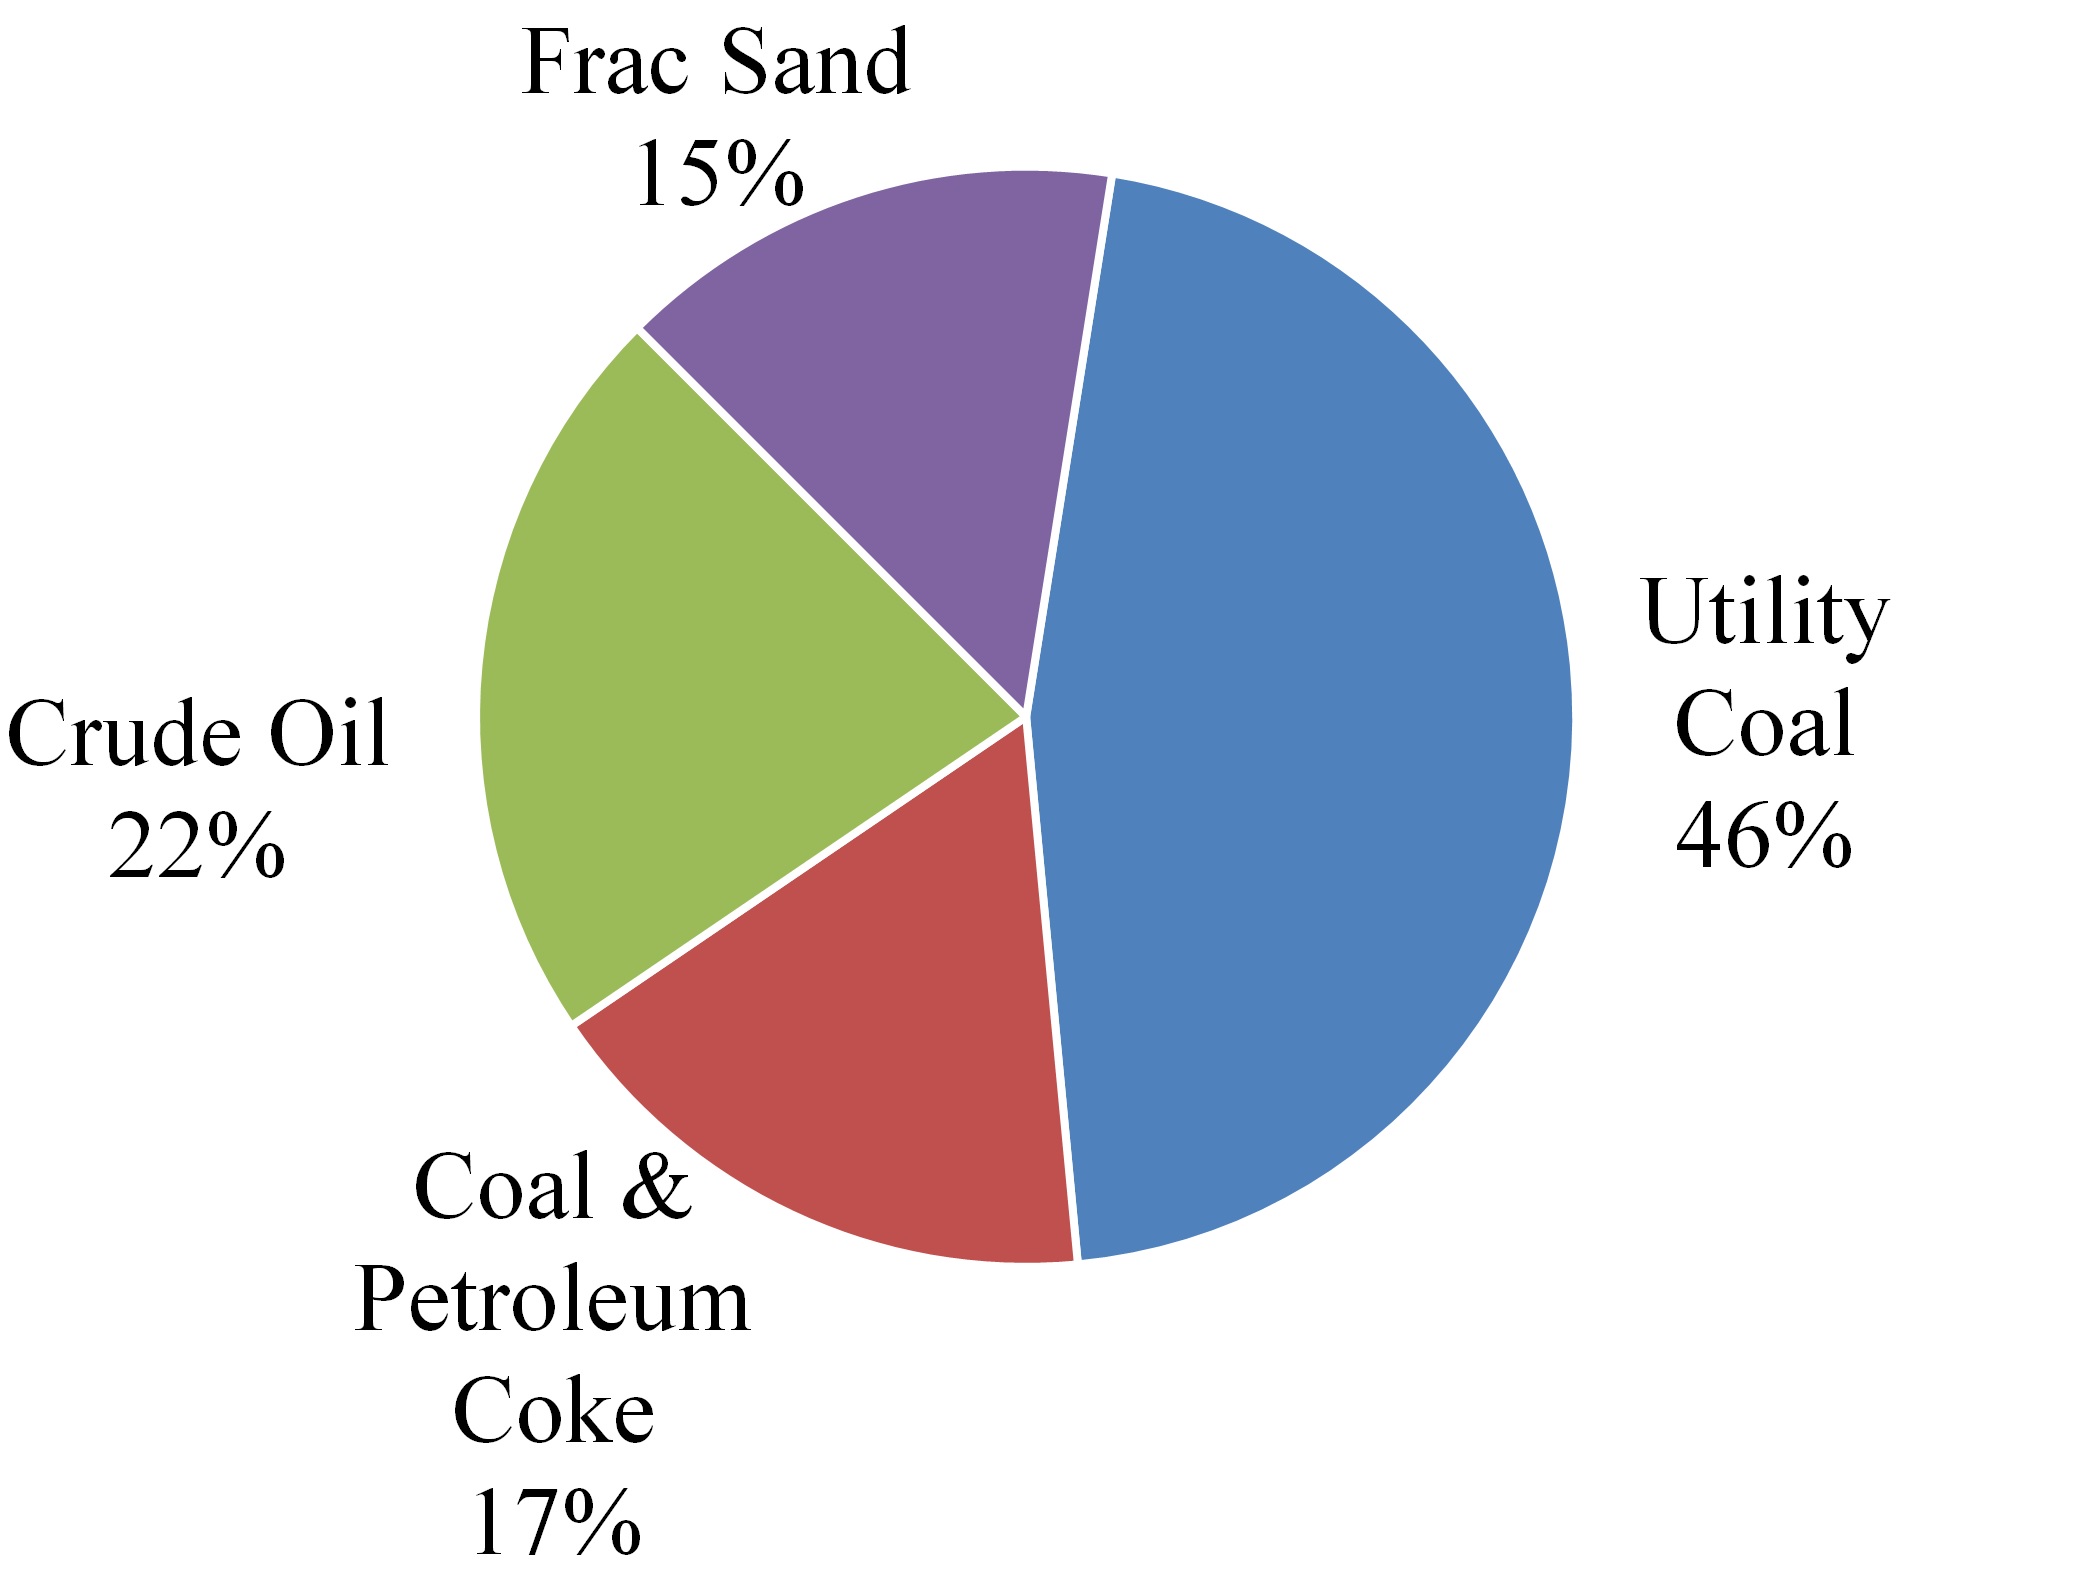
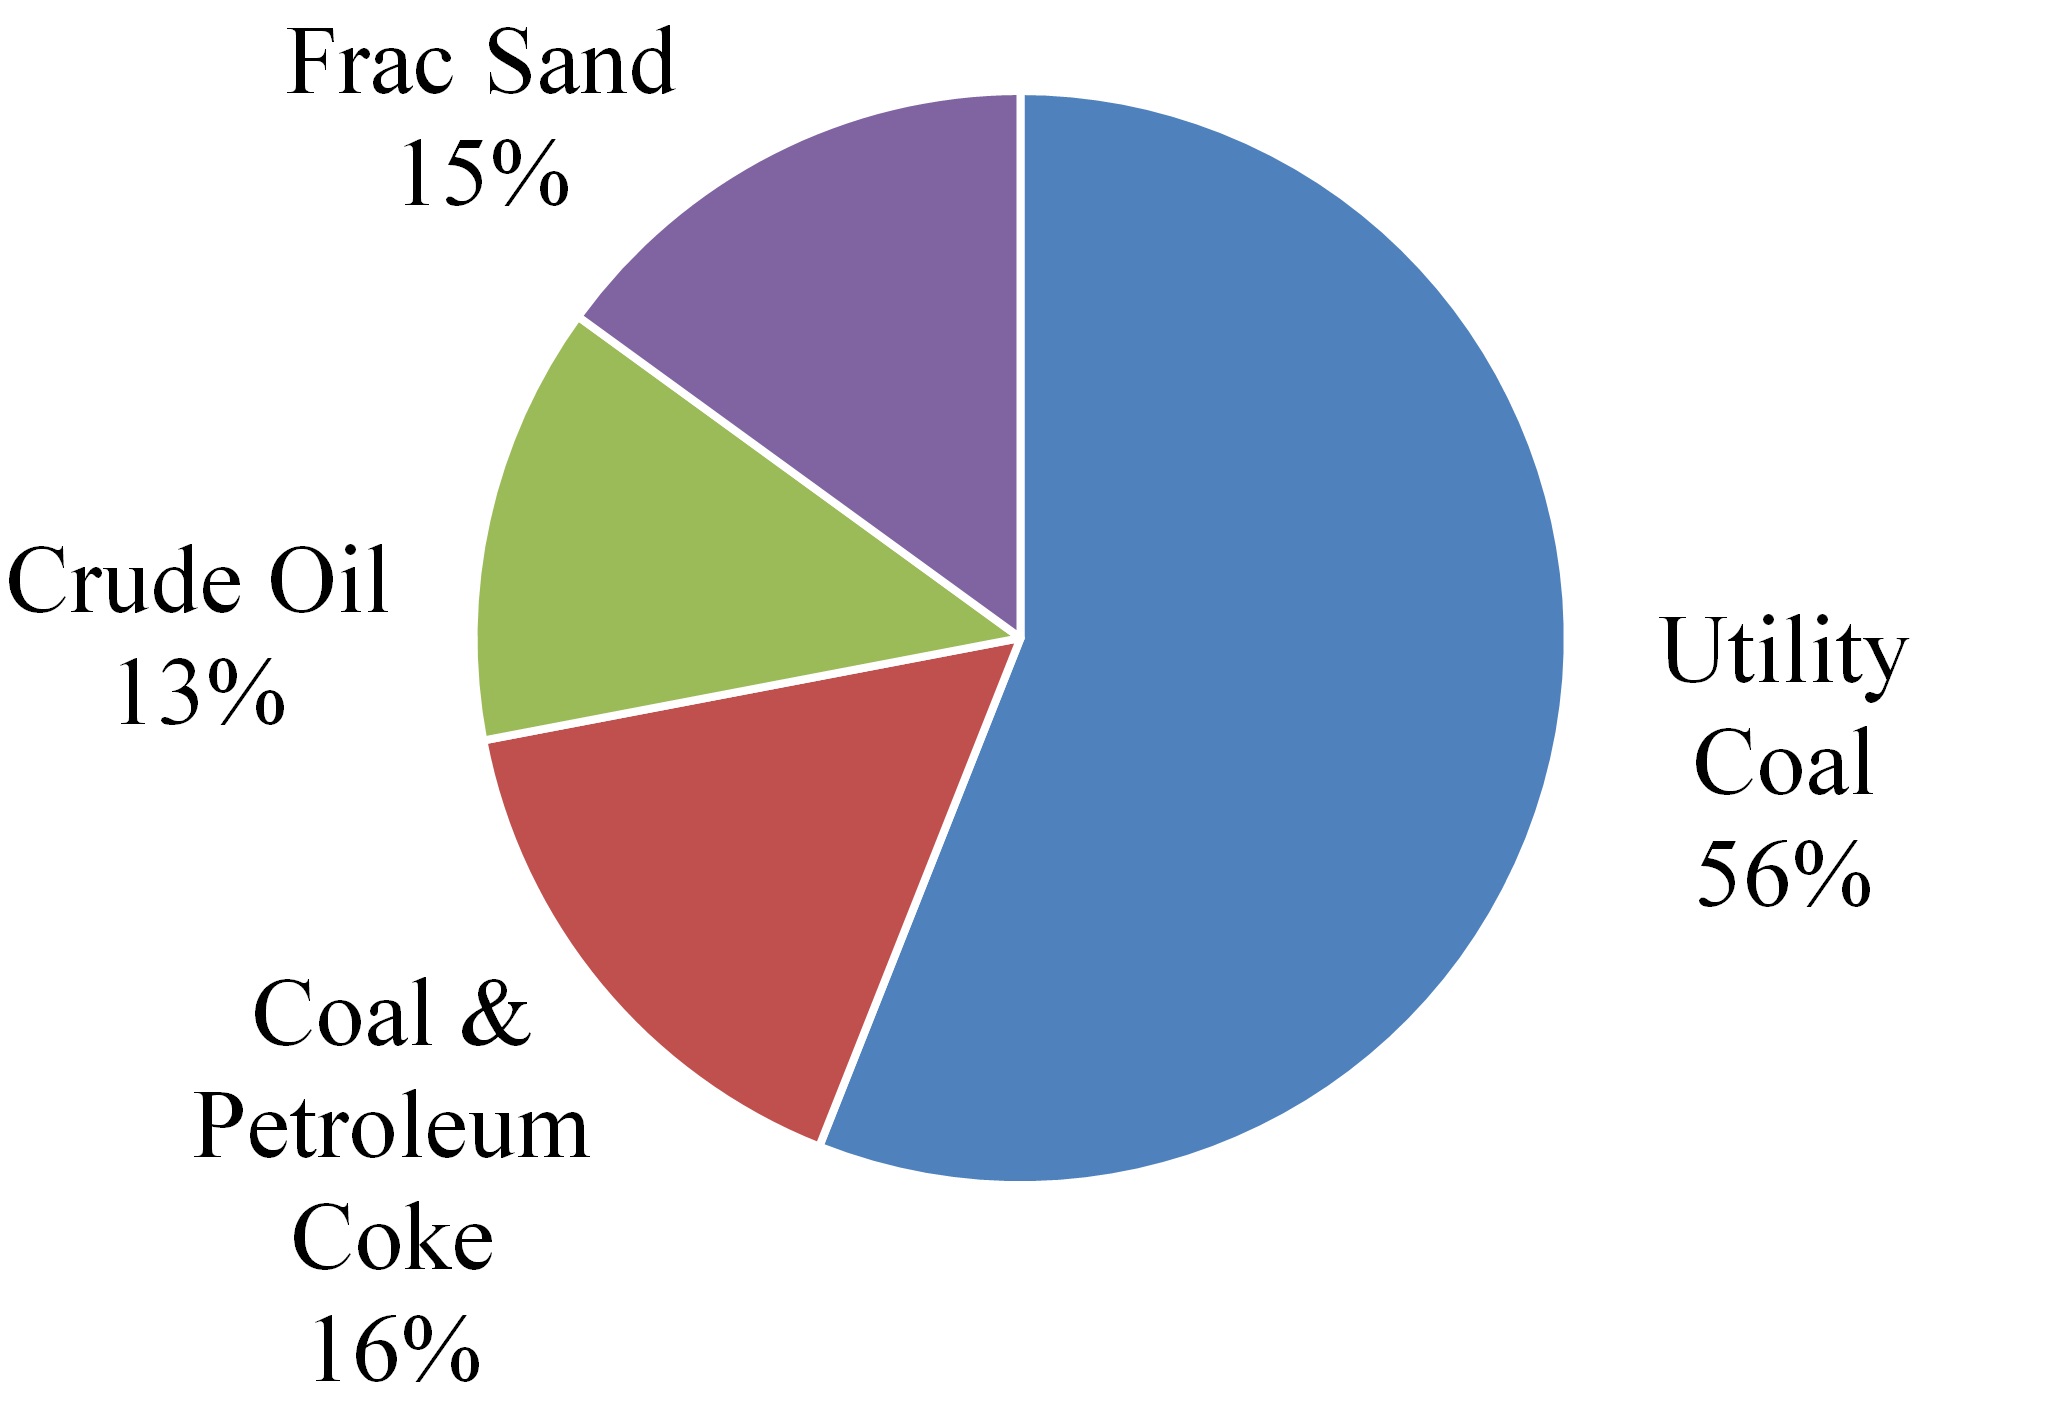
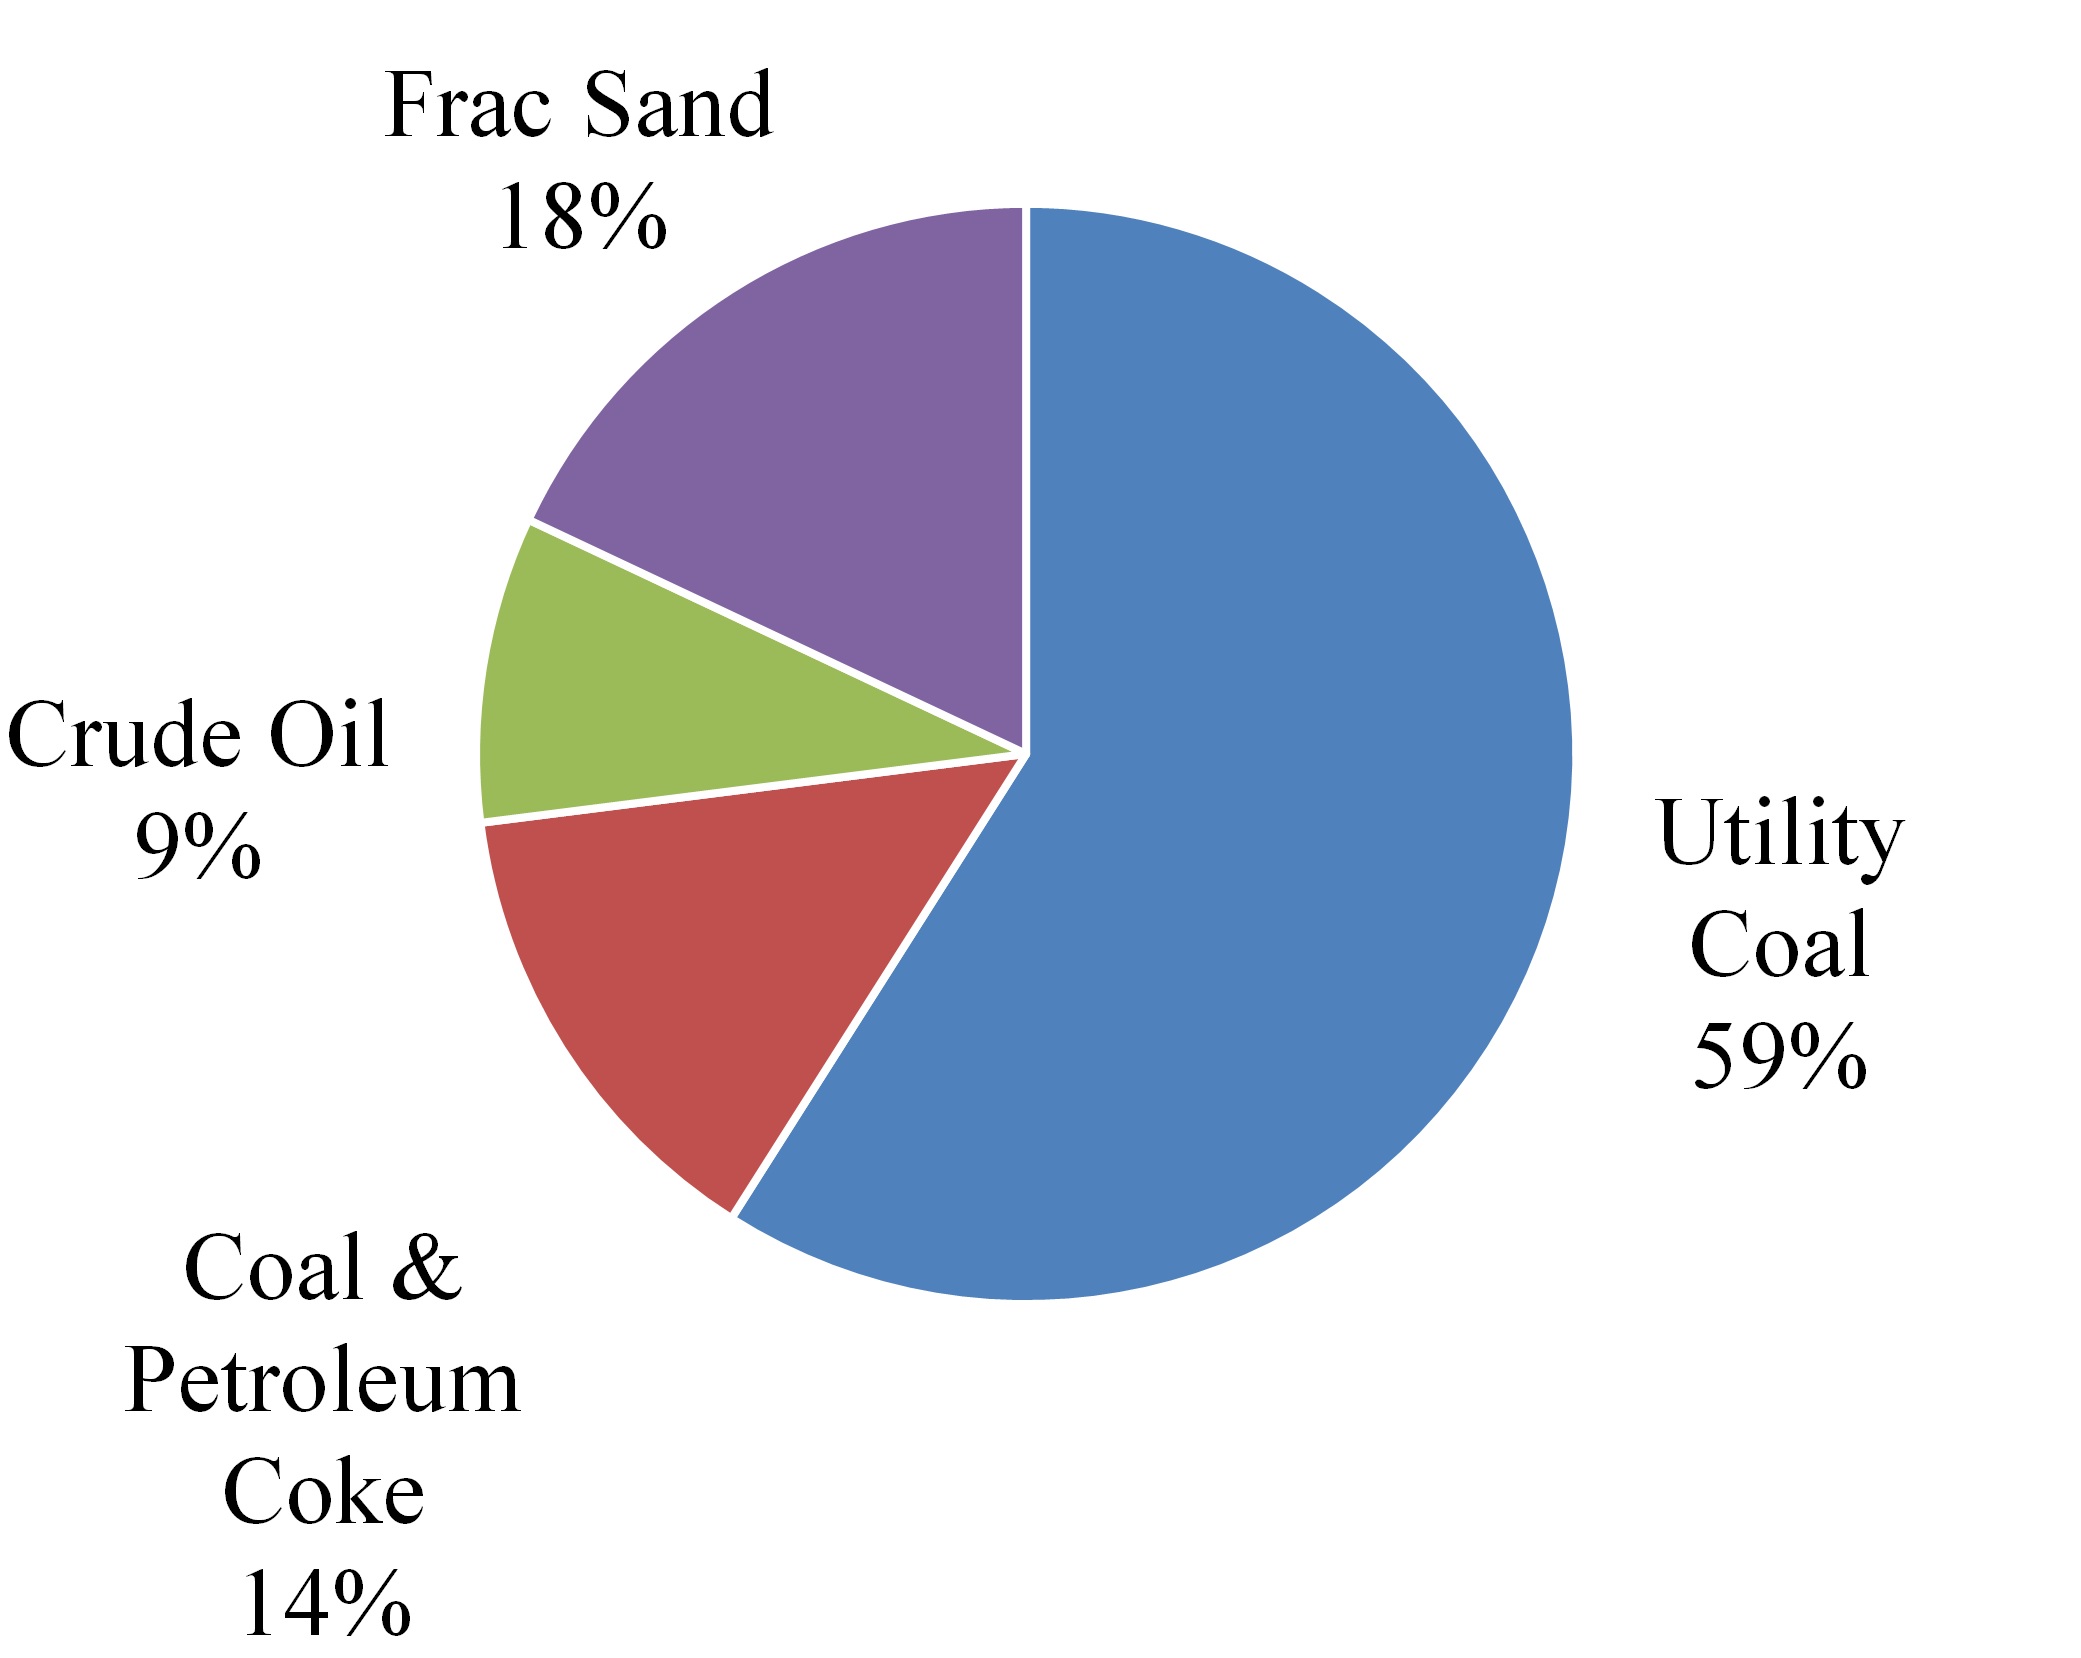
Energy. The energy sectorcommodity group includes coal, frac sand, petroleum coke and crude oil. KCS hauls unit trains (trains transporting a single commodity from one source to one destination) of coal for nine electric generating plants in the central United States. The coal originates from the Powder River Basin in Wyoming and is interchanged to KCS at Kansas City, Missouri. Coal mined in the midwest United States is transported in non-unit trains to industrial consumers such as paper mills, steel mills, and cement companies. Frac sand originating primarily in Wisconsin, Illinois or Iowa is delivered to transloads located in northeast Texas, northern Louisiana and south Texas for distribution to gas and oil wells in the region. KCS transports petroleum coke from refineries in the United States to cement companiesvarious industries in the U.S. and Mexico as well as to vessels for international distributionincluding export through the Pabtex export terminal located in Port Arthur, Texas.TX. The majority of crude by rail
business originates in Canada, and Utah, with spot shipments coming from west Texas, Colorado and North Dakota, and is delivered to U.S. Gulf Coast refineries and tank farms in Texas, Louisiana, and Alabama.
Intermodal. The intermodal freight sector consists primarily of hauling freight containers or truck trailers on behalf of steamship lines, motor carriers, and intermodal marketing companies with rail carriers serving as long-distance haulers. KCS serves and supports the U.S. and Mexican markets, as well as cross bordercross-border traffic between the U.S. and Mexico. In light of the importance of trade between Asia and North America, the Company believes the Port of Lazaro Cardenas continues to be a strategically beneficial location for ocean carriers, manufacturers and retailers. Equally important, the increase in foreign direct investment in Mexico has caused the KCS Mexico/U.S. cross border corridor to emerge as an increasingly important tool for the North American Free Trade Agreement (“NAFTA”) freight flow. The Company also provides premium service to customers over its line from Dallas through the Meridian Speedway —Speedway— a critical link in creating the most direct route between the southwest and southeast/northeast U.S.
Automotive. KCS provides rail transportation to every facet of the automotive industry supply chain, including automotive manufacturers, assembly plants and distribution centers throughout North America. Several U.S., European and Asian automakers have built or intend to build assembly plants in central Mexico to take advantage of access to lower costs, which has driven a shift in production and distribution patterns from the U.S. to Mexico. In addition, KCS transports finished vehicles imported and exported to and from Asiavarious countries through a distribution facility at the Port of Lazaro Cardenas. As the automotive industry shifts production and distribution patterns, KCS is poised to serve the automotive industry’s evolving transportation requirements.
GOVERNMENT REGULATION
The Company’s United States operations are subject to federal, state and local laws and regulations generally applicable to all businesses subject to federal preemption under certain circumstances. Rail operations are also subject to the regulatory jurisdiction of the Surface Transportation Board (“STB”), the Federal Railroad Administration (“FRA”) of the U.S. Department of Transportation (“DOT”), the Occupational Safety and Health Administration (“OSHA”), as well as other federal and state regulatory agencies. The STB has jurisdiction over disputes and complaints involving certain rates, routes and services, the sale or abandonment of rail lines, applications for line extensions and construction, and consolidation or merger with, or acquisition of control of, rail common carriers. DOT and OSHA each has jurisdiction under several federal statutes over a number of safety and health aspects of rail operations, including the transportation of hazardous materials. In 2008, the President of the United States signed the Rail Safety Improvement Act of 2008 into law, which, among other things, revised hours of service for train and certain other employees and mandated implementation of PTC at certain locations by the end of 2015. PTC is a technology designed to help prevent train-to-train collisions, overspeed derailments, incursions into rail work zones, and entry into main line track if a switch is misaligned at certain locations, including main line track where toxic inhalation hazard or poison inhalation hazard movements occur or where passenger operations occur. The Surface Transportation Extension Act of 2015 extendedamended the PTC deadline set by the the Rail Safety Improvement Act to require implementation deadline from the end of 2015 toPTC by the end of 2018, conditioned uponwhich was extended to December 31, 2020 for KCS, as certain other criteria were satisfied. By the filingend of revised2018, the Company implemented PTC Implementation Plans,on all required sections of its rail network, locomotives and wayside assets. The Company will continue to work with a further two-year extension possible subjectthe Class I freight railroads and Amtrak to review by the DOT. KCS filed a revised PTC Implementation Plan by the statutory due date.complete interoperability on or before December 31, 2020. PTC will add to operating costs, increase the number of employees the Company employs and require KCS to make significant investments in new safety technology.
KCS’s U.S. subsidiaries are subject to extensive federal, state and local environmental regulations. These laws cover discharges to water, air emissions, toxic substances, and the generation, handling, storage, transportation and disposal of waste and hazardous materials. These regulations have the effect of increasing the costs, risks and liabilities associated with rail operations. Environmental risks are also inherent in rail operations, which frequently involve transporting chemicals and other hazardous materials.
Primary regulatory jurisdiction for the Company’s Mexican operations is overseen by the new Mexican Agencia Reguladora del Transporte Ferroviario (“Regulatory Agency of Rail Transportation” or “ARTF”). The ARTF establishes regulations concerning railway safety and operations, and is responsible for resolving disputes between railways and between railways and customers. KCSM must register its maximum rates with the ARTF and make regular reports to the ARTF and the Secretaría de Comunicaciones y Transportes (“Secretary of Communications and Transportation” or “SCT”). KCSM must provide reports on investmentinvestments, traffic volumes, theft and traffic volumes.vandalism on the general right of way, customer complaints, fuel consumption, number of locomotives, railcars and employees, and activities around maintenance of way, sidings and spurs, among other financial information and reports. The Company may freely set rates on a non-discriminatory basis. At any time, the ARTF may request additional information regarding the determination of such rates and may issue recommendations with respect to proposed rate increases. If the ARTF or another party considers there to be no effective competition, they canmay request an opinion from the Comisión Federal de Competencia Económica (“Mexican Antitrust Commission” or “COFECE”) regarding market conditions. If the COFECE determines that there is no effective competition for particular movements, the ARTF could set fixed maximum rates for those movements.movements or grant limited trackage rights to another railroad while the condition of no effective competition remains.
KCSM holds a concession from the Mexican government until June 2047 (exclusive(exclusively through 2027, subject to certain trackage and haulage rights granted to other concessionaires), which is renewable under certain conditions for an additional periodperiods of up to 50 years (the “Concession”).years. The Concession authorizes KCSM to provide freight transportation services over north-east rail lines which are a primary commercial corridor of the Mexican railroad system. KCSM is required to provide freight railroad services to all users on a fair and non-discriminatory basis and in accordance with efficiency and safety standards approved periodically by the Mexican government. KCSM has the right to use, but does not own, all track and buildings that are necessary for the rail lines’ operation. KCSM is obligated to maintain the right of way, track structure, buildings and related maintenance facilities to the operational standards specified in the Concession agreement and to return the assets in that condition at the end of the Concession period. During the remainder of the Concession period, KCSM is required to pay the Mexican government an annual concession duty equal to 1.25% of gross revenues. The ARTF may request information to verify KCSM´s compliance with the Concession and any applicable regulatory framework.
The Company’s Mexican operations are subject to Mexican federal and state laws and regulations relating to the protection of the environment through the establishment of standards for water discharge, water supply, emissions, noise pollution, hazardous substances and transportation and handling of hazardous and solid waste. The Mexican government may bring administrative and criminal proceedings and impose economic sanctions against companies that violate environmental laws, and temporarily or even permanently close non-complying facilities.
Noncompliance with applicable legal provisions may result in the imposition of fines, temporary or permanent shutdown of operations or other injunctive relief, criminal prosecution or, with respect to KCSM, the termination of the Concession. KCS maintains environmental provisions that are believed by management to be appropriate with respect to known and existing environmental contamination of its properties that KCS may be responsible to remedy. In addition, KCS’s subsidiaries are party to contracts and other legally binding obligations by which previous owners of certain facilities now owned by KCS are responsible to remedy contamination of such sites remaining from their previous ownership. There
Government regulations are currently no material legal or administrative proceedings pending against the Company with respect to any environmental mattersfurther discussed within Item 7, Management’s Discussion and management does not believe that continued compliance with environmental laws will have any material adverse effect on the Company’s consolidated financial statements. KCS cannot predict the effect, if any, that unidentified environmental matters or the adoptionAnalysis of additional or more stringent environmental lawsFinancial Information and regulations would have on the Company’s consolidated financial statements.Results of Operations — Other Matters.
COMPETITION
The Company competes against other railroads, many of which are much larger and have significantly greater financial and other resources. The railroad industry in North America is dominated by a few very large carriers. The larger U.S. western railroads (BNSF Railway Company and Union Pacific Railroad Company), in particular, are significant competitors of KCS because of their substantial resources and competitive routes.
In Mexico, KCSM’s operations are subject to competition from other railroads, particularly Ferrocarril Mexicano, S.A. de C.V. (“Ferromex”) and Ferrosur, S.A. de C.V. (“Ferrosur”), both controlled by Grupo Mexico S.A.B. de C.V. Ferromex and Ferrosur together are much larger and have significantly greater financial and other resources than KCSM, serving most of the major ports and cities in Mexico and together owning fifty percent of FTVM, which serves industries located within Mexico City.
The ongoing impact of past and future rail consolidation is uncertain. However, KCS believes that its investments and strategic alliances continue to competitively position the Company to attract additional rail traffic throughout its rail network.
The Company is subject to competition from motor carriers, barge lines and other maritime shipping, which compete across certain routes in KCS’s operating areas. In the past, truck carriers have generally eroded the railroad industry’s share of total transportation revenues. Intermodal traffic and certain other traffic face highly price sensitive competition, particularly from motor carriers. However, rail carriers, including KCS, have placed an emphasis on competing in the intermodal marketplace and working with motor carriers to provide end-to-end transportation of products.
While deregulation of U.S. freight rates has enhanced the ability of railroads to compete with each other and with alternative modes of transportation, this increased competition has generally resulted in downward pressure on freight rates since deregulation. Competition with other railroads and other modes of transportation is generally based on the rates charged, the quality and reliability of the service provided and the quality of the carrier’s equipment for certain commodities.
RAIL SECURITY
The Company and its rail subsidiaries have continued to research, develop and implement multidisciplinary approaches to secure the Company’s assets and personnel against transnational criminal organizations that actively target transportation networks. In addition, the Company has developed a variety of vertically integrated strategies to mitigate the risk terrorist attacks could pose to the Company, its personnel and assets. Many of the specific measures the Company utilizes for these efforts are required to be kept confidential through arrangements with government agencies, such as the Department of Homeland Security (“DHS”), or through jointly-developed and implemented strategies and plans with connecting carriers.
KCSR and KCSM developed a proprietary security plan based on an industry-wide plan developed by the Association of American Railroads (“AAR”) members which focuses on comprehensive risk assessments in five areas — hazardous materials; train operations; critical physical assets; military traffic; and information technology and communications. The security plan is kept confidential, with access to the plan tightly limited to members of management with direct security and anti-terrorism implementation responsibilities. The Company participates with other AAR members in periodic drills under the industry plan to test and refine its various provisions.
To protect the confidentiality and sensitivity of both the AAR plans and the proprietary strategies the Company has developed to safeguard against criminal enterprises, terrorism, and other security and safety threats, the following paragraphs will provide only a general overview of some of these efforts.
The Company’s security activities range from periodically providing security awareness updates to KCS employees and including safety and security information on the Company’s internet website (which can be found under the “Corporate Responsibility” tab at www.kcsouthern.com) to its ongoing implementation of security plans for rail facilities in areas labeled by the DHS as High Threat Urban Areas (“HTUAs”). The Company’s other activities to bolster security against terrorism include, but are not limited to, the following:
Conferring regularly with other railroads’ security personnel and with industry experts on security issues;
Routing shipments of certain chemicals, which might be toxic if inhaled, pursuant to federal regulations;
Initiating a series of over 20 voluntary action items agreed to between AAR and DHS as enhancing security in the rail industry;
Conducting constant and targeted security training as part of the scheduled training for operating employees and managers;
Development ofDeveloping smartphone applications to ensure immediate information, live video and pictures from security supervisors and protection assets pertaining to potential operational risks;
Developing a multi-layered security model using high-speed digital imaging, system velocity and covert and overt security filters to mitigate the risk of illicit activity;
Measuring key security metrics to ensure positive risk mitigation and product integrity trends;
Performing constant due diligence with the existing security model and by benchmarking rail security on a world-wide basis to monitor threat streams related to rail incidents;
Implementation ofImplementing a Tactical Intelligence Center by KCSM, which provides constant training with core members in new technology helping to prevent, detect, deter, deny and respond to potentially illicit activities; and
Deployment ofDeploying an array of non-intrusive technologies including, but not limited to, digital video surveillance and analytics as part of an intelligent video security solution, including a Closed Circuit Televisionclosed circuit television platform with geo-fencing for intrusion detection, to allow for remote viewing access to monitor ports of entry, intermodal and rail yards.
In addition, the Company utilizes dedicated security personnel with extensive special operations forces, intelligence, and law enforcement backgrounds to oversee the ongoing and increasingly complex security efforts of the Company in both the United States and Mexico. While the risk of theft and vandalism is higher in Mexico, KCSM remains among the safest methods of transportation for freight shipments in Mexico. KCSM’s record in rail safety is due in large part to the implementation of a multi-layered safety and security process throughout the KCSM network. In addition to having its own internal system, the process is connected to, and supported by a high level of federal, state and local law enforcement. A primary focus of this effort involves maintaining constant due diligence, intelligence and counter intelligencecounterintelligence operations, technology reportingtechnology-reporting applications and active vigilance while enhancing overall system velocity, which reduces the residual risk for incidents to occur.
RAILWAY LABOR ACT
Labor relations in the U.S. railroad industry are subject to extensive governmental regulation under the Railway Labor Act (“RLA”). Under the RLA, national labor agreements are renegotiated on an industry-wide scale when they become open for modification, but their terms remain in effect until new agreements are reached or the RLA’s procedures (which include mediation, cooling-off periods, and the possibility of presidential intervention) are exhausted. Contract negotiations with the various unions generally take place over an extended period of time and the Company rarely experiences work stoppages during negotiations. Wages, health and welfare benefits, work rules and other issues have traditionally been addressed during these negotiations.
COLLECTIVE BARGAINING
Approximately 75% of KCSR employees are covered by collective bargaining agreements. These agreements do not have expiration dates, but rather remain in place until modified by subsequent agreements. KCSR participates in industry-wide multi-employer bargaining as a member of the National Carriers’ Conference Committee (the “NCCC”), as well as local bargaining for agreements that are limited to KCSR's property. Multi-employer agreements are subject to a procedure that allows requests for changes to be served every five years. The last amendments toLong-term agreements were reached voluntarily or through the collective bargaining agreements witharbitration process during 2017 and 2018 covering all of the participating unions were reached and ratified during 2011 and the first half of 2012, and were retroactive to January 1, 2010. The current round of multi-employer bargaining began on January 1, 2015. The subjects of bargaining primarily concern salary and benefits payable to the various union employees. The union labor negotiation has not historically resultedunions. These agreements will be in any strike, lock-out, or other disruption in the Company’s business operations. The Company does not believe the expected settlements will have a material impact on the consolidated financial statements.effect through December 2019.
KCSM Servicios union employees are covered by one labor agreement, which was signed on April 16, 2012, between KCSM Servicios and the Sindicato de Trabajadores Ferrocarrileros de la República Mexicana (“Mexican Railroad Union”), for an indefiniteand which remains in effect during the period of time,the Concession, for the purpose of regulating the relationship between the parties. Approximately 80% of KCSM Servicios employees are covered by this labor agreement. The compensation terms under this labor agreement are subject to renegotiation on an annual basis and all other benefits are subject to negotiation every two years. The union labor negotiations with the Mexican Railroad Union have not historically resulted in any strike, boycott or other disruption in KCSM’s business operations. On November 4, 2016,During the compensation terms covering the period from July 1, 2016 through June 30, 2017, were finalized betweenthird quarter of 2018, KCSM Servicios and the Mexican Railroad Union.Union concluded their negotiation over compensation terms for the period covering July 1, 2018, to June 30, 2019. The finalization of the compensation terms did not have a significant effect on the Company’s consolidated financial statements.
EXECUTIVE OFFICERS OF KCS AND SUBSIDIARIES
All executive officers are elected annually and serve at the discretion of the Board of Directors. All of the executive officers have employment agreements with KCS and/or its subsidiaries. The mailing address of the principal executive officers other than Mr. Zozaya is P.O. Box 219335,427 W. 12th Street, Kansas City, Missouri 64121.64105. Mr. Zozaya’s mailing address is Montes Urales No. 625, Col. Lomas de Chapultepec, C.P. 11000, Mexico D.F.
Patrick J. Ottensmeyer — President and Chief Executive Officer— 5961 — Served in this capacity since July 1, 2016. Mr. Ottensmeyer has been a director of KCS since July 1, 2016 and served as President of KCS since March 1, 2015. He served as Executive Vice President Sales and Marketing of KCS from October 16, 2008 through March 1, 2015. Mr. Ottensmeyer joined KCS in May 2006 as Executive Vice President and Chief Financial Officer. Prior to joining KCS, Mr. Ottensmeyer served as Chief Financial Officer of Intranasal Therapeutics, Inc. from 2001 to May 2006. From 2000 to 2001, he served as Corporate Vice President Finance and Treasurer for Dade-Behring Holdings, Inc. From 1993 to 1999, Mr. Ottensmeyer served as Vice President Finance and Treasurer at Burlington Northern Santa Fe Corporation and BNSF Railway and their predecessor companies.
Warren K. Erdman — Executive Vice President — Administration and Corporate Affairs — 5860 — Served in this capacity since April 2010. Mr. Erdman served as Executive Vice President — Corporate Affairs from October 2007 until April 2010. He served as Senior Vice President — Corporate Affairs of KCS and KCSR from January 2006 to September 2007. Mr. Erdman served as Vice President — Corporate Affairs of KCS from April 15, 1997 to December 31, 2005 and as Vice President — Corporate Affairs of KCSR from May 1997 to December 31, 2005. Prior to joining KCS, Mr. Erdman served as Chief of Staff to United States Senator Kit Bond of Missouri from 1987 to 1997.
Brian D. Hancock — Executive Vice President and Chief MarketingInnovation Officer — 5153 — Served in this capacity since joining KCS inOctober 1, 2018. Mr. Hancock served as Executive Vice President and Chief Marketing Officer from August 2015.2015 until September 2018. Prior to joining KCS, Mr. Hancock served as Senior Vice President of Supply Chain for Family
Dollar Stores, Inc. from 2013 to July 2015. From 2011 to 2013, Mr. Hancock served as President – North America for The Martin – Brower Company, L.L.C. From 2005 to 2011, he served as Vice President – Global Supply Chain for Whirlpool Corporation.
Jeffrey M. Songer — Executive Vice President and Chief Operating Officer — 4749 — Served in this capacity since March 2016. MrMr. Songer served as Senior Vice President Engineering and Chief Transportation Officer of the Company from August 2014 to February 2016 and as Vice President and Chief Engineer for KCSR from June 2012 to July 2014. Prior to serving as
KCSR’s Vice President and Chief Engineer, Mr. Songer served as Assistant Vice President — Engineering and Planning from March 2011 to June 2012, and as its General Director — Planning, Scheduling & Administration from January 2007 to March 2011.
Michael W. Upchurch — Executive Vice President and Chief Financial Officer — 5658 — Served in this capacity since October 16, 2008. Mr. Upchurch joined KCS in March 2008 as Senior Vice President Purchasing and Financial Management. From 1990 through September 2006, Mr. Upchurch served in various senior financial leadership positions at Sprint Nextel Corporation and its predecessor, Sprint Corporation, including Senior Vice President Financial Operations, Senior Vice President Finance Sprint Business Solutions and Senior Vice President Finance Long Distance Division.
José Guillermo Zozaya Delano — President and Executive Representative — KCSM — 6466 — Served in this position since April 20, 2006. Mr. Zozaya has 35 years of experience in law and government relations, most recently as the Legal and Government Relations Director for ExxonMobil México, S.A. de C.V., where he spent nine years prior to joining KCSM.
Lora S. Cheatum — Senior Vice President — Human Resources — 6062 — Served in this capacity since joining KCS in October 2014. Ms. Cheatum previously served as Senior Vice President Global Human Resources of Layne Christensen from 2012 to October 2014. From 2010 to 2012, she served as Director — Field Operations at Fitness Together Holdings, Inc. Ms. Cheatum spent nine years with Kansas City Power & Light, from 2001 to 2010, where she was Vice President of Procurement and previously as Vice President Human Resources.
Michael J. Naatz — Executive Vice President and Chief Marketing Officer — 53 — Served in this capacity since October 1, 2018. Mr. Naatz served as Senior Vice President Operations Support and Chief Information Officer — 51 — Served in this capacity sincefrom August 2014. Mr. Naatz served2014 until September 2018 and as Senior Vice President and Chief Information Officer of the Company from May 2012 to July 2014. Prior to joining KCS, Mr. Naatz served as President of USF Holland, a YRC Worldwide, Inc. (“YRCW”) company, from 2011 to May 2012. From 2010 to 2011, Mr. Naatz served as President and Chief Customer Officer - Customer Care Division at YRCW. From 2008 to 2010, he served as Executive Vice President and Chief Information & Service Officer at YRCW. From 2005 to 2007, he served as President — Enterprise Services Division at YRCW. From 1994 to 2005, he held various leadership positions with USF Corporation.
Mary K. StadlerSuzanne M. Grafton — Senior Vice President and Chief Accounting Officer — 5743 — Served in this capacity since July 24, 2017. Ms. Grafton served as Vice President of Audit and Enterprise Risk Management of the Company from April 2016 to July 2017 and as Vice President of Accounting from May 2014 to March 2, 2009.2016. From April 1990 through August 2008,September 2006 to May 2014, Ms. StadlerGrafton served in various financeaccounting leadership positions at Sprint Nextel Corporation and its predecessor, Sprint Corporation, most recently as Vice President — Assistant Controller.KCS.
William J. Wochner — Senior Vice President and Chief Legal Officer — 6971 — Served in this capacity since February 2007. Effective March 31, 2019, Mr. Wochner will be retiring. He served as Vice President and Interim General Counsel from December 2006 to January 2007. From September 2006 to December 2006, Mr. Wochner served as Vice President and Associate General Counsel. From March 2005 to September 2006, Mr. Wochner served as Vice President Sales and Marketing/Contracts for KCSR. From February 1993 to March 2005, Mr. Wochner served as Vice President and General Solicitor of KCSR.
Adam J. Godderz — General Counsel and Corporate Secretary — 44 — Served in this capacity since January 1, 2019. Mr. Godderz served as Associate General Counsel and Corporate Secretary of the Company from June 2018 to December 2018 and as Vice President of Labor Relations and Corporate Secretary from November 2015 to May 2018. From January 2013 to November 2015, Mr. Godderz served as Associate General Counsel and Corporate Secretary. From September 2007 to January 2013, Mr. Godderz served as Associate General Counsel at KCS.
There are no arrangements or understandings between the executive officers and any other person pursuant to which the executive officer was or is to be selected as an officer of KCS, except with respect to the executive officers who have entered into employment agreements designating the position(s) to be held by the executive officer.
None of the above officers is related to another, or to any of the directors of KCS.
AVAILABLE INFORMATION
KCS’s website (www.kcsouthern.com) provides at no cost KCS’s Annual Reports on Form 10-K, Quarterly Reports on Form 10-Q, and Current Reports on Form 8-K, and amendments to those reports, as soon as reasonably practicable after the electronic filing of these reports is made with the Securities and Exchange Commission. In addition, KCS’s corporate governance guidelines, ethics and legal compliance policy, and the charters of the Audit Committee, the Finance and Strategic
Investments Committee, the Nominating and Corporate Governance Committee and the Compensation and Organization Committee of the Board of Directors are available on KCS’s website. These guidelines, policies and charters are available in print without charge to any
stockholder requesting them. Written requests for these materials may be made to the Corporate Secretary, P.O. Box 219335, Kansas City, Missouri 64121-9335 (or if by express delivery to 427 West 12th Street, Kansas City, Missouri 64105). From time to time, KCS publicly designates material information by posting it on the website, investors.kcsouthern.com, in lieu of press releases.
See Item 8, Financial Statements and Supplementary Data — Note 1 “Description, Description of the Business”Business and Note 18, “Geographic Information”Geographic Information for more information on the description and general development of the Company’s business and financial information about geographic areas.
KCS as aU.S. and Mexico rail common carrier by rail, issubsidiaries are required by United States and Mexican laws, respectively, to transport hazardous materials, which could expose KCS to significant costs and claims.
Under United States federal statutes and applicable Mexican laws, KCS’s common carrier responsibility requires it to transport hazardous materials. Any rail accident or other incident or accident on KCS’s network, facilities, or at the facilities of KCS’s customers involving the release of hazardous materials, including toxic inhalation hazard (or TIH) materials, could involve significant costs and claims for personal injury, property damage, and environmental penalties and remediation in excess of the Company’s insurance coverage for these risks, which could have a material adverse effect on KCS’s consolidated financial statements.
KCS’s business is subject to regulation by federal, state and local legislatures and agencies that could impose significant cost on the Company’s business operations.
KCS israil subsidiaries are subject to legislation and regulation enacted by federal, state and local legislatures and agencies in the U.S. and Mexico with respect to railroad operations. Government regulation of the railroad industry is a significant determinant of the competitiveness and profitability of railroads. Changes in legislation or regulation could have a negative impact on KCS’s ability to negotiate prices for rail services, could negatively affect competition among rail carriers, or could negatively impact operating practices, resulting in reduced efficiency, increased operating costs or increased capital investment, all of which could result in a material adverse effect on KCS’s consolidated financial statements.
New economic regulation in the U.S. or Mexico in current or future proceedings could change the regulatory framework within which the Company operates which could materially change the Company's business and have ana material adverse effect on the Company's consolidated financial statements.
Amendments to the Mexican Regulatory Railroad Service Law became effective in January 2015 and the new Mexican antitrust legislation became effective in July 2014. Under Article 47 of the Mexican Regulatory Railroad Service Law and its regulations, if the COFECE determines that effective competition does not exist, then the ARTF has authority to impose new limited mandatory trackage rights and/or rate regulation.
COFECE´s antitrust review is underway. The purpose of that review is to determine whether or not there is “effective competition” in the rail markets for interconnection services, switching rights and trackage rights. The COFECE review includes the entire freight rail transportation market in Mexico and is not targeted to any single rail carrier. Notwithstanding that, it is too early to determine what, if any, impact this review may have on Mexican rail operations in the future, if the COFECE determines there is a lack of effective competition, it could request the ARTF to establish new limited mandatory trackage rights and/or rate regulation under the Amendments to the Mexican Regulatory Railroad Service Law. COFECE has extended its own preliminary report deadline to January 30, 2017.
COFECE has not published guidelines regarding the factors that constitute a lack of competition. It is, therefore, unclear under what particular circumstances COFECE would deem a lack of competition to exist. If the ARTF intervenes and imposes remedies, it may negatively impact profitability.
As part of the Rail Safety Improvement Act of 2008 in the United States, Class I railroad carriers and passenger and commuter rail operators must implement PTC, a technology designed to help prevent train-to-train collisions, overspeed derailments, incursions into rail work zones, and entry into main line track if a switch is misaligned. PTC is required to be implemented at certain locations, including main line track where toxic inhalation hazard movements regularly occur or where passenger operations occur. The Surface Transportation Extension Act of 2015 extendedamended the PTC deadline set by the Rail Safety Improvement Act to require implementation deadline from the end of 2015 toPTC by the end of 2018, conditioned upon the filing of revised PTC Implementation Plans, with a further two-year
extension possible subjectwhich was extended to review by the Department of Transportation.December 31, 2020 for KCS, filed a revised PTC Implementation Plan by the statutory due date.as certain other criteria were satisfied. PTC will add to operating costs, increase the number of employees the Company employs and require KCS to make significant investments in new safety technology. KCS’s failure to meet deadlines, including any extension, could result in fines, service interruptions or penalties and could have a material adverse effect on the Company’s consolidated financial statements.
KCS’s inadvertent failure or inability to comply with applicable laws and regulations could have a material adverse effect on the Company’s consolidated financial statements and operations, including fines, penalties, or limitations on operating activities until compliance with applicable requirements is achieved. Congress and government agencies may change the legislative or regulatory framework within which the Company operates without providing any recourse for any adverse effects on the Company’s business that occur as a result of such change. Additionally, some of the regulations require KCS to obtain and maintain various licenses, permits and other authorizations. Any failure to obtain or maintain these licenses, permits, and other authorizations could adversely affecthave a material adverse effect on KCS’s business operations.
KCSM’s Mexican Concession is subject to revocation or termination in certain circumstances which would prevent KCSM from operating its railroadconducting rail operations over the Concession and would have a material adverse effect on the Company’s consolidated financial statements.
KCSM operates under the Concession granted by the Mexican government until June 2047, which is renewable for an additional period of up to 50 years, subject to certain conditions. The Concession gives KCSM exclusive rights to provide freight transportation services over its rail lines for thethrough 2027 (the first 30 years of the 50-year Concession,Concession), subject to certain trackage and haulage rights granted to other concessionaires. The SCT and ARTF, which are principally responsible for regulating railroad services in Mexico, have broad powers to monitor KCSM’s compliance with the Concession, and they can require KCSM to supply them with any technical, administrative and financial information they request. Among other obligations, KCSM must comply with the investment commitments established in its business plan, which forms an integral part of the Concession, and must update the plan every three years. The SCT treats KCSM’s business plans confidentially. The SCT and ARTF also monitor KCSM’s compliance with efficiency and safety standards established in the Concession. The SCT and ARTF review, and may amend, these standards from time to time.
Under the Concession, KCSM has the right to operate its rail lines, but it does not own the land, roadway or associated structures. If the Mexican government legally terminates the Concession, it would own, control, and manage such public domain assets used in the operation of KCSM’s rail lines. All other property not covered by the Concession, including all locomotives and railcars otherwise acquired, would remain KCSM’s property. In the event of early termination, or total or partial revocation of the Concession, the Mexican government would have the right to cause the Company to lease all service-related assets to it for a term of at least one year, automatically renewable for additional one-year terms up to five years. The amount of rent would be determined by experts appointed by KCSM and the Mexican government. The Mexican government must exercise this right within four months after early termination or revocation of the Concession. In addition, the Mexican government would also have a right of first refusal with respect to certain transfers by KCSM of railroad equipment within 90 days after revocation of the Concession.
The Mexican government may also temporarily seize control of KCSM’s rail lines and its assets in the event of a natural disaster, war, significant public disturbance or imminent danger to the domestic peace or economy. In such a case, the SCT may restrict KCSM’s ability to exploit the Concession in such manner as the SCT deems necessary under the circumstances, but only for the duration of any of the foregoing events. Mexican law requires that the Mexican government pay compensation if it effects a statutory appropriation for reasons of the public interest. With respect to a temporary seizure due to any cause other than international war, the Mexican Regulatory Railroad Service Law and regulations provide that the Mexican government will indemnify an affected concessionaire for an amount equal to damages caused and losses suffered. However, these payments may not be sufficient to compensate KCSM for its losses and may not be made timely.
The SCT may revoke the Concession if KCSM is sanctioned onfor the same cause at least three times within a specified numberperiod of occasionsfive years for any of the following: unjustly interrupting the operation of its rail lines or for charging rates higher than those it has registered with the ARTF; unlawfully restricting the ability of other Mexican rail operators to use its rail lines; failing to make payments for damages caused during the performance of services; failing to comply with any term or condition of the Mexican Regulatory Railroad Service Law and regulations or the Concession; failing to make the capital investments required under its three-year business plan filed with the SCT; or failing to maintain an obligations compliance bond and insurance coverage as specified in the Mexican Regulatory Railroad Service Law and regulations. In addition, the Concession would revoketerminate automatically if KCSM changes its nationality or assigns or creates any lien on the Concession, or if there is a change in control of KCSM without the
SCT’s approval. The SCT may also terminate the Concession as a result of KCSM’s surrender of its rights under the Concession, or for reasons of public interest or upon KCSM’s liquidation or bankruptcy. If the Concession is terminated or revoked by the SCT for any reason, KCSM would receive no compensation and its interest in its rail lines, and all other fixtures covered by the Concession, as well as all improvements made by it, would revert to the Mexican government. Revocation or termination of the Concession could adversely affecthave a material adverse effect on the Company’s consolidated financial statements.
KCS’s ownership of KCSM and operations in Mexico subject it to economic and political risks.
The Mexican government has exercised, and continues to exercise, significant influence over the Mexican economy. Accordingly, Mexican governmental actions concerning the economy and state-owned enterprises could have a significant impact on Mexican private sector entities in general and on KCSM’s operations in particular. KCS cannot predict the impact that the political landscape, including multiparty rule and civil disobedience, will have on the Mexican economy. Furthermore,
KCS’s consolidated financial statements and prospects may be affected by currency fluctuations, inflation, interest rates, regulation, taxation and other political, social and economic developments in or affecting Mexico.
The Mexican economy in the past has suffered balance of payment deficits and shortages in foreign exchange reserves. Although Mexico has imposed foreign exchange controls in the past, there are currently no exchange controls in Mexico. Pursuant to the provisions of NAFTA, if Mexico experiences serious balance of payment difficulties or the threat of such difficulties in the future, Mexico would have the right to impose foreign exchange controls on investments made in Mexico, including those made by United States and Canadian investors. Any restrictive exchange control policy could adversely affect KCS’s ability to obtain U.S. dollars or to convert Mexican pesos (“pesos” or “Ps.”) into dollars for purposes of making payments. This could have a material adverse effect on KCS’s consolidated financial statements.
The social and political situation in Mexico could adversely affect the Mexican economy and changes in laws, public policies and government programs could be enacted, which could have ana material adverse effect on KCS’s consolidated financial statements.
Downturns in the United States economy or in trade between the United States and Asia or Mexico and fluctuations in the peso-dollar exchange rates would likelycould have adverse effects on KCS’s consolidated financial statements.
The level and timing of KCS’s Mexican business activity is heavily dependent upon the level of United States-Mexican trade and the effects of NAFTAcurrent or future multinational trade agreements on such trade. The Mexican operations depend on the United States and Mexican markets for the products KCSM transports, the relative position of Mexico and the United States in these markets at any given time, and tariffs or other barriers to trade. Failure to preserve free trade provisions, or any other action imposing import duties or border taxes, could negatively impact KCS customers and the volume of rail shipments, and could have a material adverse effect on KCS’s consolidated financial statements.
Downturns in the United States or Mexican economies or in trade between the United States and Mexico would likelycould have material adverse effects on KCS’s consolidated financial statements and the Company’s ability to meet debt service obligations. In addition, KCS has invested significant amounts in developing its intermodal operations, including the Port of Lazaro Cardenas, in part to provide Asian importers with an alternative to the west coast ports of the United States, and the level of intermodal traffic depends, to an extent, on the volume of Asian shipments routed through Lazaro Cardenas. Reduction in trading volumes, which may be caused by factors beyond KCS’s control, including increased government regulations regarding the safety and quality of Asian-manufactured products, may adversely affect KCS’s consolidated financial statements.
U.S. President Donald J. Trump, certain members of the U.S. House of Representatives, and key U.S. administrative officials and policy makers have suggested renegotiation of NAFTA and the implementation of tariffs, border taxes or other measures that could impact the level of trade between the U.S. and Mexico. Any such proposal or measure could negatively impact KCS customers and the volume of rail shipments, and could have a material adverse effect on KCS’s consolidated financial statements.
Additionally, fluctuations in the peso-dollar exchange rates could lead to shifts in the types and volumes of Mexican imports and exports. Although a decrease in the level of exports of some of the commodities that KCSM transports to the United States may be offset by a subsequent increase in imports of other commodities KCSM hauls into Mexico and vice versa, any offsetting increase might not occur on a timely basis, if at all. Future developments in United States-Mexican trade beyond the Company’s control may result in a reduction of freight volumes or in an unfavorable shift in the mix of products and commodities KCSM carries.
Severe weakening of the peso against the U.S. dollar may result in disruption of the international foreign exchange markets and may limit the ability to transfer pesos or to convert pesos into U.S. dollars for the purpose of making timely
payments of interest and principal on the non-peso denominated indebtedness. Although the Mexican government currently does not restrict, and for many years has not restricted, the right or ability of Mexican or foreign persons or entities to convert pesos into U.S. dollars or to transfer foreign currencies out of Mexico, the Mexican government could, as in the past, institute restrictive exchange rate policies that could limit the ability to transfer or convert pesos into U.S. dollars or other currencies for the purpose of making timely payments and contractual commitments. Devaluation or depreciation of the peso against the U.S. dollar may also adversely affect U.S. dollar prices for KCS’s securities.
Fluctuations in the peso-dollar exchange rates also have an effect on KCS’s consolidated financial statements. A weakening of the peso against the U.S. dollar would cause reported peso-denominated revenues and expenses to decrease, and wouldcould increase reported foreign exchange loss due to the Company’s net monetary assets that are peso-denominated. Exchange rate variations also affect the calculation of taxes under Mexican income tax law, and a strengthening of the peso against the U.S. dollar wouldcould cause an increase in the Company’s cash tax obligation and effective income tax rate.
Severe weather or other natural disasters could result in significant business interruptions and expenditures.
The Company’s operations may be affected by severe weather or other natural disasters. The Company operates in and along the Gulf of Mexico, and its facilities may be materially adversely affected by hurricanes, floods and other extreme
weather conditions that could also adversely affect KCS’s shipping, agricultural, chemical and other customers. Severe weather or other natural disasters could result in significant business interruption and could have a material adverse effect on KCS’s consolidated financial statements.
KCS’s business may be adversely affected by changes in general economic or other conditions.
KCS’s operations may be materially adversely affected by changes in the economic conditions of the industries and geographic areas that produce and consume the freight that KCS transports. The relative strength or weakness of the United States and Mexican economies affects the businesses served by KCS. A significant and sustained decrease in crude oil prices could adversely affect the transport of crude oil by rail to the U.S. Gulf region as well as negatively impact railroad volumes related to equipment and other materials that support crude oil production. Prolonged negative changes in domestic and global economic conditions or disruptions of either or both of the financial and credit markets, including the availability of short and long-term debt financing, may affect KCS, as well as the producers and consumers of the commodities that KCS transports and may have a material adverse effect on KCS’s consolidated financial statements.
The transportation industry is highly cyclical, generally tracking the cycles of the world economy. Although transportation markets are affected by general economic conditions, there are numerous specific factors within each particular market that may influence operating results. Some of KCS’s customers do business in industries that are highly cyclical, including the energy, automotive, housing and agriculture industries. Any downturn or change in government policy in these industries could have a material adverse effect on operating results. Also, some of the products transported have had a historical pattern of price cyclicality which has typically been influenced by the general economic environment and by industry capacity and demand. KCS cannot assure that prices and demand for these products will not decline in the future, adversely affecting those industries and, in turn, could have a material adverse effect on the Company’s consolidated financial statements.
Significant reductions in the volume of rail shipments due to economic or other conditions could have a material adverse effect on KCS’s consolidated financial statements.
KCS depends on the stability, availability and security of its information technology systems to operate its business.
KCS relies on information technology in all aspects of its business. A significant disruption or failure of its information technology systems, including its computer hardware, software, communications equipment, wayside equipment or locomotive onboard equipment could result in service interruptions, safety failures, security failures, regulatory compliance failures or other operational difficulties.
The security risks associated with information technology systems have increased in recent years because of the increased sophistication, activities and evolving techniques of perpetrators of cyber attacks. A failure in or breach of KCS’s information technology security systems, or those of its third party service providers, as a result of cyber attacks or unauthorized access to its network could disrupt KCS’s business, result in the disclosure or misuse of confidential or proprietary information, increase its costs and/or cause losses and reputational damage. KCS also confronts the risk that a terrorist or nation-state sponsored group may seek to use its property, including KCS’s information technology systems, to inflict major harm.
A significant disruption, failure or unauthorized access of KCS’s information technology system could have a material adverse effect on KCS’s consolidated financial statements.
Capacity constraints could adversely affect service and operating efficiency.
KCS may experience capacity constraints due to increased demand for rail services, unavailability of equipment, crew shortages, or extreme weather. Also, due to the interconnectivity between all railroads, especially in the U.S., congestion on other railroads could result in operational inefficiencies for KCS.
Traffic congestion experienced in the U.S. or Mexican railroad system may result in overall traffic congestion which would impact the ability to move traffic to and from Mexico. In addition, the growth of cross border traffic in recent years has contributed to congestion on the international bridge at the Nuevo Laredo-Laredo border gateway,Mexico, which is expected to continue in the near future. This could also result in operational inefficiencies for KCS and adversely affectcould have a material adverse effect on KCS’s operations.
Significant expansions in the capacity of the Company’s network can require a substantial amount of time and investment. Although KCS constantly monitors its network in an effort to optimize its rail services, there can be no assurance that such measures will adequately address capacity constraints on a timely basis.
KCS may be subject to various claims and litigation that could have a material adverse effect on KCS’s consolidated financial statements.
The Company may be exposed to the potential of various claims and litigation related to labor and employment, personal injury, commercial disputes, freight loss and other property damage, and other matters that arise in the normal course of business. Any material changes to litigation trends or a catastrophic rail accident or series of accidents involving any or all of property damage, personal injury, and environmental liability could have a material adverse effect on KCS’s consolidated financial statements.
KCS competes against other railroads and other transportation providers.
The Company’s domestic and international operations are subject to competition from other railroads, as well as from truck carriers, barge lines, and other maritime shippers. Many of KCS’s rail competitors are much larger and have significantly greater financial and other resources than KCS, which may enable rail competitors to reduce rates and make KCS’s freight services less competitive. KCS’s ability to respond to competitive pressures by matching rate reductions and decreasing rates without adversely affecting gross margins and operating results will depend on, among other things, the ability to reduce operating costs. KCS’s failure to respond to competitive pressures, and particularly rate competition, in a timely manner could have a material adverse effect on the Company’s consolidated financial statements.
The railroad industry is dominated by a few large carriers. These larger railroads could attempt to use their size and pricing power to block other railroads’ access to gateways and routing options that are currently and have historically been available. In addition, if there is future consolidation in the railroad industry in the United States or Mexico, there can be no assurance that it will not have ana material adverse effect on the Company’s consolidated financial statements.
Trucking, maritime, and barge competitors, while able to provide rate and service competition to the railroad industry, are able to use public rights-of-way, require substantially smaller capital investment and maintenance expenditures than railroads and allow for more frequent and flexible scheduling. Continuing competitive pressures, any reduction in margins due to competitive pressures, developments that increase the quality or decrease the cost of alternative modes of transportation in the locations in which the Company operates, or legislation or regulations that provide motor carriers with additional advantages, such as increased size of vehicles and reduced weight restrictions, could result in downward pressure on freight rates, which in turn could have a material adverse effect on the Company’s consolidated financial statements.
A key part of KCS’s growth strategy is based upon the conversion of truck traffic to rail. There can be no assurance the Company will succeed in its efforts to convert traffic from truck to rail transport or that the customers already converted will be retained. If the railroad industry in general is unable to preserve its competitive advantages vis-à-vis the trucking industry, revenue growth could be adversely affected. Additionally, revenue growth could be affected by, among other factors, an expansion in the availability, or an improvement in the quality, of the trucking services offered by carriers resulting from regulatory and administrative interpretations and implementation of certain provisions of NAFTA,current or future multinational trade agreements, and KCS’s inability to grow
its existing customer base and capture additional cargo transport market share because of competition from the shipping industry and other railroads.
KCS’s business strategy, operations and growth rely significantly on agreements with other railroads and third parties.
Operation of KCS’s rail network and its plans for growth and expansion rely significantly on agreements with other railroads and third parties, including joint ventures and other strategic alliances, as well as interchange, trackage rights, haulage rights and marketing agreements with other railroads and third parties that enable KCS to exchange traffic and utilize trackage the Company does not own. KCS’s ability to provide comprehensive rail service to its customers depends in large part upon its ability to maintain these agreements with other railroads and third parties, and upon the performance of the obligations under the agreements by the other railroads and third parties. The termination of, or the failure to renew, these agreements could adversely affecthave a material adverse effect on KCS’s consolidated financial statements. KCS is also dependent in part upon the financial strength and efficient performance of other railroads. There can be no assurance that KCS will not be materially adversely affected by operational or financial difficulties of other railroads.
KCS is subject to environmental regulations, which may impose significant costs on the Company’s business operations.
KCS subsidiaries’ operations are subject to environmental regulation enacted by federal, state and local legislatures in the U.S. and Mexico. From time to time, certain KCS facilities have not been in compliance with environmental health and safety
laws and regulations and there can be no assurance that KCS will always be in compliance with such laws and regulations in the future. Environmental liability under federal and state law in the United States can also extend to previously owned or operated properties, leased properties and properties owned by third parties, as well as to properties currently owned and used by the Company. Environmental liabilities may also arise from claims asserted by adjacent landowners or other third parties. Given the nature of its business, the Company incurs, and expects to continue to incur, environmental compliance costs, including, in particular, costs necessary to maintain compliance with requirements governing chemical and hazardous material shipping operations, refueling operations and repair facilities. KCS presently has environmental investigation and remediation obligations at certain sites, and will likely incur such obligations at additional sites in the future.
The Company’s Mexican subsidiaries’ operations are subject to Mexican federal and state laws and regulations relating to the protection of the environment, including standards for, among other things, water discharge, water supply, emissions, noise pollution, hazardous substances and transportation and handling of hazardous and solid waste. Under applicable Mexican law and regulations, administrative and criminal proceedings may be brought and economic sanctions imposed against companies that violate environmental laws, and non-complying facilities may be temporarily or permanently closed. KCSM is also subject to the laws of various jurisdictions with respect to the discharge of materials into the environment and to environmental laws and regulations issued by the governments of each of the Mexican states in which KCSM’s facilities are located. The terms of KCSM’s Concession from the Mexican government also impose environmental compliance obligations on KCSM. Failure to comply with any environmental laws or regulations may result in the termination of KCSM’s Concession or in fines or penalties that may affect profitability.
Liabilities accrued for environmental costs represent the Company’s best estimate of the probable future obligation for the remediation and settlement of matters related to these sites. However, remediation costs may exceed such estimates, due to various factors such as evolving environmental laws and regulations, changes in technology, the extent of other parties’ participation, developments in environmental surveys and studies, and the extent of corrective action that may ultimately be required. The Company cannot predict the effect, if any, that unidentified environmental matters or the adoption of additional or more stringent environmental laws and regulations would have on KCS’s consolidated financial statements.
KCS’s inadvertent failure or inability to comply with applicable environmental laws and regulations could have a material adverse effect on the Company’s consolidated financial statements and operations, including fines, penalties, or limitations on operating activities until compliance with applicable requirements is achieved. Government entities may change the legislative or regulatory framework within which the Company operates without providing any recourse for any adverse effects on the Company’s business that occur as a result of such change. Additionally, some of the regulations require KCS to obtain and maintain various licenses, permits and other authorizations. Any failure to obtain or maintain these licenses, permits, and other authorizations could adversely affecthave a material adverse effect on KCS’s business operations.
KCS’s business is vulnerable to fluctuations in fuel costs and disruptions in fuel supplies.
KCS incurs substantial fuel costs in its railroad operations and these costs represent a significant portion of its transportation expenses. Significant price increases for fuel may have a material adverse effect on operating results. If KCS is unable to recapture its costs of fuel from its customers, operating results could be materially adversely affected. In addition, a severe disruption of fuel supplies resulting from supply shortages, political unrest, a disruption of oil imports, weather events, war, or otherwise, and the resulting impact on fuel prices could materially adversely affecthave a material adverse effect on KCS’s consolidated financial statements.
KCSKCSM currently meets the majority of its fuel requirements for its Mexican operations through purchases from PEMEX RefinacióTransformación Industrial (“PEMEX”), thea national oil company ofin Mexico, and other authorized fuel distributors of PEMEX fuel around the country. If PEMEX were to experience significant operational difficulties not quickly resolved, the MexicanKCSM operations could be materially adversely affected.
Weaknesses in the short and long-term debt markets could negatively impact the Company’s access to capital.
Due to the significant capital expenditures required to operate and maintain a safe and efficient railroad, the Company regularly relies on debt markets forobtains financing through the issuance of long-term debt instruments bank financing and short-term commercial paper.paper, as well as credit facilities provided by financial institutions. Instability or disruptions of the capital markets, including debt markets, or the deterioration of the Company’s financial condition due to internal or external factors, could restrict or prohibit access and could increase the cost of financing sources. A significant deterioration of the Company’s financial condition could also reduce credit
ratings to below investment grade, limiting its access to external sources of capital, and increasing the costs of short and long-term debt financing, and could have a material adverse effect on KCS’s consolidated financial statements.
KCS’s business may be affected by climate change and the market and regulatory responses to climate change.
Climate change could have a material adverse effect on operations and KCS’s operations may be adversely affected by restrictions,consolidated financial statements. Restrictions, caps, taxes, or other controls on emissions of greenhouse gases, including diesel exhaust.exhaust, could significantly impact operations and increase operating costs. Restrictions on emissions could also affect KCS’s customers that use commodities that KCS transports to produce energy, use significant amounts of energy in producing or delivering the commodities KCS transports, or manufacture or produce goods that consume significant amounts of energy or burn fossil fuels, including coal-fired power plants, chemical producers, farmers and food producers, and automakers and other manufacturers. Significant cost increases, government regulation, or changes of consumer preferences for goods or services relating to alternative sources of energy or emissions reductions could materially affect the markets for the commodities KCS transports, which in turn could have a material adverse effect on KCS’s consolidated financial statements. Government incentives encouraging the use of alternative sources of energy could also affect certain customers and their respective markets for certain commodities KCS transports in an unpredictable manner that could alter traffic patterns, including, for example, the impacts of ethanol incentives on farming and ethanol producers. Any of these factors, individually or in conjunction with one or more of the other factors, or other unforeseen impacts of climate change could have a material adverse effect on KCS’s consolidated financial statements.
A majority of KCS’s employees belong to labor unions. Strikes or work stoppages could adversely affect operations.
The Company is a party to collective bargaining agreements with various labor unions in the United States and Mexico. As of December 31, 2016,2018, approximately 75% and 80% of KCSR and KCSM Servicios employees, respectively, were covered by labor contracts subject to collective bargaining. The Company may be subject to, among other things, strikes, work stoppages or work slowdowns as a result of disputes under these collective bargaining agreements and labor contracts or KCS’s potential inability to negotiate acceptable contracts with these unions. In the United States, because such agreements are generally negotiated on an industry-wide basis, determination of the terms and conditions of labor agreements have been and could continue to be beyond KCS’s control. KCS may, therefore, be subject to terms and conditions in industry-wide labor agreements that could have a material adverse effect on its consolidated financial statements. If the unionized workers in the United States or Mexico were to engage in a strike, work stoppage or other slowdown; if other employees were to become unionized or if the terms and conditions in future labor agreements were renegotiated, KCS could experience a significant disruption of its operations and higher ongoing labor costs. Although the U.S. Railway Labor Act imposes restrictions on the right of United States railway workers to strike, there is no law in Mexico imposing similar restrictions on the right of railway workers in that country to strike.
KCS is dependent on certain key suppliers of core rail equipment.
KCS relies on a limited number of suppliers of core rail equipment (including locomotives, rolling stock equipment, rail and ties). The capital intensive nature and complexity of such equipment creates high barriers of entry for any potential new suppliers. If any of KCS’s suppliers discontinue production or experience capacity or supply shortages, this could result in increased costs or difficulty in obtaining rail equipment and materials, which could have a material adverse effect on KCS’s consolidated financial statements.
The availabilityunavailability of qualified personnel could adversely affect KCS’s operations.
Changes in demographics, training requirements and the availabilityunavailability of qualified personnel could negatively affect KCS’s ability to meet demand for rail service. Unforeseen increases in demand for rail services may exacerbate such risks, which could have a negative impact on KCS’s operational efficiency and otherwise have a material adverse effect on KCS’s consolidated financial statements.
KCS’s business may be affected by future acts of terrorism, war or other acts of violence or crime.
Terrorist attacks, such as an attack on the Company’s chemical transportation activities, any government response thereto and war or risk of war may adversely affectcould have a material adverse effect on KCS’s consolidated financial statements. These acts may also impact the Company’s ability to raise capital or its future business opportunities. KCS’s rail lines and facilities could be direct targets or indirect casualties of acts of terror, which could cause significant business interruption and damage to KCS’s
property. In recent years, there have been reported incidents of train-related robberies in Mexico, including incidents involving KCSM’s trains and infrastructure. Other acts of violence or crime could also materially adversely affect the Company’s business.
As a result, acts of terrorism or war or acts of crime or violence could result in increased costs and liabilities and decreased revenues for KCS. In addition, insurance premiums charged for some or all of the applicable coverage currently maintained by KCS could increase dramatically or certain coverage may not be adequate to cover losses or may not be available in the future.
| |
| Item 1B. | Unresolved Staff Comments |
None.
Track Configuration
KCSRThe Kansas City Southern Railway Company (“KCSR”) operates over a railroad system consisting of approximately 3,400 route miles in ten states extending from the midwest and southeast portions of the United States south to the Mexican border, which includes approximately 635640 miles of trackage rights that permit KCSR to operate its trains with its crews over other railroads’ tracks.
Under its Concessionconcession from the Mexican government KCSM(the “Concession”), Kansas City Southern de México, S.A. de C.V. (“KCSM”) has the right to operate approximately 3,2003,300 route miles, but does not own the land, roadway, or associated structures, and additionally has approximately 550 miles of trackage rights. The Concession requires KCSM to make investments as described in a business plan filed every three years with the Mexican government. See Item 1A, “RiskRisk Factors — KCSM’s“KCSM’s Mexican Concession is subject to revocation or termination in certain circumstances which would prevent KCSM from operating its railroad and would have a material adverse effect on the Company’s consolidated financial statements.”
Kansas City Southern Rail Network
Equipment Configuration
As of December 31, 20162018 and 20152017, KCS owned and leased the following units of equipment:
| | | | 2016 | | 2015 | 2018 | | 2017 |
| | Owned | | Leased | | Total | | Owned | | Leased | | Total | Owned | | Leased | | Total | | Owned | | Leased | | Total |
| Freight Cars: | | | | | | | | | | | | | | | | | | | | | | |
| Box cars | 3,212 |
| | 2,105 |
| | 5,317 |
| | 3,003 |
| | 3,359 |
| | 6,362 |
| 3,178 |
| | 991 |
| | 4,169 |
| | 3,205 |
| | 1,212 |
| | 4,417 |
|
| Hoppers (covered and open top) | 4,333 |
| | 2,030 |
| | 6,363 |
| | 4,048 |
| | 2,116 |
| | 6,164 |
| 5,419 |
| | 1,108 |
| | 6,527 |
| | 4,735 |
| | 2,107 |
| | 6,842 |
|
| Gondolas | 2,789 |
| | 1,295 |
| | 4,084 |
| | 2,798 |
| | 1,365 |
| | 4,163 |
| 2,560 |
| | 169 |
| | 2,729 |
| | 2,619 |
| | 1,267 |
| | 3,886 |
|
| Automotive | 2,483 |
| | 768 |
| | 3,251 |
| | 2,084 |
| | 808 |
| | 2,892 |
| 3,316 |
| | 742 |
| | 4,058 |
| | 2,731 |
| | 1,142 |
| | 3,873 |
|
| Flat cars (intermodal and other) | 851 |
| | 97 |
| | 948 |
| | 807 |
| | 82 |
| | 889 |
| 1,142 |
| | 1,075 |
| | 2,217 |
| | 850 |
| | 98 |
| | 948 |
|
| Tank cars | 4 |
| | 645 |
| | 649 |
| | 6 |
| | 651 |
| | 657 |
| 4 |
| | 570 |
| | 574 |
| | 4 |
| | 568 |
| | 572 |
|
| Total | 13,672 |
| | 6,940 |
| | 20,612 |
| | 12,746 |
| | 8,381 |
| | 21,127 |
| 15,619 |
| | 4,655 |
| | 20,274 |
| | 14,144 |
| | 6,394 |
| | 20,538 |
|
| | | | | | | | | | | | | | | | | | | | | | | |
| Locomotives: | | | | | | | | | | | | | | | | | | | | | | |
| Freight | 736 |
| | 121 |
| | 857 |
| | 736 |
| | 121 |
| | 857 |
| 753 |
| | 119 |
| | 872 |
| | 736 |
| | 146 |
| | 882 |
|
| Switching | 187 |
| | — |
| | 187 |
| | 187 |
| | — |
| | 187 |
| 177 |
| | — |
| | 177 |
| | 187 |
| | — |
| | 187 |
|
| Total | 923 |
| | 121 |
| | 1,044 |
| | 923 |
| | 121 |
| | 1,044 |
| 930 |
| | 119 |
| | 1,049 |
| | 923 |
| | 146 |
| | 1,069 |
|
| | | Average Age (in Years) of Owned and Leased Locomotives: | 2016 | | 2015 | 2018 | | 2017 |
| Freight | 15.0 |
| | 14.0 |
| 16.9 |
| | 16.2 |
|
| Switching | 41.0 |
| | 40.0 |
| 43.5 |
| | 42.0 |
|
| All locomotives | 19.7 |
| | 18.7 |
| 21.5 |
| | 20.2 |
|
Property and Facilities
KCS operates numerous facilities, including terminals for intermodal and other freight, rail yards for train-building, switching, storage-in-transit (the temporary storage of customer goods in rail cars prior to shipment) and other activities; offices to administer and manage operations; dispatch centers to direct traffic on the rail network; crew quarters to house train crews along the rail line; and shops and other facilities for fueling and maintenance and repair of locomotives, freight cars and other equipment.
Capital Expenditures
The Company’s cash capital expenditures for the three years ended December 31, 20162018, 20152017, and 20142016, and planned 20172019 capital expenditures are included in Item 7, “Management’sManagement’s Discussion and Analysis of Financial Condition and Results of Operations — Liquidity and Capital Resources — Capital Expenditures”.Expenditures. See also Item 7, “Management’sManagement’s Discussion and Analysis of Financial Condition and Results of Operations — Critical Accounting Policies and Estimates — Capitalization, Depreciation and Amortization of Property and Equipment (including Concession Assets)” regarding the Company’s policies and guidelines related to capital expenditures.
The Company is subject to various legal proceedings and claims that arise in the ordinary course of business. For more information on legal proceedings, see Item 1A, “RiskRisk Factors — KCS“KCS may be subject to various claims and litigation that could have a material adverse effect on KCS’s consolidated financial statements,” Item 7, “Management’sManagement’s Discussion and Analysis of Financial Condition and Results of Operations — “OtherOther Matters — Litigation,” and Item 8, “FinancialFinancial Statements and Supplementary Data — Note 16, Commitments and Contingencies.”
| |
| Item 4. | Mine Safety Disclosures |
Not applicable.
Part II
| |
| Item 5. | Market for KCS’s Common Equity, Related Stockholder Matters and Issuer Purchases of Equity Securities |
Market Information
The Company’s common stock is traded on the New York Stock Exchange under the ticker symbol “KSU”. The following table presents for the quarters indicated the dividends declared and the high and low sales price offor the Company’s common and preferred stock.
|
| | | | | | | | | | | | | | | |
| | Fourth | | Third | | Second | | First |
| 2016 | | | | | | | |
| Dividends per share: | | | | | | | |
| Common stock | $ | 0.33 |
| | $ | 0.33 |
| | $ | 0.33 |
| | $ | 0.33 |
|
| $25 par preferred stock | 0.25 |
| | 0.25 |
| | 0.25 |
| | 0.25 |
|
| | | | | | | | |
| Stock price ranges: | | | | | | | |
| $25 par preferred: | | | | | | | |
| — High | $ | 31.10 |
| | $ | 29.54 |
| | $ | 29.00 |
| | $ | 27.30 |
|
| — Low | 25.52 |
| | 26.40 |
| | 25.70 |
| | 25.31 |
|
| Common: | | | | | | | |
| — High | $ | 96.83 |
| | $ | 100.69 |
| | $ | 98.99 |
| | $ | 88.84 |
|
| — Low | 79.30 |
| | 86.52 |
| | 83.00 |
| | 62.20 |
|
| | | | | | | | |
| 2015 | | | | | | | |
| Dividends per share: | | | | | | | |
| Common stock | $ | 0.33 |
| | $ | 0.33 |
| | $ | 0.33 |
| | $ | 0.33 |
|
| $25 par preferred stock | 0.25 |
| | 0.25 |
| | 0.25 |
| | 0.25 |
|
| | | | | | | | |
| Stock price ranges: | | | | | | | |
| $25 par preferred: | | | | | | | |
| — High | $ | 27.10 |
| | $ | 29.00 |
| | $ | 28.90 |
| | $ | 29.75 |
|
| — Low | 25.37 |
| | 25.25 |
| | 25.25 |
| | 27.02 |
|
| Common: | | | | | | | |
| — High | $ | 100.40 |
| | $ | 101.24 |
| | $ | 108.29 |
| | $ | 122.90 |
|
| — Low | 69.70 |
| | 86.38 |
| | 90.02 |
| | 101.14 |
|
|
| | | | | | | | | | | | | | | |
| | Fourth | | Third | | Second | | First |
| 2018 | | | | | | | |
| Dividends per share: | | | | | | | |
| Common stock | $ | 0.36 |
| | $ | 0.36 |
| | $ | 0.36 |
| | $ | 0.36 |
|
| $25 par preferred stock | 0.25 |
| | 0.25 |
| | 0.25 |
| | 0.25 |
|
| | | | | | | | |
| 2017 | | | | | | | |
| Dividends per share: | | | | | | | |
| Common stock | $ | 0.36 |
| | $ | 0.36 |
| | $ | 0.33 |
| | $ | 0.33 |
|
| $25 par preferred stock | 0.25 |
| | 0.25 |
| | 0.25 |
| | 0.25 |
|
| | | | | | | | |
Dividend Policy
Common Stock. Any declarations and payments of dividends to holders of the Company’s common stock are at the discretion of the Board of Directors, which dependsand are based on many factors, including the Company’s financial condition, earnings, capital requirements and other factors that the Board of Directors deems relevant. Subject to these qualifications, the Company expects to continue to pay dividends on an ongoing basis.
Holders
There were 2,2292,063 record holders of KCS common stock on January 20, 2017;18, 2019; however, the number of actual holders of KCS common stock is greater due to the practice of brokerage firms registering many shares for clients in the brokerage firm’s name.
Securities Authorized for Issuance Under Equity Compensation Plans
See Item 12, Security Ownership of Certain Beneficial Owners and Management and Related Stockholder Matters for information about securities authorized for issuance under KCS’s equity compensation plans.
Securities Authorized for Issuance Under Equity Compensation Plans
See Part III, Item 12, “Security Ownership of Certain Beneficial Owners and Management and Related Stockholder Matters” for information about securities authorized for issuance under KCS’s equity compensation plans.
Performance Graph
The following graph shows the changes in value over the five years ended December 31, 20162018, of an assumed investment of $100 in: (i) KCS’s common stock; (ii) the stocks that comprise the Dow Jones U.S. Industrial Transportation Index; and (iii) the stocks that comprise the S&P 500 Index. The table following the graph shows the value of those investments on December 31 for each of the years indicated. The values for the assumed investments depicted on the graph and in the table have been calculated assuming that any cash dividends are reinvested.
COMPARISON OF FIVE YEAR CUMULATIVE TOTAL RETURN
Among Kansas City Southern, the S&P 500 Index
and the Dow Jones U.S. Industrial Transportation Index
| | | | 2011 | 2012 | 2013 | 2014 | 2015 | 2016 | 2013 | 2014 | 2015 | 2016 | 2017 | 2018 |
| Kansas City Southern | $ | 100.00 |
| $ | 124.04 |
| $ | 185.44 |
| $ | 184.61 |
| $ | 114.59 |
| $ | 132.18 |
| $ | 100.00 |
| $ | 99.55 |
| $ | 61.80 |
| $ | 71.28 |
| $ | 89.63 |
| $ | 82.40 |
|
S&P 500 (1) | 100.00 |
| 116.00 |
| 153.58 |
| 174.60 |
| 117.01 |
| 198.18 |
| 100.00 |
| 113.69 |
| 115.26 |
| 129.05 |
| 157.22 |
| 150.33 |
|
Dow Jones U.S. Industrial Transportation (2) | 100.00 |
| 106.86 |
| 150.58 |
| 183.22 |
| 142.63 |
| 184.72 |
| 100.00 |
| 121.68 |
| 94.72 |
| 122.67 |
| 157.31 |
| 144.98 |
|
_____________________
| |
| (1) | The S&P 500 is a registered trademark of the McGraw-Hill Companies,Standard & Poor’s, a division of S&P Global, Inc. The S&P 500 Index reflects the weighted average market value for 500 companies whose shares are traded on the New York Stock Exchange, American Stock Exchange and the Nasdaq Stock Market. |
| |
| (2) | The Dow Jones U.S. Industrial Transportation Index is a registered trademark of S&P Dow Jones & Co.,Indices LLC, a division of S&P Global, Inc., an independent company. |
Purchases of Equity Securities
On May 14, 2015, the Company announced that the Board of Directors approved a share repurchase program, pursuant to which up to $500 million in shares of common stock could be purchased through June 30, 2017. During 2016,2018, KCS repurchased 2,127,6122,272,213 shares of common stock for $185.4$243.1 million at an average price of $87.15$106.98 per share under this program. and 13,775 shares of $25 par preferred stock for $0.4 million at an average price of $26.23 per share. See Item 8, Financial Statements and Supplementary Data — Note 14, Stockholders’ Equity for additional information.
The following table presents common stock repurchases during each month for the fourth quarter of 2016:2018:
|
| | | | | | | | | | | | | | |
| Period | | (a) Total Number of Shares (or Units) Purchased | | (b) Average Price Paid per Share (or Unit) | | (c) Total Number of Shares (or Units) Purchased as Part of Publicly Announced Plans or Programs | | (d) Maximum Number (or Approximate Dollar Value) of Shares (or Units) that may yet be purchased under the Plans or Programs |
| October 1-31, 2016 | | 219,000 |
| | $ | 89.87 |
| | 219,000 |
| | $ | 186,270,801 |
|
| November 1-30, 2016 | | 572,000 |
| | $ | 86.61 |
| | 572,000 |
| | $ | 136,727,495 |
|
| December 1-31, 2016 | | 190,000 |
| | $ | 85.82 |
| | 190,000 |
| | $ | 120,420,941 |
|
| Total | | 981,000 |
| | |
| | 981,000 |
| | |
|
|
| | | | | | | | | | | | | | | | | | | |
| Period | | (a) Total Number of Shares (or Units) Purchased (1) | | (b) Average Price Paid per Share (or Unit) | | (c) Total Number of Shares (or Units) Purchased as Part of Publicly Announced Plans or Programs (2) | | (d) Maximum Number (or Approximate Dollar Value) of Shares (or Units) that may yet be purchased under the Plans or Programs (2) | |
| Common stock | | | | | | | | | | | | | |
| October 1-31, 2018 | | 100,909 |
| | | $ | 102.00 |
| | | 100,909 |
| | | $ | 371,439,510 |
| | |
| November 1-30, 2018 | | 345,341 |
| | | $ | 100.58 |
| | | 345,341 |
| | | $ | 336,705,382 |
| | |
| December 1-31, 2018 | | 350,757 |
| | | $ | 99.71 |
| | | 350,757 |
| | | $ | 301,732,864 |
| | |
| Total | | 797,007 |
| | | |
| | | 797,007 |
| | | |
| | |
| $25 Par preferred stock | | | | | | | | | | | | | |
| October 1-31, 2018 | | 900 |
| | | $ | 26.53 |
| | | — |
| | | — |
| | |
| November 1-30, 2018 | | 2,500 |
| | | $ | 26.58 |
| | | — |
| | | — |
| | |
| December 1-31, 2018 | | 1,150 |
| | | $ | 26.15 |
| | | — |
| | | — |
| | |
| Total | | 4,550 |
| | | | | | — |
| | | | | |
|
| | |
| (1 | ) | All $25 par preferred stock repurchases were made other than through a publicly disclosed plan or program. Repurchases of $25 par preferred stock were made through open market purchases and/or privately negotiated transactions. |
| (2 | ) | On August 15, 2017, the Company announced that the Board of Directors approved a share repurchase program, pursuant to which up to $800.0 million in shares of common stock could be repurchased through June 30, 2020. The authorization included a $200.0 million Accelerated Share Repurchase (“ASR”) program and a $600.0 million open market share repurchase program. |
| |
| |
| Item 6. | Selected Financial Data |
The selected financial data below (in millions, except per share amounts) should be read in conjunction with “Management’sItem 7, Management’s Discussion and Analysis of Financial Condition and Results of Operations” included under Item 7 of this Form 10-KOperations as well as the consolidated financial statements and the related notes.
| | | | 2016 | | 2015 | | 2014 | | 2013 | | 2012 | 2018 | | 2017 | | 2016 | | 2015 | | 2014 |
| Earnings From Continuing Operations | | | | | | | | | | | | | | | | | | |
| Revenues | $ | 2,334.2 |
| | $ | 2,418.8 |
| | $ | 2,577.1 |
| | $ | 2,369.3 |
| | $ | 2,238.6 |
| $ | 2,714.0 |
| | $ | 2,582.9 |
| | $ | 2,334.2 |
| | $ | 2,418.8 |
| | $ | 2,577.1 |
|
| Operating expenses (i) (ii) (iii) | 1,515.7 |
| | 1,615.0 |
| | 1,768.0 |
| | 1,630.7 |
| | 1,522.7 |
| 1,727.7 |
| | 1,661.3 |
| | 1,515.7 |
| | 1,615.0 |
| | 1,768.0 |
|
| Operating income | $ | 818.5 |
| | $ | 803.8 |
| | $ | 809.1 |
| | $ | 738.6 |
| | $ | 715.9 |
| $ | 986.3 |
| | $ | 921.6 |
| | $ | 818.5 |
| | $ | 803.8 |
| | $ | 809.1 |
|
Net income (iv) | $ | 479.9 |
| | $ | 485.3 |
| | $ | 504.3 |
| | $ | 353.3 |
| | $ | 379.4 |
| $ | 629.4 |
| | $ | 963.9 |
| | $ | 479.9 |
| | $ | 485.3 |
| | $ | 504.3 |
|
| Earnings per common share: | | | | | | | | | | | | | | | | | | |
| Basic | $ | 4.44 |
| | $ | 4.41 |
| | $ | 4.56 |
| | $ | 3.19 |
| | $ | 3.44 |
| $ | 6.16 |
| | $ | 9.18 |
| | $ | 4.44 |
| | $ | 4.41 |
| | $ | 4.56 |
|
| Diluted | 4.43 |
| | 4.40 |
| | 4.55 |
| | 3.18 |
| | 3.43 |
| 6.13 |
| | 9.16 |
| | 4.43 |
| | 4.40 |
| | 4.55 |
|
| Financial Position | | | | | | | | | | | | | | | | | | |
| Total assets | $ | 8,817.5 |
| | $ | 8,341.0 |
| | $ | 7,976.4 |
| | $ | 7,283.7 |
| | $ | 6,284.7 |
| $ | 9,469.8 |
| | $ | 9,198.7 |
| | $ | 8,817.5 |
| | $ | 8,341.0 |
| | $ | 7,976.4 |
|
Total long-term debt obligations, including current portion and short-term borrowings | 2,478.2 |
| | 2,401.1 |
| | 2,301.4 |
| | 2,168.8 |
| | 1,588.7 |
| 2,689.4 |
| | 2,619.4 |
| | 2,478.2 |
| | 2,401.1 |
| | 2,301.4 |
|
| Total stockholders’ equity | 4,089.9 |
| | 3,914.3 |
| | 3,755.5 |
| | 3,370.6 |
| | 3,096.6 |
| 4,813.0 |
| | 4,548.9 |
| | 4,089.9 |
| | 3,914.3 |
| | 3,755.5 |
|
| Total equity | 4,404.5 |
| | 4,224.7 |
| | 4,064.1 |
| | 3,676.6 |
| | 3,400.7 |
| 5,132.7 |
| | 4,865.4 |
| | 4,404.5 |
| | 4,224.7 |
| | 4,064.1 |
|
| Other Data Per Common Share | | | | | | | | | | | | | | | | | | |
| Cash dividends declared per common share | $ | 1.32 |
| | $ | 1.32 |
| | $ | 1.12 |
| | $ | 0.86 |
| | $ | 0.78 |
| $ | 1.44 |
| | $ | 1.38 |
| | $ | 1.32 |
| | $ | 1.32 |
| | $ | 1.12 |
|
_____________________
| |
| (i) | During 2018, the Company recognized a pre-tax gain of $17.9 million within operating expenses for insurance recoveries related to damage from Hurricane Harvey in 2017. |
| |
| (ii) | During 2018, 2017 and 2016, the Company recognized a benefit of $37.7 million, $44.1 million and $62.8 million respectively, within operating expenses related to a credit available under changes in Mexican law for the excise tax included in the price of fuel that is purchased and consumed in locomotives and certain work equipment in Mexico. |
| |
(ii)(iii) | During 2015 and 2014, the Company recognized pre-tax lease termination costs of $9.6 million and $38.3 million, respectively, within operating expenses due to the early termination of certain operating leases and the related purchase of equipment. |
| |
(iii) | During 2012, the Company recognized a pre-tax gain of $43.0 million within operating expenses for the elimination of a deferred statutory profit sharing liability as a result of the organizational restructuring during the period. |
| |
| (iv) | During 2018, 2015 2014, 2013 and 2012,2014, the Company recognized pre-tax debt retirement and exchange costs of $2.2 million, $7.6 million $6.6 million, $119.2 million and $20.1$6.6 million, respectively, related to debt retirement and restructuring activities that occurred during the periods. |
| |
| (v) | During 2017, the Company recognized a provisional $413.0 million net tax benefit, as a result of the Tax Cuts and Jobs Act (the “Tax Reform Act”), which was signed into law December 22, 2017. During 2018, the Company recognized a $20.9 million net tax benefit for adjustments to the provisional tax impacts of the Tax Reform Act recognized in 2017. |
| |
| Item 7. | Management’s Discussion and Analysis of Financial Condition and Results of Operations |
The following is a discussion of Kansas City Southern’s results of operations, certain changes in its financial position, liquidity, capital structure and business developments for the periods covered by the consolidated financial statements included under Item 8 of this Form 10-K. This discussion should be read in conjunction with the included consolidated financial statements, the related notes, and other information included in this report.
CAUTIONARY INFORMATION
The discussions set forth in this Annual Report on Form 10-K may contain forward-looking statements within the meaning of Section 27A of the Securities Act of 1933, as amended, and Section 21E of the Securities Exchange Act of 1934, as amended. In addition, management may make forward-looking statements orally or in other writings, including, but not limited to, in press releases, quarterly earnings calls, executive presentations, in the annual report to stockholders and in other filings with the Securities and Exchange Commission. Readers can usually identify these forward-looking statements by the use of such verbs as “expects,” “anticipates,” “believes” or similar verbs or conjugations of such verbs. These statements involve a number of risks and uncertainties. Actual results could materially differ from those anticipated by such forward-looking statements. Such differences could be caused by a number of factors or combination of factors including, but not limited to, the factors identified below and those discussed under Item 1A, Risk Factors, of this Form 10-K, “Risk Factors.”10-K. Readers are strongly encouraged to consider these factors and the following factors when evaluating any forward-looking statements concerning the Company:
the outcome of claims and litigation, including those related to environmental contamination, personal injuries and property damage;
changes in legislation and regulations or revisions of controlling authority;
the adverse impact of any termination or revocation of KCSM’s ConcessionKansas City Southern de México, S.A. de C.V. (“KCSM”)’s concession by the Mexican government;
United States, Mexican and global economic, political and social conditions;
the effects of the North American Free Trade Agreement, or NAFTA,current and future multinational trade agreements on the level of trade among the United States, Mexico and Canada;
the level of trade between the United States and Asia or Mexico;
the effects of fluctuations in the peso-dollar exchange rate;
natural events such as severe weather, fire, floods, hurricanes, earthquakes or other disruptions to the Company’s operating systems, structures and equipment or the ability of customers to produce or deliver their products;
the effects of adverse general economic conditions affecting customer demand and the industries and geographic areas that produce and consume the commodities KCS carries;
the dependence on the stability, availability and security of the information technology systems to operate its business;
the effect of demand for KCS’s services exceeding network capacity or traffic congestion on operating efficiencies and service reliability;
uncertainties regarding the litigation KCS faces and any future claims and litigation;
the impact of competition, including competition from other rail carriers, trucking companies and maritime shippers in the United States and Mexico;
KCS’s reliance on agreements with other railroads and third parties to successfully implement its business strategy, operations and growth and expansion plans, including the strategy to convert customers from using trucking services to rail transportation services;
compliance with environmental regulations;
disruption in fuel supplies, changes in fuel prices and the Company’s ability to recapture its costs of fuel from customers;
material adverse changes in economic and industry conditions, including the availability of short and long-term financing, both within the United States and Mexico and globally;
climate change and the market and regulatory responses to climate change;
changes in labor costs and labor difficulties, including strikes and work stoppages affecting either operations or customers’ abilities to deliver goods for shipment;
KCS’s reliance on certain key suppliers of core rail equipment;
availabilityunavailability of qualified personnel; and
acts of terrorism, war or other acts of violence or crime or risk of such activities.
Forward-looking statements reflect the information only as of the date on which they are made. The Company does not undertake any obligation to update any forward-looking statements to reflect future events, developments, or other information. If KCS does update one or more forward-looking statements, no inference should be drawn that additional updates will be made regarding that statement or any other forward-looking statements.
CORPORATE OVERVIEW
Kansas City Southern, a Delaware corporation, is a transportation holding company that has railroad investments in the U.S., Mexico and Panama. In the U.S., the Company serves the central and south central U.S. Its international holdings serve northeastern and central Mexico and the port cities of Lazaro Cardenas, Tampico and Veracruz, and a fifty percent interest in Panama Canal Railway Company provides ocean-to-ocean freight and passenger service along the Panama Canal. KCS’s North American rail holdings and strategic alliances are primary components of a NAFTANorth American Free Trade Agreement (“NAFTA”) railway system, linking the commercial and industrial centers of the U.S., Canada and Mexico. Its principal subsidiaries and affiliates include the following:
The Kansas City Southern Railway Company (“KCSR”), a wholly-owned subsidiary;
Kansas City Southern de México, S.A. de C.V. (“KCSM”),KCSM, a wholly-owned subsidiary;
Mexrail, Inc. (“Mexrail”), a wholly-owned consolidated subsidiary; which, in turn, wholly owns The Texas Mexican Railway Company (“Tex-Mex”);
KCSM Servicios, S.A. de C.V. (“KCSM Servicios”), a wholly-owned subsidiary;
Meridian Speedway, LLC (“MSLLC”), a seventy percent-owned consolidated affiliate;
Panama Canal Railway Company (“PCRC”), a fifty percent-owned unconsolidated affiliate,affiliate;
TFCM, S. de R.L. de C.V. (“TCM”), a forty-five percent-owned unconsolidated affiliate;
Ferrocarril y Terminal del Valle de México, S.A. de C.V. (“FTVM”), a twenty-five percent-owned unconsolidated affiliate; and
PTC-220, LLC (“PTC-220”), a fourteen percent-owned unconsolidated affiliate .affiliate.
EXECUTIVE SUMMARY
20162018 Financial Overview
Revenues in 2016 decreased 3%2018 increased 5% from 2015,2017, due to a3% and 2% decreaseincreases in revenue per carload/unit and carload/unit volumes.volumes, respectively. Revenue per carload/unit decreasedincreased due to higher fuel surcharge and positive pricing impacts, partially offset by the weakening of the Mexican peso against the U.S. dollar and lower fuel surcharge, partially offset by positive pricing impacts. Energy revenue decreased by $49.6 milliondollar. Volumes increased primarily due to lower volumes inincreased refined product shipments to Mexico, crude oil growth as a result of low crude oil spreadsincreased production in Canada, higher intermodal volumes, and increased pipeline capacity. Volumes also decreased as thefavorable comparative volumes due to Hurricane Harvey service interruptions in 2017. These increases were partially offset by a decline in new crude drilling operationsEnergy driven primarily by a reduction in the U.S. has reduced the demand for frac sand. In addition, low natural gas prices and high coal inventory levels reduced the demand for utility coal in 2016.
Operating expenses decreased 6% compared to 2015,volume due to a $62.8 million MexicanTexas utility closure in January 2018, and network congestion in northern Mexico during the second half of 2018. During the second half of the fourth quarter of 2018, network fluidity improved from the peak congestion that occurred in the third quarter of 2018.
Operating expenses increased 4% compared to 2017, primarily due to higher fuel excise tax credit recognizedprices, increases in 2016,depreciation and personal injury expense, and an increase in expenses due to network congestion in northern Mexico. These increases were partially offset by gain on insurance recoveries related to hurricane damage and the weakening of the Mexican peso against the U.S. dollar and lower fuel prices.dollar. Expense reductionsfluctuations resulting from higher fuel prices and the weakening of the Mexican peso and lower fuel prices largelypartially offset the revenue reductionsfluctuations driven by these same macroeconomic factors. These expense reductions were partially offset by higher incentive compensation and increased depreciation expense. Operating expenses as a percentage of revenues decreased to 64.9%63.7% in 20162018 from 66.8%64.3% in 2015.2017.
In 2016,2018, the Company invested $584.0$512.3 million in capital expenditures. In addition, the Company purchased $26.6$100.5 million of equipment under existing operating leases or replacement equipment as certain operating leases expired, which was primarily funded with internally generated cash flows and short-term borrowings.
debt.
The Company reported 20162018 earnings of $4.43$6.13 per diluted share on consolidated net income attributable to Kansas City Southern and subsidiaries of $478.1$627.4 million for the year ended December 31, 2016,2018, compared to annual earnings of $4.40$9.16 per diluted share on consolidated net income attributable to Kansas City Southern and subsidiaries of $483.5$962.0 million for 2015.
During 2016, KCS repurchased 2,127,612 shares2017. The decrease is due to a higher effective tax rate in 2018 primarily as a result of common stock for $185.4the $413.0 million at an average price of $87.15 per share under the $500.0 million share repurchase program announcednet tax benefit recognized in May 2015. Since inception of this program, KCS has repurchased 4,261,596 shares of common stock for $379.6 million at an average price of $89.07 per share. Management's assessment of market conditions, available liquidity and other factors will determine the timing and volume of any future repurchases.
On May 16, 2016, KCS issued $250.0 million principal amount of senior unsecured notes, which bear interest semiannually at a fixed annual rate of 3.125%. The net proceeds2017 resulting from the offering were used to repay the outstanding commercial paper issuedTax Cuts and Jobs Act (the “Tax Reform Act”), and lower foreign exchange gain, partially offset by KCS and for other general corporate purposes.
On October 28, 2016, $250.0 million principal amount of outstanding floating rate senior notes issued by KCS and KCSM matured and were redeemed by the Company at a redemption price equal to 100% of the principal amount using available cash on hand and commercial paper.an increase in operating income.
RESULTS OF OPERATIONS
Year Ended December 31, 20162018, compared with the Year Ended December 31, 20152017
The following summarizes KCS’s consolidated income statement components (in millions):
| | | | 2016 | | 2015 | | Change | 2018 | | 2017 | | Change |
| Revenues | $ | 2,334.2 |
| | $ | 2,418.8 |
| | $ | (84.6 | ) | $ | 2,714.0 |
| | $ | 2,582.9 |
| | $ | 131.1 |
|
| Operating expenses | 1,515.7 |
| | 1,615.0 |
| | (99.3 | ) | 1,727.7 |
| | 1,661.3 |
| | 66.4 |
|
| Operating income | 818.5 |
| | 803.8 |
| | 14.7 |
| 986.3 |
| | 921.6 |
| | 64.7 |
|
| Equity in net earnings of affiliates | 14.6 |
| | 18.3 |
| | (3.7 | ) | 2.6 |
| | 11.5 |
| | (8.9 | ) |
| Interest expense | (97.7 | ) | | (81.9 | ) | | (15.8 | ) | (110.0 | ) | | (100.2 | ) | | (9.8 | ) |
| Debt retirement and exchange costs | — |
| | (7.6 | ) | | 7.6 |
| |
| Foreign exchange loss | (72.0 | ) | | (56.6 | ) | | (15.4 | ) | |
| Other expense, net | (0.7 | ) | | (3.4 | ) | | 2.7 |
| |
| Debt retirement costs | | (2.2 | ) | | — |
| | (2.2 | ) |
| Foreign exchange gain | | 7.8 |
| | 41.7 |
| | (33.9 | ) |
| Other income (expense), net | | 2.4 |
| | (0.3 | ) | | 2.7 |
|
| Income before income taxes | 662.7 |
| | 672.6 |
| | (9.9 | ) | 886.9 |
| | 874.3 |
| | 12.6 |
|
| Income tax expense | 182.8 |
| | 187.3 |
| | (4.5 | ) | |
| Income tax expense (benefit) | | 257.5 |
| | (89.6 | ) | | 347.1 |
|
| Net income | 479.9 |
| | 485.3 |
| | (5.4 | ) | 629.4 |
| | 963.9 |
| | (334.5 | ) |
| Less: Net income attributable to noncontrolling interest | 1.8 |
| | 1.8 |
| | — |
| 2.0 |
| | 1.9 |
| | 0.1 |
|
| Net income attributable to Kansas City Southern and subsidiaries | $ | 478.1 |
| | $ | 483.5 |
| | $ | (5.4 | ) | $ | 627.4 |
| | $ | 962.0 |
| | $ | (334.6 | ) |
Revenues
The following summarizes revenues (in millions), carload/unit statistics (in thousands) and revenue per carload/unit:
| | | | Revenues | | Carloads and Units | | Revenue per Carload/Unit | Revenues | | Carloads and Units | | Revenue per Carload/Unit |
| | 2016 | | 2015 | | % Change | | 2016 | | 2015 | | % Change | | 2016 | | 2015 | | % Change | 2018 | | 2017 | | % Change | | 2018 | | 2017 | | % Change | | 2018 | | 2017 | | % Change |
| Chemical and petroleum | $ | 475.4 |
| | $ | 474.2 |
| | — |
| | 258.5 |
| | 259.7 |
| | — |
| | $ | 1,839 |
| | $ | 1,826 |
| | 1 | % | $ | 622.1 |
| | $ | 539.9 |
| | 15 | % | | 297.9 |
| | 273.5 |
| | 9 | % | | $ | 2,088 |
| | $ | 1,974 |
| | 6 | % |
| Industrial and consumer products | 554.0 |
| | 570.4 |
| | (3 | %) | | 317.0 |
| | 320.5 |
| | (1 | %) | | 1,748 |
| | 1,780 |
| | (2 | %) | 591.0 |
| | 588.3 |
| | — |
| | 324.9 |
| | 329.9 |
| | (2 | %) | | 1,819 |
| | 1,783 |
| | 2 | % |
| Agriculture and minerals | 461.0 |
| | 429.3 |
| | 7 | % | | 251.4 |
| | 238.8 |
| | 5 | % | | 1,834 |
| | 1,798 |
| | 2 | % | 486.4 |
| | 477.4 |
| | 2 | % | | 241.9 |
| | 244.3 |
| | (1 | %) | | 2,011 |
| | 1,954 |
| | 3 | % |
| Energy | 202.7 |
| | 252.3 |
| | (20 | %) | | 253.9 |
| | 280.8 |
| | (10 | %) | | 798 |
| | 899 |
| | (11 | %) | 256.3 |
| | 283.8 |
| | (10 | %) | | 248.6 |
| | 291.7 |
| | (15 | %) | | 1,031 |
| | 973 |
| | 6 | % |
| Intermodal | 357.6 |
| | 381.5 |
| | (6 | %) | | 952.8 |
| | 990.3 |
| | (4 | %) | | 375 |
| | 385 |
| | (3 | %) | 382.8 |
| | 363.8 |
| | 5 | % | | 1,030.4 |
| | 975.1 |
| | 6 | % | | 372 |
| | 373 |
| | — |
|
| Automotive | 189.9 |
| | 218.7 |
| | (13 | %) | | 133.3 |
| | 126.5 |
| | 5 | % | | 1,425 |
| | 1,729 |
| | (18 | %) | 253.2 |
| | 230.8 |
| | 10 | % | | 161.9 |
| | 155.5 |
| | 4 | % | | 1,564 |
| | 1,484 |
| | 5 | % |
| Carload revenues, carloads and units | 2,240.6 |
| | 2,326.4 |
| | (4 | %) | | 2,166.9 |
| | 2,216.6 |
| | (2 | %) | | $ | 1,034 |
| | $ | 1,050 |
| | (2 | %) | 2,591.8 |
| | 2,484.0 |
| | 4 | % | | 2,305.6 |
| | 2,270.0 |
| | 2 | % | | $ | 1,124 |
| | $ | 1,094 |
| | 3 | % |
| Other revenue | 93.6 |
| | 92.4 |
| | 1 | % | | | | | | | | | | | | | 122.2 |
| | 98.9 |
| | 24 | % | | | | | | | | | | | | |
| Total revenues (i) | $ | 2,334.2 |
| | $ | 2,418.8 |
| | (3 | %) | | | | | | | | | | | | | $ | 2,714.0 |
| | $ | 2,582.9 |
| | 5 | % | | | | | | | | | | | | |
| | | | | | | | | | | | | | | | | | | | | | | | | | | | | | | | | | | |
| (i) Included in revenues: | | | | | | | | | | | | | | | | | | | | | | | | | | | | | | | | | | |
| Fuel surcharge | $ | 103.8 |
| | $ | 230.1 |
| | | | | | | | | | | | | | | $ | 253.1 |
| | $ | 169.5 |
| | | | | | | | | | | | | | |
Revenues include revenue for transportation services and fuel surcharges. ForRevenues and carload/unit volumes increased 5% and 2%, respectively, for the year ended December 31, 2016, revenues and carload/unit volumes decreased 3% and 2%, respectively,2018, compared to the prior year. Revenue decreased by $66.0 million or approximately 3%, compared to the prior year,Volumes increased primarily due to increased refined product shipments to Mexico, crude oil growth as a result of increased production in Canada, higher intermodal volumes, and favorable comparative volumes due to Hurricane Harvey service interruptions in 2017. These increases were partially offset by a decline in Energy driven primarily by a reduction in utility coal volume due to a Texas utility closure in January 2018, and network congestion in northern Mexico during the second half of 2018.
Revenue per carload/unit increased by 3% due to higher fuel surcharge and positive pricing impacts. The increase in revenue per carload/unit was partially offset by the weakening of the Mexican peso against the U.S. dollar of approximately $9.0 million, compared to the prior year, for revenue transactions denominated in Mexican pesos. The average exchange rate of Mexican pesos per U.S. dollar was Ps.18.7Ps.19.2 for 20162018 compared to Ps.15.8Ps.18.9 for 2015.
Revenue per carload/unit decreased by 2% for the year ended December 31, 2016, compared to the prior year, due to the weakening of the Mexican peso against the U.S. dollar and lower fuel surcharge, partially offset by positive pricing impacts.2017.
KCS’s fuel surcharges are a mechanism to adjust revenue based upon changes in fuel prices above fuel price thresholds set in KCS’s tariffs or contracts. Fuel surcharge revenue is calculated using a fuel price from a prior time period that can be up to 60 days earlier. In a period of volatile fuel prices or changing customer business mix, changes in fuel expense and fuel surcharge revenue may differ.
Fuel surcharge revenue decreased $126.3increased $83.6 million for the year ended December 31, 2016,2018, compared to the prior year, due in part to the adjustment of certain line haul rates while reducing or eliminating fuel surcharges on those rates. In addition, fuel surcharge revenue decreasedprimarily due to lower U.S.higher fuel prices and the impactincreased fuel surcharge rates.
The following discussion provides an analysis of revenues by commodity group:
Revenues by commodity
group for 20162018
|
| |
Chemical and petroleum. Revenues increased $1.2 increased $82.2 million for the year ended December 31, 2016,2018, compared to 2015,2017, due to a 1%9% increase in carload/unit volumes and a 6% increase in revenue per carload/unit. Volumes increased primarily due to increased refined fuel product shipments to Mexico and favorable comparative volumes due to Hurricane Harvey service interruptions in 2017. Revenue per carload/unit increased due to positive pricing impacts and mix, partially offset by lowerlonger average length of haul, higher fuel surcharge, and the weakening of the Mexican peso against the U.S. dollar. Plastic volumes increased due to strong market demand and low commoditypositive pricing environment and petroleum volumes increased as a result of several customers’ business expansion. These increases were partially offset by a decrease in chemical volumes due to oversupply caused by low natural gas prices that drove fertilizer prices down and a customer’s lost business.impacts. |
|
|
| |
Industrial and consumer products. Revenues decreased $16.4Revenue increased $2.7 million for the year ended December 31, 2016,2018, compared to 2015,2017, due to a 2% decreaseincrease in revenue per carload/unit andoffset by a 1%2% decrease in carload/unit volumes. Revenue per carload/unit increased due to higher fuel surcharge, mix, and positive pricing impacts, partially offset by shorter average length of haul due to change in sourcing location for a metals plant. Volumes decreased due to the weakening of the Mexican peso against the U.S. dollarcapacity constraints and lower fuel surcharge,network congestion in northern Mexico, partially offset by positive pricing impacts. Paperfavorable comparative volumes decreased due to competitive trucking market, global softnessHurricane Harvey service interruptions in the market, and high inventory levels.2017. |
|
Revenues by commodity
group for 20162018
|
| |
Agriculture and minerals. Revenues increased $31.7$9.0 million for the year ended December 31, 20162018 compared to 2015,2017, due to a 5% increase in carload/unit volumes and a 2%3% increase in revenue per carload/unit. Grain and food product volumes increased due to improved cycle times. In addition, grain volumes increased due to additional equipment capacity,unit, partially offset by a 1% decrease in ores and minerals volumes due to weather related issues in the southeast region of the United States.carload/unit volumes. Revenue per carload/unit increased due to higher fuel surcharge, longer average length of haul, and mix, partially offset bypositive pricing impacts. Volume decreased due to network congestion in northern Mexico and changes in food products due to lower fuel surchargemarket demand, a facility outage, and the weakening of the Mexican peso against the U.S. dollar.shift in sourcing trends. |
|
|
| |
Energy. Revenues decreased $49.6$27.5 million for the year ended December 31, 2016,2018, compared to 2015,2017, due to an 11%a 15% decrease in carload/unit volumes, partially offset by a 6% increase in revenue per carload/unitunit. Utility coal volumes decreased due to a Texas utility closure in January 2018 and a 10% decreaselower natural gas prices. Frac sand volumes decreased due to changes in carload/unit volumes.sourcing patterns. These decreases were partially offset by crude oil growth driven by increased production in Canada with increased rail utilization. Revenue per carload/unit decreasedincreased due to mix, higher fuel surcharge, and positive pricing impacts, partially offset by a shorter average length of haul and lower fuel surcharge. Volumes decreased as low natural gas prices and high coal inventory levels reduced the demand for utility coal in 2016. In addition, crude oil volumes decreased as result of low crude oil spreads and increased pipeline capacity, and the decline in new crude drilling operations in the U.S. has reduced the demand for frac sand.haul. | |
Intermodal. Revenues decreased $23.9increased $19.0 million for the year ended December 31, 2016,2018, compared to 2015,2017, due to a 4% decrease6% increase in carload/unit volumes attributable to growth in the U.S. domestic and a 3% decrease in revenue per carload/unit. Volumes decreasedcross-border lanes, which was aided by tight truck capacity, and favorable comparative volumes due to Hurricane Harvey service disruptions related to the floodinginterruptions in the southeastern United States earlier in the year and protests in Mexico during July of 2016, increased truck conversion, and high retail inventory levels. Revenue per carload/unit decreased2017. This was partially offset by lower international volumes as a result of lost business to truck competition and competitive rail pricing impacts and shorter average lengthdue to the weakness of haul.the Mexican peso against the U.S. dollar.
Automotive. Revenues decreased $28.8increased $22.4 million for the year ended December 31, 2016,2018, compared to 2015,2017, due to an 18% decrease5% increase in revenue per carload/unit partially offset byand a 5%4% increase in carload/unit volumes. Revenue per carload/unit decreasedincreased due to higher fuel surcharge and positive pricing impacts, partially offset by a shorter average length of haul and the weakening of the Mexican peso against the U.S. dollar and lower fuel surcharge.dollar. Volumes increased due to 2015 service-related issuesan increase in plant production and new customersan increase in 2016,Lazaro Cardenas import volumes, partially offset by customers’ temporary plant shutdownsnetwork congestion in the first half of 2016.northern Mexico.
Operating Expenses
Operating expenses, as shown below (in millions), decreased $99.3increased $66.4 million for the year ended December 31, 20162018, compared to 20152017, primarily due to higher fuel prices, increases in depreciation and personal injury expense, and an increase in expenses due to network congestion in northern Mexico during the Mexican fuel excise tax credit,second half of 2018. These increases were partially offset by a gain on insurance recoveries related to hurricane damage and the weakening of the Mexican peso against the U.S. dollar, lower fuel prices and purchased services, and lease termination costs recognized in 2015, partially offset by higher incentive compensation and increased depreciation expense.dollar. The weakening of the Mexican peso against the U.S. dollar resulted in an expense reduction of approximately $63.0$9.0 million or 4% for expense transactions denominated in Mexican pesos. The average exchange rate of Mexican pesos per U.S. dollar was Ps.18.7Ps.19.2 for 20162018 compared to Ps.15.8Ps.18.9 for 2015.2017.
| | | | | | Change | | | Change |
| | 2016 | | 2015 | | Dollars | | Percent | 2018 | | 2017 | | Dollars | | Percent |
| Compensation and benefits | $ | 462.4 |
| | $ | 442.2 |
| | $ | 20.2 |
| | 5 | % | $ | 495.7 |
| | $ | 493.8 |
| | $ | 1.9 |
| | — |
|
| Purchased services | 208.5 |
| | 223.0 |
| | (14.5 | ) | | (7 | %) | 200.7 |
| | 193.7 |
| | 7.0 |
| | 4 | % |
| Fuel | 253.8 |
| | 306.9 |
| | (53.1 | ) | | (17 | %) | 348.2 |
| | 316.1 |
| | 32.1 |
| | 10 | % |
| Mexican fuel excise tax credit | (62.8 | ) | | — |
| | (62.8 | ) | | 100 | % | (37.7 | ) | | (44.1 | ) | | 6.4 |
| | (15 | %) |
| Equipment costs | 120.0 |
| | 119.4 |
| | 0.6 |
| | 1 | % | 126.1 |
| | 129.2 |
| | (3.1 | ) | | (2 | %) |
| Depreciation and amortization | 305.0 |
| | 284.6 |
| | 20.4 |
| | 7 | % | 346.7 |
| | 320.9 |
| | 25.8 |
| | 8 | % |
| Materials and other | 228.8 |
| | 229.3 |
| | (0.5 | ) | | — |
| 265.9 |
| | 251.7 |
| | 14.2 |
| | 6 | % |
| Lease termination costs | — |
| | 9.6 |
| | (9.6 | ) | | (100 | %) | |
| Gain on insurance recoveries related to hurricane damage | | (17.9 | ) | | — |
| | (17.9 | ) | | 100 | % |
| Total operating expenses | $ | 1,515.7 |
| | $ | 1,615.0 |
| | $ | (99.3 | ) | | (6 | %) | $ | 1,727.7 |
| | $ | 1,661.3 |
| | $ | 66.4 |
| | 4 | % |
Compensation and benefits. Compensation and benefits increased $20.2$1.9 million for the year ended December 31, 2016,2018, compared to 2015,2017, due to higherwage inflation of approximately $15.0 million and increased headcount of approximately $12.0 million, partially offset by a decrease in incentive compensation of approximately $34.0$14.0 million, and annual wage increasesreduced benefits of approximately $14.0 million. Incentive compensation increased due to higher expected achievement of short$8.0 million, and long-term incentive performance targets in 2016, as compared to 2015. These increases were partially offset by the weakening of the Mexican peso of approximately $19.0 million compared to 2015, and lower U.S. labor costs of approximately $15.0 million due to reduced volumes and increased productivity.$3.0 million.
Purchased services. Purchased services expense decreased $14.5increased $7.0 million for the year ended December 31, 2016,2018, compared to 2015,2017, due to car repairhigher repairs and maintenance expense and increases in Mexico being performed in-housecomputer software and programming expenses, partially offset by savings from mechanical in-sourcing starting in October 2016 and the weakeningfourth quarter of the Mexican peso.2017.
Fuel. Fuel expense decreased $53.1increased $32.1 million for the year ended December 31, 2016,2018, compared to 2015,2017, due to higher diesel fuel prices of approximately $27.0 million and $18.0 million in the U.S. and Mexico, respectively, partially offset by lower consumption of approximately $9.0 million and the weakening of the Mexican peso of approximately $28.0 million and lower diesel fuel prices of approximately $18.0 million and $4.0 million in the U.S. and Mexico, respectively.million. The average price per gallon inclusive of the impact from the weakening of the Mexican peso, was $1.95$2.58 in 2016,2018, compared to $2.32$2.27 in 2015. In addition, fuel expense decreased due to improved fuel efficiency and lower fuel consumption.2017.
Mexican fuel excise tax credit. The Mexican fuel excise tax is used by the Mexican government to control fuel price. Mexico is transitioning to market-based fuel pricing, and the transition is expected to be complete by the end of 2017. The implementation of a 2016 fuel excise tax credit for the Mexico railroad industry effectively moved the industry to market-based pricing in 2016.
For the year ended December 31, 2016,2018, the Company recognized a $62.8$37.7 million credit available under changesbenefit, compared to a $44.1 million benefit recognized in Mexican law for the2017. The reduced benefit is due to a lower excise tax includedrate in the price of fuel that is purchased and consumed in locomotives and certain work equipment in Mexico. The Mexican fuel excise tax credit is realized through the offset of the total 2016 Mexico income tax liability and income tax withholding payment obligations of KCSM. Recently enacted legislation extended the fuel excise tax crediteffect for 2018 as compared to Mexican railroads in 2017.
Equipment costs. Equipment costs increased $0.6decreased $3.1 million for the year ended December 31, 2016,2018, compared to 2015,2017, due to lower lease expense, partially offset by higher car hire expense resulting from network congestion in northern Mexico.
Depreciation and amortization. Depreciation and amortization expense increased $25.8 million for the year ended December 31, 2018, compared to 2017, due to volume mix, partially offset by lower leasea larger asset base, including investments in positive train control.
Materials and other. Materials and other expense increased $14.2 million for the year ended December 31, 2018, compared to 2017, due to an increase in personal injury expense of approximately $2.0 million recognized in 2018, compared to an approximate $4.0 million reduction in personal injury expense recognized in 2017 as a result of the purchasechanges in estimates. Additional increased expense was due to higher derailment activity of equipment under existing operating leasesapproximately $6.0 million, and replacement equipment as certain operating leases expired.mechanical in-sourcing, which resulted in additional materials purchased of approximately $3.0 million.
Depreciation and amortization.Gain on insurance recoveries related to hurricane damage. Depreciation and amortization expense increased $20.4During 2018, the Company partially settled its insurance claim for $35.5 million for the year ended December 31, 2016, comparedrelated to 2015, due toHurricane Harvey. As a larger asset base.
Materials and other. Materials and other expense was flat for the year ended December 31, 2016, compared to 2015.
Lease termination costs. Lease termination costs were $9.6 million for the year ended December 31, 2015, due to the early termination of certain operating leases and the related purchaseresult of the equipment. Thenonrefundable partial settlement, the Company did not incur lease termination costs forrecognized a gain on insurance recoveries of $17.9 million, net of the year ended December 31, 2016.self-insured retention and insurance receivable.
Non-Operating Expenses
Equity in net earnings of affiliates. Equity in net earnings from affiliates decreased $3.7$8.9 million for the year ended December 31, 2016,2018, compared to 2015,2017. Significant components of this change are as follows:
* Equity in earnings from the operations of FTVM decreased $5.4 million for the year ended December 31, 2018, compared to 2017, due to lower netFTVM’s participation in constructing, maintaining, and operating a rail spur to Mexico City’s new international airport, in which the airport’s construction has been suspended.
* Equity in earnings from the operations of PCRC and FTVMdecreased $3.1 million for the year ended December 31, 2018, compared to 2017 as a result of lower volumes.volumes primarily due to loss of a customer.
Interest expense. Interest expense increased $15.8$9.8 million for the year ended December 31, 2016,2018, compared to 2015,2017, due to higher average debt balances and average interest rates as a result of the Company’s issuance ofand debt during the third quarter of 2015 and second quarter of 2016.balances. For the year ended December 31, 2016,2018, the average debt balance (including short-term borrowings)commercial paper) was $2,492.7$2,698.7 million, compared to $2,257.8$2,603.6 million in 2015.2017. The average interest rate for the year ended December 31, 20162018 was 4.0%4.1%, compared to 3.7%3.9% in 2015.2017.
Debt retirement costs. Debt retirement costs were $2.2 million during 2018, related to the call premiums and exchange costs. write-off of unamortized debt issuance costs and original issue discounts associated with the Company’s various debt redemption activities. The Company did not incur debt retirement and exchange costs during 2016. For the year ended December 31, 2015, debt retirement and exchange costs were $7.6 million, related to costs that were payable to parties other than the debt holders as a result of the KCSR and KCSM senior notes exchanged for KCS senior notes.2017.
Foreign exchange loss.gain. For the years ended December 31, 20162018 and 2015,2017, foreign exchange lossgain was $72.0$7.8 million and $56.6$41.7 million, respectively. Foreign exchange lossgain includes the re-measurement and settlement of net monetary assets denominated in Mexican pesos and the lossgain on foreign currency derivative contracts.
For the years ended December 31, 20162018 and 2015,2017, the re-measurement and settlement of net monetary assets denominated in Mexican pesos resulted in a foreign exchange lossgain of $18.5$1.5 million and $9.4$3.5 million, respectively.
The Company enters into foreign currency derivative contracts to hedge its net exposure to fluctuations in the Mexican cash tax obligation due to changes in the value of the Mexican peso against the U.S. dollar. For the years ended December 31, 20162018 and 2015,2017, foreign exchange lossgain on foreign currency derivative contracts was $53.5$6.3 million and $47.2$38.2 million, respectively.
Other expense,income (expense), net. Other expense,income (expense), net, decreasedincreased $2.7 million for the year ended December 31, 20162018, compared to 20152017, due to loweran increase in miscellaneous expenses.income.
Income tax expense.expense (benefit). Income tax expense decreased $4.5increased $347.1 million for the year ended December 31, 20162018, compared to 20152017, due to lower pre-taxthe impact of the Tax Reform Act enacted on December 22, 2017. For the year ended December 31, 2017, the Company recognized a $487.6 million tax benefit as a result of revaluing the U.S. ending net deferred tax liabilities from 35% to the newly enacted U.S. corporate income and a lower effective tax rate.rate of 21%. The tax benefit was partially offset by tax expense of $74.6 million for the deemed mandatory repatriation of undistributed earnings. The effective tax rate was 27.6%29.0% and 27.8%(10.2%) for the years ended December 31, 20162018 and 2015,2017, respectively. The decreaseincrease in the effective tax rate was primarily due to the more significant weakeningimpact of the Mexican peso againstTax Reform Act. The effective tax rate for the year ended December 31, 2018 reflects the benefit of the permanent reduction in the U.S. dollarcorporate income tax rate from a maximum of 35% to 21%, partially offset by an increase of 1.3% in 2016,the effective tax rate due to the impact of the global intangible low-taxed income (“GILTI”) provisions included in the Tax Reform Act and effective January 1, 2018. The Company also recognized a $20.9 million tax benefit during 2018, related to adjustments to the provisional tax impacts of the Tax Reform Act as compared to 2015.provided for in Staff Accounting Bulletin No. 118 for the deemed repatriation earnings and the revaluation of deferred tax assets and liabilities included in its consolidated financial statements for the year ended December 31, 2017.
The weakeningfluctuations of the Mexican peso during 2016 and 20152018 decreased the Company’s Mexican cash tax obligation by $49.2 million and $46.4$1.8 million for the yearsyear ended December 31, 2016 and 2015, respectively.2018, whereas the strengthening of the Mexican peso during 2017 increased the Company’s Mexican cash tax obligation by $18.8 million for the year ended December 31, 2017. The Company enters into foreign currency derivative contracts to hedge its net exposure to fluctuations in the Mexican cash tax obligation due to changes in the
value of the Mexican peso against the U.S. dollar, and gains and losses on these foreign currency derivative contracts are recorded in foreign exchange loss.gain (loss).
Mexico Tax Reform
In December 2018, the Mexican government enacted changes in the tax law effective January 1, 2019 (“Mexico Tax Reform”). Mexico Tax Reform eliminated “universal compensation” that allowed Mexican taxpayers to offset recoverable tax balances against balances due for other federal taxes. The elimination of “universal compensation” could negatively impact the timing of KCSM’s cash flow by up to $60.0 million in 2019 while awaiting refunds of value added tax from the Mexican government.
Mexico Tax Reform also eliminated the option to monetize the Mexican fuel excise tax credit by offsetting income tax withholding payment obligations. Previously, the Company had the option to monetize the Mexican fuel excise tax credit through income tax withholding and income tax obligations. The Company believes it will continue to be eligible for the Mexican fuel excise tax credit and will have the ability to offset future credits against income tax obligations in accordance with Mexico Tax Reform.
Mexico Tax Reform included tax incentives for a northern border zone of Mexico. The Company does not expect the northern border zone incentives will have a material impact to the Company’s consolidated financial statements.
The Company is continuing to evaluate the potential impact of Mexico Tax Reform to the 2019 consolidated financial statements.
Further information on the components of the effective tax rates for the years ended December 31, 20162018 and 2015,2017, is presented in Item 8, Financial Statements and Supplementary Data — Note 13, to the Consolidated Financial Statements in Item 8.Income Taxes.
Year Ended December 31, 20152017, compared with the Year Ended December 31, 20142016
The following summarizes KCS’s consolidated income statement components (in millions):
| | | | 2015 | | 2014 | | Change | 2017 | | 2016 | | Change |
| Revenues | $ | 2,418.8 |
| | $ | 2,577.1 |
| | $ | (158.3 | ) | $ | 2,582.9 |
| | $ | 2,334.2 |
| | $ | 248.7 |
|
| Operating expenses | 1,615.0 |
| | 1,768.0 |
| | (153.0 | ) | 1,661.3 |
| | 1,515.7 |
| | 145.6 |
|
| Operating income | 803.8 |
| | 809.1 |
| | (5.3 | ) | 921.6 |
| | 818.5 |
| | 103.1 |
|
| Equity in net earnings of affiliates | 18.3 |
| | 21.1 |
| | (2.8 | ) | 11.5 |
| | 14.6 |
| | (3.1 | ) |
| Interest expense | (81.9 | ) | | (72.8 | ) | | (9.1 | ) | (100.2 | ) | | (97.7 | ) | | (2.5 | ) |
| Debt retirement and exchange costs | (7.6 | ) | | (6.6 | ) | | (1.0 | ) | |
| Foreign exchange loss | (56.6 | ) | | (35.5 | ) | | (21.1 | ) | |
| Foreign exchange gain (loss) | | 41.7 |
| | (72.0 | ) | | 113.7 |
|
| Other expense, net | (3.4 | ) | | (2.2 | ) | | (1.2 | ) | (0.3 | ) | | (0.7 | ) | | 0.4 |
|
| Income before income taxes | 672.6 |
| | 713.1 |
| | (40.5 | ) | 874.3 |
| | 662.7 |
| | 211.6 |
|
| Income tax expense | 187.3 |
| | 208.8 |
| | (21.5 | ) | |
| Income tax expense (benefit) | | (89.6 | ) | | 182.8 |
| | (272.4 | ) |
| Net income | 485.3 |
| | 504.3 |
| | (19.0 | ) | 963.9 |
| | 479.9 |
| | 484.0 |
|
| Less: Net income attributable to noncontrolling interest | 1.8 |
| | 1.7 |
| | 0.1 |
| 1.9 |
| | 1.8 |
| | 0.1 |
|
| Net income attributable to Kansas City Southern and subsidiaries | $ | 483.5 |
| | $ | 502.6 |
| | $ | (19.1 | ) | $ | 962.0 |
| | $ | 478.1 |
| | $ | 483.9 |
|
Revenues
The following summarizes revenues (in millions), carload/unit statistics (in thousands) and revenue per carload/unit:
| | | | Revenues | | Carloads and Units | | Revenue per Carload/Unit | Revenues | | Carloads and Units | | Revenue per Carload/Unit |
| | 2015 | | 2014 | | % Change | | 2015 | | 2014 | | % Change | | 2015 | | 2014 | | % Change | 2017 | | 2016 | | % Change | | 2017 | | 2016 | | % Change | | 2017 | | 2016 | | % Change |
| Chemical and petroleum | $ | 474.2 |
| | $ | 453.0 |
| | 5 | % | | 259.7 |
| | 246.9 |
| | 5 | % | | $ | 1,826 |
| | $ | 1,835 |
| | — |
| $ | 539.9 |
| | $ | 475.4 |
| | 14 | % | | 273.5 |
| | 258.5 |
| | 6 | % | | $ | 1,974 |
| | $ | 1,839 |
| | 7 | % |
| Industrial and consumer products | 570.4 |
| | 623.3 |
| | (8 | %) | | 320.5 |
| | 347.4 |
| | (8 | %) | | 1,780 |
| | 1,794 |
| | (1 | %) | 588.3 |
| | 554.0 |
| | 6 | % | | 329.9 |
| | 317.0 |
| | 4 | % | | 1,783 |
| | 1,748 |
| | 2 | % |
| Agriculture and minerals | 429.3 |
| | 446.6 |
| | (4 | %) | | 238.8 |
| | 233.9 |
| | 2 | % | | 1,798 |
| | 1,909 |
| | (6 | %) | 477.4 |
| | 461.0 |
| | 4 | % | | 244.3 |
| | 251.4 |
| | (3 | %) | | 1,954 |
| | 1,834 |
| | 7 | % |
| Energy | 252.3 |
| | 326.8 |
| | (23 | %) | | 280.8 |
| | 299.2 |
| | (6 | %) | | 899 |
| | 1,092 |
| | (18 | %) | 283.8 |
| | 202.7 |
| | 40 | % | | 291.7 |
| | 253.9 |
| | 15 | % | | 973 |
| | 798 |
| | 22 | % |
| Intermodal | 381.5 |
| | 395.8 |
| | (4 | %) | | 990.3 |
| | 1,019.6 |
| | (3 | %) | | 385 |
| | 388 |
| | (1 | %) | 363.8 |
| | 357.6 |
| | 2 | % | | 975.1 |
| | 952.8 |
| | 2 | % | | 373 |
| | 375 |
| | (1 | %) |
| Automotive | 218.7 |
| | 238.4 |
| | (8 | %) | | 126.5 |
| | 127.1 |
| | — |
| | 1,729 |
| | 1,876 |
| | (8 | %) | 230.8 |
| | 189.9 |
| | 22 | % | | 155.5 |
| | 133.3 |
| | 17 | % | | 1,484 |
| | 1,425 |
| | 4 | % |
| Carload revenues, carloads and units | 2,326.4 |
| | 2,483.9 |
| | (6 | %) | | 2,216.6 |
| | 2,274.1 |
| | (3 | %) | | $ | 1,050 |
| | $ | 1,092 |
| | (4 | %) | 2,484.0 |
| | 2,240.6 |
| | 11 | % | | 2,270.0 |
| | 2,166.9 |
| | 5 | % | | $ | 1,094 |
| | $ | 1,034 |
| | 6 | % |
| Other revenue | 92.4 |
| | 93.2 |
| | (1 | %) | | | | | | | | | | | | | 98.9 |
| | 93.6 |
| | 6 | % | | | | | | | | | | | | |
| Total revenues (i) | $ | 2,418.8 |
| | $ | 2,577.1 |
| | (6 | %) | | | | | | | | | | | | | $ | 2,582.9 |
| | $ | 2,334.2 |
| | 11 | % | | | | | | | | | | | | |
| | | | | | | | | | | | | | | | | | | | | | | | | | | | | | | | | | | |
| (i) Included in revenues: | | | | | | | | | | | | | | | | | | | | | | | | | | | | | | | | | | |
| Fuel surcharge | $ | 230.1 |
| | $ | 334.7 |
| | | | | | | | | | | | | | | $ | 169.5 |
| | $ | 103.8 |
| | | | | | | | | | | | | | |
Revenues include both revenue for transportation services and fuel surcharges. ForNotwithstanding the year ended December 31, 2015,impacts of Hurricane Harvey, revenues and carload/unit volumes decreased 6%increased 11% and 3%5%, respectively, for the year ended December 31, 2017, compared to the prior year. Revenue decreasedper carload/unit increased by $79.06% due to mix, increased average length of haul, positive pricing impacts, and higher fuel surcharge. Energy revenues increased $81.1 million, or approximately 3%primarily due to an increase in utility coal volumes due to higher natural gas prices and lower coal inventory levels. In addition, frac sand volumes increased due to strong demand as a result of higher crude oil prices. Chemical and petroleum revenues increased $64.5 million, primarily due to increased refined product and liquefied petroleum gas shipments to Mexico. The increase in revenue per carload/unit was partially offset by the weakening of the Mexican peso against the U.S. dollar of approximately $8.0 million, compared to the prior year, for revenue transactions denominated in Mexican pesos. The average exchange rate of Mexican pesos per U.S. dollar was Ps.15.8Ps.18.9 for 2015,2017 compared to Ps.13.3Ps.18.7 for 2014.
Revenue per carload/unit decreased by 4% for the year ended December 31, 2015, compared to the prior year, due to lower fuel surcharge and the weakening of the Mexican peso against the U.S. dollar, partially offset by positive pricing impacts.2016.
KCS’s fuel surcharges are a mechanism to adjust revenue based upon changes in fuel prices above fuel price thresholds set in KCS’s tariffs or contracts. Fuel surcharge revenue is calculated using a fuel price from a prior time period that can be up to 60 days earlier. In a period of volatile fuel prices or changing customer business mix, changes in fuel expense and fuel surcharge revenue may differ.
Fuel surcharge revenue decreased $104.6increased $65.7 million for the year ended December 31, 2015,2017, compared to the prior year, due to lower U.S.higher fuel prices.prices and the impact of fuel prices increasing above the fuel price thresholds for certain of KCS’s tariffs and contracts. Additionally, fuel surcharge increased due to separating the fuel surcharge for certain customers from the line haul rate, as well as increased volumes.
The following discussion provides an analysis of revenues by commodity group:
Revenues by commodity
group for 20152017
|
| |
Chemical and petroleum. RevenuesRevenues increased $21.2$64.5 million for the year ended December 31, 2015,2017, compared to 2014,2016, due to a 5%7% increase in revenue per carload/unit and a 6% increase in carload/unit volumes. Petroleum volumesRevenue per carload/unit increased as a resultdue to longer average length of new businesshaul and plasticspositive pricing impacts. Petroleum volumes increased due to lower commodity prices. Revenue per carload/unit was flat for the year ended December 31, 2015, comparedrefined product and liquefied petroleum gas shipments to 2014, as positive pricing impacts were offset by the weakening of the Mexican peso against the U.S. dollar and lower fuel surcharge.Mexico. | |
|
| |
Industrial and consumer products. Revenues decreased $52.9increased $34.3 million for the year ended December 31, 2015,2017, compared to 2014,2016, due to an 8% decreasea 4% increase in carload/unit volumes and a 1% decrease2% increase in revenue per carload/unit. Metals and scrapOther carloads’ volumes decreasedincreased due to the decline in new drilling operations in the U.S. and higher imports from foreign sources.strong military movements. Revenue per carload/unit decreasedincreased due to lowerhigher fuel surcharge, metals and the weakeningscrap longer average length of the Mexican peso against the U.S. dollar, partially offset byhaul, and positive pricing impacts. | |
Revenues by commodity
group for 20152017
|
| |
Agriculture and minerals. Revenues decreased $17.3increased $16.4 million for the year ended December 31, 2015,2017 compared to 2014,2016, due to a 6% decrease7% increase in revenue per carload/unit, partially offset by a 2% increase3% decrease in carload/unit volumes. Revenue per carload/unit increased due to positive pricing impacts, longer average length of haul, and higher fuel surcharge. Food products volumes decreased due to lower fuel surcharge and the weakening of the Mexican peso against the U.S. dollar. Food products volumes increased as a result of a customer's temporary plant shutdown during the third quarter of 2014. This increase was partially offset by a decreasechange in grain volumes due to service-related issues in the second and third quarters of 2015.market demand. | |
|
| |
Energy. Revenues decreased $74.5increased $81.1 million for the year ended December 31, 2015,2017, compared to 2014,2016, due to an 18% decreasea 22% increase in revenue per carload/unit and a 6% decrease15% increase in carload/unit volumes. RevenueRevenues per carload/unit decreasedincreased due to lower fuel surcharge, a short-term rate concession provided to a customer during the second half of 2015 and shorterlonger average length of haul. Volumes decreased as lowhaul, positive pricing impacts, mix, and higher fuel surcharge. Utility coal volumes increased due to higher natural gas prices reduced theand lower coal inventory levels. Additionally, frac sand volumes increased due to strong demand for utility coal and the decline in new crude drilling operations in the U.S. reduced the demand for frac sand. These decreases were partially offset by increasedas a result of higher crude oil volumes due to new business.prices. | |
Intermodal. Revenues decreased $14.3increased $6.2 million for the year ended December 31, 2015,2017, compared to 2014,2016, due to a 3% decrease in2% increase in carload/unit volumes, andpartially offset by a 1% decrease in revenue per carload/unit. LowerThe volume increase was attributable to new business and lower volumes in second half of 2016 due to service-related issues in the second and third quarters of 2015 and the conversion of rail traffic to truck wereservice disruptions from protests, partially offset by volume growth driven by trans-Pacific imports viatruck capacity in the Port of Lazaro Cardenas.U.S. and Mexico. Revenue per carload/unit decreased due to lower fuel surcharge.shorter average length of haul and mix.
Automotive. Revenues decreased $19.7increased $40.9 million for the year ended December 31, 2015,2017, compared to 2014,2016, due to an 8% decreasea 17% increase in carload/unit volumes and a 4% increase in revenue per carload/unit. Volumes increased due to customers’ temporary plant shutdowns in the first half of 2016, the introduction of new automobile models, and new plant openings. Revenue per carload/unit decreasedincreased due to higher fuel surcharge and positive pricing impacts, partially offset by the weakening of the Mexican peso against the U.S. dollar, partially offset by positive pricing impacts. Volumes were flat for the year ended December 31, 2015, compared to 2014, due to service-related issues in the second and third quarters of 2015.dollar.
Operating Expenses
Operating expenses, as shown below (in millions), decreasedincreased $153.0145.6 million for the year ended December 31, 20152017, compared to 20142016, primarily due to the weakening of the Mexican peso against the U.S. dollar and lower U.S.higher fuel prices partially offset by increased depreciation expense.and consumption, and compensation and benefits. The weakening of the Mexican peso against the U.S. dollar resulted in an expense reduction of approximately $77.0$5.0 million for expense transactions denominated in Mexican pesos. The average exchange rate of Mexican pesos per U.S. dollar was Ps.15.8Ps.18.9 for 20152017 compared to Ps.13.3Ps.18.7 for 2014. Lower U.S. fuel prices reduced 2015 expenses by $71.5 million.2016.
| | | | | | Change | | | Change |
| | 2015 | | 2014 | | Dollars | | Percent | 2017 | | 2016 | | Dollars | | Percent |
| Compensation and benefits | $ | 442.2 |
| | $ | 474.5 |
| | $ | (32.3 | ) | | (7 | %) | $ | 493.8 |
| | $ | 462.4 |
| | $ | 31.4 |
| | 7 | % |
| Purchased services | 223.0 |
| | 245.2 |
| | (22.2 | ) | | (9 | %) | 193.7 |
| | 208.5 |
| | (14.8 | ) | | (7 | %) |
| Fuel | 306.9 |
| | 415.9 |
| | (109.0 | ) | | (26 | %) | 316.1 |
| | 253.8 |
| | 62.3 |
| | 25 | % |
| Mexican fuel excise tax credit | | (44.1 | ) | | (62.8 | ) | | 18.7 |
| | (30 | %) |
| Equipment costs | 119.4 |
| | 119.2 |
| | 0.2 |
| | — |
| 129.2 |
| | 120.0 |
| | 9.2 |
| | 8 | % |
| Depreciation and amortization | 284.6 |
| | 258.1 |
| | 26.5 |
| | 10 | % | 320.9 |
| | 305.0 |
| | 15.9 |
| | 5 | % |
| Materials and other | 229.3 |
| | 216.8 |
| | 12.5 |
| | 6 | % | 251.7 |
| | 228.8 |
| | 22.9 |
| | 10 | % |
| Lease termination costs | 9.6 |
| | 38.3 |
| | (28.7 | ) | | (75 | %) | |
| Total operating expenses | $ | 1,615.0 |
| | $ | 1,768.0 |
| | $ | (153.0 | ) | | (9 | %) | $ | 1,661.3 |
| | $ | 1,515.7 |
| | $ | 145.6 |
| | 10 | % |
Compensation and benefits. Compensation and benefits decreased $32.3increased $31.4 million for the year ended December 31, 2015,2017, compared to 2014,2016, due to the weakening of the Mexican pesoincreases in annual wages and benefits of approximately $23.0$16.0 million. In addition, compensation and benefits increased by approximately $12.0 million lower incentive compensation of $22.4 million and a reduction in post-employment liabilities due to changesincreased headcount as a result of higher carloads and car repair in discount rates. These decreases were partially offset by annual salary rate increases and a 3% growthMexico being performed in-house starting in headcount.October 2016.
Purchased services. Purchased services expense decreased $22.2$14.8 million for the year ended December 31, 2015,2017, compared to 2014,2016, due to renegotiation ofcar repair in Mexico being performed in-house starting in October 2016, partially offset by increases in repairs and maintenance, contracts during 2015, the weakening of the Mexican pesojoint facilities expenses, computer software expenses, and lower track maintenance and corporate expenses.detours.
Fuel. Fuel expense decreased $109.0increased $62.3 million for the year ended December 31, 2015,2017, compared to 2014,2016, due to lower U.S.higher diesel fuel prices of $71.5approximately $30.0 million and $21.0 million in Mexico and the U.S., respectively, and higher consumption of approximately $19.0 million, partially offset by the weakening of the Mexican peso of approximately $37.0$4.0 million and improved efficiency of approximately $4.0 million. These decreases were partially offset by approximately $12.0 million increase due to Mexican diesel prices. The average price per gallon, inclusive of the impact from the weakening of the Mexican peso, was $2.32$2.27 in 2015,2017, compared to $3.03$1.95 in 2014. In addition,2016.
Mexican fuel expense decreasedexcise tax credit. For the year ended December 31, 2017, the Company recognized a $44.1 million benefit, compared to a $62.8 million benefit recognized in 2016. The reduced benefit is due to improved fuel efficiency anda lower fuel consumption.excise tax rate in effect for 2017 as compared to 2016.
Equipment costs. Equipment costs increased $0.2$9.2 million for the year ended December 31, 2015,2017, compared to 2014, primarily2016, due to higher car hire expense due to longer cycle times,resulting from increased automotive business impacting rates and volumes, partially offset by lower lease expense as a result of the purchase of equipment under existing operating leases and replacement equipment as certain operating leases expired.improved efficiency.
Depreciation and amortization. Depreciation and amortization increased $26.5$15.9 million for the year ended December 31, 2015,2017, compared to 2014,2016, due to a larger asset base, including the purchase of equipment under existing operating leases and replacement equipment as certain operating leases expired.base.
Materials and other. Materials and other expense increased $12.5$22.9 million for the year ended December 31, 2015,2017, compared to 2014,2016, due to car repair in Mexico being performed in-house starting in October 2016, which resulted in additional materials purchased, and in an increase in materials and supplies,casualty derailment expense, property taxes, environmental expense and the settlement of a litigation dispute during 2015. These increases were partially offset by the weakening of the Mexican peso, lower employee expenses and a reduction in personal injury expense recognized during 2015 as a result of changes in estimates due to favorable claim experience
Lease termination costs. Lease termination costs were $9.6 million and $38.3 million for the years ended December 31, 2015 and 2014, respectively, due to the early termination of certain operating leases and the related purchase of the equipment.expense.
Non-Operating Expenses
Equity in net earnings of affiliates. Equity in net earnings from affiliates decreased $2.83.1 million for the year ended December 31, 20152017, compared to 20142016. Equity in net earnings from the operations, as a result of Ferrocarril y Terminal del Valle de Mexico, S.A. de C.V. decreased due to higher operating expenses. In addition,lower equity in net earnings from the operations of Panama Canal Railway Company decreasedPCRC due to lowera decrease in container volumes.
Interest expense. Interest expense increased $9.1$2.5 million for the year ended December 31, 2015,2017, compared to 2014,2016, due to higher average debt balances, partially offset by lower average interest rates and average debt balances as a result of an increased proportion of commercial paper in the Company’s issuance ofoverall debt during the third quarter of 2015.mix. For the year ended December 31, 2015,2017, the average debt balance (including short-term borrowings)commercial paper) was $2,257.8$2,603.6 million, compared to $2,174.7$2,492.7 million in 20142016. The average interest rate for the year ended December 31, 20152017 was 3.7%3.9%, compared to 3.5%4.0% in 2014.2016.
Debt retirement andForeign exchange costs.gain (loss). Debt retirement and exchange costs were $7.6 million for the year ended December 31, 2015, related to costs that were payable to parties other than the debt holders as a result of the KCSR and KCSM senior notes exchanged for KCS senior notes. For the year ended December 31, 2014, debt retirement and2017 foreign exchange costs were $6.6gain was $41.7 million, relatedcompared to the call premiums, original issue discounts and write-offa loss of unamortized debt issuance costs associated with the Company’s various debt redemption activities.
$72.0 million in 2016. Foreign exchange loss. For the years ended December 31, 2015 and 2014, foreign exchange loss was $56.6 million and $35.5 million, respectively. Foreign exchange lossgain (loss) includes the re-measurement and settlement of net monetary assets denominated in Mexican pesos and the lossgain (loss) on foreign currency derivative contracts.
For the yearsyear ended December 31, 2015 and 2014,2017, the re-measurement and settlement of net monetary assets denominated in Mexican pesos resulted in a foreign exchange gain of $3.5 million, compared to a loss of $9.418.5 million and $7.6 million, respectively.in 2016.
The Company enters into foreign currency derivative contracts to hedge its net exposure to fluctuations in the Mexican cash tax obligation due to changes in the value of the Mexican peso against the U.S. dollar. For the yearsyear ended December 31, 2015 and 2014,2017, foreign exchange lossgain on foreign currency derivative contracts was $47.2$38.2 million, and $27.9compared to a loss of $53.5 million respectively.in 2016.
Other expense, net. Other expense, net, increaseddecreased $1.20.4 million for the year ended December 31, 20152017, compared to 20142016, due to loweran increase in miscellaneous income.
Income tax expense.expense (benefit). Income tax expense (benefit) decreased $21.5272.4 million for the year ended December 31, 20152017, compared to 20142016, due to lower pre-taxthe impact of the Tax Reform Act enacted on December 22, 2017. The Company recognized a $487.6 million tax benefit as a result of revaluing the U.S. ending net deferred tax liabilities from 35% to the newly enacted U.S. corporate income and a lower effective tax rate.rate of 21%. The tax benefit was partially offset by tax expense of $74.6 million for the deemed mandatory repatriation of undistributed earnings. The effective tax rate was 27.8%(10.2%) and 29.3%27.6% for the years ended December 31, 20152017 and 20142016, respectively. The decrease in the effective tax rate was primarily due to impact of the more significantTax Reform Act.
The strengthening of the Mexican peso as of December 31, 2017 as compared to December 31, 2016 increased the Company’s Mexican cash tax obligation by $18.8 million for the year ended December 31, 2017, whereas the weakening of the Mexican peso againstas of December 31, 2016 decreased the U.S. dollar in 2015 as compared to 2014.
The weakening of theCompany’s Mexican peso during 2015 and 2014 decreased the cash tax obligation by $46.4 million and $27.7$49.2 million for the yearsyear ended December 31, 2015 and 2014, respectively.2016. The Company enters into foreign currency derivative contracts to hedge its net exposure to fluctuations in the Mexican cash tax obligation due to changes in the value of the Mexican peso against the U.S. dollar, and gains and losses on these foreign currency derivative contracts are recorded in foreign exchange loss.gain (loss).
Further information on the components of the effective tax rates for the years ended December 31, 20152017 and 2014,2016, is presented in Item 8, Financial Statements and Supplementary Data — Note 13, to the Consolidated Financial Statements in Item 8.Income Taxes.
LIQUIDITY AND CAPITAL RESOURCES
Overview
The Company focuses its cash and capital resources on investing in the business, shareholder returns and optimizing its capital structure.
The Company believes, based on current expectations, that cash and other liquid assets, operating cash flows, access to debt and equity capital markets, and other available financing resources will be sufficient to fund anticipated operating expenses, capital expenditures, debt service costs, dividends, share repurchases and other commitments in the foreseeable
future. The Company may, from time to time, incur debt to refinance existing indebtedness, purchase equipment under operating leases, repurchase shares or fund equipment additions or new investments.
During 2016,2018, the Company invested $584.0$512.3 million in capital expenditures and purchased $26.6 million of equipment under existing operating leases or replacement equipment as certain operating leases expired.expenditures. See Capital Expenditures section for further details.
During 2016, KCS2018, the Company repurchased 2,127,6122,272,213 shares of common stock for $185.4$243.1 million at an average price of $87.15$106.98 per share under the $500.0$800.0 million common share repurchase program announced in May 2015.August 2017. Since inception of this program, KCSthe Company has repurchased 4,261,5964,691,682 shares of common stock for $379.6 million at an average price of $89.07$106.20 per share.share and a total cost of $498.3 million. Remaining share repurchases are expected to be funded by cash on hand, cash generated from operations and debt. Management's assessment of market conditions, available liquidity and other factors will determine the timing and volume of any future repurchases. Refer to Item 8, Financial Statements and Supplementary Data — Note 14, Stockholders’ Equity for additional detail on the Company’s common share repurchase program.
During 2018, the first quarterCompany repurchased 13,775 shares of 2016, KCS entered into agreements with certain holdersits $25 par preferred stock for $0.4 million at an average price of KCSR and KCSM senior notes to exchange approximately $55.6 million of existing KCSR and KCSM senior notes for new securities issued by KCS with the same interest rates, interest payment dates and maturity dates and substantially identical redemption provisions as the corresponding existing senior note.$26.23 per share.
On May 16, 2016,3, 2018, KCS issued $250.0$500.0 million principal amount of senior unsecured notes, which bear interest semiannually at a fixed annual rate of 3.125%4.70% (the “4.70% Senior Notes”). The net proceeds from the offering were used to repay the outstanding commercial paper issued by KCS, repay a locomotive lease and certain equipment loans, and for other general corporate purposes.
On October 28, 2016, $250.0May 3, 2018, KCSM repurchased $5.3 million of the remaining $10.9 million aggregate principal amount of outstanding floating rateits 3.0% senior unsecured notes issued by KCS and KCSM matured and were redeemed by the Companydue May 15, 2023, at a redemptiondiscounted price equal to 100%95.91% of the principal amountamount.
During May 2018, the Company paid the remaining $23.0 million and $19.1 million principal amounts under its locomotive financing agreements with Export Development Canada and DVB Bank AG, respectively, using available cash on hand and commercial paper.a portion of the proceeds from the issuance of the 4.70% Senior Notes.
The Company’s current financing instruments contain restrictive covenants which limit or preclude certain actions; however, the covenants are structured such that the Company expects to have sufficient flexibility to conduct its operations. The Company was in compliance with all of its debt covenants as of December 31, 2016.2018.
For discussion regarding the agreements representing the indebtedness of KCS, see “NoteItem 8, Financial Statements and Supplementary Data — Note 11, Short-Term Borrowings”Borrowings and “NoteNote 12, Long-Term Debt” in the “Notes to the Consolidated Financial Statements” section of this annual report on Form 10-K.Debt.
During 20162018, the Company’s Board of Directors declared quarterly cash dividends of $0.33$0.36 per share or $141.9$146.7 million on its common stock. On January 26, 2017, the Company’s Board of Directors declared a cash dividend of $0.33 per share payable on April 5, 2017, to common stockholders of record as of March 13, 2017. Subject to the discretion of the Board of Directors, capital availability and a determination that cash dividends continue to be in the best interest of its stockholders, the Company intends to pay a quarterly dividend on an ongoing basis.
On December 31, 20162018, total available liquidity (the cash balance plus revolving credit facility availability) was $789.2$900.5 million, compared to available liquidity at December 31, 20152017 of $856.6$588.9 million. This increase was primarily due to the issuance of the 4.70% Senior Notes, a portion of which were used to pay down KCS’s outstanding commercial paper during 2018.
As of December 31, 2016,2018, the total cash and cash equivalents held outside of the U.S. in foreign subsidiaries was $133.0 million.$27.9 million, after repatriating $233.8 million during 2018. The Company expects that this cash will be available to fund company operations without incurring significant additional income taxes.
KCS’s operating results and financing alternatives can be unexpectedly impacted by various factors, some of which are outside of its control. For example, if KCS were to experience a reduction in revenues or a substantial increase in operating costs or other liabilities, its earnings could be significantly reduced, increasing the risk of non-compliance with debt covenants. Additionally, the Company is subject to external factors impacting debt and equity capital markets and its ability to obtain financing under reasonable terms is subject to market conditions. Volatility in capital markets and the tightening of market liquidity could impact KCS’s access to capital. Further, KCS’s cost of debt can be impacted by independent rating agencies which assign debt ratings based on certain factors including competitive position, credit measurements such as interest coverage and leverage ratios, and liquidity.
In December 2018, the Mexican government enacted Mexico Tax Reform. Mexico Tax Reform eliminated “universal compensation” that allowed Mexican taxpayers to offset recoverable tax balances against balances due for other federal taxes. The elimination of “universal compensation” could negatively impact the timing of KCSM’s cash flow by up to $60.0 million in 2019 while awaiting refunds of value added tax from the Mexican government.
Cash Flow Information and Contractual Obligations
Summary cash flow data follows (in millions):
| | | | 2016 | | 2015 | | 2014 | 2018 | | 2017 | | 2016 |
| Cash flows provided by (used for): | | | | | | | | | | |
| Operating activities | $ | 913.3 |
| | $ | 909.3 |
| | $ | 906.0 |
| $ | 945.7 |
| | $ | 1,028.4 |
| | $ | 919.0 |
|
| Investing activities | (628.2 | ) | | (873.0 | ) | | (982.9 | ) | (651.9 | ) | | (681.1 | ) | | (628.2 | ) |
| Financing activities | (251.1 | ) | | (247.7 | ) | | (4.6 | ) | (327.4 | ) | | (383.8 | ) | | (256.8 | ) |
| Net increase (decrease) in cash and cash equivalents | 34.0 |
| | (211.4 | ) | | (81.5 | ) | (33.6 | ) | | (36.5 | ) | | 34.0 |
|
| Cash and cash equivalents beginning of year | 136.6 |
| | 348.0 |
| | 429.5 |
| 134.1 |
| | 170.6 |
| | 136.6 |
|
| Cash and cash equivalents end of year | $ | 170.6 |
| | $ | 136.6 |
| | $ | 348.0 |
| $ | 100.5 |
| | $ | 134.1 |
| | $ | 170.6 |
|
During 20162018, and 2017, cash and cash equivalents increased $34.0decreased $33.6 million and $36.5 million, respectively, as a result of the impacts discussed in the paragraphs below. During 2015, cash and cash equivalents decreased $211.4 million as a result of the repurchase of common stock of $194.2 million and higher dividend payments.
Operating Cash Flows. Net cash provided by operating activities increased $4.0decreased $82.7 million for 2016,2018, as compared to 2015,2017, primarily due to an increase in cash inflows from working capital items resulting mainly from the timingMexican income tax payments of certain payments,$145.2 million, partially offset by the 2016 Mexican fuel excise tax credit, for which cash will be receivedan increase in 2017.operating income of $64.7 million. Net cash provided by operating activities increased $3.3$109.4 million for 2015,2017, as compared to 2014, as a decrease in net income was more than offset by higher non-cash depreciation and amortization expense and unrealized foreign exchange loss on foreign currency contracts. Additionally, materials and supplies increased2016, due to timingincreased operating income of construction activities and fuel purchases.$103.1 million.
Investing Cash Flows. Net cash used for investing activities decreased $244.8$29.2 million for 2016,2018, as compared to 2015,2017, due to reduceda $65.1 million decrease in capital expenditures, a $11.8 million decrease in cash outflows for other investing activities and reduced$7.6 million of insurance proceeds received in 2018 relating to 2017 hurricane damage, partially offset by a $56.3 million increase in expenditures for the purchase or replacement of equipment under existing operating leases. Net cash used for investing activities decreased $109.9increased $52.9 million for 2015,2017, as compared to 2014,2016, due to reduceda $21.8 million increase in capital expenditures, a $19.5 million increase in investments in and advances to affiliates and a $16.0 million increase in expenditures for the purchase or replacement of equipment under existing operating leases, partially offset by higher capital expenditures and other investing activities.leases. Additional capital expenditure information is included within the Capital Expenditure section of Liquidity and Capital Resources.
Financing Cash Flows. FinancingNet cash inflows are generated from the issuance of long-term debt, short-term borrowings and proceeds from the issuance of common stock under employee stock plans. Financing cash outflows are used for the repayment of debt, short-term borrowings, share repurchases and the payment of dividends and debt costs. Financing cash flowsfinancing activities decreased $56.4 million for 2016, 2015, and 2014 are discussed in more detail below:
Net financing cash outflows for 2016 were $251.1 million2018, as compared to 2017, due to the the repurchase of common stock of $185.4 million, the payment of dividends of $142.8 million and the net repayment ofan increase in proceeds from long-term debt of $27.7$499.4 million and a decrease in shares repurchased of $132.1 million as a result of the $200.0 million accelerated share repurchase program that was executed in the third quarter of 2017. These decreases were partially offset by the net proceeds from short-term borrowings of $100.8 million.
Net financing cash outflows for 2015 were $247.7 million due toan increase in the net repayment of short-term borrowings of $371.1$507.1 million, an increase in repayment of long-term debt of $56.1 million and an increase in debt costs of $8.0 million. Net cash used for financing activities increased $127.0 million for 2017, as compared to 2016, due to an increase in the repurchase of common stock of $194.2$190.2 million, the payment of dividends of $140.1 million and the payment of debt costs of $20.3 million. These cash outflows were partially offset by an increase in net proceeds from long-term debtshort-term borrowings of $473.9$58.2 million.
Net financing cash outflows for 2014 were $4.6 million due to the the net repayment of $333.0 million of long-term debt and the payment of $116.6 million of dividends, offset by the net proceeds of $448.6 million from short-term borrowings.
Contractual Obligations. The following table outlines the material obligations and commitments as of December 31, 20162018 (in millions):
|
| | | | | | | | | | | | | | | | | | | |
| | Payments Due by Period |
| Total | | Less Than 1 Year | | 1-3 Years | | 3-5 Years | | More than 5 years |
| Long-term debt and short-term borrowings (including interest and capital lease obligations) (i) | $ | 4,752.8 |
| | $ | 119.6 |
| | $ | 503.8 |
| | $ | 848.8 |
| | $ | 3,280.6 |
|
| Operating leases | 205.3 |
| | 57.5 |
| | 69.6 |
| | 32.2 |
| | 46.0 |
|
| Deemed mandatory repatriation tax (ii) | 11.3 |
| | — |
| | — |
| | 2.5 |
| | 8.8 |
|
| Obligations due to uncertainty in income taxes | 2.2 |
| | — |
| | — |
| | 2.2 |
| | — |
|
| Capital expenditure obligations (iii) | 276.6 |
| | 141.2 |
| | 135.4 |
| | — |
| | — |
|
| Other contractual obligations (iv) | 681.3 |
| | 230.2 |
| | 133.9 |
| | 110.4 |
| | 206.8 |
|
| Total | $ | 5,929.5 |
| | $ | 548.5 |
| | $ | 842.7 |
| | $ | 996.1 |
| | $ | 3,542.2 |
|
|
| | | | | | | | | | | | | | | | | | | | | | | |
| | Payments Due by Period | | More than 5 years | | Other |
| | Total | | Less Than 1 Year | | 1-3 Years | | 3-5 Years | | |
| Long-term debt and short-term borrowings (including interest and capital lease obligations) (i) | $ | 4,037.6 |
| | $ | 299.9 |
| | $ | 235.8 |
| | $ | 472.6 |
| | $ | 3,029.3 |
| | $ | — |
|
| Operating leases | 300.5 |
| | 66.4 |
| | 85.0 |
| | 54.6 |
| | 94.5 |
| | — |
|
| Obligations due to uncertainty in income taxes (ii) | 3.8 |
| | — |
| | — |
| | — |
| | — |
| | 3.8 |
|
| Capital expenditure obligations (iii) | 249.7 |
| | 216.6 |
| | 29.6 |
| | 3.5 |
| | — |
| | — |
|
| Other contractual obligations (iv) | 455.0 |
| | 162.4 |
| | 155.9 |
| | 78.7 |
| | 58.0 |
| | — |
|
| Total | $ | 5,046.6 |
| | $ | 745.3 |
| | $ | 506.3 |
| | $ | 609.4 |
| | $ | 3,181.8 |
| | $ | 3.8 |
|
_____________________
| |
| (i) | For variable rate obligations, interest payments were calculated using the December 31, 20162018 rate. For fixed rate obligations, interest payments were calculated based on the applicable rates and payment dates. |
| |
| (ii) | For amounts whereU.S. federal income tax on deemed mandatory repatriation is payable over 8 years pursuant to the year of settlement cannot be reasonably estimated, obligations due to uncertainty in income taxes are included in the Other column.Tax Reform Act. |
| |
| (iii) | Capital expenditure obligations include minimum capital expenditures under the KCSM Concession agreement and other regulatory requirements. |
| |
| (iv) | Other contractual obligations include purchase commitments and certain maintenance agreements. |
In the normal course of business, the Company enters into long-term contractual commitments for future goods and services needed for the operations of the business. Such commitments are not in excess of expected requirements and are not reasonably likely to result in performance penalties or payments that would have a material adverse effect on the Company’s liquidity. Such commitments are not included in the above table.
The Company is party to four utilization leases covering 616 railcars in which car hire revenue as defined in the lease agreements is shared between the lessor and the Company. The leases expire at various times through 2024. Amounts that may be due to lessors under these utilization leases vary from month to month based on car hire rental with the minimum monthly cost to the Company being zero. Accordingly, the utilization leases have been excluded from contractual obligations above.
The SCT previously required KCSM to submit a five-year capital expenditures plan every five years. As a result of new regulation in 2016, the SCT requires KCSM to submit a three-year capital expenditures plan every three years, once the most recent plan expires.years. The most recent five-yearthree-year plan was submitted in 20122017 for the years 20132018 — 2017.2020. KCSM expects to continue capital spending at current levels in future years and will continue to have capital expenditure obligations past 2017,2020, which are not included in the table above.
Off-Balance Sheet Arrangements
On November 2, 2007, PCRC completed an offering of $100.0 million of 7.0% senior secured notes due November 1, 2026 (the “Notes”). The Notes are senior obligations of PCRC, secured by certain assets of PCRC. KCS has pledged its shares of PCRC as security for the Notes. The Notes are otherwise non-recourse to KCS. The Company has agreed, along with Mi-Jack Products, Inc. (“Mi-Jack”), the other 50% owner of PCRC, to each fund one-half50% of any debt service reserve and liquidity reserve (reserves which are required to be established by PCRC in connection with the issuance of the Notes). As of December 31, 20162018, the Company’s portion of these reserves was $5.5$5.6 million. The Company has issued a standby letter of credit in the amount of $5.5$5.6 million to fund its share of these reserves.
Capital Expenditures
KCS has funded, and expects to continue to fund, capital expenditures with operating cash flows and short and long-term debt.
The following table summarizes capital expenditures by type for the years ended December 31, 20162018, 20152017, and 20142016, respectively (in millions):
| | | | 2016 | | 2015 | | 2014 | | 2018 | | 2017 | | 2016 |
| Roadway capital program | $ | 271.8 |
| | $ | 294.0 |
| | $ | 304.0 |
| | $ | 245.7 |
| | $ | 269.3 |
| | $ | 271.8 |
|
| Locomotives and freight cars | 112.6 |
| | 201.2 |
| | 244.0 |
| | 101.2 |
| | 75.7 |
| | 112.6 |
|
| Capacity | 109.6 |
| | 86.6 |
| | 93.0 |
| | 69.8 |
| | 111.4 |
| | 109.6 |
|
| Positive train control | 49.6 |
| | 34.0 |
| | 8.6 |
| | 28.9 |
| | 51.7 |
| | 49.6 |
|
| Information technology | 29.3 |
| | 21.9 |
| | 31.5 |
| | 35.4 |
| | 33.7 |
| | 29.3 |
|
| Other | 11.1 |
| | 11.0 |
| | 21.6 |
| | 31.3 |
| | 17.7 |
| | 11.1 |
|
| Total capital expenditures (accrual basis) | 584.0 |
| | 648.7 |
| | 702.7 |
| | 512.3 |
| | 559.5 |
| | 584.0 |
|
| Change in capital accruals | (20.1 | ) | | 39.3 |
| | (34.5 | ) | | 8.0 |
| | 25.9 |
| | (20.4 | ) |
| Total cash capital expenditures | $ | 563.9 |
| | $ | 688.0 |
| | $ | 668.2 |
| | $ | 520.3 |
| | $ | 585.4 |
| | $ | 563.6 |
|
| | | | | | | | | | | | |
| Purchase or replacement of equipment under operating leases | | | | | | |
| Purchase or replacement of equipment under operating leases: | | | | | | | |
| Locomotives | | | $ | 50.6 |
| | $ | — |
| | $ | — |
|
| Freight cars | $ | 26.6 |
| | $ | 144.2 |
| | $ | 224.4 |
| | 49.9 |
| | 42.6 |
| | 26.6 |
|
| Locomotives | — |
| | — |
| | 76.3 |
| |
| Total purchase or replacement of equipment under operating leases (accrual basis) | 26.6 |
| | 144.2 |
| | 300.7 |
| | 100.5 |
| | 42.6 |
| | 26.6 |
|
| Change in capital accruals | — |
| | — |
| | 1.4 |
| | (1.6 | ) | | — |
| | — |
|
| Total cash purchase or replacement of equipment under operating leases | $ | 26.6 |
| | $ | 144.2 |
| | $ | 302.1 |
| | $ | 98.9 |
| | $ | 42.6 |
| | $ | 26.6 |
|
Generally, the Company’s capital program consists of capital replacement and equipment. For 2017,2019, internally generated cash flows and short-term borrowings are expected to fund cash capital expenditures, which are currently estimated to be between $550.0$640.0 million and $560.0$660.0 million. In addition, the Company periodically reviews its equipment and property under operating leases. Any additional purchase or replacement of equipment and property under operating leases during 20172019 is expected to be funded with internally generated cash flows and/or short-term debt. The locomotive operating lease buyout shown in the table above was completed using a portion of the proceeds from the issuance of the 4.70% Senior Notes.
Property Statistics
The following table summarizes certain property statistics as of December 31:
| | | | 2016 | | 2015 | | 2014 | 2018 | | 2017 | | 2016 |
| Track miles of rail installed | 146 |
| | 177 |
| | 169 |
| 166 |
| | 174 |
| | 146 |
|
| Cross ties installed (thousands) | 711 |
| | 829 |
| | 880 |
| 651 |
| | 699 |
| | 711 |
|
Shelf Registration Statements and Public Securities Offerings
KCS has one current, universal shelf registration statement on file with the SEC (the “Universal Shelf” — Registration No. 333-200411)333-221537). The Universal Shelf was filed on November 20, 201413, 2017 in accordance with the securities offering reform rules of the SEC that allow “well-known seasoned issuers” to register an unspecified amount of different types of securities on an immediately effective Form S-3 registration statement. The Universal Shelf will expire on November 20, 2017.13, 2020.
CRITICAL ACCOUNTING POLICIES AND ESTIMATES
KCS’s accounting and financial reporting policies are in conformity with U.S. generally accepted accounting principles (“U.S. GAAP”). The preparation of financial statements in conformity with U.S. GAAP requires management to make estimates and assumptions that affect the reported amounts of assets and liabilities, the disclosure of contingent assets and liabilities at the date of the financial statements, and the reported amounts of revenues and expenses during the reporting period. Management believes that the following accounting policies and estimates are critical to an understanding of KCS’s historical and future performance. Management has discussed the development and selection of the following critical accounting estimates with the Audit Committee of KCS’s Board of Directors and the Audit Committee has reviewed the selection, application and disclosure of the Company’s critical accounting policies and estimates.
Capitalization, Depreciation and Amortization of Property and Equipment (including Concession Assets)
Due to the highly capital intensive nature of the railroad industry, capitalization and depreciation of property and equipment are a substantial portion of the Company’s consolidated financial statements. Net property and equipment, including concession assets, comprised approximately 92% of the Company’s total assets as of December 31, 2016,2018, and related depreciation and amortization comprised approximately 20% of total operating expenses for the year ended December 31, 2016.2018.
KCS capitalizes costs for self-constructed additions and improvements to property including direct labor and material, indirect overhead costs, and interest during long-term construction projects. Direct costs are charged to capital projects based on the work performed and the material used. Indirect overhead costs are allocated to capital projects as a standard percentage, which is evaluated annually, and applied to direct labor and material costs. Asset removal activities are performed in conjunction with replacement activities; therefore, removal costs are estimated based on a standard percentage of direct labor and indirect overhead costs related to capital replacement projects. For purchased assets, all costs necessary to make the asset ready for its intended use are capitalized. Expenditures that significantly increase asset values, productive capacity, efficiency, safety or extend useful lives are capitalized. Repair and maintenance costs are expensed as incurred.
Property and equipment are carried at cost and are depreciated primarily on the group method of depreciation, which the Company believes closely approximates a straight line basis over the estimated useful lives of the assets measured in years. The group method of depreciation applies a composite rate to classes of similar assets rather than to individual assets. Composite depreciation rates are based upon the Company’s estimates of the expected average useful lives of assets as well as expected net salvage value at the end of their useful lives. In developing these estimates, the Company utilizes periodic depreciation studies performed by an independent engineering firm. Depreciation rate studies are performed at least every three years for equipment and at least every six years for road property (rail, ties, ballast, etc.). The depreciation studies take into account factors such as:
Statistical analysis of historical patterns of use and retirements of each asset class;
Evaluation of any expected changes in current operations and the outlook for the continued use of the assets;
Evaluation of technological advances and changes to maintenance practices; and
Historical and expected salvage to be received upon retirement.
The depreciation studies may also indicate that the recorded amount of accumulated depreciation is deficient or in excess of the amount indicated by the study. Any such deficiency or excess is amortized as a component of depreciation expense over the remaining useful lives of the affected asset class, as determined by the study. The Company also monitors these factors in non-study years to determine if adjustments should be made to depreciation rates. The Company completedperformed depreciation studies for KCSR in 2018 and KCSM in 2016 and KCSR in 2015.2016. The impacts of the studies were immaterial to the consolidated financial results for all periods.
Also under the group method of depreciation, the cost of railroad property and equipment (net of salvage or sales proceeds) retired or replaced in the normal course of business is charged to accumulated depreciation with no gain or loss recognized. Actual historical costs are retired when available, such as with equipment costs. The use of estimates in recordingrecognizing the retirement of roadway assets is necessary as it is impractical to track individual, homogeneous network-type assets. Certain types of roadway assets are retired using statistical curves derived from the depreciation studies that indicate the relative distribution of the age of the assets retired. For other roadway assets, historical costs are estimated by (1) deflating current costs
using inflation indices published by the U.S. Bureau of Labor Statistics and (2) the estimated useful life of the assets as determined by the depreciation studies. The indices applied to the replacement value are selected because they closely correlate with the major costs of the items comprising the roadway assets. Because of the number of estimates inherent in the depreciation and retirement processes and because it is impossible to precisely estimate each of these variables until a group of assets is completely retired, the Company continually monitors the estimated useful lives of its assets and the accumulated depreciation associated with each asset group to ensure the depreciation rates are appropriate.
Estimation of the average useful lives of assets and net salvage values requires management judgment. Estimated average useful lives may vary over time due to changes in physical use, technology, asset strategies and other factors that could have an impact on the retirement experience of the asset classes. Accordingly, changes in the assets’ estimated useful lives could significantly impact future periods’ depreciation expense. Depreciation and amortization expense for the year ended December 31, 20162018 was $305.0$346.7 million. If the weighted average useful lives of assets were changed by one year, annual depreciation and amortization expense would change approximately $11.0 million.
Gains or losses on dispositions of land or non-group property and abnormal retirements of railroad property are recognized through income. A retirement of railroad property would be considered abnormal if the cause of the retirement is unusual in nature and its actual life is significantly shorter than what would be expected for that group based on the depreciation studies. An abnormal retirement could cause the Company to re-evaluate the estimated useful life of the impacted asset class. There were no significant gains or losses from abnormal retirements of property or equipment for any of the three years ended December 31, 2016.2018.
Costs incurred by the Company to acquire the concession rights and related assets, as well as subsequent improvements to the concession assets, are capitalized and amortized using the group method of depreciation over the lesser of the current expected Concession term, including probable renewal of an additional 50-year term, or the estimated useful lives of the assets and rights. The Company’s ongoing evaluation of the useful lives of concession assets and rights considers the aggregation of the following facts and circumstances:
The Company’s executive management is dedicated to ensuring compliance with the various provisions of the Concession and to maintaining positive relationships with the SCT and other Mexican federal, state, and municipal governmental authorities;
During the time since the Concession was granted, the relationships between KCSM and the various Mexican governmental authorities have matured and the guidelines for operating under the Concession have become more defined with experience;
There are no known supportable sanctions or compliance issues that would cause the SCT to revoke the Concession or prevent KCSM from renewing the Concession; and
KCSM operations are an integral part of the KCS operations strategy, and related investment analyses and operational decisions assume that the Company’s cross border rail business operates into perpetuity, and do not assume that Mexico operations terminate at the end of the current Concession term.
Based on the above factors, as of December 31, 2016,2018, the Company continues to believe that it is probable that the Concession will be renewed for an additional 50-year term beyond the current term.
Long-lived assets are reviewed for impairment when events or circumstances indicate that the carrying amount of an asset may not be recoverable. If impairment indicators are present and the estimated future undiscounted cash flows are less than the carrying value of the long-lived assets, the carrying value would be reduced to the estimated fair value. Future cash flow estimates for an impairment review would be based on the lowest level of identifiable cash flows, which are the Company’s U.S. and Mexican operations. During the years ended December 31, 20162018 and 2015,2017, management did not identify any indicators of impairment.
Income Taxes
Deferred income taxes represent a net asset or liability of the Company. For financial reporting purposes, management determines the current tax liability, as well as deferred tax assets and liabilities, in accordance with the asset and liability method of accounting for income taxes. The provision for income taxes is the sum of income taxes both currently payable and deferred
into the future. Currently payable income taxes represent the liability related to the Company’s U.S., state and foreign income tax returns for the current year and anticipated tax payments resulting from income tax audits, while the net deferred tax expense or benefit represents the change in the balance of net deferred tax assets or liabilities as reported on the balance sheet. The changes in deferred tax assets and liabilities are determined based upon the estimated timing of reversal of differences between the carrying amount of assets and liabilities for financial reporting purposes and the basis of assets and liabilities for tax purposes as measured using the currently enacted tax rates that will be in effect at the time these differences are expected to reverse. Additionally, management estimates whether taxable operating income in future periods will be sufficient to fully recognize any deferred tax assets. Valuation allowances are recorded as appropriate to reduce deferred tax assets to the amount considered likely to be realized.
On December 22, 2017, the President of the United States signed into law the Tax Reform Act. The legislation significantly changed U.S. tax law by, among other things, lowering corporate income tax rates, implementing a territorial tax system and imposing a repatriation tax on deemed repatriated earnings of foreign subsidiaries. The Tax Reform Act permanently reduced the U.S. corporate income tax rate from a maximum of 35% to a flat 21% rate, effective January 1, 2018. The SEC staff issued Staff Accounting Bulletin No. 118 (“SAB 118”) to address the application of U.S. GAAP in situations when a registrant did not have the necessary information available, prepared, or analyzed (including computations) in reasonable detail to complete the accounting for certain income tax effects of the Tax Reform Act. The Company recognized provisional tax impacts related to the deemed repatriated earnings and the revaluation of deferred tax assets and liabilities in its consolidated financial statements for the year ended December 31, 2017. Adjustments made to the provisional amounts allowed under SAB 118 were identified and recorded as discrete adjustments during the year ended December 31, 2018. The accounting was completed in the fourth quarter of 2018.
Income tax expense related to Mexican operations has additional complexities such as the impact of exchange rate variations, which can have a significant impact on the effective income tax rate.
Management believes that the assumptions and estimates related to the provision for income taxes are critical to the Company’s results of operations. For the year ended December 31, 2016,2018, income tax expense totaled $182.8$257.5 million. For every 1% change in the 20162018 effective rate, income tax expense would have changed by approximately $6.6$8.9 million. For further information on the impact of foreign exchange fluctuation on income taxes, refer to Item 7A, Quantitative and Qualitative Disclosures About Market Risk — Foreign Exchange Sensitivity inItem 7A.Sensitivity.
OTHER MATTERS
Litigation. The Company is a party to various legal proceedings and administrative actions, all of which are of an ordinary, routine nature and incidental to its operations. Included in these proceedings are various tort claims brought by current and former employees for job relatedjob-related injuries and by third parties for injuries related to railroad operations. KCS aggressively defends these matters and has established liability provisions that management believes are adequate to cover expected costs. Although it is not possible to predict the outcome of any legal proceeding, in the opinion of the Company’s management, other than those proceedingsas described in Note 16 to the Consolidated Financial Statements in Item 8, of this Form 10-K,Financial Statements and Supplementary Data — Note 16, Commitments and Contingencies, such proceedings and actions should not, individually or in the aggregate, have a material adverse effect on the Company’s consolidated financial statements.
Inflation. U.S. generally accepted accounting principles require the use of historical cost, which does not reflect the effects of inflation on the replacement cost of property. Due to the capital intensive nature of KCS’s business, the replacement cost of these assets would be significantly higher than the amounts reported under the historical cost basis.
Recent Accounting Pronouncements. Refer to Item 8, Financial Statements and Supplementary Data — Note 2 to the Consolidated Financial Statements in Item 8 of this Form
10-K, Significant Accounting Policies for information relative to recent accounting pronouncements.
Regulatory Updates
Mexican Antitrust Law. Pursuant to the Mexican Antitrust Law and the Regulatory Railroad Service Law, the Investigating Authority of the Mexican government’s antitrust commission (Comisión Federal de Competencia Económica or the “COFECE”) announced in September 2016 that it would review competitive conditions in the Mexican railroad industry, with respect to the existence of effective competition in the provision of interconnection services, trackage rights, switching rights and interline services used to render public freight transport in Mexico. The review included the entire freight rail transportation market in Mexico and was not targeted to any single rail carrier.
On March 15, 2017, the Investigating Authority published an executive summary of its preliminary report in the Federal Official Gazette (Diario Oficial de la Federación). The preliminary report concluded that there was a lack of effective competition in the market for trackage rights (“Relevant Market”) throughout the entire networks of KCSM, Ferrocarril Mexicano, S.A. de C.V., Ferrosur, S.A. de C.V., and FTVM.
The Company disagreed with the Investigating Authority’s reasoning and preliminary conclusions, and responded on April 20, 2017, with its evidence and arguments to support its position, as provided in the Mexican antitrust law. The Company’s response argued that the investigation which supported the conclusions in the preliminary report was conducted contrary to the rule of law, the rules of procedure, and relied upon faulty economic analysis.
On March 7, 2018, KCSM received the Final Resolution handed down by the COFECE Panel in connection with the investigation regarding effective competition in the market for interconnection services, trackage rights and switching rights used to provide railway freight public services in the rail freight industry.
The Final Resolution dismissed the preliminary report issued by the Investigating Authority along with that report’s finding of a lack of effective competition for interconnection services. The Final Resolution represents the end of the investigation and no further amendments or modifications may be made to the preliminary report.
USMCA. On November 30, 2018, U.S. President Trump, Canadian Prime Minister Trudeau, and then-Mexican President Peña Nieto signed the U.S.-Mexico-Canada-Agreement (“USMCA”). The agreement would serve as a successor to the 1994 North American Free Trade Agreement (“NAFTA”). The USMCA will not become effective until all three parties have completed their respective domestic ratification procedures.
In the United States, congressional review and approval of the USMCA is done under the Bipartisan Trade Priorities and Accountability Act of 2015. Implementing legislation is expected to be introduced in Congress possibly in the first quarter of 2019.
U.S. Tariff Imposition on Imports. The administration of U.S. President Donald J. Trump has implemented new U.S. tariffs, that could impact the level of trade between the U.S and Mexico and global commerce. U.S. trading partners have responded by announcing retaliatory tariffs on some U.S. exports. At this time, the Company cannot determine the impacts these tariffs will have on the Company’s consolidated financial statements.
| |
| Item 7A. | Quantitative and Qualitative Disclosures About Market Risk |
KCS is exposed to certain market risks including interest rate, commodity, and foreign exchange risks and utilizes various financial instruments that have certain inherent market risks. These instruments have been entered into for hedging rather than trading purposes. The following information, together with information included in Item 7, “Management’sManagement’s Discussion and Analysis of Financial Condition and Results of Operations”Operations, and Item 8, Financial Statements and Supplementary Data — Note 10, to the Consolidated Financial Statements in Item 8 of this Form 10-K,Derivative Instruments, describe the key aspects of certain financial instruments that have market risk to KCS.
The analysis presented below for each of the Company's market risks uses a sensitivity model based on hypothetical changes (increases or decreases) to market risks using defined parameters and assumptions to quantify the potential impacts to the consolidated statements of income. The hypothetical changes to market risks do not represent KCS's view of future market changes. The effect of a change in a particular assumption was calculated without adjusting any other assumptions. These market risks and the potential impacts to the consolidated statements of income for the current year, have not materially fluctuated, individually or in the aggregate from the preceding year; thus only current year information is presented below.
Interest Rate Sensitivity. Floating-rate indebtedness includes commercial paper borrowings, revolving credit facilities and floatingThe Company is subject to interest rate senior notes which totaled $181.4 million and $330.0 million at December 31, 2016 and 2015, respectively. Considering the balance of $181.4 million of variable rate debt at December 31, 2016, KCS is sensitive to fluctuations in interest rates. For example, a hypothetical 100 basis points increaserisk associated with its debt. Changes in interest rates would result in additional interest expenseimpact the fair value of $1.8 million on an annualized basis for the floating-rate instruments issued by the Company as of December 31, 2016.
outstanding fixed-rate debt, but there is no impact to current earnings or cash flow. Based upon the borrowing rates available to KCS and its subsidiaries for indebtedness with similar terms and average maturities, the fair value of long-term debt was approximately $2,303.8$2,661.3 million and $2,287.5$2,377.8 million at December 31, 20162018 and 2015,2017, respectively, compared with a carrying value of $2,296.9$2,689.4 million and $2,321.1$2,274.3 million at December 31, 20162018 and 2015,2017, respectively.
Changes in interest rates may impact the cost of future long-term debt issued by the Company, and as a result, represent interest rate risk to the Company. In May 2017, the Company executed four treasury lock agreements with an aggregate notional value of $275.0 million and a weighted-average interest rate of 2.85%. The purpose of the treasury locks is to hedge the U.S. Treasury benchmark interest rate associated with future interest payments related to the anticipated refinancing of the $275.0 million of 2.35% senior notes due May 15, 2020. The Company has designated the treasury locks as cash flow hedges, and for the year ended December 31, 2018, recognized an unrealized gain of $2.6 million, net of tax, in the consolidated statements of comprehensive income. A hypothetical 100 basis points change in the ten-year U.S. Treasury Rate would result in a change in unrealized gain or loss of approximately $24.0 million. Upon settlement in 2020, the unrealized gain or loss in accumulated other comprehensive income will be amortized to interest expense over the life of the future underlying debt issuance.
Alternatively, changes in interest rates do not affect the fair value of variable rate debt, but affect future earnings and cash flows. The Company's floating-rate indebtedness includes commercial paper borrowings, and any outstanding borrowings under revolving credit facilities. At December 31, 2018, KCS had no commercial paper or revolving credit facility borrowings outstanding. At December 31, 2017, KCS had outstanding commercial paper borrowings of $345.2 million, and no borrowings outstanding under the revolving credit facility.
Commodity Price Sensitivity. KCS periodically participates in diesel fuel purchase commitments and derivative financial instruments. At December 31, 20162018 and 2015,2017, KCS did not have any outstanding fuel derivative financial instruments. The Company also holds fuel inventories for use in operations. These inventories are not material to KCS’s overall financial position. Fuel costs are expected to reflect market conditions in 20172019; however, fuel costs are unpredictable and subject to a variety of factors outside the Company’s control. Assuming annual consumption of 130135 million gallons, a hypothetical 10 cent change in the price per gallon of fuel would cause a $13.0$13.5 million change in operating expenses. KCS mitigates the impact of increased fuel costs through fuel surcharge revenues from customers; however, in a period of volatile fuel prices or changing customer business mix, changes in fuel expense and fuel surcharge revenue may differ.
Foreign Exchange Sensitivity. KCS’s foreign subsidiaries use the U.S. dollar as their functional currency; however, a portion of the foreign subsidiaries’ revenues and expenses areis denominated in Mexican pesos. Based on the volume of revenue and expense transactions denominated in Mexican pesos, revenue and expense fluctuations have historically offset.
The Company has exposure to fluctuations in the value of the Mexican peso against the U.S. dollar due to its net monetary assets and liabilities that are denominated in Mexican pesos. Monetary assets and liabilities include cash, accounts receivable and payable and other items that will convert to cash in the future and are remeasured into dollars using the current exchange rate. The remeasurement and settlement of monetary assets and liabilities is recognized in the consolidated statements of income as foreign exchange gains and losses. At December 31, 2018, the Company had Ps.2,168.4Ps.799.7 million of net monetary assets at December 31, 2016.denominated in Mexican pesos, as monetary assets exceeded monetary liabilities.
The following table presents an estimate of the impactpotential impacts to the consolidated statements of income that would result from a hypothetical change in the exchange rate of one Mexican peso per U.S. dollar at December 31, 20162018:
|
| | | | | | |
| | Hypothetical Change in Exchange Rate | | Amount of Gain (Loss) | | Affected Line Item in the Consolidated Statements of Income |
Net monetary assets denominated in Mexican pesos at December 31, 2016:2018: | | | | | | |
Ps.2,168.4Ps.799.7 million | | From Ps.20.7Ps.19.7 to Ps.21.7Ps.20.7 | | ($4.82.0 million) | | Foreign exchange lossgain (loss) |
Ps.2,168.4Ps.799.7 million | | From Ps.20.7Ps.19.7 to Ps.19.7Ps.18.7 | | $5.32.2 million | | Foreign exchange lossgain (loss) |
Mexican income taxes are paid in Mexican pesos, and as a result, the effective income tax rate reflects fluctuations in the value of the Mexican peso against the U.S. dollar. Most significantly, any gain or loss from the revaluation of the Company’s net U.S. dollar-denominated monetary liabilities into Mexican pesos is included in Mexican taxable income under Mexican tax law. As a result, a strengthening of the Mexican peso against the U.S. dollar for the reporting period will generally increase the Mexican cash tax obligation and the effective income tax rate, and a weakening of the Mexican peso against the U.S. dollar for the reporting period will generally decrease the Mexican cash tax obligation and the effective tax rate.
The following table presents an estimate of the impactpotential impacts to the effective income tax rate and income tax expense that would result from a hypothetical change in the exchange rate of one Mexican peso at December 31, 2016:
|
| | | | | | |
| Hypothetical Change in Exchange Rate | | Increase (Decrease) in Effective Income Tax Rate | | Amount of Expense (Benefit) | | Affected Line Item in the Consolidated Statements of Income |
From Ps.20.7Ps.19.7 to Ps.21.7Ps.20.7 | (2.5% | (1.7%) | | ($16.714.8 million) | | Income tax expense (benefit) |
From Ps.20.7Ps.19.7 to Ps.19.7Ps.18.7 | 2.8% | 1.8% | | $18.416.4 million | | Income tax expense (benefit) |
The Company has executed, and mayexpects to continue to enter intoexecute foreign currency derivative instruments to hedge its exposure to fluctuations in the Mexican cash tax obligation due to changes in the value of the Mexican peso against the U.S. dollar. These derivative instruments have historically offset the effects of foreign currency changes on income tax expense (benefit) resulting in minimal impact to net income.
As ofAt December 31, 2016,2018, the Company had outstanding foreign currency option contracts known as zero-cost collars with an aggregate notional amount of $120.0 million. Given the maturity date of January 2019, the Company believes there was minimal market risk associated with these contracts at December 31, 2018. The zero-cost collars matured in January 2019 and resulted in cash received of $0.3 million.
At December 31, 2018, the Company had outstanding foreign currency forward contracts with an aggregate notional amount of $340.0$20.0 million. These contracts matured on January 17, 2017,mature September 30, 2019, and obligatedobligate the Company to purchase a total of $6,207.7Ps.410.9 million at a weighted-average exchange rate of Ps.18.26Ps. 20.5 to each U.S. dollar.
During January 2017,2019, the Company entered into offsettingseveral foreign currency forward contracts with an aggregate notional amount of $287.0 million.$290.0 million and maturity dates throughout 2019. These offsetting contracts matured on January 17, 2017, and obligatedobligate the Companycompany to sellpurchase a total of Ps.6,207.7Ps.5,754.9 million at a weighted-average exchange rate of Ps.21.63Ps.19.84 to each U.S. dollar.
During January 2017,The following table presents the Companypotential impacts to the consolidated statements of income that would result from a hypothetical change in the exchange rate of one Mexican peso at maturity date for the foreign currency forward contracts outstanding at December 31, 2018 and those entered into foreign currency option contracts known as zero-cost collars with an aggregate notional amount of $380.0 million to hedge its exposure to fluctuations in the Mexican cash tax obligation due to changes in the value of the Mexican peso against the U.S. dollar. The zero-cost collar contracts with an aggregate notional amount of $130.0 million and $250.0 million will mature on April 25, 2017 andduring January 16, 2018, respectively. The zero-cost collar contracts have a weighted-average rate of Ps.21.61 to each U.S. dollar for the Mexican peso call options purchased by KCS and a weighted-average rate of Ps.23.87 to each U.S. dollar for the Mexican peso put options sold by KCS.2019:
|
| | | | | | |
| Aggregate notional amount: | | Hypothetical Change in Exchange Rate | | Amount of Gain (Loss) | | Affected Line Item in the Consolidated Statements of Income |
| $310.0 million | | From Ps.19.9 to Ps.20.9 | | ($14.8 million) | | Foreign exchange gain (loss) |
| $310.0 million | | From Ps.19.9 to Ps.18.9 | | $16.4 million | | Foreign exchange gain (loss) |
The Company has not designated these foreign currency derivative instruments as hedging instruments for accounting purposes. The foreign currency derivative instruments will be measured at fair value each period and any change in fair value will be recognized in foreign exchange gain (loss) within the consolidated statements of income.
| |
| Item 8. | Financial Statements and Supplementary Data |
Index to Consolidated Financial Statements
|
| |
| | Page |
| |
| |
| |
| |
| |
| |
| |
| |
| |
| |
| |
| |
| Financial Statement Schedules: | |
All schedules are omitted because they are not applicable, are insignificant, or the required information is shown in the consolidated financial statements or notes thereto.
Management’s Report on Internal Control over Financial Reporting
The management of Kansas City Southern is responsible for establishing and maintaining adequate internal control over financial reporting as such term is defined in Exchange Act Rules 13a-15(f) and 15d-15(f). under the Securities Exchange Act of 1934, as amended. KCS’s internal control over financial reporting was designed to provide reasonable assurance regarding the reliability of financial reporting and the preparation of financial statements for external purposes in accordance with generally accepted accounting principles.
Because of its inherent limitations, internal control over financial reporting may not prevent or detect misstatements. Also, projections of any evaluation of effectiveness to future periods are subject to the Company’s management and Boardrisk that controls may become inadequate because of Directors regardingchanges in conditions, or that the preparation and fair presentationdegree of published financial statements.
All internal control systems, no matter how well designed, have inherent limitations. Therefore, even those systems determined to be effective can provide only reasonable assurancecompliance with respect to financial statement preparation and presentation.the policies or procedures may deteriorate.
Under the supervision and with the participation of the Company’s Chief Executive Officer and Chief Financial Officer, management conducted an evaluation of the effectiveness of the Company’s internal control over financial reporting as of December 31, 2016,2018, based on the framework established by the Committee of Sponsoring Organizations of the Treadway Commission in Internal Control — Integrated Framework (2013) (commonly referred to as the COSO Framework). Based on its evaluation, management concluded that the Company’s internal control over financial reporting was effective as of December 31, 20162018, based on the criteria outlined in the COSO Framework.
The effectiveness of the Company’s internal control over financial reporting as of December 31, 20162018, has been audited by KPMGPricewaterhouseCoopers LLP, an independent registered public accounting firm, as stated in their attestation report, which immediately follows this report.
Report of Independent Registered Public Accounting Firm
The
To theBoard of Directors and Stockholders
of Kansas City Southern:Southern
Opinions on the Financial Statements and Internal Control over Financial Reporting
We have audited the accompanying consolidated balance sheet of Kansas City Southern’s (the Company)Southern and its subsidiaries(“the Company”)as ofDecember 31, 2018,and the related consolidated statements of income, comprehensive income, changes in equity and cash flows for the year then ended, including the related notes (collectively referred to as the “consolidated financial statements”).We also have audited the Company's internal control over financial reporting as ofDecember 31, 2016,2018, based on criteria established in Internal Control - Integrated Framework(2013)issued by the Committee of Sponsoring Organizations of the Treadway Commission (COSO).
In our opinion, the consolidatedfinancial statements referred to above present fairly, in all material respects, the financial position of the Company as of December 31, 2018, and the results of itsoperations and itscash flows for the year then endedin conformity with accounting principles generally accepted in the United States of America. Also in our opinion, the Company maintained, in all material respects, effective internal control over financial reporting as of December 31, 2018, based on criteria established in Internal Control - Integrated Framework(2013)issued by the COSO.
Basis for Opinions
The Company’sCompany's management is responsible for these consolidated financial statements, for maintaining effective internal control over financial reporting, and for its assessment of the effectiveness of internal control over financial reporting, included in the accompanying Management’sManagement's Report on Internal Control over Financial Reporting. Our responsibility is to express an opinionopinions on the Company’s consolidatedfinancial statements and on the Company's internal control over financial reporting based on our audit. We are a public accounting firm registered with the Public Company Accounting Oversight Board (United States) (PCAOB) and are required to be independent with respect to the Company in accordance with the U.S. federal securities laws and the applicable rules and regulations of the Securities and Exchange Commission and the PCAOB.
We conducted our audit in accordance with the standards of the Public Company Accounting Oversight Board (United States).PCAOB. Those standards require that we plan and perform the audit to obtain reasonable assurance about whether the consolidated financial statements are free of material misstatement, whether due to error or fraud, and whether effective internal control over financial reporting was maintained in all material respects.
Our audit of the consolidatedfinancial statements included performing procedures to assess the risks of material misstatement of the consolidated financial statements, whether due to error or fraud, and performing procedures that respond to those risks. Such procedures included examining, on a test basis, evidence regarding the amounts and disclosures in the consolidated financial statements. Our audit also included evaluating the accounting principles used and significant estimates made by management, as well as evaluating the overall presentation of the consolidated financial statements. Our audit of internal control over financial reporting included obtaining an understanding of internal control over financial reporting, assessing the risk that a material weakness exists, and testing and evaluating the design and operating effectiveness of internal control based on the assessed risk. Our audit also included performing such other procedures as we considered necessary in the circumstances. We believe that our audit provides a reasonable basis for our opinion.opinions.
Definition and Limitations of Internal Control over Financial Reporting
A company’s internal control over financial reporting is a process designed to provide reasonable assurance regarding the reliability of financial reporting and the preparation of financial statements for external purposes in accordance with generally accepted accounting principles. A company’s internal control over financial reporting includes those policies and procedures that (1)(i) pertain to the maintenance of records that, in reasonable detail, accurately and fairly reflect the transactions and dispositions of the assets of the company; (2)(ii) provide reasonable assurance that transactions are recorded as necessary to permit preparation of financial statements in accordance with generally accepted accounting principles, and that receipts and expenditures of the company are being made only in accordance with authorizations of management and directors of the company; and (3)(iii) provide reasonable assurance regarding prevention or timely detection of unauthorized acquisition, use, or disposition of the company’s assets that could have a material effect on the financial statements.
Because of its inherent limitations, internal control over financial reporting may not prevent or detect misstatements. Also, projections of any evaluation of effectiveness to future periods are subject to the risk that controls may become inadequate because of changes in conditions, or that the degree of compliance with the policies or procedures may deteriorate.
In our opinion,
/s/PricewaterhouseCoopers LLP
Kansas City, Southern maintained, in all material respects, effective internal control over financial reportingMissouri
January 25, 2019
We have served as the Company’s auditor since 2017.
Report of Independent Registered Public Accounting Firm
To the Stockholders and Board of Directors
Kansas City Southern:
Opinion on criteria established in Internal Control - Integrated Framework(2013) issued by the Committee of Sponsoring Organizations of the Treadway Commission (COSO).Consolidated Financial Statements
We also have audited in accordance with the standards of the Public Company Accounting Oversight Board (United States), theaccompanying consolidated balance sheetssheet of Kansas City Southern and subsidiaries (the Company) as of December 31, 2016 and 2015,2017, and the related consolidated statements of income, comprehensive income, changes in equity, and cash flows for each of the years in the three-yeartwo-year period ended December 31, 2016, and our report dated January 27, 2017, expressed an unqualified opinion on those consolidated financial statements.
/s/ KPMG LLP
Kansas City, Missouri
January 27, 2017
Report of Independent Registered Public Accounting Firm
The Board of Directors and Stockholders
Kansas City Southern:
We have audited the accompanying consolidated balance sheets of Kansas City Southern and subsidiaries (the Company) as of December 31, 2016 and 2015, and the related notes (collectively, the “consolidated financial statements”). In our opinion, the consolidated financial statements present fairly, in all material respects, the financial position of income, comprehensive income, changes in equity,the Company as of December 31, 2017, and the results of its operations and its cash flows for each of the years in the three-yeartwo-year period ended December 31, 2016. 2017, in conformity with U.S. generally accepted accounting principles.
Basis for Opinion
These consolidated financial statements are the responsibility of the Company’s management. Our responsibility is to express an opinion on these consolidated financial statements based on our audits. We are a public accounting firm registered with the PCAOB and are required to be independent with respect to the Company in accordance with the U.S. federal securities laws and the applicable rules and regulations of the Securities and Exchange Commission and the PCAOB.
We conducted our audits in accordance with the standards of the Public Company Accounting Oversight Board (United States).PCAOB. Those standards require that we plan and perform the audit to obtain reasonable assurance about whether the consolidated financial statements are free of material misstatement. An audit includesmisstatement, whether due to error or fraud. Our audits included performing procedures to assess the risks of material misstatement of the consolidated financial statements, whether due to error or fraud, and performing procedures that respond to those risks. Such procedures included examining, on a test basis, evidence supportingregarding the amounts and disclosures in the consolidated financial statements. An auditOur audits also includes assessingincluded evaluating the accounting principles used and significant estimates made by management, as well as evaluating the overall presentation of the consolidated financial statement presentation.statements. We believe that our audits provide a reasonable basis for our opinion.
In our opinion, the consolidated financial statements referred to above present fairly, in all material respects, the financial position of Kansas City Southern and subsidiaries as of December 31, 2016 and 2015, and the results of their operations and their cash flows for each of the years in the three-year period ended December 31, 2016, in conformity with U.S. generally accepted accounting principles.
We also have audited, in accordance with the standards of the Public Company Accounting Oversight Board (United States), Kansas City Southern’s internal control over financial reporting as of December 31, 2016, based on criteria established in Internal Control - Integrated Framework (2013) issued by the Committee of Sponsoring Organizations of the Treadway Commission (COSO), and our report dated January 27, 2017 expressed an unqualified opinion on the effectiveness of the Company’s internal control over financial reporting.
/s/ KPMG LLP
We have served as the Company’s auditor from 2001 to 2018.
Kansas City, Missouri
January 27, 201726, 2018
Kansas City Southern and Subsidiaries
Consolidated Statements of Income
Years Ended December 31,
|
| | | | | | | | | | | |
| | 2016 | | 2015 | | 2014 |
| | (In millions, except share and per share amounts) |
| Revenues | $ | 2,334.2 |
| | $ | 2,418.8 |
| | $ | 2,577.1 |
|
| Operating expenses: | | | | | |
| Compensation and benefits | 462.4 |
| | 442.2 |
| | 474.5 |
|
| Purchased services | 208.5 |
| | 223.0 |
| | 245.2 |
|
| Fuel | 253.8 |
| | 306.9 |
| | 415.9 |
|
| Mexican fuel excise tax credit | (62.8 | ) | | — |
| | — |
|
| Equipment costs | 120.0 |
| | 119.4 |
| | 119.2 |
|
| Depreciation and amortization | 305.0 |
| | 284.6 |
| | 258.1 |
|
| Materials and other | 228.8 |
| | 229.3 |
| | 216.8 |
|
| Lease termination costs | — |
| | 9.6 |
| | 38.3 |
|
| Total operating expenses | 1,515.7 |
| | 1,615.0 |
| | 1,768.0 |
|
| Operating income | 818.5 |
| | 803.8 |
| | 809.1 |
|
| Equity in net earnings of affiliates | 14.6 |
| | 18.3 |
| | 21.1 |
|
| Interest expense | (97.7 | ) | | (81.9 | ) | | (72.8 | ) |
| Debt retirement and exchange costs | — |
| | (7.6 | ) | | (6.6 | ) |
| Foreign exchange loss | (72.0 | ) | | (56.6 | ) | | (35.5 | ) |
| Other expense, net | (0.7 | ) | | (3.4 | ) | | (2.2 | ) |
| Income before income taxes | 662.7 |
| | 672.6 |
| | 713.1 |
|
| Income tax expense | 182.8 |
| | 187.3 |
| | 208.8 |
|
| Net income | 479.9 |
| | 485.3 |
| | 504.3 |
|
| Less: Net income attributable to noncontrolling interest | 1.8 |
| | 1.8 |
| | 1.7 |
|
| Net income attributable to Kansas City Southern and subsidiaries | 478.1 |
| | 483.5 |
| | 502.6 |
|
| Preferred stock dividends | 0.2 |
| | 0.2 |
| | 0.2 |
|
| Net income available to common stockholders | $ | 477.9 |
| | $ | 483.3 |
| | $ | 502.4 |
|
| | | | | | |
| Earnings per share: | |
| Basic earnings per share | $ | 4.44 |
| | $ | 4.41 |
| | $ | 4.56 |
|
| Diluted earnings per share | $ | 4.43 |
| | $ | 4.40 |
| | $ | 4.55 |
|
| | | | | | |
Average shares outstanding (in thousands): | | | | | |
| Basic | 107,560 |
| | 109,709 |
| | 110,163 |
|
| Potentially dilutive common shares | 201 |
| | 206 |
| | 270 |
|
| Diluted | 107,761 |
| | 109,915 |
| | 110,433 |
|
See accompanying notes to consolidated financial statements.
50
Kansas City Southern and Subsidiaries
Consolidated Statements of Comprehensive Income
Years Ended December 31,
|
| | | | | | | | | | | |
| | 2016 | | 2015 | | 2014 |
| | (In millions) |
| Net income | $ | 479.9 |
| | $ | 485.3 |
| | $ | 504.3 |
|
| Other comprehensive loss: | | | | | |
| Reclassification adjustment from cash flow hedges included in net income, net of tax of less than $0.1 million | — |
| | — |
| | 0.1 |
|
| Amortization of prior service credit, net of tax of less than $(0.1) million and $(0.1) million | — |
| | (0.1 | ) | | (0.2 | ) |
| Foreign currency translation adjustments, net of tax of $(1.0) million, $(0.8) million and $(0.7) million | (1.5 | ) | | (1.4 | ) | | (1.1 | ) |
| Other comprehensive loss | (1.5 | ) | | (1.5 | ) | | (1.2 | ) |
| Comprehensive income | 478.4 |
| | 483.8 |
| | 503.1 |
|
| Less: comprehensive income attributable to noncontrolling interest | 1.8 |
| | 1.8 |
| | 1.7 |
|
| Comprehensive income attributable to Kansas City Southern and subsidiaries | $ | 476.6 |
| | $ | 482.0 |
| | $ | 501.4 |
|
See accompanying notes to consolidated financial statements.
51
Kansas City Southern and Subsidiaries
Consolidated Balance Sheets
December 31,
|
| | | | | | | |
| | 2016 | | 2015 |
| | (In millions, except share and per share amounts) |
| ASSETS | | | |
| Current assets: | | | |
| Cash and cash equivalents | $ | 170.6 |
| | $ | 136.6 |
|
| Accounts receivable, net | 191.0 |
| | 171.9 |
|
| Materials and supplies | 152.6 |
| | 137.9 |
|
| Other current assets | 133.8 |
| | 90.6 |
|
| Total current assets | 648.0 |
| | 537.0 |
|
| Investments | 32.9 |
| | 34.7 |
|
| Property and equipment (including concession assets), net | 8,069.7 |
| | 7,705.4 |
|
| Other assets | 66.9 |
| | 63.9 |
|
| Total assets | $ | 8,817.5 |
| | $ | 8,341.0 |
|
| LIABILITIES AND EQUITY | | | |
| Current liabilities: | | | |
| Long-term debt due within one year | $ | 25.4 |
| | $ | 276.1 |
|
| Short-term borrowings | 181.3 |
| | 80.0 |
|
| Accounts payable and accrued liabilities | 537.7 |
| | 401.5 |
|
| Total current liabilities | 744.4 |
| | 757.6 |
|
| Long-term debt | 2,271.5 |
| | 2,045.0 |
|
| Deferred income taxes | 1,289.3 |
| | 1,191.1 |
|
| Other noncurrent liabilities and deferred credits | 107.8 |
| | 122.6 |
|
| Total liabilities | 4,413.0 |
| | 4,116.3 |
|
| Stockholders’ equity: | | | |
| $25 par, 4% noncumulative, preferred stock, 840,000 shares authorized, 649,736 shares issued, 242,170 shares outstanding | 6.1 |
| | 6.1 |
|
| $.01 par, common stock, 400,000,000 shares authorized, 123,352,185 shares issued; 106,606,619 and 108,461,144 shares outstanding at December 31, 2016 and 2015, respectively | 1.1 |
| | 1.1 |
|
| Additional paid-in capital | 954.8 |
| | 947.1 |
|
| Retained earnings | 3,134.1 |
| | 2,964.7 |
|
| Accumulated other comprehensive loss | (6.2 | ) | | (4.7 | ) |
| Total stockholders’ equity | 4,089.9 |
| | 3,914.3 |
|
| Noncontrolling interest | 314.6 |
| | 310.4 |
|
| Total equity | 4,404.5 |
| | 4,224.7 |
|
| Total liabilities and equity | $ | 8,817.5 |
| | $ | 8,341.0 |
|
See accompanying notes to consolidated financial statements.
52
Kansas City Southern and Subsidiaries
Consolidated Statements of Cash Flows
|
| | | | | | | | | | | |
| | 2016 | | 2015 | | 2014 |
| (In millions) |
| Operating activities: | | | | | |
| Net income | $ | 479.9 |
| | $ | 485.3 |
| | $ | 504.3 |
|
| Adjustments to reconcile net income to net cash provided by operating activities: | | | | | |
| Depreciation and amortization | 305.0 |
| | 284.6 |
| | 258.1 |
|
| Deferred income taxes | 104.8 |
| | 135.8 |
| | 140.1 |
|
| Equity in net earnings of affiliates | (14.6 | ) | | (18.3 | ) | | (21.1 | ) |
| Share-based compensation | 19.2 |
| | 11.4 |
| | 10.0 |
|
| Excess tax benefit from share-based compensation | (5.7 | ) | | 0.1 |
| | 0.7 |
|
| Distributions from unconsolidated affiliates | 13.0 |
| | 16.5 |
| | 25.5 |
|
| Debt retirement and exchange costs | — |
| | 7.6 |
| | 6.6 |
|
| Unrealized loss on foreign currency derivative instruments | 41.1 |
| | 46.0 |
| | 4.3 |
|
| Mexican fuel excise tax credit | (62.8 | ) | | — |
| | — |
|
| Changes in working capital items: | | | | | |
| Accounts receivable | (18.3 | ) | | 12.0 |
| | 17.2 |
|
| Materials and supplies | (14.2 | ) | | (26.2 | ) | | 9.2 |
|
| Other current assets | 9.9 |
| | (10.1 | ) | | (10.0 | ) |
| Accounts payable and accrued liabilities | 55.8 |
| | (31.4 | ) | | (26.1 | ) |
| Other, net | 0.2 |
| | (4.0 | ) | | (12.8 | ) |
| Net cash provided by operating activities | 913.3 |
| | 909.3 |
| | 906.0 |
|
| Investing activities: | | | | | |
| Capital expenditures | (563.9 | ) | | (688.0 | ) | | (668.2 | ) |
| Purchase or replacement of equipment under operating leases | (26.6 | ) | | (144.2 | ) | | (302.1 | ) |
| Property investments in MSLLC | (33.1 | ) | | (17.4 | ) | | (26.7 | ) |
| Other, net | (4.6 | ) | | (23.4 | ) | | 14.1 |
|
| Net cash used for investing activities | (628.2 | ) | | (873.0 | ) | | (982.9 | ) |
| Financing activities: | | | | | |
| Proceeds from short-term borrowings | 8,698.7 |
| | 10,866.2 |
| | 15,368.8 |
|
| Repayment of short-term borrowings | (8,597.9 | ) | | (11,237.3 | ) | | (14,920.2 | ) |
| Proceeds from issuance of long-term debt | 248.7 |
| | 623.7 |
| | 175.0 |
|
| Repayment of long-term debt | (276.4 | ) | | (149.8 | ) | | (508.0 | ) |
| Dividends paid | (142.8 | ) | | (140.1 | ) | | (116.6 | ) |
| Shares repurchased | (185.4 | ) | | (194.2 | ) | | — |
|
| Debt costs | (2.6 | ) | | (20.3 | ) | | (4.9 | ) |
| Excess tax benefit from share-based compensation | 5.7 |
| | (0.1 | ) | | (0.7 | ) |
| Proceeds from employee stock plans | 0.9 |
| | 4.2 |
| | 2.0 |
|
| Net cash used for financing activities | (251.1 | ) | | (247.7 | ) | | (4.6 | ) |
| Cash and cash equivalents: | | | | | |
| Net increase (decrease) during each year | 34.0 |
| | (211.4 | ) | | (81.5 | ) |
| At beginning of year | 136.6 |
| | 348.0 |
| | 429.5 |
|
| At end of year | $ | 170.6 |
| | $ | 136.6 |
| | $ | 348.0 |
|
| Supplemental cash flow information | | | | | |
| Non-cash investing and financing activities: | | | | | |
| Capital expenditures and purchase or replacement of equipment under operating lease accrued but not yet paid at end of year | $ | 64.0 |
| | $ | 43.9 |
| | $ | 83.2 |
|
| Capital lease obligations incurred | 2.4 |
| | 4.7 |
| | 9.1 |
|
| Non-cash asset acquisitions | 4.8 |
| | 7.6 |
| | 5.9 |
|
| Dividends accrued but not yet paid at end of year | 35.2 |
| | 35.9 |
| | 31.0 |
|
| Cash payments: | | | | | |
| Interest paid, net of amounts capitalized | $ | 84.3 |
| | $ | 81.1 |
| | $ | 72.5 |
|
| Income tax payments, net of refunds | 40.5 |
| | 40.3 |
| | 62.9 |
|
|
| | | | | | | | | | | |
| | 2018 | | 2017 | | 2016 |
| | (In millions, except share and per share amounts) |
| Revenues | $ | 2,714.0 |
| | $ | 2,582.9 |
| | $ | 2,334.2 |
|
| Operating expenses: | | | | | |
| Compensation and benefits | 495.7 |
| | 493.8 |
| | 462.4 |
|
| Purchased services | 200.7 |
| | 193.7 |
| | 208.5 |
|
| Fuel | 348.2 |
| | 316.1 |
| | 253.8 |
|
| Mexican fuel excise tax credit | (37.7 | ) | | (44.1 | ) | | (62.8 | ) |
| Equipment costs | 126.1 |
| | 129.2 |
| | 120.0 |
|
| Depreciation and amortization | 346.7 |
| | 320.9 |
| | 305.0 |
|
| Materials and other | 265.9 |
| | 251.7 |
| | 228.8 |
|
| Gain on insurance recoveries related to hurricane damage | (17.9 | ) | | — |
| | — |
|
| Total operating expenses | 1,727.7 |
| | 1,661.3 |
| | 1,515.7 |
|
| Operating income | 986.3 |
| | 921.6 |
| | 818.5 |
|
| Equity in net earnings of affiliates | 2.6 |
| | 11.5 |
| | 14.6 |
|
| Interest expense | (110.0 | ) | | (100.2 | ) | | (97.7 | ) |
| Debt retirement costs | (2.2 | ) | | — |
| | — |
|
| Foreign exchange gain (loss) | 7.8 |
| | 41.7 |
| | (72.0 | ) |
| Other income (expense), net | 2.4 |
| | (0.3 | ) | | (0.7 | ) |
| Income before income taxes | 886.9 |
| | 874.3 |
| | 662.7 |
|
| Income tax expense (benefit) | 257.5 |
| | (89.6 | ) | | 182.8 |
|
| Net income | 629.4 |
| | 963.9 |
| | 479.9 |
|
| Less: Net income attributable to noncontrolling interest | 2.0 |
| | 1.9 |
| | 1.8 |
|
| Net income attributable to Kansas City Southern and subsidiaries | 627.4 |
| | 962.0 |
| | 478.1 |
|
| Preferred stock dividends | 0.2 |
| | 0.2 |
| | 0.2 |
|
| Net income available to common stockholders | $ | 627.2 |
| | $ | 961.8 |
| | $ | 477.9 |
|
| | | | | | |
| Earnings per share: | |
| Basic earnings per share | $ | 6.16 |
| | $ | 9.18 |
| | $ | 4.44 |
|
| Diluted earnings per share | $ | 6.13 |
| | $ | 9.16 |
| | $ | 4.43 |
|
| | | | | | |
Average shares outstanding (in thousands): | | | | | |
| Basic | 101,852 |
| | 104,728 |
| | 107,560 |
|
| Potentially dilutive common shares | 418 |
| | 312 |
| | 201 |
|
| Diluted | 102,270 |
| | 105,040 |
| | 107,761 |
|
See accompanying notes to consolidated financial statements.
53
Kansas City Southern and Subsidiaries
Consolidated Statements of Comprehensive Income
Years Ended December 31,
|
| | | | | | | | | | | |
| | 2018 | | 2017 | | 2016 |
| | (In millions) |
| Net income | $ | 629.4 |
| | $ | 963.9 |
| | $ | 479.9 |
|
| Other comprehensive income (loss): | | | | | |
| Unrealized gain (loss) on interest rate derivative instruments during the period, net of tax of $1.0 million and $(2.2) million | 2.6 |
| | (3.4 | ) | | — |
|
| Foreign currency translation adjustments, net of tax of $3.8 million and $(1.0) million for 2017 and 2016 | 0.1 |
| | (3.3 | ) | | (1.5 | ) |
| Other comprehensive income (loss) | 2.7 |
| | (6.7 | ) | | (1.5 | ) |
| Comprehensive income | 632.1 |
| | 957.2 |
| | 478.4 |
|
| Less: comprehensive income attributable to noncontrolling interest | 2.0 |
| | 1.9 |
| | 1.8 |
|
| Comprehensive income attributable to Kansas City Southern and subsidiaries | $ | 630.1 |
| | $ | 955.3 |
| | $ | 476.6 |
|
See accompanying notes to consolidated financial statements.
54
Kansas City Southern and Subsidiaries
Consolidated Balance Sheets
December 31,
|
| | | | | | | |
| | 2018 | | 2017 |
| | (In millions, except share and per share amounts) |
| ASSETS | | | |
| Current assets: | | | |
| Cash and cash equivalents | $ | 100.5 |
| | $ | 134.1 |
|
| Accounts receivable, net | 301.2 |
| | 237.8 |
|
| Materials and supplies | 160.3 |
| | 150.8 |
|
| Other current assets | 73.4 |
| | 157.4 |
|
| Total current assets | 635.4 |
| | 680.1 |
|
| Investments | 44.9 |
| | 44.6 |
|
| Property and equipment (including concession assets), net | 8,691.1 |
| | 8,403.8 |
|
| Other assets | 98.4 |
| | 70.2 |
|
| Total assets | $ | 9,469.8 |
| | $ | 9,198.7 |
|
| LIABILITIES AND EQUITY | | | |
| Current liabilities: | | | |
| Long-term debt due within one year | $ | 10.1 |
| | $ | 38.8 |
|
| Short-term borrowings | — |
| | 345.1 |
|
| Accounts payable and accrued liabilities | 436.9 |
| | 587.8 |
|
| Total current liabilities | 447.0 |
| | 971.7 |
|
| Long-term debt | 2,679.3 |
| | 2,235.5 |
|
| Deferred income taxes | 1,079.9 |
| | 987.2 |
|
| Other noncurrent liabilities and deferred credits | 130.9 |
| | 138.9 |
|
| Total liabilities | 4,337.1 |
| | 4,333.3 |
|
| Stockholders’ equity: | | | |
| $25 par, 4% noncumulative, preferred stock, 840,000 shares authorized, 649,736 shares issued; 228,395 and 242,170 shares outstanding at December 31, 2018 and 2017, respectively | 5.7 |
| | 6.1 |
|
| $.01 par, common stock, 400,000,000 shares authorized, 123,352,185 shares issued; 100,896,678 and 103,036,805 shares outstanding at December 31, 2018 and 2017, respectively | 1.0 |
| | 1.0 |
|
| Additional paid-in capital | 946.6 |
| | 943.3 |
|
| Retained earnings | 3,870.6 |
| | 3,611.4 |
|
| Accumulated other comprehensive loss | (10.9 | ) | | (12.9 | ) |
| Total stockholders’ equity | 4,813.0 |
| | 4,548.9 |
|
| Noncontrolling interest | 319.7 |
| | 316.5 |
|
| Total equity | 5,132.7 |
| | 4,865.4 |
|
| Total liabilities and equity | $ | 9,469.8 |
| | $ | 9,198.7 |
|
See accompanying notes to consolidated financial statements.
55
Kansas City Southern and Subsidiaries
Consolidated Statements of Cash Flows
|
| | | | | | | | | | | |
| | 2018 | | 2017 | | 2016 |
| | (In millions) |
| Operating activities: | | | | | |
| Net income | $ | 629.4 |
| | $ | 963.9 |
| | $ | 479.9 |
|
| Adjustments to reconcile net income to net cash provided by operating activities: | | | | | |
| Depreciation and amortization | 346.7 |
| | 320.9 |
| | 305.0 |
|
| Deferred income taxes | 91.7 |
| | (301.3 | ) | | 104.8 |
|
| Equity in net earnings of affiliates | (2.6 | ) | | (11.5 | ) | | (14.6 | ) |
| Share-based compensation | 20.4 |
| | 18.2 |
| | 19.2 |
|
| Distributions from affiliates | 5.5 |
| | 12.5 |
| | 13.0 |
|
| Settlement of foreign currency derivative instruments | 13.9 |
| | (10.8 | ) | | (58.4 | ) |
| (Gain) loss on foreign currency derivative instruments | (6.3 | ) | | (38.2 | ) | | 53.5 |
|
| Mexican fuel excise tax credit | (37.7 | ) | | (44.1 | ) | | (62.8 | ) |
| Gain on insurance recoveries related to hurricane damage | (17.9 | ) | | — |
| | — |
|
| Insurance proceeds related to hurricane damage | 17.9 |
| | — |
| | — |
|
| Deemed mandatory repatriation tax | (18.7 | ) | | 41.3 |
| | — |
|
| Changes in working capital items: | | | | | |
| Accounts receivable | (68.4 | ) | | (46.7 | ) | | (18.3 | ) |
| Materials and supplies | (4.5 | ) | | 1.4 |
| | (14.2 | ) |
| Other current assets | (3.4 | ) | | (24.5 | ) | | 9.9 |
|
| Accounts payable and accrued liabilities | (18.2 | ) | | 160.4 |
| | 101.8 |
|
| Other, net | (2.1 | ) | | (13.1 | ) | | 0.2 |
|
| Net cash provided by operating activities | 945.7 |
| | 1,028.4 |
| | 919.0 |
|
| Investing activities: | | | | | |
| Capital expenditures | (520.3 | ) | | (585.4 | ) | | (563.6 | ) |
| Purchase or replacement of equipment under operating leases | (98.9 | ) | | (42.6 | ) | | (26.6 | ) |
| Property investments in MSLLC | (26.1 | ) | | (26.0 | ) | | (33.1 | ) |
| Investments in and advances to affiliates | (19.2 | ) | | (20.4 | ) | | (0.9 | ) |
| Insurance proceeds related to hurricane damage | 7.6 |
| | — |
| | — |
|
| Proceeds from disposal of property | 8.7 |
| | 8.8 |
| | 5.0 |
|
| Other, net | (3.7 | ) | | (15.5 | ) | | (9.0 | ) |
| Net cash used for investing activities | (651.9 | ) | | (681.1 | ) | | (628.2 | ) |
| Financing activities: | | | | | |
| Net short-term borrowings | (348.1 | ) | | 159.0 |
| | 100.8 |
|
| Proceeds from issuance of long-term debt | 499.4 |
| | — |
| | 248.7 |
|
| Repayment of long-term debt | (81.5 | ) | | (25.4 | ) | | (276.4 | ) |
| Dividends paid | (147.5 | ) | | (142.5 | ) | | (142.8 | ) |
| Shares repurchased | (243.5 | ) | | (375.6 | ) | | (185.4 | ) |
| Debt issuance and retirement costs paid | (8.0 | ) | | — |
| | (2.6 | ) |
| Proceeds from employee stock plans | 1.8 |
| | 0.7 |
| | 0.9 |
|
| Net cash used for financing activities | (327.4 | ) | | (383.8 | ) | | (256.8 | ) |
| Cash and cash equivalents: | | | | | |
| Net increase (decrease) during each year | (33.6 | ) | | (36.5 | ) | | 34.0 |
|
| At beginning of year | 134.1 |
| | 170.6 |
| | 136.6 |
|
| At end of year | $ | 100.5 |
| | $ | 134.1 |
| | $ | 170.6 |
|
| Supplemental cash flow information | | | | | |
| Non-cash investing and financing activities: | | | | | |
| Capital expenditures and purchase or replacement of equipment under operating lease accrued but not yet paid at end of year | $ | 26.9 |
| | $ | 34.9 |
| | $ | 60.8 |
|
| Other investing activities accrued but not yet paid at the end of the year | 60.6 |
| | 56.7 |
| | 38.3 |
|
| Capital lease obligations incurred | — |
| | 0.1 |
| | 2.4 |
|
| Non-cash asset acquisitions | 0.7 |
| | 0.1 |
| | 4.8 |
|
| Dividends accrued but not yet paid at end of year | 36.6 |
| | 37.2 |
| | 35.2 |
|
| Cash payments: | | | | | |
| Interest paid, net of amounts capitalized | $ | 105.0 |
| | $ | 97.9 |
| | $ | 84.3 |
|
| Income tax payments, net of refunds | 221.0 |
| | 51.1 |
| | 40.5 |
|
See accompanying notes to consolidated financial statements.
56
Kansas City Southern and Subsidiaries
Consolidated Statements of Changes in Equity
(in millions, except per share amounts)
| | | | td5 Par Preferred Stock | | $.01 Par Common Stock | | Additional Paid-in Capital | | Retained Earnings | | Accumulated Other Comprehensive Income (Loss) | | Non- controlling Interest | | Total | td5 Par Preferred Stock | | $.01 Par Common Stock | | Additional Paid-in Capital | | Retained Earnings | | Accumulated Other Comprehensive Loss | | Non- controlling Interest | | Total |
| |
| | | |
| Balance at December 31, 2013 | $ | 6.1 |
| | $ | 1.1 |
| | $ | 942.5 |
| | $ | 2,422.9 |
| | $ | (2.0 | ) | | $ | 306.0 |
| | $ | 3,676.6 |
| |
| Net income | | | | | | | 502.6 |
| | | | 1.7 |
| | 504.3 |
| |
| Other comprehensive loss |
|
| |
|
| |
|
| |
|
| | (1.2 | ) | |
|
| | (1.2 | ) | |
| Contributions from noncontrolling interest | | | | | | | | | | | 0.9 |
| | 0.9 |
| |
| Dividends on common stock ($1.12/share) | | | | | | | (123.6 | ) | | | | | | (123.6 | ) | |
| Dividends on $25 par preferred stock ($1.00/share) | | | | | | | (0.2 | ) | | | | | | (0.2 | ) | |
| Options exercised and stock subscribed, net of shares withheld for employee taxes | | | | | (2.0 | ) | | | | | | | | (2.0 | ) | |
| Excess tax benefit from share-based compensation | | | | | (0.7 | ) | | | | | | | | (0.7 | ) | |
| Share-based compensation | | | | | 10.0 |
| | | | | | | | 10.0 |
| |
| Balance at December 31, 2014 | 6.1 |
| | 1.1 |
| | 949.8 |
| | 2,801.7 |
| | (3.2 | ) | | 308.6 |
| | 4,064.1 |
| |
| Net income | | | | | | | 483.5 |
| | | | 1.8 |
| | 485.3 |
| |
| Other comprehensive loss |
|
| |
|
| |
|
| |
|
| | (1.5 | ) | |
|
| | (1.5 | ) | |
| Dividends on common stock ($1.32/share) | | | | | | | (144.8 | ) | | | | | | (144.8 | ) | |
| Dividends on $25 par preferred stock ($1.00/share) | | | | | | | (0.2 | ) | | | | | | (0.2 | ) | |
| Share repurchases | | | | | (18.7 | ) | | (175.5 | ) | | | | | | (194.2 | ) | |
| Options exercised and stock subscribed, net of shares withheld for employee taxes | | | | | 4.7 |
| | | | | | | | 4.7 |
| |
| Excess tax benefit from share-based compensation | | | | | (0.1 | ) | | | | | | | | (0.1 | ) | |
| Share-based compensation | | | | | 11.4 |
| | | | | | | | 11.4 |
| |
| Balance at December 31, 2015 | 6.1 |
| | 1.1 |
| | 947.1 |
| | 2,964.7 |
| | (4.7 | ) | | 310.4 |
| | 4,224.7 |
| $ | 6.1 |
| | $ | 1.1 |
| | $ | 947.1 |
| | $ | 2,964.7 |
| | $ | (4.7 | ) | | $ | 310.4 |
| | $ | 4,224.7 |
|
| Net income | | | | | | | 478.1 |
| | | | 1.8 |
| | 479.9 |
| | | | | | | 478.1 |
| | | | 1.8 |
| | 479.9 |
|
| Other comprehensive loss |
|
| |
|
| |
|
| | | | (1.5 | ) | |
|
| | (1.5 | ) |
|
| |
|
| |
|
| |
|
| | (1.5 | ) | |
|
| | (1.5 | ) |
| Contributions from noncontrolling interest | | | | | | | | | | | 2.4 |
| | 2.4 |
| | | | | | | | | | | 2.4 |
| | 2.4 |
|
| Dividends on common stock ($1.32/share) | | | | | | | (141.9 | ) | | | | | | (141.9 | ) | | | | | | | (141.9 | ) | | | | | | (141.9 | ) |
| Dividends on $25 par preferred stock ($1.00/share) | | | | | | | (0.2 | ) | | | | | | (0.2 | ) | | | | | | | (0.2 | ) | | | | | | (0.2 | ) |
| Share repurchases | | | | | (18.8 | ) | | (166.6 | ) | | | | | | (185.4 | ) | | | | | (18.8 | ) | | (166.6 | ) | | | | | | (185.4 | ) |
| Options exercised and stock subscribed, net of shares withheld for employee taxes | | | | | 1.6 |
| | | | | | | | 1.6 |
| | | | | 1.6 |
| | | | | | | | 1.6 |
|
| Excess tax benefit from share-based compensation | | | | | 5.7 |
| | | | | | | | 5.7 |
| | | | | 5.7 |
| | | | | | | | 5.7 |
|
| Share-based compensation | | | | | 19.2 |
| | | | | | | | 19.2 |
| | | | | 19.2 |
| | | | | | | | 19.2 |
|
| Balance at December 31, 2016 | $ | 6.1 |
| | $ | 1.1 |
| | $ | 954.8 |
| | $ | 3,134.1 |
| | $ | (6.2 | ) | | $ | 314.6 |
| | $ | 4,404.5 |
| 6.1 |
| | 1.1 |
| | 954.8 |
| | 3,134.1 |
| | (6.2 | ) | | 314.6 |
| | 4,404.5 |
|
| Cumulative-effect adjustment due to adoption of ASU 2016-09, Improvements to Employee Share-Based Payment Accounting | | | | | | 1.3 |
| | 1.2 |
| | | | | | 2.5 |
|
| Net income | | | | | | | | 962.0 |
| | | | 1.9 |
| | 963.9 |
|
| Other comprehensive loss | |
|
| |
|
| |
|
| |
|
| | (6.7 | ) | |
|
| | (6.7 | ) |
| Dividends on common stock ($1.38/share) | | | | | | | | (144.2 | ) | | | | | | (144.2 | ) |
| Dividends on $25 par preferred stock ($1.00/share) | | | | | | | | (0.2 | ) | | | | | | (0.2 | ) |
| Share repurchases | | | | (0.1 | ) | | (34.0 | ) | | (341.5 | ) | | | | | | (375.6 | ) |
| Options exercised and stock subscribed, net of shares withheld for employee taxes | | | | | | 3.0 |
| | | | | | | | 3.0 |
|
| Share-based compensation | | | | | | 18.2 |
| | | | | | | | 18.2 |
|
| Balance at December 31, 2017 | | 6.1 |
| | 1.0 |
| | 943.3 |
| | 3,611.4 |
| | (12.9 | ) | | 316.5 |
| | 4,865.4 |
|
| Reclassification due to adoption of ASU 2018-02, Reclassification of Certain Tax Effects from Accumulated Other Comprehensive Income | | | | | | | | 0.7 |
| | (0.7 | ) | | | | — |
|
| Net income | | | | | | | | 627.4 |
| | | | 2.0 |
| | 629.4 |
|
| Other comprehensive income | |
|
| |
|
| |
|
| | | | 2.7 |
| |
|
| | 2.7 |
|
| Contributions from noncontrolling interest | | | | | | | | | | | | 1.2 |
| | 1.2 |
|
| Dividends on common stock ($1.44/share) | | | | | | | | (146.7 | ) | | | | | | (146.7 | ) |
| Dividends on $25 par preferred stock ($1.00/share) | | | | | | | | (0.2 | ) | | | | | | (0.2 | ) |
| Share repurchases | | (0.4 | ) | | — |
| | (21.1 | ) | | (222.0 | ) | | | | | | (243.5 | ) |
| Options exercised and stock subscribed, net of shares withheld for employee taxes | | | | | | 4.0 |
| | | | | | | | 4.0 |
|
| Share-based compensation | | | | | | 20.4 |
| |
| | | | | | 20.4 |
|
| Balance at December 31, 2018 | | $ | 5.7 |
| | $ | 1.0 |
| | $ | 946.6 |
| | $ | 3,870.6 |
| | $ | (10.9 | ) | | $ | 319.7 |
| | $ | 5,132.7 |
|
See accompanying notes to consolidated financial statements.
5457
Kansas City Southern and Subsidiaries
Notes to Consolidated Financial Statements
Note 1. Description of the Business
Kansas City Southern (“KCS” or the “Company”), a Delaware corporation, is a holding company with principal operations in rail transportation.
The Company is engaged primarily in the freight rail transportation business operating through a single coordinated rail network under one reportable business segment. The Company generates revenues and cash flows by providing its customers with freight delivery services both within its regions, and throughout North America through connections with other Class I rail carriers. KCS’s customers conduct business in a number of different industries, including electric-generating utilities, chemical and petroleum products, paper and forest products, agriculture and mineral products, automotive products and intermodal transportation.
The primary subsidiaries of the Company consist of the following:
The Kansas City Southern Railway Company (“KCSR”), a wholly-owned consolidated subsidiary. KCSR is a U.S. Class I railroad that services the midwest and southeast regions of the United States;
Kansas City Southern de México, S.A. de C.V. (“KCSM”), a wholly-owned consolidated subsidiary which operates under the rights granted by the Concession acquired from the Mexican government in 1997 (the “Concession”) as described below;
Mexrail, Inc. (“Mexrail”), a wholly-owned consolidated subsidiary; which wholly owns The Texas Mexican Railway Company (“Tex-Mex”);
KCSM Servicios, S.A. de C.V. (“KCSM Servicios”), a wholly-owned consolidated subsidiary which provides employee services to KCSM; and
Meridian Speedway, LLC (“MSLLC”), a seventy percent-owned consolidated affiliate. MSLLC owns the former KCSR rail line between Meridian, Mississippi and Shreveport, Louisiana, which is the portion of the rail line between Dallas, Texas and Meridian known as the “Meridian Speedway”.
Including equity investments in:
Panama Canal Railway Company (“PCRC”), a fifty percent-owned unconsolidated affiliate which provides ocean to ocean freight and passenger services along the Panama Canal;
TFCM, S. de R.L. de C.V. (“TCM”), a forty-five percent-owned unconsolidated affiliate that operates a bulk liquid terminal in San Luis Potosí, Mexico;
Ferrocarril y Terminal del Valle de México, S.A. de C.V. (“FTVM”), a twenty-five percent-owned unconsolidated affiliate that provides railroad services as well as ancillary services in the greater Mexico City area; and
PTC-220, LLC (“PTC-220”), a fourteen percent-owned unconsolidated affiliate that holds the licenses to large blocks of radio spectrum and other assets for the deployment of positive train control.
The KCSM Concession. KCSM holds a concession from the Mexican government until June 2047 (exclusive service through 2027, subject to certain trackage and haulage rights granted to other concessionaires), which is renewable under certain conditions for an additional periodperiods of up to 50 years (the “Concession”). The Concession is to provide freight transportation services over north-east rail lines which are a primary commercial corridor of the Mexican railroad system. KCSM has the right to use, but does not own, all track and buildings that are necessary for the rail lines’ operation. KCSM is required to pay the Mexican government an annual concession duty equal to 1.25% of gross revenues during the Concession period.
Employees and Labor Relations. KCSR participates in industry-wide multi-employer bargaining as a member of the National Carriers’ Conference Committee, as well as local bargaining for agreements that are limited to KCSR's property. Approximately 75% of KCSR employees are covered by collective bargaining agreements.
Kansas City Southern and Subsidiaries
Notes to Consolidated Financial Statements-(Continued)
KCSM Servicios union employees are covered by one labor agreement, which was signed on April 16, 2012, between KCSM Servicios and the Sindicato de Trabajadores Ferrocarrileros de la República Mexicana (“Mexican Railroad Union”), for an indefiniteand which remains in effect during the period of time,the Concession, for the purpose of regulating the relationship between the parties. Approximately 80% of KCSM Servicios employees are covered by this labor agreement.
Union labor negotiations have not historically resulted in any strike, boycott, or other disruption in the Company’s business operations.
Kansas City Southern and Subsidiaries
Notes to Consolidated Financial Statements-(Continued)
Note 2. Significant Accounting Policies
Principles of Consolidation. The accompanying consolidated financial statements are presented using the accrual basis of accounting and include the Company and its majority-owned subsidiaries. All significant intercompany accounts and transactions have been eliminated. Certain prior year amounts have been reclassified to conform to the current year presentation.
The equity method of accounting is used for all entities in which the Company or its subsidiaries have significant influence, but not a controlling interest. The Company evaluates less-than-majority-owned investments for consolidation pursuant to consolidation and variable interest entity guidance. The Company does not have any less-than-majority-owned investments requiring consolidation.
During the first quarter of 2018, the Company adopted Accounting Standards Update ("ASU") No. 2014-09, Revenue from Contracts with Customers, which is also known as Accounting Standard Codification ("ASC") Topic 606, for all contracts, using the modified retrospective method. Results from reporting periods beginning after January 1, 2018, are presented under ASC Topic 606, while prior period amounts are not adjusted and continue to be reported in accordance with the Company's historical accounting under ASC Topic 605, Revenue Recognition. The adoption of this guidance did not have a significant impact on the Company's consolidated financial statements; thus no adjustment was made to the opening balance of equity at January 1, 2018. See Note 3, Revenue for additional information.
During the first quarter of 2018, the Company adopted ASU No. 2018-02, Reclassification of Certain Tax Effects from Accumulated Other Comprehensive Income, which allows for a reclassification from accumulated other comprehensive loss to retained earnings for stranded tax effects resulting from the Tax Cuts and Jobs Act. The Company applied the guidance as of the beginning of the period of adoption and reclassified $0.7 million, due to the change in federal corporate tax rate, from accumulated other comprehensive loss to retained earnings. It is the Company’s policy to release income tax effects from accumulated other comprehensive loss using the portfolio approach.
Use of Estimates. The accounting and financial reporting policies of the Company conform to accounting principles generally accepted in the United States of America (“U.S. GAAP”). The preparation of financial statements in conformity with U.S. GAAP requires management to make estimates and assumptions that affect the reported amounts of assets and liabilities, the disclosure of contingent assets and liabilities at the date of the financial statements, and the reported amounts of revenues and expenses during the reporting period. Significant items subject to such estimates and assumptions include those related to the recoverability and useful lives of assets, litigation provisions, and income taxes. Changes in facts and circumstances may result in revised estimates and actual results could differ from those estimates.
Revenue Recognition. The primary performance obligation for the Company is to move customers’ freight from an origin to a destination. A performance obligation is created when a customer under a transportation contract or public tariff submits a bill of lading for the transport of goods. The Company recognizes freight revenue based upon the percentage of completion of a commodity movementproportionally as a shipment moves from origin to destination, withusing the related expensedistance shipped to measure progress, as the customer simultaneously receives and consumes the benefit over time. Related expenses are recognized as incurred. Revenue associated with in-transit shipments at period end is recognized based on the distance shipped as of the balance sheet date. Payment is received at or shortly after the performance obligation is satisfied.
The transaction price is generally in the form of a fixed fee determined at the inception of the transportation contract or the inception of the bill of lading. Certain customer agreements have variable consideration that are based on milestone achievements in the form of rebates, discounts or incentives. The Company makes judgments to determine whether the variable
Kansas City Southern and Subsidiaries
Notes to Consolidated Financial Statements-(Continued)
consideration is probable of occurring and should be included in the estimated transaction price at the beginning of the period to apply a more consistent rate throughout the year based on an analysis of historical experience with the customer, forecasted shipments and other economic indicators. The Company adjusts the estimate on a quarterly basis.
Other revenues, in general,including switching, storage, and demurrage are distinct services and are recognized when the product is shipped, as services are performed or as contractual obligations are fulfilled. The consideration for other revenue is allocated between the separate services based upon the stand-alone transaction price.
Foreign Exchange Gain (Loss). For financial reporting purposes, foreign subsidiaries maintain records in U.S. dollars, which is the functional currency. The dollar is the currency that reflects the economic substance of the underlying events and circumstances relevant to the entity. Monetary assets and liabilities denominated in pesos are remeasured into dollars using current exchange rates. The difference between the exchange rate on the date of the transaction and the exchange rate on the settlement date, or balance sheet date if not settled, is included in the income statement as foreign exchange gain or loss.
Cash Equivalents. Short-term liquid investments with an initial maturity of three months or less are classified as cash and cash equivalents.
Accounts Receivable, net. Accounts receivable are net of an allowance for uncollectible accounts as determined by historical experience and adjusted for economic uncertainties or known trends. Accounts are charged to the allowance when a customer enters bankruptcy, when an account has been transferred to a collection agent or submitted for legal action, or when a customer is significantly past due and all available means of collection have been exhausted. At December 31, 20162018 and 2015,2017, the allowance for doubtful accounts was $5.3$4.1 million and $4.9$4.6 million, respectively. For the years ended December 31, 2016, 20152018, 2017 and 2014,2016, bad debt expense was $1.2$0.3 million, $1.0$1.6 million and $0.4$1.2 million, respectively.
Materials and Supplies. Materials and supplies consisting of diesel fuel, items to be used in the maintenance of rolling stock and items to be used in the maintenance or construction of road property are valued at the lower of average cost or net realizable value.
Derivative Instruments. Derivatives are measured at fair value and recorded on the balance sheet as either assets or liabilities. Changes in the fair value of derivatives are recorded either through current earnings or as other comprehensive income, depending on hedge designation. Gains and losses on derivative instruments classified as cash flow hedges are reported in other comprehensive income and are reclassified into earnings in the periods in which earnings are impacted by the variability of the cash flow of the hedged item. The ineffective portion of all hedge transactions is recognized in current period earnings.
Property and Equipment (including Concession Assets). KCS capitalizes costs for self-constructed additions and improvements to property including direct labor and material, indirect overhead costs, and interest during long-term construction projects. For purchased assets, all costs necessary to make the asset ready for its intended use are capitalized.
Kansas City Southern and Subsidiaries
Notes to Consolidated Financial Statements-(Continued)
Expenditures that significantly increase asset values, productive capacity, efficiency, safety or extend useful lives are capitalized. Repair and maintenance costs are expensed as incurred.
Property and equipment are carried at cost and are depreciated primarily on the group method of depreciation, which the Company believes closely approximates a straight line basis over the estimated useful lives of the assets measured in years. The group method of depreciation applies a composite rate to classes of similar assets rather than to individual assets. Composite depreciation rates are based upon the Company’s estimates of the expected average useful lives of assets as well as expected net salvage value at the end of their useful lives. In developing these estimates, the Company utilizes periodic depreciation studies performed by an independent engineering firm. Depreciation rate studies are performed at least every three years for equipment and at least every six years for road property (rail, ties, ballast, etc.). The Company completedperformed depreciation studies for KCSR in 2018 and KCSM in 2016 and KCSR in 2015.2016. The impacts of the studies were immaterial to the consolidated financial results for all periods.
Under the group method of depreciation, the cost of railroad property and equipment (net of salvage or sales proceeds) retired or replaced in the normal course of business is charged to accumulated depreciation with no gain or loss recognized. Gains or losses on dispositions of land or non-group property and abnormal retirements of railroad property are recognized through income. A retirement of railroad property would be considered abnormal if the cause of the retirement is unusual in
Kansas City Southern and Subsidiaries
Notes to Consolidated Financial Statements-(Continued)
nature and its actual life is significantly shorter than what would be expected for that group based on the depreciation studies. An abnormal retirement could cause the Company to re-evaluate the estimated useful life of the impacted asset class.
Costs incurred by the Company to acquire the concession rights and related assets, as well as subsequent improvements to the concession assets, are capitalized and amortized using the group method of depreciation over the lesser of the current expected Concession term, including probable renewal of an additional 50-year term, or the estimated useful lives of the assets and rights.
Long-lived assets are reviewed for impairment when events or circumstances indicate that the carrying amount of an asset may not be recoverable. If impairment indicators are present and the estimated future undiscounted cash flows are less than the carrying value of the long-lived assets, the carrying value would be reduced to the estimated fair value. Future cash flow estimates for an impairment review would be based on the lowest level of identifiable cash flows, which are the Company’s U.S. and Mexican operations. During the years ended December 31, 20162018 and 2015,2017, management did not identify any indicators of impairment.
Goodwill. Goodwill represents the excess of the purchase price over the fair value of the net identifiable assets acquired in business combinations. As of December 31, 20162018 and 20152017, the goodwill balance was $13.2 million, which is included in other assets in the consolidated balance sheets. Goodwill is not amortized, but is reviewed at least annually, or more frequently as indicators warrant, for impairment. An impairment loss would be recognized to the extent that the carrying amount exceeds the assets’ fair values. The Company performed its annual impairment review for goodwill as of November 30, 20162018 and 2015,2017, and concluded there was no impairment.
Investments and Impairment. The Company reviews equity method investments for impairment whenever events or changes in circumstances indicate that the carrying amount of the investment may not be recoverable in accordance with generally accepted accounting principles. This determination requires significant judgment. In making this judgment, the Company considers available quantitative and qualitative evidence in evaluating potential impairment of these investments. If it is determined that an indicator of impairment exists, the Company assesses whether the carrying value exceeds the fair value of the asset. If the carrying value of the investment exceeds its fair value, the Company will evaluate, among other factors, general market conditions, the duration and extent to which the carrying value is greater than the fair value, and KCS’s intent and ability to hold, or plans to sell, the investment. The Company also considers specific adverse conditions related to the financial health of and business outlook for the investee, including industry and sector performance, changes in technology, and operational and financing cash flow factors. Once a decline in fair value is determined to be other-than-temporary, an impairment charge will be recorded and a new carrying basis in the investment will be established. No impairment charges were recognized during the years ended December 31, 2018, 2017 and 2016.
Fair Value of Financial Instruments. Non-financial assets and liabilities are recognized at fair value on a nonrecurring basis. These assets and liabilities are measured at fair value on an ongoing basis but are subject to recognition in the financial statements only in certain circumstances. Fair value is defined as the exchange price that would be received for an asset or paid to transfer a liability (an exit price) in the principal or most advantageous market for the asset or liability in an orderly transaction between market participants on the measurement date. The Company determines the fair values of its financial instruments based on the fair value hierarchy which requires an entity to maximize the use of observable inputs and minimize the use of unobservable inputs when measuring fair value. The hierarchy is broken down into three levels based upon the observability of inputs. Fair values determined by Level 1 inputs utilize quoted prices (unadjusted) in active markets for identical assets or liabilities that the Company has the ability to access. Level 2 inputs include quoted prices for similar assets and liabilities in active markets, and inputs other than quoted prices that are observable for the asset or liability. Level 3 inputs are unobservable inputs for the asset or liability, and include situations where there is little, if any, market activity for the asset or liability. In certain cases, the inputs used to measure fair value may fall into different levels of the fair value hierarchy. In such cases, the level in the fair value hierarchy within which the fair value measurement in its entirety falls has been determined based on the lowest level input that is significant to the fair value measurement in its entirety. The Company’s
Kansas City Southern and Subsidiaries
Notes to Consolidated Financial Statements-(Continued)
assessment of the significance of a particular input to the fair value in its entirety requires judgment and considers factors specific to the asset or liability.
Kansas City Southern and Subsidiaries
Notes to Consolidated Financial Statements-(Continued)
Environmental Liabilities. The Company recordsrecognizes liabilities for remediation and restoration costs related to past activities when the Company’s obligation is probable and the costs can be reasonably estimated. Costs of future expenditures for environmental remediation are not discounted to their present value. Recoveries of environmental remediation costs from other parties are recorded as assets when their receipt is deemed probable. Costs of ongoing compliance activities related to current operations are expensed as incurred.
Personal Injury Claims. Personal injury claims in excess of self-insurance levels are insured up to certain coverage amounts, depending on the type of claim and year of occurrence. The Company’s personal injury liability is based on actuarial studies performed on an undiscounted basis by an independent third party actuarial firm and reviewed by management. The liability is based on claims filed and an estimate of claims incurred but not yet reported. Adjustments to the liability are reflected as operating expenses in the period in which the adjustments are known. Legal fees related to personal injury claims are recordedrecognized in operating expense in the period incurred.
Health and Welfare and Postemployment Benefits. The Company provides certain medical, life and other postemployment benefits to certain active employees and retirees. The Company uses actuaries to assist management in measuring the benefit obligation and cost based on the current plan provisions, employee demographics, and assumptions about financial and demographic factors affecting the probability, timing and amount of expected future benefit payments. Significant assumptions include the discount rate, rate of increase in compensation levels, and the health care cost trend rate. Actuarial gains and losses determined at the measurement date (December 31) are recognized immediately in the consolidated statements of income.
Share-Based Compensation. The Company accounts for all share-based compensation in accordance with fair value recognition provisions. Under this method, compensation expense is measured at grant date fair value net of estimated forfeitures, and is recognized over the requisite service period in which the award is earned. Forfeitures are recognized as they occur. The Company issues treasury stock to settle share-based awards.
Income Taxes. Deferred income tax effects of transactions reported in different periods for financial reporting and income tax return purposes are recordedrecognized under the asset and liability method of accounting for income taxes. This method gives consideration to the future tax consequences of the deferred income tax items and immediately recognizes changes in income tax laws in the year of enactment. In addition,On December 22, 2017, the Company has not provided U.S. federal income taxesPresident of the United States signed into law the Tax Cuts and Jobs Act (the “Tax Reform Act”). Further information on the undistributed operating earningstax impacts of its foreign subsidiaries because the Company intends to indefinitely reinvest the earnings outside the U.S. or the earnings will be remittedTax Reform Act is included in a tax-free transaction.Note 12, Income Taxes.
The Company has recognized a deferred tax asset, net of a valuation allowance, for net operating loss and tax credit carryovers. The Company projects sufficient future taxable income to realize the deferred tax asset recorded less the valuation allowance. These projections take into consideration assumptions about future income, future capital expenditures and inflation rates. If assumptions or actual conditions change, the deferred tax asset, net of the valuation allowance, will be adjusted to properly reflect the expected tax benefit.
Treasury Stock. The excess of repurchase price over par value of common shares held in treasury is allocated between additional paid-in capital and retained earnings.
New Accounting Pronouncements
In May 2014, the FASB issued Accounting Standards Update (“ASU”) No. 2014-09, Revenue from Contracts with Customers, which requires companies to recognize revenue to depict the transfer of promised goods or services to customers in an amount that reflects the consideration it expects to be entitled in exchange for those goods or services. The new standard will become effective for the Company beginning with the first quarter 2018 and the Company plans to adopt the accounting standard using the modified retrospective transition approach. The modified retrospective transition approach will recognize any changes from the beginning of the year of initial application through retained earnings with no restatement of comparative periods. The Company has substantially completed a review of the likely impacts of the application of the new standard to the
Kansas City Southern and Subsidiaries
Notes to Consolidated Financial Statements-(Continued)
existing portfolio of customer contracts entered into prior to the adoption of the new standard and will continue to review new contracts entered into prior to the adoption of the new standard. Based on this review, the adoption of this guidance is not expected to have a material impact on the Company’s consolidated financial statements.
In February 2016, the FASB issued ASU No. 2016-02, Leases, which requires lessees to recognize for all leases a right-to-use asset and a lease obligation for all leases.in the consolidated balance sheet. Expenses are recognized in the consolidated statement of income in a manner similar to current accounting guidance. Lessees are permitted to make an accounting policy election to not recognize an asset and liability for leases with a term of twelve months or less. Lessor accounting under the new standard is substantially unchanged. Additional qualitative and quantitative disclosures, including significant judgments made by management, will be required. The new standard will become effective for the Company beginning with the first quarter 2019 and requires2019. The Company will adopt the accounting standard using a modified retrospectiveprospective transition approach.approach, which applies the provisions of the new guidance at the effective date without adjusting the comparative periods presented. The Company is currently evaluatingfinalizing its evaluation of the impacts that the adoption of this accounting guidance will have on the consolidated financial statements.statements, and
In March 2016, the FASB issued ASU 2016-09, Improvements
Kansas City Southern and Subsidiaries
Notes to Employee Share-Based Payment Accounting, which simplifies several aspectsConsolidated Financial Statements-(Continued)
estimates approximately $175.0 million of the accounting for employee share-based payment transactions including the accounting for income taxes, forfeitures,right-to-use assets and statutory tax withholding requirements, as well as classification of related amounts within the statement of cash flows. The new standardlease liabilities will become effective for the Company beginning with the first quarter of 2017. Upon adoption of the new ASU, the Company plans to account for forfeitures as incurred. The adoption of this guidance will not have a material impact on the Company’s consolidated financial statements.
In August 2016, the FASB issued ASU 2016-15, Statement of Cash Flows, which reduces diversity in practice in how certain transactions are classifiedbe recognized in the statement of cash flows. The Company plans to early adopt the ASU beginning with the first quarter of 2017. The adoption of this guidance will not have a material impact on the Company’s consolidated financial statements.
In October 2016, the FASB issued ASU 2016-16, Intra-Entity Transfers of Assets Other Than Inventory, that requires entities to recognize at the transaction date the income tax consequences of many intercompany asset transfers. The Company plans to early adopt the ASU beginning with the first quarter of 2017. The adoption of this guidance will not have a material impact on the Company’s consolidated financial statements.balance sheet upon adoption.
Note 3. Revenue
Disaggregation of Revenue
The following table presents revenues disaggregated by the major commodity groups as well as the product types included within the major commodity groups (in millions). The Company believes disaggregation by product type best depicts how cash flows are affected by economic factors. See Note 18, Geographic Information for revenues by geographical area.
|
| | | | | | | | | | | |
| | Years ended December 31, |
| | 2018 (ASC 606) | | 2017 (ASC 605) | | 2016 (ASC 605) |
| Chemical & Petroleum | | | | | |
| Chemicals | $ | 236.3 |
| | $ | 225.1 |
| | $ | 204.7 |
|
| Petroleum | 241.9 |
| | 186.0 |
| | 142.5 |
|
| Plastics | 143.9 |
| | 128.8 |
| | 128.2 |
|
| Total | 622.1 |
| | 539.9 |
| | 475.4 |
|
| | | | | | |
| Industrial & Consumer Products | | | | | |
| Forest Products | 268.0 |
| | 255.8 |
| | 250.2 |
|
| Metals & Scrap | 208.2 |
| | 223.3 |
| | 211.2 |
|
| Other | 114.8 |
| | 109.2 |
| | 92.6 |
|
| Total | 591.0 |
| | 588.3 |
| | 554.0 |
|
| | | | | | |
| Agriculture & Minerals | | | | | |
| Grain | 289.9 |
| | 278.1 |
| | 262.9 |
|
| Food Products | 145.7 |
| | 151.1 |
| | 149.8 |
|
| Ores & Minerals | 20.9 |
| | 19.9 |
| | 19.6 |
|
| Stone, Clay & Glass | 29.9 |
| | 28.3 |
| | 28.7 |
|
| Total | 486.4 |
| | 477.4 |
| | 461.0 |
|
| | | | | | |
| Energy | | | | | |
| Utility Coal | 117.3 |
| | 166.3 |
| | 125.8 |
|
| Coal & Petroleum Coke | 44.3 |
| | 40.8 |
| | 37.9 |
|
| Frac Sand | 37.4 |
| | 51.8 |
| | 24.8 |
|
| Crude Oil | 57.3 |
| | 24.9 |
| | 14.2 |
|
| Total | 256.3 |
| | 283.8 |
| | 202.7 |
|
| | | | | | |
| Intermodal | 382.8 |
| | 363.8 |
| | 357.6 |
|
| | | | | | |
| Automotive | 253.2 |
| | 230.8 |
| | 189.9 |
|
| | | | | | |
| Total Freight Revenues | 2,591.8 |
| | 2,484.0 |
| | 2,240.6 |
|
| | | | | | |
| Other Revenue | 122.2 |
| | 98.9 |
| | 93.6 |
|
| | | | | | |
| Total Revenues | $ | 2,714.0 |
| | $ | 2,582.9 |
| | $ | 2,334.2 |
|
Major customers
No individual customer makes up greater than 10% of total consolidated revenues.
Kansas City Southern and Subsidiaries
Notes to Consolidated Financial Statements-(Continued)
Contract Balances
The amount of revenue recognized in 2018 from performance obligations partially satisfied in the previous year was $20.0 million. The performance obligations that were unsatisfied or partially satisfied as of December 31, 2018, were $21.9 million, which represents in-transit shipments that are fully satisfied the following month.
A receivable is any unconditional right to consideration, and is recognized as shipments have been completed and the relating performance obligation has been fully satisfied. At December 31, 2018 and 2017, the accounts receivable, net balance was $301.2 million and $237.8 million, respectively. Contract assets represent a conditional right to consideration in exchange for goods or services. The Company did not have any contract assets at December 31, 2018 and 2017.
Contract liabilities represent consideration received in advance from customers, and are recognized as revenue over time as the relating performance obligation is satisfied. The amount of revenue recognized in 2018 that was included in the opening contract liability balance was $26.8 million. The Company has recognized contract liabilities within the accounts payable and accrued liabilities financial statement caption on the balance sheet. These are considered current liabilities as they will be settled in less than 12 months.
The following tables summarize the changes in contract liabilities (in millions):
|
| | | | | | | | |
| Contract liabilities | | Years ended December 31, |
| | | 2018 (ASC 606) | | 2017 (ASC 605) |
| Beginning balance | | $ | 26.8 |
| | $ | 13.7 |
|
| Revenue recognized that was included in the contract liability balance at the beginning of the period | | (26.8 | ) | | (13.7 | ) |
| Increases due to consideration received, excluding amounts recognized as revenue during the period | | 32.4 |
| | 26.8 |
|
| Ending balance | | $ | 32.4 |
| | $ | 26.8 |
|
Note 4. Hurricane Harvey
In late August 2017, Hurricane Harvey made landfall on the Texas coast and caused flood damage to the Company’s track infrastructure and significantly disrupted the Company’s rail service. The Company filed a claim in the fourth quarter of 2017 under its insurance program for property damage, incremental expenses, and lost profits caused by Hurricane Harvey. In the third quarter of 2017, the Company recognized a receivable for probable insurance recovery offsetting the impact of incremental expenses recognized in the quarter. During 2018, the Company partially settled its insurance claim for $35.5 million. As a result of the nonrefundable partial settlement, the Company recognized gain on insurance recoveries of $17.9 million, net of the self-insured retention and insurance receivable. The Company received the nonrefundable cash proceeds from the partial settlement in the fourth quarter of 2018.
Note 5. Mexican Fuel Excise Tax Credit
Fuel purchases made in Mexico are subject to an excise tax that is included in fuel expense. During the second quarterprice of 2016, thefuel. The Company determined that it could utilize ais eligible for and utilizes an available credit available under changes in Mexican law for the excise tax included in the price of fuel that is purchased and consumed in locomotives and certain work equipment in Mexico. As a result,For the years ended December 31, 2018, 2017 and 2016, the Company recognized a $37.7 million, $44.1 million and $62.8 million benefit, during the year ended December 31, 2016.respectively. The Mexican fuel excise tax credit is realized through the offset of the current yeartotal annual Mexico income tax liability and income tax withholding payment obligations of KCSM, with no carryforward to future periods.
4. Flooding in the Southeastern United States
In March 2016, flooding in the southeastern United States caused damage to the Company’s track infrastructure and interruptions to the Company’s rail service. The Company filed a claim under its insurance program for property damage, incremental expenses and lost profits caused by this flooding event. In December 2016, the Company settled its insurance claim related to the flooding, and as a result, recognized a gain on insurance recovery of $3.0 million. This gain primarily represents the recovery of lost profits and the replacement value of property in excess of its carrying value, net of the self-insured retention. The gain on insurance recovery was recognized in Materials and other in the Consolidated Statements of Income.
Kansas City Southern and Subsidiaries
Notes to Consolidated Financial Statements-(Continued)
Note 5.6. Earnings Per Share
Basic earnings per common share is computed by dividing net income available to common stockholders by the weighted-average number of common shares outstanding for the period. Diluted earnings per share adjusts basic earnings per common share for the effects of potentially dilutive common shares, if the effect is not anti-dilutive. Potentially dilutive common shares include the dilutive effects of shares issuable under the Stock Option2008 and Performance Award Plan2017 Equity Incentive Plans and shares issuable upon the conversion of preferred stock to common stock.
Kansas City Southern and Subsidiaries
Notes to Consolidated Financial Statements-(Continued)
The following table reconciles the basic earnings per share computation to the diluted earnings per share computation (in millions, except share and per share amounts):
| | | | 2016 | | 2015 | | 2014 | 2018 | | 2017 | | 2016 |
| Net income available to common stockholders for purposes of computing basic and diluted earnings per share | $ | 477.9 |
| | $ | 483.3 |
| | $ | 502.4 |
| $ | 627.2 |
| | $ | 961.8 |
| | $ | 477.9 |
|
Weighted-average number of shares outstanding (in thousands): | | | | | | | | | | |
| Basic shares | 107,560 |
| | 109,709 |
| | 110,163 |
| 101,852 |
| | 104,728 |
| | 107,560 |
|
| Effect of dilution | 201 |
| | 206 |
| | 270 |
| 418 |
| | 312 |
| | 201 |
|
| Diluted shares | 107,761 |
| | 109,915 |
| | 110,433 |
| 102,270 |
| | 105,040 |
| | 107,761 |
|
| Earnings per share: | | | | | | | | | | |
| Basic earnings per share | $ | 4.44 |
| | $ | 4.41 |
| | $ | 4.56 |
| $ | 6.16 |
| | $ | 9.18 |
| | $ | 4.44 |
|
| Diluted earnings per share | $ | 4.43 |
| | $ | 4.40 |
| | $ | 4.55 |
| $ | 6.13 |
| | $ | 9.16 |
| | $ | 4.43 |
|
| | Potentially dilutive shares excluded from the calculation (in thousands): | 2016 | | 2015 | | 2014 | 2018 | | 2017 | | 2016 |
| Stock options excluded as their inclusion would be anti-dilutive | 185 |
| | 84 |
| | 57 |
| 117 |
| | 150 |
| | 185 |
|
Kansas City Southern and Subsidiaries
Notes to Consolidated Financial Statements-(Continued)
Note 6.7. Property and Equipment (including Concession Assets)
The following tables list the major categories of property and equipment, including concession assets, as well as the weighted-average composite depreciation rate for each category (in millions):
| | | As of December 31, 2016 | Cost | | Accumulated Depreciation | | Net Book Value | | Depreciation Rates for 2016 | |
| As of December 31, 2018 | | Cost | | Accumulated Depreciation | | Net Book Value | | Depreciation Rates for 2018 |
| Land | $ | 219.2 |
| | $ | — |
| | $ | 219.2 |
| | N/A |
| $ | 219.3 |
| | $ | — |
| | $ | 219.3 |
| | N/A |
|
| Concession land rights | 141.2 |
| | (25.1 | ) | | 116.1 |
| | 1.0 | % | 141.2 |
| | (27.9 | ) | | 113.3 |
| | 1.0 | % |
| Rail and other track material | 1,925.4 |
| | (445.0 | ) | | 1,480.4 |
| | 1.6-3.2% |
| 2,032.2 |
| | (264.2 | ) | | 1,768.0 |
| | 2.4-2.9% |
|
| Ties | 1,710.1 |
| | (423.8 | ) | | 1,286.3 |
| | 2.0-5.0% |
| 1,682.9 |
| | (450.6 | ) | | 1,232.3 |
| | 2.0-4.8% |
|
| Grading | 910.7 |
| | (153.9 | ) | | 756.8 |
| | 0.9 | % | 978.2 |
| | (169.4 | ) | | 808.8 |
| | 0.9 | % |
| Bridges and tunnels | 739.4 |
| | (137.6 | ) | | 601.8 |
| | 1.1 | % | 803.9 |
| | (153.8 | ) | | 650.1 |
| | 1.1 | % |
| Ballast | 748.3 |
| | (215.1 | ) | | 533.2 |
| | 2.5-4.7% |
| 797.9 |
| | (221.9 | ) | | 576.0 |
| | 2.5-4.2% |
|
| Other (a) | 1,152.1 |
| | (332.4 | ) | | 819.7 |
| | 3.0 | % | 1,367.2 |
| | (401.4 | ) | | 965.8 |
| | 3.2 | % |
| Total road property | 7,186.0 |
| | (1,707.8 | ) | | 5,478.2 |
| | 2.8 | % | 7,662.3 |
| | (1,661.3 | ) | | 6,001.0 |
| | 2.8 | % |
| Locomotives | 1,485.9 |
| | (356.9 | ) | | 1,129.0 |
| | 4.5 | % | 1,638.1 |
| | (436.3 | ) | | 1,201.8 |
| | 4.9 | % |
| Freight cars | 887.7 |
| | (152.5 | ) | | 735.2 |
| | 3.5 | % | 1,034.1 |
| | (200.9 | ) | | 833.2 |
| | 2.7 | % |
| Other equipment | 66.2 |
| | (23.6 | ) | | 42.6 |
| | 6.4 | % | 67.3 |
| | (29.0 | ) | | 38.3 |
| | 5.7 | % |
| Total equipment | 2,439.8 |
| | (533.0 | ) | | 1,906.8 |
| | 4.2 | % | 2,739.5 |
| | (666.2 | ) | | 2,073.3 |
| | 4.1 | % |
| Technology and other | 182.2 |
| | (126.2 | ) | | 56.0 |
| | 17.4 | % | 305.6 |
| | (173.9 | ) | | 131.7 |
| | 16.6 | % |
| Construction in progress | 293.4 |
| | — |
| | 293.4 |
| | N/A |
| 152.5 |
| | — |
| | 152.5 |
| | N/A |
|
| Total property and equipment (including concession assets) | $ | 10,461.8 |
| | $ | (2,392.1 | ) | | $ | 8,069.7 |
| | N/A |
| $ | 11,220.4 |
| | $ | (2,529.3 | ) | | $ | 8,691.1 |
| | N/A |
|
_____________
| |
| (a) | Other includes signals, buildings and other road assets. |
Kansas City Southern and Subsidiaries
Notes to Consolidated Financial Statements-(Continued)
| | | As of December 31, 2015 | Cost | | Accumulated Depreciation | | Net Book Value | | Depreciation Rates for 2015 | |
| As of December 31, 2017 | | Cost | | Accumulated Depreciation | | Net Book Value | | Depreciation Rates for 2017 |
| Land | $ | 218.1 |
| | $ | — |
| | $ | 218.1 |
| | N/A |
| $ | 218.6 |
| | $ | — |
| | $ | 218.6 |
| | N/A |
|
| Concession land rights | 141.2 |
| | (23.7 | ) | | 117.5 |
| | 1.0 | % | 141.2 |
| | (26.5 | ) | | 114.7 |
| | 1.0 | % |
| Rail and other track material | 1,814.7 |
| | (394.6 | ) | | 1,420.1 |
| | 1.8-3.0% |
| 1,967.0 |
| | (425.9 | ) | | 1,541.1 |
| | 2.7-3.0% |
|
| Ties | 1,596.2 |
| | (357.1 | ) | | 1,239.1 |
| | 2.0-4.1% |
| 1,779.6 |
| | (441.0 | ) | | 1,338.6 |
| | 2.0-4.8% |
|
| Grading | 878.4 |
| | (144.9 | ) | | 733.5 |
| | 0.9 | % | 969.9 |
| | (162.1 | ) | | 807.8 |
| | 0.9 | % |
| Bridges and tunnels | 703.4 |
| | (130.7 | ) | | 572.7 |
| | 1.1 | % | 775.0 |
| | (144.9 | ) | | 630.1 |
| | 1.1 | % |
| Ballast | 696.6 |
| | (187.7 | ) | | 508.9 |
| | 2.5-4.1% |
| 795.2 |
| | (222.0 | ) | | 573.2 |
| | 2.3-4.2% |
|
| Other (a) | 1,095.0 |
| | (301.9 | ) | | 793.1 |
| | 3.0 | % | 1,270.4 |
| | (363.3 | ) | | 907.1 |
| | 3.2 | % |
| Total road property | 6,784.3 |
| | (1,516.9 | ) | | 5,267.4 |
| | 2.7 | % | 7,557.1 |
| | (1,759.2 | ) | | 5,797.9 |
| | 2.8 | % |
| Locomotives | 1,456.6 |
| | (302.7 | ) | | 1,153.9 |
| | 4.6 | % | 1,527.9 |
| | (375.2 | ) | | 1,152.7 |
| | 4.7 | % |
| Freight cars | 809.6 |
| | (123.6 | ) | | 686.0 |
| | 3.9 | % | 937.9 |
| | (168.9 | ) | | 769.0 |
| | 2.7 | % |
| Other equipment | 59.9 |
| | (20.7 | ) | | 39.2 |
| | 6.5 | % | 69.1 |
| | (26.6 | ) | | 42.5 |
| | 5.9 | % |
| Total equipment | 2,326.1 |
| | (447.0 | ) | | 1,879.1 |
| | 4.4 | % | 2,534.9 |
| | (570.7 | ) | | 1,964.2 |
| | 4.0 | % |
| Technology and other | 159.3 |
| | (120.7 | ) | | 38.6 |
| | 15.6 | % | 229.1 |
| | (144.4 | ) | | 84.7 |
| | 17.1 | % |
| Construction in progress | 184.7 |
| | — |
| | 184.7 |
| | N/A |
| 223.7 |
| | — |
| | 223.7 |
| | N/A |
|
Total property and equipment (including concession assets) | $ | 9,813.7 |
| | $ | (2,108.3 | ) | | $ | 7,705.4 |
| | N/A |
| $ | 10,904.6 |
| | $ | (2,500.8 | ) | | $ | 8,403.8 |
| | N/A |
|
_____________
| |
| (a) | Other includes signals, buildings and other road assets. |
Concession assets, net of accumulated amortization of $610.7$596.1 million and $538.0$638.2 million, totaled $2,131.6$2,260.4 million and $2,070.52,208.1 million at December 31, 20162018 and 20152017, respectively.
The Company capitalized $0.5$0.2 million, $0.70.3 million, and $0.90.5 million of interest for the years ended December 31, 20162018, 20152017, and 20142016, respectively.
Depreciation and amortization of property and equipment (including concession assets) totaled $305.0$346.7 million, $284.6$320.9 million and $258.1305.0 million, for 20162018, 20152017, and 20142016, respectively.
Note 7. Lease Termination Costs
During 2016, 2015 and 2014, the Company purchased $26.6 million, $144.2 million and $300.7 million, respectively, of equipment under existing operating leases and replacement equipment as certain operating leases expired. For the years ended December 31, 2015 and 2014, the Company recognized $9.6 million and $38.3 million of lease termination costs (included in operating expenses) due to the early termination of certain operating leases and the related purchase of the equipment. The Company did not incur lease termination costs during 2016.
Kansas City Southern and Subsidiaries
Notes to Consolidated Financial Statements-(Continued)
Note 8. Other Balance Sheet Captions
Other Current Assets. Other current assets included the following items at December 31 (in millions):
| | | | 2016 | | 2015 | 2018 | | 2017 |
| Refundable taxes | $ | 113.2 |
| | $ | 71.6 |
| $ | 11.2 |
| | $ | 81.6 |
|
| Mexican fuel excise tax credit | | 30.9 |
| | 35.1 |
|
| Prepaid expenses | 18.2 |
| | 16.8 |
| 21.7 |
| | 18.3 |
|
| Other | 2.4 |
| | 2.2 |
| 9.6 |
| | 22.4 |
|
| Other current assets | $ | 133.8 |
| | $ | 90.6 |
| $ | 73.4 |
| | $ | 157.4 |
|
Kansas City Southern and Subsidiaries
Notes to Consolidated Financial Statements-(Continued)
Accounts Payable and Accrued Liabilities. Accounts payable and accrued liabilities included the following items at December 31 (in millions):
| | | | 2016 | | 2015 | 2018 | | 2017 |
| Accounts payable | $ | 247.8 |
| | $ | 176.7 |
| $ | 180.5 |
| | $ | 225.1 |
|
| Income and other taxes | | 35.2 |
| | 111.8 |
|
| Accrued wages and vacation | 78.7 |
| | 50.9 |
| 60.9 |
| | 89.0 |
|
| Derailments, personal injury and other claim provisions | 39.2 |
| | 40.5 |
| 44.0 |
| | 48.0 |
|
| Foreign currency derivative instruments | 41.1 |
| | 46.0 |
| |
| Dividends payable | 35.2 |
| | 35.9 |
| 36.4 |
| | 37.2 |
|
| Income and other taxes | 36.0 |
| | 18.8 |
| |
| Other | 59.7 |
| | 32.7 |
| 79.9 |
| | 76.7 |
|
| Accounts payable and accrued liabilities | $ | 537.7 |
| | $ | 401.5 |
| $ | 436.9 |
| | $ | 587.8 |
|
Note 9. Fair Value Measurements
The Company’s assets and liabilities recordedrecognized at fair value have been categorized based upon a fair value hierarchy as described in Note 2, — “SignificantSignificant Accounting Policies”.Policies. As of December 31, 20162018, the Company’s derivative financial instruments are measured at fair value on a recurring basis and consist of foreign currency forward and option contracts and treasury lock agreements, which are classified as Level 2 valuations. The Company determines the fair value of its derivative financial instrument positions based upon pricing models using inputs observed from actively quoted markets and also takes into consideration the contract terms as well as other inputs, including market currency exchange rates and in the case of option contracts, volatility, the risk-free interest rate and the time to expiration. The fair value of the foreign currency derivative instruments was a liability of $41.1 million and $46.0 million as of December 31, 2016 and 2015, respectively.
The Company’s short-term financial instruments include cash and cash equivalents, accounts receivable, accounts payable and short-term borrowings. The carrying value of the short-term financial instruments approximates their fair value.
The fair value of the Company’s debt is estimated using quoted market prices when available. When quoted market prices are not available, fair value is estimated based on current market interest rates for debt with similar maturities and credit quality. The faircarrying value of the Company’s debt was $2,303.8$2,689.4 million and $2,287.52,274.3 million at December 31, 20162018 and 2015, respectively. The carrying value was $2,296.9 million and $2,321.1 million at December 31, 2016 and 20152017, respectively. If the Company’s debt were measured at fair value, the fair value measurements of the individual debt instruments would have been classified as either Level 1 or Level 2 in the fair value hierarchy.
The fair value of the Company’s financial instruments is presented in the following table (in millions):
|
| | | | | | | | |
| | | December 31, 2018 | | December 31, 2017 |
| | | Level 2 | | Level 2 |
| Assets | | | | |
| Foreign currency derivative instruments | | $ | 0.3 |
| | $ | 7.9 |
|
| Liabilities | | | | |
| Debt instruments | | 2,661.3 |
| | 2,377.8 |
|
| Treasury lock agreements | | 2.0 |
| | 5.6 |
|
Kansas City Southern and Subsidiaries
Notes to Consolidated Financial Statements-(Continued)
Note 10. Derivative Instruments
The Company enters into derivative transactions in certain situations based on management’s assessment of current market conditions and perceived risks. Management intends to respond to evolving business and market conditions and in doing so, may enter into such transactions as deemed appropriate.
Credit Risk. As a result of the use of derivative instruments, the Company is exposed to counterparty credit risk. The Company manages this risk by limiting its counterparties to large financial institutions which meet the Company’s credit rating standards and have an established banking relationship with the Company. As of December 31, 2016,2018, the Company did not expect any losses as a result of default of its counterparties.
Interest Rate Derivative Instruments. In May 2017, the Company executed four treasury lock agreements with an aggregate notional value of $275.0 million and a weighted-average interest rate of 2.85%. The purpose of the treasury locks is to hedge the U.S. Treasury benchmark interest rate associated with future interest payments related to the anticipated refinancing of the $275.0 million, 2.35% senior notes due May 15, 2020. The Company has designated the treasury locks as cash flow hedges and recorded unrealized gains and losses in accumulated other comprehensive loss. Upon settlement, the unrealized gain or loss in accumulated other comprehensive loss will be amortized to interest expense over the life of the future underlying debt issuance.
Foreign Currency Derivative Instruments. The Company’s Mexican subsidiaries have net U.S. dollar-denominated monetary liabilities which, for Mexican income tax purposes, are subject to periodic revaluation based on changes in the value of the Mexican peso against the U.S. dollar. This revaluation creates fluctuations in the Company’s Mexican income tax expense and the amount of income taxes paid in Mexico. The Company hedges its exposure to this cash tax risk by entering into foreign currency forward contracts and foreign currency option contracts known as zero-cost collars.
The foreign currency forward contracts involve the Company’s purchase of pesos at an agreed-upon weighted-average exchange rate to each U.S dollar. The zero-cost collars involve the Company’s purchase of a Mexican peso call option and a simultaneous sale of a Mexican peso put option, with equivalent U.S. dollar notional amounts for each option and no net cash premium paid by the Company.
Below is a summary of the The Company’s 2016 and 2015 foreign currency forward and zero-cost collar contracts are executed with counterparties in the U.S. and are governed by an International Swaps and Derivatives Association agreement that includes standard netting arrangements. Asset and liability positions from contracts with the same counterparty are net settled upon maturity/expiration and presented on a net basis in the consolidated balance sheets prior to settlement. There was no offsetting of derivative contracts (amountsassets or liabilities in millions, except Ps./USD): |
| | | | | | | | | | | | | | | | | | | | | | | | | | | | | | | | |
| Foreign currency forward contracts | | | | | | | | | | | | |
| | Contracts to purchase Ps./pay USD | | Offsetting contracts to sell Ps./receive USD | | |
| | Notional amount | | Notional amount | | Weighted-average exchange rate (in Ps./USD) | | Maturity date | | Notional amount | | Notional amount | | Weighted-average exchange rate (in Ps./USD) | | Maturity date | | Cash received/(paid) on settlement |
| 2016 contracts outstanding at December 31, 2016 | $ | 340.0 |
| | Ps. | 6,207.7 |
| | Ps. | 18.3 |
| | 1/17/2017 | | — |
| | — |
| | — |
| | — |
| | — |
|
| 2016 contracts and 2016 offsetting contracts settled | $ | 60.0 |
| | Ps. | 1,057.3 |
| | Ps. | 17.6 |
| | 4/29/2016 | | $ | 60.7 |
| | Ps. | 1,057.3 |
| | Ps. | 17.4 |
| | 4/29/2016 |
| | $ | 0.7 |
|
| 2015 contracts and 2016 offsetting contracts settled | $ | 300.0 |
| | Ps. | 4,480.4 |
| | Ps. | 14.9 |
| | 1/15/2016 | | $ | 251.0 |
| | Ps. | 4,480.4 |
| | Ps. | 17.9 |
| | 1/15/2016 |
| | $ | (49.0 | ) |
| 2014 contracts and 2015 offsetting contracts settled | $ | 300.0 |
| | Ps. | 4,364.7 |
| | Ps. | 14.6 |
| | 1/15/2015 | | $ | 298.8 |
| | Ps. | 4,364.7 |
| | Ps. | 14.6 |
| | 1/15/2015 |
| | $ | (1.2 | ) |
| 2014 contracts and 2014 offsetting contracts settled | $ | 345.0 |
| | Ps. | 4,642.5 |
| | Ps. | 13.5 |
| | 12/31/2014 | | $ | 321.4 |
| | Ps. | 4,642.5 |
| | Ps. | 14.4 |
| | 12/31/2014 |
| | $ | (23.6 | ) |
| Foreign currency zero-cost collar contracts | | | | | | | | | | | | |
| | Notional amount | | Maturity date | | Cash received/(paid) on settlement | | | | | | | | | | | | |
| 2015 contracts settled in 2016 | $ | 80.0 |
| | 1/15/2016 |
| | $ | (10.1 | ) | | | | | | | | | | | | |
| 2015 contracts settled in 2015 | $ | 50.0 |
| | 9/28/2015 |
| | $ | (4.3 | ) | | | | | | | | | | | | |
Kansas City Southern and Subsidiaries
Notes to Consolidated Financial Statements-(Continued)
Below is a summary of the Company’s 2018, 2017 and 2016 foreign currency derivative contracts (amounts in millions, except Ps./USD): |
| | | | | | | | | | | | | | | | | | | | | | | | | | | | | | | | | | |
| Foreign currency forward contracts | | | | | | | | | | | |
| | Contracts to purchase Ps./pay USD | | Offsetting contracts to sell Ps./receive USD | | |
| | Notional amount | | Notional amount | | Weighted-average exchange rate (in Ps./USD) | | Maturity date | | Notional amount | | Notional amount | | Weighted-average exchange rate (in Ps./USD) | | Maturity date | | Cash received/(paid) on settlement |
| Contracts executed in 2018 and outstanding at December 31, 2018 | $ | 20.0 |
| | Ps. | 410.9 |
| | Ps. | 20.5 |
| | 9/30/2019 |
| | — |
| | — |
| | — |
| | — |
| | — |
|
| Contracts executed in 2016 and settled in 2017 | $ | 340.0 |
| | Ps. | 6,207.7 |
| | Ps. | 18.3 |
| | 1/17/2017 |
| | $ | 287.0 |
| | Ps. | 6,207.7 |
| | Ps. | 21.6 |
| | 1/17/2017 |
| | $ | (53.0 | ) |
| Contracts executed in 2016 and settled in 2016 | $ | 60.0 |
| | Ps. | 1,057.3 |
| | Ps. | 17.6 |
| | 4/29/2016 |
| | $ | 60.7 |
| | Ps. | 1,057.3 |
| | Ps. | 17.4 |
| | 4/29/2016 |
| | $ | 0.7 |
|
| Contracts executed in 2015 and settled in 2016 | $ | 300.0 |
| | Ps. | 4,480.4 |
| | Ps. | 14.9 |
| | 1/15/2016 |
| | $ | 251.0 |
| | Ps. | 4,480.4 |
| | Ps. | 17.9 |
| | 1/15/2016 |
| | $ | (49.0 | ) |
| | | | | | | | | | | | | | | | | | |
| Foreign currency zero-cost collar contracts | | | | | | | | | | | | |
| | Notional amount | | Weighted-average call rate outstanding options (in Ps./USD) | | Weighted-average put rate outstanding options (in Ps./USD) | | Cash received/(paid) on settlement | | | | | | | | | | |
| Contracts executed in 2018 and outstanding at December 31, 2018 | $ | 120.0 |
| | Ps. | 19.2 |
| | Ps. | 22.6 |
| | — |
| | | | | | | | | | |
| Contracts executed in 2018 and settled in 2018 | $ | 220.0 |
| | | | | | $ | 3.9 |
| | | | | | | | | | |
| Contracts executed in 2017 and settled in 2018 | $ | 80.0 |
| | | | | | $ | 10.0 |
| | | | | | | | | | |
| Contracts executed in 2017 and settled in 2017 | $ | 450.0 |
| | | | | | $ | 42.2 |
| | | | | | | | | | |
| Contracts executed in 2015 and settled in 2016 | $ | 80.0 |
| | | | | | $ | (10.1 | ) | | | | | | | | | | |
The Company has not designated any of the foreign currency derivative contracts as hedging instruments for accounting purposes. The Company measures the foreign currency derivative contracts at fair value each period and recognizes any change in fair value in foreign exchange lossgain (loss) within the consolidated statements of income. The cash flows associated with these instruments is classified as an operating activity within the consolidated statements of cash flows.
Kansas City Southern and Subsidiaries
Notes to Consolidated Financial Statements-(Continued)
The following table presents the fair value of derivative instruments included in the consolidated balance sheets at December 31 ((in millionsmillions)):
| | | | Derivative Liabilities | Derivative Assets |
| | Balance Sheet Location | | 2016 | | 2015 | Balance Sheet Location | | 2018 | | 2017 |
| Derivatives not designated as hedging instruments: | | | | | | | | |
| Foreign currency forward contracts | Accounts payable and accrued liabilities | | $ | 41.1 |
| | $ | 39.8 |
| |
| Foreign currency zero-cost collar contracts | Accounts payable and accrued liabilities | | — |
| | 6.2 |
| Other current assets | | $ | 0.3 |
| | $ | 7.9 |
|
| Total derivative liabilities | | $ | 41.1 |
| | $ | 46.0 |
| |
| Total derivatives not designated as hedging instruments | | | 0.3 |
| | 7.9 |
|
| Total derivative assets | | | $ | 0.3 |
| | $ | 7.9 |
|
|
| | | | | | | | | |
| | Derivative Liabilities |
| | Balance Sheet Location | | 2018 | | 2017 |
| Derivatives designated as hedging instruments: | | | | | |
| Treasury lock agreements | Other noncurrent liabilities and deferred credits | | $ | 2.0 |
| | $ | 5.6 |
|
| Total derivatives designated as hedging instruments | | | 2.0 |
| | 5.6 |
|
| Total derivative liabilities | | | $ | 2.0 |
| | $ | 5.6 |
|
The following table presents the effects of derivative instruments on the consolidated statements of income and consolidated statements of comprehensive income for the years ended December 31 (in millions):
| | | Derivatives in Cash Flow Hedging Relationships | | | | Amount of Gain/(Loss) Recognized in OCI on Derivative |
| | Location of Gain/(Loss) Recognized in Income on Derivative | | Amount of Gain/(Loss) Recognized in Income on Derivative | | | 2018 | | 2017 | | 2016 |
| Derivatives not designated as hedging instruments: | | 2016 | | 2015 | | 2014 | |
| Treasury lock agreements | | Treasury lock agreements | | $ | 3.6 |
| | $ | (5.6 | ) | | $ | — |
|
| Total | | | $ | 3.6 |
| | $ | (5.6 | ) | | $ | — |
|
| | | | | | | | | |
| Derivatives Not Designated as Hedging Instruments | | Location of Gain/(Loss) Recognized in Income on Derivative | | Amount of Gain/(Loss) Recognized in Income on Derivative |
| | | | 2018 | | 2017 | | 2016 |
| Foreign currency zero-cost collar contracts | | Foreign exchange gain (loss) | | $ | 6.3 |
| | $ | 50.1 |
| | $ | (3.9 | ) |
| Foreign currency forward contracts | Foreign exchange loss | | $ | (49.6 | ) | | $ | (36.7 | ) | | $ | (27.9 | ) | Foreign exchange gain (loss) | | — |
| | (11.9 | ) | | (49.6 | ) |
| Foreign currency zero-cost collar contracts | Foreign exchange loss | | (3.9 | ) | | (10.5 | ) | | — |
| |
| Total | | $ | (53.5 | ) | | $ | (47.2 | ) | | $ | (27.9 | ) | | $ | 6.3 |
| | $ | 38.2 |
| | $ | (53.5 | ) |
Note 11. Short-Term Borrowings
Commercial Paper. The Company’s commercial paper program generally serves as the primary means of short-term funding. As of December 31, 2016,2018, KCS had $181.3no commercial paper outstanding. As of December 31, 2017, KCS had $345.1 million of commercial paper outstanding, net of $0.1 million discount, at a weighted-average interest rate of 1.290%1.846%. As ofFor the years ended December 31, 2015, KCS had $80.0 million of2018, 2017 and 2016, commercial paper borrowings were outstanding atfor less than 90 days and the related activity is presented on a weighted-average interest ratenet basis in the consolidated statements of 1.072%.cash flows.
Kansas City Southern and Subsidiaries
Notes to Consolidated Financial Statements-(Continued)
Note 12. Long-Term Debt
Long-term debt at December 31 (in millions):
| | | | | | | | | | | | | | | | | | | | | | | | | |
| | 2016 | | 2015 | 2018 | | 2017 |
| | Principal | | Unamortized Discount and Debt Issuance Costs | | Net | | Principal | | Unamortized Discount and Debt Issuance Costs | | Net | Principal | | Unamortized Discount and Debt Issuance Costs | | Net | | Principal | | Unamortized Discount and Debt Issuance Costs | | Net |
| Revolving credit facilities, variable interest rate, due 2020 | $ | — |
| | $ | — |
| | $ | — |
| | $ | — |
| | $ | — |
| | $ | — |
| $ | — |
| | $ | — |
| | $ | — |
| | $ | — |
| | $ | — |
| | $ | — |
|
| KCS Floating rate senior notes | — |
| | — |
| | — |
| | 244.8 |
| | 1.0 |
| | 243.8 |
| |
| KCS 2.35% senior notes, due 2020 | 257.3 |
| | 1.7 |
| | 255.6 |
| | 239.5 |
| | 2.1 |
| | 237.4 |
| 257.3 |
| | 0.7 |
| | 256.6 |
| | 257.3 |
| | 1.2 |
| | 256.1 |
|
| KCS 3.00% senior notes, due 2023 | 439.1 |
| | 4.7 |
| | 434.4 |
| | 439.1 |
| | 5.4 |
| | 433.7 |
| 439.1 |
| | 3.2 |
| | 435.9 |
| | 439.1 |
| | 4.0 |
| | 435.1 |
|
| KCS 3.85% senior notes, due 2023 | 199.2 |
| | 2.0 |
| | 197.2 |
| | 195.0 |
| | 2.2 |
| | 192.8 |
| 199.2 |
| | 1.4 |
| | 197.8 |
| | 199.2 |
| | 1.7 |
| | 197.5 |
|
| KCS 3.125% senior notes, due 2026 | 250.0 |
| | 3.4 |
| | 246.6 |
| | — |
| | — |
| | — |
| 250.0 |
| | 2.7 |
| | 247.3 |
| | 250.0 |
| | 3.1 |
| | 246.9 |
|
| KCS 4.30% senior notes, due 2043 | 448.7 |
| | 9.6 |
| | 439.1 |
| | 437.6 |
| | 9.8 |
| | 427.8 |
| 448.7 |
| | 9.1 |
| | 439.6 |
| | 448.7 |
| | 9.3 |
| | 439.4 |
|
| KCS 4.95% senior notes, due 2045 | 499.2 |
| | 8.0 |
| | 491.2 |
| | 476.7 |
| | 7.9 |
| | 468.8 |
| 499.2 |
| | 7.4 |
| | 491.8 |
| | 499.2 |
| | 7.6 |
| | 491.6 |
|
| KCS 4.70% senior notes, due 2048 | | 500.0 |
| | 6.2 |
| | 493.8 |
| | — |
| | — |
| | — |
|
| KCSR senior notes 3.85% to 4.95%, due through 2045 | 2.9 |
| | — |
| | 2.9 |
| | 40.7 |
| | 0.6 |
| | 40.1 |
| 2.7 |
| | — |
| | 2.7 |
| | 2.9 |
| | — |
| | 2.9 |
|
| KCSM senior notes 2.35% to 3.00%, due through 2023 | 28.5 |
| | 0.2 |
| | 28.3 |
| | 51.5 |
| | 0.3 |
| | 51.2 |
| 23.2 |
| | 0.1 |
| | 23.1 |
| | 28.5 |
| | 0.2 |
| | 28.3 |
|
| RRIF loans 2.96% to 4.29%, due serially through 2037 | 81.4 |
| | 0.5 |
| | 80.9 |
| | 84.9 |
| | 0.6 |
| | 84.3 |
| 74.1 |
| | 0.4 |
| | 73.7 |
| | 77.8 |
| | 0.5 |
| | 77.3 |
|
| Financing agreements 5.737% to 9.310%, due serially through 2023 | 102.5 |
| | 0.4 |
| | 102.1 |
| | 119.9 |
| | 0.5 |
| | 119.4 |
| 15.5 |
| | — |
| | 15.5 |
| | 84.2 |
| | 0.3 |
| | 83.9 |
|
| Capital lease obligations, due serially to 2024 | 18.3 |
| | — |
| | 18.3 |
| | 21.4 |
| | — |
| | 21.4 |
| 11.4 |
| | — |
| | 11.4 |
| | 15.0 |
| | — |
| | 15.0 |
|
| Other debt obligations | 0.3 |
| | — |
| | 0.3 |
| | 0.4 |
| | — |
| | 0.4 |
| 0.2 |
| | — |
| | 0.2 |
| | 0.3 |
| | — |
| | 0.3 |
|
| Total | 2,327.4 |
| | 30.5 |
| | 2,296.9 |
| | 2,351.5 |
| | 30.4 |
| | 2,321.1 |
| 2,720.6 |
| | 31.2 |
| | 2,689.4 |
| | 2,302.2 |
| | 27.9 |
| | 2,274.3 |
|
| Less: Debt due within one year | 25.4 |
| | — |
| | 25.4 |
| | 276.1 |
| | — |
| | 276.1 |
| 10.1 |
| | — |
| | 10.1 |
| | 38.8 |
| | — |
| | 38.8 |
|
| Long-term debt | $ | 2,302.0 |
| | $ | 30.5 |
| | $ | 2,271.5 |
| | $ | 2,075.4 |
| | $ | 30.4 |
| | $ | 2,045.0 |
| $ | 2,710.5 |
| | $ | 31.2 |
| | $ | 2,679.3 |
| | $ | 2,263.4 |
| | $ | 27.9 |
| | $ | 2,235.5 |
|
Revolving Credit Facility
KCS, with certain of its domestic subsidiaries named therein as guarantors, has an $800.0 million revolving credit facility (the “KCS Revolving Credit Facility”), with a $25.0 million standby letter of credit facility which, if utilized, constitutes usage under the revolving facility. The KCS Revolving Credit Facility serves as a backstop for KCS’s $800.0 million commercial paper program (the “KCS Commercial Paper Program”) which generally serves as the Company’s primary means of short-term funding.
Borrowings under the KCS Revolving Credit Facility bear interest at floating rates. Depending on the Company’s credit rating, the margin that KCS pays above the London Interbank Offered Rate (“LIBOR”) at any point is between 1.125% and 2.0%. As of December 31, 2016,2018, the margin is 1.5%was 1.25% based on KCS’s current credit rating.
The KCS Revolving Credit Facility is guaranteed by KCSR, together with certain domestic subsidiaries named therein as guarantors (the “Subsidiary Guarantors”) and matures on December 9, 2020. The KCS Revolving Credit Facility agreement contains representations, warranties, covenants (including financial covenants related to a leverage ratio and an interest coverage ratio) and events of default that are customary for credit agreements of this type. The occurrence of an event of
Kansas City Southern and Subsidiaries
Notes to Consolidated Financial Statements-(Continued)
default could result in the termination of the commitments and the acceleration of the repayment of any outstanding principal balance on the KCS Revolving Credit Facility and the KCS Commercial Paper Program.
Kansas City Southern and Subsidiaries
Notes to Consolidated Financial Statements-(Continued)
As of December 31, 20162018 and 2015,2017, KCS had no outstanding borrowings under the KCS Revolving Credit Facility.
Debt Exchange
During the first quarter of 2016, KCS entered into agreements with certain holders of KCSR and KCSM senior notes (collectively, the “Existing Notes”) to exchange Existing Notes for new securities issued by KCS. Each KCS note issued in exchange for an Existing Note has the same interest rate, interest payment dates and maturity date and substantially identical redemption provisions as the corresponding Existing Note. The following table summarizes the outstanding notes that were exchanged on March 29, 2016 (in millions):
|
| | | | | | | | | | | | | |
| Issuer of Existing Notes | Series of Existing Notes | | Principal Amount Outstanding Prior to Exchange | | Principal Amount of Notes Exchanged | | Principal Amount Outstanding Following Exchange |
| KCSR | 3.85% Senior Notes due 2023 | | $ | 5.0 |
| | $ | 4.2 |
| | $ | 0.8 |
|
| KCSR | 4.30% Senior Notes due 2043 | | 12.4 |
| | 11.1 |
| | 1.3 |
|
| KCSR | 4.95% Senior Notes due 2045 | | 23.3 |
| | 22.5 |
| | 0.8 |
|
| KCSM | 2.35% Senior Notes due 2020 | | 35.4 |
| | 17.8 |
| | 17.6 |
|
The Company has accounted for this transaction as a debt exchange as the exchanged debt instruments are not considered to be substantially different. The balance of the unamortized discount and issue costs from the Existing Notes is being amortized as an adjustment of interest expense over the term of the KCS notes. There was no gain or loss recognized as a result of the exchange.
Senior Notes
The Company’s senior notes include certain covenants which are customary for these types of debt instruments issued by borrowers with similar credit ratings.
The KCS Notes are unsecured and unsubordinated obligations of the Company and are unconditionally guaranteed, jointly and severally, by KCSR and each current and future domestic subsidiary of KCS that guarantees the KCS Revolving Credit Facility or certain other debt of KCS or a Note Guarantor (collectively, the “Note Guarantors”).
KCSR’s senior notes are unconditionally guaranteed, jointly and severally, on an unsecured senior basis, by KCS and each current and future domestic subsidiary of KCS that guarantees the KCS Revolving Credit Facility or certain other debt of KCS or a note guarantor. KCSR’s senior notes and the note guarantees rank pari passu in right of payment with KCSR’s, KCS’s and the Note Guarantors’ existing and future unsecured, unsubordinated obligations.
KCSM’s senior notes are denominated in U.S. dollars; are unsecured, unsubordinated obligations; rank pari passu in right of payment with KCSM’s existing and future unsecured, unsubordinated obligations and are senior in right of payment to KCSM’s future subordinated indebtedness.
Senior notes are redeemable at the issuer’s option, in whole or in part, at any time, by paying the greater of either 100% of the principal amount to be redeemed and a formula price based on interest rates prevailing at the time of redemption and time remaining to maturity. In addition, KCSM senior notes are redeemable, in whole but not in part, at KCSM’s option at any time at a redemption price of 100% of their principal amount, plus any accrued unpaid interest in the event of certain changes in the Mexican withholding tax rate.
3.125% Senior Notes.On May 16, 2016,3, 2018, KCS issued $250.0$500.0 million principal amount of senior unsecured notes due JuneMay 1, 20262048 (the “3.125%“4.70% Senior Notes”), which bear interest semiannually at a fixed annual rate of 3.125%4.70%. The 3.125%4.70% Senior Notes were issued at a discount to par value, resulting in a $1.3$0.6 million discount and a yield to maturity of 3.185%4.707%. The net proceeds from the offering were used to repay the outstanding commercial paper issued by KCS, repay a locomotive lease and certain equipment loans, and for other general corporate purposes.
Kansas City Southern and Subsidiaries
Notes to Consolidated Financial Statements-(Continued)
Floating Rate Senior Notes.On October 28, 2016, $250.0the remaining $10.9 million aggregate principal amount of outstanding floating rateits 3.0% senior unsecured notes issued by KCS and KCSM (together, the “Floating Rate Senior Notes”) matured. The Floating Rate Senior Notes were redeemed by the Company upon maturitydue May 15, 2023, at a redemptiondiscounted price equal to 100%95.91% of the principal amount using available cash on hand and commercial paper.amount. As a result, the Company recognized a debt retirement benefit of $0.2 million within debt retirement costs in the consolidated statements of income.
RRIF Loan Agreements
The following loans were made under the Railroad Rehabilitation and Improvement Financing (“RRIF”) Program administered by the Federal Railroad Administration (“FRA”):
KCSR RRIF Loan Agreement. On February 21, 2012, KCSR entered into an agreement with the FRA to borrow $54.6 million to be used to reimburse KCSR for a portion of the purchase price of thirty new locomotives (the “Locomotives”) acquired by KCSR in the fourth quarter of 2011. The loan bears interest at 2.96% annually and the principal balance amortizes quarterly with a final maturity of February 24, 2037. The obligations under the financing agreement are secured by a first priority security interest in the Locomotives and certain related rights. In addition, the Company has agreed to guarantee repayment of the amounts due under the financing agreement and certain related agreements. The occurrence of an event of default could result in the acceleration of the repayment of any outstanding principal balance of the loan.
Tex-Mex RRIF Loan Agreement. On June 28, 2005, Tex-Mex entered into an agreement with the FRA to borrow $50.0 million to be used for infrastructure improvements in order to accommodate growing freight rail traffic related to the NAFTA corridor. The loan bears interest at 4.29% annually and the principal balance amortizes quarterly with a final maturity of July 13, 2030. The loan is guaranteed by Mexrail, which has issued a pledge agreement in favor of the lender equal to the gross revenues earned by Mexrail on per-car fees on traffic crossing the International Rail Bridge in Laredo, Texas. In addition, the Company has agreed to guarantee the scheduled principal payment installments due to the FRA from Tex-Mex under the loan agreement on a rolling five-year basis.
Kansas City Southern and Subsidiaries
Notes to Consolidated Financial Statements-(Continued)
Locomotive Financing Agreements
During 2008 and 2011, KCSM entered into various financing agreements totaling $216.0 million to purchase locomotives. The agreements mature between December 2020 and September 2023, are payable on a quarterly or semi-annual basis and contain annual interest rates ranging between 5.737% and 9.310%. KCSM has either granted the lender a security interest in the locomotives to secure the loan or has secured the loans by transferring legal ownership of the locomotives to irrevocable trusts established by KCSM to which the lender is the primary beneficiary and KCSM has a right of reversion upon satisfaction of the obligations of the loan agreements.
KCSM’s locomotive financing agreements contain representations, warranties and covenants typical of such equipment loan agreements. Events of default in the financing agreements include, but are not limited to, certain payment defaults, certain bankruptcy and liquidation proceedings and the failure to perform any covenants or agreements contained in the financing agreements. Any event of default could trigger acceleration of KCSM’s payment obligations under the terms of the financing agreements.
During May 2018, the Company paid the remaining $23.0 million and $19.1 million principal amounts under its locomotive financing agreements with Export Development Canada and DVB Bank AG, respectively, using a portion of the proceeds from the issuance of the 4.70% Senior Notes. As a result of the early repayment, the Company recognized $2.4 million in debt retirement costs in the consolidated statements of income.
Debt Covenants Compliance
The Company was in compliance with all of its debt covenants as of December 31, 2016.2018.
Other Debt Provisions
Certain loan agreements and debt instruments entered into or guaranteed by the Company and its subsidiaries provide for default in the event of a specified change in control of the Company or particular subsidiaries of the Company.
Kansas City Southern and Subsidiaries
Notes to Consolidated Financial Statements-(Continued)
Leases and Debt Maturities
The Company leases transportation equipment, as well as office and other operating facilities, under various capital and operating leases. Rental expenses under operating leases were $61.0$49.3 million, $63.9$59.5 million, and $76.461.0 million for the years ended December 31, 20162018, 20152017 and 20142016, respectively. Operating leases that contain scheduled rent adjustments are recognized on a straight-line basis over the term of the lease. Contingent rentals and sublease rentals were not significant. Minimum annual payments and present value thereof under existing capital leases, other debt maturities and minimum annual rental commitments under non-cancelable operating leases are as follows (in millions):
| | | | Long- Term Debt | | Capital Leases | | Total Debt | | | | | Long- Term Debt | | Capital Leases | | Total Debt | | | | |
| Years | Minimum Lease Payments | | Less Interest | | Net Present Value | | Operating Leases | | Total | Minimum Lease Payments | | Less Interest | | Net Present Value | | Operating Leases | | Total |
| 2017 | $ | 22.0 |
| | $ | 4.9 |
| | $ | 1.5 |
| | $ | 3.4 |
| | $ | 25.4 |
| | $ | 66.4 |
| | $ | 91.8 |
| |
| 2018 | 35.2 |
| | 4.9 |
| | 1.3 |
| | 3.6 |
| | 38.8 |
| | 45.1 |
| | 83.9 |
| |
| 2019 | 15.5 |
| | 3.7 |
| | 1.0 |
| | 2.7 |
| | 18.2 |
| | 39.9 |
| | 58.1 |
| $ | 7.4 |
| | $ | 3.7 |
| | $ | 1.0 |
| | $ | 2.7 |
| | $ | 10.1 |
| | $ | 57.5 |
| | $ | 67.6 |
|
| 2020 | 299.0 |
| | 2.7 |
| | 0.8 |
| | 1.9 |
| | 300.9 |
| | 32.9 |
| | 333.8 |
| 290.9 |
| | 2.7 |
| | 0.8 |
| | 1.9 |
| | 292.8 |
| | 43.6 |
| | 336.4 |
|
| 2021 | 8.8 |
| | 2.7 |
| | 0.6 |
| | 2.1 |
| | 10.9 |
| | 21.7 |
| | 32.6 |
| 4.2 |
| | 2.7 |
| | 0.6 |
| | 2.1 |
| | 6.3 |
| | 26.0 |
| | 32.3 |
|
| 2022 | | 4.3 |
| | 2.7 |
| | 0.4 |
| | 2.3 |
| | 6.6 |
| | 18.9 |
| | 25.5 |
|
| 2023 | | 649.2 |
| | 2.4 |
| | 0.1 |
| | 2.3 |
| | 651.5 |
| | 13.3 |
| | 664.8 |
|
| Thereafter | 1,928.6 |
| | 5.1 |
| | 0.5 |
| | 4.6 |
| | 1,933.2 |
| | 94.5 |
| | 2,027.7 |
| 1,753.2 |
| | 0.1 |
| | — |
| | 0.1 |
| | 1,753.3 |
| | 46.0 |
| | 1,799.3 |
|
| Total | $ | 2,309.1 |
| | $ | 24.0 |
| | $ | 5.7 |
| | $ | 18.3 |
| | $ | 2,327.4 |
| | $ | 300.5 |
| | $ | 2,627.9 |
| $ | 2,709.2 |
| | $ | 14.3 |
| | $ | 2.9 |
| | $ | 11.4 |
| | $ | 2,720.6 |
| | $ | 205.3 |
| | $ | 2,925.9 |
|
In the normal course of business, the Company enters into long-term contractual requirements for future goods and services needed for the operations of the business. Such commitments are not in excess of expected requirements and are not reasonably likely to result in performance penalties or payments that would have a material adverse effect on the Company’s liquidity.
Kansas City Southern and Subsidiaries
Notes to Consolidated Financial Statements-(Continued)
Note 13. Income Taxes
Current income tax expense represents the amounts expected to be reported on the Company’s income tax returns, and deferred tax expense or benefit represents the change in net deferred tax assets and liabilities. Deferred tax assets and liabilities are determined based on the difference between the financial statement and tax bases of assets and liabilities as measured by the enacted tax rates that will be in effect when these differences reverse. Valuation allowances are recorded as appropriate to reduce deferred tax assets to the amount considered likely to be realized.
Tax Expense.Cuts and Jobs Act. IncomeOn December 22, 2017, the President of the United States signed into law the Tax Cuts and Jobs Act (the “Tax Reform Act”). The legislation significantly changed U.S. tax law by, among other things, lowering corporate income tax rates, implementing a territorial tax system and imposing a repatriation tax on deemed repatriated earnings of foreign subsidiaries. The Tax Reform Act permanently reduced the U.S. corporate income tax rate from a maximum of 35% to a 21% rate, effective January 1, 2018.
While the Tax Reform Act provides for a territorial tax system, beginning in 2018, it includes the global intangible low-taxed income (“GILTI”) provision. The Company elected to account for GILTI tax in the period in which it is incurred. The GILTI provisions require the Company to include in its U.S. income tax return foreign subsidiary earnings in excess of an allowable return on the foreign subsidiary’s tangible assets. The GILTI tax expense consistsis primarily caused by a U.S. foreign tax credit limitation which requires an allocation of interest expense to the GILTI income, effectively rendering the allocated interest expense non-deductible. As a result of the following components (in millions):
|
| | | | | | | | | | | |
| | 2016 | | 2015 | | 2014 |
| Current: | | | | | |
| Federal | $ | 1.0 |
| | $ | — |
| | $ | (2.5 | ) |
| State and local | 0.6 |
| | 0.3 |
| | 1.2 |
|
| Foreign | 76.4 |
| | 51.2 |
| | 70.0 |
|
| Total current | 78.0 |
| | 51.5 |
| | 68.7 |
|
| Deferred: | | | | | |
| Federal | 92.7 |
| | 109.3 |
| | 112.6 |
|
| State and local | 13.1 |
| | 15.5 |
| | 16.9 |
|
| Foreign | (1.0 | ) | | 11.0 |
| | 10.6 |
|
| Total deferred | 104.8 |
| | 135.8 |
| | 140.1 |
|
| Total income tax expense | $ | 182.8 |
| | $ | 187.3 |
| | $ | 208.8 |
|
Income beforeProvisional Tax Impacts. On December 22, 2017, the SEC staff issued Staff Accounting Bulletin No. 118 (“SAB 118”) to address the application of U.S. GAAP in situations when a registrant does not have the necessary information available, prepared, or analyzed (including computations) in reasonable detail to complete the accounting for certain income taxes consiststax effects of the Tax Reform Act. The Company recognized a provisional $413.0 million net tax benefit related to the deemed repatriated earnings and the revaluation of deferred tax assets and liabilities in its consolidated financial statements for the year ended December 31, 2017. Adjustments made to the provisional amounts allowed under SAB 118 were identified and recorded as discrete adjustments as described in the following (in millions):paragraphs.
On April 2, 2018, the Internal Revenue Service (“IRS”) issued guidance on how to determine, report and pay the repatriation tax on deemed repatriated earnings of foreign subsidiaries provided in the Tax Reform Act and included in the consolidated financial statements for the year ended December 31, 2017. During the second quarter of 2018, the Company recognized a $4.3 million discrete tax benefit resulting from the additional guidance. |
| | | | | | | | | | | |
| | 2016 | | 2015 | | 2014 |
| Income before income taxes: | | | | | |
| U.S. | $ | 279.9 |
| | $ | 315.0 |
| | $ | 326.5 |
|
| Foreign | 382.8 |
| | 357.6 |
| | 386.6 |
|
| Total income before income taxes | $ | 662.7 |
| | $ | 672.6 |
| | $ | 713.1 |
|
Kansas City Southern and Subsidiaries
Notes to Consolidated Financial Statements-(Continued)
Tax Expense (Benefit). Income tax expense (benefit) consists of the following components (in millions):
|
| | | | | | | | | | | |
| | 2018 | | 2017 | | 2016 |
| Current: | | | | | |
| Federal | $ | (10.5 | ) | | $ | 47.3 |
| | $ | 1.0 |
|
| State and local | 0.7 |
| | 0.6 |
| | 0.6 |
|
| Foreign | 175.6 |
| | 163.8 |
| | 76.4 |
|
| Total current | 165.8 |
| | 211.7 |
| | 78.0 |
|
| Deferred: | | | | | |
| Federal | 77.6 |
| | (350.1 | ) | | 92.7 |
|
| State and local | 9.1 |
| | 11.9 |
| | 13.1 |
|
| Foreign | 5.0 |
| | 36.9 |
| | (1.0 | ) |
| Total deferred | 91.7 |
| | (301.3 | ) | | 104.8 |
|
| Total income tax expense (benefit) | $ | 257.5 |
| | $ | (89.6 | ) | | $ | 182.8 |
|
Income before income taxes consists of the following (in millions):
|
| | | | | | | | | | | |
| | 2018 | | 2017 | | 2016 |
| Income before income taxes: | | | | | |
| U.S. | $ | 366.2 |
| | $ | 331.8 |
| | $ | 279.9 |
|
| Foreign | 520.7 |
| | 542.5 |
| | 382.8 |
|
| Total income before income taxes | $ | 886.9 |
| | $ | 874.3 |
| | $ | 662.7 |
|
The tax effects of temporary differences that give rise to significant portions of the deferred tax assets and deferred tax liabilities follow at December 31 follow (in millions):
| | | | 2016 | | 2015 | 2018 | | 2017 |
| Assets: | | | | | | |
| Tax credit and loss carryovers | $ | 70.7 |
| | $ | 83.6 |
| $ | 28.9 |
| | $ | 26.9 |
|
| Reserves not currently deductible for tax | 79.8 |
| | 84.2 |
| 48.0 |
| | 54.1 |
|
| Other | 31.6 |
| | 35.7 |
| 26.4 |
| | 25.2 |
|
| Gross deferred tax assets before valuation allowance | 182.1 |
| | 203.5 |
| 103.3 |
| | 106.2 |
|
| Valuation allowance | (1.7 | ) | | (1.1 | ) | (2.3 | ) | | (2.1 | ) |
| Net deferred tax assets | 180.4 |
| | 202.4 |
| 101.0 |
| | 104.1 |
|
| Liabilities: | | | | | | |
| Property | (1,389.0 | ) | | (1,314.9 | ) | (1,099.2 | ) | | (1,012.7 | ) |
| Investments | (73.8 | ) | | (71.3 | ) | (49.7 | ) | | (48.0 | ) |
| Other | (6.9 | ) | | (7.3 | ) | (32.0 | ) | | (30.6 | ) |
| Gross deferred tax liabilities | (1,469.7 | ) | | (1,393.5 | ) | (1,180.9 | ) | | (1,091.3 | ) |
| Net deferred tax liability | $ | (1,289.3 | ) | | $ | (1,191.1 | ) | $ | (1,079.9 | ) | | $ | (987.2 | ) |
Kansas City Southern and Subsidiaries
Notes to Consolidated Financial Statements-(Continued)
Tax Rates. Differences between the Company’s effective income tax rate and the U.S. federal statutory income tax rate of 21% for 2018 and 35% for 2017 and 2016 follow (in millions):
| | | | 2016 | | 2015 | | 2014 | 2018 | | 2017 | | 2016 |
| | Dollars | | Percent | | Dollars | | Percent | | Dollars | | Percent | Dollars | | Percent | | Dollars | | Percent | | Dollars | | Percent |
| Income tax expense using the statutory rate in effect | $ | 231.9 |
| | 35.0 | % | | $ | 235.4 |
| | 35.0 | % | | $ | 249.6 |
| | 35.0 | % | $ | 186.2 |
| | 21.0 | % | | $ | 306.0 |
| | 35.0 | % | | $ | 231.9 |
| | 35.0 | % |
| Tax effect of: | | | | | | | | | | | | | | | | | | | | | | |
| Difference between U.S. and foreign tax rate | (17.4 | ) | | (2.6 | %) | | (17.8 | ) | | (2.6 | %) | | (23.0 | ) | | (3.2 | %) | 46.1 |
| | 5.2 | % | | (26.6 | ) | | (3.0 | %) | | (19.2 | ) | | (2.9 | %) |
| Foreign exchange (i) | (45.0 | ) | | (6.8 | %) | | (40.5 | ) | | (6.1 | %) | | (24.2 | ) | | (3.4 | %) | 21.8 |
| | 2.5 | % | | 31.6 |
| | 3.6 | % | | (45.0 | ) | | (6.8 | %) |
| Tax credits | | (14.2 | ) | | (1.6 | %) | | (8.4 | ) | | (1.0 | %) | | (14.3 | ) | | (2.2 | %) |
| Global intangible low-taxed income (“GILTI”) tax, net | | 11.8 |
| | 1.3 | % | | — |
| | — |
| | — |
| | — |
|
| Withholding tax | | 11.2 |
| | 1.3 | % | | 8.1 |
| | 0.9 | % | | 9.6 |
| | 1.4 | % |
| State and local income tax provision, net | 8.1 |
| | 1.2 | % | | 10.3 |
| | 1.5 | % | | 11.7 |
| | 1.6 | % | 7.5 |
| | 0.8 | % | | 8.3 |
| | 1.0 | % | | 8.1 |
| | 1.2 | % |
| Change in U.S. tax rate | | (2.2 | ) | | (0.3 | %) | | (487.6 | ) | | (55.8 | %) | | — |
| | — |
|
| Deemed mandatory repatriation | | (18.7 | ) | | (2.1 | %) | | 74.6 |
| | 8.6 | % | | — |
| | — |
|
| Other, net | 5.2 |
| | 0.8 | % | | (0.1 | ) | | — |
| | (5.3 | ) | | (0.7 | %) | 8.0 |
| | 0.9 | % | | 4.4 |
| | 0.5 | % | | 11.7 |
| | 1.9 | % |
| Income tax expense | $ | 182.8 |
| | 27.6 | % | | $ | 187.3 |
| | 27.8 | % | | $ | 208.8 |
| | 29.3 | % | |
| Income tax expense (benefit) | | $ | 257.5 |
| | 29.0 | % | | $ | (89.6 | ) | | (10.2 | %) | | $ | 182.8 |
| | 27.6 | % |
_____________________
| |
| (i) | Mexican income taxes are paid in Mexican pesos, and as a result, the effective income tax rate reflects fluctuations in the value of the Mexican peso against the U.S. dollar. The foreign exchange impact on income taxes includes the gain or loss from the revaluation of the Company’s net U.S. dollar-denominated monetary liabilities into Mexican pesos which is included in Mexican taxable income under Mexican tax law. As a result, a strengthening of the Mexican peso against the U.S. dollar for the reporting period will generally increase the Mexican cash tax obligation and the effective income tax rate, and a weakening of the Mexican peso against the U.S. dollar for the reporting period will generally decrease the Mexican cash tax obligation and the effective tax rate. To hedge its exposure to this cash tax risk, the Company enters into foreign currency derivative contracts, which are measured at fair value each period and any change in fair value is recognized in foreign exchange lossgain (loss) within the consolidated statements of income. Refer to Note 10, Derivative Instruments for further information. |
Kansas City Southern and Subsidiaries
Notes to Consolidated Financial Statements-(Continued)
Difference Attributable to Foreign Investments. At December 31, 2016,As a result of the Company’s cumulativedeemed mandatory repatriation provisions in the Tax Reform Act, the Company included $1,395.7 million of undistributed earnings in income subject to U.S. tax at reduced tax rates. In addition, the Company recognized $226.1 million of global intangible low-taxed income (“GILTI”) included in the Tax Reform Act which increases earnings previously taxed in the U.S. As a result, the Company does not intend to distribute earnings in a taxable manner, and therefore intends to limit distributions to earnings previously taxed in the U.S., or earnings that would qualify for the 100 percent dividends received deduction provided for in the Tax Reform Act, and earnings that would not result in any significant foreign subsidiaries was $2,181.8 million.taxes. The Company repatriated $233.8 million during 2018 of earnings previously taxed in the U.S. resulting in no significant taxes. Therefore, the Company has not providedrecognized a deferred income tax liability on the undistributed earnings because the Company intends to indefinitely reinvest the earnings outside the U.S. or remit the earningsits investment in tax-free transactions. If the foreign earnings were to be remitted in a taxable transaction, as of December 31, 2016, the Company would incur gross federal income taxes of $763.6 million which would be partially offset by foreign tax credits.subsidiaries.
Tax Carryovers. The Company has U.S. state net operating losses which are carried forward from 5 to 20 years and are analyzed each year to determine the likelihood of realization. The state loss carryovers arise from both combined and separate tax filings from as early as 1999 and may expire as early as December 31, 20172019 and as late as December 31, 2036.2038. The state loss carryover at December 31, 2016,2018, was $435.1$443.3 million resulting in a state deferred tax asset of $26.2 million. In addition, the Company has $49.6 million of U.S. federal tax credit carryovers consisting primarily of $37.2 million of track maintenance credits which, if not used, will begin to expire in 2025.
Kansas City Southern and Subsidiaries
Notes to Consolidated Financial Statements-(Continued)
The Mexico federal loss carryovers at December 31, 2016,2018, were $7.5$7.9 million and, if not used, will begin to expire in 2025.2026. A deferred tax asset was recordedrecognized in prior periods for the expected future tax benefit of these losses which will be carried forward to reduce only Mexican income tax payable in future years. A deferred tax asset is also recorded for an asseta foreign tax credit carryover in the amount of $4.3$5.1 million, which if not used, will begin to expire in 2017.2028.
The valuation allowance for deferred tax assets as of December 31, 20162018 and 2015,2017, was $1.7$2.3 million and $1.1$2.1 million, respectively.respectively, primarily attributable to state net operating loss carryovers. The Company believes it is more likely than not that reversals of existing temporary differences that will produce future taxable income and the results of future operations will generate sufficient taxable income to realize the deferred tax assets, net of valuation allowances, related to loss carryovers and tax credits.carryovers.
Uncertain Tax Positions. The accounting guidance for uncertainty in income taxes prescribes a recognition threshold and measurement attribute for the financial statement recognition and measurement of a tax position taken or expected to be taken in a tax return. The guidance requires the Company to recognize in the consolidated financial statements the benefit of a tax position only if the impact is more likely than not of being sustained on audit based on the technical merits of the position. A reconciliation of the beginning and ending amount of unrecognized tax benefits is as follows (in millions):
| | | | 2016 | | 2015 | 2018 | | 2017 |
| Balance at January 1, | $ | 1.7 |
| | $ | 1.7 |
| $ | — |
| | $ | 3.8 |
|
| Additions based on tax positions related to the current year | 1.3 |
| | — |
| |
| Additions for tax positions of prior years | 2.5 |
| | — |
| 2.2 |
| | — |
|
| Reductions for tax positions of prior years | | — |
| | (0.1 | ) |
| Reductions as a result of lapse of statute of limitations | (1.7 | ) | | — |
| — |
| | (3.7 | ) |
| Balance at December 31, | $ | 3.8 |
| | $ | 1.7 |
| $ | 2.2 |
| | $ | — |
|
AllA tax expense of $2.2 million was recognized in the third quarter of 2018 relating to an uncertain tax position on tax credits generated in prior tax years. The unrecognized tax benefitsbenefit would affect the effective income tax rate if recognized, and is not expected to significantly change in the next twelve months.
Interest and penalties related to uncertain tax positions are included in income before taxes on the consolidated statements of income. Accrued interest and penalties on unrecognized tax benefits and interest and penalty expense was immaterial to the consolidated financial statements for all periods presented.
Tax Contingencies. Tax returns filed in the U.S. for periods after 20122014 and in Mexico for periods after 2008 for KCSM and after 2010 for Mexico subsidiaries other than KCSM2012 remain open to examination by the taxing authorities. In 2018, the IRS initiated an examination of the 2016 U.S. federal tax return. The Company does not expect that the examination will have a material impact on the consolidated financial statements. During the first quarter of 2017, the Company received audit assessments from the Servicio de Administración Tributaria (the “SAT”), the Mexican equivalent of the IRS, is currently examiningfor the KCSM 2009 2010 and 20112010 Mexico tax returnsreturns. In 2017, the Company commenced administrative actions with the SAT. During the first quarter of 2018, the audit assessments were nullified by the SAT. In the third quarter of 2018, the SAT issued new assessments and the 2013 Mexico tax returnCompany filed administrative appeals with the SAT. The Company believes that it has strong legal arguments in its favor and it is more likely than not that it will prevail in any challenge of KCSM Servicios. An SAT examination was completed during the second quarter of 2016 without adjustment for the 2012 Mexico tax return of KCSM Servicios. assessments.
The Company litigated a Value Added Tax (“VAT”) audit assessment from the SAT for KCSM for the year ended December 31, 2005. In November 2016, KCSM was notified of a resolution by the Mexican tax court annulling this assessment. The SAT has appealed this resolution to the Mexican circuit court. In September 2017, KCSM was notified of a resolution by the circuit court which ordered the tax court to consider an argument made by KCSM in the original tax court proceeding that was not addressed in the tax court’s November 2016 resolution. In October 2017, the tax court ruled that the arguments made by KCSM asserting that the SAT unduly extended the audit process were not valid, and also annulled the assessment consistent with the tax court’s earlier November 2016 ruling. In December 2017, KCSM and the SAT filed an appeal with the Federal Courts of Appeals. In November 2018, the Appeals Court issued a ruling denying the SAT appeal and permanently annulled the VAT assessment. The Company believes itSAT is more likely than not that it will continueunable to prevail in this matter. However, an unexpected adverse resolution could haveappeal the decision. The Appeals Court also denied KCSM’s appeal, therefore through March 29, 2019, the SAT can issue a material effect on the consolidated financial statements in a particular quarter or fiscal year.new assessment; however, any such new assessment would
Kansas City Southern and Subsidiaries
Notes to Consolidated Financial Statements-(Continued)
result in no tax being assessed based on the Tax Court’s guidelines, and therefore should not have a material impact to the Company’s consolidated financial statements.
KCSM has not historically assessed VAT on international import transportation services provided to its customers based on a written ruling that KCSM obtained from the SAT in 2008 stating that such services were not subject to VAT (the “2008 Ruling”). Notwithstanding the 2008 Ruling, in December 2013, the SAT unofficially informed KCSM of an intended implementation of new criteria effective as of January 1, 2014, pursuant to which VAT would be assessed on all international import transportation services on the portion of the services provided within Mexico. Additionally, in November 2013, the SAT filed an action to nullify the 2008 Ruling, potentially exposing the application of the new criteria to open tax years. In February 2014, KCSM filed an action opposing the SAT’s nullification action. In December 2016, KCSM was notified of a resolution issued by the Mexican tax court confirming the 2008 Ruling. The SAT appealed this resolution. In October 2017, the circuit court resolved to not render a decision on the case but rather to send the SAT’s appeal to the Supreme Court. In February 2018, the Supreme Court decided not to hear the case and remanded the SAT’s appeal back to the circuit court for a decision. In July 2018, the circuit court ordered the tax court to consider certain arguments made by the SAT in the original court proceeding that were not addressed in the tax court’s December 2016 resolution. On October 2, 2018, the tax court issued a decision confirming the 2008 Ruling. The SAT has appealed this resolution.decision. The Company believes it is more likely than not that it will continue to prevail in this matter. AsFurther, as of the date of this filing, the SAT has not implemented any new criteria regarding thisthe assessment of VAT on international import transportation services. The Company believes it is probable that any unexpected nullification of the 2008 Ruling and the implementation of any new VAT criteria would be applied on a prospective basis, in which case, due to the pass-through nature of VAT, KCSM would begin to assess its customers for VAT on international import transportation services, resulting in no material impact to the Company’s consolidated financial statements.
Note 14. Stockholders’ Equity
Information regarding the Company’s capital stock at December 31 follows:
| | | | Shares Authorized | | Shares Issued | Shares Authorized | | Shares Issued |
| | 2016 | | 2015 | 2016 | | 2015 | 2018 | | 2017 | 2018 | | 2017 |
| $25 par, 4% noncumulative, preferred stock | 840,000 |
| | 840,000 |
| | 649,736 |
| | 649,736 |
| 840,000 |
| | 840,000 |
| | 649,736 |
| | 649,736 |
|
| $1 par, preferred stock | 2,000,000 |
| | 2,000,000 |
| | — |
| | — |
| 2,000,000 |
| | 2,000,000 |
| | — |
| | — |
|
| $.01 par, common stock | 400,000,000 |
| | 400,000,000 |
| | 123,352,185 |
| | 123,352,185 |
| 400,000,000 |
| | 400,000,000 |
| | 123,352,185 |
| | 123,352,185 |
|
Shares outstanding at December 31:
| | | | 2016 | | 2015 | 2018 | | 2017 |
| $25 par, 4% noncumulative, preferred stock | 242,170 |
| | 242,170 |
| 228,395 |
| | 242,170 |
|
| $.01 par, common stock | 106,606,619 |
| | 108,461,144 |
| 100,896,678 |
| | 103,036,805 |
|
Share Repurchase Program.Repurchases. In May 2015,August 2017, the Company announced a new common share repurchase program ofauthorizing the Company to purchase up to $500.0$800.0 million which expires on June 30, 2017. Management's assessment of market conditions, available liquidity and other factors will determine the timing and volume of repurchases. During 2016, KCS repurchased 2,127,612its outstanding shares of common stock for $185.4 million atthrough June 30, 2020 (the “2017 Program”). Share repurchases may be made in the open market, through privately negotiated transactions, or through an average price of $87.15 peraccelerated share under this program. Since inception of thisrepurchase (“ASR”) program KCS has repurchased 4,261,596 shares of common stock for $379.6 million at an average price of $89.07 per share. The excess of repurchase price over par value is allocated between additional paid-in capital and retained earnings.
Treasury Stock. Shares of common stock in Treasury and related activity follow:
|
| | | | | | | | |
| | 2016 | | 2015 | | 2014 |
| Balance at beginning of year | 14,891,041 |
| | 12,959,855 |
| | 13,122,956 |
|
| Shares repurchased | 2,127,612 |
| | 2,133,984 |
| | — |
|
| Shares issued to fund stock option exercises | (15,264 | ) | | (89,035 | ) | | (46,100 | ) |
| Employee stock purchase plan shares issued | (82,372 | ) | | (52,736 | ) | | (33,402 | ) |
| Nonvested shares issued | (179,309 | ) | | (62,936 | ) | | (121,865 | ) |
| Nonvested shares forfeited | 3,858 |
| | 1,909 |
| | 38,266 |
|
| Balance at end of year | 16,745,566 |
| | 14,891,041 |
| | 12,959,855 |
|
Change in Control Provisions.limited to $200.0 million. The Company and certain of its subsidiaries have entered into agreements with certain employees whereby, upon defined circumstances constituting a change in controland settled an ASR program for the full ASR amount authorized under the 2017 Program during the second half of the Company or subsidiary, certain stock2017.
Kansas City Southern and Subsidiaries
Notes to Consolidated Financial Statements-(Continued)
options become exercisable, certain benefit entitlements are automatically fundedDuring 2018, the Company repurchased 2,272,213 shares of common stock at an average price of $106.98 per share and such employees are entitled to specified cash payments upon terminationa total cost of employment.$243.1 million. Since inception of the 2017 Program, the Company has repurchased 4,691,682 shares at an average price of $106.20 per share and a total cost of $498.3 million.
TheDuring 2018, the Company and certainrepurchased 13,775 shares of its subsidiaries have established trusts to provide$25 par preferred stock for the funding$0.4 million at an average price of corporate commitments$26.23 per share.
Treasury Stock. Shares of common and entitlements of certain officers, directors, employeespreferred stock in treasury and others in the event of a specified change in control of the Company or subsidiary. Assets held in such trusts on related activity follow:December 31, 2016 and 2015, were not material. Depending upon the circumstances at the time of any such change in control, the most significant of which would be the price paid for KCS common stock by a party seeking to control the Company, funding of the Company’s trusts could be substantial.
|
| | | | | | | | |
| | 2018 | | 2017 | | 2016 |
| Balance at beginning of year | 20,315,380 |
| | 16,745,566 |
| | 14,891,041 |
|
| Shares repurchased | 2,285,988 |
| | 3,759,678 |
| | 2,127,612 |
|
| Shares issued to fund stock option exercises | (24,024 | ) | | (9,110 | ) | | (15,264 | ) |
| Employee stock purchase plan shares issued | (62,866 | ) | | (76,401 | ) | | (82,372 | ) |
| Nonvested shares issued | (51,191 | ) | | (124,519 | ) | | (179,309 | ) |
| Nonvested shares forfeited | 5,995 |
| | 20,166 |
| | 3,858 |
|
| Balance at end of year | 22,469,282 |
| | 20,315,380 |
| | 16,745,566 |
|
Cash Dividends on Common Stock. The following table presents the amount of cash dividends declared per common share by the Company’s Board of Directors:
|
| | | | | | | | | | | |
| | 2016 | | 2015 | | 2014 |
| Cash dividends declared per common share | $ | 1.32 |
| | $ | 1.32 |
| | $ | 1.12 |
|
|
| | | | | | | | | | | |
| | 2018 | | 2017 | | 2016 |
| Cash dividends declared per common share | $ | 1.44 |
| | $ | 1.38 |
| | $ | 1.32 |
|
Note 15. Share-Based Compensation
On October 7, 2008,May 4, 2017, the Company’sCompany’ stockholders approved the Kansas City Southern 2017 Equity Incentive Plan (the “2017 Plan”), which replaced the Kansas City Southern 2008 Stock Option and Performance Award Plan (the “2008 Plan”). The 2008 plan became effectiveBoard of Directors and its Compensation and Organization Committee had previously adopted the 2017 Plan, subject to stockholder approval, on October 14, 2008January 26, 2017, and replaced the Kansas City Southern 1991 Amended and Restated Stock Option and Performance Award Plan.February 17, 2017, respectively. The 20082017 Plan provides for the granting of up to 2.3 million3,750,000 shares of the Company’s common stock to eligible persons as defined in the 20082017 Plan. The material terms and performance measures ofOutstanding equity awards granted under the 2008 Plan were reapprovedand the 2017 Plan (the “Plans”) are to be governed by the Company’s stockholders on May 2, 2013.
On February 19, 2016terms and conditions of each individual plan and the Company granted 66,320 shares of nonvested stock (“the market-based award”) under the 2008 Plan. The market-basedrelated award contains a market condition that accelerates the vesting in three tranches if the twenty trading day volume-weighted average price of the Company’s common stock is above $84.14, $91.79 or $99.44. If the target share prices are met prior to December 31, 2017, the awards would vest on January 5, 2018. If the target prices are met after January 1, 2018 but prior to the fifth anniversary of the grant date, the awards would vest immediately. If the target prices are not met prior to the fifth anniversary of the grant date, the awards would forfeit. The target prices of $84.14 and $91.79 were met in the first and second quarters of 2016, respectively. The target price of $99.44 has not been met as of December 31, 2016. See further details in the nonvested stock summary table below.agreements.
Stock Options. The exercise price for options granted under the 2008 PlanPlans equals the closing market price of the Company’s stock on the date of grant. Options generally have a 3 year-year vesting period and are exercisable over the 10 year-year contractual term, except that options outstanding become immediately exercisable upon certain defined circumstances constituting a change in control of the Company. The grant date fair value less estimated forfeitures, is recorded to expense on a straight-line basis over the vesting period.
The fair value of each option award is estimated on the date of grant using the Black-Scholes option pricing model. The weighted-average assumptions used were as follows:
| | | | 2016 | | 2015 | | 2014 | 2018 | | 2017 | | 2016 |
| Expected dividend yield | 1.60 | % | | 0.94 | % | | 1.19 | % | 1.36 | % | | 1.52 | % | | 1.60 | % |
| Expected volatility | 32.29 | % | | 37.11 | % | | 45.57 | % | 27.09 | % | | 30.74 | % | | 32.29 | % |
| Risk-free interest rate | 1.51 | % | | 1.82 | % | | 1.96 | % | 2.80 | % | | 2.20 | % | | 1.51 | % |
Expected term (years) | 6.0 |
| | 6.0 |
| | 6.0 |
| 6.0 |
| | 6.0 |
| | 6.0 |
|
| Weighted-average grant date fair value of stock options granted | $ | 22.98 |
| | $ | 41.49 |
| | $ | 38.31 |
| $ | 28.52 |
| | $ | 24.49 |
| | $ | 22.98 |
|
Kansas City Southern and Subsidiaries
Notes to Consolidated Financial Statements-(Continued)
The expected dividend yield is calculated as the ratio of dividends paid per share of common stock to the stock price on the date of grant. The expected volatility is based on the historical volatility of the Company’s stock price over a term equal to the estimated life of the options. The risk-free interest rate is determined based on U.S. Treasury rates for instruments with
Kansas City Southern and Subsidiaries
Notes to Consolidated Financial Statements-(Continued)
terms approximating the expected lifeterm of the options granted, which represents the period of time the awards are expected to be outstanding and is based on the historical experience of similar awards.
A summary of stock option activity is as follows:
|
| | | | | | | | | | | | |
| | Number of Shares | | Weighted- Average Exercise Price Per Share | | Weighted- Average Remaining Contractual Term | | Aggregate Intrinsic Value |
| | | | | | In years | | In millions |
| Options outstanding at December 31, 2015 | 317,745 |
| | $ | 73.94 |
| | | | |
| Granted | 113,127 |
| | 82.71 |
| | | | |
| Exercised | (15,264 | ) | | 57.48 |
| | | | |
| Forfeited or expired | (805 | ) | | 106.52 |
| | | | |
| Options outstanding at December 31, 2016 | 414,803 |
| | $ | 76.87 |
| | 6.4 | | $ | 6.0 |
|
| Vested and expected to vest at December 31, 2016 | 411,726 |
| | $ | 76.77 |
| | 6.4 | | $ | 6.0 |
|
| Exercisable at December 31, 2016 | 253,188 |
| | $ | 67.60 |
| | 5.0 | | $ | 5.8 |
|
|
| | | | | | | | | | | | |
| | Number of Shares | | Weighted- Average Exercise Price Per Share | | Weighted- Average Remaining Contractual Term | | Aggregate Intrinsic Value |
| | | | | | In years | | In millions |
| Options outstanding at December 31, 2017 | 500,624 |
| | $ | 78.74 |
| | | | |
| Granted | 93,070 |
| | 105.83 |
| | | | |
| Exercised | (24,024 | ) | | 74.57 |
| | | | |
| Forfeited or expired | (5,155 | ) | | 94.32 |
| | | | |
| Options outstanding at December 31, 2018 | 564,515 |
| | $ | 83.24 |
| | 5.8 | | $ | 9.1 |
|
| | | | | | | | |
| Exercisable at December 31, 2018 | 385,774 |
| | $ | 77.26 |
| | 4.6 | | $ | 8.3 |
|
The aggregate intrinsic value in the table above, which is the amount by which the market value of the underlying stock exceeded the exercise price of outstanding options, represents the amount optionees would have realized if all in-the-money options had been exercised on the last business day of the period indicated.
Compensation cost of $2.5 million, $2.02.3 million, and $1.72.5 million was recognized for stock option awards for the years ended December 31, 20162018, 20152017, and 20142016, respectively. The total income tax benefit recognized in the consolidated statements of income was $0.9$0.6 million, $0.70.8 million, and $0.70.9 million for the years ended December 31, 20162018, 20152017 and 20142016, respectively.
Additional information regarding stock option exercises appears in the table below (in millions):
| | | | 2016 | | 2015 | | 2014 | 2018 | | 2017 | | 2016 |
| Aggregate grant-date fair value of stock options vested | $ | 1.8 |
| | $ | 2.0 |
| | $ | 2.3 |
| $ | 1.9 |
| | $ | 2.8 |
| | $ | 1.8 |
|
| Intrinsic value of stock options exercised | 0.6 |
| | 6.1 |
| | 3.3 |
| 1.0 |
| | 0.2 |
| | 0.6 |
|
| Cash received from option exercises | 0.9 |
| | 4.2 |
| | 2.0 |
| 1.8 |
| | 0.7 |
| | 0.9 |
|
| Tax benefit realized from options exercised during the annual period | 0.2 |
| | 2.3 |
| | 1.3 |
| |
| Tax benefit from options exercised during the annual period | | 0.2 |
| | 0.1 |
| | 0.2 |
|
As of December 31, 20162018, $1.1$1.3 million of unrecognized compensation cost relating to nonvested stock options is expected to be recognized over a weighted-average period of 1.0 year. At December 31, 20162018, there were 562,7543,468,741 shares available for future grants under the 20082017 Plan.
Nonvested Stock. The 2008 Plan providesPlans provide for the granting of nonvested stock awards to officers and other designated employees. The grant date fair value is based on the closing market price on the date of the grant. These awards are subject to forfeiture if employment terminates during the vesting period, which is generally 3 year or 5 year vesting for employees. Awards granted to the Company’s directors vest immediately on date of grant. The grant date fair value of nonvested shares less estimated forfeitures, is recorded to compensation expense on a straight-line basis over the vesting period.
Kansas City Southern and Subsidiaries
Notes to Consolidated Financial Statements-(Continued)
On February 19, 2016 the Company granted 66,320 shares of nonvested stock (“the market-based award”) under the 2008 Plan that contained a market condition that accelerated the vesting in three tranches if the twenty trading day volume-weighted average price of the Company’s common stock was above certain targets, which fully vested on January 5, 2018.
The fair value and requisite service period of nonvested market-based awards granted on February 19, 2016 arewere estimated on the date of grant using the Monte Carlo simulation model. The assumptions used in the Monte Carlo simulation model are consistent with those used to value stock options and were as follows:
|
| | | | | |
| | | | Nonvested Stock |
| Expected dividend yield | | | 1.58 | % |
| Expected volatility | | | 31.68 | % |
| Risk-free interest rate | | | 0.53% - 1.89% |
|
Expected term (years) | | | 1.9 |
|
| Weighted-average grant date fair value | | | $ | 70.95 |
|
A summary of nonvested stock activity is as follows:
| | | | Number of Shares | | Weighted- Average Grant Date Fair Value | | Aggregate Intrinsic Value | Number of Shares | | Weighted- Average Grant Date Fair Value | | Aggregate Intrinsic Value |
| | | | | | In millions | | | | | In millions |
| Nonvested stock at December 31, 2015 | 146,783 |
| | $ | 99.61 |
| | | |
| Nonvested stock at December 31, 2017 | | 276,679 |
| | $ | 93.28 |
| | |
| Granted | 174,703 |
| | 80.92 |
| | | 83,099 |
| | 106.52 |
| | |
| Vested | (79,618 | ) | | 81.55 |
| | | (96,162 | ) | | 95.75 |
| | |
| Forfeited | (3,858 | ) | | 123.02 |
| | | (5,995 | ) | | 94.20 |
| | |
| Nonvested stock at December 31, 2016 | 238,010 |
| | $ | 91.55 |
| | $ | 20.2 |
| |
| Nonvested stock at December 31, 2018 | | 257,621 |
| | $ | 96.61 |
| | $ | 24.6 |
|
The fair value (at vest date) of shares vested during the years ended December 31, 20162018, 20152017, and 20142016 was $7.0$10.4 million, $6.45.9 million, and $8.57.0 million, respectively.
The weighted-average grant date fair value of nonvested stock granted during 20162018, 20152017, and 20142016 was $80.92,$106.52, $112.0393.29 and $105.0480.92, respectively. Compensation cost for nonvested stock and market-based awards was $9.6$10.8 million, $5.19.3 million, and $4.09.6 million for the years ended December 31, 20162018, 20152017, and 20142016, respectively. The total income tax benefit recognized in the consolidated statements of income was $3.5$2.6 million, $1.93.5 million, and $1.53.5 million for the years ended December 31, 20162018, 20152017, and 20142016, respectively.
As of December 31, 20162018, $11.4$11.3 million of unrecognized compensation costs related to nonvested stock and market-based awards is expected to be recognized over a weighted-average period of 1.41.1 years.
Performance Based Awards. The Company granted performance based nonvested stock awards during 2018 (the “2018 Awards”), 2017 (the “2017 Awards”) and 2016 (the “2016 Awards”), 2015 (the “2015 Awards”) and 2014 (the “2014 Awards”). The awards granted provide a target number of shares that generally vest at the end of a 3 year-year requisite service period following the grant date. In addition to the service condition, the number of nonvested shares to be received depends on the attainment of defined Company-wide performance goals based on operating ratio (“OR”) and return on invested capital (“ROIC”) over a three-year performance period. The 2016 Awardsawards are also subject to a revenue growth multiplier based on a three-year performance period calculated as defined in the related award agreement that can range from 80% to 140% of the award earned based on the OR and ROIC achieved. The number of nonvested shares ultimately earned will range between zero to 200% of the target award.
Kansas City Southern and Subsidiaries
Notes to Consolidated Financial Statements-(Continued)
A summary of performance based nonvested stock activity at target is as follows:
| | | | Target Number of Shares * | | Weighted-Average Grant Date Fair Value | Target Number of Shares * | | Weighted-Average Grant Date Fair Value |
| Nonvested stock, at December 31, 2015 | 141,604 |
| | $ | 106.83 |
| |
| Nonvested stock, at December 31, 2017 | | 139,502 |
| | $ | 93.05 |
|
| Granted | 62,866 |
| | 82.71 |
| 50,162 |
| | 105.83 |
|
| Vested | (59,463 | ) | | 105.03 |
| (32,219 | ) | | 119.35 |
|
| Forfeited | (608 | ) | | 105.55 |
| (4,466 | ) | | 91.89 |
|
| Nonvested stock, at December 31, 2016 | 144,399 |
| | $ | 97.08 |
| |
| Nonvested stock, at December 31, 2018 | | 152,979 |
| | $ | 91.74 |
|
_____________________
* For the 20162018 Awards and the 20152017 Awards, participants in the aggregate can earn up to a maximum of 125,73299,594 and 70,420104,220 shares, respectively. For the 20142016 Awards, the performance shares earned were 36,300.102,144.
The weighted-average grant date fair value of performance based nonvested stock granted during 20162018, 20152017 and 20142016 was $82.71,$105.83, $119.3587.09 and $94.2382.71, respectively. The Company expenses the grant date fair value of the awards which are probable of being earned over the performance periods. Compensation cost on performance based awards was $5.7$5.8 million, $3.06.0 million and $3.75.7 million for the years ended December 31, 20162018, 20152017 and 2014,2016, respectively. Total income tax benefit recognized in the consolidated statements of income for performance based awards was $2.1$1.5 million, $1.12.2 million and $1.32.1 million for the years ended December 31, 20162018, 20152017 and 2014,2016, respectively.
As of December 31, 20162018, $3.9$4.9 million of unrecognized compensation cost related to performance based awards is expected to be recognized over a weighted-average period of 1.0 year.eleven months. The fair value (at vest date) of shares vested for the year ended December 31, 20162018 was $5.0$3.5 million.
Employee Stock Purchase Plan. The employee stock purchase plan (“ESPP”) provides substantially all U.S. full-time employees of the Company, certain subsidiaries and certain other affiliated entities, with the right to subscribe to an aggregate of 4.0 million shares of common stock of the Company.
Prior to January 1, 2015, Under the ESPP, eligible employees couldmay contribute, through payroll deductions, up to 5% of their regular base compensation during six-month purchase periods. The purchase price for shares was equal to 90% of the closing market price on either the exercise date or the offering date, whichever was lower.
Effective January 1, 2015, the ESPP plan was amended to allow eligible employees to contribute up to 10% of their regular base compensation during six-month purchase periods at a purchase price equal to 85% of the closing market price on either the exercise date or the offering date, whichever is lower.
At the end of each purchase period, the accumulated deductions are applied toward the purchase of the Company’s common stock. Both the discount in grant price and the share option purchase price are valued to derive the award’s fair value. The awards vest and the expense is recognized ratably over the offering period.
Kansas City Southern and Subsidiaries
Notes to Consolidated Financial Statements-(Continued)
The following table summarizes activity related to the various ESPP offerings:
|
| | | | | | | | | | | | |
| | Exercise Date | | Received from Employees(i) In millions |
| | Date Issued | | Purchase Price | | Shares Issued | |
| | | | | | | | |
| July 2016 offering | January 12, 2017 | | $ | 72.12 |
| | 36,108 |
| | $ | 2.6 |
|
| January 2016 offering | July 11, 2016 | | 62.66 |
| | 41,895 |
| | 2.6 |
|
| July 2015 offering | January 8, 2016 | | 63.47 |
| | 40,477 |
| | 2.6 |
|
| January 2015 offering | July 6, 2015 | | 77.52 |
| | 35,097 |
| | 2.7 |
|
| July 2014 offering | January 9, 2015 | | 96.48 |
| | 17,639 |
| | 1.7 |
|
| January 2014 offering | July 10, 2014 | | 96.76 |
| | 17,026 |
| | 1.6 |
|
|
| | | | | | | | | | | | |
| | Exercise Date | | Received from Employees(i) In millions |
| | Date Issued | | Purchase Price | | Shares Issued | |
| | | | | | | | |
| July 2018 offering | January 3, 2019 | | $ | 81.13 |
| | 35,972 |
| | $ | 2.9 |
|
| January 2018 offering | July 2, 2018 | | 90.07 |
| | 32,271 |
| | 2.9 |
|
| July 2017 offering | January 4, 2018 | | 89.18 |
| | 30,595 |
| | 2.7 |
|
| January 2017 offering | July 5, 2017 | | 68.70 |
| | 40,293 |
| | 2.8 |
|
| July 2016 offering | January 12, 2017 | | 72.12 |
| | 36,108 |
| | 2.6 |
|
| January 2016 offering | July 11, 2016 | | 62.66 |
| | 41,895 |
| | 2.6 |
|
_____________________
| |
| (i) | Represents amounts received from employees through payroll deductions for share purchases under applicable offering. |
The fair value of the ESPP stock purchase rights is estimated on the date of grant using the Black-Scholes option pricing model. The weighted-average assumptions used for each of the respective periods were as follows:
| | | | Year Ended December 31, | Year Ended December 31, |
| | 2016 | | 2015 | | 2014 | 2018 | | 2017 | | 2016 |
| Expected dividend yield | 1.65 | % | | 1.20 | % | | 0.99 | % | 1.22 | % | | 1.47 | % | | 1.65 | % |
| Expected volatility | 23.84 | % | | 17.00 | % | | 19.03 | % | 13.29 | % | | 17.09 | % | | 23.84 | % |
| Risk-free interest rate | 0.46 | % | | 0.10 | % | | 0.10 | % | 1.73 | % | | 0.89 | % | | 0.46 | % |
Expected term (years) | 0.5 |
| | 0.5 |
| | 0.5 |
| 0.5 |
| | 0.5 |
| | 0.5 |
|
| Weighted-average grant date fair value | $ | 17.29 |
| | $ | 20.55 |
| | $ | 17.13 |
| $ | 18.66 |
| | $ | 17.90 |
| | $ | 17.29 |
|
Compensation expense of $1.4$1.3 million, $1.3 million, and $0.61.4 million was recognized for ESPP option awards for the years ended December 31, 20162018, 20152017, and 20142016, respectively. At December 31, 20162018, there were 3.63.5 million remaining shares available for future ESPP offerings under the plan.
Note 16. Commitments and Contingencies
Concession Duty. Under KCSM’s 50-year Concession, which could expire in 2047 unless extended, KCSM pays annual concession duty expense of 1.25% of gross revenues. For the year ended December 31, 20162018, the concession duty expense, which is recorded within materials and other in operating expenses, was $14.9$17.8 million, compared to $15.4$17.0 million and $15.814.9 million for the same periods in 20152017 and 20142016, respectively.
Litigation. The Company is a party to various legal proceedings and administrative actions, all of which except as set forth below, are of an ordinary, routine nature and incidental to its operations. Included in these proceedings are various tort claims brought by current and former employees for job-related injuries and by third parties for injuries related to railroad operations. KCS aggressively defends these matters and has established liability provisions, which management believes are adequate to cover expected costs. Although it is not possible to predict the outcome of any legal proceeding, in the opinion of management, other than those proceedings described in detail below, such proceedings and actions should not, individually, or in the aggregate, have a material adverse effect on the Company’s consolidated financial statements.
Kansas City Southern and Subsidiaries
Notes to Consolidated Financial Statements-(Continued)
Environmental Liabilities. The Company’s U.S. operations are subject to extensive federal, state and local environmental laws and regulations. The major U.S. environmental laws to which the Company is subject include, among others, the Federal Comprehensive Environmental Response, Compensation and Liability Act (“CERCLA,” also known as the Superfund law), the Toxic Substances Control Act, the Federal Water Pollution Control Act, and the Hazardous Materials Transportation Act. CERCLA can impose joint and several liabilities for cleanup and investigation costs, without regard to fault or legality of the original conduct, on current and predecessor owners and operators of a site, as well as those who generate, or arrange for the disposal of, hazardous substances. The Company does not believe that compliance with the requirements imposed by the environmental legislation will impair its competitive capability or result in any material additional capital expenditures, operating or maintenance costs. The Company is, however, subject to environmental remediation costs as described in the following paragraphs.
The Company’s Mexico operations are subject to Mexican federal and state laws and regulations relating to the protection of the environment through the establishment of standards for water discharge, water supply, emissions, noise pollution, hazardous substances and transportation and handling of hazardous and solid waste. The Mexican government may bring administrative and criminal proceedings, impose economic sanctions against companies that violate environmental laws, and temporarily or even permanently close non-complying facilities.
The risk of incurring environmental liability is inherent in the railroad industry. As part of serving the petroleum and chemicals industry, the Company transports hazardous materials and has a professional team available to respond to and handle environmental issues that might occur in the transport of such materials.
The Company performs ongoing reviews and evaluations of the various environmental programs and issues within the Company’s operations, and, as necessary, takes actions intended to limit the Company’s exposure to potential liability. Although these costs cannot be predicted with certainty, management believes that the ultimate outcome of identified matters will not have a material adverse effect on the Company’s consolidated financial statements.
Personal Injury. The Company’s personal injury liability is based on semi-annual actuarial studies performed on an undiscounted basis by an independent third party actuarial firm and reviewed by management. This liability is based on personal injury claims filed and an estimate of claims incurred but not yet reported. Actual results may vary from estimates due to the number, type and severity of the injury, costs of medical treatments and uncertainties in litigation. Adjustments to the liability are reflected within operating expenses in the period in which changes to estimates are known. Personal injury claims in excess of self-insurance levels are insured up to certain coverage amounts, depending on the type of claim and year of occurrence. The personal injury liability as of December 31, 20162018, is based on an updated actuarial study of personal injury claims through November 30, 20162018, and review of December 20162018 experience. For the years ended December 31, 20162018 and 20152017, the Company recordedrecognized a $1.1$2.4 million increase and $6.1$3.6 million reduction, respectively, in personal injury liability, due to changes in estimates as a result of the Company’s claims development and settlement experience.
The personal injury liability activity was as follows (in millions):
|
| | | | | | | |
| | 2016 | | 2015 |
| Balance at beginning of year | $ | 23.9 |
| | $ | 29.3 |
|
| Accruals | 4.8 |
| | 6.8 |
|
| Changes in estimate | (1.1 | ) | | (6.1 | ) |
| Payments | (3.8 | ) | | (6.1 | ) |
| Balance at end of year | $ | 23.8 |
| | $ | 23.9 |
|
Certain Disputes with Ferromex. KCSM and Ferrocarril Mexicano, S.A. de C.V. (“Ferromex”) use certain trackage rights, switching services and interline services provided by each other. KCSM and Ferromex had not agreed on the rates to be charged for trackage rights and switching services for periods beginning in 1998 through December 31, 2008, or for interline services for periods beginning in 1998 through February 8, 2010. Both KCSM and Ferromex had initiated administrative proceedings seeking a determination by the Mexican Secretaría de Comunicaciones y Transportes (“Secretary of Communications and
Kansas City Southern and Subsidiaries
Notes to Consolidated Financial Statements-(Continued)
Transportation” or “SCT”) of the rates that KCSM and Ferromex should pay each other. The SCT issued rulings in 2002 and 2008 setting the rates for the services and both KCSM and Ferromex had challenged these rulings based on different grounds. Additionally, KCSM and Ferromex had not settled amounts payable to each other for trackage rights and switching services for the year ended December 31, 2009.
In the first quarter of 2016, KCSM and Ferromex executed a settlement agreement resolving amounts payable to each other for trackage rights and switching services for periods beginning in 1998 through December 31, 2009, and for interline services for periods beginning in 1998 through February 8, 2010. Under this settlement agreement, KCSM and Ferromex also agreed to terminate all related administrative proceedings. This settlement agreement did not have a significant effect on the consolidated financial statements. |
| | | | | | | |
| | 2018 | | 2017 |
| Balance at beginning of year | $ | 19.3 |
| | $ | 23.8 |
|
| Accruals | 5.3 |
| | 4.8 |
|
| Changes in estimate | 2.4 |
| | (3.6 | ) |
| Payments | (7.4 | ) | | (5.7 | ) |
| Balance at end of year | $ | 19.6 |
| | $ | 19.3 |
|
Tax Contingencies. Information regarding tax contingencies is included in Note 13, Income Taxes -— Tax Contingencies.
Contractual Agreements. In the normal course of business, the Company enters into various contractual agreements related to commercial arrangements and the use of other railroads’ or governmental entities’ infrastructure needed for the operations of the business. The Company is involved or may become involved in certain disputes involving transportation rates,
Kansas City Southern and Subsidiaries
Notes to Consolidated Financial Statements-(Continued)
product loss or damage, charges, and interpretations related to these agreements. While the outcome of these matters cannot be predicted with certainty, the Company does not believebelieves that, when resolved, these disputes will not have a material effect on its consolidated financial statements.
Credit Risk. The Company continually monitors risks related to economic changes and certain customer receivables concentrations. Significant changes in customer concentration or payment experience,terms, deterioration of customer creditworthiness, bankruptcy, insolvency or liquidation of a customer, or weakening in economic trends could have a significant impact on the collectability of the Company’s receivables and its operating results. If the financial condition of the Company’s customers were to deteriorate and result in an impairment of their ability to make payments, additional allowances may be required. The Company has recorded provisions for uncollectability based on its best estimate as of December 31, 2016.2018.
Panama Canal Railway Company (”PCRC”) Guarantees and Indemnities. At December 31, 20162018, the Company had issued and outstanding $5.5$5.6 million under a standby letter of credit to fulfill its obligation to fund fifty percent of the debt service reserve and liquidity reserve established by PCRC in connection with the issuance of the 7.0% Senior Secured Notes due November 1, 2026 (the “PCRC Notes”). Additionally, KCS has pledged its shares of PCRC as security for the PCRC Notes.
Mexican Antitrust Review. Pursuant to the Mexican Regulatory Railroad Service Law as recently amended and the new Mexican Antitrust Law, on September 12, 2016, the Mexican government’s antitrust commission (Comisión Federal de Competencia Económica or “COFECE”), announced that it would review competitive conditions in the Mexican railroad industry, with respect to the existence of effective competition in the provision of interconnection services, trackage rights and switching rights used to render public freight transport in Mexico. The COFECE review includes the entire freight rail transportation market in Mexico and is not targeted to any single rail carrier. Notwithstanding that it is too early to determine what, if any, impact this review may have on Mexican rail operations in the future, if the COFECE determines there is a lack of effective competition, it could request the new Mexican Agencia Reguladora del Transporte Ferroviario (“Regulatory Agency of Rail Transportation” or “ARTF”), which oversees primary regulatory jurisdiction for the Company’s Mexican operations, to establish new limited mandatory trackage rights and/or rate regulation under the Amendments to the Mexican Regulatory Railroad Service Law. COFECE has extended its own preliminary report deadline to January 30, 2017.
Surface Transportation Board. On July 27, 2016, the Surface Transportation Board issued a Notice of Proposed Rulemaking in Ex Parte 711 (Sub-No.1) Reciprocal Switching proposing rules related to reciprocal switching. Initial comments on the proposed rule were due by October 26, 2016, and replies to the initial comments were due by January 13, 2017. Until the rule has been finalized, KCS cannot determine what effect, if any, the rule will have on its business.
Kansas City Southern and Subsidiaries
Notes to Consolidated Financial Statements-(Continued)
Note 17. Quarterly Financial Data (Unaudited)
| | | | Fourth | | Third | | Second | | First | Fourth | | Third | | Second | | First |
| | (In millions, except per share amounts) | (In millions, except per share amounts) |
| 2016 | | | | | | | | |
| 2018 | | | | | | | | |
| Revenues | $ | 598.5 |
| | $ | 604.5 |
| | $ | 568.5 |
| | $ | 562.7 |
| $ | 694.0 |
| | $ | 699.0 |
| | $ | 682.4 |
| | $ | 638.6 |
|
| Operating income | 210.9 | (i) | | 199.8 | (i) | | 219.9 | (i) | | 187.9 |
| |
| Net income | 130.3 |
| | 121.0 |
| | 120.5 |
| | 108.1 |
| |
| Operating income (i) | | 256.4 |
| | 265.4 |
| | 245.8 |
| | 218.7 |
|
| Net income (ii) | | 161.8 |
| | 174.0 |
| | 148.7 |
| | 144.9 |
|
| Net income attributable to Kansas City Southern and subsidiaries | 129.6 |
| | 120.6 |
| | 120.1 |
| | 107.8 |
| 161.1 |
| | 173.6 |
| | 148.2 |
| | 144.5 |
|
| Per share data: | | | | | | | | | | | | | | |
| Basic earnings per common share | $ | 1.21 |
| | $ | 1.12 |
| | $ | 1.12 |
| | $ | 1.00 |
| $ | 1.59 |
| | $ | 1.71 |
| | $ | 1.45 |
| | $ | 1.41 |
|
| Diluted earnings per common share | 1.21 |
| | 1.12 |
| | 1.11 |
| | 0.99 |
| 1.59 |
| | 1.70 |
| | 1.45 |
| | 1.40 |
|
| | | | | | | | | | | | | | | |
| 2015 | | | | | | | | |
| 2017 | | | | | | | | |
| Revenues | $ | 598.0 |
| | $ | 631.9 |
| | $ | 585.8 |
| | $ | 603.1 |
| $ | 660.4 |
| | $ | 656.6 |
| | $ | 656.4 |
| | $ | 609.5 |
|
| Operating income | 218.9 |
| | 219.9 |
| | 186.8 |
| | 178.2 | (ii) | 237.8 |
| | 233.8 |
| | 239.3 |
| | 210.7 |
|
| Net income | 140.0 |
| | 131.9 |
| | 112.2 |
| | 101.2 |
| |
| Net income (iii) | | 552.4 |
| | 129.9 |
| | 134.7 |
| | 146.9 |
|
| Net income attributable to Kansas City Southern and subsidiaries | 139.3 |
| | 131.6 |
| | 111.8 |
| | 100.8 |
| 551.7 |
| | 129.3 |
| | 134.4 |
| | 146.6 |
|
| Per share data: | | | | | | | | | | | | | | |
| Basic earnings per common share | $ | 1.28 |
| | $ | 1.20 |
| | $ | 1.01 |
| | $ | 0.91 |
| $ | 5.35 |
| | $ | 1.24 |
| | $ | 1.27 |
| | $ | 1.38 |
|
| Diluted earnings per common share | 1.28 |
| | 1.20 |
| | 1.01 |
| | 0.91 |
| 5.33 |
| | 1.23 |
| | 1.27 |
| | 1.38 |
|
_____________________
| |
(i) | During the second, third and fourth quarters of 2016, the Company recognized $34.0 million, $15.6 million and $13.2 million, respectively, of credits available under changes in Mexican law for the excise tax included in the price of fuel that is purchased and consumed in locomotives and certain work equipment in Mexico. |
| |
(ii) | During the first quarter of 2015, the Company recognized pre-tax lease termination costs of $9.6 million, due to the early termination of certain operating leases and the related purchase of equipment. |
(i) During the third and fourth quarters of 2018, the Company recognized a pre-tax gain of $9.4 million and $8.5 million, respectively, within operating expense for insurance recoveries related to damage from Hurricane Harvey in 2017.
(ii) During the second and third quarters of 2018, the Company recognized discrete tax benefits of $4.3 million and $16.6 million, respectively, for adjustments to the provisional tax impacts of the Tax Reform Act.
(iii) During the fourth quarter of 2017, the Company recognized a provisional $413.0 million net tax benefit as a result of the Tax Reform Act, which was signed into law December 22, 2017.
Kansas City Southern and Subsidiaries
Notes to Consolidated Financial Statements-(Continued)
Note 18. Geographic Information
The Company strategically manages its rail operations as one reportable business segment over a single coordinated rail network that extends from the midwest and southeast portions of the United States south into Mexico and connects with other Class I railroads. Financial information reported at this level, such as revenues, operating income and cash flows from operations, is used by corporate management, including the Company’s chief operating decision-maker, in evaluating overall financial and operational performance, market strategies, as well as the decisions to allocate capital resources. The Company’s chief operating decision-maker is the chief executive officer.
The following tables provide information by geographic area (in millions):
| | | | Years ended December 31, | Years ended December 31, |
| | 2016 | | 2015 | | 2014 | 2018 | | 2017 | | 2016 |
| Revenues | | | | | | | | | | |
| U.S. | $ | 1,210.8 |
| | $ | 1,248.4 |
| | $ | 1,372.2 |
| $ | 1,424.8 |
| | $ | 1,359.5 |
| | $ | 1,210.8 |
|
| Mexico | 1,123.4 |
| | 1,170.4 |
| | 1,204.9 |
| 1,289.2 |
| | 1,223.4 |
| | 1,123.4 |
|
| Total revenues | $ | 2,334.2 |
| | $ | 2,418.8 |
| | $ | 2,577.1 |
| $ | 2,714.0 |
| | $ | 2,582.9 |
| | $ | 2,334.2 |
|
| | | |
December 31, |
December 31, |
| | 2016 | | 2015 | 2018 | | 2017 |
| Property and equipment (including concession assets), net | | | | | | |
| U.S. | $ | 4,960.6 |
| | $ | 4,642.6 |
| $ | 5,401.3 |
| | $ | 5,227.3 |
|
| Mexico | 3,109.1 |
| | 3,062.8 |
| 3,289.8 |
| | 3,176.5 |
|
| Total property and equipment (including concession assets), net | $ | 8,069.7 |
| | $ | 7,705.4 |
| $ | 8,691.1 |
| | $ | 8,403.8 |
|
Note 19. Subsequent Events
Foreign Currency Hedging
As of December 31, 2016,2018, the Company had outstanding foreign currency forward contracts with an aggregate notional amount of $340.0 million. During January 2017, the Company entered into offsetting foreign currency forward contracts with an aggregate notional amount of $287.0 million. These offsetting contracts matured on January 17, 2017, and obligated the Company to sell a total of Ps.6,207.7 million at a weighted-average exchange rate of Ps.21.63 to each U.S. dollar.
During January 2017, the Company entered into foreign currency option contracts known as zero-cost collars with an aggregate notional amount of $380.0$120.0 million, to hedge its exposure to fluctuations in the Mexican cash tax obligation due to changes in the value of the Mexican peso against the U.S. dollar. The zero-cost collarDuring January 2019, these contracts matured, resulting in cash received of $0.3 million.
During January 2019, the Company entered into several foreign currency forward contracts with an aggregate notional amount of $130.0$290.0 million and $250.0maturity dates throughout 2019. These contracts obligate the Company to purchase a total of Ps.5,754.9 million will mature on April 25, 2017 and January 16, 2018, respectively. The zero-cost collar contracts haveat a weighted-average exchange rate of Ps.21.61Ps.19.84 to each U.S. dollar for the Mexican peso call options purchased by KCS and a weighted-average rate of Ps.23.87 to each U.S. dollar for the Mexican peso put options sold by KCS.dollar.
The Company has not designated these foreign currency derivative instruments as hedging instruments for accounting purposes. The Company will measure the foreign currency derivative instruments at fair value each period and will recognize any change in fair value in foreign exchange gain (loss) within the consolidated statements of comprehensive income.
Common Stock Dividend
On January 26, 2017, the Company’s Board of Directors declared a cash dividend of $0.33 per share payable on April 5, 2017, to common stockholders of record as of March 13, 2017. The aggregate amount of the dividend declared was approximately $35.2 million.
Kansas City Southern and Subsidiaries
Notes to Consolidated Financial Statements-(Continued)
Note 20. Condensed Consolidating Financial Information
Pursuant to Securities and Exchange Commission (“SEC”) Regulation S-X Rule 3-10 “Financial statements of guarantors and issuers of guaranteed securities registered or being registered”, the Company is required to provide condensed consolidating financial information for issuers of certain of its senior notes that are guaranteed.
As of December 31, 2016,2018, KCS, the parent, had outstanding $2,093.5$2,593.5 million senior notes due through 2045.2048. The senior notes are unsecured obligations of KCS, and are also jointly and severally and fully and unconditionally guaranteed on an unsecured senior basis by KCSR and certain wholly-owned100% owned domestic subsidiaries of KCS. As a result, the Company is providing the following condensed consolidating financial information (in millions)KCS (the “Guarantor Subsidiaries”).
Condensed Consolidating Statements of Comprehensive Income - KCS Notes
|
| | | | | | | | | | | | | | | | | | | |
| | 2016 |
| | Parent | | Guarantor Subsidiaries | | Non-Guarantor Subsidiaries | | Consolidating Adjustments | | Consolidated KCS |
| Revenues | $ | — |
| | $ | 1,101.3 |
| | $ | 1,252.5 |
| | $ | (19.6 | ) | | $ | 2,334.2 |
|
| Operating expenses | 4.7 |
| | 794.7 |
| | 734.0 |
| | (17.7 | ) | | 1,515.7 |
|
| Operating income (loss) | (4.7 | ) | | 306.6 |
| | 518.5 |
| | (1.9 | ) | | 818.5 |
|
| Equity in net earnings of affiliates | 468.5 |
| | 7.1 |
| | 12.7 |
| | (473.7 | ) | | 14.6 |
|
| Interest expense | (81.9 | ) | | (83.0 | ) | | (63.1 | ) | | 130.3 |
| | (97.7 | ) |
| Foreign exchange loss | — |
| | — |
| | (72.0 | ) | | — |
| | (72.0 | ) |
| Other income (expense), net | 104.4 |
| | (0.2 | ) | | 24.1 |
| | (129.0 | ) | | (0.7 | ) |
| Income before income taxes | 486.3 |
| | 230.5 |
| | 420.2 |
| | (474.3 | ) | | 662.7 |
|
| Income tax expense | 7.1 |
| | 87.4 |
| | 89.2 |
| | (0.9 | ) | | 182.8 |
|
| Net income | 479.2 |
| | 143.1 |
| | 331.0 |
| | (473.4 | ) | | 479.9 |
|
| Less: Net income attributable to noncontrolling interest | — |
| | 1.8 |
| | — |
| | — |
| | 1.8 |
|
| Net income attributable to Kansas City Southern and subsidiaries | 479.2 |
| | 141.3 |
| | 331.0 |
| | (473.4 | ) | | 478.1 |
|
| Other comprehensive loss | (1.5 | ) | | — |
| | (2.5 | ) | | 2.5 |
| | (1.5 | ) |
| Comprehensive income attributable to Kansas City Southern and subsidiaries | $ | 477.7 |
| | $ | 141.3 |
| | $ | 328.5 |
| | $ | (470.9 | ) | | $ | 476.6 |
|
Kansas City Southern and Subsidiaries
Notes to Consolidated Financial Statements-(Continued)
Condensed Consolidating Statements of Comprehensive Income - KCS Notes—(Continued)
|
| | | | | | | | | | | | | | | | | | | |
| | 2015 |
| | Parent | | Guarantor Subsidiaries | | Non-Guarantor Subsidiaries | | Consolidating Adjustments | | Consolidated KCS |
| Revenues | $ | — |
| | $ | 1,135.9 |
| | $ | 1,302.3 |
| | $ | (19.4 | ) | | $ | 2,418.8 |
|
| Operating expenses | 4.6 |
| | 779.7 |
| | 849.3 |
| | (18.6 | ) | | 1,615.0 |
|
| Operating income (loss) | (4.6 | ) | | 356.2 |
| | 453.0 |
| | (0.8 | ) | | 803.8 |
|
| Equity in net earnings of affiliates | 464.0 |
| | 7.4 |
| | 16.5 |
| | (469.6 | ) | | 18.3 |
|
| Interest expense | (4.6 | ) | | (84.9 | ) | | (40.1 | ) | | 47.7 |
| | (81.9 | ) |
| Debt retirement and exchange costs | 0.1 |
| | (5.2 | ) | | (2.5 | ) | | — |
| | (7.6 | ) |
| Foreign exchange loss | — |
| | — |
| | (56.6 | ) | | — |
| | (56.6 | ) |
| Other income (expense), net | 45.9 |
| | (3.1 | ) | | 1.4 |
| | (47.6 | ) | | (3.4 | ) |
| Income before income taxes | 500.8 |
| | 270.4 |
| | 371.7 |
| | (470.3 | ) | | 672.6 |
|
| Income tax expense | 16.5 |
| | 98.3 |
| | 72.5 |
| | — |
| | 187.3 |
|
| Net income | 484.3 |
| | 172.1 |
| | 299.2 |
| | (470.3 | ) | | 485.3 |
|
| Less: Net income attributable to noncontrolling interest | — |
| | 1.8 |
| | — |
| | — |
| | 1.8 |
|
| Net income attributable to Kansas City Southern and subsidiaries | 484.3 |
| | 170.3 |
| | 299.2 |
| | (470.3 | ) | | 483.5 |
|
| Other comprehensive loss | (1.5 | ) | | — |
| | (2.2 | ) | | 2.2 |
| | (1.5 | ) |
| Comprehensive income attributable to Kansas City Southern and subsidiaries | $ | 482.8 |
| | $ | 170.3 |
| | $ | 297.0 |
| | $ | (468.1 | ) | | $ | 482.0 |
|
Kansas City Southern and Subsidiaries
Notes to Consolidated Financial Statements-(Continued)
Condensed Consolidating Statements of Comprehensive Income - KCS Notes—(Continued)
|
| | | | | | | | | | | | | | | | | | | |
| | 2014 |
| | Parent | | Guarantor Subsidiaries | | Non-Guarantor Subsidiaries | | Consolidating Adjustments | | Consolidated KCS |
| Revenues | $ | — |
| | $ | 1,242.0 |
| | $ | 1,353.7 |
| | $ | (18.6 | ) | | $ | 2,577.1 |
|
| Operating expenses | 7.6 |
| | 901.0 |
| | 879.1 |
| | (19.7 | ) | | 1,768.0 |
|
| Operating income (loss) | (7.6 | ) | | 341.0 |
| | 474.6 |
| | 1.1 |
| | 809.1 |
|
| Equity in net earnings of affiliates | 476.7 |
| | 7.6 |
| | 18.9 |
| | (482.1 | ) | | 21.1 |
|
| Interest expense | (0.1 | ) | | (83.3 | ) | | (39.6 | ) | | 50.2 |
| | (72.8 | ) |
| Debt retirement and exchange costs | — |
| | (2.7 | ) | | (3.9 | ) | | — |
| | (6.6 | ) |
| Foreign exchange loss | — |
| | — |
| | (35.5 | ) | | — |
| | (35.5 | ) |
| Other income (expense), net | 50.1 |
| | 0.2 |
| | (1.2 | ) | | (51.3 | ) | | (2.2 | ) |
| Income before income taxes | 519.1 |
| | 262.8 |
| | 413.3 |
| | (482.1 | ) | | 713.1 |
|
| Income tax expense | 16.5 |
| | 99.1 |
| | 93.2 |
| | — |
| | 208.8 |
|
| Net income | 502.6 |
| | 163.7 |
| | 320.1 |
| | (482.1 | ) | | 504.3 |
|
| Less: Net income attributable to noncontrolling interest | — |
| | 1.7 |
| | — |
| | — |
| | 1.7 |
|
| Net income attributable to Kansas City Southern and subsidiaries | 502.6 |
| | 162.0 |
| | 320.1 |
| | (482.1 | ) | | 502.6 |
|
| Other comprehensive income (loss) | (1.2 | ) | | 0.1 |
| | (1.8 | ) | | 1.7 |
| | (1.2 | ) |
| Comprehensive income attributable to Kansas City Southern and subsidiaries | $ | 501.4 |
| | $ | 162.1 |
| | $ | 318.3 |
| | $ | (480.4 | ) | | $ | 501.4 |
|
Kansas City Southern and Subsidiaries
Notes to Consolidated Financial Statements-(Continued)
Condensed Consolidating Balance Sheets - KCS Notes
|
| | | | | | | | | | | | | | | | | | | |
| | December 31, 2016 |
| | Parent | | Guarantor Subsidiaries | | Non-Guarantor Subsidiaries | | Consolidating Adjustments | | Consolidated KCS |
| Assets: | | | | | | | | | |
| Current assets | $ | 0.9 |
| | $ | 275.4 |
| | $ | 381.2 |
| | $ | (9.5 | ) | | $ | 648.0 |
|
| Investments | — |
| | 3.9 |
| | 29.0 |
| | — |
| | 32.9 |
|
| Investments in consolidated subsidiaries | 3,497.7 |
| | 493.7 |
| | — |
| | (3,991.4 | ) | | — |
|
| Property and equipment (including concession assets), net | — |
| | 4,203.6 |
| | 3,868.8 |
| | (2.7 | ) | | 8,069.7 |
|
| Other assets | 2,015.5 |
| | 43.0 |
| | 252.6 |
| | (2,244.2 | ) | | 66.9 |
|
| Total assets | $ | 5,514.1 |
| | $ | 5,019.6 |
| | $ | 4,531.6 |
| | $ | (6,247.8 | ) | | $ | 8,817.5 |
|
| Liabilities and equity: | | | | | | | | | |
| Current liabilities | $ | (501.3 | ) | | $ | 1,004.0 |
| | $ | 252.6 |
| | $ | (10.9 | ) | | $ | 744.4 |
|
| Long-term debt | 1,883.1 |
| | 1,357.7 |
| | 1,274.9 |
| | (2,244.2 | ) | | 2,271.5 |
|
| Deferred income taxes | 26.9 |
| | 1,075.3 |
| | 188.0 |
| | (0.9 | ) | | 1,289.3 |
|
| Other liabilities | 4.0 |
| | 86.3 |
| | 17.5 |
| | — |
| | 107.8 |
|
| Stockholders’ equity | 4,101.4 |
| | 1,181.7 |
| | 2,798.6 |
| | (3,991.8 | ) | | 4,089.9 |
|
| Noncontrolling interest | — |
| | 314.6 |
| | — |
| | — |
| | 314.6 |
|
| Total liabilities and equity | $ | 5,514.1 |
| | $ | 5,019.6 |
| | $ | 4,531.6 |
| | $ | (6,247.8 | ) | | $ | 8,817.5 |
|
|
| | | | | | | | | | | | | | | | | | | |
| | December 31, 2015 |
| | Parent | | Guarantor Subsidiaries | | Non-Guarantor Subsidiaries | | Consolidating Adjustments | | Consolidated KCS |
| Assets: | | | | | | | | | |
| Current assets | $ | 242.8 |
| | $ | 189.5 |
| | $ | 359.5 |
| | $ | (254.8 | ) | | $ | 537.0 |
|
| Investments | — |
| | 3.9 |
| | 30.8 |
| | — |
| | 34.7 |
|
| Investments in consolidated subsidiaries | 3,108.4 |
| | 479.6 |
| | — |
| | (3,588.0 | ) | | — |
|
| Property and equipment (including concession assets), net | — |
| | 3,903.2 |
| | 3,803.0 |
| | (0.8 | ) | | 7,705.4 |
|
| Other assets | 1,791.1 |
| | 40.6 |
| | 19.3 |
| | (1,787.1 | ) | | 63.9 |
|
| Total assets | $ | 5,142.3 |
| | $ | 4,616.8 |
| | $ | 4,212.6 |
| | $ | (5,630.7 | ) | | $ | 8,341.0 |
|
| Liabilities and equity: | | | | | | | | | |
| Current liabilities | $ | (566.9 | ) | | $ | 1,066.6 |
| | $ | 512.8 |
| | $ | (254.9 | ) | | $ | 757.6 |
|
| Long-term debt | 1,759.8 |
| | 1,260.0 |
| | 812.3 |
| | (1,787.1 | ) | | 2,045.0 |
|
| Deferred income taxes | 20.9 |
| | 998.4 |
| | 171.8 |
| | — |
| | 1,191.1 |
|
| Other liabilities | 3.8 |
| | 94.4 |
| | 24.4 |
| | — |
| | 122.6 |
|
| Stockholders’ equity | 3,924.7 |
| | 887.0 |
| | 2,691.3 |
| | (3,588.7 | ) | | 3,914.3 |
|
| Noncontrolling interest | — |
| | 310.4 |
| | — |
| | — |
| | 310.4 |
|
| Total liabilities and equity | $ | 5,142.3 |
| | $ | 4,616.8 |
| | $ | 4,212.6 |
| | $ | (5,630.7 | ) | | $ | 8,341.0 |
|
Kansas City Southern and Subsidiaries
Notes to Consolidated Financial Statements-(Continued)
Condensed Consolidating Statements of Cash Flows - KCS Notes
|
| | | | | | | | | | | | | | | | | | | |
| | 2016 |
| | Parent | | Guarantor Subsidiaries | | Non-Guarantor Subsidiaries | | Consolidating Adjustments | | Consolidated KCS |
| Operating activities: | | | | | | | | | |
| Net cash provided | $ | 428.4 |
| | $ | 236.0 |
| | $ | 482.7 |
| | $ | (233.8 | ) | | $ | 913.3 |
|
| Investing activities: | | | | | | | | | |
| Capital expenditures | — |
| | (373.1 | ) | | (190.8 | ) | | — |
| | (563.9 | ) |
| Purchase or replacement of equipment under operating leases | — |
| | (26.6 | ) | | — |
| | — |
| | (26.6 | ) |
| Property investments in MSLLC | — |
| | — |
| | (33.1 | ) | | — |
| | (33.1 | ) |
| Proceeds from repayment of loans to affiliates | 9,067.7 |
| | — |
| | — |
| | (9,067.7 | ) | | — |
|
| Loans to affiliates | (9,123.4 | ) | | — |
| | — |
| | 9,123.4 |
| | — |
|
| Contributions to consolidated affiliates | (153.4 | ) | | (6.5 | ) | | — |
| | 159.9 |
| | — |
|
| Other investing activities | — |
| | (12.6 | ) | | 6.1 |
| | 1.9 |
| | (4.6 | ) |
| Net cash used | (209.1 | ) | | (418.8 | ) | | (217.8 | ) | | 217.5 |
| | (628.2 | ) |
| Financing activities: | | | | | | | | | |
| Proceeds from short-term borrowings | 8,698.7 |
| | 243.5 |
| | — |
| | (243.5 | ) | | 8,698.7 |
|
| Repayment of short-term borrowings | (8,597.9 | ) | | (243.5 | ) | | — |
| | 243.5 |
| | (8,597.9 | ) |
| Proceeds from issuance of long-term debt | 248.7 |
| | — |
| | — |
| | — |
| | 248.7 |
|
| Repayment of long-term debt | (244.8 | ) | | (3.5 | ) | | (28.1 | ) | | — |
| | (276.4 | ) |
| Dividends paid | (142.8 | ) | | — |
| | (230.2 | ) | | 230.2 |
| | (142.8 | ) |
| Shares repurchased | (185.4 | ) | | — |
| | — |
| | — |
| | (185.4 | ) |
| Proceeds from loans from affiliates | — |
| | 8,879.9 |
| | — |
| | (8,879.9 | ) | | — |
|
| Repayment of loans from affiliates | — |
| | (8,824.2 | ) | | — |
| | 8,824.2 |
| | — |
|
| Contributions from affiliates | — |
| | 153.1 |
| | 6.8 |
| | (159.9 | ) | | — |
|
| Other financing activities | 4.2 |
| | (0.1 | ) | | (1.8 | ) | | 1.7 |
| | 4.0 |
|
| Net cash provided (used) | (219.3 | ) | | 205.2 |
| | (253.3 | ) | | 16.3 |
| | (251.1 | ) |
| Cash and cash equivalents: | | | | | | | | | |
| Net increase | — |
| | 22.4 |
| | 11.6 |
| | — |
| | 34.0 |
|
| At beginning of year | 0.2 |
| | 10.2 |
| | 126.2 |
| | — |
| | 136.6 |
|
| At end of year | $ | 0.2 |
| | $ | 32.6 |
| | $ | 137.8 |
| | $ | — |
| | $ | 170.6 |
|
Kansas City Southern and Subsidiaries
Notes to Consolidated Financial Statements-(Continued)
Condensed Consolidating Statements of Cash Flows - KCS Notes—(Continued)
|
| | | | | | | | | | | | | | | | | | | |
| | 2015 |
| | Parent | | Guarantor Subsidiaries | | Non-Guarantor Subsidiaries | | Consolidating Adjustments | | Consolidated KCS |
| Operating activities: | | | | | | | | | |
| Net cash provided | $ | 45.3 |
| | $ | 356.6 |
| | $ | 526.0 |
| | $ | (18.6 | ) | | $ | 909.3 |
|
| Investing activities: | | | | | | | | | |
| Capital expenditures | — |
| | (382.8 | ) | | (305.2 | ) | | — |
| | (688.0 | ) |
| Purchase or replacement of equipment under operating leases | — |
| | (82.8 | ) | | (61.4 | ) | | — |
| | (144.2 | ) |
| Property investments in MSLLC | — |
| | — |
| | (17.4 | ) | | — |
| | (17.4 | ) |
| Proceeds from repayment of loans to affiliates | 293.9 |
| | — |
| | — |
| | (293.9 | ) | | — |
|
| Loans to affiliates | (80.0 | ) | | — |
| | — |
| | 80.0 |
| | — |
|
| Other investing activities | (0.8 | ) | | (31.4 | ) | | 6.5 |
| | 2.3 |
| | (23.4 | ) |
| Net cash provided (used) | 213.1 |
| | (497.0 | ) | | (377.5 | ) | | (211.6 | ) | | (873.0 | ) |
| Financing activities: | | | | | | | | | |
| Proceeds from short-term borrowings | 80.0 |
| | 10,786.2 |
| | — |
| | — |
| | 10,866.2 |
|
| Repayment of short-term borrowings | — |
| | (10,937.3 | ) | | (300.0 | ) | | — |
| | (11,237.3 | ) |
| Proceeds from issuance of long-term debt | — |
| | 663.7 |
| | 40.0 |
| | (80.0 | ) | | 623.7 |
|
| Repayment of long-term debt | — |
| | (88.4 | ) | | (61.4 | ) | | — |
| | (149.8 | ) |
| Dividends paid | (140.1 | ) | | — |
| | (17.8 | ) | | 17.8 |
| | (140.1 | ) |
| Shares repurchased | (194.2 | ) | | — |
| | — |
| | — |
| | (194.2 | ) |
| Repayment of loans from affiliates | — |
| | (293.9 | ) | | — |
| | 293.9 |
| | — |
|
| Other financing activities | (4.1 | ) | | (9.2 | ) | | (1.4 | ) | | (1.5 | ) | | (16.2 | ) |
| Net cash provided (used) | (258.4 | ) | | 121.1 |
|
| (340.6 | ) | | 230.2 |
| | (247.7 | ) |
| Cash and cash equivalents: | | | | | | | | | |
| Net decrease | — |
| | (19.3 | ) | | (192.1 | ) | | — |
| | (211.4 | ) |
| At beginning of year | 0.2 |
| | 29.5 |
| | 318.3 |
| | — |
| | 348.0 |
|
| At end of year | $ | 0.2 |
| | $ | 10.2 |
| | $ | 126.2 |
| | $ | — |
| | $ | 136.6 |
|
Kansas City Southern and Subsidiaries
Notes to Consolidated Financial Statements-(Continued)
Condensed Consolidating Statements of Cash Flows - KCS Notes—(Continued)
|
| | | | | | | | | | | | | | | | | | | |
| | 2014 |
| | Parent | | Guarantor Subsidiaries | | Non-Guarantor Subsidiaries | | Consolidating Adjustments | | Consolidated KCS |
| Operating activities: | | | | | | | | | |
| Net cash provided | $ | 345.3 |
| | $ | 379.1 |
| | $ | 495.9 |
| | $ | (314.3 | ) | | $ | 906.0 |
|
| Investing activities: | | | | | | | | | |
| Capital expenditures | — |
| | (479.5 | ) | | (190.2 | ) | | 1.5 |
| | (668.2 | ) |
| Purchase or replacement of equipment under operating leases | — |
| | (203.6 | ) | | (98.5 | ) | | — |
| | (302.1 | ) |
| Property investments in MSLLC | — |
| | — |
| | (26.7 | ) | | — |
| | (26.7 | ) |
| Proceeds from repayment of loans to affiliates | 70.4 |
| | — |
| | — |
| | (70.4 | ) | | — |
|
| Contributions to consolidated affiliates | (299.6 | ) | | — |
| | — |
| | 299.6 |
| | — |
|
| Other investing activities | (1.0 | ) | | 8.6 |
| | 5.8 |
| | 0.7 |
| | 14.1 |
|
| Net cash used | (230.2 | ) | | (674.5 | ) | | (309.6 | ) | | 231.4 |
| | (982.9 | ) |
| Financing activities: | | | | | | | | | |
| Proceeds from short-term borrowings | — |
| | 15,068.8 |
| | 300.0 |
| | — |
| | 15,368.8 |
|
| Repayment of short-term borrowings | — |
| | (14,920.2 | ) | | — |
| | — |
| | (14,920.2 | ) |
| Proceeds from issuance of long-term debt | — |
| | 175.0 |
| | — |
| | — |
| | 175.0 |
|
| Repayment of long-term debt | — |
| | (423.6 | ) | | (84.4 | ) | | — |
| | (508.0 | ) |
| Dividends paid | (116.6 | ) | | — |
| | (314.3 | ) | | 314.3 |
| | (116.6 | ) |
| Repayment of loans from affiliates | — |
| | (70.4 | ) | | — |
| | 70.4 |
| | — |
|
| Contributions from affiliates | — |
| | 300.4 |
| | 1.4 |
| | (301.8 | ) | | — |
|
| Other financing activities | 1.3 |
| | (1.4 | ) | | (3.5 | ) | | — |
| | (3.6 | ) |
| Net cash provided (used) | (115.3 | ) | | 128.6 |
| | (100.8 | ) | | 82.9 |
| | (4.6 | ) |
| Cash and cash equivalents: | | | | | | | | | |
| Net increase (decrease) | (0.2 | ) | | (166.8 | ) | | 85.5 |
| | — |
| | (81.5 | ) |
| At beginning of year | 0.4 |
| | 196.3 |
| | 232.8 |
| | — |
| | 429.5 |
|
| At end of year | $ | 0.2 |
| | $ | 29.5 |
| | $ | 318.3 |
| | $ | — |
| | $ | 348.0 |
|
Kansas City Southern and Subsidiaries
Notes to Consolidated Financial Statements-(Continued)
As of December 31, 2016,2018, KCSR had outstanding $2.9$2.7 million principal amount of senior notes due through 2045. The senior notes are unsecured obligations of KCSR, and are also jointly and severally and fully and unconditionally guaranteed on an unsecured senior basis by KCS and certain wholly-owned domestic subsidiaries. As a result, the Company is providing theGuarantor Subsidiaries.
The following condensed and consolidating financial information ((in millions)millions.) of KCS, KCSR, the Guarantor Subsidiaries and the other KCS subsidiaries that are not guarantors (the "Non-Guarantor Subsidiaries") are being presented in order to meet the reporting requirements under Rule 3-10 of Regulation S-X. Pursuant to Rule 3-10(d) and (f) of Regulation S-X, separate financial statements for the Issuer, the Parent and the Guarantor Subsidiaries are not required to be filed with the SEC as the subsidiary debt issuer and the guarantors are directly or indirectly 100% owned by the Parent and the guarantees are full and unconditional and joint and several.
Condensed Consolidating Statements of Comprehensive Income - KCSR Notes
| | | | 2016 | 2018 |
| | Parent | | KCSR | | Guarantor Subsidiaries | | Non-Guarantor Subsidiaries | | Consolidating Adjustments | | Consolidated KCS | Parent | | KCSR | | Guarantor Subsidiaries | | Non-Guarantor Subsidiaries | | Consolidating Adjustments | | Consolidated KCS |
| Revenues | $ | — |
| | $ | 1,077.3 |
| | $ | 43.7 |
| | $ | 1,252.5 |
| | $ | (39.3 | ) | | $ | 2,334.2 |
| $ | — |
| | $ | 1,279.2 |
| | $ | 45.2 |
| | $ | 1,433.5 |
| | $ | (43.9 | ) | | $ | 2,714.0 |
|
| Operating expenses | 4.7 |
| | 776.3 |
| | 38.1 |
| | 734.0 |
| | (37.4 | ) | | 1,515.7 |
| 5.2 |
| | 877.2 |
| | 38.7 |
| | 848.4 |
| | (41.8 | ) | | 1,727.7 |
|
| Operating income (loss) | (4.7 | ) | | 301.0 |
| | 5.6 |
| | 518.5 |
| | (1.9 | ) | | 818.5 |
| (5.2 | ) | | 402.0 |
| | 6.5 |
| | 585.1 |
| | (2.1 | ) | | 986.3 |
|
| Equity in net earnings (losses) of affiliates | 468.5 |
| | (0.2 | ) | | 5.3 |
| | 12.7 |
| | (471.7 | ) | | 14.6 |
| 635.6 |
| | (1.1 | ) | | 4.5 |
| | 0.3 |
| | (636.7 | ) | | 2.6 |
|
| Interest expense | (81.9 | ) | | (83.0 | ) | | — |
| | (63.1 | ) | | 130.3 |
| | (97.7 | ) | (96.1 | ) | | (78.8 | ) | | — |
| | (28.6 | ) | | 93.5 |
| | (110.0 | ) |
| Foreign exchange loss | — |
| | — |
| | — |
| | (72.0 | ) | | — |
| | (72.0 | ) | |
| Other income (expense), net | 104.4 |
| | (0.2 | ) | | — |
| | 24.1 |
| | (129.0 | ) | | (0.7 | ) | |
| Debt retirement costs | | — |
| | — |
| | — |
| | (2.2 | ) | | — |
| | (2.2 | ) |
| Foreign exchange gain | | — |
| | — |
| | — |
| | 7.8 |
| | — |
| | 7.8 |
|
| Other income, net | | 92.5 |
| | 1.6 |
| | — |
| | 1.9 |
| | (93.6 | ) | | 2.4 |
|
| Income before income taxes | 486.3 |
| | 217.6 |
| | 10.9 |
| | 420.2 |
| | (472.3 | ) | | 662.7 |
| 626.8 |
| | 323.7 |
| | 11.0 |
| | 564.3 |
| | (638.9 | ) | | 886.9 |
|
| Income tax expense | 7.1 |
| | 84.3 |
| | 3.1 |
| | 89.2 |
| | (0.9 | ) | | 182.8 |
| |
| Income tax expense (benefit) | | (0.6 | ) | | 69.7 |
| | 2.6 |
| | 186.3 |
| | (0.5 | ) | | 257.5 |
|
| Net income | 479.2 |
| | 133.3 |
| | 7.8 |
| | 331.0 |
| | (471.4 | ) | | 479.9 |
| 627.4 |
| | 254.0 |
| | 8.4 |
| | 378.0 |
| | (638.4 | ) | | 629.4 |
|
| Less: Net income attributable to noncontrolling interest | — |
| | — |
| | 1.8 |
| | — |
| | — |
| | 1.8 |
| — |
| | — |
| | — |
| | 2.0 |
| | — |
| | 2.0 |
|
| Net income attributable to Kansas City Southern and subsidiaries | 479.2 |
| | 133.3 |
| | 6.0 |
| | 331.0 |
| | (471.4 | ) | | 478.1 |
| 627.4 |
| | 254.0 |
| | 8.4 |
| | 376.0 |
| | (638.4 | ) | | 627.4 |
|
| Other comprehensive loss | (1.5 | ) | | — |
| | — |
| | (2.5 | ) | | 2.5 |
| | (1.5 | ) | |
| Other comprehensive income | | 2.7 |
| | — |
| | — |
| | 0.1 |
| | (0.1 | ) | | 2.7 |
|
| Comprehensive income attributable to Kansas City Southern and subsidiaries | $ | 477.7 |
| | $ | 133.3 |
| | $ | 6.0 |
| | $ | 328.5 |
| | $ | (468.9 | ) | | $ | 476.6 |
| $ | 630.1 |
| | $ | 254.0 |
| | $ | 8.4 |
| | $ | 376.1 |
| | $ | (638.5 | ) | | $ | 630.1 |
|
Kansas City Southern and Subsidiaries
Notes to Consolidated Financial Statements-(Continued)
Condensed Consolidating Statements of Comprehensive Income—(Continued)
|
| | | | | | | | | | | | | | | | | | | | | | | |
| | 2017 |
| | Parent | | KCSR | | Guarantor Subsidiaries | | Non-Guarantor Subsidiaries | | Consolidating Adjustments | | Consolidated KCS |
| Revenues | $ | — |
| | $ | 1,220.8 |
| | $ | 43.5 |
| | $ | 1,359.0 |
| | $ | (40.4 | ) | | $ | 2,582.9 |
|
| Operating expenses | 5.7 |
| | 862.8 |
| | 39.1 |
| | 791.0 |
| | (37.3 | ) | | 1,661.3 |
|
| Operating income (loss) | (5.7 | ) | | 358.0 |
| | 4.4 |
| | 568.0 |
| | (3.1 | ) | | 921.6 |
|
| Equity in net earnings of affiliates | 974.8 |
| | 19.0 |
| | 4.5 |
| | 9.6 |
| | (996.4 | ) | | 11.5 |
|
| Interest expense | (81.3 | ) | | (72.2 | ) | | — |
| | (34.4 | ) | | 87.7 |
| | (100.2 | ) |
| Debt retirement costs | — |
| | — |
| | — |
| | — |
| | — |
| | — |
|
| Foreign exchange gain | — |
| | — |
| | — |
| | 41.7 |
| | — |
| | 41.7 |
|
| Other income (expense), net | 86.7 |
| | (0.6 | ) | | — |
| | 1.2 |
| | (87.6 | ) | | (0.3 | ) |
| Income before income taxes | 974.5 |
| | 304.2 |
| | 8.9 |
| | 586.1 |
| | (999.4 | ) | | 874.3 |
|
| Income tax expense (benefit) | 9.9 |
| | (310.6 | ) | | (42.5 | ) | | 254.2 |
| | (0.6 | ) | | (89.6 | ) |
| Net income | 964.6 |
| | 614.8 |
| | 51.4 |
| | 331.9 |
| | (998.8 | ) | | 963.9 |
|
| Less: Net income attributable to noncontrolling interest | — |
| | — |
| | — |
| | 1.9 |
| | — |
| | 1.9 |
|
| Net income attributable to Kansas City Southern and subsidiaries | 964.6 |
| | 614.8 |
| | 51.4 |
| | 330.0 |
| | (998.8 | ) | | 962.0 |
|
| Other comprehensive income (loss) | (6.7 | ) | | — |
| | — |
| | 0.5 |
| | (0.5 | ) | | (6.7 | ) |
| Comprehensive income attributable to Kansas City Southern and subsidiaries | $ | 957.9 |
| | $ | 614.8 |
| | $ | 51.4 |
| | $ | 330.5 |
| | $ | (999.3 | ) | | $ | 955.3 |
|
Kansas City Southern and Subsidiaries
Notes to Consolidated Financial Statements-(Continued)
Condensed Consolidating Statements of Comprehensive Income—(Continued)
|
| | | | | | | | | | | | | | | | | | | | | | | |
| | 2016 |
| | Parent | | KCSR | | Guarantor Subsidiaries | | Non-Guarantor Subsidiaries | | Consolidating Adjustments | | Consolidated KCS |
| Revenues | $ | — |
| | $ | 1,077.3 |
| | $ | 43.7 |
| | $ | 1,252.5 |
| | $ | (39.3 | ) | | $ | 2,334.2 |
|
| Operating expenses | 4.7 |
| | 776.3 |
| | 38.1 |
| | 734.0 |
| | (37.4 | ) | | 1,515.7 |
|
| Operating income (loss) | (4.7 | ) | | 301.0 |
| | 5.6 |
| | 518.5 |
| | (1.9 | ) | | 818.5 |
|
| Equity in net earnings (losses) of affiliates | 468.5 |
| | (0.2 | ) | | 3.5 |
| | 12.7 |
| | (469.9 | ) | | 14.6 |
|
| Interest expense | (81.9 | ) | | (83.0 | ) | | — |
| | (63.1 | ) | | 130.3 |
| | (97.7 | ) |
| Debt retirement costs | — |
| | — |
| | — |
| | — |
| | — |
| | — |
|
| Foreign exchange loss | — |
| | — |
| | — |
| | (72.0 | ) | | — |
| | (72.0 | ) |
| Other income (expense), net | 104.4 |
| | (0.2 | ) | | — |
| | 24.1 |
| | (129.0 | ) | | (0.7 | ) |
| Income before income taxes | 486.3 |
| | 217.6 |
| | 9.1 |
| | 420.2 |
| | (470.5 | ) | | 662.7 |
|
| Income tax expense | 7.1 |
| | 84.3 |
| | 3.1 |
| | 89.2 |
| | (0.9 | ) | | 182.8 |
|
| Net income | 479.2 |
| | 133.3 |
| | 6.0 |
| | 331.0 |
| | (469.6 | ) | | 479.9 |
|
| Less: Net income attributable to noncontrolling interest | — |
| | — |
| | — |
| | 1.8 |
| | — |
| | 1.8 |
|
| Net income attributable to Kansas City Southern and subsidiaries | 479.2 |
| | 133.3 |
| | 6.0 |
| | 329.2 |
| | (469.6 | ) | | 478.1 |
|
| Other comprehensive loss | (1.5 | ) | | — |
| | — |
| | (2.5 | ) | | 2.5 |
| | (1.5 | ) |
| Comprehensive income attributable to Kansas City Southern and subsidiaries | $ | 477.7 |
| | $ | 133.3 |
| | $ | 6.0 |
| | $ | 326.7 |
| | $ | (467.1 | ) | | $ | 476.6 |
|
Kansas City Southern and Subsidiaries
Notes to Consolidated Financial Statements-(Continued)
Condensed Consolidating Statements of Comprehensive Income - KCSR Notes—(Continued)Balance Sheets
|
| | | | | | | | | | | | | | | | | | | | | | | |
| | 2015 |
| | Parent | | KCSR | | Guarantor Subsidiaries | | Non-Guarantor Subsidiaries | | Consolidating Adjustments | | Consolidated KCS |
| Revenues | $ | — |
| | $ | 1,112.5 |
| | $ | 42.1 |
| | $ | 1,302.3 |
| | $ | (38.1 | ) | | $ | 2,418.8 |
|
| Operating expenses | 4.6 |
| | 760.4 |
| | 38.0 |
| | 849.3 |
| | (37.3 | ) | | 1,615.0 |
|
| Operating income (loss) | (4.6 | ) | | 352.1 |
| | 4.1 |
| | 453.0 |
| | (0.8 | ) | | 803.8 |
|
| Equity in net earnings (losses) of affiliates | 464.0 |
| | (1.4 | ) | | 5.5 |
| | 16.5 |
| | (466.3 | ) | | 18.3 |
|
| Interest expense | (4.6 | ) | | (84.8 | ) | | (0.1 | ) | | (40.1 | ) | | 47.7 |
| | (81.9 | ) |
| Debt retirement and exchange costs | 0.1 |
| | (5.2 | ) | | — |
| | (2.5 | ) | | — |
| | (7.6 | ) |
| Foreign exchange loss | — |
| | — |
| | — |
| | (56.6 | ) | | — |
| | (56.6 | ) |
| Other income (expense), net | 45.9 |
| | (3.2 | ) | | 0.1 |
| | 1.4 |
| | (47.6 | ) | | (3.4 | ) |
| Income before income taxes | 500.8 |
| | 257.5 |
| | 9.6 |
| | 371.7 |
| | (467.0 | ) | | 672.6 |
|
| Income tax expense | 16.5 |
| | 95.2 |
| | 3.1 |
| | 72.5 |
| | — |
| | 187.3 |
|
| Net income | 484.3 |
| | 162.3 |
| | 6.5 |
| | 299.2 |
| | (467.0 | ) | | 485.3 |
|
| Less: Net income attributable to noncontrolling interest | — |
| | — |
| | 1.8 |
| | — |
| | — |
| | 1.8 |
|
| Net income attributable to Kansas City Southern and subsidiaries | 484.3 |
| | 162.3 |
| | 4.7 |
| | 299.2 |
| | (467.0 | ) | | 483.5 |
|
| Other comprehensive loss | (1.5 | ) | | — |
| | — |
| | (2.2 | ) | | 2.2 |
| | (1.5 | ) |
| Comprehensive income attributable to Kansas City Southern and subsidiaries | $ | 482.8 |
| | $ | 162.3 |
| | $ | 4.7 |
| | $ | 297.0 |
| | $ | (464.8 | ) | | $ | 482.0 |
|
|
| | | | | | | | | | | | | | | | | | | | | | | |
| | December 31, 2018 |
| | Parent | | KCSR | | Guarantor Subsidiaries | | Non-Guarantor Subsidiaries | | Consolidating Adjustments | | Consolidated KCS |
| Assets: | | | | | | | | | | | |
| Current assets | $ | 229.8 |
| | $ | 257.6 |
| | $ | 5.0 |
| | $ | 350.4 |
| | $ | (207.4 | ) | | $ | 635.4 |
|
| Investments | — |
| | 3.9 |
| | 4.4 |
| | 36.6 |
| | — |
| | 44.9 |
|
| Investments in consolidated subsidiaries | 4,852.8 |
| | 4.4 |
| | 190.2 |
| | — |
| | (5,047.4 | ) | | — |
|
| Property and equipment (including concession assets), net | — |
| | 4,429.2 |
| | 165.1 |
| | 4,104.8 |
| | (8.0 | ) | | 8,691.1 |
|
| Other assets | 2,523.4 |
| | 59.3 |
| | — |
| | 36.8 |
| | (2,521.1 | ) | | 98.4 |
|
| Total assets | $ | 7,606.0 |
| | $ | 4,754.4 |
| | $ | 364.7 |
| | $ | 4,528.6 |
| | $ | (7,783.9 | ) | | $ | 9,469.8 |
|
| Liabilities and equity: | | | | | | | | | | | |
| Current liabilities | $ | 214.2 |
| | $ | 109.2 |
| | $ | 80.1 |
| | $ | 252.3 |
| | $ | (208.8 | ) | | $ | 447.0 |
|
| Long-term debt | 2,563.0 |
| | 1,828.8 |
| | — |
| | 808.5 |
| | (2,521.0 | ) | | 2,679.3 |
|
| Deferred income taxes | (4.4 | ) | | 812.8 |
| | 84.7 |
| | 188.8 |
| | (2.0 | ) | | 1,079.9 |
|
| Other liabilities | 20.2 |
| | 94.8 |
| | 0.2 |
| | 15.8 |
| | (0.1 | ) | | 130.9 |
|
| Stockholders’ equity | 4,813.0 |
| | 1,908.8 |
| | 199.7 |
| | 2,943.5 |
| | (5,052.0 | ) | | 4,813.0 |
|
| Noncontrolling interest | — |
| | — |
| | — |
| | 319.7 |
| | — |
| | 319.7 |
|
| Total liabilities and equity | $ | 7,606.0 |
| | $ | 4,754.4 |
| | $ | 364.7 |
| | $ | 4,528.6 |
| | $ | (7,783.9 | ) | | $ | 9,469.8 |
|
|
| | | | | | | | | | | | | | | | | | | | | | | |
| | December 31, 2017 |
| | Parent | | KCSR | | Guarantor Subsidiaries | | Non-Guarantor Subsidiaries | | Consolidating Adjustments | | Consolidated KCS |
| Assets: | | | | | | | | | | | |
| Current assets | $ | 292.0 |
| | $ | 214.1 |
| | $ | 8.8 |
| | $ | 475.5 |
| | $ | (310.3 | ) | | $ | 680.1 |
|
| Investments | — |
| | 3.9 |
| | — |
| | 40.7 |
| | — |
| | 44.6 |
|
| Investments in consolidated subsidiaries | 4,462.4 |
| | 7.4 |
| | 182.2 |
| | — |
| | (4,652.0 | ) | | — |
|
| Property and equipment (including concession assets), net | — |
| | 4,283.2 |
| | 171.6 |
| | 3,954.9 |
| | (5.9 | ) | | 8,403.8 |
|
| Other assets | 2,159.6 |
| | 46.8 |
| | — |
| | 252.5 |
| | (2,388.7 | ) | | 70.2 |
|
| Total assets | $ | 6,914.0 |
| | $ | 4,555.4 |
| | $ | 362.6 |
| | $ | 4,723.6 |
| | $ | (7,356.9 | ) | | $ | 9,198.7 |
|
| Liabilities and equity: | | | | | | | | | | | |
| Current liabilities | $ | 277.9 |
| | $ | 578.7 |
| | $ | 94.9 |
| | $ | 332.0 |
| | $ | (311.8 | ) | | $ | 971.7 |
|
| Long-term debt | 2,066.8 |
| | 1,517.2 |
| | — |
| | 1,040.3 |
| | (2,388.8 | ) | | 2,235.5 |
|
| Deferred income taxes | (7.1 | ) | | 734.8 |
| | 84.0 |
| | 177.0 |
| | (1.5 | ) | | 987.2 |
|
| Other liabilities | 13.5 |
| | 70.0 |
| | 0.3 |
| | 55.1 |
| | — |
| | 138.9 |
|
| Stockholders’ equity | 4,562.9 |
| | 1,654.7 |
| | 183.4 |
| | 2,802.7 |
| | (4,654.8 | ) | | 4,548.9 |
|
| Noncontrolling interest | — |
| | — |
| | — |
| | 316.5 |
| | — |
| | 316.5 |
|
| Total liabilities and equity | $ | 6,914.0 |
| | $ | 4,555.4 |
| | $ | 362.6 |
| | $ | 4,723.6 |
| | $ | (7,356.9 | ) | | $ | 9,198.7 |
|
Kansas City Southern and Subsidiaries
Notes to Consolidated Financial Statements-(Continued)
Condensed Consolidating Statements of Comprehensive Income - KCSR Notes—(Continued)Cash Flows
|
| | | | | | | | | | | | | | | | | | | | | | | |
| | 2014 |
| | Parent | | KCSR | | Guarantor Subsidiaries | | Non-Guarantor Subsidiaries | | Consolidating Adjustments | | Consolidated KCS |
| Revenues | $ | — |
| | $ | 1,215.8 |
| | $ | 48.7 |
| | $ | 1,353.7 |
| | $ | (41.1 | ) | | $ | 2,577.1 |
|
| Operating expenses | 7.6 |
| | 881.6 |
| | 41.8 |
| | 879.1 |
| | (42.1 | ) | | 1,768.0 |
|
| Operating income (loss) | (7.6 | ) | | 334.2 |
| | 6.9 |
| | 474.6 |
| | 1.0 |
| | 809.1 |
|
| Equity in net earnings (losses) of affiliates | 476.7 |
| | (0.1 | ) | | 5.5 |
| | 18.9 |
| | (479.9 | ) | | 21.1 |
|
| Interest expense | (0.1 | ) | | (83.3 | ) | | — |
| | (39.6 | ) | | 50.2 |
| | (72.8 | ) |
| Debt retirement and exchange costs | — |
| | (2.7 | ) | | — |
| | (3.9 | ) | | — |
| | (6.6 | ) |
| Foreign exchange loss | — |
| | — |
| | — |
| | (35.5 | ) | | — |
| | (35.5 | ) |
| Other income (expense), net | 50.1 |
| | 0.2 |
| | — |
| | (1.2 | ) | | (51.3 | ) | | (2.2 | ) |
| Income before income taxes | 519.1 |
| | 248.3 |
| | 12.4 |
| | 413.3 |
| | (480.0 | ) | | 713.1 |
|
| Income tax expense | 16.5 |
| | 94.7 |
| | 4.4 |
| | 93.2 |
| | — |
| | 208.8 |
|
| Net income | 502.6 |
| | 153.6 |
| | 8.0 |
| | 320.1 |
| | (480.0 | ) | | 504.3 |
|
| Less: Net income attributable to noncontrolling interest | — |
| | — |
| | 1.7 |
| | — |
| | — |
| | 1.7 |
|
| Net income attributable to Kansas City Southern and subsidiaries | 502.6 |
| | 153.6 |
| | 6.3 |
| | 320.1 |
| | (480.0 | ) | | 502.6 |
|
| Other comprehensive income (loss) | (1.2 | ) | | 0.1 |
| | — |
| | (1.8 | ) | | 1.7 |
| | (1.2 | ) |
| Comprehensive income attributable to Kansas City Southern and subsidiaries | $ | 501.4 |
| | $ | 153.7 |
| | $ | 6.3 |
| | $ | 318.3 |
| | $ | (478.3 | ) | | $ | 501.4 |
|
|
| | | | | | | | | | | | | | | | | | | | | | | |
| | 2018 |
| | Parent | | KCSR | | Guarantor Subsidiaries | | Non-Guarantor Subsidiaries | | Consolidating Adjustments | | Consolidated KCS |
| Operating activities: | | | | | | | | | | | |
| Net cash provided | $ | 223.8 |
| | $ | 460.9 |
| | $ | 1.2 |
| | $ | 501.3 |
| | $ | (241.5 | ) | | $ | 945.7 |
|
| Investing activities: | | | | | | | | | | | |
| Capital expenditures | — |
| | (244.8 | ) | | (1.1 | ) | | (274.4 | ) | | — |
| | (520.3 | ) |
| Purchase or replacement of equipment under operating leases | — |
| | (88.4 | ) | | — |
| | (10.5 | ) | | — |
| | (98.9 | ) |
| Property investments in MSLLC | — |
| | — |
| | — |
| | (26.1 | ) | | — |
| | (26.1 | ) |
| Insurance proceeds related to hurricane damage | — |
| | 7.6 |
| | — |
| | — |
| | — |
| | 7.6 |
|
| Investments in and advances to affiliates | (7.8 | ) | | — |
| | (7.8 | ) | | (15.2 | ) | | 11.6 |
| | (19.2 | ) |
| Proceeds from repayment of loans to affiliates | 4,584.5 |
| | — |
| | — |
| | 125.0 |
| | (4,709.5 | ) | | — |
|
| Loans to affiliates | (4,515.6 | ) | | — |
| | — |
| | (125.0 | ) | | 4,640.6 |
| | — |
|
| Proceeds from disposal of property | — |
| | 4.1 |
| | — |
| | 4.6 |
| | — |
| | 8.7 |
|
| Other investing activities | — |
| | (6.1 | ) | | — |
| | — |
| | 2.4 |
| | (3.7 | ) |
| Net cash provided (used) | 61.1 |
| | (327.6 | ) | | (8.9 | ) | | (321.6 | ) | | (54.9 | ) | | (651.9 | ) |
| Financing activities: | | | | | | | | | | | |
| Net short-term borrowings | (348.1 | ) | | — |
| | — |
| | — |
| | — |
| | (348.1 | ) |
| Proceeds from issuance of long-term debt | 499.4 |
| | — |
| | — |
| | — |
| | — |
| | 499.4 |
|
| Repayment of long-term debt | — |
| | (3.9 | ) | | (0.1 | ) | | (77.5 | ) | | — |
| | (81.5 | ) |
| Debt issuance and retirement costs paid | (6.2 | ) | | — |
| | — |
| | (1.8 | ) | | — |
| | (8.0 | ) |
| Dividends paid | (147.5 | ) | | — |
| | — |
| | (239.1 | ) | | 239.1 |
| | (147.5 | ) |
| Shares repurchased | (243.5 | ) | | — |
| | — |
| | — |
| | — |
| | (243.5 | ) |
| Proceeds from loans from affiliates | 125.0 |
| | 4,465.6 |
| | — |
| | 50.0 |
| | (4,640.6 | ) | | — |
|
| Repayment of loans from affiliates | (125.0 | ) | | (4,584.5 | ) | | — |
| | — |
| | 4,709.5 |
| | — |
|
| Contributions from affiliates | — |
| | — |
| | 7.8 |
| | 3.8 |
| | (11.6 | ) | | — |
|
| Other financing activities | 1.8 |
| | — |
| | — |
| | — |
| | — |
| | 1.8 |
|
| Net cash provided (used) | (244.1 | ) | | (122.8 | ) | | 7.7 |
| | (264.6 | ) | | 296.4 |
| | (327.4 | ) |
| Cash and cash equivalents: | | | | | | | | | | | |
| Net increase (decrease) | 40.8 |
| | 10.5 |
| | — |
| | (84.9 | ) | | — |
| | (33.6 | ) |
| At beginning of year | 0.7 |
| | 17.6 |
| | — |
| | 115.8 |
| | — |
| | 134.1 |
|
| At end of year | $ | 41.5 |
| | $ | 28.1 |
| | $ | — |
| | $ | 30.9 |
| | $ | — |
| | $ | 100.5 |
|
Kansas City Southern and Subsidiaries
Notes to Consolidated Financial Statements-(Continued)
Condensed Consolidating Balance Sheets - KCSR NotesStatements of Cash Flows—(Continued)
|
| | | | | | | | | | | | | | | | | | | | | | | |
| | December 31, 2016 |
| | Parent | | KCSR | | Guarantor Subsidiaries | | Non-Guarantor Subsidiaries | | Consolidating Adjustments | | Consolidated KCS |
| Assets: | | | | | | | | | | | |
| Current assets | $ | 0.9 |
| | $ | 271.8 |
| | $ | 4.6 |
| | $ | 381.2 |
| | $ | (10.5 | ) | | $ | 648.0 |
|
| Investments | — |
| | 3.9 |
| | — |
| | 29.0 |
| | — |
| | 32.9 |
|
| Investments in consolidated subsidiaries | 3,497.7 |
| | (9.8 | ) | | 491.7 |
| | — |
| | (3,979.6 | ) | | — |
|
| Property and equipment (including concession assets), net | — |
| | 4,024.5 |
| | 179.1 |
| | 3,868.8 |
| | (2.7 | ) | | 8,069.7 |
|
| Other assets | 2,015.5 |
| | 43.0 |
| | — |
| | 252.6 |
| | (2,244.2 | ) | | 66.9 |
|
| Total assets | $ | 5,514.1 |
| | $ | 4,333.4 |
| | $ | 675.4 |
| | $ | 4,531.6 |
| | $ | (6,237.0 | ) | | $ | 8,817.5 |
|
| Liabilities and equity: | | | | | | | | | | | |
| Current liabilities | $ | (501.3 | ) | | $ | 913.2 |
| | $ | 91.7 |
| | $ | 252.6 |
| | $ | (11.8 | ) | | $ | 744.4 |
|
| Long-term debt | 1,883.1 |
| | 1,357.7 |
| | 0.1 |
| | 1,274.9 |
| | (2,244.3 | ) | | 2,271.5 |
|
| Deferred income taxes | 26.9 |
| | 937.7 |
| | 137.6 |
| | 188.0 |
| | (0.9 | ) | | 1,289.3 |
|
| Other liabilities | 4.0 |
| | 86.2 |
| | 0.1 |
| | 17.5 |
| | — |
| | 107.8 |
|
| Stockholders’ equity | 4,101.4 |
| | 1,038.6 |
| | 131.3 |
| | 2,798.6 |
| | (3,980.0 | ) | | 4,089.9 |
|
| Noncontrolling interest | — |
| | — |
| | 314.6 |
| | — |
| | — |
| | 314.6 |
|
| Total liabilities and equity | $ | 5,514.1 |
| | $ | 4,333.4 |
| | $ | 675.4 |
| | $ | 4,531.6 |
| | $ | (6,237.0 | ) | | $ | 8,817.5 |
|
|
| | | | | | | | | | | | | | | | | | | | | | | |
| | December 31, 2015 |
| | Parent | | KCSR | | Guarantor Subsidiaries | | Non-Guarantor Subsidiaries | | Consolidating Adjustments | | Consolidated KCS |
| Assets: | | | | | | | | | | | |
| Current assets | $ | 242.8 |
| | $ | 182.7 |
| | $ | 7.7 |
| | $ | 359.5 |
| | $ | (255.7 | ) | | $ | 537.0 |
|
| Investments | — |
| | 3.9 |
| | — |
| | 30.8 |
| | — |
| | 34.7 |
|
| Investments in consolidated subsidiaries | 3,108.4 |
| | (7.6 | ) | | 477.6 |
| | — |
| | (3,578.4 | ) | | — |
|
| Property and equipment (including concession assets), net | — |
| | 3,716.4 |
| | 186.8 |
| | 3,803.0 |
| | (0.8 | ) | | 7,705.4 |
|
| Other assets | 1,791.1 |
| | 40.5 |
| | — |
| | 19.3 |
| | (1,787.0 | ) | | 63.9 |
|
| Total assets | $ | 5,142.3 |
| | $ | 3,935.9 |
| | $ | 672.1 |
| | $ | 4,212.6 |
| | $ | (5,621.9 | ) | | $ | 8,341.0 |
|
| Liabilities and equity: | | | | | | | | | | | |
| Current liabilities | $ | (566.9 | ) | | $ | 959.6 |
| | $ | 107.8 |
| | $ | 512.8 |
| | $ | (255.7 | ) | | $ | 757.6 |
|
| Long-term debt | 1,759.8 |
| | 1,259.9 |
| | 0.1 |
| | 812.3 |
| | (1,787.1 | ) | | 2,045.0 |
|
| Deferred income taxes | 20.9 |
| | 863.7 |
| | 134.7 |
| | 171.8 |
| | — |
| | 1,191.1 |
|
| Other liabilities | 3.8 |
| | 94.2 |
| | 0.2 |
| | 24.4 |
| | — |
| | 122.6 |
|
| Stockholders’ equity | 3,924.7 |
| | 758.5 |
| | 118.9 |
| | 2,691.3 |
| | (3,579.1 | ) | | 3,914.3 |
|
| Noncontrolling interest | — |
| | — |
| | 310.4 |
| | — |
| | — |
| | 310.4 |
|
| Total liabilities and equity | $ | 5,142.3 |
| | $ | 3,935.9 |
| | $ | 672.1 |
| | $ | 4,212.6 |
| | $ | (5,621.9 | ) | | $ | 8,341.0 |
|
|
| | | | | | | | | | | | | | | | | | | | | | | |
| | 2017 |
| | Parent | | KCSR | | Guarantor Subsidiaries | | Non-Guarantor Subsidiaries | | Consolidating Adjustments | | Consolidated KCS |
| Operating activities: | | | | | | | | | | | |
| Net cash provided | $ | 220.4 |
| | $ | 556.6 |
| | $ | 0.4 |
| | $ | 266.9 |
| | $ | (15.9 | ) | | $ | 1,028.4 |
|
| Investing activities: | | | | | | | | | | | |
| Capital expenditures | — |
| | (375.2 | ) | | (0.3 | ) | | (209.9 | ) | | — |
| | (585.4 | ) |
| Purchase or replacement of equipment under operating leases | — |
| | (42.6 | ) | | — |
| | — |
| | — |
| | (42.6 | ) |
| Property investments in MSLLC | — |
| | — |
| | — |
| | (26.0 | ) | | — |
| | (26.0 | ) |
| Insurance proceeds related to hurricane damage | — |
| | — |
| | — |
| | — |
| | — |
| | — |
|
| Investments in and advances to affiliates | (0.6 | ) | | — |
| | (0.6 | ) | | (20.4 | ) | | 1.2 |
| | (20.4 | ) |
| Proceeds from repayment of loans to affiliates | 12,241.7 |
| | — |
| | — |
| | — |
| | (12,241.7 | ) | | — |
|
| Loans to affiliates | (12,102.6 | ) | | — |
| | — |
| | — |
| | 12,102.6 |
| | — |
|
| Proceeds from disposal of property | — |
| | 6.0 |
| | — |
| | 2.8 |
| | — |
| | 8.8 |
|
| Other investing activities | — |
| | (17.2 | ) | | — |
| | (1.7 | ) | | 3.4 |
| | (15.5 | ) |
| Net cash provided (used) | 138.5 |
| | (429.0 | ) | | (0.9 | ) | | (255.2 | ) | | (134.5 | ) | | (681.1 | ) |
| Financing activities: | | | | | | | | | | | |
| Net short-term borrowings | 159.0 |
| | — |
| | — |
| | — |
| | — |
| | 159.0 |
|
| Proceeds from issuance of long-term debt | — |
| | — |
| | — |
| | — |
| | — |
| | — |
|
| Repayment of long-term debt | — |
| | (3.5 | ) | | (0.1 | ) | | (21.8 | ) | | — |
| | (25.4 | ) |
| Debt issuance and retirement costs paid | — |
| | — |
| | — |
| | — |
| | — |
| | — |
|
| Dividends paid | (142.5 | ) | | — |
| | — |
| | (12.5 | ) | | 12.5 |
| | (142.5 | ) |
| Shares repurchased | (375.6 | ) | | — |
| | — |
| | — |
| | — |
| | (375.6 | ) |
| Proceeds from loans from affiliates | — |
| | 12,102.6 |
| | — |
| | — |
| | (12,102.6 | ) | | — |
|
| Repayment of loans from affiliates | — |
| | (12,241.7 | ) | | — |
| | — |
| | 12,241.7 |
| | — |
|
| Contribution from affiliates | — |
| | — |
| | 0.6 |
| | 0.6 |
| | (1.2 | ) | | — |
|
| Other financing activities | 0.7 |
| | — |
| | — |
| | — |
| | — |
| | 0.7 |
|
| Net cash provided (used) | (358.4 | ) | | (142.6 | ) | | 0.5 |
| | (33.7 | ) | | 150.4 |
| | (383.8 | ) |
| Cash and cash equivalents: | | | | | | | | | | | |
| Net increase (decrease) | 0.5 |
| | (15.0 | ) | | — |
| | (22.0 | ) | | — |
| | (36.5 | ) |
| At beginning of year | 0.2 |
| | 32.6 |
| | — |
| | 137.8 |
| | — |
| | 170.6 |
|
| At end of year | $ | 0.7 |
| | $ | 17.6 |
| | $ | — |
| | $ | 115.8 |
| | $ | — |
| | $ | 134.1 |
|
Kansas City Southern and Subsidiaries
Notes to Consolidated Financial Statements-(Continued)
Condensed Consolidating Statements of Cash Flows - KCSR Notes
|
| | | | | | | | | | | | | | | | | | | | | | | |
| | 2016 |
| | Parent | | KCSR | | Guarantor Subsidiaries | | Non-Guarantor Subsidiaries | | Consolidating Adjustments | | Consolidated KCS |
| Operating activities: | | | | | | | | | | | |
| Net cash provided | $ | 428.4 |
| | $ | 235.4 |
| | $ | 0.6 |
| | $ | 482.7 |
| | $ | (233.8 | ) | | $ | 913.3 |
|
| Investing activities: | | | | | | | | | | | |
| Capital expenditures | — |
| | (372.5 | ) | | (0.6 | ) | | (190.8 | ) | | — |
| | (563.9 | ) |
| Purchase or replacement of equipment under operating leases | — |
| | (26.6 | ) | | — |
| | — |
| | — |
| | (26.6 | ) |
| Property investments in MSLLC | — |
| | — |
| | — |
| | (33.1 | ) | | — |
| | (33.1 | ) |
| Proceeds from repayment of loans to affiliates | 9,067.7 |
| | — |
| | — |
| | — |
| | (9,067.7 | ) | | — |
|
| Loans to affiliates | (9,123.4 | ) | | — |
| | — |
| | — |
| | 9,123.4 |
| | — |
|
| Contributions to consolidated affiliates | (153.4 | ) | | — |
| | (6.5 | ) | | — |
| | 159.9 |
| | — |
|
| Other investing activities | — |
| | (12.6 | ) | | — |
| | 6.1 |
| | 1.9 |
| | (4.6 | ) |
| Net cash used | (209.1 | ) | | (411.7 | ) | | (7.1 | ) | | (217.8 | ) | | 217.5 |
| | (628.2 | ) |
| Financing activities: | | | | | | | | | | | |
| Proceeds from short-term borrowings | 8,698.7 |
| | 243.5 |
| | — |
| | — |
| | (243.5 | ) | | 8,698.7 |
|
| Repayment of short-term borrowings | (8,597.9 | ) | | (243.5 | ) | | — |
| | — |
| | 243.5 |
| | (8,597.9 | ) |
| Proceeds from issuance of long-term debt | 248.7 |
| | — |
| | — |
| | — |
| | — |
| | 248.7 |
|
| Repayment of long-term debt | (244.8 | ) | | (3.4 | ) | | (0.1 | ) | | (28.1 | ) | | — |
| | (276.4 | ) |
| Dividends paid | (142.8 | ) | | — |
| | — |
| | (230.2 | ) | | 230.2 |
| | (142.8 | ) |
| Shares repurchased | (185.4 | ) | | — |
| | — |
| | — |
| | — |
| | (185.4 | ) |
| Proceeds from loans from affiliates | — |
| | 8,879.9 |
| | — |
| | — |
| | (8,879.9 | ) | | — |
|
| Repayment of loans from affiliates | — |
| | (8,824.2 | ) | | — |
| | — |
| | 8,824.2 |
| | — |
|
| Contributions from affiliates | — |
| | 146.6 |
| | 6.5 |
| | 6.8 |
| | (159.9 | ) | | — |
|
| Other financing activities | 4.2 |
| | (0.1 | ) | | — |
| | (1.8 | ) | | 1.7 |
| | 4.0 |
|
| Net cash provided (used) | (219.3 | ) | | 198.8 |
| | 6.4 |
| | (253.3 | ) | | 16.3 |
| | (251.1 | ) |
| Cash and cash equivalents: | | | | | | | | | | | |
| Net increase (decrease) | — |
| | 22.5 |
| | (0.1 | ) | | 11.6 |
| | — |
| | 34.0 |
|
| At beginning of year | 0.2 |
| | 10.1 |
| | 0.1 |
| | 126.2 |
| | — |
| | 136.6 |
|
| At end of year | $ | 0.2 |
| | $ | 32.6 |
| | $ | — |
| | $ | 137.8 |
| | $ | — |
| | $ | 170.6 |
|
Kansas City Southern and Subsidiaries
Notes to Consolidated Financial Statements-(Continued)
Condensed Consolidating Statements of Cash Flows - KCSR Notes—Flows—(Continued)
|
| | | | | | | | | | | | | | | | | | | | | | | |
| | 2015 |
| | Parent | | KCSR | | Guarantor Subsidiaries | | Non-Guarantor Subsidiaries | | Consolidating Adjustments | | Consolidated KCS |
| Operating activities: | | | | | | | | | | | |
| Net cash provided | $ | 45.3 |
| | $ | 355.6 |
| | $ | 1.0 |
| | $ | 526.0 |
| | $ | (18.6 | ) | | $ | 909.3 |
|
| Investing activities: | | | | | | | | | | | |
| Capital expenditures | — |
| | (381.5 | ) | | (1.3 | ) | | (305.2 | ) | | — |
| | (688.0 | ) |
| Purchase or replacement of equipment under operating leases | — |
| | (82.8 | ) | | — |
| | (61.4 | ) | | — |
| | (144.2 | ) |
| Property investments in MSLLC | — |
| | — |
| | — |
| | (17.4 | ) | | — |
| | (17.4 | ) |
| Proceeds from repayment of loans to affiliates | 293.9 |
| | — |
| | — |
| | — |
| | (293.9 | ) | | — |
|
| Loans to affiliates | (80.0 | ) | | — |
| | — |
| | — |
| | 80.0 |
| | — |
|
| Other investing activities | (0.8 | ) | | (30.7 | ) | | (0.7 | ) | | 6.5 |
| | 2.3 |
| | (23.4 | ) |
| Net cash provided (used) | 213.1 |
| | (495.0 | ) | | (2.0 | ) | | (377.5 | ) | | (211.6 | ) | | (873.0 | ) |
| Financing activities: | | | | | | | | | | | |
| Proceeds from short-term borrowings | 80.0 |
| | 10,786.2 |
| | — |
| | — |
| | — |
| | 10,866.2 |
|
| Repayment of short-term borrowings | — |
| | (10,937.3 | ) | | — |
| | (300.0 | ) | | — |
| | (11,237.3 | ) |
| Proceeds from issuance of long-term debt | — |
| | 663.7 |
| | — |
| | 40.0 |
| | (80.0 | ) | | 623.7 |
|
| Repayment of long-term debt | — |
| | (88.3 | ) | | (0.1 | ) | | (61.4 | ) | | — |
| | (149.8 | ) |
| Dividends paid | (140.1 | ) | | — |
| | — |
| | (17.8 | ) | | 17.8 |
| | (140.1 | ) |
| Shares repurchased | (194.2 | ) | | — |
| | — |
| | — |
| | — |
| | (194.2 | ) |
| Repayment of loans from affiliates | — |
| | (293.9 | ) | | — |
| | — |
| | 293.9 |
| | — |
|
| Other financing activities | (4.1 | ) | | (9.9 | ) | | 0.7 |
| | (1.4 | ) | | (1.5 | ) | | (16.2 | ) |
| Net cash provided (used) | (258.4 | ) | | 120.5 |
| | 0.6 |
| | (340.6 | ) | | 230.2 |
| | (247.7 | ) |
| Cash and cash equivalents: | | | | | | | | | | | |
| Net decrease | — |
| | (18.9 | ) | | (0.4 | ) | | (192.1 | ) | | — |
| | (211.4 | ) |
| At beginning of year | 0.2 |
| | 29.0 |
| | 0.5 |
| | 318.3 |
| | — |
| | 348.0 |
|
| At end of year | $ | 0.2 |
| | $ | 10.1 |
| | $ | 0.1 |
| | $ | 126.2 |
| | $ | — |
| | $ | 136.6 |
|
Kansas City Southern and Subsidiaries
Notes to Consolidated Financial Statements-(Continued)
Condensed Consolidating Statements of Cash Flows - KCSR Notes—(Continued)
|
| | | | | | | | | | | | | | | | | | | | | | | |
| | 2014 |
| | Parent | | KCSR | | Guarantor Subsidiaries | | Non-Guarantor Subsidiaries | | Consolidating Adjustments | | Consolidated KCS |
| Operating activities: | | | | | | | | | | | |
| Net cash provided | $ | 345.3 |
| | $ | 377.0 |
| | $ | 2.1 |
| | $ | 495.9 |
| | $ | (314.3 | ) | | $ | 906.0 |
|
| Investing activities: | | | | | | | | | | | |
| Capital expenditures | — |
| | (477.8 | ) | | (1.7 | ) | | (190.2 | ) | | 1.5 |
| | (668.2 | ) |
| Purchase or replacement of equipment under operating leases | — |
| | (203.6 | ) | | — |
| | (98.5 | ) | | — |
| | (302.1 | ) |
| Property investments in MSLLC | — |
| | — |
| | — |
| | (26.7 | ) | | — |
| | (26.7 | ) |
| Proceeds from repayment of loans to affiliates | 70.4 |
| | — |
| | — |
| | — |
| | (70.4 | ) | | — |
|
| Contributions to consolidated affiliates | (299.6 | ) | | — |
| | — |
| | — |
| | 299.6 |
| | — |
|
| Other investing activities | (1.0 | ) | | 9.7 |
| | (1.1 | ) | | 5.8 |
| | 0.7 |
| | 14.1 |
|
| Net cash used | (230.2 | ) | | (671.7 | ) | | (2.8 | ) | | (309.6 | ) | | 231.4 |
| | (982.9 | ) |
| Financing activities: | | | | | | | | | | | |
| Proceeds from short-term borrowings | — |
| | 15,068.8 |
| | — |
| | 300.0 |
| | — |
| | 15,368.8 |
|
| Repayment of short-term borrowings | — |
| | (14,920.2 | ) | | — |
| | — |
| | — |
| | (14,920.2 | ) |
| Proceeds from issuance of long-term debt | — |
| | 175.0 |
| | — |
| | — |
| | — |
| | 175.0 |
|
| Repayment of long-term debt | — |
| | (423.5 | ) | | (0.1 | ) | | (84.4 | ) | | — |
| | (508.0 | ) |
| Dividends paid | (116.6 | ) | | — |
| | — |
| | (314.3 | ) | | 314.3 |
| | (116.6 | ) |
| Repayment of loans from affiliates | — |
| | (70.4 | ) | | — |
| | — |
| | 70.4 |
| | — |
|
| Contributions from affiliates | — |
| | 299.3 |
| | 1.1 |
| | 1.4 |
| | (301.8 | ) | | — |
|
| Other financing activities | 1.3 |
| | (1.4 | ) | | — |
| | (3.5 | ) | | — |
| | (3.6 | ) |
| Net cash provided (used) | (115.3 | ) | | 127.6 |
| | 1.0 |
| | (100.8 | ) | | 82.9 |
| | (4.6 | ) |
| Cash and cash equivalents: | | | | | | | | | | | |
| Net increase (decrease) | (0.2 | ) | | (167.1 | ) | | 0.3 |
| | 85.5 |
| | — |
| | (81.5 | ) |
| At beginning of year | 0.4 |
| | 196.1 |
| | 0.2 |
| | 232.8 |
| | — |
| | 429.5 |
|
| At end of year | $ | 0.2 |
| | $ | 29.0 |
| | $ | 0.5 |
| | $ | 318.3 |
| | $ | — |
| | $ | 348.0 |
|
|
| | | | | | | | | | | | | | | | | | | | | | | |
| | 2016 |
| | Parent | | KCSR | | Guarantor Subsidiaries | | Non-Guarantor Subsidiaries | | Consolidating Adjustments | | Consolidated KCS |
| Operating activities: | | | | | | | | | | | |
| Net cash provided | $ | 434.1 |
| | $ | 235.4 |
| | $ | 0.6 |
| | $ | 482.7 |
| | $ | (233.8 | ) | | $ | 919.0 |
|
| Investing activities: | | | | | | | | | | | |
| Capital expenditures | — |
| | (372.2 | ) | | (0.6 | ) | | (190.8 | ) | | — |
| | (563.6 | ) |
| Purchase or replacement of equipment under operating leases | — |
| | (26.6 | ) | | — |
| | — |
| | — |
| | (26.6 | ) |
| Property investments in MSLLC | — |
| | — |
| | — |
| | (33.1 | ) | | — |
| | (33.1 | ) |
| Insurance proceeds related to hurricane damage | — |
| | — |
| | — |
| | — |
| | — |
| | — |
|
| Investments in and advances to affiliates | (153.4 | ) | | — |
| | (6.5 | ) | | (0.9 | ) | | 159.9 |
| | (0.9 | ) |
| Proceeds from repayment of loans to affiliates | 9,067.7 |
| | — |
| | — |
| | — |
| | (9,067.7 | ) | | — |
|
| Loans to affiliates | (9,123.4 | ) | | — |
| | — |
| | — |
| | 9,123.4 |
| | — |
|
| Proceeds from disposal of property | — |
| | 2.0 |
| | — |
| | 3.1 |
| | (0.1 | ) | | 5.0 |
|
| Other investing activities | — |
| | (14.9 | ) | | — |
| | 3.9 |
| | 2.0 |
| | (9.0 | ) |
| Net cash used | (209.1 | ) | | (411.7 | ) | | (7.1 | ) | | (217.8 | ) | | 217.5 |
| | (628.2 | ) |
| Financing activities: | | | | | | | | | | | |
| Net short-term borrowings | 100.8 |
| | — |
| | — |
| | — |
| | — |
| | 100.8 |
|
| Proceeds from issuance of long-term debt | 248.7 |
| | — |
| | — |
| | — |
| | — |
| | 248.7 |
|
| Repayment of long-term debt | (244.8 | ) | | (3.4 | ) | | (0.1 | ) | | (28.1 | ) | | — |
| | (276.4 | ) |
| Debt issuance and retirement costs paid | (2.4 | ) | | — |
| | — |
| | (0.2 | ) | | — |
| | (2.6 | ) |
| Dividends paid | (142.8 | ) | | — |
| | — |
| | (230.2 | ) | | 230.2 |
| | (142.8 | ) |
| Shares repurchased | (185.4 | ) | | — |
| | — |
| | — |
| | — |
| | (185.4 | ) |
| Proceeds from loans from affiliates | — |
| | 9,123.4 |
| | — |
| | — |
| | (9,123.4 | ) | | — |
|
| Repayment of loans from affiliates | — |
| | (9,067.7 | ) | | — |
| | — |
| | 9,067.7 |
| | — |
|
| Contribution from affiliates | — |
| | 146.6 |
| | 6.5 |
| | 6.8 |
| | (159.9 | ) | | — |
|
| Other financing activities | 0.9 |
| | (0.1 | ) | | — |
| | (1.6 | ) | | 1.7 |
| | 0.9 |
|
| Net cash provided (used) | (225.0 | ) | | 198.8 |
| | 6.4 |
| | (253.3 | ) | | 16.3 |
| | (256.8 | ) |
| Cash and cash equivalents: | | | | | | | | | | | |
| Net increase (decrease) | — |
| | 22.5 |
| | (0.1 | ) | | 11.6 |
| | — |
| | 34.0 |
|
| At beginning of year | 0.2 |
| | 10.1 |
| | 0.1 |
| | 126.2 |
| | — |
| | 136.6 |
|
| At end of year | $ | 0.2 |
| | $ | 32.6 |
| | $ | — |
| | $ | 137.8 |
| | $ | — |
| | $ | 170.6 |
|
| |
| Item 9. | Changes in and Disagreements with Accountants on Accounting and Financial Disclosure |
Not Applicable.
| |
| Item 9A. | Controls and Procedures |
(a) Disclosure Controls and Procedures
The Chief Executive Officer and Chief Financial Officer have reviewed and evaluated the effectiveness of the Company’s disclosure controls and procedures (as defined in Rules 13a-15(e) and 15d-15(e) under the Securities Exchange Act of 1934, as amended (the “Exchange Act”), as of the end of the fiscal year for which this annual report on Form 10-K is filed.December 31, 2018. Based on that evaluation, the Chief Executive Officer and Chief Financial Officer have concluded that the currentCompany’s disclosure controls and procedures arewere effective to ensure that information required to be disclosed in reports filed or submitted under the Exchange Act is recorded, processed, summarized and reported within the time periods specified in the Securities and Exchange Commission rules and forms, and include controls and procedures designed to ensure that information required to be disclosed by the Company in such reports is accumulated and communicated to management, including the Chief Executive Officer and Chief Financial Officer, as appropriate to allow timely decisions regarding required disclosures.
(b) Changes in Internal Control over Financial Reporting
There have been no changes in the Company’s internal control over financial reporting that occurred during the last fiscal quarter (the fourth quarter in the case of an annual report)ended December 31, 2018 that have materially affected, or are reasonably likely to materially affect, the Company’s internal control over financial reporting.
(c) Internal Control over Financial Reporting
The report of management on the Company’s internal control over financial reporting (as defined in Rule 13a-15(f) and 15d-15(f) under the Exchange Act) is included as “Management’s Report on Internal Control over Financial Reporting” in Item 8.8, Financial Statements and Supplementary Data.
KPMGPricewaterhouseCoopers LLP, the independent registered public accounting firm that audited the Company’s financial statements contained herein, has issued an attestation report onalso audited the Company’s internal control over financial reporting as of December 31, 2016.2018. The attestationaudit report is included in Item 8, of this Form 10-K.Financial Statements and Supplementary Data.
| |
| Item 9B. | Other Information |
None.
Part III
The Company has incorporated by reference certain responses to the Items of this Part III pursuant to Rule 12b-23 under the Exchange Act and General Instruction G(3) to Form 10-K. The Company’s definitive proxy statement for the 2019 annual meeting of stockholders scheduled for May 4, 2017 (“Proxy Statement”), will be filed no later than 120 days after December 31, 20162018.
| |
| Item 10. | Directors, Executive Officers and Corporate Governance |
(a) Directors of the Company
The sections of the Proxy Statement entitled “Proposal 1 — Election of Directors” and “The Board of Directors” are incorporated by reference in partial response to this Item 10.
(b) Executive Officers of the Company
See “Executive Officers of KCS and Subsidiaries” in Part I, Item 1 of this annual report incorporated by reference herein for information about the executive officers of the Company.
(c) Changes to Shareholder Nominating Procedures
The Information set forth in the Proxy Statement is incorporated by reference in partial response to this Item 10.None.
(d) Audit Committee and Audit Committee Financial Experts
The section of the Proxy Statement entitled “Board Committees — The Audit Committee” is incorporated by reference in partial response to this Item 10.
(e) Compliance with Section 16(a) of the Exchange Act
The response to Item 405 of Regulation S-K under “Section 16(a) Beneficial Ownership Reporting Compliance” in the Proxy Statement is incorporated by reference in partial response to this Item 10.
(f) Code of Ethics
The Company has adopted a Code of Business Conduct and Ethics (“Code of Ethics”) that applies to directors, officers (including, among others, the principal executive officer, principal financial officer and principal accounting officer) and employees. The Company has posted its Code of Ethics on its website (www.kcsouthern.com) and will post on its website any amendments to, or waivers from, a provision of its Code of Ethics that applies to the Company’s principal executive officer, principal financial officer or principal accounting officer as required by applicable rules and regulations. The Code of Ethics is available, in print, upon written request to the Corporate Secretary, P.O. Box 219335, Kansas City, Missouri 64121-9335.
(g) Annual Certification to the New York Stock Exchange
KCS’s common stock is listed on the New York Stock Exchange (“NYSE”) under the ticker symbol “KSU”. As a result, the Chief Executive Officer is required to make annually, and he made on May 24, 2016,30, 2018, a CEO’s Annual Certification to the New York Stock Exchange in accordance with Section 303A.12 of the NYSE Listed Company Manual stating that he was not aware of any violations by KCS of the NYSE corporate governance listing standards.
| |
| Item 11. | Executive Compensation |
Information required by Item 11The sections of Part III isthe Proxy Statement entitled “Compensation Discussion and Analysis”, “Compensation Committee Report”, “Executive Compensation”, “Board Committees - Compensation Committee Interlocks and Insider Participation”, and “Director Compensation” are incorporated by reference from the Proxy Statement pursuantin response to Regulation 14A of the Exchange Act.this Item 11.
| |
| Item 12. | Security Ownership of Certain Beneficial Owners and Management and Related Stockholder Matters |
The section of the Proxy Statement entitled “Beneficial Ownership” is incorporated by reference in partial response to this Item 12.
Equity Compensation Plan Information
The following table provides information as of December 31, 20162018, about the common stock that may be issued upon the exercise of options, warrants and rights, as well as shares remaining available for future issuance under the Company’s existing equity compensation plans. | | | Plan Category | Number of Securities to Be Issued upon Exercise of Outstanding Options, Warrants and Rights | | Weighted- Average Exercise Price of Outstanding Options, Warrants and Rights | | Number of Securities Remaining Available for Future Issuance under Equity Compensation Plans-Excluding Securities Reflected in the First Column (i) | Number of Securities to Be Issued upon Exercise of Outstanding Options, Warrants and Rights | | Weighted- Average Exercise Price of Outstanding Options, Warrants and Rights | | Number of Securities Remaining Available for Future Issuance under Equity Compensation Plans-Excluding Securities Reflected in the First Column (i) |
| Equity compensation plans: | | | | | | | | | | |
| Approved by security holders | 601,992 |
| | $ | 81.36 |
| | 4,181,366 |
| 761,057 |
| | $ | 85.02 |
| | 6,948,222 |
|
| Not approved by security holders | — |
| | — |
| | — |
| — |
| | — |
| | — |
|
| Total | 601,992 |
| | $ | 81.36 |
| | 4,181,366 |
| 761,057 |
| | $ | 85.02 |
| | 6,948,222 |
|
_____________________
| |
| (i) | Includes 3,618,6123,479,481 shares available for issuance under the 2009 Employee Stock Purchase Plan and 562,7543,468,741 shares available for issuance under the 20082017 Plan as awards in the form of Nonvested Shares, Bonus Shares, Performance Units or Performance Shares or issued upon the exercise of Options (including ISOs), stock appreciation rights or limited stock appreciation rights awarded under the 20082017 Plan. |
The Company has no knowledge of any arrangement the operation of which may at a subsequent date result in a change of control of the Company.
| |
| Item 13. | Certain Relationships and Related Transactions, and Director Independence |
Information required by Item 13The sections of Part III isthe Proxy Statement entitled “Certain Transactions” and “Corporate Governance - Director Independence” are incorporated by reference from the Proxy Statement pursuantin response to Regulation 14A of the Exchange Act.this Item 13.
| |
| Item 14. | Principal Accountant Fees and Services |
Information required by Item 14The section of Part IIIthe Proxy Statement entitled “Independent Registered Public Accounting Firm” is incorporated by reference from the Proxy Statement pursuantin response to Regulation 14A of the Exchange Act.this Item 14.
Part IV
| |
Item 15. | Exhibits and Financial Statement Schedules |
Item 15. Exhibits and Financial Statement Schedules
(a) List of Documents filed as part of this Report
(1) Financial Statements
The consolidated financial statements and related notes, together with the reports of PricewaterhouseCoopers LLP, Independent Registered Public Accounting Firm and KPMG LLP, Independent Registered Public Accounting Firm, appear in Part II Item 8, Financial Statements and Supplementary Data, of this Form 10-K.Data.
(2) Financial Statement Schedules
None.
(3) List of Exhibits
(a) Exhibits
The Company has attached or incorporated by reference herein certain exhibits as specified below pursuant to
Rule 12b-32 under the Exchange Act.
|
| |
| Exhibit | Description |
| 3.1 | |
| | |
| 3.1.1 | |
| | |
| 3.2 | |
| | |
| 4.1 | As permitted by Item 601(b)(4)(iii)(A) of Regulation S-K, the Company has not filed with this Annual Report on Form 10-K certain instruments defining the rights of holders of long-term debt of the Company and its subsidiaries because the total amount of securities authorized under any of such instruments does not exceed 10% of the total assets of the Company and its subsidiaries on a consolidated basis. The Company agrees to furnish a copy of any such agreements to the Securities and Exchange Commission upon request. |
| | |
| 4.2 | |
| | |
| 4.2.1 | |
| | |
| 4.2.2 | |
| | |
| 4.3 | |
| | |
| 4.3.1 | |
| | |
| 4.3.2 | |
| | |
| 4.3.3 | |
| | |
| 4.3.4 | |
|
| |
| Exhibit | Description |
| 4.3.5 | |
| | |
| 4.4 | |
| | |
| 4.4.1 | |
| | |
| 4.4.2 | |
| | |
| 4.5 | |
| | |
| 4.5.1 | |
| | |
| 4.5.2 | |
| | |
| 4.5.3 | |
| | |
| 4.6 | |
| | |
| 4.6.1 | First Supplemental Indenture, dated December 9, 2015, among KCS, the Note Guarantors and U.S. Bank National Association, as trustee, filed as exhibit 4.2 to the Company’s Current Report on Form 8-K filed on December 15, 2015 (File No. 1-4717), is incorporated herein by reference as Exhibit 4.6.1. |
| |
4.6.2 | |
| | |
4.6.34.6.2 | |
| | |
4.6.44.6.3 | |
| | |
4.6.54.6.4 | |
| | |
4.6.64.6.5 | |
| | |
4.6.74.6.6 | |
| | |
4.6.84.6.7 | |
| |
| 4.6.8 |
|
| |
| |
|
| |
| Exhibit | Description |
| 4.6.9 | Registration Rights Agreement, dated December 9, 2015, among KCS, theForm of Note Guarantors, Citigroup Global Markets Inc.representing 4.700% Senior Notes due 2048 (included in Exhibit 4.2), J.P. Morgan Securities LLC, Merrill Lynch, Pierce, Fenner & Smith Incorporated and Morgan Stanley & Co. LLC, filed as exhibit 4.8Exhibit 4.3 to the Company’s Current Report on Form 8-K, filed on December 15, 2015May 4, 2018 (File No. 1-4717), is incorporated herein by reference as Exhibit 4.6.9. |
| | |
| 10.1 | |
| |
| 10.2 | |
| | |
| 10.3* | |
| | |
| 10.4* | Kansas City Southern 1991 Amended and Restated Stock Option and Performance Award Plan, as amended and restated effective as of August 7, 2007 (the “Amended 1991 Plan”), filed as Exhibit 10.2 to the Company’s Form 10-Q for the quarter ended September 30, 2007, filed on October 26, 2007 (File No. 1-4717), is incorporated herein by reference as Exhibit 10.4. |
| |
10.4.1* | First Amendment to the Kansas City Southern 1991 Amended and Restated Stock Option and Performance Award Plan, effective July 2, 2008, filed as Exhibit 10.1 to the Company’s Current Report on Form 8-K, filed on July 8, 2008 (File No. 1-4717), is incorporated herein by reference as Exhibit 10.4.1. |
| |
10.4.2* | Form of Non-Qualified Stock Option Award Agreement for employees under the Amended 1991 Plan, filed as Exhibit 10.8.2 to the Company’s Form 10-K for the year ended December 31, 2004, filed on March 30, 2005 (File No. 1-4717), is incorporated herein by reference as Exhibit 10.4.2. |
| |
10.4.3* | Form of Non-Qualified Stock Option Award Agreement for Directors under the Amended 1991 Plan, filed as Exhibit 10.8.3 to the Company’s Form 10-K for the year ended December 31, 2004, filed on March 30, 2005 (File No. 1-4717), is incorporated herein by reference as Exhibit 10.4.3. |
| |
10.4.4* | Form of Non-Qualified Stock Option Award agreement for employees under the Amended 1991 Plan (referencing threshold dates), filed as Exhibit 10.8.4 to the Company’s Form 10-K for the year ended December 31, 2004, filed on March 30, 2005 (File No. 1-4717), is incorporated herein by reference as Exhibit 10.4.4. |
| |
10.4.5* | Form of Restricted Shares Award Agreement (cliff vesting) under the Amended 1991 Plan, filed as Exhibit 10.5.6 to the Company’s Form 10-K for the year ended December 31, 2007, filed on February 15, 2008 (File No. 1-4717), is incorporated herein by reference as Exhibit 10.4.5. |
| |
10.4.6* | Form of Restricted Shares Award Agreement under the Amended 1991 Plan (applicable to restricted shares to be purchased), filed as Exhibit 10.8.7 to the Company’s Form 10-K for the year ended December 31, 2004, filed on March 30, 2005 (File No. 1-4717), is incorporated herein by reference as Exhibit 10.4.6. |
| |
10.4.7* | Form of Restricted Shares Award Agreement (consultants) under the Amended 1991 Plan, filed as Exhibit 10.5.9 to the Company’s Form 10-K for the year ended December 31, 2007, filed on February 15, 2008 (File No. 1-4717), is incorporated herein by reference as Exhibit 10.4.7. |
| |
10.4.8* | Form of Restricted Shares Award Agreement (executive plan) under the Amended 1991 Plan, filed as Exhibit 10.5.10 to the Company’s Form 10-K for the year ended December 31, 2007, filed on February 15, 2008 (File No. 1-4717), is incorporated herein by reference as Exhibit 10.4.8. |
| |
10.5* | |
| | |
10.6*10.5* | |
| |
| 10.6* | |
| | |
| 10.7* | |
|
| |
Exhibit | Description |
| 10.8 | |
| | |
| 10.8.1 | English translation of amendment, dated February 12, 2001, filed as Exhibit 10.10.1 to the Company'sCompany’s Form 10-K for the year ended December 31, 2011, filed on February 8, 2012 (File No. 1-4717), of concession title granted by SCT in favor of KCSM, formerly known as FNE, December 2, 1996, is incorporated herein by reference as Exhibit 10.8.1. |
| | |
| 10.8.2 | English translation of amendment no. 2, dated November 22, 2006, filed as Exhibit 10.10.2 to the Company'sCompany’s Form 10-K for the year ended December 31, 2011, filed on February 8, 2012 (File No. 1-4717), of concession title granted by SCT in favor of KCSM, formerly known as FNE, December 2, 1996, as amended February 12, 2001, is incorporated herein by reference as Exhibit 10.8.2. |
| | |
| 10.8.3 | English translation of amendment no. 3, dated March 26, 2014, of concession title granted by SCT in favor of KCSM, formerly known as FNE, December 2, 1996, as amended February 12, 2001 and November 22, 2006, is attachedfiled as Exhibit 10.8.3 to thisthe Company’s Form 10-K for the year ended December 31, 2016, filed on January 27, 2017 (File No. 1-4717), is incorporated herein by reference as Exhibit 10.8.3. |
| | |
| 10.9 | Agreement to Forego Compensation between A. Edward Allinson and the Company, fully executed on March 30, 2001; Loan Agreement between A. Edward Allinson and the Company, fully executed on September 18, 2001; and the Promissory Note executed by the Trustees of The A. Edward Allinson Irrevocable Trust Agreement, dated June 4, 2001, Courtney Ann Arnot, A. Edward Allinson III and Bradford J. Allinson, Trustees, as Maker, and the Company, as Holder, filed as Exhibit 10.36 to the Company’s Form 10-K for the year ended December 31, 2002, filed on March 28, 2003 (File No. 1-4717), are incorporated herein by reference as Exhibit 10.9. |
| | |
| 10.10 | Agreement to Forego Compensation between Michael G. Fitt and the Company, fully executed on March 30, 2001; Loan Agreement between Michael G. Fitt and the Company, fully executed on September 7, 2001; and the Promissory Note executed by the Trustees of The Michael G. and Doreen E. Fitt Irrevocable Insurance Trust, Anne E. Skyes, Colin M-D. Fitt and Ian D.G. Fitt, Trustees, as Maker, and the Company, as Holder, filed as Exhibit 10.37 to the Company’s Form 10-K for the year ended December 31, 2002, filed on March 28, 2003 (File No. 1-4717), are incorporated herein by reference as Exhibit 10.10. |
| | |
| 10.11 | Transaction Agreement, dated December 1, 2005, among the Company, KCSR, Norfolk Southern Corporation and The Alabama Great Southern Railroad Company (the “Transaction Agreement”), filed as Exhibit 10.46 to the Company’s Form 10-K for the year ended December 31, 2005, filed on April 7, 2006 (File No. 1-4717), is incorporated herein by reference as Exhibit 10.11. |
| | |
|
| |
| Exhibit | Description |
| 10.11.1 | |
| | |
| 10.11.2 | |
| |
| 10.11.3 | |
| | |
| 10.11.4 | Amendment No. 1 and Waiver to Limited Liability Company Agreement, dated August 12, 2011, among Meridian Speedway, LLC, the Company, KCS Holdings, Inc. and The Alabama Great Southern Railroad Company, filed as Exhibit 10.2 to the Company’s Form 10-Q for the quarter ended September 30, 2011, filed on October 21, 2011 (File No. 1-4717), is incorporated herein by reference as Exhibit 10.11.4. |
| | |
| 10.11.5 | Amendment No. 2 to Limited Liability Company Agreement, dated December 9, 2013, among the Company, KCS Holdings, Inc. and The Alabama Great Southern Railroad Company, is attachedfiled as Exhibit 10.11.5 to thisthe Company’s Form 10-K for the year ended December 31, 2016, filed on January 27, 2017 (File No. 1-4717), is incorporated herein by reference as Exhibit 10.11.5. |
| | |
|
| |
Exhibit | Description |
| 10.12 | Participation Agreement, dated August 2, 2006, among KCSR, KCSR Trust 2006-1 (acting through Wilmington Trust Company, as owner trustee) (“2006 Trust”), HSH Nordbank AG, New York Branch, Wells Fargo Bank Northwest, National Association, and DVB Bank AG, filed as Exhibit 10.4 to the Company’s Form 10-Q for the quarter ended September 30, 2006, filed on November 9, 2006 (File No. 1-4717), is incorporated herein by reference as Exhibit 10.12. |
| | |
| 10.12.1 | |
| | |
| 10.13 | Participation Agreement, dated September 27, 2007, among KCSR, KCSR 2007-1 Statutory Trust (acting through U.S. Bank Trust National Association, as owner trustee) (“2007 Trust”), U.S. Bank Trust National Association, GS Leasing (KCSR 2007-1) LLC, Wilmington Trust Company, and KfW, filed as Exhibit 10.51 to the Company’s Form 10-K for the year ended December 31, 2007, filed on February 15, 2008 (File No. 1-4717), is incorporated herein by reference as Exhibit 10.13. |
| | |
| 10.13.1 | |
| | |
| 10.14* | |
| | |
| 10.14.1* | Form of Non-Qualified Stock Option Award Agreement under the 2008 Plan, filed as Exhibit 10.47.1 to the Company’s Form 10-K for the year ended December 31, 2008, filed on February 17, 2009 (File No. 1-4717), is incorporated herein by reference as Exhibit 10.14.1. |
| |
10.14.2* | Form of Restricted Shares Award Agreement (cliff vesting) under the 2008 Plan, filed as Exhibit 10.47.2 to the Company’s Form 10-K for the year ended December 31, 2008, filed on February 17, 2009 (File No. 1-4717), is incorporated herein by reference as Exhibit 10.14.2. |
| |
10.14.3* | Form of Restricted Shares Award Agreement (graded vesting) under the 2008 Plan, filed as Exhibit 10.47.3 to the Company’s Form 10-K for the year ended December 31, 2008, filed on February 17, 2009 (File No. 1-4717), is incorporated herein by reference as Exhibit 10.14.3. |
| |
10.14.4* | Form of Restricted Shares Award Agreement under the 2008 Plan (applicable to restricted shares to be purchased), filed as Exhibit 10.47.4 to the Company’s Form 10-K for the year ended December 31, 2008, filed on February 17, 2009 (File No. 1-4717), is incorporated herein by reference as Exhibit 10.14.4. |
| |
10.14.5* | Form of Restricted Shares Award and Performance Shares Award Agreement under the 2008 Plan, filed as Exhibit 10.47.5 to the Company’s Form 10-K for the year ended December 31, 2008, filed on February 17, 2009 (File No. 1-4717), is incorporated herein by reference as Exhibit 10.14.5. |
| |
10.14.6* | Form of Restricted Shares Award Agreement (performance based vesting) under the 2008 Plan, filed as Exhibit 10.1 to the Company’s Current Report on Form 8-K, filed on September 17, 2010 (File No. 1-4717), is incorporated herein by reference as Exhibit 10.14.6. |
| |
10.14.7* | |
| | |
10.14.8*10.14.2* | Form of Restricted Shares Award Agreement (for use with the Executive Plan) under the 2008 Plan, filed as Exhibit 10.5 to the Company’s Current Report on Form 8-K filed on February 23, 2015 (File No. 1-4717), is incorporated herein by reference as Exhibit 10.14.8. |
| |
10.14.9* | |
| | |
10.14.10*10.14.3* | Form of Restricted Share Award Agreement (Employees) under the 2008 Plan for the 2016 Stock Appreciation Incentive Plan, filed as Exhibit 10.3 to the Company’s Current Report on Form 8-K filed on February 25, 2016 (File No. 1-4717), is incorporated herein by reference as Exhibit 10.14.10. |
| |
|
| |
Exhibit | Description |
10.14.11* | Form of Restricted Share Award Agreement (Independent Contractors) under the 2008 Plan for the 2016 Stock Appreciation Incentive Plan, filed as Exhibit 10.4 to the Company’s Current Report on Form 8-K filed on February 25, 2016 (File No. 1-4717), is incorporated herein by reference as Exhibit 10.14.11. |
| |
10.14.12* | Form of Non-Qualified Stock Option, Restricted Share and Performance Share Award Agreement (United States Employees) under the 2008 Plan for the 2014 Long-Term Incentive Program, filed as Exhibit 10.1 to the Company’s Current Report on Form 8-K filed on February 26, 2014 (File No. 1-4717), is incorporated herein by reference as Exhibit 10.14.12.10.14.3. |
| | |
10.14.13*10.14.4* | |
|
| |
10.14.14*Exhibit | Description |
| 10.14.5* | |
| | |
10.14.15*10.14.6* | Form of Non-Qualified Stock Option, Restricted Share and Performance Share Award Agreement (Independent Contractors) under the 2008 Plan for the 2015 Long-Term Incentive Program, filed as Exhibit 10.3 to the Company’s Current Report on Form 8-K filed on February 23, 2015 (File No. 1-4717), is incorporated herein by reference as Exhibit 10.14.15. |
| |
10.14.16* | |
| | |
10.14.17*10.14.7* | |
| | |
10.14.18*10.15* | Performance Share Award Agreement for David Starling dated February 18, 2015, under the 2008 Plan, filed as Exhibit 10.6 to the Company’s Current Report on Form 8-K filed on February 23, 2015 (File No. 1-4717), is incorporated herein by reference as Exhibit 10.14.18. |
| |
10.15 | Participation Agreement (KCSR 2008-1), dated as of April 1, 2008, among KCSR, KCSR 2008-1 Statutory Trust (acting through U.S. Bank Trust National Association, not in its individual capacity, but solely as Owner Trustee) (“KCSR 2008-1 Statutory Trust”), U.S. Bank Trust National Association (only in its individual capacity as expressly provided therein), MetLife Capital, Limited Partnership (as Owners Participant), Wilmington Trust Company (as Indenture Trustee) and Export Development Canada (as Loan Participant), filed as Exhibit 10.2 to the Company’s Form 10-Q for the quarter ended March 31, 2008, filed on April 24, 2008 (File No. 1-4717), is incorporated herein by reference as Exhibit 10.15. |
| |
10.15.1 | Equipment Lease Agreement (KCSR 2008-1), dated as of April 1, 2008, between KCSR 2008-1 Statutory Trust (as Lessor) and KCSR (as Lessee), filed as Exhibit 10.3 to the Company’s Form 10-Q for the quarter ended March 31, 2008, filed on April 24, 2008 (File No. 1-4717), is incorporated herein by reference as Exhibit 10.15.1. |
| |
10.16 | Loan and Security Agreement, dated February 26, 2008, between KCSM and Export Development Canada, filed as Exhibit 10.1 to the Company’s Form 10-Q for the quarter ended March 31, 2008, filed on April 24, 2008 (File No. 1-4717), is incorporated herein by reference as Exhibit 10.16. |
| |
10.17 | Loan Agreement, dated as of September 24, 2008, between KCSM and DVB Bank AG, filed as Exhibit 10.1 to the Company’s Form 10-Q for the quarter ended September 30, 2008, filed on October 28, 2008 (File No. 1-4717), is incorporated herein by reference as Exhibit 10.17. |
| |
10.18* | |
| | |
| 10.15.1* |
| | | Exhibit | Description | 10.18.1* | English translation of Amendment Agreement to the Individual Indefinite Employment Contract of April 20, 2006, dated May 27, 2009, between KCSM and José Guillermo Zozaya Delano, filed as Exhibit 10.1 to the Company’s Current Report on Form 8-K, filed on June 2, 2009 (File No. 1-4717), is incorporated herein by reference as Exhibit 10.18.1.10.15.1. | | | | 10.19*10.16* | | | | | 10.19.1*10.16.1* | | | | | 10.20*10.17* | Employment Agreement, dated September 10, 2008, between KCSR and David L. Starling, filed as Exhibit 10.1 to the Company’s Current Report on Form 8-K, filed on September 15, 2008 (File No. 1-4717), is incorporated herein by reference as Exhibit 10.20. | | | 10.20.1* | Addendum to Employment Agreement, dated June 28, 2010, among the Company, KCSR and David L. Starling, filed as Exhibit 10.2 to the Company’s Current Report on Form 8-K, filed on June 29, 2010 (File No. 1-4717), is incorporated herein by reference as Exhibit 10.20.1. | | | 10.20.2* | Amendment to Employment Agreement dated December 17, 2012, between KCSR and David L. Starling, filed as Exhibit 10.29.2 to the Company’s Form 10-K for the year ended December 31, 2012, filed on February 4, 2013 (File No. 1-4717), is incorporated herein by reference as Exhibit 10.20.2. | | | 10.20.3* | Retention Agreement dated February 18, 2015, between the Company and David L. Starling, filed as Exhibit 10.8 to the Company’s Current Report on Form 8-K filed on February 23, 2015 (File No. 1-4717), is incorporated herein by reference as Exhibit 10.20.3. | | | 10.21* | Employment Agreement, dated September 28, 2009, between KCSR and Mary K. Stadler, filed as Exhibit 10.1 to the Company’s Current Report on Form 8-K, filed on October 2, 2009 (File No. 1-4717), is incorporated herein by reference as Exhibit 10.21. | | | 10.21.1* | Amendment to Employment Agreement dated December 17, 2012, between KCSR and Mary K. Stadler, filed as Exhibit 10.30.1 to the Company’s Form 10-K for the year ended December 31, 2012, filed on February 4, 2013 (File No. 1-4717), is incorporated herein by reference as Exhibit 10.21.1. | | | 10.22* | | | | | 10.23*10.18* | | | | | 10.18.1* | | | | | 10.18.2* | | | | | 10.18.3* | | | | | 10.18.4* | | | | | 10.19* | | | | | 10.2410.20 | | | | | 10.2510.21 | |
| | | 10.26Exhibit | Description | | 10.22 | | | | | 10.2710.23 | |
| | | Exhibit10.23.1 | Description | 10.27.1 | | | | | 10.2810.24 | Credit Agreement, dated December 9, 2015, among the Company, the guarantors party thereto, the various financial institutions and other persons from time to time parties thereto as lenders, Bank of America, N.A., as administrative agent, JPMorgan Chase Bank, N.A. and Citibank, N.A., as co-syndication agents and Merrill Lynch, Pierce, Fenner & Smith Incorporated, J.P. Morgan Securities LLC and Citigroup Global Markets Inc., as joint lead arrangers and joint bookrunning managers, filed as exhibit 10.1 to the Company’s Current Report on Form 8-K filed on December 15, 2015 (File No. 1-4717), is incorporated herein by reference as Exhibit 10.28.10.24. | | | | 12.110.25* | Computation | | | | 10.26* | | | | | 10.26.1* | | | | | 10.26.2* | | | | | 10.26.3* | | | | | 10.26.4* | | | | | 10.26.5* | | | | | | 21.1 | | | | | | 23.1 | | | | | 23.2 | | | | | | 24.1 | | | | | | 31.1 | | | | | | 31.2 | | | | | | 32.1 | | | | | | 32.2 | |
| | | | Exhibit | Description | | 101 | The following financial information from Kansas City Southern’s Annual Report on Form 10-K for the year ended December 31, 2016,2018, formatted in XBRL (Extensible Business Reporting Language) includes: (i) Consolidated Statements of Income for the years ended December 31, 2016, 20152018, 2017 and 2014,2016, (ii) Consolidated Statements of Comprehensive Income for the years ended December 31, 2016, 2015,2018, 2017, and 2014,2016, (iii) Consolidated Balance Sheets as of December 31, 20162018 and December 31, 2015,2017, (iv) Consolidated Statements of Cash Flows for the years ended December 31, 2016, 2015,2018, 2017, and 2014,2016, (v) Consolidated Statements of Changes in Equity for the Three Years ended December 31, 2016, 2015,2018, 2017, and 2014,2016, and (vi) the Notes to Consolidated Financial Statements. | | | | | | * Management contract or compensatory plan or arrangement. | | |
Item 16. Form 10-K Summary None. SIGNATURES Pursuant to the requirements of Section 13 or 15 (d) of the Securities Exchange Act of 1934, the Company has duly caused this report to be signed on its behalf by the undersigned, thereunto duly authorized.
| | | | Kansas City Southern | | | | | By: | /S/ PATRICK J. OTTENSMEYER | | | Patrick J. Ottensmeyer President, Chief Executive Officer and Director |
January 27, 201725, 2019 POWER OF ATTORNEY Know all people by these presents, that each person whose signature appears below constitutes and appoints Patrick J. Ottensmeyer and Michael W. Upchurch, and each of them, his or her true and lawful attorneys-in-fact and agents, with full power of substitution and resubstitution, for him or her and in his or her name, place and stead, in any and all capacities, to sign any amendments to this annual report on Form 10-K, and to file the same, with all exhibits thereto, with the Securities and Exchange Commission, granting unto said attorneys-in-fact and agents, and each of them, full power and authority to do and perform each and every act and thing requisite and necessary to be done in and about the premises, as fully and to all intents and purposes as he or she might or could do in person, hereby confirming all that said attorneys-in-fact and agents or either of them, or his or their substitute or substitutes, may lawfully do or cause to be done by virtue hereof. Pursuant to the requirements of the Securities Exchange Act of 1934, this report has been signed below by the following persons on behalf of the Company and in the capacities indicated on January 27, 2017.25, 2019.
| | | | | Signature | | Title | | | | /S/ PATRICK J. OTTENSMEYER | | President, Chief Executive Officer and Director (Principal Executive Officer). | | Patrick J. Ottensmeyer | | | | | | | /S/ MICHAEL W. UPCHURCH | | Executive Vice President and Chief Financial Officer (Principal Financial Officer). | | Michael W. Upchurch | | | | | | /s/ S/ MUZANNE ARYM. G K. STADLERRAFTON | | Senior Vice President and Chief Accounting Officer
(Principal Accounting Officer). | Mary K. StadlerSuzanne M. Grafton | | | | | | /S/ ROBERT J. DRUTEN | | Chairman of the Board and Director. | | Robert J. Druten | | | | | | /s/ LSYDIA / DI. BAVID L. STARLINGEEBE | | Director. | David L. StarlingLydia I. Beebe | | | | | | | /S/ LU M. CÓRDOVA | | Director. | | Lu M. Córdova | | | | | | /S/ HENRY R. DAVIS | | Director. | Henry R. Davis | | | | | /S/ TERRENCE P. DUNN
| | Director. | | Terrence P. Dunn | | |
| | | | | Signature | | Title | | | | /S/ ANTONIO O. GARZA, JR. | | Director. | | Antonio O. Garza, Jr. | | | | | | | /S/ DAVID GARZA-SANTOS | | Director. | | David Garza-Santos | | | | | | | /s/ MITCHELL J. KREBS | | Director. | | Mitchell J. Krebs | | | | | | /s/ HENRY J. MAIER | | Director. | | Henry J. Maier | | | | | | /S/ THOMAS A. MCDONNELL | | Director. | | Thomas A. McDonnell | | | | | | /S/ RODNEY E. SLATER | | Director. | | Rodney E. Slater | | |
Kansas City Southern
2016 Form 10-K Annual Report
Index to Exhibits
| | | Exhibit | Document | 10.8.3 | English translation of amendment no. 3, dated March 26, 2014, of concession title granted by SCT in favor of KCSM, formerly known as FNE, December 2, 1996, as amended February 12, 2001 and November 22, 2006. | | | 10.11.5 | Amendment No. 2 to Limited Liability Company Agreement, dated December 9, 2013, among the Company, KCS Holdings, Inc. and The Alabama Great Southern Railroad Company. | | | 12.1 | Computation of Ratio of Earnings to Fixed Charges | | | 21.1 | Subsidiaries of the Company | | | 23.1 | Consent of KPMG LLP, Independent Registered Public Accounting Firm | | | 31.1 | Certification of Patrick J. Ottensmeyer pursuant to Section 302 of the Sarbanes-Oxley Act of 2002 | | | 31.2 | Certification of Michael W. Upchurch pursuant to Section 302 of the Sarbanes-Oxley Act of 2002 | | | 32.1 | Certification of Patrick J. Ottensmeyer furnished pursuant to 18 U.S.C. Section 1350, as adopted pursuant to Section 906 of the Sarbanes-Oxley Act of 2002 | | | 32.2 | Certification of Michael W. Upchurch furnished pursuant to 18 U.S.C. Section 1350, as adopted pursuant to Section 906 of the Sarbanes-Oxley Act of 2002 | | | 101 | The following financial information from Kansas City Southern’s Annual Report on Form 10-K for the year ended December 31, 2016, formatted in XBRL (Extensible Business Reporting Language) includes: (i) Consolidated Statements of Income for the years ended December 31, 2016, 2015 and 2014, (ii) Consolidated Statements of Comprehensive Income for the years ended December 31, 2016, 2015 and 2014, (iii) Consolidated Balance Sheets as of December 31, 2016 and December 31, 2015, (iv) Consolidated Statements of Cash Flows for the years ended December 31, 2016, 2015 and 2014, (v) Consolidated Statements of Changes in Equity for the three years ended December 31, 2016, 2015 and 2014, and (vi) the Notes to Consolidated Financial Statements.
|
|