| Delaware | 38-1510762 | |||||||||
| (State or other jurisdiction of | ||||||||||
| incorporation or organization) | (I.R.S. Employer Identification No.) | |||||||||
999 West Big Beaver Road, Troy, Michigan 48084
| (Address of | ||||
(248) 362-4444
| (Registrant’s | telephone number, including area code) | |||
Securities registered pursuant to Section 12(b) of the Act:
Title of each class | Trading Symbols | Name of each exchange on which registered | ||||||||
| Class A Common | KELYA | NASDAQ Global Market | ||||||||
| Class B Common | KELYB | NASDAQ Global Market | ||||||||
Securities Registered Pursuant to Section 12(g) of the Act: None
Indicate by check mark if the registrant is a well-known seasoned issuer, as defined in Rule 405 of the Securities Act. Yes [ ]☐ No [X]☒
Indicate by check mark if the registrant is not required to file reports pursuant to Section 13 or Section 15(d) of the Act. Yes [ ]☐ No [X]☒
Indicate by check mark whether the registrant (1) has filed all reports required to be filed by Section 13 or 15(d) of the Securities Exchange Act of 1934 during the preceding 12 months (or for such shorter period that the registrant was required to file such reports), and (2) has been subject to such filing requirements for the past 90 days. Yes [X]☒ No[ ] ☐
Indicate by check mark whether the registrant has submitted electronically and posted on its corporate Web site, if any, every Interactive Data File required to be submitted and posted pursuant to Rule 405 of Regulation S-T (§232.405 of this chapter) during the preceding 12 months (or for shorter period that the registrant was required to submit and post such files). Yes [X]☒ No [ ]☐
Indicate by check mark whether the registrant is a large accelerated filer, an accelerated filer, a non-accelerated filer, a smaller reporting company or an emerging growth company. See the definitions of “large accelerated filer,” “accelerated filer,” “smaller reporting company” and “emerging growth company” in Rule 12b-2 of the Exchange Act.
| Large accelerated filer | ☒ | Accelerated filer | ☐ | ||||||||
| Non-accelerated filer reporting company) | ☐ | Smaller reporting company | ☐ | ||||||||
| Emerging growth company | ☐ | ||||||||||
If an emerging growth company, indicate by check mark if the registrant has elected not to use the extended transition period for complying with any new or revised financial accounting standards provided pursuant to Section 13(a) of the Exchange Act. [ ]☐
Indicate by check mark whether the registrant has filed a report on and attestation to its management’s assessment of the effectiveness of its internal control over financial reporting under Section 404(b) of the Sarbanes-Oxley Act (15 U.S.C. 7262(b)) by the registered public accounting firm that prepared or issued its audit report. ☒
If securities are registered pursuant to Section 12(b) of the Act, indicate by check mark whether the financial statements of the registrant included in the filing reflect the correction of an error to previously issued financial statements. ☐
Indicate by check mark whether any of those error corrections are restatements that required a recovery analysis of incentive-based compensation received by any of the registrant’s executive officers during the relevant recovery period pursuant to §240.10D-1(b). ☐
Indicate by check mark whether the registrant is a shell company (as defined in Rule 12b-2 of the Act). Yes [ ]☐ No [X]☒
The aggregate market value of the voting and non-voting common equity held by non-affiliates computed by reference to the price at which the common equity was last sold, or the average bid and asked price of such common equity, as of the last business day of the registrant’s most recently completed second fiscal quarter, was approximately $699,819,783.$668.3 million.
Registrant had 34,997,71533,831,598 shares of Class A and 3,431,8623,342,146 of Class B common stock, par value $1.00, outstanding as of February 6, 2018. 5, 2023.
Documents Incorporated by Reference
The proxy statement of the registrant with respect to its 20182023 Annual Meeting of Stockholders is incorporated by reference in Part III.
2
PART I
Unless the context otherwise requires, throughout this Annual Report on Form 10-K the words “Kelly,” “Kelly Services,” “the Company,” “we,” “us” and “our” refer to Kelly Services, Inc. and its consolidated subsidiaries.
ITEM 1. BUSINESS.
History and Development of Business
Founded by William R.Russell Kelly in 1946, Kelly Services® pioneered an industry that connects people withto work in ways that enrich their lives. At ourOur inception we helped usher in and embolden a workforce of women, opening doors and creating opportunities where none had existed. Ascompletely new opportunities. Over the next 76 years, as work evolved, weKelly equipped people with the skills to master thenew technologies of the day:as they emerged: launching the first-of-its-kind online learning center for scientists; creating testing &and training packages for newbreakthrough office programs; and launching skill builders to alignthat aligned with new light industrial protocols. With each advance, we have empowered people to meetKelly met the needs of a changing marketplace,the marketplace; empowering our people to reach their personal goals and enabled companiesenabling our clients to access skilled talent that canto move their businessesorganizations forward.
As work has evolved so has ourKelly's range of solutions, growing over the years to reflect the changing needs of our customersemployers and the changing naturedesires and lifestyles of work itself.talent. We have progressed from a United States-based company concentrating primarily on traditional office staffing intobusiness to a workforce solutions leadercreative, insightful and agile talent company delivering expertise in a numberportfolio of specialty services. While rankingIn line with market demand, we are increasingly delivering a variety of outcome-based services in which we provide specialized talent and operational management of functions and departments on behalf of our clients.
We rank as one of the world’s largest scientific and clinical research staffing providers we alsoand place professional and technical employeestalent at allvarious levels in engineering, IT law and finance.telecommunications specialties. We are also a leading education staffing provider in the U.S., placing talent across the full education spectrum from early childhood education to higher education. These specialty services complement our expertise in professional office services, contact center and light industrial and electronic assembly staffing, as well as our leading position in the K-12 educational staffing market in the U.S.staffing. As work has evolved and workforcetalent management has become more complex, we have also developed a talent supply chain management approachinnovative solutions to help many of the world’s largest companiesemployers plan for and manage their workforce. Innovative solutions supporting this approach spanworkforce through recruitment outsourcing, consulting, recruitment,payroll processing, talent advisory, career transition and vendorsupplier management services.
Geographic Breadth of Services
Headquartered in Troy, Michigan,the United States, Kelly provides workforce solutions to a diversifieddiverse group of customerslocal, regional and global clients in three regions: the Americas,; Europe and the Middle East, and Africa (“EMEA”); and Asia Pacific(“APAC”).Our customer base spansAsia-Pacific region across a variety of industries and includes 95 of the Fortune 100™ companies.industries.
In 2017,2022, we assigned nearly 500,000more than 300,000 temporary employees to a variety of customers around the globe.
Description of Business Segments
Kelly is a talent solutions company organized into five specialty businesses, which are divided into three principal business segments: Americas Staffing, Global Talent Solutions (“GTS”)also our reportable segments, serving clients of all sizes across a variety of industries. This structure enables us to focus on specialties with robust demand, promising growth opportunities and International Staffing. In July 2016,areas in which we expanded our joint venture with Persol Holdings (formerly Temp Holdings) to form PersolKelly Asia Pacific (the “JV”)excel at attracting and moved our APACplacing talent.
•Professional & Industrial – delivers staffing, operations into the JV. In early 2017, we restructured components of our previous Americas Commercial, Americas Professionaloutcome-based and Technical,permanent placement services focused on office, professional, light industrial and Outsourcing and Consulting Group segments under a single delivery organization, triggering a change in our operating structure. We now provide staffing through our branch networks in our Americas and International operations, with commercial and specialized professional/technical staffing businesses in each region. We also provide a suite of innovative talent fulfillment and outcome-based solutions through our GTS segment, which delivers integrated talent management solutions to meet customer needs across the entire spectrum of talent categories. Using talent supply chain strategies, GTS helps customers design, execute, and manage workforce programs that enable them to connect with talent across all work styles (full-time, contract, temporary, etc.), gain access to a vast network of service providers, and achieve their business goals on time and on budget.
•Science, Engineering & Technology ("SET") – delivers staffing, outcome-based and permanent placement services focused on science and clinical research, engineering, technology and telecommunications specialties predominantly in the U.S. and Canada and includes our Softworld, NextGen and Global Technology Associates subsidiaries
•Education – delivers staffing, permanent placement and executive search services across the full education spectrum from early childhood to higher education in the U.S. and includes Teachers On Call, Insight Workforce Solutions, Greenwood/Asher and Pediatric Therapeutic Services ("PTS")
3
•Outsourcing & Consulting Group ("Outsourcing & Consulting," "OCG") – delivers Managed Service Provider ("MSP"), Puerto Rico, Canada, MexicoRecruitment Process Outsourcing ("RPO"), Payroll Process Outsourcing ("PPO") and Brazil. This segmentTalent Advisory Services to customers on a global basis and includes RocketPower
•International – delivers temporary staffing, RPO and permanent placement services in 14 countries in Europe, as well as direct-hire placement services in a number of specialty staffing services, including: Office, providing trained employees for data entry, clerical and administrative support roles across numerous industries; Education, supplying schools nationwideMexico delivered in accordance with instructional and non-instructional employees; Marketing, providing support staff for seminars, sales and trade shows; Electronic Assembly, providing assemblers, quality control inspectors and technicians; Light Industrial, placing maintenance workers, material handlers and assemblers; Science, providing all levels of scientists and scientific and clinical research workforce solutions; Engineering, supplying engineering professionals across all disciplines, including aeronautical, chemical, civil/structural, electrical/instrumentation, environmental, industrial, mechanical, petroleum, pharmaceutical, quality and telecommunications; Information Technology, placing ITchanges in labor market regulations
Financial information regarding our industryreportable segments is included in the Segment Disclosures footnote in the notes to our consolidated financial statements presented in Part II, Item 8 of this report.
Business Objectives
By connecting our clients with qualified talent in our conviction that our business canan ever-evolving world of work, Kelly has a positive impact on the people, clients and does make a difference on a daily basis—for our customers, in the lives of our employees and talent networks, in the local communities we serve and in the broader economy. We aspire to beserve. As a destination for top talent and a strategic business partner for our customers. Our solutions are designedclients, we continue to connect with talent across targeted specialties and flexible work styles, and to offer customers access to workforce solutions that can be customized to any scope or scale as they seek to operate more efficient, competitive organizations. To achieve these goals, we will adopt forward-looking technologies and innovative business practices and forward-looking technologies that can drive success in a dynamic market.
With more than one-third of the world’s workforce now participating as independent workers, morewe help companies are adoptingadopt strategies that recognize and utilize contingent labor, consultants and project-based work as keys toenablers of their ongoing success. We
We’re also using our position in the middle of the talent supply and demand equation to challenge outdated barriers that hold back far too many people from attaining meaningful work, supporting their families and contributing to the economy. Our Equity@Work initiative seeks to upend systemic barriers to employment and make the labor market more equitable and accessible for more people. While systemic change takes time, we continue to refine our core competencies to help them connectmake progress with talentadditional outreach, new alliances and realize their business objectives. Kelly offers world-class staffing on a temporarypartnerships and direct placement basis, as well as a comprehensive array of outsourcing, consulting and talent advisory services. Kelly will continue to target our areas of investment and expertise to solve our customers’ workforce challenges and create opportunity for talent in the changing marketplace.continued executive commitment.
Business Operations
Service Marks
We own numerous service marks that are registered with the United States Patent and Trademark Office, the European Union Community TrademarkIntellectual Property Office and numerous individual country trademark offices.
Seasonality and Economic Cycles
Our quarterly operating results arehave historically been affected by the seasonality ofcyclical response to both economic downturns and upswings. Customers tend to use our customers’ businesses. Demandservices to supplement their existing workforce and generally hire permanent employees when long-term demand is expected to increase. As a consequence, our revenue from services tends to increase when the economy grows. Conversely, our revenue from services decreases when the economy declines and customer demand for staffingour services historically has been lower duringalso declines. Our business also experiences seasonal fluctuations, particularly in our Education operating segment. Revenue in Education is generally lowest in the firstthird quarter and typically increases during the remainder of the year.in line with schools’ summer break.
Working Capital
Our working capital requirements are primarily generated from temporary employee payroll which is generally paid weekly or monthly and customer accounts receivable.receivable which is generally outstanding for longer periods, with days sales outstanding ("DSO") of 61 days as of January 1, 2023. Since receipts from customers generally lag payroll payments to temporary employees, working capital requirements increase and operating cash flows may decrease substantially in periods of growth. Conversely, when economic activity slows, working capital requirements may substantially decrease and operating cash flows increase. Such increases dissipate over time if the economic downturn continues for an extended period.
Customers
Kelly’s client portfolio spans companiesemployers of all sizes, ranging from local and mid-sized businesses to the Fortune 500. In 2017,2022, an estimated 52%54% of total Companycompany revenue was attributed to our largest 100 large customers. Our largest single customer accounted for approximately fiveseven percent of total revenue in 2017.2022.
4
Government Contracts
Although we conduct business under various federal, state and local government contracts, no single one accounts forcontract represents more than three percent of total Companycompany revenue in 2017. 2022.
Competition
The worldwide temporary staffingworkforce solutions industry is competitive and highly fragmented. In the United States, approximately 100 competitorswe compete with other firms that operate nationally and approximately 10,000offer a breadth of service similar to ours, and with thousands of smaller regional or specialized companies that compete in varying degrees at local levels. Additionally, severaldegrees. Outside the United States, we face similar staffing companies compete globally.competition. In 2017,2022, our largest competitors were Randstad, Adecco S.A., Randstad Holding N.V.,Group, ManpowerGroup Inc., and Allegis Group and Recruit Holdings. Group.
Key factors that influence our success are quality of service, price and breadth of service.
Quality of service is highly dependent on the availability of qualified competent talent, and our ability to promptly and effectively recruit, screen, train, retain and manage a pool of employees who match the skills required by particularour customers. During an economic downturn, weWe must balance competitive pricing pressures, which may intensify during an economic downturn, with the need to attract and retain a qualified workforce. Price competition in the staffing industry is intense, particularly for education, office clerical and light industrial personnel and pricing pressure from customers and competitors continues to be significant.
Companies may seek a single supplier to manage all of their demand for contingent talent. To provide the breadth of service required, clients may need us to manage staffing needs. Kelly’s talent supply chain management approachsuppliers and independent workers on their behalf. Kelly seeks to address this requirement for our larger customers,clients, enabling us to deliver talent wherever and whenever they need it around the world.
Kelly is committed to the highest standards of corporate citizenship. Given the worldwide reach of our workers, clients, suppliers and partners, we recognize the global impact of our business practices and the importance of public accountability. We continue to advocate on behalf of the global workforce, improve our workplaces, contribute to the communities we serve and ensure our actions are socially, ethically and environmentally responsible.
Regulation
Our services are subject to a variety of complex federal and state laws and regulations in the countries where we operate. We continuously monitor legislation and regulatory changes for their potential effect on our business. We invest in technology and process improvements to implement required changes while minimizing the impact on our operating efficiency and effectiveness. Regulatory cost increases are passed through to our clients to the fullest extent possible. As a service business, we are involved in a service business,not materially impacted by federal, state or local laws that regulate the discharge of materials into the environment do not materially impact us. environment.
Human Capital
We employare a talent solutions company dedicated to connecting people to work in ways that enrich their lives, and our employees are critical to achieving this noble purpose. To succeed in our highly competitive and rapidly evolving market, we must attract and retain experienced internal employees, as well as talent we put to work for our customers. As part of these efforts, we strive to offer competitive total rewards programs, promote employee development, foster an inclusive and diverse environment and allow employees to give back to their communities and make a social impact.
We are committed to the health, safety and wellness of our employees and talent. The success of our business is fundamentally connected to the well-being of our people. Accordingly, we seek to implement policies and practices that align with applicable laws and regulations and are in the best interest of our employees, talent and the communities in which we operate.
Internal Employees
As of January 1, 2023, we employed approximately 1,100 people at our corporate headquarters in Troy, Michigan, and approximately 6,7004,800 staff members in the United States and an additional 2,700 in our international locations. Kelly retention rates for high performing and high potential employees align with our comparable benchmark.
Compensation and Benefits. Kelly is committed to providing competitive, equitable and fiscally responsible total rewards programs to our employees. Our compensation programs are designed to attract, retain and reward talented individuals
5
with the skills necessary to achieve our strategic goals and create long-term value for our shareholders. We provide employees with competitive compensation opportunities, with strong pay-for-performance linkages that include a mix of base salary, short-term incentives and, in the case of our more senior employees, long-term equity awards. Our programs provide fair and competitive opportunities that align employee and stockholder interests. In addition to cash and equity compensation, we offer employees competitive benefits such as life and health (medical, dental and vision) insurance, paid time off, wellness benefits and defined contribution retirement plans. We review our compensation and benefits programs annually and respond to changes in market practice. For example, recent enhancements to our U.S. benefits program include additional time off for significant life events, a financial advisor program, support programs for certain chronic health conditions and introduction of a well-being app globally. In addition, pay and benefits programs for our international networkemployees align with competitive local practices.
Inclusion and Diversity. Since 1947, our founder fought to increase women's access to work, and we’ve long been an outspoken advocate for the value temporary and independent workers bring to the workplace. We are committed to fostering an inclusive and diverse workforce. For example, most of branch offices.Kelly's U.S. workforce is female, including a majority of director and above roles. Additionally, for a fifth consecutive year, we’ve achieved a 100% rating from the Human Rights Campaign Foundation’s Corporate Equality Index for LGBTQ+ equality in the workplace. We believe an inclusive environment with diverse teams creates a workplace that is conducive to producing more creative solutions, results in better, more innovative products and services, and presents Kelly as a workplace leader, aiding our ability to attract and retain high-performing talent. We are focused on fostering a culture of belonging, where everyone feels welcomed and respected and can thrive as we work together. Kelly promotes employee development and internal career mobility to enable our team to achieve their full potential and to ensure we have the evolving workforce capabilities that the future demands.
Community Involvement. We consider sustainability a guiding principle in strengthening the relationship with our global workforce, suppliers and customers. Through our programs and initiatives, we seek to improve the quality of life of our employees, their families and the communities in which they live and serve. Designed on the concept of social investment and nurturing shared values, our approach ensures the creation of future development capacities instead of aiding on isolated occasions. We support initiatives where our employees can actively engage in the causes they believe in that are also connected to our sustainability strategy. In 2017,2022, we assigned nearly 500,000 temporaryachieved over 7,800 hours of volunteering (for the U.S. and Canada), engaging over 1,000 employees. Through our Equity@Work efforts, we are living our commitment to ensure equitable access to work and growth by creating alliances with like-minded companies, policy groups and institutions to positively impact how companies hire, advance and help more people thrive.
For more information on our diversity and inclusion and community involvement initiatives, please see our Sustainability Report - Growing with Purpose, which is available at kellyservices.com.
Talent
In addition to our internal employees, to a varietyKelly recruits talent on behalf of our customers around the globe.
Foreign Operations
For information regarding sales, earnings from operations and long-lived assets by domestic and foreign operations, please refer to the information presented in the Segment Disclosures footnote in the notes to our consolidated financial statements, presented in Part II, Item 8 of this report.
Access to Company Information
We electronically file our annual report on Form 10-K, quarterly reports on Form 10-Q, current reports on Form 8-K and all amendments to those reports with the Securities and Exchange Commission (“SEC”). The public may read and copy any of the reports that are filed with the SEC at the SEC’s Public Reference Room at 100 F Street, NE, Washington, DC 20549. The public may obtain information on the operation of the Public Reference Room by calling the SEC at 1-800-SEC-0330. The SEC also maintains an Internet website at www.sec.gov that contains reports, proxy and information statements and other information regarding issuers that file electronically.
We make available, free of charge, through our website, and by responding to requests addressed to our senior vice president of investor relations, our annual report on Form 10-K, quarterly reports on Form 10-Q, current reports on Form 8-K and all
6
amendments to those reports. These reports are available as soon as reasonably practicable after such material is electronically filed with or furnished to the SEC. Our website address is: www.kellyservices.com. The information contained on our website, or on other websites linked to our website, is not part of this report.
7
ITEM 1A. RISK FACTORS.
Risks Related to Macroeconomic Conditions
Our business is significantly affected by fluctuations in general economic conditions.
Demand for staffing services is significantly affected by the general level of economic activity and employment in the United States and the other countries in which we operate. When economic activity increases, temporary employees are often added before full-time employees are hired. As economic activity slows, however, many companies reduce their use of temporary employees before laying off full-time employees. Customer responses to real or perceived economic conditions, including perceptions related to market conditions, labor supply and inflation, could negatively impact customer behavior. Significant swings in economic activity historically have had a disproportionate impact on staffing industry volumes. We may not fully benefit from times of increased economic activity should we experience shortages in the supply of temporary employees. We may also experience more competitive pricing pressure and slower customer payments during periods of economic downturn. A substantial portion of our revenues and earnings are generated by our business operations in the United States. Any significant economic downturn in the United States or certain other countries in which we operate could have a material adverse effect on our business, financial condition and results of operations.
Our business has been adversely impacted by the novel coronavirus (COVID-19) outbreak and could be impacted by future outbreaks.
The emergence of new strain(s) of COVID-19 that are more deadly, contagious, or vaccine resistant, or a decline in the effectiveness of vaccines or treatment regimens could result in another economic downturn, a decline in demand for our services, or increased worker absenteeism. Likewise, the financial viability of third parties on which we rely to provide staffing services or manage critical business functions could also be impacted by further negative COVID-19 developments.
Our stock price may be subject to significant volatility and could suffer a decline in value.
The market price of our common stock may be subject to significant volatility. We believe that many factors, including several which are beyond our control, have a significant effect on the market price of our common stock. These include:
•actual or anticipated variations in our quarterly operating results;
•announcements of new services by us or our competitors;
•announcements relating to strategic relationships, acquisitions or divestitures;
•changes in financial estimates by securities analysts;
•changes in general economic conditions;
•actual or anticipated changes in laws and government regulations;
•commencement of, or involvement in, litigation;
•any major change in our board or management;
•changes in industry trends or conditions; and
•sales of significant amounts of our common stock or other securities in the market.
In addition, the stock market in general, and the NASDAQ Global Market in particular, have experienced significant price and volume fluctuations that have often been unrelated or disproportionate to the operating performance of listed companies. These broad market and industry factors may seriously harm the market price of our common stock, regardless of our operating performance. In the past, securities class action litigation has often been instituted following periods of volatility in the market price of a company’s securities. A securities class action suit against us could result in substantial costs, potential liabilities and the diversion of our management’s attention and resources. Further, our operating results may be below the expectations of securities analysts or investors. In such event, the price of our common stock may decline.
Risks Related to our Industry Segment
We operate in a highly competitive industry with low barriers to entry and may be unable to compete successfully against existing or new competitors.
The worldwide staffing services market is highly competitive with limited barriers to entry. We compete in global, national, regional and local markets with full-service and specialized temporary staffing and consulting companies. While the majority of our competitors are significantly smaller than us, several competitors, includingRandstad, Adecco S.A., Randstad Holding N.V.,Group, ManpowerGroup Inc., and Allegis Group and Recruit Holdings, are considerably larger than we are and have more substantial marketing and financial resources. Additionally, the emergence of online staffing platforms or other forms of disintermediation may pose a
8
competitive threat to our services, which operate under a more traditional staffing business model. Price competition in the staffing industry is intense, particularly for the provision of office clerical, and light industrial and education personnel. We expect that the level of competition will remain high, which could limit our ability to maintain or increase our market share or profitability.
The number of customers distributing their staffing service purchases among a broader group of competitors continues to increase which, in some cases, may make it more difficult for us to obtain new customers, or to retain or maintain our current share of business, with existing customers. We also face the risk that our current or prospective customers may decide to provide similar services internally. As a result, there can be no assurance that we will not encounter increased competition in the future.
Technological advances may significantly disrupt the labor market and weaken demand for human capital at a rapid rate.capital.
Our success is directly dependent on our customers’ demands for talent. As technology continues to evolve, more tasks currently performed by people may be replaced by automation, robotics, machine learning, artificial intelligence, and other technological advances outside of our control. This trend poses a risk to the staffing industry, as a whole, particularly in lower-skill job categories that may be more susceptible to such replacement.
Competition rules arising from government legislation, litigation or regulatory activity may limit how we structure and market our services.
As we increasingly offer services outside the realm of traditionala leading staffing including business process outsourcing,and recruiting company, we are exposedclosely scrutinized by government agencies under U.S. and foreign competition laws. An increasing number of governments are regulating competition law activities, leading to additional risksincreased scrutiny. Some jurisdictions also allow competitors or consumers to assert claims of anti-competitive conduct.
The European Commission and its various competition authorities have targeted industry trade associations in which could have a material adverse effect onwe participate, resulting in the assessment of fines against our business.
•We may have to choose between withdrawing certain services from certain geographies to avoid fines or designing and activities. Our networks and applications are increasingly accessed from locations and by devices not within our physical control, and the specificsdeveloping alternative versions of our technology systems and networks may vary by geographic region. In the course of ordinary business, we may store or process proprietary or confidential information concerning our business and financial performance and current, past or prospective employees, customers, vendors and managed suppliers. The secure and consistent operation of these systems, networks and processes is criticalthose services to our business operations. Moreover, our temporary employees may be exposed to, or have access to, similar information in the course of their customer assignments. We routinely experience cyber attacks,comply with government rulings, which may include the use of malware, computer viruses, social engineering schemes and other means of attempted disruption or unauthorized access.
•Adverse rulings may act as precedent in a sufficient amount to cover increased costs as a result of any changes in claims-related liabilities.other competition law proceedings.
Our business is subject to extensive government regulation, which may restrict the types of employment services we are permitted to offer or result in additional or increased taxes, including payroll taxes or other costs that reduce our revenues and earnings.
The temporary employment industry is heavily regulated in many of the countries in which we operate. Changes in laws or government regulations may result in prohibition or restriction of certain types of employment services we are permitted to offer or the imposition of new or additional benefit, licensing or tax requirements that could reduce our revenues and earnings. In particular, we are subject to state unemployment taxes in the U.S., which typically increase during periods of increased levels of unemployment. We also receive benefits, such as the work opportunity income tax credit in the U.S., that regularly expire and may not be reinstated. There can be no assurance that we will be able to increase the fees charged to our customers in a timely manner and in a sufficient amount to fully cover increased costs as a result of any changes in laws or government regulations. Any future changes in laws or government regulations, or interpretations thereof, including additional laws and regulations enacted at a local level may make it more difficult or expensive for us to provide staffing services and could have a material adverse effect on our business, financial condition and results of operations.
9
Unexpected changes in claim trends on our workers’ compensation, unemployment, disability and regulatory activity relatingmedical benefit plans may negatively impact our financial condition.
We self-insure, or otherwise bear financial responsibility for, a significant portion of expected losses under our workers’ compensation program, disability and medical benefits claims. Unexpected changes in claim trends, including the severity and frequency of claims, actuarial estimates and medical cost inflation, could result in costs that are significantly different than initially reported. If future claims-related liabilities increase due to competition rulesunforeseen circumstances, or if we must make unfavorable adjustments to accruals for prior accident years, our costs could increase significantly. In addition, unemployment insurance costs are dependent on benefit claims experience from employees which may limit howvary from current levels and result in increased costs. There can be no assurance that we structure and marketwill be able to increase the fees charged to our services.
We may have additional tax or unclaimed property liabilities that exceed our estimates.
We are subject to a multitude of federal, state, local, and localforeign taxes in the jurisdictions in which we operate in, including the tax provisions of the U.S. Patient Protection and Affordable Care Act and the Health Care and Education Reconciliation Act of 2010. We are also subject to unclaimed or abandoned property (escheat) laws.operate. Our tax expense could be materially impacted by changes in tax laws in these jurisdictions, changes in the valuation of deferred tax assets and liabilities or changes in the mix of income by country. The demographicsoverall size of our workforce and the visibility of our industry may make it more likely we become a target of government investigations, and we are regularly subject to audit by tax authorities. Although we believe our tax and unclaimed property estimates are reasonable, the final determination of audits and any related litigation could be materially different from our historical tax provisions and accruals. The results of an audit or litigation could materially harm our business.
Risks Related to Strategy and Execution
Our future performance depends on the Company’s effective execution of our business strategy.
The performance of the Company’s business is dependent on our ability to effectively execute our growth strategy. Our strategy includes targeted investments in select specialty areas, focusing on growth platforms and implementation of a cost-effective operating model to bridge our strategy to execution. If we are unsuccessful in executing our strategy, we may not achieve either our stated goal of revenue growth or the intended productivity improvements, which could negatively impact profitability. Even if effectively executed, our strategy may be insufficient considering changes in market conditions, technology, competitive pressures or other external factors.
If we fail to successfully develop new service offerings, we may be unable to retain and acquire customers, resulting in a decline in revenues.
The Company’s successful execution of our growth strategy requires that we match evolving customer expectations with evolving service offerings. The development of new service offerings requires accurate anticipation of customer needs and emerging technology and workforce trends. We must make long-term investments in our information technology infrastructure and commit resources to development efforts before knowing whether these investments will result in service offerings that achieve customer acceptance and generate the revenues required to provide desired returns. If we fail to accurately anticipate and meet our customers’ needs through the development of new service offerings or do not successfully deliver new service offerings, our competitive position could weaken, causing a material adverse effect on our results of operations and financial condition.
A loss of major customers or a change in such customers’ buying behavior or economic strength could have a material adverse effect on our business.
We serve many large corporate customers through high volume service agreements. While we intend to maintain or increase our revenues and earnings from our major corporate customers, we are exposed to risks arising from the possible loss of major customer accounts. A change in labor strategy or the deterioration of the financial condition or business prospects of these customers could reduce their need for our services and result in a significant decrease in the revenues and earnings we derive from these customers. Such change could occur due to factors in our customers' control but also could occur due to economic, social, climate, or political factors outside of our customers' control. Our customers are also exposed to third-party risk through their use of vendors and suppliers which, in the event of a third-party incident at a customer, could result in a deterioration in their financial condition. Continuing merger and acquisition activity involving our large corporate customers could put existing business at risk or impose additional pricing pressures. Since receipts from customers generally lag payroll to temporary employees, the bankruptcy of a major customer could have a material adverse impact on our ability to meet our working capital requirements. The expansion of payment terms may extend our working capital requirements and reduce available capital for
10
investment. Additionally, most of our customer contracts can be terminated by the customer on short notice without penalty. This creates uncertainty with respect to the revenues and earnings we may recognize with respect to our customer contracts.
Our business with large customer accounts reflects a market-driven shift in buying behaviors in which reliance on a small number of staffing partners has shifted to reliance upon a network of talent providers. The movement from single-sourced to competitively sourced staffing contracts may also substantially reduce our future revenues from such customers. While Kelly has sought to address this trend, including providing MSP services within our OCG segment, we may not be selected or retained as the MSP by our large customers. This may result in a material decrease in the revenue we derive from providing staffing services to such customers. In addition, revenues may be materially impacted from our decision to exit customers due to pricing pressure or other business factors.
Our business with the federal government and government contractors presents additional risk considerations. We must comply with laws and regulations relating to the formation, administration and performance of federal government contracts. Failure to meet these obligations could result in civil penalties, fines, suspension of payments, reputational damage, disqualification from doing business with government agencies and other sanctions or adverse consequences. Government procurement practices may change in ways that impose additional costs or risks upon us or pose a competitive disadvantage. Our employees may be unable to obtain or retain the security clearances necessary to conduct business under certain contracts, or we could lose or be unable to secure or retain a necessary facility clearance. Government agencies may temporarily or permanently lose funding for awarded contracts, or there could be delays in the start-up of projects already awarded and funded.
We are at risk of damage to our brands, which are important to our success.
Our success depends, in part, on the value associated with our brands. Because we assign employees to work under the direction and supervision of our customer at work locations not under Kelly’s control, we are at risk of our employees engaging in unauthorized conduct that could harm our reputation. Our Education segment is particularly susceptible to this exposure. Any incident, act or omission that damages Kelly’s reputation could cause the loss of current and future customers, additional regulatory scrutiny and liability to third parties, which could negatively impact profitability.
As we increasingly offer services outside the realm of traditional staffing, including business process outsourcing and services intended to connect talent to independent work, we are exposed to additional risks which could have a material adverse effect on our business.
Our business strategy focuses on driving profitable growth in key specialty areas, including through business process outsourcing arrangements, where we provide operational management of our customers’ non-core functions or departments. This could expose us to certain risks unique to that business, including product liability or product recalls. As the nature of work changes, we deliver services that connect talent to independent work with our customers and expose the Company to risks of misclassifying workers, which could result in regulatory audits and penalties. Although we have internal vetting processes intended to control such risks, there is no assurance that these processes will be effective or that we will be able to identify these potential risks in a timely manner. Our specialties also include professional services where errors or omissions by employees or independent contractors can result in substantial injury or damages. We attempt to mitigate and transfer such risks through contractual arrangements with our customers and suppliers; however, these services may give rise to liability claims and litigation. While we maintain specifiedinsurance in types and amounts we believe are appropriate for the contemplated risks, there is no assurance that such insurance coverage will remain available on reasonable terms or be sufficient in amount or scope.
We are increasingly dependent on third parties for the execution of critical functions.
We rely on third parties to support critical functions within our operations, including portions of our technology infrastructure, vendor management, customer relationship management, and applicant tracking systems. If we are unable to contract with third parties having the specialized skills needed to support our growth strategies or integrate their products and services with our business, or if they fail to meet our performance requirements, the results of operations could be adversely impacted. We also rely on supplier partnerships to deliver our services to customers in certain territories. If our suppliers fail to meet our standards and expectations or are unfavorably regarded by our customers, our ability to discontinue the relationship may be limited and could result in reputational damage, customer loss, and adversely affect our results of operations. The failure or inability to perform on the part of one or more of these critical suppliers or partners could cause significant disruptions and increased costs.
Our information technology strategy may not yield its intended results.
Our information technology strategy includes improvements to our applicant onboarding and tracking systems, order management, and improvements to financial covenantsprocesses such as billing and accounts payable through system consolidation and
11
upgrades. We do not use a single enterprise resource planning system, which limits our ability to react to evolving technology and customer expectations and increases the amount of investment and effort necessary to provide global service integration to our customers. Although the technology strategy is intended to increase productivity and operating efficiencies, these initiatives may not yield their intended results. Any delays in completing, or an inability to successfully complete, these technology initiatives or an inability to achieve the anticipated efficiencies could adversely affect our operations, liquidity and financial condition. Some of the initiatives are dependent on the products and services of third party vendors. If our vendors are unable to provide these services, or fail to meet our standards and expectations, we could experience business interruptions or data loss which could have a material adverse effect on our business, financial condition and results of operations.
Past and future acquisitions may not be successful.
As a part of our growth strategy, we continue to monitor the market for acquisition targets to bolster our inorganic growth aspirations. Acquisitions involve a number of risks, including the diversion of management’s attention from its existing operations, the failure to retain key personnel or customers of an acquired business, the failure to realize anticipated benefits such as cost savings and revenue enhancements, potential substantial transaction costs associated with acquisitions, the assumption of unknown liabilities of the acquired business and the inability to successfully integrate the business into our operations. There can be no assurance that any past or future acquired businesses will generate anticipated revenues or earnings.
Further, acquisitions result in goodwill and intangible assets which have the risk of impairment if the future operating results and cash flows of such acquisitions are lower than our initial estimates. In the event that we determine that there is an impairment, we may be required to record a significant non-cash charge to earnings that could adversely affect our results of operations. In 2022, changes in market conditions related to demand in hiring in the high-tech industry and slowing growth in RPO more broadly, resulted in a goodwill impairment charge of $41.0 million.
Certain equity investments may expose us to additional risks and uncertainties.
We participate, or may participate in the future, in certain investments in equity affiliates, such as joint ventures or other investments with strategic partners, including PersolKelly Pte. Ltd. These investments or arrangements expose us to a number of risks, including the risk that the management of the investment or combined venture may not be able to fulfill their performance obligations under the management agreements or that the joint venture parties may be incapable of providing the required financial support. Additionally, improper, illegal or unethical actions by the investment or venture management could have a negative impact on the reputation of the investment or venture and our Company.
Risks Related to Operating a Global Enterprise
We conduct a significant portion of our operations outside of the United States and we are subject to risks relating to our international business activities, including fluctuations in currency exchange rates and numerous legal and regulatory requirements.
We conduct our business in major staffing markets throughout the world. Our operations outside the United States are subject to risks inherent in international business activities, including:
•fluctuations in currency exchange rates;
•restrictions or limitations on the transfer of funds;
•government intrusions including asset seizures, expropriations or de facto control;
•varying economic and geopolitical conditions;
•differences in cultures and business practices;
•differences in employment and tax laws and regulations;
•differences in accounting and reporting requirements;
•differences in labor and market conditions;
•compliance with trade sanctions;
•changing and, in some cases, complex or ambiguous laws and regulations; and
•litigation, investigations and claims.
Our operations outside the United States are reported in the applicable local currencies and then translated into U.S. dollars at the applicable currency exchange rates for inclusion in our bank credit facilities,consolidated financial statements. Exchange rates for currencies of these countries may fluctuate in relation to the U.S. dollar and these fluctuations may have an adverse or credit market events beyondfavorable effect on our control, could adversely restrict our financial and operating flexibility andresults when translating foreign currencies into U.S. dollars.
12
Our international operations subject us to potential liability under anti-corruption, trade protection, and other risks, includinglaws and regulations.
The Foreign Corrupt Practices Act and other anti-corruption laws and regulations (“Anti-Corruption Laws”) prohibit corrupt payments by our employees, vendors, or agents. While we devote substantial resources to our global compliance programs and have implemented policies, training, and internal controls designed to reduce the risk of losscorrupt payments, our employees, vendors, or agents may violate our policies. Our failure to comply with Anti-Corruption Laws could result in significant fines and penalties, criminal sanctions against us, our officers or our employees, prohibitions on the conduct of accessour business, and damage to capital markets.our reputation. Operations outside the U.S. may be affected by changes in trade protection laws, policies and measures, and other regulatory requirements affecting trade and investment. As a result, we may be subject to legal liability and reputational damage.
We depend on our ability to attract, develop and retain qualified permanent full-time employees.
As we aim to expand the number of clients utilizing our higher margin specialty solutions in support of our growth strategy, we are highly reliant on individuals who possess specialized knowledge and skills to lead related specialty solutions and operations. Social, political and financial conditions can negatively impact the availability of qualified personnel. Competition for individuals with proven specialized knowledge and skills is intense, and demand for these individuals is expected to remain strong in the foreseeable future. Our success is dependent on our ability to attract, develop and retain these employees.
We depend on our ability to attract and retain qualified temporary personnel (employed directly by us or through third-party suppliers).
We depend on our ability to attract qualified temporary personnel who possess the skills and experience necessary to meet the staffing requirements of our customers. We must continually evaluate our base of available qualified personnel to keep pace with changing customer needs. Competition for individuals with proven professional skills is intense, and demand for these individuals is expected to remain strong for the foreseeable future. Low unemployment, as well as social, political and financial conditions can negatively impact the amount of qualified personnel available to meet the staffing requirements of our customers. There can be no assurance that qualified personnel will continue to meetbe available in sufficient numbers and on terms of employment acceptable to us and our customers. Our success is substantially dependent on our ability to recruit and retain qualified temporary personnel.
We may be exposed to employment-related claims and losses, including class action lawsuits and collective actions, which could have a material adverse effect on our business.
We employ and assign personnel in the workplaces of other businesses. The risks of these financial covenants,activities include possible claims relating to:
•discrimination and harassment;
•wrongful termination or retaliation;
•violations of employment rights related to employment screening or privacy issues;
•apportionment between us and our customer of legal obligations as an employer of temporary employees;
•classification of workers as employees or independent contractors;
•employment of unauthorized workers;
•violations of wage and hour requirements;
•entitlement to employee benefits, including health insurance and retroactive benefits;
•failure to comply with leave policy and other labor requirements; and
•errors and omissions by our temporary employees, particularly for the actions of professionals such as engineers, therapists, accountants, teachers and scientists.
We are also subject to potential risks relating to misuse of customer proprietary information, misappropriation of funds, death or injury to our employees, damage to customer facilities due to negligence of temporary employees, criminal activity and other similar occurrences. We may incur fines and other losses or negative publicity with respect to interest coverage (see Debt footnotethese risks. In addition, these occurrences may give rise to litigation, which could be time-consuming and expensive. In the U.S. and certain other countries in which we operate, new employment and labor laws and regulations have been proposed or adopted that may increase the potential exposure of employers to employment-related claims and litigation. In addition, such laws and regulations are arising
13
with increasing frequency at the state and local level in the notesU.S. and the resulting inconsistency in such laws and regulations results in additional complexity. There can be no assurance that the corporate policies and practices we have in place to help reduce our exposure to these risks will be effective or that we will not experience losses as a result of these risks. Although we maintain insurance in types and amounts we believe are appropriate in light of the aforementioned exposures, there can also be no assurance that such insurance policies will remain available on reasonable terms or be sufficient in amount or scope of coverage. Additionally, should we have a material inability to produce records as a consequence of litigation or a government investigation, the cost or consequences of such matters could become much greater.
Risks Related to Cyber Security and Data Privacy
Damage to our consolidated financial statements), maykey data centers could affect our ability to sustain critical business applications.
Many business processes critical to our continued operation are hosted in outsourced facilities in America, Europe and Asia. Certain other processes are hosted at our corporate headquarters complex or occur in cloud-based computer environments. These critical processes include, but are not be assured. Iflimited to, payroll, customer reporting, and order management. Although we default under this or any otherhave taken steps to protect all such instances by establishing robust data backup and disaster recovery capabilities, the loss of these data centers or access to the cloud-based environments could create a substantial risk of business interruption which could have a material adverse effect on our business, financial condition and results of operations.
A failure to maintain the privacy of information entrusted to us could have significant adverse consequences.
In the normal course of business we control, process, or have access to personal information regarding our own employees or employment candidates, as well as that of many of our customers or managed suppliers. Information concerning these individuals may also reside in systems controlled by third parties for purposes such as employee benefits and payroll administration. The legal and regulatory environment concerning data privacy is becoming more complex and challenging, and the potential consequences of non-compliance have become more severe. The European Union’s General Data Protection Regulation, the California Consumer Privacy Act and similar laws impose additional compliance requirements related to the lenderscollection, use, processing, transfer, disclosure, and retention of personal information, which can increase operating costs and resources to accomplish. Any failure to abide by these regulations or to protect such personal information from inappropriate access or disclosure, whether through social engineering or by accident or other cause, could declare all outstanding borrowings, accrued interesthave severe consequences including fines, litigation, regulatory sanctions, reputational damage, and feesloss of customers or employees. Although we have a program designed to be due and payable or significantly increasepreserve the costprivacy rights of the facility. In these circumstances,personal data that we control or process, as well as personal data that we entrust to third parties, there can be no assurance that our program will meet all current and future regulatory requirements, anticipate all potential methods of unauthorized access, or prevent all inappropriate disclosures. Our insurance coverage may not be sufficient to cover all such costs or consequences, and there can be no assurance that any insurance that we wouldnow maintain will remain available under acceptable terms.
Cyberattacks or other breaches of network or information technology security could have sufficient liquidityan adverse effect on our systems, services, reputation and financial results.
We rely upon multiple information technology systems and networks, some of which are web-based or managed by third parties, to repayprocess, transmit, and store electronic information and to manage or refinance this indebtedness at favorable ratessupport a variety of critical business processes and activities. Our networks and applications are increasingly accessed from locations and by devices not within our physical control, and the specifics of our technology systems and networks may vary by geographic region. In the course of ordinary business, we may store or at all. Events beyondprocess proprietary or confidential information concerning our controlbusiness and financial performance and current, past or prospective employees, customers, vendors and managed suppliers. The secure and consistent operation of these systems, networks and processes is critical to our business operations. Moreover, our temporary employees may be exposed to, or have access to, similar information in the course of their customer assignments. We routinely experience cyberattacks, which may include the use or attempted use of malware, ransomware, computer viruses, phishing, social engineering schemes and other means of attempted disruption or unauthorized access. Additionally, the rapid pace of change in information security and cyber security threats could result in a heightened threat level for us or companies in our industry with little notice. Our relationships with third parties, including suppliers we manage, customers, and vendors creates potential avenues for malicious actors to initiate a supply chain attack. Even in instances where we are not a target of a malicious actor, we could be exposed to risk due to our relationships and business processes with these third parties.
The actions we take to reduce the failurerisk of oneimpairments to our operations or moresystems and breaches of confidential or proprietary data may not be sufficient to prevent or repel future cyber events or other impairments of our banks, reducingnetworks or information technologies. An event involving the destruction, modification, accidental or unauthorized release, or theft of sensitive information from systems related to our accessbusiness, or an attack that results in damage to liquidityor unavailability of our key technology
14
systems or those of critical vendors (e.g., ransomware), could result in damage to our reputation, fines, regulatory sanctions or interventions, contractual or financial liabilities, additional compliance and potentially resultingremediation costs, loss of employees or customers, loss of payment card network privileges, operational disruptions and other forms of costs, losses or reimbursements, any of which could materially adversely affect our operations or financial condition. Our cyber security and business continuity plans, and those of our third parties with whom we do business, may not be effective in reduced financialanticipating, preventing and operating flexibility. If broader credit markets wereeffectively responding to experience dislocation, ourall potential accesscyber risk exposures. Our insurance coverage may not be sufficient to other funding sources wouldcover all such costs or consequences, and there can be limited.no assurance that any insurance that we now maintain will remain available under acceptable terms.
Risks Related to Our Capital Structure
Our controlling stockholder exercises voting control over our company and has the ability to elect or remove from office all of our directors.
The Terence E. Adderley Revocable Trust K (“Trust K”) which became irrevocable upon the Executive Chairmandeath of Terence E. Adderley on October 9, 2018, is our controlling stockholder. In accordance with the provisions of Trust K, William U. Parfet, David M. Hempstead and Andrew H. Curoe were appointed as successor trustees of the trust. Mr. Parfet is the brother of Donald R. Parfet, the Chairman of the Board of our board of directors and certain trusts with respect to which he acts as trustee or co-trustee, control approximately 93% of the outstandingCompany. The trustees, acting by majority vote, have sole investment and voting power over the shares of Kelly Class B common stock held by Trust K, which represent approximately 93.5% of the outstanding Class B shares. The voting rights of our Class B common stock are perpetual, and our Class B common stock is not subject to transfer restrictions or mandatory conversion obligations under our certificate of incorporation or bylaws.
Our Class B common stock is the only class of our common stock entitled to voting rights. Mr. Adderley isThe trustees of Trust K are therefore able to exercise voting control with respect to all matters requiring stockholder approval, including the election or removal from office of all members of the Company’s board of directors.
We are not subject to certain of the listing standards that normally apply to companies whose shares are quoted on the NASDAQ Global Market.
Our Class A and Class B common stock are quoted on the NASDAQ Global Market. Under the listing standards of the NASDAQ Global Market, we are deemed to be a “controlled company” by virtue of the fact that Terence E. Adderley, the Executive Chairman and Chairman of the Board of our board of directors, and certain trusts of which he acts as trustee or co-
We currently comply with certain of the listing standards of the NASDAQ Global Market that do not apply to controlled companies. Our compliance is voluntary, however, and there can be no assurance that we will continue to comply with these standards in the future.
Provisions in our certificate of incorporation and bylaws and Delaware law may delay or prevent an acquisition of our company.Company.
Our restated certificate of incorporation and bylaws contain provisions that could make it harder for a third party to acquire us without the consent of our board of directors. For example, if a potential acquirer were to make a hostile bid for us, the acquirer would not be able to call a special meeting of stockholders to remove our board of directors or act by written consent without a meeting. The acquirer would also be required to provide advance notice of its proposal to replace directors at any annual meeting and would not be able to cumulate votes at a meeting, which would require the acquirer to hold more shares to gain representation on the board of directors than if cumulative voting were permitted.
15
Our board of directors also has the ability to issue additional shares of common stock which could significantly dilute the ownership of a hostile acquirer. In addition, Section 203 of the Delaware General Corporation Law limits mergers and other business combination transactions involving 15 percent or greater stockholders of Delaware corporations unless certain board or stockholder approval requirements are satisfied. These provisions and other similar provisions make it more difficult for a third party to acquire us without negotiation.
Our board of directors could choose not to negotiate with an acquirer that it did not believe was in our strategic interests. If an acquirer is discouraged from offering to acquire us or prevented from successfully completing a hostile acquisition by these or other measures, our shareholders could lose the opportunity to sell their shares at a favorable price.
The holders of shares of our Class A common stock are not entitled to voting rights.
Under our certificate of incorporation, the holders of shares of our Class A common stock are not entitled to voting rights, except as otherwise required by Delaware law. As a result, Class A common stock holdersstockholders do not have the right to vote for the election of directors or in connection with most other matters submitted for the vote of our stockholders.stockholders, including mergers and certain other business combination transactions involving the Company.
Provisions in U.S. and foreign tax law could limit the use of tax credit and net operating loss carryforwards in the event of an ownership change. In general, an ownership change occurs under U.S. tax law if there is a change in the corporation’s equity ownership that exceeds 50% over a rolling three-year period. If we experience an ownership change, inclusive of our Class A and Class B common stock, priceour tax credit and net operating loss carryforwards generated prior to the ownership change may be subject to significant volatilityannual limitations that could reduce, eliminate or defer their utilization. Such limitation could materially impact our financial condition and could suffer a declineresults of operations.
Failure to maintain specified financial covenants in value.
Our bank credit facilities contain covenants that require us to maintain specified financial ratios and satisfy other financial conditions. During 2022, we met all of the market price of our common stock. These include:
notes to our consolidated financial statements), cannot be assured. If we default under this or any other of these requirements, the lenders could declare all outstanding borrowings, accrued interest and fees to be due and payable or significantly increase the cost of the facility. Additionally, our credit facilities contain cross-default provisions. In addition, the stock market in general, and the NASDAQ Global Market in particular,these circumstances, there can be no assurance that we would have experienced significant price and volume fluctuations that have often been unrelatedsufficient liquidity to repay or disproportionate to the operating performance of listed companies. These broad market and industry factors may seriously harm the market price ofrefinance this indebtedness at favorable rates or at all. Events beyond our common stock, regardless of our operating performance. In the past, securities class action litigation has often been instituted following periods of volatility in the market price of a company’s securities. A securities class action suit against uscontrol could result in substantial costs, potential liabilities and the diversionfailure of one or more of our management’s attentionbanks, reducing our access to liquidity and resources. Further,potentially resulting in reduced financial and operating flexibility. If broader credit markets were to experience dislocation, our operating results maypotential access to other funding sources would be below the expectations of securities analysts or investors. In such event, the price of our common stock may decline.limited.
ITEM 1B. UNRESOLVED STAFF COMMENTS.
None.
ITEM 2. PROPERTIES.
Our headquarters is a leased facility located in Troy, Michigan whereand is available to our corporate, subsidiary and divisional offices are currently located. The original headquarters building was purchased in 1977. Headquarters operations were expanded into additional buildings purchased in 1991, 1997 and 2001.
16
ITEM 3. LEGAL PROCEEDINGS.
While the ultimate outcome of these matters currently pending cannot be predicted with certainty, we believe that the resolution of any such proceedings will not have a material adverse effect on our financial condition, results of operations or cash flows.
In January 2018, the Hungarian Competition Authority initiated proceedings against the Company, along with a local industry trade association and its members, due to alleged infringement of national competition regulations. We are fully cooperatingThe Authority announced its decision on December 18, 2020, levying a fine against the trade association with joint and several secondary liability placed on the investigation, and are supplying materials and information20 member companies. Our apportioned secondary liability as a member company is approximately $300,000. The matter is still pending. Certain member companies exercised their right to comply withchallenge the Authority’s undertakings.decision, which could impact the apportionment. The Company does not believe that resolution of this matter will have a material adverse effect upon the Company’s competitive position, results of operations, cash flows or financial position.
ITEM 4. MINE SAFETY DISCLOSURES.
Not applicable.
17
PART II
ITEM 5. MARKET FOR THE REGISTRANT’S COMMON EQUITY, RELATED STOCKHOLDER MATTERS AND ISSUER PURCHASES OF EQUITY SECURITIES.
Market Information and Dividends
Our Class A and Class B common stock is traded on the NASDAQ Global Market under the symbols “KELYA” and “KELYB,” respectively. The high and low selling prices for our Class A common stock and Class B common stock as quoted by the NASDAQ Global Market and the dividends paid on the common stock for each quarterly period in the last two fiscal years are reported in the table below. Our ability to pay dividends is subject to compliance with certain financial covenants contained in our debt facilities, as described in the Debt footnote in the notes to our consolidated financial statements.
| Per share amounts (in dollars) | |||||||||||||||||||||||||||||
First Quarter | Second Quarter | Third Quarter | Fourth Quarter | Year | |||||||||||||||||||||||||
| 2022 | |||||||||||||||||||||||||||||
| Class A common | |||||||||||||||||||||||||||||
| High | $ | 23.00 | $ | 21.69 | $ | 22.56 | $ | 18.78 | $ | 23.00 | |||||||||||||||||||
| Low | 16.22 | 16.73 | 13.41 | 13.64 | 13.41 | ||||||||||||||||||||||||
| Class B common | |||||||||||||||||||||||||||||
| High | 22.30 | 21.77 | 26.64 | 18.63 | 26.64 | ||||||||||||||||||||||||
| Low | 16.74 | 17.01 | 13.64 | 14.04 | 13.64 | ||||||||||||||||||||||||
| Dividends | 0.05 | 0.075 | 0.075 | 0.075 | 0.275 | ||||||||||||||||||||||||
| 2021 | |||||||||||||||||||||||||||||
| Class A common | |||||||||||||||||||||||||||||
| High | $ | 23.90 | $ | 26.98 | $ | 25.00 | $ | 20.87 | $ | 26.98 | |||||||||||||||||||
| Low | 19.13 | 22.51 | 18.58 | 15.88 | 15.88 | ||||||||||||||||||||||||
| Class B common | |||||||||||||||||||||||||||||
| High | 57.46 | 60.00 | 24.70 | 21.27 | 60.00 | ||||||||||||||||||||||||
| Low | 18.00 | 22.15 | 17.95 | 16.63 | 16.63 | ||||||||||||||||||||||||
| Dividends | — | — | 0.05 | 0.05 | 0.10 | ||||||||||||||||||||||||
| Per share amounts (in dollars) | |||||||||||||||||||
First Quarter | Second Quarter | Third Quarter | Fourth Quarter | Year | |||||||||||||||
| 2017 | |||||||||||||||||||
| Class A common | |||||||||||||||||||
| High | $ | 23.48 | $ | 24.70 | $ | 25.48 | $ | 30.93 | $ | 30.93 | |||||||||
| Low | 20.87 | 20.27 | 21.01 | 24.69 | 20.27 | ||||||||||||||
| Class B common | |||||||||||||||||||
| High | 23.00 | 23.75 | 23.00 | 28.50 | 28.50 | ||||||||||||||
| Low | 20.30 | 20.18 | 20.95 | 27.20 | 20.18 | ||||||||||||||
| Dividends | 0.075 | 0.075 | 0.075 | 0.075 | 0.30 | ||||||||||||||
| 2016 | |||||||||||||||||||
| Class A common | |||||||||||||||||||
| High | $ | 19.73 | $ | 20.15 | $ | 20.98 | $ | 23.61 | $ | 23.61 | |||||||||
| Low | 14.63 | 17.81 | 18.01 | 18.06 | 14.63 | ||||||||||||||
| Class B common | |||||||||||||||||||
| High | 18.04 | 20.00 | 21.60 | 27.80 | 27.80 | ||||||||||||||
| Low | 15.43 | 15.04 | 17.23 | 17.75 | 15.04 | ||||||||||||||
| Dividends | 0.05 | 0.075 | 0.075 | 0.075 | 0.275 | ||||||||||||||
Holders
The number of holders of record of our Class A and Class B common stock were approximately 6,60010,500 and 200,700, respectively, as of February 2, 2018. January 30, 2023.
Recent Sales of Unregistered Securities
None.
18
Issuer Purchases of Equity Securities
During the fourth quarter of 2017,2022, we reacquired shares of our Class A common stock as follows:
| Period | Total Number of Shares (or Units) Purchased | Average Price Paid per Share (or Unit) | Total Number of Shares (or Units) Purchased as Part of Publicly Announced Plans or Programs | Maximum Number (or Approximate Dollar Value) of Shares (or Units) That May Yet Be Purchased Under the Plans or Programs | ||||||||||||||||||||||
| (in millions of dollars) | ||||||||||||||||||||||||||
| October 3, 2022 through November 6, 2022 | 143 | $ | 14.53 | — | $ | — | ||||||||||||||||||||
| November 7, 2022 through December 4, 2022 | 68,238 | 16.90 | 68,114 | 48.8 | ||||||||||||||||||||||
| December 5, 2022 through January 1, 2023 | 408,607 | 16.41 | 406,530 | 42.2 | ||||||||||||||||||||||
| Total | 476,988 | $ | 16.48 | 474,644 | ||||||||||||||||||||||
| Period | Total Number of Shares (or Units) Purchased | Average Price Paid per Share (or Unit) | Total Number of Shares (or Units) Purchased as Part of Publicly Announced Plans or Programs | Maximum Number (or Approximate Dollar Value) of Shares (or Units) That May Yet Be Purchased Under the Plans or Programs | ||||||||||
| (in millions of dollars) | ||||||||||||||
| October 2, 2017 through November 5, 2017 | 845 | $ | 26.31 | — | $ | — | ||||||||
| November 6, 2017 through December 3, 2017 | 289 | 29.36 | — | — | ||||||||||
| December 4, 2017 through December 31, 2017 | — | — | — | — | ||||||||||
| Total | 1,134 | $ | 27.09 | — | ||||||||||
On November 9, 2022, the Company's board of directors approved a plan for the Company to repurchase shares of its Class A common stock with a market value not to exceed $50.0 million through transactions executed in the open market within one year. We may also reacquire shares outside the program in connection with shares sold to cover taxesemployee tax withholdings due upon the vesting of restricted stock held by employees. Accordingly, 1,1342,344 shares were reacquired in transactions outside the repurchase program during the Company’s fourth quarter.
19
Performance Graph
The following graph compares the cumulative total return of our Class A common stock with that of the S&P SmallCap 600 Index and the S&P 1500 Human Resources and Employment Services Index for the five years ended December 31, 2017.2022. The graph assumes an investment of $100 on December 31, 20122017 and that all dividends were reinvested.
COMPARISON OF FIVE YEAR CUMULATIVE TOTAL RETURN
Assumes Initial Investment of $100
December 31, 20122017 – December 31, 20172022
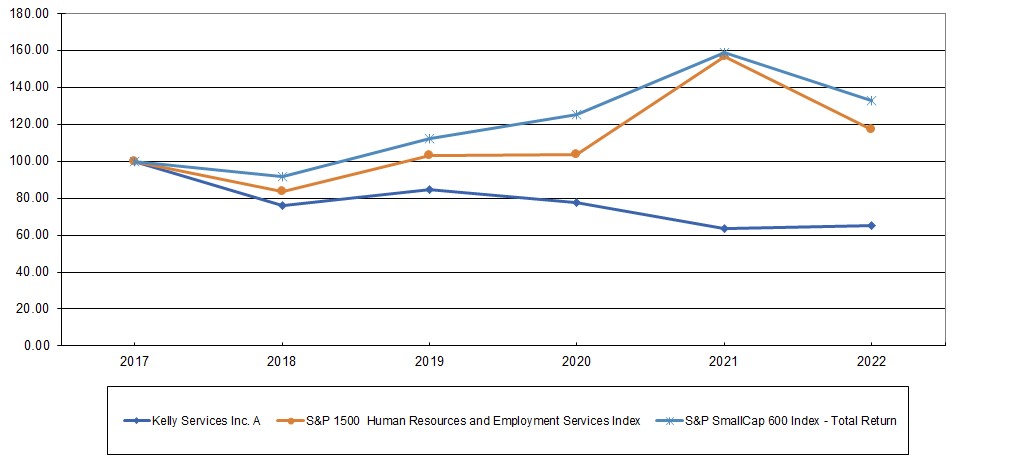

| 2017 | 2018 | 2019 | 2020 | 2021 | 2022 | |||||||||||||||
| Kelly Services, Inc. | $ | 100.00 | $ | 76.01 | $ | 84.84 | $ | 77.59 | $ | 63.59 | $ | 65.03 | ||||||||
| S&P SmallCap 600 Index | $ | 100.00 | $ | 91.52 | $ | 112.37 | $ | 125.05 | $ | 158.59 | $ | 133.06 | ||||||||
| S&P 1500 Human Resources and Employment Services Index | $ | 100.00 | $ | 83.73 | $ | 102.81 | $ | 103.69 | $ | 156.71 | $ | 117.07 | ||||||||
ITEM 6. [RESERVED]
20
| 2012 | 2013 | 2014 | 2015 | 2016 | 2017 | |||||||||||||
| Kelly Services, Inc. | $ | 100.00 | $ | 160.17 | $ | 110.53 | $ | 106.17 | $ | 152.98 | $ | 184.46 | ||||||
| S&P SmallCap 600 Index | $ | 100.00 | $ | 141.31 | $ | 149.45 | $ | 146.50 | $ | 185.40 | $ | 209.94 | ||||||
| S&P 1500 Human Resources and Employment Services Index | $ | 100.00 | $ | 176.48 | $ | 177.11 | $ | 191.21 | $ | 209.27 | $ | 266.36 | ||||||
| (In millions except per share amounts) | 2017 | 2016 | 2015 (1) | 2014 | 2013 | |||||||||||||||
| Revenue from services | $ | 5,374.4 | $ | 5,276.8 | $ | 5,518.2 | $ | 5,562.7 | $ | 5,413.1 | ||||||||||
| Earnings from operations | 83.3 | 63.2 | 53.8 | 23.7 | 58.9 | |||||||||||||||
Gain on investment in PersolKelly Asia Pacific (2) | — | 87.2 | — | — | — | |||||||||||||||
| Net earnings | 71.6 | 120.8 | 53.8 | 23.7 | 58.9 | |||||||||||||||
| Basic earnings per share | 1.84 | 3.10 | 1.39 | 0.61 | 1.54 | |||||||||||||||
| Diluted earnings per share | 1.81 | 3.08 | 1.39 | 0.61 | 1.54 | |||||||||||||||
| Dividends per share | ||||||||||||||||||||
| Classes A and B common | 0.30 | 0.275 | 0.20 | 0.20 | 0.20 | |||||||||||||||
Working capital (3) | 458.1 | 443.5 | 411.3 | 428.1 | 474.5 | |||||||||||||||
| Total assets | 2,376.3 | 2,028.1 | 1,939.6 | 1,917.9 | 1,798.6 | |||||||||||||||
| Total noncurrent liabilities | 300.5 | 245.0 | 228.4 | 224.1 | 214.0 | |||||||||||||||
ITEM 7. MANAGEMENT’S DISCUSSION AND ANALYSIS OF FINANCIAL CONDITION AND RESULTS OF OPERATIONS.
Executive Overview
•We increased total company revenue driven by top-line growth in our Education, SET and adjustments to advance that strategy. We have set our sights on becoming an evenOCG business units.
•Our more competitive, consultativeprofitable outcome-based solutions demonstrated resilience amid macroeconomic headwinds and profitable company, and we are reshaping our business to make that vision a reality. We will measure our progress against bothgenerated solid revenue and gross profit growth, as well as earningsgrowth.
•Each of our five business units expanded itsgross profit rate, reflecting our ongoing drive to shift toward a higher-margin, higher-value business mix.
•Excluding the impact of goodwill impairment charges and conversion rate. The goals we have established are baseda loss on the current economicdisposal of our Russian operations, we improved earnings from operations, demonstrating our ability to effectively translate gross margin expansion to earnings growth.
2022 was also a year in which we accelerated our transformation and business environment,streamlined our portfolio.
•We ended the cross-ownership arrangement between Kelly and may change as conditions warrant. We expect:
•We redeployed a portion of the net proceeds from these transactions to advance our inorganic growth strategy, while preserving the remaining capital to pursue additional high-margin, high-growth acquisitions in the future.
•We acted decisively to transfer ownership of our Russian operations to a Russian company.
•We increased our dividend to its pre-pandemic level and authorized a $50 million repurchase of outstanding Class A common shares.
Together, these achievements and actions demonstrate our commitment to our specialty growth strategy and create long-term value for all our stakeholders.
As the macroeconomic situation unfolds in 2023, we will stay the course in our pursuit of profitable growth while proactively controlling costs to manage through investmentsthis economic cycle. In each of our chosen specialties, we will continue to shift toward a business mix characterized not only by higher margins and value, but greater resilience to lessen the impact of market fluctuations. We also intend to drive inorganic growth using our available capital to pursue additional high-quality acquisitions in Education, SET and OCG. Finally, we will continue to invest in technology and process automationnew products that will improve the talent and customer experience, increase efficiency and enable organic growth. Together, these actions will ensure a return from our delivery infrastructure and, as a result;
21
Financial Measures
The constant currency (“CC”) change amounts in the following tables refer to the year-over-year percentage changes resulting from translating 20172022 financial data into U.S. dollars using the same foreign currency exchange rates used to translate financial data for 2016.2021. We believe that CC measurements are a useful measure, indicating the actual trends of our operations without distortion due to currency fluctuations. We use CC results when analyzing the performance of our segments and measuring our results against those of our competitors. Additionally, substantially all of our foreign subsidiaries derive revenues and incur cost of services and selling, general and administrative expenses (“SG&A”) expenses within a single country and currency which, as a result, provides a natural hedge against currency risks in connection with their normal business operations.
CC measures are non-GAAP (Generally Accepted Accounting Principles) measures and are used to supplement measures in accordance with GAAP.GAAP (Generally Accepted Accounting Principles). Our non-GAAP measures may be calculated differently from those provided by other companies, limiting their usefulness for comparison purposes. Non-GAAP measures should not be considered a substitute for, or superior to, measures of financial performance prepared in accordance with GAAP.
Reported and CC percentage changes were computed based on actual amounts in thousands of dollars.
Return on sales (earnings from operations divided by revenue from services) and conversion rate (earnings from operations divided by gross profit) in the following tables are ratios used to measure the Company’s operating efficiency.
EBITDA (earnings before interest, taxes, depreciation and amortization) and EBITDA margin (EBITDA divided by revenue from services) are measures used for understanding the Company's ability to generate cash flow and for judging overall operating performance.
NM (not meaningful) in the following tables is used in place of percentage changes where: the change is in excess of 500%, the change involves a comparison between earnings and loss amounts, or the comparison amount is zero.
Days sales outstanding (“DSO”) represents the number of days that sales remain unpaid for the period being reported. DSO is calculated by dividing average net sales per day (net sales excluding secondary supplier expense for(based on a rolling three-month period) into trade accounts receivable, net of allowances at the period end. Although secondary supplier revenues are recorded on a net basis (net of secondary supplier expense), secondary supplier revenue is included in the daily sales calculation in order to properly reflect the gross revenue amounts billed to the customer.
22
Results of Operations
Total Company
(Dollars in millions)
| 2022 | 2021 | Change | |||||||||||||||||||||||||||||||||||||||||||||||||||
| Revenue from services | $ | 4,965.4 | $ | 4,909.7 | 1.1 | % | |||||||||||||||||||||||||||||||||||||||||||||||
| Gross profit | 1,011.8 | 919.2 | 10.1 | ||||||||||||||||||||||||||||||||||||||||||||||||||
| SG&A expenses excluding restructuring charges | 943.5 | 866.6 | 8.9 | ||||||||||||||||||||||||||||||||||||||||||||||||||
| Restructuring charges | — | 4.0 | NM | ||||||||||||||||||||||||||||||||||||||||||||||||||
| Total SG&A expenses | 943.5 | 870.6 | 8.4 | ||||||||||||||||||||||||||||||||||||||||||||||||||
| Goodwill impairment charge | (41.0) | — | NM | ||||||||||||||||||||||||||||||||||||||||||||||||||
| Loss on disposal | (18.7) | — | NM | ||||||||||||||||||||||||||||||||||||||||||||||||||
| Gain on sale of assets | 6.2 | — | NM | ||||||||||||||||||||||||||||||||||||||||||||||||||
| Earnings (loss) from operations | 14.8 | 48.6 | (69.7) | ||||||||||||||||||||||||||||||||||||||||||||||||||
| Gain (loss) on investment in Persol Holdings | (67.2) | 121.8 | NM | ||||||||||||||||||||||||||||||||||||||||||||||||||
| Loss on currency translation from liquidation of subsidiary | (20.4) | — | NM | ||||||||||||||||||||||||||||||||||||||||||||||||||
| Gain on insurance settlement | — | 19.0 | NM | ||||||||||||||||||||||||||||||||||||||||||||||||||
| Other income (expense), net | 1.6 | (3.6) | 146.4 | ||||||||||||||||||||||||||||||||||||||||||||||||||
| Earnings (loss) before taxes and equity in net earnings (loss) of affiliate | (71.2) | 185.8 | NM | ||||||||||||||||||||||||||||||||||||||||||||||||||
| Income tax expense (benefit) | (7.9) | 35.1 | (122.6) | ||||||||||||||||||||||||||||||||||||||||||||||||||
| Equity in net earnings (loss) of affiliate | 0.8 | 5.4 | (85.9) | ||||||||||||||||||||||||||||||||||||||||||||||||||
| Net earnings (loss) | $ | (62.5) | $ | 156.1 | NM | % | |||||||||||||||||||||||||||||||||||||||||||||||
| Gross profit rate | 20.4 | % | 18.7 | % | 1.7 | pts. | |||||||||||||||||||||||||||||||||||||||||||||||
| Conversion rate | 1.5 | 5.3 | (3.8) | ||||||||||||||||||||||||||||||||||||||||||||||||||
The discussion that follows focuses on 2022 results compared to 2021. For a discussion of 2021 results compared to 2020, see "Management's Discussion and Analysis of Financial Condition and Results of Operations" in Part II, Item 7 of our Annual Report on Form 10-K for the fiscal year ended January 2, 2022, filed on February 17, 2022.
2022 vs. 2021
Revenue from services increased 1.1% on a reported basis and 3.2% on a constant currency basis, and reflects revenue increases in Education, Science, Engineering & Technology, and Outsourcing & Consulting operating segments, partially offset by declines in Professional & Industrial and International segments. Our first quarter 2021 acquisition of Softworld, a technology staffing and solutions firm, and our first quarter 2022 acquisition of RocketPower, an RPO solutions provider, and our second quarter 2022 acquisition of PTS, a specialty firm that provides in-school therapy services, added approximately 180 basis points to the revenue growth rate. Compared to 2021, revenue from staffing services decreased 1.2% and revenue from outcome-based services increased 6.3%. Permanent placement revenue, which is included in revenue from services, increased 18.9% from 2021.
Gross profit increased 10.1% on a reported basis and 12.1% on a constant currency basis on higher revenue volume, combined with an increase in the following tables, has a significantgross profit rate. The gross profit rate increased 170 basis points due primarily to favorable product mix, lower employee-related costs, higher permanent placement income and the impact onof the acquisitions of Softworld, RocketPower and PTS, which generate higher gross profit rates. There areThe gross profit rate increased in all operating segments. Permanent placement revenue, which is included in revenue from services and has very low direct costs of services, associated with staffing fee-based income. Therefore, increases or decreases in staffing fee-based income can havehas a disproportionate impact on gross profit rates.
Total Company
| 2017 | 2016 | Change | CC Change | |||||||||||
| Revenue from services | $ | 5,374.4 | $ | 5,276.8 | 1.9 | % | 1.3 | % | ||||||
| Gross profit | 954.1 | 906.3 | 5.3 | 4.7 | ||||||||||
| SG&A expenses excluding restructuring charges | 868.4 | 839.7 | 3.4 | 3.0 | ||||||||||
| Restructuring charges | 2.4 | 3.4 | (31.6 | ) | (31.2 | ) | ||||||||
| Total SG&A expenses | 870.8 | 843.1 | 3.3 | 2.9 | ||||||||||
| Earnings from operations | 83.3 | 63.2 | 31.7 | |||||||||||
| Earnings from operations excluding restructuring charges | 85.7 | 66.6 | 28.5 | |||||||||||
| Staffing fee-based income (included in revenue from services) | 57.3 | 58.5 | (2.2 | ) | (3.7 | ) | ||||||||
| Gross profit rate | 17.8 | % | 17.2 | % | 0.6 | pts. | ||||||||
| Conversion rate | 8.7 | 7.0 | 1.7 | |||||||||||
| Conversion rate excluding restructuring charges | 9.0 | 7.4 | 1.6 | |||||||||||
| Return on sales | 1.5 | 1.2 | 0.3 | |||||||||||
| Return on sales excluding restructuring charges | 1.6 | 1.3 | 0.3 | |||||||||||
23
expenses also reflects increases in salary and related costs and increases in performance-based incentive compensation expenses.
The goodwill impairment charge relates to our RocketPower business, which delivers RPO services primarily to customers in the following discussions, revenue increaseshigh-tech industry, and is included in the Americas StaffingOutsourcing & Consulting segment. Changes in market conditions related to demand in hiring in the high-tech industry and GTS segmentsslowing growth in RPO more broadly resulted in a goodwill impairment charge of $41.0 million in 2022.
Loss on disposal relates to our decision in May 2022 to sell our business in Russia. As a result, our Russian operations were classified as a held for sale disposal group and an impairment loss of $18.5 million representing the excess carrying value over the fair value of the net assets, less costs to sell, was recognized in the second quarter of 2022 with an additional loss of $0.2 million recognized in the third quarter upon completion of the transaction. Gain on sale of assets relates to the disposition of under-utilized real property located in the United States.
Earnings from operations for 2022 totaled $14.8 million, compared to earnings of $48.6 million in 2021. The decline is due primarily to the goodwill impairment charge and the loss on disposal, partially offset by a decline in the International Staffing segment. During 2016, we transferred our APAC staffing businesses for a 49% interest in the PersolKelly Asia Pacific joint venture, which is accounted for as an equity method investment, resulting in the decrease in International Staffing segment revenue.
The loss on investment in total SG&A expenses for 2016 are restructuring charges of $3.4Persol Holdings in 2022 represented the $52.4 million which relate to actions takenloss resulting from changes in the Americas Staffingmarket price of our investment in the common stock of Persol Holdings up until the date of the transaction and International Staffing segmentsthe $14.8 million loss on sale, including transaction costs from the sale of the investment in an open-market transaction. The gain on the investment in Persol Holdings in 2021 resulted from changes in the quoted market price of the Persol Holdings common stock.
Loss on currency translation from liquidation of subsidiary represents the impact of the liquidation of our Kelly Japan subsidiary following the sale of the company’s investment in Persol Holdings and the return of capital through a dividend payment to increase operational efficiencyits U.S. parent.
The change in Other income (expense), net is primarily the result of $5.5 million of foreign exchange gains related to U.S.-denominated cash equivalents held by our Kelly Japan subsidiary following the sale of the Persol Holdings shares and prepareprior to its dividend payment to the businessesU.S. parent in the first quarter of 2022.
Income tax benefit was $7.9 million for future growth.
2022 and income tax expense was $35.1 million for 2021. 2022 benefited from lower pretax earnings, changes in the fair value of the Company’s investment in Persol Holdings, and the impairment of tax deductible goodwill. These benefits were offset by the charge associated with tax exempt life insurance cash surrender value losses. Income tax expense for 2017 was $12.8 million, compared to $30.0 million for 2016. 2021 included charges from changes in the fair value of the Company’s investment in Persol Holdings and the gain on insurance settlement. These amounts were offset by benefits from a change in tax rate in the United Kingdom and tax exempt life insurance cash surrender value gains.
Our tax expense is affected by recurring items, such as the amount of pretax income and its mix by jurisdiction, U.S. work opportunity credits and the change in cash surrender value of non-taxable investments in life insurance policies that are used to fund nonqualified deferred compensation plans. It is also affected by discrete items that may occur in any given period but are not consistent from period to period, such as tax law changes, or changes in judgment regarding the realizability of deferred tax assets. Income tax expense in 2017 included a $13.9 million charge to revalue net deferred tax assets due to the U.S. Tax Cuts and Jobs Act, which reduced the U.S. federal corporate income tax rate from 35% to 21%. This charge was offset by a benefit from tax-free income on life insurance policies, and a benefit from the release of valuation allowances in Norway, Germany and France. Income tax expense in 2016 included a $23.5 million charge from the gain on the investment in PersolKelly Asia Pacific, partially offset by a benefit from the release of valuation allowances in Italy. Both 2017 and 2016 benefitted from the work opportunity credit, which is a temporary provision in the U.S. tax law and expires for employees hired after 2019. While the work opportunity credit has routinely been extended, it is uncertain whether it will again be extended.
| 2017 | 2016 | Change | CC Change | |||||||||||
| Revenue from services | $ | 2,345.9 | $ | 2,191.6 | 7.0 | % | 6.8 | % | ||||||
| Gross profit | 429.1 | 398.2 | 7.8 | 7.6 | ||||||||||
| SG&A expenses excluding restructuring charges | 346.0 | 327.6 | 5.7 | 5.5 | ||||||||||
| Restructuring charges | 0.4 | 1.8 | (80.0 | ) | (79.8 | ) | ||||||||
| Total SG&A expenses | 346.4 | 329.4 | 5.2 | 5.0 | ||||||||||
| Earnings from operations | 82.7 | 68.8 | 20.0 | |||||||||||
| Earnings from operations excluding restructuring charges | 83.1 | 70.6 | 17.5 | |||||||||||
| Gross profit rate | 18.3 | % | 18.2 | % | 0.1 | pts. | ||||||||
| Conversion rate | 19.3 | 17.3 | 2.0 | |||||||||||
| Conversion rate excluding restructuring charges | 19.3 | 17.7 | 1.6 | |||||||||||
| Return on sales | 3.5 | 3.1 | 0.4 | |||||||||||
| Return on sales excluding restructuring charges | 3.5 | 3.2 | 0.3 | |||||||||||
| 2017 | 2016 | Change | CC Change | |||||||||||
| Revenue from services | $ | 1,998.9 | $ | 1,977.1 | 1.1 | % | 1.0 | % | ||||||
| Gross profit | 373.7 | 345.9 | 8.1 | 7.9 | ||||||||||
| SG&A expenses excluding restructuring charges | 294.7 | 287.3 | 2.6 | 2.5 | ||||||||||
| Restructuring charges | 2.0 | 0.4 | 415.5 | 417.6 | ||||||||||
| Total SG&A expenses | 296.7 | 287.7 | 3.1 | 3.0 | ||||||||||
| Earnings from operations | 77.0 | 58.2 | 32.4 | |||||||||||
| Earnings from operations excluding restructuring charges | 79.0 | 58.6 | 35.0 | |||||||||||
| Gross profit rate | 18.7 | % | 17.5 | % | 1.2 | pts. | ||||||||
| Conversion rate | 20.6 | 16.8 | 3.8 | |||||||||||
| Conversion rate excluding restructuring charges | 21.1 | 16.9 | 4.2 | |||||||||||
| Return on sales | 3.9 | 2.9 | 1.0 | |||||||||||
| Return on sales excluding restructuring charges | 4.0 | 3.0 | 1.0 | |||||||||||
| 2017 | 2016 | Change | CC Change | |||||||||||
| Revenue from services | $ | 1,048.2 | $ | 1,127.1 | (7.0 | )% | (9.0 | )% | ||||||
| Gross profit | 153.7 | 166.4 | (7.7 | ) | (9.8 | ) | ||||||||
| SG&A expenses excluding restructuring charges | 131.6 | 145.7 | (9.8 | ) | (11.6 | ) | ||||||||
| Restructuring charges | — | 1.2 | (100.0 | ) | (100.0 | ) | ||||||||
| Total SG&A expenses | 131.6 | 146.9 | (10.4 | ) | (12.2 | ) | ||||||||
| Earnings from operations | 22.1 | 19.5 | 13.3 | |||||||||||
| Earnings from operations excluding restructuring charges | 22.1 | 20.7 | 7.2 | |||||||||||
| Gross profit rate | 14.7 | % | 14.8 | % | (0.1 | ) | pts. | |||||||
| Conversion rate | 14.4 | 11.7 | 2.7 | |||||||||||
| Conversion rate excluding restructuring charges | 14.4 | 12.4 | 2.0 | |||||||||||
| Return on sales | 2.1 | 1.7 | 0.4 | |||||||||||
| Return on sales excluding restructuring charges | 2.1 | 1.8 | 0.3 | |||||||||||
| 2016 (52 Weeks) | 2015 (53 Weeks) | Change | CC Change | |||||||||||
| Revenue from services | $ | 5,276.8 | $ | 5,518.2 | (4.4 | )% | (3.2 | )% | ||||||
| Gross profit | 906.3 | 920.3 | (1.5 | ) | (0.5 | ) | ||||||||
| SG&A expenses excluding restructuring charges | 839.7 | 853.6 | (1.6 | ) | (0.7 | ) | ||||||||
| Restructuring charges | 3.4 | — | NM | NM | ||||||||||
| Total SG&A expenses | 843.1 | 853.6 | (1.2 | ) | (0.3 | ) | ||||||||
| Earnings from operations | 63.2 | 66.7 | (5.2 | ) | ||||||||||
| Earnings from operations excluding restructuring charges | 66.6 | 66.7 | (0.1 | ) | ||||||||||
| Staffing fee-based income (included in revenue from services) | 58.5 | 65.3 | (10.3 | ) | (8.3 | ) | ||||||||
| Gross profit rate | 17.2 | % | 16.7 | % | 0.5 | pts. | ||||||||
| Conversion rate | 7.0 | 7.2 | (0.2 | ) | ||||||||||
| Conversion rate excluding restructuring charges | 7.4 | 7.2 | 0.2 | |||||||||||
| Return on sales | 1.2 | 1.2 | — | |||||||||||
| Return on sales excluding restructuring charges | 1.3 | 1.2 | 0.1 | |||||||||||
The increase in income tax expense from the prior year is primarilynet loss for 2022 was $62.5 million, compared to net earnings of $156.1 million for 2021. This change was due to tax expensethe Persol Holdings investment, including the first quarter 2022 sale and related impacts, the goodwill impairment charge, the loss on disposal related to the sale of $23.5 million fromour Russian operations, partially offset by improved gross profit in 2022 and the gain on sale of under-utilized real property in the investment in PersolKelly Asia Pacific, the impact of which is partially offset by a benefit from the release of valuation allowances in Italy.United States.
Operating Results By Segment
(Dollars in millions)
| 2016 (52 Weeks) | 2015 (53 Weeks) | Change | CC Change | |||||||||||
| Revenue from services | $ | 2,191.6 | $ | 2,209.0 | (0.8 | )% | 0.3 | % | ||||||
| Gross profit | 398.2 | 394.1 | 1.0 | 1.8 | ||||||||||
| SG&A expenses excluding restructuring charges | 327.6 | 333.6 | (1.8 | ) | (1.2 | ) | ||||||||
| Restructuring charges | 1.8 | — | NM | NM | ||||||||||
| Total SG&A expenses | 329.4 | 333.6 | (1.3 | ) | (0.7 | ) | ||||||||
| Earnings from operations | 68.8 | 60.5 | 13.8 | |||||||||||
| Earnings from operations excluding restructuring charges | 70.6 | 60.5 | 16.8 | |||||||||||
| Gross profit rate | 18.2 | % | 17.8 | % | 0.4 | pts. | ||||||||
| Conversion rate | 17.3 | 15.3 | 2.0 | |||||||||||
| Conversion rate excluding restructuring charges | 17.7 | 15.3 | 2.4 | |||||||||||
| Return on sales | 3.1 | 2.7 | 0.4 | |||||||||||
| Return on sales excluding restructuring charges | 3.2 | 2.7 | 0.5 | |||||||||||
| 2022 | 2021 | % Change | |||||||||||||||||||||||||||||||||||||||
| Revenue From Services: | |||||||||||||||||||||||||||||||||||||||||
| Professional & Industrial | $ | 1,666.2 | $ | 1,837.4 | (9.3) | % | |||||||||||||||||||||||||||||||||||
| Science, Engineering & Technology | 1,265.4 | 1,156.8 | 9.4 | ||||||||||||||||||||||||||||||||||||||
| Education | 636.2 | 416.5 | 52.7 | ||||||||||||||||||||||||||||||||||||||
| Outsourcing & Consulting | 468.0 | 432.1 | 8.3 | ||||||||||||||||||||||||||||||||||||||
| International | 932.2 | 1,067.8 | (12.7) | ||||||||||||||||||||||||||||||||||||||
| Less: Intersegment revenue | (2.6) | (0.9) | 182.8 | ||||||||||||||||||||||||||||||||||||||
| Consolidated Total | $ | 4,965.4 | $ | 4,909.7 | 1.1 | % | |||||||||||||||||||||||||||||||||||
2022 vs. 2021
Professional & Industrial revenue from services decreased 9.3%. The decrease was due primarily to a 2% decrease12.4% decline in staffing services resulting from lower hours volume, partially offset by higher bill rates. Included in the decline in hours was the impact from a 1%shift of a large staffing customer to a permanent placement model which resulted in lower staffing volume. Revenue from outcome-based services declined 0.3% due to lower demand for our call center specialty, partially offset by growth in other specialties.
Science, Engineering & Technology revenue from services increased 9.4% on a reported basis, which includes revenue from the acquisition of Softworld in the second quarter of 2021. Excluding the impact of the addition of Softworld revenue in the first quarter of 2022, the revenue growth was 6.1%, which was driven by increases in our outcome-based services as well as an increase in averagerevenue in our staffing business coming from increases in bill rates and permanent placement income, partially offset by a decline in hours.
Education revenue from services increased 52.7%. The revenue increase includes the impact of the acquisition of PTS in May 2022. On an organic basis, revenue increased 45.9% reflecting increased demand from existing customers, new customer wins and the impact of higher bill rates.
Outsourcing & Consulting revenue from services increased 8.3% on a reported basis, which includes the revenue from the acquisition of RocketPower in March 2022. On an organic basis, revenue growth was 2.7% due primarily to strong demand for RPO services, coupled with revenue growth in MSP, partially offset by declines in PPO revenue.
International revenue from services decreased 12.7% on a reported basis and decreased 4.7% in constant currency. The decrease was primarily the result of the sale of our Russian operations in hours volume isJuly 2022, combined with revenue declines in Mexico due in part, to the 53rd weekimpact of legislation enacted in 2015,the third quarter of 2021, which added approximately 1% to 2015 revenueplaced restrictions on the staffing industry. Revenue in Americas Staffing. The increaseEurope decreased 9.2% on a reported basis and decreased 0.3% in average bill rates was primarilyconstant currency, with the impact of the sale of our Russian operations nearly offset by growth in most geographies.
25
Operating Results By Segment (continued)
(Dollars in millions)
| 2022 | 2021 | Change | |||||||||||||||||||||||||||||||||||||||
| Gross Profit: | |||||||||||||||||||||||||||||||||||||||||
| Professional & Industrial | $ | 302.5 | $ | 310.0 | (2.4) | % | |||||||||||||||||||||||||||||||||||
| Science, Engineering & Technology | 297.0 | 253.9 | 17.0 | ||||||||||||||||||||||||||||||||||||||
| Education | 100.3 | 65.1 | 54.0 | ||||||||||||||||||||||||||||||||||||||
| Outsourcing & Consulting | 169.6 | 141.4 | 20.0 | ||||||||||||||||||||||||||||||||||||||
| International | 142.4 | 148.8 | (4.3) | ||||||||||||||||||||||||||||||||||||||
| Consolidated Total | $ | 1,011.8 | $ | 919.2 | 10.1 | % | |||||||||||||||||||||||||||||||||||
| Gross Profit Rate: | |||||||||||||||||||||||||||||||||||||||||
| Professional & Industrial | 18.2 | % | 16.9 | % | 1.3 | pts. | |||||||||||||||||||||||||||||||||||
| Science, Engineering & Technology | 23.5 | 21.9 | 1.6 | ||||||||||||||||||||||||||||||||||||||
| Education | 15.8 | 15.6 | 0.2 | ||||||||||||||||||||||||||||||||||||||
| Outsourcing & Consulting | 36.3 | 32.7 | 3.6 | ||||||||||||||||||||||||||||||||||||||
| International | 15.3 | 13.9 | 1.4 | ||||||||||||||||||||||||||||||||||||||
| Consolidated Total | 20.4 | % | 18.7 | % | 1.7 | pts. | |||||||||||||||||||||||||||||||||||
2022 vs. 2021
Gross profit for the Professional & Industrial segment decreased due to wage inflation and the resulting impact on the bill rate. Americas Staffing represented 42% of total Companylower revenue in 2016 and 40% in 2015.
Science, Engineering & Technology gross profit increased on higher revenue volume, combined with an increase in the gross profit rate. The gross profit rate increased 160 basis points due to lower taxes,improved specialty mix, including the acquisition of Softworld which generates higher gross profit margins, and increased permanent placement income, partially offset by higher workers’ compensationemployee-related costs.
Gross profit for the Education segment increased on higher revenue volume and employee benefit costs,an increase in the gross profit rate. The gross profit rate increased 20 basis points, due primarily to the acquisition of PTS which generates higher margins, and higher permanent placement income at Greenwood/Asher.
Outsourcing & Consulting gross profit increased on higher revenue volume, combined with an increase in the negative impactgross profit rate. The gross profit rate increased 360 basis points, primarily due to a change in product mix within this segment. Growth in RPO, including the acquisition of changesRocketPower, and MSP with higher margins, was coupled with decreased revenues in customer mix.our PPO product, which generates lower profit margins.
International gross profit decreased 1.3%4.3% on a reported basis and 0.7%improved 4.6% on a CCconstant currency basis. On a reported basis, due mainlylower revenue volume was partially offset by an improved gross profit rate. On a constant currency basis, the improved gross profit rate more than offset the impact of lower revenue volume. In comparison to lower performance-based compensation. Included in 2016 SG&A expenses are restructuring charges of $1.8 million. These charges represent severance costs related to headcount reductions as well as lease buyout coststhe prior year, the gross profit rate increased 140 basis points, primarily due to branch consolidations.improved business mix and higher permanent placement income.
26
Operating Results By Segment (continued)
(Dollars in millions)
| 2022 | 2021 | % Change | |||||||||||||||||||||||||||||||||||||||
| SG&A Expenses: | |||||||||||||||||||||||||||||||||||||||||
| Professional & Industrial | $ | 270.5 | $ | 278.6 | (2.9) | % | |||||||||||||||||||||||||||||||||||
| Science, Engineering & Technology | 214.9 | 180.2 | 19.2 | ||||||||||||||||||||||||||||||||||||||
| Education | 81.8 | 62.1 | 31.7 | ||||||||||||||||||||||||||||||||||||||
| Outsourcing & Consulting | 149.8 | 122.7 | 22.1 | ||||||||||||||||||||||||||||||||||||||
| International | 132.5 | 138.9 | (4.6) | ||||||||||||||||||||||||||||||||||||||
| Corporate expenses | 94.0 | 88.1 | 6.6 | ||||||||||||||||||||||||||||||||||||||
| Consolidated Total | $ | 943.5 | $ | 870.6 | 8.4 | % | |||||||||||||||||||||||||||||||||||
| 2016 (52 Weeks) | 2015 (53 Weeks) | Change | CC Change | |||||||||||
| Revenue from services | $ | 1,977.1 | $ | 1,997.2 | (1.0 | )% | (0.7 | )% | ||||||
| Gross profit | 345.9 | 331.4 | 4.3 | 4.8 | ||||||||||
| SG&A expenses excluding restructuring charges | 287.3 | 260.5 | 10.3 | 10.8 | ||||||||||
| Restructuring charges | 0.4 | — | NM | NM | ||||||||||
| Total SG&A expenses | 287.7 | 260.5 | 10.4 | 11.0 | ||||||||||
| Earnings from operations | 58.2 | 70.9 | (18.0 | ) | ||||||||||
| Earnings from operations excluding restructuring charges | 58.6 | 70.9 | (17.5 | ) | ||||||||||
| Gross profit rate | 17.5 | % | 16.6 | % | 0.9 | pts. | ||||||||
| Conversion rate | 16.8 | 21.4 | (4.6 | ) | ||||||||||
| Conversion rate excluding restructuring charges | 16.9 | 21.4 | (4.5 | ) | ||||||||||
| Return on sales | 2.9 | 3.6 | (0.7 | ) | ||||||||||
| Return on sales excluding restructuring charges | 3.0 | 3.6 | (0.6 | ) | ||||||||||
Total SG&A expenses in the GTS segmentProfessional & Industrial decreased during 2016 due2.9%, primarily to revenue declines in our centrally delivered staffing business due to lower demand. This decrease was partially offset by growthexpenses to support lower volumes in the BPO, CWOour staffing and RPO practice areas due primarily to the expansion of programs with existing customers and, to a lesser extent, new customer programs. The 53rd week in 2015 added approximately 1% to 2015 revenue in GTS. GTS revenue represented 38% of total Company revenue in 2016 and 36% in 2015.
Total SG&A expenses in Science, Engineering & Technology increased 19.2%, and includes the impact of the acquisition of Softworld in the second quarter of 2021. Excluding the impact of the addition of Softworld expenses in the first quarter of 2022, SG&A expenses increased 13.6%. The increase in organic SG&A expenses is due primarily to higher performance-based incentive compensation expense and higher salary-related costs from increasing headcount.
Total SG&A expenses in Education increased 31.7%, and includes the impact of the acquisition of PTS in May 2022. Excluding the impact of the PTS acquisition, SG&A expenses increased 24.0%, due primarily to higher salary-related expenses as headcount has increased as revenues have grown.
Total SG&A expenses in Outsourcing & Consulting increased 22.1%, and includes the impact of the acquisition of RocketPower in March 2022. Excluding the impact of the RocketPower acquisition, SG&A expenses increased 12.0%, due primarily to higher salary-related expenses as headcount has increased as revenues have grown.
Total SG&A expenses in International decreased 4.6% on a reported basis and increased 3.6% on a constant currency basis. The increase in constant currency was primarily a resultdue to higher salary-related expenses driven by an increase in headcount, reflecting improving revenue in Europe, partially offset by the impact of costs relatedthe sale of our Russian operations in July 2022.
Corporate expenses increased 6.6%, primarily due to additional sales resources, costs associated with increased volume with existing customers and implementation of new business, including salaries andhigher performance-based incentive compensation and bad debt expense. The bad debt expense was primarily related to certain aged accounts receivable at a subsidiary in Germany.
27
Operating Results By Segment (continued)
(Dollars in millions)
| 2016 (52 Weeks) | 2015 (53 Weeks) | Change | CC Change | |||||||||||
| Revenue from services | $ | 1,127.1 | $ | 1,332.7 | (15.4 | )% | (12.7 | )% | ||||||
| Gross profit | 166.4 | 199.0 | (16.3 | ) | (14.0 | ) | ||||||||
| SG&A expenses excluding restructuring charges | 145.7 | 175.7 | (17.0 | ) | (14.3 | ) | ||||||||
| Restructuring charges | 1.2 | — | NM | NM | ||||||||||
| Total SG&A expenses | 146.9 | 175.7 | (16.4 | ) | (13.7 | ) | ||||||||
| Earnings from operations | 19.5 | 23.3 | (16.2 | ) | ||||||||||
| Earnings from operations excluding restructuring charges | 20.7 | 23.3 | (11.4 | ) | ||||||||||
| Gross profit rate | 14.8 | % | 14.9 | % | (0.1 | ) | pts. | |||||||
| Conversion rate | 11.7 | 11.7 | — | |||||||||||
| Conversion rate excluding restructuring charges | 12.4 | 11.7 | 0.7 | |||||||||||
| Return on sales | 1.7 | 1.7 | — | |||||||||||
| Return on sales excluding restructuring charges | 1.8 | 1.7 | 0.1 | |||||||||||
| 2022 | 2021 | % Change | |||||||||||||||||||||||||||||||||||||||
| Earnings (Loss) from Operations: | |||||||||||||||||||||||||||||||||||||||||
| Professional & Industrial | $ | 32.0 | $ | 31.4 | 1.8 | % | |||||||||||||||||||||||||||||||||||
| Science, Engineering & Technology | 82.1 | 73.7 | 11.4 | ||||||||||||||||||||||||||||||||||||||
| Education | 18.5 | 3.0 | NM | ||||||||||||||||||||||||||||||||||||||
| Outsourcing & Consulting | (21.2) | 18.7 | NM | ||||||||||||||||||||||||||||||||||||||
| International | 9.9 | 9.9 | (0.5) | ||||||||||||||||||||||||||||||||||||||
| Corporate | (94.0) | (88.1) | (6.6) | ||||||||||||||||||||||||||||||||||||||
| Loss on disposal | (18.7) | — | NM | ||||||||||||||||||||||||||||||||||||||
| Gain on sale of assets | 6.2 | — | NM | ||||||||||||||||||||||||||||||||||||||
| Consolidated Total | $ | 14.8 | $ | 48.6 | (69.7) | % | |||||||||||||||||||||||||||||||||||
2022 vs. 2021
Professional & Industrial reported earnings of $32.0 million, a 1.8% increase from 2021. The increase was due to the transaction to form the PersolKelly Asia Pacific joint venture in the third quartereffective cost management as gross profit declined.
Science, Engineering & Technology reported earnings of 2016, resulting in a 14% decrease in International Staffing revenue$82.1 million, an 11.4% increase from services. This decrease, combined with a 3% decrease in average bill rates (flat on a CC basis) and partially offset by a 2% increase in hours volume in our European operations, accounted for the change in revenue from services.2021. The increase in hours volumeearnings was primarily due to increased customer demandthe impact of the Softworld acquisition. In addition, increases in Portugal. International Staffing represented 21% of total Company revenue in 2016 and 24% in 2015. The 53rd week in 2015 added approximately 1% to 2015 revenue in International Staffing.
Education reported earnings of $18.5 million in 2022, compared to earnings of $3.0 million in 2021. The change was mainly driven by unfavorable customer mix in Switzerland.
Outsourcing & Consulting reported a loss of $21.2 million in 2022, compared to earnings of $18.7 million in 2021, due primarily to a charge of $41.0 million related to the APAC staffing business. Additionally, SG&A expenses decreasedimpairment of goodwill of RocketPower in the EMEA region2022.
International reported earnings of $9.9 million in both 2022 and 2021. The decline in earnings due to effective cost controlthe sale of operations in headquarters expenses across the region. Included in SG&A expenses are restructuring charges of $1.2 million, which reflect a repositioning of the operating model to pursueRussia was nearly offset by growth in staffing fee-based income and specialized temporary staffing business in Italy.most geographies.
28
Results of Operations
Financial Condition
Historically, we have financed our operations through cash generated by operating activities and access to credit markets. Our working capital requirements are primarily generated from temporary employee payroll, which is generally paid weekly or monthly, and customer accounts receivable.receivable, which is generally outstanding for longer periods. Since receipts from customers generally lag payroll paid to temporary employees, working capital requirements increase substantially in periods of growth. Conversely, when economic activity slows, working capital requirements may substantially decrease. This may result in an increase in our operating cash flows; however, any such increase would not be sustainable in the event that an economic downturn continued for an extended period.
As highlighted in the consolidated statements of cash flows, our liquidity and available capital resources are impacted by four key components: cash, cash equivalents and equivalents,restricted cash, operating activities, investing activities and financing activities.
Cash, Cash Equivalents and Restricted Cash
Cash, cash equivalents and restricted cash totaled $32.5$162.4 million at year-end 2017,2022, compared to $29.6$119.5 million at year-end 2016.2021. As further described below, during 2017,2022, we used $76.3 million of cash for operating activities, generated $71.2$167.5 million of cash from operatinginvesting activities and used $61.0$50.6 million of cash for investing activities and used $3.4 million in cash for financing activities.
Operating Activities
In 2017,2022, we generated $71.2used $76.3 million of net cash fromfor operating activities, as compared to generating $39.6$85.0 million in 20162021 and generating $25.3$186.0 million in 2015. 2020. Net cash used for operating activities in 2022 and 2021 included $86.8 million and $29.7 million, respectively, of cash outflows related to the repayment of U.S. payroll taxes originally deferred in 2020. Net cash from operating activities in 2020 benefited from the deferral of $117.0 million of U.S. payroll taxes. In addition, in 2022 we paid $48.4 million of income taxes related to the sale of Persol Holdings common stock.
The change from 20162021 to 20172022 was primarily driven bydue to the impact of payments related to the payroll tax deferral, income tax payments related to the sale of Persol Holdings common stock and increased working capital requirements. Trade accounts receivable totaled $1.5 billion at year-end 2022 and $1.4 billion at year-end 2021. Global DSO for the fourth quarter was 61 days for 2022, compared to 60 days for 2021. Accounts payable and accrued liabilities was $723.3 million and increased from year-end 2021 as a decrease in performance based compensationresult of increased MSP supplier payables. The change from 2020 to 2021 was primarily due to the deferral of payroll tax payments, partially offset by the impact of higher DSO as discussed below. The change from 2015 to 2016 was primarily due to lower growth in trade accounts receivable.global DSO.
Our working capital position (total current assets less total current liabilities) was $458.1$586.4 million at year-end 2017,2022, an increase of $14.6$92.9 million from year-end 2016.2021. Excluding the increase in cash, working capital increased $51.9 million from year-end 2021. The current ratio (total current assets divided by total current liabilities) was 1.5 at year-end 20172022 and 1.6 at year-end 2016.2021.
Investing Activities
In 2017,2022, we used $61.0generated $167.5 million of net cash forfrom investing activities, compared to generating $10.3using $180.7 million in 20162021 and using $17.6generating $9.8 million in 2015. 2020. Included in cash generated from investing activities in 2022 is $196.9 million of proceeds from the sale of the investment in Persol Holdings, $119.5 million of proceeds from the sale of almost all of the Company's shares in our equity investment in PersolKelly and $10.1 million of proceeds from the sale of land and other real property. This was partially offset by $58.3 million of cash used for the acquisition of RocketPower in March 2022, net of cash received, $84.8 million of cash used for the acquisition of PTS in May 2022, net of cash received, and $6.0 million of cash disposed from the sale of our operations in Russia in July 2022, net of proceeds.
Included in cash used for investing activities in 20172021 is $37.2$213.0 million of cash used for the acquisition of Teachers On Call,Softworld in April 2021, net of cash received and including working capital adjustments. This was partially offset by $19.0 million of proceeds from an insurance settlement that represented a payment received in the cash received. fourth quarter of 2021 related to the settlement of claims under a representations and warranties insurance policy purchased by the Company in connection with the acquisition of Softworld.
Included in cash generated from investing activities in 20162020 is $23.3$55.5 million of net cashproceeds representing the cash received, lessnet of transaction expenses, for the sale of three headquarters properties as a part of a sale and leaseback transaction and $5.6 million received from a payment on the loans to PersolKelly Pte. Ltd. This was partially offset by cash used for the acquisitions of
29
Insight in January 2020 and Greenwood/Asher in November 2020. Cash used for the acquisition of Insight totaled $36.4 million, net of the cash deconsolidated relating toreceived and including working capital adjustments. Cash used for the PersolKelly Asia Pacific joint venture transaction. acquisition of Greenwood/Asher totaled $2.8 million, net of the cash received and including working capital adjustments.
Capital expenditures which totaled $24.6$12.0 million in 2017, $12.72022, $11.2 million in 20162021 and $16.9$15.5 million in 2015, were2020. Capital expenditures in both 2022 and 2021 primarily related to the Company’sCompany's IT infrastructure, technology programs. The increase reflects higher spending for technology programs and headquarters furniture and fixtures. Capital expenditures in 2020 primarily related to the Company's headquarters leasehold improvements, IT infrastructure and headquarters building improvements in 2017 as compared to 2016.technology programs.
Financing Activities
In 2017,2022, we used $3.4$50.6 million of cash for financing activities, as compared to using $69.1$8.1 million in 2016both 2021 and using $44.0 million2020. The change in 2015. Changes in net cash fromused for financing activities arewas primarily related to short-term borrowing activities. Debt totaled $10.2 million at year-end 2017 and was zero at year-end 2016. Debt-to-total capital (total debt reported on the balance sheet divided by total debt plus stockholders’ equity) is a common ratio to measure the relative capital structure and leveragebuyback of the Company. Our ratioCompany's common shares held by Persol Holdings for $27.2 million in February 2022, $7.8 million in share repurchases of debt-to-total capital was 0.9% at year-end 2017the Company's Class A common stock in the fourth quarter of 2022 and 0.0% at year-end 2016.
dividend payments. Dividends paid per common share were $0.30 in 2017, $0.275 in 20162022, $0.10 in 2021 and $0.20$0.075 in 2015.2020. Payments of dividends are restricted by the financial covenants contained in our debt facilities. Details of this restriction are contained in the Debt footnote in the notes to our consolidated financial statements.
Changes in net cash from financing activities are also impacted by short-term borrowing activities. Debt totaled $0.7 million at year-end 2022, which represented local borrowings, compared to no debt at year-end 2021. Debt-to-total capital (total debt reported in the consolidated balance sheet divided by total debt plus stockholders’ equity) is a common ratio to measure the relative capital structure and leverage of the Company. Our ratio of debt-to-total capital was 0.1% at year-end 2022 and 0.0% at year-end 2021.
In 2022, the net change in short-term borrowings was primarily due to borrowings on local lines of credit. In 2021 and 2020, the net change in short-term borrowings was primarily due to payments on local lines of credit.
Contractual Obligations and Commercial Commitments
Summarized below are our obligations and commitments to make future payments as of year-end 2017:2022:
| Payment due by period | ||||||||||||||||||||||||||||||||||||||||||||||||
| Payment due by period | Total | Less than 1 year | 1-3 Years | 3-5 Years | More than 5 years | |||||||||||||||||||||||||||||||||||||||||||
| Total | Less than 1 year | 1-3 Years | 3-5 Years | More than 5 years | (In millions of dollars) | |||||||||||||||||||||||||||||||||||||||||||
| (In millions of dollars) | ||||||||||||||||||||||||||||||||||||||||||||||||
| Operating leases | $ | 82.8 | $ | 25.9 | $ | 34.4 | $ | 16.2 | $ | 6.3 | ||||||||||||||||||||||||||||||||||||||
| Leases | Leases | $ | 85.9 | $ | 19.1 | $ | 23.3 | $ | 13.2 | $ | 30.3 | |||||||||||||||||||||||||||||||||||||
| Short-term borrowings | 10.2 | 10.2 | — | — | — | Short-term borrowings | 0.7 | 0.7 | — | — | — | |||||||||||||||||||||||||||||||||||||
| Accrued insurance | 75.6 | 25.7 | 23.5 | 9.8 | 16.6 | |||||||||||||||||||||||||||||||||||||||||||
| Accrued workers’ compensation | Accrued workers’ compensation | 63.6 | 22.9 | 19.1 | 8.3 | 13.3 | ||||||||||||||||||||||||||||||||||||||||||
| Accrued retirement benefits | 193.2 | 15.5 | 31.1 | 30.4 | 116.2 | Accrued retirement benefits | 197.5 | 23.4 | 46.7 | 46.9 | 80.5 | |||||||||||||||||||||||||||||||||||||
| Other long-term liabilities | 8.5 | 1.7 | 3.1 | 1.7 | 2.0 | |||||||||||||||||||||||||||||||||||||||||||
| Other liabilities | Other liabilities | 7.4 | 2.2 | 4.2 | 0.6 | 0.4 | ||||||||||||||||||||||||||||||||||||||||||
| Uncertain income tax positions | 1.4 | 0.1 | 0.5 | 0.3 | 0.5 | Uncertain income tax positions | 0.6 | 0.2 | 0.3 | 0.1 | — | |||||||||||||||||||||||||||||||||||||
| Purchase obligations | 31.8 | 20.4 | 11.1 | 0.3 | — | Purchase obligations | 53.0 | 32.9 | 20.1 | — | — | |||||||||||||||||||||||||||||||||||||
| Total | $ | 403.5 | $ | 99.5 | $ | 103.7 | $ | 58.7 | $ | 141.6 | Total | $ | 408.7 | $ | 101.4 | $ | 113.7 | $ | 69.1 | $ | 124.5 | |||||||||||||||||||||||||||
Purchase obligations above represent unconditional commitments relating primarily to technology services and online tools and voice and data communications services which we expect to utilize generally within the next twothree fiscal years, in the ordinary course of business. We have no material, unrecorded commitments, losses, contingencies or guarantees associated with any related parties or unconsolidated entities.
30
Liquidity
We expect to meet our ongoing short-term and long-term cash requirements principally through cash generated from operations, available cash and equivalents, securitization of customer receivables and committed unused credit facilities. Additional funding sources could include public or private bonds, asset-based lending, additional bank facilities issuanceor sale of equity or other sources.non-core assets. To meet significant cash requirements related to our nonqualified retirement plan, we may utilize proceeds from Company-owned life insurance policies. During 2020, cash generated from operations was supplemented by the deferral of payments of the Company's U.S. social security taxes as allowed by the Coronavirus Aid, Relief, and Economic Security Act. We have repaid the $117.0 million deferred payroll tax balances, including $29.5 million in the first quarter of 2022 and $57.3 million in the fourth quarter of 2022.
We utilize intercompany loans, dividends, capital contributions and redemptions to effectively manage our cash on a global basis. We periodically review our foreign subsidiaries’ cash balances and projected cash needs. As part of those reviews, we may identify cash that we feel should be repatriated to optimize the Company’s overall capital structure. As of the 20172022 year end, these reviews have not resulted in any specific plans to repatriate a majority of our international cash balances. We expect much of our international cash will be needed to fund working capital growth in our local operations. The majorityoperations as working capital needs, primarily trade accounts receivable, increase during periods of our international cash is concentrated in agrowth. A cash pooling arrangement (the “Cash Pool”) and is available to fund general corporate needs internationally. The Cash Pool is a set of cash accounts maintained with a single bank that must, as a whole, maintain at least a zero balance; individual accounts may be positive or negative. This allows countries with excess cash to invest and countries with cash needs to utilize the excess cash.
At year-end 2022, we had $200.0 million of available capacity on our $200.0 million revolving credit facility and $100.5 million of available capacity on our $150.0 million securitization facility. The securitization facility carried no short-term borrowings and $49.5 million of standby letters of credit related to workers’ compensation. Together, the revolving credit and securitization facilities provide the Company with committed funding capacity that may be used for general corporate purposes subject to financial covenants and restrictions. While we believe these facilities will cover our working capital needs over the short term, if economic conditions or operating results change significantly from our current expectations, we may need to seek additional sources of funds. Throughout 2022 and as of the 2022 year end, we met the debt covenants related to our revolving credit facility and securitization facility.
At year-end 2022, we also had additional unsecured, uncommitted short-term credit facilities totaling $5.9 million, under which we had $0.7 million of borrowings. Details of our debt facilities as of the 2022 year end are contained in the Debt footnote in the notes to our consolidated financial statements.
We managehave historically managed our cash and debt very closely to optimize our capital structure. As our cash balances build, we tend to pay down debt as appropriate. Conversely, when working capital needs grow, we tend to use corporate cash and cash available in the Cash Pool first, and then access our borrowing facilities.
In February 2022, we metcompleted transactions to monetize a substantial portion of our assets in the debt covenants relatedAsia-Pacific region which will allow us to strategically redeploy resources to accelerate our growth. Specifically, we concluded our cross-shareholding arrangement with Persol Holdings and reduced our ownership interest in PersolKelly, our APAC joint venture. We sold our investment in Persol Holdings common stock in an open-market transaction. We repurchased the 1.6 million Kelly Class A and 1,475 Kelly Class B common shares owned by Persol Holdings at a price based on the last five trading days prior to the transaction. We sold almost all of our ownership interest in PersolKelly to our revolving credit facility and securitization facility.
We monitor the credit ratings of our major banking partners on a regular basis and have regular discussions with them. Based on our reviews and communications, we believe the risk of one or more of our banks not being able to honor commitments is insignificant. We also review the ratings and holdings of our money market funds and other investment vehicles regularly to ensure high credit quality and access to our invested cash.
31
Critical Accounting Estimates
We prepare our consolidated financial statements in conformity with accounting principles generally accepted in the United States. In this process, it is necessary for us to make certain assumptions and related estimates affecting the amounts reported in the consolidated financial statements and the attached notes. Actual results can differ from assumed and estimated amounts.
Critical accounting estimates are those that we believe require the most difficult, subjective or complex judgments, often as a result of the need to make estimates about the effect of matters that are inherently uncertain. We base our estimates on historical experience and on various other assumptions we believe to be reasonable under the circumstances, the results of which form the basis for making judgments about the carrying value of assets and liabilities that are not readily apparent from other sources. Judgments and uncertainties affecting the application of those estimates may result in materially different amounts being reported under different conditions or using different assumptions. We consider the following estimates to be most critical in understanding the judgments involved in preparing our consolidated financial statements.
Workers’ Compensation
In the U.S., we have a combination of insurance and self-insurance contracts under which we effectively bear the first $1.0 million of risk per single accident. There is no aggregate limitation on our per-accident exposure under these insurance and self-insurance programs. We establish accruals for workers’ compensation utilizing actuarial methods to estimate the undiscounted future cash payments that will be made to satisfy the claims, including an allowance for incurred-but-not-reported claims. We retain an independent consulting actuary to establish ultimate loss forecasts for the current and prior accident years of our insurance and self-insurance programs. The consulting actuary establishes loss development factors and loss rates, based on our historical claims experience as well as industry experience, and applies those factors to current claims information to derive an estimate of our ultimate claims liability. In preparing the estimates, the consulting actuary may consider factors such as the nature, frequency and severity of the claims; reserving practices of our third party claims administrators; performance of our medical cost management and return to work programs; changes in our territory and business line mix; and current legal, economic and regulatory factors such as industry estimates of medical cost trends. Where appropriate, multiple generally accepted actuarial techniques are applied and tested in the course of preparing the loss forecast. We use the ultimate loss forecasts, as developed by the consulting actuary, to establish total expected program costs for each accident year by adding our estimates of non-loss costs such as claims handling fees and excess insurance premiums. When claims exceed the applicable loss limit or self-insured retention and realization of recovery of the claim from existing insurance policies is deemed probable, we record a receivable from the insurance company for the excess amount.
We evaluate the accrual quarterly throughout the year and make adjustments as needed. The ultimate cost of these claims may be greater than or less than the established accrual. While we believe that the recorded amounts are reasonable, there can be no assurance that changes to our estimates will not occur due to limitations inherent in the estimation process. In the event we determine that a smaller or larger accrual is appropriate, we would record a credit or a charge to cost of services in the period in which we made such a determination. The accrual for workers’ compensation, net of related receivables which are included in prepaid expenses and other current assets and other assets in the consolidated balance sheet, was $59.4$43.3 million and $59.7$48.4 million at year-end 20172022 and 2016,2021, respectively.
Business Combinations
We account for business combinations using the acquisition method of accounting, in which the purchase price is allocated for assets acquired and liabilities assumed and recorded at the estimated fair values at the date of acquisition. Any excess of the purchase price over the estimated fair values of the net assets acquired is recorded as goodwill. Management is required to make significant assumptions and estimates in determining the fair value of the assets acquired, particularly intangible assets. Purchased intangible assets are primarily comprised of acquired trade names and customer relationships that are recorded at fair value at the date of acquisition. We utilize third-party valuation specialists to assist us in the determination of the fair value of the intangibles. The fair value of trade name intangibles is determined using the relief-from-royalty method, which relies on the use of estimates and assumptions about projected revenue growth rates, royalty rates and discount rates. The fair value of customer relationship intangibles is determined using the multi-period excess earnings method, which relies on the use of estimates and assumptions about projected revenue growth rates, customer attrition rates, profit margins and discount rates. Determining the useful lives of intangible assets also requires judgment and are inherently uncertain. There is a measurement period of up to one year in which to finalize the fair value determinations and preliminary fair value estimates may be revised if new information is obtained during this period.
32
Income Taxes
Income tax expense is based on expected income and statutory tax rates in the various jurisdictions in which we operate. Judgment is required in determining our income tax expense. We establish accruals for uncertain tax positions under generally accepted accounting principles, which require that a position taken or expected to be taken in a tax return be recognized in the consolidated financial statements when it is more likely than not (i.e., a likelihood of more than fifty percent) the position would be sustained upon examination by tax authorities who have full knowledge of all relevant information. A recognized tax position is then measured at the largest amount of benefit that is greater than fifty percent likely of being realized upon ultimate settlement.
Our effective tax rate includes the impact of accruals and changes to accruals that we consider appropriate, as well as related interest and penalties. A number of years may lapse before a particular matter, for which we have or have not established an accrual, is audited and finally resolved. While it is often difficult to predict the final outcome or the timing of resolution of any particular tax matter, we believe that our accruals are appropriate under generally accepted accounting principles. Favorable or unfavorable adjustments of the accrual for any particular issue would be recognized as an increase or decrease to our income
tax expense in the period of a change in facts and circumstances. Our current tax accruals are presented in income and other taxes in the consolidated balance sheet within income and other taxes and long-term tax accruals are presented in other long-term liabilities in the consolidated balance sheet within other long-term liabilities. sheet.
Tax laws require items to be included in the tax return at different times than the items are reflected in the consolidated financial statements. As a result, the income tax expense reflected in our consolidated financial statements is different than the liability reported in our tax return. Some of these differences are permanent, which are not deductible or taxable on our tax return, and some are temporary differences, which give rise to deferred tax assets and liabilities. Deferred tax assets generally represent items that can be used as a tax deduction or credit in our tax return in future years for which we have already recorded the tax benefit in our consolidated income statement. We establish valuation allowances for our deferred tax assets when the amount of expected future taxable income is not likely to support the use of the deduction or credit. Deferred tax liabilities generally represent items for which we have already taken a deduction on our tax return, but have not yet recognized as expense in our consolidated financial statements. Our net deferred tax asset is recorded using currently enacted tax laws, and may need to be adjusted in the event tax laws change.
The U.S. work opportunity credit is allowed for wages earned by employees in certain targeted groups. The actual amount of creditable wages in a particular period is estimated, since the credit is only available once an employee reaches a minimum employment period and the employee’s inclusion in a targeted group is certified by the applicable state. As these events often occur after the period the wages are earned, judgment is required in determining the amount of work opportunity credits accrued for in each period. We evaluate the accrual regularly throughout the year and make adjustments as needed.
We test goodwill for impairment annually and whenever events or circumstances make it more likely than not that an impairment may have occurred. Generally accepted accounting principles requireGAAP requires that goodwill be tested for impairment at a reporting unit level. WeFor segments with a goodwill balance, we have determined that our reporting units are the same as our operating and reportable segments. Ifsegments based on our organizational structure or one level below our operating segments (the component level).
We may first use a qualitative assessment ("step zero test") for the annual impairment test if we have determined that it is more likely than not that the fair value for one or more reporting units is greater than their carrying value. In conducting the qualitative assessment, we assess the totality of relevant events and circumstances that affect the fair value or carrying value of the reporting unit. Such events and circumstances may include macroeconomic conditions, industry and market conditions, cost factors, overall financial performance, entity-specific events and events affecting a reporting unit.
If we may use aelect to forgo the qualitative assessment for the annual impairment test.
For the step one quantitative test, we determine the fair value of our reporting units we primarily relied on anusing the income approach. Under the income approach, estimated fair value is determined based on estimated future cash flows discounted by an estimated market participant weighted-average cost of capital, which reflects the overall level of inherent risk of the reporting unit being measured. Estimated future cash flows are based on our internal projection model.model and reflects management’s outlook for the reporting units. Assumptions and estimates about future cash flows and discount rates are complex and often subjective. They can be affected by a variety of factors, including external factors such as industry and economic trends, and internal factors such as changes in our business strategy and our internal forecasts.
33
The goodwill resulting from the estimated fair valueacquisition of a reporting unit, a second stepRocketPower during the first quarter of the impairment test is performed in order to determine the implied fair value of a reporting unit’s goodwill. Determining the implied fair value of goodwill requires valuation of a reporting unit’s tangible and intangible assets and
We completed our annual impairment test for all reporting units with goodwill in the fourth quarter for the fiscal year ended 2017 and 2016 and determined that goodwill was not impaired. In 2017, we elected to perform2022. We performed a step one quantitative assessmenttest for the Americas StaffingSoftworld and GTSPTS reporting units. In 2016,As a result of the quantitative assessment, we electeddetermined that the estimated fair value of the Softworld and PTS reporting units was more than its carrying value. Additionally, we performed a step zero qualitative analysis for the Education and RocketPower reporting units to performdetermine whether a further quantitative analysis was necessary and concluded that a step one quantitative assessmentanalysis was not necessary at that time. As a result of the quantitative and qualitative assessments, the Company determined goodwill related to these reporting units was not impaired at that time.
During 2022, customers within the high-tech industry vertical, in which RocketPower specializes, reduced or eliminated their full-time hiring, reducing demand for RocketPower's services, and on-going economic uncertainty has more broadly impacted the growth in demand for RPO in the near-term. These changes in market conditions therefore caused a triggering event requiring an interim impairment test for goodwill as of the third quarter of 2022. Job eliminations in the high-tech industry vertical continued during the fourth quarter of 2022, indicating a broad, sustained reduction in hiring was likely and is now expected to last through much of 2023, directly impacting RocketPower and the demand for RocketPower's services in this vertical. These changes in market conditions caused another triggering event requiring an interim impairment test for goodwill as of year-end 2022.
We performed an interim step one quantitative test for RocketPower’s goodwill and determined that the estimated fair value of the reporting unit no longer exceeded the carrying value as of third quarter-end and year-end 2022. Based on the result of our previous Americas Commercial, Americas PTinterim goodwill impairment test, we recorded a goodwill impairment charge of $30.7 million in the third quarter of 2022 and OCG reporting units.we recorded an additional goodwill impairment charge of $10.3 million to write off the remaining balance of RocketPower’s goodwill in the fourth quarter of 2022, for a total goodwill impairment charge of $41.0 million as of year-end 2022.
Our step one analysis used significant assumptions, by segment, including: expected future revenue and expense growth rates, profit margins cost of capital,and discount rate and forecasted capital expenditures.rate. Although we believe the assumptions and estimates we have made are reasonable and appropriate, different assumptions and estimates could materially impact our reported financial results. Different assumptions of the anticipated future results and growth from these businessesour business could result in an impairment charge, which would decrease operating income and result in lower asset values on our consolidated balance sheet. The estimated fair value of the Softworld and PTS reporting units exceeds the carrying value by more than 10%. As a measure of sensitivity bothof the fair value for the Softworld and PTS reporting units, havewhile holding all other assumptions constant, an estimated fair value that is at least doubleincrease in the carrying valuediscount rate of 100 basis points or a decrease of 100 basis points in 2017. In addition, reducing ourthe revenue growth rate assumptions by more than 100%for each forecasted period used to determine the fair value of both reporting units would not result in an impairment of goodwill.
We completed our annual impairment test for all reporting units with goodwill in the fourth quarter for the fiscal year ended 2021. We performed a step one quantitative test for the Softworld reporting unit. As a result of the quantitative assessment, we determined that the estimated fair value falling below book valueof the Softworld reporting unit was more than its carrying value. Additionally, we performed a step zero qualitative analysis for boththe Education reporting units.unit to determine whether a further quantitative analysis was necessary and concluded that a step one quantitative analysis was not necessary. As a result of the quantitative and qualitative assessments, the Company determined goodwill was not impaired as of year-end 2021.
At year-end 20172022 and 2016,2021, total goodwill amounted to $107.1$151.1 million and $88.4$114.8 million, respectively (seerespectively. See the Goodwill and Intangible Assets footnote in the notes to our consolidated financial statements).statements for more information.
34
Litigation
Kelly is subject to legal proceedings, investigations and claims arising out of the normal course of business. Kelly routinely assesses the likelihood of any adverse judgments or outcomes to these matters, as well as ranges of probable losses. A determination of the amount of the accruals required, if any, for these contingencies is made after analysis of each known issue. Development of the analysis includes consideration of many factors including: potential exposure, the status of proceedings, negotiations, discussions with our outside counsel and results of similar litigation and, in the case of class action lawsuits, participation rates.litigation. The required accruals may change in the future due to new developments in each matter. For further discussion, see the Contingencies footnote in the notes to our consolidated financial statements. At year-end 20172022 and 2016,2021, the gross accrual for litigation costs amounted to $5.3$2.3 million and $9.2$1.4 million, respectively, which areis included in accounts payable and accrued liabilities and in accrued workers’ compensation and other claims in the consolidated balance sheet.
NEW ACCOUNTING PRONOUNCEMENTS
See New Accounting Pronouncements footnote in the notes to our consolidated financial statements presented in Part II, Item 8 of this report for a description of new accounting pronouncements.
35
CAUTIONARY NOTE REGARDING FORWARD-LOOKING STATEMENTS
Certain statements contained herein and in this reportour investor conference call related to these results are “forward-looking” statements within the meaning of the Private Securities Litigation Reform Actapplicable securities laws and regulations. These forward-looking statements are based on current expectations and assumptions and are subject to a number of 1995.significant risks and uncertainties. Forward-looking statements include statements which are predictive in nature, which depend upon or refer to future events or conditions, or which include words such as “expects,” “anticipates,” “intends,” “plans,” “believes,” “estimates,” or variations or negatives thereof or by similar or comparable words or phrases. In addition, any statements concerning future financial performance (including future revenues, earnings or growth rates), ongoing business strategies or prospects, and possible future actions by us that may be provided by management, including oral statements or other written materials released to the public, are also forward-looking statements. Forward-looking statements are based on current expectations and projections about future events and are subject to risks, uncertainties and assumptions about our Company and economic and market factors in the countries in which we do business, among other things. These statements are not guarantees of future performance, and we have no specific intention to update these statements.
Actual events and results may differ materially from those expressed or forecasted in forward-looking statements due to a number of factors. The principal important risk factors that could cause our actual performance and future events and actions to differ materially from such forward-looking statements include, but are not limited to, changing market and economic conditions, the impact of the novel coronavirus (COVID-19) outbreak, competitive market pressures including pricing and technology introductions and disruptions, changingdisruption in the labor market and economic conditions,weakened demand for human capital resulting from technological advances, competition law risks, the impact of changes in laws and regulations (including federal, state and international tax laws), unexpected changes in claim trends on workers’ compensation, unemployment, disability and medical benefit plans, or the risk of additional tax liabilities in excess of our estimates, our ability to achieve our business strategy, the risk of damage to our brand, the risk our intellectual property assets could be infringed upon or compromised, our ability to successfully develop new service offerings, our exposure to risks associated with services outside traditional staffing, including business process outsourcing, our increasing dependency on third parties for the execution of critical functions, the risks associated with past and future acquisitions, exposure to risks associated with investments in equity affiliates including PersolKelly Asia Pacific, material changes in demand from or loss of large corporate customers as well as changes in their buying practices, risks particular to doing business with the government or government contractors, the risk of damage to our brands, our exposure to risks associated with services outside traditional staffing, including business process outsourcing, services of licensed professionals and services connecting talent to independent work, our increasing dependency on third parties for the execution of critical functions, our ability to effectively implement and manage our information technology strategy, the risks associated with past and future acquisitions, including risk of related impairment of goodwill and intangible assets, exposure to risks associated with certain equity investments, including with strategic partners, risks associated with conducting business in foreign countries, including foreign currency fluctuations, risks associated with violations of anti-corruption, trade protection and other laws and regulations, availability of qualified full-time employees, availability of temporary workers with appropriate skills required by customers, liabilities for employment-related claims and losses, including class action lawsuits and collective actions, our ability to sustain critical business applications through our key data centers, risks arising from failure to preserve the privacy of information entrusted to us or to meet our obligations under global privacy laws, the risk of cyber attackscyberattacks or other breaches of network or information technology security, our ability to sustain critical business applications throughrealize value from our key data centers, our ability to effectively implementtax credit and manage our information technology projects, our ability to maintain adequate financial and management processes and controls, risk of potential impairment charges triggered by adverse industry developments or operational circumstances, unexpected changes in claim trends on workers’ compensation, unemployment, disability and medical benefit plans, the impact of changes in laws and regulations (including federal, state and international tax laws), competition law risks, the risk of additional tax or unclaimed property liabilities in excess of our estimates,net operating loss carryforwards, our ability to maintain specified financial covenants in our bank facilities to continue to access credit markets, and other risks, uncertainties and factors discussed in this report and in our other filings with the Securities and Exchange Commission. Actual results may differ materially from any forward lookingforward-looking statements contained herein, and we haveundertake no intentionduty to update these statements. any forward-looking statement to conform the statement to actual results or changes in the Company’s expectations. Certain risk factors are discussed more fully under “Risk Factors” in Part I, Item 1A of this report.
ITEM 7A. QUANTITATIVE AND QUALITATIVE DISCLOSURES ABOUT MARKET RISK.
We are exposed to foreign currency risk primarily related to our foreign subsidiaries. Exchange rates impact the U.S. dollar value of our reported earnings, our investments in and held by subsidiaries, local currency denominated borrowings and intercompany transactions with and between subsidiaries. Our foreign subsidiaries primarily derive revenues and incur expenses within a single country and currency which, as a result, provide a natural hedge against currency risks in connection with normal business operations. Accordingly, changes in foreign currency rates vs. the U.S. dollar, euro or Swiss franc generally do not impact local cash flows. Intercompany transactions which create transactional foreign currency risk include services, royalties, loans, contributions and distributions.
In addition, we are exposed to interest rate risks through our use of the multi-currency line of credit and other borrowings. A hypothetical fluctuation of 10% of market interest rates would not have had a material impact on 20172022 earnings.
We are exposed to market risk as a result of our obligation to pay benefits under our nonqualified deferred compensation plan and our related investments in company-owned variable universal life insurance policies. The obligation to employees increases and decreases based on movements in the equity and debt markets. The investments in mutual funds, as part of the
36
company-owned variable universal life insurance policies, are designed to mitigate, but not eliminate, this risk with offsetting gains and losses.
ITEM 8. FINANCIAL STATEMENTS AND SUPPLEMENTARY DATA.
The financial statements and supplementary data required by this Item are set forth in the accompanying index on page 4642 of this filing and are presented in pages 47-81.43-95.
ITEM 9. CHANGES IN AND DISAGREEMENTS WITH ACCOUNTANTS ON ACCOUNTING AND FINANCIAL DISCLOSURE.
ITEM 9A. CONTROLS AND PROCEDURES.
Conclusion Regarding the Effectiveness of Disclosure Controls and Procedures
Based on their evaluation as of the end of the period covered by this report, our Chief Executive Officer and Chief Financial Officer have concluded that our disclosure controls and procedures (as defined in Rules 13a-15(e) and 15d-15(e) under the Securities Exchange Act of 1934) are effective at a reasonable assurance level.
Management’s Report on Internal Control Over Financial Reporting
Management’s report on internal control over financial reporting is presented preceding the consolidated financial statements on page 4743 of this report.
Attestation Report of Independent Registered Public Accounting Firm
PricewaterhouseCoopers LLP, independent registered public accounting firm, has audited the effectiveness of our internal control over financial reporting as of December 31, 2017,January 1, 2023, as stated in their report which appears herein.
Changes in Internal Control Over Financial Reporting
There were no changes in our internal control over financial reporting that occurred during our fourth fiscal quarter that have materially affected, or are reasonably likely to materially affect, our internal control over financial reporting.
ITEM 9B. OTHER INFORMATION.
None.
ITEM 9C. DISCLOSURE REGARDING FOREIGN JURISDICTIONS THAT PREVENT INSPECTIONS.
Not applicable.
37
PART III
Information required by Part III with respect to Directors, Executive Officers and Corporate Governance (Item 10), Executive Compensation (Item 11), Security Ownership of Certain Beneficial Owners and Management and Related Stockholder Matters (Item 12), Certain Relationships and Related Transactions, and Director Independence (Item 13) and Principal Accounting Fees and Services (Item 14), except as set forth under the titles “Executive Officers of the Registrant,” which is included on page 40,pages 38-39, and “Code of Business Conduct and Ethics,” which is included on page 41,40, (Item 10), and except as set forth under the title “Equity Compensation Plan Information,” which is included on pages 41-42,page 40, (Item 12), is to be included in a definitive proxy statement filed not later than 120 days after the close of our fiscal year and the proxy statement, when filed, is incorporated in this report by reference.
ITEM 10. EXECUTIVE OFFICERS OF THE REGISTRANT.
The following individuals serve as executive officers of the Company as of December 31, 2017:January 1, 2023:
| Name/Office | Age | Served as an Officer Since | Business Experience During Last 5 Years | |||||||||||||||||
Peter W. Quigley President and Chief Executive Officer | 61 | 2004 | Served as officer of the Company. | |||||||||||||||||
Olivier G. Thirot Executive Vice President and Chief Financial Officer | 61 | 2008 | Served as officer of the Company. | |||||||||||||||||
Peter M. Boland Senior Vice President Chief Marketing Officer | 58 | 2018 | January 2018 - Present Served as officer of the Company. | |||||||||||||||||
| Amy J. Bouque Senior Vice President Chief People Officer | 54 | 2020 | September 2020 - Present Served as officer of the Company. January 2016 - August 2020 Executive Director - Talent Management - Ally Financial, Detroit Michigan | |||||||||||||||||
Tammy L. Browning Senior Vice President President, KellyOCG | 49 | 2018 | October 2018 - Present Served as officer of the Company. October 2010 - April 2018 SVP Global Operations - Yoh | |||||||||||||||||
Timothy L. Dupree Senior Vice President President, Kelly Professional & Industrial | 46 | 2014 | Served as officer of the Company. | |||||||||||||||||
Dinette Koolhaas Senior Vice President President, Kelly International | 53 | 2008 | Served as officer of the Company. | |||||||||||||||||
38
| Name/Office | Age | Served as an Officer Since | Business Experience During Last 5 Years | |||
George S. Corona President and Chief Executive Officer | 59 | 2000 | Served as officer of the Company. | |||
Teresa S. Carroll Executive Vice President, President, Global Talent Solutions and General Manager - Sales, Marketing and HR | 52 | 2000 | Served as officer of the Company. | |||
Peter W. Quigley Executive Vice President, President, Global Staffing and General Manager - IT, Global Service and Global Business Service | 56 | 2004 | Served as officer of the Company. | |||
| Steven S. Armstrong Senior Vice President and General Manager, U.S. Operations | 60 | 1994 | Served as officer of the Company. | |||
| Hannah S. Lim-Johnson (1) Chief Legal Officer | 46 | 2017 | September 2017 - Present Served as officer of the Company October 2016 - April 2017 Deputy General Counsel, Chief Litigation Counsel & Assistant Corporate Secretary - PSEG, Newark, NJ June 2012 - September 2016 VP, Chief Litigation & Chief Compliance Counsel - ADT Corp, Boca Raton, FL | |||
Olivier G. Thirot Senior Vice President and and Chief Financial Officer | 56 | 2008 | Served as officer of the Company. | |||
Laura S. Lockhart Vice President, Corporate Controller and Chief Accounting Officer | 48 | 2008 | Served as officer of the Company. | |||
| Name/Office | Age | Served as an Officer Since | Business Experience During Last 5 Years | |||||||||||||||||
Daniel Hugo Malan Senior Vice President President, Kelly Science, Engineering & Technology | 53 | 2020 | March 2020 - Present Served as officer of the Company. December 2019 - February 2020 Managing Partner - Talent Capital Advisors August 2018 - November 2019 Chief Operating Officer - Employbridge December 2016 - July 2018 President, Commercial Business - Employbridge | |||||||||||||||||
| Darren L. Simons Senior Vice President and Chief Digital Officer | 52 | 2021 | July 2021 - Present Served as officer of the Company. July 2020 - July 2021 President - RDI Global Solutions May 2019 - July 2020 President - Cielo May 2014 - April 2019 SVP and President - CDI | |||||||||||||||||
Nicola M. Soares Senior Vice President President, Kelly Education | 54 | 2011 | Served as officer of the Company. | |||||||||||||||||
Vanessa P. Williams Senior Vice President General Counsel Assistant Secretary | 51 | 2020 | October 2020 - Present Served as officer of the Company. February 2020 - September 2020 SVP, Division General Counsel- Transportation and Third Party Risk Management and Compliance - IHS Markit December 2016 - February 2020 VP, Division General Counsel - Transportation - IHS Markit | |||||||||||||||||
Laura S. Lockhart Vice President, Corporate Controller and Chief Accounting Officer | 53 | 2008 | Served as officer of the Company. | |||||||||||||||||
39
CODE OF BUSINESS CONDUCT AND ETHICS.
We have adopted a Code of Business Conduct and Ethics that applies to our directors, officers and employees, including our principal executive officer, principal financial officer and principal accounting officer or controller or persons performing similar functions. The Code of Business Conduct and Ethics is included as Exhibit 14 in the Index to Exhibits on page 82.96. We have posted our Code of Business Conduct and Ethics on our website at www.kellyservices.com. We intend to post any changes in or waivers from our Code of Business Conduct and Ethics applicable to any of these officers on our website.
ITEM 12. SECURITIES AUTHORIZED FOR ISSUANCE UNDER EQUITY COMPENSATION PLANS.
Equity Compensation Plan Information
The following table shows the number of shares of our Class A common stock that may be issued upon the exercise of outstanding options, warrants and rights, the weighted-average exercise price of outstanding options, warrants and rights, and the number of securities remaining available for future issuance under our equity compensation plans as of the fiscal year end for 2017.
2022.
| Number of securities to be issued upon exercise of outstanding options, warrants and rights | Weighted-average exercise price of outstanding options, warrants and rights | Number of securities remaining available for future issuance under equity compensation plans (excluding securities reflected in the first column) | ||||||||||||||||||
Equity compensation plans approved by security holders - Fixed Share provision(1), | — | — | 2,705,794 | |||||||||||||||||
Equity compensation plans not approved by security holders | — | — | ||||||||||||||||||
| — | ||||||||
| 2,705,794 | ||||||||
(1)The equity compensation plan approved by our stockholders is our Equity Incentive Plan.
(2)The Fixed Share provision applies to shares granted on and after May 10, 2017, and the amended Equity Incentive Plan provides that the maximum number of shares available for grants, including stock options and restricted stock, was 15 percent of the outstanding Class A common stock, adjusted for plan activity over the preceding five years. The Company has no plans to issue additional shares under the Evergreen provision that was in effect prior to May 10, 2017.The number of shares to be issued upon exercise of outstanding options, warrants and rights under the Evergreen provision excludes: 417,101 shares of restricted stock; performance shares that have been earned but not yet vested totaling 249,827 shares of financial measure performance awards, 216,942 shares of total shareholder return performance awards, and 34,700 shares of single financial measure performance awards; and performance shares granted to employees and not yet earned or vested totaling 574,201 shares of financial measure performance awards and 225,388 shares of total shareholder return performance awards, each calculated using an assumed maximum award performance level of 200%, at December 31, 2017.available for grants is 4,700,000.
SIGNATURES Pursuant to the requirements of Section 13 or 15(d) of the Securities Exchange Act of 1934, registrant has duly caused this report to be signed on its behalf by the undersigned, thereunto duly authorized.
Pursuant to the requirements of the Securities Exchange Act of 1934, this report has been signed below by the following persons on behalf of the registrant and in the capacities and on the dates indicated.
SIGNATURES (continued)
Critical Audit Matters
PricewaterhouseCoopers LLP
The number of shares to be issued upon exercise of outstanding options, warrants and rights under the Fixed Share provision excludes: 22,750607,154 shares of restricted stock; performance shares that have been earned but not yet vested totaling 15,548 of8,388 financial measure performance awards, and 82,996 single financial measure performance awards; and performance shares granted to employees and not
yet earned or vested totaling 74,624893,573 shares of financial measure performance awards, and 37,308 shares of total shareholder return performance awards, each calculated using an assumed maximum award performance level of 200%, where applicable, at December 31, 2017.January 1, 2023.
(3)The Non-Employee Directors Deferred Compensation Plan is an equity compensation plan that has not been approved by our stockholders. This plan provides non-employee directors with the opportunity to defer all or a portion of the fees they receive. Participants may elect to have director fees that are paid in either cash or common stock, deferred into the plan. Participants choose from a list of investment funds as determined by the Company for their deferrals of cash. Deferrals of common stock must remain in common stock. Amounts deferred under the plan are subject to applicable tax withholding. The plan is intended to be a non-qualified deferred compensation arrangement in compliance with Section 409A of the Code. Shares acquired by participants in this plan will be issued from the share reserve stated in the Equity Incentive Plan.
40
PART IV
ITEM 15. EXHIBITS, FINANCIAL STATEMENT SCHEDULES.
(a)The following documents are filed as part of this report:
(i)Financial statements:
Management’s Report on Internal Control Over Financial Reporting
Report of Independent Registered Public Accounting Firm (PCAOB ID 238)
Consolidated Statements of Earnings for the three fiscal years ended December 31, 2017January 1, 2023
Consolidated Statements of Comprehensive Income for the three fiscal years ended December 31, 2017January 1, 2023
Consolidated Balance Sheets at December 31, 2017January 1, 2023 and January 1, 20172, 2022
Consolidated Statements of Stockholders’ Equity for the three fiscal years ended December 31, 2017January 1, 2023
Consolidated Statements of Cash Flows for the three fiscal years ended December 31, 2017January 1, 2023
Notes to Consolidated Financial Statements
(ii)Financial Statement Schedule -
For the three fiscal years ended December 31, 2017:January 1, 2023:
Schedule II - Valuation Reserves
All other schedules are omitted because they are not applicable or the required information is shown in the financial statements or notes thereto.
(iii)The Exhibits are listed in the Index to Exhibits included beginning at page 96, which is incorporated herein by reference.
(b)The Index to Exhibits and required Exhibits are included following the Financial Statement Schedule beginning at page 96 of this filing.
(c)None.
ITEM 16. FORM 10-K SUMMARY.
None.
41
KELLY SERVICES, INC. AND SUBSIDIARIES
INDEX TO FINANCIAL STATEMENTS AND
SUPPLEMENTAL SCHEDULE
Page Reference in Report on Form 10-K | |||||
Consolidated Statements of Earnings for the three fiscal years ended | |||||
Consolidated Statements of Comprehensive Income for the three fiscal years ended | |||||
Consolidated Balance Sheets at January | |||||
Consolidated Statements of Stockholders' Equity for the three fiscal years ended | |||||
Consolidated Statements of Cash Flows for the three fiscal years ended | |||||
42
Management’s Report on Internal Control Over Financial Reporting
The management of Kelly Services, Inc. (the “Company”), is responsible for establishing and maintaining adequate internal control over financial reporting. Internal control over financial reporting is defined in Rules 13a-15(f) and 15d-15(f) promulgated under the Securities Exchange Act of 1934 as a process designed by, or under the supervision of, the Company’s principal executive and principal financial officers and effected by the Company’s board of directors, management and other personnel, to provide reasonable assurance regarding the reliability of financial reporting and the preparation of financial statements for external purposes in accordance with generally accepted accounting principles and includes those policies and procedures that:
•Pertain to the maintenance of records that in reasonable detail accurately and fairly reflect the transactions and dispositions of the assets of the Company;
•Provide reasonable assurance that transactions are recorded as necessary to permit preparation of financial statements in accordance with generally accepted accounting principles, and that receipts and expenditures of the Company are being made only in accordance with authorizations of management and directors of the Company; and
•Provide reasonable assurance regarding prevention or timely detection of unauthorized acquisition, use or disposition of the Company’s assets that could have a material effect on the financial statements.
Because of its inherent limitations, internal control over financial reporting may not prevent or detect misstatements. Also, projections of any evaluation of effectiveness to future periods are subject to the risk that controls may become inadequate because of changes in conditions, or that the degree of compliance with the policies or procedures may change.
The Company completed the acquisition of RocketPower on March 7, 2022 and the acquisition of PTS on May 2, 2022. Under guidelines established by the SEC, companies are permitted to exclude acquisitions from their assessment of internal control over financial reporting during the first year of an acquisition while integrating the acquired company. Accordingly, we have excluded the acquired RocketPower and PTS businesses from our assessment and report on internal control over financial reporting for the year ending January 1, 2023. We are in the process of integrating RocketPower and PTS into our system of internal control over financial reporting. RocketPower and PTS both individually accounted for less than 1% of the Company's total assets as of January 1, 2023 and less than 1% of the Company's total revenue for the year ended 2022.
The Company’s management assessed the effectiveness of the Company’s internal control over financial reporting as of December 31, 2017.January 1, 2023. In making this assessment, the Company’s management used the criteria set forth by the Committee of Sponsoring Organizations of the Treadway Commission (COSO) in Internal Control-Integrated Framework (2013).
Based on our assessment, management determined that, as of December 31, 2017,January 1, 2023, the Company’s internal control over financial reporting was effective based on those criteria.
The effectiveness of the Company’s internal control over financial reporting as of December 31, 2017January 1, 2023 has been audited by PricewaterhouseCoopers LLP, an independent registered public accounting firm, as stated in their report which appears on pages 48-49.44-46.
43
Report of Independent Registered Public Accounting Firm
To the Stockholders and Board of Directors and Stockholders of Kelly Services, Inc.:
Opinions on the Financial Statements and Internal Control over Financial Reporting
We have audited the accompanying consolidated balance sheets of Kelly Services, Inc. and its subsidiaries (the “Company”) as of December 31, 2017 andJanuary 1, 2017,2023 and January 2, 2022, and the related consolidated statements of earnings, comprehensive income, stockholders’ equity and cash flows for each of the three years ended December 31, 2017, January 1, 2017,2023, January 2, 2022, and January 3, 2016,2021, including the related notes and financial statement schedule listed in the accompanying index (collectively referred to as the “consolidated financial statements”). We also have audited the Company's internal control over financial reporting as ofDecember 31, 2017, January 1, 2023, based on criteria established in Internal Control - Integrated Framework(2013)issued by the Committee of Sponsoring Organizations of the Treadway Commission (COSO).
In our opinion, the consolidated financial statements referred to above present fairly, in all material respects, the financial position of the Company as of December 31, 2017January 1, 2023 and January 1, 2017,2, 2022, and the results of theirits operations and theirits cash flows for each of the three years ended December 31, 2017, January 1, 2017,2023, January 2, 2022, and January 3, 20162021 in conformity with accounting principles generally accepted in the United States of America. Also in our opinion, the Company maintained, in all material respects, effective internal control over financial reporting as of December 31, 2017,January 1, 2023, based on criteria established in Internal Control - Integrated Framework (2013) issued by the COSO.
Basis for Opinions
The Company's management is responsible for these consolidated financial statements, for maintaining effective internal control over financial reporting, and for its assessment of the effectiveness of internal control over financial reporting, included in the accompanying Management’s Report on Internal Control Over Financial Reporting. Our responsibility is to express opinions on the Company’s consolidatedfinancial statements and on the Company's internal control over financial reporting based on our audits. We are a public accounting firm registered with the Public Company Accounting Oversight Board (United States) ("PCAOB")(PCAOB) and are required to be independent with respect to the Company in accordance with the U.S. federal securities laws and the applicable rules and regulations of the Securities and Exchange Commission and the PCAOB.
We conducted our audits in accordance with the standards of the PCAOB. Those standards require that we plan and perform the audits to obtain reasonable assurance about whether the consolidated financial statements are free of material misstatement, whether due to error or fraud, and whether effective internal control over financial reporting was maintained in all material respects.
Our audits of the consolidated financial statements included performing procedures to assess the risks of material misstatement of the consolidated financial statements, whether due to error or fraud, and performing procedures that respond to those risks. Such procedures included examining, on a test basis, evidence regarding the amounts and disclosures in the consolidated financial statements. Our audits also included evaluating the accounting principles used and significant estimates made by management, as well as evaluating the overall presentation of the consolidated financial statements. Our audit of internal control over financial reporting included obtaining an understanding of internal control over financial reporting, assessing the risk that a material weakness exists, and testing and evaluating the design and operating effectiveness of internal control based on the assessed risk. Our audits also included performing such other procedures as we considered necessary in the circumstances. We believe that our audits provide a reasonable basis for our opinions.
As described in Management’s Report on Internal Control Over Financial Reporting, management has excluded Rocket Power Holdings LLC and Rocket Power Ops LLC (collectively, RocketPower) and Pediatric Therapeutic Services (PTS) from its assessment of internal control over financial reporting as of January 1, 2023, because they were acquired by the Company in purchase business combinations during 2022. We have also excluded RocketPower and PTS from our audit of internal control over financial reporting. RocketPower and PTS are wholly-owned subsidiaries whose total assets and total revenues excluded from management’s assessment and our audit of internal control over financial reporting both individually represented less than 1% of the related consolidated financial statement amounts as of and for the year ended January 1, 2023.
Definition and Limitations of Internal Control over Financial Reporting
A company’s internal control over financial reporting is a process designed to provide reasonable assurance regarding the reliability of financial reporting and the preparation of financial statements for external purposes in accordance with generally accepted accounting principles. A company’s internal control over financial reporting includes those policies and procedures
44
that (i) pertain to the maintenance of records that, in reasonable detail, accurately and fairly reflect the transactions and dispositions of the assets of the company; (ii) provide reasonable assurance that transactions are recorded as necessary to permit preparation of financial statements in accordance with generally accepted accounting principles, and that receipts and expenditures of the company are being made only in accordance with authorizations of management and directors of the company; and (iii) provide reasonable assurance regarding prevention or timely detection of unauthorized acquisition, use, or disposition of the company’s assets that could have a material effect on the financial statements.
Because of its inherent limitations, internal control over financial reporting may not prevent or detect misstatements. Also, projections of any evaluation of effectiveness to future periods are subject to the risk that controls may become inadequate because of changes in conditions, or that the degree of compliance with the policies or procedures may deteriorate.
Critical Audit Matters
The critical audit matters communicated below are matters arising from the current period audit of the consolidated financial statements that were communicated or required to be communicated to the audit committee and that (i) relate to accounts or disclosures that are material to the consolidated financial statements and (ii) involved our especially challenging, subjective, or complex judgments. The communication of critical audit matters does not alter in any way our opinion on the consolidated financial statements, taken as a whole, and we are not, by communicating the critical audit matters below, providing separate opinions on the critical audit matters or on the accounts or disclosures to which they relate.
Goodwill Interim Impairment Assessment – RocketPower Reporting Unit
As described in Notes 1, 4, and 9 to the consolidated financial statements, the Company’s goodwill balance was $151.1 million as of January 1, 2023, and the goodwill allocated to the RocketPower reporting unit was $41.0 million upon its March 2022 acquisition and $0 as of January 1, 2023. The Company performs its annual goodwill impairment testing in the fourth quarter each year and regularly assesses whenever events or circumstances make it more likely than not that an impairment may have occurred. If the carrying value of the net assets assigned to a reporting unit exceeds the estimated fair value of a reporting unit, goodwill is deemed impaired and is written down to the extent of the difference. During the third quarter of 2022, customers within the high-tech industry vertical in which RocketPower specializes reduced or eliminated their full-time hiring, reducing demand for RocketPower’s services, and on-going economic uncertainty has more broadly impacted the growth in demand for Recruitment Process Outsourcing (RPO) in the near-term. These changes in market conditions therefore caused a triggering event requiring an interim impairment test for goodwill. Based on the result of management’s interim goodwill impairment test as of third quarter 2022, management recorded a goodwill impairment charge of $30.7 million to write off a portion of RocketPower’s goodwill. Management determined the fair value of the RocketPower reporting unit using an income approach. Under the income approach, estimated fair value is determined based on estimated future cash flows discounted by an estimated market participant weighted-average cost of capital. Management’s analysis used the following significant assumptions: expected future revenue growth rates, profit margins and discount rate.
The principal considerations for our determination that performing procedures relating to the goodwill impairment assessment of the RocketPower reporting unit is a critical audit matter are (i) the significant judgment by management when developing the fair value estimate of the reporting unit; (ii) a high degree of auditor judgment, subjectivity, and effort in performing procedures and evaluating management’s significant assumptions related to expected future revenue growth rates, profit margins and discount rate; and (iii) the audit effort involved the use of professionals with specialized skill and knowledge.
Addressing the matter involved performing procedures and evaluating audit evidence in connection with forming our overall opinion on the consolidated financial statements. These procedures included testing the effectiveness of controls relating to management’s goodwill impairment assessment, including controls over the valuation of theRocketPower reporting unit. These procedures also included, among others (i) testing management’s process for developing the fair value estimate of the reporting unit; (ii) evaluating the appropriateness of the income approach; (iii) testing the completeness and accuracy of underlying data used in the model; and (iv) evaluating the reasonableness of the significant assumptions used by management related to expected future revenue growth rates, profit margins, and discount rate. Evaluating management’s assumptions related to expected future revenue growth rates and profit margins involved evaluating whether the assumptions used by management were reasonable considering (i) the current and past performance of the reporting unit; (ii) the consistency with external market and industry data; and (iii) whether these assumptions were consistent with evidence obtained in other areas of the audit. Professionals with specialized skill and knowledge were used to assist in the evaluation of the Company’s income approach and the discount rate significant assumption.
Workers’ Compensation
As described in Note 1 to the consolidated financial statements, in the U.S., the Company has a combination of insurance and self-insurance contracts under which they effectively bear the first $1.0 million of risk per single accident. Management establishes the accrual for workers’ compensation claims utilizing actuarial methods to estimate the undiscounted future cash payments that will be made to satisfy the claims, including an allowance for incurred-but-not-reported claims. Management
45
retains an independent consulting actuary to establish loss development factors and loss rates, based on historical claims experience as well as industry experience, and applies those factors to current claims information to derive an estimate of the ultimate claims liability. In preparing the estimates, the consulting actuary considers a number of assumptions and multiple generally accepted actuarial methods in the course of preparing the loss forecast for claims. When claims exceed the applicable loss limit or self-insured retention and realization of recovery of the claim from existing insurance policies is deemed probable, management records a receivable from the insurance company for the excess amount. Management evaluates the accrual quarterly throughout the year and makes adjustments as needed. As disclosed by management, as of January 1, 2023, the accrual for accrued workers’ compensation, net of related receivables, is $43.3 million.
The principal considerations for our determination that performing procedures relating to workers’ compensation is a critical audit matter are (i) the significant judgment by management when determining the actuarial methods and the significant assumptions to use in establishing the accrual for workers’ compensation claims; (ii) a high degree of auditor judgment, subjectivity, and effort in performing procedures and evaluating management’s actuarial methods and significant assumptions related to the loss development factors and loss rates; and (iii) the audit effort involved the use of professionals with specialized skill and knowledge.
Addressing the matter involved performing procedures and evaluating audit evidence in connection with forming our overall opinion on the consolidated financial statements. These procedures included testing the effectiveness of controls relating to management’s accrual for workers’ compensation claims, including controls over the actuarial methods and development of significant assumptions. These procedures also included, among others (i) the involvement of professionals with specialized skill and knowledge to assist in developing an independent estimate for the accrual for workers’ compensation claims and (ii) comparing the independent estimate to management’s estimate to evaluate the reasonableness of management’s estimate. Developing the independent estimate involved (i) testing the completeness and accuracy of underlying data provided by management; (ii) evaluating management’s actuarial methods and significant assumptions related to the loss development factors and loss rates; and (iii) independently developing the loss development factors and loss rates and actuarial methods used.
/s/ PricewaterhouseCoopers LLP
Detroit, Michigan
February 20, 201816, 2023
We have served as the Company’s auditor since at least 1960.
46
KELLY SERVICES, INC. AND SUBSIDIARIES
CONSOLIDATED STATEMENTS OF EARNINGS
| 2022 | 2021 | 2020 | |||||||||||||||
| (In millions of dollars except per share items) | |||||||||||||||||
| Revenue from services | $ | 4,965.4 | $ | 4,909.7 | $ | 4,516.0 | |||||||||||
| Cost of services | 3,953.6 | 3,990.5 | 3,688.4 | ||||||||||||||
| Gross profit | 1,011.8 | 919.2 | 827.6 | ||||||||||||||
| Selling, general and administrative expenses | 943.5 | 870.6 | 805.6 | ||||||||||||||
| Goodwill impairment charge | 41.0 | — | 147.7 | ||||||||||||||
| Gain on sale of assets | (6.2) | — | (32.1) | ||||||||||||||
| Loss on disposal | 18.7 | — | — | ||||||||||||||
| Earnings (loss) from operations | 14.8 | 48.6 | (93.6) | ||||||||||||||
| Gain (loss) on investment in Persol Holdings | (67.2) | 121.8 | (16.6) | ||||||||||||||
| Gain on insurance settlement | — | 19.0 | — | ||||||||||||||
| Loss on currency translation from liquidation of subsidiary | (20.4) | — | — | ||||||||||||||
| Other income (expense), net | 1.6 | (3.6) | 3.4 | ||||||||||||||
| Earnings (loss) before taxes and equity in net earnings (loss) of affiliate | (71.2) | 185.8 | (106.8) | ||||||||||||||
| Income tax expense (benefit) | (7.9) | 35.1 | (34.0) | ||||||||||||||
| Net earnings (loss) before equity in net earnings (loss) of affiliate | (63.3) | 150.7 | (72.8) | ||||||||||||||
| Equity in net earnings (loss) of affiliate | 0.8 | 5.4 | 0.8 | ||||||||||||||
| Net earnings (loss) | $ | (62.5) | $ | 156.1 | $ | (72.0) | |||||||||||
| Basic earnings (loss) per share | $ | (1.64) | $ | 3.93 | $ | (1.83) | |||||||||||
| Diluted earnings (loss) per share | $ | (1.64) | $ | 3.91 | $ | (1.83) | |||||||||||
| Average shares outstanding (millions): | |||||||||||||||||
| Basic | 38.1 | 39.4 | 39.3 | ||||||||||||||
| Diluted | 38.1 | 39.5 | 39.3 | ||||||||||||||
| 2017 | 2016 | 2015 (1) | |||||||||
| (In millions of dollars except per share items) | |||||||||||
| Revenue from services | $ | 5,374.4 | $ | 5,276.8 | $ | 5,518.2 | |||||
| Cost of services | 4,420.3 | 4,370.5 | 4,597.9 | ||||||||
| Gross profit | 954.1 | 906.3 | 920.3 | ||||||||
| Selling, general and administrative expenses | 870.8 | 843.1 | 853.6 | ||||||||
| Earnings from operations | 83.3 | 63.2 | 66.7 | ||||||||
| Gain on investment in PersolKelly Asia Pacific | — | 87.2 | — | ||||||||
| Other expense, net | (1.6 | ) | (0.7 | ) | (3.5 | ) | |||||
| Earnings before taxes and equity in net earnings (loss) of affiliate | 81.7 | 149.7 | 63.2 | ||||||||
| Income tax expense | 12.8 | 30.0 | 8.7 | ||||||||
| Net earnings before equity in net earnings (loss) of affiliate | 68.9 | 119.7 | 54.5 | ||||||||
| Equity in net earnings (loss) of affiliate | 2.7 | 1.1 | (0.7 | ) | |||||||
| Net earnings | $ | 71.6 | $ | 120.8 | $ | 53.8 | |||||
| Basic earnings per share | $ | 1.84 | $ | 3.10 | $ | 1.39 | |||||
| Diluted earnings per share | $ | 1.81 | $ | 3.08 | $ | 1.39 | |||||
| Dividends per share | $ | 0.30 | $ | 0.275 | $ | 0.20 | |||||
| Average shares outstanding (millions): | |||||||||||
| Basic | 38.3 | 38.1 | 37.8 | ||||||||
| Diluted | 39.0 | 38.4 | 37.9 | ||||||||
See accompanying Notes to Consolidated Financial Statements.
47
KELLY SERVICES, INC. AND SUBSIDIARIES
CONSOLIDATED STATEMENTS OF COMPREHENSIVE INCOME
| 2022 | 2021 | 2020 | |||||||||||||||
| (In millions of dollars) | |||||||||||||||||
| Net earnings (loss) | $ | (62.5) | $ | 156.1 | $ | (72.0) | |||||||||||
| Other comprehensive income (loss), net of tax: | |||||||||||||||||
| Foreign currency translation adjustments, net of tax benefit of $0.2 million and tax expense of $0.1 million and $0.2 million, respectively | (7.5) | (24.2) | 13.9 | ||||||||||||||
| Less: Reclassification adjustments included in net earnings (loss) - liquidation of Japan subsidiary | 20.4 | — | — | ||||||||||||||
| Less: Reclassification adjustments included in net earnings (loss) - equity method investment and other | 4.7 | — | (1.5) | ||||||||||||||
| Foreign currency translation adjustments | 17.6 | (24.2) | 12.4 | ||||||||||||||
| Pension liability adjustments, net of tax expense of $0.5 million and $0.2 million, respectively and tax benefit of $0.1 million | 1.5 | 0.5 | (0.9) | ||||||||||||||
| Less: Reclassification adjustments included in net earnings | 0.1 | 0.2 | 0.1 | ||||||||||||||
| Pension liability adjustments | 1.6 | 0.7 | (0.8) | ||||||||||||||
| Other comprehensive income (loss), net of tax | 19.2 | (23.5) | 11.6 | ||||||||||||||
| Comprehensive income (loss) | $ | (43.3) | $ | 132.6 | $ | (60.4) | |||||||||||
| 2017 | 2016 | 2015 (1) | |||||||||
| (In millions of dollars) | |||||||||||
| Net earnings | $ | 71.6 | $ | 120.8 | $ | 53.8 | |||||
| Other comprehensive income, net of tax: | |||||||||||
| Foreign currency translation adjustments, net of tax expense of $0.2 million, tax expense of $0.0 million and tax benefit of $0.4 million, respectively | 16.4 | (0.6 | ) | (19.4 | ) | ||||||
| Less: Reclassification adjustments included in net earnings | — | (0.1 | ) | (0.2 | ) | ||||||
| Foreign currency translation adjustments | 16.4 | (0.7 | ) | (19.6 | ) | ||||||
| Unrealized gains (losses) on investment, net of tax expense of $30.2 million, tax benefit of $0.7 million and tax expense of $15.8 million, respectively | 56.2 | (1.1 | ) | 28.6 | |||||||
| Pension liability adjustments, net of tax expense of $0.1 million, $0.0 million and $0.0 million, respectively | (0.6 | ) | (0.3 | ) | 0.5 | ||||||
| Less: Reclassification adjustments included in net earnings | 0.1 | 0.1 | 0.1 | ||||||||
| Pension liability adjustments | (0.5 | ) | (0.2 | ) | 0.6 | ||||||
| Other comprehensive income (loss) | 72.1 | (2.0 | ) | 9.6 | |||||||
| Comprehensive Income | $ | 143.7 | $ | 118.8 | $ | 63.4 | |||||
See accompanying Notes to Consolidated Financial Statements.
48
KELLY SERVICES, INC. AND SUBSIDIARIES
CONSOLIDATED BALANCE SHEETS
| 2022 | 2021 | |||||||||||||||||
| 2017 | 2016 | (In millions of dollars) | ||||||||||||||||
| Assets | Assets | |||||||||||||||||
| Current Assets | Current Assets | |||||||||||||||||
| Cash and equivalents | Cash and equivalents | $ | 153.7 | $ | 112.7 | |||||||||||||
| Trade accounts receivable, less allowances of $11.2 million and $12.6 million, respectively | Trade accounts receivable, less allowances of $11.2 million and $12.6 million, respectively | 1,491.6 | 1,423.2 | |||||||||||||||
| Prepaid expenses and other current assets | Prepaid expenses and other current assets | 69.9 | 52.8 | |||||||||||||||
| (In millions of dollars) | ||||||||||||||||||
| ASSETS | ||||||||||||||||||
| CURRENT ASSETS: | ||||||||||||||||||
| Cash and equivalents | $ | 32.5 | $ | 29.6 | ||||||||||||||
| Trade accounts receivable, less allowances of $12.9 million and $12.5 million, respectively | 1,286.7 | 1,138.3 | ||||||||||||||||
| Prepaid expenses and other current assets | 65.1 | 46.7 | ||||||||||||||||
| Total current assets | 1,384.3 | 1,214.6 | Total current assets | 1,715.2 | 1,588.7 | |||||||||||||
| NONCURRENT ASSETS: | ||||||||||||||||||
| Noncurrent Assets | Noncurrent Assets | |||||||||||||||||
| Property and equipment: | Property and equipment: | |||||||||||||||||
| Property and equipment | 291.8 | 270.0 | Property and equipment | 166.8 | 205.1 | |||||||||||||
| Accumulated depreciation | (205.7 | ) | (189.2 | ) | Accumulated depreciation | (139.0) | (169.8) | |||||||||||
| Net property and equipment | 86.1 | 80.8 | Net property and equipment | 27.8 | 35.3 | |||||||||||||
| Operating lease right-of-use assets | Operating lease right-of-use assets | 66.8 | 75.8 | |||||||||||||||
| Deferred taxes | 183.4 | 180.1 | Deferred taxes | 299.7 | 302.8 | |||||||||||||
| Goodwill, net | 107.1 | 88.4 | Goodwill, net | 151.1 | 114.8 | |||||||||||||
| Investment in Persol Holdings | Investment in Persol Holdings | — | 264.3 | |||||||||||||||
| Investment in equity affiliate | 117.4 | 114.8 | Investment in equity affiliate | — | 123.4 | |||||||||||||
| Other assets | 499.9 | 349.4 | Other assets | 403.2 | 389.1 | |||||||||||||
| Total noncurrent assets | 993.9 | 813.5 | Total noncurrent assets | 948.6 | 1,305.5 | |||||||||||||
| TOTAL ASSETS | $ | 2,378.2 | $ | 2,028.1 | ||||||||||||||
| Total Assets | Total Assets | $ | 2,663.8 | $ | 2,894.2 | |||||||||||||
See accompanying Notes to Consolidated Financial Statements.
49
KELLY SERVICES, INC. AND SUBSIDIARIES
CONSOLIDATED BALANCE SHEETS
| 2022 | 2021 | ||||||||||
| (In millions of dollars) | |||||||||||
| Liabilities and Stockholders' Equity | |||||||||||
| Current Liabilities | |||||||||||
| Short-term borrowings | $ | 0.7 | $ | — | |||||||
| Accounts payable and accrued liabilities | 723.3 | 687.2 | |||||||||
| Operating lease liabilities | 14.7 | 17.5 | |||||||||
| Accrued payroll and related taxes | 315.8 | 318.4 | |||||||||
| Accrued workers' compensation and other claims | 22.9 | 20.8 | |||||||||
| Income and other taxes | 51.4 | 51.3 | |||||||||
| Total current liabilities | 1,128.8 | 1,095.2 | |||||||||
| Noncurrent Liabilities | |||||||||||
| Operating lease liabilities | 55.0 | 61.4 | |||||||||
| Accrued payroll and related taxes | — | 57.6 | |||||||||
| Accrued workers' compensation and other claims | 40.7 | 37.0 | |||||||||
| Accrued retirement benefits | 174.1 | 220.0 | |||||||||
| Other long-term liabilities | 11.0 | 86.8 | |||||||||
| Total noncurrent liabilities | 280.8 | 462.8 | |||||||||
| Commitments and contingencies (See Commitments and Contingencies footnotes) | |||||||||||
| Stockholders' Equity | |||||||||||
| Capital stock, $1.00 par value | |||||||||||
| Class A common stock, 100.0 million shares authorized; 35.1 million shares issued at 2022 and 36.7 million shares issued at 2021 | 35.1 | 36.7 | |||||||||
| Class B common stock, 10.0 million shares authorized; 3.4 million shares issued at 2022 and 2021 | 3.4 | 3.4 | |||||||||
| Treasury stock, at cost | |||||||||||
| Class A common stock, 1.0 million shares at 2022 and 0.7 million shares at 2021 | (19.5) | (14.5) | |||||||||
| Class B common stock | (0.6) | (0.6) | |||||||||
| Paid-in capital | 28.0 | 23.9 | |||||||||
| Earnings invested in the business | 1,216.3 | 1,315.0 | |||||||||
| Accumulated other comprehensive income (loss) | (8.5) | (27.7) | |||||||||
| Total stockholders' equity | 1,254.2 | 1,336.2 | |||||||||
| Total Liabilities and Stockholders' Equity | $ | 2,663.8 | $ | 2,894.2 | |||||||
| 2017 | 2016 | ||||||
| (In millions of dollars) | |||||||
| LIABILITIES AND STOCKHOLDERS' EQUITY | |||||||
| CURRENT LIABILITIES: | |||||||
| Short-term borrowings | $ | 10.2 | $ | — | |||
| Accounts payable and accrued liabilities | 537.7 | 455.1 | |||||
| Accrued payroll and related taxes | 287.4 | 241.5 | |||||
| Accrued insurance | 25.7 | 23.4 | |||||
| Income and other taxes | 65.2 | 51.1 | |||||
| Total current liabilities | 926.2 | 771.1 | |||||
| NONCURRENT LIABILITIES: | |||||||
| Accrued insurance | 49.9 | 45.5 | |||||
| Accrued retirement benefits | 178.1 | 157.4 | |||||
| Other long-term liabilities | 72.5 | 42.1 | |||||
| Total noncurrent liabilities | 300.5 | 245.0 | |||||
| Commitments and contingencies (See Commitments and Contingencies footnotes) | |||||||
| STOCKHOLDERS' EQUITY: | |||||||
| Capital stock, $1.00 par value | |||||||
| Class A common stock, shares issued 36.6 million at 2017 and 2016 | 36.6 | 36.6 | |||||
| Class B common stock, shares issued 3.5 million at 2017 and 2016 | 3.5 | 3.5 | |||||
| Treasury stock, at cost | |||||||
| Class A common stock, 1.7 million shares at 2017 and 1.9 million at 2016 | (34.6 | ) | (38.4 | ) | |||
| Class B common stock | (0.6 | ) | (0.6 | ) | |||
| Paid-in capital | 32.2 | 28.6 | |||||
| Earnings invested in the business | 983.6 | 923.6 | |||||
| Accumulated other comprehensive income | 130.8 | 58.7 | |||||
| Total stockholders' equity | 1,151.5 | 1,012.0 | |||||
| TOTAL LIABILITIES AND STOCKHOLDERS' EQUITY | $ | 2,378.2 | $ | 2,028.1 | |||
See accompanying Notes to Consolidated Financial Statements.
KELLY SERVICES, INC. AND SUBSIDIARIES
CONSOLIDATED STATEMENTS OF STOCKHOLDERS’ EQUITY
| 2017 | 2016 | 2015 (1) | 2022 | 2021 | 2020 | |||||||||||||||||||||||
| (In millions of dollars) | (In millions of dollars) | |||||||||||||||||||||||||||
| Capital Stock | Capital Stock | |||||||||||||||||||||||||||
| Class A common stock | Class A common stock | |||||||||||||||||||||||||||
| Balance at beginning of year | $ | 36.6 | $ | 36.6 | $ | 36.6 | Balance at beginning of year | $ | 36.7 | $ | 36.7 | $ | 36.6 | |||||||||||||||
| Conversions from Class B | — | — | — | Conversions from Class B | — | — | 0.1 | |||||||||||||||||||||
| Share retirement | Share retirement | (1.6) | — | — | ||||||||||||||||||||||||
| Balance at end of year | 36.6 | 36.6 | 36.6 | Balance at end of year | 35.1 | 36.7 | 36.7 | |||||||||||||||||||||
| Class B common stock | Class B common stock | |||||||||||||||||||||||||||
| Balance at beginning of year | 3.5 | 3.5 | 3.5 | Balance at beginning of year | 3.4 | 3.4 | 3.5 | |||||||||||||||||||||
| Conversions to Class A | — | — | — | Conversions to Class A | — | — | (0.1) | |||||||||||||||||||||
| Balance at end of year | 3.5 | 3.5 | 3.5 | Balance at end of year | 3.4 | 3.4 | 3.4 | |||||||||||||||||||||
| Treasury Stock | Treasury Stock | |||||||||||||||||||||||||||
| Class A common stock | Class A common stock | |||||||||||||||||||||||||||
| Balance at beginning of year | (38.4 | ) | (43.7 | ) | (49.2 | ) | Balance at beginning of year | (14.5) | (16.5) | (20.3) | ||||||||||||||||||
| Issuance of restricted stock and other | 3.8 | 5.3 | 5.5 | |||||||||||||||||||||||||
| Net issuance of stock awards | Net issuance of stock awards | 2.8 | 2.0 | 3.8 | ||||||||||||||||||||||||
| Purchase of treasury stock | Purchase of treasury stock | (7.8) | — | — | ||||||||||||||||||||||||
| Balance at end of year | (34.6 | ) | (38.4 | ) | (43.7 | ) | Balance at end of year | (19.5) | (14.5) | (16.5) | ||||||||||||||||||
| Class B common stock | Class B common stock | |||||||||||||||||||||||||||
| Balance at beginning of year | (0.6 | ) | (0.6 | ) | (0.6 | ) | Balance at beginning of year | (0.6) | (0.6) | (0.6) | ||||||||||||||||||
| Issuance of restricted stock and other | — | — | — | |||||||||||||||||||||||||
| Net issuance of stock awards | Net issuance of stock awards | — | — | — | ||||||||||||||||||||||||
| Balance at end of year | (0.6 | ) | (0.6 | ) | (0.6 | ) | Balance at end of year | (0.6) | (0.6) | (0.6) | ||||||||||||||||||
| Paid-in Capital | Paid-in Capital | |||||||||||||||||||||||||||
| Balance at beginning of year | 28.6 | 25.4 | 24.9 | Balance at beginning of year | 23.9 | 21.3 | 22.5 | |||||||||||||||||||||
| Issuance of restricted stock and other | 3.6 | 3.2 | 0.5 | |||||||||||||||||||||||||
| Net issuance of stock awards | Net issuance of stock awards | 4.1 | 2.6 | (1.2) | ||||||||||||||||||||||||
| Balance at end of year | 32.2 | 28.6 | 25.4 | Balance at end of year | 28.0 | 23.9 | 21.3 | |||||||||||||||||||||
| Earnings Invested in the Business | Earnings Invested in the Business | |||||||||||||||||||||||||||
| Balance at beginning of year | 923.6 | 813.5 | 767.4 | Balance at beginning of year | 1,315.0 | 1,162.9 | 1,238.6 | |||||||||||||||||||||
| Net earnings | 71.6 | 120.8 | 53.8 | |||||||||||||||||||||||||
| Cumulative-effect adjustment from adoption of ASU 2016-13, Credit Losses | Cumulative-effect adjustment from adoption of ASU 2016-13, Credit Losses | — | — | (0.7) | ||||||||||||||||||||||||
| Net earnings (loss) | Net earnings (loss) | (62.5) | 156.1 | (72.0) | ||||||||||||||||||||||||
| Dividends | (11.6 | ) | (10.7 | ) | (7.7 | ) | Dividends | (10.6) | (4.0) | (3.0) | ||||||||||||||||||
| Share retirement | Share retirement | (25.6) | — | — | ||||||||||||||||||||||||
| Balance at end of year | 983.6 | 923.6 | 813.5 | Balance at end of year | 1,216.3 | 1,315.0 | 1,162.9 | |||||||||||||||||||||
| Accumulated Other Comprehensive Income | ||||||||||||||||||||||||||||
| Accumulated Other Comprehensive Income (Loss) | Accumulated Other Comprehensive Income (Loss) | |||||||||||||||||||||||||||
| Balance at beginning of year | 58.7 | 60.7 | 51.1 | Balance at beginning of year | (27.7) | (4.2) | (15.8) | |||||||||||||||||||||
| Other comprehensive income (loss), net of tax | 72.1 | (2.0 | ) | 9.6 | Other comprehensive income (loss), net of tax | 19.2 | (23.5) | 11.6 | ||||||||||||||||||||
| Balance at end of year | 130.8 | 58.7 | 60.7 | Balance at end of year | (8.5) | (27.7) | (4.2) | |||||||||||||||||||||
| Stockholders’ Equity at end of year | $ | 1,151.5 | $ | 1,012.0 | $ | 895.4 | Stockholders’ Equity at end of year | $ | 1,254.2 | $ | 1,336.2 | $ | 1,203.0 | |||||||||||||||
See accompanying Notes to Consolidated Financial Statements.
51
KELLY SERVICES, INC. AND SUBSIDIARIES
CONSOLIDATED STATEMENTS OF CASH FLOWS
| 2022 | 2021 | 2020 | |||||||||||||||
| (In millions of dollars) | |||||||||||||||||
| Cash flows from operating activities: | |||||||||||||||||
| Net earnings (loss) | $ | (62.5) | $ | 156.1 | $ | (72.0) | |||||||||||
| Adjustments to reconcile net earnings to net cash from operating activities: | |||||||||||||||||
| Goodwill impairment charge | 41.0 | — | 147.7 | ||||||||||||||
| Deferred income taxes | (72.1) | 21.6 | (57.1) | ||||||||||||||
| Loss on disposal | 18.7 | — | — | ||||||||||||||
| Depreciation and amortization | 33.4 | 29.8 | 24.2 | ||||||||||||||
| Operating lease asset amortization | 18.5 | 21.2 | 21.1 | ||||||||||||||
| Provision for credit losses and sales allowances | 1.5 | 1.6 | 12.8 | ||||||||||||||
| Stock-based compensation | 7.8 | 5.1 | 3.9 | ||||||||||||||
| (Gain) loss on investment in Persol Holdings | 67.2 | (121.8) | 16.6 | ||||||||||||||
| Loss on cumulative translation adjustment reversal | 20.4 | — | — | ||||||||||||||
| Gain on foreign currency remeasurement | (5.5) | — | — | ||||||||||||||
| Gain on insurance settlement | — | (19.0) | — | ||||||||||||||
| Gain on sale of assets | (6.2) | — | (32.1) | ||||||||||||||
| Equity in net (earnings) loss of PersolKelly Pte. Ltd. | (0.8) | (5.4) | (0.8) | ||||||||||||||
| Other, net | 3.3 | 6.0 | 1.4 | ||||||||||||||
| Changes in operating assets and liabilities, net of acquisitions | (141.0) | (10.2) | 120.3 | ||||||||||||||
| Net cash (used in) from operating activities | (76.3) | 85.0 | 186.0 | ||||||||||||||
| Cash flows from investing activities: | |||||||||||||||||
| Capital expenditures | (12.0) | (11.2) | (15.5) | ||||||||||||||
| Proceeds from sale of assets | 10.1 | — | 55.5 | ||||||||||||||
| Acquisition of companies, net of cash received | (143.1) | (213.0) | (39.2) | ||||||||||||||
| Cash disposed from sale of Russia, net of proceeds | (6.0) | — | — | ||||||||||||||
| Proceeds from sale of Persol Holdings investment | 196.9 | — | — | ||||||||||||||
| Proceeds from sale of equity method investment | 119.5 | — | — | ||||||||||||||
| Proceeds from company-owned life insurance | 1.5 | 12.2 | 2.3 | ||||||||||||||
| Proceeds from insurance settlement | — | 19.0 | — | ||||||||||||||
| Proceeds from sale of Brazil, net of cash disposed | — | — | 1.2 | ||||||||||||||
| Proceeds (payments) related to loans to equity affiliate | — | 5.9 | 5.6 | ||||||||||||||
| Proceeds from (investment in) equity securities | — | 5.0 | (0.2) | ||||||||||||||
| Other investing activities | 0.6 | 1.4 | 0.1 | ||||||||||||||
| Net cash from (used in) investing activities | 167.5 | (180.7) | 9.8 | ||||||||||||||
| Cash flows from financing activities: | |||||||||||||||||
| Net change in short-term borrowings | 0.8 | (0.2) | (1.7) | ||||||||||||||
| Financing lease payments | (1.4) | (1.5) | (2.0) | ||||||||||||||
| Dividend payments | (10.6) | (4.0) | (3.0) | ||||||||||||||
| Payments of tax withholding for stock awards | (0.9) | (0.6) | (1.2) | ||||||||||||||
| Buyback of common shares | (27.2) | — | — | ||||||||||||||
| Purchase of treasury stock | (7.8) | — | — | ||||||||||||||
| Contingent consideration payments | (3.3) | (1.6) | — | ||||||||||||||
| Other financing activities | (0.2) | (0.2) | (0.2) | ||||||||||||||
| Net cash used in financing activities | (50.6) | (8.1) | (8.1) | ||||||||||||||
| Effect of exchange rates on cash, cash equivalents and restricted cash | 2.3 | (4.8) | 9.4 | ||||||||||||||
| Net change in cash, cash equivalents and restricted cash | 42.9 | (108.6) | 197.1 | ||||||||||||||
| Cash, cash equivalents and restricted cash at beginning of year | 119.5 | 228.1 | 31.0 | ||||||||||||||
Cash, cash equivalents and restricted cash at end of year(1) | $ | 162.4 | $ | 119.5 | $ | 228.1 | |||||||||||
52
| 2017 | 2016 | 2015 (1) | |||||||||
| (In millions of dollars) | |||||||||||
| Cash flows from operating activities: | |||||||||||
| Net earnings | $ | 71.6 | $ | 120.8 | $ | 53.8 | |||||
| Noncash adjustments: | |||||||||||
| Depreciation and amortization | 22.7 | 21.3 | 22.3 | ||||||||
| Provision for bad debts | 5.6 | 11.0 | 3.7 | ||||||||
| Stock-based compensation | 9.1 | 10.2 | 7.9 | ||||||||
| Deferred income taxes | (5.9 | ) | 7.4 | (11.8 | ) | ||||||
| Gain on investment in PersolKelly Asia Pacific equity affiliate | — | (87.2 | ) | — | |||||||
| Other, net | (2.5 | ) | (3.9 | ) | (4.7 | ) | |||||
| Changes in operating assets and liabilities, net of acquisition | (29.4 | ) | (40.0 | ) | (45.9 | ) | |||||
| Net cash from operating activities | 71.2 | 39.6 | 25.3 | ||||||||
| Cash flows from investing activities: | |||||||||||
| Capital expenditures | (24.6 | ) | (12.7 | ) | (16.9 | ) | |||||
| Acquisition of company, net of cash received | (37.2 | ) | — | — | |||||||
| Net cash proceeds from investment in PersolKelly Asia Pacific equity affiliate | — | 23.3 | — | ||||||||
| Proceeds from repayment of loan to PersolKelly equity affiliate | 0.6 | — | — | ||||||||
| Investment in PersolKelly equity affiliate | — | — | (0.5 | ) | |||||||
| Other investing activities | 0.2 | (0.3 | ) | (0.2 | ) | ||||||
| Net cash (used in) from investing activities | (61.0 | ) | 10.3 | (17.6 | ) | ||||||
| Cash flows from financing activities: | |||||||||||
| Net change in short-term borrowings | 10.1 | (55.9 | ) | (34.7 | ) | ||||||
| Dividend payments | (11.6 | ) | (10.7 | ) | (7.7 | ) | |||||
| Payments of tax withholding for restricted shares | (1.8 | ) | (2.2 | ) | (1.8 | ) | |||||
| Other financing activities | (0.1 | ) | (0.3 | ) | 0.2 | ||||||
| Net cash used in financing activities | (3.4 | ) | (69.1 | ) | (44.0 | ) | |||||
| Effect of exchange rates on cash and equivalents | (3.9 | ) | 6.6 | (4.6 | ) | ||||||
| Net change in cash and equivalents | 2.9 | (12.6 | ) | (40.9 | ) | ||||||
| Cash and equivalents at beginning of year | 29.6 | 42.2 | 83.1 | ||||||||
| Cash and equivalents at end of year | $ | 32.5 | $ | 29.6 | $ | 42.2 | |||||
CONSOLIDATED STATEMENTS OF CASH FLOWS (continued)
(1) The following table provides a reconciliation of cash, cash equivalents and restricted cash to the amounts reported in our consolidated balance sheet:
| 2022 | 2021 | 2020 | |||||||||||||||
| (In millions of dollars) | |||||||||||||||||
| Reconciliation of cash, cash equivalents and restricted cash: | |||||||||||||||||
| Current assets: | |||||||||||||||||
| Cash and equivalents | $ | 153.7 | $ | 112.7 | $ | 223.0 | |||||||||||
| Restricted cash included in prepaid expenses and other current assets | 0.1 | 0.2 | — | ||||||||||||||
| Noncurrent assets: | |||||||||||||||||
| Restricted cash included in other assets | 8.6 | 6.6 | 5.1 | ||||||||||||||
| Cash, cash equivalents and restricted cash at end of year | $ | 162.4 | $ | 119.5 | $ | 228.1 | |||||||||||
See accompanying Notes to Consolidated Financial Statements.
53
KELLY SERVICES, INC. AND SUBSIDIARIES
NOTES TO CONSOLIDATED FINANCIAL STATEMENTS
1. Summary of Significant Accounting Policies
Nature of Operations Kelly Services, Inc. is a globalspecialty talent and workforce solutions provider operating throughout the world.
Fiscal Year The Company’s fiscal year ends on the Sunday nearest to December 31. The three most recent years ended on December 31, 2017 (2017,January 1, 2023 (2022, which contained 52 weeks), January 1, 2017 (2016,2, 2022 (2021, which contained 52 weeks) and January 3, 2016 (2015,2021 (2020, which contained 53 weeks). Period costs included in selling, general and administrative (“SG&A”) expenses are recorded on a calendar-year basis. The Company’s operations in Brazil arewere accounted for on a one-month lag.lag, until the Company sold the Brazil operations in the third quarter of 2020. The Company’s equity method investment in PersolKelly Asia Pacific arePte. Ltd. was accounted for on a one-quarter lag prior to the sale of the majority of the investment in the first quarter of 2022 (see Investment in PersolKelly Asia PacificPte. Ltd. footnote). Any material transactions in the intervening period are disclosed or accounted for in the current reporting period.
Principles of Consolidation The consolidated financial statements include the accounts and operations of the Company and its wholly owned subsidiaries. In connection with the Company’s investment in PersolKelly Asia Pacific (formerly TS Kelly Asia Pacific) in the third quarter of 2016, the CommercialAll intercompany accounts and PT staffing operations and certain OCG businesses in the APAC region were deconsolidated at that time.transactions have been eliminated. Certain prior period amounts have been reclassified to conform to the current presentation. All intercompany accounts and transactions have been eliminated.
Investment in Persol Holdings The Company’s available-for-saleprevious investment in Persol Holdings, as further described in the Fair Value MeasurementsInvestment in Persol Holdings footnote, iswas carried at fair value with the unrealized gains or losses,changes in fair value recognized in net of tax, included as a component of accumulated other comprehensive income (loss) in stockholders’ equity. Realized losses and declines in value below cost judged to be other-than-temporary, if any, are included as a component of asset impairments expense in the consolidated statement of earnings. The fair value of the available-for-saleinvestment was based on the quoted market price until the sale of the investment in the first quarter of 2022.
Investment in PersolKelly Pte. Ltd. The Company had a 49% ownership interest in its equity affiliate, PersolKelly Pte. Ltd., which was accounted for under the equity method. The operating results of the equity affiliate were recorded on a one-quarter lag and included in equity in net earnings (loss) of affiliate in the consolidated statements of earnings, until the Company sold the majority of the investment in the first quarter of 2022 (see Investment in PersolKelly Pte. Ltd. footnote). The remaining investment is based on quoted market prices. accounted for as an equity investment without a readily determinable fair value (see Fair Value Measurements footnote).
Foreign Currency Translation All of the Company’s international subsidiaries use their local currency as their functional currency, which is the currency in which they transact the majority of their activities. Revenue and expense accounts of foreign subsidiaries are translated to U.S. dollars at average exchange rates, while assets and liabilities are translated to U.S. dollars at year-end exchange rates. Resulting translation adjustments, net of tax, where applicable, are reported as accumulated foreign currency translation adjustments in stockholders’ equity and are recorded as a component of accumulated other comprehensive income. income (loss).
Revenue Recognition Revenue from Revenues are recognized when control of the promised services is recognized astransferred to our customers, in an amount that reflects the consideration we expect to be entitled to in exchange for those services. Our revenues are recorded net of any sales, value added, or similar taxes collected from our customers. We generate revenue from: the hourly sales of services are provided by our temporary employees to customers (“staffing services” revenue), the temporary or contract employees. Revenue fromrecruiting of permanent placement services is recognized at the time the employees for our customers (“permanent placement candidate begins full-time employment. Revenue from other fee-based services is recognized when the services are provided. Revenuesplacement” revenue), and through our talent fulfillment and outcome-based activities (“talent solutions” and “outcome-based services” revenue).
We record revenues from sales of services and the related direct costs are recorded in accordance with the accounting guidance on reporting revenue gross as a principal versus net as an agent. When Kelly is the principal, we actdemonstrate control over the service by being primarily responsible to our customers for fulfilling the contractual promise to provide the service. When Kelly does not demonstrate control over the service, which may be evident through the arrangement of other contingent labor suppliers and/or service providers to perform services for the customer or by Kelly not holding primary responsibility for the fulfillment of the contractual promise to provide services to the customer, the amounts billed to our customers are net of the amounts paid to the secondary suppliers/service providers and the net amount is recorded as an agent, we report the revenuesrevenues.
Staffing Services Revenue
Staffing services contracts are generally negotiated and invoiced on a net basis.per-hour or per-unit basis as the temporary staffing services are transferred to the customer. Revenue from the majority of our staffing services continues to be recognized over time as the customer simultaneously receives and consumes the services we provide. We have applied the practical expedient to recognize revenue for these services over the term of the agreement in proportion to the amount we have the right to invoice the customer.
54
KELLY SERVICES, INC. AND SUBSIDIARIES
NOTES TO CONSOLIDATED FINANCIAL STATEMENTS (continued)
Permanent Placement Revenue
Permanent placement revenue is recorded at the point in time the permanent placement candidate begins full-time employment. On the candidate start date, the customer accepts the candidate and can direct the use of the candidate as well as obtains the significant risk and rewards of the candidate. We consider this the point the control transfers to the customer.
Outcome-Based Services Revenue
Billings are generally negotiated and invoiced on a measure of time (hours, weeks, months) or per-unit basis for our services performed. We continue to recognize revenue from the majority of our outcome-based services over time as the customer simultaneously receives and consumes the services we provide. For the majority of our outcome-based services, we have applied the practical expedient to recognize revenue for these services over the term of the agreement in proportion to the amount we have the right to invoice the customer.
Talent Solutions Revenue
Talent Solutions services include: overall program management of our client’s contingent workforce, external vendors and/or independent contractors, end-to-end talent acquisition, and payroll outsourcing. Billings are generally negotiated and invoiced as a fee-based commission contingent on the amount of services managed through the program, a monthly management fee, measure of time (hours), or a per-unit basis for our services performed. We continue to recognize revenue for talent solution services over time as the customer simultaneously receives and consumes the services we provide. We have applied the practical expedient to recognize revenue for these services over the term of the agreement in proportion to the amount we have the right to invoice the customer.
Variable Consideration
Certain customers may receive cash-based incentives or credits, which are accounted for as a form of variable consideration. We estimate these amounts based on the expected or likely amount to be provided to customers and reduce revenues recognized to the extent that it is probable that a significant reversal of such adjustment will not occur. Provisions for sales allowances (billing adjustments related to errors, service issues and compromises on billing disputes), based on historical experience, are recognized at the time the related sale is recognized as a reduction in revenue from services.
Payment Terms
Customer payments are typically due within 60 days of invoicing, but may be shorter or longer depending on contract terms. Management does not assess whether a contract has a significant financing component if the expectation at contract inception is that the period between payment by the customer and the transfer of the services to the customer will be less than one year. We do not have any significant financing components or extended payment terms.
Deferred Revenue
Items which are billed to the customer at a point in time, rather than billed over time as the services are delivered to the customer, are assessed for potential revenue deferral. At this time, the balance of the contract liability as well as the amount of revenue recognized in the reporting period that was included in the deferred revenue balance at the beginning of the period is not material.
Deferred Costs
Occasionally, fulfillment costs are incurred after obtaining a contract in order to generate a resource that will be used to provide our services. These costs are considered incremental and recoverable costs to fulfill our contract with the customer. These costs to fulfill a contract are deferred and then amortized on a straight-line basis over a period of benefit that we have determined to be the average length of assignment of the employees. We determined the period of benefit by taking into consideration our customer contracts, attrition rates and other relevant factors. Amortization expense is included in SG&A expenses in the consolidated statements of earnings.
Unsatisfied Performance Obligations
The Company does not disclose the value of unsatisfied performance obligations for (i) contracts with an original expected length of one year or less and (ii) contracts for which we recognize revenue at the amount to which we have the right to invoice for services performed.
Allowance for UncollectibleCredit Losses - Trade Accounts Receivable The Company records an allowance for uncollectible accounts receivable, billed and unbilled, based on historical loss experience, customer payment patterns, and current economic trends.trends, and reasonable and supportable forecasts, as applicable. The reserve for sales allowances as discussed above, is also included in the allowance for uncollectible accounts receivable. The Company estimates the current expected credit losses by applying internally developed loss rates to all outstanding receivable balances by aging category. Accounts receivable are written-off against the allowance when they are deemed uncollectible. The Company reviews the adequacy of the allowance for uncollectible accounts
55
KELLY SERVICES, INC. AND SUBSIDIARIES
NOTES TO CONSOLIDATED FINANCIAL STATEMENTS (continued)
receivable on a quarterly basis and, if necessary, increases or decreases the balance by recording a charge or credit to SG&A expenses for the portion of the adjustment relating to uncollectible accounts receivable, and a charge or credit to revenue from services for the portion of the adjustment relating to sales allowances.
We are exposed to credit losses primarily through our sales of workforce solution services to customers. We establish an allowance for estimated credit losses in the current period resulting from the failure of our customers to make required payments on their trade accounts receivable in future periods. We pool such assets by geography and other similar risk characteristics, such as accounts in collection, and apply an aging method to estimate future credit losses utilizing inputs such as historical write-off experience, customer payment patterns, current collection data, and reasonable and supportable forecasts, as applicable. Credit risk with respect to accounts receivable is limited due to short payment terms. The Company also performs ongoing credit evaluations using applicable credit ratings of its customers to help analyze credit risk. We monitor ongoing credit exposure through frequent review of past due accounts (based on the payment terms of the contract) and follow-up with customers, as appropriate.We may employ collection agencies and legal counsel to pursue recovery of defaulted receivables.
Allowance for Credit Losses - Other Financial Assets The Company measures expected credit losses on qualified financial assets that do not result from revenue transactions using a probability of default method by type of financing receivable. The estimate of expected credit losses considers credit ratings, financial data, historical write-off experience, current conditions, and reasonable and supportable forecasts, as applicable, to estimate the risk of loss.
Cost of Services Cost of services are those costs directly associated with the earning of revenue. The primary examples of these types of costs are temporary employee wages, along with other employee related costs, including associated payroll taxes, temporary employee benefits, such as service bonus and holiday pay, and workers’ compensation costs. These costs differ fundamentally from SG&A expenses in that they arise specifically from the action of providing our services to customers whereas SG&A costs are incurred regardless of whether or not we place temporary employees with our customers.
Advertising Expenses Advertising expenses, which are expensed as incurred and are included in SG&A expenses, were $7.9$6.4 million in 2017 and $7.62022, $7.5 million in 20162021 and 2015.$8.1 million in 2020.
Use of Estimates The preparation of financial statements in conformity with generally accepted accounting principles requires management to make estimates and assumptions that affect the reported amounts in the consolidated financial statements and accompanying notes. Estimates are used for, but not limited to, the accounting for the allowance for uncollectible accounts
receivable and credit losses, workers’ compensation, goodwill and long-lived asset impairment, valuation of acquired intangibles, litigation costs and income taxes. Actual results could differ materially from those estimates.
Cash and Equivalents Cash and equivalents are stated at fair value. The Company considers securities with original maturities of three months or less to be cash and equivalents.
Property and Equipment Property and equipment are stated at cost and are depreciated on a straight-line basis over their estimated useful lives. Cost and estimated useful lives of property and equipment by function are as follows:
| Category | 2017 | 2016 | Life | Category | 2022 | 2021 | Useful Life | |||||||||||||||||||||||||||||||
| (In millions of dollars) | (In millions of dollars) | |||||||||||||||||||||||||||||||||||||
| Land | $ | 3.8 | $ | 3.8 | — | Land | $ | — | $ | — | — | |||||||||||||||||||||||||||
| Work in process | 5.3 | 0.8 | — | Work in process | 3.0 | 0.3 | — | |||||||||||||||||||||||||||||||
| Buildings and improvements | 64.9 | 61.1 | 15 | to | 45 years | Buildings and improvements | 0.4 | 12.9 | 15 | to | 40 years | |||||||||||||||||||||||||||
| Computer hardware and software | 154.2 | 145.0 | 3 | to | 12 years | Computer hardware and software | 126.8 | 147.9 | 3 | to | 12 years | |||||||||||||||||||||||||||
| Equipment, furniture and fixtures | 37.9 | 33.8 | 5 | years | Equipment, furniture and fixtures | 22.7 | 26.6 | 5 | years | |||||||||||||||||||||||||||||
| Leasehold improvements | 25.7 | 25.5 | The lesser of the life of the lease or 5 years. | Leasehold improvements | 13.9 | 17.4 | HQ: 15 years | |||||||||||||||||||||||||||||||
| Branches: Lesser of the lease or 5 years | ||||||||||||||||||||||||||||||||||||||
| Total property and equipment | $ | 291.8 | $ | 270.0 | Total property and equipment | $ | 166.8 | $ | 205.1 | |||||||||||||||||||||||||||||
The Company capitalizes external costs and internal payroll costs directly incurred in the development of software for internal use as required by the Internal-Use Software Subtopic of the Financial Accounting Standards Board (“FASB”) Accounting Standards Codification (“ASC”). Work in process represents capitalized costs for internal useinternal-use software not yet in service. Depreciation expense was $21.8$13.6 million for 2017, $20.72022, $16.4 million for 20162021 and $21.4$16.8 million for 2015.2020.
56
KELLY SERVICES, INC. AND SUBSIDIARIES
NOTES TO CONSOLIDATED FINANCIAL STATEMENTS (continued)
Cloud Computing Arrangements The Company recognizes rent expensehas cloud computing arrangements that are comprised of internal-use software platforms that are accounted for as service contracts. The Company does not have the ability to take possession of the software without significant penalty nor can the Company run the software on its own hardware or contract with another party unrelated to the vendor to host the software. Implementation costs associated with these cloud computing arrangements are capitalized when incurred during the application development phase. Amortization is calculated on a straight-line basis overand is a component of SG&A expenses in our consolidated statements of earnings.
Amortization expense was $4.2 million for 2022, $2.2 million for 2021, and $1.0 million for 2020. The related accumulated amortization totaled $7.3 million in 2022 and $3.2 million in 2021. Capitalized amounts related to such arrangements are recorded within prepaid and other current assets and non-current other assets in the lease term. This includesconsolidated balance sheet. As of year-end 2022 and 2021, the impact of both scheduled rent increasesCompany had $2.7 million recorded in prepaid expenses and free or reduced rents (commonly referred to as “rent holidays”). The Company records allowances provided by landlords for leasehold improvements as deferred rentother current assets in the consolidated balance sheet and as operating cash flows$21.0 million and $13.9 million, respectively, recorded in non-current other assets in the consolidated statementsbalance sheet related to capitalized cloud computing arrangements (see Other Assets footnote).
Leases Right-of-use("ROU") assets represent our right to use an underlying asset for the lease term and lease liabilities represent our obligation to make lease payments arising from the lease. Operating lease ROU assets and liabilities are recognized at commencement date based on the present value of cash flows.lease payments over the lease term. Since most of the Company’s leases do not have an implicit borrowing rate, we use our incremental borrowing rate based on the information available at commencement date in determining the present value of lease payments. Our leases may include options allowing us in our sole discretion to extend or terminate the lease, and when it is reasonably certain that we will exercise those options, we will include those periods in our lease term. Variable costs, such as payments for insurance and tax payments, are expensed when the obligation for those payments is incurred.
Goodwill and Other Intangible Assets Goodwill represents the excess of the purchase price over the acquisition date fair value of net assets acquired. Purchased intangible assets with definite livesare primarily comprised of acquired trade names and customer relationships that are recorded at estimated fair value at the date of acquisitionacquisition. The fair value of trade name intangibles is determined using the relief-from-royalty method, which relies on the use of estimates and assumptions about projected revenue growth rates, royalty rates and discount rates. The fair value of customer relationship intangibles is determined using the multi-period excess earnings method, which relies on the use of estimates and assumptions about projected revenue growth rates, customer attrition rates, profit margins and discount rates.
Purchased intangible assets with definite lives are amortized over their respective useful lives (from 35 to 15 years) on a straight-line basis or, if appropriate, on an accelerated basis commensurate with the related cash flows.basis.
Impairment of Long-Lived Assets, Intangible Assets, Goodwill, and Equity Method Investmentsand Equity Securities The Company evaluates long-lived assets and intangible assets with definite lives for impairment whenever events or changes in circumstances indicate that the carrying amount of an asset may not be recoverable. When estimated undiscounted future cash flows will not be sufficient to recover the asset group’s carrying amount of the asset group, in which the long-lived asset being tested for impairment resides, the asset is written down to its estimated fair value. Assets to be disposed of by sale, if any, are reported at the lower of the carrying amount or estimated fair value less cost to sell.
We test goodwill for impairment at the reporting unit level annually in the fourth quarter and whenever events or circumstances make it more likely than not that an impairment may have occurred. WeGenerally accepted accounting principles require that goodwill be tested for impairment at a reporting unit level. For segments with a goodwill balance, we have determined that our reporting units are the same as our operating and reportable segments based on our organizational structure. structure or one level below our operating segments (the component level).
We may first use a qualitative assessment for one or more reporting units("step zero test") for the annual goodwill impairment test if we have determined that it is more likely than not that the fair value of thefor one or more reporting unit(s)units is moregreater than their carrying value.
If we elect to forgo the qualitative assessment for a reporting unit, goodwill is tested for impairment using a two-step process. In the first step,by comparing the estimated fair value of a reporting unit is compared to its carrying value.value ("step one test"). If the estimated fair value of a reporting unit exceeds the carrying value of the net assets assigned to a reporting unit, goodwill is not considered impaired and no further testing is required.
57
KELLY SERVICES, INC. AND SUBSIDIARIES
NOTES TO CONSOLIDATED FINANCIAL STATEMENTS (continued)
required. If the carrying value of the net assets assigned to a reporting unit exceeds the estimated fair value of a reporting unit, a second step of the impairment test is performed in order to determine the implied fair value of a reporting unit’s goodwill. If the
For the step one quantitative test, we determine the fair value of our reporting units using the income approach. Under the income approach, estimated fair value is determined based on estimated future cash flows discounted by an estimated market participant weighted-average cost of capital, which reflects the overall level of inherent risk of the reporting unit being measured. Estimated future cash flows are based on our internal projection model and reflects management’s outlook for the reporting unit. Assumptions and estimates about future cash flows and discount rates are complex and often subjective. They can be affected by a variety of factors, including external factors such as industry and economic trends, and internal factors such as changes in our business strategy and our internal forecasts. Our analysis used the following significant assumptions: expected future revenue growth rates, profit margins and discount rate.
Prior to the sale of the majority of our investment in our equity affiliate, we evaluated our equity method investment for indicators of impairment on a periodicquarterly basis or whenever events or circumstances indicateindicated the carrying amount may be other-than-temporarily impaired. If we concludehad concluded that there iswas an other-than-temporary impairment of our equity method investment, we will adjustwould have adjusted our carrying amount of our investment to the adjusted fair value.
We evaluate our equity securities measured under the measurement alternative for indicators of impairment on a quarterly basis and whenever observable price changes occur. The measurement alternative represents cost, less impairment, plus or minus observable price changes. Quarterly, we also confirm the securities still qualify to be measured in accordance with the measurement alternative. The value of the securities will be adjusted for any increases or decreases as a result of an observable price change.
Accounts Payable Included in accounts payable balances are book overdrafts, which are outstanding checks in excess of funds on deposit. Such amounts totaled $7.3$0.4 million and $8.8$5.4 million at year-end 20172022 and 2016,2021, respectively.
Accrued Payroll and Related Taxes Included in current accrued payroll and related taxes are book overdrafts, which are outstanding checks in excess of funds on deposit. Such amounts totaled $18.6$67.6 million and $18.4$39.1 million at year-end 20172022 and 2016,2021, respectively. Payroll taxes for temporary employees are recognized proportionately to direct wages for interim periods based on expected full-year amounts. Included in 2021 current and noncurrent accrued payroll and related taxes are deferred U.S. payroll tax payments as allowed by COVID-19 economic relief legislation.
Income Taxes The Company accounts for income taxes using the liability method. Under this method, deferred tax assets and liabilities are recognized for the expected tax consequences of temporary differences between the tax bases of assets and liabilities and their reported amounts. Valuation allowances are provided against deferred tax assets when it is more likely than not that some portion or all of the deferred tax asset will not be realized.
The U.S. work opportunity credit is allowed for wages earned by employees in certain targeted groups. The actual amount of creditable wages in a particular period is estimated, since the credit is only available once an employee reaches a minimum employment period and the employee’s inclusion in a targeted group is certified by the applicable state. As these events often occur after the period the wages are earned, judgment is required in determining the amount of work opportunity credits accrued for in each period. We evaluate the accrual regularly throughout the year and make adjustments as needed.
Uncertain tax positions that are taken or expected to be taken in a tax return are recognized in the financial statements when it is more likely than not (i.e., a likelihood of more than fifty percent) that the position would be sustained upon examination by tax authorities that have full knowledge of all relevant information. A recognized tax position is then measured at the largest amount of benefit that is greater than fifty percent likely of being realized upon ultimate settlement.
Interest and penalties related to income taxes are classified as income tax expense. U.S. taxes on global intangible low-taxed income will be(“GILTI”) are accounted for as a current period expense when incurred.
Stock-Based Compensation The Company may grant restricted stock awards and units (collectively, “restricted stock”), stock options (both incentive and nonqualified), stock appreciation rights and performance awards of the Company's Class A stock to key employees associated with the Company’s Class A stock.employees. The Company utilizes the market price on the date of grant as the fair value for restricted stock and the market price on the date of grant less the present value of the expected dividends not received during the vesting period for performance awards. The Company also estimates a fair value of performance awards related to relative total shareholder return using a Monte Carlo simulation model. The Company estimates the fair value of stock option awards, if any, on the date of grant using an option-pricing model. The value of awards is recognized as expense, net of forfeitures as they occur, over the requisite service periods in SG&A expense in the Company’s consolidated statements of earnings.
58
KELLY SERVICES, INC. AND SUBSIDIARIES
NOTES TO CONSOLIDATED FINANCIAL STATEMENTS (continued)
Earnings Per Share Restricted stock that entitle their holders to receive nonforfeitable dividends before vesting are considered participating securities and, therefore, are included in the calculation of earnings per share using the two-class method. The two-class method is an earnings allocation formula that determines earnings per share for each class of common stock and participating security according to dividends declared and participation rights in undistributed earnings. Under this method, earnings from continuing operations (or net earnings) is reduced by the amount of dividends declared, and the remaining undistributed earnings is allocated to common stock and participating securities based on the proportion of each class’s weighted average shares outstanding to the total weighted average shares outstanding. The calculation of diluted earnings per share includes the effect of potential common shares outstanding in the average weighted shares outstanding.
Workers’ Compensation In the U.S., the Company has a combination of insurance and self-insurance contracts under which we effectively bear the first $1.0 million of risk per single accident. The Company establishes accruals for workers’ compensation claims utilizing actuarial methods to estimate the undiscounted future cash payments that will be made to satisfy the claims, including an allowance for incurred-but-not-reported claims. The estimates areCompany retains an independent consulting actuary to establish loss development factors and loss rates, based both on historical claims experience as well as industry experience, and applies those factors to current legal, economicclaims information to derive an estimate of the ultimate claims liability.
In preparing the estimates, the consulting actuary considers a number of assumptions and regulatory factors.multiple generally accepted actuarial methods in the course of preparing the loss forecast for claims. When claims exceed the applicable loss limit or self-insured retention and realization of recovery of the claim from existing insurance policies is deemed probable, the Company records a receivable from the insurance company for the excess amount. The receivable is included in prepaid expenses and other current assets and other assets in the consolidated balance sheet at year end. The Company regularly updates its estimates,evaluates the accrual quarterly throughout the year and makes adjustments as needed, and the ultimate cost of these claims may be greater than or less than the established accrual.
59
KELLY SERVICES, INC. AND SUBSIDIARIES
NOTES TO CONSOLIDATED FINANCIAL STATEMENTS (continued)
2. Revenue
Revenue Disaggregated by Service Type
Kelly has five operating segments: Professional & Industrial (“P&I”), Science, Engineering & Technology (“SET”), Education, Outsourcing & Consulting Group ("Outsourcing & Consulting," "OCG") and International. Other than OCG, each segment delivers talent through staffing services, permanent placement or outcome-based services. Our OCG segment delivers talent solutions including managed service provider ("MSP"), payroll process outsourcing ("PPO"), recruitment process outsourcing ("RPO"), and talent advisory services. International also delivers RPO talent solutions within its local markets.
The following table presents our segment revenues disaggregated by service type (in millions of dollars):
| December Year to Date | ||||||||||||||||||||||||||||||||
| 2022 | 2021 | 2020 | ||||||||||||||||||||||||||||||
| Professional & Industrial | ||||||||||||||||||||||||||||||||
| Staffing services | $ | 1,228.2 | $ | 1,402.4 | $ | 1,423.3 | ||||||||||||||||||||||||||
| Permanent placement | 28.9 | 24.7 | 9.9 | |||||||||||||||||||||||||||||
| Outcome-based services | 409.1 | 410.3 | 425.2 | |||||||||||||||||||||||||||||
| Total Professional & Industrial | 1,666.2 | 1,837.4 | 1,858.4 | |||||||||||||||||||||||||||||
| Science, Engineering & Technology | ||||||||||||||||||||||||||||||||
| Staffing services | 869.0 | 813.2 | 751.8 | |||||||||||||||||||||||||||||
| Permanent placement | 29.7 | 24.4 | 12.5 | |||||||||||||||||||||||||||||
| Outcome-based services | 366.7 | 319.2 | 254.8 | |||||||||||||||||||||||||||||
| Total Science, Engineering & Technology | 1,265.4 | 1,156.8 | 1,019.1 | |||||||||||||||||||||||||||||
| Education | ||||||||||||||||||||||||||||||||
| Staffing services | 627.8 | 411.5 | 286.4 | |||||||||||||||||||||||||||||
| Permanent placement | 8.4 | 5.0 | 0.5 | |||||||||||||||||||||||||||||
| Total Education | 636.2 | 416.5 | 286.9 | |||||||||||||||||||||||||||||
| Outsourcing & Consulting | ||||||||||||||||||||||||||||||||
| Talent solutions | 468.0 | 432.1 | 363.5 | |||||||||||||||||||||||||||||
| Total Outsourcing & Consulting | 468.0 | 432.1 | 363.5 | |||||||||||||||||||||||||||||
| International | ||||||||||||||||||||||||||||||||
| Staffing services | 892.3 | 1,032.9 | 971.8 | |||||||||||||||||||||||||||||
| Permanent placement | 22.6 | 21.3 | 16.8 | |||||||||||||||||||||||||||||
| Talent solutions | 17.3 | 13.6 | — | |||||||||||||||||||||||||||||
| Total International | 932.2 | 1,067.8 | 988.6 | |||||||||||||||||||||||||||||
| Total Intersegment | (2.6) | (0.9) | (0.5) | |||||||||||||||||||||||||||||
| Total Revenue from Services | $ | 4,965.4 | $ | 4,909.7 | $ | 4,516.0 | ||||||||||||||||||||||||||
60
KELLY SERVICES, INC. AND SUBSIDIARIES
NOTES TO CONSOLIDATED FINANCIAL STATEMENTS (continued)
Revenue Disaggregated by Geography
Our operations are subject to different economic and regulatory environments depending on geographic location. Our P&I and Education segments operate in the Americas region, our SET segment operates in the Americas and Europe regions, and OCG operates in the Americas, Europe and Asia-Pacific regions. The International segment includes Europe and our Brazil and Mexico operations, which are included in the Americas region. Our Russian operations were sold in the third quarter of 2022 and our Brazil operations were sold in August 2020 (see Acquisitions and Dispositions footnote).
The below table presents our revenues disaggregated by geography (in millions of dollars):
| December Year to Date | ||||||||||||||||||||
| 2022 | 2021 | 2020 | ||||||||||||||||||
| Americas | ||||||||||||||||||||
| United States | $ | 3,671.5 | $ | 3,513.4 | $ | 3,260.2 | ||||||||||||||
| Canada | 168.2 | 155.0 | 122.5 | |||||||||||||||||
| Puerto Rico | 112.4 | 102.1 | 77.0 | |||||||||||||||||
| Mexico | 46.5 | 92.7 | 114.4 | |||||||||||||||||
| Brazil | — | — | 17.0 | |||||||||||||||||
| Total Americas Region | 3,998.6 | 3,863.2 | 3,591.1 | |||||||||||||||||
| Europe | ||||||||||||||||||||
| Switzerland | 222.8 | 222.2 | 200.4 | |||||||||||||||||
| France | 199.4 | 223.1 | 198.2 | |||||||||||||||||
| Portugal | 169.5 | 158.2 | 141.7 | |||||||||||||||||
| Italy | 69.3 | 74.2 | 58.2 | |||||||||||||||||
| Russia | 63.4 | 132.2 | 118.5 | |||||||||||||||||
| United Kingdom | 57.1 | 68.3 | 73.7 | |||||||||||||||||
| Other | 143.2 | 128.8 | 104.6 | |||||||||||||||||
| Total Europe Region | 924.7 | 1,007.0 | 895.3 | |||||||||||||||||
| Total Asia-Pacific Region | 42.1 | 39.5 | 29.6 | |||||||||||||||||
| Total Kelly Services, Inc. | $ | 4,965.4 | $ | 4,909.7 | $ | 4,516.0 | ||||||||||||||
61
KELLY SERVICES, INC. AND SUBSIDIARIES
NOTES TO CONSOLIDATED FINANCIAL STATEMENTS (continued)
The below table presents our SET, OCG and International segment revenues disaggregated by geographic region (in millions of dollars):
| December Year to Date | ||||||||||||||||||||
| 2022 | 2021 | 2020 | ||||||||||||||||||
| Science, Engineering & Technology | ||||||||||||||||||||
| Americas | $ | 1,250.3 | $ | 1,149.3 | $ | 1,013.7 | ||||||||||||||
| Europe | 15.1 | 7.5 | 5.4 | |||||||||||||||||
| Total Science, Engineering & Technology | $ | 1,265.4 | $ | 1,156.8 | $ | 1,019.1 | ||||||||||||||
| Outsourcing & Consulting | ||||||||||||||||||||
| Americas | $ | 403.3 | $ | 369.4 | $ | 302.2 | ||||||||||||||
| Europe | 22.6 | 23.2 | 31.7 | |||||||||||||||||
| Asia-Pacific | 42.1 | 39.5 | 29.6 | |||||||||||||||||
| Total Outsourcing & Consulting | $ | 468.0 | $ | 432.1 | $ | 363.5 | ||||||||||||||
| International | ||||||||||||||||||||
| Americas | $ | 45.2 | $ | 91.5 | $ | 130.4 | ||||||||||||||
| Europe | 887.0 | 976.3 | 858.2 | |||||||||||||||||
| Total International | $ | 932.2 | $ | 1,067.8 | $ | 988.6 | ||||||||||||||
Deferred Costs
Deferred fulfillment costs, which are included in prepaid expenses and other current assets in the consolidated balance sheet, were $2.7 million as of year-end 2022 and $1.3 million as of 2021. Amortization expense for the deferred costs was $10.1 million for 2022, $20.5 million for 2021 and $21.5 million for 2020. As of year-end 2022, there was no impairment loss in relation to the costs capitalized.
3. Credit Losses
The rollforward of our allowance for credit losses related to trade accounts receivable, which is recorded in trade accounts receivable, less allowance in the consolidated balance sheet, is as follows (in millions of dollars):
| December Year to Date | |||||||||||||||||
| 2022 | 2021 | 2020 | |||||||||||||||
| Allowance for credit losses: | |||||||||||||||||
| Beginning balance | $ | 9.4 | $ | 9.8 | $ | 9.7 | |||||||||||
| Impact of adopting ASC 326 | — | — | 0.3 | ||||||||||||||
| Current period provision | 1.3 | 1.3 | 2.0 | ||||||||||||||
| Currency exchange effects | (0.2) | (0.5) | 0.1 | ||||||||||||||
| Write-offs | (2.8) | (1.2) | (2.3) | ||||||||||||||
| Ending balance | $ | 7.7 | $ | 9.4 | $ | 9.8 | |||||||||||
Write-offs are presented net of recoveries, which were not material for December year to date 2022, 2021 and 2020.
We were engaged in litigation with a customer over a disputed accounts receivable balance for certain services rendered more than five years ago, which had been recorded as a long-term receivable in other assets in the consolidated balance sheet. In September 5, 2017,2020, a ruling was issued in favor of the customer, which we appealed. Upon receiving the ruling, we increased our allowance for credit losses by $9.2 million in the third quarter of 2020 to reflect the likelihood of collection, which was recorded in other assets in the consolidated balance sheet. The related allowance for credit losses on this long-term customer receivable was $10.9 million as of year-end 2020 and represented the likelihood of collection. In September 2021, a final
62
KELLY SERVICES, INC. AND SUBSIDIARIES
NOTES TO CONSOLIDATED FINANCIAL STATEMENTS (continued)
ruling in the case was entered in favor of the customer. As a result, in the third quarter of 2021, we wrote off the entire receivable balance with this customer, including $0.6 million not previously reserved. The unreserved portion was recorded in SG&A expenses in the consolidated statements of earnings. The rollforward of our allowance for credit losses related to the long-term customer receivable, which was recorded in other assets in the consolidated balance sheet, is as follows (in millions of dollars):
| December Year to Date | |||||||||||||||||
| 2021 | 2020 | ||||||||||||||||
| Allowance for credit losses: | |||||||||||||||||
| Beginning balance | $ | 10.9 | $ | 1.0 | |||||||||||||
| Impact of adopting ASC 326 | — | 0.7 | |||||||||||||||
| Current period provision | 0.6 | 9.5 | |||||||||||||||
| Currency exchange effects | — | (0.3) | |||||||||||||||
| Write-offs | (11.5) | — | |||||||||||||||
| Ending Balance | $ | — | $ | 10.9 | |||||||||||||
There were no long-term customer receivables in 2022. No allowances related to other receivables were material for December year to date 2022, 2021 and 2020.
4. Acquisitions and Dispositions
Acquisitions
In the second quarter of 2022, Kelly Services USA, LLC ("KSU"), a wholly owned subsidiary of the Company, acquired Pediatric Therapeutic Services ("PTS"), as detailed below. In the first quarter of 2022, the Company acquired Rocket Power Holdings LLC and Rocket Power Ops LLC (collectively, "RocketPower"), as detailed below. In the second quarter of 2021, the Company acquired Softworld, Inc. ("Softworld"), as detailed below. In the fourth quarter of 2020, KSU acquired Greenwood/Asher & Associates, LLC ("Greenwood/Asher"), as detailed below. In the first quarter of 2020, KSU acquired Insight Workforce Solutions LLC and its affiliate, Insight EDU LLC (collectively, "Insight"), as detailed below.
Pediatric Therapeutic Services
On May 2, 2022, KSU acquired 100% of the issued and outstanding sharesmembership interests of Teachers On Call, Inc. (“TOC”), an educational staffing firm in the U.S.PTS for a purchase price of $41.0$82.1 million. PTS is a specialty firm that provides and manages various state and federally mandated in-school therapy services. This acquisition expands Education's K-12 solution offering in the education staffing market and serves as an entry point into the therapeutic services market. Under terms of the purchase agreement, the purchase price was adjusted for cash held by TOCPTS at the closing date less anand estimated working capital adjustmentadjustments resulting in the Company paying cash of $39.0$85.7 million. Total consideration includes $1.1 million at closing.of additional consideration that is payable to the seller related to employee retention credits and is recorded in accounts payable and accrued liabilities in the consolidated balance sheet. In the third quarter of 2022, the Company paid $0.1 million of the employee retention credits and the remainder is expected to be paid in the first quarter of 2023. The total consideration is as follows (in millions of dollars):
| Cash consideration paid | $ | 85.7 | |||
| Additional consideration payable | 1.1 | ||||
| Total consideration | $ | 86.8 | |||
Due to the limited amount of time that has passed since acquiring PTS, the purchase price allocation for this acquisition is preliminary and could change. As of year-end 2017, there have been no significant purchase price adjustments.
63
KELLY SERVICES, INC. AND SUBSIDIARIES
NOTES TO CONSOLIDATED FINANCIAL STATEMENTS (continued)
| Cash | $ | 1.8 | |
| Other current assets | 3.6 | ||
| Goodwill | 18.7 | ||
| Intangibles | 18.3 | ||
| Other noncurrent assets | 0.5 | ||
| Current liabilities | (3.9 | ) | |
| Purchase price paid at closing | $ | 39.0 | |
| Cash | $ | 0.9 | |||
| Trade accounts receivable | 10.0 | ||||
| Prepaid expenses and other current assets | 1.6 | ||||
| Net property and equipment | 0.4 | ||||
| Goodwill | 36.3 | ||||
| Intangibles | 40.3 | ||||
| Accounts payable and accrued liabilities, current | (2.6) | ||||
| Accrued payroll and related taxes, current | (0.1) | ||||
| Total consideration, including working capital adjustments | $ | 86.8 | |||
The fair value of the acquired receivables represents the contractual value. Included in the assets purchased in the PTS acquisition was approximately $18.3$40.3 million of intangible assets,intangibles, made up of $12.0$29.8 million in customer relationships, $4.8$9.3 million associated with TOC’s trademarkPTS's trade names and $1.5$1.2 million for a candidate database. The customernon-compete agreements. Customer relationships are beingwill be amortized on a straight-line basis over 1015 years with no residual value, trade names will be amortized over 15 years with no residual value, and the database is beingnon-compete agreements will be amortized on a straight-line basis over fourfive years with no residual value. The trademark has an indefinite life. Goodwill generated from thisthe acquisition iswas primarily attributable to expected synergies from combining operations and expanding market potential and iswas assigned to the Americas Staffing reporting unitEducation operating segment (see Goodwill and Intangible Assets footnote). All of the goodwill is expected to be deductible for tax purposes.
PTS's results of operations are included in the Education segment. Our consolidated revenues and earnings from operations for the year ended 2022 included $28.5 million and $3.8 million, respectively, from PTS. Pro forma results of operations for this acquisition have not been presented as the acquisition does not have a material impact to the consolidated statements of earnings.
RocketPower
On March 7, 2022, the Company acquired 100% of the issued and outstanding membership interests of RocketPower for a purchase price of $59.3 million. RocketPower is a leading provider of RPO and other outsourced talent solutions to U.S. high-tech companies. This acquisition expands OCG's RPO solution and delivery offering and enhances the specialty RPO strategy and expertise within the high-tech industry. Under terms of the purchase agreement, the purchase price was adjusted for cash held by RocketPower at the closing date and estimated working capital adjustments resulting in the Company paying cash of $61.8 million. Total consideration includes $1.1 million of additional consideration that is payable to the seller in 2023 related to employee retention credits and contingent consideration with an initial estimated fair value of $0.6 million related to an earnout payment with a maximum potential cash payment of $31.8 million in the event certain financial metrics are met per the terms of the agreement. The initial fair value of the earnout was established using a Black Scholes model and it was reassessed throughout 2022 (see Fair Value Measurements footnote). The total consideration is as follows (in millions of dollars):
| Cash consideration paid | $ | 61.8 | |||
| Additional consideration payable | 1.1 | ||||
| Contingent consideration | 0.6 | ||||
| Total consideration | $ | 63.5 | |||
64
KELLY SERVICES, INC. AND SUBSIDIARIES
NOTES TO CONSOLIDATED FINANCIAL STATEMENTS (continued)
Due to the limited amount of time that has passed since acquiring RocketPower, the purchase price allocation for this acquisition is preliminary and could change. The following table summarizes the estimated fair values of the assets acquired and liabilities assumed as of the date of the acquisition (in millions of dollars):
| Cash | $ | 3.5 | |||
| Trade accounts receivable | 6.9 | ||||
| Prepaid expenses and other current assets | 1.8 | ||||
| Net property and equipment | 0.1 | ||||
| Goodwill | 41.0 | ||||
| Intangibles | 15.8 | ||||
| Accounts payable and accrued liabilities, current | (2.9) | ||||
| Accrued payroll and related taxes, current | (1.5) | ||||
| Other long-term liabilities | (1.2) | ||||
| Total consideration, including working capital adjustments | $ | 63.5 | |||
The fair value of the acquired receivables represents the contractual value. Included in the assets purchased in the RocketPower acquisition was $15.8 million of intangible assets, made up of $7.5 million in customer relationships, $6.6 million associated with RocketPower's trade names and $1.7 million for non-compete agreements. Customer relationships will be amortized over three years with no residual value, trade names will be amortized over 10 years with no residual value, and the non-compete agreements will be amortized over six years with no residual value. Goodwill generated from the acquisition was primarily attributable to expected synergies from combining operations and expanding market potential and was assigned to the OCG operating segment. The amount of goodwill expected to be deductible for tax purposes is approximately $18.3$27.5 million. An indemnification assetIn the third and fourth quarters of $2.82022, changes in market conditions triggered interim impairment tests for both long-lived assets and goodwill, resulting in the Company recording a goodwill impairment charge of $41.0 million was recognized(see Goodwill and Intangible Assets footnote).
RocketPower's results of operations are included in the OCG segment in 2022. Our consolidated revenues and earnings from operations for the year ended 2022 included $24.3 million and a loss of $43.5 million, which includes the $41.0 million goodwill impairment charge, respectively, from RocketPower. Pro forma results of operations for this acquisition have not been presented as the acquisition does not have a material impact to the consolidated statements of earnings.
Softworld
On April 5, 2021, the Company acquired 100% of the shares of Softworld for a purchase price of $215.0 million. Softworld is a leading technology staffing and workforce solutions firm that serves clients across several end-markets, including financial services, life sciences, aerospace, defense, insurance, retail and IT consulting. This acquisition is intended to expand our capabilities, scale and solution set in our technology specialty. Under terms of the purchase agreement, the purchase price was adjusted for cash held by Softworld at the closing date relatedand estimated working capital adjustments resulting in the Company paying cash of $220.4 million. Total consideration included $2.6 million of additional consideration that was paid to pre-acquisition tax liabilities. At year-end 2017 the indemnification asset is $0.5 million with the change driven by cash received from the seller in the fourth quarter to pay pre-acquisition tax liabilities.
| Cash consideration paid | $ | 220.4 | |||
| Additional consideration payable | 2.6 | ||||
| Net working capital adjustment | (6.0) | ||||
| Total consideration | $ | 217.0 | |||
As of first quarter-end 2022, the Company’s interest in PersolKelly Asia Pacific are accountedpurchase price allocation for on a one-quarter lag under the equity method and are included in equity in net earnings (loss) of affiliate in the consolidated statement of earnings, which amounted to $2.7 million in 2017 and $1.1 million in 2016. PersolKelly Asia Pacific will perform its annual impairment test of goodwill in its fourth quarter. Any impairment, if required, would then be recorded by the Company based on the one-quarter lag. We would consider any impairment recorded by PersolKelly Asia Pacific to be a triggering event to perform our own impairment analysis regarding our investment in PersolKelly Asia Pacific.this acquisition was final.
65
KELLY SERVICES, INC. AND SUBSIDIARIES
NOTES TO CONSOLIDATED FINANCIAL STATEMENTS (continued)
The following table summarizes the estimated fair values of the assets acquired and liabilities assumed as of the date of the acquisition (in millions of dollars):
| Cash | $ | 1.4 | |||
| Trade accounts receivable | 21.6 | ||||
| Prepaid expenses and other current assets | 3.3 | ||||
| Net property and equipment | 1.2 | ||||
| Operating lease right-of-use assets | 7.6 | ||||
| Non-current deferred tax | 5.9 | ||||
| Goodwill | 111.3 | ||||
| Intangibles | 79.4 | ||||
| Other assets, noncurrent | 1.2 | ||||
| Accounts payable and accrued liabilities, current | (2.5) | ||||
| Operating lease liabilities, current | (1.3) | ||||
| Accrued payroll and related taxes, current | (4.6) | ||||
| Income and other taxes, current | (1.2) | ||||
| Operating lease liabilities, noncurrent | (6.3) | ||||
| Total consideration, including working capital adjustments | $ | 217.0 | |||
The fair value of the acquired receivables represents the contractual value. Included in the assets purchased in the Softworld acquisition was $79.4 million of intangible assets, made up of $54.9 million in customer relationships, $23.1 million associated with Softworld's trade name, and $1.4 million for non-compete agreements. The customer relationships and trade name will be amortized over 10 years with no residual value and the non-compete agreements will be amortized over five years with no residual value. Goodwill generated from the acquisition was primarily attributable to expanding market potential and the expected revenue synergies and was assigned to the SET operating segment (see Goodwill footnote). All of the goodwill is expected to be deductible for tax purposes.
During the third quarter of 2021, the Company filed a claim, in excess of policy limits, under a representations and warranties insurance policy purchased by the Company in connection with the acquisition of Softworld. The claim asserted damages arising out of alleged breaches by the sellers of Softworld of certain representations and warranties contained in the purchase agreement relating to periods prior to the closing of the acquisition. In the fourth quarter of 2021, the Company reached a settlement with the insurer for $19.0 million and received the payment. The payment was recorded entirely in gain on insurance settlement in the consolidated statements of earnings and included within cash flows from investing activities in the consolidated statements of cash flows.
Softworld's results of operations are included in the SET segment. For the year ended 2021, our consolidated revenues and net earnings included $98.0 million and $4.7 million from Softworld, respectively. The date of the acquisition was the first day of our second quarter, therefore, our first quarter results of 2021 do not include any revenue or earnings from Softworld.
Pro Forma Information
The following unaudited pro forma information presents a summary of the operating results as if the Softworld acquisition had been completed as of December 30, 2019 (in millions of dollars):
| December Year to Date | |||||||||||||||||||||||
| 2021 | 2020 | ||||||||||||||||||||||
| Pro forma revenues | $ | 4,940.9 | $ | 4,626.5 | |||||||||||||||||||
| Pro forma net earnings (loss) | $ | 157.7 | $ | (70.8) | |||||||||||||||||||
The pro forma results for 2021 and 2020 reflects amortization of the intangible assets of $2.0 million per quarter, a non-recurring adjustment to reclassify $1.3 million of transaction expenses from 2021 to 2020, deferred compensation from 2020 and applicable taxes. The unaudited pro forma information presented has been prepared for comparative purposes only and is
66
KELLY SERVICES, INC. AND SUBSIDIARIES
NOTES TO CONSOLIDATED FINANCIAL STATEMENTS (continued)
not necessarily indicative of the results of operations as they would have been had the acquisitions occurred on the assumed date, nor is it necessarily an indication of future operating results.
Greenwood/Asher
On November 18, 2020, KSU acquired 100% of the membership interests of Greenwood/Asher, a premier specialty education executive search firm in the U.S., for a purchase price of $3.5 million. Under terms of the purchase agreement, the purchase price was adjusted for cash held by Greenwood/Asher at the closing date and estimated working capital adjustments resulting in the Company paying cash of $5.2 million. The purchase price of the acquisition also includes contingent consideration with an initial estimated fair value of $2.1 million related to an earnout payment in the event certain conditions are met per the terms of the agreement. The initial fair value of the earnout was established using a Black Scholes model and it is revalued quarterly, resulting in a net increase of $2.5 million to the liability in 2021, and an increase of $1.0 million to the liability in 2022 (see Fair Value Measurements footnote). During the first quarter of 2022, the Company paid the first year earnout payment of $2.3 million. The earnout liability as of year-end 2022 is $3.3 million, which is recorded in accounts payable and accrued liabilities in the consolidated balance sheet, and is expected to be paid in the first quarter of 2023 pursuant to the terms of the purchase agreement. As of third quarter-end 2021, the purchase price allocation for this acquisition was final.
This acquisition is intended to expand our revenue opportunities in the education industry in the U.S. Greenwood/Asher's results of operations are included in the Education segment. Pro forma results of operations for this acquisition have not been presented as they are not material to the consolidated statements of earnings.
Insight
On January 14, 2020, KSU acquired 100% of the membership interests of Insight, an educational staffing company in the U.S., for a purchase price of $34.5 million. Under terms of the purchase agreement, the purchase price was adjusted for cash held by Insight at the closing date and estimated working capital adjustments resulting in the Company paying cash of $38.1 million. The purchase price of the acquisition also included contingent consideration with an estimated fair value of $1.6 million related to an earnout payment in the event certain conditions were met per the terms of the agreement. The initial fair value of the earnout was established using a Monte Carlo simulation and the liability was recorded in accounts payable and accrued liabilities in the consolidated balance sheet (see Fair Value Measurements footnote). Subsequently, the earnout was revalued, resulting in a net increase to the liability of $0.1 million in 2020 and a further increase of $0.1 million in 2021. In the third quarter of 2016,2021, the Company paid the final earnout amount of $1.8 million in cash. In our consolidated statements of cash flows, $1.6 million of the payment is reflected as a financing activity representing the initial fair value of the earnout, with the remainder flowing through operating activities. There was no remaining liability for the earnout as of year-end 2022 or 2021. In the second quarter of 2020, the Company paid a working capital adjustment of $0.1 million. As of year-end 2020, the purchase price allocation was final.
This acquisition is intended to increase our market share in the education staffing market in the U.S. Insight's results of operations are included in the Education segment. Pro forma and actual results of operations for this acquisition have not been presented as it is not material to the consolidated statements of earnings.
Dispositions
Russia operations
On July 20, 2022, the Company completed the sale of its Russia operations ("disposal group"), which was included in the Company's International operating segment. The Company received cash proceeds of $7.4 million, which is less than the cash disposed of in the sale, resulting in investing cash outflows of $6.0 million in the consolidated statements of cash flows. The disposal group was previously reported as held for sale as of our second quarter-end 2022 with an $18.5 million impairment charge associated with the transaction. The total loss on the sale is $18.7 million, resulting from an additional $0.2 million loss on the transaction in the third quarter of 2022, which is recorded in loss on disposal in the consolidated statements of earnings. The loss on disposal includes the liquidation of the cumulative translation adjustment of $1.4 million.
The disposal group does not meet the requirements to be classified as discontinued operations as the sale does not have a material effect on the Company's operations and does not represent a strategic shift in the Company's strategy. Our consolidated revenue for the year ended 2022, 2021 and 2020 includes $63.4 million, $132.2 million, and $118.5 million, respectively, from the Russia operations and our consolidated earnings before taxes for the year ended 2022, 2021 and 2020 includes $1.4 million, $3.2 million and $2.4 million, respectively, from the Russia operations.
67
KELLY SERVICES, INC. AND SUBSIDIARIES
NOTES TO CONSOLIDATED FINANCIAL STATEMENTS (continued)
The major classes of divested assets and liabilities were as follows (in millions of dollars):
| Assets divested | ||||||||
| Cash and equivalents | $ | 13.4 | ||||||
| Trade accounts receivable, net | 22.8 | |||||||
| Prepaid expenses and other current assets | 0.7 | |||||||
| Property and equipment, net | 0.7 | |||||||
| Deferred taxes | 0.4 | |||||||
| Other assets | 0.3 | |||||||
| Assets divested | 38.3 | |||||||
| Liabilities divested | ||||||||
| Accounts payable and accrued liabilities | (0.6) | |||||||
| Accrued payroll and related taxes | (7.3) | |||||||
| Income and other taxes | (5.7) | |||||||
| Liabilities divested | (13.6) | |||||||
| Disposal group, net | $ | 24.7 | ||||||
Brazil operations
On August 18, 2020, the Company sold its Brazil operations for a purchase price of $1.4 million. The Company received cash proceeds of $1.2 million, net of cash disposed. As a part of the transaction, the Company has agreed to indemnify the buyer for losses and costs incurred in connection with certain events or occurrences initiated within a six-year period after closing. The aggregate losses for which the Company will provide indemnification shall not exceed $8.8 million. Accordingly, the Company recorded a pretax gainan indemnification liability of $87.2$2.5 million, on the investment in PersolKelly Asia Pacific in the consolidated statement of earnings, which represented the fair value of the liability at the time of disposition and completely offset the gain on the sale. The indemnification liability is revalued on a quarterly basis (see Fair Value Measurements footnote).
5. Investment in Persol Holdings
Prior to February 2022, the Company had a yen-denominated investment through the Company's subsidiary, Kelly Services Japan, Inc., in the common stock of Persol Holdings Co., Ltd. ("Persol Holdings"), the 100% owner of Persol Asia Pacific Pte. Ltd., the Company’s retainedjoint venture partner in PersolKelly Pte. Ltd. (the "JV"). In February 2022, the Company's board approved a series of transactions that ended the cross-shareholding agreement with Persol Holdings.
On February 14, 2022, the Company repurchased 1,576,169 Class A and 1,475 Class B common shares held by Persol Holdings for $27.2 million. The purchase price was based on the average closing price of the last five business days prior to the transaction. The shares were subsequently retired and returned to an authorized, unissued status. In accordance with the Company's policy, the amount paid to repurchase the shares in excess of par value of $25.6 million was recorded to earnings invested in the business in the consolidated balance sheet at the time of the share retirement.
On February 15, 2022, Kelly Services Japan, Inc. sold the investment in the common stock of Persol Holdings in an open-market transaction for proceeds of $196.9 million, net of transaction fees. As our investment was a noncontrolling interest in Persol Holdings, the investment was recorded at fair value based on the quoted market price of Persol Holdings stock on the Tokyo Stock Exchange through the date of the transaction (see Fair Value Measurements footnote). The $67.2 million loss in the first quarter of 2022 recorded in gain (loss) on investment in Persol Holdings in the consolidated statements of earnings included $52.4 million for losses related to changes in fair value up to the date of the transaction and $14.8 million for the discount from the market price on the date of the sale and transaction costs. A gain on the investment of $121.8 million and a loss on the investment of $16.6 million for the years ended 2021 and 2020, respectively, was recorded in gain (loss) on investment in Persol Holdings in the consolidated statements of earnings.
68
KELLY SERVICES, INC. AND SUBSIDIARIES
NOTES TO CONSOLIDATED FINANCIAL STATEMENTS (continued)
Subsequent to the transaction discussed above, the Company commenced the dissolution process of its Kelly Services Japan, Inc. subsidiary, which was considered substantially liquidated as of first quarter-end 2022. As a result, the Company recognized a $20.4 million cumulative translation adjustment loss in the first quarter of 2022, which is recorded in loss on currency translation from liquidation of subsidiary in the consolidated statements of earnings. The Company also recognized a $5.5 million foreign exchange gain related to U.S.-denominated cash equivalents held by Kelly Services Japan, Inc. following the sale of the Persol Holdings shares and prior to a dividend payment to the Company in the first quarter of 2022. The foreign exchange gain is recorded in other income (expense), net in the consolidated statements of earnings. The dissolution of the Kelly Services Japan, Inc. subsidiary was completed in the fourth quarter of 2022.
6. Investment in PersolKelly Pte. Ltd.
Prior to February 2022, the Company had a 49% ownership interest in the JV (see Investment in Persol Holdings footnote above), a staffing services business operating in ten geographies in the Asia-Pacific region. On February 14, 2022, the Company entered into an agreement to sell 95% of the Company's shares in the JV to Persol Asia Pacific in addition toPte. Ltd. On March 1, 2022, the Company received cash received less theproceeds of $119.5 million. The carrying value of net assets transferredthe shares sold was $117.6 million. In addition, the Company had $1.9 million of accumulated other comprehensive income representing the Company's share of the JV's other comprehensive income over time related to the joint venture. Income taxesshares sold that was realized upon the sale, offsetting the $1.9 million gain that resulted from the proceeds in excess of$23.5 million on this gain resulted primarily from recording deferred income taxes on outside basis differences. the carrying value.
The fair valueoperating results of the Company’s contributed operations was determined using both an income-basedinterest in the JV were accounted for on a one-quarter lag under the equity method and market-based approach. The income approach utilized a discounted cash flow analysis which included significant assumptions aboutwere reported in equity in net earnings (loss) of affiliate in the timingconsolidated statements of future cash flows, growth rates and discount rates commensurate withearnings through the underlying risksdate of the investment. The market approach entailed deriving market multiples from publicly traded companies with similar financial and operating characteristics to PersolKelly Asia Pacific and corroboratedsale. Such amounts were earnings of $0.8 million in 2022 representing the results through the date of the discounted cash flow method.sale, $5.4 million in 2021 and $0.8 million in 2020.
After the sale, the Company has a 2.5% ownership interest in the JV and discontinued its use of equity method accounting. The remaining investment is accounted for as an equity investment without a readily determinable fair value (see Fair Value Measurements footnote). The equity investment, included in other assets on the Company's consolidated balance sheet, totaled $6.4 million as of year-end 2022 and the investment in equity affiliate on the Company’s consolidated balance sheet totaled $117.4$123.4 million as of year-end 20172021.
The Company made loans to the JV in prior years, proportionate to its 49% ownership, to fund working capital requirements as a result of their sustained revenue growth. In the fourth quarter of 2020, the JV repaid $5.6 million of the outstanding loan balance and $114.8in the second quarter of 2021, the JV repaid the remaining $5.8 million asof the loan balance. As of year-end 2016.2022, there is no outstanding loan balance or accrued interest receivable relating to the loan. The net amount due to PersolKelly Asia Pacific,the JV, a related party, was $2.3 millionnot material as of year-end 20172022 or 2021. Prior to receiving full repayment of the loans in 2021, the expected credit losses were estimated over the contractual term of the loans. The required allowance was based on current and $1.1 millionprojected financial information from the JV, market-specific information and other relevant data available to the Company, as ofapplicable. The allowance was not material at year-end 2016.2021. The amount included in trade accounts payable for staffing services provided by PersolKelly Asia Pacific asJV is a supplier to CWOcertain MSP programs was $2.5 million as of year-end 2017in the region and $3.1 million as of year-end 2016. In 2017, TS Kelly Workforce Solutions made a loan repayment of $0.6 millionthe amounts for services provided to the Company, which are included in accounts payable and accrued liabilities in 2015, we made cash contributionsthe consolidated balance sheet, are not material.
On April 1, 2020, 100% of the shares of Kelly Services Australia Pty Ltd and Kelly Services (New Zealand) Limited, both subsidiaries of the JV, were sold to TS Kelly Workforce Solutions totaling $0.5an affiliate of Persol Holdings. The JV received proceeds of $17.5 million upon the sale and the Company received a direct royalty payment of $0.7 million.
7. Fair Value Measurements
Trade accounts receivable, short-term borrowings, accounts payable, accrued liabilities and accrued payroll and related taxes and short-term borrowings approximate their fair values due to the short-term maturities of these assets and liabilities.
Assets and Liabilities Measured at Fair Value on a Recurring Basis
The following tables present the assets carriedand liabilities measured at fair value on a recurring basis as of year-end 20172022 and 2016 on2021 in the consolidated balance sheet by fair value hierarchy level, as described below.
Level 1 measurements consist of unadjusted quoted prices in active markets for identical assets or liabilities. Level 2 measurements include quoted prices in markets that are not active or model inputs that are observable either directly or indirectly for substantially the full term of the asset or liability. Level 3 measurements include significant unobservable inputs.
69
KELLY SERVICES, INC. AND SUBSIDIARIES
NOTES TO CONSOLIDATED FINANCIAL STATEMENTS (continued)
| Fair Value Measurements on a Recurring Basis As of Year-End 2017 | Fair Value Measurements on a Recurring Basis As of Year-End 2022 | |||||||||||||||||||||||||||||||||||||||||
| Description | Total | Level 1 | Level 2 | Level 3 | Description | Total | Level 1 | Level 2 | Level 3 | |||||||||||||||||||||||||||||||||
| (In millions of dollars) | (In millions of dollars) | |||||||||||||||||||||||||||||||||||||||||
| Money market funds | $ | 4.3 | $ | 4.3 | $ | — | $ | — | Money market funds | $ | 108.3 | $ | 108.3 | $ | — | $ | — | |||||||||||||||||||||||||
| Available-for-sale investment | 228.1 | 228.1 | — | — | ||||||||||||||||||||||||||||||||||||||
| Investment in Persol Holdings | Investment in Persol Holdings | — | — | — | — | |||||||||||||||||||||||||||||||||||||
| Total assets at fair value | Total assets at fair value | $ | 108.3 | $ | 108.3 | $ | — | $ | — | |||||||||||||||||||||||||||||||||
| Total assets at fair value | $ | 232.4 | $ | 232.4 | $ | — | $ | — | ||||||||||||||||||||||||||||||||||
| Brazil indemnification | Brazil indemnification | $ | (3.4) | $ | — | $ | — | $ | (3.4) | |||||||||||||||||||||||||||||||||
| Greenwood/Asher earnout | Greenwood/Asher earnout | (3.3) | — | — | (3.3) | |||||||||||||||||||||||||||||||||||||
| RocketPower earnout | RocketPower earnout | — | — | — | — | |||||||||||||||||||||||||||||||||||||
| Total liabilities at fair value | Total liabilities at fair value | $ | (6.7) | $ | — | $ | — | $ | (6.7) | |||||||||||||||||||||||||||||||||
| Fair Value Measurements on a Recurring Basis As of Year-End 2016 | Fair Value Measurements on a Recurring Basis As of Year-End 2021 | |||||||||||||||||||||||||||||||||||||||||
| Description | Total | Level 1 | Level 2 | Level 3 | Description | Total | Level 1 | Level 2 | Level 3 | |||||||||||||||||||||||||||||||||
| (In millions of dollars) | (In millions of dollars) | |||||||||||||||||||||||||||||||||||||||||
| Money market funds | $ | 4.0 | $ | 4.0 | $ | — | $ | — | Money market funds | $ | 96.3 | $ | 96.3 | $ | — | $ | — | |||||||||||||||||||||||||
| Available-for-sale investment | 141.2 | 141.2 | — | — | ||||||||||||||||||||||||||||||||||||||
| Investment in Persol Holdings | Investment in Persol Holdings | 264.3 | 264.3 | — | — | |||||||||||||||||||||||||||||||||||||
| Total assets at fair value | Total assets at fair value | $ | 360.6 | $ | 360.6 | $ | — | $ | — | |||||||||||||||||||||||||||||||||
| Total assets at fair value | $ | 145.2 | $ | 145.2 | $ | — | $ | — | ||||||||||||||||||||||||||||||||||
| Brazil indemnification | Brazil indemnification | $ | (2.4) | $ | — | $ | — | $ | (2.4) | |||||||||||||||||||||||||||||||||
| Greenwood/Asher earnout | Greenwood/Asher earnout | (4.6) | — | — | (4.6) | |||||||||||||||||||||||||||||||||||||
| Total liabilities at fair value | Total liabilities at fair value | $ | (7.0) | $ | — | $ | — | $ | (7.0) | |||||||||||||||||||||||||||||||||