
KIMBALL INTERNATIONAL, INC. | ||
(Exact name of registrant as specified in its charter) | ||
| Indiana | 35-0514506 | |
| (State or other jurisdiction of | (I.R.S. Employer Identification No.) | |
| incorporation or organization) | ||
| 1600 Royal Street, Jasper, Indiana | 47549-1001 | |
| (Address of principal executive offices) | (Zip Code) |
| (812) 482-1600 | ||
| Registrant's telephone number, including area code | ||
| Securities registered pursuant to Section 12(b) of the Act: | ||
| Title of each Class | Name of each exchange on which registered | |
| Class B Common Stock, par value $0.05 per share | The NASDAQ Stock Market LLC | |
Securities registered pursuant to Section 12(g) of the Act: | ||
| Class A Common Stock, par value $0.05 per share | ||
Indicate by check mark if the registrant is a well-known seasoned issuer, as defined in Rule 405 of the Securities Act. Yes |
Indicate by check mark if the registrant is not required to file reports pursuant to Section 13 or 15(d) of the Act. Yes |
Indicate by check mark whether the registrant (1) has filed all reports required to be filed by Section 13 or 15(d) of the Securities Exchange Act of 1934 during the preceding 12 months (or for such shorter period that the registrant was required to file such reports), and (2) has been subject to such filing requirements for the past 90 days. Yes |
Indicate by check mark whether the registrant has submitted electronically and posted on its corporate Website, if any, every Interactive Data File required to be submitted and posted pursuant to Rule 405 of Regulation S-T (Section 232.405 of this chapter) during the |
Indicate by check mark if disclosure of delinquent filers pursuant to Item 405 of Regulation S-K (Section 229.405 of this chapter) is not contained herein, and will not be contained, to the best of registrant's knowledge, in definitive proxy or information statements incorporated by reference in Part III of this Form 10-K or any amendment to this Form 10-K. |
Indicate by check mark whether the registrant is a large accelerated filer, an accelerated filer, a non-accelerated filer, or a smaller reporting company. See the definitions of "large accelerated filer," "accelerated filer" and "smaller reporting company" in Rule 12b-2 of the Exchange Act. Large accelerated filero xNon-accelerated filer o Smaller reporting company o (Do not check if a smaller reporting company) |
Indicate by check mark whether the registrant is a shell company (as defined in Rule 12b-2 of the Exchange Act). Yes |
|
| |||
Page No. | |||
| PART I | |||
| PART II | |||
| PART III | |||
| PART IV | |||
(Amounts in Thousands) | 2009 |
| 2008 |
| 2007 |
Furniture Segment |
|
|
|
|
|
Branded Furniture Product Line | $ 564,618 |
| $ 624,836 |
| $ 602,903 |
Contract Private Label Furniture Product Line | -0- |
| -0- |
| 11,059 |
Total Furniture Segment | $ 564,618 |
| $ 624,836 |
| $ 613,962 |
Electronic Manufacturing Services Segment | 642,802 |
| 727,149 |
| 672,968 |
Kimball International, Inc. | $1,207,420 |
| $1,351,985 |
| $1,286,930 |
Sales of contract private label products were eliminated in conjunction with the planned exit of this product line.
| (Amounts in Thousands) | 2012 | 2011 | 2010 | |||||||||||||||||
| Electronic Manufacturing Services segment | $ | 616,751 | 54 | % | $ | 721,419 | 60 | % | $ | 709,133 | 63 | % | ||||||||
| Furniture segment | 525,310 | 46 | % | 481,178 | 40 | % | 413,611 | 37 | % | |||||||||||
| Unallocated Corporate | — | — | % | — | — | % | 64 | — | % | |||||||||||
| Kimball International, Inc. | $ | 1,142,061 | 100 | % | $ | 1,202,597 | 100 | % | $ | 1,122,808 | 100 | % | ||||||||
Electronics and electro-mechanical products (electronic assemblies) are sold globally on a contract basis and produced to customers' specifications. The Company's engineering and manufacturing services primarily entail:
|
|
|
|
During the first quarter of fiscal year 2009, the Company acquired privately-held Genesis Electronics Manufacturing of Tampa, Florida. The acquisition supports the Company's growth and diversification strategy, bringing new customers in the Company's key medical and industrial controls markets.
During the fourth quarter of fiscal year 2008, the Company approved a plan to expand its European automotive electronics capabilities and to establish a European Medical Center of Expertise in Poznan, Poland. The Company successfully completed the move of production from Longford, Ireland, into the existing Poznan facility during the fiscal year 2009 second quarter. As part of the plan, the Company will also consolidate its EMS facilities located in Bridgend, Wales, and Poznan, Poland, into a new, larger facility in Poznan, which is expected to improve the Company's margins in the very competitive EMS market. Construction of the new, larger facility in Poland is complete with limited production to begin early in the Company's fiscal year 2010. The plan is being executed in stages with a projected completion date of December 2011.
In an effort to improve profitability and increase Share Owner value while remaining committed to its business model of being market driven and customer centered, during the third quarter of fiscal year 2008, the Company approved a restructuring plan designed to more appropriately align its workforce in a changing business environment. Within the Company's EMS segment, the restructuring activities included realigning engineering and technical resources closer to the customer and streamlining administrative and sales processes. The plan also included reducing corporate personnel costs to more properly align with the overall sales mix change within the Company. This plan is complete.
During the third quarter of fiscal year 2007, the Company acquired Reptron Electronics, Inc. ("Reptron"), a U.S. based electronics manufacturing services company which provided engineering services, electronics manufacturing services, and display integration services. Reptron had four manufacturing operations located in Tampa, Florida; Hibbing, Minnesota; Gaylord, Michigan; and Fremont, California. The acquisition increased the Company's capabilities and expertise in support of the Company's long-term strategy to grow business in the medical electronics and high-end industrial sectors. With the acquisition, the Company recognized it would have excess capacity in North America. Management developed a plan as of the acquisition date to consolidate capacity within the acquired facilities. Based on a review of future growth potential in various geographies and input from existing customers regarding future capacity needs, during the fourth quarter of fiscal year 2007, the Company finalized a restructuring plan within the EMS segment to exit the manufacturing facility located in Gaylord, Michigan. Production ceased during the second quarter of fiscal year 2008, and the facility is currently held for sale. During the second quarter of fiscal year 2008, the Company approved a restructuring plan to further consolidate its EMS facilities that resulted in the exit of the manufacturing facility located in Hibbing, Minnesota. Production at the Hibbing facility ceased in the fourth quarter of fiscal year 2008, and the Company's lease of the Hibbing facility ended during the second quarter of fiscal year 2009. A majority of the Gaylord and Hibbing business transferred to several of the Company's other worldwide EMS facilities.
During the third quarter of fiscal year 2006, the Company approved a restructuring plan within the EMS segment to exit a manufacturing facility located in Northern Indiana. As part of this restructuring plan, the production for select programs was transferred to other locations within this segment. Operations at this facility ceased in the Company's first quarter of fiscal year 2007, and the facility was sold during fiscal year 2008. The decision to exit this facility was a result of excess capacity in North America.
Late in fiscal year 2007, the Company began production in a new manufacturing facility built in Nanjing, China.
The acquisitions are discussed in further detail in Item 7 - Management's Discussion and Analysis of Financial Condition and Results of Operations and in Note 2 - Acquisitions of Notes to Consolidated Financial Statements. Additional information regarding the Company's restructuring activities is located in Item 7 - Management's Discussion and Analysis of Financial Condition and Results of Operations and in Note 18 - Restructuring Expense of Notes to Consolidated Financial Statements.
Sales revenue of the EMS segment is generally not affected by seasonality with the exception of the buying patterns of automotive industry customers whose purchases of the Company's product are generally lower in the first quarter of the Company's fiscal year. Fiscal
market. The plan was executed in stages and was completed during fiscal year 2012.
facilities and start-up of new programs.
Customer Concentration
| Year Ended June 30 | ||||
| 2009 |
| 2008 |
| 2007 |
Bayer AG affiliated sales as a percent of consolidated net sales | 12% |
| 11% |
| 15% |
Bayer AG affiliated sales as a percent of EMS segment net sales | 23% |
| 21% |
| 30% |
The increased percentages of
| Year Ended June 30 | |||||
| 2012 | 2011 | 2010 | |||
| Bayer AG affiliated sales as a percent of consolidated net sales | —% | 11% | 15% | ||
| Bayer AG affiliated sales as a percent of EMS segment net sales | 1% | 19% | 24% | ||
Since 1950, the
As discussed in the EMS segment above, the Furniture segment part of the workforce reduction restructuring activities announced in the third quarter of fiscal year 2008, included realigning information technology and procurement resources closer to the customer and streamlining administrative and sales processes to drive further synergies afforded by the alignment of the sales and manufacturing functions within this segment. Related expenditures were primarily for employee severance and transition costs, and this plan is complete.
In conjunction with the cessation of manufacturing contract private label products, during fiscal year 2007 the Company approved a plan to exit the production of wood rear projection television ("PTV") cabinets and stands within the Furniture segment, which resulted in the exit of the Company's Juarez, Mexico, operation. For some time, the market demand for wood rear PTV cabinets had been declining due to the market shift to plasma and LCD large-screen televisions. As a result of ceasing operations at this facility, financial results associated with the Mexican operations in the Furniture segment were classified as discontinued operations beginning in the quarter ended December 31, 2006, and all prior periods were restated. The discontinued operations are discussed in further detail in Item 7 - Management's Discussion and Analysis of Financial Condition and Results of Operations and in Note 19 - Discontinued Operations of Notes to Consolidated Financial Statements.
As part of the Company's plan to sharpen focus and simplify business processes within the Furniture segment, the Company announced during the first quarter of fiscal year 2006, a plan which included consolidation of administrative, marketing, and business development functions to better serve the segment's primary markets. Expenses related to this plan included software impairment, accelerated amortization, employee severance, and other consolidation costs. This plan was complete as of June 30, 2008.
Additional information regarding the Company's restructuring activities is located in Item 7 - Management's Discussion and Analysis of Financial Condition and Results of Operations and in Note 18 - Restructuring Expense of Notes to Consolidated Financial Statements.
Locations
Raw Material Availability
(Amounts in Millions) | June 30, 2009 |
| June 30, 2008 |
Furniture | $ 70.2 |
| $ 101.0 |
EMS | 156.9 |
| 205.8 |
Total Backlog of Continuing Operations | $ 227.1 |
| $ 306.8 |
follows:
| (Amounts in Millions) | June 30 2012 | June 30 2011 | |||||
| EMS | $ | 170.6 | $ | 165.1 | |||
| Furniture | 72.0 | 90.4 | |||||
| Total Backlog | $ | 242.6 | $ | 255.5 | |||
| Year Ended June 30 | ||||
(Amounts in Millions) | 2009 |
| 2008 |
| 2007 |
Research and Development Costs of Continuing Operations | $14 |
| $16 |
| $17 |
| Year Ended June 30 | |||||
| (Amounts in Millions) | 2012 | 2011 | 2010 | ||
| Research and Development Costs | $13 | $13 | $12 | ||
Trademarks: President,Eloquence, Hum. Minds at Work, Pura, Fluent, and Aurora
Patent: Traxx
Swift
Environment and Energy Matters
| June 30, 2009 |
| June 30, 2008 |
United States | 4,097 |
| 4,955 |
Foreign Countries | 2,067 |
| 2,240 |
Total Full-Time Employees of Continuing Operations | 6,164 |
| 7,195 |
| June 30 2012 | June 30 2011 | ||||
| United States | 3,694 | 3,787 | |||
| Foreign Countries | 2,601 | 2,575 | |||
| Total Full-Time Employees | 6,295 | 6,362 | |||
difficulties in identifying suitable acquisition candidates and in negotiating and consummating acquisitions on terms attractive to the Company;difficulties in the assimilation of the operations of the acquired company;the diversion of resources, including diverting management's attention from current operations;risks of entering new geographic or product markets in which the Company has limited or no direct prior experience;the potential loss of key customers of the acquired company;the potential loss of key employees of the acquired company;the potential incurrence of indebtedness to fund the acquisition;the potential issuance of common stock for some or all of the purchase price, which could dilute ownership interests of the Company's current shareholders;the acquired business not achieving anticipated revenues, earnings, cash flow, or market share;excess capacity;the assumption of undisclosed liabilities; anddilution of earnings.Start-up operations could present risks to the Company's current operations.The Company is committed to growing its business, and therefore from time to time, the Company may determine that it would be in its best interests to start up a new operation. Start-up operations involve a number of risks and uncertainties, such as funding the capital expenditures related to the start-up operation, developing a management team for the new operation, diversion of management focus away from current operations, and creation of excess capacity. Any of these risks could have a material adverse effect on the Company's financial position, results of operations, or cash flows. The Company's international operations involve financial and operational risks.The Company has operations outside the United States, primarily in China, Thailand, Poland, the United Kingdom, and Mexico. The Company's international operations are subject to a number of risks, which may include the following:economic and political instability;changes in foreign regulatory requirements and laws;tariffs and other trade barriers;potentially adverse tax consequences; andforeign labor practices.economic and political instability;compliance with laws, such as the Foreign Corrupt Practices Act, applicable to U.S. companies doing business outside the United States;changes in foreign regulatory requirements and laws;10tariffs and other trade barriers;potentially adverse tax consequences including the manner in which multinational companies are taxed in the U.S.; andforeign labor practices.These risks could have an adverse effect on the Company's financial position, results of operations, or cash flows. In addition, fluctuations in exchange rates could impact the Company's operating results. The Company's risk management strategy includes the use of derivative financial instruments to hedge certain foreign currency exposures. Any hedging techniques the Company implements contain risks and may not be entirely effective. Exchange rate fluctuations could also make the Company's products more expensive than competitor's products not subject to these fluctuations, which could adversely affect the Company's revenues and profitability in international markets.If the Company's efforts to introduce new products are not successful, this could limit sales growth or cause sales to decline.The EMS segment depends on industries that utilize technologically advanced electronic components which often have short life cycles. The Company must continue to invest in advanced equipment and product development to remain competitive in this area. The Furniture segment regularly introduces new products to keep pace with workplace trends and evolving regulatory and industry requirements, including environmental, health, and safety standards such as sustainability and ergonomic considerations, and similar standards for the workplace and for product performance. The introduction of new products requires the coordination of the design, manufacturing, and marketing of such products. The design and engineering of certain new products can take nine to eighteen months or more, and further time may be required to achieve customer acceptance. Accordingly, the launch of any particular product may be delayed or be less successful than originally anticipated by the Company. Difficulties or delays in introducing new products or lack of customer acceptance of new products could limit sales growth or cause sales to decline. The EMS segment depends on industries that utilize technologically advanced electronic components which often have short life cycles. The Company must continue to invest in advanced equipment and product development to remain competitive in this area.
If customers do not perceive the Company's products to be innovative and of high quality, the Company's brand and name recognition could suffer. The Company believes that establishing and maintaining brand and name recognition is critical to business. Promotion and enhancement of the Company's brands will depend on the effectiveness of marketing and advertising efforts and on successfully providing innovative and high quality products and superior services. If customers do not perceive its products and services to be innovative and of high quality, the Company's brand and name recognition could suffer, which could have a material adverse effect on the Company's business.
In addition, the Company's credit facility expires in April 2013, and the new credit facility terms may be less favorable than the current terms.A loss of independent manufacturing representatives, dealers, or other sales channels could lead to a decline in sales of the Company's Furniture segment products. The Company's office furniture is marketed primarily through Company salespersons to end users, office furniture dealers, wholesalers, rental companies, and catalog houses. The Company's hospitality furniture is marketed to end users using independent manufacturing representatives. A significant loss within any of these sales channels could result in a sales decline and thus have an adverse impact on the Company's financial position, results of operations, or cash flows.The Company must effectively manage working capital.The Company has historically had positive operating cash flows, but effective management of working capital is key to continuing that trend. The Company closely monitors inventory and receivable efficiencies and continuously strives to improve these measures of working capital, but customer financial difficulties, cancellation or delay of customer orders, shifts in customer payment practices, transfers of production among the Company's manufacturing facilities, or Company manufacturing delays could cause deteriorating working capital trends.The Company's assets could become impaired. As business conditions change, the Company must continually evaluate and work toward the optimum asset base. It is possible that certain assets such as, but not limited to, facilities, equipment, intangible assets, or goodwill could be impaired at some point in the future depending on changing business conditions. If assets of the Company become impaired the result could be an adverse impact on the Company's financial position and results of operations.There are inherent uncertainties involved in estimates, judgments, and assumptions used in the preparation of financial statements in accordance with generally accepted accounting principles in the United States (U.S. GAAP). Any changes in estimates, judgments, and assumptions could have a material adverse effect on the Company's financial position, results of operations, or cash flows. The Company's financial statements filed with the SEC are prepared in accordance with U.S. GAAP, and the preparation of such financial statements includes making estimates, judgments, and assumptions that affect reported amounts of assets, liabilities, and related reserves, revenues, expenses, and income. Estimates are inherently subject to change in the future, and such changes could result in corresponding changes to the amounts of assets, liabilities, income, or expenses and likewise could have an adverse effect on the Company's financial position, results of operations, or cash flows.Changes in financial accounting standards may affect the Company's financial position, results of operations, or cash flows. The Financial Accounting Standards Board (FASB) is considering various proposed rule changes. The SEC is considering options for incorporating International Financial Reporting Standards (IFRS) into the U.S. financial reporting11system. The implementation of new accounting standards or changes to U.S. GAAP could adversely impact the Company's financial position, results of operations, or cash flows.Fluctuations in the Company's effective tax rate could have a significant impact on the Company's financial position, results of operations, or cash flows.The mix of pre-tax income or loss among the tax jurisdictions in which the Company operates that have varying tax rates could impact the Company's effective tax rate. The Company is subject to income taxes as well as non-income based taxes, in both the United States and various foreign jurisdictions. Judgment is required in determining the worldwide provision for income taxes, other tax liabilities, interest, and penalties. Future events could change management's assessment. The Company operates within multiple taxing jurisdictions and is subject to tax audits in these jurisdictions. These audits can involve complex issues, which may require an extended period of time to resolve. The Company has also made assumptions about the realization of deferred tax assets. Changes in these assumptions could result in a valuation allowance for these assets. Final determination of tax audits or tax disputes may be different from what is currently reflected by the Company's income tax provisions and accruals. In addition, President Obama's administration has announced proposals for a new U.S. tax legislation that, if adopted, could adversely affect the Company's tax rate.A failure to comply with the debtfinancial covenants under the Company's $100 million credit facility could adversely impact the Company.The Company's credit facility requires the Company to comply with certain debt covenants and other terms and conditions.financial covenants. The Company believes the most significant covenants under its credit facility are minimum net worth and interest coverage ratio. More detail on these debtfinancial covenants is discussed in Item 7 - Management's Discussion and Analysis of Financial Condition and Results of Operations. As of June 30, 2009,2012, the Company was in a positive net cash position of $88.6 million, defined as cash, cash equivalents, and short-term investments lesshad no short-term borrowings under its credit facilities. Therefore, in the eventfacilities and had total cash and cash equivalents of a default on any of the debt covenants under the credit facility, the Company, as of June 30, 2009, would have had sufficient cash to pay off the outstanding borrowings.$75.2 million. In the future, a default on the debtfinancial covenants under the Company's credit facility could cause an increase in the borrowing rates or could make it more difficult for the Company to secure future financing which could have an adverse effect onadversely affect the financial condition of the Company.A failure to successfully implement information technology solutions could adversely affect the Company.The Company's business depends on effective information technology systems. Information systems require an ongoing commitment of significant resources to maintain and enhance existing systems and develop new systems in order to keep pace with changes in information processing technology and evolving industry standards. Implementation delays or poor execution of information technology systems could disrupt the Company's operations and increase costs.
An inability to protect the Company's intellectual property could have a significant impact on business. The Company attempts to protect its intellectual property rights, both in the United States and in foreign countries, through a combination of patent, trademark, copyright, and trade secret laws, as well as licensing agreements and third-party nondisclosurenon-disclosure and assignment agreements. Because of the differences in foreign laws concerning proprietary rights, the Company's intellectual property rights do not generally receive the same degree of protection in foreign countries as they do in the United States, and therefore in some parts of the world, the Company has limited protections, if any, for its intellectual property. Competing effectively depends, to a significant extent, on maintaining the proprietary nature of the Company's intellectual property. The degree of protection offered by the claims of the various patents and trademarks may not be broad enough to provide significant proprietary protection or competitive advantages to the Company, and patents or trademarks may not be issued on pending or contemplated applications. In addition, not all of the Company's products are covered by patents. It is also possible that the Company's patents and trademarks may be challenged, invalidated, cancelled,canceled, narrowed, or circumvented.
A third party could claim that the Company has infringed on their intellectual property rights.The Company could be notified of a claim regarding intellectual property rights which could lead to the Company spending time and money to defend or address the claim. Even if the claim is without merit, it could result in substantial costs and diversion of resources.The Company's insurance may not adequately protect the Company from liabilities related to product defects.The Company maintains product liability and other insurance coverage that the Company believes to be generally in accordance with industry practices. However, its insurance coverage may not be adequate to protect the Company fully against substantial claims and costs that may arise from liabilities related to product defects, particularly if the Company has a large number of defective products or if the root cause is disputed.The Company's failure to maintain Food and Drug Administration (FDA) registration of one or more of its registered manufacturing facilities could negatively impact the Company's ability to produce products for its customers in the medical industry. The Company is diversifying the EMS segment which includes increasing sales to customers in the regulated medical industry. To maintain FDA registration, the Company is subject to FDA audits of the manufacturing process. FDA audit failure could result in a partial or total suspension of production, fines, or criminal prosecution. Failure or noncompliance could have an adverse effect on the Company's reputation in addition to an adverse impact on the Company's financial position, results of operations, or cash flows.The Company is subject to extensive environmental regulation and significant potential environmental liabilities.The past and present operation and ownership by the Company of manufacturing plants and real property are subject to extensive12and changing federal, state, local, and foreign environmental laws and regulations, including those relating to discharges in air, water, and land, the handling and disposal of solid and hazardous waste, the use of certain hazardous materials in the production of select EMS products, and the remediation of contamination associated with releases of hazardous substances. In addition, the increased prevalence of global climate issues may result in new regulations that may negatively impact the Company. The Company cannot predict what environmental legislation or regulations will be enacted in the future, how existing or future laws or regulations will be administered or interpreted or what environmental conditions may be found to exist. Compliance with more stringent laws or regulations, or stricter interpretation of existing laws, may require additional expenditures by the Company, some of which could be material. In addition, any investigations or remedial efforts relating to environmental matters could involve material costs or otherwise result in material liabilities.The Company's failure to retain the existing management team; maintain its engineering, technical, and manufacturing process expertise; and continue to attract qualified personnel could adversely affect the Company's business.The success of the Company is dependent on keeping pace with technological advancements and adapting services to provide manufacturing capabilities which meet customers' changing needs. In addition, the Company must retain its qualified engineering and technical personnel and successfully anticipate and respond to technological changes in a cost effective and timely manner. The Company's culture and guiding principles focus on continuous training, motivating, and development of employees, and it strives to attract, motivate, and retain qualified personnel. Failure to retain and attract qualified personnel could adversely affect the Company's business.Turnover in personnel could cause manufacturing inefficiencies.The demand for manufacturing labor in certain geographic areas makes it difficult to retainretaining experienced production employees.employees difficult. Turnover could result in additional training and inefficiencies that could impact the Company's operating results.Natural disasters or other catastrophic events may impact the Company's production schedules and, in turn, negatively impact profitability.Natural disasters or other catastrophic events, including severe weather, terrorist attacks, power interruptions, and fires, could disrupt operations and likewise the ability to produce or deliver the Company's products. The Company's manufacturing operations require significant amounts of energy, including natural gas and oil, and governmental regulations may control the allocation of such fuels to the Company. Employees are an integral part of the Company's business and events such as a pandemic could reduce the availability of employees reporting for work. In the event the Company experiences a temporary or permanent interruption in its ability to produce or deliver product, revenues could be reduced, and business could be materially adversely affected. In addition, catastrophic events, or the threat thereof, can adversely affect U.S. and world economies, and could result in delayed or lost sales of the Company's products. In addition, any continuing disruption in the Company's computer system could adversely affect the ability to receive and process customer orders, manufacture products, and ship products on a timely basis, and could adversely affect relations with customers, potentially resulting in reduction in orders from customers or loss of customers. The Company maintains insurance to help protect the Company from costs relating to some of these matters, but such may not be sufficient or paid in a timely manner to the Company in the event of such an interruption.
The requirements of being a public company may strain the Company's resources and distract management.The Company is subject to the reporting requirements of federal securities laws, including the Sarbanes-Oxley Act of 2002. Among other requirements, the Sarbanes-Oxley Act requires that the Company maintain effective disclosure controls and procedures and internal control over financial reporting. The Company has expended and expects to continue to expend significant management time and resources maintaining documentation and testing internal control over financial reporting. While management's evaluation as of June 30, 20092012 resulted in the conclusion that the Company's internal control over financial reporting was effective as of that date, the Company cannot predict the outcome of testing in future periods. If the Company concludes in future periods that its internal control over financial reporting is not effective, or if its independent registered public accounting firm is not able to render the required attestations, it could result in lost investor confidence in the accuracy, reliability, and completeness of the Company's financial reports.
The value of the Company's common stock may experience substantial fluctuations for reasons over which the Company has little control.Changes inImposition of government regulationregulations may significantly increase the Company's operating costs in the United States. The federal government has a broad agenda of potential legislativeLegislative and regulatory reforms which if enacted,by the U.S. federal government could significantly impact the profitability of the Company by burdening it with forced cost choices that cannot be recovered by increased pricing. These reforms include:The United States healthcare reform legislation passed in 2010 and upheld by the Supreme Court in 2012 is likely to increase the Company's total healthcare costs which could have a significant impact on the Company's financial position, results of operations, manufacturing facilities and employment in the U.S., or cash flows.International Traffic in Arms Regulations (ITAR) must be followed when producing defense related products for the U.S. government. A breach of these regulations could have an adverse impact on the Company's financial condition, results of operations, or cash flows.13The Company imports a portion of its wood furniture products and is thus subject to an antidumping tariff on wooden bedroom furniture supplied from China. The tariffs are subject to review and could result in retroactive and prospective tariff rate increases which could have an adverse impact on the Company's financial condition, results of operations, or cash flows.healthcare reform;increased union organization under the Employee Free Choice Act; andincreased energy in manufacturing costs resulting from Cap and Trade legislation.actual or anticipated fluctuations in operating results;announcements concerning the Company, competitors, or industry;overall volatility of the stock market;changes in the financial estimates of securities analysts or investors regarding the Company, the industry, or competitors; andgeneral market or economic conditions.actual or anticipated fluctuations in operating results;announcements concerning the Company, competitors, or industry;overall volatility of the stock market;changes in the financial estimates of securities analysts or investors regarding the Company, the industry, or competitors; andgeneral market or economic conditions.Furthermore, stock prices for many companies fluctuate widely for reasons that may be unrelated to their operating results. These fluctuations, coupled with changes in results of operations and general economic, political, and market conditions, may adversely affect the value of the Company's common stock.
Number of Facilities Approximate Square Footage completed.Item 2 - PropertiesThe location and number of the Company's major manufacturing, warehousing, and service facilities, including the executive and administrative offices, as of June 30, 2009,2012, are as follows:Furniture Electronic
Manufacturing
ServicesUnallocated
CorporateTotal Indiana 13 1 4 18 Kentucky 2 2 Florida 1 1 California 1 1 Idaho 1 1 Mexico 1 1 Thailand 1 1 Poland 1 1 China 1 1 2 United Kingdom 1 1 Total Facilities 17 8 4 29 Number of Facilities ElectronicManufacturingServices Furniture UnallocatedCorporate Total North America Florida 1 1 Idaho 1 1 Indiana 1 13 4 18 Kentucky 2 2 Virginia 1 1 Mexico 1 1 Asia China 1 1 2 Thailand 1 1 Europe Poland 1 1 Total Facilities 6 18 4 28 14The listed facilities occupy approximately 4,814,0004,820,000 square feet in aggregate, of which approximately 4,658,0004,733,000 square feet are owned and 156,00087,000 square feet are leased. Square footage of these facilities is summarized by segment as follows: Furniture Electronic
Manufacturing
ServicesUnallocated
CorporateTotal Owned 3,491,000 936,000 231,000 4,658,000 Leased 7,000 129,000 20,000 156,000 Total 3,498,000 1,065,000 251,000 4,814,000 Within the EMS segment, Approximate Square Footage ElectronicManufacturingServices Furniture UnallocatedCorporate Total Owned 1,011,000 3,491,000 231,000 4,733,000 Leased — 67,000 20,000 87,000 Total 1,011,000 3,558,000 251,000 4,820,000 During fiscal year 2012, the Company exited the Ireland facility during fiscal year 2009EMS segment facilities in California and plans to exit the United Kingdom facility in fiscal year 2011 as part of the Company's plan to consolidate these facilities and the current Poland facility into a new, larger facility in Poland. Construction of the new, larger facility in Poland is complete with limited production to begin early in the Company's fiscal year 2010 and thus is not included in the tables above as of June 30, 2009. The Ireland facility lease expired during fiscal year 2009. The Company continues to market the existing Poland facility and real estate.During fiscal year 2009 within the Furniture segment, the Company sold a plant located in Indiana as manufacturing departmentspreviously announced restructuring consolidation plans were consolidated. A leased Furniture segment research and development facility in California was exited during fiscal year 2009. A facility that houses a training and education center, a research and development center, and a product showroom was previously reported as Unallocated Corporate but is now included in the Furniture segment column above as one facility.Included in Unallocated Corporate are executive, national sales and administrative offices, and a recycling facility.
Generally, properties are utilized at normal capacity levels on a multiple shift basis. At times, certain facilities utilize a reduced second or third shift. Due to sales fluctuations, not all facilities were utilized at normal capacity during fiscal year 2009.
2012.
have a material adverse impact on the Company. Item 3 - Legal ProceedingsThe Registrant and its subsidiaries are not parties to any pending legal proceedings, other than ordinary routine litigation incidental to the business, whichbusiness. The outcome of current routine pending litigation, individually orand in the aggregate, areis not expected to be material.Item 4 - Submission of Matters to a Vote of Security HoldersNo matters were submitted to a vote of the Company's security holders during the fourth quarter of fiscal year 2009.Not applicable.
Kimball Hospitality from February 2005 until February 2010, and prior to that served in other key roles within the Furniture segment since joining the Company in June 2002. Item 12 - Security Ownership of Certain Beneficial Owners and Management and Related Share Owner Matters of Part III. Performance Graph Year Ended June 30 year ended June 30, 2008. year as the various markets have mixed outlooks. (RevPAR) for calendar year 2012. operations. Managing working capital in conjunction with fluctuating demand levels is likewise key. In addition to the above plan. investment. Partially offsetting the lower SERP expense was an increase in incentive compensation expenses in fiscal year 2012 as compared to fiscal year 2011. information. At or For the June 30 (Amounts in Millions) 2009 2008 % Change Net Sales $ 642.8 $ 727.1 (12%) Income (Loss) from Continuing Operations $ (11.8) $ (15.3) 23% Restructuring Expense, net of tax $ 1.5 $ 12.8 Goodwill Impairment, net of tax $ 8.0 $ 0.0 Open Orders $ 156.9 $ 205.8 (24%) trends due to the contract nature of the Company's business. net foreign currency exchange movement. Year Ended June 30 2009 2008 12% 11% Bayer AG affiliated sales as a percent of EMS segment net sales 23% 21% Furniture Segment At or For the June 30 (Amounts in Millions) 2009 2008 % Change Net Sales $ 564.6 $ 624.8 (10%) Income from Continuing Operations $ 8.3 $ 13.4 (38%) Restructuring Expense, net of tax $ 0.1 $ 1.3 Goodwill Impairment, net of tax $ 1.1 $ 0.0 Open Orders $ 70.2 $ 101.0 (31%) follow: travel expenses. employee benefit costs. Year Ended June 30 (Amounts in Thousands, Except for Per Share Data) 2008 2007 Net Sales of Discontinued Operations $ -0- $ 8,744 Operating Loss of Discontinued Operations, Net of Tax $ (124) $ (3,068) Loss on Disposal of Discontinued Operations, Net of Tax -0- (1,046) Loss from Discontinued Operations, Net of Tax $ (124) $ (4,114) $ (0.00) $ (0.11) restructuring charges. The At or For the Year Ended (Amounts in Millions) 2008 2007 % Change Net Sales $727.1 $673.0 8% Open Orders $205.8 $192.0 7% Included in this segment are a significant amount of sales to Bayer AG affiliates which accounted for the following portions of consolidated net sales and EMS segment net sales: Year Ended June 30 2008 2007 11% 15% Bayer AG affiliated sales as a percent of EMS segment net sales 21% 30% during fiscal years 2011 and 2010. At or For the Year Ended 2008 2007 % Change (Amounts in Millions) Net Sales: Furniture Segment Branded Furniture $624.8 $602.9 4% Contract Private Label Furniture -0- 11.1 (100%) Total $624.8 $614.0 2% Open Orders: Furniture Segment Branded Furniture $101.0 $ 95.3 6% Total $101.0 $ 95.3 6% fiscal year 2011 and (2.3)% for fiscal year 2010. 2011 2011 credit against the Covenant At or For the Period Ended June 30, 2009 Limit As Specified in Credit Agreement Excess Minimum Net Worth $382,354,000 $362,000,000 $20,354,000 Interest Coverage Ratio 25.1 3.0 22.1 sources. The Company borrowing in general. In addition, changing conditions in the credit markets, prohibitive costs, or other unforeseen circumstances could adversely impact the renewal or replacement of this facility. During fiscal year 2012 there were no borrowings on the credit facility, and costs related to the credit facility were not significant. Payments Due During Fiscal Years Ending June 30 Total 2010 2011-2012 2013-2014 Thereafter $ 13.1 $ 12.7 $ 0.1 $ 0.0 $ 0.3 32.9 10.1 11.6 2.1 9.1 15.1 3.4 5.9 3.1 2.7 197.5 182.8 8.3 6.2 0.2 1.8 0.5 1.1 0.1 0.1 $260.4 $209.5 $27.0 $11.5 $12.4 Excess and obsolete inventory15Executive Officers of the RegistrantThe executive officers of the Registrant as of August 31, 200927, 2012 are as follows: (Age as of August 31, 2009)27, 2012)
Name Age Office and
Area of Responsibility Executive Officer
SinceJames C. Thyen 65 President, Chief Executive Officer, Director 1974 Douglas A. Habig 62 Chairman of the Board 1975 Robert F. Schneider 48 Executive Vice President, Chief Financial Officer 1992 Donald D. Charron 45 Executive Vice President, President-Kimball Electronics Group 1999 P. Daniel Miller 61 Executive Vice President, President-Furniture 2000 Michelle R. Schroeder 44 Vice President, Chief Accounting Officer 2003 John H. Kahle 52 Executive Vice President, General Counsel, Secretary 2004 Gary W. Schwartz 61 Executive Vice President, Chief Information Officer 2004 Name Age Office andArea of Responsibility Executive OfficerSinceJames C. Thyen 68 President, Chief Executive Officer, Director 1974 Douglas A. Habig 65 Chairman of the Board 1975 Robert F. Schneider 51 Executive Vice President, Chief Financial Officer 1992 Donald D. Charron 48 Executive Vice President, President-Kimball Electronics Group 1999 John H. Kahle 55 Executive Vice President, General Counsel, Secretary 2004 Gary W. Schwartz 64 Executive Vice President, Chief Information Officer 2004 Donald W. Van Winkle 51 Vice President, President-Office Furniture Group 2010 Stanley C. Sapp 51 Vice President, President-Kimball Hospitality 2010 Michelle R. Schroeder 47 Vice President, Chief Accounting Officer 2003 Executive officers are elected annually by the Board of Directors. All of the executive officers unless otherwise noted have been employed by the Company for more than the past five years in the capacityprincipal occupation shown or some other executive capacity. Michelle R. SchroederDonald W. Van Winkle was appointed to Vice President, Chief Accounting OfficerPresident-Office Furniture Group in May 2009. She was appointed toFebruary 2010. He had previously served as Vice President, in December 2004, served as Corporate ControllerGeneral Manager of National Office Furniture from August 2002October 2003 until May 2009,February 2010, and prior to that served as Assistant Corporate ControllerVice President, Chief Finance and DirectorAdministrative Officer for the Furniture Brands Group as well as other key finance roles within the Furniture segment since joining the Company in January 1991. Stanley C. Sapp was appointed to Vice President, President-Kimball Hospitality in February 2010. He had previously served as Vice President and General Manager of Financial Analysis.PART IIItem 5 - Market for Registrant's Common Equity, Related Share Owner Matters and Issuer Purchases of Equity SecuritiesMarket PricesThe Company's Class B Common Stock trades on the NASDAQ Global Select Market of The NASDAQ Stock Market LLC under the symbol: KBALB. High and low sales prices by quarter for the last two fiscal years as quoted by the NASDAQ system arewere as follows:2009 2008 High Low High Low First Quarter $12.75 $ 8.00 $14.38 $10.94 Second Quarter $10.74 $ 4.05 $15.35 $11.35 Third Quarter $ 9.14 $ 5.22 $13.96 $ 9.51 Fourth Quarter $ 7.54 $ 5.02 $11.52 $ 8.28 2012 2011 High Low High Low First Quarter $ 6.92 $ 4.61 $ 6.50 $ 4.81 Second Quarter $ 6.09 $ 4.63 $ 7.17 $ 5.51 Third Quarter $ 7.19 $ 5.15 $ 7.73 $ 6.09 Fourth Quarter $ 7.84 $ 6.25 $ 7.89 $ 5.92 There is no established public trading market for the Company's Class A Common Stock. However, Class A shares are convertible on a one-for-one basis to Class B shares.16DividendsDividends
There are no restrictions on the payment of dividends except charter provisions that require on a fiscal year basis, that shares of Class B Common Stock are entitled to $0.02$0.02 per share dividend more than the annual dividends paid on Class A Common Stock, provided that dividends are paid on the Company's Class A Common Stock. Dividends declared totaled $15.6$7.4 million and $23.7 million for fiscal years 2009year 2012 and 2008, respectively.$7.3 million for fiscal year 2011. Dividends are discussed in further detail in Item 7 - Management's Discussion and Analysis of Financial Condition and Results of Operations. Included in these figures are dividends computed and accrued on unvested Class A and Class B restrictedper share units, which will be paid by a conversion to the equivalent value of common shares after a specified vesting period. Dividends declared by quarter for fiscal year 20092012 compared to fiscal year 2008 are2011 were as follows:2009 2008 Class A Class B Class A Class B First Quarter $0.155 $0.16 $0.155 $0.16 Second Quarter $0.155 $0.16 $0.155 $0.16 Third Quarter $0.045 $0.05 $0.155 $0.16 Fourth Quarter $0.045 $0.05 $0.155 $0.16 Total Dividends $0.400 $0.42 $0.620 $0.64 2012 2011 Class A Class B Class A Class B First Quarter $ 0.045 $ 0.05 $ 0.045 $ 0.05 Second Quarter 0.045 0.05 0.045 0.05 Third Quarter 0.045 0.05 0.045 0.05 Fourth Quarter 0.045 0.05 0.045 0.05 Total Dividends $ 0.180 $ 0.20 $ 0.180 $ 0.20 Share OwnersOn August 14, 2009,13, 2012, the Company's Class A Common Stock was owned by 571549 Share Owners of record, and the Company's Class B Common Stock was owned by 1,8101,666 Share Owners of record, of which 306292 also owned Class A Common Stock. Securities Authorized for Issuance Under Equity Compensation PlansSee Item 12 of Part III forThe information onrequired by this item concerning securities authorized for issuance under equity compensation plans.plans is incorporated by reference to Issuer Purchases of Equity SecuritiesA share repurchase program authorized by the Board of Directors was announced on October 16, 2007.2007. The program allows for the repurchase of up to two million shares of any combination of Class A and Class B shares and will remain in effect until all shares authorized have been repurchased. The Company did not repurchase any shares under the repurchase program during the fourth quarter of fiscal year 2009.2012. At June 30, 2009, 2012, two million shares remained available under the repurchase program.The following performance graph is not deemed to be "soliciting material" or to be "filed" with the SEC or subject to Regulation 14A or 14C under the Securities Exchange Act of 1934 or to the liabilities of Section 18 of the Securities Exchange Act of 1934 and will not be deemed to be incorporated by reference into any filing under the Securities Act of 1933 or the Securities Exchange Act of 1934, except to the extent the Company specifically incorporates it by reference into such a filing.The graph below compares the cumulative total return to Share Owners of the Company's Class B Common Stock from June 30, 2004,2007 through June 30, 2009,2012, the last business day in the respective fiscal years, to the cumulative total return of the NASDAQ Stock Market (U.S. and Foreign) and a peer group index for the same period of time. Due to the diversity of its operations, the Company is not aware of any public companies that are directly comparable to it. Therefore, the peer group index is comprised of publicly traded companies in both of the Company's segments, as follows:EMS Segment:segment: Benchmark Electronics, Inc., Jabil Circuit, Inc., Plexus Corp.Furniture Segment:segment: HNI Corp.,Corporation, Knoll, Inc., Steelcase Inc., Herman Miller, Inc.In order to reflect the segment allocation of Kimball International, Inc., a market capitalization-weighted index was first computed for each segment group, then a composite peer group index was calculated based on each segment's proportion of net sales to total consolidated sales for each fiscal year. The public companies included in the peer group have a larger revenue base than each of the Company's business segments.17The graph assumes $100 is invested in the Company's stock and each of the two indexes at the closing market quotations on June 30, 20042007 and that dividends are reinvested. The performances shown on the graph are not necessarily indicative of future price performance.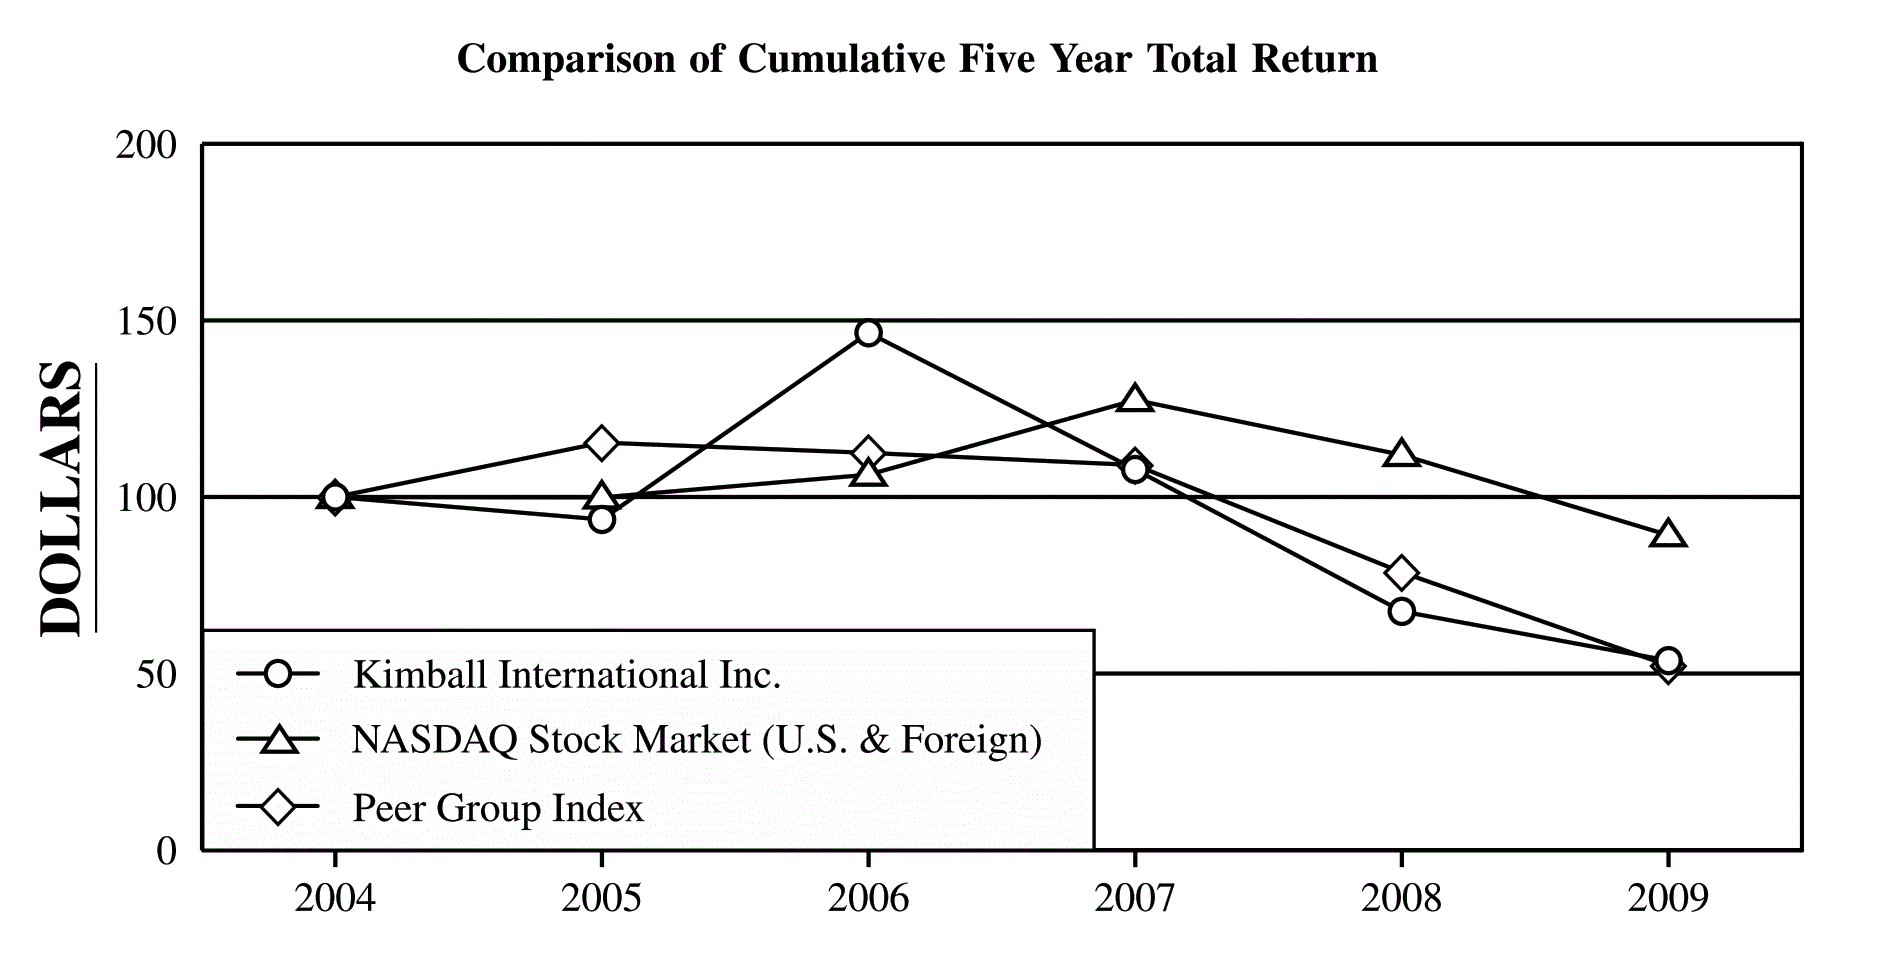
2004 2005 2006 2007 2008 2009 Kimball International, Inc. $100.00 $ 93.63 $146.50 $107.78 $ 67.61 $ 53.66 NASDAQ Stock Market (U.S. & Foreign) $100.00 $ 99.89 $106.32 $127.46 $111.91 $ 89.19 Peer Group Index $100.00 $115.40 $112.49 $109.05 $ 78.67 $ 52.26 Comparison of Cumulative Five Year Total Return
2007 2008 2009 2010 2011 2012 Kimball International, Inc. $ 100.00 $ 62.73 $ 49.79 $ 45.26 $ 54.26 $ 67.20 NASDAQ Stock Market (U.S. & Foreign) $ 100.00 $ 84.54 $ 73.03 $ 82.88 $ 110.33 $ 115.30 Peer Group Index $ 100.00 $ 72.14 $ 47.92 $ 70.95 $ 96.05 $ 85.13 18Item 6 - Selected Financial DataThis information should be read in conjunction with Item 8 - Financial Statements and Supplementary Data and Item 7 - Management's Discussion and Analysis of Financial Condition and Results of Operations. (Amounts in Thousands, Except for Per Share Data) 2009 2008 2007 2006 2005 Net Sales $1,207,420 $1,351,985 $1,286,930 $1,109,549 $1,004,386 Income from Continuing Operations $ 17,328 $ 78 $ 23,266 $ 28,613 $ 18,342 Earnings Per Share from Continuing Operations Basic: Class A $ 0.47 $ 0.00 $ 0.60 $ 0.74 $ 0.48 Class B $ 0.47 $ 0.00 $ 0.61 $ 0.75 $ 0.48 Diluted: Class A $ 0.46 $ 0.00 $ 0.58 $ 0.74 $ 0.47 Class B $ 0.47 $ 0.00 $ 0.60 $ 0.75 $ 0.48 Total Assets $ 642,269 $ 722,667 $ 694,741 $ 679,021 $ 600,540 Long-Term Debt, Less Current Maturities $ 360 $ 421 $ 832 $ 1,125 $ 350 Cash Dividends Per Share: Class A $ 0.40 $ 0.62 $ 0.62 $ 0.62 $ 0.62 Class B $ 0.42 $ 0.64 $ 0.64 $ 0.64 $ 0.64 Year Ended June 30 (Amounts in Thousands, Except for Per Share Data)2012 2011 2010 2009 2008 Net Sales $ 1,142,061 $ 1,202,597 $ 1,122,808 $ 1,207,420 $ 1,351,985 Income from Continuing Operations $ 11,634 $ 4,922 $ 10,803 $ 17,328 $ 78 Earnings Per Share from Continuing Operations: Basic: Class A $ 0.29 $ 0.12 $ 0.27 $ 0.46 $ — Class B $ 0.31 $ 0.14 $ 0.29 $ 0.47 $ — Diluted: Class A $ 0.29 $ 0.12 $ 0.27 $ 0.46 $ — Class B $ 0.31 $ 0.14 $ 0.29 $ 0.47 $ — Total Assets $ 595,516 $ 626,312 $ 636,751 $ 642,269 $ 722,667 Long-Term Debt, Less Current Maturities $ 273 $ 286 $ 299 $ 360 $ 421 Cash Dividends Per Share: Class A $ 0.18 $ 0.18 $ 0.18 $ 0.40 $ 0.62 Class B $ 0.20 $ 0.20 $ 0.20 $ 0.42 $ 0.64 The income statement activity of discontinued operations in each of the years ended June 30, 2012, 2011, 2010, and 2009 was zero. The preceding table excludes all income statement activity of discontinued operations in the discontinued operations.Fiscal year 20092012 income from continuing operations included $1.8$2.1 million ($0.04 ($0.06 per diluted share) of after-tax restructuring expenses.Fiscal year 2011 income from continuing operations included $0.6 million ($0.01 per diluted share) of after-tax restructuring expenses.Fiscal year 2010 income from continuing operations included $1.2 million ($0.03 per diluted share) of after-tax restructuring expenses, $9.1$2.0 million ($ ($0.05 per diluted share) of after-tax income resulting from settlement proceeds related to an antitrust lawsuit of which the Company was a class member, and $7.7 million ($0.20 per diluted share) of after-tax income from the sale of the facility and land in Poland.Fiscal year 2009 income from continuing operations included $1.8 million ($0.04 per diluted share) of after-tax restructuring expenses, $9.1 million ($0.24 per diluted share) of after-tax non-cash goodwill impairment, $1.6$1.6 million ($ ($0.04 per diluted share) of after-tax income from earnest money deposits retained by the Company resulting from the termination of thea contract to sell the Company's Poland buildingfacility and real estate,land, and $18.9$18.9 million ($ ($0.51 per diluted share) of after-tax gains on the sale of undeveloped land holdings and timberlands.Fiscal year 2008 income from continuing operations included $14.6$14.6 million ($ ($0.39 per diluted share) of after-tax restructuring expenses and $0.7$0.7 million ($ ($0.02 per diluted share) of after-tax income received as part of a Polish offset credit program for investments made in the Company's Poland operation.Fiscal year 2007 income from continuing operations included $0.9 million ($0.02 per diluted share) of after-tax restructuring expenses.Fiscal year 2006 income from continuing operations included $2.8 million ($0.07 per diluted share) of after-tax restructuring expenses and $1.3 million ($0.03 per diluted share) of after-tax income received as part of a Polish offset credit program for investments made in the Company's Poland operation.Fiscal year 2005 income from continuing operations included $0.2 million ($0.01 per diluted share) of after-tax restructuring expenses.Item 7 - Management's Discussion and Analysis of Financial Condition and Results of OperationsBusiness OverviewKimball International, Inc. provides a variety of products from its two business segments: the Electronic Manufacturing Services (EMS) segment and the Furniture segment. The EMS segment provides engineering and manufacturing services which utilize common production and support capabilities globally to the medical, automotive, industrial, control, and public safety industries. The Furniture segment provides furniture for the office and hospitality industries, sold under the Company's family of brand names.Projections for calendar year 2012 (by IDC and IHS iSuppli in January 2012) reported a range of projected growth from flat to19Both of the Company's segments have been adversely impacted by the weakening in the global economy. During fiscal year 2009, most of the markets in which the Company competes were affected by the global recession and liquidity crisis. The Company experienced declining sales and order trends beginning in its second fiscal quarter. Open orders at June 30, 2009 were 37% lower in the Furniture segment and 6% lower4% in the EMS segment when comparedindustry. In addition, the Semiconductor Industry Association (SIA) reported in January 2012 that semiconductor sales are projected to the levels at the end of the Company's second fiscal quarter.The EMS industry sales projections for calendar year 2009 (by IDC, iSuppli, and Electronic Trend Publications) show declines in the range of 7% to 13%. Semiconductor sales, though, are expected to decline approximately 20%have low single-digit growth in calendar year 2009,2012, and although the Company does not directly serve this market, it may indicate a decline inbe indicative of the end market demand for products utilizing electronic components. Generally, as electronics end markets decline,More recent EMS industry sales improveoutlooks have not been widely published as customers outsource a greater portion of their electronics manufacturing to free up capital for design and marketing programs and to gain cost advantages. However, customers could elect to insource a greater portion of their electronics manufacturing duringthere are no clear trends defining the industry this economic downturn.The Company continues its strategy of diversification within the EMS segment customer base as it currently focuses on the four key vertical markets of medical, automotive, industrial, control, and public safety.safety in the EMS segment. This segment's overall demand continues to stabilize, but is mixed. The automotive end market is benefiting from relative strength in the U.S. market while demand in other geographies such as Europe is less certain due to the impact of the European debt crisis. The industrial market demand is improving but continues to reflect a lower demand for heating, cooling, and ventilation (HVAC) products than historical levels. Demand in the automotive marketmedical and medical market began to stabilize during the Company's fiscal year 2009 fourth quarter, but the markets remain uncertain. The industrial control vertical market is showing signs of stabilization in certain areas, and the public safety vertical market is sending signalsmarkets remains stable.As of strength. Sales to customers inJune 2012, the medical industry are the largest portion of the Company's EMS segment with sales to customers in the automotive industry being the second largest. The Company's sales to customers in the automotive industry are diversified among more than ten domestic and foreign customers and represented approximately 27% of the EMS segment's net sales for fiscal year 2009. The amount of sales of electronic components that relate to General Motors, Ford, and Chrysler automobiles sold in North America were approximately 8% of the Company's EMS segment net sales during fiscal year 2009.The Company expects the furniture market to continue to decline or at best flatten out. The Business and Institutional Furniture Manufacturer Association (BIFMA International) is projecting an approximate 27%(BIFMA) forecasted a year-over-year declineincrease in the office furniture industry for calendar year 2009. While the Company expects its mid-market brand to fare better than its contract office furniture brand due to the project nature2012 of the contract market, it cannot predict future overall office furniture order trends at this time due to the short lead timeorders and the volatility in the global economy.7% forecast for calendar year 2013. The Company expects order rates for hospitality furniture to decline furthermarket forecasts (June 2012 reports by Smith Travel Research and PricewaterhouseCoopers LLP) project an approximate 2% increase in the near term as hotel occupancy rates and an approximate 6% increase in revenue per available room revenue rates are declining.Competitive pricing pressures within the EMS segment and on many projects within the Furniture segment continue to put pressure onburden the operating margins of select areas within both segments of the Company's operating margins.The current economic conditions and the tightening of the credit markets have also increased the risk of uncollectible accounts and notes receivables. Accordingly, the Company heightened its monitoring of receivables and related credit risks, and the Company believes its accounts and notes receivables allowance for uncollectible accounts is adequate as of June 30, 2009. Given the current market conditions and limited credit availability, the economy could decline further potentially requiring the Company to record additional allowances.The Company is continually assessing its strategies in relationcommitted to ensuring it sustains the significant macroeconomic challenges includingcost efficiencies and process improvements undertaken during the instability in the financial markets, credit availability, and demand for products. Arecession. In addition, a long-standing component of the Company's profit sharing incentive bonus plan and annual retirement contribution is that they are bothit is linked to the Company's worldwide, group, or business unit performance ofwhich adjusts compensation expense as profits change. The focus on cost control continues. At the same time, the Company which automatically lowers total compensation expense when profits are down.plans to continue to invest in capital expenditures prudently for projects in support of both organic growth and potential acquisitions that would enhance the Company's capabilities and diversification while providing an opportunity for growth and improved profitability. The Company has also implemented various initiatives in response to the deteriorating market conditions including reducing operating costs, more closely scrutinizing customer and supply chain risk, and deferring and cancelling capital expenditures that are not immediately required to support customer requirements. Examples of actions taken during fiscal year 2009 to reduce operating costs include a salary reduction plan announced in February 2009, which is expected to save $3 million in labor costs annually, permanent workforce reductions, and temporary personnel layoffs. In addition, to preserve cash, the dividends declared during the third and fourth quarters of fiscal year 2009 were reduced approximately 70% from the quarterly dividend rates paid in the first half of the fiscal year which translates to approximately $4 million less cash outflow each time dividends are paid. The Company will continuecontinues to closely monitor market changes and its liquidity in order to proactively adjust its operating costs, discretionary capital spending, and dividend levels as needed.The Company continuescontinued to havemaintain a strong balance sheet as of the end of fiscal year 2012,which includes aincluded minimal amount of long-term debt of $0.4$0.3 million and Share Owners' equity of $382.4 million.$386.2 million. The Company's short-term liquidity available, represented as cash and cash equivalents and short-term investments plus the unused amount of the Company's revolving credit facility, was $183.7$170.9 million at June 30, 2009.2012.risksdiscussion related to the current economicmarket conditions, management currently considers the following events, trends, and uncertainties to be most important to understanding the Company's financial condition and operating performance:Although the Company has seen recent moderate declines in the cost of some commodities and in fuel prices, these continue to be areas of focus within the Company.Globalization continues to reshape not only the industries in which the Company operates but also its key customers and competitors.The nature of the electronic manufacturing services industry is such that the start-up of new programs to replace departing customers or expiring programs occurs frequently. The success of the Company's EMS segment is dependent on the successful replacement of such customers or programs. Such changes usually occur gradually over time as old programs phase out of production while newer programs ramp up. While the margins vary depending on the size of the program and the vertical market being served, replacement programs often carry lower margins.Successful execution of the Company's restructuring plans is critical to the Company's future performance. The success of the restructuring initiatives is dependent on accomplishing the plans in a timely and effective manner. A critical component of the restructuring initiatives is the transfer of production among facilities which contributed to some manufacturing inefficiencies and excess working capital. The Company's restructuring plans are discussed in the segment discussions below.The increasingly competitive marketplace mandates that the Company continually re-evaluate its business models.The Company's employees throughout its business operations are an integral part of the Company's ability to compete successfully, and the stability of its management team is critical to long-term Share Owner value. The Company's career development and succession planning process helps to maintain stability in management.As end markets dictate, the Company is continually assessing under-utilized capacity and developing plans to grow the Company's customer base and better utilize manufacturing operations, including shifting manufacturing capacity to lower cost venues as necessary.o During the first quarter of fiscal year 2009, the Company approved a restructuring plan to consolidate production of select office furniture manufacturing departments. The consolidation is substantially complete and has reduced manufacturing costs and excess capacity by eliminating redundant property and equipment, processes, and employee costs.o During the fourth quarter of fiscal year 2008, the Company approved a plan to expand its European automotive electronics capabilities and to establish a European Medical Center of Expertise in Poznan, Poland. The Company presently has an operation in Poznan. The Company successfully completed the move of production from Longford, Ireland, into the existing Poznan facility during the second quarter of fiscal year 2009. As part of the plan, the Company will also consolidate its EMS facilities located in Bridgend, Wales, and Poznan into a new, larger facility in Poznan.o In an effort to improve profitability and increase Share Owner value while remaining committed to its business model of being market driven and customer centered, during the third quarter of fiscal year 2008, the Company approved a restructuring plan designed to more appropriately align its workforce in a changing business environment. Within the Company's EMS segment, the restructuring activities included realigning engineering and technical resources closer to the customer and streamlining administrative and sales processes. The Furniture segment part of the workforce reduction restructuring activities included realigning information technology and procurement resources closer to the customer and streamlining administrative and sales processes to drive further synergies afforded by the alignment of the sales and manufacturing functions within this segment. The plan also included reducing corporate personnel costs to more properly align with the overall sales mix change within the Company. This plan is complete.o In fiscal year 2008, the Company completed the consolidation of U.S. manufacturing facilities within the EMS segment due to excess capacity resulting in the exit of two facilities that were part of the 2007 acquisition of Reptron Electronics, Inc. ("Reptron"). To support diversification efforts, the Company has focused on both organic growth and acquisition activities. Acquisitions allow rapid diversification of both customers and industries served.The regulatory and business environment for U.S. public companies requires that the Company continually evaluate and enhance its practices in the areas of corporate governance and management practices. The Company has taken a number of steps to conform its corporate governance to evolving national and industry-wide best practices among U.S. public companies, not only to comply with new legal requirements, but also to enhance the decision-making process of the Board of Directors.While certain sectors are showing signs of economic recovery, the macroeconomic environment remains volatile as a result of continued uncertainty related to the European debt crisis, the upcoming U.S. elections, and the potential tax increases and spending cuts looming at the end of calendar year 2012. The uncertainty tends to cause disruption in business strategy, execution, and timing in many of the markets in which the Company competes.The nature of the EMS industry is such that the start-up of new programs to replace departing customers or expiring programs occurs frequently. As previously announced, the Company's sales to Bayer AG began to decline in the fourth quarter of fiscal year 2011 as the Company's primary manufacturing contract with Bayer AG expired. Margins on the Bayer AG product were generally lower than the Company's other EMS products. The Company continues to manufacture other products for Bayer AG. The success of the Company's EMS segment is dependent on the successful replacement of such customers or programs. Such changes usually occur gradually over time as old programs phase out of production while newer programs ramp up. The transition to new programs may temporarily reduce sales and increase operating costs, resulting in a temporary decline in operating profit at the impacted business unit.Inflation has moderated and does not appear to be a significant risk in the near-term, but the Company continues to focus on mitigating the impact of raw material commodity pricing pressures.The healthcare reform legislation that was signed into law in March 2010 and upheld by the Supreme Court in June 2012 is expected to increase the Company's healthcare and related administrative expenses as the provisions of the law become effective over the next couple of years.Globalization continues to reshape not only the industries in which the Company operates but also its key customers and competitors.20The Company's employees throughout its business operations are an integral part of the Company's ability to compete successfully, and the stability of its management team is critical to long-term Share Owner value. The Company's career development and succession planning processes help to maintain stability in management.Certain preceding statements could be considered forward-looking statements under the Private Securities Litigation Reform Act of 1995 and are subject to certain risks and uncertainties including, but not limited to, a significant change in economic conditions, loss of key customers or suppliers, or similar unforeseen events.Fiscal Year 20092012 Results of OperationsThe following discussions are based on income from continuing operations and therefore exclude all income statement activity of the prior years' discontinued operations.Financial Overview - ConsolidatedFiscal year 20092012 consolidated net sales were $1.21$1.14 billion compared to fiscal year 20082011 net sales of $1.35$1.20 billion an 11%, a 5% decrease, due to decreasedresulting from a 15% net sales decrease in both the EMS segment andwhich more than offset a 9% net sales increase in the Furniture segment. The Company recordedFiscal year 2012 net income from continuing operations for fiscal year 2009 of $17.3was $11.6 million, or $0.47$0.31 per Class B diluted share, inclusive of after-tax restructuring charges of $1.8$2.1 million, or $0.04$0.06 per Class B diluted share. The fiscal year 2009share, of after-tax restructuring charges werecosts primarily related to the European consolidation plan. The fiscal year 2009 results also included the following non-recurring items: an $18.9 million after-tax gain, or $0.51 per Class B diluted share, related to the sale of the Company's undeveloped land holdings and timberlands; a $9.1 million after-tax non-cash goodwill impairment charge, or $0.24 per Class B diluted share; and $1.6 million of after-tax income, or $0.04 per Class B diluted share, for earnest money deposits retained by the Company resulting from the termination of the contract to sell the Company's Poland building and real estate. The Company recorded net income from continuing operations for fiscal year 20082011 of $0.1$4.9 million, or less than $0.01$0.14 per Class B diluted share, inclusive of after-tax restructuring charges of $14.6$0.6 million, or $0.39$0.01 per Class B diluted share. The fiscal year 2008share, of after-tax restructuring charges werecosts primarily related to the European consolidation plan, a workforce reduction plan, and the exit of two domestic EMS facilities. Consolidated gross profit as a percent of net sales improved to 18.4% for fiscal year 2012 from 16.2%in fiscal year 2009 was 16.8% compared2011 due to 18.4%margin improvement in fiscal year 2008. Bothboth the EMS segment and Furniture segments coupled with a shift in sales mix (as depicted in the table below) toward the Furniture segment contributed towhich operates at a higher gross profit percentage than the decline asEMS segment. Gross profit is discussed in more detail in the segment discussions below.Segment Net Sales as a % of Consolidated Net Sales Year Ended June 30 2012 2011 EMS segment 54% 60% Furniture segment 46% 40% Fiscal year 20092012 consolidated selling and administrative expenses declineddecreased 1.6% in absolute dollars, but increased as a percent of net sales, and also declined in absolute dollars by 17% as compared to fiscal year 2008.2011, on decreased operating leverage due to lower revenue. The improvedCompany recorded $3.1 million less expense within selling and administrative expenses were primarilyin fiscal year 2012 than fiscal year 2011 related to benefits realized as a resultthe normal revaluation to fair value of the previously announced restructurings; lower salary and wage expense; lower incentive compensation and employee benefit costs which are linked to Company profitability; lower depreciation and amortization expense; lower sales and marketing incentive costs; lower travel costs; and other improvements resulting from the focus on managing all costs as a result of the current macroeconomic conditions. Partially offsetting these cost declines, bad debt expense was $3.8 million higher for fiscal year 2009 compared to fiscal year 2008 as a result of current market conditions. Additionally, during fiscal years 2009 and 2008, the Company recorded $2.8 million and $1.3 million, respectively, of favorable adjustments due to reductions in itsCompany's Supplemental Employee Retirement Plan (SERP) liability resulting from the normalliability. The revaluation of the liability to fair value. The result for the fiscal year comparison was a favorable variance in selling and administrative costs of $1.5 million. The gain resulting from the reduction of the SERP liability that was recognizedrecorded in selling and administrative expenses wasis exactly offset by a decline inthe revaluation of the SERP investment which was recorded in Other Income (Expense), and thus; therefore, there was no effect on net earnings. TheEmployee contributions comprise approximately 90% of the SERP investment is primarily comprised of employee contributions.Fiscal year 2009 Other General Income included a $31.52012 other expense totaled $0.7 million pre-tax gain on the sale compared to other income of undeveloped land holdings and timberlands. The gain on the sale of land was included in Unallocated Corporate in segment reporting. Also impacting the$2.0 million for fiscal year 20092011. Other General Incomeincome (expense) consisted of the following:Other Income (Expense) Year Ended June 30 (Amounts in Thousands) 2012 2011 Interest Income $ 430 $ 820 Interest Expense (35 ) (121 ) Foreign Currency/Derivative Gain (Loss) 568 (1,208 ) Gain (Loss) on Supplemental Employee Retirement Plan Investment (3 ) 3,064 Impairment Loss on Privately-Held Investment (715 ) — Impairment Loss on Convertible Debt Securities — (1,216 ) Gain (Loss) on Stock Warrants (526 ) 1,041 Other (406 ) (359 ) Other Income (Expense), net $ (687 ) $ 2,021 The impairment loss on privately-held investment, the impairment loss on convertible debt securities, and the gain (loss) on stock warrants listed in the table above all relate to the Company's investment in one privately-held company. See the Notes to Consolidated Financial Statements for more detailed information.21The fiscal year 2012 effective tax rate was $1.9 million34.3%. The fiscal year 2011 effective tax rate was (10.9)% as relatively low pre-tax income from earnest money deposits retained by the Company resulting from the termination of the contract to sell and lease back the Company's Poland building and real estate. The buyer was unable to close the transaction, and as a result, the Company was entitled to retain the deposit funds. This income was recorded in the EMS segment.The Company recorded non-cash pre-tax goodwill impairment charges of $14.6 million during fiscal year 2009 as a result of interim goodwill impairment testing which was completed due to the continued uncertainty associatedcoupled with the economy and the significant decline in the Company's sales and order trends as well as the increased disparity between the Company's market capitalization and the carrying value of its Share Owners' equity. The goodwill was related to prior acquisitions in bothfavorable impact of the Company's segments.earnings mix and the research and development credit resulted in a tax benefit despite the Company's pre-tax income. The mix of earnings between U.S. and foreign jurisdictions largely contributed to the overall tax benefit due to losses in the U.S. which have a higher statutory tax rate than the Company's foreign operations which were profitable in fiscal year 2011. See 18 - Summary of Significant Accounting PoliciesIncome Taxes of Notes to Consolidated Financial Statements for more information on goodwill.Comparing the balance sheet as of June 30, 2012 to June 30, 2011, the decrease in accounts receivable was a result of the Company's lower sales levels and a shift in the payment practices of three large EMS segment customers during fiscal year 2012 which favorably impacted the Company's accounts receivable balance. A reduction in the Company's inventory balance was primarily the result of successful inventory reduction initiatives in both segments, and the Company's accounts payable balances declined in conjunction with the reduced inventory levels. The decreased accrued expenses balance was primarily driven by a decline in accrued compensation and a decline in accrued restructuring as the European consolidation plan was completed during fiscal year 2012.Electronic Manufacturing Services SegmentEMS segment results follow: At or For the Year Ended June 30 (Amounts in Millions) 2012 2011 % Change Net Sales $ 616.8 $ 721.4 (15 )% Operating Income $ 8.9 $ 5.5 62 % Operating Income % 1.4 % 0.8 % Net Income $ 6.6 $ 4.1 62 % Restructuring Expense, net of tax $ 1.7 $ 0.5 Open Orders $ 170.6 $ 165.1 3 % Fiscal year 2009 other expense totaled $0.4 million2012 EMS segment net sales to customers in the medical, industrial, and public safety industries decreased compared to fiscal year 2008 other income of $3.2 million. The $1.5 million variance in SERP investments contributed to the increased other expenses. Fiscal year 2008 other income also included $1.3 million of pre-tax income relating to funds received as part of a Polish offset credit program for investments made in the Company's Poland operation.The Company's effective tax rate for fiscal year 2009 was 31.6%. The fiscal year 2009 effective tax rate was positively impacted by a tax benefit related to a European subsidiary and to a lesser extent various tax benefits such as tax-exempt interest income and the research and development credit together more than offset the negative impact of losses generated in select foreign jurisdictions with tax rates lower than the domestic rate. As a result of various tax benefits in fiscal year 2008, such as tax-exempt interest income and the research and development credit, coupled with the tax benefit recorded related to the pre-tax loss, the Company recorded an overall income tax benefit greater than the pre-tax loss in fiscal year 2008. For further detail see Note 9 - Income Taxes of Notes to Consolidated Financial Statements.Comparing the balance sheets as of June 30, 2009 to June 30, 2008, the Company's combined cash and short-term investments balances increased primarily due to cash inflows related to reductions in the Company's accounts receivable and inventory balances and the sale of the Company's undeveloped land holdings and timberlands. The Company's accounts receivable balance declined primarily as a result of the lower sales volumes, and the inventory balance declined due to the lower sales volumes and a focus on managing working capital during the latter half of fiscal year 2009. The Company's accounts payable balance also decreased since June 30, 2008 in relation to the declining inventory balances. The increase in property and equipment was primarily due to the construction of the new EMS segment facility in Poland and the purchase of other EMS segment manufacturing equipment. The other assets line declined due to the sale of the tracts of undeveloped land holdings and timberlands; cash proceeds received from this sale increased the Company's cash balance and allowed the Company to reduce borrowings under its credit facilities. Accrued expenses as of June 30, 2009 declined when compared to June 30, 2008 primarily due to decreased accruals for employee benefits which are linked to Company profitability, lower accrued selling expenses, lower accrued restructuring expenses, and a decline in the deferred income balance due to recognition of various items during fiscal year 2009.The variance in the additional paid-in capital and treasury stock lines was primarily attributable to the fulfillment of requests by Share Owners to convert approximately 1,188,000 shares from Class A shares to Class B shares and the issuance of vested restricted share units to key employees. The decline in Accumulated Other Comprehensive Income (Loss) was related to foreign currency translation adjustments and derivative financial instruments. See Note 17 - Comprehensive Income of Notes to Consolidated Financial Statements for more information on derivative financial instruments and foreign currency translation adjustments.Electronic Manufacturing Services SegmentDuring the first quarter of fiscal year 2009, the Company acquired privately-held Genesis Electronics Manufacturing of Tampa, Florida, for $5.4 million. The acquisition supports the Company's growth and diversification strategy, bringing new customers in the Company's key medical and industrial controls markets. The operating results of this acquisition were included in the Company's consolidated financial statements beginning on September 1, 2008 and excluding the related goodwill impairment had an immaterial impact on the fiscal year 2009 financial results. See Note 2 - Acquisitions of Notes to Consolidated Financial Statements for more information on the acquisition.During the fourth quarter of fiscal year 2008, the Company approved a plan to expand its European automotive electronics capabilities and to establish a European Medical Center of Expertise in Poznan, Poland. The Company successfully completed the move of production from Longford, Ireland, into the existing Poznan facility during the fiscal year 2009 second quarter. As part of the plan, the Company will also consolidate its EMS facilities located in Bridgend, Wales, and Poznan, Poland, into a new, larger facility in Poznan, which is expected to improve the Company's margins in the very competitive EMS market. Construction of the new, larger facility in Poland is complete with limited production to begin early in the Company's fiscal year 2010. The plan is being executed in stages with a projected completion date of December 2011. See Note 18 - Restructuring Expense of Notes to Consolidated Financial Statements for more information on restructuring charges.Also during the fourth quarter of fiscal year 2008, the Company had signed a conditional agreement to sell and lease back the facilities and real estate that house its current Poland operations. The Company planned to lease back the building until December 2011 at which time it will have completed the consolidation of its European operations into a newly constructed facility in Poland. The closing on the sale of the existing Poland facility was expected to occur before December 31, 2008. The buyer was unable to close the transaction. Pursuant to the agreement, the Company was entitled to retain approximately $1.9 million of earnest money deposit funds held by the Company which was recorded as pre-tax Other General Income in the Company's fiscal year 2009. The Company continues to market the facility and real estate which were not impaired as of June 30, 2009.EMS segment results were as follows:
Year Ended Fiscal year 2009 net sales to customers in the automotive and industrial control industries experienced double digit percentage declinesindustry. The decline in net sales to the medical industry was attributable to the expiration of a contract with one medical customer (Bayer AG) late in fiscal year 2011 which accounted for a 2008. To a lesser extent, sales to customers in the medical industry also declined, and sales to customers in the public safety industry increased when2011. Open orders as of June 30, 2012 were up 3% compared to fiscal year 2008. Due to the contract nature of the Company's business,June 30, 2011. However, open orders at a point in time may not be indicative of future sales trends.Fiscal year 20092012 EMS segment gross profit as a percent of net sales declined 1.7improved 1.4 percentage points when compared to fiscal year 20082011. The improvement was primarily due to lower volumes; inefficiencies indriven by the segment's European operations which are currently being consolidated into one facility;benefit from a shift in sales mix shift toward higher margin product and benefits realized related to lower margin product; higher employee healthcare costs; higher depreciation expense;restructuring activities in which two facilities were closed during the second quarter of fiscal year 2012.EMS segment selling and contractual customer price reductions on select products. Partially mitigating the lower margins were benefits the segment realized on the North American consolidation activities which were completed lateadministrative expenses in absolute dollars decreased 11% in fiscal year 2008.The EMS segment achieved a 25% reduction in selling and administrative expense in absolute dollars for fiscal year 20092008. Selling and administrative costs also decreased 1.5 percentage points2011, but increased as a percent of net sales.sales on the lower sales volumes. The improvement wasselling and administrative expenses declined primarily relateddue to benefits realized from restructuring activities reduced spending on travel, lower depreciation/amortization expense, and a strong focus on managing all costs including labor reductions as a resultwithin this segment.The previously announced exit of the current macroeconomic conditions. Lower incentive compensation costs and lower employee benefit costs which are linked to Company profitability also contributedCompany's small assembly facility located in Fremont, California was completed during fiscal year 2012 along with the associated move of a majority of that business to the selling and administrativeJasper, Indiana facility. In addition, the previously announced consolidation of the Company's European EMS facilities was likewise completed during fiscal year 2012. See Note 17 - Restructuring Expense of Notes to Consolidated Financial Statements for more information on restructuring charges.EMS segment Other Income/Expense for fiscal year 2012 totaled expense reduction asof $0.3 million, compared to fiscal year 2008.The restructuring expense recordedof 20092011. The variance in Other Income/Expense was primarily related to the European consolidation plan. The fiscal year 2008 restructuring expense was primarily related to the European consolidation plan, the workforce reduction plan, and the exit of two domestic EMS facilities.Fiscal year 2009 Other General Income included $1.9 million pre-tax, which equated to $1.6 million after-tax, income from the earnest money deposits retained by the Company resulting from the termination of the contract to sell and lease back the Company's Poland building and real estate.The fiscal year 2009 EMS segment earnings were also impacted by the recording of non-cash pre-tax goodwill impairment of $12.8 million, which equated to $8.0 million after-tax. During fiscal year 2008, goodwill impairment of $0.2 million pre-tax was recorded on the Restructuring line item of the Company's Consolidated Statements of Income as it related to a restructuring plan.The fiscal year 2008 other income/expense included $1.3 million of pre-tax, or $0.7 million after-tax, income relating to funds received as part of a Polish offset credit program for investments made in the Company's Poland operation.22Included in this segment arewere a significant amount of sales to Bayer AG affiliates in the prior fiscal year which accounted for the following portions of consolidated net sales and EMS segment net sales:Bayer AG affiliated sales as a percent of consolidated net sales Year Ended June 30 2012 2011 Bayer AG affiliated sales as a percent of consolidated net sales —% 11% Bayer AG affiliated sales as a percent of EMS segment net sales 1% 19% The Company's sales to Bayer AG declined due to the expiration of the Company's primary manufacturing contract with this customer. This contract accounted for a majority of the sales to Bayer AG during fiscal year 2011. Margins on the Bayer AG product were generally lower than the Company's other EMS products. The nature of the electronic manufacturing services industry is such that the start-up of new customers and new programs to replace expiring programs occurs frequently. New customer and program start-ups generally cause losses early in the life of a program, which are generally recovered as the program maturesbecomes established and becomes established.matures. This segment continues to experience margin pressures related to an overall excess capacity position in the electronics subcontracting services market.Risk factors within thisthe EMS segment include, but are not limited to, general economic and market conditions, customer order delays, increased globalization, foreign currency exchange rate fluctuations, rapid technological changes, component availability, supplier stability, the contract nature of this industry, unexpected integration issues with acquisitions, the importanceconcentration of sales to large customers, and the potential for customers to choose a dual sourcing strategy or to insourcein-source a greater portion of their electronics manufacturing. The continuing success of this segment is dependent upon its ability to replace expiring customers/programs with new customers/programs. Additional risk factors that could have an effect on the Company's performance are located within Item 1A - Risk Factors.During the first quarter of fiscal year 2009, the Company approved a restructuring plan to consolidate production of select office furniture manufacturing departments. The consolidation reduced manufacturing costs and excess capacity by eliminating redundant property and equipment, processes, and employee costs. The consolidation was substantially complete as of the end of fiscal year 2009. See Note 18 - Restructuring Expense of Notes to Consolidated Financial Statements for more information on restructuring charges.Furniture segment results were as follows:
Year Ended At or For the Year Ended June 30 (Amounts in Millions) 2012 2011 % Change Net Sales $ 525.3 $ 481.2 9 % Operating Income $ 11.9 $ 1.1 1,003 % Operating Income % 2.3 % 0.2 % Net Income $ 7.0 $ 0.5 1,374 % Open Orders $ 72.0 $ 90.4 (20 )% The fiscal year 2012 net sales declineincrease in the Furniture segment for fiscal year 2009 compared to fiscal year 20082011 resulted primarily from decreased net sales of office furniture which were partially offset by increased net sales of hospitality furniture and to a lesser extent from increased net sales of office furniture. PriceThe increase in net sales of hospitality furniture was driven by large custom projects during fiscal year 2012. The increase in office furniture net sales was due to the positive impact of price increases net of higherincremental discounting contributed approximately $9.6 million to netwhich more than offset a decrease in sales during fiscal year 2009 when compared to fiscal year 2008.volume. Fiscal year 20092012 sales of newly introduced office furniture products which have been sold for less than twelve months approximated $26.8 million. Furniture$13.5 million. Open orders of furniture products open orders at June 30, 2009 declined when compared to2012 decreased 20% from the orders open orders at as of June 30, 20082011 primarily due to decreased open orders for bothlower office furniture orders from the U.S. federal government and a large hospitality furniture.custom project received near the end of fiscal year 2011 which was included in the June 30, 2011 open orders. Open orders at a point in time may not be indicative of future sales trends.Fiscal year 20092012 Furniture segment gross profit as a percent of net sales declined 1.8improved 0.7 percentage points when compared to fiscal year 2008. In addition to the impact of the lower net sales level,2011. Fiscal year 2012 gross profit was negatively impacted by higher commodity costs, increased discounting on select product, costs incurred for supplier-related issues, and a sales mix shift to lower margin product. Partially offsetting the higher costs were price increases on select office furniture products, labor efficiency improvements, decreased employee benefit costs which are linked to Company profitability, and a decrease in LIFO inventory reserves resulting from lower inventory levels which positively impacted the fiscal year 2009 gross profit.Fiscal year 2009 selling and administrative expenses decreased in both absolute dollars and as a percent of net sales was favorably impacted by sales price increases net of incremental discounting, by a recovery of previously paid import duties related to a retroactive change in a tariff rate, and by the favorable impact resulting from a decrease in the LIFO inventory reserve. The improvement in fiscal year Fiscal year 2012 selling and administrative expenses increased in absolute dollars by 3.9%, but decreased as a percent of net sales on the higher sales volumes, when compared to fiscal year 2008.2011. The selling and administrative expense decline resulted from lowerexpenses were impacted by higher salary expenses, related to the workforce reduction restructuring activities, lower sales and marketing incentive costs, lower travel expense, lowerhigher incentive compensation costs, and employee benefit costs which are linked to Company profitability, and other improvements resulting from the focus on managing all costs as a result of the current macroeconomic conditions. Partially offsetting the selling and administrative expense improvements was increased bad debt expense of approximately $2.6 million on a pre-tax basis in fiscal year 2009 compared to fiscal year 2008.The fiscal year 2008 restructuring charges were primarily related to the workforce reduction plan.The fiscal year 2009 Furniture segment earnings were also impacted by the recording of non-cash pre-tax goodwill impairment of $1.8 million, which equated to $1.1 million after-tax.23Risk factors within this segment include, but are not limited to, general economic and market conditions, increased global competition, financial stability of customers, supply chain cost pressures, and relationships with strategic customers and product distributors. Additional risk factors that could have an effect on the Company's performance are located within Item 1A - Risk Factors.Fiscal Year 20082011 Results of OperationsDiscontinued OperationsDuring the first quarter ofFinancial Overview - ConsolidatedFiscal year 2011 consolidated net sales were $1.20 billion compared to fiscal year 2007,2010 net sales of $1.12 billion, a 7% increase, resulting from a 16% net sales increase in the Furniture segment and a 2% net sales increase in the EMS segment. Fiscal year 2011 net income was $4.9 million, or $0.14 per Class B diluted share, inclusive of $0.6 million, or $0.01 per Class B diluted share, of after-tax restructuring costs primarily related to the European consolidation plan. The Company recorded net income for fiscal year 2010 of $10.8 million, or $0.29 per Class B diluted share, inclusive of $1.2 million, or $0.03 per Class B diluted share, of after-tax restructuring costs primarily related to the European consolidation plan. The fiscal year 2010 results also included the following items: a $7.7 million after-tax gain, or $0.20 per Class B diluted share, related to the sale of a facility and land in Poland, and $2.0 million of after-tax income, or $0.05 per Class B diluted share, resulting from settlement proceeds related to an antitrust class action lawsuit of which the Company approvedwas a planclass member.Consolidated gross profit as a percent of net sales improved to exit16.2% for fiscal year 2011 from 15.7% in fiscal year 2010 primarily due to a shift in sales mix (as depicted in the production of PTV cabinets and stands withintable below) toward the Furniture segment which resultedoperates at a higher gross profit percentage than the EMS segment. Gross profit is discussed in more detail in the exitsegment discussions below.Segment Net Sales as a % of Consolidated Net Sales Year Ended June 30 2011 2010 EMS segment 60% 63% Furniture segment 40% 37% Fiscal year 2011 consolidated selling and administrative expenses increased 5.2% in absolute dollars, but decreased as a percent of net sales, compared to fiscal year 2010, on increased operating leverage as a result of the increase in revenue. The increase in absolute dollars was primarily due to higher commissions in the Furniture segment resulting from the higher sales volumes and higher labor costs which were partially offset by lower severance expense. In addition, the Company recorded $3.1 million of expense within selling and administrative expenses due to an increase in its SERP liability resulting from the normal revaluation of the liability to fair value during fiscal year 2011 compared to $1.5 million of expense which was recorded in fiscal year 2010. The value of the SERP investments increased causing additional selling and administrative expense related to the SERP liability. The SERP expense recorded in selling and administrative expenses was exactly offset by an increase in SERP investment income which was recorded in Other Income (Expense) as an investment gain; therefore, there was no effect on net earnings.The Company recorded no Other General Income during fiscal year 2011. Other General Income in fiscal year 2010 included $6.7 million pre-tax gain recorded in the EMS segment related to the sale of the Company's Juarez, Mexico, operation. Production ceased at the Juarezland and facility during the second quarter ofthat housed its Poland operation before moving to another facility in Poland. In addition, fiscal year 2007,2010 Other General Income included $3.3 million of pre-tax income also recorded in the EMS segment resulting from settlement proceeds related to the antitrust class action lawsuit of which the Company was a class member.Other Income (Expense) included other income of $2.0 million for fiscal year 2011 compared to other income of $3.3 million for fiscal year 2010. The variance in other income was driven by unfavorable foreign exchange movement that impacted the EMS segment and all inventory has been sold. Miscellaneous wrap-up activities including dispositiona $1.2 million impairment loss related to the valuation of remaining equipmentconvertible notes which were completepartially offset by the increased SERP investment income mentioned above and a revaluation of stock warrants resulting in a gain of $1.0 million.The fiscal year 2011 effective tax rate was (10.9)% as relatively low pre-tax income coupled with the favorable impact of the Company's earnings mix and the research and development credit resulted in a tax benefit despite the Company's pre-tax income. The mix of earnings between U.S. and foreign jurisdictions largely contributed to the overall tax benefit due to losses in the U.S. which have a higher statutory tax rate than the Company's foreign operations which were profitable in fiscal year 2011. The fiscal year 2010 effective tax rate was (81.0)% as relatively low pre-tax income coupled with a tax benefit due to the Company's tax planning strategy related to the sale of its Poland facility and land and the favorable impact of the Company's earnings mix resulted in a tax benefit in fiscal year 2010 despite the Company's pre-tax income. See Note 8 - Income Taxes of Notes to Consolidated Financial Statements for more information.24Electronic Manufacturing Services SegmentEMS segment results follow: At or For the Year Ended June 30 (Amounts in Millions) 2011 2010 % Change Net Sales $ 721.4 $ 709.1 2 % Operating Income $ 5.5 $ 15.3 (64 )% Net Income $ 4.1 $ 15.7 (74 )% Poland Land/Facility Gain, net of tax $ — $ 7.7 Restructuring Expense, net of tax $ 0.5 $ 1.2 Open Orders $ 165.1 $ 199.1 (17 )% Fiscal year 2011 EMS segment net sales to customers in the medical, industrial, and public safety industries increased compared to fiscal year 2010 which more than offset a decrease in net sales to customers in the automotive industry. Open orders were down 17% as of June 30, 2007. During the fourth quarter2011 compared to June 30, 2010 primarily due to lower orders from Bayer AG.Fiscal year 2011 EMS segment gross profit as a percent of net sales improved 0.2 percentage points when compared to fiscal year 20082010. The improvement was primarily driven by the Company bought outbenefit from a sales mix shift toward higher margin product, lower depreciation expense, and improved labor efficiencies at select units which more than offset inefficiencies related to the remaining termEuropean restructuring activities and higher component costs related to the rapid ramp up of the building lease. Asnew customer programs.EMS segment selling and administrative expenses in absolute dollars increased 7% in fiscal year 2011 as compared to fiscal year 2010 and also increased as a resultpercent of ceasing operations at this facility, the financial results associated with the Mexican operations in the Furniture segment were classified as discontinued operations beginning in the quarter ended December 31, 2006,net sales primarily due to increased salaries and all prior periods were restated.The pre-tax restructuring charges recorded during fiscal year 2011 totaled $0.9 million. See Note 1917 - Discontinued OperationsRestructuring Expense of Notes to Consolidated Financial Statements for more information on the discontinued operations.Financial results of the discontinued operations were as follows:Loss from Discontinued Operations per Class B Diluted Share Company does not disclose discontinued operations separately from continuing operations in the Consolidated Statements of Cash Flows. However, for clarity purposes, the Company does separately disclose the adjustment to net income for the loss on disposal of discontinued operations in cash flows from operating activities and the proceeds from disposal of discontinued operations in cash flows from investing activities.The following discussions are based on income from continuing operations and therefore exclude all income statement activity of the discontinued operations.Financial Overview - ConsolidatedFiscal year 2008 consolidated net sales were $1.35 billion compared to fiscal year 2007 net sales of $1.29 billion, a 5% increase over fiscal year 2007. The higher net sales resulted from increased EMS segment net sales related to the third quarter fiscal year 2007 Reptron acquisition within the EMS segment which contributed net sales of $144 millionrestructuring expenses recorded in fiscal year 2008 and $55 million in fiscal year 2007 as well as increased organic Furniture and EMS segment net sales. In addition, in mid-fiscal year 2007, the Company reduced the price of finished product sold to a customer in the EMS segment which carried forward through fiscal year 2008. Fiscal year 2008 had a full-year impact of this pricing reduction while fiscal year 2007 only had the impact for half of the year and thus resulted in a $65 million net sales reduction in fiscal year 2008 when compared to fiscal year 2007, which partially offset the EMS sales increase.The Company recorded income from continuing operations for fiscal year 2008 of $0.1 million, or less than $0.01 per Class B diluted share, inclusive of after-tax restructuring charges of $14.6 million, or $0.39 per Class B diluted share. The fiscal year 2008 restructuring charges2010 were primarily related to the European consolidation plan,plan.The EMS segment recorded no Other General Income during fiscal year 2011. EMS segment Other General Income for fiscal year 2010 included a workforce reduction plan,$6.7 million pre-tax gain from the sale of the existing Poland facility and land. Including the exittax benefit related to the sale of two domestic EMS facilities. Fiscal year 2007 income from continuing operationsthis facility and land, the after-tax gain was $23.3 million, or $0.60 per Class B diluted share, inclusive of after-tax restructuring charges of $0.9 million, or $0.02 per Class B diluted share. Information regarding the Reptron acquisition and restructuring plans is included in the segment discussions below.Consolidated gross profit as a percent of sales$7.7 million. In addition, Other General Income in fiscal year 2008 was 18.4%2010 included $3.3 million of pre-tax income, or $2.0 million after-tax, resulting from settlement proceeds related to the antitrust class action lawsuit.EMS segment Other Income/Expense for fiscal year 2011 totaled expense of $1.9 million, compared to 20.3%income of $0.1 million in fiscal year 2007. Both the EMS segment and the Furniture segment contributed2010. The variance in Other Income/Expense was primarily related to the decline as discussedunfavorable foreign currency exchange movement in more detail in the segment discussions below. Gross profit was also negatively impacted as the Company's sales mix continued to shift toward the EMS segment, which operates at a lower gross profit percentage than the Furniture segment. Partially offsetting the fiscal year 2008 gross profit as2011.As a percent of net sales, decline, the EMS customer pricing adjustment discussed above increased gross margin as a percent of net sales approximately 1 percentage point compared to fiscal year 2007 gross margin. This EMS customer pricing adjustment had no impact on the gross margin dollars for either fiscal year 2008 or fiscal year 2007 as the reduction in sales was offset by an equal reduction in material cost purchased from the same customer.The fiscal year 2008 consolidated selling and administrative expense level in absolute dollars approximated the fiscal year 2007 level and declined as a percent of net sales. The decline in consolidated selling and administrative costs as a percent of net sales was primarily due to the leverage of the higher net sales level and the shift in sales mix toward the EMS segment, which has a lower selling and administrative expense percentage than the Furniture segment. Fiscal year 2008 other income totaled $3.2 million compared to fiscal year 2007 other income of $9.9 million. Fiscal year 2008 interest expense was $0.9 million higher due to higher average outstanding debt balances, and fiscal year 2008 interestoperating income was $1.9 million lower than fiscal year 2007 as the Company's average cash and short-term investment balances were lower. In addition, a $3.5 million decline in the market value of the Company's SERP investments0.8% for fiscal year 2008 as compared to2011 and 2.2% for fiscal year 2007 contributed to2010. Fiscal year 2010 operating income included the decline in other income. The lossgain on the SERP investment that was recognized in other income was exactly offset by a reduction insale of the SERP liability which was recognized in sellingPoland facility and administrative expense in accordance with U.S. GAAP. Fiscal year 2008 other incomeland and also included $1.3 million pre-tax income relating to funds received as part of a Polish offset credit program for investments made in the Company's Poland operation.As a result of various tax benefits insettlement from the class action lawsuit.The EMS segment fiscal year 2008, such as tax-exempt interest income and the research and development credit, coupled with the tax benefit recorded related to the pre-tax loss, the Company recorded an overall income tax benefit greater than the pre-tax loss. The fiscal year 20072011 effective tax rate was 36%. For further detail see Note 9 - Income Taxes of Notes to Consolidated Financial Statements.Electronic Manufacturing Services SegmentIn an effort to improve profitabilityfavorably impacted by the earnings mix between U.S. and increase Share Owner value while remaining committed to its business model of being market driven and customer centered, during the third quarter offoreign jurisdictions. During fiscal year 2008,2010, the Company approved a restructuring plan designed to more appropriately align its workforce in a changing business environment. Within the Company's EMS segment the restructuring activities included realigning engineering and technical resources closer to the customer and streamlining administrative and sales processes. The plan also included reducing corporate personnel costs to more properly align with the overall sales mix change within the Company. Expenditures were primarily for employee severance and transition costs. This plan is complete.On February 15, 2007, the Company acquired Reptron, a U.S. based electronics manufacturing services company which provided engineering services, electronics manufacturing services, and display integration services. The total amountrecorded $1.0 million of funds required to consummate the merger and to pay feestax income related to the merger was $50.9 million. Reptron had four manufacturing operations located in Tampa, Florida; Hibbing, Minnesota; Gaylord, Michigan; and Fremont, California. The acquisition increased the Company's capabilities and expertise in support of the Company's long-term strategy to grow business in the medical electronics and high-end industrial sectors. The operating results of this acquisition are included in the Company's consolidated financial statements beginning on the acquisition date. With the acquisition, the Company recognized it would have excess capacity in North America. Management developed a plan as of the acquisition date to consolidate capacity within the acquired facilities. Based on a review of future growth potential in various geographies and input from existing customers regarding future capacity needs, during the fourth quarter of fiscal year 2007 the Company finalized a restructuring plan within the EMS segment to exit the facility located in Gaylord, Michigan, and transfer the business to several of the Company's other EMS facilities. The Company ceased production at the facility during the second quarter of fiscal year 2008. Excess equipment was sold during the third quarter of fiscal year 2008, and the Gaylord facility is currently classified as held for sale. Expenditures included employee severance and transition costs which were recognized as part of the purchase price allocation, not impacting earnings. Expenditures also included losses on the sale of equipment, impairment on the facility and an immaterial amount related to other closure activities which impacted earnings as the costs were incurred.land in Poland instead of tax expense normally associated with a gain, resulting from a tax planning strategy. The Company expects to recognize minimal future charges related to ongoing facility maintenance expenses. During the second quarter of fiscal year 2008, the Company approved a separate restructuring plan to further consolidate its EMS facilities that resulted in the exit of the manufacturing facility located in Hibbing, Minnesota, which was also one of the acquired Reptron facilities. Production at the Hibbing facility ceased in the fourth quarter of fiscal year 2008, and the Company's lease of the Hibbing facility ended in December 2008. A majority of the Hibbing business transferred to several of the Company's worldwide EMS facilities. Expenditures, most of which were recognized during fiscal year 2008, included employee severance and transition costs, asset and goodwill impairment, lease exit costs, and other plant closure and exit costs.During the third quarter of fiscal year 2006, the Company approved a restructuring plan within the2010 EMS segment to exit a manufacturing facility located in Northern Indiana. As part of this restructuring plan, the production for select programsincome tax was transferred to other locations within this segment. Operations at this facility ceased in the Company's first quarter of fiscal year 2007, and the facility was sold during fiscal year 2008. The plan included employee transition costs, accelerated software amortization costs, accelerated asset depreciation, and other restructuring costs which were partially offset by gains on the sale of equipment net of other asset impairment. The decision to exit this facility was a result of excess capacity in North America.EMS segment net sales and open orders were as follows:
June 30Fiscal year 2008 EMS segment net sales increased $54 million, or 8%, from fiscal year 2007. The acquisition completed midway through the third quarter of fiscal year 2007 within the EMS segment contributed sales of $144 million in fiscal year 2008 and $55 million in fiscal year 2007. In addition, in mid-fiscal year 2007, the Company reduced the price of finished product sold to a customer in the EMS segment which carried forward through fiscal year 2008. Fiscal year 2008 had a full-year impact of this pricing reduction while fiscal year 2007 only had the impact for half of the year and thus resulted in a $65 million net sales reduction in fiscal year 2008 when compared to fiscal year 2007. See the discussion below for more information on this selling price change. Increased sales to customers in the medical, industrial control, and public safety industries more than offset decreased sales to customers in the automotive industry driven by declines in the domestic automotive market.The EMS segment recorded a loss from continuing operations of $15.3 million for fiscal year 2008, inclusive of after-tax restructuring charges of $12.8 million primarily related to the European consolidation plan, the workforce reduction plan, and the exit of two domestic EMS facilities. EMS segment fiscal year 2007 income from continuing operations totaled $1.0 million, inclusive of after-tax restructuring charges of $0.1 million. Fiscal year 2008 gross profit as a percent of net sales declined 1.2 percentage points compared to fiscal year 2007. Fiscal year 2008 gross profit was negatively impacted by excess capacity costs and inefficiencies some of which were associated with the closure of two domestic facilities and the related transfer of production to other facilities within this segment. Gross profit was also negatively impacted by a shift in product mix to lower margin product.Beginning in the third quarter of fiscal year 2007, gross profit as a percent of sales was favorably impacted by a reduction in the pricingmix of select raw material which is purchased from Bayer AGearnings between U.S. and affiliates, a major customer within theforeign EMS segment. The selling price of the finished product back to Bayer AG and affiliates was likewise reduced by an amount equal to the material price reduction. While there was no impact to gross profit dollars, net income, or net cash flows related to this pricing change, gross profit as a percent of net sales increased approximately 1 percentage point, and selling and administrative expense as a percent of net sales increased by a similar percentage for fiscal year 2008 as compared to fiscal year 2007.Fiscal year 2008 selling and administrative expense increased in both dollars and as a percent of net sales when compared to fiscal year 2007. The inclusion of the selling and administrative expenses of the mid-third quarter fiscal year 2007 acquisition for the entire fiscal year 2008 was the primary driver of the increase in selling and administrative expense in absolute dollars. The customer pricing adjustment mentioned above increased selling and administrative expense as a percent of net sales, and the leverage of higher sales volume decreased selling and administrative expense as a percent of net sales. In addition, increased investments in business development resources contributed to the selling and administrative expense increase as a percent of net sales and in absolute dollars.The fiscal year 2008 and 2007 earnings were unfavorably impacted by pre-tax costs, in millions, of $2.3 and $3.5, respectively, related to the start-up of an EMS manufacturing facility in China. Fiscal year 2008 income from continuing operations included $1.3 million of pre-tax income relating to funds received as part of the Polish offset credit program for investments made in the Company's Poland operation.Bayer AG affiliated sales as a percent of consolidated net sales Year Ended June 30 2011 2010 Bayer AG affiliated sales as a percent of consolidated net sales 11% 15% Bayer AG affiliated sales as a percent of EMS segment net sales 19% 24% 25The reduction in fiscal-year-to-dateCompany's sales to Bayer AG is relatedbegan to two factors. First,decline in January 2007, Bayer AG sold its diagnostics unitthe fourth quarter of fiscal year 2011 due to Siemens AG, and thus a portionthe expiration of the Company's net sales which were formerly toprimary manufacturing contract with Bayer AG affiliates in fiscal year 2007 are now to Siemens AG. Second, netThis contract accounted for a majority of the sales to Bayer AG affiliates were also impacted as a result of the Company's aforementioned selling price reduction effective January 2007 to Bayer AG affiliates which was offset by an equal reduction in the material cost.Furniture SegmentAs part of the workforce reduction restructuring activities discussed in the EMS segment above, within the Company's Furniture segment the restructuring activities included realigning information technology and procurement resources closer to the customer and streamlining administrative andresults follow: At or For the Year Ended June 30 (Amounts in Millions) 2011 2010 % Change Net Sales $ 481.2 $ 413.6 16 % Operating Income (Loss) $ 1.1 $ (9.4 ) 111 % Net Income (Loss) $ 0.5 $ (5.8 ) 108 % Open Orders $ 90.4 $ 70.6 28 % The fiscal year 2011 net sales processes to drive further synergies afforded by the alignment of the sales and manufacturing functions within this segment. Related expenditures were primarily for employee severance and transition costs. This plan is complete.As part of the Company's plan to sharpen focus and simplify business processes withinincrease in the Furniture segment the Company announced during the first quarter ofcompared to fiscal year 2006, a plan which included consolidation of administrative, marketing, and business development functions to better serve the segment's primary markets. Expenses related to this plan included software impairment, accelerated amortization, employee severance, and other consolidation costs. This plan is complete.Furniture segment net sales and open orders were as follows:
June 30Increased net sales volumes of both office and hospitality furniture contributed to the increased branded furniture net sales level. Price increases net of higher discounting contributed approximately $4 million to the2010 resulted primarily from increased net sales of brandedoffice furniture during fiscal year 2008 when comparedand to fiscal year 2007.a lesser extent from increased net sales of hospitality furniture. The increase in office furniture sales was the result of higher sales volumes which were partially offset by higher discounting net of price increases. Fiscal year 20082011 sales of newly introduced office furniture products which the Company began selling during fiscal year 2008have been sold for less than twelve months approximated $57$17.1 million. BrandedOpen orders of furniture products open orders at June 30, 2008 were 6% higher than2011 increased 28% from the orders open as of June 30, 2010 as open orders at June 30, 2007 as higherfor both office furniture and hospitality furniture open orders more than offset lower office furniture open orders. The absence of net sales and open orders of contract private label products was a result of the planned exit of this product line. TheFiscal year 2011 Furniture segment income from continuing operations was $13.4 million in fiscal year 2008, inclusive of after-tax restructuring charges of $1.3 million, compared to income from continuing operations of $17.8 million in fiscal year 2007, which included $0.8 million of after-tax restructuring charges. The fiscal year 2008 restructuring charges were primarily related to the workforce reduction plan, and the fiscal year 2007 restructuring charges were primarily related to the consolidation and standardization of administrative, marketing, and business development functions within this segment. Fiscal year 2008 gross profit as a percent of net sales declined 2.10.7 percentage points when compared to fiscal year 2007. Gross profit was negatively impacted by supply chain cost increases,2010. Items contributing to the decline included increased fuel expense, a sales mix shift to lower margin product, anddiscounting resulting from competitive pricing pressures. Pricepressures and inflationary commodity cost increases. The gross profit decline was partially offset by price increases on select office furniture products partially offsetproduct and the increased operating leverage of the higher costs. As compared to fiscalsales volumes.Fiscal year 2007, fiscal year 20082011 selling and administrative expenses decreasedincreased in both absolute dollars andby 4.1%, but decreased as a percent of net sales ason the Furniture segment incurred lower advertising and product promotion expenses and lower incentive compensation costs. Increased investments in the segment'shigher sales force partially offset the othervolumes, when compared to fiscal year 2010. The selling and administrative savings. The leverage ofexpenses were impacted by higher commissions resulting from the segment's higher net sales, volumes also contributedhigher profit-based incentive compensation costs, and higher costs associated with sales and marketing initiatives to the selling and administrative expense asdrive growth, which were partially offset by lower severance expense.As a percent of net sales, improvement. The Furniture segment earnings were also positively impacted by savings realized through various cost reduction initiatives.See Note 18 - Restructuring Expense of Notes to Consolidated Financial Statementsoperating income (loss) was 0.2% for more information on restructuring charges.Liquidity and Capital ResourcesWorking capital at June 30, 20092012 was $176.2$191.0 million compared to working capital of $162.6$178.0 million at June 30, 2008.2011. The current ratio was 1.82.0 at June 30, 20092012 and 1.51.8 at June 30, 2008.The Company's internal measure of Accounts Receivableaccounts receivable performance, also referred to as Days Sales Outstanding (DSO), for fiscal year 20092012 of 47.245.7 days approximatedimproved compared to the 46.648.5 days for fiscal year 2008.2011. The Company defines DSO as the average of monthly accounts and notes receivable divided by an average day's net sales. The Company's Production Days Supply on Hand (PDSOH) of inventory measure for fiscal year 2009 increased2012 declined to 65.658.9 days from 59.964.4 days for fiscal year 2008.2011. The increasedimproved PDSOH was primarily driven bycompared to the rapid declineprior fiscal year corresponds with successful inventory reduction initiatives in EMS segment sales volumes.both segments during the current fiscal year. The Company defines PDSOH as the average of the monthly gross inventory divided by an average day's cost of sales.The Company's short-term liquidity available, represented as cash and cash equivalents and short-term investments plus the unused amount of the Company's revolving credit facility, totaled $183.7$170.9 million at June 30, 20092012 compared to $126.6$146.2 million at June 30, 2008. The credit facility provides an option to increase the amount available by an additional $50 million at the Company's request, subject to participating banks' consent.The Company's net cash position from an aggregate of cash,and cash equivalents and short-term investments lessposition improved to $75.2 million at June 30, 2012 from $51.4 million at June 30, 2011. The Company had no short-term borrowings under credit facilities increased from $29.8 million at outstanding as of June 30, 2008 to $88.6 million at 2012 or June 30, 2009, as cash flow generated from reductions in certain components of working capital and from the sale of assets more than offset cash payments during fiscal year 2009 for capital expenditures, the acquisition within the EMS segment, and dividends.2011. Operating activities generated $84.2$59.0 million of cash flow in fiscal year 20092012 compared to $43.4the $21.3 million of cash generated by operating activities in fiscal year 2008. Proceeds from2011. A shift in the salepayment practices of assets of $49.9 million were receivedthree large EMS segment customers during fiscal year 2009, primarily related to2012 favorably impacted cash flow by approximately $12.6 million and reduced DSO by one day. During fiscal year 2012, the sale of the Company's undeveloped land holdings and timberlands. The Company reinvested $48.3$28.3 million into capital investments for the future, primarilylargely for manufacturing equipment the new Poland facility under construction which is part of the plan to consolidate the European manufacturing footprint, and other facility improvements during fiscal year 2009.within both segments. The Company also expended $5.4paid $7.4 million for the acquisition within the EMS segment during of dividends in fiscal year 2009. Fiscal year 2009 financing cash flow activities included $19.4 million in dividend payments, which was a decrease from the $23.7 million of dividends paid during fiscal year 2008. The dividend declared during the third quarter of fiscal year 2009 payable in April 2009 was reduced approximately 70% from the quarterly dividend rates paid in previous quarters which reduced dividend payments by approximately $4 million during the Company's fiscal year 2009 fourth quarter. The dividend declared to be paid in the first quarter of fiscal year 2010 was comparable to the dividend paid in the Company's fourth quarter of fiscal year 2009.2012. Consistent with the Company's historical dividend policy, the Company's Board of Directors will evaluate the appropriate dividend payment on a quarterly basis. During fiscal26year 2010,2013, the Company expects to minimize capital expenditures where appropriate but willcontinue to invest in capital expenditures prudently, particularly for projects including potential acquisitions that would enhance the Company's capabilities and diversification while providing an opportunity for growth and improved profitability when the economy recovers. The land and new facility in Poland are expected to cost approximately $35 million of which approximately $27 million was paid prior to profitability.At June 30, 2009. The Company plans to sell its current Poland facility in the future.At 20122009,2011, the Company had $12.7 million ofno short-term borrowings outstanding under its $100$100 million credit facility described in more detail below. The Company also has several smaller foreign credit facilities available butdescribed in more detail below and likewise had no borrowings outstanding under these facilities as of June 30, 2009. At 2012 or June 30, 2008,2011.At June 30, 2012, the Company had $52.6$4.3 million contingently committed in letters of short-term borrowings outstanding.The Company maintains a $100the $100 million credit facility with an expiration date in April 2013 that allows for both issuances of letters of credit and cash borrowings. The $100$100 million credit facility provides an option to increase the amount available for borrowing to $150$150 million at the Company's request, subject to the groupconsent of the participating banks' consent.banks. The $100$100 million credit facility, upon which there were no borrowings at June 30, 2012, requires the Company to comply with certain debt covenants, includingthe most significant of which are the interest coverage ratio and minimum net worth, and other terms and conditions.worth. The Company was in compliance with thesethe debt covenants at during the fiscal year ended June 30, 2009.2012.The Company believes the most significant covenants under its $100 million credit facility are minimum net worth and interest coverage ratio. The table below compares the actual net worth and interest coverage ratio with the limits specified in the credit agreement.Covenant At or For the Period Ended June 30, 2012 Limit As Specified in Credit Agreement Excess Minimum Net Worth $386,228,000 $362,000,000 $24,228,000 Interest Coverage Ratio 604.4 3.0 601.4 The Interest Coverage Ratio is calculated on a rolling four-quarter basis as defined in the credit agreement.The outstanding balance underIn addition to the $100$100 million credit facility, consisted of $12.7 million forthe Company can opt to utilize foreign credit facilities which are available to satisfy short-term cash needs at a Euro currency borrowing, which provides a natural currency hedge against a Euro denominatedspecific foreign location rather than funding from intercompany note between the U.S. parent and Euro functional currency subsidiaries. There were also approximately $5.0 million in letters of credit against the credit facility. Total availability to borrow under the $100 million credit facility was $82.3 million at June 30, 2009.also maintains a separate foreign credit facility for its EMS segment operation in Thailand which is backed by the $100 In addition to the $100 million credit facility, the Company has several other foreign credit facilities which are available to cover bank overdrafts to satisfy short-term cash needs at that specific location rather than funding from intercompany sources. The Company has a credit facility for its EMS segment operation in Wales, United Kingdom, which is comprised of an overdraft facility which allows for multi-currency borrowings up to 2 million Sterling equivalent (approximately $3.3 million U.S. dollars at June 30, 2009 exchange rates) and an engagement facility of 3.5 million Sterling equivalent (approximately $5.8 million U.S. dollars at June 30, 2009 exchange rates), which can be used only for payment of customs, duties, or value-added taxes in the event of the Company's failure to pay its obligations. The Company also has a credit facility for its EMS segment operation in Poznan, Poland, which allows for multi-currency borrowings up to 66.0 million Euro equivalent (approximately $8.5$7.6 million U.S. dollars at June 30, 20092012 exchange rates). These overdraftforeign credit facilities can be cancelledcanceled at any time by either the bank or the Company. At June 30, 2009, the Company had no borrowings outstanding under these foreign facilities.The Company believes its principal sources of liquidity from available funds on hand, cash generated from operations, and the availability of borrowing under the Company's credit facilities will be sufficient infor fiscal year 20102013 and the foreseeable future. One of the Company's primary sources of funds is its ability to generate cash from operations to meet its liquidity obligations which could be adversely affected in the future by factors such as general economic and market conditions, lack of availability of raw material components in the supply chain, a decline in demand for the Company's products, loss of key contract customers, the ability of the Company to generate profits, and other unforeseen circumstances. In particular, should demand for the Company's products decrease significantly over the next 12 months, due to the weakened economy, the available cash provided by operations could be adversely impacted. Another source of funds is the Company's credit facilities. The $100 millionCompany expects to renew or negotiate a new credit facility is contingentto replace the current $100 million credit facility prior to its April 2013 expiration. However, a new or negotiated renewal of the credit facility may be less favorable in terms of borrowing costs than the current facility due to the impact that the current economic conditions have had on complying with certain debt covenants.The preceding statements areinclude forward-looking statements under the Private Securities Litigation Reform Act of 1995. Certain factors could cause actual results to differ materially from forward-looking statements.Fair ValueThe Company adopted the provisions of SFAS No. 157, Fair Value Measurements, which defines fair value, for financial assets and liabilities measured at fair value on a recurring basis at July 1, 2008. The adoption had an immaterial impact on the Company's financial statements. During fiscal year 2009,2012, no level 1 or level 2 financial assetsinstruments were affected by a lack of market liquidity. For level 1 financial assets, readily available market pricing was used to value the financial instruments. For available-for-sale securities classified as level 2 assets, the fair values are determined based on observable market inputs which use evaluated pricing models that vary by asset class and incorporate available trade, bid, and other market information. The Company evaluated the inputs used to value the instruments and validated the accuracy of the instrument fair values based on historical evidence. The Company's foreign currency derivatives, which were classified as level 2 assets/liabilities, were independently valued using a financial risk management software package using observable market inputs such as forward interest rate yield curves, current spot rates, and time value calculations. To verify the reasonableness of the independently determined fair values, thethese derivative fair values were compared to fair values calculated by the counterparty banks. The Company's own credit risk and counterparty credit risk had an immaterial impact on the valuation of the foreign currency derivatives.27During fiscal year 2010, the Company purchased convertible debt securities of $2.3 million and stock warrants of $0.4 million of a privately-held company. During fiscal year 2011, the convertible debt securities experienced an other-than-temporary decline in fair market value resulting in a $1.2 million impairment loss and, upon a qualified financing, were subsequently converted to non-marketable equity securities. Also during fiscal year 2011, the revaluation of stock warrants resulted in a $1.0 million derivative gain as a result of the qualified financing. During fiscal year 2012, the privately-held company experienced delays in their start-up, and therefore initiated another round of financing that the Company chose not to participate in, which resulted in the automatic conversion of preferred shares and warrants to common shares and warrants. Upon the conversion, the equity securities and warrants were revalued, resulting in an impairment loss of $0.7 million on the equity securities and a $0.5 million derivative loss on the stock warrants during fiscal year 2012.The investment in non-marketable equity securities is accounted for as a cost-method investment which carries the securities at cost. In the event of impairment, the valuation uses a probability-weighted Black-Scholes option pricing model. The stock warrants are classified as derivative instruments and are valued on a recurring basis using a market-based approach which utilizes a probability-weighted Black-Scholes option pricing model. The fair value measurements for stock warrants and the impairment of non-marketable equity securities were calculated using unobservable inputs and were classified as level 3 financial assets.See Note 1110 - Fair Value of Financial Assets and Liabilities of Notes to Consolidated Financial Statements for more information.Contractual ObligationsThe following table summarizes the Company's contractual obligations as of June 30, 2009.(Amounts in Millions) Recorded Contractual Obligations (a): Long-Term Debt Obligations (b) Other Long-Term Liabilities Reflected on the Balance Sheet (c) (d) (e) Unrecorded Contractual Obligations: Operating Leases (e) Purchase Obligations (f) Other Total (a) As of June 30, 2009, the Company had no Capital Lease Obligations.(b) Refer to Note 6 - Long-Term Debt and Credit Facility of Notes to Consolidated Financial Statements for more information regarding Long-Term Debt Obligations. Accrued interest is also included on the Long-Term Debt Obligations line. The $12.7 million long-term debt obligations due in fiscal year 2010 include $12.7 million of short-term borrowing under the Company's $100 million credit facility and less than $0.1 million of long-term debt obligations due in fiscal year 2010 which are recorded as current liabilities. The estimated interest not yet accrued related to debt is included in the Other line item within the Unrecorded Contractual Obligations.(c) 2012 Payments Due During Fiscal Years Ending June 30 (Amounts in Millions) Total 2013 2014-2015 2016-2017 Thereafter Recorded Contractual Obligations: (a) Long-Term Debt Obligations (b)$ 0.3 $ — $ — $ 0.1 $ 0.2 Other Long-Term Liabilities Reflected on the BalanceSheet (c) (d) (e)25.2 8.1 3.1 3.0 11.0 Unrecorded Contractual Obligations: Operating Leases (e)9.5 3.5 4.2 1.3 0.5 Purchase Obligations (f)198.3 181.5 11.1 5.7 — Other 0.2 — 0.1 — 0.1 Total $ 233.5 $ 193.1 $ 18.5 $ 10.1 $ 11.8 (a) As of June 30, 2012, the Company had no Capital Lease Obligations.(b) Refer to Note 5 - Long-Term Debt and Credit Facility of Notes to Consolidated Financial Statements for more information regarding Long-Term Debt Obligations. Accrued interest is also included on the Long-Term Debt Obligations line. The fiscal year 2013 amount includes less than $0.1 million of long-term debt obligations due in fiscal year 2013 which was recorded as a current liability. The estimated interest not yet accrued related to debt is included in the Other line item within the Unrecorded Contractual Obligations.(c) The timing of payments of certain items included on the "Other Long-Term Liabilities Reflected on the Balance Sheet" line above is estimated based on the following assumptions: The timing of SERP payments is estimated based on an assumed retirement age of 62 with payout based on the prior distribution elections of participants. The fiscal year 2013 amount includes $5.9 million for SERP payments recorded as current liabilities.The timing of severance plan payments is estimated based on the following assumptions:average remaining service life of employees. The fiscal year 2013 amount includes $0.8 million for severance payments recorded as a current liability.The timing of warranty payments is estimated based on historical data. The fiscal year 2013 amount includes $1.4 million for short-term warranty payments recorded as a current liability.(d) Excludes $4.2 million of long-term unrecognized tax benefits and associated accrued interest and penalties along with deferred tax liabilities and miscellaneous other long-term tax liabilities which are not tied to a contractual obligation and for which the Company cannot make a reasonably reliable estimate of the period of future payments.28(e) Refer to Note 4 - Commitments and Contingent Liabilities of Notes to Consolidated Financial Statements for more information regarding Operating Leases and certain Other Long-Term Liabilities.(f) Purchase Obligations are defined as agreements to purchase goods or services that are enforceable and legally binding and that specify all significant terms. The timing of SERP payments is estimated based on an assumed retirement age of 62 with payout based onamounts listed above for purchase obligations include contractual commitments for items such as raw materials, supplies, capital expenditures, services, and software acquisitions/license commitments. Cancellable purchase obligations that the prior distribution elections of participants. TheCompany intends to fulfill are also included in the purchase obligations amount listed above through fiscal year 2010 amount includes $3.5 million2017. In certain instances, such as when lead times dictate, the Company enters into contractual agreements for SERP payments recorded as current liabilities.The timingmaterial in excess of employee transition payments relatedthe levels required to facilitiesfulfill customer orders. In turn, agreements with the customers cover a portion of that exposure for the material which was purchased prior to be exited is estimated based on the expected termination in the underlying restructuring plan. The fiscal year 2010 amount also includes $4.4 million for restructuring employee transition payments and the related derivatives recorded ashaving a current liability.The timing of severance plan payments is estimated based on the average service life of employees. The fiscal year 2010 amount also includes $0.6 million for severance payments recorded as a current liability.The timing of warranty payments is estimated based on historical data. The fiscal year 2010 amount includes $1.6 million for short-term warranty payments recorded as a current liability.(d) Excludes $4.2 million of long-term unrecognized tax benefits associated with the adoption of Financial Accounting Standards Board Interpretation No. 48, Accounting for Uncertainty in Income Taxes (FIN 48), and associated accrued interest and penalties along with deferred tax liabilities and miscellaneous other long-term tax liabilities which are not tied to a contractual obligation and for which the Company cannot make a reasonably reliable estimate of the period of future payments.(e) Refer to Note 5 - Commitments and Contingent Liabilities of Notes to Consolidated Financial Statements for more information regarding Operating Leases and certain Other Long-Term Liabilities.(f) Purchase Obligations are defined as agreements to purchase goods or services that are enforceable and legally binding and that specify all significant terms. The amounts listed above for purchase obligations include contractual commitments for items such as raw materials, supplies, capital expenditures, services, and software acquisitions/license commitments. Cancellable purchase obligations that the Company intends to fulfill are also included in the purchase obligations amount listed above through fiscal year 2014. In certain instances, such as when lead times dictate, the Company enters into contractual agreements for material in excess of the levels required to fulfill customer orders. In turn, agreements with the customers cover a portion of that exposure for the material which was purchased prior to having a firm order.Off-Balance Sheet ArrangementsThe Company has no off-balance sheet arrangements other than standby letters of credit and operating leases entered into in the normal course of business. These arrangements do not have a material current effect and are not reasonably likely to have a material future effect on the Company's financial condition, results of operations, liquidity, capital expenditures, or capital resources. See Note 54 - Commitments and Contingent Liabilities of Notes to Consolidated Financial Statements for more information on standby letters of credit. The Company does not have material exposures to trading activities of non-exchange traded contracts.The preceding statements are forward-looking statements under the Private Securities Litigation Reform Act of 1995. Certain factors could cause actual results to differ materially from forward-looking statements.Critical Accounting PoliciesThe Company's consolidated financial statements have been prepared in accordance with accounting principles generally accepted in the United States of America. These principles require the use of estimates and assumptions that affect amounts reported and disclosed in the consolidated financial statements and related notes. Actual results could differ from these estimates and assumptions. Management uses its best judgment in the assumptions used to value these estimates, which are based on current facts and circumstances, prior experience, and other assumptions that are believed to be reasonable. The Company's management overlays a fundamental philosophy of valuing its assets and liabilities in an appropriately conservative manner. A summary of the Company's significant accounting policies is disclosed in Note 1 - Summary of Significant Accounting Policies of Notes to Consolidated Financial Statements. Management believes the following critical accounting policies reflect the more significant judgments and estimates used in preparation of the Company's consolidated financial statements and are the policies that are most critical in the portrayal of the Company's financial position and results of operations. Management has discussed these critical accounting policies and estimates with the Audit Committee of the Company's Board of Directors and with the Company's independent registered public accounting firm.Revenue recognition - The Company recognizes revenue when title and risk transfer to the customer, which under the terms and conditions of the sale may occur either at the time of shipment or when the product is delivered to the customer. Service revenue is recognized as services are rendered. Shipping and handling fees billed to customers are recorded as sales while the related shipping and handling costs are included in cost of goods sold. The Company recognizes sales net of applicable sales tax.Allowance for salesSales returns and allowances - At the time revenue is recognized certain provisions may also be recorded, including a provision for returns and allowances, which involve estimates based on current discussions with applicable customers, historical experience with a particular customer and/or product, and other relevant factors. As such, these factors may change over time causing the provisions to be adjusted accordingly. At June 30, 20092012 and June 30, 2008,2011, the reserve for returns and allowances was $4.4$2.5 million and $3.3$2.1 million, respectively. The returns and allowances reserve approximated 1% to 2% of gross trade receivables during fiscal years 20082012 and 2009 up until the last two quarters of fiscal year 2009 at which time it trended up to 3% primarily due to issues isolated to two furniture projects with unique specifications.Allowance for doubtful accounts - Allowance for doubtful accounts is generally based on a percentage of aged accounts receivable, where the percentage increases as the accounts receivable become older. However, management judgment is utilized in the final determination of the allowance based on several factors including specific analysis of a customer's credit worthiness, changes in a customer's payment history, historical bad debt experience, and general economic and market trends. The allowance for doubtful accounts at June 30, 20092012 and June 30, 20082011 was $3.1$0.8 million and $0.8$1.4 million, respectively. During the preceding two years, thisThis reserve had been at or less thanapproximated 1% of gross trade accounts receivable up until the last two quarters ofduring fiscal year 2009 at which point it approximated 2% of gross trade accounts receivable. The higher reserve was driven by increased risk created by the current market conditions.years 2012 and 2011.14%10% and 17%11% of consolidated inventories at June 30, 20092012 and June 30, 2008,2011, respectively, including
Goodwill - Goodwill represents the difference between the purchase price and the related underlying tangible and intangible net asset values resulting from business acquisitions. Annually, or if conditions indicate an earlier review is necessary, the Company compares the carrying value of the reporting unit to an estimate of the reporting unit's fair value to identify potential impairment. If the estimated fair value of the reporting unit is less than the carrying value, a second step is performed to determine the amount of potential goodwill impairment. If impaired, goodwill is written down to its estimated implied fair value. Goodwill is assigned to and the fair value is tested at the reporting unit level. The Company uses discounted cash flows to establish its reporting unit fair values. The calculation of the fair value of the reporting units considers current market conditions existing at the assessment date. During fiscal year 2009, goodwill was reviewed on an interim basis due to the continued uncertainty associated with the economy and the significant decline in the Company's sales and order trends as well as the increased disparity between the Company's market capitalization and the carrying value of its Share Owners' equity. Interim testing resulted in the recognition of non-cash pre-tax goodwill impairment of, in millions, $12.8 within the EMS segment and $1.8 within the Furniture segment. In addition to performing the required annual testing, the Company will continue to monitor circumstances and events in future periods to determine whether additional goodwill impairment testing is warranted on an interim basis. The Company can provide no assurance that an additional impairment charge for the Company's remaining goodwill balance will not occur in future periods as a result of these analyses. At June 30, 2009 and June 30, 2008, the Company's goodwill totaled, in millions, $2.6 and $15.4, respectively.
The Company is exposed to interest rate risk on certain outstanding debt balances. The outstanding loan balances under the Company's credit facilities bear interest at variable rates based on prevailing short-term interest rates. Based on the $13 million and $53 million outstanding balances of variable rate obligations at June 30, 2009 and 2008, respectively, the Company estimates that a hypothetical 100 basis point change in interest rates would not have a material effect on annual interest expense. Further information on debt balances is provided in Note 6 - Long-Term Debt and Credit Facility of Notes to Consolidated Financial Statements.
Foreign Exchange Rate Risk: The Company operates internationally and thus is subject to potentially adverse movements in foreign currency rate changes. The Company's risk management strategy includes the use of derivative financial instruments to hedge certain foreign currency exposures. Derivatives are used only to manage underlying exposures of the Company and are not used in a speculative manner. Further information on derivative financial instruments is provided in Note 1211 - Derivative Instruments of Notes to Consolidated Financial Statements. The Company estimates that a hypothetical 10% adverse change in foreign currency exchange rates from levels at June 30, 2012 and 2011 relative to non-functional currency balances of monetary instruments, to the extent not hedged by derivative instruments, would not have a material impact on profitability in an annual period.
| INDEX TO CONSOLIDATED FINANCIAL STATEMENTS | |
| Page No. | |
201232MANAGEMENT'S REPORT ON INTERNAL CONTROL OVER FINANCIAL REPORTINGThe management of Kimball International, Inc. is responsible for establishing and maintaining adequate internal control over financial reporting and for the preparation and integrity of the accompanying financial statements and other related information in this report. The consolidated financial statements of the Company and its subsidiaries, including the footnotes, were prepared in accordance with accounting principles generally accepted in the United States of America and include judgments and estimates, which in the opinion of management are applied on an appropriately conservative basis. The Company maintains a system of internal and disclosure controls intended to provide reasonable assurance that assets are safeguarded from loss or material misuse, transactions are authorized and recorded properly, and that the accounting records may be relied upon for the preparation of the financial statements. This system is tested and evaluated regularly for adherence and effectiveness by employees who work within the internal control processes, by the Company's staff of internal auditors, as well as by the independent registered public accounting firm in connection with their annual audit.The Audit Committee of the Board of Directors, which is comprised of directors who are not employees of the Company, meets regularly with management, the internal auditors, and the independent registered public accounting firm to review the Company's financial policies and procedures, its internal control structure, the objectivity of its financial reporting, and the independence of the Company's independent registered public accounting firm. The internal auditors and the independent registered public accounting firm have free and direct access to the Audit Committee, and they meet periodically, without management present, to discuss appropriate matters.Because of inherent limitations, a system of internal control over financial reporting may not prevent or detect misstatements and even when determined to be effective, can only provide reasonable assurance with respect to financial statement preparation and presentation.These consolidated financial statements are subject to an evaluation of internal control over financial reporting conducted under the supervision and with the participation of management, including the Chief Executive Officer and Chief Financial Officer. Based on that evaluation, conducted under the criteria established in Internal Control --— Integrated Framework issued by the Committee of Sponsoring Organizations of the Treadway Commission, management concluded that its internal control over financial reporting was effective as of June 30, 2009.Deloitte & Touche LLP, the Company's independent registered public accounting firm, has issued an audit report on the Company's internal control over financial reporting which is included herein./s/ JAMES C. THYEN James C. Thyen President, Chief Executive Officer August 27, 2012 /s/ ROBERT F. SCHNEIDER /s/ James C. ThyenJAMES C. THYENPresident,Chief Executive OfficerAugust 31, 2009/s/ Robert F. Schneider ROBERT F. SCHNEIDER
Executive Vice President,Chief Financial Officer August 31, 200927, 2012
33REPORT OF INDEPENDENT REGISTERED PUBLIC ACCOUNTING FIRMTo the Board of Directors and Share Owners of Kimball International, Inc.:We have audited the accompanying consolidated balance sheets of Kimball International, Inc. and subsidiaries (the "Company") as of June 30, 20092012 and 2008,2011, and the related consolidated statements of income, share owners' equity, and cash flows for each of the three years in the period ended June 30, 2009.2012. Our audits also included the financial statement schedule listed in the Index at Item 15. We also have audited the Company's internal control over financial reporting as of June 30, 2009,2012, based on criteria established in Internal Control -— Integrated Frameworkissued by the Committee of Sponsoring Organizations of the Treadway Commission. The Company's management is responsible for these financial statements and financial statement schedule, for maintaining effective internal control over financial reporting, and for its assessment of the effectiveness of internal control over financial reporting, included in the accompanying Management's Report on Internal Control over Financial Reporting. Our responsibility is to express an opinion on these financial statements and financial statement schedule and an opinion on the Company's internal control over financial reporting based on our audits.We conducted our audits in accordance with the standards of the Public Company Accounting Oversight Board (United States). Those standards require that we plan and perform the audit to obtain reasonable assurance about whether the financial statements are free of material misstatement and whether effective internal control over financial reporting was maintained in all material respects. Our audits of the financial statements included examining, on a test basis, evidence supporting the amounts and disclosures in the financial statements, assessing the accounting principles used and significant estimates made by management, and evaluating the overall financial statement presentation. Our audit of internal control over financial reporting included obtaining an understanding of internal control over financial reporting, assessing the risk that a material weakness exists, and testing and evaluating the design and operating effectiveness of internal control based on the assessed risk. Our audits also included performing such other procedures as we considered necessary in the circumstances. We believe that our audits provide a reasonable basis for our opinions.A company's internal control over financial reporting is a process designed by, or under the supervision of, the company's principal executive and principal financial officers, or persons performing similar functions, and effected by the company's board of directors, management, and other personnel to provide reasonable assurance regarding the reliability of financial reporting and the preparation of financial statements for external purposes in accordance with generally accepted accounting principles. A company's internal control over financial reporting includes those policies and procedures that (1) pertain to the maintenance of records that, in reasonable detail, accurately and fairly reflect the transactions and dispositions of the assets of the company; (2) provide reasonable assurance that transactions are recorded as necessary to permit preparation of financial statements in accordance with generally accepted accounting principles and that receipts and expenditures of the company are being made only in accordance with authorizations of management and directors of the company; and (3) provide reasonable assurance regarding prevention or timely detection of unauthorized acquisition, use, or disposition of the company's assets that could have a material effect on the financial statements.Because of the inherent limitations of internal control over financial reporting, including the possibility of collusion or improper management override of controls, material misstatements due to error or fraud may not be prevented or detected on a timely basis. Also, projections of any evaluation of the effectiveness of the internal control over financial reporting to future periods are subject to the risk that the controls may become inadequate because of changes in conditions, or that the degree of compliance with the policies or procedures may deteriorate.In our opinion, the consolidated financial statements referred to above present fairly, in all material respects, the financial position of Kimball International, Inc. and subsidiaries as of June 30, 20092012 and 2008,2011, and the results of their operations and their cash flows for each of the three years in the period ended June 30, 2009,2012, in conformity with accounting principles generally accepted in the United States of America. Also, in our opinion, such financial statement schedule, when considered in relation to the basic consolidated financial statements taken as a whole, presentpresents fairly, in all material respects, the information set forth therein. Also, in our opinion, the Company maintained, in all material respects, effective internal control over financial reporting as of June 30, 2009,2012, based on the criteria established in Internal Control -— Integrated Frameworkissued by the Committee of Sponsoring Organizations of the Treadway Commission./s/ Deloitte & Touche LLP DELOITTE & TOUCHE LLP Indianapolis, Indiana August 31, 200927, 201234CONSOLIDATED BALANCE SHEETS(Amounts in Thousands, Except for Share and Per Share Data) June 30, June 30, 2009 2008 ASSETS Current Assets: Cash and cash equivalents $ 75,932 $ 30,805 Short-term investments 25,376 51,635 Receivables, net of allowances of $4,366 and $1,057, respectively 143,398 180,307 Inventories 127,004 164,961 Prepaid expenses and other current assets 35,720 37,227 Assets held for sale 1,358 1,374 Total current assets 408,788 466,309 Property and Equipment, net of accumulated depreciation of $338,001 and $340,076, respectively 200,474 189,904 Goodwill 2,608 15,355 Other Intangible Assets, net of accumulated amortization of $62,481 and $66,087, respectively 10,181 13,373 Other Assets 20,218 37,726 Total Assets $ 642,269 $ 722,667 LIABILITIES AND SHARE OWNERS' EQUITY Current Liabilities: Current maturities of long-term debt $ 60 $ 470 Accounts payable 165,051 174,575 Borrowings under credit facilities 12,677 52,620 Dividends payable 2,393 6,989 Accrued expenses 52,426 69,053 Total current liabilities 232,607 303,707 Other Liabilities: Long-term debt, less current maturities 360 421 Other 26,948 26,072 Total other liabilities 27,308 26,493 Share Owners' Equity: Common stock-par value $0.05 per share: Class A - Shares authorized: 49,826,000 in 2009 and 2008 Shares issued: 14,368,000 in 2009 and 2008 718 718 Class B - Shares authorized: 100,000,000 in 2009 and 2008 Shares issued: 28,657,000 in 2009 and 2008 1,433 1,433 Additional paid-in capital 343 14,531 Retained earnings 458,180 456,413 Accumulated other comprehensive income (loss) (501) 12,308 Less: Treasury stock, at cost: Class A - 3,646,000 in 2009 and 2,691,000 in 2008 (50,421) (46,517) Class B - 2,093,000 in 2009 and 3,372,000 in 2008 (27,398) (46,419) Total Share Owners' Equity 382,354 392,467 Total Liabilities and Share Owners' Equity $ 642,269 $ 722,667 See Notes to Consolidated Financial Statements June 30
2012 June 30
2011ASSETS Current Assets: Cash and cash equivalents $ 75,197 $ 51,409 Receivables, net of allowances of $1,367 and $1,799, respectively 139,467 149,753 Inventories 117,681 141,097 Prepaid expenses and other current assets 44,636 50,215 Assets held for sale 1,709 2,807 Total current assets 378,690 395,281 Property and Equipment, net of accumulated depreciation of $357,808 and $360,105, respectively 186,099 196,682 Goodwill 2,480 2,644 Other Intangible Assets, net of accumulated amortization of $65,824 and $65,514, respectively 6,206 7,625 Other Assets 22,041 24,080 Total Assets $ 595,516 $ 626,312 LIABILITIES AND SHARE OWNERS' EQUITY Current Liabilities: Current maturities of long-term debt $ 14 $ 12 Accounts payable 137,423 149,107 Dividends payable 1,843 1,835 Accrued expenses 48,460 66,316 Total current liabilities 187,740 217,270 Other Liabilities: Long-term debt, less current maturities 273 286 Other 21,275 21,357 Total other liabilities 21,548 21,643 Share Owners' Equity: Common stock-par value $0.05 per share: Class A - Shares authorized: 50,000,000 Shares issued: 14,359,000 (14,368,000 in 2011)718 718 Class B - Shares authorized: 100,000,000 Shares issued: 28,666,000 (28,657,000 in 2011)1,433 1,433 Additional paid-in capital 635 230 Retained earnings 452,093 450,172 Accumulated other comprehensive income (loss) (4,963 ) 1,618 Less: Treasury stock, at cost: Class A - 4,020,000 shares (3,945,000 in 2011) (49,235 ) (49,437 ) Class B - 1,104,000 shares (1,330,000 in 2011) (14,453 ) (17,335 ) Total Share Owners' Equity 386,228 387,399 Total Liabilities and Share Owners' Equity $ 595,516 $ 626,312 35CONSOLIDATED STATEMENTS OF INCOME(Amounts in Thousands, Except for Per Share Data)Year Ended June 30 2009 2008 2007 Net Sales $ 1,207,420 $ 1,351,985 $ 1,286,930 Cost of Sales 1,004,901 1,103,511 1,025,570 Gross Profit 202,519 248,474 261,360 Selling and Administrative Expenses 192,711 232,131 233,409 Other General Income (33,417) -0- -0- Restructuring Expense 2,981 21,911 1,528 Goodwill Impairment 14,559 -0- -0- Operating Income (Loss) 25,685 (5,568) 26,423 Other Income (Expense): Interest income 2,499 3,362 5,237 Interest expense (1,565) (1,967) (1,073) Non-operating income 2,663 3,512 6,795 Non-operating expense (3,956) (1,703) (1,030) Other income (expense), net (359) 3,204 9,929 Income (Loss) from Continuing Operations Before Taxes on Income 25,326 (2,364) 36,352 Provision (Benefit) for Income Taxes 7,998 (2,442) 13,086 Income from Continuing Operations 17,328 78 23,266 Loss from Discontinued Operations, Net of Tax -0- (124) (4,114) Net Income (Loss) $ 17,328 $ (46) $ 19,152 Earnings (Loss) Per Share of Common Stock: Basic Earnings Per Share from Continuing Operations: Class A $ 0.47 $ 0.00 $ 0.60 Class B $ 0.47 $ 0.00 $ 0.61 Diluted Earnings Per Share from Continuing Operations: Class A $ 0.46 $ 0.00 $ 0.58 Class B $ 0.47 $ 0.00 $ 0.60 Basic Earnings (Loss) Per Share: Class A $ 0.47 $ (0.00) $ 0.49 Class B $ 0.47 $ (0.00) $ 0.50 Diluted Earnings (Loss) Per Share: Class A $ 0.46 $ (0.00) $ 0.47 Class B $ 0.47 $ (0.00) $ 0.49 Average Number of Shares Outstanding: Basic: Class A 11,036 11,696 11,979 Class B 26,125 25,418 26,623 Totals 37,161 37,114 38,602 Diluted: Class A 11,195 11,868 12,325 Class B 26,151 25,504 26,932 Totals 37,346 37,372 39,257 See Notes to Consolidated Financial Statements Year Ended June 30 2012 2011 2010 Net Sales $ 1,142,061 $ 1,202,597 $ 1,122,808 Cost of Sales 932,106 1,008,005 946,275 Gross Profit 209,955 194,592 176,533 Selling and Administrative Expenses 188,148 191,167 181,771 Other General Income — — (9,980 ) Restructuring Expense 3,418 1,009 2,051 Operating Income 18,389 2,416 2,691 Other Income (Expense): Interest income 430 820 1,188 Interest expense (35 ) (121 ) (142 ) Non-operating income 1,096 4,542 2,980 Non-operating expense (2,178 ) (3,220 ) (749 ) Other income (expense), net (687 ) 2,021 3,277 Income Before Taxes on Income 17,702 4,437 5,968 Provision (Benefit) for Income Taxes 6,068 (485 ) (4,835 ) Net Income $ 11,634 $ 4,922 $ 10,803 Earnings Per Share of Common Stock: Basic Earnings Per Share: Class A $ 0.29 $ 0.12 $ 0.27 Class B $ 0.31 $ 0.14 $ 0.29 Diluted Earnings Per Share: Class A $ 0.29 $ 0.12 $ 0.27 Class B $ 0.31 $ 0.14 $ 0.29 Average Number of Shares Outstanding: Basic: Class A 10,387 10,493 10,694 Class B 27,494 27,233 26,765 Totals 37,881 37,726 37,459 Diluted: Class A 10,593 10,639 10,791 Class B 27,494 27,234 26,770 Totals 38,087 37,873 37,561 36CONSOLIDATED STATEMENTS OF CASH FLOWS(Amounts in Thousands) Year Ended June 30 2009 2008 2007 Cash Flows From Operating Activities: Net income (loss) $ 17,328 $ (46) $ 19,152 Adjustments to reconcile net income (loss) to net cash provided by operating activities: Depreciation and amortization 37,618 39,421 38,905 Gain on sales of assets (32,796) (840) (775) Loss on disposal of discontinued operations -0- -0- 1,600 Restructuring and exit costs 278 2,736 953 Deferred income tax and other deferred charges (8,860) 4,193 (3,764) Goodwill impairment 14,559 -0- -0- Stock-based compensation 2,129 3,979 4,922 Excess tax benefits from stock-based compensation (297) (14) (1,095) Change in operating assets and liabilities: Receivables 31,386 3,341 2,021 Inventories 36,667 (22,960) 173 Prepaid expenses and other current assets 7,994 (2,950) (1,663) Accounts payable (5,142) 13,071 (8,252) Accrued expenses (16,705) 3,468 (7,803) Net cash provided by operating activities 84,159 43,399 44,374 Cash Flows From Investing Activities: Capital expenditures (47,679) (49,742) (40,881) Proceeds from sales of assets 49,942 5,209 2,823 Proceeds from disposal of discontinued operations -0- 250 721 Payments for acquisitions (5,391) (4,566) (51,052) Purchase of capitalized software and other assets (632) (905) (999) Purchases of available-for-sale securities (8,032) (33,184) (116,939) Sales and maturities of available-for-sale securities 34,572 53,777 152,470 Other, net (320) 3 (683) Net cash provided by (used for) investing activities 22,460 (29,158) (54,540) Cash Flows From Financing Activities: �� Proceeds from revolving credit facility 60,620 -0- 1,268 Payments on revolving credit facility (63,349) (4,445) (4,440) Additional net change in credit facilities (35,805) 32,267 925 Payments on capital leases and long-term debt (527) (1,022) (565) Repurchases of common stock -0- (24,844) (1,078) Dividends paid to Share Owners (19,410) (23,701) (24,419) Excess tax benefits from stock-based compensation 297 14 1,095 Proceeds from exercise of stock options -0- -0- 6,595 Repurchase of employee shares for tax withholding (1,209) (859) -0- Other, net -0- -0- (51) Net cash used for financing activities (59,383) (22,590) (20,670) Effect of Exchange Rate Change on Cash and Cash Equivalents (2,109) 4,127 1,006 Net Increase (Decrease) in Cash and Cash Equivalents 45,127 (4,222) (29,830) Cash and Cash Equivalents at Beginning of Year 30,805 35,027 64,857 Cash and Cash Equivalents at End of Year $ 75,932 $ 30,805 $ 35,027 See Notes to Consolidated Financial Statements Year Ended June 30 2012 2011 2010 Cash Flows From Operating Activities: Net income $ 11,634 $ 4,922 $ 10,803 Adjustments to reconcile net income to net cash provided by operating activities: Depreciation and amortization 30,973 31,207 34,760 Gain on sales of assets (28 ) (35 ) (6,771 ) Restructuring 439 — 176 Deferred income tax and other deferred charges 3,561 3,658 (2,023 ) Stock-based compensation 1,443 1,284 1,824 Excess tax benefits from stock-based compensation (41 ) — (263 ) Other, net 2,301 963 (392 ) Change in operating assets and liabilities: Receivables 6,655 2,975 (17,629 ) Inventories 20,472 3,243 (26,229 ) Prepaid expenses and other current assets 6,430 (5,004 ) (8,269 ) Accounts payable (7,081 ) (28,524 ) 26,700 Accrued expenses (17,739 ) 6,660 695 Net cash provided by operating activities 59,019 21,349 13,382 Cash Flows From Investing Activities: Capital expenditures (26,943 ) (31,371 ) (34,791 ) Proceeds from sales of assets 2,566 941 12,900 Purchases of capitalized software (1,323 ) (1,839 ) (624 ) Purchases of available-for-sale securities — — (7,193 ) Sales and maturities of available-for-sale securities — — 29,702 Other, net (13 ) (1,458 ) 198 Net cash (used for) provided by investing activities (25,713 ) (33,727 ) 192 Cash Flows From Financing Activities: Proceeds from revolving credit facility — 88,750 — Payments on revolving credit facility — (88,750 ) (12,248 ) Payments on long-term debt (11 ) (62 ) (60 ) Dividends paid to Share Owners (7,363 ) (7,330 ) (7,264 ) Excess tax benefits from stock-based compensation 41 — 263 Repurchase of employee shares for tax withholding (337 ) (278 ) (1,212 ) Net cash used for financing activities (7,670 ) (7,670 ) (20,521 ) Effect of Exchange Rate Change on Cash and Cash Equivalents (1,848 ) 6,115 (3,643 ) Net Increase (Decrease) in Cash and Cash Equivalents 23,788 (13,933 ) (10,590 ) Cash and Cash Equivalents at Beginning of Year 51,409 65,342 75,932 Cash and Cash Equivalents at End of Year $ 75,197 $ 51,409 $ 65,342 37CONSOLIDATED STATEMENTS OF SHARE OWNERS' EQUITY(Amounts in Thousands, Except for Share and Per Share Data) Common Stock Additional Paid-In Capital Retained Earnings Accumulated Other Comprehensive Income (Loss) Treasury Stock Total Share Owners' Equity Class A Class B Amounts at June 30, 2006 $ 718 $1,433 $ 6,019 $486,518 $ 886 $(72,992) $ 422,582 Comprehensive income: Net income 19,152 19,152 Net change in unrealized gains and losses on securities 76 76 Foreign currency translation adjustment 3,182 3,182 Net change in derivative gains and losses 574 574 Postemployment severance prior service cost (1,323) (1,323) Comprehensive income 21,661 Issuance of non-restricted stock ( 8,000 shares) 73 118 191 Net exchanges of shares of Class A and Class B common stock ( 1,138,000 shares) 5,940 (5,940) -0- Vesting of restricted share units (29) (29) Compensation expense related to stock incentive plans 4,745 4,745 Exercise of stock options ( 469,000 shares) 28 7,242 7,270 Performance share issuance ( 101,000 shares) (2,208) 1,667 (541) Share repurchases ( 266,000 shares) (3,624) (3,624) Dividends declared: Class A ( $0.62 per share) (7,609) (7,609) Class B ( $0.64 per share) (17,198) (17,198) Amounts at June 30, 2007 $ 718 $1,433 $ 14,568 $480,863 $ 3,395 $(73,529) $ 427,448 Comprehensive income: Net loss (46) (46) Net change in unrealized gains and losses on securities 433 433 Foreign currency translation adjustment 9,090 9,090 Net change in derivative gains and losses (714) (714) Postemployment severance prior service cost 172 172 Postemployment severance actuarial change (68) (68) Comprehensive income 8,867 Issuance of non-restricted stock ( 13,000 shares) (31) 204 173 Net exchanges of shares of Class A and Class B common stock ( 91,000 shares) (326) 326 -0- Vesting of restricted share units ( 12,000 shares) (220) 188 (32) Compensation expense related to stock incentive plans 3,763 3,763 Performance share issuance ( 139,000 shares) (3,223) 2,173 (1,050) Share repurchases ( 1,733,000 shares) (22,298) (22,298) Cumulative effect of adoption of FIN 48, Accounting for Uncertainty in Income Taxes (712) (712) Dividends declared: Class A ( $0.62 per share) (7,476) (7,476) Class B ( $0.64 per share) (16,216) (16,216) Amounts at June 30, 2008 $ 718 $1,433 $ 14,531 $456,413 $ 12,308 $(92,936) $ 392,467 Comprehensive income: Net income 17,328 17,328 Net change in unrealized gains and losses on securities 211 211 Foreign currency translation adjustment (6,034) (6,034) Net change in derivative gains and losses (5,151) (5,151) Postemployment severance prior service cost 171 171 Postemployment severance actuarial change (2,006) (2,006) Comprehensive income 4,519 Issuance of non-restricted stock ( 29,000 shares) (484) 447 (37) Net exchanges of shares of Class A and Class B common stock ( 1,188,000 shares) (10,038) 10,038 -0- Vesting of restricted share units ( 219,000 shares) (4,210) 3,460 (750) Compensation expense related to stock incentive plans 2,129 2,129 Performance share issuance ( 76,000 shares) (1,585) 1,172 (413) Dividends declared: Class A ( $0.40 per share) (4,617) (4,617) Class B ( $0.42 per share) (10,944) (10,944) Amounts at June 30, 2009 $ 718 $1,433 $ 343 $458,180 $ (501) $(77,819) $ 382,354 See Notes to Consolidated Financial Statements 44 Common Stock Additional Paid-In Capital Retained Earnings Accumulated Other Comprehensive Income (Loss) Treasury Stock Total Share Owners' Equity Class A Class B Amounts at June 30, 2009 $ 718 $ 1,433 $ 343 $ 458,180 $ (501 ) $ (77,819 ) $ 382,354 Comprehensive income: Net income 10,803 10,803 Net change in unrealized gains and losses on securities (463 ) (463 ) Foreign currency translation adjustment (10,384 ) (10,384 ) Net change in derivative gains and losses 1,724 1,724 Postemployment severance prior service cost 173 173 Postemployment severance actuarial change (324 ) (324 ) Comprehensive income 1,529 Issuance of non-restricted stock (20,000 shares) (209 ) (66 ) 258 (17 ) Net exchanges of shares of Class A and Class B
common stock (460,000 shares) (490 ) (2,567 ) 3,057 — Vesting of restricted share units (209,000 shares) (274 ) (3,435 ) 3,157 (552 ) Compensation expense related to stock incentive plans 1,824 1,824 Performance share issuance (97,000 shares) (1,075 ) (784 ) 1,480 (379 ) Dividends declared: Class A ($0.18 per share) (1,955 ) (1,955 ) Class B ($0.20 per share) (5,376 ) (5,376 ) Amounts at June 30, 2010 $ 718 $ 1,433 $ 119 $ 454,800 $ (9,775 ) $ (69,867 ) $ 377,428 Comprehensive income: Net income 4,922 4,922 Foreign currency translation adjustment 10,313 10,313 Net change in derivative gains and losses (458 ) (458 ) Postemployment severance prior service cost 171 171 Postemployment severance actuarial change 1,367 1,367 Comprehensive income 16,315 Issuance of non-restricted stock (39,000 shares) (556 ) (107 ) 499 (164 ) Net exchanges of shares of Class A and Class B
common stock (215,000 shares) (551 ) (728 ) 1,279 — Compensation expense related to stock incentive plans 1,284 1,284 Performance share issuance (99,000 shares) (66 ) (1,378 ) 1,317 (127 ) Dividends declared: Class A ($0.18 per share) (1,889 ) (1,889 ) Class B ($0.20 per share) (5,448 ) (5,448 ) Amounts at June 30, 2011 $ 718 $ 1,433 $ 230 $ 450,172 $ 1,618 $ (66,772 ) $ 387,399 Comprehensive income: Net income 11,634 11,634 Foreign currency translation adjustment (8,727 ) (8,727 ) Net change in derivative gains and losses 833 833 Postemployment severance prior service cost 172 172 Postemployment severance actuarial change 1,141 1,141 Comprehensive income 5,053 Issuance of non-restricted stock (20,000 shares) (227 ) (93 ) 243 (77 ) Net exchanges of shares of Class A and Class B
common stock (209,000 shares) (782 ) (529 ) 1,311 — Compensation expense related to stock incentive plans 1,443 1,443 Performance share issuance (131,000 shares) (29 ) (1,720 ) 1,530 (219 ) Dividends declared: Class A ($0.18 per share) (1,869 ) (1,869 ) Class B ($0.20 per share) (5,502 ) (5,502 ) Amounts at June 30, 2012 $ 718 $ 1,433 $ 635 $ 452,093 $ (4,963 ) $ (63,688 ) $ 386,228 38NOTES TO CONSOLIDATED FINANCIAL STATEMENTS
Use of Estimates:The preparation of financial statements in conformity with accounting principles generally accepted in the United States of America (US GAAP) requires management to make estimates and assumptions that affect the reported amounts included in the consolidated financial statements and related note disclosures. While efforts are made to assure estimates used are reasonably accurate based on management's knowledge of current events, actual results could differ from those estimates. no receivables sold during the fiscal year ended June 30, 2011. Factoring fees were not material. A summary of the goodwill by segment is as follows: years Income. benefits in the Provision (Benefit) for Income Taxes line of the Consolidated Statements of Income. Other General Income:No Other General Income $3.3 million. statements. Inventories Inventories are valued using the lower of last-in, first-out (LIFO) cost or market value for approximately 2009 2008 2009 segment reporting purposes. Operating leases Assumptions used to determine fiscal year end benefit obligations are as follows: 2009 2008 2009 2008 shares. Unrestricted Share Grants: 1996 Stock Incentive Program. Changes in the unrecognized tax benefit, excluding accrued interest and penalties, during fiscal years Provision (Benefit) for Income Taxes line of the Consolidated Statements of Income. Amounts accrued for interest and penalties were as follows: If dividends are not paid on shares of the Company's Class B Common Stock for a period of thirty-six consecutive months, or if at any time the number of shares of Class A Common Stock issued and outstanding is less than 15% of the total number of issued and outstanding shares of both Class A and Class B Common Stock, then all shares of Class B Common Stock shall automatically have the same rights and privileges as the Class A Common Stock, with full and equal voting rights and with equal rights to receive dividends as and if declared by the Board of Directors. (Amounts in Thousands) Level 1 Level 2 Level 3 Total Assets Cash equivalents Available-for-sale securities: Municipal Securities Derivatives Nonqualified supplemental employee retirement plan assets Total assets at fair value Liabilities Derivatives Total liabilities at fair value Foreign Exchange Contracts: thus had 2012 and 2011. For the Year Ended June 30 (Amounts in Thousands) 2009 2008 2007 Proceeds from sales Gross realized gains from sale of available-for-sale securities included in earnings Gross realized losses from sale of available-for-sale securities included in earnings 2009 2008 Each segment's product line offerings consist of similar products and services sold within various industries. The Company recognized consolidated pre-tax restructuring expense of Company recognized a pre-tax impairment loss, in thousands, of Property & Equipment Impairment and Losses on Sales Transition and Other Employee Costs Lease and Other Exit Costs Total Total Total Total 2009 2008 2007 The information required by this item with respect to Directors is incorporated by reference to the material contained in the Company's Proxy Statement for its annual meeting of Share Owners to be held October The information required by this item with respect to the Audit Committee and its financial expert and with respect to the Compensation and Governance Committee's responsibility for establishing procedures by which Share Owners may recommend nominees to the Board of Directors is incorporated by reference to the material contained in the Company's Proxy Statement for its annual meeting of Share Owners to be held October Individually and as Attorney-In-Fact Balance at Beginning Additions/(Reductions) Charged to Write-offs BalanceNote 1 Summary of Significant Accounting Policies
Principles of Consolidation: The consolidated financial statements include the accounts of all domestic and foreign subsidiaries. All significant intercompany balances and transactions have been eliminated in the consolidation. Revenue Recognition: Revenue from product sales is recognized when title and risk transfer to the customer, which under the terms and conditions of the sale, may occur either at the time of shipment or when the product is delivered to the customer. Shipping and handling fees billed to customers are recorded as sales while the related shipping and handling costs are included in cost of goods sold. The Company recognizes sales net of applicable sales tax. Service revenue is recognized as services are rendered. Based on estimated product returns and price concessions, a reserve for returns and allowances is recorded at the time of the sale, resulting in a reduction of revenue. An allowance for doubtful accounts is recorded using specific analysis of a customer's credit worthiness, changes in a customer's payment history, historical bad debt experience, and general economic and market trends. Estimates of collectibility result in an increase or decrease in selling expenses.Revenue Recognition: Revenue from product sales is recognized when title and risk transfer to the customer, which under the terms and conditions of the sale, may occur either at the time of shipment or when the product is delivered to the customer. Service revenue is recognized as services are rendered. Shipping and handling fees billed to customers are recorded as sales while the related shipping and handling costs are included in cost of goods sold. The Company recognizes sales net of applicable sales tax. Based on estimated product returns and price concessions, a reserve for returns and allowances is recorded at the time of the sale, resulting in a reduction of revenue.Cash and Cash Equivalents, and Short-Term Investments: Equivalents:Cash equivalents consist primarily of highly liquid investments with original maturities of three months or less at the time of acquisition. Cash and cash equivalents consist of bank accounts and money market funds. Bank accounts are stated at cost, which approximates fair value, and money market funds are stated at fair value. Short-term investments consist primarilyNotes Receivable and Trade Accounts Receivable: The Company's notes receivable and trade accounts receivable are recorded per the terms of municipal securities with maturities exceeding three months at the timeagreement or sale, and accrued interest is recognized when earned. The Company determines on a case-by-case basis the cessation of acquisition. Available-for-sale securities are stated at fair value. Unrealizedaccruing interest, the resumption of accruing interest, the method of recording payments received on nonaccrual receivables, and the delinquency status for the Company's limited number of notes receivable.The Company's policy for estimating the allowance for credit losses on trade accounts receivable and notes receivable includes analysis of such items as agement, credit worthiness, payment history, and historical bad debt securities are recognizedexperience. Management uses these specific analyses in earnings when a company hasconjunction with an intent to sell or is likely to be required to sell before recoveryevaluation of the loss, or whengeneral economic and market conditions to determine the debt security has incurred afinal allowance for credit loss. Otherwise, unrealized gainslosses on the trade accounts receivable and notes receivable. Trade accounts receivable and notes receivable are written off after exhaustive collection efforts occur and the receivable is deemed uncollectible. The Company's limited number of notes receivable allows management to monitor the risks, credit quality indicators, collectability, and probability of impairment on an individual basis. Adjustments to the allowance for credit losses are recorded netin selling and administrative expenses.In the ordinary course of business, customers periodically negotiate extended payment terms on trade accounts receivable. The Company may utilize accounts receivable factoring arrangements with third-party financial institutions in order to extend terms for the customer without negatively impacting the Company's cash flow. These arrangements in all cases do not contain recourse provisions against the Company for its customers' failure to pay. Receivables are considered sold when they are transferred beyond the reach of the tax related effect as a componentCompany and its creditors, the purchaser has the right to pledge or exchange the receivables, and the Company has surrendered control over the transferred receivables. During the fiscal year ended June 30, 2012, the Company sold, without recourse, $59 million of Share Owners' Equity.accounts receivable. There were Inventories: Inventories are stated at the lower of cost or market value. Cost includes material, labor, and applicable manufacturing overhead. Costs associated with underutilization of capacity are expensed as incurred. The last-in, first-out (LIFO) method was used for approximately 14%10% and 17%11% of consolidated inventories at June 30, 20092012 and June 30, 2008,2011, respectively, and remaining inventories were valued using the first-in, first-out (FIFO) method. Inventories recorded on the Company's balance sheet are adjusted for excess and obsolete inventory. Evaluation of excess inventory includes such factors as anticipated usage, inventory turnover, inventory levels, and product demand levels. Factors considered when evaluating obsolescence include the age of on-hand inventory and reduction in value due to damage, use as showroom samples, design changes, or cessation of product lines.Property, Equipment, and Depreciation:Property and equipment are stated at cost less accumulated depreciation. Depreciation is provided over the estimated useful life of the assets using the straight-line method for financial reporting purposes. Leasehold improvements are amortized on a straight-line basis over the shorter of the useful life of the improvement or the term of the lease. Major maintenance activities and improvements are capitalized; other maintenance, repairs, and minor renewals and betterments are expensed.39Impairment of Long-Lived Assets:The Company performs reviews for impairment of long-lived assets whenever events or changes in circumstances indicate that the carrying value of an asset may not be recoverable. An impairment loss is recognized when estimated future cash flows expected to result from the use of the asset and its eventual disposition are less than its carrying amount. When an impairment is identified, the carrying amount of the asset is reduced to its estimated fair value. Assets to be disposed of are recorded at the lower of net book value or fair market value less cost to sell at the date management commits to a plan of disposal.Goodwill and Other Intangible Assets:Goodwill represents the difference between the purchase price and the related underlying tangible and intangible net asset fair values resulting from business acquisitions. Annually, or if conditions indicate an earlier review is necessary, the Company may assess qualitative factors to determine if it is more likely than not that the fair value is less than its carrying amount and if it is necessary to perform the quantitative two-step goodwill impairment test. The Company also has the option to bypass the qualitative assessment and proceed directly to performing the first step of the quantitative goodwill impairment test. If the first step is determined to be necessary, the Company compares the carrying value of the reporting unit to an estimate of the reporting unit's fair value to identify potential impairment. If the estimated fair value of the reporting unit is less than the carrying value, a second step is performed to determine the amount of potential goodwill impairment. If impaired, goodwill is written down to its estimated implied fair value. Goodwill is assigned to and the fair value is tested at the reporting unit level. The Company usesfair value is established primarily using a discounted cash flows to establish its reporting unit fair value.flow analysis and secondarily a market approach utilizing current industry information. The calculation of the fair value of the reporting units considers current market conditions existing at the assessment date. During fiscal years 2012, 2011, and 2010, no goodwill impairment loss was recognized.June 30, June 30, (Amounts in Thousands) 2009 2008 Electronic Manufacturing Services $ 2,608 $ 13,622 Furniture -0- 1,733 Consolidated $ 2,608 $ 15,355 During fiscal year 2009, goodwill was reviewed on an interim basis due to the continued uncertainty associated with the economy and liquidity crisis and the significant decline in the Company's sales and order trends as well as the increased disparity between the Company's market capitalization and the carrying value of its stockholders' equity. Interim testing resulted in the recognition of goodwill impairment of, in thousands, $12,826 within the Electronic Manufacturing Services (EMS) segment and $1,733 within the Furniture segment. The impairment was recorded on the Goodwill Impairment line item of the Company's Consolidated Statements of Income.(Amounts in Thousands) Electronic Manufacturing Services Furniture Consolidated Balance as of June 30, 2010 Goodwill $ 15,269 $ 1,733 $ 17,002 Accumulated impairment losses (12,826 ) (1,733 ) (14,559 ) Goodwill, net 2,443 — 2,443 Effect of Foreign Currency Translation 201 — 201 Balance as of June 30, 2011 Goodwill 15,470 1,733 17,203 Accumulated impairment losses (12,826 ) (1,733 ) (14,559 ) Goodwill, net 2,644 — 2,644 Effect of Foreign Currency Translation (164 ) — (164 ) Balance as of June 30, 2012 Goodwill 15,306 1,733 17,039 Accumulated impairment losses (12,826 ) (1,733 ) (14,559 ) Goodwill, net $ 2,480 $ — $ 2,480 In addition to performing the required annual testing, the Company will continue to monitor circumstances and events in future periods to determine whether additional goodwill impairment testing is warranted on an interim basis. The Company can provide no assurance that an additional impairment charge for the remaining goodwill balance, which approximates only 0.4% of the Company's total assets, will not occur in future periods as a result of these analyses.Within the EMS segment, goodwill increased by, in thousands, $1,965 during fiscal year 2009 for the acquisition of Genesis Electronics Manufacturing. This acquisition was integrated into an existing reporting unit, and the goodwill was subsequently deemed impaired by the interim testing completed during the third quarter of fiscal year 2009. See Note 2 - Acquisitions of Notes to Consolidated Financial Statements for further discussion. Goodwill was offset by, in thousands, a $153 reduction due to the effect of changes in foreign currency exchange rates.During fiscal year 2008, the terminated business in conjunction with the consolidation of a Hibbing, Minnesota, operation resulted in a pre-tax goodwill impairment loss of, in thousands, $172, which was recordedOther Intangible Assets reported on the Restructuring line item of the Company's Consolidated Statements of Income.Other intangible assetsBalance Sheets consist of capitalized software, product rights, and customer relationships and are reported as Other Intangible Assets on the Consolidated Balance Sheets.relationships. Intangible assets are reviewed for impairment when events or circumstances indicate that the carrying value may not be recoverable over the remaining lives of the assets. 40A summary of other intangible assets subject to amortization by segment is as follows: June 30, 2009 June 30, 2008 (Amounts in Thousands) Cost Accumulated
Amortization Net Value Cost Accumulated
Amortization Net Value Electronic Manufacturing Services: Capitalized Software $27,455 $ 24,217 $ 3,238 $27,228 $ 22,531 $ 4,697 Customer Relationships 1,167 448 719 937 247 690 Other Intangible Assets $28,622 $ 24,665 $ 3,957 $28,165 $ 22,778 $ 5,387 Furniture: Capitalized Software $37,107 $ 32,533 $ 4,574 $43,868 $ 37,895 $ 5,973 Product Rights 1,160 334 826 1,160 210 950 Other Intangible Assets $38,267 $ 32,867 $ 5,400 $45,028 $ 38,105 $ 6,923 Unallocated Corporate: Capitalized Software $ 5,773 $ 4,949 $ 824 $ 6,267 $ 5,204 $ 1,063 Other Intangible Assets $ 5,773 $ 4,949 $ 824 $ 6,267 $ 5,204 $ 1,063 Consolidated $72,662 $ 62,481 $ 10,181 $79,460 $ 66,087 $ 13,373 The customer relationship intangible asset cost increased by, in thousands, $230 during fiscal year 2009 due to the acquisition of Genesis Electronics Manufacturing. June 30, 2012 June 30, 2011 (Amounts in Thousands) Cost AccumulatedAmortization Net Value Cost AccumulatedAmortization Net Value Electronic Manufacturing Services: Capitalized Software $ 28,470 $ 26,084 $ 2,386 $ 28,676 $ 25,700 $ 2,976 Customer Relationships 1,167 843 324 1,167 744 423 Other Intangible Assets 29,637 26,927 2,710 29,843 26,444 3,399 Furniture: Capitalized Software 36,937 33,889 3,048 36,375 33,064 3,311 Product Rights 372 210 162 1,160 606 554 Other Intangible Assets 37,309 34,099 3,210 37,535 33,670 3,865 Unallocated Corporate: Capitalized Software 5,084 4,798 286 5,761 5,400 361 Other Intangible Assets 5,084 4,798 286 5,761 5,400 361 Consolidated $ 72,030 $ 65,824 $ 6,206 $ 73,139 $ 65,514 $ 7,625 During fiscal years 2009, 2008,2012, 2011, and 2007,2010, amortization expense of other intangible assets from continuing operations, including asset write-downs associated with the Company's restructuring plans, was, in thousands, $3,931, $8,036,$2,669, $2,367, and $8,756,$2,484, respectively. Amortization expense in future periods is expected to be, in thousands, $2,389, $2,023, $1,769, $1,474,$2,140, $1,516, $909, $464, and $1,114$389 in the five years ending June 30, 2014,2017, and $1,412$788 thereafter. The amortization period for product rights is 7 years.years. The amortization period for the customer relationship intangible asset ranges from 10 to 16 years.years. The estimated useful life of internal-use software ranges from 3 to 10 years.2009,2012, the Company performed an assessmentFurniture segment recognized impairment of $256, in thousands, related to intangible product rights for a product line with volumes much lower than originally forecasted. The impairment loss was included in the Selling and Administrative Expenses line of the useful livesConsolidated Statements of Enterprise Resource Planning (ERP) software. In evaluating useful lives, the Company considered how long assets would remain functionally efficient and effective, given levels of technology, competitive factors, and the economic environment as of fiscal year 2009. This assessment indicated that the assets will continue to be used for a longer period than previously anticipated. As a result, effective October 1, 2008, the Company revised the useful lives of ERP software from 7 years to 10 years. Changes in estimates are accounted for on a prospective basis, by amortizing assets' current carrying values over their revised remaining useful lives. The effect of this change in estimate, compared to the original amortization, for fiscal year 2009 was a pre-tax reduction in amortization expense of, in thousands, $1,402. The pre-tax (decrease) increase to amortization expense in future periods is expected to be, in thousands, ($1,227), ($299), $451, $911, and $664 in the five years ending June 30, 2014, and $902 thereafter.Internal-use software is stated at cost less accumulated amortization and is amortized using the straight-line method. During the software application development stage, capitalized costs include external consulting costs, cost of software licenses, and internal payroll and payroll-related costs for employees who are directly associated with a software project. Upgrades and enhancements are capitalized if they result in added functionality which enable the software to perform tasks it was previously incapable of performing. Software maintenance, training, data conversion, and business process reengineering costs are expensed in the period in which they are incurred. Product rights to produce and sell certain products are amortized on a straight-line basis over their estimated useful lives, and capitalized customer relationships are amortized on estimated attrition rate of customers. The Company has no intangible assets with indefinite useful lives which are not subject to amortization. Research and Development: The costs of research and development are expensed as incurred. Research and development costs from continuing operations were approximately, in millions, $14, $16,$13, $13, and $17$12 in fiscal years 2009, 2008,2012, 2011, and 2007,2010, respectively.Advertising: Advertising costs are expensed as incurred. Advertising costs, from continuing operations, included in selling and administrative expenses were, in millions, $4.5, $6.2,$4.7, $4.3, and $8.3,$5.5, in fiscal years 2009, 2008,2012, 2011, and 2007,2010, respectively. Insurance and Self-insurance:The Company is self-insured up to certain limits for auto and general liability, workers' compensation, and certain employee health benefits including medical, short-term disability, and dental, with the related liabilities included in the accompanying financial statements. The Company's policy is to estimate reserves based upon a number of factors including known claims, estimated incurred but not reported claims, and other analyses, which are based on historical information along with certain assumptions about future events. Approximately 68%60% of the workforce is covered under self-insured medical and short-term disability plans.The Company carries external medical and disability insurance coverage for the remainder of its eligible workforce not covered by self-insured plans. Insurance benefits are not provided to retired employees.Income Taxes:Foreign unremitted earnings Deferred income tax assets and liabilities are recognized for the estimated future tax consequences attributable to temporary differences between the financial statement carrying amounts of entities not includedexisting assets and liabilities and their respective tax bases. These assets and liabilities are measured using enacted tax rates expected to apply to taxable income in the United Statesyears in which the temporary differences are expected to reverse. The Company evaluates the recoverability of its deferred tax return have been includedassets each quarter by assessing the likelihood of future profitability and available tax planning strategies that could be implemented41to realize its deferred tax assets. If recovery is not likely, the Company provides a valuation allowance based on its best estimate of future taxable income in the consolidated financial statements without giving effect to the United States taxes that may be payable on distribution to the United States because it is not anticipated such earnings will be remitted to the United States. Determination ofvarious taxing jurisdictions and the amount of deferred taxes ultimately realizable. Future events could change management's assessment.The Company operates within multiple taxing jurisdictions and is subject to tax audits in these jurisdictions. These audits can involve complex uncertain tax positions, which may require an extended period of time to resolve. A tax benefit from an uncertain tax position may be recognized only if it is more likely than not that the tax position will be sustained on examination by taxing authorities, based on the technical merits of the position. The Company maintains a liability for uncertain income tax and other tax positions, including accrued interest and penalties on those positions. As tax periods are effectively settled, the liability is adjusted accordingly. The Company recognizes interest and penalties related to unrecognized deferred tax liability on unremitted earnings is not practicable.Off-Balance Sheet Risk and ConcentrationConcentrations of Credit Risk:The Company has business and credit risks concentrated in the medical, automotive, and furniture industries. Two customers, Bayer AG and TRW Automotive, Inc., represented 19% and 11%, respectively, of consolidated accounts receivable at June 30, 2009. Bayer AG and Siemens AG, represented 16% and 15%, respectively, of consolidated accounts receivable at June 30, 2008. TheAdditionally, the Company currently does not foresee a credit risk associatedhas notes receivable with these receivables. The Company also has an agreement with a contract customer andelectronics engineering services firm, a note receivable related to the sale of an Indiana facility.facility, and other miscellaneous notes receivable. At June 30, 2009, $4.72012 and 2011, $3.0 million and $2.8 million, respectively, was outstanding.outstanding under the notes receivables. The Company recorded a provisioncredit risk associated with receivables is disclosed in Note 19 - Credit Quality and Allowance for potential credit losses. Credit Losses of Notes Receivable of Notes to Consolidated Financial Statements.Off-Balance Sheet Risk: The Company's off-balance sheet arrangements are limited to operating leases entered into in the normal course of business as described in Note 54 - Commitments and Contingent Liabilities of Notes to Consolidated Financial Statements.includes thewas recorded in fiscal years 2012 or 2011. Other General Income, in fiscal year 2010 of $10.0 million included a gain related toon the sale of undeveloped land and timberland holdings and earnest money deposits retained by the Company resulting from the termination of the contract to sell and lease back the Company's Poland buildingfacility of $6.7 million and real estate.land and settlement proceeds related to a class action lawsuit of which the Company was a class member of Components of Other General Income: Year Ended June 30 (Amounts in Thousands) 2009 2008 2007 Gain on Sale of Undeveloped Land and Timberland Holdings $ 31,489 $ -0- $ -0- Earnest Money Deposits Retained 1,928 -0- -0- Other General Income $ 33,417 $ -0- $ -0- Non-operating Income and Expense: Non-operating income and expense include the impact of such items as foreign currency rate movements and related derivative gain or loss, fair value adjustments on privately-held investments and Supplemental Employee Retirement Plan (SERP) investments, non-production rent income, bank charges, and other miscellaneous non-operating income and expense items that are not directly related to operations.Foreign Currency Translation:The Company uses the U.S. dollar and Euro predominately as its functional currencies. Foreign currency assets and liabilities are remeasured into functional currencies at end-of-period exchange rates, except for nonmonetary assets and equity, which are remeasured at historical exchange rates. Revenue and expenses are remeasured at the weighted average exchange rate during the fiscal year, except for expenses related to nonmonetary assets, which are remeasured at historical exchange rates. Gains and losses from foreign currency remeasurement are reported in the Non-operating income or expense line item on the Consolidated Statements of Income.For businesses whose functional currency is other than the U.S. dollar, the translation of functional currency statements to U.S. dollar statements uses end-of-period exchange rates for assets and liabilities, weighted average exchange rates for revenue and expenses, and historical rates for equity. The resulting currency translation adjustment is recorded in Accumulated Other Comprehensive Income (Loss), as a component of Share Owners' Equity.Derivative Instruments and Hedging Activities: Derivative financial instruments are recognized on the balance sheet as assets and liabilities and are measured at fair value. Changes in the fair value of derivatives are recorded each period in earnings or Accumulated Other Comprehensive Income (Loss), depending on whether a derivative is designated and effective as part of a hedge transaction, and if it is, the type of hedge transaction. Hedge accounting is utilized when a derivative is expected to be highly effective upon execution and continues to be highly effective over the duration of the hedge transaction. Hedge accounting permits gains and losses on derivative instruments to be deferred in Accumulated Other Comprehensive Income (Loss) and subsequently included in earnings in the periods in which earnings are affected by the hedged item, or when the derivative is determined to be ineffective. The Company's use ofCompany uses derivatives is generally limited toprimarily for forward purchases of foreign currency to manage exposure to the variability of cash flows, primarily related to the foreign exchange rate risks inherent in forecasted transactions denominated in foreign currency. Additionally, the Company has an investment in stock warrants which is accounted for as a derivative instrument. See Note 1211 - Derivative Instruments of Notes to Consolidated Financial Statements for more information on derivative instruments and hedging activities.Stock-Based Compensation:As described in Note 87 - Stock Compensation Plans of Notes to Consolidated Financial Statements, the Company maintains stock-based compensation plans which allow for the issuance of restricted stock, restricted share units, unrestricted share grants, incentive stock options, nonqualified stock options, performance shares, performance units, and stock appreciation rights for grant to officers and other key employees of the Company and to members of the Board of Directors who are not employees. The Company recognizes the cost resulting from share-based payment transactions using42a fair-value-based method. The estimated fair value of outstanding performance shares and restricted share units is based on the stock price at the date of the award.grant. For performance shares, the price is reduced by the present value of dividends normally paid over the vesting period which are not payable on outstanding performance share awards. The estimated fair value of stock options is determined using the Black-Scholes option pricing model. Stock-based compensation expense is recognized for the portion of the award that is ultimately expected to vest. Forfeitures are estimated at the time of grant and revised, if necessary, in subsequent periods if actual forfeitures differ from those estimates.Subsequent Events: The Company has evaluated the impact of subsequent events through August 31, 2009, which is the date these financial statements were issued.In April 2009,September 2011, the FASB issued FASB Staff Position (FSP) FAS 115-2 and FAS 124-2, Recognition and Presentationguidance to allow the use of Other-Than-Temporary Impairments. This FSP modifiesa qualitative approach to test goodwill for impairment. The guidance permits the recognitionCompany to first perform a qualitative assessment to determine whether it is more likely than not that the fair value of impairment lossesa reporting unit is less than its carrying value. The Company chose to early adopt this standard, therefore the guidance was effective for the Company's first quarter fiscal year 2012 financial statements. The adoption of this guidance did not have a material impact on debt securities so that an impairment loss is triggered when a company has an intent to sellthe Company's consolidated financial position, results of operations, or is likely to sell before recoverycash flows. At June 30, 2012, the Company's goodwill totaled $2.5 million, which approximates 0.4% of the loss,Company's total assets.In June 2011, the FASB issued new guidance on the presentation of comprehensive income. This guidance eliminates the option to present the components of other comprehensive income as part of the Statement of Share Owners' Equity. Instead, the Company must report comprehensive income in either a single continuous statement of comprehensive income which contains two sections, net income and other comprehensive income, or whenin two separate but consecutive statements. While the debt security has incurred a credit loss. This FSP also requires interim and annual disclosures, by major security type,new guidance changes the presentation of impairment losses taken and not taken, and information on credit losses.comprehensive income, there are no changes to the components that are recognized in net income or other comprehensive income under current accounting guidance. The Company adoptedguidance is effective for the FSP at the end ofCompany's first quarter fiscal year 20092013 financial statements on a retrospective basis. As this guidance only amends the presentation of the components of comprehensive income, the adoption will not have an impact on the Company's consolidated financial position, results of operations, or cash flows.In May 2011, the FASB issued guidance to amend certain measurement and provideddisclosure requirements related to fair value measurements to improve consistency with international reporting standards. The guidance required additional disclosures, including disclosures related to the required disclosures in Note 13 - Short-Term Investmentsmeasurement of Notes to Consolidated Financial Statements.level 3 assets. The guidance became effective prospectively for the Company's third quarter fiscal year 2012 financial statements. The adoption did not have a material impact on the Company's consolidated financial position or results of operations.In April 2009,January 2010, the FASB issued FSP FAS 107-1guidance to improve disclosures about fair value instruments. The guidance requires additional disclosure about significant transfers between levels 1, 2, and APB 28-1, Interim Disclosures about Fair Value3 of Financial Instruments. This FSP expands to interim periods the existing annual requirement to disclose the fair value hierarchy and requires disclosure of financial instruments that are not reflectedlevel 3 activity on a gross basis. In addition, the balance sheet at fair value.guidance clarifies existing requirements regarding the required level of disaggregation by class of assets and liabilities and also clarifies disclosures of inputs and valuation techniques. The FSP will beguidance became effective and will require additional disclosures in interim periods beginning in the Company's first quarter of fiscal year 2010.In October 2008, the FASB issued FSP FAS 157-3, Determining the Fair Value of a Financial Asset When the Market for That Asset is Not Active. This FSP clarifies the application of SFAS No. 157, Fair Value Measurements, in a market that is not active and provides an example to illustrate key considerations in determining the fair value of a financial asset when the market for that financial asset is not active. Additionally, in April 2009 the FASB issued FSP FAS 157-4, Determining Fair Value When the Volume and Level of Activity for the Asset or Liability Have Significantly Decreased and Identifying Transactions That Are Not Orderly. This FSP provides guidelines for determining the fair values when there is no active market or where the price inputs being used represent distressed sales and requires additional annual and interim disclosure of fair value by major security types. FSP FAS 157-3 was effective upon issuance and FSP FAS 157-4 became effective as of the Company's fiscal year ended June 30, 2009. Other than additional disclosure requirements, the FSP's have not had an impact on the Company's financial position or results of operations because the Company currently has no financial instruments in inactive markets.In June 2008, the FASB issued an FSP on Emerging Issues Task Force (EITF) 03-6-1, Determining Whether Instruments Granted in Share-Based Payment Transactions Are Participating Securities (FSP EITF 03-6-1). FSP EITF 03-6-1 provides that unvested share-based payment awards that contain nonforfeitable rights to dividends or dividend equivalents (whether paid or unpaid) are participating securities and shall be included in the computation of earnings per share pursuant to the two-class method. The two-class method is an earnings allocation method for computing earnings per share when an entity's capital structure includes multiple classes of common stock and participating securities. FSP EITF 03-6-1 is effective as of the beginning of the Company's fiscal year 2010 and requires that previously reported earnings per share data be recast in financial statements issued in periods after the effective date. The Company does not expect the impact of FSP EITF 03-6-1 to be significant.In May 2008, the FASB issued SFAS No. 162, The Hierarchy of Generally Accepted Accounting Principles (FAS 162). FAS 162 identifies the sources of accounting principles and the framework for selecting the principles used in the preparation of financial statements that are presented in conformity with generally accepted accounting principles in the United States. This statement did not change existing practices. This statement became effective on November 15, 2008 and did not have a material effect on the Company's consolidated financial statements. FAS 162 will be superseded when FAS 168 becomes effective in the Company's first quarter of fiscal year 2010.In April 2008, the FASB issued FSP No. FAS 142-3, Determination of the Useful Life of Intangible Assets (FSP FAS 142-3). FSP FAS 142-3 amends the factors that should be considered in developing renewal or extension assumptions used to determine the useful life of a recognized intangible asset under SFAS No. 142, Goodwill and Other Intangible Assets. FSP FAS 142-3 allows an entity to use its own historical experience in renewing or extending similar arrangements, adjusted for entity-specific factors, in developing assumptions about renewal or extension used to determine the useful life of a recognized intangible asset. As a result, the determination of intangible asset useful lives is now consistent with the method used to determine the period of expected cash flows used to measure the fair value of the intangible assets, as described in other accounting principles. The guidance for determining the useful life of a recognized intangible asset is to be applied prospectively to intangible assets acquired after the effective date. Disclosure requirements are to be applied prospectively to all intangible assets recognized as of, and subsequent to, the effective date. The provisions of FSP FAS 142-3 are effective as of the beginning of the Company's fiscal year 2010 and are currently not expected to have a material effect on the Company's consolidated financial statements.In March 2008, the FASB issued SFAS No. 161, Disclosures about Derivative Instruments and Hedging Activities (FAS 161). FAS 161 amends and expands the disclosure requirements of SFAS No. 133, Accounting for Derivative Instruments and Hedging Activities, and requires entities to provide enhanced qualitative disclosures about objectives and strategies for using derivatives, quantitative disclosures about fair values and amounts of gains and losses on derivative contracts, and disclosures about credit-risk-related contingent features in derivative agreements. The Company adopted FAS 161 as of the third quarter of fiscal year 2009 and provided the required disclosures in Note 12 - Derivative Instruments of Notes to Consolidated Financial Statements.In December 2007, the FASB issued SFAS No. 141 (revised 2007), Business Combinations (FAS 141(R)). FAS 141(R) requires that the fair value of the purchase price of an acquisition including the issuance of equity securities be determined on the acquisition date; requires that all assets, liabilities, noncontrolling interests, contingent consideration, contingencies, and in-process research and development costs of an acquired business be recorded at fair value at the acquisition date; requires that acquisition costs generally be expensed as incurred; requires that restructuring costs generally be expensed in periods subsequent to the acquisition date; and requires that changes in deferred tax asset valuation allowances and acquired income tax uncertainties after the measurement period impact income tax expense. FAS 141(R) also broadens the definition of a business combination and expands disclosures related to business combinations. Additionally, in April 2009, the FASB issued FSP 141(R)-1, Accounting for Assets Acquired and Liabilities Assumed in a Business Combination That Arise from Contingencies, which amends FAS 141(R) and requires that acquired contingent assets and liabilities be recognized at fair value if fair value can be reasonably estimated. If the fair value cannot be reasonably estimated, the asset or liability will be recognized in accordance with SFAS No. 5, Accounting for Contingencies, and FASB Interpretation No. 14, Reasonable Estimation of the Amount of a Loss. FAS 141(R) and FSP 141(R)-1 will be applied prospectively to business combinations occurring after the beginning of the Company's fiscal year 2010, except that business combinations consummated priorfor the requirement to the effective date must apply FAS 141(R) income tax requirements immediately upon adoption. The impact, if any, of FAS 141(R) and FSP 141(R)-1 on the Company's financial position, results of operations, and cash flows will depend on the extent of business combinations completed after the adoption of the standard.In December 2007, the FASB issued SFAS No. 160, Noncontrolling Interests in Consolidated Financial Statements, an Amendment of ARB No. 51 (FAS 160). FAS 160 requires that noncontrolling interests be reported as a separate component of equity, that net income attributable to the parent and to the noncontrolling interest be separately identified in the consolidated statements of income, that changes in a parent's ownership interest be accounted for as equity transactions, and that, when a subsidiary is deconsolidated, any retained noncontrolling equity investment in the former subsidiary and the gain or loss on the deconsolidation of the subsidiary be measured at fair value. FAS 160 will be applied prospectively, except for presentation and disclosure requirements which will be applied retrospectively, as of the beginning of the Company's fiscal year 2010. The Company does not currently have noncontrolling interests, and therefore the adoption of FAS 160 is not expected to have an impact on the Company's financial position, results of operations, or cash flows.In June 2007, the FASB ratified the EITF consensus on Issue No. 06-11, Accounting for Income Tax Benefits of Dividends on Share-Based Payment Awards (EITF 06-11). EITF 06-11 requires companies to recognize the income tax benefit realized from dividends or dividend equivalents that are charged to retained earnings and paid to employees for nonvested equity-classified employee share-based payment awards as an increase to additional paid-in capital. The realized income tax benefit recognized in additional paid-in capital should be included in the pool of excess tax benefits available to absorb future tax deficiencies on share-based payment awards. EITF 06-11 was adopteddisclose level 3 activity on a prospectivegross basis, for income tax benefits on dividends declared after the beginning of the Company's fiscal year 2009. The adoption of EITF 06-11 did not have a material impact on the Company's financial position, results of operations, or cash flows.In February 2007, the FASB issued SFAS No. 159, The Fair Value Option for Financial Assets and Financial Liabilities-Including an amendment of FASB Statement No. 115 (FAS 159). FAS 159 expands the use of fair value accounting but does not affect existing standards which require assets or liabilities to be carried at fair value. Under FAS 159, a company may elect to use fair value to measure financial instruments and certain other items, which may reduce the need to apply complex hedge accounting provisions in order to mitigate volatility in reported earnings. The fair value election is irrevocable and is generally made on an instrument-by-instrument basis, even if a company has similar instruments that it elects not to measure based on fair value. FAS 159 became effective as of the beginning of the Company's fiscal year 2009.2012. The Company has determined that it will not elect to use fair value accounting for any eligible items, and therefore FAS 159 will have no impact on its financial position, results of operations, or cash flows.In September 2006, the FASB issued SFAS No. 158, Employers' Accounting for Defined Benefit Pension and Other Postretirement Plans-an amendment of FASB Statements No. 87, 88, 106, and 132(R) (FAS 158). FAS 158 requires employers to recognize the overfunded or underfunded status of a defined benefit plan as an asset or liability in its statement of financial position, recognize through comprehensive income changes in that funded status in the year in which the changes occur, and measure a plan's assets and its obligations that determine its funded status as of the end of the employer's fiscal year. At the end of fiscal year 2007, the Company adopted the provisions of FAS 158 related to recognition of plan assets, benefit liabilities, and comprehensive income. The Company adopted the provisionsadoption of this rule that require measurement of plan assets and benefit obligations as of the year end balance sheet date for the Company's fiscal year 2009, and itguidance did not have a material impact on the Company's financial position, results of operations, or cash flows. This rule impacts the accounting for the Company's unfunded noncontributory postemployment severance plans.In September 2006, the FASB issued SFAS No. 157, Fair Value Measurements (FAS 157), which defines fair value, establishes a framework for measuring fair value in generally accepted accounting principles, and expands disclosures about fair value measurements. FAS 157 is only applicable to existing accounting pronouncements that require or permit fair value measurements and does not require any new fair value measurements. The standard, as originally issued, was to be effective as of the beginning of the Company's fiscal year 2009. With the issuance in February 2008 of FSP No. FAS 157-2, Effective Date of FASB Statement No. 157, the FASB approved a one-year deferral to the beginning of the Company's fiscal year 2010 for all non-financial assets and liabilities, except those that are recognized or disclosed at fair value in the financial statements on a recurring basis at least annually. In addition, the FASB has excluded leases from the scope of FAS 157 with the issuance of FSP No. FAS 157-1, Application of FASB Statement No. 157 to FASB Statement No. 13 and Other Accounting Pronouncements that Address Fair Value Measurements for Purposes of Lease Classification or Measurement under Statement 13. FAS 157 will be applied prospectively. The Company's adoption of the provisions of FAS 157 applicable to financial instruments as of July 1, 2008, did not have a material impact on the Company's financial position, results of operations, or cash flows. The provisions of FAS 157 applicable to non-financial assets and liabilities are currently not expected to have a material effect on the Company's consolidated financial statements.Note 2 AcquisitionsFiscal Year 2009 Acquisition:During fiscal year 2009, the Company acquired privately-held Genesis Electronics Manufacturing located in Tampa, Florida. The acquisition supports the Company's growth and diversification strategy, bringing new customers in key target markets. The acquisition purchase price totaled $5.4 million. Assets acquired were $7.7 million, which included $2.0 million of goodwill, and liabilities assumed were $2.3 million. Direct costs of the acquisition were not material. Goodwill was allocated to the EMS segment of the Company. The operating results of this acquisition are included in the Company's consolidated financial statements beginning on September 1, 2008 and excluding subsequent goodwill impairment, had an immaterial impact on the fiscal year 2009 financial results. See Note 1 - Summary of Significant Accounting Policies of Notes to Consolidated Financial Statements for more information on goodwill impairment. The purchase price allocation is final.Fiscal Year 2007 Acquisition:On February 15, 2007, the Company completed the acquisition of Reptron. The operating results of this acquisition are included in the Company's consolidated financial statements beginning on the acquisition date.The acquisition is included in the Company's EMS segment and increased the Company's capabilities and expertise in support of the Company's long-term strategy to grow business in the medical electronics and high-end industrial sectors. The acquisition included four manufacturing operations located in Tampa, Florida; Hibbing, Minnesota; Gaylord, Michigan; and Fremont, California. In fiscal year 2008, pursuant to its restructuring plans, the Company ceased operations at the Gaylord, Michigan, and Hibbing, Minnesota, facilities and transferred a majority of the business to several of the Company's other worldwide EMS facilities.The total amount of funds required to consummate the merger and to pay fees related to the merger was $50.9 million. The merger was funded with available cash and short-term investments. Merger funds were used to purchase all outstanding Reptron stock for $3.8 million, repay outstanding indebtedness and accrued interest of $17.6 million, tender senior secured notes for $22.4 million at acquisition date plus $4.8 million of senior secured notes and accrued interest redeemed in fiscal year 2008, and pay direct acquisition costs of $2.3 million.The following table summarizes the final purchase price allocation to assets acquired, liabilities assumed, and goodwill. The acquisition resulted in $11.9 million of goodwill for the EMS segment of the Company. Goodwill of $10.1 million is deductible for tax purposes. The Company also identified and recorded intangible assets of $0.9 million related to customer relationships. See Note 1 - Summary of Significant Accounting Policies of Notes to Consolidated Financial Statements for further disclosure related to goodwill and intangible assets. The purchase price allocation is final.(Amounts in Thousands)Reptron Acquisition Purchase Price AllocationAccounts Receivable$13,218Inventory24,948Deferred Tax Asset1,130Other Current Assets1,173Property and Equipment18,380Customer Relationship Intangible Asset937Other Long-Term Assets339Goodwill11,876 Total assets acquired$72,001Accounts Payable$16,584Accrued Expenses3,547Accrued Restructuring767Other Liabilities184 Total liabilities assumed$21,082 Net assets acquired$50,919Note 3 Inventories14%10% and 17%11% of consolidated inventories at June 30, 20092012 and June 30, 2008,2011, respectively, including approximately 83%78% and 85%81% of the Furniture segment inventories at June 30, 20092012 and June 30, 2008,2011, respectively. The EMS segment inventories and the remaining inventories in the Furniture segment are valued using the lower of first-in, first-out (FIFO) cost or market value.Had the FIFO method been used for all inventories, income from continuing operations would have been $2.4$0.4 millionlower in fiscal year 2009, $1.12012, $0.2 millionhigher in fiscal year 2008,2011, and $0.1$0.8 million higherlower in fiscal year 2007.2010. Certain inventory quantity reductions caused liquidations of LIFO inventory values, which increased income from continuing operations by $2.5$1.8 million in fiscal year 2009, $0.12012, $0.9 million in fiscal year 2008,2011, and $1.1$1.3 million in fiscal year 2007.2010.43Inventory components at June 30 arewere as follows:(Amounts in Thousands) Finished products $ 35,530 $ 42,201 Work-in-process 11,752 14,363 Raw materials 93,999 126,583 Total FIFO inventory $141,281 $183,147 LIFO Reserve (14,277) (18,186) Total inventory $127,004 $164,961 52(Amounts in Thousands) 2012 2011 Finished products $ 26,552 $ 33,287 Work-in-process 12,582 11,734 Raw materials 91,105 109,337 Total FIFO inventory $ 130,239 $ 154,358 LIFO reserve (12,558 ) (13,261 ) Total inventory $ 117,681 $ 141,097 Note 43 Property and EquipmentMajor classes of property and equipment at June 30 consist of the following:(Amounts in Thousands) 2008 Land $ 9,399 $ 9,472 Buildings and improvements 167,997 171,249 Machinery and equipment 331,139 326,136 Construction-in-progress 29,940 23,123 Total $ 538,475 $ 529,980 Less: Accumulated depreciation (338,001) (340,076) Property and equipment, net $ 200,474 $ 189,904 (Amounts in Thousands) 2012 2011 Land $ 12,050 $ 12,849 Buildings and improvements 175,574 184,684 Machinery and equipment 350,995 349,489 Construction-in-progress 5,288 9,765 Total $ 543,907 $ 556,787 Less: Accumulated depreciation (357,808 ) (360,105 ) Property and equipment, net $ 186,099 $ 196,682 The useful lives used in computing depreciation are based on the Company's estimate of the service life of the classes of property, as follows: Years Buildings and improvements 5 to 50 Machinery and equipment 2 to 20 Leasehold improvements Lesser of Useful Life or Term of Lease Depreciation and amortization of property and equipment, from continuing operations, including asset write-downs associated with the Company's restructuring plans, totaled, in millions, $33.9$28.9 for fiscal year 2009, $34.02012, $29.0 for fiscal year 2008,2011, and $31.7$32.5 for fiscal year 2007.2010.During fiscal year 2012, the Furniture segment recognized impairment of $78, in thousands, related to equipment for a product line with volumes much lower than originally forecasted, which was included in the Cost of Sales line on the Company's Consolidated Statements of Income.Due to a decline in the market value of a held for sale EMS facility, the Company recognized in Unallocated Corporate a pre-tax impairment loss, in thousands, of $572 during fiscal year 2012, which was included in the Restructuring Expense line on the Company's Consolidated Statements of Income.At June 30, 2009,2012, in thousands, assets totaling $1,358$1,709 were classified as held for sale, and consisted of $1,160$588 for a facility and land related to the Gaylord, Michigan exited operation within the EMS segment and $198$1,121 for equipment related to previously held timberlands. All of these assetsan idle Furniture segment manufacturing facility and land located in Jasper, Indiana. The Gaylord, Michigan facility and land were reported as unallocated corporate assets for segment reporting purposes. The Company expects to sell theseidle Jasper, Indiana manufacturing facility and land were reported as Furniture segment assets during the next 12 months.Due to a decline in the market value of the held for sale EMS facility, the Company recognized a pre-tax impairment loss, in thousands, of $214 during fiscal year 2009. The impairment was recorded on the Restructuring Expense line item of the Company's Consolidated Statements of Income. The fair value of the assets was determined by prices for similar assets.During fiscal year 2009,2012, the Company decided to sell its undevelopedsold a tract of land holdings and timberlands usingin Poland which was previously classified as held for sale. The sale had an auction approach. The undeveloped land holdings and timberlands were includedimmaterial effect on the Other Assets line item of the Company's consolidated financial statements.At June 30, 2008 Consolidated Balance Sheet. As a result of the auction, the Company recognized a pre-tax gain, in thousands, of $31,489, which was recorded on the Other General Income line item of the Company's Consolidated Statements of Income. In addition, in thousands, $244 of equipment related to the timberlands was sold during fiscal year 2009. The Company recognized an immaterial gain on the sale of this equipment.At June 30, 2008,2011$1,374$2,807 classified as held for sale.44Note 54 Commitments and Contingent LiabilitiesLeases:Leases: from continuing operations for certain office, showroom, manufacturing facilities, land, and equipment, which expire from fiscal year 20102013 to 2056, contain provisions under which minimum annual lease payments are, in millions, $3.4, $3.3, $2.6, $1.7,$3.5, $2.5, $1.7, $0.9, and $1.4$0.4 for the five years ended June 30, 2014,2017, respectively, and aggregate $2.7$0.5 million from fiscal year 20152018 to the expiration of the leases in fiscal year 2056.2056. The Company is obligated under certain real estate leases to maintain the properties and pay real estate taxes. Certain of these leases include renewal options and escalation clauses. Total rental expenses from continuing operations amounted to, in millions, $6.1, $7.8,$4.8, $6.2, and $6.5$5.4 in fiscal years 2009, 2008,2012, 2011, and 2007,2010, respectively, including certain leases requiring contingent lease payments based on warehouse space utilized, which amounted to expense of, in millions, $0.4, $0.5, and $0.4 in fiscal years 2012, 2011, and 2010, respectively.As of June 30, 2009,2012 and 2011, the Company had no capitalized capital leases.Guarantees:As of June 30, 2008,2012 and 2011, the Company had in millions, $0.4 of capitalized leases for equipment.Guarantees:noAs of June 30, 2009 and 2008, the Company had no guarantees issued which were contingent on the future performance of another entity. Standby letters of credit are issued to third-party suppliers, lessors, and insurance and financial institutions and can only be drawn upon in the event of the Company's failure to pay its obligations to the beneficiary. As of June 30, 2009 and 2008, theThe Company had a maximum financial exposure from unused standby letters of credit totaling approximately $5.0$4.3 million as of June 30, 2012 and $5.1$5.2 million respectively. as of June 30, 2011. The Company is not aware of circumstances that would require it to perform under any of these arrangements and believes that the resolution of any claims that might arise in the future, either individually or in the aggregate, would not materially affect the Company's financial statements. Accordingly, no liability has been recorded as of June 30, 20092012 and 20082011 with respect to the standby letters of credit. The Company also enters into commercial letters of credit to facilitate payments to vendors and from customers.Product Warranties:The Company estimates product warranty liability at the time of sale based on historical repair cost trends in conjunction with the length of the warranty offered. Management refines the warranty liability in cases where specific warranty issues become known.Changes in the product warranty accrual during fiscal years 2009, 2008,2012, 2011, and 20072010 were as follows:(Amounts in Thousands) 2009 2008 2007 Product Warranty Liability at the beginning of the year $ 1,470 $ 2,147 $ 2,127 Accrual for warranties issued 1,311 446 961 Accruals (reductions) related to pre-existing warranties (including changes in estimates) 509 (166) (47) Settlements made (in cash or in kind) (1,114) (957) (894) Product Warranty Liability at the end of the year $ 2,176 $ 1,470 $ 2,147 (Amounts in Thousands) 2012 2011 2010 Product Warranty Liability at the beginning of the year $ 2,109 $ 1,818 $ 2,176 Additions to warranty accrual (including changes in estimates) 1,019 1,060 59 Settlements made (in cash or in kind) (877 ) (769 ) (417 ) Product Warranty Liability at the end of the year $ 2,251 $ 2,109 $ 1,818 (2) The credit facility for the EMS segment operation in Poland allows for multi-currency borrowings up to a 6 million Euro equivalent (approximately $7.6 million U.S. dollars at June 30, 2012 exchange rates) and is available to cover bank overdrafts. Bank overdrafts may be deemed necessary to satisfy short-term cash needs at the Company's Poland location rather than funding from intercompany sources. This credit facility is reviewed for renewal annually and can be canceled at any time by either the bank or the Company. Interest on the overdraft is charged at 1.75% over the Euro Overnight Index Average (EONIA).As of both June 30, 2009, the Company had $12.7 million of2012 and 2011, there were no outstanding short-term borrowings outstanding. The Company utilized a Euro currency borrowing which provides a natural currency hedge against Euro denominated intercompany notes between the US parent and the Euro functional currency subsidiaries. The Company also had approximately $5.0 million in letters of credit against the credit facility. There were no borrowings outstanding under the separate Thailand credit facility which is backed by the $100 million credit facility. Total availability to borrow under the $100 million credit facility was $82.3 million at June 30, 2009. At June 30, 2008, the Company had $52.6 million of short-term borrowings outstanding under the credit facility.The Company also has a credit facility for its EMS segment operation in Wales, United Kingdom. The facility will be reviewed in November 2009 and can be terminated by either the bank or the Company at any time. The facility is comprised of an overdraft facility which allows for multi-currency borrowings up to 2 million Sterling equivalent (approximately $3.3 million US dollars at June 30, 2009 exchange rates) and an engagement facility of 3.5 million Sterling equivalent (approximately $5.8 million US dollars at June 30, 2009 exchange rates), which can be used only for payment of customs, duties, or value-added taxes in the event of the Company's failure to pay its obligations. Bank overdrafts may be deemed necessary to satisfy short-term cash needs rather than funding from intercompany sources. The interest rate applicable to the Sterling overdraft facility is charged at 2% per annum over the Bank of England's Sterling Base Rate. The interest rate applicable to the engagement facility is determined by the bank at the time a drawing request is made. The Company had no borrowings outstanding under this credit facility at June 30, 2009 and 2008.During fiscal year 2009, the Company entered into a credit facility for its EMS segment operation in Poznan, Poland, which allows for multi-currency borrowings up to 6 million Euro equivalent (approximately $8.5 million U.S. dollars at June 30, 2009 exchange rates) and is available to cover bank overdrafts. Bank overdrafts may be deemed necessary to satisfy short-term cash needs at the Company's Poznan location rather than funding from intercompany sources. Interest on the overdraft is charged at 1% over the Euro Overnight Index Average (EONIA). This overdraft facility can be cancelled at any time by either the bank or the Company. At June 30, 2009, the Company had no borrowings outstanding under this overdraft facility.As of June 30, 2009 and 2008, the weighted average interest rates on the Company's short-term borrowings outstanding under the credit facilities were 1.46% and 4.99%, respectively.borrowings. Cash payments for interest on borrowings were, in thousands, $1,807, $2,197,$889,$203, in fiscal years 2009, 2008,2012, 2011, and 2007,2010, respectively. Capitalized interest expense was not materialimmaterial during fiscal years 2009, 2008,2012, 2011, and 2007.2010.Note 76 Employee Benefit PlansRetirement Plans:The Company has a trusteed defined contribution retirement plan in effect for substantially all domestic employees meeting the eligibility requirements. The plan includes a 401(k) feature, thereby permitting participants to make additional voluntary contributions on a pre-tax basis. Payments by the Company to the trusteed plan have a five-year vesting schedule and are held for the sole benefit of participants. The Company also maintains a trusteed defined contribution retirement plan for employees of acquired companies.The Company maintains a supplemental employee retirement plan (SERP) for executive employees which enable them to defer cash compensation on a pre-tax basis in excess of IRS limitations. The SERP is structured as a rabbi trust, and therefore assets in the SERP portfolio are subject to creditor claims in the event of bankruptcy.Company contributions for domestic employees are based on a percent of net income with certain minimum and maximum limits as determined annually by the Compensation and Governance Committee of the Board of Directors. There was no employer contribution to the retirement plans during fiscal year 2009. Total expense related to employer contributions to the domestic retirement plans was, $5.8 millionin millions, $5.3, $5.0, and $4.5 for each of fiscal years 20082012, 2011, and 2007.2010, respectively.Employees of certain foreign subsidiaries are covered by local pension or retirement plans. Total expense related to employer contributions to these foreign plans for 2009, 2008,fiscal years 2012, 2011, and 20072010 was, in millions, $0.7, $1.0,$0.3, $0.5, and $0.9,$0.6, respectively.46Severance Plans:The Company maintains severance plans for all domestic employees. The plans,employees which were initiated at the end of fiscal year 2007, provide severance benefits to eligible employees meeting the plans' qualifications, primarily involuntary termination without cause. There are no statutory requirements for the Company to contribute to the plans, nor do employees contribute to the plans. The plans hold no assets. Benefits are paid using available cash on hand when eligible employees meet plan qualifications for payment. Benefits are based upon an employee's years of service and accumulate up to certain limits specified in the plans and include both salary and an allowance for medical benefits. The components and changes in the Benefit Obligation, Accumulated Other Comprehensive Income (Loss), and Net Periodic Benefit Cost are as follows:(Amounts in Thousands) 2009 2008 Changes and Components of Benefit Obligation: Benefit obligation at beginning of year $ 2,177 $ 2,200 Service cost 432 282 Interest cost 205 120 Actuarial loss for the period 3,854 130 Benefits paid (1,199) (555) Benefit obligation at end of year $ 5,469 $ 2,177 Balance in current liabilities $ 643 $ 283 Balance in noncurrent liabilities 4,826 1,894 Total benefit obligation recognized in the Consolidated Balance Sheets $ 5,469 $ 2,177 Changes and Components in Accumulated Other Comprehensive Income (Loss) (before tax): Accumulated Other Comprehensive Income (Loss) at beginning of year $ 2,027 $ 2,200 Net change due to unrecognized actuarial loss 3,336 113 Change due to unrecognized prior service cost (285) (286) Accumulated Other Comprehensive Income (Loss) at end of year $ 5,078 $ 2,027 Balance in unrecognized actuarial loss $ 3,450 $ 113 Balance in unrecognized prior service cost 1,628 1,914 Total accumulated other comprehensive income (loss) recognized in Share Owners' Equity $ 5,078 $ 2,027 Components of Net Periodic Benefit Cost (before tax): Service cost $ 432 $ 282 Interest cost 205 120 Amortization of prior service cost 285 286 Amortization of actuarial loss 517 17 Net periodic benefit cost recognized in the Consolidated Statements of Income $ 1,439 $ 705 June 30 (Amounts in Thousands) 2012 2011 Changes and Components of Benefit Obligation: Benefit obligation at beginning of year $ 5,073 $ 5,900 Service cost 811 934 Interest cost 189 264 Actuarial (gain) loss for the period (1,265 ) (1,501 ) Benefits paid (88 ) (524 ) Benefit obligation at end of year $ 4,720 $ 5,073 Balance in current liabilities $ 828 $ 890 Balance in noncurrent liabilities 3,892 4,183 Total benefit obligation recognized in the Consolidated Balance Sheets $ 4,720 $ 5,073 June 30 (Amounts in Thousands) 2012 2011 Changes and Components in Accumulated Other Comprehensive Income (Loss) (before tax): Accumulated Other Comprehensive Income (Loss) at beginning of year $ 2,771 $ 5,332 Change in unrecognized prior service cost (286 ) (286 ) Net change in unrecognized actuarial loss (1,898 ) (2,275 ) Accumulated Other Comprehensive Income (Loss) at end of year $ 587 $ 2,771 Balance in unrecognized prior service cost $ 771 $ 1,057 Balance in unrecognized actuarial (gain) loss (184 ) 1,714 Total Accumulated Other Comprehensive Income (Loss) recognized in Share Owners' Equity $ 587 $ 2,771 (Amounts in Thousands) Year Ended June 30 Components of Net Periodic Benefit Cost (before tax): 2012 2011 2010 Service cost $ 811 $ 934 $ 854 Interest cost 189 264 408 Amortization of prior service cost 286 286 285 Amortization of actuarial (gain) loss 633 774 753 Net periodic benefit cost recognized in the Consolidated Statements of Income $ 1,919 $ 2,258 $ 2,300 The significant increase in the benefit obligation was a result of an increase in the historical rate of severance payments used to project future severance eligible terminations. The benefit cost in the above table includes only normal recurring levels of severance activity, as estimated using an actuarial method and management judgment. Unusual or nonrecurringnon-recurring severance actions, such as those disclosed in Note 1817 - Restructuring Expense of Notes to Consolidated Financial Statements, are not estimable using actuarial methods and are expensed when incurred.in accordance with the applicable U.S. GAAP.The Company amortizes prior service costs on a straight-line basis over the average remaining service period of employees that were active at the time of the plan initiation and amortizes actuarial losses(gain) loss on a straight-line basis over the average47remaining service period of employees expected to receive benefits under the plan.The estimated actuarial net loss and prior service cost and actuarial net (gain) loss for the severance plans that will be amortized from accumulated other comprehensive income (loss) into net periodic benefit cost over the next fiscal year are, pre-tax in thousands, $406$286 and $286,$(32), respectively. Discount Rate 6.6% 5.5% Rate of Compensation Increase 3.0% 5.0% 2012 2011 Discount Rate 3.3% 4.8% Rate of Compensation Increase 4.0% 4.0% Weighted average assumptions used to determine fiscal year net periodic benefit costs are as follows: Discount Rate 5.9% 5.5% Rate of Compensation Increase 4.5% 5.0% 2012 2011 2010 Discount Rate 4.1% 5.0% 6.2% Rate of Compensation Increase 4.0% 4.0% 3.3% Note 87 Stock Compensation PlansOn August 19, 2003, the Board of Directors adopted the 2003 Stock Option and Incentive Plan (the "2003 Plan"), which was approved by the Company's Share Owners on October 21, 2008. Under the 2003 Plan, 2,500,000 shares of Common Stock were reserved for restricted stock, restricted share units, unrestricted share grants, incentive stock options, nonqualified stock options, performance shares, performance units, and stock appreciation rights for grant to officers and other key employees of the Company and to members of the Board of Directors who are not employees. The 2003 Plan is a ten-year plan. The Company also has stock options outstanding under a former stock incentive plan, which is described below. The pre-tax compensation cost that was charged against income from continuing operations for all of the plans was $2.1$1.4 million $4.0, $1.3 million, and $4.9$1.8 million in fiscal year 2009, 2008,2012, 2011, and 2007,2010, respectively. The total income tax benefit from continuing operations for stock compensation arrangements was $0.9$0.6 million $1.6, $0.5 million, and $1.9$0.7 million in fiscal year 2009, 2008,2012, 2011, and 2007,2010, respectively. The Company generally uses treasury shares for fulfillment of option exercises and issuance of performance shares, and conversion of restricted share units.Performance Shares:The Company awards performance shares to officers and other key employees under the 2003 Plan. Under these awards, a number of shares will be grantedissued to each participant based upon the attainment of the applicable bonus percentage calculated under the Company's profit sharing incentive bonus plan as applied to a total potential share award made and approved by the Compensation and Governance Committee. Performance shares are vested when issued shortly after the end of the fiscal year in which the performance measurement period is complete and are issued as Class A and Class B common shares. Certain outstanding performance shares are applicable to performance measurement periods in future fiscal years and will be measured at fair value when the performance targets are established in future fiscal years. The contractual life of performance shares ranges from one yearto five years.years. If a participant is not employed by the Company on the date of issuance,shares are issued, the performance share award is forfeited, except in the case of death, retirement at age 62 or older, total permanent disability, or certain other circumstances described in the Company's employment policy. Additionally, to the extent performance conditions are not fully attained, performance shares are forfeited.A summary of performance share activity under the 2003 Plan during fiscal year 20092012 is presented below: Number
of Shares Weighted Average
Grant Date
Fair ValuePerformance shares outstanding at July 1, 2008 759,052 $12.16 Granted 446,645 10.37 Vested (109,197) 12.17 Forfeited (188,465) 12.09 Performance shares outstanding at June 30, 2009 908,035 $10.39 Numberof Shares Weighted AverageGrant DateFair ValuePerformance shares outstanding at July 1, 2011 1,563,278 $5.10 Granted 800,150 $5.46 Vested (187,915 ) $5.09 Forfeited (430,113 ) $5.09 Performance shares outstanding at June 30, 2012 1,745,400 $5.45 As of June 30, 2009,2012, there was approximately $1.2$2.5 million of unrecognized compensation cost related to performance shares,48based on the latest estimated attainment of performance goals. That cost is expected to be recognized over annual performance periods ending August 20092012 through August 2013,2016, with a weighted average vesting period of 1.6 years.one year, six months. The fair value of performance shares is based on the stock price at the date of award,grant, reduced by the present value of dividends normally paid over the vesting period which are not payable on outstanding performance share awards. The weighted average grant date fair value was $10.37; $12.16;$5.46; $5.10; and $17.42$6.25 for performance share awards granted in fiscal year 2009, 2008,2012, 2011, and 2007,2010, respectively. During fiscal year 2009, 2008,2012, 2011, and 2007,2010, respectively, 109,197; 201,598;187,915; 141,049; and 150,651140,832 performance shares vested at a fair value of $1.3$1.0 million $3.4, $0.9 million, and $1.8 million.$1.1 million. These shares are the total number of shares vested, prior to the reduction of shares withheld to satisfy tax withholding obligations. The number of shares presented in the above table, the amounts of unrecognized compensation, and the weighted average period include performance shares awarded that are applicable to future performance measurement periods and will be measured at fair value when the performance targets are established in future fiscal years.Restricted Share Units:Nonvested Restricted Share Units (RSU) awarded to officers and other key employees are currently outstanding under the 2003 Plan. RSUs vest five years after the date of award. Upon vesting, the outstanding number of RSUs and the value of dividends accumulated over the vesting period are converted to shares of Class A and Class B common stock. If the employment of a holder of an RSU terminates before the RSU has vested for any reason other than death, retirement at age 62 or older, total permanent disability, or certain other circumstances described in the Company's employment policy, the RSU and accumulated dividends will be forfeited.A summary of RSU activity under the 2003 Plan during fiscal year 2009 is presented below: Number of
Share Units Weighted Average
Grant Date
Fair ValueRestricted Share Units outstanding at July 1, 2008 480,900 $15.77 Granted -0- -0- Vested (239,250) 17.29 Forfeited (1,700) 15.95 Restricted Share Units outstanding at June 30, 2009 239,950 $14.25 As of June 30, 2009, there was approximately $0.4 million of unrecognized compensation cost related to nonvested RSU compensation arrangements awarded under the 2003 Plan. That cost is expected to be recognized over a weighted average period of 0.6 years. The fair value of RSU awards is based on the stock price at the date of award. The total fair value of RSU awards vested during fiscal year 2009, 2008, and 2007 was, in thousands, $4,137, $233, and $24, respectively.Under the 2003 Plan, unrestricted shares may be granted to participantsemployees and members of the Board of Directors as consideration for service to the Company. Unrestricted share grants do not have vesting periods, holding periods, restrictions on sale, or other restrictions. The fair value of unrestricted shares is based on the stock price at the date of the award. During fiscal year 2009, 2008,2012, 2011, and 2007,2010, respectively, the Company granted a total of 29,545; 13,186;22,187; 46,977; and 7,66819,662 unrestricted shares of Class B common stock at an average grant date fair value of $6.45, $13.16,$5.95, $6.71, and $24.53,$7.63, for a total fair value of $0.2$0.1 million $0.2, $0.3 million and $0.2 million.$0.2 million. These shares are the total number of shares granted, prior to the reduction of shares withheld to satisfy tax withholding obligations. These shares were issuedawarded to non-employee members of the Board of Directors as compensation for director's fees, as a result of directors' elections to receive unrestricted shares in lieu of cash payment, andpayment. Director's fees are expensed over the period that directors earn the compensation. Other unrestricted shares were awarded to officers ofas consideration for their service to the Company.
Restricted Share Units:Restricted Share Units (RSU) were awarded to officers and other key employees under the 2003 Plan in fiscal years prior to fiscal year 2012. As of June 30, 2012, there was no unrecognized compensation cost related to RSU compensation arrangements awarded under the 2003 Plan as all RSU's had vested. The total fair value of RSU awards vested during fiscal year 2012, 2011, and 2010 was, in millions, $0, $0, and $3.4, respectively.Stock Options:The Company has stock options outstanding under a former stock incentive plan. The 1996 Stock Incentive Program, which was approved by the Company's Share Owners on October 22, 1996, allowed the issuance of incentive stock options, nonqualified stock options, stock appreciation rights, and performance share awards to officers and other key employees of the Company and to members of the Board of Directors who are not employees. The 1996 Stock Incentive Program will continue to have options outstanding through fiscal year 2013. The 1996 Directors' Stock Compensation and Option Plan, available to all members of the Board of Directors, was approved by the Company's Share Owners on October 22, 1996. Under the terms of that plan, Directors electing to receive all, or a portion, of their fees in the form of Company stock were also granted a number of stock options equal to 50% of the number of shares received for compensation of fees. All outstanding shares under the Directors' Stock Compensation and Option Plan expired during fiscal year 2009. No shares remain available for new grants under the Company's prior stock option plans.There were no stock option grants awarded during fiscal years 2009, 2008,2012, 2011, and 2007.2010. For outstanding awards, the fair value at the date of the grant was estimated using the Black-Scholes option pricing model. Options outstanding are exercisable one to five years after the date of grant and expire ten years after the date of grant. Stock options are forfeited when employment terminates, except in the case of retirement at age 62 or older, death, permanent disability, or certain other circumstances described in the Company's employment policy.49A summary of stock option activity during fiscal year 20092012 is presented below: Number of
Shares Weighted Average
Exercise
Price Weighted Average
Remaining
Contractual Life Aggregate
Intrinsic
ValueOptions outstanding at July 1, 2008 779,162 $15.45 Granted -0- -0- Exercised -0- -0- Forfeited (4,500) 15.06 Expired (27,144) 18.12 Options outstanding at June 30, 2009 747,518 $15.36 2.9 years $ -0- Options vested 747,518 $15.36 2.9 years $ -0- Options exercisable at June 30, 2009 747,518 $15.36 2.9 years $ -0- Number ofShares Weighted AverageExercisePrice Weighted AverageRemainingContractual Life AggregateIntrinsicValueOptions outstanding at July 1, 2011 619,585 $15.10 Granted — $— Exercised — $— Forfeited (1,500 ) $15.06 Expired (139,585 ) $15.24 Options outstanding at June 30, 2012 478,500 $15.06 4 months $— Options vested and exercisable at June 30, 2012 478,500 $15.06 4 months $— No options were exercised during fiscal years 20092012, 2011, and 2008. The total intrinsic value of options exercised during fiscal year 2007 was $5.8 million. The value of existing shares held by employees was used to exercise stock options. The actual tax benefit realized for the tax deductions from option exercises totaled $1.9 million for fiscal year 2007.2010.Note 98 Income TaxesDeferred income taxes reflect the net tax effect of temporary differences between the carrying amounts of assets and liabilities for financial reporting purposes and the amounts used for income tax purposes. Income tax benefits associated with net operating losses of, in thousands, $4,582$5,698 expire from fiscal year 2013 to 2029.2034. Income tax benefits associated with tax credit carryforwards of, in thousands, $3,506,$2,734, expire from fiscal year 2016 to 2022.2026. As of June 30, 2012, the Company was in a cumulative three-year domestic income position, after adjustment for permanent items. In evaluating whether a valuation allowance was warranted for the U.S. federal net deferred tax asset as of June 30, 2012, management weighed both positive and negative evidence and determined that it was more likely than not that all of the deferred tax asset would be realized, and accordingly, a valuation allowance for the U.S. federal net deferred tax asset was not required. A valuation reserve was provided as of June 30, 20092012 for deferred tax assets relating to certain foreign and state net operating losses of, in thousands, $1,573, certain state tax credit carryforwards of, in thousands, $3,407,$1,761, and, in thousands, $152$150 related to other deferred tax assets that the Company currently believes are more likely than not to remain unrealized in the future. During fiscal year ended June 30, 2012, the valuation reserve was reduced primarily due to the expiration of a state tax credit.50 The components of the deferred tax assets and liabilities as of June 30, 2012 and 2011, were as follows:The components of the deferred tax assets and liabilities as of June 30, 2009 and 2008, were as follows: (Amounts in Thousands) 2009 2008 Deferred Tax Assets: Receivables $ 3,451 $ 1,680 Inventory 2,833 2,606 Employee benefits 2,840 3,022 Deferred compensation 8,114 8,146 Restricted share units 1,565 2,573 Other current liabilities 1,031 1,443 Warranty reserve 868 586 Credit carryforwards 3,506 3,564 Restructuring 4,900 5,467 Goodwill 5,010 (58) Net operating loss carryforward 4,582 4,166 Miscellaneous 3,317 2,201 Valuation Allowance (5,132) (4,966) Total asset $ 36,885 $ 30,430 Deferred Tax Liabilities: Property & equipment $ 7,293 $ 7,298 Capitalized software 128 64 Foreign currency gains and losses 1,600 -0- Miscellaneous 833 730 Total liability $ 9,854 $ 8,092 Net Deferred Income Taxes $ 27,031 $ 22,338 The components of income (loss) from continuing operations before taxes on income are as follows: Year Ended June 30 (Amounts in Thousands) 2009 2008 2007 United States $ 30,658 $ (2,605) $ 38,576 Foreign (5,332) 241 (2,224) Total income (loss) from continuing operations before income taxes on income $ 25,326 $ (2,364) $ 36,352 (Amounts in Thousands) 2012 2011 Deferred Tax Assets: Receivables $ 1,492 $ 1,420 Inventory 2,009 2,409 Employee benefits 640 608 Deferred compensation 12,885 12,092 Other current liabilities 1,313 1,583 Warranty reserve 767 698 Credit carryforwards 2,734 6,272 Restructuring 107 3,173 Goodwill 3,510 4,011 Net operating loss carryforward 5,698 5,749 Miscellaneous 4,322 2,698 Valuation Allowance (1,911 ) (6,698 ) Total asset $ 33,566 $ 34,015 Deferred Tax Liabilities: Property & equipment $ 10,075 $ 6,986 Capitalized software 62 115 Net foreign currency gains — 1,677 Miscellaneous 494 597 Total liability $ 10,631 $ 9,375 Net Deferred Income Taxes $ 22,935 $ 24,640 The provision (benefit) for income taxes from continuing operations is composed of the following items: Year Ended June 30 (Amounts in Thousands) 2009 2008 2007 Currently Payable: Federal $ 9,457 $ 2,355 $ 16,185 Foreign 1,521 934 553 State 1,713 815 2,897 Total current 12,691 4,104 19,635 Deferred Taxes: Federal (2,554) (4,200) (5,303) Foreign (1,294) (698) (488) State (845) (1,648) (758) Total deferred (4,693) (6,546) (6,549) Total provision (benefit) for income taxes from continuing operations $ 7,998 $ (2,442) $ 13,086 A reconciliation of the statutory U.S. income tax rate from continuing operations to the Company's effective income tax rate follows: Year Ended June 30 2009 2008 2007 (Amounts in Thousands) Amount % Amount % Amount % Tax computed at U.S. federal statutory rate $ 8,864 35.0% $ (827) 35.0% $ 12,723 35.0% State income taxes, net of federal income tax benefit 565 2.2 (542) 22.9 1,420 3.9 Foreign tax effect 2,093 8.3 151 (6.4) 843 2.3 Tax-exempt interest income (559) (2.2) (692) 29.3 (1,201) (3.3) Domestic manufacturing deduction 86 0.3 (214) 9.1 (323) (0.9) Research credit (753) (3.0) (604) 25.5 (686) (1.9) Foreign subsidiary bad debt deduction (2,411) (9.5) -0- -0- -0- -0- Other - net 113 0.5 286 (12.1) 705 2.0 Resolution of IRS audit -0- -0- -0- -0- (395) (1.1) Total provision (benefit) for income taxes from
continuing operations $ 7,998 31.6% $ (2,442) 103.3% $ 13,086 36.0% Cash payments for income taxes, net of refunds, were in thousands, $2,848, $8,456, and $14,599 in fiscal years 2009, 2008, and 2007, respectively. In 2006, Year Ended June 30 (Amounts in Thousands) 2012 2011 2010 United States $ 7,831 $ (2,966 ) $ (8,434 ) Foreign 9,871 7,403 14,402 Total income before income taxes on income $ 17,702 $ 4,437 $ 5,968 Foreign unremitted earnings of entities not included in the FASB issued FIN 48, which clarifiesUnited States tax return have been included in the accounting for uncertainty in tax positions. FIN 48 requires that the Company recognize in itsconsolidated financial statements without giving effect to the impact of a tax position, ifUnited States taxes that positionmay be payable on distribution to the United States because it is more likely than not of being sustained on audit, based onanticipated such earnings will be remitted to the technical merits of the position.United States. The Company adopted the provisions of FIN 48 on July 1, 2007, the beginningaggregate unremitted earnings of the Company's fiscal year. Upon the adoptionforeign subsidiaries for which a deferred income tax liability has not been recorded was approximately $80.3 million as of FIN 48 on July 1, 2007, the Company recognized a $5.8 million increase in the liability for unrecognized tax benefits including interest and penalties. The increase was accounted for as a reduction to the July 1, 2007 balanceJune 30, 2012. Determination of retained earnings in the amount of $0.7 million and an increase tounrecognized deferred tax assetsliability on unremitted earnings is not practicable.51The provision (benefit) for income taxes is composed of $5.1 million. The total liabilitythe following items: Year Ended June 30 (Amounts in Thousands) 2012 2011 2010 Currently Payable (Refundable): Federal $ 954 $ (2,527 ) $ (6,768 ) Foreign 1,849 (130 ) 3,474 State 877 150 (305 ) Total current 3,680 (2,507 ) (3,599 ) Deferred Taxes: Federal 1,784 1,090 1,407 Foreign 970 1,509 (1,553 ) State (366 ) (577 ) (1,090 ) Total deferred 2,388 2,022 (1,236 ) Total provision (benefit) for income taxes $ 6,068 $ (485 ) $ (4,835 ) A reconciliation of the statutory U.S. income tax rate to the Company's effective income tax rate follows: Year Ended June 30 2012 2011 2010 (Amounts in Thousands) Amount % Amount % Amount % Tax computed at U.S. federal statutory rate $ 6,196 35.0 % $ 1,553 35.0 % $ 2,089 35.0 % State income taxes, net of federal income tax benefit 332 1.9 (277 ) (6.3 ) (907 ) (15.2 ) Foreign tax effect (639 ) (3.6 ) (1,213 ) (27.3 ) (3,120 ) (52.3 ) Tax-exempt interest income — — — — (169 ) (2.8 ) Research credit (247 ) (1.4 ) (751 ) (16.9 ) (674 ) (11.3 ) Foreign subsidiary land and building gain — — — — (2,236 ) (37.5 ) Other - net 426 2.4 203 4.6 182 3.1 Total provision (benefit) for income taxes $ 6,068 34.3 % $ (485 ) (10.9 )% $ (4,835 ) (81.0 )% Net cash payments (refunds) for unrecognized tax benefits totaled $6.4 million as of July 1, 2007.income taxes were, in thousands, $1,504, $(2,851), and $8,866 in fiscal years 2012, 2011, and 2010, respectively.20092012, 2011, and 20082010 were as follows:(Amounts in Thousands) 2009 2008 Beginning balance - July 1 $ 1,020 $ 5,617 Tax positions related to prior years: Additions 341 161 Reductions [1] -0- (4,737) Tax positions related to current year: Additions 985 70 Reductions (3) -0- Settlements (3) (13) Lapses in statute of limitations (175) (78) Ending balance - June 30 $ 2,165 $ 1,020 Portion that, if recognized, would reduce tax expense and effective tax rate $ 1,905 $ 730 [1] (Amounts in Thousands) 2012 2011 2010 Beginning balance - July 1 $ 2,499 $ 2,466 $ 2,165 Tax positions related to prior fiscal years: Additions 250 312 532 Reductions (84 ) (77 ) (130 ) Tax positions related to current fiscal year: Additions — 96 74 Reductions — (42 ) — Settlements — (74 ) (36 ) Lapses in statute of limitations (41 ) (182 ) (139 ) Ending balance - June 30 $ 2,624 $ 2,499 $ 2,466 Portion that, if recognized, would reduce tax expense and effective tax rate $ 2,190 $ 2,125 $ 2,097 52The $4.7 million reduction during fiscal year 2008 was due primarilyCompany recognizes interest and penalties related to the IRS approving Form 3115 Application for Change in Accounting Method. The approval of Form 3115 eliminated the need for an unrecognized tax benefit liability. The reductionbenefits in the liability resulted in a corresponding adjustment to deferred tax assets.(Amounts in Thousands) As of
June 30, 2009 As of
June 30, 2008 As of
July 1, 2007Accrued Interest and Penalties: Interest $ 344 $ 341 $ 674 Penalties 146 159 151 As of June 30 (Amounts in Thousands) 2012 2011 2010 Accrued Interest and Penalties: Interest $ 256 $ 230 $ 311 Penalties 85 86 117 Accrued interest and penalties are not included in the tabular roll forward of unrecognized tax benefits above. The Company recognizes interest and penalties accrued related to unrecognized tax benefits as Interest expense and Non-operating expense, respectively, under the Other Income (Expense) category on the Consolidated Statements of Income. Interest and penalties income/(expense) recognized for the fiscal years ended June 30, 20092012, 2011, and June 30, 20082010 were, in thousands, $10$(2), $107, and $325 income,$72, respectively.The Company, or one of its wholly-owned subsidiaries, files U.S. federal income tax returns and income tax returns in various state, local, and foreign jurisdictions. The Company is no longer subject to any significant U.S. federal tax examinations by tax authorities for years before fiscal year 2006.2008. The Company is subject to various state and local income tax examinations by tax authorities for years after June 30, 2002 and various foreign jurisdictions for years after June 30, 2003.2004. The Company does not expect the change in the amount of unrecognized tax benefits in the next 12 months to have a significant impact on the results of operations or the financial position of the Company.Note 109 Common StockOn a fiscal year basis, shares of Class B Common Stock are entitled to an additional $0.02$0.02 per share dividend more than the dividends paid on Class A Common Stock, provided that dividends are paid on the Company's Class A Common Stock. The owners of both Class A and Class B Common Stock are entitled to share pro-rata, irrespective of class, in the distribution of the Company's available assets upon dissolution.Owners of Class B Common Stock are entitled to elect, as a class, one member of the Company's Board of Directors. In addition, owners of Class B Common Stock are entitled to full voting powers, as a class, with respect to any consolidation, merger, sale, lease, exchange, mortgage, pledge, or other disposition of all or substantially all of the Company's fixed assets, or dissolution of the Company. Otherwise, except as provided by statute with respect to certain amendments to the Articles of Incorporation, the owners of Class B Common Stock have no voting rights, and the entire voting power is vested in the Class A Common Stock, which has one vote per share. The Habig families own directly or share voting power in excess of 50% of the Class A Common Stock of Kimball International, Inc. The owner of a share of Class A Common Stock may, at their option, convert such share into one share of Class B Common Stock at any time.During fiscal year 2008, cash payments for repurchases of Class B Common Stock were $24.8 million. With these repurchases, theNote 10 Fair ValueThe Company completed a previously authorized share repurchase program. Subsequent to the completion of the previously authorized share repurchase program, the Board of Directors authorized a plan which allows for the repurchase of up to an additional 2,000,000 shares of the Company's common stock.Note 11 Fair Value of Financial Assets and LiabilitiesIn September 2006, the FASB issued SFAS No. 157, Fair Value Measurements (FAS 157), which defines fair value, establishes a framework for measuring fair value, and expands disclosures about fair value measurements. The provisions of FAS 157 were effective for the Company as of July 1, 2008, however, the FASB deferred the effective date of FAS 157 until the beginning of the Company's fiscal year 2010, as it relates to fair value measurement requirements for non-financial assets and liabilities that are not measured at fair value on a recurring basis. Accordingly, the Company adopted FAS 157 for financialcategorizes assets and liabilities measured at fair value on a recurring basis at July 1, 2008. The adoption did not have a material impact on the Company's financial statements.The fair value framework as established in FAS 157 requires the categorization of assets and liabilities into three levels based upon the assumptions (inputs) used to price the assets or liabilities. Level 1 provides the most reliable measure of fair value, whereas Levellevel 3 generally requires significant management judgment. The three levels are defined as follows:Level 1: Unadjusted quoted prices in active markets for identical assets and liabilities.Level 2: Observable inputs other than those included in Level 1. For example, quoted prices for similar assets or liabilities in active markets or quoted prices for identical assets or liabilities in inactive markets.Level 3: Unobservable inputs reflecting management's own assumptions about the inputs used in pricing the asset or liability.Level 1: Unadjusted quoted prices in active markets for identical assets and liabilities.Level 2: Observable inputs other than those included in level 1. For example, quoted prices for similar assets or liabilities in active markets or quoted prices for identical assets or liabilities in inactive markets.Level 3: Unobservable inputs reflecting management's own assumptions about the inputs used in pricing the asset or liability.The Company's policy is to recognize transfers between these levels as of the end of each quarterly reporting period. There were no transfers between these levels during fiscal year 2012.53Financial Instruments Recognized at Fair ValueThe following methods and assumptions were used to measure fair value:Financial Instrument Level Valuation Technique/Inputs Used Cash Equivalents Market--Quoted1Market - Quoted market prices Available-for-sale securities: Municipal securitiesDerivative Assets: Foreign exchange contracts Market--Based on market data which use evaluated pricing models and incorporate available trade, bid, and other market informationDerivative Assets2 Market--BasedMarket - Based on observable market inputs using standard calculations, such as time value, forward interest rate yield curves, and current spot rates, considering counterparty credit riskNonqualifiedDerivative Assets: Stock warrants3 Market - Based on a probability-weighted Black-Scholes option pricing model with the following inputs (level 3 input values indicated in parenthesis): risk-free interest rate (0.69%), historical stock price volatility (97.1%) and weighted average expected term (4 years, 5 months). Enterprise value was estimated using a discounted cash flow calculation.Stock warrants are revalued and analyzed for reasonableness on a quarterly basis. The level 3 inputs used are the standard inputs used in the Black-Scholes model. Input values are based on publicly available information (Federal Reserve interest rates) and internally-developed information (historical stock price volatility of comparable investments) and remaining expected term of warrants.Significant increases (decreases) in the historical stock price volatility, expected life, and enterprise value in isolation would result in a significantly higher (lower) fair value measurement. The inputs do not have any interrelationships.Trading securities: Mutual funds held by nonqualified supplemental employee retirement plan assets Market--Quoted1Market - Quoted market prices Derivative LiabilitiesLiabilities: Foreign exchange contracts Market--Based2Market - Based on observable market inputs using standard calculations, such as time value, forward interest rate yield curves, and current spot rates adjusted for the Company's nonperformancenon-performance risk
Recurring Fair Value Measurements:As of June 30, 2009,2012 and 2011, the fair values of financial assets and liabilities that are measured at fair value on a recurring basis using the market approach are categorized as follows:$42,114 $ -0- $ -0- $42,114 -0- 25,376 -0- 25,376 -0- 784 -0- 784 10,992 -0- -0- 10,992 $53,106 $26,160 $ -0- $79,266 $ -0- $ 3,407 $ -0- $ 3,407 $ -0- $ 3,407 $ -0- $ 3,407 There June 30, 2012 (Amounts in Thousands) Level 1 Level 2 Level 3 Total Assets Derivatives: Foreign exchange contracts — 2,278 — 2,278 Derivatives: Stock warrants — — 911 911 Trading Securities: Mutual funds held by nonqualified supplemental employee retirement plan 16,922 — — 16,922 Total assets at fair value $ 16,922 $ 2,278 $ 911 $ 20,111 Liabilities Derivatives: Foreign exchange contracts $ — $ 799 $ — $ 799 Total liabilities at fair value $ — $ 799 $ — $ 799 54 June 30, 2011 (Amounts in Thousands) Level 1 Level 2 Level 3 Total Assets Cash equivalents $ 32,021 $ — $ — $ 32,021 Derivatives: Foreign exchange contracts — 1,044 — 1,044 Derivatives: Stock warrants — — 1,437 1,437 Trading Securities: Mutual funds held by nonqualified supplemental employee retirement plan 16,138 — — 16,138 Total assets at fair value $ 48,159 $ 1,044 $ 1,437 $ 50,640 Liabilities Derivatives: Foreign exchange contracts $ — $ 1,684 $ — $ 1,684 Total liabilities at fair value $ — $ 1,684 $ — $ 1,684 During fiscal year 2010, the Company purchased convertible debt securities of $2.3 million and stock warrants of $0.4 million of a privately-held company. During fiscal year 2011, the convertible debt securities experienced an other-than-temporary decline in fair market value resulting in a $1.2 million impairment loss and, upon a qualified financing, were no changessubsequently converted to non-marketable equity securities. The investment in non-marketable equity securities is accounted for as a cost-method investment and is included in the Company's valuation techniques or inputs used to measure fair values onFinancial Instruments Not Carried At Fair Value section that follows. The revaluation of stock warrants resulted in a recurring basis$1.0 million derivative gain as a result of adopting FAS 157.Disclosurethe qualified financing. During fiscal year 2012, the privately-held company experienced delays in their start-up, and therefore initiated another round of Otherfinancing that the Company chose not to participate in, which resulted in the automatic conversion of preferred shares and warrants to common shares and warrants. Upon the conversion, the equity securities and warrants were revalued, resulting in an impairment loss of $0.7 million on the equity securities and a $0.5 million derivative loss on the stock warrants during fiscal year 2012.See Note 11 - Derivative Instruments of Notes to Consolidated Financial InstrumentsStatements for further information regarding the stock warrants. See In additionNote 12 - Investments of Notes to Consolidated Financial Statements for further information regarding the methodsconvertible debt securities and assumptions usednon-marketable equity securities.The other changes in fair value of Level 3 investment assets during fiscal year 2012 were immaterial, and no purchases or sales of Level 3 assets occurred during the period.The nonqualified supplemental employee retirement plan (SERP) assets consist of equity funds, balanced funds, a bond fund, and a money market fund. The SERP investment assets are exactly offset by a SERP liability which represents the Company's obligation to recorddistribute SERP funds to participants. See Note 12 - Investments of Notes to Consolidated Financial Statements for further information regarding the SERP.Non-Recurring Fair Value Measurements:Certain assets are measured at fair value on a non-recurring basis. These assets are not measured at fair value on an ongoing basis, but are subject to fair value adjustments when events or circumstances indicate a significant adverse effect on the fair value of financial instruments as discussedthe asset. Assets that are written down to fair value when impaired are not subsequently adjusted to fair value unless further impairment occurs.Non-recurring fair value adjustment Level Valuation Technique/Inputs Used Impairment of assets held for sale (real estate) 3 Market - Probability-weighted cash flow calculation using estimated potential selling prices. Impairment of long-lived assets (intangible asset and property & equipment) 3 Market - Probability-weighted discounted cash flow calculation using estimated future cash flows. Due to a decline in the Fair Value Measurements section above, the following methods and assumptions were used to estimate the fairmarket value of financialthe held for sale EMS facility, the Company recognized a pre-tax impairment loss of $0.6 million during fiscal year 2012. Also during fiscal year 2012, the Company recognized impairment of, in millions, $0.3 and $0.1 related to intangible product rights and equipment, respectively, for a product line which is near the end of its production period.55Financial Instruments Not Carried At Fair Value:Financial instruments as required by SFAS No. 107, Disclosures About Fair Values of Financial Instruments. There were no changes in the methods or significant assumptions used in estimating fair value for the year ended June 30, 2009.Other financial instruments containedthat are not reflected in the Consolidated Balance Sheets whereat fair value that have carrying amounts which approximate fair value include the carrying amount approximates fair value:AssetsFinancial Instrument LiabilitiesCertain cash and cash equivalentsLevel Accounts payableValuation Technique/Inputs UsedReceivablesNotes receivable Borrowings under credit facilitiesOther assets not recorded at fair value2 Dividends payableMarket - Price approximated based on the assumed collection of receivables in the normal course of business, taking into account the customer's non-performance riskNon-marketable equity securities (cost-method investments, which carry shares at cost except in the event of impairment) Accrued expenses3Cost Method, with Impairment Recognized Using a Market-Based Valuation Technique - See the explanation below the table regarding the method used to periodically estimate the fair value of cost-method investments.In the event of impairment, the valuation is based on a probability-weighted Black-Scholes option pricing model with the following inputs (level 3 input values indicated in parenthesis): risk-free interest rate (0.69%), historical stock price volatility (97.1%) and weighted average expected term (4 years, 5 months). Enterprise value was estimated using a discounted cash flow calculation.
The level 3 inputs used are the standard inputs used in the Black-Scholes model. Input values are based on publicly available information (Federal Reserve interest rates) and internally-developed information (historical stock price volatility of comparable investments) and remaining expected holding period of securities.
Significant increases (decreases) in the historical stock price volatility, expected life, and enterprise value in isolation would result in a significantly higher (lower) fair value measurement. The inputs do not have any interrelationships.Long-term debt (carried at amortized cost) 3 Income - Price estimated using a discounted cash flow analysis based on quoted long-term debt market rates, taking into account the Company's non-performance risk TheInvestments in non-marketable equity securities are accounted for using the cost method if the Company does not have the ability to exercise significant influence over the operating and financial policies of the investee. On a periodic basis, but no less frequently than quarterly, these investments are assessed for impairment when there are events or changes in circumstances that may have a significant adverse effect on the fair value estimate for long-term debt, excluding capital leases, wasof the investment. If a significant adverse effect on the fair value of the investment has occurred and is deemed to be other-than-temporary, the fair value of the investment is estimated, using a discounted cash flow analysis based on quoted long-term debt market rates adjusted forand the Company's non-performance risk. There was an immaterial difference betweenamount by which the carrying value and estimatedof the cost-method investment exceeds its fair value of long-term debtis recorded as of June 30, 2009 and 2008.an impairment loss.The carrying value of the Company's short-term financial instruments, including cash deposit accounts, trade accounts receivable, prepaid and deposit accounts, trade accounts payable, accrued expenses and dividends payable, approximate fair value due to the relatively short maturity and immaterial non-performance risk of such instruments. These financial instruments are categorized as Level 2 financial instruments.Note 1211 Derivative InstrumentsIn March 2008, the FASB issued SFAS No. 161, Disclosures about Derivative Instruments and Hedging Activities (FAS 161). FAS 161 amends and expands the disclosure requirements of SFAS No. 133, Accounting for Derivative Instruments and Hedging Activities (FAS 133), and requires entities to provide enhanced qualitative disclosures about objectives and strategies for using derivatives, quantitative disclosures about fair values and amounts of gains and losses on derivative contracts, and disclosures about credit-risk-related contingent features in derivative agreements. The Company adopted FAS 161 in the third quarter of fiscal year 2009 and applied the new disclosure requirements prospectively.The Company operates internationally and is therefore exposed to foreign currency exchange rate fluctuations in the normal course of its business. The Company's primary means of managing this exposure is to utilize natural hedges, such as aligning currencies used in the supply chain with the sale currency. To the extent natural hedging techniques do not fully offset currency risk, the Company uses derivative instruments with the objective of reducing the residual exposure to certain foreign currency rate movements. Factors considered in the decision to hedge an underlying market exposure include the materiality of the risk, the volatility of the market, the duration of the hedge, the degree to which the underlying exposure is committed to, and the availability, effectiveness, and cost of derivative instruments. Derivative instruments are only utilized for risk management purposes and are not used for speculative or trading purposes.The Company uses forward contracts designated as cash flow hedges to protect against foreign currency exchange rate risks56inherent in forecasted transactions denominated in a foreign currency. Foreign exchange contracts are also used to hedge against foreign currency exchange rate risks related to intercompany balances denominated in currencies other than the functional currencies. As of June 30, 2009,2012, the Company had outstanding foreign currency forwardexchange contracts to hedge currencies against the U.S. dollar in the aggregate notional amount of $13.3$25.3 million and to hedge currencies against the Euro in the aggregate notional amount of 31.034.7 million EUR. The notional amount is an indicatoramounts are indicators of the volume of derivative activities but isare not an indicatorindicators of the potential gain or loss on the derivatives.In limited cases due to unexpected changes in forecasted transactions, cash flow hedges may cease to meet the criteria to be designated as cash flow hedges. Depending on the type of exposure hedged, the Company may either purchase a forwardderivative contract in the opposite position of the undesignated hedge or may retain the hedge until it matures if the hedge continues to provide an adequate offset in earnings against the currency revaluation impact of foreign currency denominated liabilities.The fair value of outstanding derivative instruments is recognized on the balance sheet as a derivative asset or liability. When derivatives are settled with the counterparty, the derivative asset or liability is relieved and cash flow is impacted for the net settlement. For derivative instruments that meet the criteria of hedging instruments under FAS 133,FASB guidance, the effective portions of the gain or loss on the derivative instrument are initially recorded net of related tax effect in Accumulated Other Comprehensive Income (Loss), a component of Share Owners' Equity, and are subsequently reclassified into earnings in the period or periods during which the hedged transaction is recognized in earnings. The ineffective portion of the derivative gain or loss is reported in the Non-operating income or expense line item on the Consolidated Statements of Income immediately. The gain or loss associated with derivative instruments that are not designated as hedging instruments or that cease to meet the criteria for hedging under FAS 133FASB guidance is also reported in the Non-operating income or expense line item on the Consolidated Statements of Income immediately.Based on fair values as of June 30, 2009,2012, the Company estimates that $7.1approximately $0.1 million of pre-tax derivative losses deferred in Accumulated Other Comprehensive Income (Loss) will be reclassified into earnings, along with the earnings effects of related forecasted transactions, within the fiscal year ending June 30, 2010. 2013. Losses on forwardforeign exchange contracts are generally offset by gains in operating costs in the income statement when the underlying hedged transaction is recognized in earnings. Because gains or losses on forwardforeign exchange contracts fluctuate partially based on currency spot rates, the future effect on earnings of the cash flow hedges alone is not determinable, but in conjunction with the underlying hedged transactions, the result is expected to be a decline in currency risk. The maximum length of time the Company had hedged its exposure to the variability in future cash flows was 15 and 2712 months as of both June 30, 20092012 and 2008, respectively.June 30, 2011.Stock Warrants:In conjunction with the Company's investments in convertible debt securities of a privately-held company during fiscal year 2010, the Company received common and preferred stock warrants which provide the right to purchase the privately-held company's equity securities at a specified exercise price.As part of the June 2011 qualified financing related to the convertible debt securities, the latest preferred stock offering price of warrants was modified to a $0.25 per share exercise price (originally based on the previous offering price of $1.50), and the number of warrants was modified to 11 million shares (originally 1,833,000 shares). The qualified financing did not impact the common warrants, which remained at a $0.15 per share exercise price (2,750,000 shares). The revaluation of warrants due to the change in terms and the valuation of the underlying business resulted in a $1.0 million gain during fiscal year 2011, recognized in the Non-operating income line item on the Consolidated Statements of Income.During fiscal year 2012, the privately-held company experienced delays in their start-up, and therefore initiated another round of financing that the Company chose not to participate in, which resulted in the automatic conversion of the preferred warrants to common warrants. Upon the conversion, the stock warrants were revalued resulting in a $0.5 million derivative loss on stock warrants during fiscal year 2012.The value of the stock warrants fluctuates primarily in relation to the value of the privately-held company's underlying securities, either providing an appreciation in value or potentially expiring with no value. The stock warrants expire in June 2017.See Note 1110 - Fair Value of Financial Assets and Liabilities of Notes to Consolidated Financial Statements for further information regarding the fair value of derivative assets and liabilities and Note 1716 - Comprehensive Income of Notes to Consolidated Financial Statements for the amount and changes in derivative gains and losses deferred in Accumulated Other Comprehensive Income (Loss).57Information on the location and amounts of derivative fair values in the Consolidated Balance Sheets and derivative gains and losses in the Consolidated Statements of Income are presented below.Fair Values of Derivative Instruments on the Consolidated Balance Sheets Asset Derivatives Liability Derivatives Fair Value As of Fair Value As of (Amounts in Thousands) Balance Sheet Location June 30,
2009 June 30,
2008 Balance Sheet Location June 30,
2009 June 30,
2008Derivatives designated as
hedging instruments under FAS 133 Foreign currency forward contracts Prepaid expenses and other current assets $ 742 $ 1,307 Accrued expenses $ 2,581 $ 2,582 Derivatives not designated as
hedging instruments under FAS 133 Foreign currency forward contracts Prepaid expenses and other current assets 42 -0- Accrued expenses 631 -0- Other liabilities (long-term) 195 -0- Total derivatives $ 784 $ 1,307 $ 3,407 $ 2,582 The Effect of Derivative Instruments on Other Comprehensive Income (Loss) (Amounts in Thousands) June 30 2009 2008 2007 Amount of Pre-Tax Gain or (Loss) Recognized in Other Comprehensive Income (Loss) (OCI) on Derivative (Effective Portion) Foreign currency forward contracts $(13,832) $ (4,396) $ 2,044 The Effect of Derivative Instruments on Consolidated Statements of Income (Amounts in Thousands) Fiscal Year Ended June 30 Derivatives in FAS 133 Cash Flow Hedging Relationships Location of Gain or (Loss) 2009 2008 2007 Amount of Pre-Tax Gain or (Loss) Reclassified from Accumulated OCI into Income (Effective Portion) Foreign currency forward contracts Net Sales $ (280) $ -0- $ -0- Foreign currency forward contracts Cost of Sales (5,749) (2,069) -0- Foreign currency forward contracts Non-operating income (1,878) (1,061) 988 Total $ (7,907) $ (3,130) $ 988 Amount of Pre-Tax Gain or (Loss) Reclassified from Accumulated OCI into Income (Ineffective Portion) Foreign currency forward contracts Non-operating income $ 165 $ -0- $ 299 Derivatives Not Designated as Hedging Instruments under FAS 133 Amount of Pre-Tax Gain or (Loss) Recognized in Income on Derivative Foreign currency forward contracts Non-operating income $ 1,274 $ -0- $ -0- TOTAL DERIVATIVE PRE-TAX GAIN (LOSS) RECOGNIZED IN INCOME $ (6,468) $ (3,130) $ 1,287 Fair Values of Derivative Instruments on the Consolidated Balance Sheets Asset Derivatives Liability Derivatives Fair Value As of Fair Value As of (Amounts in Thousands) Balance Sheet Location June 30
2012 June 30
2011 Balance Sheet Location June 30
2012 June 30
2011Derivatives designated as hedging instruments: Foreign exchange contracts Prepaid expenses and other current assets $ 1,058 $ 644 Accrued expenses $ 799 $ 415 Derivatives not designated as hedging instruments: Foreign exchange contracts Prepaid expenses and other current assets 1,220 400 Accrued expenses — 1,269 Stock warrants Other assets (long-term) 911 1,437 Total derivatives $ 3,189 $ 2,481 $ 799 $ 1,684 The Effect of Derivative Instruments on Other Comprehensive Income (Loss) June 30 (Amounts in Thousands) 2012 2011 2010 Amount of Pre-Tax Gain or (Loss) Recognized in Other Comprehensive Income (Loss) (OCI) on Derivatives (Effective Portion): Foreign exchange contracts $ (192 ) $ 1,063 $ 2,494 The Effect of Derivative Instruments on Consolidated Statements of Income (Amounts in Thousands) Fiscal Year Ended June 30 Derivatives in Cash Flow Hedging Relationships Location of Gain or (Loss) 2012 2011 2,010 Amount of Pre-Tax Gain or (Loss) Reclassified from Accumulated OCI into Income (Effective Portion): Foreign exchange contracts Net Sales $ — $ — $ 15 Foreign exchange contracts Cost of Sales (1,415 ) 1,674 143 Foreign exchange contracts Non-operating income/expense 363 (121 ) 36 Total $ (1,052 ) $ 1,553 $ 194 Amount of Pre-Tax Gain or (Loss) Reclassified from Accumulated OCI into Income (Ineffective Portion): Foreign exchange contracts Non-operating income/expense $ (17 ) $ 2 $ 44 Derivatives Not Designated as Hedging Instruments Amount of Pre-Tax Gain or (Loss) Recognized in Income on Derivatives: Foreign exchange contracts Non-operating income/expense $ 2,513 $ (4,322 ) $ 1,355 Stock warrants Non-operating income/expense (526 ) 1,041 (7 ) Total $ 1,987 $ (3,281 ) $ 1,348 Total Derivative Pre-Tax Gain (Loss) Recognized in Income $ 918 $ (1,726 ) $ 1,586 Note 13 Short-Term12 InvestmentsMunicipal Securities:The Company's short-term investment portfolio consists ofincluded available-for-sale securities which iswere comprised of exempt securities issued by municipalities ("Municipal Securities") which can be in. During fiscal year 2010, the formCompany sold all of General Obligation Bonds, Revenue Bonds, Tax Anticipation Notes, Revenue Anticipation Notes, Bond Anticipation Notes, pre-refunded (by U.S. Govt. or Stateits municipal securities and Local Govt.) bonds, and short-term putable bonds. The Company's investment policy dictates that Municipal Securities must be investment grade quality.Available-for-saleno municipal securities are recorded at fair value. See Note 11 - Fair Value of Financial Assets and Liabilities of Notes to Consolidated Financial Statements for more information on the fair value of available-for-sale securities. The amortized cost basis reflects the original purchase price, with discounts and premiums amortized over the life of the security. Unrealized losses on debt securities are recognized in earnings when a company has an intent to sell or is likely to be required to sell before recovery of the loss, or when the debt security has incurred a credit loss. Otherwise, unrealized gains and losses are recorded net of the tax related effect as a component of Share Owners' Equity. Municipal Securities mature within a four-year period.Municipal Securities June 30 (Amounts in Thousands) 2009 2008 Amortized cost basis $24,606 $51,216 Unrealized holding gains 770 502 Unrealized holding losses -0- (83) Other-than-temporary impairment -0- -0- Fair Value $25,376 $51,635 There were no investments which were in an unrealized loss positionoutstanding as of June 30, 2009. Municipal Securities in a continuous unrealized loss position were as follows:Municipal Securities June 30 (Amounts in Thousands) 2009 2008 Continuous loss position for less than 12 months: Fair value $ -0- $18,535 Unrealized loss -0- (83) Continuous loss position for 12 months or greater: Fair value -0- -0- Unrealized loss -0- -0- 58Activity for the Municipal Securitiesmunicipal securities that were classified as available-for-sale was as follows:Municipal Securities $34,337 $39,126 $13,403 1,114 305 17 (88) (71) (72) Net unrealized holding gain (loss) included in Accumulated Other Comprehensive Income (Loss) 1,377 953 22 Net (gains) losses reclassified out of Accumulated Other Comprehensive Income (Loss) (1,026) (234) 104 For the Year Ended June 30 (Amounts in Thousands) 2012 2011 2010 Proceeds from sales $ — $ — $ 28,937 Gross realized gains from sale of available-for-sale securities included in earnings — — 639 Net unrealized holding gain (loss) included in Other Comprehensive Income (Loss) — — (131 ) Net (gains) losses reclassified out of Other Comprehensive Income (Loss) — — (639 ) Realized gains and losses are reported in the Other Income (Expense) category of the Consolidated Statements of Income. The cost of each individual security was used in computing the realized gains and losses. No other-than-temporary impairment was recorded on municipal securities during fiscal years 2012, 2011, and 2010.Convertible Debt and Non-marketable Equity Securities:During fiscal year 2007,2010, the Company purchased convertible debt securities of a privately-held company, which were initially allocated a value of $2.3 million. Interest accrued on the debt securities at a rate of 8.00% per annum and was due with the principal in June 2011. The Company also recorded,received stock warrants to purchase the common and preferred stock of the privately-held company at a specified exercise price, which are discussed in thousands, $49Note 11 - Derivative Instruments of Notes to Consolidated Financial Statements.During fiscal year 2011, the convertible debt securities experienced an other-than-temporary decline in fair market value resulting in a $1.2 million impairment loss and, upon a qualified financing, were subsequently converted to preferred shares. The conversion of the convertible notes to preferred shares had no earnings impact. The preferred shares are non-marketable and are accounted for as a cost-method investment, which carries the shares at cost except in the event of impairment. The preferred shares had a carrying value of $1.8 million at June 30, 2011.During fiscal year 2012, the privately-held company experienced delays in their start-up, and therefore initiated another round of financing that the Company chose not to participate in, which resulted in the automatic conversion of preferred shares to common shares. Upon the conversion, the equity securities were revalued which resulted in an impairment loss of $0.7 million during fiscal year 2012. The common shares had a carrying value of $1.1 million at June 30, 2012.The privately-held investment is included in the Other Assets line of the Consolidated Balance Sheets. See Note 10 - Fair Value of Notes to Consolidated Financial Statements for more information on the valuation of these securities. The investment does not rise to the level of a material variable interest or a controlling interest in the privately-held company which would require consolidation.Supplemental Employee Retirement Plan Investments:The Company maintains a self-directed supplemental employee retirement plan (SERP) for executive employees. The SERP is structured asutilizes a rabbi trust, and therefore assets in the SERP portfolio are subject to creditor claims in the event of bankruptcy. The Company recognizes SERP investment assets on the balance sheet at current fair value. A SERP liability of the same amount is recorded on the balance sheet representing the Company's obligation to distribute SERP funds to participants. The SERP investment assets are classified as trading, and accordingly, realized and unrealized gains and losses are recognized in income.income in the Other Income (Expense) category. Adjustments made to revalue the SERP liability are also recognized in income as selling and administrative expenses and exactly offset valuation adjustments on SERP investment assets. The change in net unrealized holding gains and (losses) at for the fiscal years ended June 30, 2009, 2008,2012, 2011, and 20072010 was, in thousands, ($2,739)$(483), ($2,385)$2,611, and $2,939,$1,385, respectively. SERP asset and liability balances were as follows: June 30 (Amounts in Thousands) SERP investment - current asset $ 3,536 $ 2,958 SERP investment - other long-term asset 7,456 10,009 Total SERP investment $ 10,992 $ 12,967 SERP obligation - current liability $ 3,536 $ 2,958 SERP obligation - other long-term liability 7,456 10,009 Total SERP obligation $ 10,992 $ 12,967 June 30 (Amounts in Thousands) 2012 2011 SERP investment - current asset $ 5,899 $ 5,604 SERP investment - other long-term asset 11,023 10,534 Total SERP investment $ 16,922 $ 16,138 SERP obligation - current liability $ 5,899 $ 5,604 SERP obligation - other long-term liability 11,023 10,534 Total SERP obligation $ 16,922 $ 16,138 59Note 1413 Accrued ExpensesAccrued expenses consisted of: June 30 (Amounts in Thousands) 2009 2008 Taxes $ 7,573 $ 5,882 Compensation 20,292 24,596 Retirement plan -0- 5,617 Insurance 7,023 7,376 Restructuring 3,793 6,728 Other expenses 13,745 18,854 Total accrued expenses $52,426 $69,053 68 June 30 (Amounts in Thousands) 2012 2011 Taxes $ 4,193 $ 8,290 Compensation 22,601 26,445 Retirement plan 5,189 4,809 Insurance 3,875 3,598 Restructuring 269 7,958 Other expenses 12,333 15,216 Total accrued expenses $ 48,460 $ 66,316 Note 1514 Segment and Geographic Area InformationManagement organizes the Company into segments based upon differences in products and services offered in each segment. The segments and their principal products and services are as follows:follows. The EMS segment provides engineering and manufacturing services which utilize common production and support capabilities to a variety of industries globally. The EMS segment focuses on electronic assemblies that have high durability requirements and are sold on a contract basis and produced to customers' specifications. The CompanyEMS segment currently sells primarily to customers in the medical, automotive, industrial, controls, and public safety industries. The Furniture segment provides furniture for the office and hospitality industries, sold under the Company's family of brand names.Included in the EMS segment arewere sales to one major customer. Sales to Bayer AG affiliates totaled, in millions, $149.5, $149.9,$5.0, $135.7, and $198.9$169.6 in fiscal years 2009, 2008,2012, 2011, and 2007,2010, respectively, representing 12%0%, 11%, and 15% of consolidated net sales, respectively, for such periods.The accounting policies of the segments are the same as those described in Note 1 - Summary of Significant Accounting Policies of Notes to Consolidated Financial Statements with additional explanation of segment allocations as follows. Corporate assets and operating costs are allocated to the segments based on the extent to which each segment uses a centralized function, where practicable. However, certain common costs have been allocated among segments less precisely than would be required for standalone financial information prepared in accordance with accounting principles generally accepted in the United States of America. Unallocated corporate assets include cash and cash equivalents, short-term investments, and other assets not allocated to segments. Unallocated corporate income from continuing operations consists of income not allocated to segments for purposes of evaluating segment performance such as the gain on the sale of the Company's undeveloped land holdings and timberlands, and includes income from corporate investments and other non-operational items. Sales between the Furniture segment and EMS segment are not material.The Company evaluates segment performance based upon several financial measures, although the two most common includeincluding economic profit, which incorporates a segment's cost of capital when evaluating financial performance, operating income, and net income. Operating income from continuing operations. Income from continuing operations isand net income are reported for each segment as it isthey are the measuremeasures most consistent with the measurement principles used in the Company's consolidated financial statements.The Company aggregates multiple operating segments into each reportable segment. The aggregated operating segments have similar economic characteristics and meet the other aggregation criteria required by SFAS 131, Disclosure about Segments of an Enterprise and Related Information.U.S. GAAP.60Income statement amounts presented are from continuing operations.At or For the Year Ended June 30, 2009 Electronic Manufacturing Services Furniture Unallocated Corporate and Eliminations Consolidated (Amounts in Thousands) Net Sales $ 642,802 $ 564,618 $ -0- $ 1,207,420 Depreciation and Amortization 22,181 15,437 -0- 37,618 Goodwill Impairment 12,826 1,733 -0- 14,559 Interest Income -0- -0- 2,499 2,499 Interest Expense 320 -0- 1,245 1,565 Provision (Benefit) for Income Taxes (9,150) 5,054 12,094 7,998 Income (Loss) from Continuing Operations(1) (11,768) 8,285 20,811 17,328 Total Assets 351,506 184,755 106,008 642,269 Goodwill 2,608 -0- -0- 2,608 Capital Expenditures 36,958 10,721 -0- 47,679 At or For the Year Ended June 30, 2008 Electronic Manufacturing Services Furniture Unallocated Corporate and Eliminations Consolidated (Amounts in Thousands) Net Sales $ 727,149 $ 624,836 $ -0- $ 1,351,985 Depreciation and Amortization 17,621 21,800 -0- 39,421 Interest Income -0- -0- 3,362 3,362 Interest Expense 1,043 -0- 924 1,967 Provision (Benefit) for Income Taxes (9,737) 8,260 (965) (2,442) Income (Loss) from Continuing Operations(2) (15,264) 13,417 1,925 78 Total Assets 396,773 240,674 85,220 722,667 Goodwill 13,622 1,733 -0- 15,355 Capital Expenditures 27,846 21,896 -0- 49,742 At or For the Year Ended June 30, 2007 Electronic Manufacturing Services Furniture Unallocated Corporate and Eliminations Consolidated (Amounts in Thousands) Net Sales $ 672,968 $ 613,962 $ -0- $ 1,286,930 Depreciation and Amortization 20,561 18,093 -0- 38,654 Interest Income -0- -0- 5,237 5,237 Interest Expense 1,025 3 45 1,073 Provision for Income Taxes 1,489 11,283 314 13,086 Income from Continuing Operations(3) 981 17,810 4,475 23,266 Total Assets 381,631 225,555 87,555 694,741 Goodwill 13,785 1,733 -0- 15,518 Capital Expenditures 18,568 22,313 -0- 40,881 At or For the Year Ended June 30, 2012 ElectronicManufacturingServices Furniture UnallocatedCorporate andEliminations Consolidated (Amounts in Thousands) Net Sales $ 616,751 $ 525,310 $ — $ 1,142,061 Depreciation and Amortization 17,590 13,383 — 30,973 Operating Income (Loss) 8,904 11,874 (2,389 ) 18,389 Interest Income — — 430 430 Interest Expense 6 2 27 35 Provision (Benefit) for Income Taxes 2,042 4,837 (811 ) 6,068 Net Income (Loss) (1)6,572 6,957 (1,895 ) 11,634 Total Assets 332,115 183,415 79,986 595,516 Goodwill 2,480 — — 2,480 Capital Expenditures 13,485 13,458 — 26,943 At or For the Year Ended June 30, 2011 ElectronicManufacturingServices Furniture UnallocatedCorporate andEliminations Consolidated (Amounts in Thousands) Net Sales $ 721,419 $ 481,178 $ — $ 1,202,597 Depreciation and Amortization 17,153 14,054 — 31,207 Operating Income (Loss) 5,487 1,077 (4,148 ) 2,416 Interest Income — — 820 820 Interest Expense 22 — 99 121 Provision (Benefit) for Income Taxes (452 ) 256 (289 ) (485 ) Net Income (2)4,067 472 383 4,922 Total Assets 377,067 191,275 57,970 626,312 Goodwill 2,644 — — 2,644 Capital Expenditures 24,863 6,508 — 31,371 At or For the Year Ended June 30, 2010 ElectronicManufacturingServices Furniture UnallocatedCorporate andEliminations Consolidated (Amounts in Thousands) Net Sales $ 709,133 $ 413,611 $ 64 $ 1,122,808 Depreciation and Amortization 20,570 14,190 — 34,760 Operating Income (Loss) 15,291 (9,374 ) (3,226 ) 2,691 Interest Income — — 1,188 1,188 Interest Expense 77 — 65 142 Provision (Benefit) for Income Taxes (361 ) (4,104 ) (370 ) (4,835 ) Net Income (Loss) (3)15,731 (5,751 ) 823 10,803 Total Assets 384,491 182,396 69,864 636,751 Goodwill 2,443 — — 2,443 Capital Expenditures 22,455 12,336 — 34,791 (1) Includes after-tax restructuring charges of $1.8$2.1 million in fiscal year 2009. On a segment basis, the2012. The EMS segment recorded a $1.5 million restructuring charge, the Furniture segment recorded a $0.1 million restructuring charge, and Unallocated Corporate and Eliminations recorded, a $0.2respectively, $1.7 million restructuring charge. expense and $0.4 million expense. See Note 1817 - Restructuring Expense of Notes to the Consolidated Financial Statements for further discussion. Additionally,(2) Includes after-tax restructuring charges of $0.6 million in fiscal year 2009, the2011. The EMS segment recorded $1.6 million of after-tax income for earnest money deposits retained by the Company resulting from the termination of the contract to sell the Company's Poland building and real estate. Unallocated Corporate and Eliminations also recorded, in fiscal year 2009 $18.9respectively, $0.5 million of after-tax gains on the sale of undeveloped land holdings expense and timberlands. Also, during fiscal year 2009, the Company recorded $9.1$0.1 million of after-tax costs related to goodwill impairment, consisting of $8.0 million in the EMS segment and $1.1 million in the Furniture segment. expense. See the Goodwill and Other Intangible Assets section of Note 117 - Summary of Significant Accounting PoliciesRestructuring Expense of Notes to the Consolidated Financial Statements for further discussion.(3) (2) Includes consolidated after-tax restructuring charges of $14.6$1.2 million in fiscal year 2008. On a segment basis, the EMS segment recorded a $12.8 million restructuring charge, the Furniture segment recorded a $1.3 million restructuring charge, and Unallocated Corporate and Eliminations recorded a $0.5 million restructuring charge. See Note 18 - Restructuring Expense of Notes to Consolidated Financial Statements for further discussion.2010. The EMS segment, also recorded $0.7the Furniture segment,61and Unallocated Corporate and Eliminations recorded, respectively, $1.2 million expense, $0.1 million income, and $0.1 million expense. See Note 17 - Restructuring Expense of Notes to Consolidated Financial Statements for further discussion. The EMS segment also recorded $2.0 million of after-tax income resulting from settlement proceeds related to an antitrust lawsuit of which the Company was a class member and a $7.7 million million after-tax gain from the sale of the facility and land in Poland.Geographic Area:The following geographic area data includes net sales based on the location where title transfers and long-lived assets based on physical location. Long-lived assets include property and equipment and other long-term assets such as software. At or For the Year Ended June 30 (Amounts in Thousands) 2012 2011 2010 Net Sales: United States $ 870,080 $ 817,252 $ 699,620 Poland (4)3,412 132,518 3,877 United Kingdom (4)15,603 26,723 113,576 Other Foreign 252,966 226,104 305,735 Total net sales $ 1,142,061 $ 1,202,597 $ 1,122,808 Long-Lived Assets: United States $ 129,258 $ 134,639 $ 134,115 Poland 44,427 47,765 40,905 Other Foreign 18,899 21,630 19,563 Total long-lived assets $ 192,584 $ 204,034 $ 194,583 (4) The decrease in net sales to Poland in fiscal year 2008, received as part2012 compared to fiscal year 2011 was attributable to the expiration of a Polish offset credit program for investments madecontract with one medical customer (Bayer AG). The increase in Poland net sales and the Company's Poland operation.(3) Includes consolidated after-tax restructuring charges of $0.9 milliondecline in United Kingdom net sales in fiscal year 2007. On2011 compared to fiscal year 2010 was due to the transfer of production between these locations which resulted in a segment basis,change in the EMS segment recorded a $0.1 million restructuring charge, the Furniture segment recorded a $0.8 million restructuring charge, and Unallocated Corporate and Eliminations recorded a minimal amount of restructuring. See Note 18 - Restructuring Expense of Notesshipping destination to Consolidated Financial Statements for further discussion. Poland.Sales by Product Line: The Furniture segment produces and sells a variety of similar products and services. Net sales to external customers by product line within the Furniture segment were as follows: Year Ended June 30 (Amounts in Thousands) 2009 2008 2007 Net Sales: Furniture Branded Furniture $ 564,618 $ 624,836 $ 602,903 Contract Private Label Products(4) -0- -0- 11,059 Total $ 564,618 $ 624,836 $ 613,962 (4) The Net Sales decline was the result of the planned exit of Contract Private Label Products which was complete as of June 30, 2007. Geographic Area: The following geographic area data includes net sales based on product shipment destination and long-lived assets based on physical location. Long-lived assets include property and equipment and other long-term assets such as software. At or For the Year Ended June 30 (Amounts in Thousands) 2009 2008 2007 Net Sales: United States $ 795,861 $ 990,326 $ 921,230 United Kingdom(5) 211,766 -0- -0- Other Foreign 199,793 361,659 365,700 Total net sales $ 1,207,420 $ 1,351,985 $ 1,286,930 Long-Lived Assets: United States $ 142,187 $ 166,589 $ 167,579 Poland 44,807 24,097 16,062 Other Foreign 22,806 26,889 24,868 Total long-lived assets $ 209,800 $ 217,575 $ 208,509 (5) In fiscal year 2009, the Company's Wales facility changed its shipping arrangement with customers so that products are shipped to the United Kingdom, and the customer takes possession of the product in the United Kingdom. It is not practicable to provide the United Kingdom net sales for prior years because the product shipment destination occurred throughout Europe, but no individual country had a significant share of net sales in relation to total net sales. 62Note 1615 Earnings Per ShareEarnings per share are computed using the two-class common stock method due to the dividend preference of Class B Common Stock. Basic earnings per share are based on the weighted average number of shares outstanding during the period. Diluted earnings per share are based on the weighted average number of shares outstanding plus the assumed issuance of common shares and related payment of assumed dividends for all potentially dilutive securities. Earnings per share of Class A and Class B Common Stock are as follows:EARNINGS PER SHARE FROM CONTINUING OPERATIONS Year Ended June 30, 2009 Year Ended June 30, 2008 Year Ended June 30, 2007 (Amounts in Thousands, Except for Per Share Data) Class A Class B Total Class A Class B Total Class A Class B Total Basic Earnings Per Share from Continuing Operations: Dividends Declared $ 4,617 $ 10,944 $ 15,561 $ 7,476 $ 16,216 $23,692 $ 7,609 $17,198 $24,807 Undistributed Earnings (Loss) 525 1,242 1,767 (7,442) (16,172) (23,614) (478) (1,063) (1,541) Income from Continuing Operations $ 5,142 $ 12,186 $ 17,328 $ 34 $ 44 $ 78 $ 7,131 $16,135 $23,266 Average Basic Shares Outstanding 11,036 26,125 37,161 11,696 25,418 37,114 11,979 26,623 38,602 Basic Earnings Per Share from
Continuing Operations $ 0.47 $ 0.47 $ 0.00 $ 0.00 $ 0.60 $ 0.61 Diluted Earnings Per Share from Continuing Operations: Dividends Declared and Assumed Dividends on Dilutive Shares $ 4,632 $ 10,945 $ 15,577 $ 7,514 $ 16,224 $23,738 $ 7,708 $17,360 $25,068 Undistributed Earnings (Loss) 525 1,226 1,751 (7,514) (16,146) (23,660) (565) (1,237) (1,802) Income from Continuing Operations $ 5,157 $ 12,171 $ 17,328 $ -0- $ 78 $ 78 $ 7,143 $16,123 $23,266 Average Diluted Shares Outstanding 11,195 26,151 37,346 11,868 25,504 37,372 12,325 26,932 39,257 Diluted Earnings Per Share
from Continuing Operations $ 0.46 $ 0.47 $ 0.00 $ 0.00 $ 0.58 $ 0.60 Reconciliation of Basic and Diluted EPS from Continuing Operations Calculations: Income from Continuing Operations Used for Basic EPS Calculation $ 5,142 $ 12,186 $ 17,328 $ 34 $ 44 $ 78 $ 7,131 $16,135 $23,266 Assumed Dividends Payable on Dilutive Shares: Stock options -0- -0- -0- -0- -0- -0- -0- 151 151 Performance shares 15 1 16 38 8 46 99 11 110 Reduction of Undistributed Earnings (Loss) - allocated based on Class A and Class B shares -0- (16) (16) (72) 26 (46) (87) (174) (261) Income from Continuing Operations
Used for Diluted EPS Calculation $ 5,157 $ 12,171 $ 17,328 $ -0- $ 78 $ 78 $ 7,143 $16,123 $23,266 Average Shares Outstanding for Basic
EPS Calculation 11,036 26,125 37,161 11,696 25,418 37,114 11,979 26,623 38,602 Dilutive Effect of Average Outstanding: Stock options -0- -0- -0- -0- -0- -0- -0- 236 236 Performance shares 38 2 40 61 12 73 160 16 176 Restricted share units 121 24 145 111 74 185 186 57 243 Average Shares Outstanding for Diluted
EPS Calculation 11,195 26,151 37,346 11,868 25,504 37,372 12,325 26,932 39,257 Included in dividends declared for the basic and diluted earnings per share computation are dividends computed and accrued on unvested Class A and Class B restricted share units, which will be paid by a conversion to the equivalent value of common shares after a vesting period. In fiscal year 2009, all 755,000 average stock options outstanding were antidilutive and were excluded from the dilutive calculation. In fiscal year 2008, all 792,000 average stock options outstanding were antidilutive and were excluded in the dilutive calculation. In addition, 149,000 of the 334,000 average restricted share units and 82,000 of the 155,000 average performance share grants were antidilutive and excluded from the dilutive calculation. In fiscal year 2007, all 1,147,000 average stock options outstanding were dilutive and were included in the dilutive calculation. EARNINGS PER SHARE Year Ended June 30, 2012 Year Ended June 30, 2011 Year Ended June 30, 2010 (Amounts in Thousands, Except for Per Share Data) Class A Class B Total Class A Class B Total Class A Class B Total Basic Earnings Per Share: Dividends Declared $ 1,869 $ 5,502 $ 7,371 $ 1,889 $ 5,448 $ 7,337 $ 1,955 $ 5,376 $ 7,331 Less: Unvested Participating Dividends — — — — — — (9 ) — (9 ) Dividends to Common Share Owners 1,869 5,502 7,371 1,889 5,448 7,337 1,946 5,376 7,322 Undistributed Earnings (Loss) 4,263 (2,415 ) 3,472 Less: Earnings (Loss) Allocated to Participating Securities — — (4 ) Undistributed Earnings (Loss) Allocated to Common Share Owners1,169 3,094 4,263 (672 ) (1,743 ) (2,415 ) 990 2,478 3,468 Income Available to Common Share Owners $ 3,038 $ 8,596 $ 11,634 $ 1,217 $ 3,705 $ 4,922 $ 2,936 $ 7,854 $ 10,790 Average Basic Common Shares Outstanding 10,387 27,494 37,881 10,493 27,233 37,726 10,694 26,765 37,459 Basic Earnings Per Share $ 0.29 $ 0.31 $ 0.12 $ 0.14 $ 0.27 $ 0.29 Diluted Earnings Per Share: Dividends Declared and Assumed Dividends on Dilutive Shares $ 1,906 $ 5,502 $ 7,408 $ 1,916 $ 5,448 $ 7,364 $ 1,972 $ 5,377 $ 7,349 Less: Unvested Participating Dividends — — — — — — (9 ) — (9 ) Dividends and Assumed Dividends to Common Share Owners 1,906 5,502 7,408 1,916 5,448 7,364 1,963 5,377 7,340 Undistributed Earnings (Loss) 4,226 (2,442 ) 3,454 Less: Earnings (Loss) Allocated to Participating Securities — — (4 ) Undistributed Earnings (Loss) Allocated to Common Share Owners1,175 3,051 4,226 (686 ) (1,756 ) (2,442 ) 991 2,459 3,450 Income Available to Common Share Owners $ 3,081 $ 8,553 $ 11,634 $ 1,230 $ 3,692 $ 4,922 $ 2,954 $ 7,836 $ 10,790 Average Diluted Common Shares Outstanding 10,593 27,494 38,087 10,639 27,234 37,873 10,791 26,770 37,561 Diluted Earnings Per Share $ 0.29 $ 0.31 $ 0.12 $ 0.14 $ 0.27 $ 0.29 Reconciliation of Basic and Diluted EPS Calculations: Income Used for Basic EPS Calculation $ 3,038 $ 8,596 $ 11,634 $ 1,217 $ 3,705 $ 4,922 $ 2,936 $ 7,854 $ 10,790 Assumed Dividends Payable on Dilutive Shares: Performance shares 37 — 37 27 — 27 17 1 18 Increase (Reduction) of Undistributed Earnings (Loss) - allocated based on Class A and Class B shares6 (43 ) (37 ) (14 ) (13 ) (27 ) 1 (19 ) (18 ) Income Used for Diluted EPS Calculation $ 3,081 $ 8,553 $ 11,634 $ 1,230 $ 3,692 $ 4,922 $ 2,954 $ 7,836 $ 10,790 Average Shares Outstanding for Basic EPS Calculation10,387 27,494 37,881 10,493 27,233 37,726 10,694 26,765 37,459 Dilutive Effect of Average Outstanding: Performance shares 206 — 206 146 1 147 97 5 102 Average Shares Outstanding for Diluted EPS Calculation10,593 27,494 38,087 10,639 27,234 37,873 10,791 26,770 37,561 Included in dividends declared for the basic and diluted earnings per share computation for fiscal year 2010 are dividends computed and accrued on unvested Class A and Class B restricted share units, which were paid by a conversion to the equivalent value of common shares on the vesting date. Restricted share units held by retirement-age participants had a nonforfeitable right to dividends and were deducted from the above dividends and undistributed earnings figures allocable to common Share Owners. All restricted share units vested during fiscal year 2010.In fiscal year 2012, 2011, and 2010, respectively, all 508,000, 625,000, and 693,000 average stock options outstanding were antidilutive and were excluded from the dilutive calculation.63Note 1716 Comprehensive IncomeComprehensive income includes all changes in equity during a period except those resulting from investments by, and distributions to, Share Owners. Comprehensive income consists of net income (loss) and other comprehensive income (loss), which includes the net change in unrealized gains and losses on investments, foreign currency translation adjustments, the net change in derivative gains and losses, net actuarial change in postemployment severance, and postemployment severance prior service cost. Year Ended June 30, 2009 Year Ended June 30, 2008 Year Ended June 30, 2007 (Amounts in Thousands) Pre-tax Tax Net Pre-tax Tax Net Pre-tax Tax Net Net income (loss) $ 17,328 $ (46) $ 19,152 Other comprehensive income (loss): Foreign currency translation adjustments $ (4,143) $ (1,891) $ (6,034) $ 9,090 $ -0- $ 9,090 $ 3,182 $ -0- $ 3,182 Postemployment severance actuarial change (3,853) 1,536 (2,317) (130) 52 (78) (2,200) 877 (1,323) Other fair value changes: Available-for-sale securities 1,377 (549) 828 953 (379) 574 22 (9) 13 Derivatives (13,832) 3,962 (9,870) (4,396) 1,678 (2,718) 2,044 (637) 1,407 Reclassification to (earnings) loss: Available-for-sale securities (1,026) 409 (617) (234) 93 (141) 104 (41) 63 Derivatives 7,742 (3,023) 4,719 3,130 (1,126) 2,004 (1,287) 454 (833) Amortization of prior service costs 285 (114) 171 286 (114) 172 -0- -0- -0- Amortization of actuarial change 517 (206) 311 17 (7) 10 -0- -0- -0- Other comprehensive income (loss) $ (12,933) $ 124 $ (12,809) $ 8,716 $ 197 $ 8,913 $ 1,865 $ 644 $ 2,509 Total comprehensive income $ 4,519 $ 8,867 $ 21,661 Accumulated other comprehensive income (loss), net of tax effects, was as follows: Year Ended June 30 2009 2008 2007 (Amounts in Thousands) Foreign currency translation adjustments $ 7,821 $ 13,855 $ 4,765 Unrealized gain (loss) from: Available-for-sale securities 463 252 (181) Derivatives (5,731) (580) 134 Postemployment benefits: Prior service costs (980) (1,151) (1,323) Net actuarial loss (2,074) (68) -0- Accumulated other comprehensive income (loss) $ (501) $ 12,308 $ 3,395 Year Ended June 30, 2012 Year Ended June 30, 2011 Year Ended June 30, 2010 (Amounts in Thousands) Pre-tax Tax Net of Tax Pre-tax Tax Net of Tax Pre-tax Tax Net of Tax Net income $ 11,634 $ 4,922 $ 10,803 Other comprehensive income (loss): Foreign currency translation adjustments $ (10,156 ) $ 1,922 $ (8,234 ) $ 13,218 $ (2,905 ) $ 10,313 $ (12,672 ) $ 2,288 $ (10,384 ) Postemployment severance actuarial change 1,265 (505 ) 760 1,501 (599 ) 902 (1,292 ) 515 (777 ) Other fair value changes: Available-for-sale securities — — — — — — (131 ) 52 (79 ) Derivatives (192 ) 302 110 1,063 (489 ) 574 2,494 (587 ) 1,907 Reclassification to (earnings) loss: Foreign currency translation adjustments (1)(493 ) — (493 ) — — — — — — Available-for-sale securities — — — — — — (639 ) 255 (384 ) Derivatives 1,069 (346 ) 723 (1,555 ) 523 (1,032 ) (238 ) 55 (183 ) Amortization of prior service costs 286 (114 ) 172 286 (115 ) 171 285 (112 ) 173 Amortization of actuarial change 633 (252 ) 381 774 (309 ) 465 753 (300 ) 453 Other comprehensive income (loss) $ (7,588 ) $ 1,007 $ (6,581 ) $ 15,287 $ (3,894 ) $ 11,393 $ (11,440 ) $ 2,166 $ (9,274 ) Total comprehensive income $ 5,053 $ 16,315 $ 1,529 (1) The reclassification of foreign currency translation adjustments to earnings relates to the final liquidation of a foreign subsidiary.Accumulated other comprehensive income (loss), net of tax effects, was as follows: Year Ended June 30 2012 2011 2010 (Amounts in Thousands) Foreign currency translation adjustments $ (977 ) $ 7,750 $ (2,563 ) Net unrealized loss on derivatives (3,632 ) (4,465 ) (4,007 ) Postemployment benefits: Prior service costs (464 ) (636 ) (807 ) Net actuarial gain (loss) 110 (1,031 ) (2,398 ) Accumulated other comprehensive income (loss) $ (4,963 ) $ 1,618 $ (9,775 ) Note 1817 Restructuring Expense$3.0$3.4 million $21.9, $1.0 million, and $1.5$2.1 million in fiscal years 2012, 2011, and 2010, respectively. Restructuring plans which were active during fiscal year 2012 are discussed in the sections below.The EMS Gaylord restructuring plan and the Furniture segment office furniture manufacturing consolidation plan, which were substantially complete prior to fiscal year 2009, 2008, and 2007, respectively. The actions discussed below represent the majority of the restructuring costs during the fiscal years presented in the summary table on the following page. Former restructuring plans that are substantially complete and did not have significant expense during the fiscal years presented2012, are included in the summary table on the following page under the caption Other Restructuring Plans and includePlan caption. Due to a decline in the company-wide workforce restructuring plan, the Furniture segment consolidation and simplification plan,market value of the EMS segment Gaylord Hibbing and Auburn restructuring plans, andfacility, the Unallocated Corporate Gaylord and Auburn restructuring plans.The Company utilizes available market prices and management estimates to determine the fair value of impaired fixed assets. Restructuring charges are included in the Restructuring Expense line item on the Company's Consolidated Statements of Income.Office Furniture Manufacturing Consolidation64Fremont Restructuring Plan:During the firstsecond quarter of fiscal year 2009,2012, the Company approvedcompleted a restructuring plan to consolidate production of select office furniture manufacturing departments. The consolidation is expected to reduce manufacturing costs and excess capacity by eliminating redundant property and equipment, processes, and employee costs. The consolidation of these manufacturing departments resultedexit a small leased EMS assembly facility located in more efficient use of manufacturing space and enabled the Company to sell one of its Indiana facilities. The consolidation was substantially complete by the end of fiscal year 2009. The pre-tax charges related to the consolidation activities were approximately,Fremont, California. This plan had been approved in millions, $0.2 consisting of $0.4 of severance and other employee costs, $0.6 gain on the sale of a facility, $0.2 of property and equipment asset impairment, and $0.2 of other consolidation costs.European Consolidation Plan:During the fourth quarter of fiscal year 2008,2011. The Company is contractually obligated on the lease of this facility until August 2013. The Company expects total pre-tax restructuring charges, exclusive of future costs if the Company approvedis unable to sub-lease the facility, to be approximately European Consolidation Plan:During the second quarter of fiscal year 2012, the Company completed a plan to expand its European automotive electronics capabilities and to establish a European Medical Center of Expertise innear Poznan, Poland. This plan had been approved in the fourth quarter of fiscal year 2008. The Company presently has an operationplan was executed in Poznan. stages as follows:The Company successfully completed the move of production from Longford, Ireland, into the existinga former Poznan, Poland facility during the fiscal year 2009 second quarter. As partConstruction of the plan, the Company will also consolidate its EMS facilities located in Bridgend, Wales, and Poznan, Poland, into a new, larger facility in Poznan,Poland was completed in the fourth quarter of fiscal year 2009.The Company sold the former Poland facility and land during fiscal year 2010 and recorded a $6.7 million pre-tax gain which is expected to improvewas included in the Other General Income line on the Company's marginsConsolidated Statements of Income.The former Poland facility was leased back until the transfer of the remaining production to the new facility was completed in fiscal year 2011.The Company completed the consolidation of its EMS facility located in Wales, United Kingdom into the new facility. Production in Wales ceased and was transferred to the Poland facility in the very competitive EMS market. Constructionsecond quarter of fiscal year 2012. The lease for the Wales facility terminated in the third quarter of fiscal year 2012.Total pre-tax restructuring charges, excluding the gain on the sale of the former facility and construction of the new larger facility, in Poland is complete with limited production to begin early in the Company's fiscal year 2010. The Company intends to sell the existing Poland facility and real estate. The plan is being executed in stages with a projected completion date of December 2011. The Company currently estimates that the pre-tax charges related to the consolidation activities will bewere approximately, in millions, $20.7$23.0 consisting of $19.1$20.8 of severance and other employee costs, $0.3$0.4 of property and equipment asset impairment, $0.8$0.4 of lease exit costs, and $0.5$1.4 of other exit costs.Summary of All Plans AccruedJune 30,
2011 (3) Fiscal Year Ended June 30, 2012 AccruedJune 30, 2012 (3) Total ChargesIncurred
Since Plan Announcement (4) Total ExpectedPlan Costs (4)(Amounts in Thousands) AmountsCharged Cash AmountsCharged (Income) Non-cash Amounts Utilized/Cash Paid Adjustments EMS Segment FY 2011 Fremont Restructuring Plan Transition and Other Employee Costs $ 264 $ — $ 15 $ (236 ) $ (43 ) $ — $ 236 $ 236 Plant Closure and Other Exit Costs — 830 — (561 ) — 269 850 890 Total $ 264 $ 830 $ 15 $ (797 ) $ (43 ) $ 269 $ 1,086 $ 1,126 FY 2008 European Consolidation Plan Transition and Other Employee Costs $ 7,694 $ 937 $ — $ (8,506 ) $ (125 ) (5) $ — $ 20,831 $ 20,831 Asset Write-downs (Gain on Sale) — — (148 ) 148 — — 374 374 Plant Closure and Other Exit Costs — 1,156 (1,156 ) — — 1,814 1,814 Total $ 7,694 $ 2,093 $ (148 ) $ (9,514 ) $ (125 ) $ — $ 23,019 $ 23,019 Total EMS Segment $ 7,958 $ 2,923 $ (133 ) $ (10,311 ) $ (168 ) $ 269 $ 24,105 $ 24,145 Unallocated Corporate Other Restructuring Plan (1)— 99 572 (671 ) — — 1,436 1,557 Consolidated Total of All Plans $ 7,958 $ 3,022 $ 439 $ (10,982 ) $ (168 ) $ 269 $ 25,541 $ 25,702 Summary of All Plans Accrued
June 30,
2008 (4) Fiscal Year Ended June 30, 2009 Accrued
June 30,
2009 (4) Total Charges (Income)
Incurred Since Plan Announcement (5) Total Expected
Plan Costs (Income) (5) (Amounts in Thousands) Amounts
Charged (Income) Cash Amounts
Charged (Income)
Non-cash Amounts Utilized/
Cash Paid Adjustments EMS Segment FY 2008 European Consolidation Plan Transition and Other Employee Costs $ 15,117 $ 1,851 $ -0- $(2,498) $ (2,182) (7) $12,288 $ 17,601 $19,139 Asset Write-downs -0- -0- (63) 63 -0- -0- 346 346 Plant Closure and Other Exit Costs -0- 394 -0- (394) -0- -0- 457 1,180 Total $ 15,117 $ 2,245 $ (63) $(2,829) $ (2,182) $12,288 $ 18,404 $20,665 Other Restructuring Plans (1) 521 252 (41) (732) -0- -0- 2,933 (6) 2,933 (6) Total EMS Segment $ 15,638 $ 2,497 $ (104) $(3,561) $ (2,182) $12,288 $ 21,337 $23,598 Furniture Segment FY 2009 Office Furniture Manufacturing Consolidation Plan Transition and Other Employee Costs $ -0- $ 443 $ -0- $ (443) $ -0- $ -0- $ 443 $ 443 Asset Write-downs (Gain on Sale) -0- (608) (8) 168 440 -0- -0- (440) (537) (8) Plant Closure and Other Exit Costs -0- 232 -0- (232) -0- -0- 232 232 Total $ -0- $ 67 $ 168 $ (235) $ -0- $ -0- $ 235 $ 138 Other Restructuring Plans (1) 487 (93) -0- (394) -0- -0- 1,097 1,097 Total Furniture Segment $ 487 $ (26) $ 168 $ (629) $ -0- $ -0- $ 1,332 $ 1,235 Unallocated Corporate Other Restructuring Plans (1) 183 232 214 (629) -0- -0- 920 1,111 Consolidated Total of All Plans $ 16,308 $ 2,703 $ 278 $(4,819) $ (2,182) $12,288 $ 23,589 $25,944 Accrued
June 30,
2007 (4) Fiscal Year Ended June 30, 2008 Accrued
June 30,
2008 (4) (Amounts in Thousands) Amounts
Charged-Cash Amounts
Charged-
Non-cash Amounts Utilized/
Cash Paid Adjustments EMS Segment FY 2008 European Consolidation Plan Transition and Other Employee Costs $ -0- $ 15,750 $ -0- $ (918) $ 285 (7) $15,117 Asset Write-downs -0- -0- 409 (409) -0- -0- Plant Closure and Other Exit Costs -0- 63 -0- (63) -0- -0- Total $ -0- $ 15,813 $ 409 $(1,390) $ 285 $15,117 Other Restructuring Plans (2) 1,042 1,554 1,167 (2,967) (275) (6) 521 Total EMS Segment $ 1,042 $ 17,367 $ 1,576 $(4,357) $ 10 $15,638 Furniture Segment Other Restructuring Plans (2) 6 1,052 1,161 (1,732) -0- 487 Unallocated Corporate Other Restructuring Plans (2) -0- 501 254 (572) -0- 183 Consolidated Total of All Plans $ 1,048 $ 18,920 $ 2,991 $(6,661) $ 10 $16,308 65 Accrued
June 30,
2006 (4) Fiscal Year Ended June 30, 2007 Accrued
June 30,
2007 (4) (Amounts in Thousands) Amounts
Charged-Cash Amounts
Charged (Income)
Non-cash Amounts Utilized/
Cash Paid Adjustments EMS Segment Other Restructuring Plans (3) $ 356 $ 337 $ (242) $ (451) $ 1,042 (6) $ 1,042 Furniture Segment Other Restructuring Plans (3) 21 72 1,195 (1,282) -0- 6 Unallocated Corporate Other Restructuring Plans (3) -0- 166 -0- (166) -0- -0- Consolidated Total of All Plans $ 377 $ 575 $ 953 $(1,899) $ 1,042 $ 1,048 (1) Other Restructuring Plans with charges during fiscal year 2009 include the EMS segment Hibbing plan initiated in fiscal year 2008, the EMS segment and Unallocated Corporate Gaylord restructuring plan initiated in fiscal year 2007, and the company-wide workforce restructuring plan initiated in fiscal year 2008. (2) Other Restructuring Plans with charges and adjustments during fiscal year 2008 include the the Furniture segment consolidation and simplification plan initiated in fiscal year 2006, the EMS segment Hibbing plan initiated in fiscal year 2008 and Gaylord plan initiated in fiscal year 2007, the Unallocated Corporate Gaylord restructuring plan initiated in fiscal year 2007 and Auburn restructuring plan initiated in fiscal year 2006, and the company-wide workforce restructuring plan initiated in fiscal year 2008. (3) Other Restructuring Plans with charges and adjustments during fiscal year 2007 include the EMS segment Gaylord plan initiated in fiscal year 2007 and Auburn plan initiated in fiscal year 2006, the Furniture segment consolidation and simplification plan initiated in fiscal year 2006, and the Unallocated Corporate Auburn restructuring plan initiated in fiscal year 2006. (4) Accrued restructuring at June 30, 2009, June 30, 2008, and June 30, 2007 was $12.3 million, $16.3 million, and $1.0 million, respectively. The balances include $3.8 million, $6.7 million, and $1.0 million recorded in current liabilities and $8.5 million, $9.6 million, and $0.0 million recorded in other long-term liabilities at June 30, 2009, June 30, 2008, and June 30, 2007, respectively. (5) These columns include restructuring plans that were active during fiscal year 2009, including the EMS segment European Consolidation Plan and Hibbing Plan, both initiated in fiscal year 2008, the Furniture segment Office Furniture Manufacturing Consolidation Plan initiated in fiscal year 2009, the EMS segment and Unallocated Corporate Gaylord restructuring plan initiated in fiscal year 2007, and the company-wide workforce restructuring plan initiated in fiscal year 2008. (6) In addition to the incurred charges and total expected plan costs in the EMS segment shown above, an additional $0.8 million increase in restructuring reserves were recognized as an adjustment to the purchase price allocation of the acquisition of Reptron, which increased the goodwill balance of the acquired entity, during fiscal years 2007 and 2008. (7) The effect of changes in foreign currency exchange rates within the EMS segment primarily due to revaluation of the restructuring liability is included in this amount. (8) The consolidation of office furniture manufacturing departments resulted in more efficient use of manufacturing space and enabled the Company to sell an Indiana facility, resulting in a gain on the sale during fiscal year 2009. An additional gain of $0.1 million is expected in fiscal year 2010 upon the sale of additional land. Fiscal Year Ended June 30, 2011 (Amounts in Thousands) AccruedJune 30, 2010 (3) AmountsCharged Cash AmountsCharged Non-cash Amounts Utilized/Cash Paid Adjustments AccruedJune 30, 2011 (3)EMS Segment FY 2011 Fremont Restructuring Plan Transition and Other Employee Costs $ — $ 246 $ 18 $ — $ — $ 264 Plant Closure and Other Exit Costs — 20 — (20 ) — — Total $ — $ 266 $ 18 $ (20 ) $ — $ 264 FY 2008 European Consolidation Plan Transition and Other Employee Costs $ 9,181 $ 619 $ — $ (2,776 ) $ 670 (5) $ 7,694 Plant Closure and Other Exit Costs — 2 — (2 ) — — Total $ 9,181 $ 621 $ — $ (2,778 ) $ 670 $ 7,694 Total EMS Segment $ 9,181 $ 887 $ 18 $ (2,798 ) $ 670 $ 7,958 Unallocated Corporate Other Restructuring Plan (1)— 104 — (104 ) — — Consolidated Total of All Plans $ 9,181 $ 991 $ 18 $ (2,902 ) $ 670 $ 7,958 AccruedJune 30,
2009 (3) Fiscal Year Ended June 30, 2010 AccruedJune 30,
2010 (3)(Amounts in Thousands) AmountsCharged (Income) Cash AmountsChargedNon-cash Amounts Utilized/Cash Paid Adjustments EMS Segment FY 2008 European Consolidation Plan Transition and Other Employee Costs $ 12,288 $ 1,673 $ — $ (3,681 ) $ (1,099 ) (5) $ 9,181 Asset Write-downs — — 176 (176 ) — — Plant Closure and Other Exit Costs — 200 — (200 ) — — Total EMS Segment $ 12,288 $ 1,873 $ 176 $ (4,057 ) $ (1,099 ) $ 9,181 Furniture Segment Other Restructuring Plan (2)— (83 ) — 83 — — Unallocated Corporate Other Restructuring Plan (2)— 85 — (85 ) — — Consolidated Total of All Plans $ 12,288 $ 1,875 $ 176 $ (4,059 ) $ (1,099 ) $ 9,181 (1) The Other Restructuring Plan with charges during fiscal years 2012 and 2011 is the Unallocated Corporate Gaylord restructuring plan initiated in fiscal year 2007.(2) Other Restructuring Plans with charges during fiscal year 2010 include the Furniture segment office furniture manufacturing consolidation plan initiated in fiscal year 2009 and the Unallocated Corporate Gaylord restructuring plan initiated in fiscal year 2007.(3) Accrued restructuring at June 30, 2012 was $0.3 million recorded in current liabilities. At June 30, 2011 accrued restructuring was $8.0 million recorded in current liabilities. At June 30, 2010 accrued restructuring was $9.2 million consisting of $2.5 million recorded in current liabilities and $6.7 million recorded in other long-term liabilities.(4) These columns include restructuring plans that were active during fiscal year 2012, including the EMS segment European Consolidation Plan initiated in fiscal year 2008, the EMS segment Fremont Restructuring Plan initiated in fiscal year 2011, and the Unallocated Corporate Gaylord restructuring plan initiated in fiscal year 2007.(5) The effect of changes in foreign currency exchange rates within the EMS segment due to revaluation of the restructuring liability is included in this amount. 66Note 18 Variable Interest EntitiesThe Company's involvement with variable interest entities (VIEs) is limited to situations in which the Company is not the primary beneficiary as the Company lacks the power to direct the activities that most significantly impact the VIE's economic performance. Thus, consolidation is not required.The Company is involved with VIEs consisting of an investment in common stock and stock warrants of a privately-held company, a note receivable related to the sale of an Indiana facility, and notes receivable resulting from loans provided to an electronics engineering services firm during fiscal year 2011. The Company also has a business development cooperation agreement with the electronic engineering services firm. For information related to the Company's investment in the privately-held company, see Note 12 - Investments and Note 11 - Derivative Instruments of Notes to Consolidated Financial Statements. The combined carrying value of the notes receivable was $2.6 million and $2.8 million as of June 30, 2012 and June 30, 2011, respectively, with no reserve, with the short-term portion recorded on the Receivables line and the long-term portion recorded on the Other Assets line of the Company's Consolidated Balance Sheet. The Company has no obligation to provide additional funding to the VIEs, and thus its exposure and risk of loss related to the VIEs is limited to the carrying value of the investments and notes receivable. Financial support provided by the Company to the VIEs was limited to the items discussed above during the fiscal year ended June 30, 2012.Note 19 Discontinued OperationsFiscal Year 2007 Discontinued Operations:DuringCredit Quality and Allowance for Credit Losses of Notes ReceivableThe Company monitors credit quality and associated risks of notes receivable on an individual basis based on criteria such as financial stability of the first quarterparty and collection experience in conjunction with general economic and market conditions. The due date for the note receivable from the sale of fiscal year 2007,an Indiana facility was extended until June 30, 2014, and the Company approved a plancontinues to exithold collateral for this note receivable thereby mitigating the productionrisk of wood rear projection television (PTV) cabinets and stands within the Furniture segment, which affected the Company's Juarez, Mexico, operation. With the exit, the Company no longer has continuing involvement with the production of PTV cabinets and stands. Production at the Juarez facility ceased during the second quarter of fiscal year 2007, and all inventory has been sold. Miscellaneous wrap-up activities including disposition of remaining equipment were complete asloss. As of June 30, 2007. Beginning in the quarter ended December 31, 2006, the year-to-date financial results associated with the Mexican operations in the Furniture segment were classified as discontinued operations,2012 and all prior periods were restated. Their operating results and gains (losses) on disposal are presented on the Loss from Discontinued Operations, Net of Tax line item2011, none of the Consolidated Statements of Income.The Company utilized available market prices and management estimates to determine the fair value of impaired fixed assets. The costs shown below related to the exit of PTV cabinet and stand production at the Juarez facility are included in discontinued operations and those costs related to the building lease and other costs after production of PTV cabinets and stands ceased are included in continuing operations. Thereoutstanding notes receivable were no charges related to exit activities at the Juarez facility during fiscal year 2009. Pre-tax charges related to exit activities at the Juarez facility during fiscal years 2008 and 2007 were as follows: (Amounts in Thousands) 2008 Exit costs in continuing operations $ -0- $ -0- $ 1,272 $ 1,272 Exit costs in discontinued operations -0- 30 13 43 $ -0- $ 30 $ 1,285 $ 1,315 2007 Exit costs in continuing operations $ -0- $ -0- $ 648 $ 648 Exit costs in discontinued operations 1,623 1,101 994 3,718 $ 1,623 $ 1,101 $ 1,642 $ 4,366 Total Exit costs in continuing operations $ -0- $ -0- $ 1,920 $ 1,920 Exit costs in discontinued operations $ 1,623 $ 1,131 $ 1,007 $ 3,761 $ 1,623 $ 1,131 $ 2,927 $ 5,681 During fiscal year 2009, the Company did not classify any additional businesses as discontinued operations. Operating results and the loss on sale of the fiscal year 2007 discontinued operations were as follows:past due.
Year Ended June 30 (Amounts in Thousands) Net Sales of Discontinued Operations $ -0- $ -0- $ 8,744 Operating Loss of Discontinued Operations $ -0- $ (78) $ (5,046) Benefit (Provision) for Income Taxes -0- (46) 1,978 Operating Loss of Discontinued Operations, Net of Tax $ -0- $ (124) $ (3,068) Loss on Disposal of Discontinued Operations $ -0- $ -0- $ (1,600) Benefit for Income Taxes -0- -0- 554 Loss on Disposal of Discontinued Operations, Net of Tax $ -0- $ -0- $ (1,046) Loss from Discontinued Operations, Net of Tax $ -0- $ (124) $ (4,114) As of June 30, 2012 As of June 30, 2011 (Amounts in Thousands) Unpaid Balance Related Allowance Receivable Net of Allowance Unpaid Balance Related Allowance Receivable Net of Allowance Note Receivable from Sale of Indiana Facility $ 1,409 $ — $ 1,409 $ 1,334 $ — $ 1,334 Notes Receivable from an Electronics Engineering Services Firm 1,221 — 1,221 1,420 — 1,420 Other Notes Receivable 322 214 108 — — — Total $ 2,952 $ 214 $ 2,738 $ 2,754 $ — $ 2,754 67Note 20 Quarterly Financial Information (Unaudited) Three Months Ended (Amounts in Thousands, Except for Per Share Data) September 30 December 31 March 31 June 30 Fiscal Year 2009: Net Sales(1) $ 339,495 $ 327,606 $ 268,852 $ 271,467 Gross Profit(1) 58,512 56,321 42,483 45,203 Other General Income (2) -0- (9,906) (23,178) (333) Restructuring Expense 963 1,053 689 276 Goodwill Impairment -0- -0- 14,559 -0- Income from Continuing Operations 2,184 8,182 4,114 2,848 Net Income 2,184 8,182 4,114 2,848 Basic Earnings Per Share from Continuing Operations: Class A $ 0.06 $ 0.22 $ 0.11 $ 0.07 Class B $ 0.06 $ 0.22 $ 0.11 $ 0.08 Diluted Earnings Per Share from Continuing Operations: Class A $ 0.06 $ 0.22 $ 0.11 $ 0.07 Class B $ 0.06 $ 0.22 $ 0.11 $ 0.08 Basic Earnings Per Share: Class A $ 0.06 $ 0.22 $ 0.11 $ 0.07 Class B $ 0.06 $ 0.22 $ 0.11 $ 0.08 Diluted Earnings Per Share: Class A $ 0.06 $ 0.22 $ 0.11 $ 0.07 Class B $ 0.06 $ 0.22 $ 0.11 $ 0.08 Fiscal Year 2008: Net Sales $ 333,937 $ 347,794 $ 332,091 $ 338,163 Gross Profit 67,780 66,680 56,073 57,941 Restructuring Expense 321 623 3,958 17,009 Income (Loss) from Continuing Operations (3) 6,562 4,240 (889) (9,835) Net Income (Loss) (3) 6,438 4,240 (889) (9,835) Basic Earnings (Loss) Per Share from Continuing Operations: Class A $ 0.18 $ 0.11 $ (0.02) $ (0.27) Class B $ 0.17 $ 0.12 $ (0.02) $ (0.27) Diluted Earnings (Loss) Per Share from Continuing Operations: Class A $ 0.17 $ 0.11 $ (0.02) $ (0.27) Class B $ 0.17 $ 0.11 $ (0.02) $ (0.27) Basic Earnings (Loss) Per Share: Class A $ 0.17 $ 0.11 $ (0.02) $ (0.27) Class B $ 0.17 $ 0.12 $ (0.02) $ (0.27) Diluted Earnings (Loss) Per Share: Class A $ 0.17 $ 0.11 $ (0.02) $ (0.27) Class B $ 0.17 $ 0.11 $ (0.02) $ (0.27) (1)Net sales and gross profit are from continuing operations. Operating results from the Genesis Electronics Manufacturing acquisition are included in the table above as of September 1, 2008 and had an immaterial impact.(2)Other General Income included $8.0 million, $23.2 million, and $0.3 million for the quarters ended December 31, 2008, March 31, 2009, and June 30, 2009, respectively, pre-tax gain related to the sale of undeveloped land and timberland holdings and $1.9 million, pre-tax, for the quarter ended December 31, 2008 related to the earnest money deposits retained by the Company resulting from the termination of the contract to sell and lease back the Company's Poland building and real estate.(3)Income from continuing operations and net income for the quarter ended September 30, 2007 included $0.7 million ($0.02 per diluted share) of after-tax income received as part of a Polish offset credit program for investments made in the Company's Poland operation. Three Months Ended (Amounts in Thousands, Except for Per Share Data) September 30 December 31 March 31 June 30 Fiscal Year 2012: Net Sales $ 270,635 $ 296,904 $ 284,414 $ 290,108 Gross Profit 46,970 54,320 50,639 58,026 Restructuring Expense 113 1,480 895 930 Net Income (Loss) (146 ) 3,197 2,506 6,077 Basic Earnings (Loss) Per Share: Class A $ (0.01 ) $ 0.08 $ 0.06 $ 0.16 Class B $ — $ 0.09 $ 0.07 $ 0.16 Diluted Earnings (Loss) Per Share: Class A $ (0.01 ) $ 0.08 $ 0.06 $ 0.16 Class B $ — $ 0.09 $ 0.07 $ 0.16 Fiscal Year 2011: Net Sales $ 294,676 $ 310,632 $ 314,466 $ 282,823 Gross Profit 47,147 49,576 50,691 47,178 Restructuring Expense 117 368 68 456 Net Income 456 876 3,306 284 Basic Earnings Per Share: Class A $ 0.01 $ 0.02 $ 0.08 $ — Class B $ 0.01 $ 0.02 $ 0.09 $ 0.01 Diluted Earnings Per Share: Class A $ 0.01 $ 0.02 $ 0.08 $ — Class B $ 0.01 $ 0.02 $ 0.09 $ 0.01 Item 9 -Changes in and Disagreements With Accountants on Accounting and Financial DisclosureNone.None.Item 9A - - Controls and Procedures(a) Evaluation of disclosure controls and procedures.The Company maintains controls and procedures designed to ensure that information required to be disclosed in the reports that the Company files or submits under the Securities Exchange Act of 1934 is recorded, processed, summarized, and reported within the time periods specified in the rules and forms of the Securities and Exchange Commission and that such information is accumulated and communicated to the Company's management, including its Chief Executive Officer and Chief Financial Officer, as appropriate, to allow timely decisions regarding required disclosure. Based upon their evaluation of those controls and procedures performed as of June 30, 2009,2012, the Chief Executive Officer and Chief Financial Officer of the Company concluded that its disclosure controls and procedures were effective.(b) Management's report on internal control over financial reporting.Pursuant to Section 404 of the Sarbanes-Oxley Act of 2002 and the rules and regulations adopted pursuant thereto, the Company included a report of management's assessment of the effectiveness of its internal control over financial reporting as part of this report. The effectiveness of the Company's internal control over financial reporting as of June 30, 20092012 has been audited by the Company's independent registered public accounting firm. Management's report and the independent registered public accounting firm's attestation report are included in the Company's Consolidated Financial Statements under the captions entitled "Management's Report on Internal Control Over Financial Reporting" and "Report of Independent Registered Public Accounting Firm" and are incorporated herein by reference.68(c) Changes in internal control over financial reporting.There have been no changes in the Company's internal control over financial reporting that occurred during the quarter ended June 30, 20092012 that have materially affected, or that are reasonably likely to materially affect, the Company's internal control over financial reporting.Item 9B -Other InformationNone.In lieu of filing a Form 8-K under Item 5.02 "Departure of Directors or Certain Officers; Election of Directors; Appointment of Certain Officers; Compensatory Arrangements of Certain Officers," the Company is providing the following disclosure in this Form 10-K as the Form 10-K is being filed within the four business day reporting requirement for the event.On August 27, 2009, the Compensation and Governance Committee of the Board of Directors of the Company approved a decrease to the base salary of the Company's Chairman of the Board (the "Chairman"), Douglas A. Habig. The Compensation and Governance Committee has historically and independently set the compensation of the Chairman, because Mr. Habig, a former Chief Executive Officer of the Company, remained an employee of the Company since becoming Chairman, and receives no director fees as an employee Chairman under the Board of Directors' fee structure. As disclosed in the Company's 2008 Proxy Statement, the Compensation and Governance Committee began a process in 2007 of examining and clarifying the proper role and duties of the Chairman and Chief Executive Officer such that the Chairman focuses on the effective operation of the Board of Directors while the Chief Executive Officer performs his duties in regard to the executive management of the Company. Continuing this examination at its August 2009 meeting, the Compensation and Governance Committee determined that a further adjustment to the Chairman's compensation was warranted. The Compensation and Governance Committee unanimously approved a salary decrease from the current annualized base of $257,400 to $170,040 which will take effect on September 7, 2009.PART IIIItem 10 - - Directors, Executive Officers and Corporate GovernanceDirectorsDirectors20, 200916, 2012 under the caption "Election of Directors."
CommitteesCommittees20, 200916, 2012 under the caption "Information Concerning the Board of Directors and Committees."Executive Officers of the RegistrantThe information required by this item with respect to Executive Officers of the Registrant is included at the end of Part I and is incorporated herein by reference.Compliance with Section 16(a) of the Exchange ActThe information required by this item with respect to compliance with Section 16(a) of the Securities Exchange Act of 1934 is incorporated by reference to the material contained in the Company's Proxy Statement for its annual meeting of Share Owners to be held October 20, 200916, 2012 under the caption "Section 16(a) Beneficial Ownership Reporting Compliance."Code of EthicsThe Company has a code of ethics that applies to all of its employees, including the Chief Executive Officer, the Chief Financial Officer, and the Chief Accounting Officer. The code of ethics is posted on the Company's website at www.ir.kimball.com. It is the Company's intention to disclose any amendments to the code of ethics on this website. In addition, any waivers of the code of ethics for directors or executive officers of the Company will be disclosed in a Current Report on Form 8-K.Item 11 - Executive CompensationThe information required by this item is incorporated by reference to the material contained in the Company's Proxy Statement for its annual meeting of Share Owners to be held October 20, 200916, 2012 under the captions "Information Concerning the Board of Directors and Committees," "Compensation Discussion and Analysis," "Compensation Committee Report," "Compensation Related Risk Assessment," and "Executive Officer and Director Compensation."69The following table summarizesinformation required by this item is incorporated by reference to the material contained in the Company's equity compensation plans asProxy Statement for its annual meeting of June 30, 2009:
October 16, 2012 under the Number of Securities to be Issued Upon Exercise of Outstanding Options, Warrants and Rights Weighted Average Exercise Price of Outstanding Options, Warrants and Rights Number of Securities Remaining Available for Future Issuance Under Equity Compensation Plans (excluding securities reflected in first column) Equity compensation plans approved by Share Owners 1,895,503 (1) $15.36(2) 645,064 (3) Equity compensation plans not approved by Share Owners -0- -0- -0- Total 1,895,503 $15.36 645,064 (1) Includes 747,518 Class B stock option grants, 870,935 Class A and 37,100 Class B performance share awards, and 199,200 Class A and 40,750 Class B restricted share unit awards. The number of performance shares assumes that performance targets willShare Owners to be met.(2) Performance shares and restricted share units not included as there is no exercise price for these awards.(3) Includes 645,064 Class A and Class B shares available for issuance as restricted stock, restricted share units, unrestricted share grants, incentive stock options, nonqualified stock options, performance shares, performance units, and stock appreciation rightsheld Company's 2003 Stock Optioncaption "Executive Officer and Incentive Plan. No shares remain availableDirector Compensation — Securities Authorized for issuance under the Company's prior stock option plans.Issuance Under Equity Compensation Plans."Item 13 - Certain Relationships and Related Transactions, and Director IndependenceRelationships and Related TransactionsThe information required by this item is incorporated by reference to the material contained in the Company's Proxy Statement for its annual meeting of Share Owners to be held October 20, 200916, 2012 under the caption "Review and Approval of Transactions with Related Persons."Director IndependenceThe information required by this item is incorporated by reference to the material contained in the Company's Proxy Statement for its annual meeting of Share Owners to be held October 20, 200916, 2012 under the caption "Information Concerning the Board of Directors and Committees."Item 14 - Principal Accounting Fees and ServicesThe information required by this item is incorporated by reference to the material contained in the Company's Proxy Statement for its annual meeting of Share Owners to be held October 20, 200916, 2012 under the caption "Independent Registered Public Accounting Firm" and "Appendix A -— Approval Process for Services Performed by the Independent Registered Public Accounting Firm."70PART IVItem 15 - Exhibits, Financial Statement Schedules(a) (a) The following documents are filed as part of this report: (1) Financial Statements: The following consolidated financial statements of the Company are found in Item 8 and incorporated herein. (2) Financial Statement Schedules: Schedules other than those listed above are omitted because they are either not required or not applicable, or the required information is presented in the Consolidated Financial Statements. (3) ExhibitsSee the Index of Exhibits on page 8775 for a list of the exhibits filed or incorporated herein as a part of this report.71SIGNATURESPursuant to the requirements of Section 13 or 15(d) of the Securities Exchange Act of 1934, the Registrant has duly caused this report to be signed on its behalf by the undersigned, thereunto duly authorized. KIMBALL INTERNATIONAL, INC. By: /s/ ROBERT F. SCHNEIDER By: /s/ Robert F. Schneider ROBERT F. SCHNEIDER
Executive Vice President,Chief Financial Officer August 31, 200927, 2012Pursuant to the requirements of the Securities Exchange Act of 1934, this report has been signed below by the following persons on behalf of the Registrant and in the capacities and on the dates indicated: /s/ JAMES C. THYEN James C. Thyen JAMES C. THYENPresident, President,
Chief Executive OfficerAugust 31, 2009 August 27, 2012 /s/ ROBERT F. SCHNEIDER Robert F. Schneider ROBERT F. SCHNEIDER
Executive Vice President,Chief Financial OfficerAugust 31, 2009 Chief Financial Officer August 27, 2012 /s/ MICHELLE R. SCHROEDER Michelle R. Schroeder MICHELLE R. SCHROEDER
Vice President,Chief Accounting Officer August 31, 2009Signature August 27, 2012 72Signature Signature Geoffrey L. StringerDOUGLAS A. HABIG *Harry W. Bowman*GEOFFREY L. STRINGER HARRY W. BOWMAN * Douglas A. Habig Harry W. Bowman Chairman of the Board Director THOMAS J. TISCHHAUSER * GEOFFREY L. STRINGER * Thomas J. Tischhauser Geoffrey L. Stringer Director Director Thomas J. TischhauserCHRISTINE M. VUJOVICH *JACK R. WENTWORTH * Christine M. Vujovich Jack R. Wentworth Director Director * The undersigned does hereby sign this document on my behalf pursuant to powers of attorney duly executed and filed with the Securities and Exchange Commission, all in the capacities as indicated: Date August 27, 2012 /s/ JAMES C. THYEN James C. Thyen *THOMAS J. TISCHHAUSER JAMES C. THYENDirectorPresident, Chief Executive Officer, Director Christine M. Vujovich *Jack R. Wentworth *CHRISTINE M. VUJOVICHJACK R. WENTWORTHDirectorDirector* The undersigned does hereby sign this document on my behalf pursuant to powers of attorney duly executed and filed with the Securities and Exchange Commission, all in the capacities as indicated:DateAugust 31, 2009/s/ Douglas A. HabigDOUGLAS A. HABIGDirector73Schedule II. - Valuation and Qualifying Accounts
Description
of Year
to Expense
Other
Accounts
and
Recoveries
at End
of Year(Amounts in Thousands) Year Ended June 30, 2009 Valuation Allowances: Short-Term Receivable Allowance $ 1,057 $ 4,137 $ 93 $ (921) $ 4,366 Long-Term Note Receivable Allowance $ -0- $ -0- $ -0- $ -0- $ -0- Deferred Tax Asset $ 4,966 $ 288 $ -0- $ (122) $ 5,132 Year Ended June 30, 2008 Valuation Allowances: Short-Term Receivable Allowance $ 1,477 $ 48 $ 11 $ (479) $ 1,057 Long-Term Note Receivable Allowance $ 1,400 $ 300 $ -0- $ (1,700) $ -0- Deferred Tax Asset $ 4,420 $ 1,159 $ -0- $ (613) $ 4,966 Year Ended June 30, 2007 Valuation Allowances: Short-Term Receivable Allowance $ 1,282 $ (282) $ 242 $ 235 $ 1,477 Long-Term Note Receivable Allowance $ 1,400 $ -0- $ -0- $ -0- $ 1,400 Deferred Tax Asset $ 3,856 $ 574 $ -0- $ (10) $ 4,420 Description Balance atBeginningof Year Additionsto Expense Adjustments to OtherAccounts Write-offs andRecoveries Balance atEnd of Year(Amounts in Thousands) Year Ended June 30, 2012 Valuation Allowances: Short-Term Receivables $ 1,799 $ 267 $ (83 ) $ (616 ) $ 1,367 Deferred Tax Asset $ 6,698 $ 355 $ — $ (5,142 ) $ 1,911 Year Ended June 30, 2011 Valuation Allowances: Short-Term Receivables $ 3,349 $ 476 $ 195 $ (2,221 ) $ 1,799 Long-Term Notes Receivable $ 69 $ — $ — $ (69 ) $ — Deferred Tax Asset $ 5,777 $ 1,297 $ — $ (376 ) $ 6,698 Year Ended June 30, 2010 Valuation Allowances: Short-Term Receivables $ 4,366 $ 232 $ (45 ) $ (1,204 ) $ 3,349 Long-Term Notes Receivable $ — $ 69 $ — $ — $ 69 Deferred Tax Asset $ 5,132 $ 814 $ — $ (169 ) $ 5,777 74INDEX OF EXHIBITSExhibit No. Exhibit No.Description 3(a) Amended and restated Articles of Incorporation of the Company (Incorporated by reference to Exhibit 3(a) to the Company's Form 10-K for the year ended June 30, 2007)3(b) Restated By-laws of the Company (Incorporated by reference to Exhibit 3(b) to the Company's Form 8-K filed August 3,October 23, 2009)10(a)* Summary of Director and Named Executive Officer Compensation 10(b)* Supplemental Bonus PlanDiscretionary Compensation 10(c)* 2003 Stock Option and Incentive Plan (Incorporated by reference to Exhibit 10(d) to the Company's Form 10-Q for the period ended December 31, 2008) 10(d)* Supplemental Employee Retirement Plan (2009 Revision) (Incorporated by reference to Exhibit 10(c) to the Company's Form 10-Q for the period ended December 31, 2008) 10(e)* 1996 Stock Incentive Program (Incorporated by reference to Exhibit 10(e) to the Company's Form 10-K for the year ended June 30, 2006)2011)10(f)* Form of Restricted Stock Unit Award Agreement (Incorporated by reference to Exhibit 10.1 to the Company's Form 8-K/A filed January 24, 2005)10(g)*Form of Annual Performance Share Award Agreement, as amended on August 22, 2006 (Incorporated by reference to Exhibit 10(b)10(a) to the Company's Form 10-Q for the period ended September 30, 2006)2011)10(h)10(g)Credit Agreement, dated as of April 23, 2008, among the Company, the lenders party thereto and JPMorgan Chase Bank, N.A., as Agent and Letter of Credit Issuer (Incorporated by reference to Exhibit 10.1 to the Company's Form 8-K filed April 28, 2008) 10(i)10(h)*Form of Employment Agreement dated March 8, 2010 between the Company and each of Donald W. Van Winkle and Stanley C. Sapp and dated May 1, 2006 between the Company and each of James C. Thyen, Douglas A. Habig, Robert F. Schneider, Donald D. Charron, P. Daniel Miller, John H. Kahle and Gary W. Schwartz (Incorporated by reference to Exhibit 10(c)10(h) to the Company's Form 10-Q10-K for the periodyear ended March 31, 2006)June 30, 2011)10(j)10(i)*Form of Long Term Performance Share Award, as amended on August 22, 2006 (Incorporated by reference to Exhibit 10(c)10(b) to the Company's Form 10-Q for the period ended September 30, 2006)2011)10(k)10(j)*Description of the Company's 20052010 Profit Sharing Incentive Bonus Plan (Incorporated by reference to Exhibit 10.1 to the Company's Form 8-K filed October 18, 2005)10(l)Contract to Purchase Real Estate at Public Auction (Incorporated by reference to Exhibit 10.1 to the Company's Form 8-K filed November 14, 2008)25, 2010)11 Computation of Earnings Per Share (Incorporated by reference to Note 1615 - Earnings Per Share of Notes to Consolidated Financial Statements)21 Subsidiaries of the Registrant 23 Consent of Independent Registered Public Accounting Firm 24 Power of Attorney 31.1 31.1Certification filed by Chief Executive Officer pursuant to Rule 13a-14(a)/15d-14(a), as adopted pursuant to Section 302 of the Sarbanes-Oxley Act of 2002 31.2 Certification filed by Chief Financial Officer pursuant to Rule 13a-14(a)/15d-14(a), as adopted pursuant to Section 302 of the Sarbanes-Oxley Act of 2002 32.1 Certification furnished by the Chief Executive Officer pursuant to 18 U.S.C. Section 1350, as adopted pursuant to Section 906 of the Sarbanes-Oxley Act of 2002 32.2 Certification furnished by the Chief Financial Officer pursuant to 18 U.S.C. Section 1350, as adopted pursuant to Section 906 of the Sarbanes-Oxley Act of 2002 * = constitutes management contract or compensatory arrangement101.INSXBRL Instance Document ** 101.SCH XBRL Taxonomy Extension Schema Document ** 101.CAL XBRL Taxonomy Extension Calculation Linkbase Document ** 101.DEF XBRL Taxonomy Extension Definition Linkbase Document ** 101.LAB XBRL Taxonomy Extension Label Linkbase Document ** 101.PRE XBRL Taxonomy Extension Presentation Linkbase Document ** 87* Constitutes management contract or compensatory arrangement** These interactive data files shall not be deemed filed for purposes of Section 11 or 12 of the Securities Act of 1933 or Section 18 of the Securities Exchange Act of 1934 or otherwise subject to liability under those sections.75