PART II
Item 5.Market for Registrant's Common Equity, Related Stockholder Matters and Issuer Purchases of Equity Securities.
The New York Stock Exchange is the principal market on which our common stock is traded, under the ticker symbol MAS. On January 31, 2020,2023, there were approximately 3,1002,600 holders of record of our common stock.
We expect that our practice of paying quarterly dividends on our common stock will continue, although the payment of future dividends is at the discretion of our Board of Directors and will depend upon our earnings, capital requirements, financial condition and other factors. The Board of Directors declared a quarterly dividend of $0.285 per share in the first quarter of 2023 with the intention to increase the annual dividend to $1.14 per share.
16
| Period | Total Number of Shares Purchased | Average Price Paid Per Common Share | Total Number of Shares Purchased as Part of Publicly Announced Plans or Programs | Maximum Value of Shares That May Yet Be Purchased Under the Plans or Programs | |||||||||
| 10/1/19 - 10/31/19 | 726,500 | $ | 42.52 | 726,500 | $ | 1,926,741,040 | |||||||
11/1/19 - 11/30/19 (A) | 7,869,212 | $ | 54.03 | 7,869,212 | $ | 1,501,539,755 | |||||||
| 12/1/19 - 12/31/19 | — | $ | — | — | $ | 1,501,539,755 | |||||||
| Total for the quarter | 8,595,712 | 8,595,712 | $ | 1,501,539,755 | |||||||||
Performance Graph
The table below compares the cumulative total shareholder return on our common stock with the cumulative total return of (i) the Standard & Poor's 500 Composite Stock Index ("S&P 500 Index"), (ii) The Standard & Poor's Industrials Index ("S&P Industrials Index") and (iii) the Standard & Poor's Consumer Durables & Apparel Index ("S&P Consumer Durables & Apparel Index"), from December 31, 20142017 through December 31, 2019,2022, when the closing price of our common stock was $47.99.$46.67. The graph assumes investments of $100 on December 31, 20142017 in our common stock and in each of the three indices and the reinvestment of dividends.
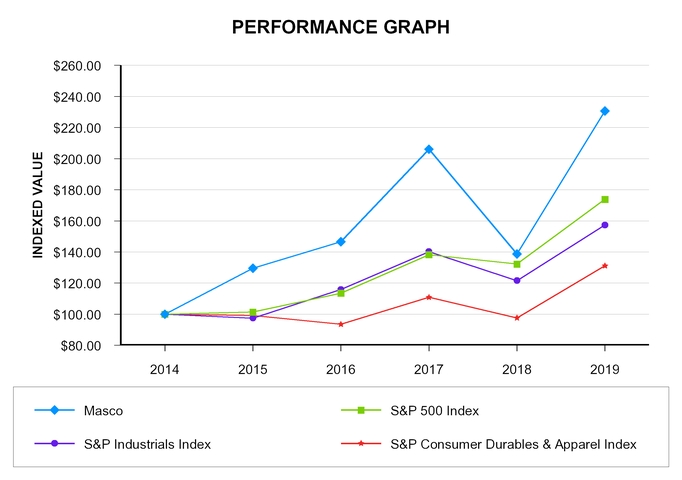
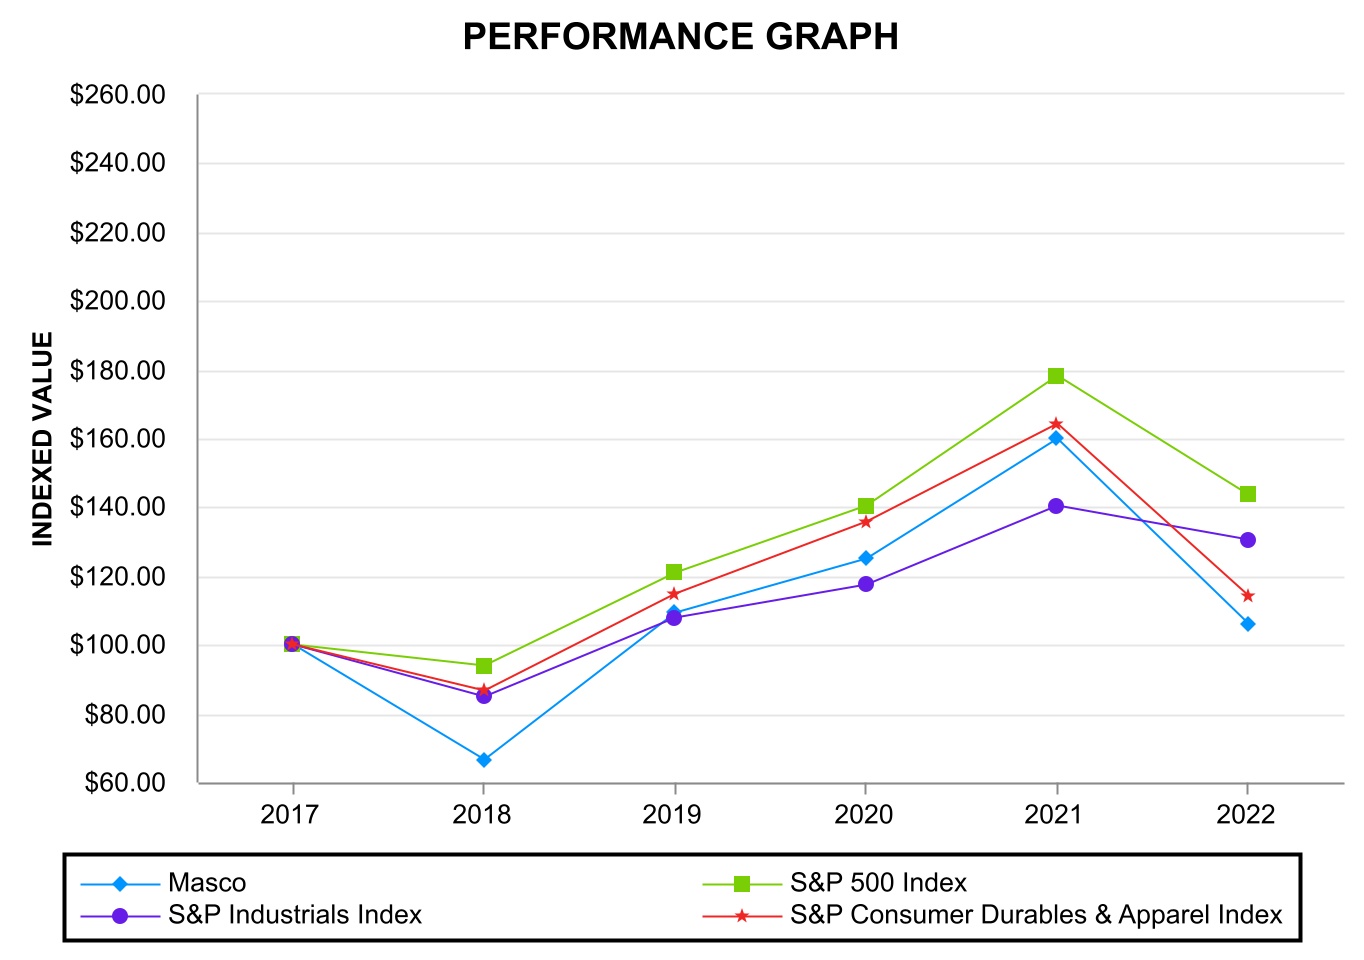
The table below sets forth the value, as of December 31 for each of the years indicated, of a $100 investment made on December 31, 20142017 in each of our common stock, the S&P 500 Index, the S&P Industrials Index and the S&P Consumer Durables & Apparel Index and includes the reinvestment of dividends.
| 2018 | 2019 | 2020 | 2021 | 2022 | |||||||||||||||||||||||||
| Masco | $ | 66.55 | $ | 109.22 | $ | 125.01 | $ | 159.81 | $ | 106.21 | |||||||||||||||||||
| S&P 500 Index | $ | 93.76 | $ | 120.84 | $ | 140.49 | $ | 178.27 | $ | 143.61 | |||||||||||||||||||
| S&P Industrials Index | $ | 85.00 | $ | 107.81 | $ | 117.52 | $ | 140.32 | $ | 130.35 | |||||||||||||||||||
| S&P Consumer Durables & Apparel Index | $ | 86.69 | $ | 114.67 | $ | 135.78 | $ | 164.21 | $ | 114.07 | |||||||||||||||||||
Item 6. [Reserved]
17
| 2015 | 2016 | 2017 | 2018 | 2019 | |||||||||||||||
| Masco | $ | 129.60 | $ | 146.62 | $ | 206.07 | $ | 138.69 | $ | 230.60 | |||||||||
| S&P 500 Index | $ | 101.38 | $ | 113.51 | $ | 138.29 | $ | 132.23 | $ | 173.86 | |||||||||
| S&P Industrials Index | $ | 97.47 | $ | 115.85 | $ | 140.22 | $ | 121.58 | $ | 157.29 | |||||||||
| S&P Consumer Durables & Apparel Index | $ | 99.25 | $ | 93.48 | $ | 110.85 | $ | 97.60 | $ | 131.17 | |||||||||
| Dollars in Millions (Except Per Common Share Data) | |||||||||||||||||||
| 2019 | 2018 | 2017 | 2016 | 2015 | |||||||||||||||
Net sales (1)(2) | $ | 6,707 | $ | 6,654 | $ | 6,014 | $ | 5,754 | $ | 5,513 | |||||||||
Operating profit (1)(2)(3) | 1,088 | 1,077 | 1,029 | 986 | 798 | ||||||||||||||
Income from continuing operations attributable to Masco Corporation (1)(2) | 639 | 636 | 426 | 426 | 282 | ||||||||||||||
Income per common share from continuing operations (1)(2): | |||||||||||||||||||
| Basic | $ | 2.21 | $ | 2.06 | $ | 1.34 | $ | 1.29 | $ | 0.82 | |||||||||
| Diluted | 2.20 | 2.05 | 1.33 | 1.28 | 0.81 | ||||||||||||||
| Dividends declared | 0.510 | 0.450 | 0.410 | 0.390 | 0.370 | ||||||||||||||
| Dividends paid | 0.495 | 0.435 | 0.405 | 0.385 | 0.365 | ||||||||||||||
| At December 31: | |||||||||||||||||||
Total assets (2) | $ | 5,027 | $ | 5,393 | $ | 5,534 | $ | 5,164 | $ | 5,664 | |||||||||
| Long-term debt | 2,771 | 2,971 | 2,969 | 2,995 | 2,403 | ||||||||||||||
Shareholders' (deficit) equity (2) | (56 | ) | 69 | 183 | (96 | ) | 58 | ||||||||||||
Item 7.Management's Discussion and Analysis of Financial Condition and Results of Operations.
The financialfollowing discussion and business analysis below provides information which we believe is relevant to an assessment and understanding of our consolidated financial position, results of operations and cash flows. This financial and business analysis should be read in conjunction with, theand is qualified in its entirety by, our consolidated financial statements (and notes related thereto) and related notes.
We design, manufacture and distribute branded home improvement and building products. These products are sold primarily for repair and remodeling activity and, to a lesser extent, new home construction. We sell our products through home center retailers, online retailers, wholesalers and distributors, mass merchandisers, hardware stores, homebuilders, distributors, and direct to the consumer.consumer, professional contractors and homebuilders.
Recent Trends
Due to changing market conditions, we are experiencing, and may continue to experience, lower market demand for our products. We have been experiencing, and may continue to experience, elevated commodity and other input costs, elevated transportation costs and supply chain disruptions, particularly disruptions related to our ability to source products, components and raw materials. We have also been experiencing, and may continue to experience, employee-related cost inflation and constraints in hiring qualified employees. While still elevated, we have recently seen some reduction of certain costs, and we aim to offset the segment, the absencepotential unfavorable impact of the recognition of the inventory step-up adjustment established as part of the 2018 Kichler acquisition, and the benefits associated with cost savings initiatives. These positive impacts were partially offset by an increase in commodityour costs and lower sales volume across the segment, an increase in strategic growth investmentsdemand for our products with productivity improvement, pricing, and a non-cash impairment charge related to an other indefinite-lived intangible asset for a trademark associated with lighting products.initiatives.
We regularly reviewdiscuss our estimates and assumptions, which are based upon historical experience,consolidated results as well as current economic conditionsour Business Segment and various other factors that we believe to be reasonable under the circumstances, theGeographic Area results of which formoperations for the basis for making judgments about the carrying values of certain assets and liabilities that are not readily apparent from other sources. Actual results may differ from these estimates and assumptions.
18
SALES AND OPERATIONS
Net Sales
Below is a summary of our productsnet sales, in millions, for the years ended December 31, 2022 and 2021:
| Year Ended December 31, | |||||||||||||||||
| 2022 | 2021 | Change | |||||||||||||||
| Net sales, as reported | $ | 8,680 | $ | 8,375 | $ | 305 | |||||||||||
| Acquisitions | (11) | — | (11) | ||||||||||||||
| Divestitures | — | (32) | 32 | ||||||||||||||
| Net sales, excluding acquisitions and divestitures | 8,669 | 8,343 | 326 | ||||||||||||||
| Currency translation | 211 | — | 211 | ||||||||||||||
| Net sales, excluding acquisitions, divestitures and the effect of currency translation | $ | 8,880 | $ | 8,343 | $ | 537 | |||||||||||
Net sales for 2022 were $8.7 billion, which increased four percent compared to 2021. Excluding acquisitions, divestitures and the effect of currency translation, net sales increased six percent.
Net sales for 2022 increased primarily due to:
•Higher net selling prices across the entire company which increased sales by nine percent.
These amounts were partially offset by:
•Lower sales volume which decreased sales by three percent.
•Unfavorable foreign currency translation which decreased sales by two percent.
Gross Profit and Gross Margin
Below is transferreda summary of our gross profit, in millions, and gross margin for the years ended December 31, 2022 and 2021:
| Year Ended December 31, | |||||||||||||||||
| 2022 | 2021 | Favorable / (Unfavorable) | |||||||||||||||
| Gross profit | $ | 2,713 | $ | 2,863 | $ | (150) | |||||||||||
| Gross margin | 31.3 | % | 34.2 | % | (290) bps | ||||||||||||
The 2022 gross profit margin was negatively impacted by:
•Increased commodity and transportation costs.
•Higher costs due to production inefficiencies and related under absorption, as well as higher excess and obsolete inventory charges resulting from business rationalization activities.
•Lower sales volume.
•Unfavorable sales mix.
These amounts were partially offset by:
•Higher net selling prices.
19
Selling, General and Administrative Expenses
Below is a summary of our customers, whichselling, general and administrative expenses, in millions, and selling, general and administrative expenses as a percentage of net sales for the years ended December 31, 2022 and 2021:
| Year Ended December 31, | |||||||||||||||||
| 2022 | 2021 | (Favorable) / Unfavorable | |||||||||||||||
| Selling, general and administrative expenses | $ | 1,390 | $ | 1,413 | $ | (23) | |||||||||||
| Selling, general and administrative expenses as percentage of net sales | 16.0 | % | 16.9 | % | (90) bps | ||||||||||||
Selling, general, and administrative expenses as a percentage of net sales in 2022 was positively impacted by:
•Higher net sales resulting from favorable net selling prices.
•Lower variable compensation.
These amounts were partially offset by:
•Increased marketing costs.
Operating Profit
Below is generally ata summary of our operating profit, in millions, and operating profit margins for the time of shipment or upon delivery based on the contractual terms with our customers. We provide customer programsyears ended December 31, 2022 and incentive offerings, including special pricing2021:
| Year Ended December 31, | |||||||||||||||||
| 2022 | 2021 | Change | |||||||||||||||
| Operating profit, as reported | $ | 1,297 | $ | 1,405 | $ | (108) | |||||||||||
| Rationalization charges | 32 | 4 | 28 | ||||||||||||||
| Impairment charges for goodwill and other intangible assets | 26 | 45 | (19) | ||||||||||||||
| Operating profit, excluding rationalization charges and impairment charges | $ | 1,355 | $ | 1,454 | $ | (99) | |||||||||||
| Operating profit margin, as reported | 14.9 | % | 16.8 | % | (190) bps | ||||||||||||
| Operating profit margin, excluding rationalization charges and impairment charges | 15.6 | % | 17.4 | % | (180) bps | ||||||||||||
Operating profit in 2022 was negatively impacted by:
•Increased commodity and co-operative advertising arrangements, promotionstransportation costs.
•Higher costs due to production inefficiencies and related under absorption, as well as higher excess and obsolete inventory charges resulting from business rationalization activities.
•Lower sales volume.
•Unfavorable foreign currency translation.
•Increased marketing costs.
•Unfavorable sales mix.
These amounts were partially offset by:
•Higher net selling prices.
•Lower variable compensation.
•Lower goodwill and other volume-based incentives. These customer programs and incentives are considered variable consideration. We includeintangible assets impairment charges in revenue variable consideration only to the extent that itour lighting business.
20
OTHER INCOME (EXPENSE), NET
Interest Expense
Below is probable that a significant reversal in the amount of cumulative revenue recognized will not occur when the variable consideration is resolved. This determination is made based upon known customer program and incentive offerings at the time of sale, and expected sales volume forecasts as it relates to our volume-based incentives. This determination is updated each reporting period.
| Year Ended December 31, | |||||||||||||||||
| 2022 | 2021 | Favorable / (Unfavorable) | |||||||||||||||
| Interest expense | $ | (108) | $ | (278) | $ | 170 | |||||||||||
The decrease in interest expense is recorded for customer incentive rebates and is generally based upon sales activity.
Other, net
Below is a $35 million impairment to one of our reporting units.
| Year Ended December 31, | |||||||||||||||||
| 2022 | 2021 | Favorable / (Unfavorable) | |||||||||||||||
| Other, net | $ | 4 | $ | (439) | $ | 443 | |||||||||||
Other, net, for 2022 included:
•$24 million of income from the revaluation of contingent consideration related to a $3prior acquisition.
This amount was partially offset by:
•$10 million impairmentof net periodic pension and post-retirement benefit expense.
•$6 million of losses related to equity method investments.
Other, net, for one2021 included:
•$430 million of our trade names.
•$18 million loss related to the divestiture of our Hüppe GmbH ("Hüppe") business.
•$16 million expense from the revaluation of contingent consideration related to a resultprior acquisition.
These amounts were partially offset by:
•$14 million gain recognized on the redemption of this decision, the projected benefit obligationspreferred stock of ACProducts Holding, Inc. and $6 million of related dividend income.
•$11 million of earnings related to equity method investments.
21
INCOME TAXES
Below is a summary of our income tax expense, in millions, and our effective tax rate for these plans were increasedthe years ended December 31, 2022 and 2021:
| Year Ended December 31, | |||||||||||||||||
| 2022 | 2021 | (Favorable) / Unfavorable | |||||||||||||||
| Income tax expense | $ | 288 | $ | 210 | $ | 78 | |||||||||||
| Effective tax rate | 24 | % | 31 | % | (7) | % | |||||||||||
Our 2021 income tax expense included $16 million due to reflect the incremental costs to terminate the plans. Upon termination in 2021, we expect to recognizeelimination of disproportionate tax effects from accumulated other comprehensive loss approximately $420income related to our debt retirement and pension plan termination and $18 million of pre-tax actuarialdue to losses and approximately $90 million of incomeproviding no tax benefit which includes approximately $11 million of tax expensein certain jurisdictions from the elimination of a disproportionate tax effect.
Refer to Note MS to the consolidated financial statements for additional information.
INCOME AND INCOME PER COMMON SHARE FROM CONTINUING OPERATIONS- ATTRIBUTABLE TO MASCO CORPORATION
Below is a summary of our income and diluted income per common share from continuing operations, in millions, except per share data, for the years ended December 31, 2022 and 2021:
| Year Ended December 31, | |||||||||||||||||
| 2022 | 2021 | Favorable / (Unfavorable) | |||||||||||||||
| Income from continuing operations | $ | 844 | $ | 410 | $ | 434 | |||||||||||
| Diluted income per common share from continuing operations | $ | 3.63 | $ | 1.62 | $ | 2.01 | |||||||||||
22
Business Segment and Geographic Area Results
The following table sets forth our net sales and operating profit information for our qualified defined-benefit pension plans to be $30 millioncontinuing operations by Business Segment and Geographic Area, dollars in 2020 compared with $16 million in 2019millions.
| Year Ended December 31, | Percent Change | |||||||||||||||||||
| 2022 | 2021 | 2022 vs. 2021 | ||||||||||||||||||
| Net Sales: | ||||||||||||||||||||
| Plumbing Products | $ | 5,252 | $ | 5,135 | 2 | % | ||||||||||||||
| Decorative Architectural Products | 3,428 | 3,240 | 6 | % | ||||||||||||||||
| Total | $ | 8,680 | $ | 8,375 | 4 | % | ||||||||||||||
| North America | $ | 6,978 | $ | 6,624 | 5 | % | ||||||||||||||
| International, principally Europe | 1,702 | 1,751 | (3) | % | ||||||||||||||||
| Total | $ | 8,680 | $ | 8,375 | 4 | % | ||||||||||||||
| Year Ended December 31, | Percent Change | |||||||||||||||||||
| 2022 | 2021 | 2022 vs. 2021 | ||||||||||||||||||
| Operating Profit (A): | ||||||||||||||||||||
| Plumbing Products | $ | 819 | $ | 929 | (12) | % | ||||||||||||||
| Decorative Architectural Products | 565 | 581 | (3) | % | ||||||||||||||||
| Total | $ | 1,384 | $ | 1,510 | (8) | % | ||||||||||||||
| North America | $ | 1,116 | $ | 1,214 | (8) | % | ||||||||||||||
| International, principally Europe | 268 | 296 | (9) | % | ||||||||||||||||
| Total | 1,384 | 1,510 | (8) | % | ||||||||||||||||
| General corporate expense, net | (87) | (105) | (17) | % | ||||||||||||||||
| Total operating profit | $ | 1,297 | $ | 1,405 | (8) | % | ||||||||||||||
(A). If we assumed that the future return on plan assets was 50 basis points lower than the assumed asset return and the discount rate decreased by 50 basis points, the2020pensionBefore general corporate expense, would increase by$5 million. Assuming a 0 percent asset return for our qualified domestic defined-benefit pension plans, projected 2020 total qualified defined-benefit pension plan expenses are expected to be approximately $37 million. We expect pension expense for our non-qualified defined-benefit pension plans to be $8 million in2020, consistent with the pension expense recognized in 2019.
Changes in future periods. Possible sources of taxable income
23
Plumbing Products
Sales
Net sales in the Plumbing Products segment increased two percent in 2022 due primarily to favorable net selling prices, which increased sales by seven percent, and projected future taxable income.
Operating profit in the future, an adjustmentPlumbing Products segment in 2022 was negatively impacted by increased commodity and transportation costs, higher costs due to the valuation allowance would be recordedproduction inefficiencies and related under absorption, higher excess and obsolete inventory charges resulting from business rationalization activities, unfavorable foreign currency translation, increased marketing costs and unfavorable sales mix. These amounts were partially offset by favorable net selling prices and, to a lesser extent, lower variable compensation.
Decorative Architectural Products
Sales
Net sales in the period such determination is made. The need to maintain a valuation allowance against deferred tax assets may cause greater volatilityDecorative Architectural Products segment increased six percent in our effective tax rate.
Operating Results
Operating profit in the U.S. Federal corporate tax rate from 35 percent to 21 percentDecorative Architectural Products segment in 2022 was negatively impacted by increased commodity and the additional U.S. taxes on our foreign earnings. The continued impact from U.S. tax reform may differ from our current estimatestransportation costs, lower sales volume, higher costs due to the issuanceproduction inefficiencies and finalization of future regulatory guidance.related under absorption, higher excess and obsolete inventory charges resulting from business rationalization activities, and increased marketing costs. These amounts were partially offset by favorable net selling prices and lower goodwill and other intangible assets impairment charges in our lighting business.
Operating Results
North America operating profit in 2022 was negatively impacted by increased commodity and transportation costs, lower sales volume, higher costs due to determineproduction inefficiencies and related under absorption, higher excess and obsolete inventory charges resulting from business rationalization activities, and increased marketing costs. These amounts were partially offset by favorable net selling prices, and to a lesser extent, lower variable compensation and lower goodwill and other intangible assets impairment charges in our lighting business.
International, Principally Europe
Sales
International net sales decreased three percent in 2022. In local currencies (including sales in currencies outside their respective functional currencies), net sales increased eight percent. Favorable net selling prices of plumbing products increased sales by six percent. Higher sales volume of plumbing products increased sales by five percent. These amounts were partially offset by the divestiture of our Hüppe business which businesses, if any, may not align with our long-term growth strategy.decreased sales by two percent and unfavorable sales mix which decreased sales by two percent.
24
International operating profit in 2022 was negatively impacted by increased commodity and transportation costs, unfavorable foreign currency translation, wage inflation, and unfavorable sales mix. These amounts were partially offset by favorable net selling prices and higher sales volume of plumbing products.
Liquidity and Capital Resources
Overview of Capital Structure
Historically, we have largely funded our growth through cash provided by our operations, the issuance of notes in the financial markets, bank borrowings and the issuance of our common stock, including issuances for certain mergers and acquisitions. Maintaining high levels of liquidity and focusing on cash generation are among our financial strategies. Our capital allocation strategy includes reinvesting in our business, balancing share repurchases with potential acquisitions and maintaining an appropriatea relevant dividend.
We had cash and cash investments of approximately $452 million and $926 million at December 31, 2022 and 2021, respectively. Our cash and cash investments consist of overnight interest bearing money market demand accounts, time deposit accounts, and money market mutual funds containing government securities and treasury obligations. While we attempt to diversify these investments in a prudent manner to minimize risk, it is possible that future changes in the financial markets could affect the security or availability of these investments. Of the cash and cash investments we held at December 31, 2022 and 2021, $321 million and $490 million, respectively, was held in our foreign subsidiaries. If these funds were needed for our operations in the U.S., their repatriation into the U.S. would not result in significant additional U.S. income tax or foreign withholding tax, as we have recorded such taxes on substantially all undistributed foreign earnings, except for those that are legally restricted.
Our current ratio was 1.6 to 1 and 1.8 to 1 at December 31, 2022 and 2021, respectively. The decrease in our current ratio is primarily due to the 364-day $500 million term loan that we entered into on April 26, 2022.
Our total debt as a percent of total capitalization was 102109 percent and 98 percent at December 31, 20192022 and 2018,2021, respectively. Refer to Note KL to the consolidated financial statements for additional information.
Capital Expenditures
We continue to invest in our manufacturing and Milgard businessesdistribution operations to increase our productivity, improve customer service and entered into a definitive agreementsupport product innovation. Capital expenditures for 2022 were $224 million, compared with $128 million for 2021. The increase in capital expenditures in 2022 was primarily due to sellcapacity expansion plans in our Masco Cabinetry business. With the combinedPlumbing Products and Decorative Architectural Products segments. For 2023, capital expenditures, excluding any potential future acquisitions, are expected to be approximately $250 million. Depreciation and amortization expense for 2022 totaled $145 million, compared with $151 million for 2021. For 2023, depreciation and amortization expense, excluding any potential future acquisitions, is expected to be approximately $150 million. Amortization expense totaled $33 million in 2022, compared with $40 million in 2021.
25
Senior Indebtedness
On March 4, 2021, we issued $600 million of 1.500% Notes due February 15, 2028, $600 million of 2.000% Notes due February 15, 2031 and $300 million of 3.125% Notes due February 15, 2051. We received proceeds of $722$1,495 million, net of discount, for the UKWGissuance of these Notes. The Notes are senior indebtedness and Milgard divestitures, we executed an accelerated stock repurchase agreementare redeemable at our option at the applicable redemption price. On March 22, 2021, proceeds from the debt issuances, together with cash on hand, were used to repurchase $400repay and early retire our $326 million of our common stock. This repurchase is under Masco's existing share repurchase authorization of $2.0 billion of shares of our common stock, which was approved in September 2019. During 2019, including the accelerated stock repurchase agreement, we repurchased 20.1 million shares of our common stock for cash aggregating $896 million.
On March 13, 2019,April 26, 2022, we entered into a revolving credit agreement (the "Credit Agreement"“2022 Credit Agreement”) with an aggregate commitment of $1.0 billion and a maturity date of April 26, 2027. Upon entry into the 2022 Credit Agreement, our credit agreement dated March 13, 2024. 2019, as amended, with an aggregate commitment of $1.0 billion, was terminated.
Under the 2022 Credit Agreement, at our request and subject to certain conditions, we can increase the aggregate commitment up to an additional $500 million with the current lenders or new lenders. Upon entry into the Credit Agreement, our credit agreement dated March 28, 2013, as amended, with an aggregate commitment of $750 million, was terminated. See Note KL to the consolidated financial statements.statements for additional information.
The 2022 Credit Agreement contains financial covenants requiring us to maintain (A) a net leverage ratio, as adjusted for certain items, not exceeding 4.0 to 1.0, and (B) a minimuman interest coverage ratio, as adjusted for certain items, not less than 2.5 to 1.0. We were in compliance with all covenants and no borrowings were outstanding under our 2022 Credit Agreement at December 31, 2019.2022. As of the date of this report, $69 million was borrowed and outstanding at a weighted average interest rate of 5.800%.
364-day Term Loan
On March 9, 2018,April 26, 2022, we entered into a 364-day $500 million senior unsecured delayed draw term loan due April 26, 2023 with a syndicate of lenders. The senior unsecured term loan and commitments thereunder are subject to prepayment or termination at our option and the loans will bear interest at SOFR plus a spread adjustment and 0.70%. The covenants, including the financial covenants, are substantially the same as those in the 2022 Credit Agreement. We repaid $300 million during 2022.
Corporate Development Strategy
We expect to maintain a balanced growth strategy pursuing organic growth by maximizing the full potential of our existing businesses and, as appropriate, complementing our existing business with strategic acquisitions.
In addition, we actively manage our portfolio of companies by divesting those businesses that do not align with our long-term growth strategy. We will continue to review all of our businesses to determine which businesses, if any, may not align with our long-term growth strategy.
Acquisitions
During 2021, our Hansgrohe SE subsidiary acquired substantiallya 75.1 percent equity interest in Easy Sanitary Solutions B.V., a manufacturer of shower channel drains that offers a wide range of products for barrier-free showering and bathroom wall niches, for approximately €47 million ($58 million), including $52 million of cash and $6 million of debt that will be paid out over two years. During 2021, we also acquired all of the net assetsshare capital of Kichler. The purchase price, netSteamist, Inc., a manufacturer of $2 million cash acquired, consisted of $549 million paid with cash on hand.
Divestitures
During 2021, we completed the scheduled repayment date.
26
Share Repurchases
We repurchased and retired 16.6 million shares of our common stock in 2022 for approximately $914 million. This included 0.6 million shares to offset the dilutive impact of restricted stock units granted in 2022. Effective October 20, 2022, our Board of Directors authorized the repurchase, for retirement, of up to $2.0 billion of shares of our common stock in open-market transactions or otherwise, replacing the previous Board of Directors authorization established in 2021. At December 31, 2022, we had $2.0 billion remaining under the 2022 authorization. Consistent with past practice and as part of our long-term capital allocation strategy, we anticipate using approximately $500 million of cash for share repurchases (including shares which was recordedwill be purchased to offset any dilution from restricted stock units granted as interest expense.part of our compensation programs) in 2023. Refer to Note O to the consolidated financial statements for additional information.
Dividend to holders of our Common Shares
We paid a quarterly dividend of $0.28 per common share for an annual dividend of $1.12 per share.
As part of our capital allocation strategy, the Board of Directors declared a quarterly dividend of $0.285 per share in the first quarter of 2023 with the intention to increase the annual dividend to $1.14 per share.
Other Liquidity and Capital Resource Activities
As part of our ongoing efforts to improve our cash flow and related liquidity, we work with suppliers to optimize our terms and conditions, including extending payment terms. We also facilitate a voluntary supply chain finance program (the "program") to provide certain of our suppliers with the opportunity to sell receivables due from us to participating financial institutions at the sole discretion of both the suppliers and the financial institutions. A third party administers the program; our responsibility is limited to making payment on the terms originally negotiated with our supplier, regardless of whether the supplier sells its receivable to a financial institution. We do not enter into agreements with any of the participating financial institutions in connection with the program. The range of payment terms we negotiate with our suppliers is consistent, irrespective of whether a supplier participates in the program.
All outstanding payments owed under the program are recorded within accounts payable in our consolidated balance sheets. The amounts owed to participating financial institutions under the program and included in accounts payable for our continuing operations were $29 million and $35$43 million at December 31, 20192022 and 2018,2021, respectively. We account for all payments made under the program as a reduction to our cash flows from operations and reported within our (decrease) increase in accounts payable and accrued liabilities, net, line within our consolidated statements of cash flows. The amounts settled through the program and paid to participating financial institutions were $164 million, $117$188 million and $186$220 million for our continuing operations during the years ended December 31, 2019, 2018,2022 and 2017,2021, respectively. A downgrade in our credit rating or changes in the financial markets could limit the financial institutions’ willingness to commit funds to, and participate in, the program. We do not believe such risk would have a material impact on our working capital or cash flows, as substantially all of our payments are made outside of the program.
We had cash and cash investments of approximately $697 million at December 31, 2019. Our cash and cash investments consist of overnight interest bearing money market demand accounts, time deposit accounts, and money market mutual funds containing government securities and treasury obligations. While we attempt to diversify these investments in a prudent manner to minimize risk, it is possible that future changes in the financial markets could affect the security or availability of these investments.
27
Cash Flows
Significant sources and (uses) of cash infor the past three years ended December 31, 2022 and 2021 are summarized as follows, in millions:
| 2022 | 2021 | ||||||||||
| Net cash from operating activities | $ | 840 | $ | 930 | |||||||
| Retirement of notes | — | (1,326) | |||||||||
| Purchase of Company common stock | (914) | (1,026) | |||||||||
| Cash dividends paid | (258) | (211) | |||||||||
| Dividends paid to noncontrolling interest | (68) | (43) | |||||||||
| Capital expenditures | (224) | (128) | |||||||||
| Proceeds from term loan | 500 | — | |||||||||
| Payment of term loan | (300) | — | |||||||||
| Debt extinguishment costs | — | (160) | |||||||||
| Proceeds from the exercise of stock options | 1 | 5 | |||||||||
| Acquisition of businesses, net of cash acquired | — | (57) | |||||||||
| Issuance of notes, net of issuance costs | — | 1,481 | |||||||||
| Employee withholding taxes paid on stock-based compensation | (17) | (15) | |||||||||
| Proceeds from disposition of: | |||||||||||
| Businesses, net of cash disposed | — | 5 | |||||||||
| Property and equipment | 1 | — | |||||||||
| Financial investments | 1 | 171 | |||||||||
| Payment of debt | (10) | (3) | |||||||||
| Effect of exchange rate changes on cash and cash investments | (18) | (20) | |||||||||
| Other, net | (8) | (3) | |||||||||
| Cash decrease | $ | (474) | $ | (400) | |||||||
| 2019 | 2018 | 2017 | |||||||||
| Net cash from operating activities | $ | 833 | $ | 1,032 | $ | 751 | |||||
| Retirement of notes | (201 | ) | (114 | ) | (535 | ) | |||||
| Purchase of Company common stock | (896 | ) | (654 | ) | (331 | ) | |||||
| Cash dividends paid | (144 | ) | (134 | ) | (129 | ) | |||||
| Dividends paid to noncontrolling interest | (42 | ) | (89 | ) | (35 | ) | |||||
| Capital expenditures | (162 | ) | (219 | ) | (173 | ) | |||||
| Debt extinguishment costs | (2 | ) | — | (104 | ) | ||||||
| Acquisition of businesses, net of cash acquired | — | (549 | ) | (89 | ) | ||||||
| Issuance of notes, net of issuance costs | — | — | 593 | ||||||||
| Employee withholding taxes paid on stock-based compensation | (23 | ) | (42 | ) | (33 | ) | |||||
| Proceeds from disposition of: | |||||||||||
| Businesses, net of cash disposed | 722 | — | 128 | ||||||||
| Property and equipment | 34 | 14 | 24 | ||||||||
| Financial investments | 1 | 5 | 7 | ||||||||
| Decrease in debt, net | (8 | ) | (1 | ) | (3 | ) | |||||
| Proceeds of short-term bank deposits, net | — | 108 | 112 | ||||||||
| Effect of exchange rate changes on cash and cash investments | 14 | 4 | 55 | ||||||||
| Other, net | 12 | 4 | (34 | ) | |||||||
| Cash increase (decrease) | $ | 138 | $ | (635 | ) | $ | 204 | ||||
Our working capital days were as follows:
| At December 31, | |||||||||||
| 2022 | 2021 | ||||||||||
| Receivable days | 53 | 51 | |||||||||
| Inventory days | 80 | 85 | |||||||||
| Accounts payable days | 68 | 66 | |||||||||
| Working capital (receivables plus inventories, less accounts payable) as a percentage of net sales | 17.4 | % | 16.0 | % | |||||||
| At December 31, | |||||
| 2019 | 2018 | ||||
| Receivable days | 54 | 54 | |||
| Inventory days | 67 | 71 | |||
| Accounts Payable days | 68 | 69 | |||
| Working capital (receivables plus inventories, less accounts payable) as a percentage of net sales | 15.7 | % | 15.8 | % | |
Net cash provided by operations of $833$840 million consisted primarily of net income adjusted for certain non-cash items, including depreciation and amortization expense of $159 million, stock-based compensation expense and amortization expense related to in-store displays, as well as employee withholding taxes paid on stock-based compensation, which is classified as a financing activity. These amounts werebenefited from operating profit, partially offset by the net gain on the sale of Milgardchanges in working capital, primarily lower accounts payable and UKWG as well as contributions to our defined-benefit pension plans.accrued liabilities balances.
Financing Activities
Net cash used for financing activities was $1,291$1,066 million, primarily due to $896$914 million for the repurchase and retirement of Company common stock (as part of our strategic initiative to drive shareholder value), $201 million for the early retirement of our 7.125% Notes due March 15, 2020, $144 million for the payment of cash dividends, $42 million for dividends paid to noncontrolling interests and $23 million for employee withholding taxes paid on stock-based compensation. These uses of cash were slightly offset by $27 million of proceeds from the exercise of stock options.
28
Investing Activities
Net cash provided byused for investing activities was $582$230 million, primarily driven by $720$224 million of proceeds from the sale of Milgard, net of cash disposed, partially offset by $162 million for capital expenditures.
Year Ended December 31 | |||||||
| 2019 | 2018 | ||||||
| Net sales, as reported | $ | 6,707 | $ | 6,654 | |||
| Acquisitions | (65 | ) | — | ||||
| Net sales, excluding acquisitions | 6,642 | 6,654 | |||||
| Currency translation | 77 | — | |||||
| Net sales, excluding acquisitions and the effect of currency translation | $ | 6,719 | $ | 6,654 | |||
| 2019 | 2018 | 2017 | |||||||||
| Operating profit, as reported | $ | 1,088 | $ | 1,077 | $ | 1,029 | |||||
| Rationalization charges | 13 | 9 | 2 | ||||||||
| Kichler inventory step up adjustment | — | 40 | — | ||||||||
| Impairment charge for other intangible assets | 9 | — | — | ||||||||
| Operating profit, as adjusted | $ | 1,110 | $ | 1,126 | $ | 1,031 | |||||
| Operating profit margins, as reported | 16.2 | % | 16.2 | % | 17.1 | % | |||||
| Operating profit margins, as adjusted | 16.5 | % | 16.9 | % | 17.1 | % | |||||
Percent Change | |||||||||||||||||
| 2019 | 2018 | 2017 | 2019 vs. 2018 | 2018 vs. 2017 | |||||||||||||
| Net Sales: | |||||||||||||||||
| Plumbing Products | $ | 3,984 | $ | 3,998 | $ | 3,732 | — | % | 7 | % | |||||||
| Decorative Architectural Products | 2,723 | 2,656 | 2,206 | 3 | % | 20 | % | ||||||||||
| Total | $ | 6,707 | $ | 6,654 | $ | 5,938 | 1 | % | 12 | % | |||||||
| North America | $ | 5,328 | $ | 5,208 | $ | 4,568 | 2 | % | 14 | % | |||||||
| International, principally Europe | 1,379 | 1,446 | 1,370 | (5 | )% | 6 | % | ||||||||||
| Total | $ | 6,707 | $ | 6,654 | $ | 5,938 | 1 | % | 12 | % | |||||||
Divestitures not included in discontinued operations (A) | — | — | 76 | ||||||||||||||
| Total net sales | $ | 6,707 | $ | 6,654 | $ | 6,014 | 1 | % | 11 | % | |||||||
| 2019 | 2018 | 2017 | |||||||||
| Operating Profit: (B) | |||||||||||
| Plumbing Products | $ | 708 | $ | 715 | $ | 702 | |||||
| Decorative Architectural Products | 480 | 456 | 438 | ||||||||
| Total | $ | 1,188 | $ | 1,171 | $ | 1,140 | |||||
| North America | $ | 987 | $ | 954 | $ | 924 | |||||
| International, principally Europe | 201 | 217 | 216 | ||||||||
| Total | 1,188 | 1,171 | 1,140 | ||||||||
| General corporate expense, net | (100 | ) | (94 | ) | (105 | ) | |||||
Divestitures not included in discontinued operations (A) | — | — | (6 | ) | |||||||
| Total operating profit | $ | 1,088 | $ | 1,077 | $ | 1,029 | |||||
Commitments and Contingencies
Litigation
Information regarding our legal proceedings is set forth in Note TU to the consolidated financial statements, which is incorporated herein by reference.
Other Commitments
We enter into contracts, which include reasonable and customary indemnifications that are standard for the industries in which we operate. Such indemnifications include claims made against builders by homeowners for issues relating to our products and workmanship. In conjunction with divestitures and other transactions, we occasionally provide reasonable and customary indemnifications. We have never had to paynot paid a material amount related to these indemnifications, and we evaluate the probability that amounts may be incurred and record an estimated liability when probable and reasonably estimable.
Contractual Obligations
The following table provides payment obligations related to current contracts at December 31, 2022, in millions:
| Payments Due by Period | |||||||||||||||||||||||||||||||||||
| 2023 | 2024-2025 | 2026-2027 | Beyond 2027 | Other | Total | ||||||||||||||||||||||||||||||
Debt (A) | $ | 205 | $ | 6 | $ | 304 | $ | 2,644 | $ | — | $ | 3,159 | |||||||||||||||||||||||
Interest (A) | 101 | 194 | 192 | 738 | — | 1,225 | |||||||||||||||||||||||||||||
| Operating leases | 50 | 89 | 68 | 174 | — | 381 | |||||||||||||||||||||||||||||
| Currently payable income taxes | 48 | — | — | — | — | 48 | |||||||||||||||||||||||||||||
Purchase commitments (B) | 438 | 64 | 35 | — | — | 537 | |||||||||||||||||||||||||||||
Uncertain tax positions, including interest and penalties (C) | — | — | — | — | 92 | 92 | |||||||||||||||||||||||||||||
| Total | $ | 842 | $ | 353 | $ | 599 | $ | 3,556 | $ | 92 | $ | 5,442 | |||||||||||||||||||||||
(A)We assume that all debt would be held to maturity. Amounts include finance lease obligations.
(B)Excludes contracts that do not require volume commitments and open or pending purchase orders.
(C)Due to the high degree of uncertainty regarding the timing of future cash outflows associated with uncertain tax positions, we are unable to make a reasonable estimate for the year in which cash settlements may occur with applicable tax authorities.
Refer to Note N to the consolidated financial statements for defined-benefit pension plan obligations.
29
Critical Accounting Policies and Estimates
Our discussion and analysis of our financial condition and results of operations is based upon our consolidated financial statements, which have been prepared in accordance with GAAP. The preparation of these financial statements requires us to make certain estimates and assumptions that affect or could have affected the reported amounts of assets and liabilities, disclosure of any contingent assets and liabilities at the date of the financial statements and the reported amounts of revenues and expenses during the reporting periods. We regularly review our estimates and assumptions, which are based upon historical experience, as well as current economic conditions and various other factors that we believe to be reasonable under the circumstances, the results of which form the basis for making judgments about the carrying values of certain assets and liabilities and related disclosures, and future revenues and expenses, that are not readily apparent from other sources. Actual results may differ from these estimates and assumptions.
Note A to the consolidated financial statements includes our accounting policies, estimates and methods used in the preparation of our consolidated financial statements.
We believe that the following critical accounting policies are affected by significant judgments and estimates used in the preparation of our consolidated financial statements.
Revenue Recognition
We recognize revenue as control of our products is transferred to our customers, which is generally at the time of shipment or upon delivery based on the contractual terms with our customers. We provide customer programs and incentive offerings, including special pricing and co-operative advertising arrangements, promotions and other volume-based incentives. These customer programs and incentives are considered variable consideration. We include in revenue variable consideration only to the extent that it is probable that a significant reversal in the amount of cumulative revenue recognized will not occur when the variable consideration is resolved. This determination is made based upon known customer program and incentive offerings at the time of sale, and expected sales volume forecasts as it relates to our volume-based incentives. This determination is updated each reporting period.
Goodwill and Other Intangible Assets
We record the excess of purchase cost over the fair value of net tangible assets of acquired companies as goodwill or other identifiable intangible assets. In the fourth quarter of each year, or as events occur or circumstances change that would more likely than not reduce the fair value of a reporting unit below its carrying amount, we complete the impairment testing of goodwill utilizing a discounted cash flow method. We selected the discounted cash flow methodology because we believe that it is comparable to what would be used by market participants. We have defined our reporting units and completed the impairment testing of goodwill at the operating segment level.
Determining market values using a discounted cash flow method requires us to make significant estimates and assumptions, including long-term projections of cash flows, market conditions and appropriate discount rates. Our judgments are based upon historical experience, current market trends, consultations with external valuation specialists and other information. While we believe that the estimates and assumptions underlying the valuation methodology are reasonable, different estimates and assumptions could result in different outcomes. In estimating future cash flows, we rely on internally generated five-year forecasts for sales and operating profits, and, currently, a two percent to three percent long-term assumed annual growth rate of cash flows for periods after the five-year forecast. We generally develop these forecasts based upon, among other things, recent sales data for existing products, planned timing of new product launches, estimated repair and remodel activity and, to a lesser extent, estimated housing starts. Our assumptions included U.S. and Eurozone Gross Domestic Product growing at approximately 1.3 percent and 1.5 percent, respectively, in 2023, and 2.0 percent and 1.5 percent, respectively, per annum over the remainder of the five-year forecast.
We utilize our weighted average cost of capital of approximately 8.75 percent as the basis to determine the discount rate to apply to the estimated future cash flows. In 2022, based upon our assessment of the risks impacting each of our businesses, we applied a risk premium to increase the discount rate to a range of 10.25 percent to 12.75 percent for our reporting units.
30
If the carrying amount of a reporting unit exceeds its fair value, an impairment loss is recognized to the extent that a reporting unit's recorded carrying value exceeds its fair value, not to exceed the carrying amount of goodwill in that reporting unit.
In the fourth quarter of 2022, we recognized a $19 million non-cash goodwill impairment charge related to a reporting unit within our Decorative Architectural Products segment due to competitive market conditions, higher inflationary costs and increased cost of capital in our lighting business. There is no remaining goodwill associated with the impaired reporting unit. A 10 percent decrease in the estimated fair value of our other reporting units would not have resulted in any additional goodwill impairment.
We review our other indefinite-lived intangible assets for impairment annually, in the fourth quarter, or as events occur or circumstances change that indicate the assets may be impaired without regard to the business unit. Potential impairment is identified by comparing the fair value of an other indefinite-lived intangible asset to its carrying value. We utilize a relief-from-royalty model to estimate the fair value of other indefinite-lived intangible assets. We consider the implications of both external (e.g., market growth, competition and local economic conditions) and internal (e.g., product sales and expected product growth) factors and their potential impact on cash flows related to the intangible asset in both the near- and long-term. We also consider the profitability of the business, among other factors, to determine the royalty rate for use in the impairment assessment.
We utilize our weighted average cost of capital of approximately 8.75 percent as the basis to determine the discount rate to apply to the estimated future cash flows. In 2022, based upon our assessment of the risks impacting each of our businesses and the nature of the other indefinite-lived intangible assets (i.e., trade name), we applied a risk premium to increase the discount rate to a range of 11.25 percent to 13.75 percent for our other indefinite-lived intangible assets.
If the carrying amount of an other indefinite-lived intangible asset exceeds its fair value, an impairment loss is recognized to the extent that an other indefinite-lived intangible asset's recorded carrying value exceeds its fair value, not to exceed the carrying amount of the other indefinite-lived intangible asset.
In the fourth quarter of 2022, we recognized a $7 million non-cash impairment charge related to a registered trademark within our Decorative Architectural Products segment due to competitive market conditions and increased cost of capital in our lighting business. As of December 31, 2022, the impaired other indefinite-lived intangible asset had a remaining net carrying value of $43 million. A 10 percent decrease in the estimated fair value of our other indefinite-lived intangibles assets would not have resulted in an impairment for any of our other indefinite-lived intangible assets.
Refer to Note H for additional information.
Income Taxes
We record deferred taxes on the future tax consequences of differences between the financial statement carrying value of our assets and liabilities and their respective tax basis. The realization of deferred tax assets depends on sufficient sources of taxable income in future periods. Possible sources of taxable income include taxable income in carryback periods, the future reversal of existing taxable temporary differences recorded as a deferred tax liability, tax-planning strategies that generate future income or gains and projected future taxable income.
If, based upon all available evidence, both positive and negative, it is more likely than not such deferred tax assets will not be realized, a valuation allowance is recorded. Significant weight is given to evidence that is objectively verifiable such as cumulative losses in recent years, however, some evidence may be based on estimates and assumptions regarding potential sources of future taxable income. Changes in these estimates and assumptions may result in a change in judgment regarding the realizability of deferred tax assets.
Refer to Note S for additional information.
Recently Adopted and Issued Accounting Pronouncements
Refer to Note A to the consolidated financial statements for discussion of recently adopted and issued accounting pronouncements, which is incorporated herein by reference.
31
| Payments Due by Period | |||||||||||||||||||||||
| 2020 | 2021-2022 | 2023-2024 | Beyond 2024 | Other | Total | ||||||||||||||||||
Debt (A) | $ | 2 | $ | 731 | $ | 5 | $ | 2,052 | $ | — | $ | 2,790 | |||||||||||
Interest (A) | 134 | 236 | 200 | 576 | — | 1,146 | |||||||||||||||||
| Operating leases | 45 | 70 | 37 | 101 | — | 253 | |||||||||||||||||
| Currently payable income taxes | 10 | — | — | — | — | 10 | |||||||||||||||||
Private equity funds (B) | — | — | — | — | 4 | 4 | |||||||||||||||||
Purchase commitments (C) | 240 | 1 | — | — | — | 241 | |||||||||||||||||
Uncertain tax positions, including interest and penalties (D) | — | — | — | — | 73 | 73 | |||||||||||||||||
| Total | $ | 431 | $ | 1,038 | $ | 242 | $ | 2,729 | $ | 77 | $ | 4,517 | |||||||||||
Item 7A. Quantitative and Qualitative Disclosures about Market Risk.
We have considered the provisions of accounting guidance regarding disclosure of accounting policies for derivative financial instruments and disclosure of quantitative and qualitative information about market risk inherent in derivative financial instruments and other financial instruments.
We are exposed to the impact of changes in interest rates and foreign currency exchange rates, particularly changes between the U.S. dollar and the European euro, British pound andsterling, Canadian dollar, Chinese renminbi, and Mexican peso, and to market price fluctuations related to our financial investments. We have insignificant involvement with derivative financial instruments and use such instruments to the extent necessary to manage exposure to foreign currency fluctuations.
At December 31, 2019,2022, we performed sensitivity analyses to assess the potential loss in the fair values of market risk sensitive instruments resulting from a hypothetical change of 10 percent in foreign currency exchange rates, a 10 percent decline in the market value of our long-term investments, or a 100 basis point change in interest rates. Based upon the analyses performed, such changes would not be expected to materially affect our consolidated financial position, results of operations or cash flows.
32
Item 8.Financial Statements and Supplementary Data.
Management's Report on Internal Control Over Financial Reporting
Our management is responsible for establishing and maintaining adequate internal control over financial reporting. Our internal control over financial reporting is a process designed to provide reasonable assurance regarding the reliability of financial reporting and the preparation of financial statements for external purposes in accordance with accounting principles generally accepted in the United States of America.
We assessed the effectiveness of our internal control over financial reporting as of December 31, 20192022 using the criteria set forth by the Committee of Sponsoring Organizations of the Treadway Commission ("COSO") in Internal Control – Integrated Framework (2013). Based on this assessment, we have determined that our internal control over financial reporting was effective as of December 31, 2019.2022.
PricewaterhouseCoopers LLP (PCAOB ID 238), an independent registered public accounting firm, has audited the effectiveness of our internal control over financial reporting as of December 31, 2019,2022, as stated in their report, which is presented herein. Their report expressed an unqualified opinion on the effectiveness of our internal control over financial reporting as of December 31, 20192022 and expressed an unqualified opinion on our 20192022 consolidated financial statements. This report appears under 'Item 8. Financial Statements and Supplementary Data'is included herein under the heading "Report of Independent Registered Public Accounting Firm."
33
Report of Independent Registered Public Accounting Firm
To the Board of Directors and Shareholders of Masco Corporation
Opinions on the Financial Statements and Internal Control over Financial Reporting
We have audited the accompanying consolidated balance sheets of Masco Corporation and its subsidiaries (the “Company”) as of December 31, 20192022 and 2018,2021, and the related consolidated statements of operations, of comprehensive income (loss), of shareholders'shareholders’ equity and of cash flows for each of the three years in the period ended December 31, 2019,2022, including the related notes and financial statement schedule listed in the index appearing under Item 15(a)(2) (collectively referred to as the “consolidated financial statements”). We also have audited the Company's internal control over financial reporting as of December 31, 2019,2022, based on criteria established in Internal Control - Integrated Framework (2013) issued by the Committee of Sponsoring Organizations of the Treadway Commission (COSO).
In our opinion, the consolidated financial statements referred to above present fairly, in all material respects, the financial position of the Company as of December 31, 20192022 and 2018,2021, and the results of its operations and its cash flows for each of the three years in the period ended December 31, 20192022 in conformity with accounting principles generally accepted in the United States of America. Also in our opinion, the Company maintained, in all material respects, effective internal control over financial reporting as of December 31, 2019,2022, based on criteria established in Internal Control - Integrated Framework(2013) issued by the COSO.
Basis for Opinions
The Company's management is responsible for these consolidated financial statements, for maintaining effective internal control over financial reporting, and for its assessment of the effectiveness of internal control over financial reporting, included in the accompanying Management’s Report on Internal Control overOver Financial Reporting. Our responsibility is to express opinions on the Company’s consolidated financial statements and on the Company's internal control over financial reporting based on our audits. We are a public accounting firm registered with the Public Company Accounting Oversight Board (United States) (PCAOB) and are required to be independent with respect to the Company in accordance with the U.S. federal securities laws and the applicable rules and regulations of the Securities and Exchange Commission and the PCAOB.
We conducted our audits in accordance with the standards of the PCAOB. Those standards require that we plan and perform the audits to obtain reasonable assurance about whether the consolidated financial statements are free of material misstatement, whether due to error or fraud, and whether effective internal control over financial reporting was maintained in all material respects.
Our audits of the consolidated financial statements included performing procedures to assess the risks of material misstatement of the consolidated financial statements, whether due to error or fraud, and performing procedures that respond to those risks. Such procedures included examining, on a test basis, evidence regarding the amounts and disclosures in the consolidated financial statements. Our audits also included evaluating the accounting principles used and significant estimates made by management, as well as evaluating the overall presentation of the consolidated financial statements. Our audit of internal control over financial reporting included obtaining an understanding of internal control over financial reporting, assessing the risk that a material weakness exists, and testing and evaluating the design and operating effectiveness of internal control based on the assessed risk. Our audits also included performing such other procedures as we considered necessary in the circumstances. We believe that our audits provide a reasonable basis for our opinions.
Definition and Limitations of Internal Control over Financial Reporting
A company’s internal control over financial reporting is a process designed to provide reasonable assurance regarding the reliability of financial reporting and the preparation of financial statements for external purposes in accordance with generally accepted accounting principles. A company’s internal control over financial reporting includes those policies and procedures that (i) pertain to the maintenance of records that, in reasonable detail, accurately and fairly reflect the transactions and dispositions of the assets of the company; (ii) provide reasonable assurance that transactions are recorded as necessary to permit preparation of financial statements in accordance with generally accepted accounting principles, and that receipts and expenditures of the
34
company are being made only in accordance with authorizations of management and directors of the company; and (iii) provide reasonable
assurance regarding prevention or timely detection of unauthorized acquisition, use, or disposition of the company’s assets that could have a material effect on the financial statements.
Because of its inherent limitations, internal control over financial reporting may not prevent or detect misstatements. Also, projections of any evaluation of effectiveness to future periods are subject to the risk that controls may become inadequate because of changes in conditions, or that the degree of compliance with the policies or procedures may deteriorate.
Critical Audit Matters
The critical audit matter communicated below is a matter arising from the current period audit of the consolidated financial statements that was communicated or required to be communicated to the audit committee and that (i) relates to accounts or disclosures that are material to the consolidated financial statements and (ii) involved our especially challenging, subjective, or complex judgments. The communication of critical audit matters does not alter in any way our opinion on the consolidated financial statements, taken as a whole, and we are not, by communicating the critical audit matter below, providing a separate opinion on the critical audit matter or on the accounts or disclosures to which it relates.
Goodwill Impairment Assessments
As described in Notes A and H to the consolidated financial statements, the Company’s consolidated goodwill balance was $509$537 million as of December 31, 2019.2022. Management performs an annual impairment test of goodwill in the fourth quarter of each year, or as events occur or circumstances change that would indicate the carrying value of goodwill may be impaired. In connection with its annual assessment, management recorded a $19 million non-cash goodwill impairment charge within their Decorative Architectural Products segment. Potential impairment is identified by comparing the fair value of a reporting unit to its carrying value, including goodwill. Management estimates fair value by using a discounted cash flow model or a market approach.model. The determination of fair value using the discounted cash flow model requires management to make significant estimates and assumptions related to forecasted sales and operating profits, and the discount rate.
The principal considerations for our determination that performing procedures relating to the goodwill impairment assessments is a critical audit matter are there was(i) the significant judgment by management when developing the fair value measurements of the reporting units. This in turn led tounits; and (ii) a high degree of auditor judgment, subjectivity, and effort in performing procedures to evaluate management’s discounted cash flow model, including significant assumptions related to forecasted sales, and the discount rates. In addition, the audit effort involved the use of professionals with specialized skill and knowledge to assist in performing these procedures and evaluating the audit evidence obtained from these procedures.as applicable.
Addressing the matter involved performing procedures and evaluating audit evidence in connection with forming our overall opinion on the consolidated financial statements. These procedures included testing the effectiveness of controls relating to management’s goodwill impairment assessments, including controls over the valuation of the Company’s reporting units. These procedures also included, among others, testing management’s process for developing the fair value estimates; evaluating the appropriateness of the discounted cash flow model; testing the completeness, accuracy, and relevance of underlying data used in the model; and, evaluating the significant assumptions used by management includingrelated to forecasted sales, and the discount rates. Professionals with specialized skill and knowledge were used to assist in evaluating the Company’s discount rate assumptions.as applicable. Evaluating management’s assumptionassumptions related to forecasted sales involved evaluating whether the assumptions used were reasonable considering (i) the current and past performance of the reporting units, (ii) the consistency with external market and industry data as it relates to forecasted sales, and (iii) whether they were consistent with evidence obtained in other areas of the audit.
/s/ PricewaterhouseCoopers LLP
Detroit, Michigan
February 11, 20209, 2023
We have served as the Company’s auditor since 1959.
35
Financial Statements and Supplementary Data
MASCO CORPORATION and Consolidated Subsidiaries
CONSOLIDATED BALANCE SHEETS
December 31, 20192022 and 20182021
(In Millions, Except Share Data)
| 2022 | 2021 | ||||||||||
| ASSETS | |||||||||||
| Current assets: | |||||||||||
| Cash and cash investments | $ | 452 | $ | 926 | |||||||
| Receivables | 1,149 | 1,171 | |||||||||
| Inventories | 1,236 | 1,216 | |||||||||
| Prepaid expenses and other | 109 | 109 | |||||||||
| Total current assets | 2,946 | 3,422 | |||||||||
| Property and equipment, net | 975 | 896 | |||||||||
| Goodwill | 537 | 568 | |||||||||
| Other intangible assets, net | 350 | 388 | |||||||||
| Operating lease right-of-use assets | 266 | 187 | |||||||||
| Other assets | 113 | 114 | |||||||||
| Total assets | $ | 5,187 | $ | 5,575 | |||||||
| LIABILITIES | |||||||||||
| Current liabilities: | |||||||||||
| Accounts payable | $ | 877 | $ | 1,045 | |||||||
| Notes payable | 205 | 10 | |||||||||
| Accrued liabilities | 807 | 884 | |||||||||
| Total current liabilities | 1,889 | 1,939 | |||||||||
| Long-term debt | 2,946 | 2,949 | |||||||||
| Noncurrent operating lease liabilities | 255 | 172 | |||||||||
| Other liabilities | 339 | 437 | |||||||||
| Total liabilities | $ | 5,429 | $ | 5,497 | |||||||
| Commitments and contingencies (Note U) | |||||||||||
| Redeemable noncontrolling interest | 20 | 22 | |||||||||
| EQUITY | |||||||||||
| Masco Corporation's shareholders' equity: | |||||||||||
Common shares, par value $1 per share Authorized shares: 1,400,000,000; Issued and outstanding: 2022 – 225,300,000; 2021 – 241,200,000 | 225 | 241 | |||||||||
Preferred shares authorized: 1,000,000; Issued and outstanding: 2022 and 2021 – None | — | — | |||||||||
| Paid-in capital | 16 | — | |||||||||
| Retained deficit | (947) | (652) | |||||||||
| Accumulated other comprehensive income | 226 | 232 | |||||||||
| Total Masco Corporation's shareholders' deficit | (480) | (179) | |||||||||
| Noncontrolling interest | 218 | 235 | |||||||||
| Total equity | (262) | 56 | |||||||||
| Total liabilities and equity | $ | 5,187 | $ | 5,575 | |||||||
| 2019 | 2018 | ||||||
| ASSETS | |||||||
| Current Assets: | |||||||
| Cash and cash investments | $ | 697 | $ | 552 | |||
| Receivables | 997 | 990 | |||||
| Inventories | 754 | 798 | |||||
| Prepaid expenses and other | 90 | 84 | |||||
| Assets held for sale | 173 | 342 | |||||
| Total current assets | 2,711 | 2,766 | |||||
| Property and equipment, net | 878 | 885 | |||||
| Goodwill | 509 | 511 | |||||
| Other intangible assets, net | 259 | 288 | |||||
| Operating lease right-of-use assets | 176 | — | |||||
| Other assets | 139 | 90 | |||||
| Assets held for sale | 355 | 853 | |||||
| Total assets | $ | 5,027 | $ | 5,393 | |||
| LIABILITIES | |||||||
| Current Liabilities: | |||||||
| Accounts payable | $ | 697 | $ | 736 | |||
| Notes payable | 2 | 8 | |||||
| Accrued liabilities | 700 | 645 | |||||
| Liabilities held for sale | 149 | 295 | |||||
| Total current liabilities | 1,548 | 1,684 | |||||
| Long-term debt | 2,771 | 2,971 | |||||
| Other liabilities | 751 | 549 | |||||
| Liabilities held for sale | 13 | 120 | |||||
| Total liabilities | 5,083 | 5,324 | |||||
| Commitments and contingencies (Note T) | |||||||
| EQUITY | |||||||
| Masco Corporation's shareholders' equity: | |||||||
Common shares, par value $1 per share Authorized shares: 1,400,000,000; Issued and outstanding: 2019 – 275,600,000; 2018 – 293,900,000 | 276 | 294 | |||||
Preferred shares authorized: 1,000,000; Issued and outstanding: 2019 and 2018 – None | — | — | |||||
| Paid-in capital | — | — | |||||
| Retained deficit | (332 | ) | (278 | ) | |||
| Accumulated other comprehensive loss | (179 | ) | (127 | ) | |||
| Total Masco Corporation's shareholders' deficit | (235 | ) | (111 | ) | |||
| Noncontrolling interest | 179 | 180 | |||||
| Total equity | (56 | ) | 69 | ||||
| Total liabilities and equity | $ | 5,027 | $ | 5,393 | |||
See notes to consolidated financial statements.
MASCO CORPORATION and Consolidated Subsidiaries
CONSOLIDATED STATEMENTS OF OPERATIONS
For the Years Ended December 31, 2019, 20182022, 2021 and 20172020
(In Millions, Except Per Common Share Data)
| 2019 | 2018 | 2017 | |||||||||
| Net sales | $ | 6,707 | $ | 6,654 | $ | 6,014 | |||||
| Cost of sales | 4,336 | 4,327 | 3,794 | ||||||||
| Gross profit | 2,371 | 2,327 | 2,220 | ||||||||
| Selling, general and administrative expenses | 1,274 | 1,250 | 1,191 | ||||||||
| Impairment charge for other intangible assets | 9 | — | — | ||||||||
| Operating profit | 1,088 | 1,077 | 1,029 | ||||||||
| Other income (expense), net: | |||||||||||
| Interest expense | (159 | ) | (156 | ) | (279 | ) | |||||
| Other, net | (15 | ) | (14 | ) | (32 | ) | |||||
| (174 | ) | (170 | ) | (311 | ) | ||||||
| Income from continuing operations before income taxes | 914 | 907 | 718 | ||||||||
| Income tax expense | 230 | 221 | 245 | ||||||||
| Income from continuing operations | 684 | 686 | 473 | ||||||||
| Income from discontinued operations, net | 296 | 98 | 107 | ||||||||
| Net income | 980 | 784 | 580 | ||||||||
| Less: Net income attributable to noncontrolling interest | 45 | 50 | 47 | ||||||||
| Net income attributable to Masco Corporation | $ | 935 | $ | 734 | $ | 533 | |||||
| Income per common share attributable to Masco Corporation: | |||||||||||
| Basic: | |||||||||||
| Income from continuing operations | $ | 2.21 | $ | 2.06 | $ | 1.34 | |||||
| Income from discontinued operations, net | 1.03 | 0.32 | 0.34 | ||||||||
| Net income | $ | 3.24 | $ | 2.38 | $ | 1.68 | |||||
| Diluted: | |||||||||||
| Income from continuing operations | $ | 2.20 | $ | 2.05 | $ | 1.33 | |||||
| Income from discontinued operations, net | 1.02 | 0.32 | 0.33 | ||||||||
| Net income | $ | 3.22 | $ | 2.37 | $ | 1.66 | |||||
| Amounts attributable to Masco Corporation: | |||||||||||
| Income from continuing operations | $ | 639 | $ | 636 | $ | 426 | |||||
| Income from discontinued operations, net | 296 | 98 | 107 | ||||||||
| Net income | $ | 935 | $ | 734 | $ | 533 | |||||
| 2022 | 2021 | 2020 | |||||||||||||||
| Net sales | $ | 8,680 | $ | 8,375 | $ | 7,188 | |||||||||||
| Cost of sales | 5,967 | 5,512 | 4,601 | ||||||||||||||
| Gross profit | 2,713 | 2,863 | 2,587 | ||||||||||||||
| Selling, general and administrative expenses | 1,390 | 1,413 | 1,292 | ||||||||||||||
| Impairment charges for goodwill and other intangible assets | 26 | 45 | — | ||||||||||||||
| Operating profit | 1,297 | 1,405 | 1,295 | ||||||||||||||
| Other income (expense), net: | |||||||||||||||||
| Interest expense | (108) | (278) | (144) | ||||||||||||||
| Other, net | 4 | (439) | (20) | ||||||||||||||
| (104) | (717) | (164) | |||||||||||||||
| Income from continuing operations before income taxes | 1,193 | 688 | 1,131 | ||||||||||||||
| Income tax expense | 288 | 210 | 269 | ||||||||||||||
| Income from continuing operations | 905 | 478 | 862 | ||||||||||||||
| Income from discontinued operations, net | — | — | 414 | ||||||||||||||
| Net income | 905 | 478 | 1,276 | ||||||||||||||
| Less: Net income attributable to noncontrolling interest | 61 | 68 | 52 | ||||||||||||||
| Net income attributable to Masco Corporation | $ | 844 | $ | 410 | $ | 1,224 | |||||||||||
| Income per common share attributable to Masco Corporation: | |||||||||||||||||
| Basic: | |||||||||||||||||
| Income from continuing operations | $ | 3.65 | $ | 1.63 | $ | 3.05 | |||||||||||
| Income from discontinued operations, net | — | — | 1.55 | ||||||||||||||
| Net income | $ | 3.65 | $ | 1.63 | $ | 4.60 | |||||||||||
| Diluted: | |||||||||||||||||
| Income from continuing operations | $ | 3.63 | $ | 1.62 | $ | 3.04 | |||||||||||
| Income from discontinued operations, net | — | — | 1.55 | ||||||||||||||
| Net income | $ | 3.63 | $ | 1.62 | $ | 4.59 | |||||||||||
| Amounts attributable to Masco Corporation: | |||||||||||||||||
| Income from continuing operations | $ | 844 | $ | 410 | $ | 810 | |||||||||||
| Income from discontinued operations, net | — | — | 414 | ||||||||||||||
| Net income | $ | 844 | $ | 410 | $ | 1,224 | |||||||||||
See notes to consolidated financial statements.
MASCO CORPORATION and Consolidated Subsidiaries
CONSOLIDATED STATEMENTS OF COMPREHENSIVE INCOME (LOSS)
For the Years Ended December 31, 2019, 20182022, 2021 and 20172020
(In Millions)
| 2019 | 2018 | 2017 | |||||||||
| Net income | $ | 980 | $ | 784 | $ | 580 | |||||
| Less: Net income attributable to noncontrolling interest | 45 | 50 | 47 | ||||||||
| Net income attributable to Masco Corporation | $ | 935 | $ | 734 | $ | 533 | |||||
| Other comprehensive (loss) income, net of tax (Note O): | |||||||||||
| Cumulative translation adjustment | $ | 6 | $ | (31 | ) | $ | 133 | ||||
| Interest rate swaps | 2 | 2 | 3 | ||||||||
| Pension and other post-retirement benefits | (64 | ) | 9 | 63 | |||||||
| Other comprehensive (loss) income, net of tax | (56 | ) | (20 | ) | 199 | ||||||
| Less: Other comprehensive (loss) income attributable to the noncontrolling interest: | |||||||||||
| Cumulative translation adjustment | $ | (1 | ) | $ | (15 | ) | $ | 28 | |||
| Pension and other post-retirement benefits | (3 | ) | (2 | ) | 1 | ||||||
| (4 | ) | (17 | ) | 29 | |||||||
| Other comprehensive (loss) income attributable to Masco Corporation | $ | (52 | ) | $ | (3 | ) | $ | 170 | |||
| Total comprehensive income | $ | 924 | $ | 764 | $ | 779 | |||||
| Less: Total comprehensive income attributable to noncontrolling interest | 41 | 33 | 76 | ||||||||
| Total comprehensive income attributable to Masco Corporation | $ | 883 | $ | 731 | $ | 703 | |||||
| 2022 | 2021 | 2020 | |||||||||||||||
| Net income | $ | 905 | $ | 478 | $ | 1,276 | |||||||||||
| Less: Net income attributable to noncontrolling interest | 61 | 68 | 52 | ||||||||||||||
| Net income attributable to Masco Corporation | $ | 844 | $ | 410 | $ | 1,224 | |||||||||||
| Other comprehensive (loss) income, net of tax (Note P): | |||||||||||||||||
| Cumulative translation adjustment | $ | (60) | $ | (32) | $ | 72 | |||||||||||
| Interest rate swaps | — | 7 | 1 | ||||||||||||||
| Pension and other post-retirement benefits | 54 | 384 | (18) | ||||||||||||||
| Other comprehensive (loss) income, net of tax | (6) | 359 | 55 | ||||||||||||||
| Less: Other comprehensive (loss) income attributable to the noncontrolling interest: | |||||||||||||||||
| Cumulative translation adjustment | $ | (9) | $ | (19) | $ | 20 | |||||||||||
| Pension and other post-retirement benefits | 9 | 4 | (2) | ||||||||||||||
| — | (15) | 18 | |||||||||||||||
| Other comprehensive (loss) income attributable to Masco Corporation | $ | (6) | $ | 374 | $ | 37 | |||||||||||
| Total comprehensive income | $ | 899 | $ | 837 | $ | 1,331 | |||||||||||
| Less: Total comprehensive income attributable to noncontrolling interest | 61 | 53 | 70 | ||||||||||||||
| Total comprehensive income attributable to Masco Corporation | $ | 838 | $ | 784 | $ | 1,261 | |||||||||||
See notes to consolidated financial statements.
MASCO CORPORATION and Consolidated Subsidiaries
CONSOLIDATED STATEMENTS OF CASH FLOWS
For the Years Ended December 31, 2019, 20182022, 2021 and 20172020
(In Millions)
| 2022 | 2021 | 2020 | |||||||||||||||
| CASH FLOWS FROM (FOR) OPERATING ACTIVITIES: | |||||||||||||||||
| Net income | $ | 905 | $ | 478 | $ | 1,276 | |||||||||||
| Depreciation and amortization | 145 | 151 | 133 | ||||||||||||||
| Fair value adjustment to contingent earnout obligation | (24) | 16 | — | ||||||||||||||
| Display amortization | — | — | 2 | ||||||||||||||
| Deferred income taxes | (15) | (68) | (3) | ||||||||||||||
| Employee withholding taxes paid on stock-based compensation | 17 | 15 | 25 | ||||||||||||||
| Loss (gain) on investments, net | 5 | (25) | (3) | ||||||||||||||
| Loss (gain) on disposition of businesses, net | 1 | 18 | (602) | ||||||||||||||
| Pension and other post-retirement benefits | (3) | 312 | (32) | ||||||||||||||
| Impairment of goodwill and other intangible assets | 26 | 45 | — | ||||||||||||||
| Stock-based compensation | 49 | 61 | 45 | ||||||||||||||
| Dividends paid-in-kind | — | (6) | (10) | ||||||||||||||
| Increase in receivables | (15) | (64) | (141) | ||||||||||||||
| Increase in inventories | (43) | (350) | (89) | ||||||||||||||
| (Decrease) increase in accounts payable and accrued liabilities, net | (225) | 190 | 332 | ||||||||||||||
| Debt extinguishment costs | — | 160 | 5 | ||||||||||||||
| Other, net | 17 | (3) | 15 | ||||||||||||||
| Net cash from operating activities | 840 | 930 | 953 | ||||||||||||||
| CASH FLOWS FROM (FOR) FINANCING ACTIVITIES: | |||||||||||||||||
| Retirement of notes | — | (1,326) | (400) | ||||||||||||||
| Purchase of Company common stock | (914) | (1,026) | (727) | ||||||||||||||
| Cash dividends paid | (258) | (211) | (145) | ||||||||||||||
| Dividends paid to noncontrolling interest | (68) | (43) | (23) | ||||||||||||||
| Issuance of notes, net of issuance costs | — | 1,481 | 415 | ||||||||||||||
| Proceeds from term loan | 500 | — | — | ||||||||||||||
| Payment of term loan | (300) | — | — | ||||||||||||||
| Debt extinguishment costs | — | (160) | (5) | ||||||||||||||
| Proceeds from the exercise of stock options | 1 | 5 | 26 | ||||||||||||||
| Employee withholding taxes paid on stock-based compensation | (17) | (15) | (25) | ||||||||||||||
| Payment of debt | (10) | (3) | (2) | ||||||||||||||
| Net cash for financing activities | (1,066) | (1,298) | (886) | ||||||||||||||
| CASH FLOWS FROM (FOR) INVESTING ACTIVITIES: | |||||||||||||||||
| Capital expenditures | (224) | (128) | (114) | ||||||||||||||
| Acquisition of businesses, net of cash acquired | — | (57) | (227) | ||||||||||||||
| Proceeds from disposition of: | |||||||||||||||||
| Businesses, net of cash disposed | — | 5 | 870 | ||||||||||||||
| Property and equipment | 1 | — | 1 | ||||||||||||||
| Financial investments | 1 | 171 | 3 | ||||||||||||||
| Other, net | (8) | (3) | (2) | ||||||||||||||
| Net cash (for) from investing activities | (230) | (12) | 531 | ||||||||||||||
| Effect of exchange rate changes on cash and cash investments | (18) | (20) | 31 | ||||||||||||||
| CASH AND CASH INVESTMENTS: | |||||||||||||||||
| (Decrease) increase for the year | (474) | (400) | 629 | ||||||||||||||
| At January 1 | 926 | 1,326 | 697 | ||||||||||||||
| At December 31 | $ | 452 | $ | 926 | $ | 1,326 | |||||||||||
| 2019 | 2018 | 2017 | |||||||||
| CASH FLOWS FROM (FOR) OPERATING ACTIVITIES: | |||||||||||
| Net income | $ | 980 | $ | 784 | $ | 580 | |||||
| Depreciation and amortization | 159 | 156 | 127 | ||||||||
| Display amortization | 12 | 21 | 25 | ||||||||
| Deferred income taxes | (41 | ) | 4 | 13 | |||||||
| Employee withholding taxes paid on stock-based compensation | 23 | 42 | 33 | ||||||||
| Gain on disposition of investments, net | (1 | ) | (4 | ) | (4 | ) | |||||
| (Gain) loss on disposition of businesses, net | (298 | ) | — | 13 | |||||||
| Pension and other postretirement benefits | (45 | ) | (47 | ) | (38 | ) | |||||
| Impairment of financial investments | — | — | 2 | ||||||||
| Impairment of goodwill and other intangible assets | 16 | — | — | ||||||||
| Stock-based compensation | 35 | 27 | 38 | ||||||||
| Increase in receivables | (37 | ) | (46 | ) | (140 | ) | |||||
| Decrease (increase) in inventories | 58 | (11 | ) | (78 | ) | ||||||
| (Decrease) increase in accounts payable and accrued liabilities, net | (27 | ) | 108 | 67 | |||||||
| Debt extinguishment costs | 2 | — | 104 | ||||||||
| Other, net | (3 | ) | (2 | ) | 9 | ||||||
| Net cash from operating activities | 833 | 1,032 | 751 | ||||||||
| CASH FLOWS FROM (FOR) FINANCING ACTIVITIES: | |||||||||||
| Retirement of notes | (201 | ) | (114 | ) | (535 | ) | |||||
| Purchase of Company common stock | (896 | ) | (654 | ) | (331 | ) | |||||
| Cash dividends paid | (144 | ) | (134 | ) | (129 | ) | |||||
| Dividends paid to noncontrolling interest | (42 | ) | (89 | ) | (35 | ) | |||||
| Issuance of notes, net of issuance costs | — | — | 593 | ||||||||
| Debt extinguishment costs | (2 | ) | — | (104 | ) | ||||||
| Increase in debt | — | — | 2 | ||||||||
| Proceeds from the exercise of stock options | 27 | 14 | — | ||||||||
| Employee withholding taxes paid on stock-based compensation | (23 | ) | (42 | ) | (33 | ) | |||||
| Payment of debt | (8 | ) | (1 | ) | (5 | ) | |||||
| Credit Agreement and other financing costs | (2 | ) | — | — | |||||||
| Net cash for financing activities | (1,291 | ) | (1,020 | ) | (577 | ) | |||||
| CASH FLOWS FROM (FOR) INVESTING ACTIVITIES: | |||||||||||
| Capital expenditures | (162 | ) | (219 | ) | (173 | ) | |||||
| Acquisition of businesses, net of cash acquired | — | (549 | ) | (89 | ) | ||||||
| Proceeds from disposition of: | |||||||||||
| Businesses, net of cash disposed | 722 | — | 128 | ||||||||
| Short-term bank deposits | — | 108 | 218 | ||||||||
| Property and equipment | 34 | 14 | 24 | ||||||||
| Other financial investments | 1 | 5 | 7 | ||||||||
| Purchases of short-term bank deposits | — | — | (106 | ) | |||||||
| Other, net | (13 | ) | (10 | ) | (34 | ) | |||||
| Net cash from (for) investing activities | 582 | (651 | ) | (25 | ) | ||||||
| Effect of exchange rate changes on cash and cash investments | 14 | 4 | 55 | ||||||||
| CASH AND CASH INVESTMENTS: | |||||||||||
| Increase (decrease) for the year | 138 | (635 | ) | 204 | |||||||
| At January 1 | 559 | 1,194 | 990 | ||||||||
| At December 31 | $ | 697 | $ | 559 | $ | 1,194 | |||||
See notes to consolidated financial statements.
MASCO CORPORATION and Consolidated Subsidiaries
CONSOLIDATED STATEMENTS OF SHAREHOLDERS' EQUITY
For the Years Ended December 31, 2019, 20182022, 2021 and 20172020
(In Millions, Except Per Common Share Data)
| Total | Common Shares ($1 par value) | Paid-In Capital | Retained (Deficit) Earnings | Accumulated Other Comprehensive (Loss) Income | Noncontrolling Interest | ||||||||||||||||||||||||||||||
| Balance, January 1, 2020 | $ | (57) | $ | 276 | $ | — | $ | (333) | $ | (179) | $ | 179 | |||||||||||||||||||||||
| Total comprehensive income | 1,331 | — | — | 1,224 | 37 | 70 | |||||||||||||||||||||||||||||
| Shares issued | 14 | 2 | 12 | — | — | — | |||||||||||||||||||||||||||||
| Shares retired: | |||||||||||||||||||||||||||||||||||
| Repurchased | (727) | (19) | (53) | (655) | — | — | |||||||||||||||||||||||||||||
| Surrendered (non-cash) | (14) | (1) | — | (13) | — | — | |||||||||||||||||||||||||||||
| Cash dividends declared | (144) | — | — | (144) | — | — | |||||||||||||||||||||||||||||
| Dividends declared to noncontrolling interest | (23) | — | — | — | — | (23) | |||||||||||||||||||||||||||||
| Stock-based compensation | 41 | — | 41 | — | — | — | |||||||||||||||||||||||||||||
| Balance, December 31, 2020 | $ | 421 | $ | 258 | $ | — | $ | 79 | $ | (142) | $ | 226 | |||||||||||||||||||||||
| Total comprehensive income | 836 | — | — | 410 | 374 | 52 | |||||||||||||||||||||||||||||
| Shares issued | 3 | 1 | 2 | — | — | — | |||||||||||||||||||||||||||||
| Shares retired: | |||||||||||||||||||||||||||||||||||
| Repurchased | (1,026) | (18) | (57) | (951) | — | — | |||||||||||||||||||||||||||||
| Surrendered (non-cash) | (13) | — | — | (13) | — | — | |||||||||||||||||||||||||||||
| Cash dividends declared | (175) | — | — | (175) | — | — | |||||||||||||||||||||||||||||
| Dividends declared to noncontrolling interest | (43) | — | — | — | — | (43) | |||||||||||||||||||||||||||||
| Redeemable noncontrolling interest - redemption adjustment | (2) | — | — | (2) | — | — | |||||||||||||||||||||||||||||
| Stock-based compensation | 55 | — | 55 | — | — | — | |||||||||||||||||||||||||||||
| Balance, December 31, 2021 | $ | 56 | $ | 241 | $ | — | $ | (652) | $ | 232 | $ | 235 | |||||||||||||||||||||||
| Total comprehensive income (loss) | 900 | — | — | 844 | (6) | 62 | |||||||||||||||||||||||||||||
| Shares issued | 1 | 1 | — | — | — | — | |||||||||||||||||||||||||||||
| Shares retired: | |||||||||||||||||||||||||||||||||||
| Repurchased | (914) | (17) | (32) | (865) | — | — | |||||||||||||||||||||||||||||
| Surrendered (non-cash) | (17) | — | — | (17) | — | — | |||||||||||||||||||||||||||||
| Cash dividends declared | (259) | — | — | (259) | — | — | |||||||||||||||||||||||||||||
| Dividends declared to noncontrolling interest | (79) | — | — | — | — | (79) | |||||||||||||||||||||||||||||
| Redeemable noncontrolling interest - redemption adjustment | 2 | — | — | 2 | — | — | |||||||||||||||||||||||||||||
| Stock-based compensation | 48 | — | 48 | — | — | — | |||||||||||||||||||||||||||||
| Balance, December 31, 2022 | $ | (262) | $ | 225 | $ | 16 | $ | (947) | $ | 226 | $ | 218 | |||||||||||||||||||||||
| Total | Common Shares ($1 par value) | Paid-In Capital | Retained (Deficit) Earnings | Accumulated Other Comprehensive (Loss) Income | Noncontrolling Interest | ||||||||||||||||||
| Balance, January 1, 2017 | $ | (96 | ) | $ | 318 | $ | — | $ | (374 | ) | $ | (235 | ) | $ | 195 | ||||||||
| Total comprehensive income | 779 | 533 | 170 | 76 | |||||||||||||||||||
| Shares issued | (19 | ) | 2 | (21 | ) | ||||||||||||||||||
| Shares retired: | |||||||||||||||||||||||
| Repurchased | (331 | ) | (9 | ) | (8 | ) | (314 | ) | |||||||||||||||
| Surrendered (non-cash) | (15 | ) | (1 | ) | (14 | ) | |||||||||||||||||
| Cash dividends declared | (129 | ) | (129 | ) | |||||||||||||||||||
| Dividends paid to noncontrolling interest | (35 | ) | (35 | ) | |||||||||||||||||||
| Stock-based compensation | 29 | 29 | |||||||||||||||||||||
| Balance, December 31, 2017 | $ | 183 | $ | 310 | $ | — | $ | (298 | ) | $ | (65 | ) | $ | 236 | |||||||||
| Reclassification of disproportionate tax effects (Refer to Note O) | — | 59 | (59 | ) | |||||||||||||||||||
| Total comprehensive income (loss) | 764 | 734 | (3 | ) | 33 | ||||||||||||||||||
| Shares issued | (9 | ) | 3 | (4 | ) | (8 | ) | ||||||||||||||||
| Shares retired: | |||||||||||||||||||||||
| Repurchased | (654 | ) | (19 | ) | (26 | ) | (609 | ) | |||||||||||||||
| Surrendered (non-cash) | (19 | ) | (19 | ) | |||||||||||||||||||
| Cash dividends declared | (137 | ) | (137 | ) | |||||||||||||||||||
| Dividends paid to noncontrolling interest | (89 | ) | (89 | ) | |||||||||||||||||||
| Stock-based compensation | 30 | 30 | |||||||||||||||||||||
| Balance, December 31, 2018 | $ | 69 | $ | 294 | $ | — | $ | (278 | ) | $ | (127 | ) | $ | 180 | |||||||||
| Total comprehensive income (loss) | 924 | 935 | (52 | ) | 41 | ||||||||||||||||||
| Shares issued | 15 | 3 | 12 | ||||||||||||||||||||
| Shares retired: | |||||||||||||||||||||||
| Repurchased | (896 | ) | (20 | ) | (42 | ) | (834 | ) | |||||||||||||||
| Surrendered (non-cash) | (10 | ) | (1 | ) | (9 | ) | |||||||||||||||||
| Cash dividends declared | (146 | ) | (146 | ) | |||||||||||||||||||
| Dividends paid to noncontrolling interest | (42 | ) | (42 | ) | |||||||||||||||||||
| Stock-based compensation | 30 | 30 | |||||||||||||||||||||
| Balance, December 31, 2019 | $ | (56 | ) | $ | 276 | $ | — | $ | (332 | ) | $ | (179 | ) | $ | 179 | ||||||||
See notes to consolidated financial statements.
MASCO CORPORATION
NOTES TO CONSOLIDATED FINANCIAL STATEMENTS
A. ACCOUNTING POLICIES
Principles of Consolidation. The consolidated financial statements include the accounts of Masco Corporation and all majority-owned subsidiaries. All significant intercompany transactions have been eliminated. We consolidate the assets, liabilities and results of operations of variable interest entities for which we are the primary beneficiary.
Use of Estimates and Assumptions in the Preparation of Financial Statements. The preparation of financial statements in conformity with accounting principles generally accepted ("GAAP") in the United States of America requires us to make certain estimates and assumptions that affect the reported amounts of assets and liabilities, disclosure of any contingent assets and liabilities at the date of the financial statements and the reported amounts of revenues and expenses during the reporting period. Actual results may differ from these estimates and assumptions.
Revenue Recognition. We recognize revenue as control of our products is transferred to our customers, which is generally at the time of shipment or upon delivery based on the contractual terms with our customers. Our customers' payment terms generally range from 30 to 65 days of fulfilling our performance obligations and recognizing revenue.days.
We provide customer programs and incentive offerings, including special pricing and co-operative advertising arrangements, promotions and other volume-based incentives. These customer programs and incentives are considered variable consideration. We include in revenue variable consideration only to the extent that it is probable that a significant reversal in the amount of cumulative revenue recognized will not occur when the variable consideration is resolved. This determination is made based upon known customer program and incentive offerings at the time of sale and expected sales volume forecasts as it relates to our volume-based incentives. This determination is updated each reporting period.
Certain product sales include a right of return. We estimate future product returns at the time of sale based on historical experience and record a corresponding refund liability. We additionally record an asset, based on historical experience, for the amount of product we expect to return to inventory as a result of the return, which is recorded in prepaid expenses and other in the consolidated balance sheets.
We consider shipping and handling activities performed by us as activities to fulfill the sales of our products. Amounts billed for shipping and handling are included in net sales, while costs incurred for shipping and handling are included in cost of sales. We capitalize incremental costs of obtaining a contract and expense the costs on a straight-line basis over the contractual period if the cost is recoverable, the cost would not have been incurred without the contract and the term of the contract is greater than one year; otherwise, we expense the amounts as incurred. We do not adjust the promised amount of consideration for the effects of a financing component if the period between when we transfer our products or services and when our customers pay for our products or services is expected to be one year or less.
Customer Displays. In-store displays that are owned by us and used to market our products are included in other assets in the consolidated balance sheets and are amortized using the straight-line method over the expected useful life of three to five years; related amortization expense is classified as a selling expense in the consolidated statementstatements of operations.
Foreign Currency. The financial statements of our foreign subsidiaries are measured using the local currency as the functional currency. Assets and liabilities of these subsidiaries are translated at exchange rates as of the balance sheet dates. Revenues and expenses are translated at average exchange rates in effect during the year. The resulting cumulative translation adjustments have been recorded in the accumulated other comprehensive loss component of shareholders' equity.income in the consolidated balance sheets. Realized foreign currency transaction gains and losses are included in other income (expense), net in the consolidated statements of operations in other income (expense), net.operations.
Cash and Cash Investments. We consider all highly liquid investments with an initial maturity of three months or less to be cash and cash investments.
41
MASCO CORPORATION
NOTES TO CONSOLIDATED FINANCIAL STATEMENTS (CONTINUED)
A. ACCOUNTING POLICIES (Continued)
Receivables. We do significant business with home center retailers, wholesalers and a number of customers, including certain home center retailers.other customers. We monitor our exposure for credit losses on our customer receivable balances and other financial investments measured at amortized cost and the credit worthiness of our customers on an on-going basis, including requiring the completion of credit applications and performing periodic reviews of our open accounts receivable. We record related allowances for doubtful accountscredit losses for estimated losses resulting from the inability of our customers to makefulfill their required payments.payment obligation to us. Allowances are estimated based upon specific customer balances, where a risk of defaultloss has been identified, and also include a provision for non-customer specific defaultslosses based upon historical collection returnexperience and write-off activity.activity as well as reasonable and supportable forecast information that considers macro-economic factors and industry-specific trends associated with our businesses, among others. A separate allowance is recorded for customer incentive rebates and is generally based upon sales activity. Receivables are presented net of certain allowances (including allowances for doubtful accounts)credit losses) of $36$53 million and $33$67 million at December 31, 20192022 and 2018,2021, respectively. Our receivables balances are generally due in less than one year.
Property and Equipment. Property and equipment, including significant improvements to existing facilities, are recorded at cost. Upon retirement or disposal, the cost and accumulated depreciation are removed from the accounts and any gain or loss is included in the consolidated statements of operations. Maintenance and repair costs are charged against earnings as incurred.
We review our property and equipment as events occur or circumstances change that would more likely than not reduce the fair value of the property and equipment below its carrying amount. If the carrying amount of property and equipment is not recoverable from its undiscounted cash flows, then we would recognize an impairment loss for the difference between the carrying amount and the current fair value. Further, we evaluate the remaining useful lives of property and equipment at each reporting period to determine whether events and circumstances warrant a revision to the remaining depreciation periods.
Depreciation. Depreciation expense is computed principally using the straight-line method over the estimated useful lives of the assets. Annual depreciation rates are as follows: buildings and land improvements, 2 to 10 percent, computer hardware and software, 17 to 33 percent, and machinery and equipment, 5 to 33 percent. Depreciation expense, including discontinued operations, was $132$112 million in 2019 and 2018 and $1162022, $111 million in 2017.2021 and $105 million in 2020.
Leases. We determine if an arrangement is a lease at inception. Operating leases are included in operating lease right-of-use assets (“ROU assets”), accrued liabilities and othernoncurrent operating lease liabilities on our consolidated balance sheet. Finance lease ROU assets are included in property and equipment, net, notes payable, and long-term debt on our consolidated balance sheet.sheets.
ROU assets represent our right to use an underlying asset for the duration of the lease term while lease liabilities represent our obligation to make lease payments in exchange for the right to use an underlying asset. ROU assets and lease liabilities are measured based on the present value of fixed lease payments over the lease term at the commencement date. The ROU asset also includes any lease payments made prior to the commencement date and initial direct costs incurred, and is reduced by any lease incentives received. We review our ROU assets as events occur or circumstances change that would indicate the carrying amount of the ROU assets are not recoverable and exceed their fair values. If the carrying amount of the ROU asset is not recoverable from its undiscounted cash flows, then we would recognize an impairment loss for the difference between the carrying amount and the current fair value.
As most of our leases do not provide an implicit discount rate, we generally use our incremental borrowing rate on the commencement date of the lease as the discount rate in determining the present value of future lease payments. We determine the incremental borrowing rate for each lease by using the current yields of our uncollateralized, publicly traded debts with maturity periods similar to the respective lease term or a comparable market alternative, adjusted to a collateralized basis based on third-party data. Our lease terms may include options to extend or terminate the lease when there are relevant economic incentives present that make it reasonably certain that we will exercise that option. We account for any non-lease components separately from lease components.
42
MASCO CORPORATION
NOTES TO CONSOLIDATED FINANCIAL STATEMENTS (CONTINUED)
A. ACCOUNTING POLICIES (Continued)
For operating leases, lease expense for future fixed lease payments is recognized on a straight-line basis over the lease term. For finance leases, lease expense for future fixed lease payments is recognized using the effective interest rate method over the lease term. Variable lease payments are recognized as lease expense in the period incurred. Leases with an initial term of 12 months or less are not recorded on the consolidated balance sheet;sheets; we recognize lease expense for these leases on a straight-line basis over the lease term.
Goodwill and Other Intangible Assets. We perform our annual impairment testing of goodwill in the fourth quarter of each year, or as events occur or circumstances change that would more likely than not reduce the fair value of a reporting unit below its carrying amount. We have defined our reporting units and completed the impairment testing of goodwill at the operating segment level. Our operating segments are reporting units that engage in business activities, for which discrete financial information, including five-year forecasts, areis available. We compare the fair value of the reporting units to the carrying value of the reporting units for goodwill impairment testing. Fair value is determined primarily using a discounted cash flow method, which includes significant unobservable inputs (Level 3 inputs), and requires us to make significant estimates and assumptions, including long-term projections of cash flows, market conditions and appropriate discount rates. Our judgments are based upon historical experience, current market trends, consultations with external valuation specialists and other information. In estimating future cash flows, we rely on internally generated five-year forecasts for sales and operating profits, and, currently, a 2two percent to 3three percent long-term assumed annual growth rate of cash flows for periods after the five-year forecast. We utilize ourFor 2022, we utilized a weighted average cost of capital of approximately 8.08.75 percent as the basis to determine the discount rate to apply to the estimated future cash flows. In 2019, basedBased upon our assessment of the risks impacting each of our businesses, we applied a risk premium to increase the discount rate to a range of 10.010.25 percent to 12.012.75 percent for our reporting units. For our Masco Cabinetry reporting unit, we utilized a market approach to determine its fair value instead of the discounted cash flow method, as we were actively marketing the Masco Cabinetry business for sale and on November 14, 2019 we entered into a definitive agreement to sell the business. If the carrying amount of a reporting unit exceeds its fair value, an impairment loss is recognized to the extent that a reporting unit's carrying value exceeds its fair value, not to exceed the carrying amount of goodwill in that reporting unit.
We review our other indefinite-lived intangible assets for impairment annually in the fourth quarter, or as events occur or circumstances change that indicate the assets may be impaired without regard to the business unit. Potential impairment is identified by comparing the fair value of an other indefinite-lived intangible asset to its carrying value. We utilize a relief-from-royalty model to estimate the fair value of other indefinite-lived intangible assets. We consider the implications of both external (e.g., market growth, competition and local economic conditions) and internal (e.g., product sales and expected product growth) factors and their potential impact on cash flows related to the intangible asset in both the near- and long-term. We also consider the profitability of the business, among other factors, to determine the royalty rate for use in the impairment assessment. We utilize our weighted average cost of capital of approximately 8.08.75 percent as the basis to determine the discount rate to apply to the estimated future cash flows. In 2019,2022, based upon our assessment of the risks impacting each of our businesses and the nature of the other indefinite-lived intangible asset (i.e., trade name), we applied a risk premium to increase the discount rate to a range of 11.011.25 percent to 13.013.75 percent for our other indefinite-lived intangible assets.
While we believe that the estimates and assumptions underlying the valuation methodologies are reasonable, different estimates and assumptions could result in different outcomes.
Intangible assets with finite useful lives are amortized using the straight-line method over their estimated useful lives. We review our intangible assets with finite useful lives as events occur or circumstances change that would more likely than not reduce the fair value of the assets below its carrying amount. If the carrying amount of the assets is not recoverable from the undiscounted cash flows, then we would recognize an impairment loss for the difference between the carrying amount and the current fair value. We evaluate the remaining useful lives of amortizable intangible assets at each reporting period to determine whether events or circumstances warrant a revision to the remaining periods of amortization.
Refer to Note H for additional information regarding goodwill and other intangible assets.
43
MASCO CORPORATION
NOTES TO CONSOLIDATED FINANCIAL STATEMENTS (CONTINUED)
A. ACCOUNTING POLICIES (Continued)
Acquisitions. We allocate the purchase price of an acquired business to its identifiable assets and liabilities based on estimated fair values. The excess of the purchase price over the amount allocated to the assets and liabilities, if any, is recorded as goodwill. In addition, any contingent consideration is fair valued as of the date of the acquisition and is recorded as part of the purchase price. This estimate is updated in future periods and any changes in the estimate, which are not considered an adjustment to the purchase price, are recorded in our consolidated statements of operations.
We use all available information to estimate fair values. We typically engage external valuation specialists to assist in the fair value determination of identifiable intangible assets and any other significant assets or liabilities. We adjust the preliminary purchase price allocation, as necessary, up to one year after the acquisition closing date as we obtain more information regarding assets acquired and liabilities assumed based on facts and circumstances that existed as of the acquisition date.
Our purchase price allocation methodology contains uncertainties because it requires us to make assumptions and to apply judgment to estimate the fair value of acquired assets and assumed liabilities. We estimate the fair value of assets and liabilities based upon the carrying value of the acquired assets and assumed liabilities and widely accepted valuation techniques, including discounted cash flows. Unanticipated events or circumstances may occur which could affect the accuracy of our fair value estimates, including assumptions regarding industry economic factors and business strategies.
Other estimates used in determining fair value include, but are not limited to, future cash flows or income related to intangibles, market rate assumptions and appropriate discount rates. Our estimates of fair value are based upon assumptions believed to be reasonable, but that are inherently uncertain, and therefore, may not be realized. Accordingly, there can be no assurance that the estimates, assumptions, and values reflected in the valuations will be realized, and actual results could vary materially.
Refer to Note B for additional information regarding acquisitions.
Fair Value Accounting.of Financial Instruments. We use derivative financial instruments to manage certain exposure to fluctuations in earnings and cash flows resulting from changes in foreign currency exchange rates, and occasionally from changes in commodity costs and interest rate exposures. Derivative financial instruments are recorded in the consolidated balance sheets as either an asset or liability measured at fair value, netted by counterparty, where the right of offset exists. The gain or loss is recognized in determining current earnings during the period of the change in fair value. We currently do not have any derivative instruments for which we have designated hedge accounting.
Warranty. We offer limited warranties on certain products with warranty periods ranginglasting up to the lifetime of the product to the original consumer purchaser. At the time of sale, we accrue a warranty liability for the estimated future cost to provide products, parts or services to repair or replace products, or refunds to satisfy our warranty obligations. Our estimate of future costs to service our warranty obligations is based upon the information available and includes a number of factors, such as the warranty coverage, the warranty period, historical experience specific to the nature, frequency and average cost to service the claim, along with industry and demographic trends.
Certain factors and related assumptions in determining our warranty liability involve judgments and estimates and are sensitive to changes in the factors described above. We believe that the warranty accrual is appropriate; however, actual claims incurred could differ from our original estimates which would require us to adjust our previously established accruals. Refer to Note TU for additional information on our warranty accrual.
A significant portion of our business is at the consumer retail level through home center retailers and other major retailers. A consumer may return a product to a retail outlet that is a warranty return. However, certain retail outlets do not distinguish between warranty and other types of returns when they claim a return deduction from us. Our revenue recognition policy takes into account this type of return when recognizing revenue, and an estimate of these amounts is recorded as a deduction to net sales at the time of sale.
44
MASCO CORPORATION
NOTES TO CONSOLIDATED FINANCIAL STATEMENTS (CONTINUED)
A. ACCOUNTING POLICIES (Continued)
Insurance Reserves. We provide for expenses associated with workers' compensation and product liability obligations when such amounts are probable and can be reasonably estimated. The accruals are adjusted as new information develops or circumstances change that would affect the estimated liability. Any obligations expected to be settled within 12 months are recorded in accrued liabilities; all other obligations are recorded in other liabilities.liabilities.
Litigation. We are involved in claims and litigation, including class actions, mass torts and regulatory proceedings, which arise in the ordinary course of our business. Liabilities and costs associated with these matters require estimates and judgments based upon our professional knowledge and experience and that of our legal counsel. When a liability is probable of being incurred and our exposure in these matters is reasonably estimable, amounts are recorded as charges to earnings. The ultimate resolution of these exposures may differ due to subsequent developments.
Stock-Based Compensation. We issue stock-based incentives in various forms to our employees and non-employee Directors. Outstanding stock-based incentives were in the form of long-term stock awards, stock options, restricted stock units ("RSUs"), phantomperformance restricted stock units ("PRSUs"), stock options, long-term stock awards and phantom stock appreciation rights ("SARs"). awards.
We measure compensation expense for RSUs and long-term stock awards at the market price of our common stock at the grant date. SuchWe measure compensation expense is recognized ratably overfor PRSUs at the shorterexpected payout of the vesting period of the stock awards, typically five years, or the length of time until the grantee becomes retirement-eligible, generally at age 65.awards. We measure compensation expense for stock options using a Black-Scholes option pricing model. Such expense is recognized ratably over the shorter of the vesting period of the stock options, typically five years, or the length of time until the grantee becomes retirement-eligible, generally at age 65. We measure compensation expense for RSUs at the expected payout of the awards. Such expense is recognized ratably over the three-year vesting period of the units. We recognize forfeitures related to stock awards,RSUs, PRSUs, stock options and RSUslong-term stock awards as they occur.
We initially measure compensation expense for phantom stock awards at the market price of our common stock at the grant date. Such expense is recognized ratably over the vesting period, typically five years. Phantom stock awards are linked to the value of our common stock on the date of grant and are settled in cash upon vesting. We account for phantom stock awards as liability-based awards; the liability is remeasured and adjusted at the end of each reporting period until the awards are fully-vested and paid to the employees. We measure
In December 2019, our Compensation and Talent Committee of the Board of Directors (the "Compensation Committee") amended the terms of equity awards under our 2014 Long Term Stock Incentive Plan to provide that newly issued RSUs, stock options and phantom stock awards vest over a three-year period and redefined retirement-eligibility as age 65 or age 55 with at least 10 years of continuous service. As such, compensation expense for SARs using a Black-Scholes option pricing model; such expenseequity awards granted in 2020 and thereafter is recognized ratably over the shorter of the vesting period, typically five years. SARs are linked tothree years, or the valuelength of our common stock on the date of grant and are settled in cash upon exercise. We account for SARs using the fair value method, which requires outstanding SARs to be classified as liability-based awards. The liability is remeasured and adjusted at the end of each reporting periodtime until the SARs are exercisedgrantee becomes retirement eligible. For prior year grants, expense was recognized ratably over the shorter of the vesting period of the long-term stock awards, stock options and payment is made to the employeesphantom stock awards, typically five years, or the SARs expire. length of time until the grantee became retirement-eligible, generally at age 65. Expense for PRSUs is recognized ratably over the three-year vesting period of the units.
Refer to Note LM for additional information on stock-based compensation.
Noncontrolling Interest. We owned 68 percent of Hansgrohe SE at both December 31, 20192022 and 2018.2021. The aggregate noncontrolling interest, net of dividends, at December 31, 20192022 and 20182021 has been recorded as a component of equity on our consolidated balance sheets.
Discontinued Operations. We report financial results for discontinued operations separately from continuing operations to distinguish the financial impact of disposal transactions from ongoing operations. Discontinued operations reporting occurs only when the disposal of a component or a group of components represents a strategic shift that will have a major effect on our operations and financial results. In our consolidated statements of cash flows, the cash flow from discontinued operations are not separately classified.
Refer to Note BC for further information regarding our discontinued operations.
45
MASCO CORPORATION
NOTES TO CONSOLIDATED FINANCIAL STATEMENTS (CONTINUED)
A. ACCOUNTING POLICIES (Concluded)
Income Taxes. DeferredWe record deferred taxes are recognized based on the future tax consequences of differences between the financial statement carrying value of our assets and liabilities and their respective tax basis. The future realization of deferred tax assets depends on the existencesufficient sources of sufficient taxable income in future periods. Possible sources of taxable income include taxable income in carryback periods, the future reversal of existing taxable temporary differences recorded as a deferred tax liability, tax-planning strategies that generate future income or gains in excess of anticipated losses in the carryforward period and projected future taxable income.
If, based upon all available evidence, both positive and negative, it is more likely than not (more than 50 percent likely) suchour deferred tax assets will not be realized, a valuation allowance is recorded. Significant weight is given to positive and negative evidence that is objectively verifiable. A company's three-year cumulative loss position is significant negative evidence in considering whether deferred
We only recognize the tax assets are realizable, and the accounting guidance restricts the amount of reliance we can place on projected taxable income to support the recovery of the deferred tax assets.
positions where it is more likely than not the position may not be sustained based on its technical merits. We record interest and penalties on our uncertain tax positions in income tax expense.
We record the tax effects of Global Intangible Low-taxed Income related to our foreign operations, if applicable, as a component of income taxes requires us totax expense in the period the tax arises.
We allocate our provision for income taxes between continuing operations and other categories of earnings, such as other comprehensive income (loss). Subsequent adjustmentsearnings. Adjustments to deferred taxes originally recorded to other comprehensive income (loss) may reverse in a different category of earnings, such as continuing operations, resulting in a disproportionate tax effect within accumulated other comprehensive income (loss).income. Generally, a disproportionate tax effect will be eliminated and recognized in income tax expense when the circumstances upon which it is premised cease to exist.
The disproportionate tax effecteffects related to our various qualified domestic defined-benefit pension plans will bewere eliminated from accumulated other comprehensive income (loss) at the termination of the related pension plans.plans in 2021. The disproportionate tax effect relating to our interest rate swap hedge, which was terminated in 2012, will bewas eliminated from accumulated other comprehensive income (loss) upon the maturityearly retirement of the related debt in March 2022.
Recently Adopted Accounting Pronouncements. In February 2016,August 2020, the Financial Accounting Standards Board ("FASB") issued a newASU 2020-06, “Debt—Debt with Conversion and Other Options (Subtopic 470-20) and Derivatives and Hedging—Contracts in Entity’s Own Equity (Subtopic 815-40): Accounting for Convertible Instruments and Contracts in an Entity’s Own Equity.” ASU 2020-06 simplifies the accounting for convertible instruments by reducing the number of accounting models for convertible debt instruments and convertible preferred stock. We adopted this standard for leases, ASC 842, which changes the accounting model for identifying and accounting for leases. We adopted ASC 842 onannual periods beginning January 1, 2019 using the optional transition method, which allows for initial application of the new standard beginning at the adoption date. We elected the package of practical expedients that allows us to forgo reassessing a) whether any existing contracts are or contain leases, b) the lease classification for any existing leases, and c) whether initial direct costs for any existing leases are capitalized. We also elected the practical expedient to use hindsight with respect to lease renewals, terminations, and purchase options when determining the lease term and in assessing impairment of the assets related to leases existing at the time of adoption. As a result of the standard, we recorded $236 million of operating lease ROU assets, $45 million of short-term operating lease liabilities, and $214 million of long-term operating lease liabilities on the date of adoption which includes assets and liabilities that have subsequently been reclassified as held for sale or disposed of. Our accounting for finance leases remained unchanged. The standard did not impact our consolidated statements of operations or statements of cash flows.
In June 2018,October 2021, the FASB issued ASU 2018-07, "Compensation-Stock Compensation2021-08, “Business Combinations (Topic 718)805): ImprovementsAccounting for Acquired Contract Assets and Contract Liabilities from Contracts with Customers.” ASU 2021-08 requires contract assets and contract liabilities acquired in a business combination to Nonemployee Share-Based Payment Accounting," which modifiesbe recognized in accordance with Topic 606 as if the accounting for share-based payment awards issued to nonemployees to largely align it withacquirer had originated the accounting for share-based payment awards issued to employees.contracts. We adopted ASU 2018-07 onthis standard for annual periods beginning January 1, 2019.2022. The adoption of thethis new standard did not impact our financial position or results of operations.
Recently Issued Accounting Pronouncements. In June 2016,September 2022, the FASB issued ASU 2016-13, "Financial Instruments-Credit Losses (Topic 326)2022-04, "Liabilities – Supplier Finance Programs (Subtopic 405-50): MeasurementDisclosure of Credit Losses on Financial Instruments,"Supplier Finance Program Obligations,” which modifies the methodology for recognizing loss impairments on certain types of financial instruments, including receivables. The new methodology requires that an entity that uses a supplier finance program in connection with the purchase of goods or services disclose information about the program’s nature, activity during the period, changes from period to estimate the credit losses expected over the life of an exposure. Additionally,period, and potential magnitude. ASU 2016-13 amends the current available-for-sale security other-than-temporary impairment model for debt securities. ASU 2016-132022-04 is effective for usannual periods on a retrospective basis, including interim periods within those annual periods, beginning January 1, 2023, except for the amendment on rollforward information, which is effective prospectively for annual periods beginning January 1, 2020. This standard2024. The adoption of this guidance will impact the valuation ofmodify our credit losses relating to our receivables, however, we dodisclosures, but will not expect the standard to have a material impact on our financial position or results of operations.statements.
46
MASCO CORPORATION
NOTES TO CONSOLIDATED FINANCIAL STATEMENTS (CONTINUED)
B. ACQUISITIONS
In the third quarter of 2021, we acquired all of the share capital of Steamist, Inc. ("Steamist") for approximately $56 million in cash. Steamist is a manufacturer of residential steam bath products that are complementary to many of our plumbing products. This business is included in our Plumbing Products segment. In connection with this acquisition, we recognized $31 million of definite-lived intangible assets, primarily related to customer relationships. The definite-lived intangible assets are being amortized on a straight-line basis over a weighted average amortization period of 11 years. We also recognized $29 million of goodwill, which is not tax deductible, and is related primarily to the expected synergies from combining the operations into our business. Working capital and other adjustments were finalized with the seller in the fourth quarter of 2021, resulting in no significant changes.
In the first quarter of 2021, our Hansgrohe SE subsidiary acquired a 75.1 percent equity interest in Easy Sanitary Solutions B.V. ("ESS"), for approximately €47 million ($58 million), including $52 million of cash and $6 million of debt that will be paid out over two years less any pending or settled indemnity matters. The cash payment was made to a third-party notary on December 29, 2020 for the acquisition of this equity interest in advance of the transaction closing on January 4, 2021. ESS is a manufacturer of shower channel drains that offers a wide range of products for barrier-free showering and bathroom wall niches. This business is included in our Plumbing Products segment. In connection with this acquisition, we recognized $32 million of definite-lived intangible assets, primarily related to customer relationships. The definite-lived intangible assets are being amortized on a straight-line basis over a weighted average amortization period of 10 years. We also recognized $35 million of goodwill, which is not tax deductible, and is related primarily to the expected synergies from combining the operations into our business. Working capital and other adjustments were finalized with the seller in the fourth quarter of 2021, resulting in no significant changes.
The remaining 24.9 percent equity interest in ESS is subject to a call and put option that is exercisable by Hansgrohe SE or the sellers, respectively, any time after December 31, 2023. The redemption value of the call and put option is the same and based on a floating EBITDA value. The call and put options were determined to be embedded within the redeemable noncontrolling interest and were recorded as temporary equity in the consolidated balance sheets. We elected to adjust the redeemable noncontrolling interest to its full redemption amount directly into retained deficit.
In the fourth quarter of 2020, we acquired substantially all of the net assets of Kraus USA Inc. ("Kraus"), a designer and distributor of sinks, faucets and accessories for the kitchen and bathroom, for approximately $103 million and an additional cash payment of up to $50 million to be paid in 2023, contingent upon the achievement of certain financial performance metrics for the year ending December 31, 2022. As of the closing date of the acquisition, the contingent consideration was assigned a fair value of approximately $8 million. Refer to Note I for additional information regarding the measurement of the contingent consideration liability. This business expands our product offerings to our customers and our online presence under the Kraus brand. This business is included in our Plumbing Products segment. In connection with this acquisition, we recognized $25 million of indefinite-lived intangible assets, which is related to trademarks, and $49 million of definite-lived intangible assets, primarily related to customer relationships. The definite-lived intangible assets are being amortized on a straight-line basis over a weighted average amortization period of 10 years. We also recognized $20 million of goodwill, which is generally tax deductible, and is related primarily to the expected synergies from combining the operations into our business. During the first quarter of 2021, we revised the allocation of the purchase price to certain identifiable assets and liabilities based on analysis of information as of the acquisition date, which resulted in a $1 million decrease to goodwill. The working capital adjustments were finalized with the seller in the second quarter of 2021, resulting in no significant changes.
47
MASCO CORPORATION
NOTES TO CONSOLIDATED FINANCIAL STATEMENTS (CONTINUED)
B. ACQUISITIONS (Concluded)
In the fourth quarter of 2020, we acquired substantially all of the net assets of Work Tools International Inc. and Elder & Jenks, LLC (collectively, "Work Tools") for approximately $53 million, including $48 million of cash and $5 million of debt that was paid out in 18 months less any pending or settled indemnity matters. Work Tools expands our product offering to our customers as it is a leading manufacturer of high-quality precision painting tools and accessories including brushes, rollers and mini rollers for DIY and professionals. This business is included in our Decorative Architectural Products segment. In connection with this acquisition, we recognized $7 million of indefinite-lived intangible assets, which is related to trademarks, and $27 million of definite-lived intangible assets, primarily related to customer relationships. The definite-lived intangible assets are being amortized on a straight-line basis over a weighted average amortization period of 12 years. We also recognized $7 million of goodwill, which is generally tax deductible, and is related primarily to the expected synergies from combining the operations into our business. The working capital adjustments were finalized with the seller in the first quarter of 2021, resulting in no significant changes.
In the first quarter of 2020, we acquired all of the share capital of SmarTap A.Y Ltd. ("SmarTap") for approximately $24 million in cash. SmarTap is a developer of a smart bathing system that monitors and controls the temperature and flow of water. This acquisition provides an adaptable solution for a wide range of products as it is compatible with showerheads, hand showers, spouts and shower jets. This business is included in our Plumbing Products segment. In connection with this acquisition, we recognized $10 million of definite-lived intangible assets, primarily related to technology, which is being amortized on a straight-line basis over a weighted average amortization period of 5 years. We also recognized $14 million of goodwill, which is not tax deductible, and is related primarily to the expected synergies from combining the operations into our business.
C. DIVESTITURES
On September 6, 2019,May 31, 2021, we completed the divestiture of our UK Window GroupHüppe GmbH ("Hüppe") business, ("UKWG"), a manufacturer of shower enclosures and distributor of windows and doors, for proceeds of approximately $8 million, of which $2 million net of cash disposed was received upon sale. The remaining $6 million was accounted for as a note receivable that is expected to be collected within the next two years.shower trays. In connection with the sale,divestiture, we recognized a loss of $70$18 million for the year ended December 31, 2019,2021, which is included in income from discontinued operations,other, net in theour consolidated statementsstatement of operations. This loss resulted primarily from the recognition of $23 million of currency translation losses that were previously included within accumulated other comprehensive income. During the first quarter of 2022, we recorded a $2 million pre-tax post-closing gain related to the finalization of working capital items in other, net in our consolidated statement of operations. The sale of Hüppe did not represent a strategic shift that will have a major effect on our operations and financial results and therefore was not presented as discontinued operations. Prior to the divestiture, the results of the business were included in our Plumbing Products segment.
On November 6, 2019, we completed the divestiture of our Milgard Windows and Doors business ("Milgard"), a manufacturer and distributor of windows and doors for proceeds of approximately $720 million, net of cash disposed, subjectdisposed. During the second quarter of 2020, a $17 million pre-tax post-closing adjustment related to finalthe finalization of working capital adjustments. In connection with the sale, we recognized a gain on the divestiture of $368 million for the year ended December 31, 2019, which is included initems was recorded to income from discontinued operations, net in the consolidated statement of operations.
48
MASCO CORPORATION
NOTES TO CONSOLIDATED FINANCIAL STATEMENTS (CONTINUED)
C. DIVESTITURES (Concluded)
As the combined sale of UKWG and Milgard and the planned disposition of Cabinetry each represented a strategic shift that will have a major effect on our operations and financial results, these businesses were presented in discontinued operations separate from continuing operations for all periods presented. In addition, depreciation and amortization, capital expenditures, and significant non-cash operating and investing activities related to discontinued operations were separately disclosed.
The results of Milgard recorded in income from discontinued operations before income tax was income of $2 million for the windows businessesyear ended December 31, 2020. The results of Cabinetry recorded in income from discontinued operations before income tax was a loss of $1$7 million for the year ended December 31, 2019 and income of $40 million and $57 million for the years ended December 31, 2018 and 2017, respectively. The results of the cabinetry business recorded in income from discontinued operations before income tax were income of $107 million, $95 million and $109 million for the years ended December 31, 2019, 2018 and 2017, respectively.
The major classes of line items constituting income from discontinued operations, net, in millions:
| Year Ended December 31, | |||||||||||||||||
| 2022 | 2021 | 2020 | |||||||||||||||
| Net sales | $ | — | $ | — | $ | 101 | |||||||||||
| Cost of sales | — | — | 78 | ||||||||||||||
| Gross profit | — | — | 23 | ||||||||||||||
| Selling, general and administrative expenses | — | — | 28 | ||||||||||||||
| Loss from discontinued operations | — | — | (5) | ||||||||||||||
| Gain on disposal of discontinued operations, net | — | — | 602 | ||||||||||||||
| Income before income tax | — | — | 597 | ||||||||||||||
| Income tax expense | — | — | (183) | ||||||||||||||
| Income from discontinued operations, net | $ | — | $ | — | $ | 414 | |||||||||||
| For the Years Ended December 31, | |||||||||||
| 2019 | 2018 | 2017 | |||||||||
| Net sales | $ | 1,528 | $ | 1,705 | $ | 1,628 | |||||
| Cost of sales | 1,184 | 1,343 | 1,236 | ||||||||
| Gross profit | 344 | 362 | 392 | ||||||||
| Selling, general and administrative expenses | 232 | 228 | 227 | ||||||||
Impairment charge for goodwill (A) | 7 | — | — | ||||||||
| Other income (expense), net | 1 | 1 | 1 | ||||||||
| Income from discontinued operations | 106 | 135 | 166 | ||||||||
| Gain on disposal of discontinued operations, net | 298 | — | — | ||||||||
| Income before income tax | 404 | 135 | 166 | ||||||||
| Income tax expense | (108 | ) | (37 | ) | (59 | ) | |||||
| Income from discontinued operations, net | $ | 296 | $ | 98 | $ | 107 | |||||
| December 31, 2019 | December 31, 2018 | ||||||
| Cash and cash investments | $ | — | $ | 7 | |||
| Receivables | 76 | 163 | |||||
| Prepaid expenses and other | 7 | 24 | |||||
| Inventories | 90 | 148 | |||||
| Property and equipment, net | 157 | 338 | |||||
| Operating lease right-of-use assets | 4 | — | |||||
| Goodwill | 181 | 387 | |||||
| Other intangible assets, net | 1 | 118 | |||||
| Other assets | 12 | 10 | |||||
| Total assets classified as held for sale | $ | 528 | $ | 1,195 | |||
| Accounts payable | $ | 103 | $ | 190 | |||
| Accrued liabilities | 46 | 105 | |||||
| Other liabilities | 13 | 120 | |||||
| Total liabilities classified as held for sale | $ | 162 | $ | 415 | |||
| For the Years Ended December 31, | |||||||||||
| 2019 | 2018 | 2017 | |||||||||
| Depreciation and amortization | $ | 29 | $ | 36 | $ | 34 | |||||
| Capital expenditures | 34 | 38 | 26 | ||||||||
| ROU assets obtained in exchange for new lease obligations | 3 | — | — | ||||||||
| Initial | Final | ||||||
| Receivables | $ | 101 | $ | 100 | |||
| Inventories | 173 | 166 | |||||
| Prepaid expenses and other | 5 | 5 | |||||
| Property and equipment | 33 | 33 | |||||
| Goodwill | 46 | 64 | |||||
| Other intangible assets | 243 | 240 | |||||
| Accounts payable | (24 | ) | (24 | ) | |||
| Accrued liabilities | (25 | ) | (30 | ) | |||
| Other liabilities | (4 | ) | (5 | ) | |||
| Total | $ | 548 | $ | 549 | |||
Our revenues are derived primarily from sales to customers in North America and Internationally, principally Europe. Net sales from these geographic markets, by segment, were as follows, in millions:
| Year Ended December 31, 2022 | |||||||||||||||||
| Plumbing Products | Decorative Architectural Products | Total | |||||||||||||||
| Primary geographic markets: | |||||||||||||||||
| North America | $ | 3,550 | $ | 3,428 | $ | 6,978 | |||||||||||
| International, principally Europe | 1,702 | — | 1,702 | ||||||||||||||
| Total | $ | 5,252 | $ | 3,428 | $ | 8,680 | |||||||||||
| Year Ended December 31, 2019 | Year Ended December 31, 2021 | |||||||||||||||||||||||||||
| Plumbing Products | Decorative Architectural Products | Total | Plumbing Products | Decorative Architectural Products | Total | |||||||||||||||||||||||
| Primary geographic markets: | Primary geographic markets: | |||||||||||||||||||||||||||
| North America | $ | 2,605 | $ | 2,723 | $ | 5,328 | North America | $ | 3,384 | $ | 3,240 | $ | 6,624 | |||||||||||||||
| International, principally Europe | 1,379 | — | 1,379 | International, principally Europe | 1,751 | — | 1,751 | |||||||||||||||||||||
| Total | $ | 3,984 | $ | 2,723 | $ | 6,707 | Total | $ | 5,135 | $ | 3,240 | $ | 8,375 | |||||||||||||||
| Year Ended December 31, 2018 | |||||||||||
| Plumbing Products | Decorative Architectural Products | Total | |||||||||
| Primary geographic markets: | |||||||||||
| North America | $ | 2,552 | $ | 2,656 | $ | 5,208 | |||||
| International, principally Europe | 1,446 | — | 1,446 | ||||||||
| Total | $ | 3,998 | $ | 2,656 | $ | 6,654 | |||||
| Year Ended December 31, 2017 | |||||||||||
| Plumbing Products | Decorative Architectural Products | Total (A) | |||||||||
| Primary geographic markets: | |||||||||||
| North America | $ | 2,362 | $ | 2,206 | $ | 4,568 | |||||
| International, principally Europe | 1,370 | — | 1,370 | ||||||||
| Total | $ | 3,732 | $ | 2,206 | $ | 5,938 | |||||
49
MASCO CORPORATION
NOTES TO CONSOLIDATED FINANCIAL STATEMENTS (CONTINUED)
| Year Ended December 31, 2020 | |||||||||||||||||
| Plumbing Products | Decorative Architectural Products | Total | |||||||||||||||
| Primary geographic markets: | |||||||||||||||||
| North America | $ | 2,753 | $ | 3,052 | $ | 5,805 | |||||||||||
| International, principally Europe | 1,383 | — | 1,383 | ||||||||||||||
| Total | $ | 4,136 | $ | 3,052 | $ | 7,188 | |||||||||||
We recognized increases toto revenue of $2$20 million, $4$9 million, and $9$7 million in 2019, 2018,2022, 2021, and 2017,2020, respectively, for variable consideration related to performance obligations settled in previous periods.
We record contract assets for items for which we have satisfied our performance obligation but our receipt of payment is contingent upon delivery or other circumstances other than the passage of time. Our contract assets are recorded in prepaid expenses and other in our consolidated balance sheets. Our contract assets generally become unconditional and are reclassified to receivables in the quarter subsequent to each balance sheet date. Our contract asset balance was $2$1 million at both December 31, 20192022 and 2018.
We record contract liabilities primarily for deferred revenue. Our contract liabilities are recorded in accrued liabilities in our consolidated balance sheets. Our contract liabilities are generally recognized to net sales in the immediately subsequent reporting period. Our contract liability balance was $40$61 million and $39$67 million at December 31, 20192022 and 2018,2021, respectively.
| Year Ended December 31, | |||||||||||
| 2022 | 2021 | ||||||||||
| Balance at January 1 | $ | 6 | $ | 7 | |||||||
| Provision for expected credit losses during the period | 5 | 1 | |||||||||
| Write-offs charged against the allowance | (4) | (2) | |||||||||
| Recoveries of amounts previously written off | 1 | 1 | |||||||||
Other (A) | — | (1) | |||||||||
| Balance at end of year | $ | 8 | $ | 6 | |||||||
(A)As a result of Hüppe being divested in May 2021, $1 million for the year ended December 31, 2021 was removed from allowance for credit losses.
50
MASCO CORPORATION
NOTES TO CONSOLIDATED FINANCIAL STATEMENTS (CONTINUED)
E. INVENTORIES
(In Millions) At December 31 | |||||||
| 2019 | 2018 | ||||||
| Finished goods | $ | 485 | $ | 508 | |||
| Raw materials | 211 | 237 | |||||
| Work in process | 58 | 53 | |||||
| Total | $ | 754 | $ | 798 | |||
| At December 31, | |||||||||||
| 2022 | 2021 | ||||||||||
| Finished goods | $ | 715 | $ | 702 | |||||||
| Raw materials | 408 | 383 | |||||||||
| Work in process | 113 | 131 | |||||||||
| Total | $ | 1,236 | $ | 1,216 | |||||||
Inventories, which include purchased parts, materials, direct labor and applied overhead, are stated at the lower of cost or net realizable value, with cost determined primarily by use of the first-in, first-out method, and to a lesser extent the average cost method.
F. LEASES
We have operating and finance leases primarily for corporate offices, manufacturing facilities, warehouses, vehicles, and equipment. Our leases have remaining lease terms up to 2320 years, some of which may include one or more renewal options with terms to extend the lease for up to an additional 2015 years,, and some of which may include options to terminate the leases prior to their expiration.
The components of lease cost included in income from continuing operations were as follows, in millions:
| 2019 | |||
| Operating lease cost | $ | 49 | |
| Short-term lease cost | 6 | ||
| Variable lease cost | 3 | ||
| Finance lease cost: | |||
| Amortization of right-of-use assets | 3 | ||
| Interest on lease liabilities | 1 | ||
| Year Ended December 31, | |||||||||||||||||
| 2022 | 2021 | 2020 | |||||||||||||||
| Operating lease cost | $ | 56 | $ | 48 | $ | 47 | |||||||||||
| Short-term lease cost | 10 | 8 | 7 | ||||||||||||||
| Variable lease cost | 5 | 4 | 3 | ||||||||||||||
| Finance lease cost: | |||||||||||||||||
| Amortization of right-of-use assets | 3 | 3 | 3 | ||||||||||||||
| Interest on lease liabilities | 1 | 1 | 1 | ||||||||||||||
Supplemental cash flow information related to leases was as follows, in millions:
| Year Ended December 31, | |||||||||||||||||||||||
| 2022 | 2021 | 2020 | |||||||||||||||||||||
| Cash paid for amounts included in the measurement of lease liabilities: | |||||||||||||||||||||||
| Operating cash flows for operating leases | $ | 47 | $ | 47 | $ | 47 | |||||||||||||||||
| Operating cash flows for finance leases | 1 | 1 | 1 | ||||||||||||||||||||
| Financing cash flows for finance leases | 2 | 2 | 2 | ||||||||||||||||||||
| ROU assets obtained in exchange for new lease obligations: | |||||||||||||||||||||||
Operating leases (A) | 126 | 67 | 27 | ||||||||||||||||||||
| Finance leases | — | — | — | ||||||||||||||||||||
| 2019 | |||
| Cash paid for amounts included in the measurement of lease liabilities: | |||
| Operating cash flows for operating leases | $ | 58 | |
| Operating cash flows for finance leases | 1 | ||
| Financing cash flows for finance leases | 8 | ||
| ROU assets obtained in exchange for new lease obligations: | |||
| Operating leases | 27 | ||
| Finance leases | — | ||
51
MASCO CORPORATION
NOTES TO CONSOLIDATED FINANCIAL STATEMENTS (CONTINUED)
F. LEASES (Concluded)
Certain other information related to leases was as follows:
| At December 31, | |||||||||||||||||
| 2022 | 2021 | 2020 | |||||||||||||||
| Weighted-average remaining lease term: | |||||||||||||||||
| Operating leases | 10 years | 9 years | 10 years | ||||||||||||||
| Finance leases | 9 years | 9 years | 10 years | ||||||||||||||
| Weighted-average discount rate: | |||||||||||||||||
| Operating leases | 4.8 | % | 4.0 | % | 4.4 | % | |||||||||||
| Finance leases | 3.3 | % | 3.3 | % | 3.3 | % | |||||||||||
Supplemental balance sheet information related to leases was as follows, in millions:
| At December 31, 2019 | |||||||
| Operating Leases | Finance Leases | ||||||
| Property and equipment, net | $ | — | $ | 29 | |||
| Notes payable | — | 2 | |||||
| Accrued liabilities | 38 | — | |||||
| Long-term debt | — | 28 | |||||
| Other liabilities | 162 | — | |||||
| At December 31, | |||||||||||||||||||||||
| 2022 | 2021 | ||||||||||||||||||||||
| Operating Leases | Finance Leases | Operating Leases | Finance Leases | ||||||||||||||||||||
| Property and equipment, net | $ | — | $ | 21 | $ | — | $ | 24 | |||||||||||||||
| Notes payable | — | 3 | — | 3 | |||||||||||||||||||
| Accrued liabilities | 39 | — | 38 | — | |||||||||||||||||||
| Long-term debt | — | 20 | — | 23 | |||||||||||||||||||
Gross ROU assets under finance leases recorded within property and equipment, net were $42 was $41 million, and $42 million at December 31, 2022 and 2021, respectively, and accumulated amortization associated with these leases was $13$20 million, and $18 million, at December 31, 2019.2022 and 2021, respectively.
At December 31, 2019,2022, future maturities of lease liabilities (under ASC 842) were as follows, in millions:
| Operating Leases | Finance Leases | ||||||||||
| Year ending December 31, | |||||||||||
| 2023 | $ | 50 | $ | 3 | |||||||
| 2024 | 47 | 3 | |||||||||
| 2025 | 42 | 3 | |||||||||
| 2026 | 38 | 3 | |||||||||
| 2027 | 30 | 3 | |||||||||
| Thereafter | 174 | 11 | |||||||||
| Total lease payments | 381 | 26 | |||||||||
| Less: imputed interest | (87) | (3) | |||||||||
| Total | $ | 294 | $ | 23 | |||||||
| Operating Leases | Finance Leases | ||||||
| Year ending December 31, | |||||||
| 2020 | $ | 45 | $ | 3 | |||
| 2021 | 39 | 3 | |||||
| 2022 | 31 | 3 | |||||
| 2023 | 21 | 3 | |||||
| 2024 | 16 | 4 | |||||
| Thereafter | 101 | 20 | |||||
| Total lease payments | 253 | 36 | |||||
| Less: imputed interest | (53 | ) | (6 | ) | |||
| Total | $ | 200 | $ | 30 | |||
(In Millions) At December 31 | |||||||
| 2019 | 2018 | ||||||
| Land and improvements | $ | 64 | $ | 64 | |||
| Buildings | 497 | 470 | |||||
| Computer hardware and software | 232 | 220 | |||||
| Machinery and equipment | 1,103 | 1,088 | |||||
| 1,896 | 1,842 | ||||||
| Less: Accumulated depreciation | (1,018 | ) | (957 | ) | |||
| Total | $ | 878 | $ | 885 | |||
52
MASCO CORPORATION
NOTES TO CONSOLIDATED FINANCIAL STATEMENTS (CONTINUED)
G. PROPERTY AND EQUIPMENT
The components of property and equipment, net were as follows, in millions:
| At December 31, | |||||||||||
| 2022 | 2021 | ||||||||||
| Land and improvements | $ | 67 | $ | 67 | |||||||
| Buildings | 579 | 514 | |||||||||
| Computer hardware and software | 265 | 259 | |||||||||
| Machinery and equipment | 1,255 | 1,199 | |||||||||
| 2,166 | 2,039 | ||||||||||
| Less: Accumulated depreciation | (1,191) | (1,143) | |||||||||
| Total | $ | 975 | $ | 896 | |||||||
H. GOODWILL AND OTHER INTANGIBLE ASSETS
Goodwill at December 31, 2022, by segment, was as follows, in millions:
| Gross Goodwill At December 31, 2022 | Accumulated Impairment Losses | Net Goodwill At December 31, 2022 | |||||||||||||||
| Plumbing Products | $ | 611 | $ | (301) | $ | 310 | |||||||||||
| Decorative Architectural Products | 366 | (139) | 227 | ||||||||||||||
| Total | $ | 977 | $ | (440) | $ | 537 | |||||||||||
The changes in the carrying amount of goodwill for years ended December 31, 2022 and 2021, by segment, were as follows, in millions:
| Gross Goodwill At December 31, 2021 | Accumulated Impairment Losses | Net Goodwill At December 31, 2021 | Acquisitions | Pre-tax Impairment Charge | Other (B) | Net Goodwill At December 31, 2022 | |||||||||||||||||||||||||||||||||||||||||
Plumbing Products (A) | $ | 623 | $ | (301) | $ | 322 | $ | — | $ | — | $ | (12) | $ | 310 | |||||||||||||||||||||||||||||||||
| Decorative Architectural Products | 366 | (120) | 246 | — | (19) | — | 227 | ||||||||||||||||||||||||||||||||||||||||
| Total | $ | 989 | $ | (421) | $ | 568 | $ | — | $ | (19) | $ | (12) | $ | 537 | |||||||||||||||||||||||||||||||||
| Gross Goodwill At December 31, 2019 | Accumulated Impairment Losses | Net Goodwill At December 31, 2019 | |||||||||
| Plumbing Products | $ | 566 | $ | (340 | ) | $ | 226 | ||||
| Decorative Architectural Products | 358 | (75 | ) | 283 | |||||||
| Total | $ | 924 | $ | (415 | ) | $ | 509 | ||||
| Gross Goodwill At December 31, 2018 | Accumulated Impairment Losses | Net Goodwill At December 31, 2018 | Additions (A) | Other (B) | Net Goodwill At December 31, 2019 | Gross Goodwill At December 31, 2020 | Accumulated Impairment Losses | Net Goodwill At December 31, 2020 | Acquisitions | Pre-tax Impairment Charge | Other (B) | Net Goodwill At December 31, 2021 | ||||||||||||||||||||||||||||||||||||||||||||||||||||||||||
| Plumbing Products | $ | 568 | $ | (340 | ) | $ | 228 | $ | — | $ | (2 | ) | $ | 226 | Plumbing Products | $ | 613 | $ | (340) | $ | 273 | $ | 63 | $ | — | $ | (14) | $ | 322 | |||||||||||||||||||||||||||||||||||||||||
| Decorative Architectural Products | 358 | (75 | ) | 283 | — | — | 283 | Decorative Architectural Products | 365 | (75) | 290 | 1 | (45) | — | 246 | |||||||||||||||||||||||||||||||||||||||||||||||||||||||
| Total | $ | 926 | $ | (415 | ) | $ | 511 | $ | — | $ | (2 | ) | $ | 509 | Total | $ | 978 | $ | (415) | $ | 563 | $ | 64 | $ | (45) | $ | (14) | $ | 568 | |||||||||||||||||||||||||||||||||||||||||
(A) As a result of Hüppe being divested in May 2021, both gross goodwill and accumulated impairment losses for the Plumbing Products segment were reduced by $39 million.
| Gross Goodwill At December 31, 2017 | Accumulated Impairment Losses | Net Goodwill At December 31, 2017 | Additions (A) | Other (B) | Net Goodwill At December 31, 2018 | ||||||||||||||||||
| Plumbing Products | $ | 574 | $ | (340 | ) | $ | 234 | $ | — | $ | (6 | ) | $ | 228 | |||||||||
| Decorative Architectural Products | 294 | (75 | ) | 219 | 64 | — | 283 | ||||||||||||||||
| Total | $ | 868 | $ | (415 | ) | $ | 453 | $ | 64 | $ | (6 | ) | $ | 511 | |||||||||
(B)Other consists of the effect of foreign currency translation.
53
MASCO CORPORATION
NOTES TO CONSOLIDATED FINANCIAL STATEMENTS (CONTINUED)
H. GOODWILL AND OTHER INTANGIBLE ASSETS (Concluded)
Other indefinite-lived intangible assets were $76$102 million and $86$109 million at December 31, 20192022 and 2018,2021, respectively, and principally included registered trademarks. During the first quarter of 2019, we recognized a $9 million impairment charge related to a registered trademark in our Decorative Architectural Products segment due to a change in the long-term net sales projections of lighting products. As a result of our 2018 acquisition, other indefinite-lived intangible assets increased by $59 million as of the acquisition date.
We completed our annual impairment testing of goodwill and other indefinite-lived intangible assets in the fourth quarters of 2019, 20182022, 2021 and 2017.2020. We recognized a $19 million and $7 million non-cash impairment charge within our Decorative Architectural Products segment to goodwill and other indefinite-lived intangible assets, respectively, in the fourth quarter of 2022 due to competitive market conditions, higher inflationary costs and increased cost of capital in our lighting business. We recognized a $45 million non-cash goodwill impairment charge within our Decorative Architectural Products segment in the fourth quarter of 2021, due to competitive market conditions and higher inflationary costs in our lighting business. There was no impairment of goodwill for any of our reporting units or of our other indefinite-lived intangible assets in any of these years, other than as disclosed above.
The carrying value of our definite-lived intangible assets was $183was $248 million (net of accumulated amortization of $94 million) at December 31, 2022 and $279 million (net of accumulated amortization of $48$75 million) at December 31, 2019 and $202 million (net of accumulated amortization of $26 million) at December 31, 20182021 and principally included customer relationships with a weighted average amortization period of 1715 years in 2019both 2022 and 16 years in 2018.2021. Amortization expense, including discontinued operations, related to the definite-lived intangible assets was $23was $29 million, $20 $31 million and $4$24 million in 2019, 20182022, 2021 and 2017,2020, respectively. As a result of our 2018 acquisition, definite-lived intangible assets increased by $181 million, as of the acquisition date.
At December 31, 2019,2022, amortization expense related to the definite-lived intangible assets during each of the next five years waswill be as follows: 2020 – $24 million; 2021 – $16 million; 2022 – $12 million, 2023 – $11$28 million; 2024 – $27 million; 2025 – $23 million, and 2024 –$11 million.
(In Millions) At December 31 | |||||||
| 2019 | 2018 | ||||||
| Equity method investments | $ | 11 | $ | 11 | |||
| Private equity funds | — | 1 | |||||
| In-store displays, net | 5 | 10 | |||||
| Deferred tax assets (Note R) | 99 | 42 | |||||
| Other | 24 | 26 | |||||
| Total | $ | 139 | $ | 90 | |||
I. FAIR VALUE OF FINANCIAL INSTRUMENTS
Kraus Acquisition Contingent Consideration. As described in Note B, an additional cash payment of up to $50 million related to the Kraus acquisition was contingent upon the achievement of certain financial performance metrics for the year ended December 31, 2022. The measurement of the liability for contingent consideration was based on significant inputs that were not observable in 2019, 2018the market, and 2017, respectively. Cash spentwere therefore classified as Level 3 inputs. Examples of utilized unobservable inputs were estimated future revenues and earnings of the acquired business and an applicable discount rate. The estimate of the liability fluctuated for displays was $11 million, $10 millionchanges in the forecast of the acquired business' future revenues and $14 millionearnings, as a result of actual levels achieved, or in 2019, 2018 and 2017, respectively, and is includedthe discount rate used to determine the present value of contingent future cash flows. All subsequent remeasurements from the initial estimate at the time of acquisition were recorded in other, net within investing activities onin the consolidated statements of cash flows.
(In Millions) At December 31 | |||||||
| 2019 | 2018 | ||||||
| Salaries, wages and commissions | $ | 141 | $ | 143 | |||
| Advertising and sales promotion | 189 | 170 | |||||
| Interest | 36 | 40 | |||||
| Warranty (Note T) | 31 | 29 | |||||
| Employee retirement plans | 41 | 40 | |||||
| Insurance reserves | 37 | 31 | |||||
| Property, payroll and other taxes | 18 | 14 | |||||
| Dividends payable | 37 | 36 | |||||
| Deferred revenue | 40 | 39 | |||||
| Product returns | 25 | 22 | |||||
| Operating lease liabilities | 38 | — | |||||
| Other | 67 | 81 | |||||
| Total | $ | 700 | $ | 645 | |||
(In Millions) At December 31 | |||||||
| 2019 | 2018 | ||||||
| Notes and debentures: | |||||||
| 7.125%, due March 15, 2020 | $ | — | $ | 201 | |||
| 3.500%, due April 1, 2021 | 399 | 399 | |||||
| 5.950%, due March 15, 2022 | 326 | 326 | |||||
| 4.450%, due April 1, 2025 | 500 | 500 | |||||
| 4.375%, due April 1, 2026 | 498 | 498 | |||||
| 3.500%, due November 15, 2027 | 300 | 300 | |||||
| 7.750%, due August 1, 2029 | 235 | 235 | |||||
| 6.500%, due August 15, 2032 | 200 | 200 | |||||
| 4.500%, due May 15, 2047 | 299 | 299 | |||||
| Other | 30 | 38 | |||||
| Prepaid debt issuance costs | (14 | ) | (17 | ) | |||
| 2,773 | 2,979 | ||||||
| Less: Current portion | 2 | 8 | |||||
| Total long-term debt | $ | 2,771 | $ | 2,971 | |||
Fair Value of Debt. The fair value of our short-term and long-term fixed-rate debt instruments is based principally upon modeled market prices for the same or similar issues, which are Level 1 inputs. The 364-day term loan has an interest rate that resets monthly and the fair value of this instrument approximates the carrying value at December 31, 2022. The aggregate estimated market value of our short-term and long-term debt at December 31, 20192022 was approximately $3.0$2.7 billion, compared with the aggregate carrying value of $2.8$3.2 billion. The aggregate estimated market value was approximately $3.0 billion,of our short-term and long-term debt at December 31, 2018, which equaled2021 was approximately $3.2 billion, compared with the aggregate carrying value of short-term and long-term debt at that date.$3.0 billion.
54
MASCO CORPORATION
NOTES TO CONSOLIDATED FINANCIAL STATEMENTS (CONTINUED)
J. OTHER ASSETS
The components of other assets were as follows, in millions:
| At December 31, | |||||||||||
| 2022 | 2021 | ||||||||||
| Deferred tax assets (Note S) | $ | 60 | $ | 57 | |||||||
| Equity method investments | 10 | 18 | |||||||||
| Other investments | 12 | 7 | |||||||||
| Other | 31 | 32 | |||||||||
| Total | $ | 113 | $ | 114 | |||||||
K. ACCRUED LIABILITIES
The components of accrued liabilities were as follows, in millions:
| At December 31, | |||||||||||
| 2022 | 2021 | ||||||||||
| Advertising and sales promotion | $ | 295 | $ | 297 | |||||||
| Salaries, wages and commissions | 136 | 195 | |||||||||
| Deferred revenue | 61 | 67 | |||||||||
| Income taxes payable | 48 | 34 | |||||||||
| Employee retirement plans | 41 | 49 | |||||||||
| Operating lease liabilities (Note F) | 39 | 38 | |||||||||
| Warranty (Note U) | 34 | 31 | |||||||||
| Interest | 30 | 29 | |||||||||
| Product returns | 25 | 23 | |||||||||
| Insurance reserves | 20 | 27 | |||||||||
| Property, payroll and other taxes | 16 | 32 | |||||||||
| Other | 62 | 62 | |||||||||
| Total | $ | 807 | $ | 884 | |||||||
55
MASCO CORPORATION
NOTES TO CONSOLIDATED FINANCIAL STATEMENTS (CONTINUED)
L. DEBT
The carrying value of outstanding debt was as follows, in millions:
| At December 31, | |||||||||||
| 2022 | 2021 | ||||||||||
| Notes and debentures: | |||||||||||
| 3.500%, due November 15, 2027 | $ | 300 | $ | 300 | |||||||
| 1.500%, due February 15, 2028 | 599 | 599 | |||||||||
| 7.750%, due August 1, 2029 | 235 | 235 | |||||||||
| 2.000%, due October 1, 2030 | 300 | 300 | |||||||||
| 2.000%, due February 15, 2031 | 596 | 596 | |||||||||
| 6.500%, due August 15, 2032 | 200 | 200 | |||||||||
| 4.500%, due May 15, 2047 | 416 | 417 | |||||||||
| 3.125%, due February 15, 2051 | 300 | 300 | |||||||||
| 364-day term loan, due April 26, 2023 | 200 | — | |||||||||
| Other | 25 | 35 | |||||||||
| Prepaid debt issuance costs | (20) | (23) | |||||||||
| 3,151 | 2,959 | ||||||||||
| Less: Current portion | 205 | 10 | |||||||||
| Total long-term debt | $ | 2,946 | $ | 2,949 | |||||||
All of the notes and debentures above are senior indebtedness and, other than the 7.75% Notes due 2029, are redeemable at our option.
At December 31, 2022, the debt maturities during each of the next five years were as follows: 2023 – $205 million; 2024 – $3 million; 2025 – $3 million; 2026 – $2 million and 2027 – $302 million.
On April 26, 2022, we entered into a revolving credit agreement (the “2022 Credit Agreement”) with an aggregate commitment of $1.0 billion and a maturity date of April 26, 2027. Under the 2022 Credit Agreement, at our request and subject to certain conditions, we can increase the aggregate commitment up to an additional $500 million with the current lenders or new lenders. Upon entry into the 2022 Credit Agreement, our credit agreement dated March 13, 2019, as amended, with an aggregate commitment of $1.0 billion, was terminated.
The 2022 Credit Agreement provides for an unsecured revolving credit facility available to us and one of our foreign subsidiaries in U.S. dollars, European euros, British pounds sterling, Canadian dollars and certain other currencies for revolving credit loans, swingline loans and letters of credit. Borrowings under the revolving credit loans denominated in any agreed upon currency other than U.S. dollars are limited to the equivalent of $500 million. We can also borrow swingline loans up to $125 million and obtain letters of credit of up to $25 million. Outstanding letters of credit under the 2022 Credit Agreement reduce our borrowing capacity and we had no outstanding letters of credit at December 31, 2022.
56
MASCO CORPORATION
NOTES TO CONSOLIDATED FINANCIAL STATEMENTS (CONTINUED)
L. DEBT (Continued)
Revolving credit loans denominated in U.S. dollars bear interest under the 2022 Credit Agreement at our option, at (A) SOFR rate for the interest period in effect for the borrowing, plus 0.1%, plus an applicable margin based upon our then-applicable corporate credit ratings; or (B) a rate per annum equal to the greatest of (i) the U.S. prime rate, (ii) the Federal Reserve Bank of New York effective rate plus 0.50% and (iii) the adjusted term SOFR rate for a one month interest period, plus 1.0%; plus an applicable margin based upon our then-applicable corporate credit ratings. Foreign currency revolving credit loans denominated in Canadian dollars bear interest at a rate per annum equal to the greater of (i) the rate equal to the PRIMCAN Index rate and (ii) the CDOR rate for a one month interest period, plus 1.0%; plus an applicable margin based upon our then-applicable corporate credit ratings. Foreign currency revolving credit loans denominated in British pounds sterling bear interest at a rate per annum equal to the Daily Simple SONIA, plus an applicable margin based upon our then-applicable corporate credit ratings. Foreign currency revolving credit loans denominated in European euros bear interest at the adjusted EURIBOR rate, plus an applicable margin based upon our then-applicable corporate credit ratings. The various benchmarks are subject to applicable floors.
The 2022 Credit Agreement contains financial covenants requiring us to maintain (A) a net leverage ratio, as adjusted for certain items, not exceeding 4.0 to 1.0, and (B) an interest coverage ratio, as adjusted for certain items, not less than 2.5 to 1.0.
In order for us to borrow under the 2022 Credit Agreement, there must not be any default in our covenants in the 2022 Credit Agreement (i.e., in addition to the two financial covenants described above, principally limitations on subsidiary debt, negative pledge restrictions, and requirements relating to legal compliance, maintenance of our properties and insurance) and our representations and warranties in the 2022 Credit Agreement must be true in all material respects on the date of borrowing (i.e., principally no material adverse change or litigation likely to result in a material adverse change, since December 31, 2021, no material ERISA or environmental non-compliance, and no material tax deficiency). We were in compliance with all covenants and no borrowings were outstanding at December 31, 2022. As of the date of this report, $69 million was borrowed and outstanding at a weighted average interest rate of 5.800%.
On April 26, 2022, we entered into a 364-day $500 million senior unsecured delayed draw term loan due April 26, 2023 with a syndicate of lenders. The senior unsecured term loan and commitments thereunder are subject to prepayment or termination at our option and the loans will bear interest at SOFR plus a spread adjustment and 0.70%. The covenants, including the financial covenants, are substantially the same as those in the 2022 Credit Agreement. We repaid $300 million during 2022.
On March 4, 2021, we issued $600 million of 1.500% Notes due February 15, 2028, $600 million of 2.000% Notes due February 15, 2031 and $300 million of 3.125% Notes due February 15, 2051. We received proceeds of $1,495 million, net of discount, for the issuance of these Notes. The Notes are senior indebtedness and are redeemable at our option at the applicable redemption price. On March 22, 2021, proceeds from the debt issuances, together with cash on hand, were used to repay and early retire our $326 million 5.950% Notes due March 15, 2022, $500 million 4.450% Notes due April 1, 2025, and $500 million 4.375% Notes due April 1, 2026. In connection with these early retirements, we incurred a loss on debt extinguishment of $168 million for the year ended December 31, 2021, which was recorded as interest expense in the consolidated statement of operations.
On September 18, 2020, we issued $300 million of 2.000% Notes due October 1, 2030 (the "2030 Notes") and received proceeds of $300 million, net of discount, for the issuance of the 2030 Notes. Also on September 18, 2020, we issued an incremental $100 million of our existing 4.500% Notes due May 15, 2047 (the "2047 Notes") and received proceeds of $119 million, including a premium, for the issuance of the 2047 Notes. The incremental $100 million formed a single series with the existing $300 million of 4.500% Notes due May 15, 2047. The 2030 Notes and 2047 Notes are senior indebtedness and are redeemable at our option at the applicable redemption price. On September 29, 2020, proceeds from the debt issuances were used to repay and early retire our $400 million 3.500% Notes due April 1, 2021. In connection with this early retirement, we incurred a loss on debt extinguishment of $6 million, which was recorded as interest expense in our consolidated statements of operations.
57
MASCO CORPORATION
NOTES TO CONSOLIDATED FINANCIAL STATEMENTS (CONTINUED)
L. DEBT (Concluded)
Interest paid was $107 million, $114 million and $136 million in 2022, 2021 and 2020, respectively. These amounts exclude $160 million and $5 million of debt extinguishment costs related to the early retirement of debt, which were recorded as interest expense and paid in 2021 and 2020, respectively.
M. STOCK-BASED COMPENSATION
Our 2014 Long Term Stock Incentive Plan (the "2014 Plan") provides for the issuance of stock-based incentives in various forms to our employees and non-employee Directors. At December 31, 2019,2022, outstanding stock-based incentives were in the form of restricted stock units, performance restricted stock units, stock options, long-term stock awards stock options, restricted stock units, and phantom stock awards.
Pre-tax compensation expense (income) included in income from continuing operations for these stock-based incentives was as follows, in millions:
| 2019 | 2018 | 2017 | |||||||||
| Long-term stock awards | $ | 20 | $ | 20 | $ | 21 | |||||
| Stock options | 4 | 3 | 3 | ||||||||
| Restricted stock units | 3 | 4 | 2 | ||||||||
| Phantom stock awards and stock appreciation rights | 4 | (2 | ) | 8 | |||||||
| Total | $ | 31 | $ | 25 | $ | 34 | |||||
| Year Ended December 31, | |||||||||||||||||
| 2022 | 2021 | 2020 | |||||||||||||||
| Restricted stock units | $ | 32 | $ | 28 | $ | 13 | |||||||||||
| Performance restricted stock units | 3 | 10 | 5 | ||||||||||||||
| Stock options | 7 | 7 | 7 | ||||||||||||||
| Long-term stock awards | 6 | 10 | 14 | ||||||||||||||
| Phantom stock awards | 1 | 6 | 4 | ||||||||||||||
| Total | $ | 49 | $ | 61 | $ | 43 | |||||||||||
At December 31, 2019, 13.92022, 11.7 million shares of our common stock were available under the 2014 Plan for the granting of long-termrestricted stock awards,units, performance restricted stock units, stock options and long-term stock awards.
Restricted Stock Units. Restricted stock units are granted to our key employees and non-employee Directors. These grants did not cause net share dilution due to our practice of repurchasing and retiring an equal number of shares in the open market.
Our restricted stock units.unit activity was as follows, units in thousands:
| Year Ended December 31, | |||||||||||||||||||||||||||||||||||
| 2022 | 2021 | 2020 | |||||||||||||||||||||||||||||||||
| Number of Shares | Weighted Average Grant Date Fair Value | Number of Shares | Weighted Average Grant Date Fair Value | Number of Shares | Weighted Average Grant Date Fair Value | ||||||||||||||||||||||||||||||
| Unvested restricted stock units at January 1 | 934 | $ | 54 | 435 | $ | 47 | — | $ | — | ||||||||||||||||||||||||||
| Granted | 621 | 59 | 670 | 57 | 446 | 47 | |||||||||||||||||||||||||||||
| Vested | (351) | 53 | (142) | 47 | — | — | |||||||||||||||||||||||||||||
| Forfeited | (50) | 54 | (29) | 54 | (11) | 48 | |||||||||||||||||||||||||||||
| Unvested restricted stock units at December 31 | 1,154 | $ | 57 | 934 | $ | 54 | 435 | $ | 47 | ||||||||||||||||||||||||||
58
MASCO CORPORATION
NOTES TO CONSOLIDATED FINANCIAL STATEMENTS (CONTINUED)
Performance Restricted Stock Awards.Units. Long-termUnder our Long Term Incentive Program, we grant performance restricted stock units to certain senior executives. These performance restricted stock units will vest and share awards will be issued at no cost to the employees, subject to our achievement of specified return on invested capital performance goals, and beginning with the 2020 grant, an additional earning per share metric over a three-year period that have been established by our Compensation Committee for the performance period. To receive the award, the recipient must be employed through the share award date. Performance restricted stock units are granted toat a target number; based on our key employees and non-employee Directors and do not cause net share dilution, as we repurchase and retire at least an equalperformance, the number of shares inperformance restricted stock units that vest can be adjusted downward to zero and upward to a maximum of 200 percent of the open market. Wetarget number.
During 2022, we granted 636,030 sharesapproximately 92,000 performance restricted stock units with a grant date fair value of long-termapproximately $55 per share, approximately 168,000 performance restricted stock awards during 2019.
| 2019 | 2018 | 2017 | |||||||||
| Unvested stock award shares at January 1 | 2 | 3 | 4 | ||||||||
| Weighted average grant date fair value | $ | 30 | $ | 24 | $ | 20 | |||||
| Stock award shares granted | 1 | 1 | 1 | ||||||||
| Weighted average grant date fair value | $ | 36 | $ | 41 | $ | 34 | |||||
| Stock award shares vested | 1 | 2 | 2 | ||||||||
| Weighted average grant date fair value | $ | 25 | $ | 21 | $ | 18 | |||||
| Stock award shares forfeited | — | — | — | ||||||||
| Weighted average grant date fair value | $ | 35 | $ | 31 | $ | 24 | |||||
| Unvested stock award shares at December 31 | 2 | 2 | 3 | ||||||||
| Weighted average grant date fair value | $ | 34 | $ | 30 | $ | 24 | |||||
units were forfeited. At December 31, 2019, 20182022, there were approximately 255,000 shares vested but unissued. During 2021, we granted approximately 85,000 performance restricted stock units with a grant date fair value of approximately $53 per share, approximately 105,000 performance restricted stock units were issued and 2017, there was $41 million, $46 million and $46 million, respectively, of total unrecognized compensation expense related to unvestedno performance restricted stock awards; such awards had a weighted average remaining vesting period of three years atunits were forfeited. At December 31, 2019, 20182021, there were approximately 186,000 shares vested but unissued. During 2020, we granted approximately 133,000 performance restricted stock units with a grant date fair value of approximately $34 per share, approximately 152,000 performance restricted stock units were issued and 2017.
Stock Options. Stock options are granted to certain key employees. The exercise price equals the market price of our common stock at the grant date. Thesedate and the stock options generally become exercisable (vest ratably) over five years beginning on the first anniversary from the date of grant and expire no later than 10 years after the grant date.
| Year Ended December 31, | |||||||||||||||||||||||||||||||||||
| 2022 | 2021 | 2020 | |||||||||||||||||||||||||||||||||
| Number of Shares | Weighted Average Exercise Price | Number of Shares | Weighted Average Exercise Price | Number of Shares | Weighted Average Exercise Price | ||||||||||||||||||||||||||||||
| Outstanding stock options at January 1 | 2,692 | $ | 37 | 2,488 | $ | 33 | 3,006 | $ | 27 | ||||||||||||||||||||||||||
| Granted | 338 | 59 | 332 | 56 | 421 | 48 | |||||||||||||||||||||||||||||
| Exercised | (32) | 34 | (128) | 25 | (878) | 17 | |||||||||||||||||||||||||||||
| Forfeited | (10) | 37 | — | 11 | (61) | 40 | |||||||||||||||||||||||||||||
| Outstanding stock options at December 31 | 2,988 | $ | 39 | 2,692 | $ | 37 | 2,488 | $ | 33 | ||||||||||||||||||||||||||
| Vested and expected to vest stock options at December 31 | 2,966 | $ | 39 | 2,617 | $ | 36 | 2,338 | $ | 33 | ||||||||||||||||||||||||||
| Exercisable (vested) stock options at December 31 | 2,051 | $ | 34 | 1,606 | $ | 31 | 1,283 | $ | 28 | ||||||||||||||||||||||||||
The aggregate intrinsic value is calculated using our stock options during 2019 with a grantprice at each respective date, weighted-averageless the exercise price (grant date price) multiplied by the number of approximately $36 per share. During 2019, 108,086 stock option shares were forfeited (includingshares. The aggregate intrinsic value for options that expired unexercised).exercised during 2022, 2021 and 2020 was $1 million, $5 million and $29 million, respectively. The aggregate intrinsic value for options vested and expected to vest at December 31, 2022, 2021 and 2020 was $30 million, $89 million and $51 million, respectively. The aggregate intrinsic value for options exercisable (vested) at December 31, 2022, 2021 and 2020 was $28 million, $63 million and $35 million, respectively.
59
MASCO CORPORATION
NOTES TO CONSOLIDATED FINANCIAL STATEMENTS (CONTINUED)
| 2019 | 2018 | 2017 | |||||||||
| Option shares outstanding, January 1 | 4 | 5 | 7 | ||||||||
| Weighted average exercise price | $ | 21 | $ | 16 | $ | 15 | |||||
| Option shares granted | 1 | — | — | ||||||||
| Weighted average exercise price | $ | 36 | $ | 42 | $ | 34 | |||||
| Option shares exercised | 2 | 1 | 2 | ||||||||
Aggregate intrinsic value on date of exercise (A) | $ | 33 | million | $ | 55 | million | $ | 47 | million | ||
| Weighted average exercise price | $ | 13 | $ | 11 | $ | 15 | |||||
| Option shares forfeited | — | — | — | ||||||||
| Weighted average exercise price | $ | 34 | $ | 31 | $ | — | |||||
| Option shares outstanding, December 31 | 3 | 4 | 5 | ||||||||
| Weighted average exercise price | $ | 27 | $ | 21 | $ | 16 | |||||
| Weighted average remaining option term (in years) | 6 | 5 | 4 | ||||||||
| Option shares vested and expected to vest, December 31 | 3 | 4 | 5 | ||||||||
| Weighted average exercise price | $ | 27 | $ | 21 | $ | 16 | |||||
Aggregate intrinsic value (A) | $ | 63 | million | $ | 36 | million | $ | 147 | million | ||
| Weighted average remaining option term (in years) | 6 | 5 | 4 | ||||||||
| Option shares exercisable (vested), December 31 | 2 | 3 | 4 | ||||||||
| Weighted average exercise price | $ | 21 | $ | 16 | $ | 13 | |||||
Aggregate intrinsic value (A) | $ | 47 | million | $ | 34 | million | $ | 123 | million | ||
| Weighted average remaining option term (in years) | 4 | 4 | 3 | ||||||||
At December 31, 2019, 20182022, 2021 and 2017,2020, there was $9$1 million, $8$4 million and $7$6 million, respectively, of unrecognized compensation expense (using the Black-Scholes option pricing model at the grant date) related to unvested stock options; such options had a weighted average remaining vesting period of three yearsone year at December 31, 2019, 20182022 and 2017.two years at both December 31, 2021 and 2020.
The weighted average grant date fair value of option shares granted and the assumptions used to estimate those values using a Black-Scholes option pricing model were as follows:
| Year Ended December 31, | |||||||||||||||||
| 2022 | 2021 | 2020 | |||||||||||||||
| Weighted average grant date fair value | $ | 14.66 | $ | 13.61 | $ | 10.67 | |||||||||||
| Risk-free interest rate | 1.90 | % | 0.75 | % | 1.53 | % | |||||||||||
| Dividend yield | 1.89 | % | 1.67 | % | 1.14 | % | |||||||||||
| Volatility factor | 29.00 | % | 30.00 | % | 24.00 | % | |||||||||||
| Expected option life | 6 years | 6 years | 6 years | ||||||||||||||
| 2019 | 2018 | 2017 | |||||||||
| Weighted average grant date fair value | $ | 8.81 | $ | 12.34 | $ | 9.68 | |||||
| Risk-free interest rate | 2.57 | % | 2.72 | % | 2.16 | % | |||||
| Dividend yield | 1.35 | % | 1.02 | % | 1.19 | % | |||||
| Volatility factor | 25.00 | % | 29.00 | % | 30.00 | % | |||||
| Expected option life | 6 years | 6 years | 6 years | ||||||||