Budapest, Hungary| Location | | Description of Property | | | | | | | Industrial: | | | | | Pittsburgh, PA | | Manufacturing / Division Offices | | | Beijing, China | | Manufacturing | (1) | | Cincinnati, OH | | Manufacturing | (1) | | Germantown, WI | | Manufacturing | (1) | | Gothenburg, Sweden | | Manufacturing / Distribution | (1) | | Ixonia, WI | | Manufacturing | (1) | | Portland, OR | | Manufacturing | |
ITEM 2. | PROPERTIES, (continued) | | Tianjin City, China | | Manufacturing | (1) |
Location | | Wilsonville, OR | | Manufacturing | | Description of Property | | | | | | Marking and Fulfillment Systems: | | | | Pittsburgh, PA | | Manufacturing / Division Offices | | Gothenburg, Sweden | | Manufacturing / Distribution | (1) | Tualatin, OR | | Manufacturing | (1) | Beijing, China | | Manufacturing | (1) | Ixonia, WI | | Manufacturing | (1) | Germantown, WI | | Manufacturing | (1) | Cincinnati, OH | | Manufacturing | (1) | | | | | Merchandising Solutions: | | | | East Butler, PA | | Manufacturing / Division Offices | | Portland, OR | | Sales Office | (1) | | | | | | | Corporate Office: | | | | | Pittsburgh, PA | | General Offices | | | | | |
| (1) | These properties are leased by the Company under operating lease arrangements. Rent expense incurred by the Company for all leased facilities was approximately $31.8 million in fiscal 2015. |
| (2) | In addition to the properties listed, the Memorialization segment leases warehouse facilities totaling approximately 1.6 million square feet in 40 states under operating leases. |
All of the owned properties are unencumbered. The Company believes its facilities are generally well suited for their respective uses and are of adequate size and design to provide the operating efficiencies necessary for the Company to be competitive. The Company's facilities provide adequate space for meeting its near-term production requirements and have availability for additional capacity. The Company intends to continue to expand and modernize its facilities as necessary to meet the demand for its products.
(1) | These properties are leased by the Company under operating lease arrangements. Rent expense incurred by the Company for all leased facilities was approximately $17.7 million in fiscal 2013. |
(2) | In addition to the properties listed, the Funeral Home Products segment leases warehouse facilities totaling approximately 1.0 million square feet in 29 states under operating leases. |
All of the owned properties are unencumbered. The Company believes its facilities are generally well suited for their respective uses and are of adequate size and design to provide the operating efficiencies necessary for the Company to be competitive. The Company's facilities provide adequate space for meeting its near-term production requirements and have availability for additional capacity. The Company intends to continue to expand and modernize its facilities as necessary to meet the demand for its products.
| ITEM 3. LEGAL PROCEEDINGS. |
Matthews is subject to various legal proceedings and claims arising in the ordinary course of business. Management does not expect that the results of any of these legal proceedings will have a material adverse effect on Matthews’Matthews' financial condition, results of operations or cash flows.
ITEM 4. MINE SAFETY DISCLOSURES.
Not applicable.
| OFFICERS AND EXECUTIVE MANAGEMENT OF THE REGISTRANT |
The following information is furnished with respect to officers and executive management as of October 31, 2013:2015:
| Name | | Age | | Positions with Registrant | | | | | | | | Joseph C. Bartolacci | | 5355 | | President and Chief Executive Officer | | | | | | | | David F. Beck | | 6163 | | Vice President and Controller | Jennifer A. CicconeMarcy L. Campbell | | 4652 | | Vice President, Human Resources | | | | | | | | Brian J. Dunn | | 5658 | | GroupExecutive Vice President, Brand SolutionsStrategy and Corporate Development | | | | | | | | Steven D. Gackenbach | | 5052 | | Group President, Memorialization | | | | | | | | Robert M. Marsh | | 47 | | Treasurer | | | | | | | Steven F. Nicola | | 5355 | | Chief Financial Officer Secretary and TreasurerSecretary | | | | | | | | Paul F. Rahill | | 5658 | | President, Cremation Division | | | | | | | | David A. Schawk | | 59 | | President, SGK Brand Solutions | | | | | | | Brian D. Walters | | 4446 | | Vice President and General Counsel |
Joseph C. Bartolacci was appointed President and Chief Executive Officer effective October 1, 2006.
David F. Beck was appointed Vice President and Controller effective February 18, 2010. Prior thereto he had been Controller since September 15, 2003.
Jennifer A. CicconeMarcy L. Campbell was appointed Vice President, Human Resources effective February 19, 2009. Prior thereto,November 2014. Ms. Ciccone had beenCampbell served as Director, CorporateRegional Human Resources since 2006.from January 2013, and as Manager, Regional Human Resources from November 2005 to December 2012.
Brian J. Dunn was appointed Executive Vice President, Strategy and Corporate Development effective July 24, 2014. Prior thereto, he served as Group President, Brand Solutions effectivesince February 18, 2010. Prior thereto, he was appointed Group President, Graphics and Marking Products effective September 1, 2007 and had been President, Marking Products Division prior thereto.
Steven D. Gackenbach was appointed Group President, Memorialization effective October 31, 2011. Prior thereto he had been Chief Commercial Officer, Memorialization since January 3, 2011 when he joined the Company. Prior to joining the Company, Mr. Gackenbach served as the Senior Director of Strategy for Kraft Foods’Foods' Cheese and Dairy Division from 2002 to 2010.
Robert M. Marsh joined the Company as Treasurer in December 2014. Prior to joining the Company, Mr. Marsh was a partner of PNC Mezzanine Capital, the principal mezzanine investment business of The PNC Financial Services Group, LLC ("PNC"). Mr. Marsh joined PNC in 1997.
Steven F. Nicola was appointed Chief Financial Officer Secretary and TreasurerSecretary effective December 1, 2003.
Paul F. Rahill was appointed President, Cremation Division in October 2002.
David A. Schawk joined the Company in July 2014 as President, SGK Brand Solutions upon Matthews' acquisition of Schawk. Mr. Schawk served as Schawk's Chief Executive Officer from July 2012, and Chief Executive Officer and President for more than five years prior thereto. Mr. Schawk was a member of the Schawk Board of Directors since 1992.
Brian D. Walters was appointed Vice President and General Counsel effective February 19, 2009. Mr. Walters joined the Company as Legal Counsel in 2005.
PART II
| ITEM 5. MARKET FOR REGISTRANT'S COMMON EQUITY AND RELATED STOCKHOLDER MATTERS. |
Market Information:
The authorized common stock of the Company consists of 70,000,000 shares of Class A Common Stock, $1 par value. At September 30, 2015, 32,875,067 shares were outstanding. The Company's Class A Common Stock is traded on the NASDAQ Global Select Market System under the symbol “MATW”"MATW". The following table sets forth the high, low and closing prices as reported by NASDAQ for the periods indicated:
| | | High | | | Low | | | Close | | | Fiscal 2013: | | | | | | | | | | | Quarter ended: September 30, 2013 | | $ | 40.50 | | | $ | 36.27 | | | $ | 38.08 | | | June 30, 2013 | | | 39.37 | | | | 32.81 | | | | 37.70 | | | March 31, 2013 | | | 35.31 | | | | 31.43 | | | | 34.92 | | | December 31, 2012 | | | 32.95 | | | | 27.42 | | | | 32.10 | | | | | | | | | | | | | | | | | Fiscal 2012: | | | | | | | | | | | | | | Quarter ended: September 30, 2012 | | $ | 32.90 | | | $ | 27.88 | | | $ | 29.82 | | | June 30, 2012 | | | 32.63 | | | | 28.95 | | | | 32.49 | | | March 31, 2012 | | | 34.36 | | | | 30.00 | | | | 31.64 | | | December 31, 2011 | | | 37.65 | | | | 28.59 | | | | 31.43 | |
| | High | | Low | | Close | | Fiscal 2015: | | | | | | Quarter ended: September 30, 2015 | $55.70 | | $47.46 | | $48.97 | | June 30, 2015 | 55.40 | | 47.00 | | 53.14 | | March 31, 2015 | 52.63 | | 44.48 | | 51.51 | | December 31, 2014 | 49.69 | | 41.10 | | 48.67 | | | | | | | | | Fiscal 2014: | | | | | | | Quarter ended: September 30, 2014 | $47.60 | | $40.99 | | $43.89 | | June 30, 2014 | 43.32 | | 39.54 | | 41.57 | | March 31, 2014 | 44.33 | | 37.08 | | 40.81 | | December 31, 2013 | 42.80 | | 37.58 | | 42.61 |
The Company has a stock repurchase program. Under the current authorization, the Company's Board of Directors has authorized the repurchase of a total of 2,500,000 shares of Matthews’Matthews' common stock under the program, of which 1,194,670661,022 shares remain available for repurchase as of September 30, 2013.2015. In November 2015, the Company's Board of Directors approved the continuation of its stock repurchase program and increased the authorization for stock repurchases by an additional 2,500,000 shares. The buy-back program is designed to increase shareholder value, enlarge the Company's holdings of its common stock, and add to earnings per share. Repurchased shares may be retained in treasury, utilized for acquisitions, or reissued to employees or other purchasers, subject to the restrictions ofset forth in the Company’sCompany's Restated Articles of Incorporation.
All purchases of the Company’sCompany's common stock during fiscal 20132015 were part of this repurchase program.
| ITEM 5. | MARKET FOR REGISTRANT'S COMMON EQUITY AND RELATED STOCKHOLDER MATTERS, (continued) |
The following table shows the monthly fiscal 20132015 stock repurchase activity:
| Period | | Total number of shares purchased | | | Average price paid per share | | | Total number of shares purchased as part of a publicly announced plan | | | Maximum number of shares that may yet be purchased under the plan | | | | | | | | | | | | | | | | | October 2012 | | | 123,000 | | | $ | 29.12 | | | | 123,000 | | | | 1,691,651 | | | November 2012 | | | 31,732 | | | | 28.91 | | | | 31,732 | | | | 1,659,919 | | | December 2012 | | | 1,000 | | | | 30.72 | | | | 1,000 | | | | 1,658,919 | | | January 2013 | | | - | | | | - | | | | - | | | | 1,658,919 | | | February 2013 | | | 41,200 | | | | 32.67 | | | | 41,200 | | | | 1,617,719 | | | March 2013 | | | 40,200 | | | | 34.41 | | | | 40,200 | | | | 1,577,519 | | | April 2013 | | | 16,691 | | | | 33.85 | | | | 16,691 | | | | 1,560,828 | | | May 2013 | | | 31,745 | | | | 38.32 | | | | 31,745 | | | | 1,529,083 | | | June 2013 | | | 119,548 | | | | 37.54 | | | | 119,548 | | | | 1,409,535 | | | July 2013 | | | 30,000 | | | | 38.65 | | | | 30,000 | | | | 1,379,535 | | | August 2013 | | | 25,000 | | | | 37.43 | | | | 25,000 | | | | 1,354,535 | | | September 2013 | | | 159,865 | | | | 37.52 | | | | 159,865 | | | | 1,194,670 | | | Total | | | 619,981 | | | $ | 34.88 | | | | 619,981 | | | | | |
| Period | | Total number of shares purchased | | | Weighted-average price paid per share | | | Total number of shares purchased as part of a publicly announced plan | | | Maximum number of shares that may yet be purchased under the plan | | | | | | | | | | | | | | | | | October 2014 | | | 10,000 | | | $ | 43.87 | | | | 10,000 | | | | 955,881 | | | November 2014 | | | 65,942 | | | | 46.54 | | | | 65,942 | | | | 889,939 | | | December 2014 | | | 97,807 | | | | 46.10 | | | | 97,807 | | | | 792,132 | | | January 2015 | | | 1,559 | | | | 46.86 | | | | 1,559 | | | | 790,573 | | | February 2015 | | | 10,000 | | | | 48.49 | | | | 10,000 | | | | 780,573 | | | March 2015 | | | 27,318 | | | | 48.17 | | | | 27,318 | | | | 753,255 | | | April 2015 | | | - | | | | - | | | | - | | | | 753,255 | | | May 2015 | | | 157 | | | | 47.97 | | | | 157 | | | | 753,098 | | | June 2015 | | | - | | | | - | | | | - | | | | 753,098 | | | July 2015 | | | - | | | | - | | | | - | | | | 753,098 | | | August 2015 | | | 55,982 | | | | 51.68 | | | | 55,982 | | | | 697,116 | | | September 2015 | | | 36,094 | | | | 49.22 | | | | 36,094 | | | | 661,022 | | | Total | | | 304,859 | | | $ | 47.78 | | | | 304,859 | | | | | |
Holders:
Based on records available to the Company, the number of registered holders of the Company's common stock was 4691,172 at
October 31, 2013.2015.
Dividends:
A quarterly dividend of $.11$.15 per share was paid for the fourth quarter of fiscal 20132015 to shareholders of record on November 25,23, 2015. The Company paid quarterly dividends of $.13 per share for each of the first three quarters of fiscal 2015 and the fourth quarter of fiscal 2014. The Company paid quarterly dividends of $.11 per share for each of the first three quarters of fiscal 2014 and the fourth quarter of fiscal 2013. The Company paid quarterly dividends of $.10 per share for each of the first three quarters of fiscal 2013 and the fourth quarter of fiscal 2012. The Company paid quarterly dividends of $.09 per share for the first three quarters of fiscal 2012 and the fourth quarter of fiscal 2011. The Company paid quarterly dividends of $.08 per share for the first three quarters of fiscal 2011 and the fourth quarter of fiscal 2010.
Cash dividends have been paid on common shares in every year for at least the past forty-fiveforty-six years. It is the present intention of the Company to continue to pay quarterly cash dividends on its common stock. However, there is no assurance that dividends will be declared and paid as the declaration and payment of dividends is at the discretion of the Board of Directors of the Company and is dependent upon many factors, including but not limited to the Company's financial condition, results of operations, cash requirements, future prospects and other factors deemed relevant by the Board.
Securities Authorized for Issuance Under Equity Compensation Plans:
See Equity Compensation Plans in Item 12 “Security"Security Ownership of Certain Beneficial Owners and Management”Management" on page 7076 of this report.
ITEM 5.MARKET FOR REGISTRANT'S COMMON EQUITY AND RELATED STOCKHOLDER MATTERS, (continued)
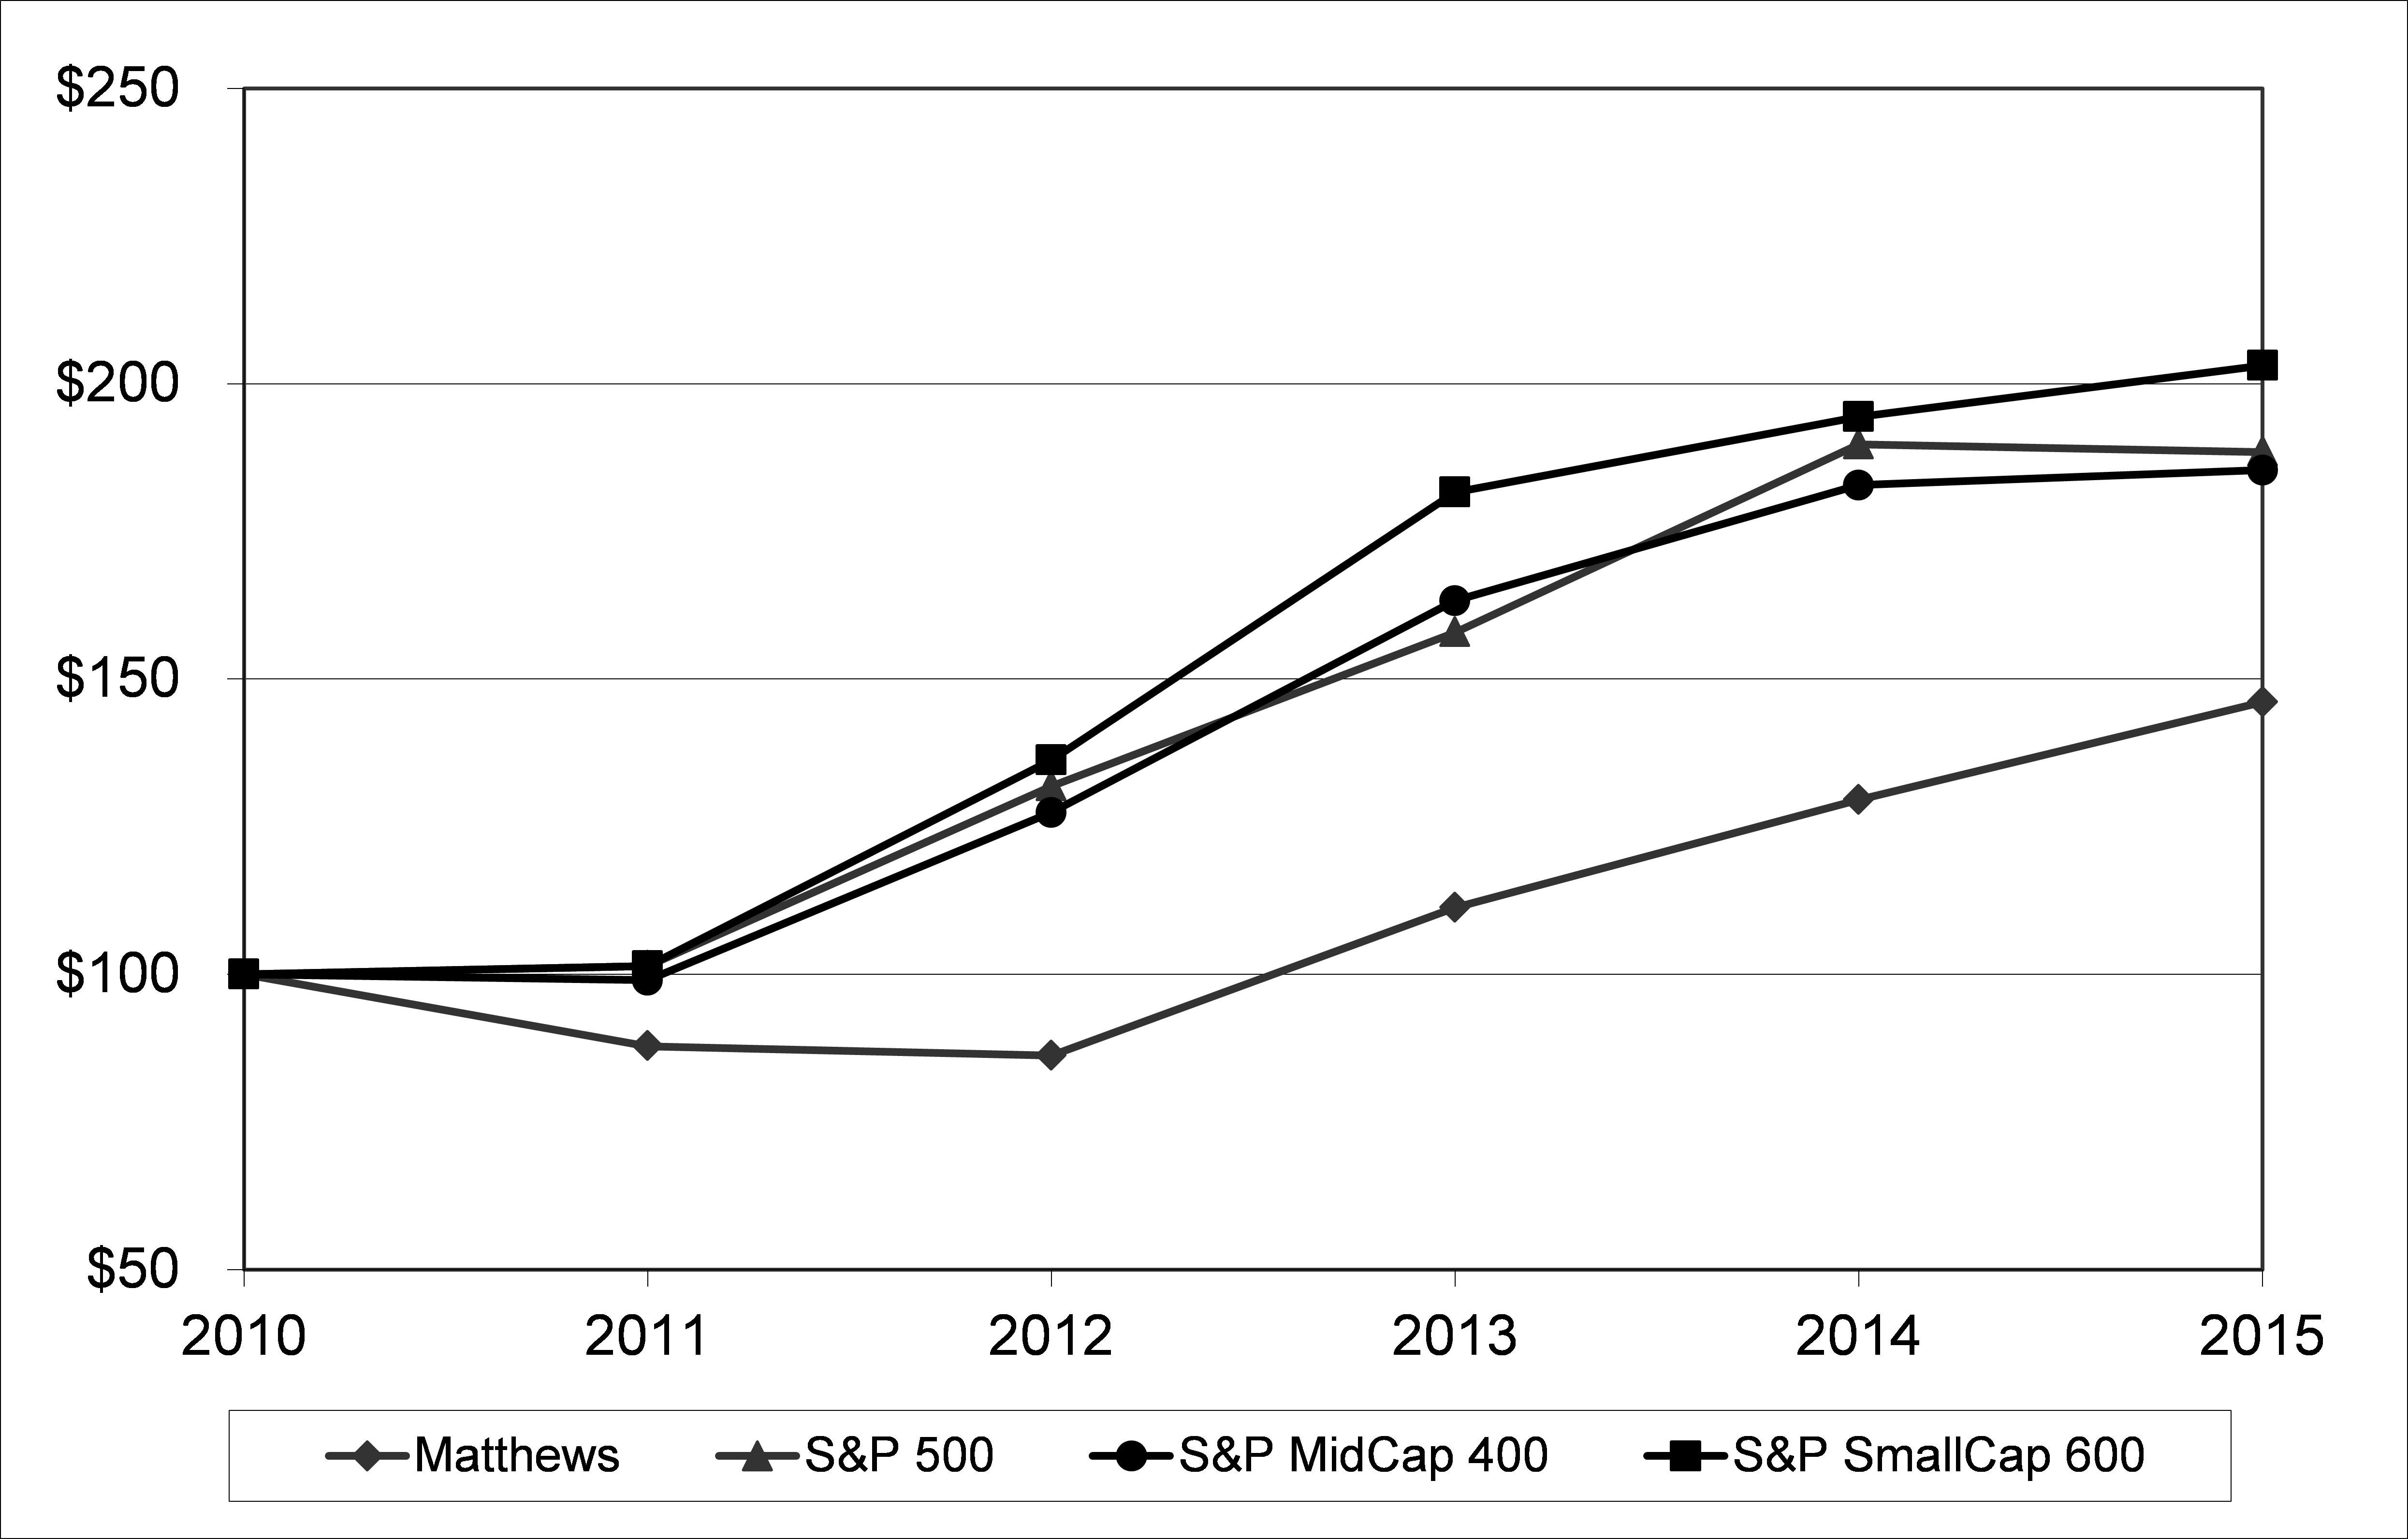
PERFORMANCE GRAPH
COMPARISON OF FIVE-YEAR CUMULATIVE RETURN * AMONG MATTHEWS INTERNATIONAL CORPORATION, S&P 500 INDEX, S&P MIDCAP 400 INDEX AND S&P SMALLCAP 600 INDEX **
* Total return assumes dividend reinvestment ** Fiscal year ended September 30
Note: Performance graph assumes $100 invested on October 1, 20082010 in Matthews International Corporation Common Stock, Standard & Poor's (S&P) 500 Index, S&P MidCap 400 Index and S&P SmallCap 600 Index. The results are not necessarily indicative of future performance.
| ITEM 6. SELECTED FINANCIAL DATA. |
| | | Years Ended September 30, | | Years Ended September 30, | | | | 2013(1) | | | 2012(2) | | | 2011(3) | | | 2010(4) | | 2009(5) | | 2015(1) | | 2014(2) | | 2013(3) | | 2012(4) | | 2011(5) | | | | (Amounts in thousands, except per share data) | | (Amounts in thousands, except per share data) | | | | (Not Covered by Report of Independent Registered Public Accounting Firm) | | (Unaudited) | | | | | | | | | | | | | | | | | | | | | | | | | | | | Net sales | | $ | 985,357 | | | $ | 900,317 | | | $ | 898,821 | | | $ | 821,829 | | | $ | 780,908 | | $1,426,068 | | $1,106,597 | | $985,357 | | $900,317 | | $898,821 | | | | | | | | | | | | | | | | | | | | | | | | | | | | | | | | | Operating profit | | | 95,792 | | | | 93,577 | | | | 118,516 | | | | 116,581 | | | | 101,011 | | 105,023 | | 81,522 | | 94,615 | | 92,585 | | 117,589 | | | | | | | | | | | | | | | | | | | | | | | | | | | | | | | | | Interest expense | | | 12,925 | | | | 11,476 | | | | 8,241 | | | | 7,419 | | | | 12,053 | | 20,610 | | 12,628 | | 12,925 | | 11,476 | | 8,241 | | | | | | | | | | | | | | | | | | | | | | | | | | | | | | | | | Net income attributable to Matthews shareholders | | | 54,888 | | | | 55,843 | | | | 72,372 | | | | 69,057 | | | | 57,732 | | 63,449 | | 42,625 | | 54,121 | | 55,276 | | 72,106 | | | | | | | | | | | | | | | | | | | | | | | | | | | | | | | | | | | | | | | | | | | | | | | | | | | | | | | | | | | | | | | | Earnings per common share: | | | | | | | | | | | | | | | | | | | | | | | | | | | | | | | Basic | | | $1.99 | | | | $1.98 | | | | $2.47 | | | | $2.32 | | | | $1.91 | | $1.93 | | $1.51 | | $1.96 | | $1.96 | | $2.46 | | Diluted | | | 1.98 | | | | 1.98 | | | | 2.46 | | | | 2.31 | | | | 1.90 | | 1.91 | | 1.49 | | 1.95 | | 1.95 | | 2.45 | | | | | | | | | | | | | | | | | | | | | | | | | | | | | | | | | Weighted-average common | | | | | | | | | | | | | | | | | | | | | | | | | | | | | | | shares outstanding: | | | | | | | | | | | | | | | | | | | | | | | | | | | | | | | Basic | | | 27,255 | | | | 27,753 | | | | 28,775 | | | | 29,656 | | | | 30,245 | | 32,939 | | 28,209 | | 27,255 | | 27,753 | | 28,775 | | Diluted | | | 27,423 | | | | 27,839 | | | | 28,812 | | | | 29,706 | | | | 30,318 | | 33,196 | | 28,483 | | 27,423 | | 27,839 | | 28,812 | | | | | | | | | | | | | | | | | | | | | | | | | | | | | | | | | Cash dividends per share | | | $.410 | | | | $.370 | | | | $.330 | | | | $.290 | | | | $.265 | | $.54 | | $.46 | | $.41 | | $.37 | | $.33 | | | | | | | | | | | | | | | | | | | | | | | | | | | | | | | | | Total assets | | $ | 1,214,927 | | | $ | 1,128,042 | | | $ | 1,097,455 | | | $ | 993,825 | | | $ | 949,653 | | $2,163,018 | | $2,024,048 | | $1,209,262 | | $1,122,171 | | $1,092,151 | | Long-term debt, non-current | | | 351,068 | | | | 298,148 | | | | 299,170 | | | | 225,256 | | | | 237,530 | | 891,217 | | 714,027 | | 351,068 | | 298,148 | | 299,170 |
| (1) | Fiscal 2015 included pre-tax charges of $36,883 and income of $8,726, which impacted operating profit and other deductions, respectively, and also included the unfavorable effect of related adjustments of $1,334 to income tax expense. These amounts primarily consisted of acquisition-related costs, trade name write-offs, strategic cost-reduction initiatives, and losses related to a theft of funds, partially offset by a gain on the settlement of a multi-employer pension plan obligation, and the impact of the favorable settlement of litigation, net of related expenses. |
| (2) | Fiscal 2014 included net charges of approximately $41,289 (pre-tax), primarily related to acquisition-related costs, strategic cost-reduction initiatives, and litigation expenses related to a legal dispute in the Memorialization segment. Charges of $38,598 and $2,691 impacted operating profit and other deductions, respectively. In addition, fiscal 2014 included the unfavorable effect of adjustments of $1,347 to income tax expense related to non-deductible expenses related to acquisition activities. |
| (3) | Fiscal 2013 included net unusual charges of approximately $14,095$15,352 (pre-tax). Unusual charges, which primarily related to strategic cost reductioncost-reduction initiatives, incremental costs related to an ERP implementation in the Cemetery ProductsMemorialization segment, acquisition relatedacquisition-related costs and an impairment charge related to the carrying value of a trade name. The unusual charges were partially offset by a gain on the final settlement of the purchase price of the remaining ownership interest in one of the Company’sCompany's subsidiaries and the benefit of adjustments to contingent consideration. |
(2)(4) | Fiscal 2012 included net unusual charges of approximately $7,850$8,779 (pre-tax), which primarily consisted of charges related to cost reductioncost-reduction initiatives and incremental costs related to an ERP implementation in the Cemetery ProductsMemorialization segment. In addition, fiscal 2012 included the favorable effect of an adjustment of $528 to income tax expense primarily related to changes in estimated tax accruals for open tax periods. |
(3)(5) | Fiscal 2011 included the favorable effect of an adjustment of $606 to income tax expense primarily related to changes in estimated tax accruals for open tax periods. |
(4) | Fiscal 2010 included the favorable effect of an adjustment of $838 to income tax expense primarily related to changes in estimated tax accruals for open tax periods. |
(5) | Fiscal 2009 included pre-tax unusual charges of approximately $16,500, which primarily consisted of severance and other costs related to the consolidation of certain production operations within the Company’s Cemetery Products segment, costs related to operational and systems improvements in several of the Company’s other businesses, and asset adjustments resulting from current market conditions. In addition, fiscal 2009 earnings included the favorable effect of an adjustment of $1,255 to income tax expense primarily related to the Company’s ability to utilize a European tax loss carryover generated in prior years and changes in the estimated tax accruals for open tax periods. |
| ITEM 7. MANAGEMENT'S DISCUSSION AND ANALYSIS OF FINANCIAL CONDITION AND RESULTS OF OPERATIONS. |
The following discussion should be read in conjunction with the consolidated financial statements of Matthews and related notes thereto. In addition, see "Cautionary Statement Regarding Forward-Looking Information" included in Part I of this Annual Report on Form 10-K.
The following table sets forth sales and operating profit for the Company’sCompany's SGK Brand Solutions, Memorialization and Brand Solutions businessesIndustrial segments for each of the last three fiscal years.
| | | | Years Ended September 30, | | | | Years Ended September 30, | | | 2015 | | 2014 | | 2013 | | | | 2013 | | | 2012 | | | 2011 | | | (Dollars in Thousands) | | Sales: | | | | | | | | | | | | | | | | | SGK Brand Solutions | | | $ 798,339 | | $ 497,328 | | $ 373,941 | | Memorialization | | $ | 517,911 | | | $ | 492,867 | | | $ | 507,342 | | | 508,058 | | 508,420 | | 517,911 | | Brand Solutions | | | 467,446 | | | | 407,450 | | | | 391,479 | | | | Industrial | | | 119,671 | | 100,849 | | 93,505 | | Consolidated | | $ | 985,357 | | | $ | 900,317 | | | $ | 898,821 | | | $1,426,068 | | $1,106,597 | | $ 985,357 | | | | | | | | | | | | | | | | | | | | | | Operating Profit: | | | | | | | | | | | | | | | | | | | | SGK Brand Solutions | | | $ 21,864 | | $ 2,536 | | $ 13,999 | | Memorialization | | $ | 72,931 | | | $ | 63,589 | | | $ | 84,992 | | | 70,064 | | 67,937 | | 71,754 | | Brand Solutions | | | 22,861 | | | | 29,988 | | | | 33,524 | | | | Industrial | | | 13,095 | | 11,049 | | 8,862 | | Consolidated | | $ | 95,792 | | | $ | 93,577 | | | $ | 118,516 | | | $ 105,023 | | $ 81,522 | | $ 94,615 | | | | | | | | | | | | | | | | | | | | |
Comparison of Fiscal 20132015 and Fiscal 2012:2014:
Sales for the year ended September 30, 20132015 were $985.4 million,$1.4 billion, compared to $900.3 million$1.1 billion for the year ended September 30, 2012.2014. The increase in fiscal 20132015 sales principally reflected the acquisitions of Schawk, Inc. ("Schawk") in July 2014 and Aurora Products Group, LLC ("Aurora") in August 2015, higher sales in the Funeral Home ProductsIndustrial segment, and Merchandisinghigher sales in the SGK Brand Solutions segments andsegment, exclusive of the benefitSchawk acquisition. These increases were partially offset by lower sales in the Memorialization segment, excluding Aurora. Additionally, consolidated sales for fiscal 2015 were unfavorably impacted by changes in foreign currencies against the U.S. dollar of recent acquisitions.approximately $56.9 million.
In the Memorialization businesses, Cemetery ProductsSGK Brand Solutions segment, sales for fiscal 20132015 were $226.6$798.3 million, compared to $215.9$497.3 million for fiscal 2012. The increase primarily reflected the full year impact of the acquisition of Everlasting Granite Memorial Co., Inc. (“Everlasting Granite”) in May 2012. Sales for the Funeral Home Products segment were $242.8 million for fiscal 2013 compared to $230.9 million for fiscal 2012. The increase principally resulted from higher unit volume and an improvement in product mix. Sales for the Cremation segment were $48.5 million for fiscal 2013 compared to $46.0 million a year ago. The increase principally resulted from higher sales of cremation equipment in the U.S. and the benefit of a small U.K. acquisition completed in fiscal 2012, partially offset by lower international sales. In the Company’s Brand Solutions businesses, sales for the Graphics Imaging segment in fiscal 2013 were $294.6 million, compared to $259.9 million a year ago.2014. The increase resulted principally from the acquisition of Wetzel Holding AG, Wetzel GmbHSchawk ($339.1 million), and certain related affiliates (collectively, “Wetzel”)higher sales, excluding the Schawk acquisition, in November 2012,Europe. These increases were partially offset by lowerthe unfavorable impact of changes in foreign currency values against the U.S. dollar of approximately $44.1 million. Memorialization segment sales for fiscal 2015 were $508.1 million compared to $508.4 million for fiscal 2014. The Memorialization segment sales reflected higher unit volume of caskets, higher sales of bronze and granite memorials, higher cremation equipment sales in the segment’s principal markets due to soft economic conditions, particularlyU.S. market, and the incremental impact of the Aurora acquisition ($14.4 million). These increases were offset by lower mausoleum sales, lower equipment sales in Europe. MarkingEurope and Fulfillment Systemsthe U.K., and the unfavorable impact of changes in foreign currency values against the U.S. dollar of approximately $9.7 million. Lower equipment sales in the U.K. reflected a large waste incinerator project in fiscal 2014 that did not repeat in fiscal 2015. Industrial segment sales for the year ended September 30, 20132015 were $93.5$119.7 million, compared to $74.6$100.8 million for fiscal 2012.2014. The increase resulted principally from higher sales of warehouse control systems and higher unit volume of marking products and related consumables, primarily in North America. These increases were partially offset by the unfavorable impact of changes in foreign currency values against the U.S. market and the acquisitiondollar of Pyramid Controls, Inc. and its affiliate, Pyramid Control Systems (collectively, “Pyramid”) in December 2012. Sales for the Merchandising Solutions segment were $79.4 million for fiscal 2013, compared to $73.0 million a year ago. The improvement was attributable to an increase in sales to several large customers in fiscal 2013.approximately $3.0 million.
| ITEM 7. | MANAGEMENT'S DISCUSSION AND ANALYSIS, (continued) |
Gross profit for the year ended September 30, 20132015 was $356.5$529.4 million, or 36.2%compared to $392.5 million for fiscal 2014. Consolidated gross profit as a percent of sales compared to $336.6 million, or 37.4% of sales,was 37.1% and 35.5% for fiscal 2012.2015 and fiscal 2014, respectively. The increase in fiscal 2013 consolidated gross profit comparedprimarily reflected the impact of higher sales. Fiscal 2015 gross profit also included an expense of $1.8 million for the partial write-off of inventory step-up value related to fiscal 2012 reflected higher sales and the benefitAurora acquisition. Fiscal 2014 gross profit included an expense of recent acquisitions.$9.5 million for the write-off of inventory step-up value related to the Schawk acquisition. The decreaseimprovement in gross profit as a percentagepercent of sales primarily reflected lower margins in the Brand Solutions businesses.
ITEM 7. MANAGEMENT'S DISCUSSION AND ANALYSIS, (continued)higher fiscal 2014 write-off of inventory step-up value, and the favorable margin impact from the Schawk acquisition.
Selling and administrative expenses for the year ended September 30, 20132015 were $260.7$424.4 million, or 26.5%compared to $311.0 million for fiscal 2014. Consolidated selling and administrative expenses as a percent of sales were 29.8% for fiscal 2015, compared to $243.0 million, or 27.0% of sales, for28.1% in fiscal 2012.2014. The increase in selling and administrative expenses was primarily attributable to the impacts of recent acquisitions, unusual charges and higher sales inand the Funeral Home Products segment. The reduction inacquisitions of Schawk and Aurora. In addition, fiscal 2015 selling and administrative costs as a percentexpenses included an increase of sales was due primarily$12.1 million in intangible asset amortization related to the benefitSchawk and Aurora acquisitions, acquisition-related expenses of adjustments$37.1 million primarily related to contingent considerationthe Schawk acquisition integration activities and the Company’s cost containment efforts in fiscal 2013. Unusual charges primarily included costsAurora transaction expenses, trade name write-offs of $4.8 million and expenses related to strategic cost-structurecost-reduction initiatives acquisition-relatedof $2.2 million, partially offset by the impact of the favorable settlement of litigation, net of related expenses, in the Memorialization segment of $9.0 million. Fiscal 2014 selling and asset adjustments.administrative expenses included expenses related to acquisition activities, primarily the Schawk acquisition, of $18.2 million, the Company's strategic cost structure initiatives of $4.5 million and litigation-related expenses in the Memorialization segment of $3.0 million.
Operating profit for fiscal 20132015 was $95.8$105.0 million, compared to $93.6$81.5 million for fiscal 2012.2014. The increase in operating profit for fiscal 2013 reflected higher sales and the impact of recent acquisitions, partially offset by net unusual charges totaling approximately $14.1 million in fiscal 2013. Fiscal 2012 included net unusual charges of approximately $7.8 million.
Cemetery ProductsSGK Brand Solutions segment operating profit for fiscal 20132015 was $32.6$21.9 million, compared to $33.2$2.5 million for fiscal 2012.2014. The decrease insegment's fiscal 20132015 operating profit comparedwas favorably impacted by the Schawk acquisition, and higher sales, exclusive of the acquisition, in Europe. The SGK Brand Solutions segment fiscal 2015 operating profit included charges totaling $39.5 million representing acquisition integration expenses, trade name write-offs, and expenses related to fiscal 2012 resulted mainly from unusual chargesstrategic cost-reduction initiatives. In addition, the segment reported an $11.7 million increase in intangible asset amortization related to the Schawk acquisition. Fiscal 2015 SGK Brand Solutions segment operating profit was also unfavorably impacted by changes in foreign currency values against the U.S. dollar of approximately $5.9$4.4 million. Fiscal 2014 SGK Brand solutions segment operating profit included expenses of $17.8 million related to acquisition activities, $4.1 million related to strategic cost-structurecost-reduction initiatives, compareda $9.5 million write-off of inventory step-up value, and also reflected the benefit of a merchandising display project that did not repeat to similar unusual chargesthe same level in fiscal 2012 of approximately $5.4 million. Operating profit for the Funeral Home products segment for fiscal 2013 was $37.3 million, compared to $26.5 million for fiscal 2012. The increase in Funeral Home Products2015. Memorialization segment operating profit for fiscal 2013 primarily reflected2015 was $70.1 million, compared to $67.9 million for fiscal 2014. The Memorialization segment fiscal 2015 operating profit included the incremental impact of the Aurora acquisition, and the impact of higher sales,the favorable settlement of litigation, net of related expenses, of $9.0 million. The fiscal 2015 Memorialization segment operating profit was unfavorably impacted by charges totaling $6.4 million, primarily consisting of acquisition-related costs, and expenses related to strategic cost-reduction initiatives. In addition, the segment reported a $403,000 increase in intangible asset amortization related to the Aurora acquisition. Memorialization segment fiscal 2014 operating profit included $4.0 million of expenses related to strategic cost-reduction initiatives and $3.0 million of litigation-related expenses, and also reflected the benefit of improved production and distribution efficiencies and the benefit of adjustments to contingent consideration. These increases were partially offset by unusual charges related to strategic cost-structure initiatives. Fiscal 2012 also included the benefit of adjustments to contingent consideration, partially offset by unusual charges for severance. Net unusual items for the Funeral Home Products segment were approximately the same aggregate amounta large incineration project that did not repeat in fiscal 2013 and 2012. Cremation segment operating profit for the year ended September 30, 2013 was $3.1 million, compared to $3.9 million a year ago. Fiscal 2013 operating profit reflected the impact of higher sales in the U.S. market, partially offset by lower sales in the European and U.K. markets. In addition, Cremation segment fiscal 2013 operating profit included unusual charges related to strategic cost-structure initiatives. Graphics Imaging segment operating profit for fiscal 2013 was $9.7 million, compared to $14.8 million for 2012. The decrease in fiscal 2013 reflected lower sales (excluding the Wetzel acquisition) and the unfavorable impact of unusual items of approximately $6.3 million. The unusual charges related to acquisition activities and strategic initiatives, and an impairment charge related to the carrying value of a trade name. Graphics Imaging segment operating profit in fiscal 2012 included net unusual charges of approximately $3.4 million primarily related to acquisition activities and severance costs, partially offset by the benefit of an adjustment to contingent consideration.2015. Operating profit for the Marking and Fulfillment SystemsIndustrial segment for fiscal 20132015 was $8.9$13.1 million, compared to $10.1$11.0 million a year ago.in fiscal 2014. The decrease in Marking and Fulfillment Systems segment operating profit principally reflectedincrease primarily resulted from the impact of unusual charges related to cost-structure strategic initiatives, partially offset by the benefit of the Pyramid acquisition and higher sales in the U.S. The Merchandising Solutions segment operating profit was $4.3 million for fiscal 2013, compared to $5.1 million for fiscal 2012. The decrease principally reflected thefavorable impact of higher sales, offset by an increase in employee-related costs and unusual charges related to strategic cost-structure initiatives.sales.
Investment income for the year ended September 30, 20132015 was $2.3 million,$175,000, compared to $3.9$2.1 million for the year ended September 30, 2012.2014. The decrease principally reflected lower rates of return on investments held in trust for certain of the Company’sCompany's benefit plans. Interest expense for fiscal 20132015 was $12.9$20.6 million, compared to $11.5$12.6 million last year.in fiscal 2014. The increase in interest expense primarily reflected higher average debt levels.levels resulting from the acquisitions of Schawk in July 2014 and Aurora in August 2015.
| ITEM 7. | MANAGEMENT'S DISCUSSION AND ANALYSIS, (continued) |
Other income (deductions), net, for the year ended September 30, 20132015 represented a decreasean increase in pre-tax income of $3.7$5.1 million, compared to a decrease in pre-tax income of $2.1$4.9 million in 2012.fiscal 2014. Other income and deductions generally include banking-related fees and the impact of currency gains or losses on certain intercompany debt.
ITEM 7. MANAGEMENT'S DISCUSSION AND ANALYSIS, (continued)debt and foreign denominated receivables and payables. Fiscal 2015 other income and deductions included an $11.5 million gain on the settlement of a multi-employer pension plan installment payment obligation. Fiscal 2014 other income and deductions included a write-off of prior deferred bank fees recognized upon the amendment of the Company's domestic Revolving Credit Facility in conjunction with the Schawk acquisition. Other income and deductions also included losses related to a theft of funds by an employee that had occurred over a multi-year period, totaling $2.3 million and $1.7 million in fiscal 2015 and fiscal 2014, respectively.
The Company's effective tax rate for fiscal 20132015 was 32.7%29.4%, compared to 34.2%34.5% for fiscal 2012. Fiscal 2012 included the favorable impact of adjustments totaling $528,000 in income tax expense primarily related to changes in the estimated tax accruals for open tax periods. Excluding this adjustment from fiscal 2012, the Company’s effective tax rate was 34.8%.2014. The decrease in the fiscal 20132015 effective tax rate, compared to fiscal 20122014, primarily reflected the benefit of the utilization of certain tax attributes as a result of legal structure reorganization in foreign jurisdictions and a relative increase in the amount of earnings generated from non-U.S. locations. The effective tax rate in fiscal 2014 included the impact of non-deductible acquisition costs relating to the Company’s European tax structure initiatives, including the fiscal 2013 benefit of a European tax loss carryback.Schawk acquisition. The difference between the Company's effective tax rate and the Federal statutory rate of 35.0% primarily reflected the impact of state taxes, offset by lower foreign income taxes.
Net earnings attributable to noncontrolling interest representedinterests was a loss of $116,000 for$161,000 in fiscal 2013,2015, compared to a lossincome of $639,000$646,000 in fiscal 2012.2014. The decrease related principallychange in net earnings attributable to higher operating income recorded by the Company’s Turkish operationnoncontrolling interests primarily reflected losses in fiscal 2013.less than wholly-owned Industrial and Memorialization businesses.
Comparison of Fiscal 20122014 and Fiscal 2011:2013:
Sales for the year ended September 30, 20122014 were $900.3 million,$1.1 billion, compared to $898.8$985.4 million for the year ended September 30, 2011. Fiscal 2012 included2013. The increase in fiscal 2014 sales principally reflected the impactacquisition of recent acquisitions, andSchawk in July 2014, higher sales in the Cremation, MarkingCompany's SGK Brand Solutions and Fulfillment SystemsIndustrial segments, the incremental impact of acquisitions completed in fiscal 2013 and Merchandising Solutions segments. These increases were offset by lower salesthe impact of significant projects in the Cemetery Products, Funeral Home ProductsSGK Brand Solutions and Graphics Imaging segments, and by the unfavorable impact of changes in the values of foreign currencies of approximately $18.4 million compared to fiscal 2011. Sales in the Cemetery Products and Funeral Home Products segments were negatively impacted by a decline in the estimated number of casketed and in-ground burial (non-cremation) deaths. In the Memorialization businesses, Cemetery Products segmentsegments. Consolidated sales for fiscal 2012 were $215.9 million compared to $224.8 million for fiscal 2011. The decrease primarily2014 also reflected lower salesthe benefit of memorial products in North America, a decrease in mausoleum sales and the unfavorable impact offavorable changes in foreign currencies against the U.S. dollar. These declinesdollar of approximately $6.2 million.
Sales for the SGK Brand Solutions segment in fiscal 2014 were partially offset by$497.3 million, compared to $373.9 million for fiscal 2013. The increase resulted principally from the acquisition of Everlasting GraniteSchawk in May 2012. Sales for the Funeral Home Products segment were $230.9 million for fiscal 2012 compared to $243.3 million for fiscal 2011, which principally resulted from a reduction in sales volume. LowerJuly 2014 ($75.1 million), higher sales volume of bronze memorials and caskets reflectedin the segment's principal markets, the incremental impact of the acquisition of Wetzel Holding AG, Wetzel GmbH and certain related affiliates (collectively, "Wetzel") in November 2012, a decline insignificant merchandising display project during the estimated numberthird and fourth fiscal quarters of casketed2014 and in-ground burial (non-cremation) deaths compared to the prior year. Sales for the Cremation segment were $46.0a $5.9 million for fiscal 2012 compared to $39.3 million for fiscal 2011. The increase principally resulted from higher sales of cremation equipment, primarily in the U.S., partially offset by the unfavorablefavorable impact of changes in foreign currency values. In the Company’s Brand Solutions businesses, sales for the Graphics Imaging segment in fiscal 2012 were $259.9 million, compared to $269.0 million for fiscal 2011. The decrease resulted principally from lower sales in the European market, and the unfavorable impact of changes in foreign currency values against the U.S. dollar. These declinesMemorialization segment sales for fiscal 2014 were $508.4 million compared to $517.9 million for fiscal 2013. The decrease primarily reflected lower unit volume of memorials and caskets and traditional cremator equipment, partially offset by a large waste incineration project in Saudi Arabia and higher mausoleum sales. Based on published CDC data, the impactCompany estimated that the number of casketed, in-ground burial deaths in the acquisition of Kroma Pre-Press Preparation Systems Industry & Trade, Inc. (“Kroma”)United States declined in fiscal 2014 compared to fiscal 2013, which was purchasedthe primary factor in July 2011. Markingthe decrease in unit volume of both memorials and Fulfillment Systemscaskets. Industrial segment sales for the year ended September 30, 20122014 were $74.6$100.8 million, compared to $61.9$93.5 million for fiscal 2011.2013. The increase wasresulted principally due tofrom higher equipment sales in the United States and the full yearincremental impact of two small acquisitions completedthe acquisition of Pyramid Control Systems ("Pyramid") in fiscal 2011, partially offset by the unfavorable impact of changes in foreign currency values. Sales for the Merchandising Solutions segment were $73.0 million for fiscal 2012, compared to $60.6 million for fiscal 2011. The improvement was attributable to an increase in sales to several large customers in fiscalDecember 2012.
Gross profit for the year ended September 30, 20122014 was $336.6$392.5 million, or 37.4%35.5% of sales, compared to $351.7$356.5 million, or 39.1%36.2% of sales, for fiscal 2011.2013. The decreasesincrease in fiscal 20122014 consolidated gross profit compared to fiscal 2013 reflected higher sales and the benefit of recent acquisitions, partially offset by higher material costs in the Memorialization segment. In addition, fiscal 2014 gross profit included an expense of $9.5 million for the write-off of inventory step-up value related to the Schawk acquisition. The decrease in gross profit as a percentage of sales compared to fiscal 2011primarily reflected lower sales, higher commodity costs, and unusual charges in severalthe impact of the Company’s segments. The unusual charges related primarily to severancewrite-off of the inventory step-up and higher material costs in several of the Company’s businesses as a result of cost structure initiatives and incremental costs related to the Company’s ERP implementation in the Cemetery ProductsMemorialization segment.
ITEM 7. | ITEM 7. | MANAGEMENT'S DISCUSSION AND ANALYSIS, (continued) |
Selling and administrative expenses for the year ended September 30, 20122014 were $243.0$311.0 million, or 27.0%28.1% of sales, compared to $233.1$261.9 million, or 25.9%26.6% of sales, for fiscal 2011. The increase in2013. Fiscal 2014 selling and administrative expenses was attributableincluded expenses related to higher salesacquisition activities (primarily the Schawk acquisition) of $18.2 million, the Company's strategic cost structure initiatives of $4.5 million and litigation expenses of $3.0 million related to a legal dispute in the Cremation, Marking and Fulfillment Systems and Merchandising Solutions segments, and the impact of acquisitions in the Cemetery Products and Marking and Fulfillment Systems segments. In addition, fiscal 2012Memorialization segment. Fiscal 2013 selling and administrative expenses include net unusual charges in several segments. Unusual charges primarily included severance costs, incremental costsexpenses of $13.6 million related to the Company’s ERP implementationstrategic cost-reduction initiatives, $3.4 million related to acquisition activities, $1.8 million related to litigation-related expenses in the Cemetery ProductsMemorialization segment, acquisition-related expenses and $2.2 million related to asset adjustments. These charges were partially offset by unusual gains consisting of adjustments to contingent consideration liabilities, a favorable settlement on a claim related to the Company’s granite business and a gain on the sale of a business investment in China. Operating profit for fiscal 2012 was $93.6 million, compared to $118.5 million for fiscal 2011. The decrease in operating profit for fiscal 2012 reflected the impact of lower consolidated sales, higher commodity costs, a $2.1 million unfavorable impact of changes in foreign currency values against the U.S. dollar and net unusual charges totaling approximately $7.8 million.
Cemetery Products segment operating profit for fiscal 2012 was $33.2 million, compared to $52.5 million for fiscal 2011. The decrease in fiscal 2012 operating profit compared to fiscal 2011 reflected lower sales, higher bronze ingot costs, the unfavorable impact of changes in foreign currency values and net unusual charges of approximately $5.4 million related to severance and ERP implementation costs. Operating profit for the Funeral Home products segment for fiscal 2012 was $26.5 million, compared to $29.0 million for fiscal 2011. The decrease in Funeral Home Products segment operating profit for fiscal 2012 primarily reflected the impact of lower sales, higher commodity (primarily fuel) costs and unusual charges of approximately $1.7 million related to severance costs. These declines2013 expenses were partially offset by the benefit of sellingadjustments to contingent consideration of $6.2 million and distribution cost structurea gain of $3.0 million on the settlement of the purchase price of the remaining ownership interest in one of the Company's subsidiaries.
Operating profit for fiscal 2014 was $81.5 million, compared to $94.6 million for fiscal 2013. The SGK Brand Solutions segment reported operating profit of $2.5 million for fiscal 2014, compared to $14.0 million for fiscal 2013. The decrease in fiscal 2014 primarily reflected the impact of acquisition-related expenses of $17.8 million, the $9.5 million write-off of inventory step-up value and expenses related to strategic cost-reduction initiatives and an adjustment to the liability for contingent consideration. Cremationof $4.1 million. Fiscal 2013 SGK Brand solutions segment operating profit forincluded expenses of $3.2 million related to acquisition activities, $5.3 million related to strategic cost-reduction initiatives and a $1.6 million impairment charge related to the year ended September 30, 2012 was $3.9 million, compared to $3.5 million forcarrying value of a trade name. These fiscal 2011. Fiscal 2012 operating profit reflected higher sales in the U.S. market,2013 expenses were partially offset by lower marginsa gain of $3.0 million on the settlement of the purchase price of the remaining ownership interest in one the Company's subsidiaries. Excluding these net charges from both years, SGK Brand Solutions operating profit increased $12.8 million as a result of higher sales inand the European market. Graphics Imagingacquisition of Schawk. Memorialization segment operating profit for fiscal 20122014 was $14.8$67.9 million, compared to $22.4$71.8 million for fiscal 2011. The decrease in2013. Memorialization segment fiscal 2012 reflected lower sales,2014 operating profit included $4.0 million of expenses related to strategic cost-reduction initiatives and unusual chargeslitigation expenses of approximately $5.1$3.0 million related to severance costs anda legal dispute with one of its competitors. Fiscal 2013 Memorialization segment operating profit included the unfavorable impact of changes in foreign currency values. The unusual chargesexpenses of $10.1 million related to strategic cost-reduction initiatives, litigation expenses of $1.8 million, and a $6.3 million benefit of adjustments to contingent consideration. Excluding the impact of these expenses from both years, fiscal 2014 operating profit decreased by $2.5 million, compared to fiscal 2013, primarily to severance and acquisition-related costs. The declines werereflecting lower sales, partially offset by an adjustment to the liability for contingent consideration and a gain on the sale of a business investment in China.productivity benefits from strategic cost-reduction initiatives. Operating profit for the Marking and Fulfillment SystemsIndustrial segment for fiscal 20122014 was $10.1$11.0 million, compared to $7.8$8.9 million for fiscal 2011.2013. The increase in Markingsegment's fiscal 2014 and Fulfillment Systems2013 operating profit included expenses related to strategic cost-reduction initiatives of $220,000 and $1.4 million, respectively. Excluding these expenses from both years, Industrial segment operating profit principally reflected the impact of acquisitions and higher sales. The Merchandising Solutions segment operating profit was $5.1 million for fiscal 2012, compared to $3.32014 increased $1.0 million forover fiscal 2011. The increase principally reflected the impact2013, primarily as a result of higher sales.
Investment income for the year ended September 30, 20122014 was $3.9$2.1 million, compared to $1.4$2.3 million for the year ended September 30, 2011. The increase principally reflected increases in the market value of investments held in trust for certain of the Company’s benefit plans.2013. Interest expense for fiscal 20122014 was $11.5$12.6 million, compared to $8.2$12.9 million for fiscal 2011.2013. The increasedecrease in interest expense reflected higher averagelower interest rates, partially offset by increased debt levels.levels in the fourth fiscal quarter of 2014 to finance the Schawk acquisition.
Other income (deductions), net, for the year ended September 30, 20122014 represented a decrease in pre-tax income of $2.1$4.9 million, compared to an increasea decrease in pre-tax income of $298,000$3.8 million in fiscal 2011.2013. Other income and deductions generally include banking-related fees and the impact of currency gains or losses on certain intercompany debt. The increase in other deductions, net, principally reflected the write-off of prior deferred bank fees upon the amendment of the Company's domestic Revolving Credit Facility in conjunction with the Schawk acquisition. Other income and deductions also included expenses related to a theft of funds by an employee totaling $1.7 million and $1.3 million for the years ended September 30, 2014 and 2013, respectively.
The Company's effective tax rate for fiscal 20122014 was 34.2%34.5%, compared to 34.4%32.6% for fiscal 2011. Fiscal 2012 and 2011 included the favorable impact of adjustments totaling $528,000 and $606,000, respectively, in income tax expense primarily related to changes in the estimated tax accruals for open tax periods. Excluding these adjustments from both periods, the Company’s effective tax rate was 34.8% for fiscal year 2012 and 35.0% for fiscal 2011.2013. The decreaseincrease in the fiscal 20122014 effective tax rate, compared to fiscal 20112013, primarily reflected the impact of the Company’s European tax structure initiatives.non-deductible acquisition expenses in fiscal 2014. The difference between the Company's effective tax rate and the Federal statutory rate of 35.0% primarily reflected the impact of state taxes, offset by lower foreign income taxes.
ITEM 7. MANAGEMENT'S DISCUSSION AND ANALYSIS, (continued)
Net earnings attributable to noncontrolling interestinterests was a lossdeduction of $639,000$646,000 for fiscal 2012,2014, compared to net income of $1.1 million$116,000 in fiscal 2011.2013. The decreasechange related principally to the Company’s acquisition of the remaining 22% interest in Saueressig GmbH & Co. KG (“Saueressig”) in April 2011 and a net losshigher operating income recorded by the Company’s Turkish operationCompany's less than wholly-owned operations in fiscal 2012.the U.K.
ITEM 7.MANAGEMENT'S DISCUSSION AND ANALYSIS, (continued)
LIQUIDITY AND CAPITAL RESOURCES:
Net cash provided by operating activities was $109.3$141.1 million for the year ended September 30, 2013,2015, compared to $83.3$90.7 million and $97.8$108.1 million for fiscal 20122014 and 2011,2013, respectively. Operating cash flow for fiscal 2015 principally included net income adjusted for depreciation and amortization, stock-based compensation expense, trade name write-offs, and an increase in deferred taxes, partially offset by an increase in working capital items and a cash contribution of $3.3 million to the Company's principal pension plan. Operating cash flow for fiscal 2014 principally included net income adjusted for depreciation and amortization, stock-based compensation expense, and an increase in deferred taxes, partially offset by an increase in working capital items and a cash contribution of $3.0 million to the Company's principal pension plan. Operating cash flow for fiscal 2013 principally included net income adjusted for depreciation and amortization, stock-based compensation expense, and an increase in deferred taxes, partially offset by an increase in working capital items (primarily accounts receivable and inventory) and a cash contribution of $2.5 million to the Company’s principal pension plan. Operating cash flow for fiscal 2012 principally included net income adjusted for depreciation and amortization, stock-based compensation expense, and an increase in deferred taxes, partially offset by an increase in working capital items (primarily accounts receivable and inventory) and a cash contribution of $5.0 million to the Company’s principal pension plan. Operating cash flow for fiscal 2011 primarily reflected net income adjusted for depreciation and amortization, stock-based compensation expense, and an increase in deferred taxes, partially offset by a net increase in working capital items. In addition the Company made a cash contribution of $9.0 million to itsCompany's principal pension plan.
Cash used in investing activities was $98.6$263.2 million for the year ended September 30, 2013,2015, compared to $45.3$411.1 million and $106.8$98.6 million for fiscal years 20122014 and 2011,2013, respectively. Investing activities for fiscal 2015 primarily reflected capital expenditures of $48.3 million, acquisition payments (net of cash acquired) of $213.5 million, primarily for the Aurora acquisition, net proceeds of $10.4 million from the sale of a subsidiary, and payment of $12.9 million related to a letter of credit issued for a customer (see discussion below). Investing activities for fiscal 2014 primarily included payments (net of cash acquired) of $382.1 million, primarily for the Schawk acquisition, and $29.2 million for capital expenditures. Investing activities for fiscal 2013 primarily included payments (net of cash acquired) of $74.0 million for acquisitions and $24.9 million for capital expenditures. Investing activities for fiscal 2012 primarily reflected capital expenditures of $33.2 million and payments (net of cash acquired) of $12.5 million for acquisitions. Investing activities for fiscal 2011 primarily reflected payments (net of cash acquired) of $84.4 million for acquisitions and capital expenditures of $22.4 million.
Capital expenditures were $24.9$48.3 million for the year ended September 30, 2013,2015, compared to $33.2$29.2 million and $22.4$24.9 million for fiscal 20122014 and 2011,2013, respectively. Capital expenditures in fiscal 2012 were higher due to new investments in gravure equipment in Germany and Turkey and investments in ERP and e-commerce systems. Capital expenditures in each of the last three fiscal years reflected reinvestments in the Company's business segments and were made primarily for the purchase of new manufacturing machinery, equipment and facilities designed to improve product quality, increase manufacturing efficiency, lower production costs and meet regulatory requirements. Capital expenditures for the last three fiscal years were primarily financed through operating cash.
Capital spending for property, plant and equipment has averaged $26.9$34.1 million for the last three fiscal years. The increase in fiscal 2015 capital spending reflects the addition of the capital requirements of Schawk, and additional information technology capital spending related to the Company's systems integration activities, primarily arising with the Schawk acquisition. Capital spending for fiscal 20142016 is currently expected to be approximately $30.0$45.0 million. The Company expects to generate sufficient cash from operations to fund all anticipated capital spending projects.
Cash provided by financing activities for the year ended September 30, 2015 was $131.2 million, and reflected proceeds, net of repayments, on long-term debt of $179.2 million, purchases of treasury stock of $14.6 million, payment of contingent consideration of $484,000, proceeds from the sale of treasury stock (stock option exercises) of $4.0 million and payment of dividends to the Company's shareholders of $17.8 million ($0.54 per share). Cash provided by financing activities for the year ended September 30, 2014 was $338.1 million, and reflected proceeds, net of repayments, on long-term debt of $357.3 million, purchases of treasury stock of $9.9 million, payment of contingent consideration of $3.7 million, proceeds from the sale of treasury stock (stock option exercises) of $8.0 million and payment of dividends to the Company's shareholders of $13.4 million ($0.46 per share). Cash used in financing activities for the year ended September 30, 2013 was $11.8$10.8 million, reflectingand reflected proceeds, net of repayments, on long-term debt of $32.2$33.2 million, purchases of treasury stock of $21.6 million, payment of contingent consideration of $11.3 million and payment of dividends to the Company’sCompany's shareholders of $11.3 million ($0.41 per share). Cash used in financing activities for the year ended September 30, 2012 was $41.0 million, reflecting purchases of treasury stock of $31.0 million, and payment of dividends to the Company’s shareholders of $10.3 million ($0.37 per share). Cash provided by financing activities for the year ended September 30, 2011 was $10.4 million, reflecting proceeds, net of repayments, on long-term debt of $68.9 million, purchases of treasury stock of $44.6 million, proceeds from the sale of treasury stock (stock option exercises) of $1.9 million, payment of dividends to the Company’s shareholders of $9.6 million ($0.33 per share) and distributions of $6.2 million to noncontrolling interests.
The Company has a domestic Revolving Credit Facility with a syndicate of financial institutions. In connection with the acquisition of Schawk in July 2013,2014, the Company amended certain terms of the Revolving Credit Facility to increase the maximum amount of borrowings available under the facility was increased from $400.0$500.0 million to $500.0 million and the facility’s maturity was extended to July 2018.$900.0 million. Borrowings under the amended facility bear interest at LIBOR plus a factor ranging from .75% to 1.25%2.00% (1.75% at September 30, 2015) based on the Company’sCompany's leverage ratio. The leverage ratio is defined as net indebtedness divided by EBITDA (earnings before interest, taxes, depreciation and amortization). The Company is required to pay an annual commitment fee ranging from .15% to .25% (based on the Company’sCompany's leverage ratio) of the unused portion of the facility.
ITEM 7. | ITEM 7. | MANAGEMENT'S DISCUSSION AND ANALYSIS, (continued) |
The Revolving Credit Facility requires the Company to maintain certain leverage and interest coverage ratios. A portion of the facility (not to exceed $25.0$30.0 million) is available for the issuance of trade and standby letters of credit. Outstanding borrowings on the Revolving Credit Facility at September 30, 20132015 and 20122014 were $305.0$857.4 million and $281.3$680.0 million, respectively. The weighted-average interest rate on outstanding borrowings at September 30, 20132015 and 20122014 was 2.81%2.41% and 2.83%2.53%, respectively.
The Company has entered into the following interest rate swaps:
| Effective Date | Amount | Fixed Interest Rate | Interest Rate Spread at September 30, 2013 | Maturity Date | Amount | Fixed Interest Rate | Interest Rate Spread at September 30, 2015 | Maturity Date | | May 2011 | $25 million | 1.37% | 1.25% | May 2014 | | | October 2011 | 25 million | 1.67% | 1.25% | October 2015 | $25 million | 1.67% | 1.75% | October 2015 | | November 2011 | 25 million | 2.13% | 1.25% | November 2014 | | | March 2012 | 25 million | 2.44% | 1.25% | March 2015 | | | June 2012 | 40 million | 1.88% | 1.25% | June 2022 | 40 million | 1.88% | 1.75% | June 2022 | | August 2012 | 35 million | 1.74% | 1.25% | June 2022 | 35 million | 1.74% | 1.75% | June 2022 | | September 2012 | 25 million | 3.03% | 1.25% | December 2015 | 25 million | 3.03% | 1.75% | December 2015 | | September 2012 | 25 million | 1.24% | 1.25% | March 2017 | 25 million | 1.24% | 1.75% | March 2017 | | November 2012 | 25 million | 1.33% | 1.25% | November 2015 | 25 million | 1.33% | 1.75% | November 2015 | | May 2014 | | 25 million | 1.35% | 1.75% | May 2018 | | November 2014 | | 25 million | 1.26% | 1.75% | June 2018 | | March 2015 | | 25 million | 1.49% | 1.75% | March 2019 | | September 2015 | | 25 million | 1.39% | 1.75% | September 2020 | | December 2015 | | 25 million | 1.59% | 1.75% | December 2020 |
The interest rate swaps have been designated as cash flow hedges of the future variable interest payments under the Revolving Credit Facility which are considered probable of occurring. Based on the Company’sCompany's assessment, all the critical terms of each of the hedges matched the underlying terms of the hedged debt and related forecasted interest payments, and as such, these hedges were considered highly effective.
The fair value of the interest rate swaps reflected an unrealized loss, net of unrealized gains, of $908,000 ($554,000 after tax) and $9.1$3.7 million ($5.62.2 million after tax)after-tax) and an unrealized gain, net of unrealized losses, of $330,000 ($201,000 after-tax) at September 30, 20132015 and 2012,2014, respectively, that is included in shareholders' equity as part of accumulated other comprehensive loss.income. Assuming market rates remain constant with the rates at September 30, 2013,2015, a loss (net of tax) of approximately $1.6 million$711,000 included in accumulated other comprehensive lossincome is expected to be recognized in earnings as an adjustment to interest expense over the next twelve months.
In March 2013, theThe Company, through certain of its European subsidiaries, entered intohas a credit facility with a European bank. The maximum amount of borrowings available under this facility is 25.035.0 million Euros ($33.839.3 million). Outstanding borrowings under the credit facility totaled 22.523.9 million Euros ($30.426.8 million) and 17.5 million Euros ($22.1 million) at September 30, 2013.2015 and 2014, respectively. The weighted-average interest rate on outstanding borrowings under the facility at September 30, 20132015 and 2014 was 1.37%.1.50% and 1.35%, respectively.
The Company, through its German subsidiary, Saueressig GmbH & Co. KG ("Saueressig"), has several loans with various European banks. Outstanding borrowings onunder these loans totaled 1.7734,000 Euros ($824,000) and 1.2 million Euros ($2.3 million) and 8.2 million Euros ($10.51.6 million) at September 30, 20132015 and 2012,2014, respectively. The weighted-average interest rate on outstanding borrowings of Saueressig at September 30, 20132015 and 20122014 was 4.04% and 6.10%3.96%, respectively.
The Company, through its German subsidiary, Wetzel GmbH ("Wetzel"), has several loans with various European banks. Outstanding borrowings under these loans totaled 1.9 million Euros ($2.1 million) and 2.9 million Euros ($3.6 million) at September 30, 2015 and 2014, respectively. The weighted-average interest rate on outstanding borrowings of Wetzel at September 30, 2015 and 2014 was 5.96% and 5.67%, respectively.
| ITEM 7. | MANAGEMENT'S DISCUSSION AND ANALYSIS, (continued) |
The Company, through its wholly-owned subsidiary, Matthews International S.p.A., has several loans with various Italian banks. Outstanding borrowings on these loans totaled 5.14.3 million Euros ($4.8 million) and 5.5 million Euros ($6.9 million) and 6.3 million Euros ($8.1 million) at September 30, 20132015 and 2012,2014, respectively. Matthews International S.p.A. also has fourthree lines of credit totaling 11.411.3 million Euros ($15.412.7 million) with the same Italian banks. Outstanding borrowings on these lines were 5.64.6 million Euros ($7.65.2 million) and 3.44.8 million Euros ($4.36.1 million) at September 30, 20132015 and 2012,2014, respectively. The weighted-average interest rate on outstanding Matthews International S.p.A. borrowings at September 30, 20132015 and 20122014 was 3.16%3.33% and 3.08%3.15%, respectively.
In September 2014, a claim seeking to draw upon a letter of credit issued by the Company of $12.9 million was filed with respect to a project for a customer. In January 2015, the Company made payment on the draw to the financial institution for the letter of credit. Pursuant to an action initiated by the Company, a court order has been issued requiring these funds to ultimately be remitted to the court pending resolution of the dispute between the parties. While it is possible the resolution of this matter could be unfavorable to the Company, management has assessed the customer's claim to be without merit and, based on information available as of this filing, expects that the ultimate resolution of this matter will not have a material adverse effect on Matthews' financial condition, results of operations or cash flows. As of September 30, 2015, the Company has presented the funded letter of credit within other current assets on the Consolidated Balance Sheet.
The Company has a stock repurchase program. Under the current authorization, the Company's Board of Directors has authorized the repurchase of a total of 2,500,000 shares of Matthews’Matthews' common stock under the program, of which 1,194,670661,022 shares remain available for repurchase as of September 30, 2013.2015. In November 2015, the Company's Board of Directors approved the continuation of its stock repurchase program and increased the authorization for stock repurchases by an additional 2,500,000 shares. The buy-back program is designed to increase shareholder value, enlarge the Company's holdings of its common stock, and add to earnings per share. Repurchased shares may be retained in treasury, utilized for acquisitions, or reissued to employees or other purchasers, subject to the restrictions ofset forth in the Company’sCompany's Restated Articles of Incorporation.
ITEM 7. MANAGEMENT'S DISCUSSION AND ANALYSIS, (continued)
At September 30, 2013,2015, approximately $46.6$53.9 million of cash and cash equivalents were held by international subsidiaries whose undistributed earnings are considered permanently reinvested. The Company’sCompany's intent is to reinvest these funds in our international operations and current plans do not demonstrate a need to repatriate them to fund U.S. operations. If the Company decides at a later date to repatriate these funds to the U.S., it would be required to provide taxes on these amounts based on the applicable U.S. tax rates net of credits for foreign taxes already paid.
Consolidated working capital was $222.0$375.6 million at September 30, 2013,2015, compared to $212.5$312.9 million at September 30, 2012. The increase in working capital at September 30, 2013 primarily reflected higher accounts receivable, an increase in accrued compensation and a decrease in the current portion of estimated contingent consideration related to acquisitions.2014. Cash and cash equivalents were $58.0$72.2 million at September 30, 2013,2015, compared to $58.3$63.0 million at September 30, 2012.2014. The Company's current ratio was 2.5 and 2.2 at September 30, 20132015 and 2012.2014, respectively.
ENVIRONMENTAL MATTERS:
The Company's operations are subject to various federal, state and local laws and regulations relating to the protection of the environment. These laws and regulations impose limitations on the discharge of materials into the environment and require the Company to obtain and operate in compliance with conditions of permits and other government authorizations. As such, the Company has developed environmental, health, and safety policies and procedures that include the proper handling, storage and disposal of hazardous materials.
The Company is party to various environmental matters. These include obligations to investigate and mitigate the effects on the environment of the disposal of certain materials at various operating and non-operating sites. The Company is currently performing environmental assessments and remediation at these sites, as appropriate.
At September 30, 2013,2015, an accrual of approximately $5.3$4.3 million had been recorded for environmental remediation (of which $1.2 million was classified in other current liabilities), representing management's best estimate of the probable and reasonably estimable costs of the Company's known remediation obligations. The accrual which reflects previously established reserves assumed with the acquisition of York and additional reserves recorded as a purchase accounting adjustment, does not consider the effects of inflation and anticipated expenditures are not discounted to their present value. Changes in the accrued environmental remediation obligation from the prior fiscal year reflect payments charged against the accrual.
| ITEM 7. | MANAGEMENT'S DISCUSSION AND ANALYSIS, (continued) |
While final resolution of these contingencies could result in costs different than current accruals, management believes the ultimate outcome will not have a significant effect on the Company's consolidated results of operations or financial position.
ACQUISITIONS:
Fiscal 2015:
In August 2015, the Company completed the acquisition of Aurora for $211.6 million (net of cash acquired), subject to a working capital adjustment. The preliminary allocation of the purchase price resulted in goodwill of $73.6 million, which was assigned to the Memorialization segment, $76.3 million of intangible assets, of which $30.5 million is not subject to amortization, $29.0 million of property, plant and equipment, and $32.6 million of other net assets, primarily working capital. Approximately $43.0 million of the goodwill is expected to be deductible for tax purposes. Aurora provides burial, cremation, and technology products to funeral home clients and distributors in the United States and Canada. In the year ended December 31, 2014, Aurora reported revenue of approximately $142.0 million. The acquisition is designed to expand the Company's memorialization product offerings and geographic distribution footprint in the United States.
Fiscal 2014:
On July 29, 2014, the Company acquired Schawk, a leading global brand development, activation and deployment company headquartered in Des Plaines, Illinois. Under the terms of the transaction, Schawk shareholders received $11.80 cash and 0.20582 shares of Matthews' common stock for each Schawk share held. Based on the closing price of Matthews' stock on July 28, 2014, the transaction represented an implied price of $20.74 per share and a total enterprise value (which included outstanding debt, net of cash acquired) of $616.7 million. Schawk provides comprehensive brand development and brand deployment services to clients primarily in the consumer packaged goods, retail and life sciences markets. Schawk creates and sells its clients' brands, produces brand assets and protects brand equities to help drive brand performance. Schawk delivers its services through more than 155 locations in over 20 countries across North and South America, Europe, Asia and Australia.
Fiscal 2013:
Acquisition spending, net of cash acquired, during the year ended September 30, 2013 totaled $74.0 million. The acquisitions were not individually significant to the Company’sCompany's consolidated financial position or results of operations, and primarily included the following:
In April 2013, the Company completed the purchase of the remaining 20% interest in Tact Group Limited (“Tact”). The Company had acquired an 80% interest in Tact in July 2009.
In March 2013, the Company completed the purchase of the remaining 38.5% interest in Kroma Pre-Press Preparation Systems Industry & Trade, Inc. ("Kroma"), completing the option arrangement in connection with the July 2011 acquisition of a 61.5% interest in Kroma.
ITEM 7. MANAGEMENT'S DISCUSSION AND ANALYSIS, (continued)
In March 2013, the Company completed the purchase of the remaining 20% interest in Furnace Construction Cremators Limited (“FCC”). The Company had acquired an 80% interest in FCC in March 2010.
In December 2012, the Company acquired Pyramid Controls, Inc. and its affiliate, Pyramid Control Systems, a provider of warehouse control systems and conveyor control solutions for distribution centers. The acquisition iswas designed to expand Matthews' fulfillment products and services in the warehouse management market. The initial purchase price for the transaction was $26.2 million, plus potential additional consideration up toof $3.7 million paid in fiscal 2014 based on future operating results.
In November 2012, the Company acquired Wetzel, a leading European provider of pre-press services and gravure printing forms, with manufacturing operations in Germany and Poland. Wetzel’sWetzel's products and services are sold primary within Europe, and the acquisition iswas designed to expand Matthews' products and services in the global graphics imaging market. The purchase price for Wetzel was 42.6 million Euros ($54.7 million) on a cash-free, debt-free basis.
The Company has completed the allocation of purchase price for all acquisitions.28
Fiscal 2012:
Acquisition spending, net of cash acquired, during the year ended September 30, 2012 totaled $12.5 million. The acquisitions were not individually material to the Company’s consolidated financial position or results of operations, and primarily included the following:
In May 2012, the Company acquired Everlasting Granite, a supplier of granite memorials, columbariums and private mausoleum estates. The transaction is intended to expand the Company’s presence and product breadth in the granite memorial business.
Fiscal 2011:
Acquisition spending, net of cash acquired, during the year ended September 30, 2011 totaled $84.4 million. The acquisitions were not individually material to the Company’s consolidated financial position or results of operations, and primarily included the following:
In August 2011, the Company acquired Lightning Pick Technologies, Inc. (“LPT”), a manufacturer that develops, installs and supports paperless order fulfillment solutions. The transaction is intended to expand the Company’s presence and product breadth in the fulfillment systems industry.
In July 2011, the Company purchased a 61.5% interest in Kroma, a leading provider of pre-press services and roto-gravure printing cylinders in Turkey. The acquisition is designed to further extend Matthews' presence as the leading provider of reprographic pre-press products and services to the European packaging and tobacco markets.
| In April 2011, the Company completed the purchase of the remaining 22% interest in Saueressig for 19.3 million Euros ($27.4 million), completing the option agreement in connection with the May 2008 acquisition of a 78% interest in Saueressig. |
| In March 2011, the Company acquired Innovative Picking Technologies, Inc. (“IPTI”), a manufacturer of paperless order fulfillment systems. The transaction is intended to expand the Company’s presence into the fulfillment systems industry. |
| In October 2010, the Company acquired Freeman Metal Products, Inc. and its affiliated companies (collectively, “Freeman”), a manufacturer and distributor of caskets. The purchase price for the acquisition was $22.8 million, plus additional consideration up to $6.0 million contingent on operating performance over the next three years. The transaction is intended to provide synergies in the manufacturing and distribution of caskets and expand the Company’s market presence in the Southeast and South Central regions of the United States. |
| ITEM 7. | MANAGEMENT'S DISCUSSION AND ANALYSIS, (continued) |
| In October 2010, the Company acquired the remaining 25% interest in Rudolf Reproflex GmbH & Co. KG (“Reproflex”). The Company acquired a 75% interest in Reproflex in 2001. |
FORWARD-LOOKING INFORMATION:
Matthews has a three-pronged strategy to attain annual growth in earnings per share. This strategy consists of the following: internal growth (which includes organic growth, cost structure and productivity improvements, new product development and the expansion into new markets with existing products), acquisitions and share repurchases under the Company’sCompany's stock repurchase program (see "Liquidity and Capital Resources").
In developing the Company’s expectations for fiscal 2014, the following significant factors were considered.
· | Strategic cost-structure initiatives, particularly with respect to lean and sourcing, will continue, as will the unusual costs associated with the initiatives. Benefits related to strategic initiatives began to be realized late in fiscal 2013 and the Company expects such benefits to continue in fiscal 2014. |
· | The increase in the number of U.S. deaths that impacted the Memorialization businesses in fiscal 2013 are expected to moderate, suggesting a flat to slightly lower casketed death rate for fiscal 2014. |
· | Challenges resulting from the European economic weakness are expected to continue which will impact the Company’s European businesses. |
· | Recent acquisitions are expected to contribute to fiscal 2014 results.
|
Based on the aforementioned, excluding unusual costs, the Company is projecting growth in fiscal 2014 earnings per share over fiscal 2013. With respect to fiscal 2016, the Company expects to continue to devote a significant level of effort to the integrations of Schawk and Aurora. Due to the size of these acquisitions and the projected synergy benefits from integration, these efforts are anticipated to continue for an extended period of time. The costs associated with these integrations, and acquisition-related step-up expense, will impact the Company's operating results for fiscal 2016. Consistent with its practice, the Company plans to identify these costs on a quarterly earnings projections, we expect lower earnings for the fiscal 2014 first quarter, with year-over-year growth projected for the remainder of the fiscal year.basis as incurred.
CRITICAL ACCOUNTING POLICIES:
The preparation of financial statements in conformity with generally accepted accounting principles requires management to make estimates and assumptions that affect the reported amounts of assets and liabilities and disclosure of contingent assets and liabilities at the date of the financial statements and the reported amounts of revenues and expenses during the reporting period. Therefore, the determination of estimates requires the exercise of judgment based on various assumptions and other factors such as historical experience, economic conditions, and in some cases, actuarial techniques. Actual results may differ from those estimates. A discussion of market risks affecting the Company can be found in Item 7A, "Quantitative and Qualitative Disclosures about Market Risk," of this Annual Report on Form 10-K.
The Company's significant accounting policies are included in the Notes to Consolidated Financial Statements included in this Annual Report on Form 10-K. Management believes that the application of these policies on a consistent basis enables the Company to provide useful and reliable financial information about the Company's operating results and financial condition. The following accounting policies involve significant estimates, which were considered critical to the preparation of the Company's consolidated financial statements for the year ended September 30, 2013.2015.
Trade Receivables and Allowance for Doubtful Accounts:
Trade receivables are carried at their estimated collectible amounts. Trade credit is generally extended on a short-term basis; thus trade receivables do not bear interest, although a finance charge may be applied to such receivables that are more than 30 days past due. The allowance for doubtful accounts is based on an evaluation of specific customer accounts for which available facts and circumstances indicate collectibilitycollectability may be uncertain. In addition, the allowance includes a reserve for all customers based on historical collection experience.
Long-Lived Assets, including Property, Plant and Equipment:
ITEM 7. MANAGEMENT'S DISCUSSION AND ANALYSIS, (continued)
Long-Lived Assets:
Property, plant and equipment, goodwill and other intangibleLong-lived assets are carriedrecorded at cost.their respective cost basis on the date of acquisition. Depreciation on property, plant and equipment is computed primarily on the straight-line method over the estimated useful lives of the assets. Property,Intangible assets with finite useful lives are amortized over their estimated useful lives. The Company reviews long-lived assets, including property, plant and equipment, are reviewed for impairmentand intangibles with finite useful lives, whenever events or changes in circumstances indicate that the carrying amount of such assets may not be recoverable. Recoverability of assets is determined by evaluating the estimated undiscounted net cash flows of the operations to which the assets relate. An impairment loss would be recognized when the carrying amount of the assets exceeds the fair value which is based on a discounted cash flow analysis.
ITEM 7.MANAGEMENT'S DISCUSSION AND ANALYSIS, (continued)
Goodwill isand Indefinite-Lived Intangibles:
Goodwill and intangible assets with indefinite useful lives are not amortized, but is subject to periodic revieware tested at least annually for impairment.impairment, or when circumstances indicate that a possible impairment may exist. In general, when the carrying value of a reporting unitthese assets exceeds itsthe implied fair value, an impairment loss must be recognized. For purposes of testing for impairment, the Company uses a combination of valuation techniques, including discounted cash flows. Intangible assets are amortized over their estimated useful lives, unless such lives are considered to be indefinite. A significant decline in cash flows generated from these assets may result in a write-down of the carrying values of the related assets. For purposes of testing goodwill for impairment, the Company uses a combination of valuation techniques, including discounted cash flows. A number of assumptions and estimates are involved in the application of the discounted cash flow model to forecast operating cash flows, including sales volumes and pricing, costs to produce, tax rates, capital spending, working capital changes, and discount rates. The Company estimates future cash flows using volume and pricing assumptions based largely on existing customer relationships and contracts, and operating cost assumptions management believes are reasonable based on historical performance and projected future performance as reflected in its most recent operating plans and projections. The discount rates used in the discounted cash flow analyses are developed with the assistance of valuation experts and management believes the discount rates appropriately reflect the risks associated with the Company's operating cash flows. In order to further validate the reasonableness of the estimated fair values of the reporting units as of the valuation date, a reconciliation of the aggregate fair values of all reporting units to market capitalization is performed using a reasonable control premium.
The Company performed its annual impairment reviews in the second quarters of fiscal 2013, 2012 and 2011 and determined that no adjustments to the carrying valuesreview of goodwill were necessary at those times. As discussed under “Results of Operations”, recent economic conditions in Europe have unfavorably impacted the operating results of the Graphics Imaging segment. Consequently, the Graphics Imaging reporting unit’s implied fair value is approaching the unit’s carrying value. If the segment’s operating results deteriorate further, an impairment charge could be required in future periods.
The Company also performed its annual impairment review of otherand indefinite-lived intangible assets in the second quarter of fiscal 2013. Based on this assessment,2015. The Company determined that the Company recorded an impairment charge of approximately $1.6 million relatedestimated fair value for all goodwill reporting units exceeded carrying value, therefore no adjustments to the carrying value of agoodwill were necessary at March 31, 2015. In connection with the integration of Schawk, the Company discontinued the use of certain legacy trade namenames and recognized write-offs of oneapproximately $4.8 million in the SGK Brand Solutions segment during the second quarter of its European Graphics businesses. The impairment was determined based upon a comparisonfiscal 2015. There were no other impairments identified during the Company's annual assessment of the carrying value of the trade name to its implied fair market value.indefinite-lived intangible assets.
Share-Based Payment:
Stock-based compensation cost is measured at grant date, based on the fair value of the award, and is recognized as expense over the employee requisite service period. A binomial lattice model is utilized to determine the fair value of awards.
Pension and Postretirement Benefits:
Pension assets and liabilities are determined on an actuarial basis and are affected by the market value of plan assets, estimates of the expected return on plan assets and the discount rate used to determine the present value of benefit obligations. Actual changes in the fair market value of plan assets and differences between the actual return on plan assets, the expected return on plan assets and changes in the selected discount rate will affect the amount of pension cost.
The Company's principal pension plan maintains a substantial portion of its assets in equity securities in accordance with the investment policy established by the Company’sCompany's pension board. Based on an analysis of the historical performance of the plan's assets and information provided by its independent investment advisor, the Company set the long-term rate of return assumption for these assets at 8.0%7.75% at September 30, 20132014 for purposes of determining fiscal 2015 pension cost and funded status.cost. The Company’sCompany's discount rate assumption used in determining the present value of the projected benefit obligation is based upon published indices as of September 30, 20132015 and September 30, 20122014 for the fiscal year end valuation. The discount rate was 5.00%4.25%, 4.00%4.25% and 4.75%5.00% in fiscal 2013, 20122015, 2014 and 2011,2013, respectively.
Environmental:
Environmental liabilities are recorded when the Company's obligation is probable and reasonably estimable. Accruals for losses from environmental remediation obligations do not consider the effects of inflation and anticipated expenditures are not discounted to their present value.
ITEM 7. | ITEM 7. | MANAGEMENT'S DISCUSSION AND ANALYSIS, (continued) |
Income Taxes:
Deferred tax assets and liabilities are provided for the differences between the financial statement and tax bases of assets and liabilities using enacted tax rates in effect for the years in which the differences are expected to reverse. Valuation allowances are recorded to reduce deferred tax assets when it is more likely than not that a tax benefit will not be realized. Deferred income taxes for U.S. tax purposes have not been provided on certain undistributed earnings of foreign subsidiaries, as such earnings are considered to be reinvested indefinitely. To the extent earnings are expected to be returned in the foreseeable future, the associated deferred tax liabilities are provided. The Company has not determined the deferred tax liability associated with these undistributed earnings, as such determination is not practicable.
Revenue Recognition:
Revenues are generally recognized when title, ownership, and risk of loss pass to the customer, which is typically at the time of product shipment. shipment and is based on the applicable shipping terms. The shipping terms vary across all businesses and depend on the product and customer.
For pre-need sales of memorials and vases, revenue is recognized when the memorial has been manufactured to the customer’scustomer's specifications (e.g., name and birth date), title has been transferred to the customer and the memorial and vase are placed in storage for future delivery. A liability has been recorded for the estimated costs of finishing pre-need bronze memorials and vases that have been manufactured and placed in storage prior to July 1, 2003 for future delivery. Beginning July 1, 2003, revenue is deferred by the Company on the portion of pre-need sales attributable to the final finishing and storage of the pre-need merchandise. Deferred revenue for final finishing is recognized at the time the pre-need merchandise is finished and shipped to the customer. Deferred revenue related to storage is recognized on a straight-line basis over the estimated average time that pre-need merchandise is held in storage. At September 30, 2013,2015, the Company held 323,708312,273 memorials and 228,936218,627 vases in its storage facilities under the pre-need sales program.
Construction revenuesRevenues from mausoleum construction and significant engineering projects, including certain cremation units and marking and industrial automation projects, are recognized under the percentage-of-completion method of accounting using the cost-to-cost basis for measuring progress toward completion. As work is performed under contracts, estimates of the costs to complete are regularly reviewed and updated. As changes in estimates of total costs at completion on projects are identified, appropriate earnings adjustments are recorded using the cumulative catch-up method. Provisions for estimated losses on uncompleted contracts are recorded during the period in which such losses become evident.
The Company offers rebates to certain customers participating in volume purchase programs. RebatesRevenues from brand development and deployment services are estimated and recorded as a reduction in sales atrecognized using the timecompleted performance method, which is typically when the Company’s products are sold.customer receives the final deliverable. For arrangements with customer acceptance provisions, revenue is recognized when the customer approves the final deliverable.
ITEM 7.MANAGEMENT'S DISCUSSION AND ANALYSIS, (continued)
LONG-TERM CONTRACTUAL OBLIGATIONS AND COMMITMENTS:
The following table summarizes the Company’sCompany's contractual obligations at September 30, 2013,2015, and the effect such obligations are expected to have on its liquidity and cash flows in future periods.
| | | Payments due in fiscal year: | | | Payments due in fiscal year: | | | | | | | | | | | | | | | | | | | | After | | | | | | | | | | | | | | | After | | | | | Total | | | 2014 | | | 2015 to 2016 | | | 2017 to 2018 | | | 2018 | | | Total | | | 2016 | | | 2017 to 2018 | | | 2019 to 2020 | | | 2020 | | | Contractual Cash Obligations: | | (Dollar amounts in thousands) | | | (Dollar amounts in thousands) | | | | | | Revolving credit facility | | $ | 335,420 | | | $ | - | | | $ | 30,420 | | | $ | 305,000 | | | $ | - | | | $ | 884,254 | | | $ | - | | | $ | 884,254 | | | $ | - | | | $ | - | | | Notes payable to banks | | | 21,530 | | | | 13,068 | | | | 6,997 | | | | 1,465 | | | | - | | | | 8,507 | | | | 5,565 | | | | 2,942 | | | | - | | | | - | | | Short-term borrowings | | | 7,639 | | | | 7,639 | | | | - | | | | - | | | | - | | | | 5,199 | | | | 5,199 | | | | - | | | | - | | | | - | | | Capital lease obligations | | | 10,658 | | | | 2,160 | | | | 2,799 | | | | 1,859 | | | | 3,840 | | | | 6,410 | | | | 1,158 | | | | 1,063 | | | | 4,189 | | | | - | | | Non-cancelable operating leases | | | 24,325 | | | | 10,048 | | | | 10,147 | | | | 2,284 | | | | 1,846 | | | | 44,039 | | | | 17,149 | | | | 17,948 | | | | 7,207 | | | | 1,735 | | | Total contractual cash obligations | | $ | 399,572 | | | $ | 32,915 | | | $ | 50,363 | | | $ | 310,608 | | | $ | 5,686 | | | $ | 948,409 | | | $ | 29,071 | | | $ | 906,207 | | | $ | 11,396 | | | $ | 1,735 | |
A significant portion of the loans included in the table above bear interest at variable rates. At September 30, 2013,2015, the weighted-average interest rate was 2.81%2.41% on the Company’sCompany's domestic Revolving Credit Facility, 1.37%1.50% on the credit facility through the Company’sCompany's European subsidiaries, 4.04% on bank loans to its wholly-owned subsidiary, Saueressig, 5.96% on bank loans to its wholly-owned subsidiary, Wetzel, and 3.16%3.33% on bank loans to the Company’sCompany's wholly-owned subsidiary, Matthews International S.p.A.
Benefit payments under the Company’sCompany's principal retirement plan are made from plan assets, while benefit payments under the supplemental retirement plan and postretirement benefit plan are funded from the Company’sCompany's operating cash. Under I.R.S. regulations, the Company was not required to make any significant contributionsa contribution to its principal retirement plan in fiscal 2013, however, in fiscal 2013, the Company made a contribution of $2.5 million to its principal retirement plan.
ITEM 7. MANAGEMENT'S DISCUSSION AND ANALYSIS, (continued)2015.
The Company is not required to make any significant cash contributions to its principal retirement plan in fiscal 2014.2016. The Company estimates that benefit payments to participants under its retirement plans (including its supplemental retirement plan) and postretirement benefit payments will be approximately $7.1$9.1 million and $926,000,$1.0 million, respectively, in fiscal 2014.2016. The amounts are expected to increase incrementally each year thereafter, to $9.1$11.2 million and $1.2 million, respectively, in 2018.2020. The Company believes that its current liquidity sources, combined with its operating cash flow and borrowing capacity, will be sufficient to meet its capital needs for the foreseeable future.
In connection with several recent acquisitions, the Company has recorded contingent consideration of approximately $3.7 million. The fair value of the contingent consideration is expected to be settled in fiscal 2014.
Unrecognized tax benefits are positions taken, or expected to be taken, on an income tax return that may result in additional payments to tax authorities. If a tax authority agrees with the tax position taken, or expected to be taken, or the applicable statute of limitations expires, then additional payments will not be necessary. As of September 30, 2013,2015, the Company had unrecognized tax benefits, excluding penalties and interest, of approximately $4.5$4.1 million. The timing of potential future payments related to the unrecognized tax benefits is not presently determinable.
INFLATION:
Except for the volatility in the cost of bronze ingot, steel, wood and fuel (see “Results"Results of Operations”Operations"), inflation has not had a material impact on the Company over the past three years nor is it anticipated to have a material impact for the foreseeable future.
ITEM 7.MANAGEMENT'S DISCUSSION AND ANALYSIS, (continued)
RECENTLY ISSUED ACCOUNTING PRONOUNCEMENTS:
On February 5, 2013,In September 2015, the Financial Accounting StandardStandards Board ("FASB") issued new guidance intended to simplify the accounting for measurement period adjustments in a business combination. Measurement period adjustments are changes to provisional amounts recorded when the accounting for a business combination is incomplete as of the end of a reporting period. The measurement period can extend for up to a year following the transaction date. During the measurement period, companies may make adjustments to provisional amounts when information necessary to complete the measurement is received. The new guidance requires companies to recognize these adjustments, including any related impacts to net income, in the reporting period in which the adjustments are determined. Companies are no longer required to retroactively apply measurement period adjustments to all periods presented. Matthews early-adopted this ASU in the fourth quarter of fiscal 2015. The adoption of this ASU did not have a material impact on our financial statements and related disclosures.
In July 2015, the FASB issued new guidance to simplify the measurement of inventory valuation at the lower of cost or net realizable value. Net realizable value is the estimated selling price in the ordinary course of business, less reasonably predictable costs of completion, disposal and transportation. The new inventory measurement requirements are effective for the Company's 2017 fiscal year, and will replace the current inventory valuation guidance that requires the use of a lower of cost or market framework. The adoption of these changes is not expected to have a material impact on the Company's consolidated financial statements.
In April 2015, the FASB issued new guidance intended to simplify the presentation of debt issuance costs. The new guidance requires that debt issuance costs related to a recognized debt liability be presented on the balance sheet as a direct deduction from the carrying amount of debt, consistent with debt discounts. The recognition and measurement guidance for debt issuance costs are not affected by this new guidance. The new requirements will be effective for the Company beginning in fiscal year 2017, and are not expected to have a material impact on the Company's consolidated financial statements.
In June 2014, the FASB issued new guidance on the accounting for share-based payments when the terms of an award provide that a performance target could be achieved after the requisite service period. This guidance is effective for Matthews beginning January 1, 2016 and will not have a material impact on the Company's consolidated financial statements.
In May 2014, the FASB issued Accounting Standards Update No. 2013-02, Reporting(ASU) 2014-09, "Revenue from Contracts with Customers: Topic 606". This ASU replaces nearly all existing U.S. GAAP guidance on revenue recognition. The standard prescribes a five-step model for recognizing revenue, the application of Amounts Reclassified Out of Accumulated Other Comprehensive Income (“which will require significant judgment. The FASB issued ASU 2013-02”). ASU 2013-02 requires companies to present information about reclassification adjustments from accumulated other comprehensive income, including the amount2015-14 in August 2015 which resulted in a deferral of the reclassification and the income statement line items affected by the reclassification.original effective date of ASU 2014-09. This standard is now effective for Matthews beginning October 1, 2018. The information must be presentedCompany is in the process of assessing the impact the adoption of this ASU will have on its consolidated financial statementsstatements.
In January 2014, the FASB issued new guidance on accounting for certain receive-variable, pay-fixed interest rate swaps. This guidance provides companies with a practical expedient to qualify for cash flow hedge accounting. The guidance was effective for Matthews beginning in fiscal 2015, and did not have a single note ormaterial impact on the face of theCompany's consolidated financial statements. ASU 2013-02 is effective for annual periods beginning after December 15, 2012, and interim periods within those annual periods. This standard will be adopted by the Company for the quarter ended December 31, 2013.
ITEM 7A. QUANTITATIVE AND QUALITATIVE DISCLOSURES ABOUT MARKET RISK:
The following discussion about the Company's market risk involves forward-looking statements. Actual results could differ materially from those projected in the forward-looking statements. The Company has market risk related to changes in interest rates, commodity prices and foreign currency exchange rates. The Company does not generally use derivative financial instruments in connection with these market risks, except as noted below.
Interest Rates - The Company’sCompany's most significant long-term debt instrument is the domestic Revolving Credit Facility, which bears interest at variable rates based on LIBOR.
The Company has entered into the following interest rate swaps: | Effective Date | Amount | Fixed Interest Rate | Interest Rate Spread at September 30, 2013 | Maturity Date | | May 2011 | $25 million | 1.37% | 1.25% | May 2014 | | October 2011 | 25 million | 1.67% | 1.25% | October 2015 | | November 2011 | 25 million | 2.13% | 1.25% | November 2014 | | March 2012 | 25 million | 2.44% | 1.25% | March 2015 | | June 2012 | 40 million | 1.88% | 1.25% | June 2022 | | August 2012 | 35 million | 1.74% | 1.25% | June 2022 | | September 2012 | 25 million | 3.03% | 1.25% | December 2015 | | September 2012 | 25 million | 1.24% | 1.25% | March 2017 | | November 2012 | 25 million | 1.33% | 1.25% | November 2015 |
ITEM 7A. | QUANTITATIVE AND QUALITATIVE DISCLOSURES ABOUT MARKET RISK, (continued) |
| Effective Date | Amount | Fixed Interest Rate | Interest Rate Spread at September 30, 2015 | Maturity Date | | October 2011 | $25 million | 1.67% | 1.75% | October 2015 | | June 2012 | 40 million | 1.88% | 1.75% | June 2022 | | August 2012 | 35 million | 1.74% | 1.75% | June 2022 | | September 2012 | 25 million | 3.03% | 1.75% | December 2015 | | September 2012 | 25 million | 1.24% | 1.75% | March 2017 | | November 2012 | 25 million | 1.33% | 1.75% | November 2015 | | May 2014 | 25 million | 1.35% | 1.75% | May 2018 | | November 2014 | 25 million | 1.26% | 1.75% | June 2018 | | March 2015 | 25 million | 1.49% | 1.75% | March 2019 | | September 2015 | 25 million | 1.39% | 1.75% | September 2020 | | December 2015 | 25 million | 1.59% | 1.75% | December 2020 |
The interest rate swaps have been designated as cash flow hedges of the future variable interest payments under the Revolving Credit Facility which are considered probable of occurring. Based on the Company’sCompany's assessment, all the critical terms of each of the hedges matched the underlying terms of the hedged debt and related forecasted interest payments, and as such, these hedges were considered highly effective.
The fair value of the interest rate swaps reflected an unrealized loss, net loss of $908,000unrealized gains, of $3.7 million ($554,000 after tax)2.2 million after-tax) at September 30, 20132015 that is included in equity as part of accumulated other comprehensive loss.income. A decrease of 10% in market interest rates (e.g. a decrease from 5.0% to 4.5%) would result in an increase of approximately $926,000$421,000 in the fair value liability of the interest rate swaps.
Commodity Price Risks - In the normal course of business, the Company is exposed to commodity price fluctuations related to the purchases of certain materials and supplies (such as bronze ingot, steel, fuel and wood) used in its manufacturing operations. The Company obtains competitive prices for materials and supplies when available. In addition, based on competitive market conditions and to the extent that the Company has established pricing terms with customers through contracts or similar arrangements, the Company’sCompany's ability to immediately increase the price of its products to offset the increased costs may be limited.
ITEM 7A.QUANTITATIVE AND QUALITATIVE DISCLOSURES ABOUT MARKET RISK, (continued)
Foreign Currency Exchange Rates - The Company is subject to changes in various foreign currency exchange rates, primarily including the Euro, British Pound, Canadian Dollar, Australian Dollar, Swedish Krona, Chinese Yuan, Hong Kong Dollar, Polish Zloty, Turkish Lira, Indian Rupee and Vietnamese DongMalaysian Ringgit in the conversion from local currencies to the U.S. dollar of the reported financial position and operating results of its non-U.S. based subsidiaries. An adverse change (strengthening dollar) of 10% in exchange rates would have resulted in a decrease in reported sales of $38.2$53.5 million and a decrease in reported operating income of $2.9$5.6 million for the year ended September 30, 2013.2015.
Actuarial Assumptions - The most significant actuarial assumptions affecting pension expense and pension obligations include the valuation of retirement plan assets, the discount rate and the estimated return on plan assets. The estimated return on plan assets is currently based upon projections provided by the Company’sCompany's independent investment advisor, considering the investment policy of the plan and the plan’splan's asset allocation. The fair value of plan assets and discount rate are “point-in-time”"point-in-time" measures, and the recent volatility of the debt and equity markets makes estimating future changes in fair value of plan assets and discount rates more challenging. In fiscal 2015, the Company elected to value its principal retirement and other postretirement benefit plan liabilities using a modified assumption of future mortality that reflects a significant improvement in life expectancy over the previous mortality assumptions. Refer to Note 11, "Pension and Other Postretirement Plans" in Item 8 – "Financial Statements and Supplementary Data" for additional information.
The following table summarizes the impact on the September 30, 20132015 actuarial valuations of changes in the primary assumptions affecting the Company’sCompany's retirement plans and supplemental retirement plan. | | Impact of Changes in Actuarial Assumptions | | Impact of Changes in Actuarial Assumptions | | | | Change in Discount Rate | | Change in Expected Return | | Change in Market Value of Assets | | Change in Discount Rate | | | Change in Expected Return | | | Change in Market Value of Assets | | | | +1% | | -1% | | +1% | | -1% | | +5% | | -5% | | | +1% | | | | -1% | | | | +1% | | | | -1% | | | | +5% | | | | -5% | | | | | | | | (Dollar amounts in thousands) | | | | | | (Dollar amounts in thousands) | | | Increase (decrease) in net benefit cost | $ (2,394) | | $ 3,163 | | $(1,204) | | $1,204 | | $(1,097) | | $1,097 | | | $(3,709) | | | | $4,596 | | | | $(1,161) | | | | $1,161 | | | | $(1,165) | | | | $1,165 | | | | | | | | | | | | | | | | | | | | | | | | | | | | | | | | | | | | | | | | Increase (decrease) in projected benefit obligation | (23,348) | | 30,054 | | | | | | | | | | | (31,200) | | | | 39,332 | | | | - | | | | - | | | | - | | | | - | | | | | | | | | | | | | | | | | | | | | | | | | | | | | | | | | | | | | | | | Increae (decrease) in funded status | 23,348 | | (30,054) | | | | | | 6,219 | | (6,219) | | | | | | | | | | | | | | | | | | | | | | | | | | | | | | | | - | - | - | | | | | | | | | | | | | | | | | | | | - | | - | | | | | Increase (decrease) in funded status | | | | 31,200 | | | | (39,332) | | | | - | | | | - | | | | 7,111 | | | | (7,111) | |
| ITEM 8. FINANCIAL STATEMENTS AND SUPPLEMENTARY DATA. |
| Description | | Pages | | | | | Management’sManagement's Report to Shareholders | | 3337 | | | | | | Report of Independent Registered Public Accounting Firm | | 34-3538 | | | | | | Financial Statements: | | | | | | | Consolidated Balance Sheets as of September 30, 20132015 and 20122014 | | 36-3739-40 | | | | | Consolidated Statements of Income for the years ended September 30, 2013, 20122015, 2014 and 20112013 | | 3841 | | | | | Consolidated Statements of Comprehensive Income for the years ended September 30, 2013, 20122015, 2014 and 20112013 | | 3942 | | | | | Consolidated Statements of Shareholders' Equity for the years ended September 30, 2013, 20122015, 2014 and 20112013 | | 4043 | | | | | Consolidated Statements of Cash Flows for the years ended September 30, 2013, 20122015, 2014 and 20112013 | | 4144 | | | | | | Notes to Consolidated Financial Statements | | 42-6645-71 | | | | | | Supplementary Financial Information (unaudited) | | 6772 | | | | | | Financial Statement Schedule – Schedule II-Valuation and Qualifying | | | Accounts for the years ended September 30, 2013, 20122015, 2014 and 20112013 | | 6873 |
MANAGEMENT’S
MANAGEMENT'S REPORT TO SHAREHOLDERS
To the Shareholders and Board of Directors of Matthews International Corporation:
Management’sManagement's Report on Financial Statements
The accompanying consolidated financial statements of Matthews International Corporation and its subsidiaries (collectively, the “Company”"Company") were prepared by management, which is responsible for their integrity and objectivity. The statements were prepared in accordance with generally accepted accounting principles and include amounts that are based on management’smanagement's best judgments and estimates. The other financial information included in this Annual Report on Form 10-K is consistent with that in the financial statements.
Management’sManagement's Report on Internal Control over Financial Reporting
Management is responsible for establishing and maintaining adequate internal control over financial reporting for the Company.Company, as such term is defined in Exchange Act Rule 13a-15f. In order to evaluate the effectiveness of internal control over financial reporting management has conducted an assessment using the criteria in Internal Control – Integrated Framework (2013), issued by the Committee of Sponsoring Organizations of the Treadway Commission (“COSO”("COSO"). The Company’s internalInternal controls over financial reporting includeis a process under the supervision of, our Chief Executive Officer and Chief Financial Officer, and effected by the Company's board of directors, management and other personnel to provide reasonable assurance regarding the reliability of financial reporting and the preparation of financial statements for external purposes in accordance with generally accepted accounting principles and includes those policies and procedures that (i) pertain to the maintenance of records that, in reasonable detail, accurately and fairly reflect the transactions and dispositions of the assets of the Company; (ii) provide reasonable assurance that transactions are recorded as necessary to permit preparation of financial statements in accordance with generally accepted accounting principles, and that receipts and expenditures of the Company are being made only in accordance with authorizations of management and directors of the Company; and (iii) provide reasonable assurance regarding prevention or timely detection of unauthorized acquisition, use, or disposition of the Company’sCompany's assets that could have a material effect on the financial statements. Because of its inherent limitations, internal control over financial reporting may not prevent or detect misstatements. Also, projections of any evaluation of effectiveness to future periods are subject to the risk that controls may become inadequate because of changes in conditions, or that the degree of compliance with the policies or procedures may deteriorate.
Wetzel Holding AG, Wetzel GmbHAurora Products Group, LLC and certain related affiliatesits subsidiaries (collectively, “Wetzel”"Aurora") hashave been excluded from management’smanagement's assessment of internal control over financial reporting as of September 30, 2013,2015, because it was acquired by the Company in a purchase business combination in November 2012. WetzelAugust 2015. Aurora is a 100% owned subsidiary whose total assets and total sales represent approximately 6%4% and 4%1%, respectively, of the related consolidated financial statement amounts of the Company as of and for the year ended September 30, 2013. The operations2015.
Management, under the supervision and with the participation of Pyramid Controls, Inc.our Chief Executive Officer and its affiliate, Pyramid Control Systems (collectively, “Pyramid”) have been excluded from management’s assessmentChief Financial Officer, evaluated the effectiveness of the Company's internal control over financial reporting as of September 30, 2013, because Pyramids assets were acquiredbased on criteria in Internal Control – Integrated Framework (2013) issued by the Company in a purchase business combination in December 2012. Pyramid’s total assetsCOSO, and total sales represent approximately 3% and 2%, respectively, of the related consolidated financial statement amounts of the Company as of and for the year ended September 30, 2013.
Based on its assessment, management has concluded that the Company maintained effective internal control over financial reporting as of September 30, 2013, based on criteria in Internal Control – Integrated Framework issued by the COSO.2015. The effectiveness of the Company’sCompany's internal control over financial reporting as of September 30, 20132015 has been audited by PricewaterhouseCoopers LLP, an independent registered public accounting firm, as statedrestated in their report which is included herein.
Management’sManagement's Certifications
The certifications of the Company’sCompany's Chief Executive Officer and Chief Financial Officer required by the Sarbanes-Oxley Act have been included as Exhibits 31 and 32 in the Company’sthis Annual Report on Form 10-K.
REPORT OF INDEPENDENT REGISTERED PUBLIC ACCOUNTING FIRM
To the Shareholders and Board of Directors of Matthews International Corporation:
In our opinion, the consolidated financial statements listed in the accompanying index present fairly, in all material respects, the financial position of Matthews International Corporation and its subsidiaries at September 30, 20132015 and 2012,2014, and the results of their operations and their cash flows for each of the three years in the period ended September 30, 20132015 in conformity with accounting principles generally accepted in the United States of America. In addition, in our opinion, the financial statement schedule listed in the accompanying index presents fairly, in all material respects, the information set forth therein when read in conjunction with the related consolidated financial statements. Also in our opinion, the Company maintained, in all material respects, effective internal control over financial reporting as of September 30, 2013,2015, based on criteria established in Internal Control - Integrated Framework (2013) issued by the Committee of Sponsoring Organizations of the Treadway Commission (COSO). The Company's management is responsible for these financial statements and financial statement schedule, for maintaining effective internal control over financial reporting and for its assessment of the effectiveness of internal control over financial reporting included in Management's Report on Internal Control over Financial Reporting appearing under Item 8. Our responsibility is to express opinions on these financial statements, on the financial statement schedule, and on the Company's internal control over financial reporting based on our integrated audits. We conducted our audits in accordance with the standards of the Public Company Accounting Oversight Board (United States). Those standards require that we plan and perform the audits to obtain reasonable assurance about whether the financial statements are free of material misstatement and whether effective internal control over financial reporting was maintained in all material respects. Our audits of the financial statements included examining, on a test basis, evidence supporting the amounts and disclosures in the financial statements, assessing the accounting principles used and significant estimates made by management, and evaluating the overall financial statement presentation. Our audit of internal control over financial reporting included obtaining an understanding of internal control over financial reporting, assessing the risk that a material weakness exists, and testing and evaluating the design and operating effectiveness of internal control based on the assessed risk. Our audits also included performing such other procedures as we considered necessary in the circumstances. We believe that our audits provide a reasonable basis for our opinions.
A company’scompany's internal control over financial reporting is a process designed to provide reasonable assurance regarding the reliability of financial reporting and the preparation of financial statements for external purposes in accordance with generally accepted accounting principles. A company’scompany's internal control over financial reporting includes those policies and procedures that (i) pertain to the maintenance of records that, in reasonable detail, accurately and fairly reflect the transactions and dispositions of the assets of the company; (ii) provide reasonable assurance that transactions are recorded as necessary to permit preparation of financial statements in accordance with generally accepted accounting principles, and that receipts and expenditures of the company are being made only in accordance with authorizations of management and directors of the company; and (iii) provide reasonable assurance regarding prevention or timely detection of unauthorized acquisition, use, or disposition of the company’scompany's assets that could have a material effect on the financial statements.
Because of its inherent limitations, internal control over financial reporting may not prevent or detect misstatements. Also, projections of any evaluation of effectiveness to future periods are subject to the risk that controls may become inadequate because of changes in conditions, or that the degree of compliance with the policies or procedures may deteriorate.
REPORT OF INDEPENDENT REGISTERED PUBLIC ACCOUNTING FIRM (continued)
As described in “Management’sManagement's Report to Shareholders”,on Internal Control over Financial Reporting, management has excluded Wetzel Holding AG, Wetzel GmbH and certain related affiliates (collectively, "Wetzel"Aurora Products Group LLC ("Aurora") from its assessment of internal control over financial reporting as of September 30, 20132015 because it was acquired by the Company in a purchase business combination in November 2012.August 2015. We have also excluded WetzelAurora from our audit of internal control over financial reporting. WetzelAurora is a 100% owned subsidiary whose total assets and total sales represent approximately 6%4% and 4%1%, respectively, of the related consolidated financial statement amounts of the Company as of and for the year ended September 30, 2013.
As described in “Management’s Report to Shareholders”, management has excluded Pyramid Controls, Inc. and its affiliate, Pyramid Control Systems (collectively, "Pyramid") from its assessment of internal control over financial reporting as of September 30, 2013 because Pyramid’s assets were acquired by the Company in a purchase business combination in December 2012. We have also excluded Pyramid from our audit of internal control over financial reporting. Pyramid’s total assets and total sales represent approximately 3% and 2%, respectively, of the related consolidated financial statement amounts of the Company as of and for the year ended September 30, 2013.2015.
/s/PricewaterhouseCoopers LLP
Pittsburgh, Pennsylvania November 27, 2013
24, 2015
MATTHEWS INTERNATIONAL CORPORATION AND SUBSIDIARIES CONSOLIDATED BALANCE SHEETS September 30, 20132015 and 20122014 (Dollar amounts in thousands, except per share data)
| ASSETS | | 2013 | | | 2012 | | | 2015 | | | 2014 | | | Current assets: | | | | | | | | | | | | | | Cash and cash equivalents | | $ | 57,986 | | | $ | 58,259 | | | $ | 72,196 | | | $ | 63,003 | | Accounts receivable, net of allowance for doubtful accounts of $10,009 and $11,177, respectively | | | 188,405 | | | | 174,632 | | | Accounts receivable, net of allowance for doubtful accounts of $10,015 and $10,937, respectively | | | | 283,963 | | | | 282,730 | | | Inventories | | | 130,768 | | | | 130,690 | | | | 171,423 | | | | 152,842 | | | Deferred income taxes | | | 9,826 | | | | 9,814 | | | | 19,753 | | | | 18,197 | | | Other current assets | | | 18,997 | | | | 19,950 | | | | 77,319 | | | | 49,456 | | | | | | | | | | | | | | | | | | | | | Total current assets | | | 405,982 | | | | 393,345 | | | | 624,654 | | | | 566,228 | | | | | | | | | | | | | | | | | | | | | Investments | | | 22,288 | | | | 18,842 | | | | 25,517 | | | | 23,130 | | | | | | | | | | | | | | | | | | | | | Property, plant and equipment, net | | | 180,731 | | | | 144,049 | | | | 227,408 | | | | 209,315 | | | | | | | | | | | | | | | | | | | | | Deferred income taxes | | | 1,871 | | | | 24,527 | | | | 938 | | | | 4,019 | | | | | | | | | | | | | | | | | | | | | Other assets | | | 14,402 | | | | 12,083 | | | | 13,773 | | | | 20,027 | | | | | | | | | | | | | | | | | | | | | Goodwill | | | 524,551 | | | | 476,181 | | | | 855,728 | | | | 819,467 | | | | | | | | | | | | | | | | | | | | | Other intangible assets, net | | | 65,102 | | | | 59,015 | | | | 415,000 | | | | 381,862 | | | | | | | | | | | | | | | | | | | | | Total assets | | $ | 1,214,927 | | | $ | 1,128,042 | | | $ | 2,163,018 | | | $ | 2,024,048 | |
The accompanying notes are an integral part of these consolidated financial statements.
MATTHEWS INTERNATIONAL CORPORATION AND SUBSIDIARIES CONSOLIDATED BALANCE SHEETS, continued September 30, 20132015 and 20122014 (Dollar amounts in thousands, except per share data)
| LIABILITIES AND SHAREHOLDERS' EQUITY | | 2013 | | | 2012 | | | 2015 | | | 2014 | | | Current liabilities: | | | | | | | | | | | | | | Long-term debt, current maturities | | $ | 22,614 | | | $ | 21,566 | | | $ | 11,737 | | | $ | 15,228 | | | Trade accounts payable | | | 45,232 | | | | 44,294 | | | | 68,896 | | | | 72,040 | | | Accrued compensation | | | 41,916 | | | | 30,222 | | | | 63,931 | | | | 60,690 | | | Accrued income taxes | | | 5,910 | | | | 7,632 | | | | 11,448 | | | | 7,079 | | | Customer prepayments | | | 13,531 | | | | 15,883 | | | | Contingent consideration | | | 3,726 | | | | 13,298 | | | | Deferred income taxes | | | | 340 | | | | 235 | | | Other current liabilities | | | 51,077 | | | | 47,978 | | | | 92,731 | | | | 98,011 | | | Total current liabilities | | | 184,006 | | | | 180,873 | | | | 249,083 | | | | 253,283 | | | | | | | | | | | | | | | | | | | | | Long-term debt | | | 351,068 | | | | 298,148 | | | | 891,217 | | | | 714,027 | | | | | | | | | | | | | | | | | | | | | Accrued pension | | | 61,642 | | | | 78,563 | | | | 95,753 | | | | 78,550 | | | | | | | | | | | | | | | | | | | | | Postretirement benefits | | | 17,956 | | | | 27,725 | | | | 19,415 | | | | 20,351 | | | | | | | | | | | | | | | | | | | | | Deferred income taxes | | | 20,332 | | | | 18,624 | | | | 144,365 | | | | 129,335 | | | | | | | | | | | | | | | | | | | | | Other liabilities | | | 26,993 | | | | 33,194 | | | | 29,139 | | | | 53,296 | | | Total liabilities | | | 661,997 | | | | 637,127 | | | | 1,428,972 | | | | 1,248,842 | | | | | | | | | | | | | | | | | | | | | Arrangement with noncontrolling interest | | | - | | | | 10,481 | | | | | | | | | | | | | | | Commitments and contingencies | | | | | | | | | | | | | | | | | | | | | | Shareholders' equity-Matthews: | | | | | | | | | | | | | | | | | Class A common stock, $1.00 par value; authorized 70,000,000 shares; 36,333,992 shares issued | | | 36,334 | | | | 36,334 | | | | 36,334 | | | | 36,334 | | | Preferred stock, $100 par value, authorized 10,000 shares, none issued | | | - | | | | - | | | | - | | | | - | | | Additional paid-in capital | | | 47,315 | | | | 47,893 | | | | 115,890 | | | | 113,225 | | | Retained earnings | | | 775,762 | | | | 727,176 | | | | 843,955 | | | | 798,353 | | | Accumulated other comprehensive loss | | | (26,940 | ) | | | (65,083 | ) | | | (150,326 | ) | | | (66,817 | ) | | Treasury stock, 9,083,910 and 8,711,924 shares, respectively, at cost | | | (283,006 | ) | | | (268,499 | ) | | | Treasury stock, 3,458,925 and 3,454,127 shares, respectively, at cost | | | | (115,033 | ) | | | (109,950 | ) | | Total shareholders' equity-Matthews | | | 549,465 | | | | 477,821 | | | | 730,820 | | | | 771,145 | | | Noncontrolling interests | | | 3,465 | | | | 2,613 | | | | 3,226 | | | | 4,061 | | | Total shareholders' equity | | | 552,930 | | | | 480,434 | | | | 734,046 | | | | 775,206 | | | | | | | | | | | | | | | | | | | | | Total liabilities and shareholders' equity | | $ | 1,214,927 | | | $ | 1,128,042 | | | $ | 2,163,018 | | | $ | 2,024,048 | |
The accompanying notes are an integral part of these consolidated financial statements.
MATTHEWS INTERNATIONAL CORPORATION AND SUBSIDIARIES CONSOLIDATED STATEMENTS OF INCOME for the years ended September 30, 2013, 20122015, 2014 and 20112013 (Dollar amounts in thousands, except per share data)
| | | 2013 | | | 2012 | | | 2011 | | | 2015 | | | 2014 | | | 2013 | | | Sales | | $ | 985,357 | | | $ | 900,317 | | | $ | 898,821 | | | $ | 1,426,068 | | | $ | 1,106,597 | | | $ | 985,357 | | | Cost of sales | | | (628,839 | ) | | | (563,747 | ) | | | (547,161 | ) | | | (896,693 | ) | | | (714,101 | ) | | | (628,839 | ) | | | | | | | | | | | | | | | | | | | | | | | | | | | | Gross profit | | | 356,518 | | | | 336,570 | | | | 351,660 | | | | 529,375 | | | | 392,496 | | | | 356,518 | | | | | | | | | | | | | | | | | | | | | | | | | | | | | Selling expense | | | (105,963 | ) | | | (103,659 | ) | | | (99,251 | ) | | | (143,299 | ) | | | (119,274 | ) | | | (107,140 | ) | | Administrative expense | | | (154,763 | ) | | | (139,334 | ) | | | (133,893 | ) | | | (281,053 | ) | | | (191,700 | ) | | | (154,763 | ) | | | | | | | | | | | | | | | | | | | | | | | | | | | | Operating profit | | | 95,792 | | | | 93,577 | | | | 118,516 | | | | 105,023 | | | | 81,522 | | | | 94,615 | | | | | | | | | | | | | | | | | | | | | | | | | | | | | Investment income | | | 2,284 | | | | 3,891 | | | | 1,443 | | | | 175 | | | | 2,063 | | | | 2,284 | | | Interest expense | | | (12,925 | ) | | | (11,476 | ) | | | (8,241 | ) | | | (20,610 | ) | | | (12,628 | ) | | | (12,925 | ) | | Other income (deductions), net | | | (3,715 | ) | | | (2,071 | ) | | | 298 | | | | 5,064 | | | | (4,881 | ) | | | (3,795 | ) | | | | | | | | | | | | | | | | | | | | | | | | | | | | Income before income taxes | | | 81,436 | | | | 83,921 | | | | 112,016 | | | | 89,652 | | | | 66,076 | | | | 80,179 | | | | | | | | | | | | | | | | | | | | | | | | | | | | | Income taxes | | | (26,664 | ) | | | (28,717 | ) | | | (38,556 | ) | | | (26,364 | ) | | | (22,805 | ) | | | (26,174 | ) | | | | | | | | | | | | | | | | | | | | | | | | | | | | Net income | | | 54,772 | | | | 55,204 | | | | 73,460 | | | | 63,288 | | | | 43,271 | | | | 54,005 | | | | | | | | | | | | | | | | | | | | | | | | | | | | | Net (income) loss attributable to noncontrolling interests | | | 116 | | | | 639 | | | | (1,088 | ) | | | 161 | | | | (646 | ) | | | 116 | | | | | | | | | | | | | | | | | | | | | | | | | | | | | Net income attributable to Matthews shareholders | | $ | 54,888 | | | $ | 55,843 | | | $ | 72,372 | | | $ | 63,449 | | | $ | 42,625 | | | $ | 54,121 | | | | | | | | | | | | | | | | | | | | | | | | | | | | | Earnings per share attributable to Matthews shareholders: | | | | | | | | | | | | | | | | | | | | | | | | | | | | | | | | | | | | | | | | | | | | | | | | | | | | Basic | | | $1.99 | | | | $1.98 | | | | $2.47 | | | | $1.93 | | | | $1.51 | | | | $1.96 | | | | | | | | | | | | | | | | | | | | | | | | | | | | | Diluted | | | $1.98 | | | | $1.98 | | | | $2.46 | | | | $1.91 | | | | $1.49 | | | | $1.95 | |
The accompanying notes are an integral part of these consolidated financial statements.
MATTHEWS INTERNATIONAL CORPORATION AND SUBSIDIARIES CONSOLIDATED STATEMENTS OF COMPREHENSIVE INCOME for the years ended September 30, 2013, 20122015, 2014 and 20112013 (Dollar amounts in thousands, except per share data)
| | | Year Ended September 30, 2011 | | | Year Ended September 30, 2015 | | | | | Matthews | | | Noncontrolling Interest | | | Total | | | Matthews | | | Noncontrolling Interest | | | Total | | | | | | | | | | | | | | | | | | | | | | | Net income (loss) | | $ | 72,372 | | | $ | 1,088 | | | $ | 73,460 | | | $ | 63,449 | | | $ | (161 | ) | | $ | 63,288 | | | Other comprehensive income (loss), net of tax: | | | | | | | | | | | | | | | | | | | | | | | | | | Foreign currency translation adjustment | | | (8,607 | ) | | | 523 | | | | (8,084 | ) | | | (77,237 | ) | | | (150 | ) | | | (77,387 | ) | | Pension plans and other postretirement benefits | | | (11,255 | ) | | | - | | | | (11,255 | ) | | | (3,823 | ) | | | - | | | | (3,823 | ) | | Unrecognized gain (loss) on derivatives: | | | | | | | | | | | | | | | | | | | | | | | | | | Net change from periodic revaluation | | | (3,246 | ) | | | - | | | | (3,246 | ) | | | (4,841 | ) | | | - | | | | (4,841 | ) | | Net amount reclassified to earnings | | | 1,586 | | | | - | | | | 1,586 | | | | 2,392 | | | | - | | | | 2,392 | | Net change in unrecognized gain (loss) on derivatives | | | (1,660 | ) | | | - | | | | (1,660 | ) | | Net change in unrecognized gain (loss) on Derivatives | | | | (2,449 | ) | | | - | | | | (2,449 | ) | | Other comprehensive income (loss), net of tax | | | (21,522 | ) | | | 523 | | | | (20,999 | ) | | | (83,509 | ) | | | (150 | | | | (83,659 | ) | | Comprehensive income (loss) | | $ | 50,850 | | | $ | 1,611 | | | $ | 52,461 | | | $ | (20,060 | ) | | $ | (311 | ) | | $ | (20,371 | ) | | | | | | | | | | | | | | | | | | | | | | | | | | | | | | Year Ended September 30, 2012 | | | Year Ended September 30, 2014 | | | | | Matthews | | | Noncontrolling Interest | | | Total | | | Matthews | | | Noncontrolling Interest | | | Total | | | | | | | | | | | | | | | | | | | | | | | | | | | | | Net income (loss) | | $ | 55,843 | | | $ | (639 | ) | | $ | 55,204 | | | $ | 42,625 | | | $ | 646 | | | $ | 43,271 | | | Other comprehensive income (loss), net of tax: | | | | | | | | | | | | | | | | | | | | | | | | | | Foreign currency translation adjustment | | | (1,895 | ) | | | (29 | ) | | | (1,924 | ) | | | (31,081 | ) | | | 115 | | | | (30,966 | ) | | Pension plans and other postretirement benefits | | | (3,327 | ) | | | - | | | | (3,327 | ) | | | (9,551 | ) | | | - | | | | (9,551 | ) | | Unrecognized gain (loss) on derivatives: | | | | | | | | | | | | | | | | | | | | | | | | | | Net change from periodic revaluation | | | (3,288 | ) | | | - | | | | (3,288 | ) | | | (1,879 | ) | | | - | | | | (1,879 | ) | | Net amount reclassified to earnings | | | 2,085 | | | | - | | | | 2,085 | | | | 2,634 | | | | - | | | | 2,634 | | Net change in unrecognized gain (loss) on derivatives | | | (1,203 | ) | | | - | | | | (1,203 | ) | | | 755 | | | | - | | | | 755 | | | Other comprehensive income (loss), net of tax | | | (6,425 | ) | | | (29 | ) | | | (6,454 | ) | | | (39,877 | ) | | | 115 | | | | (39,762 | ) | | Comprehensive income (loss) | | $ | 49,418 | | | $ | (668 | ) | | $ | 48,750 | | | $ | 2,748 | | | $ | 761 | | | $ | 3,509 | | | | | | | | | | | | | | | | | | | | | | | | | | | | | | | Year Ended September 30, 2013 | | | Year Ended September 30, 2013 | | | | | Matthews | | | Noncontrolling Interest | | | Total | | | Matthews | | | Noncontrolling Interest | | | Total | | | | | | | | | | | | | | | | | | | | | | | | | | | | | Net income (loss) | | $ | 54,888 | | | $ | (116 | ) | | $ | 54,772 | | | $ | 54,121 | | | $ | (116 | ) | | $ | 54,005 | | | Other comprehensive income (loss), net of tax: | | | | | | | | | | | | | | | | | | | | | | | | | | Foreign currency translation adjustment | | | 3,779 | | | | 82 | | | | 3,861 | | | | 3,779 | | | | 82 | | | | 3,861 | | | Pension plans and other postretirement benefits | | | 29,347 | | | | - | | | | 29,347 | | | | 29,347 | | | | - | | | | 29,347 | | | Unrecognized gain (loss) on derivatives: | | | | | | | | | | | | | | | | | | | | | | | | | | Net change from periodic revaluation | | | 2,474 | | | | - | | | | 2,474 | | | | 2,474 | | | | - | | | | 2,474 | | | Net amount reclassified to earnings | | | 2,543 | | | | - | | | | 2,543 | | | | 2,543 | | | | - | | | | 2,543 | | Net change in unrecognized gain (loss) on derivatives | | | 5,017 | | | | - | | | | 5,017 | | | | 5,017 | | | | - | | | | 5,017 | | | Other comprehensive income (loss), net of tax | | | 38,143 | | | | 82 | | | | 38,225 | | | | 38,143 | | | | 82 | | | | 38,225 | | | Comprehensive income (loss) | | $ | 93,031 | | | $ | (34 | ) | | $ | 92,997 | | | $ | 92,264 | | | $ | (34 | ) | | $ | 92,230 | | | | | | | | | | | | | | | | | | | | | | | | | | | |
The accompanying notes are an integral part of these consolidated financial statements.
MATTHEWS INTERNATIONAL CORPORATION AND SUBSIDIARIES CONSOLIDATED STATEMENTS OF SHAREHOLDERS' EQUITY for the years ended September 30, 2013, 20122015, 2014 and 20112013 (Dollar amounts in thousands, except per share data)
| | | | | | | | | | | | Accumulated | | | | | | | | | | | | | | | | | | | | | Accumulated | | | | | | | | | | | | | | | | | | | | | | | Other | | | | | | | | | | | | | | | | | | | | | Other | | | | | | | | | | | | | | | | | Additional | | | | | | Comprehensive | | | | | | Non- | | | | | | | | | Additional | | | | | | Comprehensive | | | | | | Non- | | | | | | | | Common | | | Paid-in | | | Retained | | | Income (Loss) | | | Treasury | | | controlling | | | | | | Common | | | Paid-in | | | Retained | | | Income (Loss) | | | Treasury | | | controlling | | | | | | | | Stock | | | Capital | | | Earnings | | | (net of tax) | | | Stock | | | interests | | | Total | | | Stock | | | Capital | | | Earnings | | | (net of tax) | | | Stock | | | interests | | | Total | | | Balance, September 30, 2010 | | $ | 36,334 | | | $ | 48,294 | | | $ | 621,923 | | | $ | (37,136 | ) | | $ | (207,470 | ) | | $ | 31,783 | | | $ | 493,728 | | | | Net income | | | - | | | | - | | | | 72,372 | | | | - | | | | - | | | | 1,088 | | | | 73,460 | | | | Minimum pension liability | | | - | | | | - | | | | - | | | | (11,255 | ) | | | - | | | | - | | | | (11,255 | ) | | | Translation adjustment | | | - | | | | - | | | | - | | | | (8,607 | ) | | | - | | | | 523 | | | | (8,084 | ) | | | Fair value of derivatives | | | - | | | | - | | | | - | | | | (1,660 | ) | | | - | | | | - | | | | (1,660 | ) | | | Total comprehensive income | | | | | | | | | | | | | | | | | | | | | | | | | | | 52,461 | | | | Stock-based compensation | | | - | | | | 6,972 | | | | - | | | | - | | | | - | | | | - | | | | 6,972 | | | Purchase of 1,319,375 shares treasury stock | | | - | | | | - | | | | - | | | | - | | | | (44,567 | ) | | | - | | | | (44,567 | ) | | Issuance of 290,854 shares treasury stock | | | - | | | | (6,712 | ) | | | - | | | | - | | | | 8,791 | | | | - | | | | 2,079 | | | | Dividends, $.33 per share | | | - | | | | - | | | | (9,632 | ) | | | - | | | | - | | | | - | | | | (9,632 | ) | | | Distribution to noncontrolling interests | | | - | | | | - | | | | - | | | | - | | | | - | | | | (6,220 | ) | | | (6,220 | ) | | | Arrangement-noncontrolling interest | | | - | | | | - | | | | (3,005 | ) | | | - | | | | - | | | | (23,723 | ) | | | (26,728 | ) | | | Balance, September 30, 2011 | | | 36,334 | | | | 48,554 | | | | 681,658 | | | | (58,658 | ) | | | (243,246 | ) | | | 3,451 | | | | 468,093 | | | | Net income | | | - | | | | - | | | | 55,843 | | | | - | | | | - | | | | (639 | ) | | | 55,204 | | | | Minimum pension liability | | | - | | | | - | | | | - | | | | (3,327 | ) | | | - | | | | - | | | | (3,327 | ) | | | Translation adjustment | | | - | | | | - | | | | - | | | | (1,895 | ) | | | - | | | | (29 | ) | | | (1,924 | ) | | | Fair value of derivatives | | | - | | | | - | | | | - | | | | (1,203 | ) | | | - | | | | - | | | | (1,203 | ) | | | Total comprehensive income | | | | | | | | | | | | | | | | | | | | | | | | | | | 48,750 | | | | Stock-based compensation | | | - | | | | 5,472 | | | | - | | | | - | | | | - | | | | - | | | | 5,472 | | | Purchase of 1,015,879 shares treasury stock | | | - | | | | - | | | | - | | | | - | | | | (31,017 | ) | | | - | | | | (31,017 | ) | | Issuance of 188,145 shares treasury stock | | | - | | | | (6,133 | ) | | | - | | | | - | | | | 5,764 | | | | - | | | | (369 | ) | | | Dividends, $.37 per share | | | - | | | | - | | | | (10,325 | ) | | | - | | | | - | | | | - | | | | (10,325 | ) | | | Distribution to noncontrolling interests | | | - | | | | - | | | | - | | | | - | | | | - | | | | (170 | ) | | | (170 | ) | | | Balance, September 30, 2012 | | | 36,334 | | | | 47,893 | | | | 727,176 | | | | (65,083 | ) | | | (268,499 | ) | | | 2,613 | | | | 480,434 | | | $ | 36,334 | | | $ | 47,893 | | | $ | 721,305 | | | $ | (65,083 | ) | | $ | (268,499 | ) | | $ | 2,613 | | | $ | 474,563 | | | Net income | | | - | | | | - | | | | 54,888 | | | | - | | | | - | | | | (116 | ) | | | 54,772 | | | | - | | | | - | | | | 54,121 | | | | - | | | | - | | | | (116 | ) | | | 54,005 | | | Minimum pension liability | | | - | | | | - | | | | - | | | | 29,347 | | | | - | | | | - | | | | 29,347 | | | | - | | | | - | | | | - | | | | 29,347 | | | | - | | | | - | | | | 29,347 | | | Translation adjustment | | | - | | | | - | | | | - | | | | 3,779 | | | | - | | | | 82 | | | | 3,861 | | | | - | | | | - | | | | - | | | | 3,779 | | | | - | | | | 82 | | | | 3,861 | | | Fair value of derivatives | | | - | | | | - | | | | - | | | | 5,017 | | | | - | | | | - | | | | 5,017 | | | | - | | | | - | | | | - | | | | 5,017 | | | | - | | | | - | | | | 5,017 | | | Total comprehensive income | | | | | | | | | | | | | | | | | | | | | | | | | | | 92,997 | | | | | | | | | | | | | | | | | | | | | | | | | | | | 92,230 | | | Stock-based compensation | | | - | | | | 5,562 | | | | - | | | | - | | | | - | | | | - | | | | 5,562 | | | | - | | | | 5,562 | | | | - | | | | - | | | | - | | | | - | | | | 5,562 | | Purchase of 619,981 shares treasury stock | | | - | | | | - | | | | - | | | | - | | | | (21,622 | ) | | | - | | | | (21,622 | ) | | Issuance of 247,995 shares treasury stock | | | - | | | | (6,140 | ) | | | - | | | | - | | | | 7,115 | | | | - | | | | 975 | | | | Purchase of 619,981 shares | | | | | | | | | | | | | | | | | | | | | | | | | | | | | | | of treasury stock | | | | - | | | | - | | | | - | | | | - | | | | (21,622 | ) | | | - | | | | (21,622 | ) | Issuance of 295,079 shares
of treasury stock | | | | - | | | | (8,125 | ) | | | - | | | | - | | | | 9,100 | | | | - | | | | 975 | | | Cancellations of 47,084 shares | | | | | | | | | | | | | | | | | | | | | | | | | | | | | | | of treasury stock | | | | - | | | | 1,985 | | | | - | | | | - | | | | (1,985 | ) | | | - | | | | - | | | Dividends, $.41 per share | | | - | | | | - | | | | (11,282 | ) | | | - | | | | - | | | | - | | | | (11,282 | ) | | | - | | | | - | | | | (11,282 | ) | | | - | | | | - | | | | - | | | | (11,282 | ) | | Distribution to noncontrolling interests | | | - | | | | - | | | | - | | | | - | | | | - | | | | (767 | ) | | | (767 | ) | | | - | | | | - | | | | - | | | | - | | | | - | | | | (767 | ) | | | (767 | ) | | Arrangement-noncontrolling interest | | | - | | | | - | | | | 4,980 | | | | - | | | | - | | | | 1,653 | | | | 6,633 | | | | - | | | | - | | | | 4,980 | | | | - | | | | - | | | | 1,653 | | | | 6,633 | | | Balance, September 30, 2013 | | $ | 36,334 | | | $ | 47,315 | | | $ | 775,762 | | | $ | (26,940 | ) | | $ | (283,006 | ) | | $ | 3,465 | | | $ | 552,930 | | | | 36,334 | | | | 47,315 | | | | 769,124 | | | | (26,940 | ) | | | (283,006 | ) | | | 3,465 | | | | 546,292 | | | Net income | | | | - | | | | - | | | | 42,625 | | | | - | | | | - | | | | 646 | | | | 43,271 | | | Minimum pension liability | | | | - | | | | - | | | | - | | | | (9,551 | ) | | | - | | | | - | | | | (9,551 | ) | | Translation adjustment | | | | - | | | | - | | | | - | | | | (31,081 | ) | | | - | | | | 115 | | | | (30,966 | ) | | Fair value of derivatives | | | | - | | | | - | | | | - | | | | 755 | | | | - | | | | - | | | | 755 | | | Total comprehensive income | | | | | | | | | | | | | | | | | | | | | | | | | | | | 3,509 | | | Stock-based compensation | | | | - | | | | 6,812 | | | | - | | | | - | | | | - | | | | - | | | | 6,812 | | Purchase of 228,789 shares
of treasury stock | | | | - | | | | - | | | | - | | | | - | | | | (9,905 | ) | | | - | | | | (9,905 | ) | Issuance of 5,936,169 shares
of treasury stock | | | | - | | | | 55,942 | | | | - | | | | - | | | | 186,117 | | | | - | | | | 242,059 | | | Cancellations of 77,597 shares | | | | | | | | | | | | | | | | | | | | | | | | | | | | | | | of treasury stock | | | | - | | | | 3,156 | | | | - | | | | - | | | | (3,156 | ) | | | - | | | | - | | | Dividends, $.46 per share | | | | - | | | | - | | | | (13,396 | ) | | | - | | | | - | | | | - | | | | (13,396 | ) | | Distribution to noncontrolling interests | | | | - | | | | - | | | | - | | | | - | | | | - | | | | (165 | ) | | | (165 | ) | | Balance, September 30, 2014 | | | | 36,334 | | | | 113,225 | | | | 798,353 | | | | (66,817 | ) | | | (109,950 | ) | | | 4,061 | | | | 775,206 | | | Net income | | | | - | | | | - | | | | 63,449 | | | | - | | | | - | | | | (161 | ) | | | 63,288 | | | Minimum pension liability | | | | - | | | | - | | | | - | | | | (3,823 | ) | | | - | | | | - | | | | (3,823 | ) | | Translation adjustment | | | | - | | | | - | | | | - | | | | (77,237 | ) | | | - | | | | (150 | ) | | | (77,387 | ) | | Fair value of derivatives | | | | - | | | | - | | | | - | | | | (2,449 | ) | | | - | | | | - | | | | (2,449 | ) | | Total comprehensive income | | | | | | | | | | | | | | | | | | | | | | | | | | | | (20,371 | ) | | Stock-based compensation | | | | - | | | | 9,097 | | | | - | | | | - | | | | - | | | | - | | | | 9,097 | | Purchase of 304,859 shares
of treasury stock | | | | - | | | | - | | | | - | | | | - | | | | (14,567 | ) | | | - | | | | (14,567 | ) | Issuance of 334,850 shares
of treasury stock | | | | - | | | | (7,336 | ) | | | - | | | | - | | | | 10,768 | | | | - | | | | 3,432 | | | Cancellations of 34,789 shares | | | | | | | | | | | | | | | | | | | | | | | | | | | | | | | of treasury stock | | | | | | | | 1,284 | | | | - | | | | - | | | | (1,284 | ) | | | - | | | | - | | | Dividends, $.54 per share | | | | - | | | | - | | | | (17,847 | ) | | | - | | | | - | | | | - | | | | (17,847 | ) | | Distribution to noncontrolling interests | | | | - | | | | - | | | | - | | | | - | | | | - | | | | (95 | ) | | | (95 | ) | | Acquisition of noncontrolling interests | | | | - | | | | (380 | ) | | | - | | | | - | | | | - | | | | (429 | ) | | | (809 | ) | | Balance, September 30, 2015 | | | $ | 36,334 | | | $ | 115,890 | | | $ | 843,955 | | | $ | (150,326 | ) | | $ | (115,033 | ) | | $ | 3,226 | | | $ | 734,046 | |
The accompanying notes are an integral part of these consolidated financial statements.
MATTHEWS INTERNATIONAL CORPORATION AND SUBSIDIARIES CONSOLIDATED STATEMENTS OF CASH FLOWS for the years ended September 30, 2013, 20122015, 2014 and 20112013 (Dollar amounts in thousands, except per share data)
| | | 2013 | | | 2012 | | | 2011 | | | 2015 | | | 2014 | | | 2013 | | | Cash flows from operating activities: | | | | | | | | | | | | | | | | | | | | Net income | | $ | 54,772 | | | $ | 55,204 | | | $ | 73,460 | | | $ | 63,288 | | | $ | 43,271 | | | $ | 54,005 | | Adjustments to reconcile net income to net cash provided by operating activities: | | | | | | | | | | | | | | | | | | | | | | | | | | Depreciation and amortization | | | 37,865 | | | | 28,821 | | | | 27,661 | | | | 62,620 | | | | 42,864 | | | | 37,865 | | | Stock-based compensation expense | | | 5,562 | | | | 5,472 | | | | 6,972 | | | | 9,097 | | | | 6,812 | | | | 5,562 | | | Increase in deferred taxes | | | 3,812 | | | | 6,050 | | | | 9,481 | | | | Change in deferred taxes | | | | 9,188 | | | | 5,222 | | | | 3,322 | | | Gain on sale of assets | | | (2,013 | ) | | | (5,257 | ) | | | (2,832 | ) | | | (276 | ) | | | (228 | ) | | | (347 | ) | | Unrealized loss (gain) on investments | | | | 377 | | | | (1,064 | ) | | | (1,666 | ) | | Trade name write-offs | | | | 4,842 | | | | - | | | | - | | | Changes in working capital items | | | (5,808 | ) | | | (16,403 | ) | | | (23,093 | ) | | | (2,751 | ) | | | (6,165 | ) | | | (3,003 | ) | | Decrease in other assets | | | 1,628 | | | | 4,456 | | | | 4,787 | | | | 4,064 | | | | 944 | | | | 1,628 | | | Increase (decrease) in other liabilities | | | 5,594 | | | | (3,854 | ) | | | (2,007 | ) | | | (Decrease) increase in other liabilities | | | | (8,041 | ) | | | (3,568 | ) | | | 2,789 | | Increase in pension and postretirement benefit obligations | | | 11,839 | | | | 7,634 | | | | 1,135 | | | | 8,652 | | | | 3,755 | | | | 11,839 | | | Other, net | | | (3,925 | ) | | | 1,203 | | | | 2,267 | | | | (9,996 | ) | | | (1,164 | ) | | | (3,925 | ) | | Net cash provided by operating activities | | | 109,326 | | | | 83,326 | | | | 97,831 | | | | 141,064 | | | | 90,679 | | | | 108,069 | | | Cash flows from investing activities: | | | | | | | | | | | | | | | | | | | | | | | | | | Capital expenditures | | | (24,924 | ) | | | (33,236 | ) | | | (22,440 | ) | | | (48,251 | ) | | | (29,237 | ) | | | (24,924 | ) | | Acquisitions, net of cash acquired | | | (73,959 | ) | | | (12,541 | ) | | | (84,369 | ) | | | (213,470 | ) | | | (382,104 | ) | | | (73,959 | ) | | Proceeds from sale of assets | | | 252 | | | | 1,461 | | | | 1,463 | | | | 1,062 | | | | 262 | | | | 252 | | | Purchases of investment securities | | | - | | | | (958 | ) | | | (1,639 | ) | | | Proceeds from dispositions of investments | | | - | | | | - | | | | 169 | | | | Proceeds from sale of subsidiary | | | | 10,418 | | | | - | | | | - | | | Restricted cash | | | | (12,925 | ) | | | - | | | | - | | | Net cash used in investing activities | | | (98,631 | ) | | | (45,274 | ) | | | (106,816 | ) | | | (263,166 | ) | | | (411,079 | ) | | | (98,631 | ) | | Cash flows from financing activities: | | | | | | | | | | | | | | | | | | | | | | | | | | Proceeds from long-term debt | | | 115,509 | | | | 53,330 | | | | 117,107 | | | | 279,377 | | | | 415,709 | | | | 116,482 | | | Payments on long-term debt | | | (83,293 | ) | | | (53,056 | ) | | | (48,214 | ) | | | (100,218 | ) | | | (58,431 | ) | | | (83,293 | ) | | Payment on contingent consideration | | | (11,315 | ) | | | - | | | | - | | | | (484 | ) | | | (3,703 | ) | | | (11,315 | ) | | Purchases of treasury stock | | | (21,622 | ) | | | (31,017 | ) | | | (44,567 | ) | | | (14,567 | ) | | | (9,905 | ) | | | (21,622 | ) | | Proceeds from the sale of treasury stock | | | 974 | | | | 267 | | | | 1,929 | | | | 4,015 | | | | 7,951 | | | | 974 | | | Dividends | | | (11,282 | ) | | | (10,325 | ) | | | (9,632 | ) | | | (17,847 | ) | | | (13,396 | ) | | | (11,282 | ) | | Distributions to noncontrolling interests | | | (767 | ) | | | (170 | ) | | | (6,220 | ) | | | Net cash (used in) provided by financing activities | | | (11,796 | ) | | | (40,971 | ) | | | 10,403 | | | | Transactions with noncontrolling interests | | | | (904 | ) | | | (165 | ) | | | (767 | ) | | Settlement of multi-employer pension plan obligation | | | | (18,157 | ) | | | - | | | | - | | | Net cash provided by (used in) financing activities | | | | 131,215 | | | | 338,060 | | | | (10,823 | ) | | Effect of exchange rate changes on cash | | | 828 | | | | (484 | ) | | | (866 | ) | | | 80 | | | | (2,735 | ) | | | 828 | | | Net change in cash and cash equivalents | | | (273 | ) | | | (3,403 | ) | | | 552 | | | | 9,193 | | | | 14,925 | | | | (557 | ) | | Cash and cash equivalents at beginning of year | | | 58,259 | | | | 61,662 | | | | 61,110 | | | | 63,003 | | | | 48,078 | | | | 48,635 | | | Cash and cash equivalents at end of year | | $ | 57,986 | | | $ | 58,259 | | | $ | 61,662 | | | $ | 72,196 | | | $ | 63,003 | | | $ | 48,078 | | | | | | | | | | | | | | | | | | | | | | | | | | | | | Cash paid during the year for: | | | | | | | | | | | | | | | | | | | | | | | | | | Interest | | $ | 13,059 | | | $ | 11,464 | | | $ | 8,367 | | | $ | 19,663 | | | $ | 12,570 | | | $ | 13,059 | | | Income taxes | | | 29,428 | | | | 22,765 | | | | 35,359 | | | | 11,663 | | | | 16,177 | | | | 29,428 | | | | | | | | | | | | | | | | | | | | | | | | | | | | | Non-cash investing and financing activities: | | | | | | | | | | | | | | | | | | | | | | | | | | Acquisition of equipment under capital lease | | $ | 1,276 | | | $ | 1,125 | | | $ | 2,764 | | | | - | | | $ | 949 | | | $ | 1,276 | |
The accompanying notes are an integral part of these consolidated financial statements.
MATTHEWS INTERNATIONAL CORPORATION AND SUBSIDIARIES NOTES TO CONSOLIDATED FINANCIAL STATEMENTS (Dollar amounts in thousands, except per share data)
Matthews International Corporation ("Matthews" or the “Company”"Company"), founded in 1850 and incorporated in Pennsylvania in 1902, is a designer, manufacturer and marketerprovider principally of brand solutions, memorialization products and industrial products. Brand solutions include brand solutions.development, deployment and delivery (consisting of brand management, printing plates and cylinders, pre-media services and imaging services for consumer packaged goods and retail customers, merchandising display systems, and marketing and design services). Memorialization products consist primarily of bronze and granite memorials and other memorialization products, caskets and cremation equipment for the cemetery and funeral home industries. Brand solutionsIndustrial products include graphics imaging products and services, marking and fulfillment systems and merchandising solutions. The Company's products and operations are comprised of six business segments: Cemetery Products, Funeral Home Products, Cremation, Graphics Imaging, Marking and Fulfillment Systems and Merchandising Solutions. The Cemetery Products segment is a leading manufacturer of cast bronze and granite memorials and other memorialization products, cast and etched architectural products and is a leading builder of mausoleums in the United States. The Funeral Home Products segment is a leading casket manufacturer and distributor in North America and produces a wide variety of wood, metal and cremation caskets. The Cremation segment is a leading designer and manufacturer of cremation equipment in North America and Europe. The Graphics Imaging segment manufactures and provides brand management, printing plates, gravure cylinders, pre-press services and imaging services for the primary packaging and corrugated industries. The Marking and Fulfillment Systems segment designs, manufactures and distributes a wide range of marking and coding equipment and consumables, industrial automation products and order fulfillment systems for identifying, tracking, picking and conveying consumer and industrial products. The Merchandising Solutions segment designs and manufactures merchandising displays and systems and provides creative merchandising and marketing solutions services.
The Company has manufacturingproduction and marketing facilities in the United States, Mexico,Central and South America, Canada, Europe, Australia and Asia.
| 2. | SUMMARY OF SIGNIFICANT ACCOUNTING POLICIES: |
Principles of Consolidation:
The consolidated financial statements include all domestic and foreign subsidiaries in which the Company maintains an ownership interest and has operating control. All intercompany accounts and transactions have been eliminated.
Use of Estimates:
The preparation of financial statements in conformity with generally accepted accounting principles requires management to make estimates and assumptions that affect the reported amounts of assets and liabilities and the disclosure of contingent assets and liabilities at the date of the financial statements and the reported amounts of revenues and expenses during the reporting period. Actual results could differ from those estimates.
Foreign Currency:
The functional currency of the Company’sCompany's foreign subsidiaries is the local currency. Balance sheet accounts for foreign subsidiaries are translated into U.S. dollars at exchange rates in effect at the consolidated balance sheet date. Gains or losses that result from this process are recorded in accumulated other comprehensive income (loss). The revenue and expense accounts of foreign subsidiaries are translated into U.S. dollars at the average exchange rates that prevailed during the period. GainsRealized gains and losses from foreign currency transactions are recordedpresented in otherthe Statement of income (deductions), net.
NOTES TO CONSOLIDATED FINANCIAL STATEMENTS (continued)
(Dollar amounts in thousands, except per share data)
2. | SUMMARY OF SIGNIFICANT ACCOUNTING POLICIES (continued) |
a consistent manner with the underlying transaction.
Cash and Cash Equivalents:
For purposes of the consolidated statements of cash flows, theThe Company considers all investments purchased with a remaining maturity of three months or less to be cash equivalents. The carrying amount of cash and cash equivalents approximates fair value due to the short-term maturities of these instruments.
Trade Receivables and Allowance for Doubtful Accounts:
Trade receivables are carried at their estimated collectible amounts. Trade credit is generally extended on a short-term basis; thus trade receivables do not bear interest, although a finance charge may be applied to such receivables that are more than 30 days past due. The allowance for doubtful accounts is based on an evaluation of specific customer accounts for which available facts and circumstances indicate collectibilitycollectability may be uncertain. In addition, the allowance includes a reserve for all customers based on historical collection experience.
NOTES TO CONSOLIDATED FINANCIAL STATEMENTS (continued) (Dollar amounts in thousands, except per share data)
| 2. | SUMMARY OF SIGNIFICANT ACCOUNTING POLICIES (continued) |
Inventories:
Inventories are stated at the lower of cost or market with cost generally determined under the average cost method.
Property, Plant and Equipment:
Property, plant and equipment are carried at cost. Depreciation is computed primarily on the straight-line method over the estimated useful lives of the assets, which generally range from 10 to 45 years for buildings and 3 to 12 years for machinery and equipment. Gains or losses from the disposition of assets are reflected in operating profit. The cost of maintenance and repairs is charged against income as incurred. Renewals and betterments of a nature considered to extend the useful lives of the assets are capitalized. Property, plant and equipment are reviewed for impairment whenever events or changes in circumstances indicate that the carrying amount of such assets may not be recoverable. Recoverability of assets is determined by evaluating the estimated undiscounted net cash flows of the operations to which the assets relate. An impairment loss would be recognized when the carrying amount of the assets exceeds the fair value which is based on a discounted cash flow analysis.
Goodwill and Other Intangible Assets:
Intangible assets with finite useful lives are amortized over their estimated useful lives, ranging from 2 to 20 years, and are reviewed when appropriate for possible impairment, similar to property, plant and equipment. Goodwill and intangible assets with indefinite lives are not amortized, but are subject to annual reviewtested at least annually for impairment. Other intangible assets are amortized over their estimated useful lives, ranging from 2 to 20 years.impairment, or when circumstances indicate that a possible impairment may exist. In general, when the carrying value of a reporting unitthese assets exceeds itsthe implied fair value, an impairment loss must be recognized. For purposes of testing for impairment, the Company uses a discounted cash flow technique. A significant decline in cash flows generated from these assets may result in a write-down of the carrying values of the related assets. For purposes of testing goodwill for impairment, the Company uses a combination of valuation techniques, including discounted cash flows. For purposes of testing indefinite-lived intangible assets, the Company uses a relief from royalty method.
Environmental:
Costs that mitigate or prevent future environmental issues or extend the life or improve equipment utilized in current operations are capitalized and depreciated on a straight-line basis over the estimated useful lives of the related assets. Costs that relate to current operations or an existing condition caused by past operations are expensed. Environmental liabilities are recorded when the Company’sCompany's obligation is probable and reasonably estimable. Accruals for losses from environmental remediation obligations do not consider the effects of inflation, and anticipated expenditures are not discounted to their present value.
NOTES TO CONSOLIDATED FINANCIAL STATEMENTS (continued)
(Dollar amounts in thousands, except per share data)
2. | SUMMARY OF SIGNIFICANT ACCOUNTING POLICIES (continued) |
Treasury Stock:
Treasury stock is carried at cost. The cost of treasury shares sold is determined under the average cost method.
Income Taxes:
Deferred tax assets and liabilities are provided for the differences between the financial statement and tax bases of assets and liabilities using enacted tax rates in effect for the years in which the differences are expected to reverse. Valuation allowances are recorded to reduce deferred tax assets when it is more likely than not that a tax benefit will not be realized. Deferred income taxes for U.S. tax purposes have not been provided on certain undistributed earnings of foreign subsidiaries, as such earnings are considered to be reinvested indefinitely. To the extent earnings are expected to be returned in the foreseeable future, the associated deferred tax liabilities are provided. The Company has not determined the deferred tax liability associated with these undistributed earnings, as such determination is not practicable.
NOTES TO CONSOLIDATED FINANCIAL STATEMENTS (continued) (Dollar amounts in thousands, except per share data)
| 2. | SUMMARY OF SIGNIFICANT ACCOUNTING POLICIES (continued) |
Revenue Recognition:
Revenues are generally recognized when title, ownership, and risk of loss pass to the customer, which is typically at the time of product shipment. shipment and is based on the applicable shipping terms. The shipping terms vary across all businesses and depend on the product and customer.
For pre-need sales of memorials and vases, revenue is recognized when the memorial has been manufactured to the customer’scustomer's specifications (e.g., name and birth date), title has been transferred to the customer and the memorial and vase are placed in storage for future delivery. A liability has been recorded for the estimated costs of finishing pre-need bronze memorials and vases that have been manufactured and placed in storage prior to July 1, 2003 for future delivery. Beginning July 1, 2003, revenue is deferred by the Company on the portion of pre-need sales attributable to the final finishing and storage of the pre-need merchandise. Deferred revenue for final finishing is recognized at the time the pre-need merchandise is finished and shipped to the customer. Deferred revenue related to storage is recognized on a straight-line basis over the estimated average time that pre-need merchandise is held in storage. At September 30, 2013,2015, the Company held 323,708312,273 memorials and 228,936218,627 vases in its storage facilities under the pre-need sales program.
Construction revenuesRevenues from mausoleum construction and significant engineering projects, including certain cremation units and marking and industrial automation projects, are recognized under the percentage-of-completion method of accounting using the cost-to-cost basis for measuring progress toward completion. As work is performed under contracts, estimates of the costs to complete are regularly reviewed and updated. As changes in estimates of total costs at completion on projects are identified, appropriate earnings adjustments are recorded using the cumulative catch-up method. Provisions for estimated losses on uncompleted contracts are recorded during the period in which such losses become evident.
The Company offers rebates to certain customers participating in volume purchase programs. RebatesRevenues from brand development and deployment services are estimated and recorded as a reduction in sales atrecognized using the timecompleted performance method, which is typically when the Company’s products are sold.customer receives the final deliverable. For arrangements with customer acceptance provisions, revenue is recognized when the customer approves the final deliverable.
Share-Based Payment:
Stock-based compensation cost is measured at grant date, based on the fair value of the award, and is recognized as expense over the employee requisite service period. A binomial lattice model is utilized to determine the fair value of awards.awards that have vesting conditions based on market targets.
Derivatives and Hedging:
Derivatives are held as part of a formal documented hedging program. All derivatives are straight forward and held for purposes other than trading. Matthews measures effectiveness by formally assessing, at least quarterly, the historical and probable future high correlation of changes in the fair value or future cash flows of the hedged item. If the hedging relationship ceases to be highly effective or it becomes probable that an expected transaction will no longer occur, gains and losses on the derivative will be recorded in other income (deductions) at that time.
Changes in the fair value of derivatives designated as cash flow hedges are recorded in other comprehensive income (loss), net of tax, and are reclassified to earnings in a manner consistent with the underlying hedged item. The cash flows from derivative activities are recognized in the statement of cash flows in a manner consistent with the underlying hedged item.
NOTES TO CONSOLIDATED FINANCIAL STATEMENTS (continued) (Dollar amounts in thousands, except per share data)
| 2. | SUMMARY OF SIGNIFICANT ACCOUNTING POLICIES (continued) |
Research and Development Expenses:
Research and development costs are expensed as incurred and were approximately $2,582, $2,220$13,033, $7,814 and $1,705$11,449 for the years ended September 30, 2013, 20122015, 2014 and 2011,2013, respectively.
Earnings Per Share:
Basic earnings per share is computed by dividing net income by the average number of common shares outstanding. Diluted earnings per share is computed using the treasury stock method, which assumes the issuance of common stock for all dilutive securities.
Reclassifications and Revision:
Certain reclassifications have been made in these financial statements to adjust the effect of exchange rate changes on cash in the Consolidated Statements of Cash Flows for the fiscal year ending September 30, 2012 and 2011. Additionally, the Company revised its classification of certain deferred tax assets as of September 30, 2012. The revision resulted in an $8,120 increase to current deferred tax assets with a corresponding decrease to non-current deferred tax assets. The revision, which the Company determined is not material to its consolidated financial position, had no impact on the Consolidated Statement of Income, Statement of Comprehensive Income and Statement of Cash Flows.
3. | 3. | FAIR VALUE MEASUREMENTS: |
Fair value is defined as the price that would be received to sell an asset or paid to transfer a liability in an orderly transaction between market participants at the measurement date. It establishes aA three level fair value hierarchy is used to prioritize the inputs used in valuations, as defined below:
Level 1:Observable inputs that reflect unadjusted quoted prices for identical assets or liabilities in active markets.
Level 2:Inputs other than quoted prices included within Level 1 that are observable for the asset or liability, either directly or indirectly.
Level 3:Unobservable inputs for the asset or liability.
As of September 30, 20132015 and 2012,2014, the fair values of the Company’sCompany's assets and liabilities measured on a recurring basis were categorized as follows: | | | September 30, 2013 | | | September 30, 2015 | | | | | Level 1 | | | Level 2 | | | Level 3 | | | Total | | | Level 1 | | | Level 2 | | | Level 3 | | | Total | | | Assets: | | | | | | | | | | | | | | | | | | | | | | | | | Derivatives (1) | | $ | - | | | $ | 3,736 | | | | - | | | $ | 3,736 | | | $ | -- | | | $ | -- | | | $ | -- | | | $ | -- | | | Trading securities | | | 17,929 | | | | - | | | | - | | | | 17,929 | | | | 18,444 | | | | -- | | | | -- | | | | 18,444 | | | Total assets at fair value | | $ | 17,929 | | | $ | 3,736 | | | | - | | | $ | 21,665 | | | $ | 18,444 | | | $ | -- | | | $ | -- | | | $ | 18,444 | | | | | | | | | | | | | | | | | | | | | | | | | | | | | | | | | | | | | Liabilities: | | | | | | | | | | | | | | | | | | | | | | | | | | | | | | | | | Derivatives (1) | | | - | | | $ | 4,644 | | | | - | | | $ | 4,644 | | | $ | -- | | | $ | 3,686 | | | $ | -- | | | $ | 3,686 | | | Total liabilities at fair value | | | - | | | $ | 4,644 | | | | - | | | $ | 4,644 | | | $ | -- | | | $ | 3,686 | | | $ | -- | | | $ | 3,686 | | | | | | | | | | | | | | | | | | | | | | | | | | | | | | | | | | | | (1) Interest rate swaps are valued based on observable market swap rates and are classified within Level 2 of the fair value hierarchy. | (1) Interest rate swaps are valued based on observable market swap rates and are classified within Level 2 of the fair value hierarchy. | | (1) Interest rate swaps are valued based on observable market swap rates and are classified within Level 2 of the fair value hierarchy. | |
NOTES TO CONSOLIDATED FINANCIAL STATEMENTS (continued) (Dollar amounts in thousands, except per share data)
3. | 3. | FAIR VALUE MEASUREMENTS (continued) |
| | | September 30, 2012 | | | September 30, 2014 | | | | | Level 1 | | | Level 2 | | | Level 3 | | | Total | | | Level 1 | | | Level 2 | | | Level 3 | | | Total | | | Assets: | | | | | | | | | | | | | | | | | | | | | | | | | Derivatives (1) | | $ | - | | | | - | | | | - | | | $ | - | | | $ | - | | | $ | 2,457 | | | $ | - | | | $ | 2,457 | | | Trading securities | | | 16,265 | | | | - | | | | - | | | | 16,265 | | | | 19,038 | | | | - | | | | - | | | | 19,038 | | | Total assets at fair value | | $ | 16,265 | | | | - | | | | - | | | $ | 16,265 | | | $ | 19,038 | | | $ | 2,457 | | | $ | - | | | $ | 21,495 | | | | | | | | | | | | | | | | | | | | | | | | | | | | | | | | | | | | | Liabilities: | | | | | | | | | | | | | | | | | | | | | | | | | | | | | | | | | Derivatives (1) | | | - | | | $ | 9,133 | | | | - | | | $ | 9,133 | | | $ | - | | | $ | 2,127 | | | $ | - | | | $ | 2,127 | | | Total liabilities at fair value | | | - | | | $ | 9,133 | | | | - | | | $ | 9,133 | | | $ | - | | | $ | 2,127 | | | $ | - | | | $ | 2,127 | | | | | | | | | | | | | | | | | | | | | | | | | | | | | | | | | | | | (1) Interest rate swaps are valued based on observable market swap rates and are classified within Level 2 of the fair value hierarchy. | (1) Interest rate swaps are valued based on observable market swap rates and are classified within Level 2 of the fair value hierarchy. | | (1) Interest rate swaps are valued based on observable market swap rates and are classified within Level 2 of the fair value hierarchy. | |
Inventories at September 30, 20132015 and 20122014 consisted of the following:
| | | 2013 | | | 2012 | | | 2015 | | | 2014 | | | | | | | | | | | | | | | | | Raw materials | | $ | 40,931 | | | $ | 41,003 | | | $ | 48,636 | | | $ | 46,152 | | | Work in process | | | 25,293 | | | | 22,772 | | | | 32,567 | | | | 38,631 | | | Finished goods | | | 64,544 | | | | 66,915 | | | | 90,220 | | | | 68,059 | | | | | $ | 130,768 | | | $ | 130,690 | | | $ | 171,423 | | | $ | 152,842 | |
Investment securities are recorded at estimated marketfair value at the consolidated balance sheet date and are classified as trading securities. Short-term investments consisted principally of corporate obligations with purchased maturities of over three months but less than one year. The cost of short-term investments approximated market value at September 30, 2013 and 2012. Accrued interest on these investment securities was classified with short-term investments. Investments classified as non-current and trading securities consisted of equity and fixed income mutual funds.
At September 30, 2013 and 2012, non-current The market value of these investments were as follows:
| | | 2013 | | | 2012 | | | Trading securities: | | | | | | | | Mutual funds | | $ | 17,929 | | | $ | 16,265 | | | Equity investments | | | 4,359 | | | | 2,577 | | | | | $ | 22,288 | | | $ | 18,842 | |
Non-current investments classified as trading securities are recorded at market value. Market value exceeded cost by $157$175 and $48$343 at September 30, 20132015 and 2012,2014, respectively. Realized and unrealized gains and losses are based on the specific identification method and are recorded in investment income. Realized gains (losses) for fiscal 2013, 20122015, 2014 and 20112013 were not material.
Equity investments primarily included ownership interests in various entities of less than 20%, which are recorded under the cost method of accounting.
At September 30, 2015 and 2014, non-current investments were as follows:
| | | 2015 | | | 2014 | | | | | | | | | | | Trading securities | | $ | 18,444 | | | $ | 19,038 | | | Equity investments | | | 7,073 | | | | 4,092 | | | | | $ | 25,517 | | | $ | 23,130 | |
NOTES TO CONSOLIDATED FINANCIAL STATEMENTS (continued) (Dollar amounts in thousands, except per share data)
| 6. | PROPERTY, PLANT AND EQUIPMENT: |
Property, plant and equipment and the related accumulated depreciation at September 30, 20132015 and 20122014 were as follows:
| | | 2013 | | | 2012 | | | 2015 | | | 2014 | | | Buildings | | $ | 77,936 | | | $ | 64,946 | | | $ | 101,291 | | | $ | 91,540 | | | Machinery and equipment | | | 303,674 | | | | 261,857 | | | | 350,890 | | | | 340,942 | | | | | | 381,610 | | | | 326,803 | | | | 452,181 | | | | 432,482 | | | Less accumulated depreciation | | | (233,791 | ) | | | (206,472 | ) | | | (274,187 | ) | | | (250,073 | ) | | | | | 147,819 | | | | 120,331 | | | | 177,994 | | | | 182,409 | | | Land | | | 15,534 | | | | 9,207 | | | | 19,847 | | | | 16,453 | | | Construction in progress | | | 17,378 | | | | 14,511 | | | | 29,567 | | | | 10,453 | | | | | $ | 180,731 | | | $ | 144,049 | | | $ | 227,408 | | | $ | 209,315 | |
Depreciation expense was $31,303, $24,630$43,820, $35,546 and $23,461$31,303 for each of the three years ended September 30, 2013, 20122015, 2014 and 2011,2013, respectively.
Long-term debt at September 30, 20132015 and 20122014 consisted of the following:
| | | 2013 | | | 2012 | | | 2015 | | | 2014 | | | Revolving credit facilities | | $ | 335,420 | | | $ | 281,323 | | | $ | 884,254 | | | $ | 702,055 | | | Notes payable to banks | | | 21,530 | | | | 26,626 | | | | 8,506 | | | | 13,315 | | | Short-term borrowings | | | 7,639 | | | | 4,322 | | | | 5,199 | | | | 6,410 | | | Capital lease obligations | | | 9,093 | | | | 7,443 | | | | 4,995 | | | | 7,475 | | | | | | 373,682 | | | | 319,714 | | | | 902,954 | | | | 729,255 | | | Less current maturities | | | (22,614 | ) | | | (21,566 | ) | | | (11,737 | ) | | | (15,228 | ) | | | | $ | 351,068 | | | $ | 298,148 | | | $ | 891,217 | | | $ | 714,027 | |
The Company has a domestic Revolving Credit Facility with a syndicate of financial institutions. In connection with the acquisition of Schawk, Inc. ("Schawk") in July 2013,2014, the Company entered into amendments to the Revolving Credit Facility to amend certain terms of the Revolving Credit Facility and increase the maximum amount of borrowings available under the facility was increased from $400,000$500,000 to $500,000 and the facility’s maturity was extended to July 2018.$900,000. Borrowings under the amended facility bear interest at LIBOR plus a factor ranging from .75% to 1.25%2.00% (1.75% at September 30, 2015) based on the Company’sCompany's leverage ratio. The leverage ratio is defined as net indebtedness divided by EBITDA (earnings before interest, taxes, depreciation and amortization). The Company is required to pay an annual commitment fee ranging from .15% to .25% (based on the Company’sCompany's leverage ratio) of the unused portion of the facility.
The Revolving Credit Facility requires the Company to maintain certain leverage and interest coverage ratios. A portion of the facility (not to exceed $30,000) is available for the issuance of trade and standby letters of credit. Outstanding borrowings on the Revolving Credit Facility at September 30, 20132015 and 20122014 were $305,000$857,425 and $281,323,$680,000, respectively. The weighted-average interest rate on outstanding borrowings at September 30, 20132015 and 20122014 was 2.81%2.41% and 2.83%2.53%, respectively.
NOTES TO CONSOLIDATED FINANCIAL STATEMENTS (continued) (Dollar amounts in thousands, except per share data)
| 7. | LONG-TERM DEBT (continued) |
The Company has entered into the following interest rate swaps:
| Effective Date | Amount | Fixed Interest Rate | Interest Rate Spread at September 30, 2013 | Maturity Date | Amount | Fixed Interest Rate | Interest Rate Spread at September 30, 2015 | Maturity Date | | May 2011 | $25,000 | 1.37% | 1.25% | May 2014 | | | October 2011 | 25,000 | 1.67% | 1.25% | October 2015 | $25,000 | 1.67% | 1.75% | October 2015 | | November 2011 | 25,000 | 2.13% | 1.25% | November 2014 | | | March 2012 | 25,000 | 2.44% | 1.25% | March 2015 | | | June 2012 | 40,000 | 1.88% | 1.25% | June 2022 | 40,000 | 1.88% | 1.75% | June 2022 | | August 2012 | 35,000 | 1.74% | 1.25% | June 2022 | 35,000 | 1.74% | 1.75% | June 2022 | | September 2012 | 25,000 | 3.03% | 1.25% | December 2015 | 25,000 | 3.03% | 1.75% | December 2015 | | September 2012 | 25,000 | 1.24% | 1.25% | March 2017 | 25,000 | 1.24% | 1.75% | March 2017 | | November 2012 | 25,000 | 1.33% | 1.25% | November 2015 | 25,000 | 1.33% | 1.75% | November 2015 | | May 2014 | | 25,000 | 1.35% | 1.75% | May 2018 | | November 2014 | | 25,000 | 1.26% | 1.75% | June 2018 | | March 2015 | | 25,000 | 1.49% | 1.75% | March 2019 | | September 2015 | | 25,000 | 1.39% | 1.75% | September 2020 | | December 2015 | | 25,000 | 1.59% | 1.75% | December 2020 |
The Company enters into interest rate swaps in order to achieve a mix of fixed and variable rate debt that it deems appropriate. The interest rate swaps have been designated as cash flow hedges of the future variable interest payments under the Revolving Credit Facility which are considered probable of occurring. Based on the Company’sCompany's assessment, all of the critical terms of each of the hedges matched the underlying terms of the hedged debt and related forecasted interest payments, and as such, these hedges were considered highly effective.
The fair value of the interest rate swaps reflected an unrealized loss, net of unrealized gains, of $908$3,686 ($5542,248 after tax) and $9,133an unrealized gain, net of unrealized losses, of $330 ($5,571201 after tax) at September 30, 20132015 and 2012,2014, respectively, that is included in shareholders’shareholders' equity as part of accumulated other comprehensive loss (“AOCL”income ("AOCI"). Assuming market rates remain constant with the rates at September 30, 2013,2015, a loss (net of tax) of approximately $1,580$711 included in AOCLAOCI is expected to be recognized in earnings as an adjustment to interest expense over the next twelve months.
At September 30, 20132015 and 2012,2014, the interest rate swap contracts were reflected on a gross-basis in the consolidated balance sheets as follows:
| Liability Derivatives | | | | | | Balance Sheet Location: | | 2013 | | | 2012 | | | | Derivatives | | | 2015 | | | 2014 | | | Current assets | | | | | | | | | | | | | | Other current assets | | $ | 427 | | | $ | - | | | $ | -- | | | $ | 324 | | | Long-term assets | | | | | | | | | | | | | | | | | | Other assets | | | 3,309 | | | | - | | | | -- | | | | 2,133 | | | Current liabilities: | | | | | | | | | | | | | | | | | | Other current liabilities | | | 2,590 | | | | 2,851 | | | | (1,165 | ) | | | (1,808 | ) | | Long-term liabilities: | | | | | | | | | | | | | | | | | | Other liabilities | | | 2,054 | | | | 6,282 | | | | (2,521 | ) | | | (319 | ) | | Total derivatives | | $ | 908 | | | $ | 9,133 | | | $ | (3,686 | ) | | $ | 330 | | | | | | | | | | | | | | | | | | | |
NOTES TO CONSOLIDATED FINANCIAL STATEMENTS (continued) (Dollar amounts in thousands, except per share data)
| 7. | LONG-TERM DEBT (continued) |
The loss recognized on derivatives was as follows:
| | Location of | Amount of | Location of | Amount of | | Derivatives in | Loss | Loss | Loss | Loss | | Cash Flow Hedging | Recognized in | Recognized in Income | Recognized in | Recognized in Income | | Relationships | Income on Derivatives | on Derivatives | Income on Derivatives | on Derivatives | | | | 2013 | | 2012 | | 2015 | 2014 | | | | | | | Interest rate swaps | Interest expense | $(4,170) | | $(3,418) | Interest expense | $(3,922) | $(4,318) |
The Company recognized the following losses in accumulated other comprehensive loss (“AOCL”):AOCI:
| | | | | | | | | | | | | | | | | | | | Location of Gain | | Amount of Loss | | | | | Location of Gain | | Amount of Loss | | | | | | | or (Loss) | | Reclassified from | | | | | or (Loss) | | Reclassified from | | | Derivatives in | | Amount of Gain or | | Reclassified from | | AOCL | | | Amount of | | Reclassified from | | AOCI | | | Cash Flow | | (Loss) Recognized in | | AOCL | | into Income | | | Loss Recognized in | | AOCI | | into Income | | | Hedging | | AOCL on Derivatives | | into Income | | (Effective Portion*) | | | AOCI on Derivatives | | into Income | | (Effective Portion*) | | | Relationships | | 2013 | | | 2012 | | (Effective Portion*) | | 2013 | | | 2012 | | | 2015 | | | 2014 | | (Effective Portion*) | | 2015 | | | 2014 | | | | | | | | | | | | | | | | | | | | | | | | | | | | | Interest rate swaps | | | $2,474 | | | | $(3,288) | | Interest expense | | | $(2,544) | | | | $(2,085) | | | | $(4,841) | | | | $(1,879) | | Interest expense | | | $(2,392) | | | | $(2,634) | | | | | | | | | | | | | | | | | | | | | | | | | | | | | | | | | | | | | | *There is no ineffective portion or amount excluded from effectiveness testing. | *There is no ineffective portion or amount excluded from effectiveness testing. | | *There is no ineffective portion or amount excluded from effectiveness testing. | |
In March 2013, theThe Company, through certain of its European subsidiaries, entered intohas a credit facility with a European bank. The maximum amount of borrowings available under this facility is 25.035.0 million Euros ($33,815)39,255). Outstanding borrowings under the credit facility totaled 22.523.9 million Euros ($30,434)26,829) and 17.5 million Euros ($22,055) at September 30, 2013.2015 and 2014, respectively. The weighted-average interest rate on outstanding borrowings under thethis facility at September 30, 20132015 and 2014 was 1.37%.1.50% and 1.35%, respectively.
The Company, through its German subsidiary, Saueressig GmbH & Co. KG (“Saueressig”("Saueressig"), has several loans with various European banks. Outstanding borrowings onunder these loans totaled 1.7734,452 Euros ($824) and 1.2 million Euros ($2,310) and 8.2 million Euros ($10,514)1,576) at September 30, 20132015 and 2012,2014, respectively. The weighted-average interest rate on outstanding borrowings of Saueressig at September 30, 20132015 and 20122014 was 4.04% and 6.10%3.96%, respectively.
The Company, through its German subsidiary, Wetzel GmbH ("Wetzel"), has several loans with various European banks. Outstanding borrowings under these loans totaled 1.9 million Euros ($2,110) and 2.9 million Euros ($3,624) at September 30, 2015 and 2014, respectively. The weighted-average interest rate on outstanding borrowings of Wetzel at September 30, 2015 and 2014 was 5.96% and 5.67%, respectively.
The Company, through its wholly-owned subsidiary, Matthews International S.p.A., has several loans with various Italian banks. Outstanding borrowings on these loans totaled 5.14.3 million Euros ($6,871)4,772) and 6.35.5 million Euros ($8,080)6,922) at September 30, 20132015 and 2012,2014, respectively. Matthews International S.p.A. also has three lines of credit totaling 11.411.3 million Euros ($15,379)12,707) with the same Italian banks. Outstanding borrowings on these lines were 5.64.6 million Euros ($7,639)5,166) and 3.44.8 million Euros ($4,322)6,063) at September 30, 20132015 and 2012,2014, respectively. The weighted-average interest rate on outstanding Matthews International S.p.A. borrowings at September 30, 20132015 and 20122014 was 3.16%3.33% and 3.08%3.15%, respectively.
As of September 30, 2013 and 2012, the fair value of the Company’s long-term debt, including current maturities, which is classified as Level 2 in the fair value hierarchy, approximated the carrying value included in the Consolidated Balance Sheets.
NOTES TO CONSOLIDATED FINANCIAL STATEMENTS (continued) (Dollar amounts in thousands, except per share data)
| 7. | LONG-TERM DEBT (continued) |
In September 2014, a claim seeking to draw upon a letter of credit issued by the Company of $12,925 was filed with respect to a project for a customer. In January 2015, the Company made payment on the draw to the financial institution for the letter of credit. Pursuant to an action initiated by the Company, a court order has been issued requiring these funds to ultimately be remitted to the court pending resolution of the dispute between the parties. While it is possible the resolution of this matter could be unfavorable to the Company, management has assessed the customer's claim to be without merit and, based on information available as of this filing, expects that the ultimate resolution of this matter will not have a material adverse effect on Matthews' financial condition, results of operations or cash flows. As of September 30, 2015, the Company has presented the funded letter of credit within other current assets on the Consolidated Balance Sheet.
As of September 30, 2015 and 2014, the fair value of the Company's long-term debt, including current maturities, which is classified as Level 2 in the fair value hierarchy, approximated the carrying value included in the Consolidated Balance Sheets.
Aggregate maturities of long-term debt, including short-term borrowings and capital leases, follows:
| 2014 | | $ | 22,614 | | | | 2015 | | | 34,785 | | | | 2016 | | | 5,032 | | | $ | 11,737 | | | 2017 | | | 1,623 | | | | 29,979 | | | 2018 | | | 306,365 | | | | 857,974 | | | 2019 | | | | 212 | | | 2020 | | | | 222 | | | Thereafter | | | 3,263 | | | | 2,830 | | | | | $ | 373,682 | | | $ | 902,954 | |
The authorized common stock of the Company consists of 70,000,000 shares of Class A Common Stock, $1 par value.
The Company has a stock repurchase program. The buy-back program is designed to increase shareholder value, enlarge the Company's holdings of its common stock, and add to earnings per share. Repurchased shares may be retained in treasury, utilized for acquisitions, or reissued to employees or other purchasers, subject to the restrictions ofset forth in the Company’sCompany's Restated Articles of Incorporation. Under the current authorization, the Company’sCompany's Board of Directors has authorized the repurchase of a total of 2,500,000 shares of Matthews’Matthews' common stock under the program, of which 1,194,670661,022 shares remain available for repurchase as of September 30, 2013.2015. In November 2015, the Company's Board of Directors approved the continuation of its stock repurchase program and increased the authorization for stock repurchases by an additional 2,500,000 shares.
Comprehensive income consists of net income adjusted for changes, net of any related income tax effect, in cumulative foreign currency translation, the fair value of derivatives, unrealized investment gains and losses and minimum pension liability. The deferred income tax expense (benefit) related to minimum pension liabilities and fair value of derivatives was $22,005, $(2,896)$(1,035), $(8,256)$(5,853) and $22,005 for the years ended September 30, 2013, 20122015, 2014 and 2011,2013, respectively.
Accumulated other comprehensive loss at September 30, 20132015 and 20122014 consisted of the following:
| | | 2013 | | | 2012 | | | Cumulative foreign currency translation | | $ | 3,714 | | | $ | (65 | ) | | Fair value of derivatives, net of tax of $354 and $3,562, respectively | | | (554 | ) | | | (5,571 | ) | | Minimum pension liabilities, net of tax of $18,979 and $37,777, respectively | | | (30,100 | ) | | | (59,447 | ) | | | | $ | (26,940 | ) | | $ | (65,083 | ) |
| | | 2015 | | | 2014 | | | Cumulative foreign currency translation | | $ | (104,604 | ) | | $ | (27,367 | ) | | Fair value of derivatives, net of tax of $1,437 and $129, respectively | | | (2,248 | ) | | | 201 | | | Minimum pension liabilities, net of tax of $27,530 and $25,058, respectively | | | (43,474 | ) | | | (39,651 | ) | | | | $ | (150,326 | ) | | $ | (66,817 | ) |
NOTES TO CONSOLIDATED FINANCIAL STATEMENTS (continued) (Dollar amounts in thousands, except per share data)
The Company maintains an equity incentive plan (the “2007"2012 Equity Incentive Plan”Plan") that provides for grants of stock options, restricted shares, stock-based performance units and certain other types of stock-based awards. The Company also maintains an equity incentive plan (the "2007 Equity Incentive Plan") and a stock incentive plan (the “1992"1992 Incentive Stock Plan”Plan") that previously provided for grants of stock options, restricted shares and certain other types of stock-based awards. In February 2013, the Company’s shareholders approved the adoption of a new plan,Under the 2012 Equity Incentive Plan (the “2012 Plan”), that provides for grants of stock options, restricted shares, stock-based performance units and certain other types of stock-based awards. Under the 2012 Plan, which has a ten-year term, the maximum number of shares available for grants or awards is an aggregate of 2,500,000. There will be no further grants under the 2007 Equity Incentive Plan or the 1992 Incentive Stock Plan. At September 30, 2013,2015, there were 2,500,0001,476,798 shares reserved for future issuance under the 2012 Equity Incentive Plan. All plans are administered by the Compensation Committee of the Board of Directors.
The option price for each stock option granted under any of the plans may not be less than the fair market value of the Company's common stock on the date of grant. Outstanding stock options are generally exercisable in one-third increments upon the attainment of pre-defined levels of appreciation in the market value of the Company’sCompany's Class A Common Stock. In addition, options generally vest in one-third increments after three, four and five years, respectively, from the grant date (but, in any event, not until the attainment of the market value thresholds). The options expire on the earlier of ten years from the date of grant, upon employment termination, or within specified time limits following voluntary employment termination (with the consent of the Company), retirement or death. The Company generally settles employee stock option exercises with treasury shares.
With respect to outstanding restricted share grants, for grants made prior to fiscal 2013, generally one-half of the shares vest on the third anniversary of the grant, with the remaining one-half of the shares vesting in one-third increments upon attainment of pre-defined levels of appreciation in the market value of the Company’sCompany's Class A Common Stock. For grants made in fiscal 2013 and thereafter, generally one-half of the shares vest on the third anniversary of the grant, one-quarter of the shares vest in one-third increments upon the attainment of pre-defined levels of adjusted earnings per share, and the remaining one-quarter of the shares vest in one-third increments upon attainment of pre-defined levels of appreciation in the market value of the Company’sCompany's Class A Common Stock. Additionally, restricted shares cannot vest until the first anniversary of the grant date. Unvested restricted shares generally expire on the earlier of five years from the date of grant, upon employment termination, or within specified time limits following voluntary employment termination (with the consent of the Company), retirement or death. The Company issues restricted shares from treasury shares.
For the years ended September 30, 2013, 20122015, 2014 and 2011,2013, stock-based compensation cost totaled $5,562, $5,472$9,097, $6,812 and $6,972,$5,562, respectively. The associated future income tax benefit recognized was $2,169, $2,134$3,548, $2,657 and $2,719$2,169 for the years ended September 30, 2013, 20122015, 2014 and 2011,2013, respectively.
The amount of cash received from the exercise of stock options was $974, $264$4,015, $7,951 and $1,859,$974, for the years ended September 30, 2013, 20122015, 2014 and 2011,2013, respectively. In connection with these exercises, the tax benefits realized by the Company were $99, $22$350, $698 and $278$99 for the years ended September 30, 2013, 20122015, 2014 and 2011,2013, respectively.
The transactions for restricted stock for the year ended September 30, 20132015 were as follows:
| | | | | | Weighted- | | | | | | | | average | | | | | | | | grant-date | | | | | Shares | | | fair value | | | Non-vested at September 30, 2012 | | | 551,389 | | | | $32.56 | | | Granted | | | 236,500 | | | | 25.22 | | | Vested | | | (99,226 | ) | | | 35.95 | | | Expired or forfeited | | | (47,264 | ) | | | 30.75 | | | Non-vested at September 30, 2013 | | | 641,399 | | | | 29.46 | |
| | | | Weighted- | | | | | | average | | | | | | Grant-date | | | | Shares | | Fair Value | | | Non-vested at September 30, 2014 | | | 575,150 | | | | $33.83 | | | Granted | | | 215,370 | | | | 40.07 | | | Vested | | | (183,089 | ) | | | 36.51 | | | Expired or forfeited | | | (36,864 | ) | | | 28.70 | | | Non-vested at September 30, 2015 | | | 570,567 | | | | $35.66 | |
NOTES TO CONSOLIDATED FINANCIAL STATEMENTS (continued) (Dollar amounts in thousands, except per share data)
9. SHARE-BASED PAYMENTS (continued)| 9. | SHARE-BASED PAYMENTS (continued) |
As of September 30, 2013,2015, the total unrecognized compensation cost related to unvested restricted stock was $4,022$7,681 which is expected to be recognized over a weighted-average period of 1.6 years.
The transactions for shares under options for the year ended September 30, 20132015 were as follows:
| | | | | | | | | Weighted- | | | | | | | | | | | Weighted- | | | average | | | Aggregate | | | | | | | | average | | | remaining | | | intrinsic | | | | | Shares | | | exercise price | | | contractual term | | | value | | | Outstanding, September 30, 2012 | | | 840,282 | | | $ | 37.15 | | | | | | | | | Granted | | | - | | | | - | | | | | | | | | Exercised | | | (38,475 | ) | | | 25.56 | | | | | | | | | Expired or forfeited | | | (56,983 | ) | | | 37.10 | | | | | | | | | Outstanding, September 30, 2013 | | | 744,824 | | | | 37.76 | | | | 2.2 | | | $ | 240 | | | Exercisable, September 30, 2013 | | | 413,069 | | | | 36.94 | | | | 1.9 | | | $ | 472 | |
| | | | | | | | | Weighted- | | | | | | | | | | | Weighted- | | | average | | | Aggregate | | | | | | | | average | | | Remaining | | | Intrinsic | | | | | Shares | | | Exercise Price | | | Contractual Term | | | Value | | | Outstanding, September 30, 2014 | | | 512,322 | | | | $38.62 | | | | | | | | | Exercised | | | (105,211 | ) | | | 38.17 | | | | | | | | | Expired or forfeited | | | (69,173 | ) | | | 36.53 | | | | | | | | | Outstanding, September 30, 2015 | | | 337,938 | | | | $39.19 | | | | 0.7 | | | | $3,304 | | | Exercisable, September 30, 2015 | | | 171,532 | | | | $39.55 | | | | 0.8 | | | | $1,616 | |
No shares were earnedoptions vested during the year ended September 30, 20132015 and 2012,2014, respectively. The intrinsic value of options (which is the amount by which the stock price exceeded the exercise price of the options on the date of exercise) exercised during the years ended September 30, 2015, 2014 and 2013 2012was $931, $1,653 and 2011 was $294, $57 and $743, respectively.
The transactions for non-vested option shares for the year ended September 30, 20132015 were as follows:
| | | | | | Weighted- | | | | | | | | average | | | | | | | | grant-date | | | | | Shares | | | fair value | | | Non-vested at September 30, 2012 | | | 355,872 | | | $ | 11.35 | | | Granted | | | - | | | | - | | | Vested | | | - | | | | - | | | Expired or forfeited | | | (24,117 | ) | | | 12.16 | | | Non-vested at September 30, 2013 | | | 331,755 | | | | 11.29 | |
| | | | | | Weighted- | | | | | | | | average | | | | | | | | Grant-date | | | | | Shares | | | Fair Value | | | Non-vested at September 30, 2014 | | | 312,442 | | | | $11.21 | | | Vested | | | 77,199 | | | | 12.23 | | | Expired or forfeited | | | (68,837 | ) | | | 11.70 | | | Non-vested at September 30, 2015 | | | 320,804 | | | | $11.35 | |
The fair value of each restricted stock grant is estimated on the date of grant using a binomial lattice valuation model. The following table indicates the assumptions used in estimating fair value of restricted stock for the years ended September 30, 2013, 20122015, 2014 and 2011.2013.
| | | 2013 | | | 2012 | | | 2011 | | | Expected volatility | | | 29.5 | % | | | 30.4 | % | | | 30.0 | % | | Dividend yield | | | 1.2 | % | | | 1.0 | % | | | 1.0 | % | | Average risk-free interest rate | | | 0.6 | % | | | 0.9 | % | | | 1.2 | % | | Average expected term (years) | | | 2.0 | | | | 2.0 | | | | 2.0 | |
NOTES TO CONSOLIDATED FINANCIAL STATEMENTS (continued)
(Dollar amounts in thousands, except per share data)
9. | SHARE-BASED PAYMENTS (continued) |
| | | 2015 | | | 2014 | | | 2013 | | | Expected volatility | | | 22.2 | % | | | 26.6 | % | | | 29.5 | % | | Dividend yield | | | 1.0 | % | | | 1.1 | % | | | 1.2 | % | | Average risk-free interest rate | | | 1.7 | % | | | 1.4 | % | | | 0.6 | % | | Average expected term (years) | | | 1.8 | | | | 2.0 | | | | 2.0 | |
The risk-free interest rate is based on United States Treasury yields at the date of grant. The dividend yield is based on the most recent dividend payment and average stock price over the 12 months prior to the grant date. Expected volatilities are based on the historical volatility of the Company’sCompany's stock price. The expected term for grants in the years ended September 30, 2013, 20122015, 2014 and 20112013 represents an estimate of the average period of time for restricted shares to vest. The option characteristics for each grant are considered separately for valuation purposes.
NOTES TO CONSOLIDATED FINANCIAL STATEMENTS (continued) (Dollar amounts in thousands, except per share data)
| 9. | SHARE-BASED PAYMENTS (continued) |
The Company maintains the 1994 Director Fee Plan (the "1994 Director Fee Plan"), and the 2014 Director Fee Plan (the "2014 Director Fee Plan") (collectively, the "Director Fee Plans"). There will be no further fees or share-based awards under the 1994 Director Fee Plan. Under the Company’s2014 Director Fee Plan, directors (except for the Chairman of the Board) who are not also officers of the Company each receive, as an annual retainer fee, either cash or shares of the Company's Class A Common Stock equivalentwith a value equal to $60.$75. The equivalent amountannual retainer fee paid to a non-employee Chairman of the Board is $130.$175. Where the annual retainer fee is provided in shares, each director may elect to be paid these shares on a current basis or have such shares credited to a deferred stock account as phantom stock, with such shares to be paid to the director subsequent to leaving the Board. The value of deferred shares is recorded in other liabilities. A total of 17,005 shares had been deferred under the Director Fee PlanPlans at September 30, 2013.2015. Additionally, directors who are not also officers of the Company each receive an annual stock-based grant (non-statutory stock options, stock appreciation rights and/or restricted shares) with a value of $100.$110. A total of 22,300 stock options have been granted under the plan.Director Fee Plans. At September 30, 2013, 11,8002015, there were no options were outstanding and vested.outstanding. Additionally, 103,150136,568 shares of restricted stock have been granted under the plan, 38,227Director Fee Plans, 33,418 of which were unvested at September 30, 2013.2015. A total of 300,000150,000 shares have been authorized to be issued under the 2014 Director Fee Plan.
The information used to compute earnings per share attributable to Matthews’Matthews' common shareholders was as follows:
| | | 2013 | | | 2012 | | | 2011 | | | Net income attributable to Matthews shareholders | | $ | 54,888 | | | $ | 55,843 | | | $ | 72,372 | | Less: dividends and undistributed earnings allocated to participating securities | | | 583 | | | | 861 | | | | 1,420 | | | Net income available to Matthews shareholders | | $ | 54,305 | | | $ | 54,982 | | | $ | 70,952 | | | | | | | | | | | | | | | | | Weighted-average shares outstanding (in thousands): | | | | | | | | | | | | | | Basic shares | | | 27,255 | | | | 27,753 | | | | 28,775 | | | Effect of dilutive securities | | | 168 | | | | 86 | | | | 37 | | | Diluted shares | | | 27,423 | | | | 27,839 | | | | 28,812 | | | | | | | | | | | | | | | |
| | | 2015 | | | 2014 | | | 2013 | | | Net income attributable to Matthews shareholders | | $ | 63,449 | | | $ | 42,625 | | | $ | 54,121 | | Less: dividends and undistributed earnings
allocated to participating securities | | | 10 | | | | 121 | | | | 583 | | | Net income available to Matthews shareholders | | $ | 63,439 | | | $ | 42,504 | | | $ | 53,538 | | | | | | | | | | | | | | | | | Weighted-average shares outstanding (in thousands): | | | | | | | | | | | | | | Basic shares | | | 32,939 | | | | 28,209 | | | | 27,255 | | | Effect of dilutive securities | | | 257 | | | | 274 | | | | 168 | | | Diluted shares | | | 33,196 | | | | 28,483 | | | | 27,423 | | | | | | | | | | | | | | | |
Options to purchase 271,075 782,942 and 289,502 shares of common stock were not included in the computation of diluted earnings per share for the yearsyear ended September 30, 2013, 2012 and 2011, respectively, because the inclusion of these options would be anti-dilutive.
NOTES TO CONSOLIDATED FINANCIAL STATEMENTS (continued) (Dollar amounts in thousands, except per share data)
| 11. | PENSION AND OTHER POSTRETIREMENT PLANS: |
The Company provides defined benefit pension and other postretirement plans to certain employees. Effective January 1, 2014, the Company's principal retirement plan was closed to new participants. The following provides a reconciliation of benefit obligations, plan assets and funded status of the plans as of the Company’sCompany's actuarial valuation as of September 30, 20132015 and 2012:2014:
| | | Pension | | | Other Postretirement | | | Pension | | | Other Postretirement | | | | | 2013 | | | 2012 | | | 2013 | | | 2012 | | | 2015 | | | 2014 | | | 2015 | | | 2014 | | Change in benefit obligation: | | | | | | | | | | | | | | Change in benefit obligation: | | | | | | | | | | | | | | | Benefit obligation, beginning of year | | $ | 195,860 | | | $ | 168,033 | | | $ | 28,831 | | | $ | 27,547 | | | $ | 211,036 | | | $ | 186,077 | | | $ | 21,358 | | | $ | 18,881 | | | Acquisitions | | | 9,437 | | | | - | | | | - | | | | - | | | | 27,162 | | | | - | | | | - | | | | - | | | Service cost | | | 7,160 | | | | 5,852 | | | | 796 | | | | 730 | | | | 6,764 | | | | 6,150 | | | | 454 | | | | 436 | | | Interest cost | | | 8,024 | | | | 7,842 | | | | 1,129 | | | | 1,283 | | | | 8,740 | | | | 8,927 | | | | 885 | | | | 919 | | | Assumption changes | | | (26,288 | ) | | | 19,701 | | | | (10,270 | ) | | | 2,508 | | | | Actuarial (gain) loss | | | (891 | ) | | | 688 | | | | (854 | ) | | | (2,473 | ) | | | 4,087 | | | | 18,412 | | | | (814 | ) | | | 1,929 | | | Exchange gain | | | | (1,206 | ) | | | (703 | ) | | | - | | | | - | | | Benefit payments | | | (7,225 | ) | | | (6,256 | ) | | | (751 | ) | | | (764 | ) | | | (17,856 | ) | | | (7,827 | ) | | | (1,459 | ) | | | (807 | ) | | Benefit obligation, end of year | | | 186,077 | | | | 195,860 | | | | 18,881 | | | | 28,831 | | | | 238,727 | | | | 211,036 | | | | 20,424 | | | | 21,358 | | | | | | | | | | | | | | | | | | | | | | | | | | | | | | | | | | | | Change in plan assets: | | | | | | | | | | | | | | | | | | Change in plan assets: | | | | | | | | | | | | | | | | | | | Fair value, beginning of year | | | 116,577 | | | | 100,554 | | | | - | | | | - | | | | 131,753 | | | | 123,713 | | | | - | | | | - | | | Acquisitions | | | | 25,897 | | | | - | | | | - | | | | - | | | Actual return | | | 10,838 | | | | 16,000 | | | | - | | | | - | | | | 625 | | | | 10,792 | | | | - | | | | - | | | Benefit payments | | | (7,225 | ) | | | (6,256 | ) | | | (751 | ) | | | (764 | ) | | | Benefit payments (1) | | | | (17,856 | ) | | | (7,827 | ) | | | (1,459 | ) | | | (807 | ) | | Employer contributions | | | 3,523 | | | | 6,279 | | | | 751 | | | | 764 | | | | 1,806 | | | | 5,075 | | | | 1,459 | | | | 807 | | | Fair value, end of year | | | 123,713 | | | | 116,577 | | | | - | | | | - | | | | 142,225 | | | | 131,753 | | | | - | | | | - | | | | | | | | | | | | | | | | | | | | | | | | | | | | | | | | | | | | | Funded status | | | (62,363 | ) | | | (79,283 | ) | | | (18,881 | ) | | | (28,831 | ) | | | (96,502 | ) | | | (79,283 | ) | | | (20,424 | ) | | | (21,358 | ) | | Unrecognized actuarial loss (gain) | | | 56,148 | | | | 92,940 | | | | (3,001 | ) | | | 8,561 | | | | 77,368 | | | | 69,153 | | | | (1,801 | ) | | | (987 | ) | | Unrecognized prior service cost | | | (1,935 | ) | | | (2,142 | ) | | | (1,502 | ) | | | (1,774 | ) | | | (1,231 | ) | | | (1,411 | ) | | | (1,111 | ) | | | (1,306 | ) | | Net amount recognized | | $ | (8,150 | ) | | $ | 11,515 | | | $ | (23,384 | ) | | $ | (22,044 | ) | | $ | (20,365 | ) | | $ | (11,541 | ) | | $ | (23,336 | ) | | $ | (23,651 | ) | | | | | | | | | | | | | | | | | | | | | | | | | | | | | | | | | | | Amounts recognized in the consolidated balance sheet: | | | | | | | | | | | | | | | | | | Amounts recognized in the consolidated balance sheet: | | | | | | | | | | | | | | | | | | | Current liability | | $ | (721 | ) | | $ | (720 | ) | | $ | (925 | ) | | $ | (1,106 | ) | | $ | (749 | ) | | $ | (733 | ) | | $ | (1,009 | ) | | $ | (1,007 | ) | | Noncurrent benefit liability | | | (61,642 | ) | | | (78,563 | ) | | | (17,956 | ) | | | (27,725 | ) | | | (95,753 | ) | | | (78,550 | ) | | | (19,415 | ) | | | (20,351 | ) | | Accumulated other comprehensive loss | | | 54,213 | | | | 90,798 | | | | (4,503 | ) | | | 6,787 | | | | Accumulated other comprehensive loss (income) | | | | 76,137 | | | | 67,742 | | | | (2,912 | ) | | | (2,293 | ) | | Net amount recognized | | $ | (8,150 | ) | | $ | 11,515 | | | $ | (23,384 | ) | | $ | (22,044 | ) | | $ | (20,365 | ) | | $ | (11,541 | ) | | $ | (23,336 | ) | | $ | (23,651 | ) | | | | | | | | | | | | | | | | | | | | | | | | | | | | | | | | | | | | Amounts recognized in accumulated | | | | | | | | | | | | | | | | | | | | | | | | | | | | | | | | | other comprehensive loss: | | | | | | | | | | | | | | | | | | other comprehensive loss (income): | | | | | | | | | | | | | | | | | | | Net actuarial loss (income) | | $ | 56,148 | | | $ | 92,940 | | | $ | (3,001 | ) | | $ | 8,561 | | | $ | 77,368 | | | $ | 69,153 | | | $ | (1,801 | ) | | $ | (987 | ) | | Prior service cost | | | (1,935 | ) | | | (2,142 | ) | | | (1,502 | ) | | | (1,774 | ) | | | (1,231 | ) | | | (1,411 | ) | | | (1,111 | ) | | | (1,306 | ) | | Net amount recognized | | $ | 54,213 | | | $ | 90,798 | | | $ | (4,503 | ) | | $ | 6,787 | | | $ | 76,137 | | | $ | 67,742 | | | $ | (2,912 | ) | | $ | (2,293 | ) | | | | | | | | | | | | | | | | | | | | | | | | | | | | | | | | | | |
(1) Pension benefit payments in fiscal 2015 includes $10,000 of lump sum distributions that were made to certain terminated vested employees as a settlement of the employees' pension obligations. These distributions did not meet the threshold to qualify as a settlement under U.S. GAAP and therefore, no unamortized actuarial loss was recognized in the Statement of Income upon completion of the lump sum distributions.
NOTES TO CONSOLIDATED FINANCIAL STATEMENTS (continued) (Dollar amounts in thousands, except per share data)
| 11. | PENSION AND OTHER POSTRETIREMENT PLANS (continued) |
Based upon actuarial valuations performed as of September 30, 20132015 and 2012,2014, the accumulated benefit obligation for the Company’sCompany's defined benefit pension plans was $156,661$208,407 and $172,142$180,265 at September 30, 20132015 and 2012,2014, respectively, and the projected benefit obligation for the Company’sCompany's defined benefit pension plans was $186,077$238,727 and $195,860$211,036 at September 30, 20132015 and 2012,2014, respectively.
Net periodic pension and other postretirement benefit cost for the plans included the following:
| | | Pension | | | Other Postretirement | | | Pension | | | Other Postretirement | | | | | 2013 | | | 2012 | | | 2011 | | | 2013 | | | 2012 | | | 2011 | | | 2015 | | | 2014 | | | 2013 | | | 2015 | | | 2014 | | | 2013 | | | | | | | | | | | | | | | | | | | | | | | | | | | | | | | | | | | | | | | | | Service cost | | $ | 7,160 | | | $ | 5,852 | | | $ | 5,016 | | | $ | 796 | | | $ | 730 | | | $ | 632 | | | $ | 6,764 | | | $ | 6,150 | | | $ | 7,160 | | | $ | 454 | | | $ | 436 | | | $ | 796 | | | Interest cost | | | 8,024 | | | | 7,842 | | | | 7,510 | | | | 1,129 | | | | 1,283 | | | | 1,254 | | | | 8,740 | | | | 8,927 | | | | 8,024 | | | | 885 | | | | 919 | | | | 1,129 | | | Expected return on plan assets | | | (9,071 | ) | | | (7,836 | ) | | | (7,398 | ) | | | - | | | | - | | | | - | | | | (10,151 | ) | | | (9,666 | ) | | | (9,071 | ) | | | - | | | | - | | | | - | | | Amortization: | | | | | | | | | | | | | | | | | | | | | | | | | | | | | | | | | | | | | | | | | | | | | | | | | | Prior service cost | | | (206 | ) | | | (45 | ) | | | 26 | | | | (272 | ) | | | (451 | ) | | | (476 | ) | | | (180 | ) | | | (206 | ) | | | (206 | ) | | | (195 | ) | | | (195 | ) | | | (272 | ) | | Net actuarial loss | | | 7,903 | | | | 6,814 | | | | 5,364 | | | | 439 | | | | 535 | | | | 407 | | | | Net actuarial loss (gain) | | | | 6,203 | | | | 3,927 | | | | 7,903 | | | | - | | | | (87 | ) | | | 439 | | | Net benefit cost | | $ | 13,810 | | | $ | 12,627 | | | $ | 10,518 | | | $ | 2,092 | | | $ | 2,097 | | | $ | 1,817 | | | $ | 11,376 | | | $ | 9,132 | | | $ | 13,810 | | | $ | 1,144 | | | $ | 1,073 | | | $ | 2,092 | |
Benefit payments under the Company’sCompany's principal retirement plan are made from plan assets, while benefit payments under the supplemental retirement plan and postretirement benefit plan are made from the Company’sCompany's operating cash. Under I.R.S. regulations, the Company was not required to make any significant contributions to its principal retirement plan in fiscal 2013.2015. The Company is not required to make any significant contributions to its principal retirement plan in fiscal 2014.2016.
Contributions made in fiscal 20132015 are as follows:
| Contributions | | Pension | | | Other Postretirement | | | | | | | | | | | Principal retirement plan | | $ | 2,500 | | | $ | - | | | Supplemental retirement plan | | | 725 | | | | - | | | Other postretirement plan | | | - | | | | 751 | |
| Contributions | | Pension | | | Other Postretirement | | | | | | | | | | Principal retirement plan | | $ | - | | | $ | - | | | Supplemental retirement plan | | | 725 | | | | - | | | Other retirement plans | | | 1,081 | | | | - | | | Other postretirement plan | | | - | | | | 1,459 | |
Amounts of AOCLAOCI expected to be recognized in net periodic benefit costs in fiscal 20142016 include:
| | | | | | Other | | | | | Pension | | | Postretirement | | | | | Benefits | | | Benefits | | | | | | | | | | | Net actuarial loss | | $ | 7,473 | | | $ | - | | | Prior service cost | | | (183 | ) | | | (195 | ) |
| | | | | | Other | | | | | Pension | | | Postretirement | | | | | Benefits | | | Benefits | | | | | | | | | | | Net actuarial loss | | $ | 3,964 | | | $ | (87 | ) | | Prior service cost | | | (206 | ) | | | (195 | ) |
The measurement date of annual actuarial valuations for the Company's principal retirement and other postretirement benefit plans was September 30 for fiscal 2015, 2014 and 2013. The weighted-average assumptions for those plans were:
| | | Pension | | | Other Postretirement | | | | 2015 | | | 2014 | | | 2013 | | | 2015 | | | 2014 | | | 2013 | | | Discount rate | | | 4.25 | % | | | 4.25 | % | | | 5.00 | % | | | 4.25 | % | | | 4.25 | % | | | 5.00 | % | | Return on plan assets | | | 7.25 | | | | 7.75 | | | | 8.00 | | | | - | | | | - | | | | - | | | Compensation increase | | | 3.50 | | | | 3.50 | | | | 3.50 | | | | - | | | | - | | | | - | |
NOTES TO CONSOLIDATED FINANCIAL STATEMENTS (continued) (Dollar amounts in thousands, except per share data)
| 11. | PENSION AND OTHER POSTRETIREMENT PLANS (continued) |
In October 2014, the Society of Actuaries' Retirement Plans Experience Committee released new mortality tables known as RP 2014. The measurement dateCompany considered these new tables and performed a review of annual actuarial valuations forits own mortality history to assess future improvements in mortality rates. In fiscal 2015, the Company’sCompany elected to value its principal retirement and other postretirement benefit plans was September 30 for fiscal 2013, 2012plan liabilities using a slightly modified assumption of future mortality which better approximates the plan participant population and 2011. The weighted-average assumptions for those plans were:
| | | Pension | | | Other Postretirement | | | | | 2013 | | | 2012 | | | 2011 | | | 2013 | | | 2012 | | | 2011 | | | Discount rate | | | 5.00 | % | | | 4.00 | % | | | 4.75 | % | | | 5.00 | % | | | 4.00 | % | | | 4.75 | % | | Return on plan assets | | | 8.00 | | | | 8.00 | | | | 8.00 | | | | - | | | | - | | | | - | | | Compensation increase | | | 3.50 | | | | 3.50 | | | | 3.50 | | | | - | | | | - | | | | - | |
reflects significant improvement in life expectancy over the previous mortality table, known as RP 2000. The underlying basis of the investment strategy of the Company’sCompany's defined benefit plans is to ensure the assets are invested to achieve a positive rate of return over the long term sufficient to meet the plans’plans' actuarial interest rate and provide for the payment of benefit obligations and expenses in perpetuity in a secure and prudent fashion, maintain a prudent risk level that balances growth with the need to preserve capital, diversify plan assets so as to minimize the risk of large losses or excessive fluctuations in market value from year to year, achieve investment results over the long term that compare favorably with other pension plans and appropriate indices. The Company’sCompany's investment policy, as established by the Company’sCompany's pension board, specifies the types of investments appropriate for the plans, asset allocation guidelines, criteria for the selection of investment managers, procedures to monitor overall investment performance as well as investment manager performance. It also provides guidelines enabling plan fiduciaries to fulfill their responsibilities.
The Company’s primaryCompany's defined benefit pension plan’splans' weighted-average asset allocation at September 30, 20132015 and 20122014 and weighted-average target allocation were as follows:
| | | Plan Assets at | | | Target | | | Plan Assets at | | | Target | | | Asset Category | | 2013 | | | 2012 | | | Allocation | | | 2015 | | | 2014 | | | Allocation | | | Equity securities | | $ | 67,954 | | | $ | 63,186 | | | | 55 | % | | $ | 60,460 | | | $ | 66,984 | | | | 50 | % | | Fixed income, cash and cash equivalents | | | 36,817 | | | | 35,218 | | | | 30 | % | | | 59,612 | | | | 44,341 | | | | 30 | % | | Other investments | | | 18,942 | | | | 18,173 | | | | 15 | % | | | 22,153 | | | | 20,428 | | | | 20 | % | | | | $ | 123,713 | | | $ | 116,577 | | | | 100 | % | | $ | 142,225 | | | $ | 131,753 | | | | 100 | % |
The target asset allocation relates to the Company's primary defined benefit pension plan. Plan assets in the table include the assets of the Aurora Casket Company, LLC pension plan, which has a target asset allocation of 15% equity securities and 85% fixed income, cash and cash equivalents category include cash of 2% and 4% of plan assets at September 30, 2013 and 2012, respectively, which reflects cash contributions to the Company’s principal pension plan immediately prior to the end of each fiscal year.equivalents.
Based on an analysis of the historical and expected future performance of the plan's assets and information provided by its independent investment advisor, the Company set the long-term rate of return assumption for these assets at 8.0%7.25% in 20132015 for purposes of determining pension cost and funded status under current guidance. The Company’sCompany's discount rate assumption used in determining the present value of the projected benefit obligation is based upon published indices.
The Company categorizes plan assets within a three level fair value hierarchy (see Note 3 for a further discussion of the fair value hierarchy). The valuation methodologies used to measure the fair value of pension assets, including the level in the fair value hierarchy in which each type of pension plan asset is classified as follows.
Equity securities consist of direct investments in the stocks of publicly traded companies. Such investments are valued based on the closing price reported in an active market on which the individual securities are traded. As such, the direct investments are classified as Level 1.
Mutual funds are valued at the net asset values of shares held by the Plan at year end. As such, these mutual fund investments are classified as Level 1.
NOTES TO CONSOLIDATED FINANCIAL STATEMENTS (continued) (Dollar amounts in thousands, except per share data)
| 11. | PENSION AND OTHER POSTRETIREMENT PLANS (continued) |
Mutual funds are valued at the closing price of shares held by the Plan at year end. As such, these mutual fund investments are classified as Level 1.
Fixed income securities consist of publicly traded fixed interest obligations (primarily U.S. government notes and corporate and agency bonds). Such investments are valued through consultation and evaluation with brokers in the institutional market using quoted prices and other observable market data. As such, U.S. government notes are included in Level 1, and the remainder of the fixed income securities is included in Level 2.
Cash and cash equivalents consist of direct cash holdings and short-term money market mutual funds. These values are valued based on cost, which approximates fair value, and as such, are classified as Level 1.
Other investments consist primarily of real estate, commodities, private equity holdings and hedge fund investments. These holdings are valued by investment managers based on the most recent information available. The valuation information used by investment managers may not be readily observable. As such, these investments are classified as Level 3.
The Company’sCompany's defined benefit pension plans’plans' asset categories at September 30, 20132015 and 20122014 were as follows:
| | | September 30, 2013 | | | September 30, 2015 | | | Asset Category | | Level 1 | | | Level 2 | | | Level 3 | | | Total | | | Level 1 | | | Level 2 | | | Level 3 | | | Total | | | Equity securities - stocks | | $ | 36,127 | | | $ | - | | | $ | - | | | $ | 36,127 | | | $ | 31,559 | | | $ | - | | | $ | - | | | $ | 31,559 | | | Equity securities - mutual funds | | | 30,507 | | | | 1,320 | | | | - | | | | 31,827 | | | | 27,846 | | | | 1,055 | | | | - | | | | 28,901 | | | Fixed income securities | | | 17,912 | | | | 9,487 | | | | - | | | | 27,399 | | | | 39,644 | | | | 15,474 | | | | - | | | | 55,118 | | | Cash and cash equivalents | | | 9,418 | | | | - | | | | - | | | | 9,418 | | | | 4,494 | | | | - | | | | - | | | | 4,494 | | | Other investments | | | - | | | | - | | | | 18,942 | | | | 18,942 | | | | 8,171 | | | | - | | | | 13,982 | | | | 22,153 | | | Total | | $ | 93,964 | | | $ | 10,807 | | | $ | 18,942 | | | $ | 123,713 | | | $ | 111,714 | | | $ | 16,529 | | | $ | 13,982 | | | $ | 142,225 | |
| | | September 30, 2012 | | | September 30, 2014 | | | Asset Category | | Level 1 | | | Level 2 | | | Level 3 | | | Total | | | Level 1 | | | Level 2 | | | Level 3 | | | Total | | | Equity securities - stocks | | $ | 34,127 | | | $ | - | | | $ | - | | | $ | 34,127 | | | $ | 35,310 | | | $ | - | | | $ | - | | | $ | 35,310 | | | Equity securities - mutual funds | | | 29,059 | | | | - | | | | - | | | | 29,059 | | | | 30,694 | | | | 980 | | | | - | | | | 31,674 | | | Fixed income securities | | | 10,523 | | | | 12,707 | | | | - | | | | 23,230 | | | | 20,042 | | | | 9,503 | | | | - | | | | 29,545 | | | Cash and cash equivalents | | | 11,988 | | | | - | | | | - | | | | 11,988 | | | | 14,796 | | | | - | | | | - | | | | 14,796 | | | Other investments | | | - | | | | - | | | | 18,173 | | | | 18,173 | | | | 6,098 | | | | - | | | | 14,330 | | | | 20,428 | | | Total | | $ | 85,697 | | | $ | 12,707 | | | $ | 18,173 | | | $ | 116,577 | | | $ | 106,940 | | | $ | 10,483 | | | $ | 14,330 | | | $ | 131,753 | |
Changes in the fair value of Level 3 assets at September 30, 20132015 and 20122014 are summarized as follows:
| | | Fair Value, | | | | | | | | | | | | | | | Fair Value, | | | | | Beginning of | | | | | | | | | Realized | | | Unrealized | | | End of | | | Asset Category | | Period | | | Acquisitions | | | Dispositions | | | Gains (Losses) | | | Gains | | | Period | | Other investments: | | | | | | | | | | | | | | | | | | | | Fiscal Year Ended: | | | | | | | | | | | | | | | | | | | | September 30, 2013 | | $ | 18,173 | | | $ | - | | | | - | | | $ | 48 | | | $ | 721 | | | $ | 18,942 | | | September 30, 2012 | | | 13,375 | | | | 3,800 | | | | - | | | | 766 | | | | 232 | | | | 18,173 | |
| | | Fair Value, | | | | | | | | | | | | | | | Fair Value, | | | | | Beginning of | | | | | | | | | Realized | | | Unrealized | | | End of | | | Asset Category | | Period | | | Acquisitions | | | Dispositions | | | Gains | | | Gains (Losses) | | | Period | | Other investments: | | | | | | | | | | | | | | | | | | | | Fiscal Year Ended: | | | | | | | | | | | | | | | | | | | | September 30, 2015 | | $ | 14,330 | | | $ | - | | | $ | (1,661 | ) | | $ | 608 | | | $ | 705 | | | $ | 13,982 | | | September 30, 2014 | | | 18,942 | | | | - | | | | (5,439 | ) | | | 1,118 | | | | (291 | ) | | | 14,330 | |
NOTES TO CONSOLIDATED FINANCIAL STATEMENTS (continued) (Dollar amounts in thousands, except per share data)
| 11. | PENSION AND OTHER POSTRETIREMENT PLANS (continued) |
Benefit payments expected to be paid are as follows:
| | | | | | Other | | | | | | Other | | | | | Pension | | | Postretirement | | | Pension | | | Postretirement | | | Years ending September 30: | | Benefits | | | Benefits | | | Benefits | | | Benefits | | | | | | | | | | | | | | | | | 2014 | | $ | 7,080 | | | $ | 926 | | | | 2015 | | | 7,722 | | | | 917 | | | | 2016 | | | 8,190 | | | | 1,004 | | | $ | 9,074 | | | $ | 1,009 | | | 2017 | | | 8,550 | | | | 1,126 | | | | 9,519 | | | | 1,051 | | | 2018 | | | 9,063 | | | | 1,186 | | | | 10,075 | | | | 1,146 | | | 2019-2023 | | | 53,709 | | | | 6,275 | | | | 2019 | | | | 10,673 | | | | 1,194 | | | 2020 | | | | 11,249 | | | | 1,169 | | | 2021-2025 | | | | 65,563 | | | | 6,507 | | | | | $ | 94,314 | | | $ | 11,434 | | | $ | 116,153 | | | $ | 12,076 | |
For measurement purposes, a rate of increase of 8.0%7.0% in the per capita cost of health care benefits was assumed for 2013;2016; the rate was assumed to decrease gradually to 5.0%4.0% for 20302070 and remain at that level thereafter. Assumed health care cost trend rates have a significant effect on the amounts reported. An increase in the assumed health care cost trend rates by one percentage point would have increased the accumulated postretirement benefit obligation as of September 30, 20132015 by $967$923 and the aggregate of the service and interest cost components of net periodic postretirement benefit cost for the year then ended by $107.$68. A decrease in the assumed health care cost trend rates by one percentage point would have decreased the accumulated postretirement benefit obligation as of September 30, 20132015 by $846$809 and the aggregate of the service and interest cost components of net periodic postretirement benefit cost for the year then ended by $94.$59.
Prior to its acquisition by Matthews, Schawk participated in a multi-employer pension fund pursuant to certain collective bargaining agreements. In 2012, Schawk bargained to withdraw from the fund, and recorded a withdrawal liability at the conclusion of the negotiations, based on the present value of installment payments expected to be paid through 2034. During the third quarter of fiscal 2015, the Company finalized an agreement to settle this installment payment obligation in exchange for a lump-sum payment of $18,157. Full payment of this amount was made during the fourth quarter of fiscal 2015, and is presented within cash flows from financing activities on the Consolidated Statement of Cash Flows. This settlement also resulted in an $11,522 gain recognized in other income (deductions), net during fiscal 2015.
| 12. | ACCUMULATED OTHER COMPREHENSIVE INCOME: |
The changes in AOCI by component, net of tax, for the year ended September 30, 2015 were as follows:
| | | | Postretirement Benefit Plans | | | Currency Translation Adjustment | | | Derivatives | | | Total | | | Attributable to Matthews: | | | | | | | | | | | | | | | Balance, September 30, 2014 | | | $ | (39,651 | ) | | $ | (27,367 | ) | | $ | 201 | | | $ | (66,817 | ) | | OCI before reclassification | | | | (7,378 | ) | | | (77,237 | ) | | | (4,841 | ) | | | (89,456 | ) | | Amounts reclassified from AOCI | | (a) | | 3,555 | | | | - | | (b) | | 2,392 | | | | 5,947 | | | Net current-period OCI | | | | (3,823 | ) | | | (77,237 | ) | | | (2,449 | ) | | | (83,509 | ) | | Balance, September 30, 2015 | | | $ | (43,474 | ) | | $ | (104,604 | ) | | $ | (2,248 | ) | | $ | (150,326 | ) | | Attributable to noncontrolling interest: | | | | | | | | | | | | | | | | | | | Balance, September 30, 2014 | | | $ | - | | | $ | 516 | | | $ | - | | | $ | 516 | | | OCI before reclassification | | | | - | | | | (150 | ) | | | - | | | | (150 | ) | | Net current-period OCI | | | | - | | | | (150 | ) | | | - | | | | (150 | ) | | Balance, September 30, 2015 | | | $ | - | | | $ | 366 | | | $ | - | | | $ | 366 | |
| (a) | Amounts were included in net periodic benefit cost for pension and other postretirement benefit plans (see Note 11). |
| (b) | Amounts were included in interest expense in the periods the hedged item affected earnings (see Note 7). |
NOTES TO CONSOLIDATED FINANCIAL STATEMENTS, continued (Dollar amounts in thousands, except per share data)
| 12. | ACCUMULATED OTHER COMPREHENSIVE INCOME (continued) |
Reclassifications out of AOCI for the year ended September 30, 2015 were as follows:
Details about AOCI Components | | | Year ended September 30, 2015 | | Affected line item in the Statement of Income | | | | | | | | | Postretirement benefit plans | | | | | | | Prior service (cost) credit | | (a) | $ | 375 | | | | Actuarial losses | | (a) | | (6,203 | ) | | | | (b) | | (5,828 | ) | Total before tax | | | | | | (2,273 | ) | Tax provision (benefit) | | | | | $ | (3,555 | ) | Net of tax | | Derivatives | | | | | | | | Interest rate swap contracts | | | $ | (3,922 | ) | Interest expense | | | (b) | | (3,922 | ) | Total before tax | | | | | | (1,530 | ) | Tax provision (benefit) | | | | | $ | (2,392 | ) | Net of tax |
| (a) | Amounts are included in the computation of pension and other postretirement benefit expense, which is reported in both cost of goods sold and selling and administrative expenses. For additional information, see Note 11. |
| (b) | For pre-tax items, positive amounts represent income and negative amounts represent expense. |
The provision for income taxes consisted of the following:
| | | 2015 | | | 2014 | | | 2013 | | | Current: | | | | | | | | | | | Federal | | $ | 655 | | | $ | 7,371 | | | $ | 15,703 | | | State | | | 1,466 | | | | 3,612 | | | | 3,423 | | | Foreign | | | 10,599 | | | | 10,427 | | | | 4,804 | | | | | | 12,720 | | | | 21,410 | | | | 23,930 | | | Deferred | | | 13,644 | | | | 1,395 | | | | 2,244 | | | Total | | $ | 26,364 | | | $ | 22,805 | | | $ | 26,174 | | | | | | | | | | | | | | | |
| | | 2013 | | | 2012 | | | 2011 | | | Current: | | | | | | | | | | | Federal | | $ | 15,703 | | | $ | 14,060 | | | $ | 15,306 | | | State | | | 3,423 | | | | 2,483 | | | | 3,004 | | | Foreign | | | 4,804 | | | | 6,437 | | | | 10,689 | | | | | | 23,930 | | | | 22,980 | | | | 28,999 | | | Deferred | | | 2,734 | | | | 5,737 | | | | 9,557 | | | Total | | $ | 26,664 | | | $ | 28,717 | | | $ | 38,556 | | | | | | | | | | | | | | | |
NOTES TO CONSOLIDATED FINANCIAL STATEMENTS (continued) (Dollar amounts in thousands, except per share data)
| 13. | INCOME TAXES (continued) |
The reconciliation of the federal statutory tax rate to the consolidated effective tax rate was as follows:
| | | 2013 | | | 2012 | | | 2011 | | | 2015 | | | 2014 | | | 2013 | | | Federal statutory tax rate | | | 35.0 | % | | | 35.0 | % | | | 35.0 | % | | | 35.0 | % | | | 35.0 | % | | | 35.0 | % | | Effect of state income taxes, net of federal deduction | | | 2.7 | | | | 2.1 | | | | 2.5 | | | | 1.8 | | | | 3.8 | | | | 2.7 | | | Foreign taxes less than federal statutory rate | | | (3.1 | ) | | | (0.6 | ) | | | (1.3 | ) | | | (3.2 | ) | | | (2.1 | ) | | | (3.1 | ) | | Other | | | (1.9 | ) | | | (2.3 | ) | | | (1.8 | ) | | | (4.2 | ) | | | (2.2 | ) | | | (2.0 | ) | | Effective tax rate | | | 32.7 | % | | | 34.2 | % | | | 34.4 | % | | | 29.4 | % | | | 34.5 | % | | | 32.6 | % |
NOTES TO CONSOLIDATED FINANCIAL STATEMENTS (continued)
(Dollar amountsThe Company's effective tax rate for fiscal 2015 was 29.4%, compared to 34.5% for fiscal 2014. The decrease in thousands, except per share data)
12. INCOME TAXES (continued)the fiscal 2015 effective tax rate, compared to fiscal 2014, primarily reflected the benefit of the utilization of certain tax attributes as a result of legal structure reorganization in foreign jurisdictions and a relative increase in the amount of earnings generated from non-U.S. locations. The effective tax rate in fiscal 2014 included the impact of non-deductible acquisition costs relating to the Schawk acquisition. The difference between the Company's effective tax rate and the Federal statutory rate of 35.0% primarily reflected the impact of state taxes, offset by lower foreign income taxes.
The Company's foreign subsidiaries had income before income taxes for the years ended September 30, 2013, 20122015, 2014 and 20112013 of approximately $23,662, $24,654$40,024, $23,835 and $36,870,$23,662, respectively. At September 30, 2013,2015, undistributed earnings of foreign subsidiaries for which deferred U.S. income taxes have not been provided approximated $225,084.$409,167. The Company has not determined the deferred tax liability associated with these undistributed earnings, as such determination is not practicable.
The components of deferred tax assets and liabilities at September 30, 20132015 and 20122014 are as follows:
| | | 2015 | | | 2014 | | | Deferred tax assets: | | | | | | | | Pension and postretirement benefits | | $ | 42,134 | | | $ | 34,309 | | | Accruals and reserves not currently deductible | | | 27,586 | | | | 28,090 | | | Income tax credit carryforward | | | 9,160 | | | | 9,839 | | | Operating and capital loss carryforwards | | | 25,012 | | | | 25,419 | | | Stock options | | | 8,550 | | | | 8,366 | | | Other | | | 7,396 | | | | 21,089 | | | Total deferred tax assets | | | 119,838 | | | | 127,112 | | | Valuation allowances | | | (20,977 | ) | | | (24,540 | ) | | Net deferred tax assets | | | 98,861 | | | | 102,572 | | | | | | | | | | | | | Deferred tax liabilities: | | | | | | | | | | Depreciation | | | (8,509 | ) | | | (7,651 | ) | | Goodwill and intangible assets | | | (193,876 | ) | | | (183,685 | ) | | Other | | | (20,490 | ) | | | (18,590 | ) | | | | | (222,875 | ) | | | (209,926 | ) | | | | | | | | | | | | Net deferred tax liability | | $ | (124,014 | ) | | $ | (107,354 | ) |
| | | 2013 | | | 2012 | | | Deferred tax assets: | | | | | | | | Postretirement benefits | | $ | 7,365 | | | $ | 11,244 | | | Environmental reserve | | | 1,903 | | | | 2,217 | | | Pension costs | | | 19,415 | | | | 30,145 | | | Deferred compensation | | | 66 | | | | 281 | | | Stock options | | | 10,690 | | | | 9,653 | | | Other | | | 24,261 | | | | 24,370 | | | | | | 63,700 | | | | 77,910 | | | Deferred tax liabilities: | | | | | | | | | | Depreciation | | | (3,693 | ) | | | (4,220 | ) | | Goodwill | | | (67,012 | ) | | | (57,767 | ) | | Other | | | (1,630 | ) | | | (206 | ) | | | | | (72,335 | ) | | | (62,193 | ) | | | | | | | | | | | | Net deferred tax asset | | $ | (8,635 | ) | | $ | 15,717 | |
63
NOTES TO CONSOLIDATED FINANCIAL STATEMENTS (continued) (Dollar amounts in thousands, except per share data)
| 13. | INCOME TAXES (continued) |
At September 30, 2015, the Company had U.S. state net operating loss carryforwards of $91,750, foreign net operating loss carryforwards of $66,542, foreign capital loss carryforwards of $24,130, and various U.S. and non-U.S. income tax credit carryforwards of $4,922 and $4,238, respectively, which will be available to offset future income tax liabilities. If not used, state net operating losses will begin to expire in 2017. Foreign net operating losses have no expiration period. Certain of these carryforwards are subject to limitations on use due to tax rules affecting acquired tax attributes, loss sharing between group members, and business continuation. Therefore, the Company has established tax-effected valuation allowances against these tax benefits in the amount of $20,977 at September 30, 2015. At September 30, 2015, the Company had total foreign tax credit carryforwards of $2,782, offset by a valuation allowance of $153. The Company has the ability to claim a deduction for these credits prior to expiration, and the net carrying value of the credits of $2,629 assumes that a deduction will be claimed instead of a tax credit. If unutilized, these U.S. foreign tax credits will begin to expire in 2018. The increase in deferred tax liabilities resulted primarily from purchase accounting adjustments and the acquisition of Aurora Products Group, LLC ("Aurora") in August 2015. The decrease in the valuation allowances from fiscal 2014 resulted from a fiscal 2015 legal structure reorganization in foreign jurisdictions that enabled the utilization of certain tax attributes.
Changes in the total amount of gross unrecognized tax benefits (excluding penalties and interest) are as follows:
| | | 2015 | | | 2014 | | | 2013 | | | Balance, beginning of year | | $ | 4,311 | | | $ | 4,516 | | | $ | 4,501 | | | Increase from acquisition | | | - | | | | 385 | | | | - | | | Increases for tax positions of prior years | | | 475 | | | | 369 | | | | - | | | Decreases for tax positions of prior years | | | (155 | ) | | | (863 | ) | | | (124 | ) | | Increases based on tax positions related to the current year | | | 635 | | | | 623 | | | | 708 | | | Decreases due to settlements with taxing authorities | | | (27 | ) | | | (12 | ) | | | (250 | ) | | Decreases due to lapse of statute of limitation | | | (1,153 | ) | | | (707 | ) | | | (319 | ) | | Balance, end of year | | $ | 4,086 | | | $ | 4,311 | | | $ | 4,516 | |
| | | 2013 | | | 2012 | | | 2011 | | | Balance, beginning of year | | $ | 4,501 | | | $ | 4,721 | | | $ | 5,215 | | | Increases for tax positions of prior years | | | - | | | | 742 | | | | - | | | Decreases for tax positions of prior years | | | (124 | ) | | | (74 | ) | | | (96 | ) | | Increases based on tax positions related to the current year | | | 708 | | | | 137 | | | | 202 | | | Decreases due to settlements with taxing authorities | | | (250 | ) | | | (602 | ) | | | (38 | ) | | Decreases due to lapse of statute of limitation | | | (319 | ) | | | (423 | ) | | | (562 | ) | | Balance, end of year | | $ | 4,516 | | | $ | 4,501 | | | $ | 4,721 | |
The Company had unrecognized tax benefits of $4,516$4,086 and $4,501$4,311 at September 30, 20132015 and 2012,2014, respectively, all of which, if recorded, would impact the annual effective tax rate. It is reasonably possible that the amount of unrecognized tax benefits could change by approximately $72$782 in the next 12 months primarily due to expiration of statutes related to specific tax positions.
The Company classifies interest and penalties on tax uncertainties as a component of the provision for income taxes. For fiscal 2013, the Company included a net increase of $95 in interest and penalties as a component of the provision for income taxes. Total penalties and interest accrued were $2,401$2,010 and $2,306$2,135 at September 30, 20132015 and 2012,2014, respectively. These accruals may potentially be applicable in the event of an unfavorable outcome of uncertain tax positions.
NOTES TO CONSOLIDATED FINANCIAL STATEMENTS (continued)
(Dollar amounts in thousands, except per share data)
12. INCOME TAXES (continued)
The Company is currently under examination in several tax jurisdictions and remains subject to examination until the statute of limitation expires for those tax jurisdictions. As of September 30, 2013,2015, the tax years that remain subject to examination by major jurisdiction generally are:
| United States - Federal | 20102012 and forward | | United States - State | 20092011 and forward | | Canada | 20082010 and forward | | Europe | 20052009 and forward | | United Kingdom | 20102013 and forward | | Australia | 20092011 and forward | | Asia | 20082009 and forward |
NOTES TO CONSOLIDATED FINANCIAL STATEMENTS (continued) (Dollar amounts in thousands, except per share data)
13.14. | COMMITMENTS AND CONTINGENT LIABILITIES: |
The Company operates various production, warehouse and office facilities and equipment under operating lease agreements. Annual rentals under these and other operating leases were $17,664, $16,908$31,766, $21,849 and $16,323$17,664 in fiscal 2013, 20122015, 2014 and 2011,2013, respectively. Future minimum rental commitments under non-cancelable operating lease arrangements for fiscal years 20142016 through 20182020 are $10,048, $6,331, $3,816, $1,780$17,149, $11,404, $6,544, $4,747 and $504,$2,460, respectively.
The Company is party to various legal proceedings, the eventual outcome of which are not predictable. Although the ultimate disposition of these proceedings is not presently determinable, management is of the opinion that they should not result in liabilities in an amount which would materially affect the Company’sCompany's consolidated financial position, results of operations or cash flows.
The Company has employment agreements with certain employees, the terms of which expire at various dates between fiscal 20142016 and 2018.2019. The agreements generally provide for base salary and bonus levels and include non-compete provisions. The aggregate commitment for salaries under these agreements at September 30, 20132015 was $9,752.
$8,401.
14.15. | ENVIRONMENTAL MATTERS: |
The Company's operations are subject to various federal, state and local laws and regulations relating to the protection of the environment. These laws and regulations impose limitations on the discharge of materials into the environment and require the Company to obtain and operate in compliance with conditions of permits and other government authorizations. As such, the Company has developed environmental, health and safety policies and procedures that include the proper handling, storage and disposal of hazardous materials.
The Company is party to various environmental matters. These include obligations to investigate and mitigate the effects on the environment of the disposal of certain materials at various operating and non-operating sites. The Company is currently performing environmental assessments and remediation at these sites, as appropriate.
NOTES TO CONSOLIDATED FINANCIAL STATEMENTS (continued)
(Dollar amounts in thousands, except per share data)
14. | ENVIRONMENTAL MATTERS (continued) |
At September 30, 2013,2015, an accrual of $5,324$4,349 had been recorded for environmental remediation (of which $1,218$1,239 was classified in other current liabilities), representing management's best estimate of the probable and reasonably estimable costs of the Company's known remediation obligations. The accrual which reflects previously established reserves assumed with the acquisition of York and additional reserves recorded as a purchase accounting adjustment, does not consider the effects of inflation and anticipated expenditures are not discounted to their present value. While final resolution of these contingencies could result in costs different than current accruals, management believes the ultimate outcome will not have a significant effect on the Company's consolidated results of operations or financial position.
15.16. | SUPPLEMENTAL CASH FLOW INFORMATION: |
Changes in working capital items as presented in the Consolidated Statements of Cash Flows consisted of the following:
| | | 2015 | | | 2014 | | | 2013 | | | Current assets: | | | | | | | | | | | Accounts receivable | | $ | 7,566 | | | $ | (13,492 | ) | | $ | (2,786 | ) | | Inventories | | | 17,001 | | | | 4,429 | | | | 3,827 | | | Other current assets | | | (14,567 | ) | | | (9,531 | ) | | | 1,350 | | | | | | 10,000 | | | | (18,594 | ) | | | 2,391 | | | Current liabilities: | | | | | | | | | | | | | | Trade accounts payable | | | (9,103 | ) | | | 5,720 | | | | (1,205 | ) | | Accrued compensation | | | (183 | ) | | | (2,504 | ) | | | 7,143 | | | Accrued income taxes | | | 3,389 | | | | 1,330 | | | | (2,278 | ) | | Other current liabilities | | | (6,854 | ) | | | 7,883 | | | | (9,054 | ) | | | | | (12,751 | ) | | | 12,429 | | | | (5,394 | ) | | Net change | | $ | (2,751 | ) | | $ | (6,165 | ) | | $ | (3,003 | ) |
| | | 2013 | | | 2012 | | | 2011 | | | Current assets: | | | | | | | | | | | Accounts receivable | | $ | (2,586 | ) | | $ | (7,554 | ) | | $ | (5,560 | ) | | Inventories | | | 2,870 | | | | (3,463 | ) | | | (13,627 | ) | | Other current assets | | | 2,107 | | | | (4,655 | ) | | | (2,265 | ) | | | | | 2,391 | | | | (15,672 | ) | | | (21,452 | ) | | Current liabilities: | | | | | | | | | | | | | | Trade accounts payable | | | (1,205 | ) | | | 1,024 | | | | 6,983 | | | Accrued compensation | | | 7,143 | | | | (1,476 | ) | | | (8,250 | ) | | Accrued income taxes | | | (2,278 | ) | | | (2,649 | ) | | | (3,167 | ) | | Customer prepayments | | | (2,530 | ) | | | 1,162 | | | | 2,028 | | | Other current liabilities | | | (9,329 | ) | | | 1,208 | | | | 765 | | | | | | (8,199 | ) | | | (731 | ) | | | (1,641 | ) | | Net change | | $ | (5,808 | ) | | $ | (16,403 | ) | | $ | (23,093 | ) |
NOTES TO CONSOLIDATED FINANCIAL STATEMENTS (continued) (Dollar amounts in thousands, except per share data)
16.17. | SEGMENT INFORMATION: |
Beginning October 1, 2014, the Company realigned its operations into three reporting segments, SGK Brand Solutions, Memorialization and Industrial. The SGK Brand Solutions segment is comprised of the graphics imaging business, including Schawk, and the merchandising solutions operations. The Memorialization segment is comprised of the Company's cemetery products, funeral home products and operations consist of two principal businesses that arecremation operations. The Industrial segment is comprised of three operating segments each, as described under Nature of Operations (Note 1): Memorialization Products (Cemetery Products, Funeral Home Products, Cremation)the Company's marking and Brand Solutions (Graphics Imaging, Markingautomation products and Fulfillment Systems, Merchandising Solutions).fulfillment systems. Prior periods have been revised to conform with the current presentation. Management evaluates segment performance based on operating profit (before income taxes) and does not allocate non-operating items such as investment income, interest expense, other income (deductions), net and noncontrolling interests.
The accounting policies of the segments are the same as those described in Summary of Significant Accounting Policies (Note 2). Intersegment sales are accounted for at negotiated prices. Operating profit is total revenue less operating expenses. Segment assets include those assets that are used in the Company's operations within each segment. Assets classified under “Other”"Other" principally consist of cash and cash equivalents, investments, deferred income taxes and corporate headquarters' assets. Long-lived
assets include property, plant and equipment (net of accumulated depreciation), goodwill, and other intangible assets (net of accumulated amortization).
NOTES TO CONSOLIDATED FINANCIAL STATEMENTS (continued)
(Dollar amounts in thousands, except per share data)
16. | SEGMENT INFORMATION (continued) |
Information about the Company's segments follows:
| | | Memorialization | | | Brand Solutions | | | | | | | | | | | | | | | | | | | | | | | Marking and | | | | | | | | | | | | | | Cemetery | | | Funeral Home | | | | | | Graphics | | | Fulfillment | | | Merchandising | | | | | | | | | | | Products | | | Products | | | Cremation | | | Imaging | | | Systems | | | Solutions | | | Other | | | Consolidated | | | | | | | | | | | | | | | | | | | | | | | | | | | | | Sales to external customers: | | | | | | | | | | | | | | | | | | | | | 2013 | | $ | 226,586 | | | $ | 242,803 | | | $ | 48,522 | | | $ | 294,571 | | | $ | 93,505 | | | $ | 79,370 | | | $ | - | | | $ | 985,357 | | | 2012 | | | 215,943 | | | | 230,943 | | | | 45,981 | | | | 259,865 | | | | 74,621 | | | | 72,964 | | | | - | | | | 900,317 | | | 2011 | | | 224,773 | | | | 243,291 | | | | 39,278 | | | | 268,975 | | | | 61,938 | | | | 60,566 | | | | - | | | | 898,821 | | | | | | | | | | | | | | | | | | | | | | | | | | | | | | | | | | | | | Intersegment sales: | | | | | | | | | | | | | | | | | | | | | | | | | | | 2013 | | | 39 | | | | 172 | | | | 951 | | | | 416 | | | | 10 | | | | 527 | | | | - | | | | 2,115 | | | 2012 | | | 262 | | | | 4 | | | | 60 | | | | 2 | | | | 22 | | | | 702 | | | | - | | | | 1,052 | | | 2011 | | | 251 | | | | - | | | | 52 | | | | 177 | | | | 21 | | | | 90 | | | | - | | | | 591 | | | | | | | | | | | | | | | | | | | | | | | | | | | | | | | | | | | | | Depreciation and amortization: | | | | | | | | | | | | | | | | | | | | | | | | | | | 2013 | | | 4,034 | | | | 6,267 | | | | 351 | | | | 21,968 | | | | 1,675 | | | | 2,324 | | | | 1,246 | | | | 37,865 | | | 2012 | | | 3,255 | | | | 6,416 | | | | 396 | | | | 14,175 | | | | 1,048 | | | | 2,330 | | | | 1,201 | | | | 28,821 | | | 2011 | | | 2,955 | | | | 6,371 | | | | 244 | | | | 13,580 | | | | 530 | | | | 1,949 | | | | 2,032 | | | | 27,661 | | | | | | | | | | | | | | | | | | | | | | | | | | | | | | | | | | | | | Operating profit: | | | | | | | | | | | | | | | | | | | | | | | | | | | 2013 | | | 32,571 | | | | 37,263 | | | | 3,097 | | | | 9,724 | | | | 8,862 | | | | 4,275 | | | | - | | | | 95,792 | | | 2012 | | | 33,195 | | | | 26,525 | | | | 3,869 | | | | 14,843 | | | | 10,061 | | | | 5,084 | | | | - | | | | 93,577 | | | 2011 | | | 52,474 | | | | 29,039 | | | | 3,479 | | | | 22,427 | | | | 7,819 | | | | 3,278 | | | | - | | | | 118,516 | | | | | | | | | | | | | | | | | | | | | | | | | | | | | | | | | | | | | Total assets: | | | | | | | | | | | | | | | | | | | | | | | | | | | 2013 | | | 210,242 | | | | 286,576 | | | | 40,072 | | | | 425,823 | | | | 113,420 | | | | 69,012 | | | | 69,782 | | | | 1,214,927 | | | 2012 | | | 211,205 | | | | 299,248 | | | | 41,099 | | | | 356,458 | | | | 75,217 | | | | 66,170 | | | | 78,645 | | | | 1,128,042 | | | 2011 | | | 197,127 | | | | 311,841 | | | | 35,018 | | | | 351,595 | | | | 67,193 | | | | 60,491 | | | | 74,190 | | | | 1,097,455 | | | | | | | | | | | | | | | | | | | | | | | | | | | | | | | | | | | | | Capital expenditures: | | | | | | | | | | | | | | | | | | | | | | | | | | | 2013 | | | 8,415 | | | | 2,399 | | | | 174 | | | | 9,027 | | | | 2,904 | | | | 737 | | | | 1,268 | | | | 24,924 | | | 2012 | | | 3,811 | | | | 2,540 | | | | 396 | | | | 18,693 | | | | 2,513 | | | | 1,496 | | | | 3,787 | | | | 33,236 | | | 2011 | | | 1,618 | | | | 3,850 | | | | 501 | | | | 10,820 | | | | 295 | | | | 3,165 | | | | 2,191 | | | | 22,440 | |
Information about the Company's operations by geographic area follows:
| | | United States | | | Mexico | | | Canada | | | Europe | | | Australia | | | Asia | | | Consolidated | | | | | | | | | | | | | | | | | | | | | | | | | | Sales to external customers: | | | | | | | | | | | | | | | | | | | | | 2013 | | $ | 617,371 | | | $ | - | | | $ | 12,014 | | | $ | 328,266 | | | $ | 13,534 | | | $ | 14,172 | | | $ | 985,357 | | | 2012 | | | 569,435 | | | | - | | | | 11,967 | | | | 290,283 | | | | 13,778 | | | | 14,854 | | | | 900,317 | | | 2011 | | | 559,362 | | | | - | | | | 13,086 | | | | 298,773 | | | | 13,437 | | | | 14,163 | | | | 898,821 | | | | | | | | | | | | | | | | | | | | | | | | | | | | | | | | | Long-lived assets: | | | | | | | | | | | | | | | | | | | | | | | | | | | 2013 | | | 421,697 | | | | 3,731 | | | | 483 | | | | 324,731 | | | | 6,338 | | | | 13,404 | | | | 770,384 | | | 2012 | | | 395,565 | | | | 4,743 | | | | 507 | | | | 260,809 | | | | 7,041 | | | | 10,580 | | | | 679,245 | | | 2011 | | | 380,059 | | | | 5,726 | | | | 476 | | | | 259,860 | | | | 6,752 | | | | 9,459 | | | | 662,332 | |
| | | SGK Brand Solutions | | | Memorialization | | | Industrial | | | Other | | | Consolidated | | | Sales to external customers: | | | 2015 | | $ | 798,339 | | | $ | 508,058 | | | $ | 119,671 | | | $ | - | | | $ | 1,426,068 | | | 2014 | | | 497,328 | | | | 508,420 | | | | 100,849 | | | | - | | | | 1,106,597 | | | 2013 | | | 373,941 | | | | 517,911 | | | | 93,505 | | | | - | | | | 985,357 | | | Intersegment sales: | | | 2015 | | | 478 | | | | 77 | | | | 25 | | | | - | | | | 580 | | | 2014 | | | 463 | | | | 35 | | | | 31 | | | | - | | | | 529 | | | 2013 | | | 464 | | | | 12 | | | | 10 | | | | - | | | | 486 | | | Depreciation and amortization: | | | 2015 | | | 46,594 | | | | 12,410 | | | | 2,294 | | | | 1,322 | | | | 62,620 | | | 2014 | | | 27,700 | | | | 11,486 | | | | 2,203 | | | | 1,475 | | | | 42,864 | | | 2013 | | | 24,292 | | | | 10,652 | | | | 1,675 | | | | 1,246 | | | | 37,865 | | | Operating profit: | | | 2015 | | | 21,864 | | | | 70,064 | | | | 13,095 | | | | - | | | | 105,023 | | | 2014 | | | 2,536 | | | | 67,937 | | | | 11,049 | | | | - | | | | 81,522 | | | 2013 | | | 13,999 | | | | 71,754 | | | | 8,862 | | | | - | | | | 94,615 | | | Total assets: | | | 2015 | | | 1,171,914 | | | | 766,089 | | | | 116,867 | | | | 108,148 | | | | 2,163,018 | | | 2014 | | | 1,278,869 | | | | 557,089 | | | | 115,470 | | | | 72,620 | | | | 2,024,048 | | | 2013 | | | 495,808 | | | | 536,890 | | | | 113,420 | | | | 63,144 | | | | 1,209,262 | | | Capital expenditures: | | | 2015 | | | 23,676 | | | | 10,922 | | | | 5,866 | | | | 7,787 | | | | 48,251 | | | 2014 | | | 16,734 | | | | 8,257 | | | | 3,325 | | | | 921 | | | | 29,237 | | | 2013 | | | 9,764 | | | | 10,988 | | | | 2,904 | | | | 1,268 | | | | 24,924 | | | | | | | | | | | | | | | | | | | | | | | |
NOTES TO CONSOLIDATED FINANCIAL STATEMENTS (continued) (Dollar amounts in thousands, except per share data)
| 17. | SEGMENT INFORMATION (continued) |
Information about the Company's operations by geographic area follows:
| | | United States | | | Central and South America | | | Canada | | | Europe | | | Australia | | | Asia | | | Consolidated | | | | | | | | | | | | | | | | | | | | | | | | | | Sales to external customers: | | | | | | | | | | | | | | | | | | | | | 2015 | | $ | 936,513 | | | $ | 8,806 | | | $ | 30,367 | | | $ | 398,533 | | | $ | 21,225 | | | $ | 30,624 | | | $ | 1,426,068 | | | 2014 | | | 676,764 | | | | 3,272 | | | | 14,471 | | | | 380,229 | | | | 13,994 | | | | 17,867 | | | | 1,106,597 | | | 2013 | | | 617,371 | | | | - | | | | 12,014 | | | | 328,266 | | | | 13,534 | | | | 14,172 | | | | 985,357 | | | | | | | | | | | | | | | | | | | | | | | | | | | | | | | | | Long-lived assets: | | | | | | | | | | | | | | | | | | | | | | | | | | | 2015 | | | 1,016,703 | | | | 17,488 | | | | 41,690 | | | | 349,533 | | | | 22,072 | | | | 50,650 | | | | 1,498,136 | | | 2014 | | | 918,996 | | | | 10,739 | | | | 36,543 | | | | 391,944 | | | | 21,300 | | | | 31,122 | | | | 1,410,644 | | | 2013 | | | 421,697 | | | | 3,731 | | | | 483 | | | | 324,731 | | | | 6,338 | | | | 13,404 | | | | 770,384 | |
Fiscal 2015:
On August 19, 2015, the Company completed the acquisition of Aurora for $211,604 (net of cash acquired), subject to a working capital adjustment. The preliminary allocation of the purchase price resulted in goodwill of $73,623, which was assigned to the Memorialization segment, $76,340 of intangible assets, of which $30,540 is not subject to amortization, $29,026 of property, plant and equipment, and $32,615 of other net assets, primarily working capital. Approximately $43,000 of the goodwill is expected to be deductible for tax purposes. Aurora provides burial, cremation, and technology products to funeral home clients and distributors in the United States and Canada. In the year ended December 31, 2014, Aurora reported revenue of approximately $142,000. The acquisition is designed to expand the Company's memorialization product offerings and geographic distribution footprint in the United States.
Fiscal 2014:
On July 29, 2014, the Company acquired Schawk, a leading global brand development, activation and deployment company headquartered in Des Plaines, Illinois. Under the terms of the transaction, Schawk shareholders received $11.80 cash and 0.20582 shares of Matthews' common stock for each Schawk share held. Based on the closing price of Matthews' stock on July 28, 2014, the transaction represented an implied price of $20.74 per share and a total enterprise value (which included outstanding debt, net of cash acquired) of $616,686. Schawk provides comprehensive brand development and brand deployment services to clients primarily in the consumer packaged goods, retail and life sciences markets. Schawk creates and sells its clients' brands, produces brand assets and protects brand equities to help drive brand performance. Schawk delivers its services through more than 155 locations in over 20 countries across North and South America, Europe, Asia and Australia. During fiscal 2015, the Company finalized the allocation of purchase price related to the Schawk acquisition, resulting in immaterial adjustments to property, plant and equipment, goodwill, other intangible assets, certain working capital accounts, and deferred taxes.
NOTES TO CONSOLIDATED FINANCIAL STATEMENTS (continued) (Dollar amounts in thousands, except per share data)
| 18. | ACQUISITIONS (continued) |
The following information presents a summary of the consolidated results of Matthews combined with Schawk as if the acquisition had occurred on October 1, 2012:
| | | | | | Pro Forma Combined | | | | | 2015 | | | 2014 | | | 2013 | | | Sales | | $ | 1,426,068 | | | $ | 1,458,277 | | | $ | 1,430,843 | | | Income before income taxes | | | 89,652 | | | | 89,779 | | | | 41,271 | | | Net income | | | 63,449 | | | | 63,586 | | | | 29,470 | | | Earnings per share | | $ | 1.91 | | | $ | 1.93 | | | $ | 0.89 | |
The unaudited pro forma results for fiscal 2014 and 2013 have been prepared for comparative purposes only and include certain adjustments, such as interest expense on acquisition debt and acquisition related costs. The pro forma information does not purport to be indicative of the results of operations which actually would have resulted had the acquisition occurred on the date indicated, or which may result in the future.
Fiscal 2013:
Acquisition spending, net of cash acquired, during the year ended September 30, 2013 totaled $73,959. The acquisitions were not individually material to the Company’sCompany's consolidated financial position or results of operations, and primarily included the following:
In April 2013, the Company completed the purchase of the remaining 20% interest in Tact Group Limited (“Tact”). The Company had acquired an 80% interest in Tact in July 2009.
In March 2013, the Company completed the purchase of the remaining 38.5% interest in Kroma Pre-Press Preparation Systems Industry & Trade, Inc. (“Kroma”("Kroma"), completing the option arrangement in connection with the July 2011 acquisition of a 61.5% interest in Kroma.
In March 2013, the Company completed the purchase of the remaining 20% interest in Furnace Construction Cremators Limited (“FCC”). The Company had acquired an 80% interest in FCC in March 2010.
In December 2012, the Company acquired Pyramid Controls, Inc. and its affiliate, Pyramid Control Systems (collectively, “Pyramid”"Pyramid"). Pyramid is a provider of warehouse control systems and conveyor control solutions for distribution centers. The acquisition iswas designed to expand Matthews' fulfillment products and services in the warehouse management market. The initial purchase price for the transaction was $26,178, plus potential additional consideration up to $3,700of $3,703 paid in fiscal 2014 based on future operating results.
In November 2012, the Company acquired Wetzel Holding AG, Wetzel GmbH and certain related affiliates (collectively, “Wetzel”"Wetzel"). Wetzel is a leading European provider of pre-press services and gravure printing forms, with manufacturing operations in Germany and Poland. Wetzel’sWetzel's products and services are sold primary within Europe, and the acquisition iswas designed to expand Matthews' products and services in the global graphics imaging market. The purchase price for Wetzel was 42.6 million Euros ($54,748) on a cash-free, debt-free basis.
The Company has completed the allocation of purchase price for all fiscal 2013 acquisitions.
Fiscal 2012:
Acquisition spending, net of cash acquired, during the year ended September 30, 2012 totaled $12,541. The acquisitions were not individually material to the Company’s consolidated financial position or results of operations, and primarily included the following:
In May 2012, the Company acquired Everlasting Granite Memorial Co., Inc. (“Everlasting Granite”), a supplier of granite memorials, columbariums and private mausoleum estates. The transaction was structured as an asset purchase and was designed to expand the Company’s presence and product breadth in the granite memorial business.
Fiscal 2011:
Acquisition spending, net of cash acquired, during the year ended September 30, 2011 totaled $84,369. The acquisitions were not individually material to the Company’s consolidated financial position or results of operations, and primarily included the following:
In August 2011, the Company acquired Lightning Pick Technologies, Inc. (“LPT”), a manufacturer that develops, installs and supports paperless order fulfillment solutions. The transaction is intended to expand the Company’s presence and product breadth in the fulfillment systems industry.
NOTES TO CONSOLIDATED FINANCIAL STATEMENTS (continued)
(Dollar amounts in thousands, except per share data)
17. | ACQUISITIONS (continued) |
In July 2011, the Company purchased a 61.5% interest in Kroma, a leading provider of pre-press services and roto-gravure printing cylinders in Turkey. The acquisition is designed to further extend Matthews' presence as the leading provider of reprographic pre-press products and services to the European packaging and tobacco markets. The Company also had an arrangement to acquire an additional 8.5% interest and an option agreement related to the remaining 30% interest in Kroma. At September 30, 2012, the Company recorded an estimate of $10,481 in “Arrangement with noncontrolling interest” on the Consolidated Balance Sheet related to the option agreement.
In April 2011, the Company completed the purchase of the remaining 22% interest in Saueressig for 19.3 million Euros ($27,390), completing the option agreement in connection with the May 2008 acquisition of a 78% interest in Saueressig.
| In March 2011, the Company acquired Innovative Picking Technologies, Inc. (“IPTI”), a manufacturer of paperless order fulfillment systems. The transaction is intended to expand the Company’s presence into the fulfillment systems industry. |
| In October 2010, the Company acquired Freeman Metal Products, Inc. and its affiliated companies (collectively, “Freeman”), a manufacturer and distributor of caskets. The purchase price for the acquisition was $22,800, plus additional consideration up to $6,000 contingent on operating performance over the next three years. The transaction is intended to provide synergies in the manufacturing and distribution of caskets and expand the Company’s market presence in the Southeast and South Central regions of the United States. |
| In October 2010, the Company acquired the remaining 25% interest in Rudolf Reproflex GmbH & Co. KG (“Reproflex”). The Company acquired a 75% interest in Reproflex in 2001. |
18. | GOODWILL AND OTHER INTANGIBLE ASSETS: |
Goodwill is not amortized but is subject to annual review for impairment. In general, when the carrying value of a reporting unit exceeds its implied fair value, an impairment loss must be recognized. For purposes of testing for impairment the Company uses a combination of valuation techniques, including discounted cash flows. Intangible assets are amortized over their estimated useful lives unless such lives are considered to be indefinite. A significant decline in cash flows generated from these assets may result in a write-down of the carrying values of the related assets.
The Company performed its annual impairment reviews in the second quarters of fiscal 2013 and fiscal 2012 and determined that no additional adjustments to the carrying values of goodwill were necessary. Changes to goodwill, net of accumulated amortization, during the years ended September 30, 2013 and 2012, follow.
NOTES TO CONSOLIDATED FINANCIAL STATEMENTS (continued) (Dollar amounts in thousands, except per share data)
18.19. | GOODWILL AND OTHER INTANGIBLE ASSETS (continued)ASSETS: |
| | | | | | | | | | | | | | | Marking and | | | | | | | | | | | Cemetery | | | Funeral Home | | | | | | Graphics | | | Fulfillment | | | Merchandising | | | | | | | | Products | | | Products | | | Cremation | | | Imaging | | | Systems | | | Solutions | | | Consolidated | | | | | | | | | | | | | | | | | | | | | | | | | | Goodwill | | $ | 88,142 | | | $ | 162,819 | | | $ | 16,735 | | | $ | 167,828 | | | $ | 29,593 | | | $ | 9,138 | | | $ | 474,255 | | | Accumulated impairment losses | | | (412 | ) | | | - | | | | (5,000 | ) | | | (3,840 | ) | | | - | | | | - | | | | (9,252 | ) | Balance at September 30, 2011 | | | 87,730 | | | | 162,819 | | | | 11,735 | | | | 163,988 | | | | 29,593 | | | | 9,138 | | | | 465,003 | | | | | | | | | | | | | | | | | | | | | | | | | | | | | | | | | Additions during period | | | 10,424 | | | | 57 | | | | 770 | | | | 2,896 | | | | 1,151 | | | | - | | | | 15,298 | | | Translation and other adjustments | | | (783 | ) | | | - | | | | 53 | | | | (3,462 | ) | | | 72 | | | | - | | | | (4,120 | ) | | Goodwill | | | 97,783 | | | | 162,876 | | | | 17,558 | | | | 167,262 | | | | 30,816 | | | | 9,138 | | | | 485,433 | | | Accumulated impairment losses | | | (412 | ) | | | - | | | | (5,000 | ) | | | (3,840 | ) | | | - | | | | - | | | | (9,252 | ) | Balance at September 30, 2012 | | | 97,371 | | | | 162,876 | | | | 12,558 | | | | 163,422 | | | | 30,816 | | | | 9,138 | | | | 476,181 | | | | | | | | | | | | | | | | | | | | | | | | | | | | | | | | | Additions during period | | | 914 | | | | 199 | | | | 269 | | | | 21,361 | | | | 19,677 | | | | - | | | | 42,420 | | | Translation and other adjustments | | | 1,010 | | | | 133 | | | | (4 | ) | | | 4,658 | | | | 153 | | | | - | | | | 5,950 | | | Goodwill | | | 99,707 | | | | 163,208 | | | | 17,823 | | | | 193,281 | | | | 50,646 | | | | 9,138 | | | | 533,803 | | | Accumulated impairment losses | | | (412 | ) | | | - | | | | (5,000 | ) | | | (3,840 | ) | | | - | | | | - | | | | (9,252 | ) | Balance at September 30, 2013 | | $ | 99,295 | | | $ | 163,208 | | | $ | 12,823 | | | $ | 189,441 | | | $ | 50,646 | | | $ | 9,138 | | | $ | 524,551 | |
| | | | | | | | | | | | | | | | | SGK Brand Solutions | | | Memorialization | | | Industrial | | | Consolidated | | | | | | | | | | | | | | | | | Goodwill | | $ | 204,331 | | | $ | 280,326 | | | $ | 50,646 | | | $ | 535,303 | | | Accumulated impairment losses | | | (5,752 | ) | | | (5,000 | ) | | | - | | | | (10,752 | ) | | Balance at September 30, 2013 | | | 198,579 | | | | 272,326 | | | | 50,646 | | | | 524,551 | | | | | | | | | | | | | | | | | | | | | Additions during period | | | 312,403 | | | | - | | | | 288 | | | | 312,691 | | | Translation and other adjustments | | | (15,684 | ) | | | (2,044 | ) | | | (47 | ) | | | (17,775 | ) | | Goodwill | | | 501,050 | | | | 278,282 | | | | 50,887 | | | | 830,219 | | | Accumulated impairment losses | | | (5,752 | ) | | | (5,000 | ) | | | - | | | | (10,752 | ) | | Balance at September 30, 2014 | | | 495,298 | | | | 273,282 | | | | 50,887 | | | | 819,467 | | | | | | | | | | | | | | | | | | | | | Additions during period | | | 250 | | | | 73,623 | | | | 2,226 | | | | 76,099 | | | Translation and other adjustments | | | (34,653 | ) | | | (4,959 | ) | | | (226 | ) | | | (39,838 | ) | | Goodwill | | | 466,647 | | | | 346,946 | | | | 52,887 | | | | 866,480 | | | Accumulated impairment losses | | | (5,752 | ) | | | (5,000 | ) | | | - | | | | (10,752 | ) | | Balance at September 30, 2015 | | $ | 460,895 | | | $ | 341,946 | | | $ | 52,887 | | | $ | 855,728 | |
The Company performed its annual impairment review of goodwill in the second quarter of fiscal 2015 and determined that estimated fair value for all reporting units exceeded carrying value, therefore no adjustments to the carrying value of goodwill were necessary.
In fiscal 2015, the addition to Memorialization goodwill primarily reflects the acquisition of Aurora, and the addition to Industrial goodwill primarily reflects the acquisition of a small printing products business. The amount reflected in translation and other adjustments for the SGK Brand Solutions segment includes the impact of purchase price adjustments.
In fiscal 2014, the addition to goodwill primarily reflects the acquisition of Schawk.
In fiscal 2013, the addition to Graphics ImagingSGK Brand Solutions goodwill primarily reflects the acquisition of Wetzel and the remaining 20% interest in Tact;Wetzel; the addition to Marking and Fulfillment SystemsIndustrial goodwill reflects the acquisition of Pyramid; the addition to Cemetery ProductsMemorialization goodwill reflects the acquisition of atwo small bronze manufacturermanufacturers in Europe; the addition to Cremation goodwill reflects the acquisition of the remaining 20% interest in FCC;Europe, and the addition to Funeral Home Products primarily represents the effect of an adjustment to the purchase price for a small casket distributor.
In fiscal 2012, the addition to Cemetery Products reflects the acquisition of Everlasting Granite in May 2012. The additions to Funeral Home Products and Marking and Fulfillment Systems goodwill primarily represents the effect of adjustments to purchase price; the addition to Cremation goodwill reflects the acquisition of a small cremation equipment manufacturer in Europe; and the addition to Graphics Imaging goodwill related primarily to additional consideration paid in accordance with the purchase agreement with Tact Group Limited and effect of adjustments to purchase price for Kroma.
NOTES TO CONSOLIDATED FINANCIAL STATEMENTS (continued) (Dollar amounts in thousands, except per share data)
18. 19.GOODWILL AND OTHER INTANGIBLE ASSETS (continued)
The following tables summarize the carrying amounts and related accumulated amortization for intangible assets as of September 30, 20132015 and 2012,2014, respectively. | | | Carrying | | | Accumulated | | | Impairment | | | | | | Carrying | | | Accumulated | | | | | | | | Amount | | | Amortization | | | Loss | | | Net | | | Amount | | | Amortization | | | Net | | | September 30, 2013: | | | | | | | | | | | | | | | September 30, 2015: | | | | | | | | | | | | Trade names | | $ | 24,496 | | | $ | - | * | | $ | (1,618 | ) | | $ | 22,878 | | | $ | 168,467 | | | $ | - | * | | $ | 168,467 | | | Trade names | | | 3,034 | | | | (2,142 | ) | | | - | | | | 892 | | | | 1,815 | | | | (1,718 | ) | | | 97 | | | Customer relationships | | | 59,061 | | | | (19,099 | ) | | | - | | | | 39,962 | | | | 296,689 | | | | (51,393 | ) | | | 245,296 | | | Copyrights/patents/other | | | 10,116 | | | | (8,746 | ) | | | - | | | | 1,370 | | | | 11,389 | | | | (10,249 | ) | | | 1,140 | | | | | $ | 96,707 | | | $ | (29,987 | ) | | $ | (1,618 | ) | | $ | 65,102 | | | $ | 478,360 | | | $ | (63,360 | ) | | $ | 415,000 | | | | | | | | | | | | | | | | | | | | | | | | | | | | | | | | | September 30, 2012: | | | | | | | | | | | | | | | | | | | September 30, 2014: | | | | | | | | | | | | | | | Trade names | | $ | 24,488 | | | $ | - | * | | | - | | | $ | 24,488 | | | $ | 142,529 | | | $ | - | * | | $ | 142,529 | | | Trade names | | | 2,182 | | | | (1,571 | ) | | | - | | | | 611 | | | | 2,854 | | | | (2,121 | ) | | | 733 | | | Customer relationships | | | 47,654 | | | | (15,689 | ) | | | - | | | | 31,965 | | | | 258,441 | | | | (24,785 | ) | | | 233,656 | | | Copyrights/patents/other | | | 9,920 | | | | (7,969 | ) | | | - | | | | 1,951 | | | | 14,528 | | | | (9,584 | ) | | | 4,944 | | | | | $ | 84,244 | | | $ | (25,229 | ) | | | - | | | $ | 59,015 | | | $ | 418,352 | | | $ | (36,490 | ) | | $ | 381,862 | | | *Not subject to amortization | | | | | | | | | | | | | | | | | | | | | | | | | | | | |
The net change in intangible assets during fiscal 20132015 included an increase for the acquisitionsacquisition of Wetzel and Pyramid of $12,027, offset byAurora, the impact of an impairment loss in the Graphic Imaging segment (recorded in the second fiscal quarter), foreign currency fluctuations during the period, additional amortization, and additional amortization.trade name write-offs of approximately $4,842 in the SGK Brand Solutions segment, which resulted from the discontinuance of certain legacy trade names in connection with the integration of Schawk. In addition, the Company completed the sale of a majority ownership in its Schawk Digital Solutions business, which was acquired in 2014 as part of the Schawk acquisition. Net proceeds from this transaction totaled approximately $10,400, and the sale primarily resulted in the disposal of working capital and intangible assets, and the recognition of a cost-basis investment in this business. No gain or loss was recognized on the sale. The net change in intangible assets during fiscal 20122014 included an increase for the impactacquisition of changes inSchawk, foreign currency exchange ratesfluctuations during the period and additional amortization.
Amortization expense on intangible assets was $4,156, $3,886,$18,800, $7,318, and $4,200$4,156 in fiscal 2013, 20122015, 2014 and 2011,2013, respectively. Fiscal year amortization expense is estimated to be $3,792 in 2014, $3,662 in 2015, $3,374$21,462 in 2016, $3,181$20,315 in 2017, $19,020 in 2018, $17,985 in 2019 and $3,149$16,866 in 2018.
2020.
19.20. | ACCOUNTING PRONOUNCEMENTS: |
On February 5, 2013,In September 2015, the Financial Accounting StandardStandards Board ("FASB") issued new guidance intended to simplify the accounting for measurement period adjustments in a business combination. Measurement period adjustments are changes to provisional amounts recorded when the accounting for a business combination is incomplete as of the end of a reporting period. The measurement period can extend for up to a year following the transaction date. During the measurement period, companies may make adjustments to provisional amounts when information necessary to complete the measurement is received. The new guidance requires companies to recognize these adjustments, including any related impacts to net income, in the reporting period in which the adjustments are determined. Companies are no longer required to retroactively apply measurement period adjustments to all periods presented. Matthews early-adopted this ASU in the fourth quarter of fiscal 2015. The adoption of this ASU did not have a material impact on our financial statements and related disclosures.
NOTES TO CONSOLIDATED FINANCIAL STATEMENTS (continued) (Dollar amounts in thousands, except per share data)
| 20. | ACCOUNTING PRONOUNCEMENTS (continued) |
In July 2015, the FASB issued new guidance to simplify the measurement of inventory valuation at the lower of cost or net realizable value. Net realizable value is the estimated selling price in the ordinary course of business, less reasonably predictable costs of completion, disposal and transportation. The new inventory measurement requirements are effective for the Company's 2017 fiscal year, and will replace the current inventory valuation guidance that requires the use of a lower of cost or market framework. The adoption of these changes is not expected to have a material impact on the Company's consolidated financial statements.
In April 2015, the FASB issued new guidance intended to simplify the presentation of debt issuance costs. The new guidance requires that debt issuance costs related to a recognized debt liability be presented on the balance sheet as a direct deduction from the carrying amount of debt, consistent with debt discounts. The recognition and measurement guidance for debt issuance costs are not affected by this new guidance. The new requirements will be effective for the Company beginning in fiscal year 2017, and are not expected to have a material impact on the Company's consolidated financial statements.
In June 2014, the FASB issued new guidance on the accounting for share-based payments when the terms of an award provide that a performance target could be achieved after the requisite service period. This guidance is effective for Matthews beginning January 1, 2016 and will not have a material impact on the Company's consolidated financial statements.
In May 2014, the FASB issued Accounting Standards Update No. 2013-02, Reporting(ASU) 2014-09, "Revenue from Contracts with Customers: Topic 606". This ASU replaces nearly all existing U.S. GAAP guidance on revenue recognition. The standard prescribes a five-step model for recognizing revenue, the application of Amounts Reclassified Out of Accumulated Other Comprehensive Income (“which will require significant judgment. The FASB issued ASU 2013-02”). ASU 2013-02 requires companies to present information about reclassification adjustments from accumulated other comprehensive income, including the amount2015-14 in August 2015 which resulted in a deferral of the reclassification and the income statement line items affected by the reclassification.original effective date of ASU 2014-09. This standard is now effective for Matthews beginning October 1, 2018. The information must be presentedCompany is in the process of assessing the impact the adoption of this ASU will have on its consolidated financial statementsstatements.
In January 2014, the FASB issued new guidance on accounting for certain receive-variable, pay-fixed interest rate swaps. This guidance provides companies with a practical expedient to qualify for cash flow hedge accounting. The guidance was effective for Matthews beginning in fiscal 2015, and did not have a single note ormaterial impact on the face of theCompany's consolidated financial statements. ASU 2013-02 is effective for annual periods beginning after December 15, 2012, and interim periods within those annual periods. This standard will be adopted by the Company for the quarter ended December 31, 2013.
SUPPLEMENTARY FINANCIAL INFORMATION
Selected Quarterly Financial Data (Unaudited):
The following table sets forth certain items included in the Company's unaudited consolidated financial statements for each quarter of fiscal 20132015 and fiscal 2012.2014. Information presented for the quarters ended December 31, 2014 and March 31, 2015 has been revised to reflect additional expense related to a theft of funds by an employee that had occurred over a multi-year period. Net income attributable to Matthews shareholders was adjusted by $591 and $601 for the first and second quarters of fiscal 2015, respectively. Diluted earnings per share was adjusted by $0.02 for the first and second quarters of fiscal 2015. Basic earnings per share was adjusted by $0.01 and $0.02 for the first and second quarters of fiscal 2015, respectively.
| | | | | | | | | | | | | | | | | Quarter Ended | | | | | | Quarter Ended | | | | | | | | December 31 | | | March 31 | | | June 30 | | | September 30 | | | Year Ended September 30 | | | December 31 | | | March 31 | | | June 30 | | | September 30 | | | Year Ended September 30 | | | | | (Dollar amounts in thousands, except per share data) | | | | | | (Dollar amounts in thousands, except per share data) | | | | | | FISCAL YEAR 2013: | | | | | | | | | | | | | | | | | | FISCAL YEAR 2015: | | | | | | | | | | | | | | | | | | | | | | | | | | | | | | | | | | | | | | | | | | | | | | | | | | Sales | | $ | 225,609 | | | $ | 256,390 | | | $ | 250,652 | | | $ | 252,706 | | | $ | 985,357 | | | $ | 343,584 | | | $ | 349,394 | | | $ | 364,752 | | | $ | 368,338 | | | $ | 1,426,068 | | | | | | | | | | | | | | | | | | | | | | | | | | | | | | | | | | | | | | | | | | | | | Gross profit | | | 79,974 | | | | 94,866 | | | | 91,391 | | | | 90,287 | | | | 356,518 | | | | 124,670 | | | | 127,695 | | | | 135,436 | | | | 141,574 | | | | 529,375 | | | | | | | | | | | | | | | | | | | | | | | | | | | | | | | | | | | | | | | | | | | | | Operating profit | | | 16,499 | | | | 25,070 | | | | 30,760 | | | | 23,463 | | | | 95,792 | | | | 25,585 | | | | 19,275 | | | | 27,405 | | | | 32,758 | | | | 105,023 | | | | | | | | | | | | | | | | | | | | | | | | | | | | | | | | | | | | | | | | | | | | | Net income attributable to Matthews shareholders | | | 8,255 | | | | 14,192 | | | | 17,991 | | | | 14,450 | | | | 54,888 | | | | 14,360 | | | | 8,975 | | | | 23,140 | | | | 16,974 | | | | 63,449 | | | | | | | | | | | | | | | | | | | | | | | | | | | | | | | | | | | | | | | | | | | | | Earnings per share: | | | | | | | | | | | | | | | | | | | | | | | | | | | | | | | | | | | | | | | | | | Basic | | | $.30 | | | | $.51 | | | | $.65 | | | | $.53 | | | | $1.99 | | | | $.44 | | | | $.27 | | | | $.70 | | | | $.52 | | | | $1.93 | | | Diluted | | | .30 | | | | .51 | | | | .65 | | | | .52 | | | | 1.98 | | | | .43 | | | | .27 | | | | .70 | | | | .51 | | | | 1.91 | | | | | | | | | | | | | | | | | | | | | | | | | | | | | | | | | | | | | | | | | | | | | | | | | | | | | | | | | | | | | | | | | | | | | | | | | | | | | | | | | | | | | | | FISCAL YEAR 2012: | | | | | | | | | | | | | | | | | | | | | | | FISCAL YEAR 2014: | | | | | | | | | | | | | | | | | | | | | | | | | | | | | | | | | | | | | | | | | | | | | | | | | | | | | | | | | | | | | | | | | Sales | | $ | 217,213 | | | $ | 225,545 | | | $ | 227,478 | | | $ | 230,081 | | | $ | 900,317 | | | | 229,945 | | | $ | 246,837 | | | $ | 279,983 | | | $ | 349,832 | | | $ | 1,106,597 | | | | | | | | | | | | | | | | | | | | | | | | | | | | | | | | | | | | | | | | | | | | | Gross profit | | | 77,995 | | | | 84,707 | | | | 87,709 | | | | 86,159 | | | | 336,570 | | | | 81,376 | | | | 90,182 | | | | 104,230 | | | | 116,708 | | | | 392,496 | | | | | | | | | | | | | | | | | | | | | | | | | | | | | | | | | | | | | | | | | | | | | Operating profit | | | 18,925 | | | | 25,287 | | | | 27,513 | | | | 21,852 | | | | 93,577 | | | | 14,679 | | | | 20,543 | | | | 31,830 | | | | 14,470 | | | | 81,522 | | | | | | | | | | | | | | | | | | | | | | | | | | | | | | | | | | | | | | | | | | | | | Net income attributable to Matthews shareholders | | | 11,285 | | | | 15,258 | | | | 16,325 | | | | 12,975 | | | | 55,843 | | | | 7,787 | | | | 10,992 | | | | 19,041 | | | | 4,805 | | | | 42,625 | | | | | | | | | | | | | | | | | | | | | | | | | | | | | | | | | | | | | | | | | | | | | Earnings per share | | | | | | | | | | | | | | | | | | | | | | | | | | | | | | | | | | | | | | | | | | Basic | | | $.40 | | | | $.54 | | | | $.58 | | | | $.47 | | | | $1.98 | | | | $.29 | | | | $.40 | | | | $.70 | | | | $.15 | | | | $1.51 | | | Diluted | | | .40 | | | | .54 | | | | .58 | | | | .47 | | | | 1.98 | | | | .29 | | | | .40 | | | | .69 | | | | .15 | | | | 1.49 | |
FINANCIAL STATEMENT SCHEDULE
SCHEDULE II - VALUATION AND QUALIFYING ACCOUNTS
| | | | | | Additions | | | | | | | | | | | | Additions | | | | | | | | | | | Balance at | | | | | | Charged to | | | | | | | | | Balance at | | | | | | Charged to | | | | | | | | | | | beginning of | | | Charged to | | | other | | | | | | Balance at | | | beginning of | | | Charged to | | | other | | | | | | Balance at | | | Description | | period | | | expense | | | Accounts(1) | | | Deductions(2) | | | end of period | | | period | | | expense | | | Accounts(1) | | | Deductions(2) | | | end of period | | | | | (Dollar amounts in thousands) | | | | | | (Dollar amounts in thousands) | | | | | | Allowance for Doubtful Accounts: | | | | | | | | | | | | | | | | | | | | | | | | | | | | | | | | Fiscal Year Ended: | | | | | | | | | | | | | | | | | | | | | | | | | | | | | | | | September 30, 2015 | | | $ | 10,937 | | | $ | 2,101 | | | $ | (134 | ) | | $ | (2,889 | ) | | $ | 10,015 | | | September 30, 2014 | | | | 10,009 | | | | 2,223 | | | | 883 | | | | (2,178 | ) | | | 10,937 | | | September 30, 2013 | | $ | 11,177 | | | $ | 595 | | | $ | 306 | | | $ | (2,069 | ) | | $ | 10,009 | | | | 11,177 | | | | 595 | | | | 306 | | | | (2,069 | ) | | | 10,009 | | | September 30, 2012 | | | 10,736 | | | | 1,558 | | | | - | | | | (1,117 | ) | | | 11,177 | | | | September 30, 2011 | | | 11,261 | | | | 533 | | | | 580 | | | | (1,638 | ) | | | 10,736 | | |
| (1) | Amount comprised principally of acquisitions and purchase accounting adjustments in connection with acquisitions.acquisitions, and amounts reclassified to other accounts. |
| (2) | Amounts determined not to be collectible (including direct write-offs), net of recoveries. |
| | | | | | | | | | | | | | | | | | | | Provision | | | | | | | | | | | | | | Balance at | | | Charged | | | | | | Other | | | | | | | | beginning of | | | (Credited) | | | Allowance | | | Additions | | | Balance at | | | Description | | period | | | To expense(1) | | | Changes(2) | | | (Deductions)(3) | | | end of period | | | | | (Dollar amounts in thousands) | | | | | | Deferred Tax Asset Valuation Allowance: | | | | | | | | | | | | | | | | | Fiscal Year Ended: | | | | | | | | | | | | | | | | | September 30, 2015 | | $ | 24,540 | | | $ | 399 | | | $ | (1,705 | ) | | $ | (2,257 | ) | | $ | 20,977 | | | September 30, 2014 | | | 2,234 | | | | 1,224 | | | | 22,098 | | | | (1,016 | ) | | | 24,540 | | | September 30, 2013 | | | 1,627 | | | | 512 | | | | - | | | | 95 | | | | 2,234 | |
68| (1) | Amounts relate primarily to the adjustments in net operating loss carryforwards which are precluded from use. |
| (2) | Fiscal year 2015 amounts primarily reflect a release of a valuation allowance resulting from a fiscal 2015 legal structure reorganization in foreign jurisdictions that enabled the utilization of certain tax attributes. Fiscal year 2014 amounts are comprised of reductions in net operating loss carryforwards which are precluded from use of $1,332 and purchase accounting adjustments of $23,430. |
| (3) | Consists principally of adjustments related to foreign exchange. |
| ITEM 9. CHANGES IN AND DISAGREEMENTS WITH ACCOUNTANTS ON ACCOUNTING AND FINANCIAL DISCLOSURE. |
There have been no changes in accountants or disagreements on accounting or financial disclosure between the Company and PricewaterhouseCoopers LLP, Independent Registered Public Accounting Firm,the Company's independent registered public accounting firm, for the fiscal years ended September 30, 2013, 20122015, 2014 and 2011.2013.
ITEM 9A. CONTROLS AND PROCEDURES.
| (a) Evaluation of Disclosure Controls and Procedures. |
The Company’sCompany's disclosure controls and procedures (as defined in Rules 13a-15(e) and 15d-15(e) under the Securities Exchange Act of 1934, as amended)amended (the "Exchange Act")) are designed to provide reasonable assurance that information required to be disclosed in the Company’sCompany's reports filed under thatthe Exchange Act, (the “Exchange Act”), such as this Annual Report on Form 10-K, isare recorded, processed, summarized and reported within the time periods specified in the rules of the Securities and Exchange Commission (“SEC”("SEC"). These disclosure controls and procedures also are designed to provide reasonable assurance that such information is accumulated and communicated to management, including the Chief Executive Officer and Chief Financial Officer, to allow timely decisions regarding required disclosures.
The Company acquired Wetzel AG, Wetzel GmbH and certain related affiliates (collectively, “Wetzel”) and Pyramid Controls, Inc. and its affiliate, Pyramid Control Systems, (collectively, “Pyramid”) in the first quarter of fiscal 2013, and we have excluded Wetzel and Pyramid from our assessment of the effectiveness of our internal control over financial reporting. As such, the scope of our assessment of the effectiveness of our controls and procedures does not include Wetzel and Pyramid. This exclusion is in accordance with the SEC's general guidance that an assessment of a recently acquired business may be omitted from our scope in the year of acquisition.
Management, under the supervision and with the participation of our Chief Executive Officer and Chief Financial Officer, evaluated the effectiveness of the Company’sCompany's disclosure controls and procedures in effect as of September 30, 2013.2015. Based on that evaluation, the Chief Executive Officer and Chief Financial Officer concluded that, as of September 30, 2013,2015, the Company’sCompany's disclosure controls and procedures were effective to provide reasonable assurance that material information is accumulated and communicated to management, including the Chief Executive Officer and Chief Financial Officer, and that such information is recorded, processed, summarized and properly reported within the appropriate time period, relating to the Company and its consolidated subsidiaries, required to be included in the Exchange Act reports, including this Annual Report on Form 10-K.
Remediation of Previously Disclosed Material Weakness
Management previously reported a material weakness in the Company's internal control over financial reporting, related to the design of the internal controls over segregation of duties within the treasury process, in its Annual Report on Form 10-K/A for the year ended September 30, 2014. A material weakness is a deficiency, or combination of deficiencies, in internal control over financial reporting, such that there is a reasonable possibility that a material misstatement of the Company's annual or interim financial statements will not be prevented or detected on a timely basis. The design of the internal controls over segregation of duties within the treasury process was determined to constitute a material weakness, which resulted in a cumulative loss of $14.8 million that was not previously recorded in the Company's financial statements. Specifically, an individual with the ability to execute cash transactions was responsible for providing the third-party source documents used in the cash reconciliation process. This resulted in an overstatement of our previously reported cash balance and resulted in the revision to our previously issued consolidated financial statements for the years ended September 30, 2014, 2013 and 2012. Additionally, it was determined that this could have resulted in further misstatements of the aforementioned accounts and disclosures that would result in a material misstatement of the consolidated financial statements that would not be prevented or detected. Accordingly, the internal control over segregation of duties within the treasury process was determined to constitute a material weakness in internal control over financial reporting.
| ITEM 9A. | CONTROLS AND PROCEDURES, continued |
In response to the material weakness, management took immediate action to remediate the material weakness and implemented changes in the design of this internal control to ensure appropriate segregation of duties within the Company's treasury process. Specifically, the Company implemented changes over the segregation of duties related to obtaining the third-party source documents used in the cash reconciliation process. The Company has completed the documentation and testing of the corrective actions described above for a sufficient number of periods in order to conclude that the material weakness has been remediated as of September 30, 2015.
(b) Management’sManagement's Report on Internal Control over Financial Reporting. Management’sManagement's Report on Internal Control over Financial Reporting is included in Management’sManagement's Report to Shareholders in Item 8 of this Annual Report on Form 10-K.
(c) Attestation Report of theIndependent Registered Public Accounting Firm. The Company’sCompany's internal control over financial reporting as of September 30, 20132015 has been audited by PricewaterhouseCoopers LLP, an independent registered public accounting firm, as stated in their report which is included in Item 8 of this Annual Report on Form 10-K. (d) Changes in Internal Control over Financial Reporting. ThereOther than the remediation of the previously reported material weakness described above, there have been no changes in the Company’sCompany's internal controls over financial reporting that occurred during the fourth fiscal quarter ended September 30, 20132015 that have materially affected, or are reasonably likely to materially affect, the Company’sCompany's internal controls over financial reporting.
PART III
| ITEM 10. DIRECTORS, OFFICERS and EXECUTIVE MANAGEMENT OF THE REGISTRANT. |
In addition to the information reported in Part I of this Annual Report on Form 10-K, under the caption “Officers"Officers and Executive Management of the Registrant”Registrant", the information required by this item as to the directors of the Company is hereby incorporated by reference from the information appearing under the captions “General"General Information Regarding Corporate Governance – Audit Committee”Committee", “Proposal"Proposal No. 1 – Elections of Directors”Directors" and “Compliance"Compliance with Section 16(a) of the Exchange Act”Act" in the Company’sCompany's definitive proxy statement, which involves the election of the directors and is to be filed with the Securities and Exchange Commission (the "SEC") pursuant to the Exchange Act, of 1934, as amended, within 120 days of the end of the Company’sCompany's fiscal year ended September 30, 2013.2015.
The Company’sCompany's Code of Ethics Applicable to Executive Management is set forth in Exhibit 14.1 hereto. Any amendment to the Company’sCompany's Code of Ethics or waiver of the Company’sCompany's Code of Ethics for senior financial officers, executive officers or Directors will be posted on the Company’sCompany's website within four business days following the date of the amendment or waiver, and such information will remain available on the website for at least a twelve-month period.
ITEM 11. EXECUTIVE COMPENSATION.
The information required by this item as to the compensation of directors and executive management of the Company is hereby incorporated by reference from the information appearing under the captions “Compensation"Compensation of Directors”Directors" and “Executive"Executive Compensation and Retirement Benefits”Benefits" in the Company’sCompany's definitive proxy statement which involves the election of directors and is to be filed with the CommissionSEC pursuant to the Exchange Act, within 120 days of the end of the Company’sCompany's fiscal year ended September 30, 2013.2015. The information contained in the “Compensation"Compensation Committee Report”Report" is specifically not incorporated herein by reference.
| ITEM 12. SECURITY OWNERSHIP OF CERTAIN BENEFICIAL OWNERS AND MANAGEMENT. |
The information required by this item as to the ownership by management and others of securities of the Company is hereby incorporated by reference from the information appearing under the caption “Stock Ownership”"Stock Ownership" in the Company’sCompany's definitive proxy statement which involves the election of directors and is to be filed with the CommissionSEC pursuant to the Exchange Act, within 120 days of the end of the Company’sCompany's fiscal year ended September 30, 2013.2015.
Equity Compensation Plans:
The Company maintains an equity incentive plan (the "2012 Plan") that provides for grants of stock options, restricted shares, stock-based performance units and certain other types of stock-based awards. The Company also maintains stock incentive plans (the "1992 Incentive Stock Plan" and the "2007 Equity Incentive Plan") that previously provided for grants of stock options, restricted shares and certain other types of stock-based awards. Under the 2012 Plan, which has a ten-year term, the maximum number of shares available for grants or awards is an aggregate of 2,500,000. There will be no further grants under the 2007 Equity Incentive Plan or the 1992 Incentive Stock Plan. At September 30, 2015, there were 1,476,798 shares reserved for future issuance under the 2012 Plan. All plans are administered by the Compensation Committee of the Board of Directors.
ITEM 12. | ITEM 12. | SECURITY OWNERSHIP OF CERTAIN BENEFICIAL OWNERS AND MANAGEMENT, continued |
Equity Compensation Plans:
The Company maintains an equity incentive plan (the “2007 Equity Incentive Plan”) that provides for grants of stock options, restricted shares, stock-based performance units and certain other types of stock-based awards. The Company also maintains a stock incentive plan (the “1992 Incentive Stock Plan”) that previously provided for grants of stock options, restricted shares and certain other types of stock-based awards. In February 2013, the Company’s shareholders approved the adoption of a new plan, the 2012 Equity Incentive Plan (the “2012 Plan”), that provides for grants of stock options, restricted shares, stock-based performance units and certain other types of stock-based awards. Under the 2012 Plan, which has a ten-year term, the maximum number of shares available for grants or awards is an aggregate of 2,500,000. There will be no further grants under the 2007 Equity Incentive Plan or the 1992 Incentive Stock Plan. At September 30, 2013, there were 2,500,000 shares reserved for future issuance under the 2012 Plan. All plans are administered by the Compensation Committee of the Board of Directors.
The option price for each stock option granted under any of the plans may not be less than the fair market value of the Company's common stock on the date of grant. Outstanding stock options are generally exercisable in one-third increments upon the attainment of pre-defined levels of appreciation in the market value of the Company’sCompany's Class A Common Stock. In addition, options generally vest in one-third increments after three, four and five years, respectively, from the grant date (but, in any event, not until the attainment of the market value thresholds). The options expire on the earlier of ten years from the date of grant, upon employment termination, or within specified time limits following voluntary employment termination (with the consent of the Company), retirement or death. The Company generally settles employee stock option exercises with treasury shares. With respect to outstanding restricted share grants, for grants made prior to fiscal 2013, generally one-half of the shares vest on the third anniversary of the grant, with the remaining one-half of the shares vesting in one-third increments upon attainment of pre-definedlevels of appreciation in the market value of the Company’sCompany's Class A Common Stock. For grants made in fiscal 2013 and in November 2013, generally one-half of the shares vest on the third anniversary of the grant, one-quarter of the shares vest in one-third increments upon the attainment of pre-defined levels of adjusted earnings per share, and the remaining one-quarter of the shares vest in one-third increments upon attainment of pre-defined levels of appreciation in the market value of the Company’sCompany's Class A Common Stock. Additionally, restricted shares cannot vest until the first anniversary of the grant date. For grants made in July 2014, generally one-half of the shares vest on the third anniversary of the grant, with the remaining one-half of the shares vesting in one-third increments upon the attainment of pre-defined levels of adjusted EBITDA. Unvested restricted shares generally expire on the earlier of five years from the date of grant, upon employment termination, or within specified time limits following voluntary employment termination (with the consent of the Company), retirement or death. The Company issues restricted shares from treasury shares.
The Company maintains the 1994 Director Fee Plan (the "1994 Director Fee Plan"), and the 2014 Director Fee Plan (the "2014 Director Fee Plan") (collectively, the "Director Fee Plans"). There will be no further fees or share-based awards under the 1994 Director Fee Plan. Under the Company’s2014 Director Fee Plan, directors (except for the Chairman of the Board) who are not also officers of the Company each receive, as an annual retainer fee, either cash or shares of the Company's Class A Common Stock equivalentwith a value equal to $60,000.$75,000. The equivalent amountannual retainer fee paid to a non-employee Chairman of the Board is $130,000.$175,000. Where the annual retainer fee is provided in shares, each director may elect to be paid these shares on a current basis or have such shares credited to a deferred stock account as phantom stock, with such shares to be paid to the director subsequent to leaving the Board. The value of deferred shares is recorded in other liabilities. A total of 17,005 shares had been deferred under the Director Fee PlanPlans at September 30, 2013.2015. Additionally, directors who are not also officers of the Company each receive an annual stock-based grant (non-statutory stock options, stock appreciation rights and/or restricted shares) with a value of $100,000.$110,000. A total of 22,300 stock options have been granted under the plan.Director Fee Plans. At September 30, 2013, 11,8002015, there were no options were outstanding and vested.outstanding. Additionally, 103,150136,568 shares of restricted stock have been granted under the plan, 38,227Director Fee Plans, 33,418 of which were unvested at September 30, 2013.2015. A total of 300,000150,000 shares have been authorized to be issued under the 2014 Director Fee Plan.
ITEM 12. | ITEM 12. | SECURITY OWNERSHIP OF CERTAIN BENEFICIAL OWNERS AND MANAGEMENT, continued |
The following table provides information about grants under the Company's equity compensation plans as of September 30, 2013:2015:
| | | Equity Compensation Plan Information | | | | | | Equity Compensation Plan Information | | | | | | | | | | | | | | Number of securities | | | | | | | | | Number of securities | | | | | | | | | | | remaining available | | | | | | | | | remaining available | | | | | | | | | | | for future issuance | | | | | | | | | for future issuance | | | | | Number of securities | | | Weighted-average | | | under equity | | | Number of securities | | | Weighted-average | | | under equity | | | | | to be issued upon | | | exercise price | | | compensation plans | | | to be issued upon | | | exercise price | | | compensation plans | | | | | exercise of | | | of outstanding | | | (excluding | | | exercise of | | | of outstanding | | | (excluding | | | | | outstanding options, | | | options, warrants | | | securities reflected | | | outstanding options, | | | options, warrants | | | securities reflected | | | Plan category | | warrants and rights | | | and rights | | | in column (a)) | | | warrants and rights | | | and rights | | | in column (a)) | | | | | (a) | | | (b) | | | (c) | | | (a) | | | (b) | | | (c) | | | Equity compensation plans | | | | | | | | | | | | | | | | | | | | approved by security holders: | | | | | | | | | | | | | | | | | | | | 1992 Stock Incentive Plan | | | 744,824 | | | $ | 37.76 | | | | - | (1) | | | 337,938 | | | $ | 39.19 | | | | - | (1) | | 2007 Equity Incentive Plan | | | - | | | | - | | | | - | (2) | | | - | | | | - | | | | - | (2) | | 2012 Equity Incentive Plan | | | - | | | | - | | | | 2,500,000 | (3) | | | - | | | | - | | | | 1,476,798 | (3) | | Employee Stock Purchase Plan | | | - | | | | - | | | | 1,609,270 | (4) | | | - | | | | - | | | | 1,580,994 | (4) | | Director Fee Plan | | | 28,805 | | | | 35.39 | | | | 77,913 | (5) | | | 1994 Director Fee Plan | | | | 17,005 | | | | - | | | | - | (5) | | 2014 Director Fee Plan | | | | - | | | | - | | | | 116,582 | (6) | | Equity compensation plans not approved by security holders | | None | | | None | | | None | | | None | | | None | | | None | | | Total | | | 773,629 | | | $ | 37.72 | | | | 4,187,183 | | | | 354,943 | | | $ | 39.19 | | | | 3,174,374 | |
| (1) | As a result of the approval of the 2007 Equity Incentive Plan, no further grants or awards will be made under the 1992 Incentive Stock Plan. |
| (2) | As a result of the approval of the 2012 Equity Incentive Plan, no further grants or awards will be made under the 2007 Incentive Stock Plan. |
| (3) | The 2012 Equity Incentive Plan was approved in February 2013. The Plan provides for the grant or award of stock options, restricted shares, stock-based performance units and certain other types of stock based awards, with a maximum of 2,500,000 shares available for grants or awards. |
| (4) | Shares under the Employee Stock Purchase Plan (the “Plan”"Plan") are purchased in the open market by employees at the fair market value of the Company’sCompany's stock. The Company provides a matching contribution of 10% of such purchases subject to certain limitations under the Plan. As the Plan is an open market purchase plan, it does not have a dilutive effect. |
| (5) | As a result of the approval of the 2014 Director Fee Plan, no further grants or awards will be made under the 1994 Director Fee Plan. |
| (6) | Shares of restricted stock may be issued under the 2014 Director Fee Plan. The maximum number of shares authorized to be issued under the Director Fee Plan is 300,000150,000 shares. |
| ITEM 13. CERTAIN RELATIONSHIPS AND RELATED TRANSACTIONS. |
The information required by this item as to certain relationships and transactions with management and other related parties of the Company is hereby incorporated by reference from the information appearing under the captions “Proposal"Proposal No. 1 – Election of Directors”Directors" and “Certain Transactions”"Certain Transactions" in the Company’sCompany's definitive proxy statement, which involves the election of directors and is to be filed with the CommissionSEC pursuant to the Exchange Act, within 120 days of the end of the Company’sCompany's fiscal year ended September 30, 2013.2015.
| ITEM 14. PRINCIPAL ACCOUNTING FEES AND SERVICES. |
The information required by this item as to the fees billed and the services provided by the principal accounting firm of the Company is hereby incorporated by reference from the information appearing under the caption “Relationship"Relationship with Independent Registered Public Accounting Firm”Firm" in the Company’sCompany's definitive proxy statement, which involves the election of directors and is to be filed with the CommissionSEC pursuant to the Exchange Act within 120 days of the end of the Company’sCompany's fiscal year ended September 30, 2013. 2015.
PART IV
| ITEM 15. EXHIBITS, FINANCIAL STATEMENT SCHEDULES, AND REPORTS ON FORM 8-K. |
(a) 1. Financial Statements:
The following items are included in Part II, Item 8:
| | Pages | Management’sManagement's Report to Shareholders | 3337 | | | | | Report of Independent Registered Public Accounting Firm | 34-3538 | | | | Consolidated Balance Sheets as of September 30, 20132015 and 20122014 | 36-3739-40 | | | | Consolidated Statements of Income for the years ended September 30, 2013, 20122015, 2014 and 20112013 | 3841 | | | | Consolidated Statements of Comprehensive Income for the years ended September 30, 2013, 20122015, 2014 and 20112013 | 3942 | | | | Consolidated Statements of Shareholders' Equity for the years ended September 30, 2013, 20122015, 2014 and 20112013 | 4043 | | | | Consolidated Statements of Cash Flows for the years ended September 30, 2013, 20122015, 2014 and 20112013 | 4144 | | | | | Notes to Consolidated Financial Statements | 42-6645-71 | | | | | Supplementary Financial Information (unaudited) | 6772 |
| 2. | Financial Statement Schedules: |
Schedule II - Valuation and Qualifying Accounts is included on page 6873 in Part II, Item 8 of this Annual Report on Form 10-K.
The index to exhibits is on pages 75-76.
On July 19, 2013, Matthews filed a current report on Form 8-K under Item 2 in connection with a press release announcing its earnings for the third fiscal quarter of 2013.
On July 22, 2013, Matthews filed a current report on Form 8-K under item 1 in connection with the first amended and restated loan agreement dated July 18, 2013.82-84.
SIGNATURES
Pursuant to the requirements of Section 13 or 15(d) of the Securities Exchange Act of 1934, the Registrant has duly caused this report to be signed on its behalf by the undersigned, thereunto duly authorized, on November 27, 2013.24, 2015.
| | | MATTHEWS INTERNATIONAL CORPORATION | | | | (Registrant) | | | | | | | | | | | By | /s/ Joseph C. Bartolacci | | | | Joseph C. Bartolacci | | | | President and Chief Executive Officer | | | | |
Pursuant to the requirements of the Securities Exchange Act of 1934, this report has been signed below by the following persons on behalf of the Registrant and in the capacities indicated on November 27, 2013:24, 2015:
| /s/ Joseph C. Bartolacci | | /s/ Steven F. Nicola | | Joseph C. Bartolacci | | Steven F. Nicola | | President and Chief Executive Officer | | Chief Financial Officer and Secretary | | (Principal Executive Officer) | | and Treasurer (Principal(Principal Financial | | | and Accounting Officer) | | | | | | | | | | | | | | /s/ John D. Turner | | /s/ Morgan K. O’BrienO'Brien | | John D. Turner, Chairman of the Board | | Morgan K. O’Brien,O'Brien, Director | | | | | | | | | | | | | | /s/ Gregory S. Babe | | /s/ John P. O'Leary, Jr. | | Gregory S. Babe, Director | | John P. O'Leary, Jr., Director | | | | | | | | | | | | | | /s/ Katherine E. Dietze | | /s/ Jerry R. WhitakerDon W. Quigley, Jr. | | Katherine E. Dietze, Director | | Jerry R. Whitaker,Don W. Quigley, Jr., Director | | | | | | | | | | | /s/ Terry L. Dunlap | | /s/ David A. Schawk | | Terry L. Dunlap, Director | | David A. Schawk, Director | | | | | | | | | | | | | | /s/ Alvaro Garcia-Tunon | | /s/ Jerry R. Whitaker | | Alvaro Garcia-Tunon, Director | | Jerry R. Whitaker, Director | | | | |
MATTHEWS INTERNATIONAL CORPORATION AND SUBSIDIARIES EXHIBITS INDEX __________
The following Exhibits to this report are filed herewith or, if marked with an asterisk (*), are incorporated by reference. Exhibits marked with an "a" represent a management contract or compensatory plan, contract or arrangement required to be filed by Item 601(b)(10)(iii) of Regulation S-K.
| Exhibit No. | | Description | | Prior Filing or Sequential Page Numbers Herein | | | | | | | | 2.1 | | Agreement and Plan of Merger and Reorganization, dated as of March 16, 2014, by and among Matthews International Corporation, Moonlight Merger Sub Corp., Moonlight Merger Sub LLC and Schawk, Inc.* | | Exhibit Number 2.1 to the Current Report on Form 8-K filed on March 19, 2014 | | | | | | | 2.2 | | Purchase Agreement, dated June 8, 2015, by and among Matthews International Corporation, a Pennsylvania corporation, The York Group, Inc., a Delaware corporation, Aurora Products Group, LLC, each of the persons listed on Annex A thereto, and Kohlberg management VII, L.P., in its capacity as the seller's representative* | | Exhibit Number 2.1 to the Current Report on Form 8-K filed on June 11, 2015 | | | | | | | 3.1 | | Restated Articles of Incorporation* | | Exhibit Number 3.1 to the Annual Report on Form 10-K for the year ended September 30, 1994 | | | | | | | | 3.2 | | Restated By-laws* | | Exhibit Number 99.13.1 to the Current Report on Form 8-K dated October 18, 2007
filed on April 29, 2015 | | | | | | | | 4.1 a | | Form of Revised Option Agreement of Repurchase (effective October 1, 1993)* | | Exhibit Number 4.5 to the Annual Report on Form 10-K for the year ended September 30, 1993 | | | | | | | | 4.2 | | Form of Share Certificate for Class A Common Stock* | | Exhibit Number 4.9 to the Annual Report on Form 10-K for the year ended September 30, 1994 | | | | | | | | 10.1 | | First Amended and Restated Loan Agreement* | | Exhibit Number 10.1 to the Current Report on Form 8-K filed on July 22, 2013 | | | | | | | 10.2 | | First Amendment to the First Amended and Restated Loan Agreement* | | Exhibit Number 10.1 to the Current Report on Form 8-K filed on August 1, 2014 | | | | | | | 10.3 | | Second Amendment to the First Amended and Restated Loan Agreement* | | Exhibit Number 10.2 to the Current Report on Form 8-K filed on August 1, 2014 | | | | | |
| MATTHEWS INTERNATIONAL CORPORATION AND SUBSIDIARIES | | INDEX, Continued | Exhibit dated July 18, 2013No.
| | Description | | Prior Filing or Sequential Page Numbers Herein | | | | | | | | 10.4 | | Third Amendment to the First Amended and Restated Loan Agreement* | | Exhibit Number 10.4 to the Annual Report on Form 10-K for the year ended September 30, 2014 | | | | | | | 10.5 | | Fourth Amendment to the First Amended and Restated Loan Agreement* | | Exhibit Number 10.1 to the Quarterly Report on Form 10-Q for the quarter ended June 30, 2015 | | | | | | | 10.6 | | Fifth Amendment to the First Amended and Restated Loan Agreement* | | Exhibit Number 10.2 to the Quarterly Report on Form 10-Q for the quarter ended June 30, 2015 | | | | | | | 10.7 | | Voting and Support Agreement, dated March 16, 2014, by and among Matthews International Corporation and the Stockholders of Schawk, Inc.* | | Exhibit Number 10.1 to the Current Report on Form 8-K filed on March 19, 2014 | | | | | | | 10.8 | | Shareholder's Agreement, dated as of March 16, 2014, by and among Matthews International Corporation, the Shareholders named therein and David A. Schawk, in his capacity as the Family Representative* | | Exhibit Number 10.2 to the Current Report on Form 8-K filed on March 19, 2014 | | | | | | | 10.9 a | | Employment Agreement as of the 29th day of July 2014, by and between Matthews International Corporation, a Pennsylvania corporation, and David Schawk | | Exhibit A to the Definitive Proxy Statement on Schedule 14A filed on January 20, 2015 | | | | | | | 10.10 a | | Supplemental Retirement Plan (as amended through April 23, 2009)* | | Exhibit Number 10.5a10.5 to the Annual Report on Form 10-K for the year ended September 30, 2010 | | | | | | | 10.310.11 a | | Officers Retirement Restoration Plan (effective April 23, 2009)* | | Exhibit Number 10.6 to the Annual Report on Form 10-K for the year ended September 30, 2009 | | | | | | | 10.410.12 a | | 1992 Stock Incentive Plan (as amended through April 25, 2006)* | | Exhibit Number 10.1 to the Quarterly Report on Form 10-Q for the quarter ended March 31, 2006 | | | | | | | 10.510.13 a | | Form of Stock Option Agreement* | | Exhibit Number 10.7 to the Annual Report on Form 10-K for the year ended September 30, 2008 | | | | | | | 10.610.14 a | | Form of Restricted Stock Agreement* | | Exhibit Number 10.8 to the Annual Report on Form 10-K for the year ended September 30, 2008 | | | | | | | 10.710.15 a | | 1994 Director Fee Plan (as amended through April 22, 2010)* | | Exhibit Number 10.7 to the Annual Report on Form 10-K for the year ended September 30, 2013 | | | | | | | 10.16 a | | 2014 Director Fee Plan* | | Exhibit A to the Definitive Proxy Statement on Schedule 14A filed on January 21, 2014 | | | | | |
| MATTHEWS INTERNATIONAL CORPORATION AND SUBSIDIARIES | | INDEX, Continued | Exhibit No. | | Filed Herewith
Description | | Prior Filing or Sequential Page Numbers Herein | | | | | | | 10.810.17 a | | 1994 Employee Stock Purchase Plan* | | Exhibit Number 10.2 to the Quarterly Report on Form 10-Q for the quarter ended March 31, 1995 | | | | | |
MATTHEWS INTERNATIONAL CORPORATION AND SUBSIDIARIES | INDEX, Continued |
Exhibit No. | | Description | | Prior Filing or Sequential Page Numbers Herein | | | | | | | 10.910.18 a | | 2007 Equity Incentive Plan (as amended through September 26, 2008)* | | Exhibit Number 10.11 to the Annual Report on Form 10-K for the year ended September 30, 2008 | | | | | | | 10.1010.19 a | | 2010 Incentive Compensation Plan* | | Exhibit A to 2011the Definitive Proxy Statement on Schedule 14A filed on January 18, 2011 | | | | | | | 10.1110.20 a | | 2012 Equity Incentive Plan* | | Exhibit A to 2013the Definitive Proxy Statement on Schedule 14A filed on January 22, 2013 | | | | | | | | 14.1 | | Form of Code of Ethics Applicable to Executive Management * | | Exhibit Number 14.1 to the Annual Report on Form 10-K for the year ended September 30, 2004 | | | | | | | | 21 | | Subsidiaries of the Registrant | | Filed Herewith | | | | | | | | 23 | | Consent of Independent Registered Public Accounting Firm | | Filed Herewith | | | | | | | | 31.1 | | Certification of Principal Executive Officer for Joseph C. Bartolacci | | Filed Herewith | | | | | | | | 31.2 | | Certification of Principal Financial Officer for Steven F. Nicola | | Filed Herewith | | | | | | | | 32.1 | | Certification Pursuant to 18 U.S.C. Section 1350, as Adopted Pursuant to Section 906 of the Sarbanes-Oxley Act of 2002, of Joseph C. Bartolacci | | Filed Herewith | | | | | | | | 32.2 | | Certification Pursuant to 18 U.S.C. Section 1350, as Adopted Pursuant to Section 906 of the Sarbanes-Oxley Act of 2002, of Steven F. Nicola | | Filed Herewith | | | | | | |
Copies of any Exhibits will be furnished to shareholders upon written request. Requests should be directed to Mr. Steven F. Nicola, Chief Financial Officer Secretary and TreasurerSecretary of the Registrant.
|