| | | | | | | | | | | | | | | | | | | | | | | |
| UNITED STATES |
| SECURITIES AND EXCHANGE COMMISSION |
| Washington, DC 20549 |
| | | | | | | |
| Form 10-K |
| | | | | | | |
ý Annual report pursuant to Section 13 or 15(d) of the Securities Exchange Act of 1934 for the fiscal year ended December 31, 20222023 |
| OR |
¨ Transition report pursuant to Section 13 or 15(d) of the Securities Exchange Act of 1934 for the transition period from to |
| | | | | | | |
| Commission File Number 1-7293 |
| | | | | | | |
| | | | | | | |
| TENET HEALTHCARE CORPORATION |
| (Exact name of Registrant as specified in its charter) |
| | | | | | | |
| Nevada | | | 95-2557091 | |
| (State of Incorporation) | | | (IRS Employer Identification No.) | |
| | | | | | | |
| 14201 Dallas Parkway |
| Dallas, TX 75254 |
| (Address of principal executive offices, including zip code) |
| | | | | | | |
| (469) 893-2200 |
| (Registrant’s telephone number, including area code) |
| | | | | | | |
| | | | | | | |
| Securities registered pursuant to Section 12(b) of the Act: |
| | | | | | | | | | | | | | | | | | | | |
| Title of each class | | Trading symbol | | Name of each exchange on which registered | |
| Common stock, $0.05 par value | | THC | | New York Stock Exchange | |
| 6.875% Senior Notes due 2031 | | THC31 | | New York Stock Exchange | |
| | | | | | | | | | | | | | | | | | | | | | | |
Securities registered pursuant to Section 12(g) of the Act: None |
|
| | | | | | | |
Indicate by check mark if the Registrant is a well-known seasoned issuer, as defined in Rule 405 of the Securities Act. Yes ý No ¨ |
| | | | | | | |
Indicate by check mark if the Registrant is not required to file reports pursuant to Section 13 or Section 15(d) of the Exchange Act. Yes ¨ No ý |
| | | | | | | |
Indicate by check mark whether the Registrant (1) has filed all reports required to be filed by Section 13 or 15(d) of the Exchange Act during the preceding 12 months, and (2) has been subject to such filing requirements for the past 90 days. Yes ý No ¨ |
| | | | | | | |
Indicate by check mark whether the Registrant has submitted electronically every Interactive Data File required to be submitted pursuant to Rule 405 of Regulation S-T during the preceding 12 months. Yes ý No ¨ |
| | | | | | | |
| Indicate by check mark whether the Registrant is a large accelerated filer, an accelerated filer, a non-accelerated filer, a smaller reporting company or an emerging growth company (each as defined in Exchange Act Rule 12b-2). |
| | | | | | | | | | | | | | |
Large accelerated filer ý | Accelerated filer ¨ | Non-accelerated filer ¨ |
| | | | | | | | | | | | | | |
| Smaller reporting company ☐ | | Emerging growth company ☐ | |
| | |
If an emerging growth company, indicate by check mark if the Registrant has elected not to use the extended transition period for complying with any new or revised financial accounting standards provided pursuant to Section 13(a) of the Exchange Act. ¨ |
|
Indicate by check mark whether the Registrant has filed a report on and attestation to its management’s assessment of the effectiveness of its internal control over financial reporting under Section 404(b) of the Sarbanes-Oxley Act (15 U.S.C. 7262(b)) by the registered public accounting firm that prepared or issued its audit report. ý |
|
If securities are registered pursuant to Section 12(b) of the Exchange Act, indicate by check mark whether the financial statements of the Registrant included in the filing reflect the correction of an error to previously issued financial statements. ¨ ☐ |
|
Indicate by check mark whether any of those error corrections are restatements that required a recovery analysis of incentive-based compensation received by any of the Registrant’s executive officers during the relevant recovery period pursuant to §240.10D-1(b). ¨ |
|
Indicate by check mark whether the Registrant is a shell company (as defined in Exchange Act Rule 12b-2). Yes ¨ No ý |
|
As of June 30, 2022,2023, the aggregate market value of the shares of common stock held by non-affiliates of the Registrant (treating directors, executive officers who were SEC reporting persons, and holders of 10% or more of the common stock outstanding as of that date, for this purpose, as affiliates) was approximately $5.6$6.4 billion based on the closing price of the Registrant’s shares on the New York Stock Exchange on that day. As of January 31, 2023,2024, there were 102,274,10299,995 shares (in thousands) of common stock outstanding. |
|
DOCUMENTS INCORPORATED BY REFERENCE |
|
Portions of the Registrant’s definitive proxy statement for the 20232024 annual meeting of shareholders are incorporated by reference into Part III of this Form 10-K. |
PART I.
ITEM 1. BUSINESS
OVERVIEW
Tenet Healthcare Corporation (“Tenet”) is a diversified healthcare services company with its headquarters in Dallas, Texas, and a Global Business Center (“GBC”) supporting various administrative functions in Manila, Philippines. We operate our expansive, nationwide care delivery network through direct and indirect subsidiaries, including USPI Holding Company, Inc. (“USPI”), as well as downstream partnerships and joint ventures; the terms “we,” “our” and “us,” as used in this report and unless otherwise stated or indicated by the context, refer to Tenet and these entities. At
Prior to December 31, 2022, we operated 61 acute care and specialty hospitals, as well as over 575 other healthcare facilities, including surgical hospitals, ambulatory surgery centers (each, an “ASC”), imaging centers, off-campus emergency departments (each, an “ED”) and micro‑hospitals. In addition, we operate Conifer Health Solutions, LLC (“Conifer JV”), a joint venture that provides revenue cycle management and value‑based care services to hospitals, health systems, physician practices, employers and other clients. For financial reporting purposes,2023, our business lines are classifiedwas organized into three separate reportable operating segments –reporting segments: Hospital Operations and other, (“Hospital Operations”), Ambulatory Care and Conifer. Additional information about our operating segments is provided below; statistical data forFor the segments can be foundreasons discussed in Item 7, Management’s Discussion and Analysis of Financial Condition and Results of Operations, of Part II of this report (“MD&A”)., we combined our Hospital Operations and other and Conifer segments in the three months ended December 31, 2023. Our business is now classified into two separate reporting segments:
In 2022,•Hospital Operations and Services (“Hospital Operations”), including: (i) 61 acute care and specialty hospitals, a network of employed physicians, and 164 outpatient facilities, including imaging centers, urgent care centers (each, a “UCC”), ancillary emergency facilities and micro‑hospitals, at December 31, 2023; and (ii) the publicrevenue cycle management and value‑based care services that our Conifer Health Solutions, LLC joint venture (“Conifer JV”) provides to hospitals, health systems, physician practices, employers and economic effectsother clients; and
•Ambulatory Care, which is comprised of the COVID‑19 pandemic continuedoperations of our subsidiary USPI Holding Company, Inc. (“USPI”), which held indirect ownership interests in over 460 ambulatory surgery centers (each, an “ASC”) and 24 surgical hospitals at December 31, 2023.
All prior-period data presented in this report has been adjusted to adversely impact our operating segments, as well as our patients, communities and employees,conform to varying degrees. Throughout MD&A, we have: (1) provided additional information on the effects the pandemic has had on our results of operations; (2) disclosed the various actions we have taken, and are continuing to take, to increase our liquidity and mitigate the impact of reductions in our patient volumes and changes in our service mix and revenue mix; and (3)new reporting segment structure described various legislative actions that have alleviated some of the adverse financial impacts of the pandemic on our business. The ultimate extent and scope of the pandemic and the future effects it may have on us remain unknown. Forabove. Additional information about risks and uncertainties related to COVID‑19 that could affect our business, financial condition, results of operations and cash flows, we refer you toreporting segments is provided below; statistical data for the Risk Factors section below.segments can be found in MD&A.
OPERATIONS
HOSPITAL OPERATIONS AND SERVICES SEGMENT
Hospitals, Ancillary Outpatient Facilities and Related Businesses—In 2022,2023, we continued to makepursue advantageous opportunities to grow our portfolio of hospitals and other healthcare facilities. In December 2023, we completed a joint venture transaction with NextCare, Inc. (“NextCare”) and certain of its affiliates pursuant to which we acquired ownership interests in 56 fully operational UCCs and one telehealth center located in Arizona. NextCare will continue to provide management services to each UCC pursuant to the terms of a management services agreement, and the centers will continue to operate under the NextCare brand. In addition, we are constructing a new medical campus located in the Westover Hills area of San Antonio, Texas, that is expected to include a 104‑bed acute care hospital, an ASC and medical office space. The project is currently on schedule for completion in mid‑2024. During 2023, we also broke ground on a new medical campus located in Port St. Lucie, Florida that is expected to include a 54-bed hospital, as well as medical office space. We expect to complete construction of the Port St. Lucie medical campus in late 2025.
From time to time, we also capitalize on opportunities to refine our portfolio of hospitals and other healthcare facilities when we believe such refinements will help us improve profitability, allocate capital more effectively in areas where we have a stronger presence, deploy proceeds on higher‑return investments across our Hospital Operations segmentbusiness, enhance cash flow generation and reduce our debt, among other things. In November 2023, we entered into a definitive agreement to offer more convenient access to higher‑demandsell three of our South Carolina hospitals, their affiliated physician practices and higher‑acuity clinical service linesother related hospital operations, and that transaction closed on January 31, 2024. Also in January 2024, we entered into a definitive agreement for the communities we serve. In September 2022, we opened a newsale of four acute care hospital, Piedmont Medical Center Fort Mill,hospitals and related operations in South Carolina; this newly constructed 100‑bed facility includes an emergency department, multi‑specialty operating rooms, an intensive care unit,Orange County and laborLos Angeles County, California. The transaction is expected to be completed by early 2024, subject to customary regulatory approvals, clearances and delivery rooms. We also sold or closed three outpatient centers andclosing conditions. In addition, we exited some service lines at individual facilities in 2022,2023, in each case because we believe they are no longer a core part of our long‑term growth and synergy strategies. We may decide to sell, consolidate or close facilities or service lines in the future to eliminate duplicate services or excess capacity or because of changing market conditions or other factors.
At December 31, 2022,2023, our subsidiaries operated 61 hospitals serving primarily urban and suburban communities in nine states. Our subsidiaries had sole ownership of 53 of these hospitals, six were owned or leased by entities that are majority owned by a Tenet subsidiary, and two were owned by third parties and leased by our wholly owned subsidiaries. Our Hospital Operations segment also included 109164 outpatient centers at December 31, 2022,2023, the majority of which are provider‑based and
freestanding imaging centers, freestanding UCCs, off‑campus hospital EDsemergency departments (“EDs”) and micro‑hospitals, and provider‑based ASCs.hospitals. In addition, at December 31, 2022,2023, our subsidiaries owned or leased and operated: a number of medical office buildings, all of which were located on, or nearby, our hospital campuses; over 750nearly 770 physician practices with a network of employed physicians; several accountable care organizations and clinically integrated networks; and other ancillaryassociated healthcare businesses.
Each of our general hospitals offers acute care services, operating and recovery rooms, radiology services, respiratory therapy services, clinical laboratories and pharmacies; in addition, most have: intensive care, critical care and/or coronary care units; cardiovascular, digestive disease, neurosciences, musculoskeletal and obstetrics services; and outpatient services, including physical therapy. Many of our hospitals provide tertiary care services, such as cardiothoracic surgery, complex spinal surgery, neonatal intensive care and neurosurgery, and some also offer quaternary care in areas such as heart and kidney transplants. Moreover, a number of our hospitals offer advanced treatment options for patients, including limb‑salvaging vascular procedures, acute level 1 trauma services, comprehensive intravascular stroke care, minimally invasive cardiac valve replacement, cutting‑edge imaging technology, surgical robotic capabilities and telemedicine access for select medical specialties.
All of the hospitals in our Hospital Operations segment are licensed under appropriate state laws, and each is accredited by The Joint Commission. With such accreditation, our hospitals are deemed to meet the Medicare Conditions of Participation and Conditions for Coverage, and they are eligible to participate Medicare, Medicaid and other government‑sponsored provider programs.
The following table lists, by state, the hospitals wholly owned, operated as part of a joint venture, or leased and operated by our wholly owned subsidiaries at December 31, 2022:2023:
| | | | | | | | | | | | | | | | | | | | |
| Hospital | | Location | | Licensed Beds | | | | | | | | | | | | | | | | | | Status |
HospitalAlabama | | | Location | | Licensed
Beds | | Status
Alabama | | | | | | |
Brookwood Baptist Medical Center(1) | | Homewood | | 595 | | | JV/Owned |
Citizens Baptist Medical Center(1)(2) | | Talladega | | 122 | | | JV/Leased |
Princeton Baptist Medical Center(1)(2) | | Birmingham | | 505 | | | JV/Leased |
Shelby Baptist Medical Center(1)(2) | | Alabaster | | 252 | | | JV/Leased |
Walker Baptist Medical Center(1)(2) | | Jasper | | 267 | | | JV/Leased |
| | | | | | |
| Arizona | | | | | | |
Abrazo Arizona Heart Hospital(3) | | Phoenix | | 59 | | | Owned |
| Abrazo Arrowhead Campus | | Glendale | | 217 215 | | | Owned |
| Abrazo Central Campus | | Phoenix | | 206 | | | Owned |
| Abrazo Scottsdale Campus | | Phoenix | | 120 | | | Owned |
| Abrazo West Campus | | Goodyear | | 216 | | | Owned |
Holy Cross Hospital(4) | | Nogales | | 25 | | | Owned |
| St. Joseph’s Hospital | | Tucson | | 486 | | | Owned |
| St. Mary’s Hospital | | Tucson | | 400 | | | Owned |
| | | | | | |
| California | | | | | | |
Desert Regional Medical Center(5) | | Palm Springs | | 385 | | | Leased |
| Doctors Hospital of Manteca | | Manteca | | 73 | | | Owned |
| Doctors Medical Center | | Modesto | | 461 | | | Owned |
| Emanuel Medical Center | | Turlock | | 209 | | | Owned |
Fountain Valley Regional Hospital and Medical Center(6) | | Fountain Valley | | 400 | | | Owned |
Hi-Desert Medical Center(6)(7) | | Joshua Tree | | 179 | | | Leased |
| John F. Kennedy Memorial Hospital | | Indio | | 145 | | | Owned |
Lakewood Regional Medical Center(6) | | Lakewood | | 172 | | | Owned |
Los Alamitos Medical Center(6) | | Los Alamitos | | 172 | | | Owned |
Placentia Linda Hospital(6) | | Placentia | | 114 | | | Owned |
San Ramon Regional Medical Center(7)(8) | | San Ramon | | 123 | | | JV/Owned |
| Tenet Health Central Coast Sierra Vista Regional Medical Center | | San Luis Obispo | | 162 | | | Owned |
| Tenet Health Central Coast Twin Cities Community Hospital | | Templeton | | 122 | | | Owned |
| | | | | | |
| | | | | | | | | | | | | | | | | | | | |
| Hospital | | Location | | Licensed Beds | | | | Status |
| Florida | | | | | | |
| | | | | | |
| Delray Medical Center | | Delray Beach | | 536 | | | Owned |
| | | | | | |
| Good Samaritan Medical Center | | West Palm Beach | | 333 | | | Owned |
| | | | | | |
| | | | | | |
| Palm Beach Gardens Medical Center | | Palm Beach Gardens | | 199 | | | Owned |
| | | | | | |
| St. Mary’s Medical Center | | West Palm Beach | | 420 | | | Owned |
| West Boca Medical Center | | Boca Raton | | 195 | | | Owned |
| | | | | | |
| Massachusetts | | | | | | |
| MetroWest Medical Center – Framingham Union Campus | | Framingham | | 126 136 | | | Owned |
MetroWest Medical Center – Leonard Morse Campus(3) | | Natick | | 103 | | | Owned |
| Saint Vincent Hospital | | Worcester | | 290 | | | Owned |
| | | | | | |
| Michigan | | | | | | |
| | | | | | |
| | | | | | |
| | | | | | |
| | | | | | | | | | | | | | | | | | | | |
Hospital | | Location | | Licensed
Beds | | Status |
| | | | | | |
| | | | | | |
| | | | | | |
| | | | | | |
| | | | | | |
Michigan | | | | | | |
| Children’s Hospital of Michigan | | Detroit | | 228 | | | Owned |
| Detroit Receiving Hospital | | Detroit | | 273 | | | Owned |
| Harper University Hospital | | Detroit | | 470 | | | Owned |
| Huron Valley-Sinai Hospital | | Commerce Township | | 158 | | | Owned |
| Hutzel Women’s Hospital | | Detroit | | 114 | | | Owned |
Rehabilitation Institute of Michigan(3) | | Detroit | | 69 | | | Owned |
| Sinai-Grace Hospital | | Detroit | | 404 | | | Owned |
| | | | | | |
| South Carolina | | | | | | |
Coastal Carolina Hospital(9) | | Hardeeville | | 44 | | | Owned |
East Cooper Medical Center(9) | | Mount Pleasant | | 140 | | | Owned |
Hilton Head Hospital(9) | | Hilton Head Island | | 93 | | | Owned |
| Piedmont Medical Center | | Rock Hill | | 294 | | | Owned |
| Piedmont Medical Center Fort Mill | | Fort Mill | | 100 | | | Owned |
| | | | | | |
| Tennessee | | | | | | |
| Saint Francis Hospital | | Memphis | | 479 | | | Owned |
| Saint Francis Hospital – Bartlett | | Bartlett | | 196 | | | Owned |
| | | | | | |
| Texas | | | | | | |
| Baptist Medical Center | | San Antonio | | 607 | | | Owned |
| The Hospitals of Providence East Campus | | El Paso | | 218 | | | Owned |
| The Hospitals of Providence Memorial Campus | | El Paso | | 480 | | | Owned |
| The Hospitals of Providence Sierra Campus | | El Paso | | 306 | | | Owned |
| The Hospitals of Providence Transmountain Campus | | El Paso | | 108 | | | Owned |
| Mission Trail Baptist Hospital | | San Antonio | | 110 114 | | | Owned |
| Nacogdoches Medical Center | | Nacogdoches | | 161 | | | Owned |
| North Central Baptist Hospital | | San Antonio | | 443 | | | Owned |
| Northeast Baptist Hospital | | San Antonio | | 347 | | | Owned |
Resolute HealthBaptist Hospital | | New Braunfels | | 128 | | | Owned |
| St. Luke’s Baptist Hospital | | San Antonio | | 287 | | | Owned |
| Valley Baptist Medical Center | | Harlingen | | 586 | | | Owned |
| Valley Baptist Medical Center – Brownsville | | Brownsville | | 240 | | | Owned |
| | | | | | |
| Total Licensed Beds | | | | 15,484 | | | 15,472 | | |
(1)Operated by a limited liability company formed as part of a joint venture with Baptist Health System, Inc. (“BHS”), a not‑for‑profit health system in Alabama; a Tenet subsidiary owned a 70% interest in the entity at December 31, 2022,2023, and BHS owned a 30% interest.
(2)In order to receive certain tax benefits for these hospitals, which were operated as nonprofit hospitals prior to our joint venture with BHS, we have entered into arrangements with the City of Talladega, the City of Birmingham, the City of Alabaster and the City of Jasper such that a Medical Clinic Board owns each of these hospitals, and the hospitals are leased to our joint venture entity. These capital leases expire between November 2025 and September 2036, but contain two optional renewal terms of 10 years each.
(3)Specialty hospital.
(4)Designated by the Centers for Medicare & Medicaid Services (“CMS”) as a critical access hospital.
(5)Lease expires in May 2027.
(6)In January 2024, we entered into a definitive agreement for the sale of these hospitals and related operations. The transaction is expected to be completed by early 2024, subject to customary regulatory approvals, clearances and closing conditions.
(7)Lease expires in July 2045.
(7)(8)Owned by a limited liability company formed as part of a joint venture with John Muir Health (“JMH”John Muir”), a not‑for‑profit health system in the San Francisco Bay area; a Tenet subsidiary owned a 51% interest in the entity at December 31, 2022,2023, and JMHJohn Muir owned a 49% interest. In
(9)These hospitals, their affiliated physician practices and other related hospital operations were sold on January 2023, we entered into a definitive agreement whereby JMH will acquire sole ownership of the hospital before the end of the year, subject to regulatory approvals and customary closing conditions.31, 2024.
Information regarding the utilization of licensed beds and other operating statistics at December 31, 20222023 and 20212022 can be found in MD&A.
At December 31, 2022,2023, our Hospital Operations segment also included 42 imaging centers, 14 off‑campus EDs and 10nine ASCs, all of which are operated as departments of our hospitals and under the same license, as well as 4399 separately licensed, freestanding outpatient centers – typically at locations complementary to our hospitals – consisting of 58 UCCs (56 of which are jointly owned with and managed by NextCare in Arizona), 25 imaging centers, 1415 emergency facilities (13(14 of which are licensed as micro‑hospitals), two ASCs and two urgent care centers.one ASC. Approximately half60% of the outpatient centers in our Hospital Operations segment at December 31, 20222023 were in TexasArizona and California, the same states where we had the largest concentrations of licensed hospital beds.Texas. Strong concentrations of hospital beds and outpatient centersfacilities within operating areas may help us contract more successfully withexpand our managed care payers,payer network, reduce management, marketing and other expenses, and more efficiently utilize resources. However, these concentrations increase the risk that, should any adverse economic, regulatory, environmental, competitive or other condition (including surges of COVID‑19 or other illnesses) occur in these areas, our overall business, financial condition, results of operations or cash flows could be materially adversely affected.
Accountable Care OrganizationsIn addition to the hospitals and Clinically Integrated Networks—We own, controloutpatient facilities discussed above, our Hospital Operations segment now includes our Conifer JV’s revenue cycle management and value‑based care service offerings. At December 31, 2023, we owned 76.2% of the Conifer JV, and Catholic Health Initiatives (“CHI”) had a 23.8% ownership position. The term “Conifer,” as used in Part I of this report and unless otherwise stated or operate one accountable care organization (“ACO”)indicated by the context, refers to our Conifer JV and three clinically integrated networks (each, a “CIN”) – its direct or indirect wholly owned subsidiaries.
The revenue cycle management solutions we offer consist of: (1) patient services, including: centralized insurance and benefit verification; financial clearance, pre‑certification, registration and check‑in Alabama, Arizona, Massachusettsservices; and Texas –financial counseling services, including reviews of eligibility for government healthcare or financial assistance programs, for both insured and participate in an additional ACOuninsured patients, as well as qualified health plan coverage; (2) clinical revenue integrity solutions, including: clinical admission reviews; coding; clinical documentation improvement; coding compliance audits; charge description master management; and an additional CIN with other healthcare providers for select operating areas in Arizona. An ACO is a grouphealth information services; and (3) accounts receivable management solutions, including: third‑party billing and collections; denials management; and patient collections. All of these solutions include ongoing measurement and monitoring of key revenue cycle metrics, as well as productivity and quality improvement programs. In addition, we provide customized communications and engagement solutions to optimize the relationship between providers and suppliers that work togetherpatients. We also offer value‑based care services, including clinical integration, financial risk management and population health management, all of which aim to redesignassist clients in improving the cost and quality of their healthcare delivery, processes in an effort to achieve high‑quality and efficient provision of services under contract with CMS. ACOs that achieve quality performance standards established by the U.S. Department of Health and Human Services (“HHS”) are eligible to share in a portionas well as their patient outcomes.
At December 31, 2023, we provided one or more of the amounts saved bybusiness process services described above to approximately 675 Tenet and non‑Tenet hospitals and other clients nationwide. Tenet and CHI facilities represented approximately 43% of these clients, and the Medicare program. A CIN coordinates the healthcare needsremainder were unaffiliated health systems, hospitals, physician practices, self‑insured organizations, health plans and other entities. Conifer’s agreement with CHI to provide patient access, revenue integrity, accounts receivable management and patient financial services to CHI’s facilities expires on December 31, 2032.
AMBULATORY CARE SEGMENT
At December 31, 2022,2023, USPI held indirect ownership interests in 442over 460 ASCs and 24 surgical hospitals in 35 states.
USPI’s facilities offer a range of procedures and service lines, including, among other specialties: orthopedics, total joint replacement, and spinal and other musculoskeletal procedures; gastroenterology; pain management; otolaryngology (ear, nose and throat); gastroenterology; ophthalmology; and urology. At the beginning of 2022, we owned approximately 95% of USPI, and Baylor University Medical Center (“Baylor”) owned approximately 5%. Effective June 30, 2022, we purchased all of the shares in USPI that Baylor held on that date, which increased our ownership interest in USPI’s voting shares from 95% to 100%.
We believe USPI’s ASCs and surgical hospitals offer many advantages to patients and physicians, including greater affordability, predictability, flexibility and convenience. Moreover, due in part to advancements in surgical techniques, medical technology and anesthesia, as well as the lower cost structure and greater efficiencies that are attainable at a specialized outpatient site, we believe the volume and complexity of surgical cases performed in the outpatient setting will continue to increase over time. For these reasons, we remain focused on opportunities to expand our Ambulatory Care segment through acquisitions, organic growth, construction of new outpatient centers and strategic partnerships. In July 2022, USPI formed a joint venture with United Urology Group (“UUG”) andDuring the year ended December 31, 2023, we acquired controlling ownership interests in 2220 ASCs (three ofin which were thenwe did not have a previous investment, and we opened nine de novo ASCs. We also continue to prioritize increasing our investment in development). Including the UUG centers,our unconsolidated facilities; during the year ended December 31, 2022,2023, we added over 35 ASCs to our portfolio through acquisitions of majority and minority ownership interests, and we opened 15 new (or de novo) ASCs. Also during 2022, we increased ouracquired controlling ownership interests in over 2011 of our previously unconsolidated ASCs, which allowedallowing us to consolidate their financial results. Our goal is to have an ownership interest in and operate 575 to 600 ASCs by the end of 2025.
In addition, we are taking steps to grow our Ambulatory Care segment business by replacing high-volume,high‑volume, low‑acuity servicesservice lines with service lines involving higher acuity cases. To that end, we closed or sold our ownership interests in a small number of centers that we believe are no longer part of our long-termlong‑term growth strategy.
Our goal is to have an ownership interest in and operate 575 to 600 ASCs by the end of 2025. In December 2021, USPI and principals of Surgical Center Development (“SCD”) entered into a joint venture and development agreement under which USPI will have the exclusive option to partner with affiliates of SCD on the future development of a minimum target of 50 de novo ASCs through December 2026. We believe that this arrangement will enable us to continue to sharpen our focus on the growth and expansion of ambulatory surgical services.
Operations of USPI—USPI acquires and develops its facilities primarily through the formation of joint ventures with physicians and health systems.system partners. USPI’s subsidiaries hold ownership interests in the facilities directly or indirectly and operate the majority of its facilities on a day‑to‑day basis through management services contracts.
We operate USPI’s facilities, structure our joint ventures, and adopt staffing, scheduling, and clinical systems and protocols with the goal of increasing physician productivity.productivity and satisfaction. We believe that this focus on physician satisfaction,physicians, combined with providing high‑quality healthcare in a friendly and convenient environment for patients, will continue to increase the number of procedures performed at our facilities over time. Our joint ventures also enable health systems to offer patients, physicians and payers the cost advantages, convenience and other benefits of ambulatory care in a freestanding facility and, in certain areas, establish networks needed to manage the full continuum of care for a defined population. Further, these relationships allow the health systems to focus their attention and resources on their core businesses without the challenge of acquiring, developing and operating ancillary facilities.
CONIFER SEGMENT
Nearly all of the services comprising the operations of our Conifer segment are provided by our Conifer JV or one of its direct or indirect wholly owned subsidiaries. At December 31, 2022, our Conifer Holdings, Inc. subsidiary (“Conifer Holdings”) owned 76.2% of the Conifer JV, and Catholic Health Initiatives (“CHI”) had a 23.8% ownership position. (As a result of its 2019 merger with Dignity Health, CHI is now a part of CommonSpirit Health.) The term “Conifer,” as used in Part I of this report and unless otherwise stated or indicated by the context, refers to Conifer Holdings, our Conifer JV, and their direct or indirect wholly owned subsidiaries.
Services—Conifer provides comprehensive end‑to‑end and focused‑point business process services, including hospital and physician revenue cycle management, patient communications and engagement support, and value‑based care solutions, to hospitals, health systems, physician practices, employers and other clients.
Conifer’s revenue cycle management solutions consist of: (1) patient services, including: centralized insurance and benefit verification; financial clearance, pre‑certification, registration and check‑in services; and financial counseling services, including reviews of eligibility for government healthcare or financial assistance programs, for both insured and uninsured patients, as well as qualified health plan coverage; (2) clinical revenue integrity solutions, including: clinical admission reviews; coding; clinical documentation improvement; coding compliance audits; charge description master management; and health information services; and (3) accounts receivable management solutions, including: third‑party billing and collections; denials management; and patient collections. All of these solutions, which aim to assist clients in improving their cash flow, revenue, and physician and patient satisfaction, include ongoing measurement and monitoring of key revenue cycle metrics, as well as productivity and quality improvement programs.
In addition, Conifer offers customized communications and engagement solutions to optimize the relationship between providers and patients. Conifer’s trained customer service representatives provide direct, 24‑hour, multilingual support for (1) physician referral requests, calls regarding maternity services and other patient inquiries, (2) community education and
outreach, and (3) scheduling and appointment reminders. Conifer coordinates and implements marketing outreach programs, as well, to keep patients informed of screenings, seminars, and other events and services.
Conifer also offers value‑based care solutions, including clinical integration, financial risk management and population health management, all of which aim to assist clients in improving the cost and quality of their healthcare delivery, as well as their patient outcomes. Conifer helps clients build CINs that provide predictive analytics and quality measures across the care continuum. In addition, Conifer facilitates the alignment and management of financial incentives among healthcare stakeholders through risk modeling and administration of various payment models. Furthermore, Conifer offers clients tools and analytics to improve quality of care and provide care management services for patients with chronic diseases by identifying high‑risk patients, coordinating with patients and clinicians in managing care, and monitoring clinical outcomes.
At December 31, 2022, Conifer provided one or more of the business process services described above to approximately 660 Tenet and non‑Tenet hospital and other clients nationwide. Tenet and CHI facilities represented approximately 44% of these clients, and the remainder were unaffiliated health systems, hospitals, physician practices, self‑insured organizations, health plans and other entities. We believe the pricing terms for the services Conifer provides to our facilities are commercially reasonable and consistent with estimated third-party terms. Conifer’s agreement with CHI to provide patient access, revenue integrity, accounts receivable management and patient financial services to CHI’s facilities expires on December 31, 2032. For the year ended December 31, 2022, approximately 34% of Conifer’s net operating revenues were attributable to its relationship with Tenet and approximately 46% were attributable to its relationship with CHI.
REAL PROPERTY
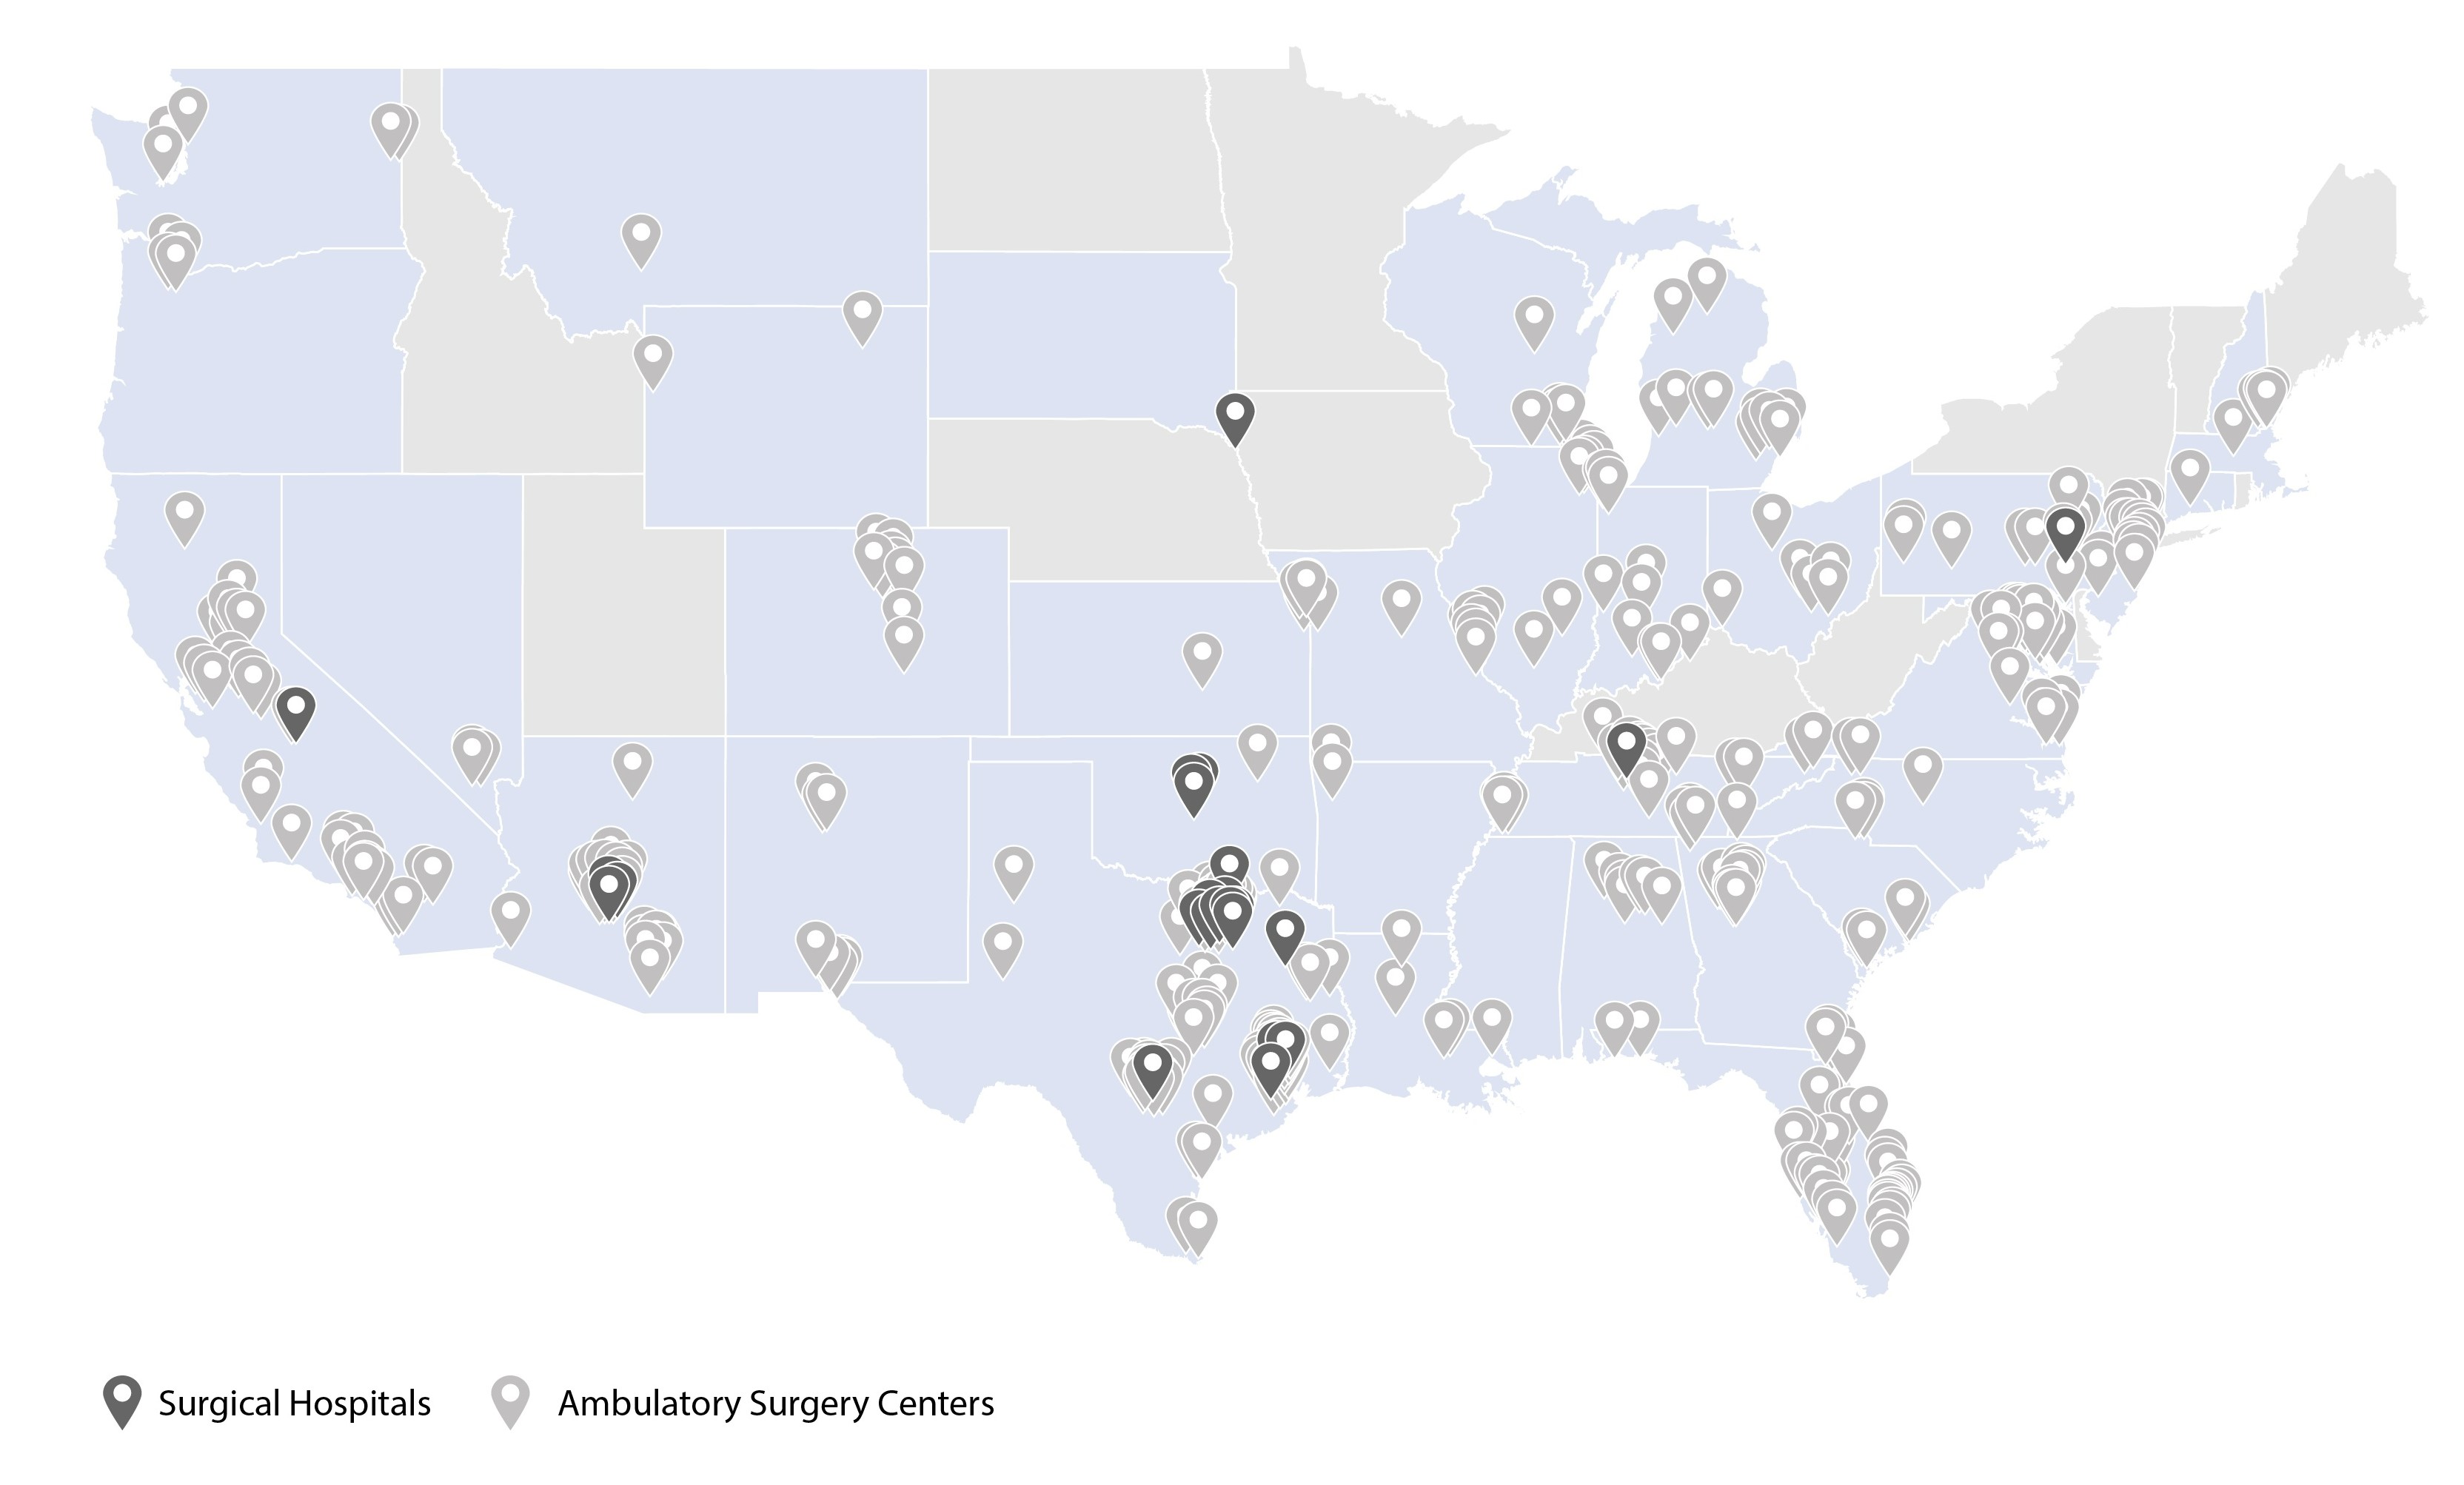
The locations of our acute care and specialty hospitals and the number of licensed beds at each at December 31, 20222023 are set forth in the table beginning on page 2. The locations of USPI’s surgical hospitals and ASCs are reflected on the map on page 45. We lease the majority of our outpatient facilities in both our Hospital Operations segment and our Ambulatory Care segment. These leases typically have initial terms ranging from five to 10 years, and most of the leases contain options to extend the lease periods. Our subsidiaries also operate a number of medical office buildings, all of which are located on, or nearby, our hospital campuses. We own many of these medical office buildings; the remainder are owned by third parties and leased by our subsidiaries. We typically lease our office space under operating lease agreements. Our corporate headquarters are located in Dallas, Texas. In addition, we maintain administrative offices in regions where we operate hospitals and other businesses, as well as our GBC in Manila. We believe that all of our properties are suitable for their respective uses and are, in general, adequate for our present needs.
HUMAN CAPITAL RESOURCES
PHYSICIANS
Our operations depend in large part on the number, quality, specialties, and admitting and scheduling practices of the licensed physicians who are members of the medical staffs of our hospitals and other facilities, as well as physicians who affiliate with us and use our facilities as an extension of their practices. Under state laws and other licensing standards, medical staffs are generally self‑governing organizations subject to ultimate oversight by the facility’s local governing board. Members of the medical staffs of our facilities also often serve on the medical staffs of facilities we do not operate, and they are free to terminate their association with our facilities or admit their patients to competing facilities at any time. It is essential to our ongoing business and clinical program development that we attract an appropriate number of quality physicians in the specialties required to support our services and that we maintain good relations with those physicians.
Although we have no contractual relationship with most of the physicians who practice at our hospitals and outpatient centers, at December 31, 2022,2023, we owned over 750nearly 770 physician practices, and our subsidiaries employed (where permitted by state law) or otherwise affiliated with over 1,450nearly 1,320 physicians. Our ability to employ physicians is closely regulated, with a number of states prohibiting the corporate practice of medicine or otherwise regulating what types of entities may employ physicians, and we structure our arrangements with healthcare providers to comply with these state laws.
In 2022,2023, we continued to experience challenges in recruiting and retaining physicians. In some of the regions in whichwhere we operate, physician recruitment and retention are affected by a shortage of qualified physicians in certain higher-demand clinical service lines and specialties. Moreover, we continue to refine our physician base and provider programs to focus on experienced, high-quality and collaborative specialists.
EMPLOYEES
We believe each employee across our network has a role integral to our mission, which is to provide quality, compassionate care in the communities we serve. At December 31, 2022,2023, we employed approximately 102,400106,500 people (of which approximately 26% were part‑time and on-call employees) in our three operatingtwo reporting segments, as follows:
| | | | | |
| Hospital Operations | 69,25084,000 | |
| Ambulatory Care | 21,40022,500 | |
| Conifer | 11,750 |
| Total | 102,400106,500 | |
At December 31, 2022, the2023, our overall employee headcount in our Hospital Operations segment remained substantially consistent with December 31, 2021. Year over year, the headcount in our Ambulatory Care segment increasedwas approximately 6%, partially due to our acquisition activity, and the headcount in our Conifer segment increased approximately 8% to support our continued growth and facilitate the transition of various administrative functions to our GBC. At4% higher than at December 31, 2022, wein part due to recruiting efforts to fill open positions and reduce contract labor expense. We had employees in all 50 U.S. states and the District of Columbia, as well as nearly 3,000approximately 3,250 employees providing support across our entire network at our GBC.GBC, at December 31, 2023. Approximately 32%33% of our employees are nurses.
Board Oversight—Our board of directors and its committees oversee human capital matters through regular reports from management and advisors. The board’s human resources committee (“HR Committee”) is responsible for establishing general compensation policies that (1) support our overall business strategies and objectives, (2) enhance our efforts to attract and retain skilled employees, (3) link compensation with our business objectives and organizational performance, and (4) provide competitive compensation opportunities for key executives. The HR Committee also provides, among other things, its perspectives regarding performance management, succession planning, leadership development, diversity, recruiting,
retention and employee training. The board’s environmental, social and governance (“ESG”) committee which was formed in 2021, provides oversight with respect to our ESG strategy and guidance on ESG matters that are relevant to our business.
ESG Report—Additional information regarding our approach to and progress in connection with ESG matters can be found in our most recent ESG Report, which is available on our website. The information found on our website, including the information in our ESG Reports, is not incorporated by reference into nor part of this or any other report or document we file with or furnish to the U.S. Securities and Exchange Commission (“SEC”).
Human Resources Practices—We have established – and continue to enhance and refine – a comprehensive set of practices for recruiting, managing and optimizing the human resources of our organization. In many cases, we utilize objective benchmarking and other tools in our efforts in such areas as organizational effectiveness, engagement, voluntary turnover and staffing efficiencies.
Compensation and Benefits; Culture—In general, we seek to attract, develop and retain ana qualified and engaged workforce, cultivate a high‑performance culture that embraces data‑driven decision‑making, and improve talent management processes to promote diversity and inclusion. To that end, we offer:
•a competitive range of compensation and benefit programs (which vary by location and other factors) designed to reward performance and promote well‑being, including an employee stock purchase plan, a 401(k) plan, health care and insurance benefits, health savings and flexible spending accounts, and paid time off;
•opportunities for continuing education and advancement through a broad range of clinical training and leadership development experiences, including in‑person and online courses and mentoring opportunities;
•a supportive, inclusive and patient‑centered culture aligned with our values and based on respect for others;
•company‑sponsored efforts encouraging and recognizing volunteerism and community service; and
•a code of conduct that promotes integrity, accountability and transparency, among other high ethical standards.
Employee Safety and Welfare—We believe our employees comprise a community built on care, and we place a high priority on maintaining a secure and healthy workplace for them. We promote a culture of safetywell‑being and reporting by connecting employee safety policies with patient safety policies, and we review and refine the policies regularly. At our hospitals, outpatient facilities, and other care sites, we align staffing to need in our nursing units, and we invest in appropriate training to improve the competency of our caregivers. In addition, we have heightened infection-prevention protocols, we maintain consistent availability of personal protective equipment and disinfection supplies, and we regularly provide concise and current infection prevention guidance.
We also offer resources to help employees manage challenging circumstances, including a comprehensive employee assistance program comprised of counseling services, financial guidance and legal aid. The Tenet Care Fund (the “Care Fund”) is a 501(c)(3) public charity that provides financial assistance to our employees who have experienced hardship due to, among other things, fires, natural disasters, catastrophic injuries and extended illnesses. The Care Fund is funded primarily by our employees for our employees.
Diversity and Inclusion—We continue to focus on the hiring, advancement and retention of underrepresented populations to further our objective of fostering an engaging culture with a workforce and leadership teams that represent the communities we serve. As of December 31, 2022,2023, our total workforce was approximately 78% female, and nearly 50%over 52% of our employees self‑identified as racially or ethnically diverse. Approximately 55% of new employees (i.e., those we hired in 2022) self‑identified as racially or ethnically diverse.
We have a Diversity Council, which consists of leaders representing different facets of our enterprise, to support our overall diversity and inclusion efforts, including in the areas of recruiting, talent development, new‑hire mentoring, community partnerships, and educational opportunities. The Diversity Council works to provide tools, guidelines and training with respect to best practices in these areas. In 2021, the Diversity Council provided oversight to our human resources department in the development and implementation of an enterprise-wide inclusive culture training session. In addition, the Diversity Council has established the following employee resource groups to support team members with similar backgrounds or shared interests: African American, Women’s Network, Asian/Pacific, LGBTQ+, Hispanic and Veteran. Each employee resource group has an executive sponsor to help in setting a unique mission and operating model for the group.
Competition; Staffing and Labor Trends—Our operations are dependent on the availability, efforts, abilities and experience of management and medical support personnel, including nurses, therapists, pharmacists and lab technicians, among others. We have always competed with other healthcare providers in recruiting and retaining thesequalified employees; however, over the past several years, our industry has been facingfaced considerable workforce challenges. Like other hospital companies, we continue to experience a shortageshortages of advanced practice providers and critical‑care nurses in certain disciplines and geographic areas. The COVID‑19 pandemic exacerbated these shortages – and, thereby, competition for qualified candidates – as more employees chose to retire early, leave the workforce or take travel assignments. In addition, in some areas, the increased demand for care of patients with COVID‑19, influenza and other respiratory viruses inat our hospitals,facilities, as well as the direct impact of these illnesses on physicians, employees and their families, have put a strain on our resources and staff. As a result
We also depend on the available labor pool of semi-skilled and unskilled workers in each of the areas where we operate. In some of our communities, employers across various industries have increased their minimum wage, which has created more competition and, in some cases, higher labor costs for this sector of employees. Furthermore, we expect that state-mandated minimum wage increases in California will result in an increase in compensation costs for certain of our employees and vendors beginning in 2024.
As a result of the aforementioned challenges, as well as inflationary pressures, we have been, and we may continue to be, required to enhance wages and benefits to recruit and retain experienced employees, pay premiums above standard compensation for essential workers, or hire more expensive temporary or contract employees, which we also compete with other healthcare providers to secure. We have also made greater investments in education and training for newly licensed medical support personnel. We continue to work within our communities to increase access to healthcare programs and careers, including at our Baptist School of Health Professions in San Antonio and through our nationwide nursing extern and immersion program, which provides students with relevant hands-on training prior to graduation. Through these efforts, we have reduced onboarding and training time of some of our new nurses, and we have reduced certain of our expenses related to new-hire training.
Union Activity and Labor Relations—At December 31, 2022,2023, approximately 26%23% of the employees in our Hospital Operations segment were represented by labor unions. Less than 1%None of the total employees in both our Ambulatory Care and Conifer segmentssegment belong to a union. Unionized employees – primarily registered nurses and service, technical and maintenance workers – are located at 33 of our hospitals, the majority of which are in California, Florida and Michigan. Organizing activities by labor unions could increase our level of union representation in future periods, which could impact our labor costs.
When we are negotiating collective bargaining agreements with unions (whether such agreements are renewals or first contracts), work stoppages and strikes may be threatened or occur. Although relatively uncommon, extended strikes have had, and could in the future have, an adverse effect on our patient volumes, net operating revenues and labor costs at individual hospitals or in local markets.
Staffing Ratio Requirements—Our acute care hospitals in California are required to maintain minimum nurse‑to‑patient staffing ratios, which impacts our labor costs. Moreover, from time to time, we are required to limit admissions if we do not have the necessary number of nurses available to meet the required ratios, which has a corresponding adverse effect on our revenues.
ESG Report—Additional information regarding our approach to (1) diversity and inclusion efforts, (2) compensation, benefits, and education and development opportunities for employees, and (3) employee health and safety, among other topics, can be found in our most recent ESG Report, which is available on our website. The information found on our website, including the information in our ESG Reports, is not incorporated by reference into nor part of this or any other report or document we file with or furnish to the U.S. Securities and Exchange Commission (“SEC”).
COMPETITION
HEALTHCARE SERVICES
We believe our hospitals and outpatient facilities compete within local communities on the basis of many factors, including: quality of care; location and ease of access; the scope and breadth of services offered; reputation; and the caliber of the facilities, equipment and employees. Trends toward clinical and pricing transparency may also impact a healthcare facility’s competitive position in ways that are difficult to predict. In addition, the competitive positions of hospitals and outpatient facilities depend in large part on the number, quality, specialties, and admitting and scheduling practices of the licensed physicians who are members of the medical staffs of those facilities, as well as physicians who affiliate with and use outpatient centers as an extension of their practices. Physicians often serve on the medical staffs of more than one facility, and they are typically free to terminate their association with such facilities or admit their patients to competing facilities at any time.
Some of the hospitals that compete with our hospitals are owned by tax‑supported government agencies, and many others are owned by not‑for‑profit organizations that may have financial advantages not available to our facilities, including (1) support through endowments, charitable contributions and tax revenues, (2) access to tax‑exempt financing, and (3) exemptions from sales, property and income taxes. In addition, in certain areas where we operate, large teaching hospitals provide highly specialized facilities, equipment and services that may not be available at most of our hospitals.
The existence or absence of state laws that require findings of need for construction and expansion of healthcare facilities or services (as described in the Healthcare Regulation and Licensing – Certificate of Need Requirements subsection below) may also impact competition. In recent years, the number of freestanding specialty hospitals, surgery centers, EDs, and imaging centers and UCCs in the geographic areas in whichwhere we operate has increased significantly. Some of these facilities are
physician‑owned. Moreover, we expect to encounter additional competition from system‑affiliated hospitals and healthcare companies, as well as health insurers and private equity companies seeking to acquire providers, in certain regions in the future.
Another major factor in the competitive position of a hospital or outpatient facility is the scope of its relationships with managed care plans. Health maintenance organizations (“HMOs”), preferred provider organizations (“PPOs”), third‑party administrators, and other third‑party payers use managed care contracts to encourage patients to use certain hospitals in exchange for discounts from the hospitals’ established charges. Our ability to enter into, maintain and renew favorable contracts with HMOs, insurers offering preferred provider arrangements and other managed care plans, as well as add new facilities to our existing agreements at contracted rates, significantly affects our revenues and operating results. Generally, we compete for managed care contracts on the basis of price, market reputation, geographic location, quality and range of services, caliber of the medical staff and convenience. Other healthcare providers may affect our ability to enter into acceptable managed care contractual arrangements or negotiate commercial rate increases. For example, some of our competitors may negotiate exclusivity provisions with managed care plans or otherwise restrict the ability of managed care companies to contract with us. Vertical integration efforts involving third‑party payers and healthcare providers, among other factors, may increase competitive challenges.
Our strategies are designed to help our hospitals and outpatient facilities remain competitive, to attract and retain an appropriate number of physicians of distinction in various specialties, as well as skilled clinical personnel and other healthcare professionals, and to increase patient volumes. To that end, we have made significant investments in equipment, technology, education and operational strategies designed to improve clinical quality at all of our facilities. In addition, we continually collaborate with physicians to implement the most current evidence‑based medicine techniques to improve the way we provide care, while using labor management tools and supply‑chain initiatives to reduce variable costs. Moreover, we participate in various value‑based programs to improve quality and cost of care. We believe the use of these practices will promote the most effective and efficient utilization of resources and result in more appropriate lengths of stay, as well as reductions in readmissions for hospitalized patients. In general, we believe that quality of care improvements may have the effects of: (1) reducing costs; (2) increasing payments from Medicare and certain managed care payers for our services as governmental and private payers continue to move to pay‑for‑performance models, and the commercial market continues to move to more narrow networks and other methods designed to encourage covered individuals to use certain facilities over others; and (3) increasing physician and patient satisfaction, which may improve our volumes. It should be noted, however, that we do face competition from otherOther competing health systems that are implementingmay implement similar strategies.
In addition, we have significantly increased our focus on operating our outpatient centers with improved accessibility and more convenient service for patients, increased predictability and efficiency for physicians, and (for most services) lower costs for payers than would be incurred with a hospital visit. We believe that emphasis on higher‑demand clinical service lines (including outpatient services), focus on expanding our ambulatory care business, cultivation of our culture of service and participation in Medicare Advantage health plans that have been experiencing higher growth rates than traditional Medicare, among other strategies, will help us address competitive challenges in our markets.
We also recognize that our future success depends, in part, on our ability to maintain and renew our existing managed care contracts and enter into new managed care contracts on competitive terms. To bolster our competitive position, we have sought to include all of our hospitals and other healthcare businesses in the related geographic area or nationally when negotiating new managed care contracts, which may result in additional volumes at facilities that were not previously a part of such managed care networks. We also continue to engage in contracting strategies that create shared value with payers.
REVENUE CYCLE MANAGEMENT SOLUTIONS
Conifer faces competition from existing participants and new entrants to theThe market for our revenue cycle management business, some of which may have significantly greater capital resources than Conifer. In addition, the internal revenue cycle management staff of hospitals and other healthcare providers, who perform many of the functions addressed by our services in effect compete with us. Moreover, providers who have previously made investments in internally developed solutions may choose to continue to rely on their own resources. Weis also currently compete with several categories of external participants who offer revenue cycle services, including: software vendors and other technology‑supported revenue cycle management business process outsourcing companies; traditional consultants, either specialized healthcare consulting firms or healthcare divisions of large accounting firms; and large, non‑healthcare focused business process and information technology outsourcing firms.
We believe that competition for the revenue cycle management and other services Conifer provides is based primarily on: (1) knowledge and understanding of the complex public and private healthcare payment and reimbursement systems; (2) a track record of delivering revenue improvements and efficiency gains for hospitals and other healthcare providers; (3) the ability to deliver solutions that are fully integrated along each step of the revenue cycle; (4) cost‑effectiveness, including the breakdown between up‑front costs and pay‑for‑performance incentive compensation; (5) reliability, simplicity and flexibility of the technology platform; (6) understanding of the healthcare industry’s regulatory environment, as well as laws and regulations relating to consumer protection; and (7) financial resources to maintain current technology and other infrastructure.
competitive. To be successful, Coniferwe must respond more quickly and effectively than itsour competitors to new or changing opportunities, technologies, standards, regulations and client requirements. Existing or new competitors may introduce technologies or services that render Conifer’s technologies or services obsolete or less marketable. Even if Conifer’s technologies and services are more effective than the offerings of its competitors, current or potential clients might prefer competitive technologies or services to Conifer’s technologies and services. Furthermore, increased competition has resulted and may continue to result in pricing pressures, which could negatively impact Conifer’s margins and growth rate.
HEALTHCARE REGULATION AND LICENSING
OVERVIEW
Like others in the healthcare industry, we are subject to an extensive and complex framework of government regulation at the federal, state and local levels. These legal and regulatory standards relate to, among other topics: ownership and operation of facilities and physician practices; licensure, certification and enrollment in government programs; the necessity and adequacy of medical care; quality of medical equipment and services; relationships with and qualifications of physicians and employees; operating conduct, policies and procedures; screening, stabilization and transfer of individuals who have emergency medical conditions; rate-setting, billing and coding for services; the preparation and filing of cost reports; the handling of overpayments; contractual arrangements; relationships with referral sources and referral recipients; privacy and security; maintenance of adequate records; construction, acquisition, expansion and closure of healthcare facilities or services;
environmental protection; compliance with fire prevention and building codes; debt collection; and communications with patients and consumers. In addition, various permits are required to dispense narcotics, operate pharmacies, handle radioactive materials and operate certain equipment. Our facilities are also subject to periodic inspection by governmental and other authorities to determine their compliance with applicable regulations, as well as the standards necessary for licensing and accreditation.
We believe that our healthcare facilities hold all required governmental approvals, licenses and permits material to the operation of their business. Furthermore, we have extensive policies and procedures in place to facilitate compliance with applicable laws, rules and regulations; however, these policies and procedures cannot ensure compliance in every case. Moreover, government regulations often change, and we may have to make adjustments to our facilities, equipment, personnel and services to remain in compliance.
The potential consequences for failing to comply with applicable laws, rules and regulations include (1) required refunds of previously received government program payments, (2) the assessment of civil monetary penalties, including treble damages, (3) fines, which could be significant, (4) exclusion from participation in federal healthcare programs and (5) criminal
sanctions, including sanctions against current or former employees. Our Medicare and Medicaid payments may be suspended pending even an investigation of what the government determines to be a credible allegation of fraud. Any of the aforementioned consequences could have a material adverse effect on our business, financial condition, results of operations or cash flows.
HEALTHCARE REFORM
The Patient Protection and Affordable Care Act, as amended by the Health Care and Education Reconciliation Act of 2010 (the “Affordable Care Act”), extended health coverage to millions of uninsured legal U.S. residents through a combination of private sector health insurance reforms and public program expansion. The initial expansion of health insurance coverage under the Affordable Care Act resulted in an increase in the number of patients using our facilities with either private or public program coverage and a decrease in uninsured and charity care admissions, along with reductions in Medicare and Medicaid reimbursement to healthcare providers, including us. Of the nine states in which we operate hospitals, four have taken action in accordance with the Affordable Care Act to expand their Medicaid programs; however, over half of our licensed beds at December 31, 20222023 were located in five states, namely Alabama, Florida, South Carolina, Tennessee and Texas, that have not expanded Medicaid under the law.
There is ongoing uncertainty with respect to the ultimate net effect of the Affordable Care Act due to the potential for continued changes in the law’s implementation and how government agencies and courts interpret it. Moreover, we cannot predict what future action, if any, Congress might take to amend the Affordable Care Act. If future modifications or interpretations result in significantly fewer individuals having private or public health coverage, we likely will experience decreased patient volumes, reduced revenues and an increase in uncompensated care, which would adversely affect our results of operations and cash flows.
There is also uncertainty regarding the potential impact of otherMore recent healthcare-related reform efforts at the federal and state levels. Some reformlevels include initiatives, requirements and proposals that could have a positive effect on our business, whileas well as others that may increase our operating costs, negatively impact our case mix, adversely affect the reimbursement we receive for our services or require us to expend resources to modify certain aspects of our operations. Moreover, some current reforms could impact our competitive position, as well as our relationships with insurers and patients, including:
•the No Surprises Act, which established federal protections that became effective in 2022 against balance billing for certain out‑of‑network services, including emergency care, and which, among other things, contains resolution procedures for payment disputes between providers and insurers through an impartial arbitration system; and
•CMS’ rules relating to hospital price transparency, which require that hospitals share payer-specific negotiated prices for certain healthcare services with the goal of making it easier for consumers to shop and compare prices across hospitals and estimate the cost of care before going to the hospital.
ANTIFRAUD AND ABUSE LAWS
A number of federal statutes, and the regulations implementing them, govern our participation in the Medicare and Medicaid payment programs, including:
•the anti‑kickback and antifraud and abuse amendments codified under Section 1128B(b) of the Social Security Act (the “Anti‑kickback Statute”), which prohibit the knowing and willful remuneration of anything of value intended to induce or reward patient referrals or the generation of business involving any item or service payable by federal healthcare programs, subject to certain government-established “safe harbor” exceptions;
•the False Claims Act (“FCA”), which prohibits the submission of claims for payment to government programs that are known to be, or should be known to be, fraudulent;
•the Stark law, which generally restricts physician referrals of Medicare or Medicaid patients to entities the physician or an immediate family member has a financial relationship with, regardless of any intent to violate the law, unless one of several exceptions applies; and
•the Civil Monetary Penalties Law, which authorizes the Secretary of HHSthe U.S. Department of Health and Human Services (“HHS”) to impose civil penalties for various forms of fraud and abuse involving the Medicare and Medicaid programs.
The statesStates in which we operate have adopted laws that prohibit payments in exchange for patient referrals, similar to the federal Anti‑kickback Statute, or that otherwise prohibit fraud and abuse activities. Many states have also passed self‑referral legislation similar to the Stark law. Often these state laws are broader in scope in terms of the providers and services regulated, and certain of the laws apply regardless of the source of payment for care. These statutes typically provide for criminal and civil penalties, as well as loss of licensure.
Application to Our Operations—We regularly enter into financial arrangements with physicians and other providers in a manner we believe complies with the Anti‑kickback Statute, the Stark law, and other applicable antifraud and abuse laws. At December 31, 2022,2023, the majority of the surgical hospitals and ASCs in our Ambulatory Care segment were owned by joint ventures with physicians and/or health systems. In addition, we have contracts with physicians and non‑physician referral sources providing for a variety of financial arrangements, including employment agreements, leases and professional service contracts, such as medical director agreements. We also provide financial incentives to recruit physicians to relocate to communities served by our hospitals, including income and collection guarantees and reimbursement of relocation costs.
As described below, the primary focus of our quality, compliance and ethics program is compliance with the requirements of Medicare, Medicaid and other federally funded healthcare programs. However, if our arrangements are found to fail to comply with applicable antifraud and abuse laws, our operations could be adversely affected. In addition, any determination by a federal or state agency or court that USPIwe or one of itsour subsidiaries has violated any of these laws could give certain of our joint venture partners or business process solutions clients a right to terminate their relationships with us; and any similar determination with respect to Conifer could give Conifer’s clients the right to terminate their services agreements with us. Moreover, any violations by and resulting penalties or exclusions imposed upon USPI’s joint venture partners or Conifer’s clients could adversely affect their financial condition and, in turn, have a material adverse effect on our business and results of operations.
Government Enforcement Efforts and Qui Tam Lawsuits—The healthcare industry is subject to heightened and coordinated civil and criminal enforcement efforts from both federal and state government agencies. The U.S. Office of Inspector General, which is an independent and objective oversight unit of HHS, conducts audits, evaluations and investigations relating to HHS programs and operations and, when appropriate, imposes civil monetary penalties, assessments and administrative sanctions.
Healthcare providers are also subject to qui tam or “whistleblower” lawsuits under the FCA, which allows private individuals to bring actions on behalf of the government, alleging that a hospital or healthcare provider has defrauded a government program, such as Medicare or Medicaid. If the government intervenes in the action and prevails, the defendant may be required to pay three times the damages sustained by the government, plus mandatory civil penalties for each false claim submitted to the government. As part of the resolution of a qui tam case, the qui tam plaintiff may share in a portion of any settlement or judgment. If the government does not intervene in the action, the qui tam plaintiff may continue to pursue the action independently. Qui tam actions can also be filed under certain state false claims laws if the fraud involves Medicaid funds or funding from state and local agencies.
We have paid significant amounts to resolve government investigations and qui tam matters brought against us in the past, and we are unable to predict the impact of any future actions on our business, financial condition, results of operations or cash flows.
HEALTH INSURANCE PORTABILITY AND ACCOUNTABILITY ACT
The Health Insurance Portability and Accountability Act of 1996 (“HIPAA”) requires administrative, physical and technical safeguards to protect the confidentiality, integrity and availability of protected health information (“PHI”) and sets forth the rights of patients to understand and control how their information is used and disclosed. We have developed a comprehensivean expansive set of policies and procedures in our efforts to comply with HIPAA, and similar state privacy laws, under the guidance of our ethics and compliance department. Our compliance officers and information security officers are responsible for implementing and monitoring enterprise‑wide compliance with our HIPAA privacy and security policies and procedures. We have also created an internal web‑based HIPAA training program, which is mandatory for all employees.
Under HIPAA, we are required to report breaches of unsecured PHI to affected individuals without unreasonable delay, but not longer than 60 days following discovery of the breach. We are also required to notify HHS and, in certain situations involving large breaches, the media. All non-permitted uses or disclosures of unsecured PHI are presumed to be breaches unless it can be established that there is a low probability the information has been compromised. Various state laws
and regulations may also require us to notify the applicable state agency and affected individuals in the event of a data breach involving individuallypersonally identifiable information.information (“PII”).
Violations of the HIPAA privacy and security regulations may result in criminal penalties and in substantial civil penalties per violation. In addition to enforcement by HHS, state attorneys general are authorized to bring civil actions seeking either injunction or damages in response to violations of HIPAA privacy and security regulations that threaten the privacy of state residents. HHS may resolve HIPAA violations through informal means, such as allowing a company to implement a corrective action plan, but HHS has the discretion to move directly to impose monetary penalties and is required to impose penalties for violations resulting from willful neglect. We are also subject to any federal or state privacy-related laws that are
more restrictive than the privacy regulations issued under HIPAA. These laws vary and could impose additional penalties and subject us to additional privacy and security restrictions. In addition, various states have enacted, and other states are considering, new laws and regulations concerning the privacy and security of consumer and other personal information. To the extent we are subject to such requirements, these laws and regulations often have far-reaching effects, are subject to amendments, changing requirements and updates to regulators’ enforcement priorities, may require us to modify our data processing practices and policies, may require us to incur substantial costs and expenses to comply, and may subject our business to a risk of increased potential liability. These laws and regulations often provide for civil penalties for violations, as well as a private right of action for data breaches, which may increase the likelihood or impact of data breach litigation.
UTILIZATION REVIEW COMPLIANCE AND HOSPITAL GOVERNANCE
The Social Security Act and Medicare regulations generally require that services that may be paid for under the Medicare program or state healthcare programs are (1) provided economically and only when, and to the extent, they are medically reasonable and necessary, (2) of a quality that meets professionally recognized standards of healthcare, and (3) supported by appropriate evidence of medical necessity and quality. The Quality Improvement Organization program established under the Social Security Act seeks: to improve the effectiveness, efficiency, economy and quality of services delivered to Medicare beneficiaries; to preserve the Medicare Trust Fund by ensuring that Medicare pays only for services that are reasonable and necessary and that are provided in the most appropriate setting; and to protect Medicare beneficiaries by expeditiously addressing complaints, violations under the Emergency Medical Treatment and Active Labor Act, and other quality‑related issues.
There has been increased scrutiny from outside auditors, government enforcement agencies and others, as well as an increased risk of government investigations and qui tam lawsuits, related to hospitals’ Medicare observation rates and inpatient admission decisions. The term “Medicare observation rate” is defined as total unique observation claims divided by the sum of total unique observation claims and total inpatient short‑stay acute care hospital claims. A low rate may raise suspicions that a hospital is inappropriately admitting patients that could be cared for in an observation setting. In addition, CMS has established a concept referred to as the “two‑midnight rule” to guide practitioners admitting patients and contractors on when it is appropriate to admit individuals as hospital inpatients. Under the two‑midnight rule, a Medicare patient should generally be admitted on an inpatient basis only when there is a reasonable expectation that the patient’s care will cross two midnights; if not, the patient generally should be treated as an outpatient, unless an exception applies.
Medical and surgical services and practices are extensively supervised by committees of staff physicians at each of our healthcare facilities, are overseen by each facility’s local governing board, the members of which primarily are community members and physicians, and are reviewed by our clinical quality personnel. The local governing board also helps maintain standards for quality care, develop short‑term and long‑range plans, and establish, review and enforce practices and procedures, as well as approves the credentials, disciplining and, if necessary, the termination of privileges of medical staff members.
CERTIFICATE OF NEED REQUIREMENTS
Some states require state approval for construction, acquisition and closure of healthcare facilities, including findings of need for additional or expanded healthcare facilities or services. Certificates or determinations of need, which are issued by governmental agencies with jurisdiction over healthcare facilities, are at times required for capital expenditures exceeding a prescribed amount, changes in bed capacity or services, and certain other matters. Our subsidiaries operate acute care hospitals in five states that require a form of state approval under certificate of need programs applicable to those hospitals. Approximately 34% of our licensed hospital beds are located in these states (namely, Alabama, Massachusetts, Michigan, South Carolina and Tennessee). The certificate of need programs in most of these states, along with several others, also apply to ASCs.
Failure to obtain necessary state approval can result in the inability to expand facilities, add services, acquire a facility or change ownership. Further, violation of such laws may result in the imposition of civil sanctions or the revocation of a facility’s license. We are unable to predict whether we will be required or able to obtain any additional certificates of need in any jurisdiction where they are required, or if any jurisdiction will eliminate or alter its certificate of need requirements in a manner that will increase competition and, thereby, affect our competitive position. In those states that do not have certificate of need requirements or that do not require review of healthcare capital expenditure amounts below a relatively high threshold, competition in the form of new services, facilities and capital spending ismay be more prevalent.
ENVIRONMENTAL MATTERS
Our healthcare operations are subject to a number of federal, state and local environmental laws, rules and regulations that govern, among other things, our disposal of solid waste, as well as our use, storage, transportation and disposal of hazardous and toxic materials (including radiological materials). Our operations also generate medical waste that must be
discarded in compliance with statutes and regulations that vary from state to state. In addition, our operating expenses could be adversely affected if legal and regulatory developments related to climate change or other initiatives result in increased energy or other costs. WeMoreover, we could also be affected by climate change and other environmental issues to the extent such issues adversely affect the general economy or result in severe weather affecting the communities in which our facilities are located.
At this time, based on current climate conditions and our assessment of existing and pending environmental rules and regulations, as well as treaties and international accords relating to climate change, we do not believe that the costs of complying with environmental laws, including regulations relating to climate change issues, will have a material adverse effect on our future capital expenditures, results of operations or cash flows. There were no material capital expenditures for environmental matters in the year ended December 31, 2022.2023.
Additional information regarding our approach to environmental matters can be found in our most recent ESG Report, which is available on our website. The information found on our website, including the information in our ESG Reports, is not incorporated by reference into nor part of this or any other report or document we file with or furnish to the SEC.
ANTITRUST LAWS
The federal government and most states have enacted antitrust laws that prohibit specific types of anti‑competitive conduct, including price fixing, wage fixing, anticompetitive hiring practices, restrictive covenants, concerted refusals to deal, price discrimination and tying arrangements, as well as monopolization and acquisitions of competitors that have, or may have, a substantial adverse effect on competition. Violations of federal or state antitrust laws can result in various sanctions, including criminal and civil penalties.
Antitrust enforcement in the healthcare industry is a priority of the U.S. Federal Trade Commission (“FTC”). and analogous state regulatory agencies. In recent years, the FTC has filed multiple administrative complaints and public comments challenging hospital transactions in several states. The FTC has focused its enforcement efforts on preventing hospital mergers that may, in the government’s view, leave insufficient local options for patient services, which could result in increased costs to consumers. In December 2023, John Muir announced it no longer intended to pursue its proposed acquisition of our 51% ownership interest in San Ramon Regional Medical Center and certain related operations after the FTC took action to challenge the transaction. In addition to hospital merger enforcement, the FTC has given increased attention to the effect of combinations involving other healthcare providers, including physician practices, as well as to the use of restrictive covenants that limit the ability of employees and others to engage in certain competitive activities. The FTC has also entered into numerous consent decrees in the past several years settling allegations of price‑fixing among providers. Moreover, a number of states have recently enacted antitrust laws requiring state agency notification and review of proposed healthcare industry transactions that are below federal reporting thresholds. The potential impact and future enforcement of these recently enacted laws remain uncertain.
LAWS AND REGULATIONS AFFECTING CONIFER’S OPERATIONSREVENUE CYCLE MANAGEMENT SERVICES
Conifer is subject to civil and criminal statutes and regulations governing consumer finance, medical billing, coding, collections and other operations. In connection with these laws and regulations, Conifer has been and expects tomay continue to be party to various lawsuits, claims, and federal and state regulatory investigations from time to time. Some of these actions may involve large demands, as well as substantial defense costs. We cannot predict the outcome of current or future legal actions against Conifer or the effect that judgments, penalties or settlements in such matters may have on Conifer.
BILLING AND COLLECTION ACTIVITIEShave.
The federal Fair Debt Collection Practices Act (“FDCPA”) regulates persons who regularly collect or attempt to collect, directly or indirectly, consumer debts owed or asserted to be owed to another person. Certain of the accounts receivable handled by Conifer’s third‑party debt collection vendors are subject to the FDCPA, which establishes specific guidelines and procedures that debt collectors must follow in communicating with consumer debtors, including the time, place and manner of such communications. Conifer auditsWe audit and monitors itsmonitor our vendors for compliance, but there can be no assurance that such audits and monitoring will detect all instances of potential non‑compliance.
Many states also regulate the billing and collection practices of creditors who collect their own debt, as well as the companies a creditor engages to bill and collect from consumers on the creditor’s behalf. These state regulations may be more stringent than the FDCPA. In addition, state regulations may be specific to medical billing and collections or the same or similar to state regulations applicable to third‑party collectors. Certain of the accounts receivable Conifer or its billing, servicing and collections subsidiary, PSS Patient Solution Services, LLC, manages for its clients are subject to these state regulations.
Conifer is also subject to both federal and state regulatory agencies who have the authority to investigate consumer complaints relating to unfair, deceptive and abusive acts and practices, as well as a variety of consumer protection laws,
including but not limited to the Telephone Consumer Protection Act and itsall applicable state equivalent.equivalents. These agencies may initiate enforcement actions, including actions to seek restitution and monetary penalties from, or to require changes in business practices of, regulated entities. In addition, affected consumers may bring suits, including class action suits, to seek monetary remedies (including statutory damages) for violations of the federal and state provisions discussed above.
LAWS AND REGULATIONS AFFECTING OUR GBC
Our operations at our GBC in the Philippines are subject to certain U.S. healthcare industry-specific requirements, as well as U.S. and foreign laws applicable to businesses generally, including anti-corruption laws. One such law, the Foreign Corrupt Practices Act (“FCPA”), regulates U.S. companies in their dealings with foreign officials, prohibiting bribes and similar practices, and requires that they maintain records that fairly and accurately reflect transactions and appropriate internal accounting controls. FCPA enforcement actions continue to be a high priority for the SEC and the U.S. Department of Justice. Our failure to comply with the FCPA could result in the imposition of fines and other civil and criminal penalties, which could be significant.
COMPLIANCE AND ETHICS
General—Our ethics and compliance department maintains our values‑based ethics and compliance program, which is designed to: (1) help staff in our corporate USPI and ConiferUSPI offices, hospitals, outpatient centers and physician practices meet or exceed applicable standards established by federal and state statutes and regulations, as well as industry practice; (2) monitor and raise awareness of ethical issues among employees and others, and stress the importance of understanding and complying with our Code of Conduct; and (3) provide a channel for employees to make confidential ethics and compliance‑related reports anonymously if they choose. The ethics and compliance department operates independently – it has its own operating budget; it has the authority to hire outside counsel, access any company document and interview any of our personnel; and our chief compliance officer reports directly to our chief executive officer, as well as to the quality, compliance and ethics committee of our board of directors.
Program Charter—Our Quality, Compliance and Ethics Program Charter is the governing document for our ethics and compliance program. Our adherence to the charter is intended to:
•support and maintain our present and future responsibilities with regard to participation in federal healthcare programs; and
•further our goals of operating an organization that (1) fosters and maintains the highest ethical standards among all employees, officers and directors, physicians practicing at our facilities, and contractors that furnish healthcare items or services, (2) values compliance with all state and federal statutes and regulations as a foundation of its corporate philosophy, and (3) aligns its behaviors and decisions with Tenet’s core values.
The primary focus of our quality, compliance and ethics program is compliance with the requirements of Medicare, Medicaid and other federally funded healthcare programs. Pursuant to the terms of the charter, our ethics and compliance department is responsible for, among other things, the following activities: (1) assessing, critiquing, and (as appropriate) drafting and distributing company policies and procedures; (2) developing, providing, and tracking ethics and compliance training and other training programs, including job‑specific training to those who work in clinical quality, coding, billing, cost reporting and referral source arrangements, in collaboration with the respective department responsible for oversight of each of these areas; (3) creating and disseminating our Code of Conduct and obtaining certifications of adherence to the Code of Conduct as a condition of employment; (4) maintaining and promoting our Ethics Action Line, a 24‑hour, toll‑free hotline that allows for confidential reporting of issues on an anonymous basis and emphasizes our no‑retaliation policy; and (5) responding to and resolving all compliance‑related issues that arise from the Ethics Action Line and compliance reports received from facilities and compliance officers (utilizing any compliance reporting software that we may employ for this purpose) or any other source that results in a report to the ethics and compliance department.
Code of Conduct—All of our employees and officers, including our chief executive officer, chief financial officer and principal accounting officer, are required to abide by our Code of Conduct to advance our mission that our business be conducted in a legal and ethical manner. The members of our board of directors and all of our contractors having functional roles similar to our employees are also required to abide by our Code of Conduct. The standards therein reflect our basic values and form the foundation of a comprehensive process that includes compliance with all corporate policies, procedures and practices. Our Code of Conduct covers such areas as quality patient care, compliance with all applicable statutes and regulations, appropriate use of our assets, protection of patient information and avoidance of conflicts of interest.
As part of the program, we provide compliance training at least annually to every employee and officer, as well as our board of directors and certain physicians and contractors. All such persons are required to report incidents that they believe in
good faith may be in violation of the Code of Conduct or our policies, and all are encouraged to contact our Ethics Action Line when they have questions about the standardsany aspect of our Code of Conduct or any ethics concerns. All reports to the Ethics Action Line are kept confidential to the extent allowed by law, and any individual who makes a report has the option to remain anonymous. Incidents of alleged financial improprieties reported to the Ethics Action Line or the ethics and compliance department are communicated to the audit committee of our board of directors. Reported cases that involve a possible violation of the law or regulatory policies and
procedures are referred to the ethics and compliance department for investigation, although certain matters may be referred out to the law or human resources department. Retaliation against anyone in connection with reporting ethical concerns is considered a serious violation of our Code of Conduct, and, if it occurs, it will result in discipline, up to and including termination of employment.
Availability of Documents—The full text of our Quality, Compliance and Ethics Program Charter, our Code of Conduct, and a number of our ethics and compliance policies and procedures are published on our website, at www.tenethealth.com, under the “Our Commitment Toto Compliance” caption in the “About Us”“About” section. Amendments to the Code of Conduct and any grant of a waiver from a provision of the Code of Conduct requiring disclosure under applicable SEC rules will be disclosed at the same location as the Code of Conduct on our website.
INSURANCE
The healthcare industry has seen significant increases in the cost of professional and general liability insurance due to increased claims and lawsuits in the ordinary course of business. We maintain captive insurance companies to self‑insure for the majority of our professional and general liability claims, and we purchase insurance from third parties to cover catastrophic claims. Commercial insurance we purchase is subject to per‑claim and policy period aggregate limits. If the policy period aggregate limit of any of these policies is exhausted, in whole or in part, it could deplete or reduce the limits available to pay other material claims applicable to that policy period. Any losses not covered by or in excess of the amounts maintained under our professional and general liability insurance policies will be funded from our working capital or other sources of liquidity.
In addition to the reserves recorded by our captive insurance subsidiaries, we maintain reserves, including reserves for incurred but not reported claims, for our self‑insured professional liability retentions and claims in excess of the policies’ aggregate limits, based on modeled estimates of losses and related expenses. Also, we provide standby letters of credit to certainsome of our insurers, which can be drawn upon under certain circumstances, to collateralize the deductible and self‑insured retentions under a select number of our professional and general liability insurance programs.
We also purchase property, cyber-liability and other insurance coverage from third parties. Our commercial insurance does not cover all claims against us and may not offset the financial impact of a material loss event. Moreover, commercial insurance may not continue to be available at a reasonable cost for us to maintain at adequate levels. The rise in the number and severity of hurricanes, wildfires, tornadoes and other weather events, whether or not precipitated by climate change, has created increased risk that is expected to lead to a rise in insurance premiums and reductions in coverage for property owners in the future. In addition, the risk of ransomware attacks, breaches or other disruptions to information technology systems is elevated in the current environment, which has caused an increase in cyber premiums and lower coverage limits. In April 2022, we experienced a cybersecurity incident that temporarily disrupted a subset of our acute care hospital operations and involved the exfiltration of certain confidential company and patient information (the “Cybersecurity Incident”).information. We estimate that the Cybersecurity Incident had an adverse pre-tax impact of approximately $100 million during the year ended December 31, 2022. This estimate includes theincurred significant costs to remediate the issues, sustained lost revenues from the associated business interruption and incurred other related expenses. Weexpenses, and we have filed a claim withinthat may exhaust our policy limits. For further information regarding our insurance coverage, see Note 16 to our Consolidated Financial Statements.
COMPANY INFORMATION
We file annual, quarterly and current reports, proxy statements and other documents with the SEC under the Securities Exchange Act of 1934, as amended (the “Exchange Act”). Our reports, proxy statements and other documents filed electronically with the SEC are available at the website maintained by the SEC at www.sec.gov.
Our website, www.tenethealth.com, also offers, free of charge, access to our annual, quarterly and current reports (and amendments to such reports), and other filings made with, or furnished to, the SEC as soon as reasonably practicable after such documents are submitted to the SEC. The information found on our website is not incorporated by reference into nor part of this or any other report or document we file with or furnish to the SEC.
FORWARD-LOOKING STATEMENTS
This report includes “forward‑looking statements” within the meaning of Section 27A of the Securities Act of 1933 and Section 21E of the Exchange Act, each as amended. All statements, other than statements of historical or present facts, that
address activities, events, outcomes, business strategies and other matters that we plan, expect, intend, assume, believe, budget, predict, forecast, project, target, estimate or anticipate (and other similar expressions) will, should or may occur in the future are forward‑looking statements, including (but not limited to) disclosuredisclosures regarding (1) the impact of the COVID‑19 pandemic, (2) our future earnings, financial position, and operational and strategic initiatives, and (3)(2) developments in the healthcare
industry.economic and public health conditions on our business. Forward‑looking statements represent management’s expectations, based on currently available information, as to the outcome and timing of future events, but, by their nature, address matters that are indeterminate. They involve known and unknown risks, uncertainties and other factors, many of which we are unable to predict or control, that may cause our actual results, performance or achievements to be materially different from those expressed or implied by forward‑looking statements. Such factors include, but are not limited to, the following:
•The public health and economic impacts of the COVID‑19 pandemic on our future operations, financial condition and liquidity, particularly if the U.S. economy remains volatile for a significant period of time;
•Our ability to enter into or renew managed care provider arrangements on acceptable terms; changes in service mix, revenue mix and surgical volumes, including potential declines in the population covered under managed care agreements; and the impact of the industry trends toward value‑based purchasing and alternative payment models;
•The effectsimpacts on our business of healthcare reform efforts, includingfrom the enactment of, or changes in, statutes and regulations affecting the healthcare industry generally; and regulatory developments, including reductions to Medicare and Medicaid payment rates or changes in reimbursement practices or to Medicaid supplemental payment programs;
•Our success in recruiting and retaining physicians, nurses and other healthcare professionals as affected by the COVID‑19 pandemic, competition and other factors;professionals;
•The effect of competition generally, and clinical and price transparency regulations, on our business;
•The timing, outcome and impact of: government investigations and litigation; changes in federal tax laws, regulations and policies; and future tax audits, disputes and litigation associated with our tax positions;
•The future course and impact of COVID-19, or the potential emergence and effects of a future pandemic, epidemic or outbreak of an infectious disease, on our operations, financial condition and liquidity;
•Security threats, catastrophic events and other disruptions that affect our information technology and related systems;information systems and confidential business data;
•Our ability to achieve operating and financial targets, attain expected levels of patient volumes, and identify and execute on measures designed to save or control costs or streamline operations;
•Operational and other risks associated with acquisitions, divestitures and joint venture arrangements, including the integration of newly acquired businesses;businesses and the risk that transactions may not receive necessary government clearances;
•The impact of our significant indebtedness; the availability and terms of capital to refinance existing debt, fund our operations and expand our business; and our ability to comply with our debt covenants and, over time, reduce leverage;
•The effect that general adverse economic conditions (including inflation),inflation, consumer behavior and other economic factors have on our volumes and our ability to collect outstanding receivables on a timely basis, among other things; and increases in the amount of uninsured accounts, as well as deductibles, co‑insurance amounts and co‑pays for insured accounts; and
•Other factors and risks referenced in this report and our other public filings.
When considering forward‑looking statements, you should keep in mind the risk factors and other cautionary statements in this report. Should one or more of the risks and uncertainties described in this report occur, or should underlying assumptions prove incorrect, our actual results and plans could differ materially from those expressed in any forward‑looking statement. We specifically disclaim any obligation to update any information contained in a forward‑looking statement or any forward‑looking statement in its entirety, except as required by law.
All forward‑looking statements attributable to us are expressly qualified in their entirety by this cautionary information.
ITEM 1A. RISK FACTORS
Our business is subject to a number of risks and uncertainties, many of which are beyond our control, that may cause our actual operating results or financial performance to be materially different from our expectations and make an investment in our securities risky. If one or more of the events discussed in this report were to occur, actual outcomes could differ materially from those expressed in or implied by any forward‑looking statements we make in this report or our other filings with the SEC, and our business, financial condition, results of operations or liquidity could be materially adversely affected; furthermore, the
trading price of our common stock could decline and our shareholders could lose all or part of their investment. Additional risks and uncertainties not presently known, or currently deemed immaterial, may also constrain our business and operations.
Risks Related to Our Overall Operations
The COVID-19 pandemic continues to adversely impact our operations; we cannot predict whether or how any future laws and regulations related to or in response to the pandemic will affect us; and the lingering economic effects of the pandemic could harm our liquidity.
In 2022, the public health and economic effects of the COVID‑19 pandemic continued to adversely impact our operations, as well as our patients, communities and employees, to varying degrees. New variants of the virus caused additional outbreaks in 2022, and there continues to be a lack of clarity about the nature and degree of the health effects of COVID‑19 over time. Known and unknown risks and uncertainties caused by the pandemic, including those described below, have had, and are continuing to have, a material impact on our business, financial condition, results of operations and cash flows; such risks and uncertainties may heighten other risks to our business as described herein.
Surges of COVID‑19 at various points throughout 2022 caused periodic spikes in COVID admissions at our hospitals and resulted in increased case cancellations in our Ambulatory Care segment. We have incurred and continue to incur additional costs to protect the health and well‑being of patients and staff. In addition, the demand for care of COVID‑19 patients in some of our hospitals put a strain on our resources and personnel. We have been required, and we may in the future be required, to temporarily reduce overall operating capacity or suspend certain services at individual facilities due to staffing constraints and other COVID‑19-related factors.
As further described below, the pandemic also exacerbated previously existing workforce shortages – and, thereby, competition for qualified candidates – as more employees chose to retire early, leave the workforce or take travel assignments. Over the past several years, we have had to rely on higher‑cost temporary and contract labor, which we compete with other healthcare providers to secure, and pay premiums above standard compensation for essential workers.
Moreover, throughout the pandemic, we have experienced significant price increases in medical supplies, particularly for personal protective equipment, and we have encountered supply-chain disruptions, including shortages and delays. In addition, our Ambulatory Care segment has been impacted by shipment delays in construction materials and capital equipment with respect to its de novo facility development efforts, which are a key part of our portfolio expansion strategy. COVID‑19 surges and outbreaks of new variants could further impact the cost of medical supplies, and supply shortages and delays may impact our ability to see, admit and treat patients.
As described in detail in MD&A, the various federal legislative actions provided relief measures intended to mitigate some of the adverse financial impacts of the COVID‑19 pandemic on the healthcare industry. We are unable to predict whether future changes, if any, to these relief measures will negatively affect our business, financial condition, results of operations or cash flows. Furthermore, some of the measures allowing for flexibility in delivery of care and financial support for healthcare providers are available only for the duration of the public health emergency as declared by the Secretary of HHS, which is now scheduled to expire on May 11, 2023. The federal government and state and local governments may consider additional stimulus and relief efforts, but we are unable to predict whether any such measures will be enacted. There can also be no assurance that we will be eligible or apply for, or receive or benefit from, additional COVID‑19‑related stimulus assistance in the future, nor can there be any assurance as to the amount and type of assistance we may receive or seek or whether we will be able to comply with the applicable terms and conditions to retain such assistance. To the extent we do receive amounts or benefits under future relief measures related to or in response to the COVID‑19 pandemic, we cannot predict how such assistance will affect our operations or whether it will offset the negative impacts on our operations arising from the pandemic.
Broad economic factors resulting from the pandemic, including higher inflation, increased unemployment rates in certain areas where we operate and reduced consumer spending, have impacted, and are continuing to impact, our service mix, revenue mix and patient volumes. Business closings and layoffs in the areas we operate may lead to increases in the uninsured and underinsured populations and adversely affect demand for our services, as well as the ability of patients to pay for services. Any increase in the amount of or deterioration in the collectability of patient accounts receivable could adversely affect our cash flows and results of operations. If general economic conditions deteriorate or remain uncertain for an extended period of time, our liquidity and ability to repay our outstanding debt may be impacted, and there can be no assurance that we will be able to raise additional funds on terms acceptable to us, if at all.
In general, the extent of the impact of the COVID‑19 pandemic on our future operational and financial performance is currently uncertain and will depend on many factors outside of our control, including, among others: the duration, severity and trajectory of the pandemic, including the possible spread of potentially more contagious and/or virulent forms of the virus; future economic conditions, as well as the impact of government actions and administrative regulations on the hospital industry and broader economy, including through existing and any future stimulus efforts; the development, availability and widespread use of effective medical treatments and vaccines; the imposition of public safety measures; the volume of canceled or rescheduled procedures at our facilities; and the volume of COVID‑19 patients across our care network. Moreover, we cannot predict when or if our hospital volumes and case mix will return to pre-pandemic levels, particularly given that millions of Americans could lose Medicaid coverage once states restart their eligibility determinations on April 1, 2023.
If we are unable to enter into, maintain and renew managed care contractual arrangements on competitive terms, if we experience material reductions in the contracted rates we receive from managed care payers or if we have difficulty collecting from managed care payers, our results of operations could be adversely affected.
Our ability to enter into, maintain and renew favorable contracts with HMOs, insurers offering preferred provider arrangements and other managed care plans, as well as add new facilities to our existing agreements at contracted rates, significantly affects our revenues and operating results. For the year ended December 31, 2022,2023, approximately 70%, or $9.730$10.248 billion, of our net patient service revenues for the hospitals and related outpatient facilities in our Hospital Operations segment was attributable to managed care payers, including Medicare and Medicaid managed care programs. Moreover, in 2022,2023, our commercial managed care net inpatient revenue per admission from the hospitals in our Hospital Operations segment was approximately 81%86% higher than our aggregate yield on a per‑admission basis from government payers, including managed Medicare and Medicaid insurance plans.managed care programs.
The ongoing trend toward consolidation among non‑government payers tends to increase their bargaining power over contract terms. Generally, we compete for these contracts on the basis of price, market reputation, geographic location, quality and range of services, caliber of the medical staff and convenience. Our contracts with managed care payers require us to comply with a number of terms related to the provision of and billing for services. If we are unable to negotiate increased reimbursement rates, maintain existing rates or other favorable contract terms, effectively respond to managed care payer cost controls and reimbursement policies, or comply with the terms of our contracts, the payments we receive for our services may be reduced. Also, we are increasingly experiencing payment denials from managed care payers, both prospectively and retroactively.
We currently have thousands of managed care contracts with various HMOs and PPOs; however, our top 10 managed care payers generated 62%65% of our managed care net patient service revenues for the year ended December 31, 2022.2023. Because of this concentration, we may experience a shortshort‑ or long‑term adverse effect on our net operating revenues if we cannot renew, replace or otherwise mitigate the impact of expired contracts with significant payers. Furthermore, material payment delays and disputes between us and significant managed care payers could have a material adverse effect on our financial condition, results of operations or cash flows. At December 31, 2022, 66%2023, 68% of our net accounts receivable for our Hospital Operations segmentsegment’s net accounts receivable was due from managed care payers.
Private payers are increasingly attempting to control healthcare costs through direct contracting with hospitals to provide services on a discounted basis, increased utilization reviews and greater enrollment in managed care programs, such as HMOs and PPOs. Any negotiated discount programs we agree to generally limit our ability to increase reimbursement rates to offset increasing costs. Furthermore,In addition, enrollment of individuals in high-deductible health plans has increased over the ongoing trend toward consolidation among non‑government payers tendslast decade. In comparison to increase their bargaining power over contract terms. Generally, we compete fortraditional health plans, these contracts on the basis of price, market reputation, geographic location, qualityplans have higher co-pays and range of services, caliber of the medical staffdeductibles due from patients, which subjects us to increased collection risk. Moreover, high-deductible health plans may exclude our hospitals and convenience. employed physicians from coverage.
Our relationships with payers, and reimbursement for the care we provide, may be further impacted by clinical and price transparency initiatives and out‑of‑network billing restrictions, including those in the No Surprises Act, which took effect January 1, 2022. In general, any material reductions in the contracted or out-of-network rates we receive for our services or any significant difficulties in collecting receivables from managed care payers could have a material adverse effect on our financial condition, results of operations or cash flows.
Future changes in healthcare laws generally, and the Medicare and Medicaid programs or other government healthcare programs specifically, including reductions in scale and scope, could have an adverse effect on our business.
We cannot predict whether or how the Affordable Care Act may be modified, amended or implemented in the future, and we are also unable to predict the impacts on our business from the enactment of, or changes in, other statutes and regulations affecting the healthcare industry generally. Some initiatives, requirements and proposals could increase our operating costs, negatively impact our patient volumes, case mix and revenue mix, adversely affect the reimbursement we receive for our services or require us to expend resources to modify certain aspects of our operations. Moreover, some current reforms could impact our competitive position, as well as our relationships with insurers and patients, including the No Surprises Act and CMS’ rules relating to hospital price transparency.
We are also unable to predict the effect of future government healthcare funding policy changes on our operations. If the rates paid by governmental payers are reduced, if the scope of services covered by governmental payers is limited, or if we or one or more of our hospitals are excluded from participation in the Medicare or Medicaid program or any other government healthcare program, there could be a material adverse effect on our business, financial condition, results of operations or cash flows.
For the year ended December 31, 2022,2023, approximately 17%16% and 7%8% of our net patient service revenues for the hospitals and related outpatient facilities in our Hospital Operations segment were from the Medicare program and various state Medicaid programs, respectively, in each case excluding Medicare and Medicaid managed care programs. The Medicare and Medicaid programs are subject to:
•statutory and regulatory changes, administrative and judicial rulings, interpretations and determinations concerning patient eligibility requirements, funding levels and the method of calculating reimbursements, among other things;
•requirements for utilization review; and
•federal and state funding restrictions.
Any of these factors could materially increase or decrease payments from these government programs in the future, as well as affect the cost of providing services to our patients and the timing of payments to our facilities, which could in turn adversely affect our overall business, financial condition, results of operations or cash flows.
Even prior to the COVID‑19 pandemic, severalSeveral states in which we operate facedcontinue to face budgetary challenges that have resulted in reduced Medicaid funding levels to hospitals and other providers. Because most states must operate with balanced budgets, and the Medicaid program is generally a significant portion of a state’s budget, states can be expected to adopt or consider adopting future legislation designed to reduce or not increase their Medicaid expenditures. In addition, some states delay issuing Medicaid payments to providers to manage state expenditures. As an alternative means of funding provider payments, many of the states in whichwhere we operate have adopted supplemental payment programs or have received federal government waivers allowing them to test new approaches and demonstration projects to improve care. Federal government denials or delayed approvals of waiver applications or extension requests byunder the states in which we operate could materially impact our Medicaid funding levels.Social Security Act. Continuing pressure on state budgets and other factors, including legislative and regulatory changes, could result in future reductions to Medicaid payments, payment delays or changes to Medicaid supplemental payment programs that could negatively impact our financial condition, results of operations or cash flows. Federal government denials or delayed approvals of waiver applications or extension requests by the states where we operate could also materially impact our Medicaid funding levels.
Because we cannot predict what actions the federal government or the states may take under existing or future legislation and/or regulatory changes to address budget gaps, deficits, Medicaid expansion, Medicaid eligibility redeterminations, provider fee programs, state‑directed payment programs or Medicaid Section 1115 waivers, we are unable to assess the effect that any such legislation or regulatory action might have on our business; however, the overall impact on our future financial position, results of operations or cash flows could be material.
It is essential to our ongoing business that we attract an appropriate number of quality physicians in the specialties required to support our services and that we maintain good relations with those physicians.
The success of our business and clinical program development depends in large part on the number, quality, specialties, and admitting and scheduling practices of the licensed physicians who are members of the medical staffs of our hospitals and other facilities, as well as physicians who affiliate with us and use our facilities as an extension of their practices. Physicians are often not employees of the hospitals or surgery centers at which they practice. Members of the medical staffs of our facilities also often serve on the medical staffs of facilities we do not operate, and they are free to terminate their association with our facilities or admit their patients to competing facilities at any time. In addition, although physicians who own interests in our facilities are generally subject to agreements restricting them from owning an interest in competitive facilities, we may not learn of, or may be unsuccessful in preventing, our physician partners from acquiring interests in competitive facilities.
We compete with system‑affiliated hospitals and healthcare companies, as well as health insurers and private equity companies, in recruiting physicians, acquiring physician practices and, where permitted by law, employing physicians. In 2022,2023, we continued to experience challenges in recruiting and retaining physicians. In some of the regions in whichwhere we operate, physician recruitment and retention are affected by a shortage of qualified physicians in certain higher-demand clinical service lines and specialties. Furthermore, our ability to recruit and employ physicians is closely regulated. For example, the types, amount and duration of compensation and assistance we can provide to recruited physicians are limited by the federal Anti‑kickback Statute and Stark law, as well as other applicable antifraud and abuse laws and regulations. All arrangements with physicians must also be fair market value and commercially reasonable. If we are unable to attract and retain sufficient numbers of quality physicians by providing adequate support personnel, technologically advanced equipment, and facilities that
meet the needs of those physicians and their patients, physicians may choose not to refer patients to our facilities, admissions and outpatient visits may decrease, and our operating performance may decline.
Our labor costs have been, and we expect will continue to be, adversely affected by competition for staffing, the shortage of experienced nurses and other healthcare professionals, and labor union activity.
Our operations are dependent on the availability, efforts, abilities and experience of management and medical support personnel, including nurses, therapists, pharmacists and lab technicians, among others. We have always competed with other healthcare providers in recruiting and retaining thesequalified employees; however, over the past several years, our industry has been facingfaced considerable workforce challenges. Like other hospital companies, we continue to experience a shortageshortages of advanced practice providers and critical‑care nurses in certain disciplines and geographic areas. The COVID‑19 pandemic exacerbated these shortages – and, thereby, competition for qualified candidates – as more employees chose to retire early, leave the workforce or take travel assignments. We expect these impacts may persist beyond the duration of the pandemic. In addition, in some areas, the increased demand for care of patients with COVID‑19, influenza and other respiratory viruses inat our hospitals,facilities, as well as the direct impact of these illnesses on physicians, employees and their families, have put a strain on our resources and staff.
We also depend on the available labor pool of semi‑skilled and unskilled workers in the areas where we operate. In some of our communities, employers across various industries have increased their minimum wage, which has created more competition and, in some cases, higher labor costs for this sector of employees. Furthermore, we expect that state-mandated minimum wage increases in California will result in an increase in compensation costs for certain of our employees and vendors beginning in 2024. State‑mandated nurse‑staffing ratios in California affect not only our labor costs, but they also cause us to limit admissions if we do not have the necessary number of nurses available to meet the required ratios, which has a corresponding adverse effect on our revenues. If other states adopt similarly restrictive staffing laws, these impacts would be compounded and could be material.
As a result of the aforementioned challenges, we have been, and we may continue to be, required to enhance wages and benefits to recruit and retain experienced employees, pay premiums above standard compensation for essential workers, make greater investments in education and training for newly licensed medical support personnel, or hire more expensive temporary or contract employees, which we also compete with other healthcare providers to secure.
We also depend on the available labor pool of semi‑skilled and unskilled workers in each of the areas where we operate. In some of our communities, employers across various industries have increased their minimum wage, which has created more competition and, in some cases, higher labor costs for this sector of employees. In addition, we expect that inflationary pressures, which we are unable to predict or control, will continue to impact our salaries, wages, benefits and benefits expense in the future. Furthermore, state‑mandated nurse‑staffing ratios in California affect not only our labor costs, but they also cause us to limit admissions if we do not have the necessary number of nurses available to meet the required ratios, which has a corresponding adverse effect on our revenues. If other states adopt similarly restrictive staffing laws, these impacts would be compounded and could be material.costs.
Increased labor union activity is another factor that can adversely affect our labor costs. At December 31, 2022,2023, approximately 26%23% of the employees in our Hospital Operations segment were represented by labor unions. Unionized employees – primarily registered nurses and service, technical and maintenance workers – are located at 33 of our hospitals, the majority of which are in California, Florida and Michigan. Organizing activities by labor unions could increase our level of union representation in future periods. When we are negotiating collective bargaining agreements with unions (whether such agreements are renewals or first contracts), work stoppages and strikes may be threatened or occur, as they did at one of our hospitals in 2021.occur. Extended strikes have had, and could in the future have, an adverse effect on our patient volumes, net operating revenues and labor costs at individual hospitals or in local markets.
In general,For the reasons stated above, our failure to successfully recruit qualified employees, manage attrition, avoid labor disruptions, control costs and plan for future labor needs could have a material adverse effect on our ability to treat patients and our overall business, financial condition, results of operations or cash flows.
Our hospitals, outpatient centers and other healthcare businesses operate in competitive environments, and this competition in our markets can adversely affect patient volumes and other aspects of our operations.
We believe our hospitals and outpatient facilities compete within local communities on the basis of many factors, including: quality of care; location and ease of access; the scope and breadth of services offered; reputation; and the caliber of the facilities, equipment and employees. Furthermore, healthcare consumers are now able to access hospital performance data on quality measures and patient satisfaction, as well as standard charges for services, to compare competing providers. The No Surprises Act created additional price transparency requirements beginning January 1, 2022, including requiring providers to send to health plans of insured patients and to uninsured patients good faith estimates of the expected charges and diagnostic codes prior to the scheduled dates of services. If any of our hospitals achieve poor results (or results that are lower than our competitors) on quality measures or patient satisfaction surveys, or if our standard charges are or are perceived to be higher than our competitors, we may attract fewer patients. In addition, the competitive positions of hospitals and outpatient facilities depend in large part on the number, quality, specialties, and admitting and scheduling practices of the licensed physicians who are members of the medical staffs of those facilities, as well as physicians who affiliate with and use outpatient centers as an extension of their practices. We compete with system‑affiliated hospitals and healthcare companies, as well as health insurers
and private equity companies, in recruiting physicians, acquiring physician practices and, where permitted by law, employing physicians.
Some of the hospitals that compete with our hospitals are owned by tax‑supported government agencies, and many others are owned by not‑for‑profit organizations that may have financial advantages not available to our facilities, including (1) support through endowments, charitable contributions and tax revenues, (2) access to tax‑exempt financing, and (3) exemptions from sales, property and income taxes. In addition, in certain areas in whichwhere we operate, large teaching hospitals provide highly specialized facilities, equipment and services that may not be available at most of our hospitals. The existence or absence of state laws that require findings of need for construction and expansion of healthcare facilities or services may also impact competition. In recent years, the number of freestanding specialty hospitals, surgery centers, EDs, and imaging centers and UCCs in the geographic areas in whichwhere we operate has increased significantly. Some of these facilities are physician‑owned.
Another major factor in the competitive position of a hospital or outpatient facility is the scope of its relationships with managed care plans given that HMOs, PPOs, third‑party administrators and other third‑party payers use managed care contracts to encourage patients to use certain hospitals in exchange for discounts from the hospitals’ established charges. Generally, we compete for managed care contracts on the basis of price, market reputation, geographic location, quality and range of services, caliber of the medical staff and convenience. Other healthcare providers may affect our ability to enter into acceptable managed care contractual arrangements or negotiate commercial rate increases. For example, some of our competitors may negotiate exclusivity provisions with managed care plans or otherwise restrict the ability of managed care companies to contract with us. Vertical integration efforts involving third‑party payers and healthcare providers, among other factors, may increase competitive challenges.
If our healthcare competitors are better able to attract patients, recruit physicians, expand services or obtain favorable managed care contracts at their facilities than we are, we may experience an overall decline in patient volumes.
The market for our revenue cycle management services is also competitive. To be successful, we must respond more quickly and effectively than our competitors to new or changing opportunities, technologies, standards, regulations and client requirements. There can be no assurance that we will be successful in generating new client relationships or maintaining existing relationships on favorable terms.
We cannot predict the future course and impacts of COVID-19, or the potential emergence and effects of a future pandemic, epidemic or outbreak of an infectious disease, on our operations, financial condition and liquidity.
New variants or future surges of COVID‑19, or the emergence or outbreak of another infectious disease, could adversely impact our patient volumes, service mix, revenue mix, operating expenses and net operating revenues in some markets or broadly across our enterprise, depending on how widespread the illness becomes. As previously experienced during the COVID-19 pandemic, we could experience spikes in admissions at our hospitals, which may put a strain on our resources and personnel, and increased case cancellations in our Ambulatory Care segment. We have been required, and we may in the future be required, to temporarily reduce overall operating capacity or suspend certain services at individual facilities due to staffing constraints and other infectious disease-related factors.
Further, COVID‑19 surges, outbreaks of new variants and future pandemics, epidemics or outbreaks could exacerbate existing workforce shortages, result in significant price increases in medical supplies, particularly for personal protective equipment, and worsen supply shortages and delays, all of which may impact our ability to see, admit and treat patients.
In general, the future course and impacts of COVID-19, or the potential emergence and effects of a future pandemic, epidemic or outbreak of an infectious disease, on our operational and financial performance is uncertain and will depend on many factors outside of our control, including, among others: the duration, severity and trajectory of the illness, including the possible spread of potentially more contagious and/or virulent forms of the infection; future economic conditions, as well as the impact of government actions and administrative regulations on the hospital industry and broader economy, including through stimulus efforts; the development, availability and widespread use of effective medical treatments and vaccines; the imposition of public safety measures; the volume of canceled or rescheduled procedures at our facilities; and the volume of affected patients across our care network.
Our business could be significantly and negatively impacted by security threats, catastrophic events and other disruptions affecting our information technology and related systems.information systems and confidential business data.
Our information technology systems are critical to the day‑to‑day operation of our business. We rely on our information technology to process, transmit and store clinical, financial and operational data that includes PHI, personally identifiable information,PII, and proprietary and confidential business data. We utilize electronic health records (“EHRs”) and other information technology in
connection with all of our operations, including our billing and other financial systems, supply chain and labor management tools. Our systems, in turn, interface with and rely on third‑party systems that we do not control, including medical devices and other processes supporting the interoperability of healthcare infrastructures. We rely on these third‑party providers to have appropriate controls to protect our systems, confidential information and other sensitive or regulated data. While we seek to obtain assurances that third parties will protect our information and business operations, there is a risk the security of data held by such third parties could be breached. We monitor and routinely test our securitybreached or that systems and processes and have a diversified data network that provides redundancies as well as other measures designed to protect the integrity, security and availability of the data we process, transmit and store. However, theare rendered unavailable causing direct business operations impacts.
The information technology and infrastructure we use, and the third‑party systems we interact with and the suppliers we use, have been, and will likely continue to be, subject to cyber attacks, computer viruses attacks by hackers, or breaches due to malfeasance or employee error. The COVID‑19 pandemic placed additional stress on our information technology systems, and the risk of attack, breach or other disruption to these systems remains elevated in the current environment. In April 2022, we experienced a cybersecurity incident that temporarily disrupted a subset of our acute carehospital operations and involved the exfiltration of certain confidential company and patient information. WeThreat actors continue to face a heightenedproliferate, adapt and devote significant effort to attacking the information systems and electronically transmitted and stored data of healthcare providers and related entities. The risk of cybersecurity threats targetingcyber attack (including ransomware attack), breach or other disruption to healthcare providers,systems, including ransomware attacks.ours, remains elevated in the current environment.
In general, attacksAttacks on, or breaches or other disruptions to, our information technology assets or those of third parties that we rely upon could impact the integrity, security or availability of data we process, transmit or store.store and could impact our operations, as well as patient PHI and customer PII. The preventive actions we take to reduce the risk of such incidents and protect our information technology and data may not be sufficient. As cybersecurity threats continue to evolve, we may not be able to anticipate certain attack methods in order to implement effective protective measures, and wemeasures. We continue to be required to expend significant additional resources to modify and strengthen our security measures, investigate and respond to cybersecurity incidents, remediate any vulnerabilities in our information systems and infrastructure, and invest in new technology designed to mitigate security risks. Our insurance against cyber‑cybersecurity risks and cyber attacks may not provide the coverage we anticipate or offset the financial impact of a material loss event. In addition, the occurrence of cybersecurity incidents and the continued and elevated risk of ransomware attacks (including ransomware), system and data breaches, and other disruptions to information technology systems in the current environment has caused increases in our cyber premiums and lower coverage limits.
Third parties to whom we outsource certain of our functions, that are part of our supply chain or with whom our systems interface and who may, in some instances, store our sensitive and confidential data, are also subject to the risks outlined above and may not have or use controls effective to protect such information. An attack, breach or other system disruption affecting any of these third parties could similarly harm our business. Further, successful cyber‑cyber attacks at other healthcare services companies, whether or not we are impacted, could lead to a general loss of consumer confidence in our industry that could negatively affect us, including harming the market perception of the effectiveness of our security measures or of the healthcare industry in general, which could result in reduced use of our services.
Our networks and technology systems have also experienced disruption due to planned events, such as system implementations, upgrades, and other maintenance and improvements, and they are subject to disruption in the future for similar events, as well as catastrophic events, including a major earthquake, fire, hurricane, telecommunications failure, terrorist attack or the like.
Any ransomware attack, breach, system interruption or unavailability of our information systems or of third-party systems with access to our data could result in: the unauthorized disclosure, misuse, loss or corruption of such data; interruptions and delays in our normal business operations (including the collection of revenues); patient harm; potential liability under privacy, security, consumer protection or other applicable laws; regulatory penalties; ransomware payments; and negative publicity and damage to our reputation. Any of these could have a material adverse effect on our business, financial condition, results of operations or cash flows.
We are subject to operational cybersecurity risks that could materially impact our business.
Because we operate an expansive, nationwide healthcare delivery network, changes to our information systems often take months or years to implement, are costly and, in some circumstances, are not compatible with other applications and devices in use. In addition, when we acquire facilities, physician practices and other operations, it takes time and resources to assess the security in place, and then implement and integrate our security practices at the acquired businesses. As a result, we operate these businesses for a period of time with their existing security programs, which may include deficiencies or vulnerabilities. We must prioritize changes and improvements to be made, and we may not be successful identifying gaps or developing alternative methods to secure our systems and data. If we are not successful, we may be more vulnerable to cybersecurity incidents that could have a material impact on our results of operations and financial condition. Moreover, not all standard cybersecurity tools and solutions we use are employed at all locations, as expansion of tool and solution use is based
We cannot predicton numerous factors. There is no guarantee that we will employ the impact healthcare reform effortsright tools and solutions at each location or that the expansion of certain tools and solutions will be successful.
Machine learning and artificial intelligence (“AI”) are increasingly driving innovations in technology, and some of our facilities employ robotics, clinical diagnostic AI tools and similar systems. If these technologies or applications fail to operate as anticipated or do not perform as specified, including due to potential design defects and defects in the development of algorithms or other technologies, human error or otherwise, we may be subject to liability and reputational harm. If we are unable to successfully maintain, enhance or operate our information systems, including through the implementation of such technologies or applications in our operations, we may be, among other things, unable to efficiently adapt to evolving laws and requirements, unable to remain competitive with others who successfully implement and advance this technology, and our patients’ safety may be adversely impacted, any of which could have a material adverse impact on our overall business, financial condition, results of operations or cash flows.
The initial expansion of health insurance coverage under the Affordable Care Act resulted in an increase in the number of patients using our facilities with either private or public program coverage and a decrease in uninsured and charity care admissions, along with reductions in Medicare and Medicaid reimbursement to healthcare providers, including us. However, there is ongoing uncertainty with respect to the ultimate net effect of the Affordable Care Act due to the potential for continued changes in the law’s implementation and how government agencies and courts interpret it. Moreover, we cannot predict what future action, if any, Congress might take to amend the Affordable Care Act. If future modifications or interpretations result in significantly fewer individuals having private or public health coverage, we likely will experience decreased patient volumes, reduced revenues and an increase in uncompensated care, which would adversely affect our results of operations and cash flows.
There is also uncertainty regarding the potential impact of other healthcare-related reform efforts at the federal and state levels. Some reform initiatives, requirements and proposals could increase our operating costs, negatively impact our case mix, adversely affect the reimbursement we receive for our services or require us to expend resources to modify certain aspects of our operations. Moreover, some current reforms could impact our competitive position, as well as our relationships with insurers and patients, including the No Surprises Act and CMS’ rules relating to hospital price transparency.
The industry trends toward value-based purchasing and alternative payment models may negatively impact our revenues.
Value‑based purchasing and alternative payment model initiatives of both governmental and private payers tying financial incentives to quality and efficiency of care willare increasingly affectaffecting the results of operations of our hospitals and other healthcare facilities, and may negatively impact our revenues if we are unable to meet expected quality standards. Medicare requires providers to report certain quality measures in order to receive full reimbursement increases for inpatient and outpatient procedures that were previously awarded automatically; each year, CMS updates these measures through refinement or removal of existing measures and the addition of new measures. Moreover, hospitals that meet or exceed certain quality performance standards will receive increased reimbursement payments, and hospitals that have “excess readmissions” for specified conditions will receive reduced reimbursement. The COVID‑19 pandemic has beenwas a disruptive force for CMS’ quality measurement programs; as a result, we expect there will continue to be volatility with respect to readmission penalties in the near term. Furthermore, Medicare no longer pays hospitals additional amounts for the treatment of certain hospital‑acquired conditions (“HACs”), unless the conditions were present at admission. Hospitals that rank in the worst 25% of all hospitals nationally for HACs in the previous year receive reduced Medicare reimbursements. In addition, the Affordable Care Act prohibits the use of federal funds under the Medicaid program to reimburse providers for treating certain provider‑preventable conditions.
The Affordable Care Act also created the CMS Innovation Center to develop and test innovative payment and service delivery models that have the potential to reduce Medicare, Medicaid or Children’s Health Insurance Program expenditures while preserving or enhancing the quality of care for beneficiaries. Congress has defined – both through the Affordable Care Act and previous legislation – a number of specific demonstrations for CMS to conduct, including bundled payment models. Generally, the bundled payment models hold hospitals financially accountable for the quality and costs for an entire episode of care for a specific diagnosis or procedure from the date of the hospital admission or inpatient procedure through 90 days post‑discharge, including services not provided by the hospital, such as physician, inpatient rehabilitation, skilled nursing and home health care. Provider participation in some of these models is voluntary; however, participation in certain other bundled payment arrangements is mandatory for providers located in randomly selected geographic locations. Under the mandatory models, hospitals are eligible to receive incentive payments or will be subject to payment reductions within certain corridors based on their performance against quality and spending criteria. It is difficult to predict what impact, if any, these demonstration programs will have on our inpatient volumes, net revenues or cash flows.
There are also trends among private payers toward value‑based purchasing and alternative payment models for healthcare services. Many large commercial payers expect hospitals to report quality data, and several of these payers will not reimburse hospitals for certain preventable adverse events. We expect value‑Value‑based purchasing programs, including programs that condition reimbursement on patient outcome measures, tomay become more common and tomay involve a higher percentage of reimbursement amounts.
We are unable at this time to predict how the industry trends toward value‑based purchasing and alternative payment models will affect our future results of operations, but they could negatively impact our revenues, particularly if we are unable to meet the quality and cost standards established by both governmental and private payers.
Violations of existing regulations or failure to comply with new or changed regulations could harm our business and financial results.
Our hospitals, outpatient centers and related healthcare businesses are subject to an extensive and complex framework of government regulation at the federal, state and local levels. These legal and regulatory standards relate to, among other topics: ownership and operation of facilities and physician practices; licensure, certification and enrollment in government
programs; the necessity and adequacy of medical care; quality of medical equipment and services; relationships with and qualifications of physicians and employees; operating conduct, policies and procedures; screening, stabilization and transfer of individuals who have emergency medical conditions; rate‑setting, billing and coding for services; the preparation and filing of cost reports; the handling of overpayments; contractual arrangements; relationships with referral sources and referral recipients; privacy and security; maintenance of adequate records; construction, acquisition, expansion and closure of healthcare facilities or services; environmental protection; compliance with fire prevention and building codes; debt collection; and communications with patients and consumers. In addition, various permits are required to dispense narcotics, operate pharmacies, handle radioactive materials and operate certain equipment. Our facilities are also subject to periodic inspection by governmental and other authorities to determine their compliance with applicable regulations, as well as the standards necessary for licensing and accreditation.
The policies and procedures we have in place to facilitate compliance with applicable laws, rules and regulations cannot ensure compliance in every case. Moreover, government regulations often change, and we may have to make adjustments to our facilities, equipment, personnel and services to remain in compliance. The potential consequences for failing to comply with applicable laws, rules and regulations include (1) required refunds of previously received government program payments, (2) the assessment of civil monetary penalties, including treble damages, (3) fines, which could be significant, (4) exclusion from participation in federal healthcare programs and (5) criminal sanctions, including sanctions against current or former employees. Our Medicare and Medicaid payments may be suspended pending even an investigation of what the government determines to be a credible allegation of fraud. Any of the aforementioned consequences could have a material adverse effect on our business, financial condition, results of operations or cash flows. Furthermore, even a public announcement that we are being investigated for possible violations of law could have a material adverse effect on the value of our common stock and our business reputation could suffer.
In general,As noted, the healthcare industry continues to attract much legislative interest and public attention. We are unable to predict the future course of federal, state and local healthcare legislation, regulation or enforcement efforts. Further changes in the regulatory framework negatively affecting healthcare providers could have a material adverse effect on our business, financial condition, results of operations or cash flows.
Violations of existing consumer protection regulations or failure to comply with new or changed regulations could harm our revenue cycle management services business.
Conifer is subject to numerous federal, state and local consumer protection and other laws governing such topics as privacy, financial services, and billing and collections activities. Regulations related to such laws are subject to changing interpretations that may be inconsistent among different jurisdictions. In addition, a regulatory determination made by, or a settlement or consent decree entered into with, one regulatory agency may not be binding upon, or preclude, investigations or regulatory actions by other agencies. Conifer’s failure to comply with applicable consumer protection and other laws could result in, among other things, the issuance of cease and desist orders (which can include orders for restitution or rescission of contracts, as well as other kinds of affirmative relief), the imposition of fines or refunds, and other civil and criminal penalties, some of which could be significant in the case of knowing or reckless violations. In addition, Conifer’s failure to comply with the statutes and regulations applicable to it could result in a reduced demand for services, invalidate all or portions of some services agreements with clients, give clients the right to terminate services agreements or give rise to contractual liabilities, among other things, any of which could have a material adverse effect on our business. Furthermore, if Conifer becomes subject to fines or other penalties, it could harm Conifer’s reputation, thereby making it more difficult to retain existing clients or attract new clients.
We could be subject to substantial uninsured liabilities or increased insurance costs as a result of significant legal actions.
We are subject to medical malpractice lawsuits, antitrust claims and other legal actions in the ordinary course of business. In addition, from time to time, we have been and expect to continue to be subject to regulatory proceedings and private litigation (including employee class action lawsuits) concerning our application of various federal and state labor laws, rules and regulations governing a variety of workplace wage and hour issues. Some of these actions involve large demands, as well as substantial defense costs. Even in states that have imposed caps on damages, litigants are seeking recoveries under new theories of liability that might not be subject to such caps. Our commercial insurance does not cover all claims against us and may not offset the financial impact of a material loss event. Moreover, commercial insurance may not continue to be available at a reasonable cost for us to maintain at adequate levels. We cannot predict the outcome of current or future legal actions against us or the effect that judgments or settlements in such matters may have on us or on our insurance costs. Additionally, professional and general liability insurance we purchase is subject to per-claim and policy period aggregate limits. If the policy period aggregate limit of any of these policies is exhausted, in whole or in part, it could deplete or reduce the limits available to pay other material claims applicable to that policy period. Any losses not covered by or in excess of the amounts maintained
under insurance policies will be funded from our working capital or other sources of liquidity. Furthermore, one or more of our insurance carriers could become insolvent and unable to fulfill its or their obligations to defend, pay or reimburse us when those obligations become due. In that case or if payments of claims exceed our estimates or are not covered by insurance, it could have a material adverse effect on our business, financial condition, results of operations or cash flows.
Any future cost-reduction initiatives may not deliver the benefits we expect, and actions taken may adversely affect our business.
Our future financial performance and level of profitability may depend, in part, on various cost‑reduction initiatives, including the outsourcing of certain functions unrelated to direct patient care. We may encounter challenges in executing cost‑reduction initiatives and not achieve the intended cost savings. In addition, we may face wrongful termination,
discrimination or other legal claims from employees affected by any workforce reductions, and we may incur substantial costs defending against such claims, regardless of their merits. The threat of such claims may also significantly increase our severance costs. Workforce reductions, whether as a result of internal restructuring or in connection with outsourcing efforts, may result in the loss of numerous long‑term employees, the loss of institutional knowledge and expertise, the reallocation of certain job responsibilities and the disruption of business continuity, all of which could negatively affect operational efficiencies and increase our operating expenses in the short term. Moreover, outsourcing and offshoring expose us to additional risks, such as reduced control over operational quality and timing, foreign political and economic instability, compliance and regulatory challenges, and natural disasters not typically experienced in the United States, such as volcanic activity and tsunamis.
TrendsAdverse financial trends affecting our actual or anticipated results may require us to record impairment and restructuring charges that may negatively impact our results of operations.
As a result of factors that have negatively affected our industry generally and our business specifically, we have been, and in the future expect to be, required to record various charges in our results of operations. During the year ended December 31, 2022,2023, we recorded $94$43 million of impairment charges and $118$79 million of restructuring charges. Our impairment tests presume stable, improving or, in some cases, declining operating results in our facilities, which are based on programs and initiatives being implemented that are designed to achieve each facility’s most recent projections. If these projections are not met, or negative trends occur that impact our future outlook, future impairments of long‑lived assets and goodwill may occur, and we may incur additional restructuring charges, which could be material. We believe significant factors that contribute to adverse financial trends include reductions in volumes of insured patients, shifts in payer mix from commercial to governmental payers combined with reductions in reimbursement rates from governmental payers, and high levels of uninsured patients. Future restructuring of our operating structure that changes our goodwill reporting units could also result in future impairments of our goodwill. Any such charges could negatively impact our results of operations.
Inflation, consumer behavior and other economic factors have had, and may continue to have, an adverse impact on our volumes and our ability to collect outstanding receivables on a timely basis, among other things.
Our business has been impacted by the rise in inflation and its effects on salaries, wages and benefits, as well as other costs. Additional economic factors, including unemployment rates and consumer spending, affect our patient volumes, service mix and revenue mix. Business closings and layoffs in the areas where we operate may lead to increases in the uninsured and underinsured populations and adversely affect demand for our services, as well as the ability of patients to pay for services. Any significant deterioration in the collectability of patient accounts receivable could adversely affect our cash flows and results of operations.
Medical supply prices remain high due to current economic conditions and other factors. In addition, our Ambulatory Care segment continues to be impacted by shipment delays in construction materials and capital equipment with respect to its de novo facility development efforts, which are a key part of our portfolio expansion strategy. Supply chain operational challenges may continue or worsen in the future, whether due to geopolitical conflicts, inflationary pressures and the recessionary environment, climate change, weather events or other issues yet to emerge.
If general economic conditions deteriorate or remain uncertain for an extended period of time, our liquidity and ability to repay our outstanding debt may be impacted, and there can be no assurance that we will be able to raise additional funds on terms acceptable to us, if at all.
Risks Related to Acquisitions, Divestitures and Joint Ventures
When we acquire new assets or businesses, we become subject to various risks and uncertainties that could adversely affect our results of operations and financial condition.
We have completed a number of acquisitions in recent years, and we expect to pursue additional transactions in the future. A key business strategy for USPI, in particular, is the acquisition and development of facilities, primarily through the formation of joint ventures with physicians and health system partners. With respect to planned or future transactions, we cannot provide any assurances that we will be able to identify suitable candidates, consummate transactions on terms that are favorable to us, or achieve synergies or other benefits in a timely manner or at all. Furthermore, companies or operations we acquire may not be profitable or may not achieve the profitability that justifies the investments made. Businesses we acquire may also have pre‑existing unknown or contingent liabilities, including liabilities for failure to comply with applicable healthcare regulations. These liabilities could be significant, and, if we are unable to exclude them from the acquisition transaction or successfully obtain and pursue indemnification from a third party or insurance proceeds, they could harm our business and financial condition. In addition, we may be unable to timely and effectively integrate ASCs, physician practices and other businesses that we acquire with our ongoing operations, or we may experience delays implementing operating procedures, personnel and systems, which could impact the financial performance of the acquired business. Significant acquisitions have required, and may in the future require, a substantial investment of time and resources across our enterprise; these efforts may affect management focus and impact our ability to properly prioritize and successfully execute on our other strategic initiatives. Moreover, future acquisitions could result in the incurrence of additional debt and contingent liabilities, potentially dilutive issuances of equity securities, and increased operating expenses, any of which could adversely affect our results of operations and financial condition.
We cannot provide any assurances that we will be successful in divesting assets we wish to sell.
From time to time, we pursue opportunities to refine our portfolio of hospitals and other healthcare facilities when we believe such refinements will help us improve profitability, allocate capital more effectively in areas where we have a stronger presence, deploy proceeds on higher-return investments across our business, enhance cash flow generation and reduce our debt, among other things. We continue toalso periodically exit service lines and businesses that we believe are no longer a core part of our long‑term growth and synergy strategies. We cannot provide any assurances that completed, planned or future divestitures or other strategic transactions will achieve their business goals or the benefits we expect.
We have in the past, and may in the future, fail to obtain applicable regulatory approvals, including FTC approvals,clearances, with respect to planned divestitures of assets or businesses. Most recently, in December 2023, John Muir announced it no longer intended to pursue its proposed acquisition of our 51% ownership interest in San Ramon Regional Medical Center and certain related operations after the FTC took action to challenge the transaction. Moreover, we may encounter difficulties in finding acquirers or alternative exit strategies on terms that are favorable to us, which could delay the receipt of anticipated proceeds necessary for us to complete our planned strategic objectives. In addition, our divestiture activities have required, and may in the future require, us to retain significant pre‑closing liabilities, recognize impairment charges (as discussed above) or agree to contractual restrictions that limit our ability to reenter a particular market, which may be material. Many of our acute care hospital divestitures also necessitate us entering into a transition services agreement with the buyer for information technology and other
related services. As a consequence, we may be exposed to the financial status of the buyer for any payments under such transition services agreements or for transferred contractual liabilities, which could be significant. Our divestitures also include the assignment of contracts, such as leases, to the buyers; in many cases, we continue to be exposed to liabilities under such arrangements if the buyers do not timely pay the obligations.
Furthermore, our divestiture and other corporate development activities may present financial and operational risks, including (1) the diversion of management attention from existing core businesses, (2) adverse effects (including a deterioration in the related asset or business) from the announcement of the planned or potential activity,transaction, and (3) the challenges associated with separating personnel and financial and other systems.
USPI and our hospital-based joint ventures depend on existing relationships with key health system partners. If we are unable to maintain synergistic relationships with these systems, or enter into new relationships, we may be unable to implement our business strategies successfully.
USPI and our hospital‑based joint ventures depend in part on the efforts, reputations and success of health system partners and the strength of our relationships with those systems. Our joint ventures could be adversely affected by any damage to those health systems’ reputations or to our relationships with them. In addition, damage to our business reputation could negatively impact the willingness of health systems to enter into relationships with us or USPI. If we are unable to maintain existing arrangements on favorable terms or enter into relationships with additional health system partners, we may be unable to implement our business strategies for our joint ventures successfully.
Our joint venture arrangements are subject to a number of operational risks that could have a material adverse effect on our business, results of operations and financial condition.
We have invested in a number of joint ventures with other entities when circumstances warranted the use of these structures, and we may form additional joint ventures in the future. These joint ventures may not be profitable or may not achieve the profitability that justifies the investments made. Furthermore, the nature of a joint venture requires us to consult with and share certain decision‑making powers with unaffiliated third parties, some of which may be not‑for‑profit health systems. If our joint venture partners do not fulfill their obligations, the affected joint venture may not be able to operate according to its business or strategic plans. In that case, our results of operations could be adversely affected or we may be required to increase our level of financial commitment to the joint venture. Moreover, differences in economic or business interests or goals among joint venture participants could result in delayed decisions, failures to agree on major issues and even litigation. If these differences cause the joint ventures to deviate from their business or strategic plans, or if our joint venture partners take actions contrary to our policies, objectives or the best interests of the joint venture, our results of operations could be adversely affected. In addition, our relationships with not‑for‑profit health systems and the joint venture agreements that govern these relationships are intended to be structured to comply with current revenue rulings published by the Internal Revenue Service, as well as case law relevant to joint ventures between for‑profit and not‑for‑profit healthcare entities. Material changes in these authorities could adversely affect our relationships with not‑for‑profit health systems and related joint venture arrangements.
Our participation in joint ventures is also subject to the risks that:
•We could experience an impasse on certain decisions because we do not have sole decision‑making authority, which could require us to expend additional resources on resolving such impasses or potential disputes.
•We may not be able to maintain good relationships with our joint venture partners (including health systems), which could limit our future growth potential and could have an adverse effect on our business strategies.
•Our joint venture partners could have investment or operational goals that are not consistent with our corporate‑wide objectives, including the timing, terms and strategies for investments or future growth opportunities.
•Our joint venture partners might become bankrupt, fail to fund their share of required capital contributions or fail to fulfill their other obligations as joint venture partners, which may require us to infuse our own capital into any such venture on behalf of the related joint venture partner or partners despite other competing uses for such capital.
•The requirements in many of our existing joint ventures that one of our wholly owned subsidiaries provide a working capital line of credit to the joint venture could necessitate the allocation of substantial financial resources to the joint venture, potentially impacting our ability to fund our other short‑term obligations.
•Provisions in some of our existing joint venture arrangements requiring mandatory capital expenditures for the benefit of the applicable joint venture could limit our ability to expend funds on other corporate opportunities.
•Our joint venture partners may have competing interests in our markets that could create conflict of interest issues.
•Any sale or other disposition of our interest in a joint venture or underlying assets of the joint venture may require consents from our joint venture partners, which we may not be able to obtain.
•Certain corporate‑wide or strategic transactions may also trigger other contractual rights held by a joint venture partner (including termination or liquidation rights) depending on how the transaction is structured, which could impact our ability to complete such transactions.
•Put/call arrangements and other joint venture exit rights could require us to utilize our cash flow, incur additional indebtedness or issue stock to satisfy the payment obligations in respect of such arrangements.
•Our joint venture arrangements that involve financial and ownership relationships with physicians and others who either refer or influence the referral of patients to our hospitals or other healthcare facilities are subject to greater regulatory scrutiny from government enforcement agencies. While we endeavor to comply with the applicable safe harbors under the Anti‑kickback Statute, certain of our current arrangements, including joint venture arrangements, do not qualify for safe harbor protection.
Risks Related to Conifer
Conifer operates in a highly competitive industry, and its current or future competitors may be able to compete more effectively than Conifer does, which could have a material adverse effect on Conifer’s margins and growth rate.
We are continuing to market Conifer’s revenue cycle management, patient communications and engagement services, and value‑based care solutions businesses. There can be no assurance that Conifer will be successful in generating new client relationships, including with respect to hospitals we or Conifer’s other clients sell, as the respective buyersTable of such hospitals may not continue to use Conifer’s services or, if they do, they may not do so under similar contractual terms. The market for Conifer’s solutions is highly competitive, and we expect competition may intensify in the future. Conifer faces competition from existing participants and new entrants to the revenue cycle management business, as well as from the staffs of hospitals and other healthcare providers who handle these processes internally. In addition, electronic medical record software vendors may expand into services offerings that compete with Conifer. To be successful, Conifer must respond more quickly and effectively than its competitors to new or changing opportunities, technologies, standards, regulations and client requirements. Moreover, existing or new competitors may introduce technologies or services that render Conifer’s technologies or services obsolete or less marketable. Even if Conifer’s technologies and services are more effective than the offerings of its competitors, current or potential clients might prefer competitive technologies or services to Conifer’s technologies and services. Furthermore, increased competition has resulted and may continue to result in pricing pressures, which could negatively impact Conifer’s margins and growth rate.ContentsViolations of existing regulations or failure to comply with new or changed regulations could harm Conifer’s business and financial results.
Conifer is subject to numerous federal, state and local consumer protection and other laws governing such topics as privacy, financial services, and billing and collections activities. Regulations governing Conifer’s operations are subject to changing interpretations that may be inconsistent among different jurisdictions. In addition, a regulatory determination made by, or a settlement or consent decree entered into with, one regulatory agency may not be binding upon, or preclude, investigations or regulatory actions by other agencies. Conifer’s failure to comply with applicable consumer protection and other laws could result in, among other things, the issuance of cease and desist orders (which can include orders for restitution or rescission of contracts, as well as other kinds of affirmative relief), the imposition of fines or refunds, and other civil and criminal penalties, some of which could be significant in the case of knowing or reckless violations. In addition, Conifer’s failure to comply with the statutes and regulations applicable to it could result in reduced demand for its services, invalidate all or portions of some of Conifer’s services agreements with its clients, give clients the right to terminate Conifer’s services agreements with them or give rise to contractual liabilities, among other things, any of which could have a material adverse effect on Conifer’s business. Furthermore, if Conifer becomes subject to fines or other penalties, it could harm Conifer’s reputation, thereby making it more difficult for Conifer to retain existing clients or attract new clients.
Risks Related to Our Indebtedness
Our level of indebtedness could, among other things, adversely affect our ability to raise additional capital to fund our operations, limit our ability to react to changes in the economy or our industry, and prevent us from meeting our obligations under the agreements relating to our indebtedness.
At December 31, 2022,2023, we had approximately $15.079$15.002 billion of total long‑term debt, as well as $116$111 million in standby letters of credit outstanding in the aggregate under our senior secured revolving credit facility (as amended, “Credit Agreement”) and our letter of credit facility agreement (as amended, “LC Facility”). Our Credit Agreement is collateralized by
eligible inventory and patient accounts receivable, including receivables for Medicaid supplemental payments, of substantially all of our wholly owned acute care and specialty hospitals, and our LC Facility is guaranteed and secured by a first priority pledge of the capital stock and other ownership interests of certain of our hospital subsidiaries on an equal‑ranking basis with our existing senior secured notes. From time to time, we expect to engage in additional capital market, bank credit and other financing activities, depending on our needs and financing alternatives available at that time.
The interest expense associated with our indebtedness offsets a substantial portion of our operating income. During 2022,2023, our interest expense was $890$901 million and represented 38%36% of our $2.333$2.510 billion of operating income. As a result, relatively small percentage changes in our operating income can result in a relatively large percentage change in our net income and earnings per share, both positively and negatively. In addition:
•Our substantial indebtedness may limit our ability to adjust to changing market conditions and place us at a competitive disadvantage compared to our competitors that have less debt.
•We may be more vulnerable in the event of a deterioration in our business, in the healthcare industry or in the economy generally, or if federal or state governments substantially limit or reduce reimbursement under the Medicare or Medicaid programs.
•Our debt service obligations reduce the amount of funds available for our operations, capital expenditures and corporate development activities, and may make it more difficult for us to satisfy our financial obligations.
•Our operations are capital intensive and require significant investment to maintain buildings, equipment, software and other assets. Our substantial indebtedness could limit our ability to obtain additional financing to fund future capital expenditures, as well as working capital, acquisitions or other needs.
•Our significant indebtedness may result in the market value of our stock being more volatile, potentially resulting in larger investment gains or losses for our shareholders, than the market value of the common stock of other companies that have a relatively smaller amount of indebtedness.
•A significant portion of our outstanding debt is subject to early prepayment penalties, such as make‑whole premiums; as a result, it may be costly to pursue debt repayment as a deleveraging strategy.
Furthermore, our Credit Agreement, our LC Facility and the indentures governing our outstanding notes contain, and any future debt obligations may contain, covenants that, among other things, restrict our ability to pay dividends, incur additional debt and sell assets.
We may not be able to generate sufficient cash to service all of our indebtedness, and we may not be able to refinance our indebtedness on favorable terms. If we are forced to take other actions to satisfy our obligations under our indebtedness, these actions may not be successful.
Our ability to make scheduled payments on or to refinance our indebtedness depends on our financial and operating performance, which is subject to prevailing economic and competitive conditions and to financial, business and other factors that may be beyond our control. We cannot assure youThere can be no assurance that we will be able to maintain a level of cash flows from operating activities sufficient to permit us to pay the principal, premium, if any, and interest on our indebtedness.
In addition, our ability to meet our debt service obligations is dependent upon the operating results of our subsidiaries and their ability to pay dividends or make other payments or advances to us. We hold most of our assets at, and conduct substantially all of our operations through, direct and indirect subsidiaries. Moreover, we rely on dividends or other intercompany transfers of funds from our subsidiaries to meet our debt service and other obligations, including payment on our outstanding debt. The ability of our subsidiaries to pay dividends or make other payments or advances to us will depend on their operating results and will be subject to applicable laws and restrictions contained in agreements governing the debt of such subsidiaries. Our less thanSubsidiaries that are not wholly owned subsidiaries may also be subject to restrictions on their ability to distribute cash to us in their financing or other agreements and, as a result, we may not be able to access their cash flows to service their respective debt obligations.
In recent years, we have regularly issued new notes to refinance our outstanding notes prior to their maturity, and we are likely to continue this practice in the future. Current capital market conditions, including the impact of inflation, have increased borrowing rates and can be expected to significantly increase our cost of capital as compared to prior periods should we seek additional funding. Moreover, global capital markets have experienced significant volatility and uncertainty in the past, and there can be no assurance that such financing alternatives will be available to us on favorable terms, or at all, should we determine it necessary or advisable to seek additional capital. In addition, our ability to incur secured indebtedness (which would generally enable us to achieve better pricing than the incurrence of unsecured indebtedness) depends in part on the value
of our assets, which depends, in turn, on the strength of our cash flows and results of operations, as well as on economic and market conditions and other factors.
If our cash flows and capital resources are insufficient to fund our debt service obligations and we are unable to refinance our indebtedness on acceptable terms, we may be forced to reduce or delay investments and capital expenditures, including those required for physical plant maintenance or operation of our existing facilities, for integrating our historical acquisitions or for future corporate development activities, and such reduction or delay could continue for years. We also may be forced to sell assets or operations, seek additional capital, or restructure our indebtedness. We cannot assure you that we would be able to take any of these actions, that these actions would be successful and permit us to meet our scheduled debt service obligations, or that these actions would be permitted under the terms of our existing or future debt agreements, including our Credit Agreement, our LC Facility and the indentures governing our outstanding notes.
Restrictive covenants in the agreements governing our indebtedness may adversely affect us.
Our Credit Agreement, our LC Facility and the indentures governing our outstanding notes contain various covenants that, among other things, limit our ability and the ability of our subsidiaries to:
•incur, assume or guarantee additional indebtedness;
•incur liens;
•make certain investments;
•provide subsidiary guarantees;
•consummate asset sales;
•redeem debt that is subordinated in right of payment to outstanding indebtedness;
•enter into sale and lease‑back transactions;
•enter into transactions with affiliates; and
•consolidate, merge or sell all or substantially all of our assets.
These restrictions are subject to a number of important exceptions and qualifications. In addition, under certain circumstances, the terms of our Credit Agreement require us to maintain a financial ratio relating to our ability to satisfy certain fixed expenses, including interest payments. Our ability to meet this financial ratio and the aforementioned restrictive covenants may be affected by events beyond our control, and we cannot assure youthere can be no assurance that we will meet those tests. These restrictions could limit our ability to obtain future financing, make acquisitions or needed capital expenditures, withstand economic downturns in our business or the economy in general, conduct operations or otherwise take advantage of business opportunities that may arise. In addition, a breach of any of these covenants could cause an event of default, which, if not cured or waived, could require us to repay the indebtedness immediately. Under these conditions, we are not certain whether we would have, or be able to obtain, sufficient funds to make accelerated payments.
Despite current indebtedness levels, we have the ability and may decide to incur substantially more debt or otherwise increase our leverage. This could further intensify the risks described above.
We have the ability to incur additional indebtedness in the future, subject to the restrictions contained in our Credit Agreement, our LC Facility and the indentures governing our outstanding notes. We may decide to incur additional secured or unsecured debt in the future to finance our operations and any judgments or settlements or for other business purposes.
Our Credit Agreement provides for revolving loans in an aggregate principal amount of up to $1.500 billion, with a $200 million subfacility for standby letters of credit. Our LC Facility provides for the issuance of standby and documentary letters of credit in an aggregate principal amount of up to $200 million. At December 31, 2022,2023, we had no cash borrowings outstanding under the Credit Agreement, and we had $116$111 million of standby letters of credit outstanding in the aggregate under the Credit Agreement and the LC Facility. Based on our eligible receivables, $1.500 billion was available for borrowing
under the Credit Agreement at December 31, 2022.2023. If new indebtedness is added or our leverage increases, the related risks that we now face could intensify.
ITEM 1B. UNRESOLVED STAFF COMMENTS
None.
ITEM 1C. CYBERSECURITY
RISK MANAGEMENT AND STRATEGY
We identify and assess areas of risk for our company on an ongoing basis, and we have developed, and regularly refine, comprehensive practices to manage and mitigate existing and potential risks to our business. Our board of directors oversees enterprise risk management as an integral and continuous part of its oversight role. Integrated into our overall enterprise risk management framework are processes dedicated to the identification, assessment and management of material risks from cybersecurity threats. Our approach to cybersecurity risk management is both proactive and defensive, and includes the following elements:
•a team dedicated solely to cybersecurity and managed by our chief information security officer (“CISO”), who reports directly to our chief information officer (“CIO”);
•an information technology request review process that includes cybersecurity assessments of third-party products and systems proposed to connect to our information systems environment or access our data; and
•a cybersecurity incident response plan.
Cybersecurity Team and Strategy—Our cybersecurity team, which includes both our employees and those of our managed services provider, is comprised of subgroups focused on distinct functional areas of responsibility. The team maintains a Security Operations Center, staffed 24 hours a day, that delivers day-to-day execution support for our cybersecurity risk management program.
We leverage a multi-layered strategy that is designed to assess, identify, manage and mitigate risks to our systems and data from cybersecurity threats. Proactively, we have implemented numerous threat‑management tools and processes. In addition, we have disaster recovery and business continuity plans that are tested and updated periodically. We strive to stay abreast of cybersecurity threats through integrated threat intelligence feeds, industry and federal threat notices, and participation in healthcare industry intelligence sharing. We also conduct table-top exercises, which serve to simulate cybersecurity incidents to practice response and identify gaps, on a regular basis. Our internal audit team performs random sampling audits of security practices at our facilities, and we routinely perform security risk assessments.
We also require all employees to participate in cybersecurity awareness training annually, and we circulate cybersecurity awareness alerts, safety tips and newsletters to employees across the enterprise regularly. In addition, we routinely run phishing campaigns and perform other tests to increase awareness of cybersecurity threats.
Third-Party Review Processes—Our business requires interaction of our systems and the sharing of data with third parties, including our service providers and vendors, as well as other healthcare providers and their vendors, that present risks to our systems and data from third-party systems and practices. Incidents and cybersecurity attacks at third parties can impact our operations and our obligations to patients, payers and others. We manage this risk through an information technology review and approval process that considers the anticipated use and implementation of proposed technologies, and includes cybersecurity team assessments of third-party products and systems proposed to connect to our information systems environment or access our data. A subgroup of our cybersecurity team is dedicated to risk-assessment analyses of vendor security practices and protections. In certain circumstances, we enter into information security agreements with service providers to secure their commitment to maintain certain security protections.
Cybersecurity Incident Response Plan—In addition to protecting our assets proactively, our cybersecurity team is tasked with detecting and defending against cybersecurity threats to our systems and data. We maintain a response plan that outlines actions to be taken with respect to cyber incidents and includes procedures, notification processes, and protocols for escalation to senior management and our board of directors. The cybersecurity incident response team is composed of a smaller, core group of our cybersecurity team, as well as a larger, extended group that includes personnel from our operations, legal, compliance, privacy, risk management, communications, incident command center, security, human resources, finance, audit and government relations teams. We also engage third parties, such as forensics consultants, external legal counsel and law enforcement, as needed and as appropriate based on the circumstances. Incidents are escalated to senior management as appropriate based on the nature of the incident.
EXISTING AND POTENTIAL RISKS
As discussed in the Risk Factors section above, our operations could be significantly and negatively impacted by cybersecurity threats and other disruptions affecting our information technology, related information systems and sensitive information. We rely on our information technology to process, transmit and store clinical, financial and operational data that includes PHI, PII and proprietary and confidential business data. We utilize EHRs and other information technology in connection with all of our operations, including our billing and other financial systems, supply chain and labor management tools. As described above, our information systems, in turn, interface with and rely on third‑party systems that we do not control, including medical devices and other processes supporting the interoperability of healthcare infrastructures.
In April 2022, we experienced a cybersecurity incident that temporarily disrupted a subset of our hospital operations and involved the exfiltration of certain confidential company and patient information. We incurred significant costs to remediate the issues, sustained lost revenues from the associated business interruption and incurred other related expenses. Following this incident, we implemented certain changes to our information systems and processes meant to provide additional protections to our environment, including enhancements to our Security Operations Center, system backups, training practices, detection tools and capabilities, and implementation of new tools and processes, among others. However, we continue to face a heightened risk of cybersecurity threats targeting healthcare providers, including ransomware attacks, which may materially impact our operations. Threat actors continue to proliferate, adapt and devote significant effort to attacking the information systems and electronically transmitted and stored data of healthcare providers and related entities.
GOVERNANCE
Board Oversight—Our board of directors has identified the oversight of cybersecurity risks to be one of its priorities, and it receives regular reports from management, including the CIO and the CISO, on various cybersecurity matters, including the security of the company’s information systems, anticipated sources of future material cyber risks and how management is addressing any significant potential vulnerability. The board’s audit committee reviews the company’s cybersecurity program at least annually and receives regular updates on cybersecurity threats and other matters. Cecil D. Haney, a member of the audit committee, brings to the board valuable insights into cybersecurity, systems planning, and crisis and risk management.
In addition to regular updates to the audit committee, we have protocols by which certain cybersecurity incidents are escalated within the company and, where appropriate, reported in a timely manner to the board and the audit committee.
Management Oversight—Our CISO, who reports directly to our CIO, oversees and manages our cybersecurity strategy and related programs. As the head of our cybersecurity team, both internal and outsourced, our CISO is primarily responsible for assessing and managing risks from cybersecurity threats. The processes by which he is informed about and monitors the prevention, detection, mitigation and remediation of cybersecurity incidents is described above. He reports information about such risks to the CIO and other members of senior management, who, in turn, report them to our board and audit committee, as appropriate. Our CISO joined the company in August 2022 with over 20 years of risk management, national security and cybersecurity experience garnered at both public and private companies, as well as governmental agencies.
ITEM 2. PROPERTIES
The disclosure required under this Item is included in Item 1, Business, of Part I of this report.
ITEM 3. LEGAL PROCEEDINGS
Because we provide healthcare services in a highly regulated industry, we have been and expect to continue to be party to various lawsuits, claims and regulatory investigations from time to time. For information regarding material pending legal proceedings in which we are involved, see Note 17 to our Consolidated Financial Statements, which is incorporated by reference.
ITEM 4. MINE SAFETY DISCLOSURES
Not applicable.
PART II.
ITEM 5. MARKET FOR REGISTRANT’S COMMON EQUITY, RELATED STOCKHOLDER MATTERS AND ISSUER PURCHASES OF EQUITY SECURITIES
Common Stock—Our common stock is listed on the New York Stock Exchange under the symbol “THC.” As of February 10, 2023,9, 2024, there were 3,4473,282 holders of record of our common stock. Our transfer agent and registrar is Computershare. Shareholders with questions regarding their stock certificates, including inquiries related to exchanging or replacing certificates or changing an address, should contact the transfer agent at (866) 229‑8416.
Equity Compensation—Refer to Item 12, Security Ownership of Certain Beneficial Owners and Management and Related Stockholder Matters, of Part III of this report, as well as Note 10 to our Consolidated Financial Statements, for information regarding securities authorized for issuance under our equity compensation plans.
Stock Performance Graph—The following graph shows the cumulative, five‑year total return for our common stock compared to the following indices:
•The S&P 500, a stock market index that measures the equity performance of 500 large companies listed on the stock exchanges in the United States (in which we are not included);
•The S&P 500 Health Care, a stock market index comprised of those companies included in the S&P 500 that are classified as part of the healthcare sector (in which we are not included); and
•A group made up of us and our healthcare provider peers (namely, Community Health Systems, Inc. (CYH), HCA Healthcare, Inc. (HCA), Tenet Healthcare Corporation (THC) and Universal Health Services, Inc. (UHS)), which we refer to as our “Peer Group” herein.
Performance data assumes that $100.00 was invested on December 31, 20172018 in our common stock and each of the indices. The data assumes the reinvestment of all cash dividends and the cash value of other distributions, if any. Moreover, in accordance with U.S. Securities and Exchange Commission (“SEC”) regulations, the returns of each company in our Peer Group have been weighted according to the respective company’s stock market capitalization at the beginning of each period for which a return is indicated. The stock price performance shown in the graph is not necessarily indicative of future stock price performance. The performance graph shall not be deemed “filed” for purposes of Section 18 of the Securities Exchange Act of 1934, as amended (the “Exchange Act”), or incorporated by reference into any of our filings under the Securities Act of 1933, as amended, or the Exchange Act, except as shall be expressly set forth by specific reference in such filing.
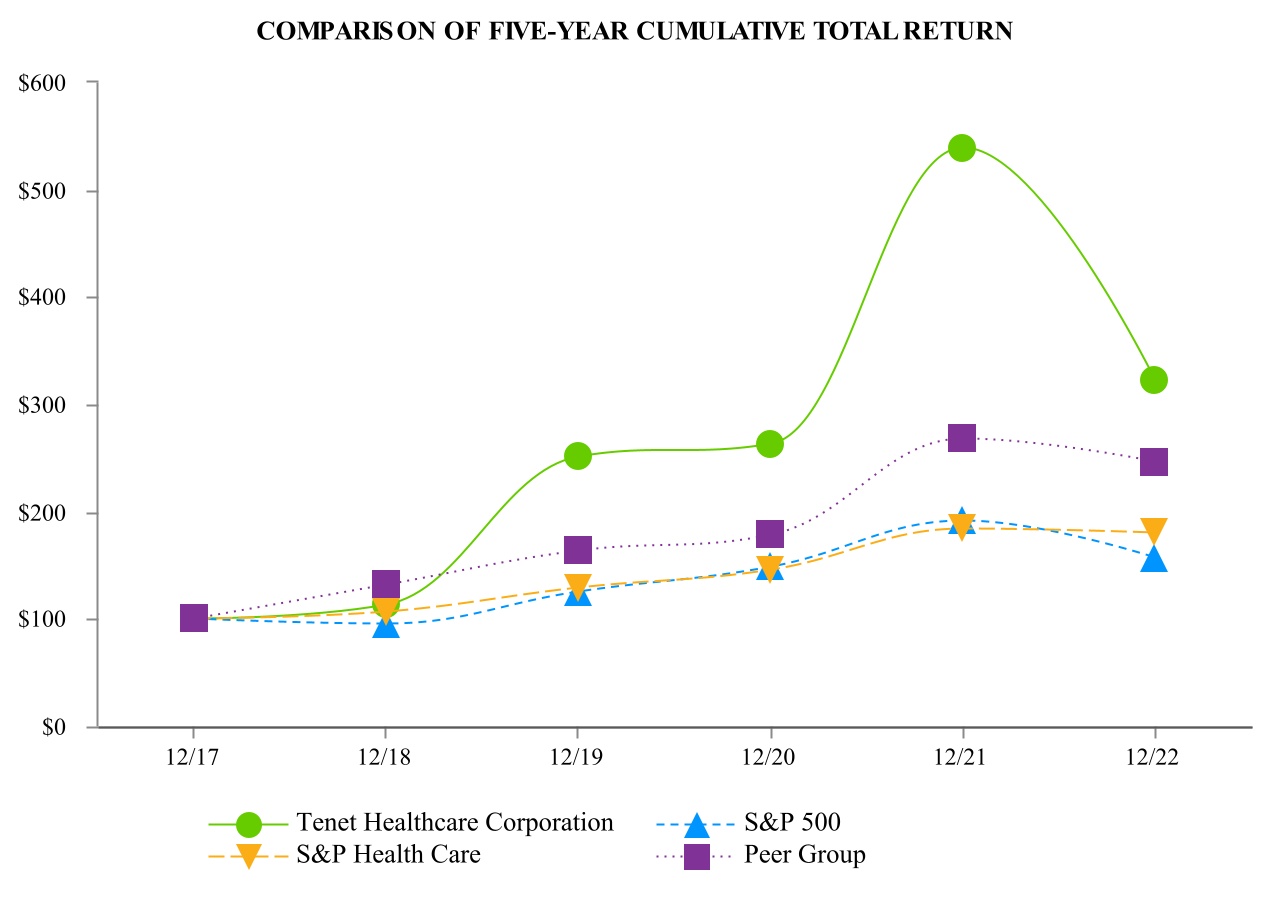
| | | | | | | | | | | | | | | | | | | | | | | | | | | | | | | | | | | |
| At December 31, |
| | 2017 | | 2018 | | 2019 | | 2020 | | 2021 | | 2022 |
| Tenet Healthcare Corporation | $ | 100.00 | | | $ | 113.06 | | | $ | 250.86 | | | $ | 263.39 | | | $ | 538.85 | | | $ | 321.83 | |
| S&P 500 | $ | 100.00 | | | $ | 95.62 | | | $ | 125.72 | | | $ | 148.85 | | | $ | 191.58 | | | $ | 156.89 | |
| S&P Health Care | $ | 100.00 | | | $ | 106.47 | | | $ | 128.64 | | | $ | 145.93 | | | $ | 184.07 | | | $ | 180.47 | |
| Peer Group | $ | 100.00 | | | $ | 131.60 | | | $ | 163.19 | | | $ | 177.96 | | | $ | 267.89 | | | $ | 245.98 | |

| | | | | | | | | | | | | | | | | | | | | | | | | | | | | | | | | | | |
| At December 31, |
| | 2018 | | 2019 | | 2020 | | 2021 | | 2022 | | 2023 |
| Tenet Healthcare Corporation | $ | 100.00 | | | $ | 221.88 | | | $ | 232.96 | | | $ | 476.60 | | | $ | 284.66 | | | $ | 440.90 | |
| S&P 500 | $ | 100.00 | | | $ | 131.49 | | | $ | 155.68 | | | $ | 200.37 | | | $ | 164.08 | | | $ | 207.21 | |
| S&P Health Care | $ | 100.00 | | | $ | 120.82 | | | $ | 137.07 | | | $ | 172.89 | | | $ | 169.51 | | | $ | 172.99 | |
| Peer Group | $ | 100.00 | | | $ | 124.00 | | | $ | 135.23 | | | $ | 203.56 | | | $ | 186.91 | | | $ | 215.92 | |
RepurchaseRepurchases of Common Stock—In October 2022, our board of directors authorized the repurchase of up to $1 billion of our common stock through aThe table below presents share repurchase program. Purchasestransactions completed during the period from the commencement of the program throughthree months ended December 31, 2022 are presented in the table below:2023:
| | | | | | | | | | | | | | | | | | | | | | | | | | |
| Period | | Total Number of Shares Purchased | | Average Price Paid per Share | | Total Number of Shares Purchased as Part of Publicly Announced Program | | Maximum Dollar Value of Shares That May Yet be Purchased Under the Program |
| | | (In Thousands) | | | | (In Thousands) | | (In Millions) |
| Inception through October 31, 2022 | | 1,800 | | $ | 41.81 | | | 1,800 | | $ | 925 | |
| November 1 through November 30, 2022 | | 4,089 | | $ | 42.74 | | | 4,089 | | $ | 750 | |
| December 1 through December 31, 2022 | | — | | | $ | — | | | — | | | $ | 750 | |
| Inception through December 31, 2022 | | 5,889 | | $ | 42.45 | | | 5,889 | | |
| | | | | | | | | | | | | | | | | | | | | | | | | | |
| Period | | Total Number of Shares Purchased | | Average Price
Paid per Share | | Total Number of Shares Purchased as Part of Publicly Announced Program(1) | | Maximum Dollar Value of Shares That May Yet be Purchased Under the Program |
| | | (In Thousands) | | | | (In Thousands) | | (In Millions) |
| October 1 through October 31, 2023 | | — | | $ | — | | | — | | $ | 660 | |
| November 1 through November 30, 2023 | | 982 | | $ | 67.12 | | | 982 | | $ | 594 | |
| December 1 through December 31, 2023 | | 644 | | $ | 68.53 | | | 644 | | $ | 550 | |
| | 1,626 | | | | 1,626 | | |
| | | | | | | | |
| | |
| (1) | In October 2022, our board of directors authorized the repurchase of up to $1 billion of our common stock through a share repurchase program that expires on December 31, 2024. The share repurchase program does not obligate us to acquire any particular amount of common stock, and it may be suspended for periods or discontinued at any time before its scheduled expiration. |
These repurchases were made, and any future repurchases will be made, in open‑marketopen-market or privately negotiated transactions, at management’s discretion subject to market conditions and other factors, and in a manner consistent with applicable securities laws and regulations. The share repurchase programtable does not obligate usinclude shares tendered to acquire any particular amountsatisfy the exercise price in connection with cashless exercises of commonemployee stock and it may be suspended for periodsoptions or discontinued at any time before its scheduled expiration date of December 31, 2024.shares tendered to satisfy tax withholding obligations in connection with employee or director equity awards.
ITEM 6. RESERVED
ITEM 7. MANAGEMENT’S DISCUSSION AND ANALYSIS OF FINANCIAL CONDITION AND RESULTS OF OPERATIONS
INTRODUCTION TO MANAGEMENT’S DISCUSSION AND ANALYSIS
The purpose of this section, Management’s Discussion and Analysis of Financial Condition and Results of Operations (“MD&A”), is to provide a narrative explanation of our financial statements that enables investors to better understand our business, to enhance our overall financial disclosures, to providegive context to the analysis of our financial information, and to provide information about the quality of, and potential variability of, our financial condition, results of operations and cash flows. MD&A, which should be read in conjunction with the accompanying Consolidated Financial Statements, includes the following sections:
•Management Overview
•Sources of Revenue for Our Hospital Operations and Services Segment
•Results of Operations
•Liquidity and Capital Resources
•Recently Issued Accounting Standards
•Critical Accounting Estimates
OurAt December 31, 2022, our business consists ofwas organized into three separate reporting segments: Hospital Operations and other, Ambulatory Care and Conifer. During the three months ended December 31, 2023, we combined our Hospital Operations and other and Conifer segments into a single reporting segment named Hospital Operations and Services (“Hospital Operations”) segment, our Ambulatory Care segment. This change was made to reflect recent updates to the organizational and management structure of our Conifer segment. and Hospital Operations and other segments. All prior‑period data presented in this report has been adjusted to conform to our new reporting segment structure.
Our Hospital Operations segment is comprised of our acute care and specialty hospitals, imaging centers,a network of employed physicians and ancillary outpatient facilities, micro‑hospitals and physician practices.facilities. At December 31, 2022,2023, our subsidiaries operated 61 hospitals serving primarily urban and suburban communities in nine states, including Piedmont Medical Center Fort Mill (“PMC Fort Mill”), the new acute care hospital we opened in South Carolina in September 2022.states. Our Hospital Operations segment also included 109164 outpatient centersfacilities at December 31, 2022, the majority of which are provider‑based and freestanding2023, including imaging centers, off‑campus hospital emergency departments and micro-hospitals, and provider‑based ambulatory surgeryurgent care centers (each, an “ASC”a “UCC”)., ancillary emergency facilities and micro‑hospitals. In addition, our Hospital Operations segment provides revenue cycle management and value-based care services to hospitals, health systems, physician practices, employers and other clients through our Conifer Health Solutions, LLC joint venture.
Our Ambulatory Care segment, through our USPI Holding Company, Inc. subsidiary (“USPI”), held ownership interests in 442 ASCs (300461 ambulatory surgery centers (each, an “ASC”) (322 consolidated) and 24 surgical hospitals (eight consolidated) in 35 states at December 31, 2022.2023. USPI’s facilities offer a range of procedures and service lines, including, among other specialties: orthopedics, total joint replacement, and spinal and other musculoskeletal procedures; gastroenterology; and urology. At the beginning of 2022, we owned approximately 95% of the voting shares of USPI, and Baylor University Medical Center (“Baylor”) owned approximately 5%. Effective June 30, 2022, we purchased all of the shares in USPI that Baylor held on that date for $406 million, which increased our ownership interest in USPI’s voting shares from 95% to 100%. See Note 18 to the accompanying Consolidated Financial Statements and the Liquidity and Capital Resources section of MD&A for additional information about this transaction.
Our Conifer segment provides revenue cycle management and value‑based care services to hospitals, health systems, physician practices, employers and other clients through our Conifer Holdings, Inc. subsidiary (“Conifer”). At December 31, 2022, Conifer provided services to approximately 660 Tenet and non‑Tenet hospitals and other clients nationwide. Almost all of the services comprising the operations of our Conifer segment are provided by Conifer Health Solutions, LLC, in which we own an interest of approximately 76%, or by one of its direct or indirect wholly owned subsidiaries.
Unless otherwise indicated, all financial and statistical information included in MD&A relates to our continuing operations, with dollar amounts expressed in millions (except per‑adjusted‑per adjusted admission and per‑adjusted‑patient‑per adjusted patient day amounts). Continuing operations information includes, with respect to our Hospital Operations segment, the results of our same 60 hospitals operated throughout the years ended December 31, 2022 and 2021, as well as the results of (1) PMC Fort Mill, which we opened in September 2022, (2) the five Miami-area hospitals and certain related operations (the “Miami Hospitals”) we sold in August 2021, (3) nearly 50 urgent care centers held in our Hospital Operations segment until their sale in April 2021 and (4) 24 imaging centers following their transfer from our Ambulatory Care segment to our Hospital Operations segment in April 2021. Continuing operations information for our Ambulatory Care segment includes the results of 40 urgent care centers held in this segment until their sale and the results of 24 imaging centers until their transfer to our Hospital Operations segment, both of which occurred in April 2021. Continuing operations information excludes the results of our hospitals and other businesses classified as discontinued operations for accounting purposes. We believe this informationpresentation is useful to investors because it includes the operations of all facilities in continuing operations for the entire time that we owned and operated them during the relevant period. In addition, continuing operations information reflects the impact of the addition or disposition of individual hospitals and other operations on our volumes, revenues and expenses. We present certain metrics as a percentage of
net operating revenues because a significant portion of our operating expenses are variable. In addition, we present certain metrics on a per‑adjusted‑admission and per‑adjusted‑patient‑day basis to show trends other than volume.
In certain cases, information presented in MD&A for our Hospital Operations segment is described as presented on a same‑hospital basis, which includes the results of our same 60 hospitals operated throughout the years ended December 31, 2022 and 2021, and excludes the results of PMC Fort Mill, the Miami Hospitals, all of the urgent care centers we sold in April 2021, the 24 imaging centers transferred from our Ambulatory Care segment to our Hospital Operations segment in April 2021, and our discontinued operations.basis. We present same‑hospital data because we believe it provides investors with useful information regarding the performance of our current portfolio of hospitals and other operations that are comparable for the periods presented. Furthermore, same‑hospital data may more clearly reflect recent trends we are experiencing with respect to volumes, revenues and expenses exclusive of variations caused by the addition or disposition of individual hospitals and other operations. Because
information presented on a same-hospital basis includes only those facilities operated throughout both periods, it will include a different mix of facilities depending upon the periods under comparison.
We present certain metrics as a percentage of net operating revenues because a significant portion of our operating expenses are variable, and we present certain metrics on a per adjusted admission and per adjusted patient day basis to show trends other than volume.
The financial information provided throughout this report, including our Consolidated Financial Statements and the notes thereto, has been prepared in conformity with accounting principles generally accepted in the United States of America (“GAAP”). However, we use certain non‑GAAP financial measures, including Adjusted EBITDA (as defined below), in this report and in communications with investors, analysts, rating agencies, banks and others to assist such parties in understanding the impact of various items on our financial statements. We use this information in our analysis of the performance of our business, excluding items we do not consider relevant to the performance of our continuing operations. In addition, we use these measures to define certain performance targets under our compensation programs.
“Adjusted EBITDA” is a non‑GAAP measure we define as net income available (loss attributable) to Tenet Healthcare Corporation common shareholders before (1) the cumulative effect of changes in accounting principle, (2) net loss attributable (income available) to noncontrolling interests, (3) income (loss) from discontinued operations, net of tax, (4) income tax benefit (expense), (5) gain (loss) from early extinguishment of debt, (6) other non‑operating income (expense), net, (7) interest expense, (8) litigation and investigation (costs) benefit, net of insurance recoveries, (9) net gains (losses) on sales, consolidation and deconsolidation of facilities, (10) impairment and restructuring charges and acquisition‑related costs, (11) depreciation and amortization, and (12) income (loss) from divested and closed businesses (i.e., health plan businesses). Litigation and investigation costs do not include ordinary course of business malpractice and other litigation and related expense.
We also present certain operational metrics and statistics in order to provide additional insight into our operational performance efficiency and to help investors better understand management’s view and strategic focus. We define these operational metrics and statistics as follows:
Adjusted admissions—represents actual admissions in the period adjusted to include outpatient services provided by facilities in our Hospital Operations segment by multiplying actual admissions by the sum of gross inpatient revenues and outpatient revenues and dividing the result by gross inpatient revenues;
Adjusted patient days—represents actual patient days in the period adjusted to include outpatient services provided by facilities in our Hospital Operations segment by multiplying actual patient days by the sum of gross inpatient revenues and outpatient revenues and dividing the result by gross inpatient revenues; and
Utilization of licensed beds—represents patient days divided by the number of days in the period divided by average licensed beds.
MANAGEMENT OVERVIEW
RECENT DEVELOPMENTS
Divestiture of Three South Carolina Hospitals—In January 2024, we completed the previously announced sale of three hospitals located in South Carolina and certain related operations (the “SC Hospitals”). We received pre‑tax proceeds of approximately $2.400 billion from this sale.
Definitive Agreement to Divest San Ramon Regional Medical Center—Sell Four California HospitalsIn—Also in January 2023,2024, we entered into a definitive agreement to sell our 51% ownership interest in San Ramon Regional Medical Centerfor the sale of four hospitals and certain related operations to John Muir Health. We expect thelocated in Orange County and Los Angeles County, California (the “OCLA Hospitals”). The transaction is expected to be completed in 2023,by early 2024, subject to customary regulatory approvals, clearances and customary closing conditions.
OPERATING ENVIRONMENT AND TRENDS
Ongoing Impact of the COVID-19 Pandemic—In 2022, the COVID‑19 pandemic continued to adversely impact our operations, as well as our patients, communities and employees, to varying degrees. As described in greater detail throughout MD&A, ongoing waves of COVID‑19 infections, changes in COVID‑related patient acuity and broad economic factors resulting from the pandemic affected our patient volumes, service mix, revenue mix, operating expenses and net operating revenues.
Various federal legislative actions, including additional funding for the Public Health and Social Services Emergency Fund (“PRF”), mitigated some of the adverse financial impacts of the COVID‑19 pandemic on our business. In the years ended December 31, 2022 and 2021, we received cash payments from the PRF and state and local grant programs totaling $196 million and $215 million, respectively, including $37 million received during 2021 by our unconsolidated affiliates for whom we provide cash management services. We recognized $194 million and $191 million from these funds as grant income during the years ended December 31, 2022 and 2021, respectively. In addition, we recognized $14 million in equity in earnings of unconsolidated affiliates in the accompanying Consolidated Statement of Operations during the year ended December 31, 2021 from grant funds.
Furthermore, throughout the pandemic, we have taken, and we continue to take, various actions to increase our liquidity and mitigate the impact of reductions in our patient volumes and changes in our service mix and revenue mix. As described in further detail in the Liquidity and Capital Resources section of MD&A, we issued new senior unsecured notes and senior secured first lien notes, redeemed existing senior unsecured notes and senior secured first lien notes, including those with the highest interest rate of all of our long‑term debt, and amended our senior secured revolving credit facility (as amended to date, the “Credit Agreement”). We also decreased our employee headcount throughout the organization at the outset of the COVID‑19 pandemic, and we deferred certain operating expenses that were not expected to impact our response to the pandemic. In addition, we reduced certain variable costs across the enterprise. Together with government relief packages, we believe these actions supported our ability to provide essential patient services during the initial uncertainty caused by the COVID‑19 pandemic and continue to do so.
The ultimate extent and scope of the pandemic and its future impact on our business remain unknown. For information about risks and uncertainties related to COVID‑19 that could affect our results of operations, financial condition and cash flows, see the Risk Factors section in Part I of this report.
Staffing and Labor Trends—We compete with other healthcare providers in recruiting and retaining qualified personnel responsible for the operation of our facilities. There is a limited availability of experienced medical support personnel nationwide, which drives up the wages and benefits required to recruit and retain employees. In particular, like others in the healthcare industry, we continue to experience a shortageshortages of advanced practice providers and critical‑care nurses in certain disciplines and geographic areas. The COVID‑19 pandemic exacerbated this shortagethese shortages as more employees chose to retire early, leave the workforce or take travel assignments. In addition, the Centers for Disease Control and Prevention has released data indicating that the 2022‑23 influenza season has thus far been more acute than in prior years compounded by concurrent
COVID‑19 surges and increases in other respiratory viral infections. In some areas, the increased demand for care of patients with COVID‑19, influenza and other respiratory viruses in our hospitals, as well as the direct impact of these illnesses on physicians, employees and their families, have put a strain on our resources and staff. Over the past several years, we have had to rely on higher-cost temporary and contract labor, which we compete with other healthcare providers to secure, and pay premiums above standard compensation for
essential workers. In general, compensation rates typically rise when overall case ratesAlthough we continue to incur a higher level of contract labor expense than we have historically, our recruitment and hospitalizations increase, whether dueretention efforts drove a reduction in this expense during the year ended December 31, 2023 as compared to COVID, flu or other illnesses.2022.
We also depend on the available labor pool of semi‑skilled and unskilled workers in each of the areas where we operate. In some of our communities, employers across various industries have increased their minimum wage, which has created more competition and, in some cases, higher labor costs for this sector of employees.
Supply-Chain Disruptions—Throughout the pandemic, Furthermore, we have experienced significant priceexpect that state‑mandated minimum wage increases in medical supplies, particularlyCalifornia will result in an increase in compensation costs for personal protective equipment (“PPE”), and we have encountered supply-chain disruptions, including shortages and delays. In addition, our Ambulatory Care segment has been impacted by shipment delays in construction materials and capital equipment with respect to its de novo facility development efforts, which are a key partcertain of our portfolio expansion strategy.employees and vendors beginning in 2024.
Inflation and Other General Economic Conditions—Our business has been impacted by the rise in inflation and its effects on elective procedures,salaries, wages and benefits, as well as other costs. OtherAdditional economic factors, including unemployment rates and consumer spending, affect our patient volumes, service mix and revenue mix and patient volumes.mix. Business closings and layoffs in the areas we operate may lead to increases in the uninsured and underinsured populations and adversely affect demand for our services, as well as the ability of patients to pay for services. Any increase in the amount of orsignificant deterioration in the collectability of patient accounts receivable could adversely affect our cash flows and results of operations.
Cybersecurity Incident—Medical supply prices remain high due to current economic conditions and other factors. In April 2022, we experiencedaddition, our Ambulatory Care segment continues to be impacted by shipment delays in construction materials and capital equipment with respect to its de novo facility development efforts, which are a cybersecurity incident that temporarily disrupted a subsetkey part of our acute care operationsportfolio expansion strategy. In general, supply chain operational challenges may continue or worsen in the future, whether due to geopolitical conflicts, inflationary pressures and involved the exfiltration of certain confidential company and patient information (the “Cybersecurity Incident”). During this time, our hospitals remained operational and continuedrecessionary environment, climate change, weather events or other issues yet to deliver patient care safely and effectively, utilizing well‑established back‑up processes. We immediately suspended user access to impacted information technology applications, executed extensive cybersecurity protection protocols, and took steps to restrict further unauthorized activity. Following the restoration of impacted information technology operations, we took additional measures to protect patient, employee and other data, as appropriate, in response to the Cybersecurity Incident.
Disruption from the Cybersecurity Incident placed pressure on our Hospital Operations segment’s volumes and earnings, particularly in April and May 2022. We estimate that the Cybersecurity Incident had an adverse pre‑tax impact of approximately $100 million. This estimate includes the costs to remediate the issues, lost revenues from the associated business interruption and other related expenses. We have insurance coverage and have filed a claim within our policy limits for these losses. We are unable to predict or control the timing or amount of insurance recoveries.emerge.
Industry Trends—We believe that several key trends are continuing to shape the demand for healthcare services: (1) consumers, employers and insurers are actively seeking lower‑cost solutions and better value as they focus more on healthcare spending; (2) patient volumes are shifting from inpatient to outpatient settings due to technological advancements and demand for care that is more convenient, affordable and accessible; (3) the growing aging population requires greater chronic disease management and higher‑acuity treatment; and (4) consolidation continues across the entire healthcare sector. Furthermore, the healthcare industry, in general, and the acute care hospital business, in particular, continue to be subject to significant regulatory uncertainty. Changes in federal or state healthcare laws, regulations, funding policies or reimbursement practices, especially those involving reductions to government payment rates, could have a significant impact on our future revenues and operations.expenses.
Ongoing Impact of the COVID-19 Pandemic—Variations in the prevalence of COVID‑19 infections and related patient acuity continued to adversely impact our patient volumes, service mix, revenue mix, operating expenses and net operating revenues in the affected areas during the year ended December 31, 2023. Due to the regional nature of surges, some areas within our network faced heightened challenges while others were able to operate under more normalized conditions. Despite these challenges, we experienced strong patient volume growth overall in our Hospital Operations and Ambulatory Care segments during the year ended December 31, 2023, which we attribute in part to patient care deferred in prior years due to the COVID-19 pandemic.
We have taken a number of actions over the past several years to increase our liquidity and mitigate the impact of fluctuations in our patient volumes and in our service and revenue mix. Moreover, various federal legislative actions, including additional funding for the Public Health and Social Services Emergency Fund (collectively, the “COVID Acts”), during the public health emergency that began in January 2020 mitigated some of the adverse financial impacts of the COVID‑19 pandemic on our business. During the years ended December 31, 2023 and 2022, we received cash payments from COVID‑19 relief programs totaling $10 million and $196 million, respectively, and recognized grant income of $16 million and $194 million, respectively. The public health emergency for the COVID‑19 pandemic ended on May 11, 2023.
We cannot predict the future course and impacts of COVID-19, or the potential emergence and effects of a future pandemic, epidemic or outbreak of an infectious disease, on our operations, financial condition or liquidity. For information about related risks and uncertainties, see the Risk Factors section in Part I of this report.
STRATEGIES
Expanding Our Ambulatory Care Segment—We continue to focus on opportunities to expand our Ambulatory Care segment through acquisitions, organic growth, construction of new outpatient centers and strategic partnerships. We believe USPI’s ASCs and surgical hospitals offer many advantages to patients and physicians, including greater affordability, predictability, flexibility and convenience. Moreover, due in part to advancements in surgical techniques, medical technology
and anesthesia, as well as the lower cost structure and greater efficiencies that are attainable at a specialized outpatient site, we believe the volume and complexity of surgical cases performed in an outpatient setting will continue to increase over time. Historically, our outpatient services have generated significantly higher margins for us than inpatient services.
During the years ended December 31, 20222023 and 2021,2022, we invested $264$172 million and $1.315 billion,$264 million, respectively, to acquire ownership interests in new ASCs, increase our ownership interests in existing facilities and invest in de novo facilities. In December 2021, USPI entered into a joint venture and development agreement with SurgCenter Development (“SCD”) under which USPI has the exclusive option to partner with affiliates of SCD on the future development of a minimum target of 50 de novo ASCs through December 2026. In July 2022, USPI formed a joint venture with United Urology Group (“UUG”) and acquired ownership interests in 22 ASCs (three of which were then in development). Including these UUG facilities, duringDuring the year ended December 31, 2022,2023, we added 37 fully operational ASCs to our portfolio through acquisitions of majority and minority ownership interests and opened 15 de novo facilities, including two ASCs acquired from UUG while in the development stage. Also during 2022, we increased ourcontrolling ownership interests in 2320 ASCs in which allowedwe did not have a previous investment, and we opened nine de novo ASCs. We also continue to prioritize increasing our investment in our unconsolidated facilities. During the year ended December 31, 2023, we acquired controlling ownership interests in 11 previously unconsolidated ASCs, allowing us to consolidate their financial results.
Driving Growth in Our Hospital Systems—We remain committed to better positioning our hospital systems and competing more effectively in the ever‑evolving healthcare environment by focusing on driving performance through operational effectiveness, increasing capital efficiency and margins, investing in our physician enterprise, particularly our specialist network, enhancing patient and physician satisfaction, growing our higher‑demand and higher‑acuity clinical service lines (including outpatient lines), expanding patient and physician access, and optimizing our portfolio of assets. Over the past several years, we have undertaken enterprise‑wide cost-efficiencycost‑efficiency measures, and we continue to transition certain support operations to our Global Business Center (“GBC”) in the Philippines. We incurred restructuring charges in conjunction with these initiatives in the year ended December 31, 2022,2023, and we could incur additional restructuring charges in the future.
We regularly review the marginal costs of providing certain services, andFrom time to time, we use analyticsalso capitalize on opportunities to manage our operations and make staffing decisions. We also exit service lines, businesses and markets that we believe are no longer a core part of our long‑term growth and synergy strategies. In April 2021, we divested the majority of our urgent care centers operated under the MedPost and CareSpot brands by our Hospital Operations and Ambulatory Care segments. In addition, we completed the sale of the Miami Hospitals in August 2021. We intend to further refine our portfolio of hospitals and other healthcare facilities when we believe such refinements will help us improve profitability, allocate capital more effectively in areas where we have a stronger presence, deploy proceeds on higher‑returnhigher-return investments across our business, enhance cash flow generation and reduce our debt, among other things. In November 2023, we entered into a definitive agreement to sell the SC Hospitals, and lower our ratiothat transaction closed on January 31, 2024. We received pre‑tax proceeds of debt‑to‑Adjusted EBITDA.approximately $2.400 billion from this sale. Also in January 2024, we entered into a definitive agreement for the sale of the OCLA Hospitals; the transaction is expected to be completed by early 2024, subject to customary regulatory approvals, clearances and closing conditions.
We also seek advantageous opportunities to grow our portfolio of hospitals and other healthcare facilities. In September 2022, we opened Piedmont Medical Center Fort Mill (“PMC Fort Mill Hospital”), a new acute care hospital located in South Carolina. This 100‑bed facility includes an emergency department, multi‑specialty operating rooms, an intensive care unit, and labor and delivery rooms. In addition, we broke ground on a new medical campus located in the Westover Hills area of San Antonio, Texas, in 2022. The campus, which is currently on schedule for completion in mid‑2024, is expected to include a 104‑bed acute care hospital, an ASC and medical office space. During 2023, we broke ground on a new medical campus located in Port St. Lucie, Florida, that is expected to include a 54‑bed hospital, as well as medical office space. We expect to complete construction of the Port St. Lucie medical campus in late 2025. Also, in December 2023, we completed a joint venture transaction with NextCare, Inc. (“NextCare”) and certain of its affiliates. Through this transaction, we acquired ownership interests in 56 fully operational UCCs and one telehealth center in Arizona.
Improving the Customer Care Experience—As consumers continue to become more engaged in managing their health, we recognize that understanding what matters most to them and earning their loyalty is imperative to our success. As such, we have enhanced our focus on treating our patients as traditional customers by: (1) establishing networks of physicians and facilities that provide convenient access to services across the care continuum; (2) expanding service lines aligned with growing community demand, including a focus on aging and chronic disease patients; (3) offering greater affordability and predictability, including simplified registration and discharge procedures, particularly in our outpatient centers; (4) improving our culture of service; and (5) creating health and benefit programs, patient education and health literacy materials that are customized to the needs of the communities we serve. Through these efforts, we intend to improve the customer care experience in every part of our operations.
Driving Conifer’s Growth—Conifer serves approximately 660 Tenet and non‑Tenet hospitals and other clients nationwide. In addition to providing revenue cycle management services to health systems and physicians, Conifer provides support to both providers and self‑insured employers seeking assistance with clinical integration, financial risk management and population health management. We believe that our success in growing Conifer and increasing its profitability depends in part on our success in executing the following strategies: (1) attracting hospitals and other healthcare providers that currently handle their revenue cycle management processes internally as new clients; (2) generating new client relationships through opportunities from USPI and Tenet’s acute care hospital acquisition and divestiture activities; (3) expanding revenue cycle management and value‑based care service offerings through organic development and small acquisitions; (4) leveraging data from tens of millions of patient interactions for continued enhancement of the value‑based care environment to drive competitive differentiation; and (5) maximizing opportunities through automation and offshoring to improve the effectiveness and efficiency of Conifer’s services.
Improving Profitability—We continue to focus on growing patient volumes and effective cost management as a means to improve profitability. Our inpatient admissions have been constrained in recent years by the COVID‑19 pandemic, increased competition, utilization pressure by managed care organizations, new delivery models that are designed to lower the utilization of acute care hospital services, the effects of higher patient co‑pays, co‑insurance amounts and deductibles, changing consumer
behavior, and adverse economic conditions and demographic trends in certain areas where we operate. Our business has also been impacted by the rise in inflation and its effects on elective procedures,salaries, wages, benefits and other costs. However, we also believe that emphasis on higher‑demand clinical service lines (including outpatient services), focus on expanding our ambulatory care business, cultivation of our culture of service, participation in Medicare Advantage health plans that have been experiencing higher growth rates than traditional Medicare, and contracting strategies that create shared value with payers should help us grow our patient volumes over time. We are also continuing to pursue new opportunities to enhance efficiency, including
further integration of enterprise‑wide centralized support functions, outsourcing additional functions unrelated to direct patient care, and reducing clinical and vendor contract variation.
Reducing Our Leverage Over Time—All of our long‑term debt has a fixed rate of interest, except for outstanding borrowings if any, under our Credit Agreement, andsenior secured revolving credit facility (as amended to date, the “Credit Agreement”), of which we had none at December 31, 2023. In addition, the maturity dates of our notes are staggered from 20242026 through 2031. We believe that our capital structure helps to minimize the near‑term impact of increased interest rates, and the staggered maturities of our debt allow us to retire or refinance our debt over time. It remains our long‑term objective to reduce our debt and lower our ratio of debt‑to‑Adjusted EBITDA, primarily through more efficient capital allocation and Adjusted EBITDA growth, which should lower our refinancing risk.
During the year ended December 31, 2022,In May 2023, we redeemed or repurchased $2.597issued $1.350 billion aggregate principal amount of our6.750% senior secured first lien and senior unsecured notes, which will mature in advance of their maturity dates.May 2031 (the “2031 Senior Secured First Lien Notes”). We financed these transactions using a substantial portion ofused the proceeds from ourthis issuance, together with cash on hand, to finance the redemption of $2.000 billionall $589 million aggregate principal amount then-outstanding of 6.125%our 4.625% senior secured first lien notes due 2030September 2024 (the “2030“September 2024 Senior Secured First Lien Notes”) and cash on hand.all $756 million aggregate principal amount then-outstanding of our 4.625% senior secured first line notes due July 2024 (the “July 2024 Senior Secured First Lien Notes”) in May and June 2023, respectively.
Repurchasing Stock—In October 2022, our board of directors authorized the repurchase of up to $1 billion of our common stock through a share repurchase program. Repurchases will be made in accordance with applicable securities laws and may be made at management’s discretion from time to time in open-market or privately negotiated transactions, subject to market conditions and other factors. The share repurchase program does not obligate us to acquire any particular amount of common stock, and it may be suspended for periods or discontinued at any time before its scheduled expiration date of December 31, 2024. We paid approximately $200 million to repurchase a total of 3,112 thousand shares during the year ended December 31, 2023, or an average of $64.27 per share, and we paid approximately $250 million to repurchase a total of 5,888,8415,889 thousand shares during the period from the commencement of the program throughyear ended December 31, 2022, or an average of $42.45 per share.
Our ability to execute on our strategies and respond to the aforementioned trends in the current operating environment is subject to numerous risks and uncertainties, all of which may cause actual results to be materially different from expectations. For information about risks and uncertainties that could affect our results of operations, see the Forward‑Looking Statements and Risk Factors sections in Part I of this report.
RECENT RESULTS OF OPERATIONS
For the purpose of comparing our results of operations for the three months ended December 31, 2023 and 2022, continuing operations information for our Hospital Operations segment includes the results of our same 60 hospitals operated throughout the three‑month periods in 2023 and 2022, as well as the results of our PMC Fort Mill Hospital, and excludes the results of our hospitals and other businesses classified as discontinued operations for accounting purposes during those periods.
The following table presents selected operating statistics for our Hospital Operations and Ambulatory Care segments on a continuing operations basis:
| | | | | Three Months Ended December 31, | | Increase
(Decrease) | | | Three Months Ended December 31, | | Increase
(Decrease) |
| 2022 | | 2021 | |
| | 2023 | |
| Hospital Operations – hospitals and related outpatient facilities: | |
| Hospital Operations – hospitals and related outpatient facilities: | |
| Hospital Operations – hospitals and related outpatient facilities: | Hospital Operations – hospitals and related outpatient facilities: | | | | | | | |
| Number of hospitals (at end of period) | Number of hospitals (at end of period) | | 61 | | | 60 | | | 1 | | (1) |
| Number of hospitals (at end of period) | |
| Number of hospitals (at end of period) | | | 61 | | | 61 | | | — | | (1) |
| Total admissions | Total admissions | | 135,151 | | | 133,809 | | | 1.0 | % | |
Adjusted admissions(2) | | 249,489 | | | 241,008 | | | 3.5 | % | |
| Adjusted admissions | |
| Adjusted admissions | |
| Adjusted admissions | |
| Paying admissions (excludes charity and uninsured) | |
| Paying admissions (excludes charity and uninsured) | |
| Paying admissions (excludes charity and uninsured) | Paying admissions (excludes charity and uninsured) | | 128,505 | | | 127,092 | | | 1.1 | % | |
| Charity and uninsured admissions | Charity and uninsured admissions | | 6,646 | | | 6,717 | | | (1.1) | % | |
| Charity and uninsured admissions | |
| Charity and uninsured admissions | |
| Admissions through emergency department | |
| Admissions through emergency department | |
| Admissions through emergency department | Admissions through emergency department | | 102,163 | | | 99,772 | | | 2.4 | % | |
| Emergency department visits, outpatient | Emergency department visits, outpatient | | 583,457 | | | 531,737 | | | 9.7 | % | |
| Emergency department visits, outpatient | |
| Emergency department visits, outpatient | |
| Total emergency department visits | |
| Total emergency department visits | |
| Total emergency department visits | Total emergency department visits | | 685,620 | | | 631,509 | | | 8.6 | % | |
| Total surgeries | Total surgeries | | 86,613 | | | 88,504 | | | (2.1) | % | |
| Total surgeries | |
| Total surgeries | |
| Patient days — total | Patient days — total | | 704,073 | | | 713,947 | | | (1.4) | % | |
Adjusted patient days(2) | | 1,250,797 | | | 1,253,882 | | | (0.2) | % | |
| Patient days — total | |
| Patient days — total | |
| Adjusted patient days | |
| Adjusted patient days | |
| Adjusted patient days | |
| Average length of stay (days) | |
| Average length of stay (days) | |
| Average length of stay (days) | Average length of stay (days) | | 5.21 | | | 5.34 | | | (2.4) | % | |
| Average licensed beds | Average licensed beds | | 15,472 | | | 15,379 | | | 0.6 | % | |
Utilization of licensed beds(3) | | 49.5 | % | | 50.5 | % | | (1.0) | % | (1) |
| Average licensed beds | |
| Average licensed beds | |
| Utilization of licensed beds | |
| Utilization of licensed beds | |
| Utilization of licensed beds | | | 48.7 | % | | 49.5 | % | | (0.8) | % | (1) |
| Total visits | Total visits | | 1,413,064 | | | 1,451,683 | | | (2.7) | % | |
| Paying visits (excludes charity and uninsured) | Paying visits (excludes charity and uninsured) | | 1,327,738 | | | 1,364,789 | | | (2.7) | % | |
| Paying visits (excludes charity and uninsured) | |
| Paying visits (excludes charity and uninsured) | |
| Charity and uninsured visits | |
| Charity and uninsured visits | |
| Charity and uninsured visits | Charity and uninsured visits | | 85,326 | | | 86,894 | | | (1.8) | % | |
| Ambulatory Care: | Ambulatory Care: | |
| Ambulatory Care: | |
| Ambulatory Care: | |
| Total consolidated facilities (at end of period) | |
| Total consolidated facilities (at end of period) | |
| Total consolidated facilities (at end of period) | Total consolidated facilities (at end of period) | | 308 | | | 257 | | | 51 | | (1) | | 330 | | | 308 | | 308 | | | 22 | | 22 | | (1) | (1) |
| Total consolidated cases | Total consolidated cases | | 363,551 | | | 308,402 | | | 17.9 | % | |
| | | | | | | | |
| | |
| (1) | The change is the difference between the 2023 and 2022 and 2021 amounts shown.presented. |
| (2) | Adjusted admissions/patient days represents actual admissions/patient days adjusted to include outpatient services provided by facilities in our Hospital Operations segment by multiplying actual admissions/patient days by the sum of gross inpatient revenues and outpatient revenues and dividing the results by gross inpatient revenues.
| (3) | Utilization of licensed beds represents patient days divided by number of days in the period divided by average licensed beds.
Total admissions increased by 1,342,1,705, or 1.0%1.3%, total surgeries increased by 295, or 0.3%, and total emergency department visits decreased by 20,650, or 3.0%, in the three months ended December 31, 20222023 compared to the three months ended December 31, 2021, primarily due to elevated volumes of influenza cases and the opening of our new PMC Fort Mill hospital in September 2022. Also during the 2022 period, total emergency department visits increased by 8.6%, due in part to the same factors. Total surgeries decreased by 1,891, or 2.1%, during the three‑month period in 2022 compared to the same period in 2021. The increase in our Ambulatory Care segment’s total consolidated cases of 17.9%14.5% in the three months ended December 31, 2022,2023, as compared to the same period in 2021, is2022, was primarily attributable to incremental case volume from our recently acquired ASCs.ASCs and same‑facility case growth, partially offset by the impact of the closure and deconsolidation of certain facilities.
The following table presents net operating revenues by segment on a continuing operations basis:
| | | | | | | | | | | | | | | | | | | | | |
| | | Three Months Ended December 31, | | Increase
(Decrease) | |
| | 2022 | | 2021 | | |
| Net operating revenues: | | | | | | | |
| Hospital Operations prior to inter-segment eliminations | | $ | 3,840 | | | $ | 3,910 | | | (1.8) | % | |
| Ambulatory Care | | 933 | | | 742 | | | 25.7 | % | |
| Conifer | | 326 | | | 324 | | | 0.6 | % | |
| Inter-segment eliminations | | (109) | | | (120) | | | (9.2) | % | |
| Total | | $ | 4,990 | | | $ | 4,856 | | | 2.8 | % | |
| | | | | | | | | | | | | | | | | | | | | |
| | | Three Months Ended December 31, | | Increase
(Decrease) | |
| | 2023 | | 2022 | | |
| | | | | | | |
| Hospital Operations | | $ | 4,302 | | | $ | 4,057 | | | 6.0 | % | |
| Ambulatory Care | | 1,077 | | | 933 | | | 15.4 | % | |
| | | | | | | |
| | | | | | | |
| Total | | $ | 5,379 | | | $ | 4,990 | | | 7.8 | % | |
Consolidated net operating revenues increased by $134$389 million, or 2.8%7.8%, in the three months ended December 31, 20222023 compared to the same period in 2021. Our2022. The increase of $245 million, or 6.0%, in our Hospital Operations segment’s net operating revenues priorduring the 2023 period was primarily due to inter‑a more favorable payer mix, negotiated commercial rate increases, higher patient volumes and acuity, and favorable Medicaid supplemental revenue adjustments totaling $52 million. Net operating revenues in our Ambulatory Care segment eliminations for the three‑month period in 2022 decreased $70increased by $144 million, or 1.8%15.4%, in the three months ended December 31, 2023 compared to the same period in 2021.2022. This decreasechange was primarily due to lower COVID-related patient volumesdriven by our recently acquired ASCs, an increase in case volume and acuity, lower surgical volumes and a shorter average length of patient stay,higher net revenue per case, partially offset by higher adjusted admissionsthe impact of the closure and improved pricing yield. Net operating
revenues in our Ambulatory Care segment increased $191 million, or 25.7%, in the three months ended December 31, 2022 compared to the three months ended December 31, 2021. This increase was mainly driven by our recently acquired ASCs, improved case volumes, incremental revenue from new service lines and negotiated commercial rate increases. Conifer’s revenues, netdeconsolidation of inter‑segment eliminations, increased $13 million, or 6.4%, during the three months ended December 31, 2022 compared to the same period in 2021, primarily due to contractual rate increases and new business expansion.certain facilities. During the three months ended December 31, 20222023 and 2021,2022, we recognized grant income of $40$2 million and $138$40 million, respectively, which amounts are not included in net operating revenues.
Our accounts receivable days outstanding (“AR Days”) from continuing operations were 58.355.4 days and 57.058.3 days at December 31, 20222023 and 2021,2022, respectively. Our AR Days target is less than 55 days. AR Days are calculated as our accounts receivable from continuing operations on the last date in the quarter divided by our net operating revenues from continuing operations for the quarter ended on that date divided by the number of days in the quarter. This calculation includes our Hospital Operations segment’s contract assets. The AR Days calculationassets and excludes (1) urgent care centers operated under the MedPost and CareSpot brands, which we divested in April 2021, (2) the Miami Hospitals, which we sold in August 2021, and (3) our California provider fee revenues.
The following table provides information about selected operating expenses by segment on a continuing operations basis:
| | | | | Three Months Ended December 31, | | Increase
(Decrease) | | | Three Months Ended December 31, | | Increase
(Decrease) |
| 2022 | | 2021 | |
| | 2023 | |
| Hospital Operations: | |
| Hospital Operations: | |
| Hospital Operations: | Hospital Operations: | | | | | | | | |
| Salaries, wages and benefits | Salaries, wages and benefits | | $ | 1,914 | | | $ | 1,841 | | | 4.0 | % | Salaries, wages and benefits | | $ | 2,060 | | | $ | | $ | 2,087 | | | (1.3) | | (1.3) | % |
| Supplies | Supplies | | 612 | | | 649 | | | (5.7) | % | Supplies | | 648 | | | 613 | | 613 | | | 5.7 | | 5.7 | % |
| Other operating expenses | Other operating expenses | | 847 | | | 875 | | | (3.2) | % | Other operating expenses | | 1,052 | | | 909 | | 909 | | | 15.7 | | 15.7 | % |
| Total | Total | | $ | 3,373 | | | $ | 3,365 | | | 0.2 | % | Total | | $ | 3,760 | | | $ | | $ | 3,609 | | | 4.2 | | 4.2 | % |
| Ambulatory Care: | Ambulatory Care: | | | | | | | Ambulatory Care: | | |
| Salaries, wages and benefits | Salaries, wages and benefits | | $ | 219 | | | $ | 178 | | | 23.0 | % | Salaries, wages and benefits | | $ | 255 | | | $ | | $ | 219 | | | 16.4 | | 16.4 | % |
| Supplies | Supplies | | 247 | | | 188 | | | 31.4 | % | Supplies | | 283 | | | 247 | | 247 | | | 14.6 | | 14.6 | % |
| Other operating expenses | Other operating expenses | | 123 | | | 94 | | | 30.9 | % | Other operating expenses | | 144 | | | 123 | | 123 | | | 17.1 | | 17.1 | % |
| Total | Total | | $ | 589 | | | $ | 460 | | | 28.0 | % | Total | | $ | 682 | | | $ | | $ | 589 | | | 15.8 | | 15.8 | % |
| Conifer: | |
| | Total: | |
| | Total: | |
| | Total: | |
| Salaries, wages and benefits | Salaries, wages and benefits | | $ | 173 | | | $ | 169 | | | 2.4 | % |
| Supplies | | 1 | | | 1 | | | — | % |
| Other operating expenses | | 62 | | | 60 | | | 3.3 | % |
| Total | | $ | 236 | | | $ | 230 | | | 2.6 | % |
| Total: | |
| Salaries, wages and benefits | |
| Salaries, wages and benefits | Salaries, wages and benefits | | $ | 2,306 | | | $ | 2,188 | | | 5.4 | % | | $ | 2,315 | | | $ | | $ | 2,306 | | | 0.4 | | 0.4 | % |
| Supplies | Supplies | | 860 | | | 838 | | | 2.6 | % | Supplies | | 931 | | | 860 | | 860 | | | 8.3 | | 8.3 | % |
| Other operating expenses | Other operating expenses | | 1,032 | | | 1,029 | | | 0.3 | % | Other operating expenses | | 1,196 | | | 1,032 | | 1,032 | | | 15.9 | | 15.9 | % |
| Total | Total | | $ | 4,198 | | | $ | 4,055 | | | 3.5 | % | Total | | $ | 4,442 | | | $ | | $ | 4,198 | | | 5.8 | | 5.8 | % |
Rent/lease expense(1): | Rent/lease expense(1): | | | | | | | Rent/lease expense(1): | | |
| Hospital Operations | Hospital Operations | | $ | 69 | | | $ | 71 | | | (2.8) | % | Hospital Operations | | $ | 70 | | | $ | | $ | 71 | | | (1.4) | | (1.4) | % |
| Ambulatory Care | Ambulatory Care | | 31 | | | 25 | | | 24.0 | % | Ambulatory Care | | 35 | | | 31 | | 31 | | | 12.9 | | 12.9 | % |
| Conifer | | 2 | | | 2 | | | — | % |
| | Total | Total | | $ | 102 | | | $ | 98 | | | 4.1 | % |
| Total | |
| Total | | | $ | 105 | | | $ | 102 | | | 2.9 | % |
| | | | | | | | |
| | |
| (1) | Included in other operating expenses. |
The following table provides information about our Hospital Operations segment’s selected operating expenses per adjusted admission on a continuing operations basis:
| | | | | | | | | | | | | | | | | | | | |
| | | Three Months Ended December 31, | | Increase
(Decrease) |
| | 2022 | | 2021 | |
| Hospital Operations: | | | | | | |
Salaries, wages and benefits per adjusted admission(1) | | $ | 7,670 | | | $ | 7,634 | | | 0.5 | % |
Supplies per adjusted admission(1) | | 2,447 | | | 2,692 | | | (9.1) | % |
Other operating expenses per adjusted admission(1) | | 3,407 | | | 3,632 | | | (6.2) | % |
| Total per adjusted admission | | $ | 13,524 | | | $ | 13,958 | | | (3.1) | % |
| | | | | | | | |
| | |
(1) | Adjusted admissions represents actual admissions adjusted to include outpatient services provided by facilities in our Hospital Operations segment by multiplying actual admissions by the sum of gross inpatient revenues and outpatient revenues and dividing the results by gross inpatient revenues. |
| | | | | | | | | | | | | | | | | | | | |
| | | Three Months Ended December 31, | | Increase
(Decrease) |
| | 2023 | | 2022 | |
| Hospital Operations: | | | | | | |
| Salaries, wages and benefits per adjusted admission | | $ | 8,234 | | | $ | 8,364 | | | (1.6) | % |
| Supplies per adjusted admission | | 2,586 | | | 2,452 | | | 5.5 | % |
| Other operating expenses per adjusted admission | | 4,197 | | | 3,653 | | | 14.9 | % |
| Total per adjusted admission | | $ | 15,017 | | | $ | 14,469 | | | 3.8 | % |
Salaries, wages and benefits expense for our Hospital Operations segment increased $73decreased $27 million, or 4.0%1.3%, in the three months ended December 31, 20222023 compared to the same period in 2021.2022. This increasedecrease was primarily attributable to higherlower contract labor expense in the three months ended December 31, 2023, partially offset by increased employee benefits expense, higher recruiting and premium payretention costs, due to the pandemic, and annual merit increases for certain of our employees. These factors were partially offset by lower employee benefit costs and our continued focus on cost‑efficiency measures. On a per‑adjusted‑admission basis, Hospital Operations salaries, wages and benefits expense increased 0.5%decreased 1.6% in the three months ended December 31, 20222023 compared to the three months ended December 31, 2021.2022.
Supplies expense for our Hospital Operations segment decreased $37increased $35 million, or 5.7%, during the three months ended December 31, 20222023 compared to the three months ended December 31, 2021.2022. This decreaseincrease was primarily attributable to lower COVID-relateddriven by higher patient volumes and acuity, decreased surgical volumes and our cost‑efficiency measures. These factors were partially offset by increased costs for certain supplies due to the COVID-19 pandemic,as well as the impact of general market conditions and inflation.on prices for supplies. On a per‑adjusted‑admission
basis, supplies expense decreased 9.1%increased 5.5% in the three months ended December 31, 20222023 compared to the three months ended December 31, 20212022 due to the aforementioned factors.
Other operating expenses for our Hospital Operations segment decreased $28increased $143 million, or 3.2%15.7%, in the three months ended December 31, 20222023 compared to the same period in 2021. This decrease2022. The change was primarily dueattributable to decreased costs associated with funding indigent care services by certainan increase of our hospitals (which costs were substantially offset by reduced net patient revenues)$40 million in medical fees and lowerhigher malpractice expense.expense of $18 million in the 2023 period. On a per‑adjusted‑admission basis, other operating expenses in the three months ended December 31, 2022 decreased 6.2%2023 increased 14.9% compared to the three months ended December 31, 2021,2022, primarily due to the factors described above, as well as increased adjusted admissions that reduce this cost metric due to various fixed costs in other operating expenses.above.
LIQUIDITY AND CAPITAL RESOURCES OVERVIEW
Cash and cash equivalents were $858 million$1.228 billion at December 31, 20222023 compared to $1.208$1.054 billion at September 30, 2022.2023.
Significant cash flow items in the three months ended December 31, 20222023 included:
•Net cash provided by operating activities before interest, taxes, discontinued operations, impairment and restructuring charges, and acquisition‑related costs, and litigation costs and settlements of $738 million, including $41 million received from federal and state grants, and a $128 million payment$1.197 billion;
•Interest payments of payroll taxes deferred during 2020;$293 million;
•Capital expenditures of $290$208 million;
•Interest payments of $247 million;
•$128169 million of distributions paid to noncontrolling interests;
•Payments totaling $57of $114 million for restructuring charges, acquisition‑related costs, and litigation costs and settlements;
•Purchasespurchases of noncontrolling interests of $39 million;
•Purchases of marketable securities and equity investments of $24 million;
•Debt payments of $65 million, including an aggregate total of $24 million cash to retire portions of our 4.625% senior secured first lien notes due in July 2024 (our “July 2024 Senior Secured First Lien Notes”) and September 2024 (our “September 2024 Senior Secured First Lien Notes”);businesses or joint ventures; and
•$250110 million of payments to purchase nearly six million1,626 thousand shares of our common stock under theour share repurchase program.
Net cash provided by operating activities was $2.374 billion in the year ended December 31, 2023 compared to $1.083 billion in the year ended December 31, 2022 compared to $1.568 billion in the year ended December 31, 2021.2022. Key factors contributing to the change between 2023 and 2022 and 2021 includeincluded the following:
•$880 million ofNo Medicare advances recouped or repaid in the year ended December 31, 2023 compared to $880 million recouped or repaid during 2022;
•A $128 million payment of payroll taxes deferred pursuant to COVID-19 legislation in 2022 compared to $512 million during 2021;none in 2023;
•$19610 million of cash received from pandemic-related grant programs in 2022during 2023 compared to $178$196 million received in 2021;
•Lower interest payments of $89 million in 2022;
•Higher incomeIncome tax payments of $69that were $82 million higher in 2023 than in 2022;
•An increase of $61$60 million less in payments forrelated to restructuring charges, acquisition‑related costs, and litigation costs and settlements in 2022;2023; and
•The timing of other working capital items.
SOURCES OF REVENUE FOR OUR HOSPITAL OPERATIONS SEGMENT
We earn revenues for patient services from a variety of sources, primarily managed care payers and the federal Medicare program, as well as state Medicaid programs, indemnity‑based health insurance companies and uninsured patients.patients (that is, patients who do not have health insurance and are not covered by some other form of third‑party arrangement).
The following table presents the sources of net patient service revenues for our hospitals and related outpatient facilities, expressed as percentages of net patient service revenues from all sources:sources on a continuing operations basis:
| | | | | Years Ended December 31, | | | Years Ended December 31, |
| 2022 | | 2021 | | 2020 |
| | 2023 | | | | 2023 | | 2022 | | 2021 |
| Medicare | Medicare | | 17.1 | % | | 17.7 | % | | 19.8 | % | Medicare | | 16.4 | % | | 17.1 | % | | 17.7 | % |
| Medicaid | Medicaid | | 6.8 | % | | 8.5 | % | | 7.9 | % | Medicaid | | 8.5 | % | | 7.7 | % | | 8.5 | % |
Managed care(1) | Managed care(1) | | 70.3 | % | | 67.7 | % | | 66.3 | % | Managed care(1) | | 70.4 | % | | 69.4 | % | | 67.7 | % |
| Uninsured | Uninsured | | 1.0 | % | | 1.3 | % | | 1.2 | % | Uninsured | | 0.6 | % | | 1.0 | % | | 1.3 | % |
| Indemnity and other | Indemnity and other | | 4.8 | % | | 4.8 | % | | 4.8 | % | Indemnity and other | | 4.1 | % | | 4.8 | % | | 4.8 | % |
| | | | | | | | |
| | |
| (1) | Includes Medicare and Medicaid managed care programs. |
Revenues related to the Texas Comprehensive Hospital Increase Reimbursement Program (“CHIRP”) are presented in managed care net patient service revenues in the table above. Amounts we were assessed to support CHIRP following its approval in 2022 were presented in Medicaid revenues in prior periods, but have been reclassified to managed care revenues to conform to the current‑year presentation in the same payer group as the revenues to more clearly reflect the results of our participation in this program. Assessments to support CHIRP totaled $126 million and $123 million during the years ended December 31, 2023 and 2022, respectively.
Our payer mix on an admissions basis for our hospitals, expressed as a percentage of total admissions from all sources on a continuing operations basis, is presented below:
| | | | | Years Ended December 31, | | | Years Ended December 31, |
| 2022 | | 2021 | | 2020 |
| | 2023 | | | | 2023 | | 2022 | | 2021 |
| Medicare | Medicare | | 20.7 | % | | 20.8 | % | | 22.8 | % | Medicare | | 19.9 | % | | 20.7 | % | | 20.8 | % |
| Medicaid | Medicaid | | 5.4 | % | | 5.8 | % | | 6.2 | % | Medicaid | | 5.0 | % | | 5.4 | % | | 5.8 | % |
Managed care(1) | Managed care(1) | | 65.8 | % | | 64.4 | % | | 61.8 | % | Managed care(1) | | 67.3 | % | | 65.8 | % | | 64.4 | % |
| Charity and uninsured | Charity and uninsured | | 4.9 | % | | 5.8 | % | | 6.3 | % | Charity and uninsured | | 4.5 | % | | 4.9 | % | | 5.8 | % |
| Indemnity and other | Indemnity and other | | 3.2 | % | | 3.2 | % | | 2.9 | % | Indemnity and other | | 3.3 | % | | 3.2 | % | | 3.2 | % |
| | | | | | | | |
| | |
| (1) | Includes Medicare and Medicaid managed care programs. |
Our hospitals and outpatient facilities are subject to various factors that affect our service mix, revenue mix and patient volumes and, thereby, impact our net patient service revenues and results of operations. These factors include, among others, changes in federal, state and statelocal healthcare and business regulations; the business environment,changes in general, economic conditions (including inflationary pressures)nationally and demographics of local communities in which we operate;regionally, including inflation; the number of uninsured and underinsured individuals in local communities treated at our hospitals; disease hotspots and seasonal cycles of illness; climate and weather conditions; physician recruitment, satisfaction, retention and attrition; advances in technology and treatments that reduce length of stay;stay or permit procedures to be performed in an outpatient rather than an inpatient setting; local healthcare
competitors; utilization pressure by managed care organizations, as well as managed care contract negotiations or terminations; hospital performance data on quality measures and patient satisfaction, as well as standard charges for services; any unfavorable publicity about us, or our joint venture partners, that impacts our relationships with physicians and patients; and changing consumer behavior, including with respect to the timing of elective procedures.
GOVERNMENT PROGRAMS
The Centers for Medicare & Medicaid Services (“CMS”) is an agency of the U.S. Department of Health and Human Services (“HHS”) that administers a number of government programs authorized by federal law; it is the single largest payer of healthcare services in the United States. Medicare is a federally funded health insurance program primarily for individuals 65 years of age and older, as well as some younger people with certain disabilities and conditions, and is provided without regard to income or assets. Medicaid is co‑administered by the states and is jointly funded by the federal government and state governments. Medicaid is the nation’s main public health insurance program for people with low incomes and is the largest source of health coverage in the United States. The Children’s Health Insurance Program (“CHIP”), which is also co‑administered by the states and jointly funded, provides health coverage to children in families with incomes too high to qualify for Medicaid, but too low to afford private coverage. Unlike Medicaid, the CHIP is limited in duration and requires the enactment of reauthorizing legislation. Funding for the CHIP has been reauthorized through federal fiscal year (“FFY”) 2029.
Healthcare Reform
The Patient Protection and Affordable Care Act, as amended by the Health Care and Education Reconciliation Act of 2010 (the “Affordable Care Act”), extended health coverage to millions of uninsured legal U.S. residents through a combination of private sector health insurance reforms and public program expansion. The expansion of Medicaid in 3941 states (including four of the nine states in which we operate acute care hospitals) and the District of Columbia is currently financed through:
•negative “productivity adjustments” to the annual market basket updates, which began in 2011 and do not expire under current law; and
•reductions to Medicare and Medicaid disproportionate share hospital (“DSH”) payments, which began for Medicare payments in FFY 2014 and, under current law, are scheduled to commence for Medicaid payments in FFYon March 9, 2024.
The Affordable Care Act also includes measures designed to promote quality and cost efficiency in healthcare delivery and provisions intended to strengthen fraud and abuse enforcement.
The initial expansion of health insurance coverage under the Affordable Care Act resulted in an increase in the number of patients using our facilities with either private or public program coverage and a decrease in uninsured and charity care admissions. Although a substantial portion of our patient volumes and, as a result, our revenues has historically been derived from government healthcare programs, reductions to our reimbursement under the Medicare and Medicaid programs as a result of the Affordable Care Act have been partially offset by increased revenues from providing care to previously uninsured individuals.
There is ongoing uncertainty with respect to the ultimate net effect ofWe cannot predict whether or how the Affordable Care Act due to the potential for continued changesmay be modified, amended or implemented in the law’s implementation and how government agencies and courts interpret it. Moreover, we cannot predict what future action, if any, Congress might take to amend the Affordable Care Act.future. If future modifications or interpretations result in significantly fewer individuals having private or public health coverage, we likely will experience decreased patient volumes, reduced revenues and an increase in uncompensated care, which would adversely affect our results of operations and cash flows. There isWe are also uncertainty regardingunable to predict the potential impactimpacts on our business of other healthcare-related reform efforts at the federal and state levels. Some reformsinitiatives, requirements and proposals may have a positive effect on our business, while others may increase our operating costs, negatively impact our patient volumes, case mix and revenue mix, adversely affect the reimbursement we receive for our services or require us to expend resources to modify certain aspects of our operations. Legislative and executive branch efforts related to healthcare reform could result in increased prices for consumers purchasing health insurance coverage, impact our competitive position, and affect our relationships with insurers and patients.
Medicare
Medicare offers its beneficiaries different ways to obtain their medical benefits. One option, the Original Medicare Plan (which includes “Part A” and “Part B”), is a fee‑for‑service (“FFS”) payment system. The other option, called Medicare Advantage (sometimes called “Part C” or “MA Plans”), includes health maintenance organizations (“HMOs”), preferred provider organizations (“PPOs”), private FFS Medicare special needs plans and Medicare medical savings account plans. Our total net patient service revenues from continuing operations of the hospitals and related outpatient facilities in our Hospital
Operations segment for services provided to patients enrolled in the Original Medicare Plan were $2.383 billion, $2.369 billion $2.615 billion and $2.695$2.615 billion for the years ended December 31, 2023, 2022 2021 and 2020,2021, respectively.
A general description of the types of payments we receive for services provided to patients enrolled in the Original Medicare Plan is provided below. Recent regulatory and legislative updates to the terms of these payment systems and their estimated effect on our revenues can be found under “Regulatory and Legislative Changes” below.
Acute Care Hospital Inpatient Prospective Payment System
Medicare Severity-Adjusted Diagnosis-Related Group Payments—Sections 1886(d) and 1886(g) of the Social Security Act set forth a system of payments for the operating and capital costs of inpatient acute care hospital admissions based on a prospective payment system (“PPS”). Under the inpatient prospective payment systems (“IPPS”), Medicare payments for hospital inpatient operating services are made at predetermined rates for each hospital discharge. Discharges are classified according to a system of Medicare severity‑adjusted diagnosis‑related groups (“MS‑DRGs”), which categorize patients with similar clinical characteristics that are expected to require similar amounts of hospital resources. CMS assigns to each MS‑DRG a relative weight that represents the average resources required to treat cases in that particular MS‑DRG, relative to the average resources used to treat cases in all MS‑DRGs.
The base payment amount for the operating component of the MS‑DRG payment is comprised of an average standardized amount that is divided into a labor‑related share and a nonlabor-related share. Both the labor‑related share of operating base payments and the base payment amount for capital costs are adjusted for geographic variations in labor and capital costs, respectively. Using diagnosis and procedure information submitted by the hospital, CMS assigns to each discharge an MS‑DRG, and the base payments are multiplied by the relative weight of the MS‑DRG assigned. The MS‑DRG operating and capital base rates, relative weights and geographic adjustment factors are updated annually, with consideration given to: the increased cost of goods and services purchased by hospitals; the relative costs associated with each MS‑DRG; changes in labor data by geographic area; and other policies. Although these payments are adjusted for area labor and capital cost differentials, the adjustments do not take into consideration an individual hospital’s operating and capital costs.
Outlier Payments—Outlier payments are additional payments made to hospitals on individual claims for treating Medicare patients whose medical conditions are more costly to treat than those of the average patient in the same MS‑DRG. To qualify for a cost outlier payment, a hospital’s billed charges, adjusted to cost, must exceed the payment rate for the MS‑DRG by a fixed threshold updated annually by CMS. A Medicare Administrative Contractor (“MAC”) calculates the cost of a claim by multiplying the billed charges by an average cost‑to‑charge ratio that is typically based on the hospital’s most recently filed cost report. Generally, if the computed cost exceeds the sum of the MS‑DRG payment plus the fixed threshold, the hospital receives 80% of the difference as an outlier payment.
Under the Social Security Act, CMS must project aggregate annual outlier payments to all PPS hospitals to be not less than 5% or more than 6% of total MS‑DRG payments (“Outlier Percentage”). The Outlier Percentage is determined by dividing total outlier payments by the sum of MS‑DRG and outlier payments. CMS annually adjusts the fixed threshold to bring projected outlier payments within the mandated limit. A change to the fixed threshold affects total outlier payments by changing: (1) the number of cases that qualify for outlier payments; and (2) the dollar amount hospitals receive for those cases that qualify for outlier payments. Under certain conditions, outlier payments are subject to reconciliation based on more recent data.
Disproportionate Share Hospital Payments—In addition to making payments for services provided directly to beneficiaries, Medicare makes additional payments to hospitals that treat a disproportionately high share of low‑income patients. Prior to October 1, 2013, DSH payments were based on each hospital’s low income utilization for each payment year (the “Pre‑ACA DSH Formula”). The Affordable Care Act revised the Medicare DSH adjustment effective for discharges occurring on or after October 1, 2013. Under the revised methodology, hospitals receive 25% of the amount they previously would have received under the Pre‑ACA DSH Formula. This amount is referred to as the “Empirically Justified Amount.”
Hospitals qualifying for the Empirically Justified Amount of DSH payments are also eligible to receive an additional payment for uncompensated care (the “UC‑DSH Amount”). The UC‑DSH Amount is a hospital’s share of a pool of funds that the CMS Office of the Actuary estimates would equal 75% of Medicare DSH that otherwise would have been paid under the Pre‑ACA DSH Formula, adjusted for changes in the percentage of individuals that are uninsured. Generally, the factors used to calculate and distribute UC‑DSH Amounts are set forth in the Affordable Care Act and are not subject to administrative or judicial review. The statute requires that each hospital’s cost of uncompensated care (i.e., charity and bad debt) as a percentage of the total uncompensated care cost of all DSH hospitals be used to allocate the pool. As of December 31, 2022, 512023, 52 of our acute care hospitals qualified for Medicare DSH payments.
The statutes and regulations that govern Medicare DSH payments have been the subject of various administrative appeals and lawsuits, and our hospitals have been participating in such appeals, including challenges to the inclusion of the Medicare Advantage (Part C) days used in the DSH calculation as set forth in the Changes to the Hospital Inpatient Prospective Payment Systems and Fiscal Year 2005 Rates. In June 2023, CMS issued a Final Action on the Treatment of Medicare Part C Days in the Calculation of a Hospital’s Medicare Disproportionate Patient Percentage, which finalized CMS’ August 2020 proposed rule to include Medicare Advantage days in the Medicare fraction for all discharges prior to October 1, 2013. CMS expects no associated effect on payments given that prior payments were made in accordance with this policy. We are unablenot able to predict whatwhether CMS’s final action will be the Secretarysubject of HHS might take with respectfurther or new legal challenges nor are we able to the DSH calculation for prior periods in this regard orpredict the outcome of the litigation;those challenges, if any, or of pending appeals; however, a favorable outcome of our DSH appeals could have a material impact on our future revenues and cash flows.
Direct Graduate and Indirect Medical Education Payments—The Medicare program provides additional reimbursement to approved teaching hospitals for the increased expenses incurred by such institutions. This additional reimbursement, which is subject to certain limits, including intern and resident full-time equivalent (“FTE”) limits, is made in the form of Direct Graduate Medical Education (“DGME”) and Indirect Medical Education (“IME”) payments. As of December 31, 2022, 302023, 32 of our hospitals were affiliated with academic institutions and were eligible to receive such payments.
IPPS Quality Adjustments—The Affordable Care Act also authorizes quality adjustments to Medicare IPPS payments under the following programs:
•Value‑Based Purchasing (“VBP”) Program – Under the VBP program, IPPS operating payments to hospitals are reduced by 2% to fund value‑based incentive payments to eligible hospitals based on their overall performance on a set of quality measures;
•Hospital Readmission Reduction Program – Under this program, IPPS operating payments to hospitals with excess readmissions are reduced up to a maximum of 3% of base MS‑DRG payments; and
•Hospital‑Acquired Conditions (“HAC”) Reduction Program – Under this program, overall inpatient payments are reduced by 1% for hospitals in the worst performing quartile of risk‑adjusted quality measures for reasonable preventable hospital‑acquired conditions.
These adjustments, which CMS updates annually, are generally based on a hospital’s performance from prior periods.
Hospital Outpatient Prospective Payment System
Under the outpatient prospective payment system (“OPPS”), hospital outpatient services, except for certain services that are reimbursed on a separate fee schedule, are classified into groups called ambulatory payment classifications (“APCs”). Services in each APC are similar clinically and in terms of the resources they require, and a payment rate is established for each APC. Depending on the services provided, hospitals may be paid for more than one APC for an encounter. CMS annually updates the APCs and the rates paid for each APC.
Inpatient Psychiatric Facility Prospective Payment System
The inpatient psychiatric facility (“IPF”) prospective payment system (“IPF-PPS”) applies to psychiatric hospitals and psychiatric units located within acute care hospitals that have been designated as exempt from the hospital inpatient prospective payment system. The IPF-PPS is based on prospectively determined per‑diem rates and includes an outlier policy that authorizes additional payments for extraordinarily costly cases. As of December 31, 2022, 192023, 18 of our general hospitals operated IPF units.
Inpatient Rehabilitation Prospective Payment System
Rehabilitation hospitals and rehabilitation units in acute care hospitals meeting certain criteria established by CMS are eligible to be paid as an inpatient rehabilitation facility (“IRF”) under the IRF prospective payment system (“IRF‑PPS”). Payments under the IRF‑PPS are made on a per-discharge basis. The IRF‑PPS uses federal prospective payment rates across distinct case‑mix groups established by a patient classification system. As of December 31, 2022,2023, we operated one freestanding IRF, and 1514 of our generalacute care hospitals operated IRF units.
Physician and Other Health Professional Services Payment System
Medicare uses a fee schedule to pay for physician and other health professional services based on a list of services and their payment rates referred to as the Medicare Physician Fee Schedule (“MPFS”). In determining payment rates for each service, CMS considers the amount of clinician work required to provide a service, expenses related to maintaining a practice and professional liability insurance costs. These three factors are adjusted for variation in the input prices in different markets, and the sum is multiplied by the fee schedule’s conversion factor (average payment amount) to produce a total payment amount.
Cost Reports
The final determination of certain Medicare payments to our hospitals, such as DSH, DGME, IME and bad debt expense, are retrospectively determined based on our hospitals’ cost reports. The final determination of these payments often takes many years to resolve because of audits by the program representatives, providers’ rights of appeal, and the application of numerous technical reimbursement provisions.
For filed cost reports, we adjust the accrual for estimated cost report settlements based on those cost reports and subsequent activity, and we recordconsider the necessity of recording a valuation allowance against those cost reports based on historical settlement trends.results. The accrual for estimated cost report settlements for periods for which a cost report is yet to be filed is recorded based on estimates of what we expect to report on the filed cost reports and a corresponding valuation allowance is recorded, asif necessary, based on the method previously described. Cost reports must generally be filed within five months after the end of the annual cost report reporting period. After the cost report is filed, the accrual and corresponding valuation allowance may need to be adjusted.
Medicare Claims Reviews
HHS estimates that the overall 20222023 Medicare FFS improper payment rate for the program is approximately 7.46%7.38%. The 20222023 error rate for Hospital IPPS payments is approximately 3%3.4%. CMS has identified the FFS program as a program at risk for significant erroneous payments, and one of the agency’s stated key goals is to pay claims properly the first time. This means paying the right amount, to legitimate providers, for covered, reasonable and necessary services provided to eligible beneficiaries. According to CMS, paying correctly the first time saves resources required to recover improper payments and ensures the proper expenditure of Medicare Trust Fund dollars. CMS has established several initiatives to prevent or identify improper payments before a claim is paid, and to identify and recover improper payments after paying a claim. The overall goal is to reduce improper payments by identifying and addressing coverage and coding billing errors for all provider types. Under the authority of the Social Security Act, CMS employs a variety of contractors (e.g., MACs, Recovery Audit Contractors and Unified Program Integrity Contractors) to process and review claims according to Medicare rules and regulations.
Claims selected for prepayment review are not subject to the normal Medicare FFS payment timeframe. Furthermore, prepayment and post‑payment claims denials are subject to administrative and judicial review, and we pursue the reversal of adverse determinations where appropriate. We have established robust protocols to respond to claims reviews and payment denials. In addition to overpayments that are not reversed on appeal, we incur additional costs to respond to requests for records and pursue the reversal of payment denials. The degree to which our Medicare FFS claims are subjected to prepayment reviews, the extent to which payments are denied, and our success in overturning denials could have an adverse effect on our cash flows and results of operations.
Meaningful Use of Health Information Technology
The Health Information Technology for Economic and Clinical Health (“HITECH”) Act, which is part of the American Recovery and Reinvestment Act of 2009, promotes the use of healthcare information technology by, among other things, providing financial incentives to hospitals and physicians to become “meaningful users” of electronic health record (“EHR”) systems and imposing penalties on those who do not. Under the HITECH Act and other laws and regulations, eligible hospitals that fail to demonstrate and maintain meaningful use of certified EHR technology and/or submit quality data every year (and have not applied and qualified for a hardship exception) are subject to a reduction of the Medicare market basket update. Eligible healthcare professionals are also subject to positive or negative payment adjustments based, in part, on their use of EHR technology. We continue to invest in the maintenance and utilization of certified EHR systems for our hospitals and employed physicians. Failure to do so could subject us to penalties that may have an adverse effect on our net revenues and results of operations.
Medicaid
Medicaid programs and the corresponding reimbursement methodologies vary from state‑to‑state and from year‑to‑year. Estimated revenues under various state Medicaid programs, including state‑funded Medicaid managed care programs, constituted approximately 19.4%19.1%, 18.7%19.4% and 17.8%18.7% of the total net patient service revenues of our acute care hospitals and related outpatient facilities for the years ended December 31, 2023, 2022 2021 and 2020,2021, respectively. We also receive DSH and other supplemental revenues under various state Medicaid programs. For the years ended December 31, 2023, 2022 2021 and 2020,2021, our total Medicaid revenues attributable to DSH and other supplemental revenues were approximately $644$929 million, $767 million and $915 million, and $754 million, respectively. The decrease between 2022 and 2021 was primarily attributable to changes in Medicaid program payments in California, Florida, Michigan and Texas. For Texas, we recognized $123 million of assessments to support the Texas Comprehensive Hospital Increase Reimbursement Program (“CHIRP”) following its approval in 2022. During the year ended December 31, 2022, we also recognized $245 million of revenue related to CHIRP that is included in
Managed Medicaid revenue rather than the DSH and other supplemental revenues classification due to the structure of the program.
Even prior to the COVID-19 pandemic, severalSeveral states in which we operate facedcontinue to face budgetary challenges that have resulted in reduced Medicaid funding levels to hospitals and other providers. Because most states must operate with balanced budgets, and the Medicaid program is generally a significant portion of a state’s budget, states can be expected to adopt or consider adopting future legislation designed to reduce or not increase their Medicaid expenditures. In addition, some states delay issuing Medicaid payments to providers to manage state expenditures. As an alternative means of funding provider payments, many of the states in whichwhere we operate have adopted supplemental payment programs authorized under the Social Security Act.
Continuing pressure on state budgets and other factors, including legislative and regulatory changes, could result in future reductions to Medicaid payments, payment delays or changes to Medicaid supplemental payment programs. Federal government denials or delayed approvals of waiver applications or extension requests by the states in whichwhere we operate could also materially impact our Medicaid funding levels.
Total Medicaid and Managed Medicaid managed care net patient service revenues from continuing operations recognized by the hospitals and related outpatient facilities in our Hospital Operations segment for the years ended December 31, 2023, 2022 and 2021 and 2020 were $2.776 billion, $2.692 billion $2.760 billion and $2.427$2.760 billion, respectively. During the year ended December 31, 2022,2023, Medicaid and Managed Medicaid managed care revenues comprised 35%44% and 65%56%, respectively, of our Medicaid‑related net patient service revenues from continuing operations recognized by the hospitals and related outpatient facilities in our Hospital
Operations segment. All Medicaid and Managed Medicaid managed care patient service revenues are presented net of provider taxes or assessments paid by our hospitals, which are reported as an offset reduction to FFS Medicaid revenue.hospitals.
Because we cannot predict what actions the federal government or the states may take under existing or future legislation and/or regulatory changes to address budget gaps, deficits, Medicaid expansion, Medicaid eligibility redeterminations, provider fee programs, state‑directed payment programs or Medicaid Section 1115 waivers, we are unable to assess the effect that any such legislation or regulatory action might have on our business; however, the impact on our future financial position, results of operations or cash flows could be material.
Regulatory and Legislative Changes
The Medicare and Medicaid programs are subject to: statutory and regulatory changes, administrative and judicial rulings, interpretations and determinations concerning patient eligibility requirements, funding levels and the method of calculating reimbursements, among other things; requirements for utilization review; and federal and state funding restrictions. Any of these factors could materially increase or decrease payments from these government programs in the future, as well as affect the cost of providing services to our patients and the timing of payments to our facilities. We are unable to predict the effect of future government healthcare funding policy changes on our operations. If the rates paid by governmental payers are reduced, if the scope of services covered by governmental payers is limited, or if we or one or more of our hospitals are excluded from participation in the Medicare or Medicaid program or any other government healthcare program, there could be a material adverse effect on our business, financial condition, results of operations or cash flows. Recent regulatory and legislative updates to the Medicare and Medicaid payment systems, as well as other government programs impacting our business, are provided below.
Payment and Policy Changes to the Medicare Inpatient Prospective Payment Systems—Systems—Section 1886(d) of the Social Security Act requires CMS to update Medicare inpatient FFS payment rates for hospitals reimbursed under the IPPS annually. The updates generally become effective October 1, the beginning of the FFY. In August 2022,2023, CMS issued final changes to the Hospital Inpatient Prospective Payment Systems for Acute Care Hospitals and Fiscal Year 20232024 Rates (“Final IPPS Rule”). The Final IPPS Rule includes the following payment and policy changes, among others:
•A market basket increase of 4.1%3.3% for MS‑DRG operating payments for hospitals reporting specified quality measure data and that are meaningful users of EHR technology; CMS also finalized a 0.3%0.2% multifactor productivity reduction required by the Affordable Care Act, and a 0.5% increase required by the Medicare Access and CHIP Reauthorization Act of 2015 that together resultresults in a net operating payment update of 4.3%3.1% before budget neutrality adjustments;
•Updates to the hospital VBP and HAC programs for FFY 2023 due to the impact of the COVID-19 public health emergency, including: the implementation of a special scoring methodology for the VBP program that results in each hospital receiving a value‑based incentive payment amount equal to the 2% reduction to its operating standardized amount; and suppression of all measures in the HAC reduction program resulting in no hospitals being penalized for FFY 2023;
•An increase in the cost outlier threshold from $30,988$38,859 to $38,859;$42,750;
•A 2.37%4.14% net increase in the capital federal MS‑DRG rate; and
•Updates to the three factors used to determine the amount and distribution of Medicare UC‑DSH Amounts.Amounts; and
•The inclusion of certain rural reclassified hospitals with geographically rural hospitals in the calculation of the rural wage index and the calculation of the wage index floor for urban hospitals in the same state.
According to CMS, the combined impact of the payment and policy changes in the Final IPPS Rule for operating costs will yield an average 2.6%3.1% increase in Medicare operating MS‑DRG FFS payments for hospitals in urban areas and an average 3.3%3.8% increase in such payments for proprietary hospitals in FFY 2023.2024. We estimate that all of the final payment and policy changes affecting operating MS‑DRG and UC‑DSH Amounts shouldwill result in a 3.7%4.0% increase in our annual Medicare FFS IPPS payments, which yields an estimated increase of approximately $55$64 million. Because of the uncertainty associated with various factors that may influence our future IPPS payments by individual hospital, including legislative, regulatory or legal actions, admission volumes, length of stay and case mix, we cannot provide any assurances regarding our estimate of the impact of the payment and policy changes.
Payment and Policy Changes to the Medicare Outpatient Prospective Payment and Ambulatory Surgery Center Payment Systems—In November 2022,2023, CMS released the final policy changes and payment rates for the Hospital Outpatient Prospective Payment System and Ambulatory Surgical Center Payment System for calendar year (“CY”) 20232024 (“Final OPPS/ASC Rule”). The Final OPPS/ASC Rule includes the following payment and policy changes, among others:
•An estimated net increase of 3.8%3.1% for the OPPS rates based on a market basket increase of 4.1%3.3%, reduced by a multifactor productivity adjustment required by the Affordable Care Act of 0.3%0.2%;
•Removal of 11 services from the Inpatient Only List (which is the list of procedures that must be performed on an inpatient basis) after determining such services meet established criteria for removal;
•Establishment of an exemption for rural Sole Community Hospitals from the site-neutral Medicare reduced payment rate for clinic visits furnished in exempt off-campus, provider-based departments and payment for such visits at the full OPPS rate; and
•A 3.8%3.1% increase to the Ambulatory Surgical Center payment rates.
CMS projects that the combined impact of the payment and policy changes in the Final OPPS/ASC Rule made certainwill yield an average 3.2% increase in Medicare FFS OPPS payments for hospitals in urban areas and an average 4.6% increase in Medicare FFS OPPS payments for proprietary hospitals. The projected annual impact of the payment and policy changes in the Final OPPS/ASC Rule is an increase to Medicare FFS hospital outpatient revenues of approximately $29 million, or 5.17%, for the facilities in our Hospital Operations segment and $16 million, or 2.64% for USPI’s ASCs and surgical hospitals. Because of the uncertainty associated with various factors that may influence our future OPPS payments, including legislative or legal actions, volumes and case mix, we cannot provide any assurances regarding our estimate of the impact of the final payment and policy changes.
Final Rule on the Remedy for the 340B-Acquired Drug Payment Policy for Calendar Years 2018-2022—CMS’ 340B program which allows certain hospitals (i.e., only nonprofit organizations with specific federal designations and/or funding) (“340B Hospitals”) to purchase drugs at discounted rates from drug manufacturers (“340B Drugs”). In the CY 2018 final rule regarding OPPS payment and policy changes, CMS reduced the payment for 340B Drugs from the average sales price (“ASP”) plus 6% to the ASP minus 22.5% and made a corresponding budget‑neutralbudget-neutral increase to payments to all hospitals for other drugs and services reimbursed under the OPPS (the “340B Payment Adjustment”). CMS retained the same 340B Payment Adjustment in the final rules regarding OPPS payment and policy changes for CYs 2019 through 2022. Certain hospital associations and hospitals commenced litigation challenging CMS’ authority to impose the 340B Payment Adjustment for CYs 2018, 2019 and 2020. Following the initial court decisions and a series of appeals, the U.S. Supreme Court (the “Supreme Court”) unanimously ruled in June 2022 that the decision to impose the 340B Payment Adjustment in CYs 2018 and 2019 was unlawful, and the case was remanded to the lower courts to determine the appropriate remedy. In response to the Supreme Court’s decision, the final rules regarding OPPS payment and policy changes for CY 2023 Final OPPS/ASC Rule affirmsaffirmed that CMS iswas now applying the default rate, generally ASP plus 6%, to 340B Drugs and biologicals, and it hashad removed the 340B Payment Adjustment made in 2018. In January 2023, the U.S. District Court for the District of Columbia issued an opinion remanding the case to HHS to determine the remediation for the prior years’ underpayments. BeforeIn response, CMS released the issuance of this opinion, CMS had indicatedHospital Outpatient Prospective Payment System: Remedy for 340B-Acquired Drugs Payment Policy for Calendar Years 2018-2022 Final Rule in November 2023. The final rule provides for a one-time lump sum remedy payment to each 340B Hospital that it is still evaluating how to apply the Supreme Court ruling to the cost yearsreceived a cut in 340B Drug payments from 2018 through 2022 (to which CMS will not apply interest). Due to budget neutrality requirements, CMS also proposed a reduction to future non‑drug item and it expectsservice payments through an adjustment to address the remedy for those cost yearsOPPS conversion factor by minus 0.5% starting in CY 2026 until the full amount is offset (which CMS estimates will take 16 years). We estimate this adjustment will result in a separate rulemaking that will be published priorreduction of less than $10 million annually to the CY 2024 proposed rule regarding OPPS paymentour acute care and policy changes.
CMS projects that the combined impact of the payment and policy changes in the Final OPPS/ASC Rule will yield an average 4.9% increase in Medicare FFS OPPS payments for hospitals in urban areas and an average 1.3% increase in Medicare FFS OPPS payments for proprietary hospitals. The projected annual impact of the payment and policy changes in the Final OPPS/ASC Rule on our hospitals is an increase to Medicare FFSsurgical hospital outpatient revenues of approximately $9 million, which represents an increase of approximately 1.5%.
Because of the uncertainty associated with various factors that may influence our future OPPS payments, including legislative or legal actions, volumes and case mix, we cannot provide any assurances regarding our estimate of the impact of the final payment and policy changes. In addition, it remains unclear at this time how CMS will finance any retroactive payments for 340B payments that were previously withheld given that the original policy was budget‑neutral and HHS already redistributed the savings. We cannot predict the remedy that will be imposed, the timing thereof, or what further actions CMS or Congress might take with respect to the 340B program; however, it is possible that reversal of the 340B Payment Adjustment could have an adverse effect on our future net operating revenues and cash flows.
Payment and Policy Changes to the Medicare Physician Fee Schedule—MPFS—In November 2022,2023, CMS released the CY 20232024 Medicare Physician Fee Schedule (“MPFS”) Final Rule (“MPFS Final Rule”). The MPFS Final Rule includes updates to payment policies, payment rates and other provisions for services reimbursed under theMPFS from January 1 through December 31, 2023.2024. Under the MPFS Final Rule, the CY 20232024 conversion factor, which is the base rate that is used to convert relative units into payment rates, was reduced from $34.61$33.89 to $33.06,$32.74, a decrease of 3.4%, due in part to budget neutrality rules and the expiration of the one-time 3% payment increaseadjustment provided for in CY 2022 by the Protecting Medicare and American Farmers from Sequester Cuts Act (the “Sequester Cuts Act”), which was signed into law in December 2021, as well as budget neutrality rules. However, the December 2022 enactment of the Consolidated Appropriations Act, 2023 (“CAA, 2023”). The CAA, 2023 provided for a 2.5% positive adjustment to the MPFS CY 2023 conversion factor and a 1.25% positive adjustment to the CY 2024 conversion factor, resulting in a 1.25% decrease in the CY 2024 conversion factor from the CY 2023 conversion factor of $33.89.factor. We estimate the impact of the MPFS Final Rule in conjunction with the positive adjustment from the CAA, 2023 shouldwill result in a reduction of approximately $4$6 million to our FFS MPFS revenues. Because of the uncertainty associated with various factors that may influence our future MPFS payments, including legislative, regulatory or legal actions, volumes and case mix, we cannot provide any assurances regarding our estimate of the impact of the final payment and policy changes.
The Coronavirus Aid, Relief, and Economic Security Act of 2020 and Related Legislation
Several pieces of legislation (the “COVID Acts”) that include funding and other provisions to mitigate the economic effects of the COVID‑19 pandemic have been signed into law since March 2020. COVID Acts—Provided below is a brief overview of certain provisions of the COVID Acts that have impacted our business in the years ended December 31, 2023, 2022 and that may continue to impact our business to varying degrees in 2023.2021. With the recent announcement thatexpiration of the public health emergency will end on May 11, 2023, and the subsequent unwinding of federal flexibilities and funding, there is no assurance or expectation that we will continue to receive or remain eligible for significant funding or assistance under the COVID Acts or similar measures in the future.
Funding for the Public Health and Social Services Emergency Fund—The COVID Acts authorized $178 billion in payments to be distributed to providers through the PRF.Public Health and Social Services Emergency Fund (“PRF”). To receive distributions, providers are required to agree to certain terms and conditions, including, among other things, that the funds are being used for lost revenues and unreimbursed COVID‑related costs as defined by HHS, and that the providers will not seek collection of out‑of‑pocket payments from a COVID‑19 patient that are greater than what the patient would have otherwise been required to pay if the care had been provided by an in-network provider. All recipients of PRF payments are required to comply with the reporting requirements described in the terms and conditions and as determined by HHS. In January 2021, HHS released updated reporting requirements that include lost revenues, expenses attributable to COVID-19 and non-financial information. The updated reporting requirements reflect certain provisions
Table of the Consolidated Appropriations Act, 2021 and Other Extensions Act (“Consolidated Appropriations Act”) affecting the calculation of lost revenues, as well as the distribution of PRF funds among subsidiaries in a hospital system. Furthermore, HHS has indicated that it will be closely monitoring and, along with the U.S. Office of Inspector General, auditing providers to ensure that recipients comply with the terms and conditions of relief programs and to prevent fraud and abuse. All providers will be subject to civil and criminal penalties for any deliberate omissions, misrepresentations or falsifications of any information given to HHS. PRF funds not utilized by the established deadlines, generally 12 to 18 months after receipt of the grant funds, will be recouped by HHS. Except for certain immaterial PRF payments we returned to HHS, we have formally accepted PRF payments issued to our providers and the terms and conditions associated with those payments, and we have complied with the reporting requirements.Contents During the years ended December 31, 2023, 2022 2021 and 2020,2021, our Hospital Operations and Ambulatory Care segments combined recognized approximately$1 million, $138 million $176 million and $868$176 million, respectively, of PRF grant income associated with lost revenues and COVID‑related costs. We recognized an additional $14 million and $17 million of PRF grant income from our unconsolidated affiliates during 2021 and 2020, respectively.the year ended December 31, 2021. Our Hospital Operations and Ambulatory Care segments combined also recognized $15 million, $56 million $15 million and $14$15 million of grant income from state and local grant programs during the years ended December 31, 2023, 2022 2021 and 2020,2021, respectively. Grant income recognized by our Hospital Operations and Ambulatory Care segments is presented in grant income, and grant income recognized through our unconsolidated affiliates is presented in equity in earnings of unconsolidated affiliates, in each case in the accompanying Consolidated Statements of Operations for the years ended December 31, 2022, 2021 and 2020. At December 31,2023, 2022 and 2021, we had2021. We did not have any remaining deferred grant payment balances offunds at December 31, 2023, but had $7 million and $5 million, respectively, which amounts wereof deferred grant payment funds at December 31, 2022. This amount was recorded in other current liabilities in the accompanying Consolidated Balance Sheets for those periods. We cannot predict whether additional distributions of grant funds will be authorized, and we cannot provide any assurances regarding the amount of grant income, if any, to be recognized in the future.
Medicare and Medicaid Payment Policy Changes—The COVID Acts have also alleviated some of the financial strain on hospitals, physicians, other healthcare providers and states through a series of Medicare and Medicaid payment policy changes, as described below:
•The CMS 2% sequestration reduction on Medicare FFS and Medicare Advantage payments to hospitals, physicians and other providers was suspended effective May 1, 2020 through December 31, 2021. The Protecting Medicare and American Farmers from Sequester Cuts Act (the “Sequester Cuts Act”) extended the 2% Medicare sequestration moratorium through March 31, 2022 and adjusted the sequestration to 1% for the period April 1, 2022 through June 30, 2022. Because further legislation was not passed, the full 2% reduction was restored effective July 1, 2022. The impact of the Sequester Cuts Act on our operations was an increase of approximately $39 million of revenues in the six months ended June 30, 2022, after which the sequestration was fully reinstated.
•The COVID Acts instituted a 20% increase in the Medicare MS‑DRG payment for COVID-19 hospital admissions for the duration ofthrough the public health emergency.emergency period, which expired May 11, 2023.
•The COVID Acts initially eliminated the scheduled nationwide reduction of $4 billion in federal Medicaid DSH allotments in FFY 2020 mandated by the Affordable Care Act and decreased the FFY 2021 DSH reduction from $8 billion to $4 billion effective December 1, 2020. Subsequently, the FFY 2021 DSH reduction was eliminated entirely, and the remaining $8 billion of DSH reductions were delayed until FFYMarch 8, 2024.
•The COVID Acts expanded the Medicare accelerated payment program, which provides prepayment of claims to providers in certain circumstances, such as national emergencies or natural disasters. Under the Consolidated Appropriations Act, 2021, providers could retain the accelerated payments for one year from the date of receipt before CMS commenced recoupment. During the year ended December 31, 2020, our hospitals and other providers applied for and received approximately $1.5 billion of accelerated payments. No additional accelerated payment funds were applied for or received in the years ended December 31, 2023, 2022 andor 2021. All advances received by our hospitals and other providers were either repaid or recouped during the years ended December 31, 2022 and 2021.
•A 6.2% increase in the Federal Medical Assistance Percentage (“FMAP”) matching funds was instituted to help states respond to the COVID‑19 pandemic. The additional funds became available to states effective January 1, 2020, and they were expected to remain available2020. The CAA, 2023 provided for the phase-down of this enhanced FMAP as follows: 6.2% through the first quarter in whichof 2023; 5.0% through the public health emergency period ends, provided that states met certain conditions. second quarter of 2023; 2.5% through the third quarter of 2023; and 1.5% through the last quarter of 2023. The increased support ended entirely as of January 1, 2024.
In addition, the COVID Acts established an incentive for states that had not already done so to expand Medicaid by temporarily increasing each such respective state’s FMAP for their base program by five percentage points for two years.
The COVID Acts included a requirement that state Medicaid programs keepyears so long as the states kept people continuously enrolled through the end of the month in whichduring the COVID‑19 public health emergency ends in exchange for the temporary increase to the FMAP. Under the CAA, 2023, the Medicaidemergency. This continuous enrollment condition and the receipt of the temporary FMAP increase will no longer be tied to the continuation of the public health emergency. Effectiveended on March 31, 2023 the continuous enrollment condition will end and, on April 1, 2023, states canwere permitted to begin eligibility redeterminations on their Medicaid populations and the disenrollment ofdisenroll individuals no longer eligible. In addition, the CAA, 2023 provides for the phase-down of the 6.2% enhanced FMAP as follows: 6.2% through the first quarter of 2023; 5.0% through the second quarter of 2023; 2.5% through the third quarter of 2023; and 1.5% through the last quarter of 2023. The increased support will end entirely as of January 1, 2024.
Because of the uncertainty associated with various factors that may influence our future Medicare and Medicaid payments, including future legislative, legal or regulatory actions, or changes in volumes and case mix, there is a risk that actual payments received under, or the ultimate impact of, these programs will differ materially from our expectations.
Funding for Uninsured Individuals—The COVID Acts provided claims reimbursement to healthcare providers generally at Medicare rates for testing uninsured individuals for COVID‑19 and treating uninsured individuals with a COVID‑19 diagnosis. A portion of the funding could also be used to reimburse providers for COVID‑19 vaccine administration to uninsured individuals. We recognized net operating revenues totaling $20 million, $91 million and $40 million related to this program in the accompanying Consolidated Statements of Operations for the years ended December 31, 2022, 2021 and 2020, respectively. This program stopped accepting reimbursement claims for the testing and treatment of uninsured individuals on March 22, 2022, and stopped accepting claims for vaccine administration to uninsured individuals on April 5, 2022. Because it was discontinued in 2022, we did not recognize any revenue under this program in 2023. We recognized net operating revenues totaling $20 million and $91 million related to this program in the accompanying Consolidated Statements of Operations for the years ended December 31, 2022 and 2021, respectively.
Tax Changes—Beginning March 27, 2020, all employers were able to elect to defer payment of the 6.2% employer Social Security tax through December 31, 2020. Deferred tax amounts were required to be paid in equal amounts over two years, with payments due in December 2021 and December 2022. During the year ended December 31, 2020, we deferred Social Security tax payments totaling $275 million pursuant to this COVID Acts provision. In December 2021, we repaid half of the outstanding deferred Social Security tax payments, and the remainder was repaid in December 2022.
CMS Innovation Models
The CMS Innovation Center develops and tests innovative payment and service delivery models that have the potential to reduce Medicare, Medicaid or CHIP expenditures while preserving or enhancing the quality of care for beneficiaries. Congress has defined – both through the Affordable Care Act and previous legislation – a number of specific demonstrations for CMS to conduct, including bundled payment models. Generally, the bundled payment models hold hospitals financially accountable for the quality and costs for an entire episode of care for a specific diagnosis or procedure from the date of the hospital admission or inpatient procedure through 90 days post‑discharge, including services not provided by the hospital, such as physician, inpatient rehabilitation, skilled nursing and home health care. Provider participation in some of these models is voluntary; for example, 19 hospitals in our Hospital Operations segment and three surgical hospitals in our Ambulatory Care segment participate in the CMS Bundled Payments for Care Improvement Advanced (“BPCIA”) program that became effective October 1, 2018, and USPI also holds the CMS contract for one physician group practice participating in the BPCIA program. Participation in certain other bundled payment arrangements is mandatory for providers located in randomly selected geographic locations. Under the mandatory models, hospitals are eligible to receive incentive payments or will be subject to payment reductions within certain corridors based on their performance against quality and spending criteria. In 2015, CMS finalized a five‑year bundled payment model (that was subsequently extended for an additional three years), called the Comprehensive Care for Joint Replacement (“CJR”) model, which includes hip and knee replacements, as well as other major leg procedures. Eleven hospitals in our Hospital Operations segment and four surgical hospitals in our Ambulatory Care segment currently participate in the CJR model. In April 2021, CMS extended the CJR model through December 31, 2024.
PRIVATE INSURANCE
Managed Care
We currently have thousands of managed care contracts with various HMOs and PPOs. HMOs generally maintain a full‑service healthcare delivery network comprised of physician, hospital, pharmacy and ancillary service providers that HMO members must access through an assigned “primary care” physician. The member’s care is then managed by his or her primary care physician and other network providers in accordance with the HMO’s quality assurance and utilization review guidelines so that appropriate healthcare can be efficiently delivered in the most cost‑effective manner. HMOs typically provide reduced benefits or reimbursement (or none at all) to their members who use non‑contracted healthcare providers for non‑emergency care.
PPOs generally offer limited benefits to members who use non‑contracted healthcare providers. PPO members who use contracted healthcare providers receive a preferred benefit, typically in the form of lower co‑pays, co‑insurance or deductibles. As employers and employees have demanded more choice, managed care plans have developed hybrid products that combine elements of both HMO and PPO plans, including high‑deductible healthcare plans that may have limited benefits, but cost the employee less in premiums.
The amount of our managed care net patient service revenues, including Medicare and Medicaid managed care programs, from our hospitals and related outpatient facilities during the years ended December 31, 2023, 2022 and 2021 and 2020 was $9.730$10.248 billion, $9.985$9.607 billion and $9.022$9.985 billion, respectively. Our top 10 managed care payers generated 62%65% of our managed care net patient service revenues for the year ended December 31, 2022. In 2022,2023. During the same period, national payers generated 44%45% of our managed care net patient service revenues; the remainder came from regional or local payers. At December 31, 2023 and 2022, 68% and 2021, 66% and 67%, respectively, of our Hospital Operations segment’s net accounts receivable for our Hospital Operations segment were due from managed care payers.
Revenues under managed care plans are based primarily on payment terms involving predetermined rates per diagnosis, per‑diem rates, discounted FFS rates and/or other similar contractual arrangements. These revenues are also subject to review and possible audit by the payers, which can take several years before they are completely resolved. The payers are billed for patient services on an individual patient basis. An individual patient’s bill is subject to adjustment on a patient‑by‑patient basis in the ordinary course of business by the payers following their review and adjudication of each particular bill. We estimate the discounts for contractual allowances at the individual hospital level utilizing billing data on an individual patient basis. At the end of each month, on an individual hospital basis, we estimate our expected reimbursement for patients of managed care plans based on the applicable contract terms. We believe it is reasonably likely for there to be an
approximately 3% increase or decrease in the estimated contractual allowances related to managed care plans. Based on reserves at December 31, 2022,2023, a 3% increase or decrease in the estimated contractual allowance would impact the estimated reserves by approximately $18$25 million. Some of the factors that can contribute to changes in the contractual allowance estimates include: (1) changes in reimbursement levels for procedures, supplies and drugs when threshold levels are triggered; (2) changes in reimbursement levels when stop‑loss or outlier limits are reached; (3) changes in the admission status of a patient due to physician orders subsequent to initial diagnosis or testing; (4) final coding of in‑house and discharged‑not‑final‑billed
patients that change reimbursement levels; (5) secondary benefits determined after primary insurance payments; and (6) reclassification of patients among insurance plans with different coverage and payment levels. Contractual allowance estimates are periodically reviewed for accuracy by taking into consideration known contract terms, as well as payment history. We believe our estimation and review process enables us to identify instances on a timely basis where such estimates need to be revised. We do not believe there were any adjustments to estimates of patient bills that were material to our revenues during the years ended December 31, 2023, 2022 2021 or 2020.2021. In addition, on a corporate‑wide basis, we do not record any general provision for adjustments to estimated contractual allowances for managed care plans. Managed care accounts, net of contractual allowances recorded, are further reduced to their net realizable value through implicit price concessions based on historical collection trends for these payers and other factors that affect the estimation process.
We expect managed care governmental admissions to continue to increase as a percentage of total managed care admissions over the near term. However, the managed Medicare and Medicaid managed care insurance plans typically generate lower yields than commercial managed care plans, which have been experiencing an improved pricing trend. Although we have benefited from solid year‑over‑year aggregate managed care pricing improvements for some time, we have seen these improvements moderate in recent years, and we believe this moderation could continue into the future, subject to incremental pricing improvements to address inflationary pressures. In the year ended December 31, 2022,2023, our commercial managed care net inpatient revenue per admission from the hospitals in our Hospital Operations segment was approximately 81%86% higher than our aggregate yield on a per-admission basis from government payers, including managed Medicare and Medicaid insurance plans.managed care programs.
Indemnity
At both December 31, 2022 and 2021, 4.8% of our net patient service revenues for our hospitals and related outpatient facilities were derived from indemnity‑based health plans. An indemnity‑based agreement generally requires the insurer to reimburse an insured patient for healthcare expenses after those expenses have been incurred by the patient, subject to policy conditions and exclusions. Unlike an HMO member, a patient with indemnity insurance is free to control his or her utilization of healthcare and selection of healthcare providers.
Legislative Changes
The No Surprises Act (“NSA”) established federal protections, which became effective on January 1, 2022, against balance billing for patients who obtain medical services from physicians and other providers not chosen by the patient and outside of the patient’s health insurance network. Providers that violate these surprise billing prohibitions may be subject to state enforcement action or federal civil monetary penalties. Among other things, the NSA limits the amount an insured patient will pay for (1) out-of-network emergency care (provided in hospital emergency departments and freestanding emergency facilities), and (2) scheduled out-of-network services (such as radiology, pathology and anesthesiology) at an in-network facility when the patient hasn’t been notified or provided consent. The NSA also prohibits insurers from assigning higher deductibles (and other cost-sharing charges) to patients for out-of-network care than they do for in-network care without patient notification and consent.
Under the NSA, insurers and providers are given the opportunity to resolve disputed out‑of‑network reimbursement through negotiation and an independent dispute resolution (“IDR”) process, unless state law specifies a different approach. The IDR process has been utilized far more than anticipated, and there is currently a backlog of claims pending determination. Moreover, provider groups have been successful in challenging certain IDR-related provisions of the regulations promulgated under the NSA, claiming the regulations unfairly favor insurers in the determination of appropriate reimbursement amounts. We cannot predict the ultimate impact of this or any future litigation nor can we predict any future regulatory changes. In addition, we are unable to fully assess the ultimate impact of the NSA on our business at this time; however, based on our experience to this point, we believe that compliance with the provisions of the NSA will not have a material adverse effect on our financial condition, results of operations or cash flows.
UNINSURED PATIENTS
Uninsured patients are patients who do not qualify for government programs payments, such as Medicare and Medicaid, do not have some form of private insurance and, therefore, are responsible for their own medical bills. A significant number of our uninsured patients are admitted through our hospitals’ emergency departments and often require high‑acuity treatment that is more costly to provide and, therefore, results in higher billings, which are the least collectible of all accounts.
Self‑pay accounts receivable, which include amounts due from uninsured patients, as well as co‑pays, co‑insurance amounts and deductibles owed to us by patients with insurance, pose significant collectability problems. At December 31, 2023 and 2022, 4% and 2021, 5% and 4%, respectively, of our Hospital Operations segment’s net accounts receivable for our Hospital Operations segment was self‑pay. Further, a significant portion of our implicit price concessions relates to self‑pay amounts.
We provide revenue cycle management services through Conifer, which is subject to various statutes and regulations regarding consumer protection in areas including finance, debt collection and credit reporting activities. For additional information, see Item 1, Business — Regulations Affecting Conifer’s Operations, of Part I of this report. Conifer has performedperform systematic analyses to focus our attention on the drivers of bad debt expenseimplicit price concessions for each hospital. While emergency department use is the primary contributor to our implicit price concessions in the aggregate, this is not the case at all hospitals. As a result, we have increased our focus on targeted initiatives that concentrate on non‑emergency department patients as well. These initiatives are intended to promote process efficiencies in collecting self‑pay accounts, as well as co‑pay, co‑insurance and deductible amounts owed to us by patients with insurance, that we deem highly collectible. We leverage a statistical‑based collections model that aligns our operational capacity to maximize our collections performance. We are dedicated to modifying and refining our processes as needed, enhancing our technology and improving staff training throughout the revenue cycle process in an effort to increase collections and reduce accounts receivable.
Over the longer term, several other initiatives we have previously announced should also help address the challenges associated with serving uninsured patients. For example, our Compact with Uninsured Patients (“Compact”) is designed to offer managed care‑style discounts to certain uninsured patients, which enables us to offer lower rates to those patients who historically had been charged standard gross charges. Under the Compact, the discount offered to uninsured patients is recognized as a contractual allowance, which reduces net operating revenues at the time the self‑pay accounts are recorded. The uninsured patient accounts, net of contractual allowances recorded, are further reduced to their net realizable value through implicit price concessions based on historical collection trends for self‑pay accounts and other factors that affect the estimation process.
We also provide financial assistance through our charity and uninsured discount programs to uninsured patients who are unable to pay for the healthcare services they receive. Our policy is not to pursue collection of amounts determined to qualify for financial assistance; therefore, we do not report these amounts in net operating revenues. Most states include an estimate of the cost of charity care in the determination of a hospital’s eligibility for Medicaid DSH payments. These payments are intended to mitigate our cost of uncompensated care. Some states have also developed provider fee or other supplemental payment programs to mitigate the shortfall of Medicaid reimbursement compared to the cost of caring for Medicaid patients.
The initial expansion of health insurance coverage under the Affordable Care Act resulted in an increase in the number of patients using our facilities with either private or public program coverage and a decrease in uninsured and charity care admissions, along with reductions in Medicare and Medicaid reimbursement to healthcare providers, including us. However, we continue to have to provide uninsured discounts and charity care due to the failure of certain states to expand Medicaid coverage and for persons living in the country who are not permitted to enroll in a health insurance exchange or government healthcare insurance program.
As discussed above, the COVID Acts included a requirement that state Medicaid programs keep people continuously enrolled during the COVID‑19 public health emergency in exchange for a temporary increase to the FMAP. This continuous enrollment condition ended on March 31, 2023 and, on April 1, 2023, states were permitted to begin eligibility redeterminations on their Medicaid populations and disenroll individuals no longer eligible. The resulting volume of redeterminations has caused backlogs in the processing of new applications, which has increased the overall certification timeframe. We expect the certification timing will return to normal as these backlogs are resolved. Although we have not been materially adversely affected to date, any increase in the volume of uninsured patients could have an impact on our uncompensated care expense.
The following table presents our estimated costs (based on selected operating expenses, which include salaries, wages and benefits, supplies and other operating expenses) of caring for our uninsured and charity patients:
| | | | | Years Ended December 31, | | | Years Ended December 31, |
| | | | 2022 | | 2021 | | 2020 | | | 2023 | | 2022 | | 2021 |
| Estimated costs for: | Estimated costs for: | | | | | | | Estimated costs for: | | |
| Uninsured patients | Uninsured patients | | $ | 537 | | | $ | 650 | | | $ | 617 | |
| Charity care patients | Charity care patients | | 83 | | | 97 | | | 147 | |
| Total | Total | | $ | 620 | | | $ | 747 | | | $ | 764 | |
RESULTS OF OPERATIONS FOR THE YEAR ENDED DECEMBER 31, 20222023 COMPARED TO THE YEAR ENDED DECEMBER 31, 20212022
For the purpose of comparing our results of operations for the years ended December 31, 2023 and 2022, continuing operations information for our Hospital Operations segment includes the results of our same 60 hospitals operated throughout 2023 and 2022, as well as the results of our PMC Fort Mill Hospital, and excludes the results of our hospitals and other businesses classified as discontinued operations for accounting purposes during those years.
The following tables present our consolidated net operating revenues, operating expenses and operating income, both in dollar amounts and as percentages of net operating revenues, on a continuing operations basis:
| | | | Years Ended December 31, | | Increase
(Decrease) | | Years Ended December 31, | | Increase
(Decrease) |
| | | 2022 | | 2021 | |
| Net operating revenues: | Net operating revenues: | | | | | |
| Net operating revenues: | |
| Net operating revenues: | | | | |
| Hospital Operations | Hospital Operations | $ | 15,061 | | | $ | 15,982 | | | $ | (921) | |
| Ambulatory Care | Ambulatory Care | 3,248 | | | 2,718 | | | 530 | |
| Conifer | 1,316 | | | 1,267 | | | 49 | |
| Inter-segment eliminations | (451) | | | (482) | | | 31 | |
| | Net operating revenues | |
| | Net operating revenues | |
| | Net operating revenues | Net operating revenues | 19,174 | | | 19,485 | | | (311) | |
| Grant income | Grant income | 194 | | | 191 | | | 3 | |
| Equity in earnings of unconsolidated affiliates | Equity in earnings of unconsolidated affiliates | 216 | | | 218 | | | (2) | |
| Operating expenses: | Operating expenses: | | | | | | Operating expenses: | | | |
| Salaries, wages and benefits | Salaries, wages and benefits | 8,844 | | | 8,878 | | | (34) | |
| Supplies | Supplies | 3,273 | | | 3,328 | | | (55) | |
| Other operating expenses, net | Other operating expenses, net | 3,998 | | | 4,206 | | | (208) | |
| Depreciation and amortization | Depreciation and amortization | 841 | | | 855 | | | (14) | |
| Impairment and restructuring charges, and acquisition-related costs | Impairment and restructuring charges, and acquisition-related costs | 226 | | | 85 | | | 141 | |
| Litigation and investigation costs | Litigation and investigation costs | 70 | | | 116 | | | (46) | |
| Net gains on sales, consolidation and deconsolidation of facilities | Net gains on sales, consolidation and deconsolidation of facilities | (1) | | | (445) | | | 444 | |
| Operating income | Operating income | $ | 2,333 | | | $ | 2,871 | | | $ | (538) | |
| | Net operating revenues | |
| Net operating revenues | |
| Net operating revenues | | 100.0 | % | | 100.0 | % | | — | % |
| Grant income | | Grant income | 0.1 | % | | 1.0 | % | | (0.9) | % |
| Equity in earnings of unconsolidated affiliates | | Equity in earnings of unconsolidated affiliates | 1.1 | % | | 1.1 | % | | — | % |
| Operating expenses: | |
| Salaries, wages and benefits | |
| Salaries, wages and benefits | |
| Salaries, wages and benefits | | 44.5 | % | | 46.1 | % | | (1.6) | % |
| Supplies | | Supplies | 17.5 | % | | 17.0 | % | | 0.5 | % |
| Other operating expenses, net | | Other operating expenses, net | 22.0 | % | | 20.8 | % | | 1.2 | % |
| Depreciation and amortization | | Depreciation and amortization | 4.2 | % | | 4.4 | % | | (0.2) | % |
| Impairment and restructuring charges, and acquisition-related costs | | Impairment and restructuring charges, and acquisition-related costs | 0.7 | % | | 1.2 | % | | (0.5) | % |
| Litigation and investigation costs | | Litigation and investigation costs | 0.2 | % | | 0.4 | % | | (0.2) | % |
| Net gains on sales, consolidation and deconsolidation of facilities | | Net gains on sales, consolidation and deconsolidation of facilities | (0.1) | % | | — | % | | (0.1) | % |
| Operating income | | Operating income | 12.2 | % | | 12.2 | % | | — | % |
| | | | | | | | | | | | | | | | | |
| | Years Ended December 31, | | Increase
(Decrease) |
| | 2022 | | 2021 | |
| Net operating revenues | 100.0 | % | | 100.0 | % | | — | % |
| Grant income | 1.0 | % | | 1.0 | % | | — | % |
| Equity in earnings of unconsolidated affiliates | 1.1 | % | | 1.1 | % | | — | % |
| Operating expenses: | | | | | |
| Salaries, wages and benefits | 46.1 | % | | 45.6 | % | | 0.5 | % |
| Supplies | 17.0 | % | | 17.1 | % | | (0.1) | % |
| Other operating expenses, net | 20.8 | % | | 21.6 | % | | (0.8) | % |
| Depreciation and amortization | 4.4 | % | | 4.4 | % | | — | % |
| Impairment and restructuring charges, and acquisition-related costs | 1.2 | % | | 0.4 | % | | 0.8 | % |
| Litigation and investigation costs | 0.4 | % | | 0.6 | % | | (0.2) | % |
| Net gains on sales, consolidation and deconsolidation of facilities | — | % | | (2.3) | % | | 2.3 | % |
| Operating income | 12.2 | % | | 14.7 | % | | (2.5) | % |
The following tables present our net operating revenues, operating expenses and operating income, both in dollar amounts and as percentages of net operating revenues, by operating segment on a continuing operations basis:
| | | | | | | | | | | | | | | | | | | | | | | | | | | | | | | | | | | |
| Year Ended December 31, 2022 | | Year Ended December 31, 2021 |
| | Hospital Operations | | Ambulatory Care | | Conifer | | Hospital Operations | | Ambulatory Care | | Conifer |
| Net operating revenues | $ | 14,610 | | | $ | 3,248 | | | $ | 1,316 | | | $ | 15,500 | | | $ | 2,718 | | | $ | 1,267 | |
| Grant income | 190 | | | 4 | | | — | | | 142 | | | 49 | | | — | |
| Equity in earnings of unconsolidated affiliates | 10 | | | 206 | | | — | | | 25 | | | 193 | | | — | |
| Operating expenses: | | | | | | | | | | | |
| Salaries, wages and benefits | 7,333 | | | 822 | | | 689 | | | 7,511 | | | 690 | | | 677 | |
| Supplies | 2,398 | | | 871 | | | 4 | | | 2,640 | | | 684 | | | 4 | |
| Other operating expenses, net | 3,302 | | | 438 | | | 258 | | | 3,586 | | | 389 | | | 231 | |
| Depreciation and amortization | 692 | | | 112 | | | 37 | | | 722 | | | 95 | | | 38 | |
| Impairment and restructuring charges, and acquisition-related costs | 180 | | | 21 | | | 25 | | | 39 | | | 27 | | | 19 | |
| Litigation and investigation costs | 53 | | | 3 | | | 14 | | | 100 | | | 14 | | | 2 | |
| Net gains on sales, consolidation and deconsolidation of facilities | (1) | | | — | | | — | | | (411) | | | (34) | | | — | |
| Operating income | $ | 853 | | | $ | 1,191 | | | $ | 289 | | | $ | 1,480 | | | $ | 1,095 | | | $ | 296 | |
| | Year Ended December 31, 2023 | |
| Year Ended December 31, 2023 | |
| Year Ended December 31, 2023 | | | Year Ended December 31, 2022 |
| | Year Ended December 31, 2022 | | Year Ended December 31, 2021 | |
| Net operating revenues | |
| Net operating revenues | |
| Net operating revenues | |
| Grant income | |
| Grant income | |
| Grant income | |
| Equity in earnings of unconsolidated affiliates | |
| Equity in earnings of unconsolidated affiliates | |
| Equity in earnings of unconsolidated affiliates | |
| Operating expenses: | |
| Operating expenses: | |
| Operating expenses: | |
| Salaries, wages and benefits | |
| Salaries, wages and benefits | |
| Salaries, wages and benefits | |
| Supplies | |
| Supplies | |
| Supplies | |
| Other operating expenses, net | |
| Other operating expenses, net | |
| Other operating expenses, net | |
| Depreciation and amortization | |
| Depreciation and amortization | |
| Depreciation and amortization | |
| Impairment and restructuring charges, and acquisition-related costs | |
| Impairment and restructuring charges, and acquisition-related costs | |
| Impairment and restructuring charges, and acquisition-related costs | |
| Litigation and investigation costs | |
| Litigation and investigation costs | |
| Litigation and investigation costs | |
| Net gains on sales, consolidation and deconsolidation of facilities | |
| Net gains on sales, consolidation and deconsolidation of facilities | |
| Net gains on sales, consolidation and deconsolidation of facilities | |
| Operating income | |
| Operating income | |
| Operating income | |
| | | Hospital Operations | | Ambulatory Care | | Conifer | | Hospital Operations | | Ambulatory Care | | Conifer | |
| Net operating revenues | |
| | Net operating revenues | |
| | Net operating revenues | Net operating revenues | 100.0 | % | | 100.0 | % | | 100.0 | % | | 100.0 | % | | 100.0 | % | | 100.0 | % | |
| Grant income | Grant income | 1.3 | % | | 0.1 | % | | — | % | | 0.9 | % | | 1.8 | % | | — | % | |
| Grant income | |
| Grant income | |
| Equity in earnings of unconsolidated affiliates | |
| Equity in earnings of unconsolidated affiliates | |
| Equity in earnings of unconsolidated affiliates | Equity in earnings of unconsolidated affiliates | 0.1 | % | | 6.3 | % | | — | % | | 0.2 | % | | 7.1 | % | | — | % | |
| Operating expenses: | Operating expenses: | | |
| Operating expenses: | |
| Operating expenses: | |
| Salaries, wages and benefits | |
| Salaries, wages and benefits | |
| Salaries, wages and benefits | Salaries, wages and benefits | 50.2 | % | | 25.3 | % | | 52.4 | % | | 48.5 | % | | 25.4 | % | | 53.4 | % | |
| Supplies | Supplies | 16.4 | % | | 26.8 | % | | 0.3 | % | | 17.0 | % | | 25.2 | % | | 0.3 | % | |
| Supplies | |
| Supplies | |
| Other operating expenses, net | |
| Other operating expenses, net | |
| Other operating expenses, net | Other operating expenses, net | 22.7 | % | | 13.5 | % | | 19.5 | % | | 23.2 | % | | 14.3 | % | | 18.2 | % | |
| Depreciation and amortization | Depreciation and amortization | 4.7 | % | | 3.4 | % | | 2.8 | % | | 4.7 | % | | 3.5 | % | | 3.0 | % | |
| Depreciation and amortization | |
| Depreciation and amortization | |
| Impairment and restructuring charges, and acquisition-related costs | |
| Impairment and restructuring charges, and acquisition-related costs | |
| Impairment and restructuring charges, and acquisition-related costs | Impairment and restructuring charges, and acquisition-related costs | 1.2 | % | | 0.6 | % | | 1.9 | % | | 0.3 | % | | 1.0 | % | | 1.5 | % | |
| Litigation and investigation costs | Litigation and investigation costs | 0.4 | % | | 0.1 | % | | 1.1 | % | | 0.6 | % | | 0.5 | % | | 0.2 | % | |
| Litigation and investigation costs | |
| Litigation and investigation costs | |
| Net gains on sales, consolidation and deconsolidation of facilities | |
| Net gains on sales, consolidation and deconsolidation of facilities | |
| Net gains on sales, consolidation and deconsolidation of facilities | Net gains on sales, consolidation and deconsolidation of facilities | — | % | | — | % | | — | % | | (2.7) | % | | (1.3) | % | | — | % | |
| Operating income | Operating income | 5.8 | % | | 36.7 | % | | 22.0 | % | | 9.5 | % | | 40.3 | % | | 23.4 | % | |
| | Operating income | |
| Operating income | |
Consolidated net operating revenues decreasedincreased by $311 million,$1.374 billion, or 1.6%7.2%, for the year ended December 31, 20222023 compared to the year ended December 31, 2021.2022. Our Hospital Operations segment’s net operating revenues net of inter‑segment eliminations, decreasedincreased by $890$757 million, or 5.7%4.8%, for the year ended December 31, 2022in 2023 compared to 2021,2022. This increase was primarily due todriven by the lossopening of revenues from the Miami Hospitals we soldour PMC Fort Mill Hospital in August 2021, lower overallSeptember 2022, a more favorable payer mix, higher patient volumes and decreased COVID-related volumes and acuity during 2022, partially offset by negotiated commercial rate increases.increases during 2023, and the adverse impact of an April 2022 cybersecurity incident (the “Cybersecurity Incident”) on patient volumes. Our Hospital Operations segment also recognized grant income from federal state and localstate grants totaling $15 million and $190 million and $142 million duringin the years ended December 31, 20222023 and 2021,2022, respectively, which is not included in net operating revenues.
Ambulatory Care net operating revenues increased by $530 million, or 19.5%, for the year ended December 31, 2022 compared to 2021. The change was primarily due to an increase from acquisitions of $453 million and same-facility growth of $146 million, which was attributable to the impact of higher patient volumes, incremental revenue from new service lines and negotiated commercial rate increases. These impacts were partially offset by $69 million of lower revenues compared to the prior‑year period due to the sale of the Ambulatory Care segment’s urgent care centers and the transfer of its imaging centers to the Hospital Operations segment in April 2021. Our Ambulatory Care segment also recognized grant income from federal grants totaling $4 million and $49 million during the years ended December 31, 2022 and 2021, respectively, which is not included in net operating revenues.
Conifer net operating revenues increased by $49 million, or 3.9%, for the year ended December 31, 2022 compared to 2021. Conifer revenues from third‑party clients, which revenues are not eliminated in consolidation, increased $80 million, or 10.2%, for the year ended December 31, 2022 compared to 2021. These increases were primarily due to contractual rate increases and new business expansion.
RESULTS OF OPERATIONS BY SEGMENT
Our operations are reported in threetwo segments:
•Hospital Operations, which is comprised of our acute care and specialty hospitals, imaging centers,a network of employed physicians and ancillary outpatient facilities, micro‑as well as the revenue cycle management and value-based care services that we provide to hospitals, health systems, physician practices, employers and physician practices;other clients; and
•Ambulatory Care, which is comprised of USPI’s ASCs and surgical hospitals; and
•Conifer, which provides revenue cycle management and value‑based care services to hospitals, health systems, physician practices, employers and other clients.hospitals.
Hospital Operations Segment
For the purpose of comparing our results of operations for the years ended December 31, 2023 and 2022, same‑hospital information includes the results of our same 60 hospitals operated throughout 2023 and 2022, and excludes the results of our PMC Fort Mill Hospital, as well as the results of our hospitals and other businesses classified as discontinued operations for accounting purposes during those years.
The following tables present operating statistics, revenues and expenses of our hospitals and related outpatient facilities on a same‑hospital basis, unless otherwise indicated:
| | Same-Hospital
Years Ended December 31, | | Increase
(Decrease) |
| | Same-Hospital
Years Ended December 31, | | | | Same-Hospital
Years Ended December 31, | | Increase
(Decrease) |
| Admissions, Patient Days and Surgeries | Admissions, Patient Days and Surgeries | | 2022 | | 2021 | | Increase
(Decrease) |
| Number of hospitals (at end of period) | Number of hospitals (at end of period) | | 60 | | | 60 | | |
| Number of hospitals (at end of period) | |
| Number of hospitals (at end of period) | | | 60 | | | 60 | | | — | | (1) |
| Total admissions | Total admissions | | 523,326 | | | 547,754 | | | (4.5) | % | |
Adjusted admissions(2) | | 962,029 | | | 973,552 | | | (1.2) | % | |
| Adjusted admissions | |
| Adjusted admissions | |
| Adjusted admissions | |
| Paying admissions (excludes charity and uninsured) | |
| Paying admissions (excludes charity and uninsured) | |
| Paying admissions (excludes charity and uninsured) | Paying admissions (excludes charity and uninsured) | | 497,990 | | | 518,515 | | | (4.0) | % | |
| Charity and uninsured admissions | Charity and uninsured admissions | | 25,336 | | | 29,239 | | | (13.3) | % | |
| Charity and uninsured admissions | |
| Charity and uninsured admissions | |
| Admissions through emergency department | Admissions through emergency department | | 395,309 | | | 409,440 | | | (3.5) | % | |
| Admissions through emergency department | |
| Admissions through emergency department | |
| Paying admissions as a percentage of total admissions | |
| Paying admissions as a percentage of total admissions | |
| Paying admissions as a percentage of total admissions | Paying admissions as a percentage of total admissions | | 95.2 | % | | 94.7 | % | | 0.5 | % | (1) | | 95.5 | % | | 95.2 | % | | 0.3 | % | (1) |
| Charity and uninsured admissions as a percentage of total admissions | Charity and uninsured admissions as a percentage of total admissions | | 4.8 | % | | 5.3 | % | | (0.5) | % | (1) | Charity and uninsured admissions as a percentage of total admissions | | 4.5 | % | | 4.8 | % | | (0.3) | % | (1) |
| Emergency department admissions as a percentage of total admissions | Emergency department admissions as a percentage of total admissions | | 75.5 | % | | 74.7 | % | | 0.8 | % | (1) | Emergency department admissions as a percentage of total admissions | | 75.0 | % | | 75.5 | % | | (0.5) | % | (1) |
| Surgeries — inpatient | Surgeries — inpatient | | 134,382 | | | 141,469 | | | (5.0) | % | |
| Surgeries — outpatient | Surgeries — outpatient | | 209,896 | | | 216,011 | | | (2.8) | % | |
| Surgeries — outpatient | |
| Surgeries — outpatient | |
| Total surgeries | |
| Total surgeries | |
| Total surgeries | Total surgeries | | 344,278 | | | 357,480 | | | (3.7) | % | |
| Patient days — total | Patient days — total | | 2,747,643 | | | 2,888,928 | | | (4.9) | % | |
Adjusted patient days(2) | | 4,883,616 | | | 5,016,029 | | | (2.6) | % | |
| Patient days — total | |
| Patient days — total | |
| Adjusted patient days | |
| Adjusted patient days | |
| Adjusted patient days | |
| Average length of stay (days) | |
| Average length of stay (days) | |
| Average length of stay (days) | Average length of stay (days) | | 5.25 | | | 5.27 | | | (0.4) | % | |
| Licensed beds (at end of period) | Licensed beds (at end of period) | | 15,372 | | | 15,379 | | | — | % | |
| Licensed beds (at end of period) | |
| Licensed beds (at end of period) | |
| Average licensed beds | Average licensed beds | | 15,381 | | | 15,396 | | | (0.1) | % | |
Utilization of licensed beds(3) | | 48.9 | % | | 51.4 | % | | (2.5) | % | (1) |
| Average licensed beds | |
| Average licensed beds | |
| Utilization of licensed beds | |
| Utilization of licensed beds | |
| Utilization of licensed beds | | | 48.8 | % | | 48.9 | % | | (0.1) | % | (1) |
| | | | | | | | |
| | |
| (1) | The change is the difference between the 2023 and 2022 and 2021 amounts shown.presented. |
| (2) | Adjusted admissions/patient days represents actual admissions/patient days adjusted to include outpatient services provided by facilities in our Hospital Operations segment by multiplying actual admissions/patient days by the sum of gross inpatient revenues and outpatient revenues and dividing the results by gross inpatient revenues.
| (3) | Utilization of licensed beds represents patient days divided by number of days in the period divided by average licensed beds.
| | | | | Same-Hospital
Years Ended December 31, | | Increase
(Decrease) | | | Same-Hospital
Years Ended December 31, | | Increase
(Decrease) |
| Outpatient Visits | Outpatient Visits | | 2022 | | 2021 | |
| Total visits | Total visits | | 5,063,852 | | | 5,319,994 | | | (4.8) | % | |
| Total visits | |
| Total visits | |
| Paying visits (excludes charity and uninsured) | |
| Paying visits (excludes charity and uninsured) | |
| Paying visits (excludes charity and uninsured) | Paying visits (excludes charity and uninsured) | | 4,752,208 | | | 4,964,084 | | | (4.3) | % | |
| Charity and uninsured visits | Charity and uninsured visits | | 311,644 | | | 355,910 | | | (12.4) | % | |
| Charity and uninsured visits | |
| Charity and uninsured visits | |
| Emergency department visits | |
| Emergency department visits | |
| Emergency department visits | Emergency department visits | | 2,166,242 | | | 2,034,405 | | | 6.5 | % | |
| Surgery visits | Surgery visits | | 209,896 | | | 216,011 | | | (2.8) | % | |
| Surgery visits | |
| Surgery visits | |
| Paying visits as a percentage of total visits | |
| Paying visits as a percentage of total visits | |
| Paying visits as a percentage of total visits | Paying visits as a percentage of total visits | | 93.8 | % | | 93.3 | % | | 0.5 | % | (1) | | 94.5 | % | | 94.2 | % | | 0.3 | % | (1) |
| Charity and uninsured visits as a percentage of total visits | Charity and uninsured visits as a percentage of total visits | | 6.2 | % | | 6.7 | % | | (0.5) | % | (1) | Charity and uninsured visits as a percentage of total visits | | 5.5 | % | | 5.8 | % | | (0.3) | % | (1) |
| | | | | | | | |
| | |
| (1) | The change is the difference between the 2023 and 2022 and 2021 amounts shown.presented. |
| | | | | | | | | | | | | | | | | | | | |
| | | Same-Hospital
Years Ended December 31, | | Increase
(Decrease) |
| Revenues | | 2023 | | 2022 | |
| Total segment net operating revenues | | $ | 16,591 | | | $ | 15,897 | | | 4.4 | % |
| Selected revenue data – hospitals and related outpatient facilities: | | | | | | |
| Net patient service revenues | | $ | 14,458 | | | $ | 13,818 | | | 4.6 | % |
| Net patient service revenue per adjusted admission | | $ | 14,664 | | | $ | 14,365 | | | 2.1 | % |
| Net patient service revenue per adjusted patient day | | $ | 2,985 | | | $ | 2,830 | | | 5.5 | % |
| | | | | | | | | | | | | | | | | | | | | |
| | | Same-Hospital
Years Ended December 31, | | Increase
(Decrease) |
| Selected Operating Expenses | | 2023 | | 2022 | |
| Salaries, wages and benefits | | $ | 8,151 | | | $ | 8,010 | | | 1.8 | % | |
| Supplies | | 2,533 | | | 2,399 | | | 5.6 | % | |
| Other operating expenses | | 3,948 | | | 3,542 | | | 11.5 | % | |
| | $ | 14,632 | | | $ | 13,951 | | | 4.9 | % | |
| | | | | | | | | | | | | | | | | | | | |
| | | Same-Hospital
Years Ended December 31, | | Increase
(Decrease) |
| Revenues | | 2022 | | 2021 | |
| Total segment net operating revenues | | $ | 14,464 | | | $ | 14,768 | | | (2.1) | % |
| Selected revenue data – hospitals and related outpatient facilities: | | | | | | |
| Net patient service revenues | | $ | 13,703 | | | $ | 14,043 | | | (2.4) | % |
Net patient service revenue per adjusted admission(1) | | $ | 14,244 | | | $ | 14,424 | | | (1.2) | % |
Net patient service revenue per adjusted patient day(1) | | $ | 2,806 | | | $ | 2,800 | | | 0.2 | % |
| | | | | | | | | | | | | | | | | | | | | | | |
| | | Same-Hospital
Years Ended December 31, | | Increase
(Decrease) |
| Selected Operating Expenses as a Percentage of Net Operating Revenues | | 2023 | | 2022 | |
| Salaries, wages and benefits | | 49.1 | % | | 50.4 | % | | (1.3) | % | (1) |
| Supplies | | 15.3 | % | | 15.1 | % | | 0.2 | % | (1) |
| Other operating expenses | | 23.8 | % | | 22.3 | % | | 1.5 | % | (1) |
| | | | | | | | |
| | |
(1) | Adjusted admissions/patient days represents actual admissions/patient days adjusted to include outpatient services provided by facilities in our Hospital Operations segment by multiplying actual admissions/patient days by the sum of gross inpatient revenues and outpatient revenues and dividing the results by gross inpatient revenues. |
| | | | | | | | | | | | | | | | | | | | | |
| | | Same-Hospital
Years Ended December 31, | | Increase
(Decrease) |
| Selected Operating Expenses | | 2022 | | 2021 | |
| Salaries, wages and benefits | | $ | 7,282 | | | $ | 7,227 | | | 0.8 | % | |
| Supplies | | 2,385 | | | 2,532 | | | (5.8) | % | |
| Other operating expenses | | 3,239 | | | 3,375 | | | (4.0) | % | |
| | $ | 12,906 | | | $ | 13,134 | | | (1.7) | % | |
| | | | | | | | | | | | | | | | | | | | | | | |
| | | Same-Hospital
Years Ended December 31, | | Increase
(Decrease) |
| Selected Operating Expenses as a Percentage of Net Operating Revenues | | 2022 | | 2021 | |
| Salaries, wages and benefits | | 50.3 | % | | 48.9 | % | | 1.4 | % | (1) |
| Supplies | | 16.5 | % | | 17.1 | % | | (0.6) | % | (1) |
| Other operating expenses | | 22.4 | % | | 22.9 | % | | (0.5) | % | (1) |
| | | | | | | | |
| | |
| (1) | The change is the difference between the 2023 and 2022 and 2021 amounts shown.presented. |
Revenues
Same‑hospital net operating revenues decreased $304increased by $694 million, or 2.1%4.4%, during the year ended December 31, 20222023 compared to the year ended December 31, 2021.previous year. This decreaseincrease was primarily due in part to lower overalla more favorable payer mix, higher patient volumes decreased COVID‑related volumes and acuity, andnegotiated commercial rate increases during the 2023 period, as well as the adverse impact of the Cybersecurity Incident on patient volumes partially offset by negotiated commercial rate increases.in 2022. Our Hospital Operations segment also recognized grant income from federal state and localstate grants totaling $190$15 million and $142$190 million in the years ended December 31, 20222023 and 2021,2022, respectively, which is not included in net operating revenues. Same‑hospital admissions and outpatient visits decreased by 4.5% and 4.8%, respectively, in the year ended December 31, 2022 compared to 2021, primarily due to the factors described above.
The following table presents our consolidated net accounts receivable by payer:
| | December 31, |
| | December 31, | | | | December 31, |
| | | | 2022 | | 2021 | | | 2023 | | 2022 |
| Medicare | Medicare | | $ | 166 | | | $ | 155 | |
| Medicaid | Medicaid | | 44 | | | 47 | |
| Net cost report settlements receivable and valuation allowances | Net cost report settlements receivable and valuation allowances | | 48 | | | 33 | |
| Managed care | Managed care | | 1,661 | | | 1,602 | |
| Self-pay uninsured | Self-pay uninsured | | 35 | | | 21 | |
| Self-pay balance after insurance | Self-pay balance after insurance | | 92 | | | 70 | |
| Estimated future recoveries | Estimated future recoveries | | 149 | | | 137 | |
| Other payers | Other payers | | 315 | | | 331 | |
| Total Hospital Operations | Total Hospital Operations | | 2,510 | | | 2,396 | |
| Ambulatory Care | Ambulatory Care | | 433 | | | 374 | |
| | Accounts receivable, net | Accounts receivable, net | | $ | 2,943 | | | $ | 2,770 | |
| Accounts receivable, net | |
| Accounts receivable, net | |
The collection of accounts receivable is a key area of focus for our business. At December 31, 2023 and 2022, our Hospital Operations segment collection rate on self‑pay accounts was approximately 29.9% and 29.5%., respectively. Our self‑pay collection rate includes payments made by patients, including co‑pays, co‑insurance amounts and deductibles paid by patients with insurance. Based on our accounts receivable from uninsured patients and co‑pays, co‑insurance amounts and deductibles owed to us by patients with insurance at December 31, 2022,2023, a 10% decrease or increase in our self‑pay collection rate, or approximately 3.0%, which we
believe could be a reasonably likely change, would result in an unfavorable or favorable adjustment to patient accounts receivable of approximately $11 million. There are various factors that can impact collection trends, such as changes in the economy and inflation, which in turn have an impact on unemployment rates and the number of uninsured and underinsured patients, the volume of patients through our emergency departments, the increased burden of co‑pays and deductibles to be made by patients with insurance, and business practices related to collection efforts. These factors, many of which have beenwere affected by the pandemic, continuously change and can have an impact on collection trends and our estimation process.
We also typically experience ongoing managed care payment delays and disputes; however, we continue to work with these payers to obtain adequate and timely reimbursement for our services. Our estimated Hospital Operations segment collection rate from managed care payers was approximately 96.7% and 95.7% at December 31, 2022.2023 and 2022, respectively.
We manage our implicit price concessions using hospital‑specific goals and benchmarks such as (1) total cash collections, (2) point‑of‑service cash collections, (3) AR Days and (4) accounts receivable by aging category. The following tables presenttable presents the approximate aging by payer of our net accounts receivable from the continuing operations of our Hospital Operations segment of $2.462$2.414 billion and $2.363$2.462 billion at December 31, 2023 and 2022, and 2021, respectively, excluding costrespectively. Cost report settlements receivable, net of payables and related valuation allowances, of $48$47 million and $33$48 million respectively, at December 31, 2023 and 2022, and 2021:respectively, are excluded from the table.
| | | Medicare | | Medicaid | | Managed
Care | | Indemnity,
Self-Pay
and Other | | Total |
| At December 31, 2022: | | | | | | | | | |
| Medicare | |
| Medicare | |
| Medicare | | | Medicaid | | Managed
Care | | Indemnity,
Self-Pay
and Other | | Total |
| At December 31, 2023: | |
| 0-60 days | |
| 0-60 days | |
| 0-60 days | 0-60 days | 90 | % | | 34 | % | | 56 | % | | 22 | % | | 50 | % | 93 | % | | 46 | % | | 58 | % | | 23 | % | | 54 | % |
| 61-120 days | 61-120 days | 5 | % | | 28 | % | | 16 | % | | 15 | % | | 15 | % | 61-120 days | 5 | % | | 23 | % | | 16 | % | | 14 | % | | 15 | % |
| 121-180 days | 121-180 days | 2 | % | | 16 | % | | 9 | % | | 7 | % | | 9 | % | 121-180 days | 1 | % | | 13 | % | | 9 | % | | 7 | % | | 8 | % |
| Over 180 days | Over 180 days | 3 | % | | 22 | % | | 19 | % | | 56 | % | | 26 | % | Over 180 days | 1 | % | | 18 | % | | 17 | % | | 56 | % | | 23 | % |
Total | Total | 100 | % | | 100 | % | | 100 | % | | 100 | % | | 100 | % | Total | 100 | % | | 100 | % | | 100 | % | | 100 | % | | 100 | % |
| | At December 31, 2021: | |
| At December 31, 2022: | |
| At December 31, 2022: | |
| At December 31, 2022: | |
| 0-60 days | |
| 0-60 days | |
| 0-60 days | 0-60 days | 93 | % | | 35 | % | | 57 | % | | 22 | % | | 52 | % | 90 | % | | 34 | % | | 56 | % | | 22 | % | | 50 | % |
| 61-120 days | 61-120 days | 4 | % | | 31 | % | | 18 | % | | 14 | % | | 16 | % | 61-120 days | 5 | % | | 28 | % | | 16 | % | | 15 | % | | 15 | % |
| 121-180 days | 121-180 days | 1 | % | | 14 | % | | 10 | % | | 9 | % | | 9 | % | 121-180 days | 2 | % | | 16 | % | | 9 | % | | 7 | % | | 9 | % |
| Over 180 days | Over 180 days | 2 | % | | 20 | % | | 15 | % | | 55 | % | | 23 | % | Over 180 days | 3 | % | | 22 | % | | 19 | % | | 56 | % | | 26 | % |
Total | Total | 100 | % | | 100 | % | | 100 | % | | 100 | % | | 100 | % | Total | 100 | % | | 100 | % | | 100 | % | | 100 | % | | 100 | % |
Conifer continuesWe continue to implement revenue cycle initiatives intended to improve our cash flow. These initiatives are focused on standardizing and improving patient access processes, including pre‑registration, registration, verification of eligibility and benefits, liability identification and collections at point‑of‑service, and financial counseling. These initiatives are intended to reduce denials, improve service levels to patients and increase the quality of accounts that end up in accounts receivable. Although we continue to focus on improving our methodology for evaluating the collectability of our accounts receivable, we may incur future charges if there are unfavorable changes in the trends affecting the net realizable value of our accounts receivable.
Patient advocates from Conifer’sour Eligibility and Enrollment Services program (“EES”) screen patients in the hospital to determine whether those patients meet eligibility requirements for financial assistance programs. They also expedite the process of applying for these government programs. Receivables from patients who are potentially eligible for Medicaid are classified as Medicaid pending, under the EES, net of appropriate implicit price concessions. Based on recent trends, approximately 97% of all accounts in the EES are ultimately approved for benefits under a government program, such as Medicaid.
The following table presents the approximate amount of accounts receivable in the EES still awaiting determination of eligibility under a government program at December 31, 2022 and 2021 by aging category:
| | | | | | | | | | | |
| December 31, |
| | 2022 | | 2021 |
| 0-60 days | $ | 79 | | | $ | 87 | |
| 61-120 days | 18 | | | 17 | |
| 121-180 days | 3 | | | 4 | |
| Over 180 days | 6 | | | 7 | |
Total | $ | 106 | | | $ | 115 | |
| | | | | | | | | | | |
| December 31, |
| | 2023 | | 2022 |
| 0-60 days | $ | 103 | | | $ | 79 | |
| 61-120 days | 33 | | | 18 | |
| 121-180 days | 9 | | | 3 | |
| Over 180 days | 16 | | | 6 | |
Total | $ | 161 | | | $ | 106 | |
Salaries, Wages and Benefits
Same‑hospital salaries, wages and benefits expense increased $55by $141 million, or 0.8%1.8%, in the year ended December 31, 20222023 compared to 2021.2022. This increasechange was primarily attributable to increased employee benefits, recruiting and retention costs, higher contract laborincentive compensation expense, and premium pay costs due to the pandemic, and annual merit increases for certain of our employees all of whichin 2023. These factors were partially offset by lower incentive compensation and employee benefit costs, as well as our continued focus on cost‑efficiency measures.a decrease in contract labor expense. Same‑hospital salaries, wages and benefits expense as a percentage of net operating revenues increaseddecreased by 140130 basis points to 50.3%49.1% in the year ended December 31, 20222023 compared to the year ended December 31, 2021. This increase was primarily due to the impact of higher contract labor and premium pay costs, decreased patient volumes, and the Cybersecurity Incident on our patient revenues during the 2022 period.2022. Salaries, wages and benefits expense for the years ended December 31, 20222023 and 20212022 included stock‑based compensation expense of $43$46 million and $41$45 million, respectively.
Supplies
Same‑hospital supplies expense decreased $147increased by $134 million, or 5.8%5.6%, in the year ended December 31, 20222023 compared to 2021. The decrease2022. This increase was primarily attributable to lower overalldriven by higher patient and surgical volumes, reduced COVID‑related volumes and acuity, and our cost‑efficiency measures, partially offset by the increased cost of certain supplies as a result of the COVID‑19 pandemic,well as the impact of general market conditions and inflation.on the cost of medical supplies during 2023, partially offset by the cost‑efficiency measures discussed below. Same‑hospital supplies expense as a percentage of net operating revenues decreasedincreased by 6020 basis points to 16.5%15.3% in the year ended December 31, 20222023 compared to the year ended December 31, 2021, primarily due to the factors described above.2022.
The pandemic created supply‑chain disruptions, including shortages and delays, as well as significant price increases in medical supplies. During the year ended December 31, 2022, general market conditions and inflation also increased the cost of medical supplies. We strive to control supplies expense through product standardization, consistent contract terms and end‑to‑end contract management, improved utilization, bulk purchases, focused spending with a smaller number of vendors and operational improvements. The items of current cost‑reduction focus include cardiac stents and pacemakers, orthopedics, implants and high‑cost pharmaceuticals.
Other Operating Expenses, Net
Same‑hospital other operating expenses decreasedincreased by $136$406 million, or 4.0%11.5%, in the year ended December 31, 20222023 compared to 2021. 2022. Other operating expenses for the year ended December 31, 2022 were reduced by net gains of $120 million primarily related to the sale of several medical office buildings and the sale of a portion of an interest in certain assets, whereas net gains recognized in 2023 were $21 million. The changes in other operating expenses during the year ended December 31, 2023 also included:
•$125 million more of medical fees;
•an increase of $89 million in malpractice expense;
•higher software costs of $35 million; and
•a $31 million increase in repair and maintenance costs.
Same‑hospital other operating expenses as a percentage of net operating revenues decreasedincreased by 50150 basis points to 22.4%23.8% in the year ended December 31, 20222023 compared to 22.9%22.3% in the year ended December 31, 2021, primarily due to the net gains from the sale of assets noted below. The changes in other operating expenses included:
•an increase in gains from the sale of assets of $102 million, which were classified as a reduction of other operating expenses, net; and
•decreased malpractice expense of $51 million.
For the years ended December 31, 2022 and 2021, other2022. Other operating expenses for our Hospital Operations segment included $273$278 million and $280$287 million respectively, of rent expense.expense for the years ended December 31, 2023 and 2022, respectively.
Ambulatory Care Segment
Our Ambulatory Care segment is comprised of USPI’s ASCs and surgical hospitals. USPI operates its surgical facilities in partnership with local physicians and, in many of these facilities, a health system partner. WeIn most cases, we hold an ownership interestinterests in each facility, with each being operatedthe facilities and operate them through a separate legal entity in most cases.entity. USPI operates facilities on a day‑to‑day basis through management services contracts. Our sources of earnings from each facility consist of:
•management and administrative services revenues from the facilities USPI operates through management services contracts, usually computed as a percentage of each facility’s net revenues; and
•our share of each facility’s net income (loss), which is computed by multiplying the facility’s net income (loss) times the percentage of each facility’s equity interests owned by USPI.
Our role as an owner and day‑to‑day manager provides us with significant influence over the operations of each facility. For many of the facilities our Ambulatory Care segment holds an ownership interest in (158(155 of 466485 facilities at December 31, 2022)2023), this influence does not represent control of the facility, so we account for our investment in the facilityeach of these facilities under the equity method for an unconsolidated affiliate. USPI controls 308330 of the facilities our Ambulatory Care segment operates, and we account for these investments as consolidated subsidiaries. Our net earnings from a facility are the same under either method, but the classification of those earnings differs. For consolidated subsidiaries, our financial statements reflect
100% of the revenues and expenses of the subsidiaries, after the elimination of intercompany amounts.subsidiaries. The net profit attributable to owners other than USPI is classified within net income available (loss attributable) to noncontrolling interests.
For unconsolidated affiliates, our statements of operations reflect our earnings in two line items:
•equity in earnings of unconsolidated affiliates—our share of the net income (loss) of each facility, which is based on the facility’s net income (loss) and the percentage of the facility’s outstanding equity interests owned by USPI; and
•management and administrative services revenues, which is included in our net operating revenues—income we earn in exchange for managing the day‑to‑day operations of each facility, usually quantifiedcomputed as a percentage of each facility’s net revenues.
Our Ambulatory Care segmentsegment’s operating income is driven by the performance of all facilities USPI operates and by USPI’s ownership interests in those facilities, but our individual revenue and expense line items contain only consolidated businesses, which represent 66%68% of those facilities. This translates to trends in consolidated operating income that often do not correspond with changes in consolidated revenues and expenses, which is why we disclose certain statistical and financial data on a pro forma systemwide basis that includes both consolidated and unconsolidated (equity method) facilities.
Our unconsolidated facilities received cash payments from the PRF during 2021, and we recognized grant income of $14 million from these funds; this income is included in equity in earnings of unconsolidated affiliates in the accompanying Consolidated Statement of Operations for the year ended December 31, 2021. No additional grant income was recognized from our unconsolidated facilities during the year ended December 31, 2022.
Year Ended December 31, 2022 Compared to the Year Ended December 31, 2021
The following table presents selected revenue and expense information for our Ambulatory Care segment:
| | | | | Years Ended December 31, | | Increase
(Decrease) | | | Years Ended December 31, | | Increase
(Decrease) |
| 2022 | | 2021 | |
| | 2023 | |
| Net operating revenues | |
| Net operating revenues | |
| Net operating revenues | Net operating revenues | | $ | 3,248 | | | $ | 2,718 | | | 19.5 | % | | $ | 3,865 | | | $ | | $ | 3,248 | | | 19.0 | | 19.0 | % |
| Grant income | Grant income | | $ | 4 | | | $ | 49 | | | (91.8) | % | Grant income | | $ | 1 | | | $ | | $ | 4 | | | (75.0) | | (75.0) | % |
| Equity in earnings of unconsolidated affiliates | Equity in earnings of unconsolidated affiliates | | $ | 206 | | | $ | 193 | | | 6.7 | % | Equity in earnings of unconsolidated affiliates | | $ | 218 | | | $ | | $ | 206 | | | 5.8 | | 5.8 | % |
| Salaries, wages and benefits | Salaries, wages and benefits | | $ | 822 | | | $ | 690 | | | 19.1 | % | Salaries, wages and benefits | | $ | 964 | | | $ | | $ | 822 | | | 17.3 | | 17.3 | % |
| Supplies | Supplies | | $ | 871 | | | $ | 684 | | | 27.3 | % | Supplies | | $ | 1,045 | | | $ | | $ | 871 | | | 20.0 | | 20.0 | % |
| Other operating expenses, net | Other operating expenses, net | | $ | 438 | | | $ | 389 | | | 12.6 | % | Other operating expenses, net | | $ | 531 | | | $ | | $ | 438 | | | 21.2 | | 21.2 | % |
Revenues
Our Ambulatory Care net operating revenues increased by $530$617 million, or 19.5%19.0%, during the year ended December 31, 20222023 compared to 2021.2022. The change was driven by an increase from acquisitions of $453$355 million, as well as ana $308 million increase in same‑facility net operating revenues, of $146 million, which was attributable to the impact of improved case volumes,volume, incremental revenue from new service lines and negotiated commercial rate increases. These impacts were partially offset by lowera decrease of $46 million in revenues of $69 million due primarily to the sale or closure of USPI’s urgent care centers and the transfer of imaging centers to the Hospital Operations segment, both in April 2021.facilities. Our Ambulatory Care segment also recognized grant income from federal grants totaling $4$1 million and $49$4 million during the years ended December 31, 20222023 and 2021,2022, respectively, which is not included in net operating revenues.
Salaries, Wages and Benefits
Salaries, wages and benefits expense increased by $132$142 million, or 19.1%17.3%, during the year ended December 31, 20222023 compared to 2021.2022. Salaries, wages and benefits expense was impacted by an increase from acquisitions of $121$76 million and an increase in same‑facility salaries, wages and benefits expense of $41$77 million due primarily to higher surgical case volumes. These increases were partially offset by a decrease of $30$11 million due primarily to the sale or closure of USPI’s urgent care centers and the transfer of imaging centers to the Hospital Operations segment.facilities. Salaries, wages and benefits expense as a percentage of net operating revenues decreased 10by 30 basis points duringfrom 25.3% in the year ended December 31, 2022 compared to 202125.0% in the year ended December 31, 2023. Salaries, wages and benefits expense included stock‑based compensation expense of $20 million and $11 million for 2023 and $13 million,2022, respectively.
Supplies
Supplies expense increased by $187$174 million, or 27.3%20.0%, during the year ended December 31, 20222023 compared to 2021.2022. The change was driven by an increase from acquisitions of $161$103 million, as well as an increase in same‑facility supplies expense of $32$81 million due primarily to an increase in surgical cases at our consolidated centers and higher pricing of certain supplies as a result of the pandemic, the impact of general market conditions and inflation. These increases were partially offset by a decrease of $10 million primarily due to the sale or closure of facilities. Supplies expense as a percentage of net operating revenues increased 160by 20 basis points from 25.2% in the year ended December 31, 2021 to 26.8% in the year ended December 31, 2022. This change was driven by an increase2022 to 27.0% in higher‑acuity, supply‑intensive surgeries and higher pricing of certain supplies.the year ended December 31, 2023.
Other Operating Expenses, Net
Other operating expenses increased by $49$93 million, or 12.6%21.2%, during the year ended December 31, 20222023 compared to 2021.2022. The change was primarily driven by an increase from acquisitions of $61$55 million, and an increase in same-facility other operating costs of $45 million, partially offset by a decrease of $18$7 million due primarily to the sale or closure of USPI’s urgent care centers and the transfer of imaging centers to the Hospital Operations segment.facilities. Other operating expenses, net as a percentage of net operating revenues decreasedincreased from 14.3% during13.5% for the year ended December 31, 20212022 to 13.5%13.7% for 2022.2023. Other operating expenses for our Ambulatory Care segment included $115$130 million and $100$115 million of rent expense for the years ended December 31, 20222023 and 2021,2022, respectively.
Facility Growth
The following table summarizes thepresents year-over-year changes in our same‑facility revenue and cases on a pro forma systemwide basis, which includes both consolidated and unconsolidated (equity method) facilities. While we do not record the revenues of unconsolidated facilities, we believe this information is important in understanding the financial performance of our
Ambulatory Care segment because these revenues are the basis for calculating our management services revenues and, together with the expenses of our unconsolidated facilities, are the basis for our equity in earnings of unconsolidated affiliates.
| | | | | | | | | | | |
| | | Year Ended December 31, 20222023 |
| Net revenues | | | 9.2 | 4.6%% |
| Cases | | | 5.6 | 2.0%% |
| Net revenue per case | | | 3.4 | 2.5%% |
Joint Ventures with Health System Partners
USPI’s business model is to jointly own its facilities with local physicians and, in many of these facilities, a health system partner. Accordingly, as of December 31, 2022, the majority of facilities in our Ambulatory Care segment were operated in this model.
The table below summarizes the amounts we paid to acquire various ownership interests in ambulatory care facilities:
| | | | | | | | | | | | | | | | | | | | |
| | | Years Ended December 31, | | Increase
(Decrease) |
| | 2022 | | 2021 | |
| Controlling interests | | $ | 234 | | | $ | 1,219 | | | $ | (985) | |
| Noncontrolling interests | | 9 | | | 79 | | | (70) | |
| Equity investment in unconsolidated affiliates and consolidated facilities | | 21 | | | 17 | | | 4 | |
| | $ | 264 | | | $ | 1,315 | | | $ | (1,051) | |
The table below provides information about the ownership structure of the facilities operated by our Ambulatory Care segment:
| | | | | | | | | | | |
| | | December 31, 20222023 |
WithOwned with a health system partner | | | 208206 | |
WithoutOwned without a health system partner | | | 258279 | |
Total facilities operated | | | 466485 | |
| | | |
| | | |
| | | |
| | | |
| | | |
| | | |
Facility Acquisitions and Investment
The table below presents the aggregate amounts we paid to acquire various ownership interests in ambulatory care facilities:
60
| | | | | | | | | | | | | | | | |
| | | Years Ended December 31, | | |
| | 2023 | | 2022 | |
| Controlling interests | | $ | 149 | | | $ | 234 | | | |
| Noncontrolling interests | | 2 | | | 9 | | | |
| Equity investment in unconsolidated affiliates and consolidated facilities | | 21 | | | 21 | | | |
| | $ | 172 | | | $ | 264 | | | |
The table below reflects the change in the number of facilities operated by our Ambulatory Care segment since December 31, 2021:2022:
| | | | | | | | | | | |
| | | Year Ended December 31, 20222023 |
| | | |
| | | |
| | | |
| | | |
| | | |
| Acquisitions | | | 3721 | |
| De novo | | | 159 | |
| Dispositions/Mergers | | | (9)(11) | |
TotalNet increase in number of facilities operated | | 4319 | |
During the year ended December 31, 2022,2023, we acquired controlling interests in 30 fully operational20 ASCs, 16 of which aresix located in Maryland, fourOhio, three in Florida,Arizona, two in each of Arizona, ColoradoCalifornia, Florida and Tennessee,Texas, and fourone in each of five geographically diverse states. In addition, we acquired a noncontrolling interest in an ASC located in other states. All ofTexas in which we previously did not have an investment. Of these facilities, 19 are jointly owned with physicians, except one that isand two are jointly owned with a health system partner and physicians. During 2022,2023, we also acquired noncontrollingcontrolling ownership interests in seven ASCs, three of which are located in Texas, two in Washington and one in each of California and New Jersey. In total, we paid $178 million to acquire controlling and noncontrolling interests in these facilities.
In addition, during the year ended December 31, 2022, we11 previously unconsolidated ASCs. We paid an aggregate of $65$151 million to acquire controlling ownership interests in 23 previously unconsolidated ASCs located in 11 geographically diverse states. Following our acquisitionall of a controlling interest in one of these ASCs, we contributed our ownership interest in it to a joint venture in which we have a noncontrolling ownership interest.the aforementioned facilities.
We also regularly engage in the purchase of equity interests with respect to our investments in unconsolidated affiliates and consolidated facilities that do not result in a change in control. These transactions are primarily the acquisitions of equity interests in ASCs and the investment of additional cash in facilities that need capital for new acquisitions, new construction or other business growth opportunities. During the year ended December 31, 2022,2023, we invested approximately $21 million in such transactions.
ConiferSegment
The following table presents selected revenue and expense information for our Conifer segment:
| | | | | | | | | | | | | | | | | | | | |
| | | Years Ended December 31, | | Increase
(Decrease) |
| | 2022 | | 2021 | |
| Revenue cycle and other services – Tenet | | $ | 451 | | | $ | 482 | | | (6.4) | % |
| Revenue cycle and other services – other customers | | $ | 865 | | | $ | 785 | | | 10.2 | % |
| Salaries, wages and benefits | | $ | 689 | | | $ | 677 | | | 1.8 | % |
| Supplies | | $ | 4 | | | $ | 4 | | | — | % |
| Other operating expenses | | $ | 258 | | | $ | 231 | | | 11.7 | % |
Revenues
Our Conifer segment’s operating revenues from third-party clients, which revenues are not eliminated in consolidation, increased $80 million, or 10.2%, for the year ended December 31, 2022 compared to 2021. This increase was primarily attributable to contractual rate increases and new business expansion.
Salaries, Wages and Benefits
Salaries, wages and benefits expense for Conifer increased $12 million, or 1.8%, in the year ended December 31, 2022 compared to 2021. Salaries, wages and benefits expense included stock‑based compensation expense of $2 million in both 2022 and 2021.
Other Operating Expenses, Net
Other operating expenses for Conifer increased $27 million, or 11.7%, in the year ended December 31, 2022 compared to 2021. This increase was primarily due to new business expansion, higher vendor utilization and increased recruiting expenses in 2022. For both of the years ended December 31, 2022 and 2021, other operating expenses for our Conifer segment included $10 million of rent expense.
Consolidated
Impairment and Restructuring Charges, and Acquisition-Related Costs
The following table presents information about our impairment and restructuring charges, and acquisition‑related costs:
| | Years Ended December 31, | |
| 2022 | | 2021 | |
| | Years Ended December 31, | | | | Years Ended December 31, |
| | 2023 | | | | 2023 | | 2022 |
| Consolidated: | Consolidated: | | | | | | Consolidated: | | |
| Impairment charges | Impairment charges | | $ | 94 | | | $ | 8 | | |
| Restructuring charges | Restructuring charges | | 118 | | | 57 | | |
| Acquisition-related costs | Acquisition-related costs | | 14 | | | 20 | | |
| Total impairment and restructuring charges, and acquisition-related costs | Total impairment and restructuring charges, and acquisition-related costs | | $ | 226 | | | $ | 85 | | |
| | By segment: | By segment: | | |
| By segment: | |
| By segment: | |
| Hospital Operations | |
| Hospital Operations | |
| Hospital Operations | Hospital Operations | | $ | 180 | | | $ | 39 | | |
| Ambulatory Care | Ambulatory Care | | 21 | | | 27 | | |
| Conifer | | 25 | | | 19 | | |
| | Total impairment and restructuring charges, and acquisition-related costs | Total impairment and restructuring charges, and acquisition-related costs | | $ | 226 | | | $ | 85 | | |
| Total impairment and restructuring charges, and acquisition-related costs | |
| Total impairment and restructuring charges, and acquisition-related costs | |
Impairment charges for the year ended December 31, 2023 were comprised of $42 million from our Ambulatory Care segment, primarily associated with the write‑down of certain equity method investments held by that segment, and $1 million from our Hospital Operations segment. Restructuring charges for the year ended December 31, 2023 consisted of $36 million of legal costs related to the sale of certain businesses, $15 million of employee severance costs, $12 million related to the transition of various administrative functions to our GBC, $10 million of contract and lease termination fees, and $6 million of other restructuring costs. Acquisition‑related costs during 2023 consisted entirely of transaction costs.
Impairment charges duringfor the year ended December 31, 2022 included $82 million for the write‑down of certain buildings and medical equipment located in one of our markets to their estimated fair values. Material adverse trends in our estimates of future undiscounted cash flows of the hospitals indicated the aggregate carrying value of the hospitals’ long‑lived assets was not recoverable from their estimated future cash flows. We believe the most significant factors contributing to the adverse financial trends included decreased revenues and lower patient volumes due to the pandemic and competition, as well as higher labor costs as a resultbecause of the pandemic. As a result, we updated the estimate of the fair value of the hospitals’ long‑lived assets and compared it to the aggregate carrying value of those assets. Because the fair value estimates were lower than the aggregate carrying value of the long‑lived assets, an impairment charge was recorded for the difference in the amounts. We also recorded $12 million of other impairment charges. For additional discussion, see Note 6 to the accompanying Consolidated Financial Statements. Impairment charges for the year ended December 31, 2022 were comprised of $86$88 million from our Hospital Operations segment and $6 million from our Ambulatory Care segment and $2 million from our Conifer segment.
Restructuring charges for the year ended December 31, 2022 consisted of $27 million of employee severance costs, $16 million related to the transition of various administrative functions to our GBC, $32 million related to contract and lease termination fees, and $43 million of other restructuring costs. Acquisition‑related costs during 2022 consisted entirely of transaction costs.
Impairment charges for the year ended December 31, 2021 were comprised of $5 million from our Ambulatory Care segment, primarily related to the impairment of certain management contract intangible assets, and $3 million from our Conifer segment. Restructuring charges during the year ended December 31, 2021 consisted of $14 million of employee severance costs, $19 million related to the transition of various administrative functions to our GBC and $24 million of other restructuring costs. Acquisition‑related costs during 2021 consisted entirely of transaction costs.
Our impairment tests presume stable, improving or, in some cases, declining operating results in our facilities, which are based on programs and initiatives being implemented that are designed to achieve each facility’s most recent projections. If these projections are not met, or negative trends occur that impact our future outlook, future impairments of long-lived assets and goodwill may occur, and we may incur additional restructuring charges, which could be material.
Litigation and Investigation Costs
Litigation and investigation costs for the years ended December 31, 2023 and 2022 were $47 million and 2021 were $70 million, and $116 million, respectively. The decrease of $46 million, or 39.7%, in 2022 as compared to 2021 was primarily due to higher costs associated with legal proceedings and governmental investigations during 2021. See Note 17 to the accompanying Consolidated Financial Statements for additional information.
Net Gains on Sales, Consolidation and Deconsolidation of Facilities
We recognized a net gain of $23 million from the sale, consolidation and deconsolidation of facilities during the year ended December 31, 2023, which primarily arose from the consolidation of facilities by our Ambulatory Care segment. During the year ended December 31, 2021,2022, we recorded net gains on sales, consolidation and deconsolidation of facilities of $445 million, primarily comprised ofrecognized a gain of $406 million related to the sale$1 million.
Interest Expense
Interest expense for the year ended December 31, 20222023 was $890$901 million compared to $923$890 million for the year ended December 31, 2021.2022.
Loss from Early Extinguishment of Debt
We recorded losses from the early extinguishment of debt totaling $11 million during the year ended December 31, 2023. These losses related to the redemption of all of the outstanding principal of our September 2024 Senior Secured First Lien Notes in May 2023 and our July 2024 Senior Secured First Lien Notes in June 2023, in each case in advance of the notes’ maturity dates.
During the year ended December 31, 2022, we incurred aggregatenet losses from the early extinguishment of debt of $109 million. TheseThe net losses primarily related to the redemption in full of our 7.500% senior secured first lien notes due 2025 (“2025 Senior Secured First Lien Notes”) in February 2022 and open market purchases and the subsequent redemption in full of our 6.750% senior unsecured notes due 2023 (the “2023 Senior Unsecured Notes”) during the six months ended June 30, 2022.
DuringIn both 2023 and 2022, the year ended December 31, 2021, we incurred aggregate losses from the early extinguishment of debt of $74 million. These losses related to the partial redemption of our July 2024 Senior Secured First Lien Notes in September 2021, the redemption in full of our 5.125% senior secured second lien notes due 2025 (the “2025 Senior Secured Second Lien Notes”) in June 2021 and the retirement in full of our 7.000% senior unsecured notes due 2025 (“2025 Senior Unsecured Notes”) in March 2021.
In both 2022 and 2021, the net losses from early extinguishment of debt primarily related to the differencedifferences between the purchase or redemption prices and the par values of the notes, as well as the write‑off of associated unamortized issuance costs.
Income Tax Expense
During the year ended December 31, 2022,2023, we recorded income tax expense of $306 million in continuing operations on pre‑tax income of $1.617 billion compared to income tax expense of $344 million in continuing operations on pre‑tax income of $1.344 billion compared to income tax expense of $411 million in continuing operations on pre‑tax income of $1.888 billion during the year ended December 31, 2021.2022.
A reconciliation between the amount of reported income tax expense and the amount computed by multiplying income from continuing operations before income taxes by the statutory federal tax rate is presented below:
| | | | Years Ended December 31, | | Years Ended December 31, |
| | | 2022 | | 2021 | | 2023 | | 2022 |
| Tax expense at statutory federal rate of 21% | Tax expense at statutory federal rate of 21% | $ | 282 | | | $ | 396 | |
| State income taxes, net of federal income tax benefit | State income taxes, net of federal income tax benefit | 64 | | | 77 | |
| | Tax benefit attributable to noncontrolling interests | Tax benefit attributable to noncontrolling interests | (122) | | | (114) | |
| Tax benefit attributable to noncontrolling interests | |
| Tax benefit attributable to noncontrolling interests | |
| Nondeductible goodwill | Nondeductible goodwill | 1 | | | 35 | |
| Nondeductible executive compensation | Nondeductible executive compensation | 10 | | | 8 | |
| Nondeductible litigation costs | — | | | 1 | |
| Impact of change in state filing method, net of change in unrecognized tax benefit | |
| | Stock-based compensation tax benefit | |
| | Stock-based compensation tax benefit | |
| | Stock-based compensation tax benefit | Stock-based compensation tax benefit | (6) | | | (5) | |
| Changes in valuation allowance | Changes in valuation allowance | 120 | | | 2 | |
| | Prior-year provision to return adjustments and other changes in deferred taxes | Prior-year provision to return adjustments and other changes in deferred taxes | (12) | | | 8 | |
| Other items | Other items | 7 | | | 3 | |
| Income tax expense | Income tax expense | $ | 344 | | | $ | 411 | |
During the year ended December 31, 2023, the valuation allowance increased by $71 million, including an increase of $73 million due to limitations on the tax deductibility of interest expense and a decrease of $2 million due to changes in the expected realizability of deferred tax assets. The balance in the valuation allowance as of December 31, 2023 was $248 million.
A change in the business interest expense disallowance rules took effect in 2022, resulting in a larger amount of interest disallowance compared to prior years. During the year ended December 31, 2022, the valuation allowance increased by $120 million, including an increase of $123 million due to limitations on the tax deductibility of interest expense, a decrease of $1 million due to the expiration or worthlessness of unutilized net operating loss carryovers, and a decrease of $2 million due to changes in the expected realizability of deferred tax assets. The balance in the valuation allowance as of December 31, 2022 was $177 million. During the year ended December 31, 2021, the valuation allowance increased by $2 million, including an increase of $2 million due to limitations on the tax deductibility of interest expense, a decrease of $2 million due to the expiration or worthlessness of unutilized state net operating loss carryovers, and an increase of $2 million due to changes in the
expected realizability of deferred tax assets. The remaining balance in the valuation allowance at December 31, 2021 was $57 million.
Net Income Available to Noncontrolling Interests
Net income available to noncontrolling interests was $700 million for the year ended December 31, 2023 compared to $590 million for the year ended December 31, 2022 compared to $562 million for the year ended December 31, 2021.2022. Net income available to noncontrolling interests in 20222023 was comprised of $469$586 million related to our Ambulatory Care segment $77 million related to our Conifer segment and $44$114 million related to our Hospital Operations segment. Of the portion related to our Ambulatory Care segment, $9 million related to the minority interest Baylor held in USPI until June 30, 2022.
ADDITIONAL SUPPLEMENTAL NON-GAAP DISCLOSURES
The financial information provided throughout this report, including our Consolidated Financial Statements and the notes thereto, has been prepared in conformity with accounting principles generally acceptedAs noted in the United States of America (“GAAP”). However,introduction to MD&A, we use certain non‑GAAP financial measures, defined belowincluding Adjusted EBITDA, in this report and in communications with investors, analysts, rating agencies, banks and others to assist such parties in understanding the impact of various items on our financial statements, some of which are recurring or involve cash payments. We use this information in our analysis of the performance of our business, excluding items we do not consider relevant to the performance of our continuing operations. In addition, we use these measures to define certain performance targets under our compensation programs.
“Adjusted EBITDA” is a non‑GAAP measure we define as net income available (loss attributable) to Tenet Healthcare Corporation common shareholders before (1) the cumulative effect of changes in accounting principle, (2) net loss attributable (income available) to noncontrolling interests, (3) income (loss) from discontinued operations, net of tax, (4) income tax benefit (expense), (5) gain (loss) from early extinguishment of debt, (6) other non‑operating income (expense), net, (7) interest expense, (8) litigation and investigation (costs) benefit, net of insurance recoveries, (9) net gains (losses) on sales, consolidation and deconsolidation of facilities, (10) impairment and restructuring charges and acquisition‑related costs, (11) depreciation and amortization, and (12) income (loss) from divested and closed businesses (i.e., health plan businesses). Litigation and investigation costs do not include ordinary course of business malpractice and other litigation and related expense.
statements. We believe the foregoing non‑GAAP measureAdjusted EBITDA is useful to investors and analysts because it presents additional information about our financial performance. Investors, analysts, company management and our board of directors utilize this non‑GAAP measure, in addition to GAAP measures, to track our financial and operating performance and compare that performance to peer companies, which utilize similar non‑GAAP measures in their presentations. The human resources committee of our board of directors also uses certain non‑GAAP measures to evaluate management’s performance for the purpose of determining incentive compensation. We believe that Adjusted EBITDA is a useful measure, in part, because certain investors and analysts use both historical and projected Adjusted EBITDA, in addition to GAAP and other non‑GAAP measures, as factors in determining the estimated fair value of shares of our common stock. Company management also regularly reviews the Adjusted EBITDA performance for each operatingreporting segment. We do not use Adjusted EBITDA to measure liquidity, but instead to measure operating performance. The non‑GAAP Adjusted EBITDA measure we utilize may not be comparable to similarly titled measures reported by other companies. Because this measure excludes many items that are included in our financial statements, it does not provide a complete measure of our operating performance. Accordingly, investors are encouraged to use GAAP measures when evaluating our financial performance.
The following table presents the reconciliation of Adjusted EBITDA to net income available to Tenet Healthcare Corporation common shareholders (the most comparable GAAP term):
| | | | Years Ended December 31, |
| | | 2022 | | 2021 |
| | Years Ended December 31, | |
| | Years Ended December 31, | |
| | Years Ended December 31, | |
| | 2023 | |
| Net income available to Tenet Healthcare Corporation common shareholders | Net income available to Tenet Healthcare Corporation common shareholders | | $ | 411 | | | $ | 914 | |
| Less: Net income available to noncontrolling interests | | (590) | | | (562) | |
| Income (loss) from discontinued operations, net of tax | | 1 | | | (1) | |
| Net income available to Tenet Healthcare Corporation common shareholders | |
| Net income available to Tenet Healthcare Corporation common shareholders | |
| Less: | |
| Less: | |
| Less: | |
| Net income available to noncontrolling interests | |
| Net income available to noncontrolling interests | |
| Net income available to noncontrolling interests | |
| Income from discontinued operations, net of tax | |
| Income from discontinued operations, net of tax | |
| Income from discontinued operations, net of tax | |
| Income from continuing operations | |
| Income from continuing operations | |
| Income from continuing operations | Income from continuing operations | | 1,000 | | | 1,477 | |
| Income tax expense | Income tax expense | | (344) | | | (411) | |
| Income tax expense | |
| Income tax expense | |
| Loss from early extinguishment of debt | |
| Loss from early extinguishment of debt | |
| Loss from early extinguishment of debt | Loss from early extinguishment of debt | | (109) | | | (74) | |
| Other non-operating income, net | Other non-operating income, net | | 10 | | | 14 | |
| Other non-operating income, net | |
| Other non-operating income, net | |
| Interest expense | |
| Interest expense | |
| Interest expense | Interest expense | | (890) | | | (923) | |
| Operating income | Operating income | | 2,333 | | | 2,871 | |
| Operating income | |
| Operating income | |
| Litigation and investigation costs | |
| Litigation and investigation costs | |
| Litigation and investigation costs | Litigation and investigation costs | | (70) | | | (116) | |
| Net gains on sales, consolidation and deconsolidation of facilities | Net gains on sales, consolidation and deconsolidation of facilities | | 1 | | | 445 | |
| Net gains on sales, consolidation and deconsolidation of facilities | |
| Net gains on sales, consolidation and deconsolidation of facilities | |
| Impairment and restructuring charges, and acquisition-related costs | |
| Impairment and restructuring charges, and acquisition-related costs | |
| Impairment and restructuring charges, and acquisition-related costs | Impairment and restructuring charges, and acquisition-related costs | | (226) | | | (85) | |
| Depreciation and amortization | Depreciation and amortization | | (841) | | | (855) | |
| Loss from divested and closed businesses | | — | | | (1) | |
| Depreciation and amortization | |
| Depreciation and amortization | |
| | Adjusted EBITDA | Adjusted EBITDA | | $ | 3,469 | | | $ | 3,483 | |
| | Adjusted EBITDA | |
| | Adjusted EBITDA | |
| | Net operating revenues | |
| | Net operating revenues | |
| | Net operating revenues | Net operating revenues | | $ | 19,174 | | | $ | 19,485 | |
| | | Net income available to Tenet Healthcare Corporation common shareholders as a % of net operating revenues | Net income available to Tenet Healthcare Corporation common shareholders as a % of net operating revenues | | 2.1 | % | | 4.7 | % |
| | | Net income available to Tenet Healthcare Corporation common shareholders as a % of net operating revenues | |
| | Net income available to Tenet Healthcare Corporation common shareholders as a % of net operating revenues | |
| Adjusted EBITDA as a % of net operating revenues (Adjusted EBITDA margin) | Adjusted EBITDA as a % of net operating revenues (Adjusted EBITDA margin) | | 18.1 | % | | 17.9 | % |
| | Adjusted EBITDA as a % of net operating revenues (Adjusted EBITDA margin) | |
| | Adjusted EBITDA as a % of net operating revenues (Adjusted EBITDA margin) | |
RESULTS OF OPERATIONS FOR THE YEAR ENDED DECEMBER 31, 20212022 COMPARED TO THE YEAR ENDED DECEMBER 31, 20202021
A complete discussion of theour results of operations for the year ended December 31, 20212022 compared to the year ended December 31, 20202021 can be found in our Annual Report on Form 10‑K10-K for the year ended December 31, 2021.2022. The discussion below is limited to data that was adjusted to conform to our new reporting segment structure.
For the purpose of comparing our results of operations for the years ended December 31, 2022 and 2021, continuing operations information includes, with respect to our Hospital Operations segment, the results of our same 60 hospitals operated throughout 2022 and 2021, as well as the results of (1) our PMC Fort Mill Hospital, (2) five Miami-area hospitals and certain related operations (the “Miami Hospitals”) prior to their divestiture in August 2021, (3) nearly 50 UCCs held in our Hospital Operations segment until their sale in April 2021 and (4) 24 imaging centers following their transfer from our Ambulatory Care
segment to our Hospital Operations segment in April 2021. Continuing operations excludes the results of our hospitals and other businesses classified as discontinued operations for accounting purposes during 2022 and 2021.
The following tables present our net operating revenues, operating expenses and operating income, both in dollar amounts and as percentages of net operating revenues, by segment on a continuing operations basis:
| | | | | | | | | | | | | | | | | | | | | | | | | | | |
| Year Ended December 31, 2022 | | Year Ended December 31, 2021 |
| | Hospital Operations | | Ambulatory Care | | | | Hospital Operations | | Ambulatory Care | | |
| Net operating revenues | $ | 15,926 | | | $ | 3,248 | | | | | $ | 16,767 | | | $ | 2,718 | | | |
| Grant income | 190 | | | 4 | | | | | 142 | | | 49 | | | |
| Equity in earnings of unconsolidated affiliates | 10 | | | 206 | | | | | 25 | | | 193 | | | |
| Operating expenses: | | | | | | | | | | | |
| Salaries, wages and benefits | 8,022 | | | 822 | | | | | 8,188 | | | 690 | | | |
| Supplies | 2,402 | | | 871 | | | | | 2,644 | | | 684 | | | |
| Other operating expenses, net | 3,560 | | | 438 | | | | | 3,817 | | | 389 | | | |
| Depreciation and amortization | 729 | | | 112 | | | | | 760 | | | 95 | | | |
| Impairment and restructuring charges, and acquisition-related costs | 205 | | | 21 | | | | | 58 | | | 27 | | | |
| Litigation and investigation costs | 67 | | | 3 | | | | | 102 | | | 14 | | | |
| Net gains on sales, consolidation and deconsolidation of facilities | (1) | | | — | | | | | (411) | | | (34) | | | |
| Operating income | $ | 1,142 | | | $ | 1,191 | | | | | $ | 1,776 | | | $ | 1,095 | | | |
| | | | | | | | | | | |
| Net operating revenues | 100.0 | % | | 100.0 | % | | | | 100.0 | % | | 100.0 | % | | |
| Grant income | 1.2 | % | | 0.1 | % | | | | 0.8 | % | | 1.8 | % | | |
| Equity in earnings of unconsolidated affiliates | 0.1 | % | | 6.3 | % | | | | 0.1 | % | | 7.1 | % | | |
| Operating expenses: | | | | | | | | | | | |
| Salaries, wages and benefits | 50.4 | % | | 25.3 | % | | | | 48.8 | % | | 25.4 | % | | |
| Supplies | 15.1 | % | | 26.8 | % | | | | 15.8 | % | | 25.2 | % | | |
| Other operating expenses, net | 22.4 | % | | 13.5 | % | | | | 22.8 | % | | 14.3 | % | | |
| Depreciation and amortization | 4.6 | % | | 3.4 | % | | | | 4.5 | % | | 3.5 | % | | |
| Impairment and restructuring charges, and acquisition-related costs | 1.3 | % | | 0.6 | % | | | | 0.3 | % | | 1.0 | % | | |
| Litigation and investigation costs | 0.3 | % | | 0.1 | % | | | | 0.6 | % | | 0.5 | % | | |
| Net gains on sales, consolidation and deconsolidation of facilities | — | % | | — | % | | | | (2.5) | % | | (1.3) | % | | |
| Operating income | 7.2 | % | | 36.7 | % | | | | 10.6 | % | | 40.3 | % | | |
Consolidated net operating revenues decreased by $311 million, or 1.6%, for the year ended December 31, 2022 compared to the year ended December 31, 2021. Our Hospital Operations net operating revenues decreased by $841 million, or 5.0%, in 2022 compared to 2021, primarily due to the loss of revenues from the sale of the Miami Hospitals, lower overall patient volumes, and decreased COVID‑related volumes and acuity during 2022, partially offset by negotiated commercial rate increases. Our Hospital Operations segment also recognized income from federal, state and local grants totaling $190 million and $142 million during the years ended December 31, 2022 and 2021, respectively, which is not included in net operating revenues.
RESULTS OF OPERATIONS BY SEGMENT
Hospital Operations Segment
For the purpose of comparing our results of operations for the years ended December 31, 2022 and 2021, same‑hospital information includes the results of our same 60 hospitals operated throughout 2022 and 2021, and excludes the results of (1) our PMC Fort Mill Hospital, (2) the Miami Hospitals, (3) all of the UCCs we sold in April 2021, (4) the 24 imaging centers transferred from our Ambulatory Care segment to our Hospital Operations segment in April 2021, and (5) the results of our hospitals and other businesses classified as discontinued operations for accounting purposes during 2022 and 2021.
The following tables present operating statistics, revenues and expenses of our hospitals and related outpatient facilities on a same‑hospital basis, unless otherwise indicated:
| | | | | | | | | | | | | | | | | | | | | | | |
| | Same-Hospital
Years Ended December 31, | | Increase
(Decrease) |
| Admissions, Patient Days and Surgeries | | 2022 | | 2021 | |
| Number of hospitals (at end of period) | | 60 | | | 60 | | | — | | (1) |
| Total admissions | | 523,326 | | | 547,754 | | | (4.5) | % | |
| Adjusted admissions | | 962,029 | | | 973,552 | | | (1.2) | % | |
| Paying admissions (excludes charity and uninsured) | | 497,990 | | | 518,515 | | | (4.0) | % | |
| Charity and uninsured admissions | | 25,336 | | | 29,239 | | | (13.3) | % | |
| Admissions through emergency department | | 395,309 | | | 409,440 | | | (3.5) | % | |
| Paying admissions as a percentage of total admissions | | 95.2 | % | | 94.7 | % | | 0.5 | % | (1) |
| Charity and uninsured admissions as a percentage of total admissions | | 4.8 | % | | 5.3 | % | | (0.5) | % | (1) |
| Emergency department admissions as a percentage of total admissions | | 75.5 | % | | 74.7 | % | | 0.8 | % | (1) |
| Surgeries — inpatient | | 134,382 | | | 141,469 | | | (5.0) | % | |
| Surgeries — outpatient | | 209,896 | | | 216,011 | | | (2.8) | % | |
| Total surgeries | | 344,278 | | | 357,480 | | | (3.7) | % | |
| Patient days — total | | 2,747,643 | | | 2,888,928 | | | (4.9) | % | |
| Adjusted patient days | | 4,883,616 | | | 5,016,029 | | | (2.6) | % | |
| Average length of stay (days) | | 5.25 | | | 5.27 | | | (0.4) | % | |
| Licensed beds (at end of period) | | 15,372 | | | 15,379 | | | — | % | |
| Average licensed beds | | 15,381 | | | 15,396 | | | (0.1) | % | |
| Utilization of licensed beds | | 48.9 | % | | 51.4 | % | | (2.5) | % | (1) |
| | | | | | | | |
| | |
| (1) | The change is the difference between the 2022 and 2021 amounts presented. |
| |
| |
| | | | | | | | | | | | | | | | | | | | | | | |
| | | Same-Hospital
Years Ended December 31, | | Increase
(Decrease) |
| Outpatient Visits | | 2022 | | 2021 | |
| Total visits | | 5,063,852 | | | 5,319,994 | | | (4.8) | % | |
| Paying visits (excludes charity and uninsured) | | 4,752,208 | | | 4,964,084 | | | (4.3) | % | |
| Charity and uninsured visits | | 311,644 | | | 355,910 | | | (12.4) | % | |
| Emergency department visits | | 2,166,242 | | | 2,034,405 | | | 6.5 | % | |
| Surgery visits | | 209,896 | | | 216,011 | | | (2.8) | % | |
| Paying visits as a percentage of total visits | | 93.8 | % | | 93.3 | % | | 0.5 | % | (1) |
| Charity and uninsured visits as a percentage of total visits | | 6.2 | % | | 6.7 | % | | (0.5) | % | (1) |
| | | | | | | | |
| | |
| (1) | The change is the difference between the 2022 and 2021 amounts presented. |
| | | | | | | | | | | | | | | | | | | | |
| | | Same-Hospital
Years Ended December 31, | | Increase
(Decrease) |
| Revenues | | 2022 | | 2021 | |
| Total segment net operating revenues | | $ | 15,329 | | | $ | 15,553 | | | (1.4) | % |
| Selected revenue data – hospitals and related outpatient facilities: | | | | | | |
| Net patient service revenues | | $ | 13,703 | | | $ | 14,043 | | | (2.4) | % |
| Net patient service revenue per adjusted admission | | $ | 14,244 | | | $ | 14,424 | | | (1.2) | % |
| Net patient service revenue per adjusted patient day | | $ | 2,806 | | | $ | 2,800 | | | 0.2 | % |
| | | | | | | | | | | | | | | | | | | | | |
| | | Same-Hospital
Years Ended December 31, | | Increase
(Decrease) |
| Selected Operating Expenses | | 2022 | | 2021 | |
| Salaries, wages and benefits | | $ | 7,971 | | | $ | 7,904 | | | 0.8 | % | |
| Supplies | | 2,389 | | | 2,536 | | | (5.8) | % | |
| Other operating expenses | | 3,497 | | | 3,606 | | | (3.0) | % | |
| | $ | 13,857 | | | $ | 14,046 | | | (1.3) | % | |
| | | | | | | | | | | | | | | | | | | | | | | |
| | | Same-Hospital
Years Ended December 31, | | Increase
(Decrease) |
| Selected Operating Expenses as a Percentage of Net Operating Revenues | | 2022 | | 2021 | |
| Salaries, wages and benefits | | 52.0 | % | | 50.8 | % | | 1.2 | % | (1) |
| Supplies | | 15.6 | % | | 16.3 | % | | (0.7) | % | (1) |
| Other operating expenses | | 22.8 | % | | 23.2 | % | | (0.4) | % | (1) |
| | | | | | | | |
| | |
| (1) | The change is the difference between the 2022 and 2021 amounts presented. |
Revenues
Same-hospital net operating revenues decreased by $224 million, or 1.4%, during the year ended December 31, 2022 compared to the year ended December 31, 2021. This decrease was due in part to lower overall patient volumes, decreased COVID-related volumes and acuity, and the adverse impact of the Cybersecurity Incident on patient volumes in 2022. These factors were partially offset by commercial rate increases negotiated with our managed care payers and an increase in revenue from our revenue management services attributable to contractual rate increases and new business expansion. Our Hospital Operations segment also recognized income from federal, state and local grants totaling $190 million and $142 million in the years ended December 31, 2022 and 2021, respectively, which is not included in net operating revenues. Same-hospital admissions and outpatient visits decreased by 4.5% and 4.8%, respectively, in the year ended December 31, 2022 compared to 2021, primarily due to the factors described above.
The following table presents our consolidated net accounts receivable by payer:
| | | | | | | | | | | | | | |
| | December 31, |
| | | 2022 | | 2021 |
| Medicare | | $ | 166 | | | $ | 155 | |
| Medicaid | | 44 | | | 47 | |
| Net cost report settlements receivable and valuation allowances | | 48 | | | 33 | |
| Managed care | | 1,661 | | | 1,602 | |
| Self-pay uninsured | | 35 | | | 21 | |
| Self-pay balance after insurance | | 92 | | | 70 | |
| Estimated future recoveries | | 149 | | | 137 | |
| Other payers | | 315 | | | 331 | |
| Total Hospital Operations | | 2,510 | | | 2,396 | |
| Ambulatory Care | | 433 | | | 374 | |
| | | | |
| Accounts receivable, net | | $ | 2,943 | | | $ | 2,770 | |
At December 31, 2022 and 2021, our Hospital Operations segment estimated collection rate was 29.5% and 26.5%, respectively, on self‑pay accounts and 95.7% and 96.6%, respectively, from managed care payers.
The following table presents the approximate aging by payer of our net accounts receivable from the continuing operations of our Hospital Operations segment of $2.462 billion and $2.363 billion at December 31, 2022 and 2021, respectively. Cost report settlements receivable and valuation allowances of $48 million and $33 million at December 31, 2022 and 2021, respectively, are excluded from the table.
| | | | | | | | | | | | | | | | | | | | | | | | | | | | | |
| |
| Medicare | | Medicaid | | Managed
Care | | Indemnity,
Self-Pay
and Other | | Total |
| At December 31, 2022: | | | | | | | | | |
| 0-60 days | 90 | % | | 34 | % | | 56 | % | | 22 | % | | 50 | % |
| 61-120 days | 5 | % | | 28 | % | | 16 | % | | 15 | % | | 15 | % |
| 121-180 days | 2 | % | | 16 | % | | 9 | % | | 7 | % | | 9 | % |
| Over 180 days | 3 | % | | 22 | % | | 19 | % | | 56 | % | | 26 | % |
Total | 100 | % | | 100 | % | | 100 | % | | 100 | % | | 100 | % |
| | | | | | | | | |
| At December 31, 2021: | | | | | | | | | |
| 0-60 days | 93 | % | | 35 | % | | 57 | % | | 22 | % | | 52 | % |
| 61-120 days | 4 | % | | 31 | % | | 18 | % | | 14 | % | | 16 | % |
| 121-180 days | 1 | % | | 14 | % | | 10 | % | | 9 | % | | 9 | % |
| Over 180 days | 2 | % | | 20 | % | | 15 | % | | 55 | % | | 23 | % |
Total | 100 | % | | 100 | % | | 100 | % | | 100 | % | | 100 | % |
The following table presents the approximate amount of accounts receivable in the EES still awaiting determination of eligibility under a government program by aging category:
| | | | | | | | | | | |
| December 31, |
| | 2022 | | 2021 |
| 0-60 days | $ | 79 | | | $ | 87 | |
| 61-120 days | 18 | | | 17 | |
| 121-180 days | 3 | | | 4 | |
| Over 180 days | 6 | | | 7 | |
Total | $ | 106 | | | $ | 115 | |
Salaries, Wages and Benefits
Same‑hospital salaries, wages and benefits expense increased by $67 million, or 0.8%, in the year ended December 31, 2022 compared to 2021. This increase was primarily attributable to higher contract labor and premium pay costs due to the pandemic, and annual merit increases for certain of our employees, all of which were partially offset by lower incentive compensation and employee benefit costs, as well as our continued focus on cost‑efficiency measures. Same‑hospital salaries, wages and benefits expense as a percentage of net operating revenues increased by 120 basis points to 52.0% in the year ended December 31, 2022 compared to the year ended December 31, 2021. This increase was primarily due to the impact of higher contract labor and premium pay costs, decreased patient volumes, and the effect of the Cybersecurity Incident on our patient revenues during 2022. Salaries, wages and benefits expense for the years ended December 31, 2022 and 2021 included stock‑based compensation expense of $45 million and $43 million, respectively.
Supplies
Same‑hospital supplies expense decreased by $147 million, or 5.8%, in the year ended December 31, 2022 compared to 2021. The decrease was primarily attributable to lower overall patient volumes, reduced COVID‑related volumes and acuity, and our cost‑efficiency measures, partially offset by the increased cost of certain supplies as a result of the COVID‑19 pandemic, the impact of general market conditions and inflation. Same‑hospital supplies expense as a percentage of net operating revenues decreased by 70 basis points to 15.6% in the year ended December 31, 2022 compared to the year ended December 31, 2021, primarily due to the factors described above.
We continued to experience supply‑chain disruptions, including shortages and delays, as well as significant price increases in medical supplies created by the pandemic during the year ended December 31, 2022. In addition, general market conditions and inflation also increased the cost of medical supplies during 2022. The items of cost‑reduction focus during the year ended December 31, 2022 included cardiac stents and pacemakers, orthopedics, implants and high-cost pharmaceuticals.
Other Operating Expenses, Net
Same‑hospital other operating expenses decreased by $109 million, or 3.0%, in the year ended December 31, 2022 compared to 2021. Same‑hospital other operating expenses as a percentage of net operating revenues decreased by 40 basis points to 22.8% in the year ended December 31, 2022 compared to 23.2% in the year ended December 31, 2021, primarily due to the net gains from the sale of assets noted below. The changes in other operating expenses included:
•an increase in gains from the sale of assets of $102 million, which were classified as a reduction of other operating expenses, net; and
•decreased malpractice expense of $51 million.
For the years ended December 31, 2022 and 2021, other operating expenses for our Hospital Operations segment included $283 million and $290 million, respectively, of rent expense.
Consolidated
Impairment and Restructuring Charges, and Acquisition-Related Costs
The following table presents information about our impairment and restructuring charges, and acquisition‑related costs:
| | | | | | | | | | | | | | |
| | Years Ended December 31, |
| | 2022 | | 2021 |
| Consolidated: | | | | |
| Impairment charges | | $ | 94 | | | $ | 8 | |
| Restructuring charges | | 118 | | | 57 | |
| Acquisition-related costs | | 14 | | | 20 | |
| Total impairment and restructuring charges, and acquisition-related costs | | $ | 226 | | | $ | 85 | |
| | | | |
| By segment: | | | | |
| Hospital Operations | | $ | 205 | | | $ | 58 | |
| Ambulatory Care | | 21 | | | 27 | |
| | | | |
| Total impairment and restructuring charges, and acquisition-related costs | | $ | 226 | | | $ | 85 | |
Impairment charges for the year ended December 31, 2022 included $82 million for the write‑down of certain buildings and medical equipment located in one of our markets to their estimated fair values. Material adverse trends in our estimates of future undiscounted cash flows of the hospitals indicated the aggregate carrying value of the hospitals’ long‑lived assets was not recoverable from their estimated future cash flows. We believe the most significant factors contributing to the adverse financial trends included decreased revenues and lower patient volumes due to the pandemic and competition, as well as higher labor costs because of the pandemic. As a result, we updated the estimate of the fair value of the hospitals’ long‑lived assets and compared it to the aggregate carrying value of those assets. Because the fair value estimates were lower than the aggregate carrying value of the long‑lived assets, an impairment charge was recorded for the difference in the amounts. We also recorded $12 million of other impairment charges. For additional discussion, see Note6to the accompanying Consolidated Financial Statements. Impairment charges for the year ended December 31, 2022 were comprised of $88 million from our Hospital Operations segment and $6 million from our Ambulatory Care segment.
Restructuring charges for the year ended December 31, 2022 consisted of $27 million of employee severance costs, $16 million related to the transition of various administrative functions to our GBC, $32 million related to contract and lease termination fees, and $43 million of other restructuring costs. Acquisition‑related costs during 2022 consisted entirely of transaction costs.
Impairment charges for the year ended December 31, 2021 were comprised of $5 million from our Ambulatory Care segment, primarily related to the impairment of certain management contract intangible assets, and $3 million from our Hospital Operations segment. Restructuring charges during the year ended December 31, 2021 consisted of $14 million of employee severance costs, $19 million related to the transition of various administrative functions to our GBC and $24 million of other restructuring costs. Acquisition-related costs during 2021 consisted entirely of transaction costs.
Net Income Available to Noncontrolling Interests
Net income available to noncontrolling interests was $590 million for the year ended December 31, 2022 compared to $562 million for the year ended December 31, 2021. Net income available to noncontrolling interests in 2022 was comprised of $469 million related to our Ambulatory Care segment and $121 million related to our Hospital Operations segment. Of the portion related to our Ambulatory Care segment, $9 million related to the minority interest Baylor held in USPI until June 30, 2022.
LIQUIDITY AND CAPITAL RESOURCES
CASH REQUIREMENTS
Scheduled Contractual Obligations
Our obligations to make future cash payments under contractsfor scheduled contractual obligations are summarized in the table below, all as of December 31, 2022.2023. Other than the repayment of long-term debt, we expect to use net cash generated from operating activities, cash on hand or borrowings under our Credit Agreement to satisfy the below obligations. Long‑term debt maturities may be refinanced or repaid using net cash generated from operating activities or from the proceeds from sales of facilities.
| | | | | Total | | Years Ended December 31, | | Thereafter |
| | | | Total | | Years Ended December 31, | | Later Years |
| | | | 2023 | | 2024 | | 2025 | | 2026 | | 2027 | |
| | | (In Millions) | (In Millions) |
Long-term debt(1) | Long-term debt(1) | $ | 19,318 | | | $ | 835 | | | $ | 2,179 | | | $ | 768 | | | $ | 2,807 | | | $ | 3,584 | | | $ | 9,145 | |
Finance lease obligations(1) | Finance lease obligations(1) | 325 | | | 110 | | | 80 | | | 39 | | | 14 | | | 7 | | | 75 | |
| Long-term non-cancelable operating leases | 1,523 | | | 254 | | | 229 | | | 198 | | | 163 | | | 139 | | | 540 | |
| Long-term non-cancelable operating lease obligations | |
| | Academic teaching services | Academic teaching services | 320 | | | 64 | | | 64 | | | 64 | | | 64 | | | 64 | | | — | |
| | | Academic teaching services | |
| | Academic teaching services | |
| | Defined benefit plan obligations | Defined benefit plan obligations | 468 | | | 23 | | | 23 | | | 23 | | | 23 | | | 23 | | | 353 | |
| Information technology contract services | 332 | | | 203 | | | 119 | | | 2 | | | 2 | | | 2 | | | 4 | |
| Defined benefit plan obligations | |
| Defined benefit plan obligations | |
| Information technology services contracts | |
| Purchase orders | Purchase orders | 369 | | | 369 | | | — | | | — | | | — | | | — | | | — | |
| Total | Total | $ | 22,655 | | | $ | 1,858 | | | $ | 2,694 | | | $ | 1,094 | | | $ | 3,073 | | | $ | 3,819 | | | $ | 10,117 | |
| | | | | | | | |
| | |
| (1) | Amounts include both principal and interest. |
Long-term Debt—Our Credit Agreement, which has a scheduled maturity date of March 16, 2027, provides for revolving loans in an aggregate principal amount of up to $1.500 billion subject to borrowing availability, with a $200 million subfacility for standby letters of credit. In March 2022, we amended our Credit AgreementOutstanding revolving loans accrue interest depending on the type of loan at either (a) a base rate plus an applicable margin ranging from 0.25% to among other things, (1) decrease the aggregate revolving credit commitments from the previous maximum of $1.900 billion to $1.500 billion, (2) extend the Credit Agreement’s maturity date to March 2027 and (3) replace the London Interbank Offered Rate (“LIBOR”) with0.75% per annum or (b) the Term Secured Overnight Financing Rate (“SOFR”) and, Daily Simple SOFR or the Euro Interbank Offered Rate (EURIBOR) (each, as defined in the Credit Agreement) asplus an applicable margin ranging from 1.25% to 1.75% per annum and (in the reference interest rate.case of Term SOFR and Daily Simple SOFR only) a credit spread adjustment of 0.10%, in each case based on available credit. An unused commitment fee payable on the undrawn portion of the revolving loans ranges from 0.25% to 0.375% per annum based on available credit. Our borrowing availability is based on a specified percentage of eligible inventory and accounts receivable, including self‑pay accounts. At December 31, 2022,2023, we had no cash borrowings outstanding under the Credit Agreement, and we had less than $1 million of standby letters of credit outstanding. Based on our eligible receivables, $1.500 billion was available for borrowing under the Credit Agreement at December 31, 2023.
At December 31, 2022,2023, we had outstanding senior unsecured notes and senior secured notes (“Senior Notes”) with an aggregate principal balance of $14.757$14.762 billion. The Senior Notes generally require semi‑annual interest payments and have maturity dates ranging from 2024 through 2031. Any outstanding principal and accrued but unpaid interest is due upon maturity.
We consummatedcompleted the following transactions affectingrelated to our Senior Notessenior secured notes in the year ended December 31, 2022:2023:
•DuringIn May 2023, we issued $1.350 billion aggregate principal amount of our 2031 Senior Secured First Lien Notes, which will mature on May 15, 2031. We pay interest on the three months ended December 31, 2022, we paid $13 million from2031 Senior Secured First Lien Notes semi-annually in arrears on May 15 and November 15 of each year, which payments commenced on November 15, 2023. We used the issuance proceeds, together with cash on hand, to repurchase $14finance the redemption of our September 2024 Senior Secured First Lien Notes and our July 2024 Senior Secured First Lien Notes, as described below.
•Also in May 2023, we paid $596 million using a portion of the proceeds from the issuance of our 2031 Senior Secured First Lien Notes to redeem all $589 million aggregate principal amount thenoutstanding of our September 2024 Senior Secured First Lien Notes in advance of their maturity date.
•In June 2023, we used the remaining proceeds from the issuance of our 2031 Senior Secured First Lien Notes along with cash on hand to redeem all $756 million aggregate principal amount outstanding of our July 2024 Senior Secured First Lien Notes in advance of their maturity date through multiple open‑market transactions.
•Also during the three months ended December 31, 2022, we paid $11 million from cash on hand to repurchase $11 million of the aggregate principal amount then outstanding of our September 2024 Senior Secured First Lien Notes in advance of their maturity date through multiple open‑market transactions.
•In June 2022, we issued $2.000 billion aggregate principal amount of our 2030 Senior Secured First Lien Notes. We pay interest on these notes semi‑annually in arrears on June 15 and December 15 of each year, which payments commended on December 15, 2022. As further discussed below, we used a substantial portion of the issuance proceeds from the 2030 Senior Secured First Lien Notes, after payment of fees and expenses, to finance the redemption of our 2023 Senior Unsecured Notes.
•Through a series of open‑market transactions during the six months ended June 30, 2022, we repurchased $124 million aggregate principal amount outstanding of our 2023 Senior Unsecured Notes using cash on hand. Following the issuance of our 2030 Senior Secured First Lien Notes in June 2022, we used a substantial portion of the proceeds to redeem the then‑remaining $1.748 billion aggregate principal outstanding of the 2023 Senior Unsecured Notes in advance of their maturity date. In total, we paid $1.933 billion during the six months ended June 30, 2022 to retire our 2023 Senior Unsecured Notes in full and recorded aggregate losses from early extinguishment of debt of $71 million.
•In February 2022, we paid $730 million from cash on hand to redeem all $700 million aggregate principal amount outstanding of our 2025 Senior Secured First Lien Notes in advance of their maturity date. In connection with the redemption, we recorded a loss from early extinguishment of debt of $38 million in the three months ended March 31, 2022.
At December 31, 2022,2023, using the last 12 months of Adjusted EBITDA, our ratio of total long‑term debt, net of cash and cash equivalent balances, to Adjusted EBITDA was 4.1x.3.89x. We anticipate this ratio will fluctuate from quarter to quarter based on earnings performance and other factors, including in the event we use of our Credit Agreement as a source of liquidity andor enter into acquisitions that involve the assumption of long‑term debt. We seek to manage this ratio and increase the efficiency of our balance sheet by following our business plan and managing our cost structure, including through possiblecurrently planned and potential future asset divestitures, and through other changes in our capital structure. As part of our long‑term objective to manage our capital structure, we continue to evaluate opportunities to retire, purchase, redeem and refinance outstanding debt subject to prevailing market conditions, our liquidity requirements, operating results, contractual restrictions and other factors. Our ability to achieve our leverage and capital structure objectives is subject to numerous risks and uncertainties, many of which are described in the Forward‑Looking Statements and Risk Factors sections in Part I of this report.
Interest payments, net of capitalized interest, were $882 million, $848 million $937 million and $962$937 million in the years ended December 31, 2023, 2022 2021 and 2020,2021, respectively. For the year ending December 31, 2023,2024, we expect annual interest payments to be approximately $835$850 million to $845$860 million.
Future maturities of our long-term debt obligations are summarized in the table above. See Note 8 to the accompanying Consolidated Financial Statements for additional information about our long‑term debt obligations.
Lease Obligations—We have operating lease agreements primarily for real estate, including off‑campus outpatient facilities, medical office buildings, and corporate and other administrative offices, as well as for medical office equipment. Our finance leases are primarily for medical equipment and information technology and telecommunications assets. As of December 31, 2022,2023, we had fixed payment obligations of $1.517$1.415 billion under non‑cancellable lease agreements. Future payments due in connection with our operating and finance leases, including imputed interest, are summarized in the table above. Additional information about our lease commitments is provided in Note 7 to the accompanying Consolidated Financial Statements.
Academic Teaching Services—We enter into contracts for academic teaching services with university and physician groups to support graduate medical education. These agreements contain various rights and termination provisions.
Defined Benefit Plan Obligations—We maintain three frozen, non‑qualified defined benefit plans that provide supplemental retirement benefits to certain of our current and former executives. These plans are unfunded, and plan obligations are paid from our working capital. We also maintain a frozen, qualified defined benefit plan that benefitsfor certain of our current and former employees in Detroit. See Note 10 to the accompanying Consolidated Financial Statements for additional information about our defined benefit plans.
Information Technology Services Contracts—We enter into various non‑cancellable contracts for information technology services and licenses as a normal part of our business. These contracts generally relate to information technology infrastructure support and services, software licenses for certain operational and administrative systems, and cybersecurity‑related software and services.
Purchase Orders—We had outstanding short‑term purchase commitments of $369$386 million at December 31, 2022,2023, which we expect to pay within 12 months.
Other Contractual Obligations
Asset Retirement Obligations—Asset retirement obligations represent the estimated costs to perform environmental remediation work, which we are legally obligated to complete, at certain of our facilities upon their retirement. This work could include asbestos abatement, the removal of underground storage tanks and other similar activities. At December 31, 2022,2023, the undiscounted aggregate future estimated payments related to these obligations was $184$206 million. We are unable to predict the timing of these payments due to the uncertainty and long timeframes inherent in these obligations.
Standby Letters of Credit—Standby letters of credit are required principally by our insurers and various states to collateralize our workers’ compensation programs pursuant to statutory requirements and as security to collateralize the deductible and self‑insured retentions under certain of our professional and general liability insurance programs. The amount of
collateral required is primarily dependent upon the level of claims activity and our creditworthiness. The insurers require the collateral in case we are unable to meet our obligations to claimants within the deductible or self‑insured retention layers.
We have a letter of credit facility (as amended to date, the “LC Facility”) that provides for the issuance, from time to time, of standby and documentary letters of credit in an aggregate principal amount of up to $200 million. Drawings under any letter of credit issued underWe amended the LC Facility accruein September 2023 to, among other things, (1) extend the scheduled maturity date from September 12, 2024 to March 16, 2027, and (2) replace the London Interbank Offered Rate (LIBOR) with Term SOFR as the reference interest if not reimbursed within three business days.rate. The LC Facility is subject to an effective maximum secured debt covenant of 4.25 to 1.00. At December 31, 2022,2023, we had $116$111 million of standby letters of credit outstanding under the LC Facility. The timing of reimbursement payments is uncertain, as we cannot foresee when, or if, a standby letter of credit will be drawn upon.
Guarantees—Our guarantees include minimum revenue guarantees, primarily related to physicians under relocation agreements and physician groups that provide services at our hospitals, as well as operating lease guarantees. At December 31, 2022,2023, the maximum potential amount of future payments under these guarantees was $266$444 million, of which $168$295 million were recorded in the accompanying Consolidated Balance Sheet at December 31, 2022.2023. The timing and amount of future payments under these guarantees is uncertain.
Professional and General Liability Obligations—At December 31, 2022,2023, the current and long‑term professional and general liability reserves included in our Consolidated Balance Sheet were $255$254 million and $790$792 million, respectively, and the current and long‑term workers’ compensation reserves included in our Consolidated Balance Sheet were $45$30 million and $93$99 million, respectively. The timing of professional and general liability payments is uncertain as such payments depend on several factors, including the nature of claims and when they are received.
Baylor Put/Call Agreement—Note Payable—As further discussed in Note 18 to the accompanying Consolidated Financial Statements, we had a put/call agreement (the “Baylor Put/Call Agreement”) with respect to the 5% ownership interest Baylor held in USPI until June 30, 2022. The Baylor Put/Call Agreement gave Baylor the option to annually put up to one-third of its total shares in USPI (the “Baylor Shares”) over a period of three years beginning in 2021. We had the right to call the difference between the number of shares Baylor put each year and the maximum number of shares it could have put.
In each of 2021 and 2022, we notified Baylor of our intention to exercise our call option to purchase 33.3% of the Baylor Shares for that year (66.6% in total). In June 2022, we entered into an agreement within June 2022 to purchase the 5% voting ownership interest in USPI Baylor (the “Share Purchase Agreement”) to complete the purchase of the Baylor Shares we called in 2021 and 2022 and to accelerate the acquisition of the remaining Baylor Shares eligible to be put/called in 2023.held at that time. Under the terms of the Share Purchase Agreement,share purchase agreement, we agreed to pay Baylor $406 million to buy its entire 5% voting interest in USPI. We paid $11 million upon execution of the Share Purchase Agreement and are obligated to make additional non-interest bearingnon-interest-bearing monthly payments of approximately $11 million which payments commenced in August 2022.through June 2025. At December 31, 2022,2023, we had liabilities of $135 million recorded in other current liabilities and $190$63 million in other long-term liabilities in the accompanying Consolidated Balance Sheet for the purchase of these shares.
Investment in the SCD Centers—USPI continues to make offers in an ongoing process to acquire a portion of the equity interests in certain of the ASCs acquired from SCD in December 2021 from the physician owners for consideration of up to approximately $250 million. During the year ended December 31, 2022, we made aggregate payments of $58 million to acquire controlling interests in 18 of these ASCs. We cannot reasonably predict how many additional physician owners will accept our offers to acquire a portion of their equity, nor the timing or amount of any remaining payments.
SCD Development Agreement—In December 2021, USPI and SCD’s principals entered into a joint venture and development agreement under which USPI has the exclusive option to partner with affiliates of SCD on the future development of a minimum target of 50 de novo ASCs through December 2026. The timing and amount of payments related to the development of these facilities is currently unknown.obligation.
Other than the obligations described above, we had no off‑balance sheet arrangements that may have a current or future material effect on our financial condition, revenues or expenses, results of operations, liquidity, capital expenditures or capital resources at December 31, 2022.2023.
Other Cash Requirements
Capital Expenditures—Our capital expenditures primarily relate to the expansion and renovation of existing facilities (including amounts to comply with applicable laws and regulations), surgical hospital expansion focused on higher acuity services, equipment and information systems additions and replacements, introduction of new medical technologies (including robotics), design and construction of new facilities, and various other capital improvements. We continue to implement our portfolio diversification strategy into ambulatory surgery and have a baseline intention to invest $250 million annually in
ambulatory business acquisitions and de novo facilities. Capital expenditures were $751 million, $762 million $658 million and $540$658 million in the years ended December 31, 2023, 2022 2021 and 2020,2021, respectively. We anticipate that our capital expenditures for continuing operations for the year ending December 31, 20232024 will total approximately $625$775 million to $675$875 million, including $196$154 million that was accrued as a liability at December 31, 2022.2023.
We completed thecontinued construction of and opened PMC Fort Mill to patients during the year ended December 31, 2022. This 100‑bed facility includes an emergency department, multi‑specialty operating rooms, an intensive care unit, and labor and delivery rooms. In addition, we broke ground in 2022 on a new healthcaremedical campus located in the Westover Hills area of San Antonio, Texas, whichin 2023. The campus willis expected to include a 104‑bed acute care hospital, an ASC and medical office space. WeThe project is currently on schedule for completion in mid‑2024; we expect construction of the Westover Hills facilitiesit will cost approximately $230$235 million. During 2023, we also broke ground on a new medical campus located in Port St. Lucie, Florida, that is expected to include a 54‑bed hospital, as well as medical office space. We expect the Port St. Lucie campus to be complete in late 2025 and that it will cost approximately $187 million over the construction period.
By the beginning of 2030, all hospitals in California providing acute care services must meet standards that are intended to ensure that they remain intact and capable of continued operation following an earthquake. During 2022, weWe began planning foranalyzing the nonstructural performance category (“NPC”) seismic requirements for our hospitals in California which we expect to complete byin 2022 and completed the end of 2023 for review by the State.analysis in 2023. This analysis, will clarifywhich identified the NPC work required to be completed in future years to bring our hospitals in compliance with the building requirements by the 2030 deadline, andwas submitted to the resultsState for review at the end of the NPC planning will inform more detailed design and cost estimates after we receive State feedback. We will also determine any additional structural category performance (“SCP”) work, with required design and construction work in both categories coordinated.2023. At this time, we are unable to reasonably estimate the amountcost of the NPC and SCPstructural category performance (“SCP”) work our
hospitals will require or the potential cost to retrofit them. The additional NPC work required will not change the timing or general nature of our ongoing or currently planned NPC or SCP work on our buildings.
Income Taxes—Income tax payments, net of tax refunds, were $161$243 million, and $92$161 million in the years ended December 31, 20222023 and 2021,2022, respectively. At December 31, 2022,2023, our carryforwards available to offset future taxable income consisted of (1) federal net operating loss (“NOL”) carryforwards of approximately $100$41 million pre‑tax, $40$39 million of which expires in 20242026 to 2037 and $60$2 million of which has no expiration date, (2) charitable contribution carryforwards of approximately $45$52 million expiring in 2025 through 2027 and (3) state NOL carryforwards of approximately $3.106$3.339 billion expiring in 20232024 through 20422043 for which the associated deferred tax benefit, net of valuation allowance and federal tax impact, is $42$35 million.
Our ability to utilize NOL carryforwards to reduce future taxable income may be limited under Section 382 of the Internal Revenue Code if certain ownership changes in our company occur during a rolling three‑year period. These ownership changes include purchases of common stock under share repurchase programs, the offering of stock by us, the purchase or sale of our stock by 5% shareholders, as defined in the Treasury regulations, or the issuance or exercise of rights to acquire our stock. If such ownership changes by 5% shareholders result in aggregate increases that exceed 50 percentage points during the three‑year period, then Section 382 imposes an annual limitation on the amount of our taxable income that may be offset by the NOL carryforwards or tax credit carryforwards at the time of ownership change.
Periodic examinations of our tax returns by the IRS or other taxing authorities could result in the payment of additional taxes. The IRS has completed audits of our tax returns for all tax years ended on or before December 31, 2007. All disputed issues with respect to these audits have been resolved and all related tax assessments (including interest) have been paid. Our tax returns for years ended after December 31, 2007 and USPI’s tax returns for years ended after December 31, 20182020 remain subject to audit by the IRS.
The Inflation Reduction Act of 2022 (the “Tax Act”) was enacted in August 2022. Among other things, the Tax Act implemented a corporate alternative minimum tax (“CAMT”) of 15% on book income of certain large corporations, a 1% excise tax on net stock repurchases and several tax incentives to promote clean energy. The provision pertaining to an excise tax on corporate stock repurchases imposes a nondeductible 1% excise tax on publicly traded corporations for the net value of certain stock that any such corporation repurchases. The value of the repurchases subject to the tax is reduced by the value of any stock the corporation issued during the tax year, including stock issued or provided to employees. The CAMT imposes a minimum tax on net income adjusted for certain items prescribed by the Tax Act. Both the CAMT and the excise tax provisions of the Tax Act are effective for tax years beginning after December 31, 2022. We are awaiting the publication of additional guidance relatedexpect to be subject to the CAMT to fully assess its applicability and potential impact on our Consolidated Financial Statements.CAMT; however, we currently do not expect any material impact.
SOURCES AND USES OF CASH
Our liquidity for the year ended December 31, 20222023 was primarily derived from net cash provided by operating activities and cash on hand. During 2022, we also received $196 million of supplemental funds from federal and state grants provided under COVID-19 relief legislation. We had $858 million$1.228 billion of cash and cash equivalents on hand at December 31, 20222023 to fund our operations and capital expenditures, and our borrowing availability under our Credit Agreement was $1.500 billion based on our borrowing base calculation at December 31, 2022.2023.
Our primary source of operating cash is the collection of accounts receivable. As such, our operating cash flow is impacted by levels of cash collections, as well as levels of implicit price concessions, due to shifts in payer mix and other factors. Our Credit Agreement provides additional liquidity to manage fluctuations in operating cash caused by these factors.
Net cash provided by operating activities was $2.374 billion in the year ended December 31, 2023 compared to $1.083 billion in the year ended December 31, 2022 compared to $1.568 billion in the year ended December 31, 2021.2022. Key factors contributing to the change between 2023 and 2022 and 2021 includeincluded the following:
•$880 million ofNo Medicare advances recouped or repaid in the year ended December 31, 2023 compared to $880 million recouped or repaid during 2022;
•A $128 million payment of payroll taxes deferred pursuant to COVID-19 legislation in 2022 compared to $512 million during 2021;none in 2023;
•$19610 million of cash received from pandemic-related grant programs in 2022during 2023 compared to $178$196 million received in 2021;
•Lower interest payments of $89 million in 2022;
•Higher incomeIncome tax payments of $69that were $82 million higher in 2023 than in 2022;
•An increase of $61$60 million less in payments forrelated to restructuring charges, acquisition‑related costs, and litigation costs and settlements in 2022;2023; and
•The timing of other working capital items.
Net cash used in investing activities totaledwas $969 million for the year ended December 31, 2023 as compared to $808 million for the year ended December 31, 2022. Key factors contributing to the change between 2023 and 2022 comparedprimarily included the following: (1) proceeds from sales of facilities and other assets were $139 million lower during the 2023 period, primarily due to $714 million forthe sale of several medical office buildings and the sale of a portion of an interest in certain assets during the year ended December 31, 2021. Proceeds2022; and (2) proceeds received from the sale of our marketable securities decreased by $26 million during 2023.
Investing activities during the year ended December 31, 2022 primarily included: (1) capital expenditures of $762 million and (2) payments totaling $234 million to acquire businesses, partially offset by (3) proceeds from the sale of facilities and other assets were $1.038 billion lower during 2022 as compared to 2021, primarily due to the sale of the majority of our urgent care centers in April 2021 and the sale of the Miami Hospitals in August 2021, and capital expenditures were $104 million higher in 2022 as compared to 2021. These amounts were substantially offset by a decrease of $986 million in$210 million.
Net cash used to purchase businesses during 2022.
In addition to the proceeds from the sales noted above, investing activity during the year ended December 31, 2021 included purchases of businesses totaling $1.220in financing activities was $1.035 billion primarily related to USPI’s acquisition activity. In addition, capital expenditures increased by $118 million and purchases of equity interests increased $64 million during 2021, as compared to the year ended December 31, 2020.
We used net cash of $1.781 billion and $936 million for financing activities duringin the years ended December 31, 2023 and 2022, respectively. The 2023 period primarily included (1) distributions of $594 million to noncontrolling interest holders, (2) payments totaling $200 million to repurchase 3,112 thousand shares of our common stock under our repurchase program, and 2021, respectively. (3) payments of $167 million to purchase noncontrolling ownership interests, partially offset by (4) proceeds from the issuance of $1.350 billion aggregate principal amount of our 2031 Senior Secured First Lien Notes, which proceeds were subsequently used, together with cash on hand, to finance the redemption of the combined $1.345 billion aggregate principal amount outstanding of our September 2024 Senior Secured First Lien Notes and July 2024 Senior Secured First Lien Notes.
Financing activityactivities during the year ended December 31, 2022 includedprimarily included: (1) aggregate payments against our borrowings of $2.851 billion, the majority of which was used to retire $2.597 billion aggregate principal amount outstanding of our Senior Notessenior secured first lien notes and senior unsecured notes in advance of their maturity dates, anddates; (2) payments totaling $250 million under our stock repurchase program to reacquire nearly six million5,889 thousand shares of our common stock. In addition,stock under our repurchase program; and (3) distributions to noncontrolling interest holders increased $137of $560 million, during 2022 as compared to 2021, partially due toincluding distributions of the proceeds from the sale of several medical office buildings to minority interest holders totalingof $61 million in 2022.million. The aforementioned payments were partially offset by the $2.000 billion of proceeds received from the issuance of our 6.125% senior secured first lien notes due June 15, 2030 Senior Secured First Lien Notes during the year ended December 31, 2022. Financing activity during the year ended December 31, 2021 included proceeds from our issuance of $2.850 billion aggregate principal amount of Senior Notes. We used a portion of these proceeds, together with the proceeds from our sale of the Miami Hospitals and cash on hand, to redeem and retire $2.988 billion aggregate principal amount of our then-outstanding Senior Notes during 2021. Financing activity in 2021 also included the receipt of $37 million of grant funds by our Ambulatory Care segment’s unconsolidated affiliates and their repayment of $104 million of Medicare advances. Additionally, we paid total distributions to noncontrolling interest holders of $423 million during the year ended December 31, 2021.
We have several structured payables arrangements that are a part of our strategy to make our procurement processes more efficient and cost effective. At December 31, 2022, we were paying approximately 6,300 vendors under these programs, with an annual charge volume of approximately $1.3 billion. We do not expect these programs to result in any significant changes to our liquidity.
We record our equity securities and our debt securities classified as available‑for‑sale at fair market value. The majority of our investments are valued based on quoted market prices or other observable inputs. We have no investments that we expect will be negatively affected by the current economic conditions such that they willand materially impact our financial condition, results of operations or cash flows.
DEBT INSTRUMENTS, GUARANTEES AND RELATED COVENANTS
Credit Agreement—At December 31, 2022,2023, our Credit Agreement provided for revolving loans in an aggregate principal amount of up to $1.500 billion with a $200 million subfacility for standby letters of credit. In April 2021, we amended the Credit Agreement to, among other things, extend the duration of previous amendments that raised the aggregate revolving credit commitments from $1.500 billion to $1.900 billion, subject to borrowing availability. In March 2022, we amended the revolving credit facility again to, among other things, (1) decrease the previous maximum aggregate revolving credit commitments from $1.900 billion to $1.500 billion, subject to borrowing availability, (2) extend the scheduled maturity date from September 2024 to March 2027 and (3) replace LIBOR with Term SOFR and Daily Simple SOFR (each, as defined in the Credit Agreement) as the reference interest rate. Obligations under the Credit Agreement are guaranteed by substantially all of our domestic wholly owned hospital subsidiaries and are secured by a first‑priority lien on the eligible inventory and accounts receivable owned by us and the subsidiary guarantors, including receivables for Medicaid supplemental payments.
At December 31, 2022,2023, we had no cash borrowings outstanding under the Credit Agreement, and we had less than $1 million of standby letters of credit outstanding. Based on our eligible receivables, $1.500 billion was available for borrowing under the Credit Agreement at December 31, 2023. We were in compliance with all covenants and conditions in our Credit Agreement and, based on our eligible receivables, $1.500 billion was available for borrowing at December 31, 2022. See Note 8 to the accompanying Consolidated Financial Statements for additional information about our Credit Agreement.2023.
Letter of Credit Facility—Our LC Facility provides for the issuance, from time to time, of standby and documentary letters of credit from time to time, in an aggregate principal amount of up to $200 million and matures in September 2024. Obligations under the LC Facility are guaranteed and secured by a first‑priority pledge of the capital stock and other ownership interests of certain of our wholly owned domestic hospital subsidiaries on an equal‑ranking basis with our senior secured first lien notes.million. At December 31, 2022, $116 million of standby letters of credit were outstanding, and2023, we were in compliance with all covenants and conditions in ourthe LC Facility.Facility, and we had $111 million of standby letters of credit outstanding thereunder.
Senior Unsecured Notes and Senior Secured Note Issuances and Debt Refinancing TransactionsNotes—A detailed discussion of our debt transactions during the year ended December 31, 20222023 is provided inunder the Cash Requirements subsection above. In the aggregate, we recognized a net loss from the early extinguishment of debt of $109$11 million in the year ended December 31, 20222023 related to our retirementredemption of certain Senior Notessenior secured first lien notes prior to their scheduled maturity dates. This loss was primarily related to the differencedifferences between the purchase prices and the par values of the notes we retired,redeemed, as well as the write‑offwrite-off of unamortized issuance costs associated with them.
LIQUIDITY
We continue to experience negative impacts of the pandemic on our business to varying degrees. Surges of COVID‑19 at various points throughout 2022 caused periodic spikes in COVID admissions at our hospitals and resulted in increased case cancellations in our Ambulatory Care segment. Throughout the pandemic, we have experienced significant price increases in medical supplies, particularly for personal protective equipment, and we have encountered supply-chain disruptions, including shortages and delays. In addition, our Ambulatory Care segment has been impacted by shipment delays in construction materials and capital equipment with respect to its de novo facility development efforts, which are a key part of our portfolio expansion strategy. The pandemic also exacerbated previously existing workforce shortages – and, thereby, competition for qualified candidates – as more employees chose to retire early, leave the workforce or take travel assignments. Over the past several years, we have had to rely on higher‑cost temporary and contract labor, which we compete with other healthcare providers to secure, and pay premiums above standard compensation for essential workers. We have been required, and we may in the future be required, to temporarily reduce overall operating capacity or suspend certain services at individual facilities due to staffing constraints and other COVID‑19‑related factors.
Broad economic factors resulting from the pandemic, including higher inflation, increased unemployment rates in certain areas where we operate and reduced consumer spending, have impacted, and are continuing to impact, our service mix, revenue mix and patient volumes. Business closings and layoffs in the areas we operate may lead to increases in the uninsured and underinsured populations and adversely affect demand for our services, as well as the ability of patients to pay for services. Any increase in the amount of or deterioration in the collectability of patient accounts receivable could adversely affect our cash flows and results of operations. If general economic conditions deteriorate or remain uncertain for an extended period of time, our liquidity and ability to repay our outstanding debt may be impacted.
We have taken, and continue to take, various actions to increase our liquidity and mitigate the impact of reductions in our patient volumes and changes in our service mix and revenue mix. These actions included the sale and redemption of various senior unsecured notes and senior secured notes, which eliminated any significant debt maturities until July 2024 and will reduce our future annual cash interest expense payments. In addition, we have continued cost-efficiency measures, as well as necessary cost reductions, to substantially offset incremental costs, including temporary staffing and premium pay, as well as higher supply costs for PPE. We have also sought to compensate for the pandemic’s disruption of our patient volumes and service mix by growing our services for which demand has been more resilient, including our higher‑acuity service lines. While the length of time that will be required for our hospital patient volumes and mix to return to pre-pandemic levels is unknown, especially demand for lower‑acuity services, we believe demand for our higher‑acuity service lines will continue to grow over time. We believe our actions, together with government relief packages, supported our ability to provide essential patient services during the initial uncertainty caused by the pandemic and continue to do so.LIQUIDITY
From time to time, we expect to engage in additional capital markets, bank credit and other financing activities depending on our needs and financing alternatives available at that time. We believe our existing debt agreements provide flexibility for future secured or unsecured borrowings.
Our cash on hand fluctuates day‑to‑day throughout the year based on the timing and levels of routine cash receipts and disbursements, including our book overdrafts, and required cash disbursements, such as interest payments and income tax payments. These fluctuations can result in material intra-quarter net operating and investing uses of cash that have caused, and in the future may cause, us to use our Credit Agreement as a source of liquidity. We believe that existing cash and cash equivalents on hand, borrowing availability under our Credit Agreement and anticipated future cash provided by our operating activities should be adequate to meet our current cash needs. These sources of liquidity, in combination with any potential future debt incurrence, should also be adequate to finance planned capital expenditures, payments on the current portion of our long-term debt, payments to current and former joint venture partners, including those related to our Share Purchase Agreementshare purchase agreement with Baylor, and other presently known operating needs.
Various aspects of our operations continue to experience adverse impacts of the COVID‑19 pandemic, although to a much lesser extent than previously experienced. If new variants emerge and cause surges in COVID‑19 cases, the local economies of areas we serve could be negatively affected. Any significant deterioration in the collectability of patient accounts receivable could adversely affect our cash flows and results of operations. If general economic conditions deteriorate or remain uncertain for an extended period of time, our liquidity and ability to repay our outstanding debt may be impacted.
Long-term liquidity for debt service and other purposes will be dependent on the amount of cash provided by operating activities and, subject to favorable market and other conditions, the successful completion of future borrowings and potential refinancings. However, our cash requirements could be materially affected by the use of cash in acquisitions of businesses, repurchases of securities, the exercise of put rights or other exit options by our joint venture partners, and contractual or regulatory commitments to fund capital expenditures in, or intercompany borrowings to, businesses we own. In addition, liquidity could be adversely affected by a deterioration in our results of operations, including our ability to generate sufficient cash from operations, as well as by the various risks and uncertainties discussed in this section and the Risk Factors section in Part I of this report, including any costs associated with legal proceedings and government investigations.
We dohave not relyrelied on commercial paper or other short-term financing arrangements nor do we enteror entered into repurchase agreements or other short-term financing arrangements not otherwise reported in our balance sheet. In addition, we do not have significant exposure to floating interest rates given that all of our current long-term indebtedness has fixed rates of interest except for borrowings, if any, under our Credit Agreement.
RECENTLY ISSUED ACCOUNTING STANDARDS
See Note 24 to the accompanying Consolidated Financial Statements for a discussion of recently issued accounting standards.
CRITICAL ACCOUNTING ESTIMATES
In preparing our Consolidated Financial Statements in conformity with GAAP, we must use estimates and assumptions that affect the amounts reported in our Consolidated Financial Statements and accompanying notes. We regularly evaluate the accounting policies and estimates we use. In general, we base the estimates on historical experience and on assumptions that we believe to be reasonable, given the particular circumstances in which we operate. Actual results may vary from those estimates.
We consider our critical accounting estimates to be those that (1) involve significant judgments and uncertainties, (2) require estimates that are more difficult for management to determine, and (3) may produce materially different outcomes under different conditions or when using different assumptions.
Our critical accounting estimates cover the following areas:
•Recognition of net operating revenues, including contractual allowances and implicit price concessions;
•Accruals for general and professional liability risks;
•Impairment of long‑lived assets;
•Impairment of goodwill; and
•Accounting for income taxes.
REVENUE RECOGNITION
We report net patient service revenues at the amounts that reflect the consideration we expect to be entitled to in exchange for providing patient care. These amounts are due from patients, third‑party payers (including managed care payers and government programs) and others, and they include variable consideration for retroactive revenue adjustments due to settlement of audits, reviews and investigations. Generally, we bill our patients and third‑party payers several days after the services are performed or shortly after discharge. Revenues are recognized as performance obligations are satisfied.
We determine performance obligations based on the nature of the services we provide. We recognize revenues for performance obligations satisfied over time based on actual charges incurred in relation to total expected charges. We believe that this method provides a faithful depiction of the transfer of services over the term of performance obligations based on the inputs needed to satisfy the obligations. Generally, performance obligations satisfied over time relate to patients in our hospitals receiving inpatient acute care services. We measure performance obligations from admission to the point when there are no further services required for the patient, which is generally the time of discharge. We recognize revenues for performance obligations satisfied at a point in time, which generally relate to patients receiving outpatient services, when (1) services are provided, and (2) we do not believe the patient requires additional services.
We determine the transaction price based on gross charges for services provided, reduced by contractual adjustments recognized for third‑party payers, discounts provided to uninsured patients in accordance with our Compact, and estimated implicit price concessions related primarily to uninsured patients. We determine our estimates of contractual adjustments and discounts based on contractual agreements, our discount policies and historical experience. We determine our estimate of implicit price concessions based on our historical collection experience with these classes of patients using a portfolio approach as a practical expedient to account for patient contracts as collective groups rather than individually. The financial statement effects of using this practical expedient are not materially different from an individual contract approach.
Revenues under the traditionalThe final determination of certain FFS Medicare and Medicaid programs are based primarily on prospective payment systems. Retrospectively determined cost‑based revenues under these programs, which were more prevalent in earlier periods, and certain otherprogram payments to our hospitals, such as IME,DSH, DGME, DSHIME and bad debt expense reimbursement, which are retrospectively determined based on our hospitals’ cost reports, are estimated using historical trendsreports. The final determination of these payments often takes many years to resolve because of audits by the program representatives, providers’ rights of appeal, and current factors. Cost report settlements under these programs are subject to audit by Medicare and Medicaid auditors and administrative and judicial review, and it can take several years until final settlementthe application of such matters is determined and completely resolved. Because the laws, regulations, instructions and rule interpretations governing Medicare and Medicaidnumerous technical reimbursement are complex and change frequently, the estimates we record could change by material amounts.
provisions. We have a system and estimation process for recording Medicare net patient service revenue and estimated cost report settlements. As a result, wetherefore record accruals to reflect the expected final settlements on our cost reports. For filed cost reports, we recordadjust the accrual for estimated cost report settlements based on those cost reports and subsequent activity, and recordwe consider the necessity of recording a valuation allowance against those cost reports based on historical settlement trends.results. The accrual for estimated cost report settlements for periods for which a cost report is yet to be filed is recorded based on estimates of what we expect to report on the filed cost reports, and a corresponding valuation allowance is recorded, as
if necessary, based on the method previously described. Cost reports must generally must be filed within five months after the end of the annual cost report reporting period. After the cost report is filed, the accrual and corresponding valuation allowance may need to be adjusted. In addition, because the laws, regulations, instructions and rule interpretations governing Medicare and Medicaid reimbursement are complex and change frequently, the estimates we record could change by material amounts.
Revenues under managed care plans are based primarily on payment terms involving predetermined rates per diagnosis, per‑diem rates, discounted FFS rates and/or other similar contractual arrangements. These revenues are also subject to review and possible audit by the payers, which can take several years before they are completely resolved. The payers are billed for patient services on an individual patient basis. An individual patient’s bill is subject to adjustment on a patient‑by‑patient basis in the ordinary course of business by the payers following their review and adjudication of each particular bill. We estimate the discounts for contractual allowances at the individual hospital level utilizing billing data on an individual patient basis. At the end of each month, on an individual hospital basis, we estimate our expected reimbursement for patients of managed care plans based on the applicable contract terms. We believe it is reasonably likely for there to be an approximately 3% increase or decrease in the estimated contractual allowances related to managed care plans. Based on reserves at December 31, 2022,2023, a 3% increase or decrease in the estimated contractual allowance would impact the estimated reserves by approximately $18$25 million. Some of the factors that can contribute to changes in the contractual allowance estimates include: (1) changes in reimbursement levels for procedures, supplies and drugs when threshold levels are triggered; (2) changes in reimbursement levels when stop‑loss or outlier limits are reached; (3) changes in the admission status of a patient due to physician orders subsequent to initial diagnosis or testing; (4) final coding of in‑house and discharged‑not‑final‑billed patients that change reimbursement levels; (5) secondary benefits determined after primary insurance payments; and (6) reclassification of patients among insurance plans with different coverage and payment levels. Contractual allowance estimates are periodically reviewed for accuracy by taking into consideration known contract terms, as well as payment history. We believe our estimation and review process enables us to identify instances on a timely basis where such estimates need to be revised. We do not believe there were any adjustments to estimates of patient bills that were material to our revenues during the year ended December 31, 2022.2023. In addition, on a corporate‑wide basis, we do not record any general provision for adjustments
to estimated contractual allowances for managed care plans. Managed care accounts, net of contractual allowances recorded, are further reduced to their net realizable value through implicit price concessions based on historical collection trends for these payers and other factors that affect the estimation process.
Generally, patients who are covered by third‑party payers are responsible for related co‑pays, co‑insurance and deductibles, which vary in amount. We also provide services to uninsured patients and offer uninsured patients a discount from standard charges. We estimate the transaction price for patients with co‑pays, co‑insurance and deductibles and for those who are uninsured based on historical collection experience and current market conditions. Under our Compact and other uninsured discount programs, the discount offered to certain uninsured patients is recognized as a contractual allowance, which reduces net operating revenues at the time the self‑pay accounts are recorded. The uninsured patient accounts, net of contractual allowances recorded, are further reduced to their net realizable value at the time they are recorded through implicit price concessions based on historical collection trends for self‑pay accounts and other factors that affect the estimation process. There are various factors that can impact collection trends, such as: changes in the economy, which in turn have an impact on unemployment rates and the number of uninsured and underinsured patients; the volume of patients through our emergency departments; the increased burden of co‑pays, co‑insurance amounts and deductibles to be made by patients with insurance; and business practices related to collection efforts. These factors continuously change and can have an impact on collection trends and our estimation process. Subsequent changes to the estimate of the transaction price are generally recorded as adjustments to net patient service revenues in the period of the change.
We record implicit price concessions, primarily related to uninsured patients and patients with co‑pays, co‑insurance and deductibles. The implicit price concessions included in estimating the transaction price represent the difference between amounts billed to patients and the amounts we expect to collect based on our collection history with similar patients. Although outcomes vary, our policy is to attempt to collect amounts due from patients, including co‑pays, co‑insurance and deductibles due from patients with insurance, at the time of service while complying with all federal and state statutes and regulations, including, but not limited to, the Emergency Medical Treatment and Active Labor Act (“EMTALA”). Generally, as required by EMTALA, patients may not be denied emergency treatment due to inability to pay. Therefore, services, including the legally required medical screening examination and stabilization of the patient, are performed without delaying to obtain insurance information. In non‑emergency circumstances or for elective procedures and services, it is our policy to verify insurance prior to a patient being treated; however, there are various exceptions that can occur. Such exceptions can include, for example, instances where (1) we are unable to obtain verification because the patient’s insurance company was unable to be reached or contacted, (2) a determination is made that a patient may be eligible for benefits under various government programs, such as Medicaid or Victims of Crime, and it takes several days or weeks before qualification for such benefits is confirmed or denied, and (3) under physician orders we provide services to patients that require immediate treatment.
Based on our accounts receivable from uninsured patients and co-pays, co-insurance amounts and deductibles owed to us by patients with insurance at December 31, 2022,2023, a 10% increase or decrease in our self‑pay collection rate, or approximately 3%, which we believe could be a reasonably likely change, would result in a favorable or unfavorable adjustment to patient accounts receivable of approximately $11 million.
ACCRUALS FOR GENERAL AND PROFESSIONAL LIABILITY RISKS
We accrue for estimated professional and general liability claims, to the extent not covered by insurance, when they are probable and can be reasonably estimated. We maintain reserves, which are based on modeled estimates for the portion of our professional liability risks, including incurred but not reported claims, to the extent we do not have insurance coverage. Our liability consists of estimates established based upon calculations using several factors, including the number of expected claims, estimates of losses for these claims based on recent and historical settlement amounts, estimates of incurred but not reported claims based on historical experience and the timing of historical payments. We consider the number of expected claims and average cost per claim to be the most significant assumptions in estimating accruals for general and professional liabilities. Our liabilities are adjusted for new claims information in the period such information becomes known. Malpractice expense is recorded within other operating expenses in our consolidated statements of operations.
Our estimated reserves for professional and general liability claims will change significantly if future trends differ from projected trends. We believe it is reasonably likely for there to be a 500 basis point increase or decrease in our frequency or severity trend. Based on our reserves and other information at December 31, 2022,2023, a 500 basis point increase in our frequency trend would increase the estimated reserves by $36$34 million, and a 500 basis point decrease in our frequency trend would decrease the estimated reserves by $27$29 million. A 500 basis point increase in our severity trend would increase the estimated reserves by $206$250 million, and a 500 basis point decrease in our severity trend would decrease the estimated reserves by $130$146 million. In addition, because of the complexity of the claims, the extended period of time to settle the claims and the wide range of potential outcomes, our ultimate liability for professional and general liability claims could change materially from our current estimates.
The table below shows the case reserves and incurred but not reported and loss development reserves:
| | | |
| | | | December 31, | December 31, |
| | | 2022 | | 2021 |
| Case reserves | Case reserves | $ | 343 | | | $ | 387 | |
| Case reserves | |
| Case reserves | |
| Incurred but not reported and loss development reserves | |
| Incurred but not reported and loss development reserves | |
| Incurred but not reported and loss development reserves | Incurred but not reported and loss development reserves | 702 | | | 658 | |
| Total reserves | Total reserves | $ | 1,045 | | | $ | 1,045 | |
| Total reserves | |
| Total reserves | |
Several actuarial methods, including the incurred, paid loss development and Bornhuetter‑Ferguson methods, are applied to our historical loss data to produce estimates of ultimate expected losses and the resulting incurred but not reported and loss development reserves. These methods use our specific historical claims data related to paid losses and loss adjustment expenses, historical and current case reserves, reported and closed claim counts, and a variety of hospital census information. These analyses are considered in our determination of our estimate of the professional liability claims, including the incurred but not reported and loss development reserve estimates. The determination of our estimates involves subjective judgment and could result in material changes to our estimates in future periods if our actual experience is materially different than our assumptions.
Malpractice claims generally take up to five years to settle from the time of the initial reporting of the occurrence to the settlement payment. Accordingly, the percentage of reserves at December 31, 20222023 and 20212022 representing unsettled claims was approximately 95%99% and 98%95%, respectively.
The following table, which includes both our continuing and discontinued operations, presents the amount of our accruals for professional and general liability claims and the corresponding activity therein:
| | | |
| | | | Years Ended December 31, | Years Ended December 31, |
| | | 2022 | | 2021 |
| Accrual for professional and general liability claims, beginning of the year | Accrual for professional and general liability claims, beginning of the year | $ | 1,045 | | | $ | 978 | |
Accrual for professional and general liability claims, beginning of the year | |
Accrual for professional and general liability claims, beginning of the year | |
| Less losses recoverable from re-insurance and excess insurance carriers | |
| Less losses recoverable from re-insurance and excess insurance carriers | |
| Less losses recoverable from re-insurance and excess insurance carriers | Less losses recoverable from re-insurance and excess insurance carriers | (38) | | | (50) | |
Expense related to(1): | Expense related to(1): | | | |
Expense related to(1): | |
Expense related to(1): | |
| Current year | |
| Current year | |
| Current year | Current year | 173 | | | 200 | |
| Prior years | Prior years | 74 | | | 131 | |
| Prior years | |
| Prior years | |
| Total incurred loss and loss expense | |
| Total incurred loss and loss expense | |
| Total incurred loss and loss expense | Total incurred loss and loss expense | 247 | | | 331 | |
| Paid claims and expenses related to: | Paid claims and expenses related to: | | | |
| Paid claims and expenses related to: | |
| Paid claims and expenses related to: | |
| Current year | |
| Current year | |
| Current year | Current year | (7) | | | (13) | |
| Prior years | Prior years | (249) | | | (239) | |
| Prior years | |
| Prior years | |
| Total paid claims and expenses | |
| Total paid claims and expenses | |
| Total paid claims and expenses | Total paid claims and expenses | (256) | | | (252) | |
| Plus losses recoverable from re-insurance and excess insurance carriers | Plus losses recoverable from re-insurance and excess insurance carriers | 47 | | | 38 | |
| Plus losses recoverable from re-insurance and excess insurance carriers | |
| Plus losses recoverable from re-insurance and excess insurance carriers | |
| Accrual for professional and general liability claims, end of year | Accrual for professional and general liability claims, end of year | $ | 1,045 | | | $ | 1,045 | |
| Accrual for professional and general liability claims, end of year | |
| Accrual for professional and general liability claims, end of year | |
(1)Total malpractice expense for continuing operations, including premiums for insured coverage and recoveries from third parties, was $276$369 million and $355$276 million in the years ended December 31, 20222023 and 2021,2022, respectively.
IMPAIRMENT OF LONG-LIVED ASSETS
We evaluate our long‑lived assets for possible impairment annually or whenever events or changes in circumstances indicate that the carrying amount of an asset group may not be recoverable from estimated future undiscounted cash flows.flows (“UDCF”). If the estimated future undiscounted cash flowsUDCF are less than the carrying value of the asset group, we calculate the amount of an impairment charge only if the carrying value of the asset group exceeds the fair value. For purposes of impairment testing, all asset groups are evaluated at a level below that of the reporting unit, and their carrying values do not include any allocations of goodwill. The fair values of assets are estimated based on third‑party appraisals, established market values of comparable assets or internally developed estimates of future net cash flows expected to result from the use and ultimate disposition of those assets. The estimates of these future net cash flows are based on assumptions and projections we believe to be reasonable and supportable. Estimates require our subjective judgments and take into account assumptions about revenue and expense growth rates, operating margins and recoverable disposition values, based on industry and operating factors. These assumptions may vary by type of asset group and presume stable, improving or, in some cases, declining results, depending on their circumstances. If the presumed level of performance does not occur as expected, impairment may result.
We report long‑lived assets to be disposed of at the lower of their carrying amounts or fair values less costs to sell. In such circumstances, our estimates of fair value are based on third‑party appraisals, established market prices for comparable assets or internally developed estimates of future net cash flows.
Fair value estimates can change by material amounts in subsequent periods. Many factors and assumptions can impact the estimates, including the following risks:
•future financial results, which can be impacted by volumes of insured patients and declines in commercial managed care patients, terms of managed care payer arrangements, our ability to collect amounts due from uninsured and managed care payers, loss of volumes as a result of competition, physician recruitment and retention, and our ability to manage costs such as labor costs, which can be adversely impacted by labor shortages, inflationary pressure on wages and union activity;
•changes in payments from governmental healthcare programs and in government regulations, such as reductions to Medicare and Medicaid payment rates resulting from government legislation or rule‑making or from budgetary challenges of states in which we operate;
•how the hospitals and ambulatory centers are operated in the future;
•the nature of the ultimate disposition of the assets; and
•macro-economic conditions such as inflation, GDPgross domestic product (GDP) growth and unforeseen technological advancements.
our investment in certain equity method investments held by our Ambulatory Care segment. During the year ended December 31, 2022, we recorded $94 million of impairment charges, of which $82 million related to the impairment of certain buildings and medical equipment located in one of our markets. Of the total impairment charges recognized for the year ended December 31, 2022, $86 million related to our Hospital Operations segment, $6 million related to our Ambulatory Care segment and $2 million related to our Conifer segment.
During the year ended December 31, 2021, we recorded $8 million of impairment charges, primarily related to the write‑down of certain indefinite-lived management contracts within our Ambulatory Care segment to their estimated fair values. Of the total impairment charges recognized for the yearyears ended December 31, 2023, 2022 and 2021, $1 million, $88 million and $3 million, respectively, related to our Hospital Operations segment and $42 million, $6 million and $5 million, respectively, related to our Ambulatory Care segment and $3 million related to our Conifer segment.
In our most recent impairment analysis as of December 31, 2022,2023, we had twoone asset groups,group, including three and fivetwo hospitals and related operations, respectively, with a carrying valuesvalue of $219$181 million and $478 million, respectively, whose estimated undiscounted future cash flowsUDCF was approximately 99% of the asset group’s carrying value. However, the asset group’s estimated fair value exceeded their respectiveits carrying value by approximately 129% and 134%106%, respectively. The individual estimated undiscounted future cash flows of these long‑lived asset groups may not be considered to be substantially in excess of cash flows necessary to recover the respective carrying value of their long-lived assets.therefore no impairment was recognized. Future adverse trends that necessitate unfavorable changes in the estimates of the undiscounted future cash flows of either asset groupassumptions and projections underlying our fair value estimate could result in the estimated undiscounted future cash flowsfair value being less than the respective carrying value of the long‑lived assets, which would require a fair value assessment of the affected asset group, and if the fair value amount is less than the carrying value of the asset group’s long‑lived assets, material impairment charges could result.
IMPAIRMENT OF GOODWILL
Goodwill represents the excess of purchase price over the net estimated fair value of identifiable assets acquired and liabilities assumed in a business combination. Goodwill is determined to have an indefinite useful life and is not amortized, but is instead subject to impairment tests performed at least annually, or when events occur that would more likely than not reduce the fair value of the reporting unit below its carrying amount. For goodwill, we assess qualitative factors to determine whether it is more likely than not that the fair value of a reporting unit is less than its carrying amount. Further testing is required only if we determine, based on the qualitative assessment, that it is more likely than not that a reporting unit’s fair value is less than its carrying value. Otherwise, no further impairment testing is required. If we determine the carrying value of goodwill is impaired, or if the carrying value of a business that is to be sold or otherwise disposed of exceeds its fair value, we reduce the carrying value, including any allocated goodwill, to fair value, with any impairment not to exceed the carrying amount of goodwill. Any impairment would be recognized as a charge to income from operations and a reduction in the carrying value of goodwill.
At December 31, 2022, our business included three reportableOur reporting segments – Hospital Operations, Ambulatory Care and Conifer. Our reportable segments are the reporting units used to perform our goodwill impairment analysis,analysis. At December 31, 2022, our business was organized into three separate reporting segments: Hospital Operations and goodwill is accordingly assignedother, Ambulatory Care and Conifer. During the three months ended December 31, 2023, we combined our Hospital Operations and other and Conifer segments into a single reporting segment named Hospital Operations and Services (Hospital Operations). This change was made to these reportingreflect recent updates to the organizational and management structure of our Conifer and Hospital Operations and other segments. We completedperformed our annual goodwill impairment tests for goodwillanalysis as of October 1, 2022.
The allocated2023 based on our three separate reporting segments. We performed an additional goodwill balances related toimpairment analysis as of December 31, 2023, following the combination of our Hospital Operations Ambulatory Careand other and Conifer segments, were $2.806 billion, $6.712 billion and $605 million, respectively, at December 31, 2022. We performed a separate qualitative analysis forbased on our reporting units and, in each case, concluded it was more likely than not that the fair value of each reporting unit exceeded its respective carrying value.new two-segment structure. Factors considered in these analyses included recent and estimated future operating trends derived from macro‑economic conditions, industry conditions and other
factors specific to each reporting segment. Neither of the impairment analyses resulted in the identification of a goodwill impairment. At December 31, 2023 and 2022, the allocated goodwill balances related to our Hospital Operations segment were $3.119 billion and $3.411 billion, respectively, and $7.188 billion and $6.712 billion, respectively, related to our Ambulatory Care segment.
ACCOUNTING FOR INCOME TAXES
We account for income taxes using the asset and liability method. This approach requires the recognition of deferred tax assets and liabilities for the expected future tax consequences of temporary differences between the carrying amounts and the tax bases of assets and liabilities. Income tax receivables and liabilities and deferred tax assets and liabilities are recognized based on the amounts that more likely than not will be sustained upon ultimate settlement with taxing authorities.
Developing our provision for income taxes and analysis of uncertain tax positions requires significant judgment and knowledge of federal and state income tax laws, regulations and strategies, including the determination of deferred tax assets and liabilities and, if necessary, any valuation allowances that may be required for deferred tax assets.
We assess the realization of our deferred tax assets to determine whether an income tax valuation allowance is required. Based on all available evidence, both positive and negative, and the weight of that evidence to the extent such evidence can be objectively verified, we determine whether it is more likely than not that all or a portion of the deferred tax assets will be realized. The main factors that we consider include:
•Cumulative profits/losses in recent years, adjusted for certain nonrecurring items;
•Income/losses expected in future years;
•Unsettled circumstances that, if unfavorably resolved, would adversely affect future operations and profit levels;
•The availability, or lack thereof, of taxable income in prior carryback periods that would limit realization of tax benefits; and
•The carryforward period associated with the deferred tax assets and liabilities.
During the year ended December 31, 2023, the valuation allowance increased by $71 million, including an increase of $73 million due to limitations on the tax deductibility of interest expense and a decrease of $2 million due to changes in the expected realizability of deferred tax assets. The balance in the valuation allowance as of December 31, 2023 was $248 million.
A change in the business interest expense disallowance rules took effect in 2022, resulting in a larger amount of interest disallowance compared to prior years. During the year ended December 31, 2022, the valuation allowance increased by $120 million, including an increase of $123 million due to limitations on the tax deductibility of interest expense, a decrease of $1 million due to the expiration or worthlessness of unutilized net operating loss carryovers, and a decrease of $2 million due to changes in the expected realizability of deferred tax assets. The balance in the valuation allowance as of December 31, 2022 was $177 million. During the year ended December 31, 2021, the valuation allowance increased by $2 million, including an increase of $2 million due to limitations on the tax deductibility of interest expense, a decrease of $2 million due to the expiration or worthlessness of unutilized state net operating loss carryovers, and an increase of $2 million due to changes in the expected realizability of deferred tax assets. The remaining balance in the valuation allowance at December 31, 2021 was $57 million. Deferred tax assets relating to interest expense limitations under Internal Revenue Code Section 163(j) have a full valuation allowance because the interest expense carryovers are not expected to be utilized in the foreseeable future.
We consider many factors when evaluating our uncertain tax positions, and such judgments are subject to periodic review. Tax benefits associated with uncertain tax positions are recognized in the period in which one of the following conditions is satisfied: (1) the more likely than not recognition threshold is satisfied; (2) the position is ultimately settled through negotiation or litigation; or (3) the statute of limitations for the taxing authority to examine and challenge the position has expired. Tax benefits associated with an uncertain tax position are derecognized in the period in which the more likely than not recognition threshold is no longer satisfied.
While we believe we have adequately provided for our income tax receivables or liabilities and our deferred tax assets or liabilities, adverse determinations by taxing authorities or changes in tax laws and regulations could have a material adverse effect on our consolidated financial position, results of operations or cash flows.
ITEM 7A. QUANTITATIVE AND QUALITATIVE DISCLOSURES ABOUT MARKET RISK
The following table presents information about certain of our market‑sensitive financial instruments at December 31, 2022.2023. The fair values were determined based on quoted market prices for the same or similar instruments. The average effective interest rates presented are based on the rate in effect at the end of the reporting period. The effects of unamortized discounts and issue costs are excluded from the table.
| | | |
| | | | Maturity Date, Years Ending December 31, | |
| | | 2023 | | 2024 | | 2025 | | 2026 | | 2027 | | Thereafter | | Total | | Fair Value | 2024 | | 2025 | | 2026 | | 2027 | | 2028 | | Thereafter | | Total | | Fair Value |
| | | (Dollars in Millions) | | (Dollars in Millions) |
| Fixed-rate long-term debt | Fixed-rate long-term debt | $ | 145 | | | $ | 1,463 | | | $ | 77 | | | $ | 2,143 | | | $ | 3,012 | | | $ | 8,370 | | | $ | 15,210 | | | $ | 14,121 | |
| Average effective interest rates | Average effective interest rates | 5.2 | % | | 4.7 | % | | 6.0 | % | | 4.9 | % | | 5.7 | % | | 5.4 | % | | 5.3 | % | | | Average effective interest rates | 6.4 | % | | 7.2 | % | | 4.9 | % | | 5.7 | % | | 5.8 | % | | 5.5 | % | | 5.6 | % | | |
We have no affiliation with partnerships, trusts or other entities (sometimes referred to as “special‑purpose” or “variable‑interest” entities) whose purpose is to facilitate off‑balance sheet financial transactions or similar arrangements by us. As a result, we have no exposure to the financing, liquidity, market or credit risks associated with such entities. We do not hold or issue derivative instruments for trading purposes and are not a party to any instruments with leverage or prepayment features.
ITEM 8. FINANCIAL STATEMENTS AND SUPPLEMENTARY DATA
MANAGEMENT REPORT ON INTERNAL CONTROL OVER FINANCIAL REPORTING
To Our Shareholders:
Management is responsible for establishing and maintaining adequate internal control over financial reporting, as such term is defined in Rule 13a-15(f) under the Securities Exchange Act of 1934, as amended. Management assessed the effectiveness of Tenet’s internal control over financial reporting as of December 31, 2022.2023. This assessment was performed under the supervision of and with the participation of management, including the chief executive officer and chief financial officer.
In making this assessment, management used criteria based on the framework in Internal Control — Integrated Framework (2013) issued by the Committee of Sponsoring Organizations of the Treadway Commission (“COSO”). Based on the assessment using the COSO framework, management concluded that Tenet’s internal control over financial reporting was effective as of December 31, 2022.2023.
Tenet’s internal control over financial reporting as of December 31, 20222023 has been audited by Deloitte & Touche LLP, an independent registered public accounting firm, as stated in their report, which is included herein. Deloitte & Touche LLP has also audited Tenet’s Consolidated Financial Statements as of and for the year ended December 31, 2022,2023, and that firm’s audit report on such Consolidated Financial Statements is also included herein.
Internal control over financial reporting cannot provide absolute assurance of achieving financial reporting objectives because of its inherent limitations. Internal control over financial reporting is a process that involves human diligence and compliance and is subject to lapses in judgment and breakdowns resulting from human failures. Internal control over financial reporting also can be circumvented by collusion or improper management override. Because of such limitations, there is a risk that material misstatements may not be prevented or detected on a timely basis by internal control over financial reporting. However, these inherent limitations are known features of the financial reporting process. Therefore, it is possible to design into the process safeguards to reduce, though not eliminate, this risk.
| | | | | |
| /s/ SAUMYA SUTARIA | /s/ DANIEL J. CANCELMISUN PARK |
| Saumya Sutaria, M.D. | Daniel J. CancelmiSun Park |
| Chief Executive Officer | Executive Vice President and Chief Financial Officer |
February 17, 202316, 2024 | February 17, 202316, 2024 |
REPORT OF INDEPENDENT REGISTERED PUBLIC ACCOUNTING FIRM
To the Shareholders and the Board of Directors of Tenet Healthcare Corporation
Opinion on Internal Control over Financial Reporting
We have audited the internal control over financial reporting of Tenet Healthcare Corporation and subsidiaries (the “Company”) as of December 31, 2022,2023, based on criteria established in Internal Control — Integrated Framework (2013) issued by the Committee of Sponsoring Organizations of the Treadway Commission (COSO). In our opinion, the Company maintained, in all material respects, effective internal control over financial reporting as of December 31, 2022,2023, based on criteria established in Internal Control — Integrated Framework (2013) issued by COSO.
We have also audited, in accordance with the standards of the Public Company Accounting Oversight Board (United States) (PCAOB), the consolidated financial statements and financial statement schedule as of and for the year ended December 31, 2022,2023, of the Company and our report dated February 17, 2023,16, 2024, expressed an unqualified opinion on those financial statements.
Basis for Opinion
The Company’s management is responsible for maintaining effective internal control over financial reporting and for its assessment of the effectiveness of internal control over financial reporting, included in the accompanying Management’s Report on Internal Control over Financial Reporting. Our responsibility is to express an opinion on the Company’s internal control over financial reporting based on our audit. We are a public accounting firm registered with the PCAOB and are required to be independent with respect to the Company in accordance with the U.S. federal securities laws and the applicable rules and regulations of the Securities and Exchange Commission and the PCAOB.
We conducted our audit in accordance with the standards of the PCAOB. Those standards require that we plan and perform the audit to obtain reasonable assurance about whether effective internal control over financial reporting was maintained in all material respects. Our audit included obtaining an understanding of internal control over financial reporting, assessing the risk that a material weakness exists, testing and evaluating the design and operating effectiveness of internal control based on the assessed risk, and performing such other procedures as we considered necessary in the circumstances. We believe that our audit provides a reasonable basis for our opinion.
Definition and Limitations of Internal Control over Financial Reporting
A company’s internal control over financial reporting is a process designed to provide reasonable assurance regarding the reliability of financial reporting and the preparation of financial statements for external purposes in accordance with generally accepted accounting principles. A company’s internal control over financial reporting includes those policies and procedures that (1) pertain to the maintenance of records that, in reasonable detail, accurately and fairly reflect the transactions and dispositions of the assets of the company; (2) provide reasonable assurance that transactions are recorded as necessary to permit preparation of financial statements in accordance with generally accepted accounting principles, and that receipts and expenditures of the company are being made only in accordance with authorizations of management and directors of the company; and (3) provide reasonable assurance regarding prevention or timely detection of unauthorized acquisition, use, or disposition of the company’s assets that could have a material effect on the financial statements.
Because of its inherent limitations, internal control over financial reporting may not prevent or detect misstatements. Also, projections of any evaluation of effectiveness to future periods are subject to the risk that controls may become inadequate because of changes in conditions, or that the degree of compliance with the policies or procedures may deteriorate.
/s/ DELOITTE & TOUCHE LLP
Dallas, Texas
February 17, 202316, 2024
REPORT OF INDEPENDENT REGISTERED PUBLIC ACCOUNTING FIRM
To the Shareholders and the Board of Directors of Tenet Healthcare Corporation
Opinion on the Financial Statements
We have audited the accompanying consolidated balance sheets of Tenet Healthcare Corporation and subsidiaries (the “Company”) as of December 31, 20222023 and 2021,2022, the related consolidated statements of operations, other comprehensive income, (loss), changes in equity, and cash flows for each of the three years in the period ended December 31, 2022,2023, and the related notes and the consolidated financial statement schedule listed in the Index at Item 15 (collectively referred to as the “financial statements”). In our opinion, the financial statements present fairly, in all material respects, the financial position of the Company as of December 31, 20222023 and 2021,2022, and the results of its operations and its cash flows for each of the three years in the period ended December 31, 2022,2023, in conformity with accounting principles generally accepted in the United States of America.
We have also audited, in accordance with the standards of the Public Company Accounting Oversight Board (United States) (PCAOB), the Company's internal control over financial reporting as of December 31, 2022,2023, based on criteria established in Internal Control — Integrated Framework (2013) issued by the Committee of Sponsoring Organizations of the Treadway Commission and our report dated February 17, 2023,16, 2024, expressed an unqualified opinion on the Company's internal control over financial reporting.
Basis for Opinion
These financial statements are the responsibility of the Company's management. Our responsibility is to express an opinion on the Company's financial statements based on our audits. We are a public accounting firm registered with the PCAOB and are required to be independent with respect to the Company in accordance with the U.S. federal securities laws and the applicable rules and regulations of the Securities and Exchange Commission and the PCAOB.
We conducted our audits in accordance with the standards of the PCAOB. Those standards require that we plan and perform the audit to obtain reasonable assurance about whether the financial statements are free of material misstatement, whether due to error or fraud. Our audits included performing procedures to assess the risks of material misstatement of the financial statements, whether due to error or fraud, and performing procedures that respond to those risks. Such procedures included examining, on a test basis, evidence regarding the amounts and disclosures in the financial statements. Our audits also included evaluating the accounting principles used and significant estimates made by management, as well as evaluating the overall presentation of the financial statements. We believe that our audits provide a reasonable basis for our opinion.
Critical Audit Matters
The critical audit matters communicated below are matters arising from the current-period audit of the financial statements that were communicated or required to be communicated to the audit committee and that (1) relate to accounts or disclosures that are material to the financial statements and (2) involved our especially challenging, subjective, or complex judgments. The communication of critical audit matters does not alter in any way our opinion on the financial statements, taken as a whole, and we are not, by communicating the critical audit matters below, providing separate opinions on the critical audit matters or on the accounts or disclosures to which they relate.
Net Operating Revenues and Accounts Receivable -— Implicit Price Concessions — Refer to Notes 1, 3, and 15 to the financial statements
Critical Audit Matter Description
Management reports net patient service revenues and accounts receivable at the amounts that reflect the consideration to which they expect to be entitled for providing patient care. As of and for the year ended December 31, 2022, the balances for net operating revenues, of which approximately 93% is net patient service revenues, and accounts receivable were $19.174 billion and $2.943 billion, respectively. The transaction price is based on gross charges for services provided, reduced by contractual adjustments recognized for third-party payers, discounts provided to uninsured patients in accordance with the Company’s Compact with Uninsured Patients, and estimated implicit price concessions related primarily to uninsured patients.patients and patients with co-pays, co-insurance and deductibles. The implicit price concessions are estimates developed by management based on their historical collection experience with thesefor payer classes of patients using a portfolio approach.
We identified the estimate of implicit price concessions for certain hospital markets in the Hospital Operations and Services segment as a critical audit matter because of the significant judgments made by management to reduce net patient service revenues and accounts receivable for these hospital markets to their net realizable value through implicit price concessions. Performing audit procedures to evaluate management’s estimate of implicit price concessions involved especially subjective
Givenauditor judgment given the judgments necessary to estimate the implicit price concessions to determine the amount of net patient service revenues recognized and the value of accounts receivable as a result of inherent subjectivity in collection trends from changes in the economy, patient volumes, amounts to be paid by patients with insurance, and other factors auditing such estimates involved especially subjective judgments.considered by management.
How the Critical Audit Matter Was Addressed in the Audit
Our audit procedures related to management’s estimates of the implicit price concessions used to determine the value ofreduce net patient service revenues and accounts receivable to their net realizable value for certain hospital markets in the Hospital Operations and Services segment included the following, among others:
•We tested the effectiveness of controls overrelated to net patient service revenues and the valuation of accounts receivable, including those over the historical collectionscollection data and management’s analysis of their historical collection experience and judgments applied to develop their assumptions for implicit price concessions.payer classes.
•We evaluated the methods and assumptions used by management to estimate the implicit price concessions by:
–Testing the underlying data that served as the basis for the implicit price concession ratesconcessions developed by management, including the historical collections data within thefor payer classes, of patients, to evaluate whether the inputs to management’s estimate were reasonable.
–ComparingPerforming a retrospective analysis on management’s prior-year expectationreserve estimates for prior years by (1) calculating the reserves based on actual collection results and comparing to management’s recorded balances and (2) comparing actual amounts recorded duringwrite-offs in the current year.year to the prior year estimated losses.
•We developed an independent estimateindependently recalculated reserve rates using historical collection data for each class of patients.payer class. We then compared the result to the implicit price concession estimate developed by management to evaluate the reasonableness of accounts receivable and net patient service revenues.
Professional and General Liability Reserves-Reserves — Refer to Notes 1 and 16 to the financial statements
Critical Audit Matter Description
Management records an accrualaccruals for the portion of their professional and general liability risks, including incurred but not reported claims, for which they are self-insured and that are probable and can be reasonably estimated. As of December 31, 2022, the accrual for professional and general liability reserves was $1.045 billion. This accrual isThese accruals are estimated based on internal and third-party modeled estimates of projected payments using case-specific facts and circumstances and the Company’s historical claim loss reporting, claim development and settlement patterns, reported and closed claim counts, and a variety of hospital census information.
GivenWe identified the professional and general liability reserves for hospitals in the Hospital Operations and Services segment as a critical audit matter because auditing management’s estimate for these reserves involved especially subjective auditor judgment and required the involvement of our actuarial specialists given the subjectivity of estimating the projected liability of reported and unreported claims, auditing the professional and general liability reserves involved especially subjective judgments.claims.
How the Critical Audit Matter Was Addressed in the Audit
Our audit procedures related to the professional and general liability reserves for hospitals in the Hospital Operations and Services segment included the following, among others:
•We tested the effectiveness of controls related to the professional and general liability reserves, including those over the estimation of the projected liability of reported and unreported claims.
•We evaluated the data used by management to estimate the professional and general liability reserves by:
–Testing the underlying data that served as the basis for the internal and third-party actuarial analyses, including historical claims, to evaluate thatwhether the inputs to the actuarial estimates were reasonable.
–Comparing management’s prior-year recorded balanceprior year expected emergence of losses to actual losses incurred during the current year.
•With the assistance of our internal actuarial specialists, we developed an independent range of estimates of the professional and general liability reserves, using loss data, historical and industry claim development factors, among other factors, to derive a range of projections of ultimate losses, and compared our estimates to management’s estimates.the recorded balance.
/s/ DELOITTE & TOUCHE LLP
Dallas, Texas
February 17, 202316, 2024
We have served as the Company's auditor since 2007.
CONSOLIDATED BALANCE SHEETS
Dollars in Millions, Share Amounts in Thousands
| | | | | | | | | | | | | | |
| | | December 31, | | December 31, |
| | 2022 | | 2021 |
| ASSETS | | | | |
| Current assets: | | | | |
| Cash and cash equivalents | | $ | 858 | | | $ | 2,364 | |
| Accounts receivable | | 2,943 | | | 2,770 | |
| Inventories of supplies, at cost | | 405 | | | 384 | |
| | | | |
| | | | |
| Other current assets | | 1,775 | | | 1,557 | |
| Total current assets | | 5,981 | | | 7,075 | |
| Investments and other assets | | 3,147 | | | 3,254 | |
| Deferred income taxes | | 19 | | | 65 | |
Property and equipment, at cost, less accumulated depreciation and amortization ($6,201 at December 31, 2022 and $5,960 at December 31, 2021) | | 6,462 | | | 6,427 | |
| Goodwill | | 10,123 | | | 9,261 | |
Other intangible assets, at cost, less accumulated amortization ($1,428 at December 31, 2022 and $1,374 at December 31, 2021) | | 1,424 | | | 1,497 | |
| Total assets | | $ | 27,156 | | | $ | 27,579 | |
| LIABILITIES AND EQUITY | | | | |
| Current liabilities: | | | | |
| Current portion of long-term debt | | $ | 145 | | | $ | 135 | |
| Accounts payable | | 1,504 | | | 1,300 | |
| Accrued compensation and benefits | | 778 | | | 896 | |
| Professional and general liability reserves | | 255 | | | 254 | |
| Accrued interest payable | | 213 | | | 203 | |
| | | | |
| Contract liabilities | | 110 | | | 959 | |
| Other current liabilities | | 1,471 | | | 1,362 | |
| Total current liabilities | | 4,476 | | | 5,109 | |
| Long-term debt, net of current portion | | 14,934 | | | 15,511 | |
| Professional and general liability reserves | | 790 | | | 791 | |
| Defined benefit plan obligations | | 331 | | | 421 | |
| Deferred income taxes | | 217 | | | 36 | |
| Contract liabilities – long-term | | 13 | | | 15 | |
| Other long-term liabilities | | 1,787 | | | 1,439 | |
| Total liabilities | | 22,548 | | | 23,322 | |
| Commitments and contingencies | | | | |
| Redeemable noncontrolling interests in equity of consolidated subsidiaries | | 2,149 | | | 2,203 | |
| Equity: | | | | |
| Shareholders’ equity: | | | | |
Common stock, $0.05 par value; authorized 262,500,000 shares; 156,462,456 shares issued at December 31, 2022 and 155,520,691 shares issued at December 31, 2021 | | 8 | | | 8 | |
| Additional paid-in capital | | 4,778 | | | 4,877 | |
| Accumulated other comprehensive loss | | (181) | | | (233) | |
| Accumulated deficit | | (803) | | | (1,214) | |
Common stock in treasury, at cost, 54,215,871 shares at December 31, 2022 and 48,331,649 shares at December 31, 2021 | | (2,660) | | | (2,410) | |
| Total shareholders’ equity | | 1,142 | | | 1,028 | |
| Noncontrolling interests | | 1,317 | | | 1,026 | |
| Total equity | | 2,459 | | | 2,054 | |
| Total liabilities and equity | | $ | 27,156 | | | $ | 27,579 | |
See accompanying Notes to Consolidated Financial Statements.
CONSOLIDATED STATEMENTS OF OPERATIONS
Dollars in Millions, Except Per-Share Amounts
| | | | | | | | | | | | | | | | | |
| | Years Ended December 31, |
| | 2022 | | 2021 | | 2020 |
| Net operating revenues | $ | 19,174 | | | $ | 19,485 | | | $ | 17,640 | |
| Grant income | 194 | | | 191 | | | 882 | |
| Equity in earnings of unconsolidated affiliates | 216 | | | 218 | | | 169 | |
| Operating expenses: | | | | | |
| Salaries, wages and benefits | 8,844 | | | 8,878 | | | 8,418 | |
| Supplies | 3,273 | | | 3,328 | | | 2,982 | |
| Other operating expenses, net | 3,998 | | | 4,206 | | | 4,125 | |
| Depreciation and amortization | 841 | | | 855 | | | 857 | |
| Impairment and restructuring charges, and acquisition-related costs | 226 | | | 85 | | | 290 | |
| Litigation and investigation costs | 70 | | | 116 | | | 44 | |
| Net gains on sales, consolidation and deconsolidation of facilities | (1) | | | (445) | | | (14) | |
| Operating income | 2,333 | | | 2,871 | | | 1,989 | |
| Interest expense | (890) | | | (923) | | | (1,003) | |
| Other non-operating income, net | 10 | | | 14 | | | 1 | |
| Loss from early extinguishment of debt | (109) | | | (74) | | | (316) | |
| Income from continuing operations, before income taxes | 1,344 | | | 1,888 | | | 671 | |
| Income tax benefit (expense) | (344) | | | (411) | | | 97 | |
| Income from continuing operations, before discontinued operations | 1,000 | | | 1,477 | | | 768 | |
| Discontinued operations: | | | | | |
| Income (loss) from operations | 1 | | | (1) | | | — | |
| | | | | |
| Income (loss) from discontinued operations | 1 | | | (1) | | | — | |
| Net income | 1,001 | | | 1,476 | | | 768 | |
| Less: Net income available to noncontrolling interests | 590 | | | 562 | | | 369 | |
| Net income available to Tenet Healthcare Corporation common shareholders | $ | 411 | | | $ | 914 | | | $ | 399 | |
| Amounts available to Tenet Healthcare Corporation common shareholders | | | | | |
| Income from continuing operations, net of tax | $ | 410 | | | $ | 915 | | | $ | 399 | |
| Income (loss) from discontinued operations, net of tax | 1 | | | (1) | | | — | |
| Net income available to Tenet Healthcare Corporation common shareholders | $ | 411 | | | $ | 914 | | | $ | 399 | |
| Earnings (loss) per share available (attributable) to Tenet Healthcare Corporation common shareholders: | | | | | |
| Basic | | | | | |
| Continuing operations | $ | 3.83 | | | $ | 8.56 | | | $ | 3.80 | |
| Discontinued operations | 0.01 | | | (0.01) | | | — | |
| | $ | 3.84 | | | $ | 8.55 | | | $ | 3.80 | |
| Diluted | | | | | |
| Continuing operations | $ | 3.78 | | | $ | 8.43 | | | $ | 3.75 | |
| Discontinued operations | 0.01 | | | (0.01) | | | — | |
| | $ | 3.79 | | | $ | 8.42 | | | $ | 3.75 | |
| Weighted average shares and dilutive securities outstanding (in thousands): | | | | | |
| Basic | 106,929 | | | 106,833 | | | 105,010 | |
| Diluted | 110,516 | | | 108,571 | | | 106,263 | |
| | | | | | | | | | | | | | |
| | | December 31, | | December 31, |
| | 2023 | | 2022 |
| ASSETS | | | | |
| Current assets: | | | | |
| Cash and cash equivalents | | $ | 1,228 | | | $ | 858 | |
| Accounts receivable | | 2,914 | | | 2,943 | |
| Inventories of supplies, at cost | | 411 | | | 405 | |
| | | | |
| Assets held for sale | | 775 | | | — | |
| Other current assets | | 1,839 | | | 1,775 | |
| Total current assets | | 7,167 | | | 5,981 | |
| Investments and other assets | | 3,157 | | | 3,147 | |
| Deferred income taxes | | 77 | | | 19 | |
Property and equipment, at cost, less accumulated depreciation and amortization ($6,478 at December 31, 2023 and $6,201 at December 31, 2022) | | 6,236 | | | 6,462 | |
| Goodwill | | 10,307 | | | 10,123 | |
Other intangible assets, at cost, less accumulated amortization ($1,447 at December 31, 2023 and $1,428 at December 31, 2022) | | 1,368 | | | 1,424 | |
| Total assets | | $ | 28,312 | | | $ | 27,156 | |
| LIABILITIES AND EQUITY | | | | |
| Current liabilities: | | | | |
| Current portion of long-term debt | | $ | 120 | | | $ | 145 | |
| Accounts payable | | 1,408 | | | 1,504 | |
| Accrued compensation and benefits | | 930 | | | 778 | |
| Professional and general liability reserves | | 254 | | | 255 | |
| Accrued interest payable | | 200 | | | 213 | |
| Liabilities held for sale | | 69 | | | — | |
| | | | |
| Other current liabilities | | 1,779 | | | 1,581 | |
| Total current liabilities | | 4,760 | | | 4,476 | |
| Long-term debt, net of current portion | | 14,882 | | | 14,934 | |
| Professional and general liability reserves | | 792 | | | 790 | |
| Defined benefit plan obligations | | 335 | | | 331 | |
| Deferred income taxes | | 326 | | | 217 | |
| | | | |
| Other long-term liabilities | | 1,709 | | | 1,800 | |
| Total liabilities | | 22,804 | | | 22,548 | |
| Commitments and contingencies | | | | |
| Redeemable noncontrolling interests in equity of consolidated subsidiaries | | 2,391 | | | 2,149 | |
| Equity: | | | | |
| Shareholders’ equity: | | | | |
Common stock, $0.05 par value; authorized 262,500 shares; 157,271 shares issued at December 31, 2023 and 156,462 shares issued at December 31, 2022 | | 8 | | | 8 | |
| Additional paid-in capital | | 4,834 | | | 4,778 | |
| Accumulated other comprehensive loss | | (181) | | | (181) | |
| Accumulated deficit | | (192) | | | (803) | |
Common stock in treasury, at cost, 57,321 shares at December 31, 2023 and 54,215 shares at December 31, 2022 | | (2,861) | | | (2,660) | |
| Total shareholders’ equity | | 1,608 | | | 1,142 | |
| Noncontrolling interests | | 1,509 | | | 1,317 | |
| Total equity | | 3,117 | | | 2,459 | |
| Total liabilities and equity | | $ | 28,312 | | | $ | 27,156 | |
See accompanying Notes to Consolidated Financial Statements.
CONSOLIDATED STATEMENTS OF OTHER COMPREHENSIVE INCOME (LOSS)OPERATIONS
Dollars in Millions, Except Per-Share Amounts
| | | | | | | | | | | | | | | | | |
| | Years Ended December 31, |
| | 2022 | | 2021 | | 2020 |
| Net income | $ | 1,001 | | | $ | 1,476 | | | $ | 768 | |
| Other comprehensive income (loss): | | | | | |
| Adjustments for defined benefit plans | 63 | | | 50 | | | (41) | |
| Amortization of net actuarial loss included in other non-operating income, net | 9 | | | 11 | | | 9 | |
| Unrealized gain (loss) on debt securities held as available-for-sale | (4) | | | — | | | 1 | |
| | | | | |
| Foreign currency translation adjustments and other | 1 | | | 1 | | | — | |
| Other comprehensive income (loss) before income taxes | 69 | | | 62 | | | (31) | |
| Income tax benefit (expense) related to items of other comprehensive income (loss) | (17) | | | (14) | | | 7 | |
| Total other comprehensive income (loss), net of tax | 52 | | | 48 | | | (24) | |
| Comprehensive net income | 1,053 | | | 1,524 | | | 744 | |
| Less: Comprehensive income to noncontrolling interests | 590 | | | 562 | | | 369 | |
| Comprehensive income available to Tenet Healthcare Corporation common shareholders | $ | 463 | | | $ | 962 | | | $ | 375 | |
| | | | | | | | | | | | | | | | | |
| | Years Ended December 31, |
| | 2023 | | 2022 | | 2021 |
| Net operating revenues | $ | 20,548 | | | $ | 19,174 | | | $ | 19,485 | |
| Grant income | 16 | | | 194 | | | 191 | |
| Equity in earnings of unconsolidated affiliates | 228 | | | 216 | | | 218 | |
| Operating expenses: | | | | | |
| Salaries, wages and benefits | 9,146 | | | 8,844 | | | 8,878 | |
| Supplies | 3,590 | | | 3,273 | | | 3,328 | |
| Other operating expenses, net | 4,515 | | | 3,998 | | | 4,206 | |
| Depreciation and amortization | 870 | | | 841 | | | 855 | |
| Impairment and restructuring charges, and acquisition-related costs | 137 | | | 226 | | | 85 | |
| Litigation and investigation costs | 47 | | | 70 | | | 116 | |
| Net gains on sales, consolidation and deconsolidation of facilities | (23) | | | (1) | | | (445) | |
| Operating income | 2,510 | | | 2,333 | | | 2,871 | |
| Interest expense | (901) | | | (890) | | | (923) | |
| Other non-operating income, net | 19 | | | 10 | | | 14 | |
| Loss from early extinguishment of debt | (11) | | | (109) | | | (74) | |
| Income from continuing operations, before income taxes | 1,617 | | | 1,344 | | | 1,888 | |
| Income tax expense | (306) | | | (344) | | | (411) | |
| Income from continuing operations, before discontinued operations | 1,311 | | | 1,000 | | | 1,477 | |
| Discontinued operations: | | | | | |
| Income (loss) from operations | — | | | 1 | | | (1) | |
| | | | | |
| Income (loss) from discontinued operations, net of tax | — | | | 1 | | | (1) | |
| Net income | 1,311 | | | 1,001 | | | 1,476 | |
| Less: Net income available to noncontrolling interests | 700 | | | 590 | | | 562 | |
| Net income available to Tenet Healthcare Corporation common shareholders | $ | 611 | | | $ | 411 | | | $ | 914 | |
| Amounts available to Tenet Healthcare Corporation common shareholders: | | | | | |
| Income from continuing operations, net of tax | $ | 611 | | | $ | 410 | | | $ | 915 | |
| Income (loss) from discontinued operations, net of tax | — | | | 1 | | | (1) | |
| Net income available to Tenet Healthcare Corporation common shareholders | $ | 611 | | | $ | 411 | | | $ | 914 | |
| Earnings (loss) per share available (attributable) to Tenet Healthcare Corporation common shareholders: | | | | | |
| Basic | | | | | |
| Continuing operations | $ | 6.01 | | | $ | 3.83 | | | $ | 8.56 | |
| Discontinued operations | — | | | 0.01 | | | (0.01) | |
| | $ | 6.01 | | | $ | 3.84 | | | $ | 8.55 | |
| Diluted | | | | | |
| Continuing operations | $ | 5.71 | | | $ | 3.78 | | | $ | 8.43 | |
| Discontinued operations | — | | | 0.01 | | | (0.01) | |
| | $ | 5.71 | | | $ | 3.79 | | | $ | 8.42 | |
| Weighted average shares and dilutive securities outstanding (in thousands): | | | | | |
| Basic | 101,639 | | | 106,929 | | | 106,833 | |
| Diluted | 104,800 | | | 110,516 | | | 108,571 | |
See accompanying Notes to Consolidated Financial Statements.
CONSOLIDATED STATEMENTS OF OTHER COMPREHENSIVE INCOME
Dollars in Millions
| | | | | | | | | | | | | | | | | |
| | Years Ended December 31, |
| | 2023 | | 2022 | | 2021 |
| Net income | $ | 1,311 | | | $ | 1,001 | | | $ | 1,476 | |
| Other comprehensive income: | | | | | |
| Adjustments for defined benefit plans | (9) | | | 63 | | | 50 | |
| Amortization of net actuarial loss included in other non-operating income, net | 7 | | | 9 | | | 11 | |
| Unrealized gain (loss) on debt securities held as available-for-sale | 2 | | | (4) | | | — | |
| | | | | |
| Foreign currency translation adjustments and other | — | | | 1 | | | 1 | |
| Other comprehensive income before income taxes | — | | | 69 | | | 62 | |
| Income tax expense related to items of other comprehensive income | — | | | (17) | | | (14) | |
| Total other comprehensive income, net of tax | — | | | 52 | | | 48 | |
| Comprehensive net income | 1,311 | | | 1,053 | | | 1,524 | |
| Less: Comprehensive income available to noncontrolling interests | 700 | | | 590 | | | 562 | |
| Comprehensive income available to Tenet Healthcare Corporation common shareholders | $ | 611 | | | $ | 463 | | | $ | 962 | |
See accompanying Notes to Consolidated Financial Statements.
CONSOLIDATED STATEMENTS OF CHANGES IN EQUITY
Dollars in Millions, Share Amounts in Thousands
| | | | | | | | | | | | | | | | | | | | | | | | | | | | | | | | | | | | | | | | | | | | | | | |
| | Tenet Healthcare Corporation Shareholders’ Equity | | | | |
| | Common Stock | | Additional
Paid-in
Capital | | Accumulated
Other
Comprehensive
Loss | | Accumulated
Deficit | | Treasury
Stock | | Noncontrolling
Interests | | Total Equity |
| | Shares
Outstanding | | Issued Par
Amount | | | | | | |
| Balances at December 31, 2019 | 104,197 | | | $ | 7 | | | $ | 4,760 | | | $ | (257) | | | $ | (2,513) | | | $ | (2,414) | | | $ | 854 | | | $ | 437 | |
| Net income | — | | | — | | | — | | | — | | | 399 | | | — | | | 183 | | | 582 | |
| Distributions paid to noncontrolling interests | — | | | — | | | — | | | — | | | — | | | — | | | (152) | | | (152) | |
| Other comprehensive loss | — | | | — | | | — | | | (24) | | | — | | | — | | | — | | | (24) | |
| Accretion of redeemable noncontrolling interests | — | | | — | | | (4) | | | — | | | — | | | — | | | — | | | (4) | |
| Purchases of businesses and noncontrolling interests, net | — | | | — | | | 27 | | | — | | | — | | | — | | | 24 | | | 51 | |
| Cumulative effect of accounting change | — | | | — | | | — | | | — | | | (14) | | | — | | | — | | | (14) | |
| Stock-based compensation expense, tax benefit and issuance of common stock | 1,873 | | | — | | | 61 | | | — | | | — | | | — | | | — | | | 61 | |
| Balances at December 31, 2020 | 106,070 | | | 7 | | | 4,844 | | | (281) | | | (2,128) | | | (2,414) | | | 909 | | | 937 | |
| Net income | — | | | — | | | — | | | — | | | 914 | | | — | | | 226 | | | 1,140 | |
| Distributions paid to noncontrolling interests | — | | | — | | | — | | | — | | | — | | | — | | | (206) | | | (206) | |
| Other comprehensive income | — | | | — | | | — | | | 48 | | | — | | | — | | | — | | | 48 | |
| Accretion of redeemable noncontrolling interests | — | | | — | | | (11) | | | — | | | — | | | — | | | — | | | (11) | |
| Purchases of businesses and noncontrolling interests, net | — | | | — | | | — | | | — | | | — | | | — | | | 97 | | | 97 | |
| | | | | | | | | | | | | | | |
| Stock-based compensation expense, tax benefit and issuance of common stock | 1,119 | | | 1 | | | 44 | | | — | | | — | | | 4 | | | — | | | 49 | |
| Balances at December 31, 2021 | 107,189 | | | 8 | | | 4,877 | | | (233) | | | (1,214) | | | (2,410) | | | 1,026 | | | 2,054 | |
| Net income | — | | | — | | | — | | | — | | | 411 | | | — | | | 242 | | | 653 | |
| Distributions paid to noncontrolling interests | — | | | — | | | — | | | — | | | — | | | — | | | (229) | | | (229) | |
| Other comprehensive income | — | | | — | | | — | | | 52 | | | — | | | — | | | — | | | 52 | |
| Accretion of redeemable noncontrolling interests | — | | | — | | | (104) | | | — | | | — | | | — | | | — | | | (104) | |
| Purchases (sales) of businesses and noncontrolling interests, net | — | | | — | | | (34) | | | — | | | — | | | — | | | 278 | | | 244 | |
| Repurchases of common stock | (5,889) | | | — | | | — | | | — | | | — | | | (250) | | | — | | | (250) | |
| Stock-based compensation expense, tax benefit and issuance of common stock | 947 | | | — | | | 39 | | | — | | | — | | | — | | | — | | | 39 | |
| Balances at December 31, 2022 | 102,247 | | | $ | 8 | | | $ | 4,778 | | | $ | (181) | | | $ | (803) | | | $ | (2,660) | | | $ | 1,317 | | | $ | 2,459 | |
See accompanying Notes to Consolidated Financial Statements.
CONSOLIDATED STATEMENTS OF CASH FLOWS
Dollars in Millions
| | | | | | | | | | | | | | | | | |
| | Years Ended December 31, |
| | 2022 | | 2021 | | 2020 |
| Net income | $ | 1,001 | | | $ | 1,476 | | | $ | 768 | |
| Adjustments to reconcile net income to net cash provided by operating activities: | | | | | |
| Depreciation and amortization | 841 | | | 855 | | | 857 | |
| Deferred income tax expense (benefit) | 209 | | | 250 | | | (128) | |
| Stock-based compensation expense | 56 | | | 56 | | | 44 | |
| Impairment and restructuring charges, and acquisition-related costs | 226 | | | 85 | | | 290 | |
| Litigation and investigation costs | 70 | | | 116 | | | 44 | |
| Net gains on sales, consolidation and deconsolidation of facilities | (1) | | | (445) | | | (14) | |
| Loss from early extinguishment of debt | 109 | | | 74 | | | 316 | |
| Equity in earnings of unconsolidated affiliates, net of distributions received | 2 | | | (10) | | | (37) | |
| Amortization of debt discount and debt issuance costs | 33 | | | 33 | | | 38 | |
| Pre-tax loss (income) from discontinued operations | (1) | | | 1 | | | — | |
| Net gains from the sale of investments and long-lived assets | (117) | | | (23) | | | (25) | |
| Other items, net | 13 | | | (10) | | | (4) | |
| Changes in cash from operating assets and liabilities: | | | | | |
| Accounts receivable | (140) | | | (197) | | | 195 | |
| Inventories and other current assets | (64) | | | (52) | | | (145) | |
| Income taxes | (26) | | | 68 | | | 19 | |
| Accounts payable, accrued expenses, contract liabilities and other current liabilities | (898) | | | (584) | | | 1,302 | |
| Other long-term liabilities | (15) | | | 28 | | | 221 | |
| Payments for restructuring charges, acquisition-related costs, and litigation costs and settlements | (214) | | | (153) | | | (333) | |
| Net cash used in operating activities from discontinued operations, excluding income taxes | (1) | | | — | | | (1) | |
| Net cash provided by operating activities | 1,083 | | | 1,568 | | | 3,407 | |
| Cash flows from investing activities: | | | | | |
| Purchases of property and equipment | (762) | | | (658) | | | (540) | |
| Purchases of businesses or joint venture interests, net of cash acquired | (234) | | | (1,220) | | | (1,177) | |
| Proceeds from sales of facilities and other assets | 210 | | | 1,248 | | | 77 | |
| | | | | |
| Proceeds from sales of marketable securities, long-term investments and other assets | 76 | | | 31 | | | 59 | |
| Purchases of marketable securities and equity investments | (92) | | | (108) | | | (44) | |
| Other items, net | (6) | | | (7) | | | 17 | |
| Net cash used in investing activities | (808) | | | (714) | | | (1,608) | |
| Cash flows from financing activities: | | | | | |
| Repayments of borrowings under credit facility | — | | | — | | | (740) | |
| Proceeds from borrowings under credit facility | — | | | — | | | 740 | |
| Repayments of other borrowings | (2,851) | | | (3,221) | | | (3,293) | |
| Proceeds from other borrowings | 2,023 | | | 2,872 | | | 3,818 | |
| Repurchases of common stock | (250) | | | — | | | — | |
| Debt issuance costs | (24) | | | (31) | | | (48) | |
| Distributions paid to noncontrolling interests | (560) | | | (423) | | | (287) | |
| Proceeds from sale of noncontrolling interests | 27 | | | 25 | | | 14 | |
| Purchases of noncontrolling interests | (100) | | | (27) | | | (39) | |
| | | | | |
| Medicare advances and grants received by unconsolidated affiliates, net of recoupment | — | | | (67) | | | 187 | |
| Other items, net | (46) | | | (64) | | | 33 | |
| Net cash provided by (used in) financing activities | (1,781) | | | (936) | | | 385 | |
| Net increase (decrease) in cash and cash equivalents | (1,506) | | | (82) | | | 2,184 | |
| Cash and cash equivalents at beginning of period | 2,364 | | | 2,446 | | | 262 | |
| Cash and cash equivalents at end of period | $ | 858 | | | $ | 2,364 | | | $ | 2,446 | |
| Supplemental disclosures: | | | | | |
| Interest paid, net of capitalized interest | $ | (848) | | | $ | (937) | | | $ | (962) | |
| Income tax payments, net | $ | (161) | | | $ | (92) | | | $ | (12) | |
| | | | | | | | | | | | | | | | | | | | | | | | | | | | | | | | | | | | | | | | | | | | | | | |
| | Tenet Healthcare Corporation Shareholders’ Equity | | | | |
| | Common Stock | | Additional
Paid-in
Capital | | Accumulated
Other
Comprehensive
Loss | | Accumulated
Deficit | | Treasury
Stock | | Noncontrolling
Interests | | Total Equity |
| | Shares
Outstanding | | Issued Par
Amount | | | | | | |
| Balances at December 31, 2020 | 106,070 | | | $ | 7 | | | $ | 4,844 | | | $ | (281) | | | $ | (2,128) | | | $ | (2,414) | | | $ | 909 | | | $ | 937 | |
| Net income | — | | | — | | | — | | | — | | | 914 | | | — | | | 226 | | | 1,140 | |
| Distributions paid to noncontrolling interests | — | | | — | | | — | | | — | | | — | | | — | | | (206) | | | (206) | |
| Other comprehensive income | — | | | — | | | — | | | 48 | | | — | | | — | | | — | | | 48 | |
| Accretion of redeemable noncontrolling interests | — | | | — | | | (11) | | | — | | | — | | | — | | | — | | | (11) | |
| Purchases of businesses and noncontrolling interests, net | — | | | — | | | — | | | — | | | — | | | — | | | 97 | | | 97 | |
| | | | | | | | | | | | | | | |
| Stock-based compensation expense, tax benefit and issuance of common stock | 1,119 | | | 1 | | | 44 | | | — | | | — | | | 4 | | | — | | | 49 | |
| Balances at December 31, 2021 | 107,189 | | | 8 | | | 4,877 | | | (233) | | | (1,214) | | | (2,410) | | | 1,026 | | | 2,054 | |
| Net income | — | | | — | | | — | | | — | | | 411 | | | — | | | 242 | | | 653 | |
| Distributions paid to noncontrolling interests | — | | | — | | | — | | | — | | | — | | | — | | | (229) | | | (229) | |
| Other comprehensive income | — | | | — | | | — | | | 52 | | | — | | | — | | | — | | | 52 | |
| Accretion of redeemable noncontrolling interests | — | | | — | | | (104) | | | — | | | — | | | — | | | — | | | (104) | |
| Purchases (sales) of businesses and noncontrolling interests, net | — | | | — | | | (34) | | | — | | | — | | | — | | | 278 | | | 244 | |
| Repurchases of common stock | (5,889) | | | — | | | — | | | — | | | — | | | (250) | | | — | | | (250) | |
| | | | | | | | | | | | | | | |
| Stock-based compensation expense, tax benefit and issuance of common stock | 947 | | | — | | | 39 | | | — | | | — | | | — | | | — | | | 39 | |
| Balances at December 31, 2022 | 102,247 | | | 8 | | | 4,778 | | | (181) | | | (803) | | | (2,660) | | | 1,317 | | | 2,459 | |
| Net income | — | | | — | | | — | | | — | | | 611 | | | — | | | 334 | | | 945 | |
| Distributions paid to noncontrolling interests | — | | | — | | | — | | | — | | | — | | | — | | | (289) | | | (289) | |
| | | | | | | | | | | | | | | |
| | | | | | | | | | | | | | | |
| Purchases of businesses and noncontrolling interests, net | — | | | — | | | 5 | | | — | | | — | | | — | | | 147 | | | 152 | |
| Repurchases of common stock | (3,112) | | | — | | | — | | | — | | | — | | | (201) | | | — | | | (201) | |
| Stock-based compensation expense, tax benefit and issuance of common stock | 815 | | | — | | | 51 | | | — | | | — | | | — | | | — | | | 51 | |
| Balances at December 31, 2023 | 99,950 | | | $ | 8 | | | $ | 4,834 | | | $ | (181) | | | $ | (192) | | | $ | (2,861) | | | $ | 1,509 | | | $ | 3,117 | |
See accompanying Notes to Consolidated Financial Statements.
CONSOLIDATED STATEMENTS OF CASH FLOWS
Dollars in Millions
| | | | | | | | | | | | | | | | | |
| | Years Ended December 31, |
| | 2023 | | 2022 | | 2021 |
| Net income | $ | 1,311 | | | $ | 1,001 | | | $ | 1,476 | |
| Adjustments to reconcile net income to net cash provided by operating activities: | | | | | |
| Depreciation and amortization | 870 | | | 841 | | | 855 | |
| Deferred income tax expense | 52 | | | 209 | | | 250 | |
| Stock-based compensation expense | 66 | | | 56 | | | 56 | |
| Impairment and restructuring charges, and acquisition-related costs | 137 | | | 226 | | | 85 | |
| Litigation and investigation costs | 47 | | | 70 | | | 116 | |
| Net gains on sales, consolidation and deconsolidation of facilities | (23) | | | (1) | | | (445) | |
| Loss from early extinguishment of debt | 11 | | | 109 | | | 74 | |
| Equity in earnings of unconsolidated affiliates, net of distributions received | (13) | | | 2 | | | (10) | |
| Amortization of debt discount and debt issuance costs | 32 | | | 33 | | | 33 | |
| Pre-tax loss (income) from discontinued operations | — | | | (1) | | | 1 | |
| Net gains from the sale of investments and long-lived assets | (29) | | | (117) | | | (23) | |
| Other items, net | (4) | | | 13 | | | (10) | |
| Changes in cash from operating assets and liabilities: | | | | | |
| Accounts receivable | (29) | | | (140) | | | (197) | |
| Inventories and other current assets | (139) | | | (64) | | | (52) | |
| Income taxes | 10 | | | (26) | | | 68 | |
| Accounts payable, accrued expenses, contract liabilities and other current liabilities | 215 | | | (898) | | | (584) | |
| Other long-term liabilities | 14 | | | (15) | | | 28 | |
| Payments for restructuring charges, acquisition-related costs, and litigation costs and settlements | (154) | | | (214) | | | (153) | |
| Net cash used in operating activities from discontinued operations, excluding income taxes | — | | | (1) | | | — | |
| Net cash provided by operating activities | 2,374 | | | 1,083 | | | 1,568 | |
| Cash flows from investing activities: | | | | | |
| Purchases of property and equipment | (751) | | | (762) | | | (658) | |
| Purchases of businesses or joint venture interests, net of cash acquired | (224) | | | (234) | | | (1,220) | |
| Proceeds from sales of facilities and other assets | 71 | | | 210 | | | 1,248 | |
| | | | | |
| Proceeds from sales of marketable securities and long-term investments | 50 | | | 76 | | | 31 | |
| Purchases of marketable securities and equity investments | (104) | | | (92) | | | (108) | |
| Other items, net | (11) | | | (6) | | | (7) | |
| Net cash used in investing activities | (969) | | | (808) | | | (714) | |
| Cash flows from financing activities: | | | | | |
| | | | | |
| | | | | |
| Repayments of borrowings | (1,542) | | | (2,851) | | | (3,221) | |
| Proceeds from borrowings | 1,370 | | | 2,023 | | | 2,872 | |
| Repurchases of common stock | (200) | | | (250) | | | — | |
| Debt issuance costs | (16) | | | (24) | | | (31) | |
| Distributions paid to noncontrolling interests | (594) | | | (560) | | | (423) | |
| Proceeds from the sale of noncontrolling interests | 43 | | | 27 | | | 25 | |
| Purchases of noncontrolling interests | (167) | | | (100) | | | (27) | |
| | | | | |
| Medicare advances and grants received by unconsolidated affiliates, net of recoupment | — | | | — | | | (67) | |
| Other items, net | 71 | | | (46) | | | (64) | |
| Net cash used in financing activities | (1,035) | | | (1,781) | | | (936) | |
| Net increase (decrease) in cash and cash equivalents | 370 | | | (1,506) | | | (82) | |
| Cash and cash equivalents at beginning of period | 858 | | | 2,364 | | | 2,446 | |
| Cash and cash equivalents at end of period | $ | 1,228 | | | $ | 858 | | | $ | 2,364 | |
| Supplemental disclosures: | | | | | |
| Interest paid, net of capitalized interest | $ | (882) | | | $ | (848) | | | $ | (937) | |
| Income tax payments, net | $ | (243) | | | $ | (161) | | | $ | (92) | |
See accompanying Notes to Consolidated Financial Statements.
NOTES TO CONSOLIDATED FINANCIAL STATEMENTS
NOTE 1. SIGNIFICANT ACCOUNTING POLICIES
Description of Business
Tenet Healthcare Corporation (together with our subsidiaries, referred to herein as “Tenet,” “we” or “us”) is a diversified healthcare services company headquartered in Dallas, Texas. At December 31, 2022, our business was organized into three separate reporting segments: Hospital Operations and other, Ambulatory Care and Conifer. During the three months ended December 31, 2023, we combined our Hospital Operations and other and Conifer segments into a single reporting segment named Hospital Operations and Services (“Hospital Operations”). The results of the revenue cycle management and value-based care services we provide to hospitals, health systems, physician practices, employers and other clients previously reported under our Conifer segment are now combined with our Hospital Operations segment. See below for additional discussion of this change.
Our expansive, nationwide care delivery network includesnow consists of our Hospital Operations and Ambulatory Care segments. As of December 31, 2023, our Hospital Operations segment was comprised of our 61 acute care and specialty hospitals, a network of employed physicians and 164 outpatient facilities, including imaging centers, urgent care centers (each, a “UCC”), ancillary emergency facilities and micro‑hospitals. Our Ambulatory Care segment is comprised of the operations of our subsidiary USPI Holding Company, Inc. (“USPI”), which hadheld indirect ownership interests in 442461 ambulatory surgery centers and 24 surgical hospitals at December 31, 2022. We hold2023. USPI held noncontrolling interests in 158155 of these facilities, which are recorded using the equity method of accounting. We also operated 61 acute care and specialty hospitals, 109 other outpatient facilities, a network of employed physicians and a Global Business Center (“GBC”) in Manila, Philippines at December 31, 2022. In addition, we operate Conifer Health Solutions, LLC, in which we own an interest of approximately 76%, through our Conifer Holdings, Inc. subsidiary (“Conifer”).
Effective June 30, 2022, we purchased all of the shares previously held byin USPI that Baylor University Medical Center (“Baylor”) in USPIheld on that date for $406 million, which increased our ownership interest in USPI’s voting shares from 95% to 100%. See (see Note 1813 for additional information about this transaction.transaction). In addition, we operate a Global Business Center (“GBC”) in Manila, Philippines.
Our business consists of our Hospital Operations and other (“Hospital Operations”) segment, our Ambulatory Care segment and our Conifer segment. Our Hospital Operations segment is comprised of our acute care and specialty hospitals, imaging centers, ancillary outpatient facilities, micro‑hospitals and physician practices. Our Ambulatory Care segment is comprised of the operations of USPI, which holds indirect ownership interests in and manages ambulatory surgery centers and surgical hospitals. Our Conifer segment provides revenue cycle management and value‑based care services to hospitals, health systems, physician practices, employers and other clients.
Basis of Presentation
Our Consolidated Financial Statements include the accounts of Tenet and its wholly owned and majority‑owned subsidiaries. We eliminate intercompany accounts and transactions in consolidation, and we include the results of operations of businesses that are newly acquired in purchase transactions from their dates of acquisition. We account for significant investments in other affiliated companies using the equity method. We also utilize the equity method when we have the ability to exercise significant influence over the affiliated company, despite not holding a significant percentage of its ownership interest. Unless otherwise indicated, all financial and statistical data included in these notes to our Consolidated Financial Statements relate to our continuing operations, with dollar amounts expressed in millions (except per‑share amounts). and share amounts expressed in thousands.
We adopted the Financial Accounting Standards Board’s (“FASB”) Accounting Standards Update (“ASU”) 2020-06, “Accounting for Convertible Instruments and Contracts in an Entity’s Own Equity” (“ASU 2020-06”), effective as of January 1, 2022 using the modified retrospective method. Among other amendments, ASU 2020-06 changed the accounting for diluted earnings‑per‑share for convertible instruments and contracts that may be settled in cash or stock. ASU 2020-06 eliminated an entity’s ability to rebut the presumption of share settlement for convertible instruments and contracts that can be partially or fully settled in cash at the issuer’s election. Additionally, ASU 2020-06 requires that the if‑converted method, which is more dilutive than the treasury stock method, be used for all convertible instruments. As a result of our adoption of ASU 2020-06, diluted weighted average shares outstanding increased by approximately three million2,364 thousand shares and 2,673 thousand shares for the years ended December 31, 2023 and 2022, respectively, and diluted earnings per share available to Tenet common shareholders decreased by $0.26 and $0.01, respectively, for these same periods.
Changes to prior-year presentation—At December 31, 2022, our business was organized into three separate reporting segments: Hospital Operations and other, Ambulatory Care and Conifer. During the yearthree months ended December 31, 2022.
Effective January 1, 2020,2023, we adopted ASU 2016‑13, “Financial Instruments—Credit Losses (Topic 326) Measurementcombined our Hospital Operations and other and Conifer segments into a single reporting segment named Hospital Operations and Services (Hospital Operations). This change was made to reflect recent updates to the organizational and management structure of Credit Losses on Financial Instruments” (“ASU 2016‑13”), using the modified retrospective transition approach as of the our Conifer and Hospital Operations and other segments. All prior‑period of adoption. The amendmentsdata presented in this ASU required a financial asset (or a group of financial assets) measured at amortized cost basis to be presented at the net amount expected to be collected. The allowance for credit losses is a valuation account that is deducted from the amortized cost basis of the financial asset(s) to present the net carrying value at the amount expected to be collected on the financial asset. Upon adoption of ASU 2016‑13 on January 1, 2020, we recorded a cumulative effect adjustment to increase accumulated deficit by $14 million.
Certain prior-year amounts havereport has been reclassifiedadjusted to conform to our new reporting segment structure.
As of December 31, 2023, our business was organized into two reporting segments:
•our Hospital Operations segment, which includes (1) our acute care and specialty hospitals, physician practices, imaging centers, UCCs, ancillary emergency facilities and micro‑hospitals, and (2) the current‑year presentation. Duerevenue cycle management and value‑based care services we provide to their increased significance, net gains from the sale of investmentshospitals, health systems, physician practices, employers and long-lived assets are presented separately in the operating activities section of the accompanying Consolidated Statements of Cash Flows. In prior periods, this activity was included in other items, net within the operating activities section.clients through our Conifer Health Solutions, LLC joint venture; and
•our Ambulatory Care segment, which is comprised of the ambulatory surgery center and surgical hospital operations of our subsidiary USPI Holding Company, Inc.
In addition, contract liabilities and contract liabilities – long-term are no longer significant enough to present separately. These obligations are now included in other current liabilities and other long-term liabilities, respectively, in the accompanying Consolidated Balance Sheets.
Use of Estimates
The preparation of financial statements in conformity with accounting principles generally accepted in the United States of America (“GAAP”) requires us to make estimates and assumptions that affect the amounts reported in our Consolidated Financial Statements and these accompanying notes. We regularly evaluate the accounting policies and estimates we use. In general, we base the estimates on historical experience and on assumptions that we believe to be reasonable given the particular circumstances in which we operate. Although we believe all adjustments considered necessary for a fair presentation have been included, actual results may vary from those estimates. The financial and statistical information we report to other regulatory agencies may be prepared on a basis other than GAAP or using different assumptions or reporting periods and, therefore, may vary from the amounts presented herein. Although we make every effort to ensure that the information we report to those agencies is accurate, complete and consistent with applicable reporting guidelines, we cannot be responsible for the accuracy of the information they make available to the public.
COVID-19 Pandemic
TheDuring the COVID‑19 pandemic, has impacted all three segments of our business, as well as our patients, communities and employees, to varying degrees since March 2020. Throughout this time, federal, state and local authorities have undertakenundertook several actions designed to assist healthcare providers in providingdelivering care to COVID‑19 and other patients and to mitigate the adverse economic impact of the pandemic. Among other things, federal legislation (collectively, the “COVID Acts”) authorized aggregate grant payments of $178 billion to be distributed through the Public Health and Social Services Emergency Fund (“PRF”) to healthcare providers who experienced lost revenues and increased expenses as a result of the COVID‑19 pandemic. The COVID Acts also revised the Medicare accelerated payment program (“MAPP”) and permitted employers to defer payroll Social Security tax payments in 2020. Our participation in these programs and the related accounting policies are summarized below. The Secretary of the U.S. Department of Health and Human Services (“HHS”) ended the COVID‑19 Public Health Emergency in May 2023.
Grant Income—As detailed in the table below, we received cash payments from the PRF and state and local grant programs during the years ended December 31, 2023, 2022 2021 and 2020.2021. Grant funds received by our Hospital Operations segment and those facilities in our Ambulatory Care segment that we consolidate are included in cash flows from operating activities in our consolidated statements of cash flows. Grant funds received by unconsolidated affiliates for which we provide cash management services (“Cash‑Managed Affiliates”) are included in cash flows from financing activities.
| | Years Ended December 31, |
| 2022 | | 2021 | | 2020 |
| | Years Ended December 31, | | | | Years Ended December 31, |
| | 2023 | | | | 2023 | | 2022 | | 2021 |
| Grant funds received from COVID-19 relief programs: | Grant funds received from COVID-19 relief programs: | | | | | | |
| Included in cash flows from operating activities: | Included in cash flows from operating activities: | |
| Included in cash flows from operating activities: | |
| Included in cash flows from operating activities: | |
| Hospital Operations | |
| Hospital Operations | |
| Hospital Operations | Hospital Operations | | $ | 193 | | | $ | 142 | | | $ | 824 | |
| Ambulatory Care | Ambulatory Care | | 3 | | | 36 | | | 76 | |
| $ | 196 | | | $ | 178 | | | $ | 900 | |
| | $ | |
| | Included in cash flows from financing activities: | Included in cash flows from financing activities: | |
| Included in cash flows from financing activities: | |
| Included in cash flows from financing activities: | |
| Cash‑Managed Affiliates | |
| Cash‑Managed Affiliates | |
| Cash‑Managed Affiliates | Cash‑Managed Affiliates | | $ | — | | | $ | 37 | | | $ | 74 | |
|
To receive distributions, providers must agreeagreed to certain terms and conditions, including, among other things, that the funds would be used for lost revenues and unreimbursed pandemic‑pandemic‑related costs as defined by the U.S. Department of Health and Human Services (“HHS”),HHS, and that the providers willwould not seek collection of out‑of‑out‑of‑pocket payments from a COVID‑COVID‑19 patient that are greater than what the patient would have otherwise been required to pay if the care had been provideddelivered by an in‑in‑network provider. All recipients of PRF payments are required to comply with the reporting requirements described in the terms and conditions and as determined by the Secretary of HHS. PRF funds not utilized by the established deadlines, generally 12 to 18 months after receipt, will be recouped by HHS.
We recognize grant payments as income when there is reasonable assurance that we have complied with the conditions associated with the grant. The estimates we use to recognize grant income could change materially in the future based on our operating performance or fluctuations in the severity of COVID‑19 outbreaks at individual locations, as well as the government’s grant compliance guidance.
The table below summarizes grant income recognized by our Hospital Operations and Ambulatory Care segments, which is presented in grant income, and grant income recognized through our unconsolidated affiliates, which is presented in equity in earnings of unconsolidatedunconsolidated affiliates, in each case in our consolidated statements of operations.
| | | | | | | | | | | | | | | | | | | | |
| | Years Ended December 31, |
| | 2022 | | 2021 | | 2020 |
| | | | | | |
| | | | | | |
| | | | | | |
| | | | | | |
| | | | | | |
| | | | | | |
| | | | | | |
| | | | | | |
| | | | | | |
| Grant income recognized from COVID-19 relief programs: | | | | | | |
| Included in grant income: | | | | | | |
| Hospital Operations | | $ | 190 | | | $ | 142 | | | $ | 823 | |
| Ambulatory Care | | 4 | | | 49 | | | 59 | |
| | $ | 194 | | | $ | 191 | | | $ | 882 | |
| | | | | | |
| Included in equity in earnings of unconsolidated affiliates: | | | | | | |
| Unconsolidated affiliates | | $ | — | | | $ | 14 | | | $ | 17 | |
At | | | | | | | | | | | | | | | | | | | | |
| | Years Ended December 31, |
| | 2023 | | 2022 | | 2021 |
| | | | | | |
| | | | | | |
| | | | | | |
| | | | | | |
| | | | | | |
| | | | | | |
| | | | | | |
| | | | | | |
| | | | | | |
| Grant income recognized from COVID-19 relief programs: | | | | | | |
| Included in grant income: | | | | | | |
| Hospital Operations | | $ | 15 | | | $ | 190 | | | $ | 142 | |
| Ambulatory Care | | 1 | | | 4 | | | 49 | |
| | $ | 16 | | | $ | 194 | | | $ | 191 | |
| | | | | | |
| Included in equity in earnings of unconsolidated affiliates: | | | | | | |
| Unconsolidated affiliates | | $ | — | | | $ | — | | | $ | 14 | |
We had no deferred grant payments remaining at December 31, 2023, and we had $7 million of deferred grant payments at December 31, 2022, and 2021, we had remaining deferred grant payment balances of $7 million and $5 million, respectively, which amounts wereamount was recorded in other current liabilities in the accompanying Consolidated Balance Sheets for those periods.Sheet.
Medicare Accelerated Payment Program (MAPP)—In certain circumstances, when a healthcare facility is experiencing financial difficulty due to delays in receiving payment for the Medicare services it provided, it may be eligible for an accelerated or advance payment pursuant to the MAPP. The COVID Acts revised the MAPP to disburse payments to healthcare providers more quickly and to allow recipients to retain the advance payments for one year from the date of receipt before recoupment commenced through offsets of Medicare claims payments. Recipients were also permitted to repay the advance payments at any time. Our Hospital Operations and Ambulatory Care segments both received advance payments from the MAPP following its expansion under the COVID Acts in the year ended December 31, 2020; however, no additional advances were received duringin the years ended December 31, 2022 and 2021.subsequent years.
The table below summarizes MAPP advances received in prior periods that were repaid or recouped during the years ended December 31, 2022 and 2021. No advances were repaid or recouped during the year ended December 31, 2020.2023. Advances to our Hospital Operations segment and those facilities in our Ambulatory Care segment that we consolidate were recouped through a reduction of their respective Medicare claims payments and, together with any repayments, are presented in cash flows from operating activities in our consolidated statements of cash flows. Advance payments to our Cash‑Managed Affiliates were recouped through a reduction of those affiliates’ Medicare claims payments and, together with any repayments, are presented in cash flows from financing activities.
| | | | | | | | | | | | | |
| | | Years Ended December 31, |
| | | 2022 | | 2021 |
| MAPP advances repaid or recouped: | | | | | |
| Included in cash flows from operating activities: | | | | | |
| Hospital Operations | | | $ | 876 | | | $ | 457 | |
| Ambulatory Care | | | 4 | | | 55 | |
| | | $ | 880 | | | $ | 512 | |
| | | | | |
| Included in cash flows from financing activities: | | | | | |
| Cash‑Managed Affiliates | | | $ | — | | | $ | 104 | |
DuringAll remaining MAPP advances we previously received were fully repaid or recouped during the year ended December 31, 2022, all of the remaining MAPP advances we received were fully repaid or recouped, which resulted in no outstanding liability at December 31, 2023 and 2022. In the accompanying Consolidated Balance Sheets, advances totaling $880 million were included in contract liabilities at December 31, 2021.
Deferral of Employment Tax Payments—The COVID Acts permitted employers to defer payment of the 6.2% employer Social Security tax beginning March 27, 2020 through December 31, 2020. Deferred tax amounts were required to be paid in equal amounts over two years beginning in December 2021. We made a payment of $128 million in December 2021 and remitted the second and final paymentemployer’s Social Security tax payments deferred during 2020 in payments of $128 million in December 2022 which resulted in no outstanding liability at December 31, 2022. At December 31, 2021, deferred Social Security tax payments totaling $128 million were included in accrued compensation and benefits in the accompanying Consolidated Balance Sheets.2021.
Translation of Foreign Currencies
We formed ourOur GBC, which is located in the Philippines, during the year ended December 31, 2019.performs certain administrative functions and other support tasks. The GBC’s accounts are measured in its local currency (the Philippine peso) and then translated into U.S. dollars. All assets and liabilities denominated in foreign currency are translated using the current rate of exchange at the balance sheet date. Results of operations denominated in foreign currency are translated using the average rates prevailing throughout the period of operations. Translation gains or losses resulting from changes in exchange rates are accumulated in shareholders’ equity.
Net Operating Revenues
We recognize net operating revenues in the period in which we satisfy our performance obligations under contracts by transferring services to our customers. Net operating revenues are recognized in the amounts we expect to be entitled to, which are the transaction prices allocated for the distinct services. Net operating revenues for our Hospital Operations and Ambulatory Care segments primarily consist of net patient service revenues, principally for patients covered by Medicare, Medicaid, managed care and other health plans, as well as certain uninsured patients under our Compact with Uninsured Patients (“Compact”) and other uninsured discount and charity programs. Net operating revenues for our Conifer segment primarily consist of revenues from providing revenue cycle management services to health systems, individual hospitals and physician practices.
Net Patient Service Revenues—Revenues
We report net patient service revenues at the amounts that reflect the consideration we expect to be entitled to in exchange for providing patient care. These amounts are due from patients, third‑party payers (including managed care payers and government programs) and others, and they include variable consideration for retroactive revenue adjustments due to settlement of audits, reviews and investigations. Generally, we bill our patients and third‑party payers several days after the services are performed or shortly after discharge. Revenues are recognized as performance obligations are satisfied.
We determine performance obligations based on the nature of the services we provide. We recognize revenues for performance obligations satisfied over time based on actual charges incurred in relation to total expected charges. We believe that this method provides a faithful depiction of the transfer of services over the term of performance obligations based on the inputs needed to satisfy the obligations. Generally, performance obligations satisfied over time relate to patients in our hospitals receiving inpatient acute care services. We measure performance obligations from admission to the point when there are no further services required for the patient, which is generally the time of discharge. We recognize revenues for performance obligations satisfied at a point in time, which generally relate to patients receiving outpatient services, when (1) services are provided, and (2) we do not believe the patient requires additional services.
Because our patient service performance obligations relate to contracts with a duration of less than one year, we have elected to apply the optional exemption provided in FASB Accounting Standards Codification (“ASC”) 606‑10‑50‑14(a) and, therefore, we are not required to disclose the aggregate amount of the transaction price allocated to performance obligations that are unsatisfied or partially unsatisfied at the end of the reporting period. The unsatisfied or partially unsatisfied performance obligations referred to above are primarily related to inpatient acute care services at the end of the reporting period. The performance obligations for these contracts are generally completed when the patients are discharged, which generally occurs within days or weeks of the end of the reporting period.
We determine the transaction price based on gross charges for services provided, reduced by contractual adjustments recognized for third‑party payers, discounts provided to uninsured patients in accordance with our Compact, and estimated implicit price concessions related primarily to uninsured patients. We determine our estimates of contractual adjustments and discounts based on contractual agreements, our discount policies and historical experience. We determine our estimate of implicit price concessions based on our historical collection experience with these classes of patients using a portfolio approach as a practical expedient to account for patient contracts as collective groups rather than individually. The financial statement effects of using this practical expedient are not materially different from an individual contract approach.
Gross charges are retail charges. They are not the same as actual pricing, and they generally do not reflect what a hospital is ultimately paid and, therefore, are not displayed in our consolidated statements of operations. Hospitals are typically paid amounts that are negotiated with insurance companies or are set by the government. Gross charges are used to calculate Medicare outlier payments and to determine certain elements of payment under managed care contracts (such as stop‑loss payments). Because Medicare requires that a hospital’s gross charges be the same for all patients (regardless of payer category), gross charges are what hospitals charge all patients prior to the application of discounts and allowances.
Revenues under the traditionalcertain fee‑for‑service (“FFS”) Medicare and Medicaid programs are based primarily on prospective payment systems. Retrospectively determined cost‑based revenues under these programs, which were more prevalent in earlier periods, and certain otherprogram payments to our hospitals, such as Indirect Medical Education, Direct Graduate Medical Education, disproportionate share hospital and bad debt expense reimbursement, which are retrospectively determined based on our hospitals’ cost reports, are estimated using historical trendsreports. The final determination of these payments often takes many years to resolve because of audits by the program representatives, providers’ rights of appeal, and current factors. Cost report settlements under these programs are subject to audit by Medicare and Medicaid auditors and administrative and judicial review, and it can take several years until final settlementthe application of such matters is determined and completely resolved. Because the laws, regulations, instructions and rule interpretations governing Medicare and Medicaidnumerous technical reimbursement are complex and change frequently, the estimates we record could change by material amounts.
provisions. We have a system and estimation process for recording Medicare net patient service revenue and estimated cost report settlements. As a result, wetherefore record accruals to reflect the expected final settlements on our cost reports. For filed cost reports, we recordadjust the accrual for estimated cost report settlements based on those cost reports and subsequent activity, and recordwe consider the necessity of recording a valuation allowance against those cost reports based on historical settlement trends.results. The accrual for estimated cost report settlements for periods for which a cost report is yet to be filed is recorded based on estimates of what we expect to report on the filed cost reports, and a corresponding valuation allowance is recorded, asif necessary, based on the method previously described. Cost reports must generally must be filed
within five months after the end of the annual cost report reporting period. After the cost report is filed, the accrual and corresponding valuation allowance may need to be adjusted.
Settlements with third‑party payers for retroactive revenue adjustments due to audits, reviews or investigations are considered variable consideration and are included in the determination of the estimated transaction price for providing patient care using the most likely outcome method. These settlements are estimated based on the terms of the payment agreement with the payer, correspondence from the payer and our historical settlement activity, including an assessment to ensure that it is probable that a significant reversal in the amount of cumulative revenue recognized will not occur when the uncertainty associated with the retroactive adjustment is subsequently resolved. Estimated settlements are adjusted in future periods as adjustments become known (that is, new information becomes available), or as years are settled or are no longer subject to such audits, reviews and investigations. Because the laws, regulations, instructions and rule interpretations governing Medicare and Medicaid reimbursement are complex and change frequently, the estimates we record could change by material amounts.
Private Insurance—Revenues under managed care plans are based primarily on payment terms involving predetermined rates per diagnosis, per‑diem rates, discounted FFS rates and/or other similar contractual arrangements. These revenues are also subject to review and possible audit by the payers, which can take several years before they are completely resolved. The payers are billed for patient services on an individual patient basis. An individual patient’s bill is subject to adjustment on a patient‑by‑patient basis in the ordinary course of business by the payers following their review and adjudication of each particular bill. We estimate the discounts for contractual allowances at the individual hospital level utilizing billing data on an individual patient basis. At the end of each month, on an individual hospital basis, we estimate our expected reimbursement for patients of managed care plans based on the applicable contract terms. Contractual allowance estimates are periodically reviewed for accuracy by taking into consideration known contract terms, as well as payment history. We believe our estimation and review process enables us to identify instances on a timely basis where such estimates need to be revised. We do not believe there were any adjustments to estimates of patient bills that were material to our revenues during the years ended December 31, 2023, 2022 2021 or 2020.2021. In addition, on a corporate‑wide basis, we do not record any general provision for adjustments to estimated contractual allowances for managed care plans. Managed care accounts, net of contractual allowances recorded, are further reduced to their net realizable value through implicit price concessions based on historical collection trends for these payers and other factors that affect the estimation process.
We know of no claims, disputes or unsettled matters with any payer that would materially affect our revenues for which we have not adequately provided in the accompanying Consolidated Financial Statements.
Uninsured Patients—Generally, patients who are covered by third‑party payers are responsible for related co‑pays, co‑insurance and deductibles, which vary in amount. We also provide services to uninsured patients and offer uninsured patients a discount from standard charges. We estimate the transaction price for patients with co‑pays, co‑insurance and deductibles and for those who are uninsured based on historical collection experience and current market conditions. Under our Compact and other uninsured discount programs, the discount offered to certain uninsured patients is recognized as a contractual allowance, which reduces net operating revenues at the time the self‑pay accounts are recorded. The uninsured patient accounts, net of contractual allowances recorded, are further reduced to their net realizable value at the time they are recorded through implicit price concessions based on historical collection trends for self‑pay accounts and other factors that affect the estimation process. There are various factors that can impact collection trends, such as: changes in the economy, which in turn have an impact on unemployment rates and the number of uninsured and underinsured patients; the volume of patients through our emergency departments; the increased burden of co‑pays, co‑insurance amounts and deductibles to be made by patients with insurance; and business practices related to collection efforts. These factors continuously change and can have an impact on collection trends
and our estimation process. Subsequent changes to the estimate of the transaction price are generally recorded as adjustments to net patient service revenues in the period of the change.
We record implicit price concessions, primarily related to uninsured patients and patients with co‑pays, co‑insurance and deductibles. The implicit price concessions included in estimating the transaction price represent the difference between amounts billed to patients and the amounts we expect to collect based on our collection history with similar patients. Although outcomes vary, our policy is to attempt to collect amounts due from patients, including co‑pays, co‑insurance and deductibles due from patients with insurance, at the time of service while complying with all federal and state statutes and regulations, including, but not limited to, the Emergency Medical Treatment and Active Labor Act (“EMTALA”). Generally, as required by EMTALA, patients may not be denied emergency treatment due to inability to pay. Therefore, services, including the legally required medical screening examination and stabilization of the patient, are performed without delaying to obtain insurance information. In non‑emergency circumstances or for elective procedures and services, it is our policy to verify insurance prior to a patient being treated; however, there are various exceptions that can occur. Such exceptions can include, for example, instances where (1) we are unable to obtain verification because the patient’s insurance company was unable to be reached or contacted, (2) a determination is made that a patient may be eligible for benefits under various government programs, such as Medicaid or Victims of Crime, and it takes several days or weeks before qualification for such benefits is confirmed or denied, and (3) under physician orders we provide services to patients that require immediate treatment.
There are various factors that can impact collection trends, such as: changes in the economy, which in turn have an impact on unemployment rates and the number of uninsured and underinsured patients; the volume of patients through our
emergency departments; the increased burden of co‑pays, co‑insurance amounts and deductibles to be made by patients with insurance; and business practices related to collection efforts. These factors continuously change and can have an impact on collection trends and our estimation process. Subsequent changes to the estimate of the transaction price are generally recorded as adjustments to net patient service revenues in the period of the change.
We also provide charity care to patients who are financially unable to pay for the healthcare services they receive. Most patients who qualify for charity care are charged a per‑diem amount for services received, subject to a cap. Except for the per‑diem amounts, our policy is not to pursue collection of amounts determined to qualify as charity care; therefore, we do not report these amounts in net operating revenues. Patient advocates from our Eligibility and Enrollment Services program screen patients in the hospital to determine whether those patients meet eligibility requirements for financial assistance programs. They also expedite the process of applying for these government programs.
Conifer Revenues—Amounts related to services provided to patients for which we have not billed and that do not meet the conditions of unconditional right to payment at the end of the reporting period are contract assets. Approximately 88% of our Hospital Operations segment’s contract assets meet the conditions for unconditional right to payment and are reclassified to patient receivables within 90 days.
Revenue Cycle Management and Other Services
Our ConiferHospital Operations segment recognizesalso provides revenue cycle management and other services to health systems, individual hospitals and physician practices. We recognize revenue from itsour contracts when Conifer’sthe underlying performance obligations are satisfied, which is generally as services are rendered. Revenue is recognized in an amount that reflects the consideration to which Conifer expectswe expect to be entitled.
At contract inception, Conifer assesseswe assess the services specified in itsour contracts with customers and identifiesidentify a performance obligation for each distinct contracted service. Conifer identifies the performance obligations and considers all the services provided under the contract. ConiferWe generally considersconsider the following distinct services as separate performance obligations:
•revenue cycle management services;
•value‑based care services;
•patient communication and engagement services;
•consulting services; and
•other client‑defined projects.
Conifer’sOur contracts generally consist of fixed‑price, volume‑based or contingency‑based fees. Conifer’s long‑Long‑term contracts typically provide for Conifer to deliverthe delivery of recurring monthly services over a multi‑year period. The contracts are typically priced such that Conifer’sour monthly fee to itsour customer represents the value obtained by the customer in the month for those services. Such multi‑year service contracts may have upfront fees related to transition or integration work performed by Coniferus to set up the delivery for the ongoing services. Such transition or integration work typically does not result in a separately identifiable obligation; thus, the fees and expenses related to such work are deferred and recognized over the life of the related contractual service period. For contracts in which the amortization period of the asset is one year or less, we have elected to apply the practical expedient provided by FASB ASC 340‑40‑25‑4 and expense these costs as incurred.
Revenue for fixed‑priced contracts is typically recognized at the time of billing unless evidence suggests that the revenue is earned or Conifer’sour obligations are fulfilled in a different pattern. Revenue for volume‑based contracts is typically recognized as the services are being performed at the contractually billable rate, which is generally a percentage of collections or a percentage of client net patient revenue.
Contract Assets and Liabilities—Our client contract terms, including payment conditions, are diverse. For non‑fixed‑price arrangements, we may invoice clients before we perform the contracted services, with subsequent adjustments (true‑up) to align with actual fees. In contrast, some contracts require payment after we have performed the contracted services (in arrears). Contracts may also feature performance‑based incentives or penalties, along with other variable consideration. Revenue recognition occurs when services are rendered and the client gains control or benefit of the services, regardless of the invoicing schedule, leading to the recognition of a contract asset for unbilled revenue. Unbilled revenue is recognized as receivables in the month the services are performed. Conversely, advance payments from clients result in the recognition of a contract liability for deferred revenue until the revenue recognition requirements are met.
Cash and Cash Equivalents
We treat highly liquid investments with original maturities of three months or less as cash equivalents. Cash and cash equivalents were $1.228 billion and $858 million and $2.364 billion at December 31, 20222023 and 2021,2022, respectively. At December 31, 20222023 and 2021,2022, our book overdrafts were $266$187 million and $226$266 million, respectively, which were classified as accounts payable. At December 31, 2023 and 2022, and 2021, $140$100 million and $188$140 million, respectively, of total cash and cash equivalents in the accompanying Consolidated Balance Sheets were intended for the operations of our insurance‑related subsidiaries.
At December 31, 2023, 2022 2021 and 2020,2021, we had $154 million, $196 million $95 million and $93$95 million, respectively, of property and equipment purchases accrued for items received but not yet paid. Of these amounts, $141 million, $191 million $88 million and $85$88 million, respectively, were included in accounts payable.
In June 2022, we acquired all of Baylor’s 5% voting ownership interest in USPI. We paid $11 million from cash on hand and recognized a liability of $377 million, the present value of the liability on the acquisition date, for the remainder of the purchase price. We recorded reductions in redeemable noncontrolling interest of $365 million for the carrying value of Baylor’s ownership interest and $23 million to additional paid-in capital for the difference between the carrying value and present value of the purchase price for the shares on the acquisition date. This has been reflected as noncash financing activity in the accompanying Consolidated Statement of Cash Flows for the year ended December 31, 2022. Payments made subsequent to the transaction’s close are reflected as cash activity within the financing section of our consolidated statements of cash flows.flows in the respective period. See Note 18 for additional information about this transaction.
Investments in Debt and Equity Securities
We classify investments in debt securities as either available‑for‑sale, held‑to‑maturity or as part of a trading portfolio. Our policy is to classify investments in debt securities that may be needed for cash requirements as “available‑for‑sale.” At December 31, 2023 and 2022, we had no significant investments in debt securities classified as either held‑to‑maturity or trading. We carry debt securities classified as available‑for‑sale at fair value. We report their unrealized gains and losses, net of taxes, as accumulated other comprehensive income (loss). We periodically evaluate available-for-sale securities in unrealized loss positions for credit impairment, using both qualitative and quantitative criteria. In the event a security is deemed to be impaired as the result of a credit loss, we record a loss in our consolidated statements of operations.
We carry equity securities at fair value, and we report their unrealized gains and losses in other non-operating income, net, in our consolidated statements of operations. If the equity security does not have a readily determinable fair value, the carrying value of the security is adjusted only when there is a price change that is observable from a transaction of an identical or similar investment. We include realized gains or losses in our consolidated statements of operations based on the specific identification method.
Investments in Unconsolidated Affiliates
We control 308As of December 31, 2023, we controlled 330 of the facilities withinin our Ambulatory Care segment and, therefore, consolidateconsolidated their results. We account for many of the facilities in which our Ambulatory Care segment holds ownership interests in (158(155 of 466485 at December 31, 2022)2023), as well as additional companies in which our Hospital Operations segment holds ownership interests, under the equity method as investments in unconsolidated affiliates and report only our share of net income as equity in earnings of unconsolidated affiliates in the accompanying Consolidated Statements of Operations. In the yearsyear ended December 31, 2021, and 2020, equity in earnings of unconsolidated affiliates included $14 million and $17 million, respectively, from PRF grantsgrant funds recognized by our Ambulatory Care segment’s unconsolidated affiliates. No additional revenue was recognized from PRF grantsgrant funds by unconsolidated affiliates during the yearyears ended December 31, 2023 and 2022.
Summarized financial information for equity method investees is included in the following table. For investments acquired during the reported periods, amounts below include 100% of the investee’s results beginning on the date of our acquisition of the investment.
| | December 31, |
| December 31, | | | December 31, |
| | | 2022 | | 2021 | | 2020 | | 2023 | | 2022 | | 2021 |
| Current assets | Current assets | $ | 1,142 | | | $ | 1,176 | | | $ | 1,309 | |
| Noncurrent assets | Noncurrent assets | $ | 1,356 | | | $ | 1,390 | | | $ | 1,262 | |
| Current liabilities | Current liabilities | $ | (479) | | | $ | (495) | | | $ | (516) | |
| Noncurrent liabilities | Noncurrent liabilities | $ | (878) | | | $ | (855) | | | $ | (866) | |
| Noncontrolling interests | Noncontrolling interests | $ | (644) | | | $ | (659) | | | $ | (621) | |
| | | | Years Ended December 31, |
| | | 2022 | | 2021 | | 2020 |
| | | Years Ended December 31, |
| | | | 2023 | | 2022 | | 2021 |
| Net operating revenues | Net operating revenues | $ | 3,360 | | | $ | 3,030 | | | $ | 2,665 | |
| Net income | Net income | $ | 805 | | | $ | 836 | | | $ | 702 | |
| Net income attributable to the investees | Net income attributable to the investees | $ | 453 | | | $ | 499 | | | $ | 437 | |
OurThe equity method investment that contributed the most to our equity in earnings of unconsolidated affiliates during the years ended December 31, 2023, 2022 2021 and 20202021 was Texas Health Ventures Group, LLC (“THVG”), which is operated by USPI. THVG represented $104 million, $89 million $107 million and $85$107 million of total equity in earnings of unconsolidated affiliates of $228 million, $216 million $218 million and $169$218 million in the years ended December 31, 2023, 2022 and 2021, and 2020, respectively.
Property and Equipment
Additions and improvements to property and equipment exceeding established minimum amounts with a useful life greater than one year are capitalized at cost. Expenditures for maintenance and repairs are charged to expense as incurred. We use the straight‑line method of depreciation for buildings, building improvements and equipment. The estimated useful life for buildings and improvements is primarily 15 to 40 years, and for equipment three to 15 years. Newly constructed hospitals are usually depreciated over 50 years. Interest costs related to construction projects are capitalized. In the years ended December 31, 2023, 2022 2021 and 2020,2021, capitalized interest was $9 million, $8 million $4 million and $5$4 million, respectively.
We evaluate our long‑lived assets for possible impairment annually or whenever events or changes in circumstances indicate that the carrying amount of the asset, or related group of assets, may not be recoverable from estimated future undiscounted cash flows. If the estimated future undiscounted cash flows are less than the carrying value of the assets, we calculate the amount of an impairment charge only if the carrying value of the long‑lived assets exceeds their fair value. The fair value of the asset is estimated based on third‑party appraisals, established market values of comparable assets or internally developed estimates of future net cash flows expected to result from the use and ultimate disposition of the asset. The estimates of these future cash flows are based on assumptions and projections we believe to be reasonable and supportable. Estimates require our subjective judgments and take into account assumptions about revenue and expense growth rates, operating margins and recoverable disposition values, based on industry and operating factors. These assumptions may vary by type of asset and presume stable, improving or, in some cases, declining results, depending on their circumstances. If the presumed level of performance does not occur as expected, impairment may result.
We report long‑lived assets to be disposed of at the lower of their carrying amounts or fair values less costs to sell. In such circumstances, our estimates of fair value are based on third‑party appraisals, established market prices for comparable assets or internally developed estimates of future net cash flows.
Leases
We determine if an arrangement is a lease at inception of the contract. Our right‑of‑use assets represent our right to use the underlying assets for the lease term and our lease liabilities represent our obligation to make lease payments arising from the leases. Right‑of‑use assets and lease liabilities are recognized at the commencement date based on the present value of lease payments over the lease term. We use our estimated incremental borrowing rate, which is derived from information available at the lease commencement date, in determining the present value of lease payments. For our Hospital Operations and Conifer segments,segment, we estimate our incremental borrowing rates for our portfolio of leases using documented rates included in our recent equipment finance leases or, if applicable, recent secured debt issuances that correspond to various lease terms. We also give consideration to information obtained from our bankers, our secured debt fair value and publicly available data for instruments with similar characteristics. For our Ambulatory Care segment, we estimate an incremental borrowing rate for each center by utilizing
utilizing historical and projected financial data, estimating a hypothetical credit rating using publicly available market data and adjusting the market data to reflect the effects of collateralization.
Our operating leases are primarily for real estate, including off‑campus outpatient facilities, medical office buildings, and corporate and other administrative offices, as well as medical and office equipment. Our finance leases are primarily for medical equipment and information technology and telecommunications assets. Our real estate lease agreements typically have initial terms of five to 10 years, and our equipment lease agreements typically have initial terms of three years. We do not record leases with an initial term of 12 months or less (short‑term leases) in our consolidated balance sheets.
Our real estate leases may include one or more options to renew, with renewals that can extend the lease term from five to 10 years. The exercise of lease renewal options is at our sole discretion. In general, we do not consider renewal options to be reasonably likely to be exercised, therefore, renewal options are generally not recognized as part of our right‑of‑use assets and lease liabilities. Certain leases also include options to purchase the leased property. The useful life of assets and leasehold improvements are limited by the expected lease term, unless there is a transfer of title or purchase option reasonably certain of exercise. The majority of our medical equipment leases have terms of three years with a bargain purchase option that is reasonably certain of exercise, so these assets are depreciated over their useful life, typically ranging from five to seven years. Similarly, some of our leases of information technology and telecommunications assets include a transfer of title and, therefore, have useful lives of 15 years.
Certain of our lease agreements for real estate include payments based on actual common area maintenance expenses and others include rental payments adjusted periodically for inflation. These variable lease payments are recognized in other operating expenses, net, but are not included in the right‑of‑use asset or liability balances. Our lease agreements do not contain any material residual value guarantees, restrictions or covenants.
We have elected the practical expedient that allows lessees to choose to not separate lease and non‑lease components by class of underlying asset and are applying this expedient to all relevant asset classes. We have also elected the practical expedient package to not reassess at adoption (1) expired or existing contracts for whether they are or contain a lease, (2) the lease classification of any existing leases or (3) initial indirect costs for existing leases.
Goodwill and Other Intangible Assets
Goodwill represents the excess of costs over the fair value of assets of businesses acquired. Goodwill and other intangible assets acquired in purchase business combinations and determined to have indefinite useful lives are not amortized, but instead are subject to impairment tests performed at least annually. For goodwill, we perform the test atOur reporting segments are the reporting unit level when events occur that require an evaluationunits used to be performed or at least annually.perform our goodwill analysis. If we determine the carrying value of goodwill is impaired, or if the carrying value of a business that is to be sold or otherwise disposed of exceeds its fair value, we reduce the carrying value, including any allocated goodwill, to fair value. Estimates of fair value are based on third‑party appraisals, established market prices for comparable assets or internally developed estimates of future net cash flows and presume stable, improving or, in some cases, declining results at our hospitals, depending on their circumstances.
Other intangible assets consist of capitalized software costs, which are amortized on a straight‑line basis over the estimated useful life of the software, which ranges from three to 15 years, costs of acquired management and other contract service rights, most of which have indefinite lives, and miscellaneous intangible assets.
Accruals for General and Professional Liability Risks
We accrue for estimated professional and general liability claims, to the extent not covered by insurance, when they are probable and can be reasonably estimated. We maintain reserves, which are based on modeled estimates for the portion of our professional liability risks, including incurred but not reported claims, to the extent we do not have insurance coverage. Our liability consists of estimates established based upon calculations using several factors, including the number of expected claims, estimates of losses for these claims based on recent and historical settlement amounts, estimates of incurred but not reported claims based on historical experience and the timing of historical payments. Our liabilities are adjusted for new claims information in the period such information becomes known. Malpractice expense is recorded within other operating expenses in our consolidated statements of operations.
Income Taxes
We account for income taxes using the asset and liability method. This approach requires the recognition of deferred tax assets and liabilities for the expected future tax consequences of temporary differences between the carrying amounts and
the tax bases of assets and liabilities. Income tax receivables and liabilities and deferred tax assets and liabilities are recognized based on the amounts that more likely than not will be sustained upon ultimate settlement with taxing authorities.
Developing our provision for income taxes and analysis of uncertain tax positions requires significant judgment and knowledge of federal and state income tax laws, regulations and strategies, including the determination of deferred tax assets and liabilities and, if necessary, any valuation allowances that may be required for deferred tax assets.
We assess the realization of our deferred tax assets to determine whether an income tax valuation allowance is required. Based on all available evidence, both positive and negative, and the weight of that evidence to the extent such evidence can be objectively verified, we determine whether it is more likely than not that all or a portion of the deferred tax assets will be realized. The main factors that we consider include:
•Cumulative profits/losses in recent years, adjusted for certain nonrecurring items;
•Income/losses expected in future years;
•Unsettled circumstances that, if unfavorably resolved, would adversely affect future operations and profit levels;
•The availability, or lack thereof, of taxable income in prior carryback periods that would limit realization of tax benefits; and
•The carryforward period associated with the deferred tax assets and liabilities.
We consider many factors when evaluating our uncertain tax positions, and such judgments are subject to periodic review. Tax benefits associated with uncertain tax positions are recognized in the period in which one of the following conditions is satisfied: (1) the more likely than not recognition threshold is satisfied; (2) the position is ultimately settled through negotiation or litigation; or (3) the statute of limitations for the taxing authority to examine and challenge the position has expired. Tax benefits associated with an uncertain tax position are derecognized in the period in which the more likely than not recognition threshold is no longer satisfied.
Segment Reporting
We primarily operate acute care hospitals and related healthcare facilities. Our Hospital Operations segment generated 76%81%, 80%83% and 81%86% of our net operating revenues in the years ended December 31, 2023, 2022 2021 and 2020,2021, respectively. Major decisions, including capital resource allocations, are made at the consolidated level, not at the market or hospital level. The factors for determining the reportable segments include the manner in which management evaluates operating performance combined with the nature of the individual business activities.
Costs Associated with Exit or Disposal Activities
We recognize costs associated with exit (including restructuring) or disposal activities when they are incurred and can be measured at fair value, rather than at the date of a commitment to an exit or disposal plan.
NOTE 2. EQUITY
Nonredeemable Noncontrolling Interests
Our nonredeemable noncontrolling interests balances at December 31, 20222023 and 20212022 in the accompanying Consolidated Statements of Changes in Equity were comprised of $132$185 million and $128$132 million, respectively, from our Hospital Operations segment, and $1.185$1.324 billion and $898 million,$1.185 billion, respectively, from our Ambulatory Care segment. Our net income attributable to nonredeemable noncontrolling interests for the years ended December 31, 2023, 2022 2021 and 20202021 were comprised of $21$30 million, $21 million and $14$21 million, respectively, from our Hospital Operations segment, and $304 million, $221 million $205 million and $169$205 million, respectively, from our Ambulatory Care segment.
Share Repurchase Program
OnIn October 22, 2022, we announced that our board of directors had authorized the repurchase of up to $1 billion of our common stock through a share repurchase program that expires on December 31, 2024. Under the program, shares can be purchased in the open market or through privately negotiated transactions in a manner consistent with applicable securities laws
and regulations, including pursuant to a Rule 10b5-1 plan maintainedif established by the Company, at times and in amounts based on market conditions and other factors.
The table below summarizes transactions completed under the repurchase program:program during the years ended December 31, 2023 and 2022:
| | Period | Period | | Total Number of Shares Purchased | | Average Price Paid per Share | | Total Number of Shares Purchased as Part of Publicly Announced Program | | Maximum Dollar Value of Shares That May Yet be Purchased Under the Program | Period | | Total Number of Shares Purchased | | Average Price Paid per Share | | Total Number of Shares Purchased as Part of Publicly Announced Program | | Maximum Dollar Value of Shares That May Yet be Purchased Under the Program |
| | | | (In Thousands) | | | | (In Thousands) | | (In Millions) | | | (In Thousands) | | | | (In Thousands) | | (In Millions) |
| Inception through October 31, 2022 | Inception through October 31, 2022 | | 1,800 | | $ | 41.81 | | | 1,800 | | $ | 925 | |
| November 1 through November 30, 2022 | November 1 through November 30, 2022 | | 4,089 | | $ | 42.74 | | | 4,089 | | $ | 750 | |
| December 1 through December 31, 2022 | December 1 through December 31, 2022 | | — | | | $ | — | | | — | | | $ | 750 | |
| Inception through December 31, 2022 | Inception through December 31, 2022 | | 5,889 | | $ | 42.45 | | | 5,889 | |
| | January 1 through January 31, 2023 | |
| | January 1 through January 31, 2023 | |
| | January 1 through January 31, 2023 | |
| February 1 through February 28, 2023 | |
| March 1 through March 31, 2023 | |
| April 1 through April 30, 2023 | |
| May 1 through May 31, 2023 | |
| June 1 through June 30, 2023 | |
| July 1 through July 31, 2023 | |
| August 1 through August 31, 2023 | |
| September 1 through September 30, 2023 | |
| October 1 through October 31, 2023 | |
| November 1 through November 30, 2023 | |
| December 1 through December 31, 2023 | |
| Year ended December 31, 2023 | |
NOTE 3. ACCOUNTS RECEIVABLE
The principal components of accounts receivable are shown in the table below:
| | December 31, | | | December 31, |
| | | | | | | | | | | | 2023 | | 2022 |
| | December 31, |
| | 2022 | | 2021 |
| | Patient accounts receivable | |
| Patient accounts receivable | |
| Patient accounts receivable | Patient accounts receivable | $ | 2,746 | | | $ | 2,600 | |
| Estimated future recoveries | Estimated future recoveries | 149 | | | 137 | |
| Net cost reports and settlements receivable and valuation allowances | Net cost reports and settlements receivable and valuation allowances | 48 | | | 33 | |
| Accounts receivable, net | Accounts receivable, net | $ | 2,943 | | | $ | 2,770 | |
| Accounts receivable, net | |
| Accounts receivable, net | |
Accounts that are pursued for collection through Conifer’s business offices are maintained on our hospitals’ books and reflected in patient accounts receivable. Patient accounts receivable, including billed accounts and certain unbilled accounts, as well as estimated amounts due from third‑party payers for retroactive adjustments, are receivables if our right to consideration is unconditional and only the passage of time is required before payment of that consideration is due. Estimated uncollectable amounts are generally considered implicit price concessions that are a direct reduction to patient accounts receivable rather than allowance for doubtful accounts.
We also provide financial assistance through our charity and uninsured discount programs to uninsured patients who are unable to pay for the healthcare services they receive. Our policy is not to pursue collection of amounts determined to qualify for financial assistance; therefore, we do not report these amounts in net operating revenues. Most states include an estimate of the cost of charity care in the determination of a hospital’s eligibility for Medicaid disproportionate share hospital payments. These payments are intended to mitigate our cost of uncompensated care.
Some states have also developed provider fee or other supplemental payment programs to mitigate the shortfall of Medicaid reimbursement compared to the cost of caring for Medicaid patients.
We participate in various provider fee programs, which help reduce the amount of uncompensated care from indigent patients and those covered by Medicaid. The following table summarizes the amount and classification of assets and liabilities in the accompanying Consolidated Balance Sheets related to California’s provider fee program:
| | | | | | | | | | | |
| December 31, |
| | 2022 | | 2021 |
| Assets: | | | |
| Other current assets | $ | 367 | | | $ | 370 | |
| Investments and other assets | $ | 197 | | | $ | 213 | |
| | | |
| Liabilities: | | | |
| Other current liabilities | $ | 145 | | | $ | 123 | |
| Other long-term liabilities | $ | 63 | | | $ | 60 | |
| | | | | | | | | | | |
| December 31, |
| | 2023 | | 2022 |
| Assets: | | | |
| Other current assets | $ | 329 | | | $ | 367 | |
| Investments and other assets | $ | 334 | | | $ | 197 | |
| | | |
| Liabilities: | | | |
| Other current liabilities | $ | 172 | | | $ | 145 | |
| Other long-term liabilities | $ | 135 | | | $ | 63 | |
The following table presents our estimated costs (based on selected operating expenses, which include salaries, wages and benefits, supplies and other operating expenses) of caring for our uninsured and charity patients:
| | | | Years Ended December 31, | | Years Ended December 31, |
| | | 2022 | | 2021 | | 2020 | | 2023 | | 2022 | | 2021 |
| Estimated costs for: | Estimated costs for: | | | | | | Estimated costs for: | | | |
| Uninsured patients | Uninsured patients | $ | 537 | | | $ | 650 | | | $ | 617 | |
| Charity care patients | Charity care patients | 83 | | | 97 | | | 147 | |
| $ | 620 | | | $ | 747 | | | $ | 764 | |
| $ | |
NOTE 4. CONTRACT BALANCES
Hospital Operations Segment
Amounts related to services provided to patients for which we have not billed and that do not meet the conditions of unconditional right to payment at the end of the reporting period are contract assets. For ourOur Hospital Operations segment, oursegment’s contract assets include services that we have provided toand liabilities primarily derive from: (1) patients who are still receiving ongoing inpatient care infrom one of our facilities at the end of the reporting period.period; (2) timing differences between our performance of revenue cycle management and other contractually-based services and the invoicing or receipt of payment for these services; and, with respect to the year ended December 31, 2021 as discussed below, (3) advance payments from the MAPP following its expansion under the COVID Acts. Our Hospital Operations segment’s contract assets were included in other current assets, and its contract liabilities are included in other current liabilities or other long‑term liabilities, depending upon when we expect to recognize the underlying revenue, in the accompanying Consolidated Balance Sheets at December 31, 2022 or 2021. Approximately 88%2023 and 2022.
The opening and closing balances of our Hospital Operations segment’s receivables, contract assets, and current and long‑term contract liabilities were as follows:
| | | | | | | | | | | | | | | | | | | | | | | | | | |
| | Receivables | | Contract Assets –
Unbilled Revenue | | Contract Liabilities –
Current
Deferred Revenue and Advances from Medicare | | Contract Liabilities –
Long-Term
Deferred Revenue |
| December 31, 2022 | | $ | 37 | | | $ | 200 | | | $ | 110 | | | $ | 13 | |
| December 31, 2023 | | 21 | | | 208 | | | 59 | | | 12 | |
| Increase (decrease) | | $ | (16) | | | $ | 8 | | | $ | (51) | | | $ | (1) | |
| | | | | | | | |
| December 31, 2021 | | $ | 28 | | | $ | 199 | | | $ | 955 | | | $ | 15 | |
| December 31, 2022 | | 37 | | | 200 | | | 110 | | | 13 | |
| Increase (decrease) | | $ | 9 | | | $ | 1 | | | $ | (845) | | | $ | (2) | |
At December 31, 2021, the current portion of our Hospital Operations segment’s contract assets meet the conditions for unconditional right to payment and are reclassified to patient receivables within 90 days.
As discussed in Note 1, our Hospital Operations segment received advance payments from theliabilities included $876 million of MAPP following its expansion under the COVID Acts in 2020; however, no additional advances were received during the years ended December 31, 2022 or 2021.advances. All remaining MAPP advances received by our Hospital Operations segment were either repaid or recouped during 2022, and 2021, which resulted in no outstanding liability at December 31, 2023 and 2022. The remaining advance payments at December 31, 2021 were recorded as contract liabilities in the accompanying Consolidated Balance Sheets.
The opening and closing balances of contract assets and contract liabilities, as well as their classification in our consolidated balance sheets, for our Hospital Operations segment were as follows:
| | | | | | | | | | | | | | | | | | | | |
| | Contract Assets | | Contract Liabilities – Current Advances from Medicare | | Contract Liabilities – Long-Term Advances from Medicare |
| December 31, 2021 | | $ | 181 | | | $ | 876 | | | $ | — | |
| December 31, 2022 | | 185 | | | — | | | — | |
| Increase (decrease) | | $ | 4 | | | $ | (876) | | | $ | — | |
| | | | | | |
| December 31, 2020 | | $ | 208 | | | $ | 510 | | | $ | 819 | |
| December 31, 2021 | | 181 | | | 876 | | | — | |
| Increase (decrease) | | $ | (27) | | | $ | 366 | | | $ | (819) | |
Ambulatory Care Segment
Our Ambulatory Care segment also received advance payments from the MAPP following its expansion in 2020; however, no additional advances were received duringIn the years ended December 31, 2023 and 2022, or 2021. All remaining MAPP advances received by our Ambulatory Care segment were either repaid or recouped during 2022we recognized revenue totaling $71 million and 2021, which resulted in no outstanding liability at December 31, 2022. The remaining advance payments at December 31, 2021 were recorded as contract liabilities in the accompanying Consolidated Balance Sheets.
The opening and closing balances of contract liabilities for our Ambulatory Care segment were as follows:
| | | | | | | | | | | | | | | | |
| | Contract Liabilities – Current Advances from Medicare | | Contract Liabilities – Long-Term Advances from Medicare | | |
| December 31, 2021 | | $ | 4 | | | $ | — | | | |
| December 31, 2022 | | — | | | — | | | |
| Decrease | | $ | (4) | | | $ | — | | | |
| | | | | | |
| December 31, 2020 | | $ | 93 | | | $ | 83 | | | |
| December 31, 2021 | | 4 | | | — | | | |
| Decrease | | $ | (89) | | | $ | (83) | | | |
Conifer Segment
The opening and closing balances of Conifer’s receivables, contract asset, and current and long‑term contract liabilities were as follows:
| | | | | | | | | | | | | | | | | | | | | | | | | | |
| | Receivables | | Contract Asset –
Unbilled Revenue | | Contract Liability –
Current
Deferred Revenue | | Contract Liability –
Long-Term
Deferred Revenue |
| December 31, 2021 | | $ | 28 | | | $ | 18 | | | $ | 79 | | | $ | 15 | |
| December 31, 2022 | | 37 | | | 15 | | | 110 | | | 13 | |
| Increase (decrease) | | $ | 9 | | | $ | (3) | | | $ | 31 | | | $ | (2) | |
| | | | | | | | |
| December 31, 2020 | | $ | 56 | | | $ | 20 | | | $ | 56 | | | $ | 16 | |
| December 31, 2021 | | 28 | | | 18 | | | 79 | | | 15 | |
| Increase (decrease) | | $ | (28) | | | $ | (2) | | | $ | 23 | | | $ | (1) | |
The differences between the opening and closing balances of Conifer’s contract assets and contract liabilities are primarily related to prepayments for those clients who are billed in advance, changes in estimates related to metric‑based services, and up‑front integration services that are typically not distinct and are, therefore, recognized over the performance obligation period to which they relate. Our Conifer segment’s receivables and contract assets were reported as part of other current assets in the accompanying Consolidated Balance Sheets, and its current and long‑term contract liabilities were reported as part of contract liabilities and contract liabilities – long‑term, respectively, in the accompanying Consolidated Balance Sheets.
In both of the years ended December 31, 2022 and 2021, Conifer recognized $56 million, ofrespectively, from our revenue cycle management services that was included in the opening current deferred revenue liability.
This revenue consists primarily of prepayments for those contract clients who arewere billed in advance, changes in estimates related to metric‑based services and up‑front integration services that are recognized over the service period.
Contract Costs
Costs—We recognized amortization expense related to deferred contract setup costs of $5 million in the year ended December 31, 2023, and $4 million in each of the years ended December 31, 2022 2021 and 2020.2021. At December 31, 20222023 and 2021,2022, the unamortized customer contract costs were $24$22 million and $23$24 million, respectively, and were presented as part of investments and other assets in the accompanying Consolidated Balance Sheets.
Ambulatory Care Segment
All remaining MAPP advances received by our Ambulatory Care segment were either repaid or recouped during 2022, which resulted in no outstanding liability at December 31, 2023 and 2022. The opening and closing balances of contract liabilities for our Ambulatory Care segment were as follows:
| | | | | | | | | | | | |
| | Contract Liabilities – Current Advances from Medicare | | | | |
| | | | | | |
| | | | | | |
| | | | | | |
| | | | | | |
| December 31, 2021 | | $ | 4 | | | | | |
| December 31, 2022 | | — | | | | | |
| Decrease | | $ | (4) | | | | | |
NOTE 5. ASSETS AND LIABILITIES HELD FOR SALE
In November 2023, we entered into a definitive agreement for the sale of three hospitals located in South Carolina and certain related operations (together, the “SC Hospitals”), all of which were held by our Hospital Operations segment. The assets and liabilities related to the SC Hospitals were included in assets held for sale and liabilities held for sale, respectively, in the accompanying Consolidated Balance Sheet at December 31, 2023. We received pre-tax proceeds of approximately $2.400 billion when this sale closed in January 2024.
In January 2023, we entered into a definitive agreement to sell our 51% ownership interest in San Ramon Regional Medical Center and certain related operations (“San Ramon RMC”), which is held by our Hospital Operations segment, to John Muir Health (“John Muir”). We reclassified the assets and liabilities related to San Ramon RMC to assets held for sale and liabilities held for sale, respectively, in our consolidated balance sheet following our decision to sell our ownership interest. John Muir announced it no longer intended to pursue the acquisition after the U.S. Federal Trade Commission took action to challenge the transaction, following which we removed the assets and liabilities from held for sale and reclassified them as held and used in our consolidated balance sheet.
We completed the sale of five Miami‑area hospitals and certain related operations (the “Miami Hospitals”) held by our Hospital Operations segment in August 2021, resulting in our recognition of a pre‑tax gain on sale of $406 million in the year ended December 31, 2021.
In the three months ended June 30, 2021, we completed the sale of the majority of our urgent care centersUCCs operated under the MedPost and CareSpot brands by our Hospital Operations and Ambulatory Care segments, and we also completed the separate sale of a Philadelphia‑area building held by our Hospital Operations segment. We recorded a gain related to the sale of the urgent care centersUCCs of $14 million and a gain of $2 million related to the sale of the building in Philadelphia in 2021.
Gains related to the sales described above were included in net gains on sales, consolidation and deconsolidation of facilities in the accompanying Consolidated Statement of Operations for the year ended December 31, 2021. No impairment charge was incurred during the years ended December 31, 2023, 2022 2021 or 20202021 related to planned divestitures.
Assets and liabilities classified as held for sale at December 31, 2023 were comprised of the following:
| | | | | | | | | | | | |
| | | | | | |
| Accounts receivable | | | | $ | 78 | | | |
| Other current assets | | | | 25 | | | |
| Investments and other long-term assets | | | | 26 | | | |
| Property and equipment | | | | 204 | | | |
| Other intangible assets | | | | 17 | | | |
| Goodwill | | | | 425 | | | |
| Current liabilities | | | | (45) | | | |
| | | | | | |
| Long-term liabilities | | | | (24) | | | |
| Net assets held for sale | | | | $ | 706 | | | |
The following table presents amounts included in income from continuing operations, before income taxes, related to significant components of our business that were recently disposed of:of or were classified as held for sale at December 31, 2023:
| | | | | | | | | | | | | | | | | |
| | Years Ended December 31, |
| | 2022 | | 2021 | | 2020 |
| | | | | |
| | | | | |
| | | | | |
| Miami Hospitals (includes a $406 million gain on sale in 2021) | $ | 10 | | | $ | 455 | | | $ | 67 | |
| | | | | |
| | | | | |
| | | | | |
| | | | | |
| | | | | |
| | | | | |
| | | | | | | | | | | | | | | | | |
| | Years Ended December 31, |
| | 2023 | | 2022 | | 2021 |
| Significant disposals: | | | | | |
| Income (loss) from continuing operations, before income taxes: | | | | | |
| Miami Hospitals (includes a $406 million gain on sale in 2021) | $ | (3) | | | $ | 10 | | | $ | 455 | |
| | | | | |
| | | | | |
| Significant planned divestitures classified as held for sale: | | | | | |
| Income from continuing operations, before income taxes: | | | | | |
| SC Hospitals | $ | 130 | | | $ | 127 | | | $ | 135 | |
| | | | | |
NOTE 6. IMPAIRMENT AND RESTRUCTURING CHARGES, AND ACQUISITION-RELATED COSTS
We recognized impairment charges on long‑livedcertain assets in 2023, 2022 2021 and 20202021 because the fair values of those assets or groups of assets indicated that the carrying amount was not recoverable. The fair value estimates were derived from third‑party appraisals, established market values of comparable assets, or internally developed estimates of future net cash flows. These fair value estimates can change by material amounts in subsequent periods. Many factors and assumptions can impact the estimates, including the future financial results of the facilities, how the facilities are operated in the future, changes in healthcare industry trends and regulations, and the nature of the ultimate disposition of the assets. In certain cases, these fair value estimates assume the highest and best use of facility assets in the future to a marketplace participant is other than as a medical facility. In these cases, the estimates are based on the fair value of the real property and equipment if utilized other than as a medical facility. The impairment recognized does not include the costs of closing the facilities or other future operating costs, which could be substantial. Accordingly, the ultimate net cash realized from the facilities, should we choose to sell them, could be significantly less than their impaired value.
Our impairment tests presume stable, improving or, in some cases, declining operating results in our facilities, which are based on programs and initiatives being implemented that are designed to achieve each facility’s most recent projections. If these projections are not met, or negative trends occur that impact our future outlook, future impairments of long-lived assets and goodwill may occur, and we may incur additional restructuring charges, which could be material.
At December 31, 2022, our continuing operations consisted of three reportableOur reporting segments – Hospital Operations, Ambulatory Care and Conifer. Our segments are the reporting units used to perform our goodwill impairment analysis. At December 31, 2022, our business was organized into three separate reporting segments: Hospital Operations and other, Ambulatory Care and Conifer. As discussed in Note 1, we combined our Hospital Operations and other and Conifer segments into a single reporting segment named Hospital Operations and Services (Hospital Operations) during the three months ended December 31, 2023. We completedperformed our annual goodwill impairment tests for goodwillanalysis as of October 1, 2022.2023 based on our three separate reporting segments. We performed an additional goodwill impairment analysis as of December 31, 2023, following the combination of our Hospital Operations and other and Conifer segments, based on our new two-segment structure. Neither of the impairment analyses resulted in the identification of a goodwill impairment.
We periodically incur costs to implement restructuring efforts for specific operations, which are recorded in our statement of operations as they are incurred. Our restructuring plans focus on various aspects of operations, including aligning our operations in the most strategic and cost‑effective structure, such as the establishment of support operations at our GBC. Certain restructuring and acquisition‑related costs are based on estimates. Changes in estimates are recognized as they occur.
Year Ended December 31, 2023
During the year ended December 31, 2023, we recorded impairment and restructuring charges and acquisition‑related costs of $137 million, consisting of $79 million of restructuring charges, $43 million of impairment charges and $15 million of acquisition‑related transaction costs. Impairment charges for the year ended December 31, 2023 primarily arose from the write‑down of our investment in certain equity method investments held by our Ambulatory Care segment. Restructuring charges consisted of $36 million of legal costs related to the sale of certain businesses, $15 million of employee severance costs, $12 million related to the transition of various administrative functions to our GBC, $10 million of contract and lease termination fees, and $6 million of other restructuring costs.
Year Ended December 31, 2022
During the year ended December 31, 2022, we recorded impairment and restructuring charges and acquisition‑related costs of $226 million, consisting of $118 million of restructuring charges, $94 million of impairment charges and $14 million of acquisition‑related transaction costs. Impairment charges included $82 million for the write‑down of certain buildings and medical equipment located in one of our markets to their estimated fair values, which assets are part of our Hospital Operations segment. Material adverse trends in our estimates of future undiscounted cash flows of the hospitals indicated the aggregate carrying value of the hospitals’ long‑lived assets was not recoverable from their estimated future cash flows. We believe the most significant factors contributing to the adverse financial trends included decreased revenues and lower patient volumes due to the pandemic and competition, as well as higher labor costs as a resultbecause of the pandemic. As a result, we updated the estimate of the fair value of the hospitals’ long‑lived assets and compared it to the aggregate carrying value of those assets. Because the fair value estimates were lower than the aggregate carrying value of the long‑lived assets, an impairment charge was recorded for the difference in the amounts. The aggregate carrying value of the hospitals’ assets held and used for which impairment charges were recorded was $167 million at December 31, 2022. Impairment charges for the year ended December 31, 2022 were comprised of $86$88 million from our Hospital Operations segment and $6 million from our Ambulatory Care segment and $2 million from our Conifer segment.
Restructuring charges consisted of $27 million of employee severance costs, $16 million related to the transition of various administrative functions to our GBC, $32 million of contract and lease termination fees, and $43 million of other restructuring costs. Acquisition‑related costs consisted of $14 million of transaction costs.
Year Ended December 31, 2021
During the year ended December 31, 2021, we recorded impairment and restructuring charges and acquisition‑related costs of $85 million, consisting of $57 million of restructuring charges, $8 million of impairment charges and $20 million of acquisition‑related costs. Restructuring charges consisted of $14 million of employee severance costs, $19 million related to the transition of various administrative functions to our GBC and $24 million of other restructuring costs. Our impairment charges for the year ended December 31, 2021, comprised of $5 million from our Ambulatory Care segment and $3 million from our ConiferHospital Operations segment, primarily consisted of charges to reduce the carrying value of certain management contract intangible assets held by our Ambulatory Care segment to their estimated fair value. Acquisition‑related costs for the year ended December 31, 2021 consisted of $20 million of transaction costs.
Year Ended December 31, 2020
During the year ended December 31, 2020, we recorded impairment and restructuring charges and acquisition‑related costs of $290 million, consisting of $92 million of impairment charges, $184 million of restructuring charges and $14 million of acquisition‑related costs. Impairment charges included $76 million for the write‑down of hospital buildings to their estimated fair values, which assets are part of our Hospital Operations segment. Material adverse trends in our estimates of future undiscounted cash flows of the hospitals indicated the aggregate carrying value of the hospitals’ long‑lived assets was not recoverable from their estimated future cash flows. We believe the most significant factors contributing to the adverse financial trends included reductions in volumes of insured patients, shifts in payer mix from commercial to governmental payers combined with reductions in reimbursement rates from governmental payers, and high levels of uninsured patients. As a result, we updated the estimate of the fair value of the hospitals’ long‑lived assets and compared it to the aggregate carrying value of those assets. Because the fair value estimates were lower than the aggregate carrying value of the long‑lived assets, an impairment charge was recorded for the difference in the amounts. The aggregate carrying value of the hospitals’ assets held and used for which impairment charges were recorded was $483 million at December 31, 2020. We also recorded $16 million of other impairment charges. Restructuring charges consisted of $65 million of employee severance costs, $50 million related to the transitioning of various administrative functions to our GBC, $23 million of charges due to the termination of the USPI management equity plan, $14 million of contract and lease termination fees, and $32 million of other restructuring costs. Acquisition‑related costs consisted of $14 million of transaction costs. Our impairment charges for the year ended December 31, 2020 were comprised of $79 million from our Hospital Operations segment, $12 million from our Ambulatory Care segment and $1 million from our Conifer segment.
NOTE 7. LEASES
The following table presents the components of our right‑of‑use assets and liabilities related to leases and their classification in our Consolidated Balance Sheets at:Sheets:
| | December 31, |
| | | | December 31, | | | | | | December 31, |
| Component of Lease Balances | Component of Lease Balances | | Classification in Consolidated Balance Sheet | | 2022 | | 2021 | Component of Lease Balances | | Classification in Consolidated Balance Sheets | | 2023 | | 2022 |
| Assets: | Assets: | | | | | | |
| Operating lease assets | |
| Operating lease assets | |
| Operating lease assets | Operating lease assets | | Investments and other assets | | $ | 1,129 | | | $ | 1,002 | |
| Finance lease assets | Finance lease assets | | Property and equipment, at cost, less accumulated depreciation and amortization | | 303 | | | 333 | |
| Total leased assets | Total leased assets | | $ | 1,432 | | | $ | 1,335 | |
| | Liabilities: | Liabilities: | |
| Liabilities: | |
| Liabilities: | |
| Operating lease liabilities: | Operating lease liabilities: | |
| Operating lease liabilities: | |
| Operating lease liabilities: | |
| Current | |
| Current | |
| Current | Current | | Other current liabilities | | $ | 207 | | | $ | 201 | |
| Long-term | Long-term | | Other long-term liabilities | | 1,046 | | | 924 | |
| Total operating lease liabilities | Total operating lease liabilities | | 1,253 | | | 1,125 | |
| Finance lease liabilities: | Finance lease liabilities: | |
| Current | Current | | Current portion of long-term debt | | 99 | | | 106 | |
| Current | |
| Current | |
| Long-term | Long-term | | Long-term debt, net of current portion | | 165 | | | 176 | |
| Total finance lease liabilities | Total finance lease liabilities | | 264 | | | 282 | |
| Total lease liabilities | Total lease liabilities | | $ | 1,517 | | | $ | 1,407 | |
The following table presents the components of our lease expense and their classification in our Consolidated Statements of Operations:
| | | | | | | | | | | | | | | | | | | | | | | | | | | | |
| Component of Lease Expense | | Classification in Consolidated Statements of Operations | | | | Years Ended December 31, |
| | | | 2022 | | 2021 | | 2020 |
| Operating lease expense | | Other operating expenses, net | | | | $ | 262 | | | $ | 241 | | | $ | 247 | |
| Finance lease expense: | | | | | | | | | | |
| Amortization of leased assets | | Depreciation and amortization | | | | 58 | | | 71 | | | 86 | |
| Interest on lease liabilities | | Interest expense | | | | 8 | | | 9 | | | 11 | |
| Total finance lease expense | | | | | | 66 | | | 80 | | | 97 | |
| Variable and short term-lease expense | | Other operating expenses, net | | | | 150 | | | 171 | | | 156 | |
| Total lease expense | | | | | | $ | 478 | | | $ | 492 | | | $ | 500 | |
| | | | | | | | | | | | | | | | | | | | | | | | | | | | |
| Component of Lease Expense | | Classification in Consolidated Statements of Operations | | | | Years Ended December 31, |
| | | | 2023 | | 2022 | | 2021 |
| Operating lease expense | | Other operating expenses, net | | | | $ | 259 | | | $ | 262 | | | $ | 241 | |
| Finance lease expense: | | | | | | | | | | |
| Amortization of leased assets | | Depreciation and amortization | | | | 55 | | | 58 | | | 71 | |
| Interest on lease liabilities | | Interest expense | | | | 8 | | | 8 | | | 9 | |
| Total finance lease expense | | | | | | 63 | | | 66 | | | 80 | |
| Variable and short term-lease expense | | Other operating expenses, net | | | | 159 | | | 150 | | | 171 | |
| Total lease expense | | | | | | $ | 481 | | | $ | 478 | | | $ | 492 | |
The weighted‑average lease terms and discount rates for operating and finance leases are presented in the following table:
| | Years Ended December 31, |
| 2022 | | 2021 | | 2020 |
| | Years Ended December 31, | | | | Years Ended December 31, |
| | 2023 | | | | 2023 | | 2022 | | 2021 |
| Weighted-average remaining lease term (years): | Weighted-average remaining lease term (years): | | | | | | |
| Operating leases | |
| Operating leases | |
| Operating leases | Operating leases | | 8.0 | | 7.5 | | 7.9 | | 7.6 | | 8.0 | | 7.5 |
| Finance leases | Finance leases | | 5.5 | | 5.7 | | 5.7 | Finance leases | | 6.0 | | 5.5 | | 5.7 |
| | Weighted-average discount rate: | Weighted-average discount rate: | |
| Weighted-average discount rate: | |
| Weighted-average discount rate: | |
| Operating leases | |
| Operating leases | |
| Operating leases | Operating leases | | 4.8 | % | | 5.1 | % | | 5.5 | % | | 5.0 | % | | 4.8 | % | | 5.1 | % |
| Finance leases | Finance leases | | 5.9 | % | | 5.4 | % | | 5.6 | % | Finance leases | | 6.5 | % | | 5.9 | % | | 5.4 | % |
Cash flow and other information related to leases is included in the following table:
| | Years Ended December 31, |
| 2022 | | 2021 | | 2020 |
| | Years Ended December 31, | | | | Years Ended December 31, |
| | 2023 | | | | 2023 | | 2022 | | 2021 |
| Cash paid for amounts included in the measurement of lease liabilities: | Cash paid for amounts included in the measurement of lease liabilities: | | | | | | |
| Operating cash outflows from operating leases | |
| Operating cash outflows from operating leases | |
| Operating cash outflows from operating leases | Operating cash outflows from operating leases | | $ | 250 | | | $ | 237 | | | $ | 239 | |
| Operating cash outflows from finance leases | Operating cash outflows from finance leases | | $ | 14 | | | $ | 12 | | | $ | 15 | |
| Financing cash outflows from finance leases | Financing cash outflows from finance leases | | $ | 118 | | | $ | 140 | | | $ | 154 | |
| | Right-of-use assets obtained in exchange for lease obligations: | Right-of-use assets obtained in exchange for lease obligations: | |
| Right-of-use assets obtained in exchange for lease obligations: | |
| Right-of-use assets obtained in exchange for lease obligations: | |
| Operating leases | |
| Operating leases | |
| Operating leases | Operating leases | | $ | 341 | | | $ | 176 | | | $ | 304 | |
| Finance leases | Finance leases | | $ | 97 | | | $ | 136 | | | $ | 98 | |
Future maturities of lease liabilities at December 31, 20222023 are presented in the following table:
| | Operating Leases | | Finance Leases | | Total |
| 2023 | | $ | 254 | | | $ | 110 | | | $ | 364 | |
| | Operating Leases | | | | Operating Leases | | Finance Leases | | Total |
| 2024 | 2024 | | 229 | | | 80 | | | 309 | |
| 2025 | 2025 | | 198 | | | 39 | | | 237 | |
| 2026 | 2026 | | 163 | | | 14 | | | 177 | |
| 2027 | 2027 | | 139 | | | 7 | | | 146 | |
| 2028 | |
| Later years | Later years | | 540 | | | 75 | | | 615 | |
| Total lease payments | Total lease payments | | 1,523 | | | 325 | | | 1,848 | |
| Less: Imputed interest | Less: Imputed interest | | 270 | | | 61 | | | 331 | |
| Total lease obligations | Total lease obligations | | 1,253 | | | 264 | | | 1,517 | |
| Less: Current obligations | Less: Current obligations | | 207 | | | 99 | | | 306 | |
| Long-term lease obligations | Long-term lease obligations | | $ | 1,046 | | | $ | 165 | | | $ | 1,211 | |
During the three months ended March 31, 2022, we sold several medical office buildings held in our Hospital Operations segment for net cash proceeds of $147 million and concurrently entered into operating lease agreements to continue use of the facilities. We recognized a gain of $69 million from the sale of these buildings, included in other operating expenses, net in the accompanying Consolidated Statement of Operations, and we recognized right-of-use assets and operating lease obligations of $103 million, in each case in the three months ended March 31, 2022.
NOTE 8. LONG-TERM DEBT
The table below showspresents our long‑term debt included in the accompanying Consolidated Balance Sheets:
| | December 31, |
| December 31, | | | December 31, |
| | | 2022 | | 2021 | | 2023 | | 2022 |
| Senior unsecured notes: | Senior unsecured notes: | | | | Senior unsecured notes: | | | |
| 6.750% due 2023 | $ | — | | | $ | 1,872 | |
| 6.125% due 2028 | 6.125% due 2028 | 2,500 | | | 2,500 | |
| 6.875% due 2031 | 6.875% due 2031 | 362 | | | 362 | |
| Senior secured first lien notes: | Senior secured first lien notes: | | | | Senior secured first lien notes: | | | |
| 4.625% due July 2024 | 4.625% due July 2024 | 756 | | | 770 | |
| 4.625% due September 2024 | 4.625% due September 2024 | 589 | | | 600 | |
| 7.500% due 2025 | — | | | 700 | |
| 4.875% due 2026 | 4.875% due 2026 | 2,100 | | | 2,100 | |
| 5.125% due 2027 | 5.125% due 2027 | 1,500 | | | 1,500 | |
| 4.625% due 2028 | 4.625% due 2028 | 600 | | | 600 | |
| 4.250% due 2029 | 4.250% due 2029 | 1,400 | | | 1,400 | |
| 4.375% due 2030 | 4.375% due 2030 | 1,450 | | | 1,450 | |
| 6.125% due 2030 | 6.125% due 2030 | 2,000 | | | — | |
| 6.750% due 2031 | |
| Senior secured second lien notes: | Senior secured second lien notes: | |
| 6.250% due 2027 | |
| 6.250% due 2027 | |
| 6.250% due 2027 | 6.250% due 2027 | 1,500 | | | 1,500 | |
| Finance leases, mortgages and other notes | Finance leases, mortgages and other notes | 453 | | | 443 | |
| Unamortized issue costs and note discounts | Unamortized issue costs and note discounts | (131) | | | (151) | |
| Long-term debt | Long-term debt | 15,079 | | | 15,646 | |
| Less: Current portion | Less: Current portion | 145 | | | 135 | |
| Long-term debt, net of current portion | Long-term debt, net of current portion | $ | 14,934 | | | $ | 15,511 | |
Senior SecuredUnsecured Notes and Senior UnsecuredSecured Notes
On September 10, 2021,At December 31, 2023, we redeemed approximately $1.100 billionhad senior unsecured notes and senior secured notes with aggregate principal amounts outstanding of $14.762 billion. These notes have fixed interest rates ranging from 4.250% to 6.875% and require semi‑annual interest payments in arrears. A payment of the then‑outstanding $1.870principal and any accrued but unpaid interest is due upon the maturity date of the respective notes, which dates are staggered from January 2026 through November 2031. We completed the following transactions related to our senior secured notes during the years ended December 31, 2023 and 2022.
2023 Transactions:
•In May 2023, we issued $1.350 billion aggregate principal amount of our 4.625%6.750% senior secured first lien notes, due July 2024 (“July 2024which will mature on May 15, 2031 (the “2031 Senior Secured First Lien Notes”) in advance of their maturity date.. We paid $1.113 billion to redeempay interest on the notes, which was primarily funded with the proceeds from the sale of the Miami Hospitals in August 2021. During the three months ended December 31, 2022, we repurchased an additional $14 million of the aggregate remaining principal amount of our July 20242031 Senior Secured First Lien Notes through multiple open‑market transactions. In total, we paid $13 million fromsemi-annually in arrears on May 15 and November 15 of each year, which payments commenced on November 15, 2023. We used the issuance proceeds, together with cash on hand, duringto finance the three‑month period to repurchase the notes. In connection with these transactions, we recorded aggregate gains from early extinguishment of debt of less than $1 million during the three months ended December 31, 2022, and a loss of $20 million in the three months ended September 30, 2021. The loss recognized in 2021 primarily related to the difference between the purchase price and the par value of the notes, as well as the write‑off of associated unamortized issuance costs.
During the three months ended December 31, 2022, we also repurchased $11 million of the then $600 million aggregate principal amount outstandingredemption of our 4.625% senior secured first lien notes due September 2024 (the “September 2024 Senior Secured First Lien Notes”) and our 4.625% senior secured first lien notes due July 2024 (the “July 2024 Senior Secured First Lien Notes”), as described below.
•Also in May 2023, we paid $596 million using a portion of the proceeds from the issuance of our 2031 Senior Secured First Lien Notes to redeem all $589 million aggregate principal amount outstanding of our September 2024 Senior Secured First Lien Notes in advance of their maturity date.
•In June 2023, we used the remaining proceeds from the issuance of our 2031 Senior Secured First Lien Notes along with cash on hand to redeem all $756 million aggregate principal amount outstanding of our July 2024 Senior Secured First Lien Notes in advance of their maturity date.
2022 Transactions:
•On February 23, 2022, we redeemed all $700 million aggregate principal amount outstanding of our 7.500% senior secured first lien notes due 2025 in advance of their maturity date. We made aggregate payments of $11paid $730 million from cash on hand through multiple open‑market transactions to repurchase theseredeem the notes. In connection with these repurchases, we recognized aggregate gains of less than $1 million during the three months ended December 31, 2022.
•On June 15, 2022, we issued $2.000 billion aggregate principal amount of 6.125% senior secured first lien notes, which will mature on June 15, 2030 (the “2030 Senior Secured First Lien Notes”). We pay interest on the
2030 Senior Secured First Lien Notes semi‑annually in arrears on June 15 and December 15 of each year, which payments commenced in December 2022. As further discussed below, we used a substantial portion of the issuance proceeds from the 2030 Senior Secured First Lien Notes, after payment of fees and expenses, to finance the redemption of our 6.750% senior unsecured notes due 2023 (the “2023 Senior Unsecured Notes”).
•Through a series of open‑market transactions during the six months ended June 30, 2022, we repurchased $124 million aggregate principal amount outstanding of our 2023 Senior Unsecured Notes using cash on hand. Following the issuance of our 2030 Senior Secured First Lien Notes, we used a substantial portion of the proceeds to redeem the then-remaining $1.748 billion aggregate principal outstanding of the 2023 Senior Unsecured Notes in advance of their maturity date. In total, we paid $1.933 billion during the six months ended June 30, 2022 to retire all $1.872 billion aggregate principal amount
outstanding of our 2023 Senior Unsecured Notes, andNotes.
•During the three months ended December 31, 2022, we recorded aggregate lossespaid a total of $13 million from early extinguishment of debt of $71cash on hand through multiple open‑market transactions to repurchase $14 million primarily related to the difference between the purchase prices and the par value of the notes, as well as$770 million aggregate principal amount then outstanding of our July 2024 Senior Secured First Lien Notes in advance of their maturity date.
•Also during the write‑off of associated unamortized issuance costs.
On February 23,three months ended December 31, 2022, we redeemed all $700repurchased $11 million of the then‑remaining $600 million aggregate principal amount outstanding of our 7.500% senior secured first lien notes due 2025September 2024 Senior Secured First Lien Notes in advance of their maturity date. We paid $730made aggregate payments of $11 million from cash on hand through multiple open‑market transactions to redeemrepurchase these notes.
We recorded net losses from the notes. In connection with the redemption, we recorded a loss from early extinguishment of debt of $38$11 million and $109 million in connection with the three monthsaforementioned purchases and redemptions during the years ended MarchDecember 31, 2023 and 2022, respectively. The losses recognized during both periods primarily related to the differencedifferences between the purchase priceor redemption prices and the par value of the notes, as well as the write‑off of associated unamortized issuance costs.
On December 1, 2021, we issued $1.450 billion aggregate principal amount of 4.375% senior secured first lien notes, which will mature on January 15, 2030 (the “2030 Senior Secured First Lien Notes”). We will pay interest on the 2030 Senior Secured First Lien Notes semi‑annually in arrears on January 15 and July 15 of each year, which payments commended in July 2022. We used the net proceeds from the issuance of the 2030 Senior Secured First Lien Notes, after payment of fees and expenses, to finance the acquisition of a group of ambulatory surgery centers in December 2021 and for general corporate purposes.
On June 2, 2021, we issued $1.400 billion aggregate principal amount of 4.250% senior secured first lien notes, which will mature on June 1, 2029 (the “2029 Senior Secured First Lien Notes”). We pay interest on the 2029 Senior Secured First Lien Notes semi‑annually in arrears on June 1 and December 1 of each year, which payments commenced in December 2021. The proceeds from the sale of the 2029 Senior Secured First Lien Notes were used, after payment of fees and expenses, together with cash on hand, to finance the redemption of all $1.410 billion aggregate principal amount then outstanding of our 5.125% senior secured second lien notes due 2025 (the “2025 Senior Secured Second Lien Notes”) in advance of their maturity date for approximately $1.428 billion. In connection with the redemption, we recorded a loss from early extinguishment of debt of approximately $31 million in the three months ended June 30, 2021, primarily related to the difference between the purchase price and the par value of the 2025 Senior Secured Second Lien Notes, as well as the write‑off of associated unamortized issuance costs.
In March 2021, we retired all $478 million aggregate principal amount outstanding of our 7.000% senior unsecured notes due 2025 in advance of their maturity date. We paid approximately $495 million from cash on hand to retire the notes. In connection with the retirement, we recorded a loss from early extinguishment of debt of $23 million in the three months ended March 31, 2021, primarily related to the difference between the purchase price and the par valuevalues of the notes, as well as the write‑off of associated unamortized issuance costs.
All of our senior secured notes are guaranteed by certain of our wholly owned domestic hospital company subsidiaries and secured by a pledge of the capital stock and other ownership interests of those subsidiaries on either a first lien or second lien basis, as indicated in the table above. All of our senior secured notes and the related subsidiary guarantees are our and the subsidiary guarantors’ senior secured obligations. All of our senior secured notes rank equally in right of payment with all of our other senior secured indebtedness. Our senior secured notes rank senior to any subordinated indebtedness that we or such subsidiary guarantors may incur; they are effectively senior to our and such subsidiary guarantors’ existing and future unsecured indebtedness and other liabilities to the extent of the value of the collateral securing the notes and the subsidiary guarantees; they are effectively subordinated to our and such subsidiary guarantors’ obligations under our senior secured revolving credit facility (as amended to date, the “Credit Agreement”) to the extent of the value of the collateral securing borrowings thereunder; and they are structurally subordinated to all obligations of our non‑guarantor subsidiaries.
The indentures setting forth the terms of our senior secured notes contain provisions governing our ability to redeem the notes and the terms by which we may do so. At our option, we may redeem our senior secured notes, in whole or in part, at any time at a redemption price equal to 100% of the principal amount of the notes redeemed plus the make‑whole premium set forth in the related indenture, together with accrued and unpaid interest thereon, if any, to the redemption date. Certain series of the senior secured notes may also be redeemed, in whole or in part, at certain redemption prices set forth in the applicable indentures, together with accrued and unpaid interest. In addition, we may be required to purchase for cash all or any part of each series of our senior secured notes upon the occurrence of a change of control (as defined in the applicable indentures) for a cash purchase price of 101% of the aggregate principal amount of the notes, plus accrued and unpaid interest.
All of our senior unsecured notes are general unsecured senior debt obligations that rank equally in right of payment with all of our other unsecured senior indebtedness, but are effectively subordinated to our senior secured notes described above, the obligations of our subsidiaries and any obligations under our Credit Agreement to the extent of the value of the collateral. We may redeem any series of our senior unsecured notes, in whole or in part, at any time at a redemption price equal
to 100% of the principal amount of the notes redeemed, plus a make‑whole premium specified in the applicable indenture, if any, together with accrued and unpaid interest to the redemption date.
Credit Agreement
Our Credit Agreement provides for revolving loans in an aggregate principal amount of up to $1.500 billion with a $200 million subfacility for standby letters of credit. We amended our Credit Agreement in April 2020 to increase our borrowing availability in response to the COVID-19 pandemic. This amendment, among other things, (1) increased the aggregate revolving credit commitments from the previous limit of $1.500 billion to $1.900 billion (the “Increased Commitments”), subject to borrowing availability, and (2) increased the advance rate and raise limits on certain eligible accounts receivable in the calculation of the borrowing base, in each case, for an incremental period of 364 days. In April 2021, we amended the Credit Agreement to, among other things, extend the availability of the Increased Commitmentsincremental borrowing capacity made temporarily available to us beginning in April 2020 (the “Increased Commitments”), which was schedule to expire in April 2021, through April 2022 and reduce the interest rate margins. In March 2022, we further amended our Credit Agreement to, among other things, (1) decrease the aggregate revolving credit commitments from the previous Increased Commitments to aggregate revolving credit commitments not to exceed $1.500
$1.500 billion, subject to borrowing availability, (2) extend the scheduled maturity date to March 16, 2027, and (3) replace the London Interbank Offered Rate (LIBOR) with the Term Secured Overnight Financing Rate (“SOFR”LIBOR”) and Daily Simple SOFR (each, as defined in the Credit Agreement) as the reference interest rate. At December 31, 2022,2023, we had no cash borrowings outstanding under the Credit Agreement, and we had less than $1 million of standby letters of credit outstanding. Based on our eligible receivables, $1.500 billion was available for borrowing at December 31, 2022.2023.
Outstanding revolving loans accrue interest depending on the type of loan at either (a) a base rate plus an applicable margin ranging from 0.25% to 0.75% per annum or (b) Term SOFR,Secured Overnight Financing Rate (“SOFR”), Daily Simple SOFR or the Euro Interbank Offered Rate (EURIBOR) (each, as defined in the Credit Agreement) plus an applicable margin ranging from 1.25% to 1.75% per annum and (in the case of Term SOFR and Daily Simple SOFR only) a credit spread adjustment of 0.10%, in each case based on available credit. An unused commitment fee payable on the undrawn portion of the revolving loans ranges from 0.25% to 0.375% per annum based on available credit. Our borrowing availability is based on a specified percentage of eligible inventory and accounts receivable, including self‑pay accounts.
Obligations under the Credit Agreement continue to be guaranteed by substantially all of our domestic wholly owned hospital subsidiaries and secured by a first‑priority lien on the eligible inventory and accounts receivable owned by us and the subsidiary guarantors, including receivables for Medicaid supplemental payments.
Letter of Credit Facility
We have a letter of credit facility (as amended to date, the “LC Facility”) that provides for the issuance, from time to time, of standby and documentary letters of credit in an aggregate principal amount of up to $200 million. TheWe amended the LC Facility in September 2023 to, among other things, (1) extend the scheduled maturity date of the LC Facility isfrom September 12, 2024. Obligations under2024 to March 16, 2027, and (2) replace LIBOR with Term SOFR as the LC Facility are guaranteed and secured by a first‑priority pledge of the capital stock and other ownership interests of certain of our wholly owned domestic hospital subsidiaries on an equal‑ranking basis with our senior secured first lien notes.
reference interest rate. Drawings under any letter of credit issued under the LC Facility that we have not reimbursed within three business days after notice thereof accrue interest at a base rate, as defined in the LC Facility, plus a margin of 0.50% per annum. An unused commitment fee is payable at an initial rate of 0.25% per annum with a step up to 0.375% per annum should our secured‑debt‑to‑EBITDA ratio equal or exceed 3.00 to 1.00 at the end of any fiscal quarter. A fee on the aggregate outstanding amount of issued but undrawn letters of credit accrues at a rate of 1.50% per annum. An issuance fee equal to 0.125% per annum of the aggregate face amount of each outstanding letter of credit is payable to the account of the issuer of the related letter of credit. The LC Facility is subject to an effective maximum secured debt covenant of 4.25 to 1.00. Obligations under the LC Facility are guaranteed and secured by a first‑priority pledge of the capital stock and other ownership interests of certain of our wholly owned domestic hospital subsidiaries on an equal‑ranking basis with our senior secured first lien notes. At December 31, 2022,2023, we had $116$111 million of standby letters of credit outstanding under the LC Facility and were in compliance with all applicable covenants and conditions.
Covenants
Senior Secured Notes—The indentures governing our senior secured notes contain covenants that, among other things, restrict our ability and the ability of our subsidiaries to incur liens, consummate asset sales, enter into sale and lease‑back transactions or consolidate, merge or sell all or substantially all of our or their assets, other than in certain transactions between one or more of our wholly owned subsidiaries. These restrictions, however, are subject to a number of exceptions and qualifications. In particular, there are no restrictions on our ability or the ability of our subsidiaries to incur additional indebtedness, make restricted payments, pay dividends or make distributions in respect of capital stock, purchase or redeem capital stock, enter into transactions with affiliates or make advances to, or invest in, other entities (including unaffiliated entities). In addition, the indentures governing our senior secured notes contain a covenant that neither we nor any of our
subsidiaries will incur secured debt, unless at the time of and after giving effect to the incurrence of such debt, the aggregate amount of all such secured debt (including the aggregate principal amount of senior secured notes outstanding and any outstanding borrowings under our Credit Agreement at such time) does not exceed the amount that would cause the secured debt ratio (as defined in the indentures) to exceed 4.00 to 1.00.
Senior Unsecured Notes—The indentures governing our senior unsecured notes contain covenants and conditions that have, among other requirements, limitations on (1) liens on “principal properties” and (2) sale and lease‑back transactions with respect to principal properties. A principal property is defined in the senior unsecured notes indentures as a hospital that has an asset value on our books in excess of 5% of our consolidated net tangible assets, as defined in such indentures. The above limitations do not apply, however, to (1) debt that is not secured by principal properties or (2) debt that is secured by principal properties if the aggregate of such secured debt does not exceed 15% of our consolidated net tangible assets, as further described in the indentures. The senior unsecured notes indentures also prohibit the consolidation, merger or sale of all or substantially all assets unless no event of default would result after giving effect to such transaction.
Credit Agreement—Our Credit Agreement contains customary covenants for an asset‑backed facility, including a minimum fixed charge coverage ratio to be met if the designated excess availability under the revolving credit facility falls
below $150 million, as well as limits on debt, asset sales and prepayments of certain other debt. The Credit Agreement also includes a provision, which we believe is customary in receivables‑backed credit facilities, that gives our lenders the right to require that proceeds of collections of substantially all of our consolidated accounts receivable be applied directly to repay outstanding loans and other amounts that are due and payable under the Credit Agreement at any time that unused borrowing availability under the revolving credit facility is less than $150 million for three consecutive business days or if an event of default has occurred and is continuing thereunder. In that event, we would seek to re‑borrow under the Credit Agreement to satisfy our operating cash requirements. Our ability to borrow under the Credit Agreement is subject to conditions that we believe are customary in revolving credit facilities, including that no events of default then exist.
Future Maturities
Future long‑term debt maturities, including finance lease obligations were as follows as of December 31, 2022:2023:
| | | | | | | | | | | | | | | | | | | | | | | | | | | | | | | | | | | | | | | | | |
| | | | Years Ending December 31, | | Later Years |
| | Total | | 2023 | | 2024 | | 2025 | | 2026 | | 2027 | |
| Long-term debt, including finance lease obligations | $ | 15,210 | | | $ | 145 | | | $ | 1,463 | | | $ | 77 | | | $ | 2,143 | | | $ | 3,012 | | | $ | 8,370 | |
| | | | | | | | | | | | | | | | | | | | | | | | | | | | | | | | | | | | | | | | | |
| | | | Years Ending December 31, | | Later Years |
| | Total | | 2024 | | 2025 | | 2026 | | 2027 | | 2028 | |
| Long-term debt, including finance lease obligations | $ | 15,123 | | | $ | 120 | | | $ | 92 | | | $ | 2,149 | | | $ | 3,029 | | | $ | 3,114 | | | $ | 6,619 | |
NOTE 9. GUARANTEES
Consistent with our policy on physician relocation and recruitment, we provide income guarantee agreements to certain physicians who agree to relocate to fill a community need in the service area of one of our hospitals and commit to remain in practice in the area for a specified period of time. Under such agreements, we are required to make payments to the physicians in excess of the amounts they earn in their practices up to the amount of the income guarantee. The income guarantee periods are typically 12 months. If a physician does not fulfill his or her commitment period to the community, which is typically three years subsequent to the guarantee period, we seek recovery of the income guarantee payments from the physician on a prorated basis. We also provide revenue collection guarantees to hospital‑based physician groups providing certain services at our hospitals with terms generally ranging from one to three years.
At December 31, 2022,2023, the maximum potential amount of future payments under our income guarantees to certain physicians who agree to relocate and revenue collection guarantees to hospital‑based physician groups providing certain services at our hospitals was $164$356 million. We had a total liability of $143$274 million recorded for these guarantees included in other current liabilities in the accompanying Consolidated Balance Sheet at December 31, 2022.2023.
At December 31, 2022,2023, we also had issued guarantees of the indebtedness and other obligations of our investees to third parties, the maximum potential amount of future payments under which was approximately $102$88 million. Of the total, $25$21 million relates to the obligations of consolidated subsidiaries, which obligations were recorded in other current liabilities in the accompanying Consolidated Balance Sheet at December 31, 2022.
NOTE 10. EMPLOYEE BENEFIT PLANS
Share-Based Compensation Plans
We have granted stock options and restricted stock units (“RSUs”) to certain of our employees and directors pursuant to our stock incentive plans. Stock options have an exercise price equal to the fair market value of the shares on the date of grant and generally expire 10 years from the date of grant. An RSU is a contractual right to receive one share of our common stock in the future, and the fair value of the RSU is based on our share price on the grant date. Typically, stock options and time‑based RSUs vest one‑third on each of the first three anniversary dates of the grant; however, certain special retention awards may have different vesting terms. Shares underlying vested RSUs are generally distributed to participants (settled) immediately after the vesting date. In addition, grants of RSUs to our non‑employee directors as part of their annual compensation vest immediately and are settled on the third anniversary of the date of grant, while initial grants made to directors vestvested immediately but will not settle uponuntil separation from the board. We did not make any new initial grants to a non‑employee director in either 2023 or 2022. Compensation cost is measured by the fair value of the awards on their grant dates and is recognized over the requisite service period of the awards, whether or not the awards had any intrinsic value during the period.
We also grant performance‑based RSUs that vest subject to the achievement of specified performance goals within a specified time frame. The performance‑based RSUs may contain provisions that increase or decrease the number of RSUs that ultimately vest, depending upon the level of achievement. For certain of our performance‑based awards, the number of options or RSUs that ultimately vest is also subject to adjustment based on the achievement of a market‑based condition. These adjustments generally range from 0% to 200% of the number of RSUs initially granted.granted for awards made prior to December 31, 2022, and from 0% to 225% for certain awards granted after that date. The fair value of awards that contain a
market‑based condition is estimated using a discrete model to analyze the fair value of the subject shares. The discrete model utilizes multiple stock paths, through the use of a Monte Carlo simulation, which paths are then analyzed to determine the fair value of the subject shares.
Pursuant to the terms of our stock‑based compensation plans, awards granted under the plan vest and may be exercised as determined by the human resources committee of our board of directors. In the event of a change in control, the human resources committee of our board of directors may, at its sole discretion without obtaining shareholder approval, accelerate the vesting or performance periods of the awards.
At December 31, 2022,2023, assuming outstanding performance‑based stock options and RSUs for which performance has not yet been determined will achieve target performance, approximately 9.5 million8,895 thousand shares of common stock were available under our 2019 Stock Incentive Plan for future stock option grants and other equity incentive awards, including RSUs. The accompanying Consolidated Statements of Operations include pre-tax compensation costs related to our stock‑based compensation arrangements of $66 million for the year ended December 31, 2023, and $56 million for each of the years ended December 31, 2022 and 2021, respectively, and $44 million for the year ended December 31, 2020.2021.
Stock Options
The following table summarizes stock option activity during the years ended December 31, 2023, 2022 and 2021:
| | | | | | | | | | | | | | | | | | | | | | | | | | |
| | | Number of Options | | Wtd. Avg.
Exercise Price
Per Share | | Aggregate
Intrinsic Value | | Wtd. Avg
Remaining Life |
| | | | | | | (In Millions) | | |
| Outstanding at December 31, 2020 | | 912,531 | | | $ | 22.51 | | | | | |
| Exercised | | (391,533) | | | $ | 20.66 | | | | | |
| | | | | | | | |
| Outstanding at December 31, 2021 | | 520,998 | | | $ | 23.90 | | | | | |
| Exercised | | (60,051) | | | $ | 28.26 | | | | | |
| Outstanding at December 31, 2022 | | 460,947 | | | $ | 23.33 | | | | | |
| | | | | | | | |
| Exercised | | (76,507) | | | $ | 26.07 | | | | | |
| | | | | | | | |
| Outstanding at December 31, 2023 | | 384,440 | | | $ | 22.79 | | | $ | 20 | | | 4.1 years |
| | | | | | | | |
| | | | | | | | |
The stock options exercised during both of the years ended December 31, 2023 and 2022 had aggregate intrinsic values of $4 million, and the stock options exercised during the year ended December 31, 2021 and 2020:
| | | | | | | | | | | | | | | | | | | | | | | | | | |
| | | Number of Options | | Wtd. Avg.
Exercise Price
Per Share | | Aggregate
Intrinsic Value | | Wtd. Avg
Remaining Life |
| | | | | | | (In Millions) | | |
| Outstanding at December 31, 2019 | | 1,960,992 | | | $ | 20.24 | | | | | |
| Exercised | | (987,471) | | | $ | 17.96 | | | | | |
| Forfeited/Expired | | (60,990) | | | $ | 23.28 | | | | | |
| Outstanding at December 31, 2020 | | 912,531 | | | $ | 22.51 | | | | | |
| Exercised | | (391,533) | | | $ | 20.66 | | | | | |
| Outstanding at December 31, 2021 | | 520,998 | | | $ | 23.90 | | | | | |
| | | | | | | | |
| Exercised | | (60,051) | | | $ | 28.26 | | | | | |
| | | | | | | | |
| Outstanding at December 31, 2022 | | 460,947 | | | $ | 23.33 | | | $ | 12 | | | 5.1 years |
| | | | | | | | |
| | | | | | | | |
had an aggregate intrinsic value of $15 million. No stock options were granted during the years ended December 31, 2023, 2022 2021 or 2020. There were 60,051, 391,533 and 987,471 stock options exercised during the years ended December 31, 2022, 2021, and 2020, respectively. The stock options exercised in 2022 had an aggregate intrinsic value of approximately $4 million, and options exercised during 2021 and 2020 both had aggregate intrinsic values of approximately $15 million. Allall outstanding options were vested and exercisable at December 31, 2022.
The following table summarizes information about our outstanding stock options at December 31, 2022:2023:
| | | |
| | | | | Options Outstanding and Exercisable | |
| Range of Exercise Prices | Range of Exercise Prices | | Number of
Options | | Wtd. Avg.
Remaining
Contractual Life | | Wtd. Avg.
Exercise Price | |
| Range of Exercise Prices | |
| Range of Exercise Prices | |
| $18.99 to $20.609 | |
| $18.99 to $20.609 | |
| $18.99 to $20.609 | $18.99 to $20.609 | | 293,796 | | | 4.6 years | | $ | 19.75 | | |
| $20.61 to $35.430 | $20.61 to $35.430 | | 167,151 | | | 6.0 years | | $ | 29.62 | | |
| $20.61 to $35.430 | |
| $20.61 to $35.430 | |
| | | | 460,947 | | | 5.1 years | | $ | 23.33 | | |
| | |
| | |
As of December 31, 2022, 42.3%2023, 30.8% of all our outstanding options were held by current employees and 57.7%69.2% were held by former employees. All of our outstanding options were in‑the‑money, that is, they had exercise price less than the $48.79$75.57 market price of our common stock on December 31, 2022.2023.
Compensation costs related to our stock-based compensation arrangements for the years ended December 31, 2021 and 2020 included $1 million and $2 million, respectively,
Restricted Stock Units
The following table summarizes RSU activity during the years ended December 31, 2023, 2022 2021 and 2020:2021:
| | | | | Restricted
Stock Units | | Wtd. Avg. Grant Date Fair
Value Per Unit | | | Restricted
Stock Units | | Wtd. Avg. Grant Date Fair
Value Per Unit |
| Unvested at December 31, 2019 | | 1,463,499 | | | $ | 25.08 | |
| Granted | | 1,767,730 | | | $ | 27.72 | |
| Vested | | (825,727) | | | $ | 25.66 | |
| Forfeited | | (310,296) | | | $ | 32.09 | |
| Unvested at December 31, 2020 | Unvested at December 31, 2020 | | 2,095,206 | | | $ | 25.87 | |
| Granted | Granted | | 900,018 | | | $ | 58.61 | |
| Vested | Vested | | (765,814) | | | $ | 30.51 | |
| Forfeited | Forfeited | | (58,208) | | | $ | 37.60 | |
| Unvested at December 31, 2021 | Unvested at December 31, 2021 | | 2,171,202 | | | $ | 40.51 | |
| Granted | Granted | | 641,205 | | | $ | 80.79 | |
| Vested | Vested | | (1,187,384) | | | $ | 37.18 | |
| Forfeited | Forfeited | | (104,605) | | | $ | 53.58 | |
| Unvested at December 31, 2022 | Unvested at December 31, 2022 | | 1,520,418 | | | $ | 66.36 | |
| Granted | |
| Performance-based adjustment | |
| Vested | |
| Forfeited | |
| Unvested at December 31, 2023 | |
DuringThe table below summarizes the time-based RSUs granted during the year ended December 31, 2022, we2023:
| | | | | | | | |
No. of RSUs Granted | | Vesting Terms |
| 309,282 | | RSUs will vest and be settled ratably over a three‑year period from the grant date |
| 42,626 | | RSUs will vest and be settled on the fifth anniversary of the grant date |
| 42,100 | | RSUs granted to our non-employee directors for the 2023-2024 board service year, which vested immediately and will be settled on the third anniversary of the grant date |
| 33,586 | | RSUs vested and settled in December 2023 |
| 20,707 | | RSUs will vest and be settled upon the relocation of one of our executive officers |
| 2,007 | | RSUs will vest and be settled on the third anniversary of the grant date |
The table below summarizes the performance-based RSUs granted an aggregate of 641,205 RSUs. Of these, 237,381 will vest ratably over a three‑during the year period from the grant date, 53,716 RSUs that were scheduled to vest ratably over 11 quarterly periods, 9,215 will vest ratably over a four‑year period from the grant date, 4,608 will vest on the second anniversary of the grant date, and 6,170 will vest evenly on the third and fourth anniversaries of the grant date. We also granted 35,482 RSUs to our non‑employee directors for the 2022-2023 board service year, which units vested and will settle as described above. In November 2022, we granted 7,325 to a non-executive member of the board of directors for their service as chairman of the board through the end of 2023. Unlike our normal grants to board members, these RSUs will vest onended December 31, 2023 if2023:
| | | | | | | | | | | | | | | | | | | | | | | | | | |
No. of RSUs Granted | | | | Performance Period | | Potential Vesting Range |
| Vesting Terms | | | Minimum | | Maximum |
| 301,562 | | RSUs will vest and be settled on the third anniversary of the grant date | | 2023 to 2025 | | — | % | | 225 | % |
| 185,901 | | RSUs vested and settled immediately as a result of our level of achievement with respect to performance‑based RSUs granted in 2020 | | | | | | |
| 7,720 | | RSUs will vest and be settled on the third anniversary of the grant date | | 2023 to 2025 | | — | % | | 200 | % |
The table below summarizes the grantee serves as chairman through that date.time-based RSUs granted during the year ended December 31, 2022:
| | | | | | | | |
No. of RSUs Granted | | Vesting Terms |
| 237,381 | | RSUs will vest and be settled ratably over a three‑year period from the grant date |
| 53,716 | | RSUs were scheduled to vest and be settled ratably over 11 quarterly periods |
| 35,482 | | RSUs granted to our non-employee directors for the 2022-2023 board service year vested immediately and will be settled on the third anniversary of the grant date |
| 9,215 | | RSUs will vest and be settled ratably over a four-year period from the grant date |
| 7,325 | | RSUs granted to a non-executive member of the board of directors for his service as chairman of the board; award vested and settled in December 2023 |
| 6,170 | | RSUs will vest and be settled evenly on the third and fourth anniversaries of the grant date |
| 4,608 | | RSUs will vest and be settled on the second anniversary of the grant date |
In addition, we granted 287,308 performance‑based RSUs during the year ended December 31, 2022; the vesting of these RSUs is contingent on our achievement of specified performance goals for the years 2022 to 2024. Provided the goals are achieved, the performance‑based RSUs will vest and be settled on the third anniversary of the grant date. The actual number of performance‑based RSUs that could vest will range from 0% to 200% of the 287,308 units granted, depending on our level of achievement with respect to the performance goals.
DuringThe table below summarizes the time-based RSUs granted during the year ended December 31, 2021 we2021:
| | | | | | | | |
No. of RSUs Granted | | Vesting Terms |
| 263,180 | | RSUs will vest and be settled ratably over a three-year period from the grant date |
| 189,215 | | RSUs were scheduled to vest and be settled ratably over eight quarterly periods from the grant date |
| 53,341 | | RSUs will vest and be settled on the fourth anniversary of the grant date |
| 38,366 | | RSUs granted to our non-employee directors for the 2021-2022 board service year, which vested immediately and will be settled on the third anniversary of the grant date |
| 33,351 | | RSUs will vest and be settled on the third anniversary of the grant date |
| 14,192 | | RSUs vested on December 31, 2021 and were settled in January 2022 |
| 8,509 | | RSUs, one-third of which will vest and be settled on the second anniversary of the grant date and the remainder of which will vest and be settled on the fourth anniversary |
| 1,372 | | RSUs granted to a new member of our board of directors, which vested immediately and will be settled upon separation from the board |
The table below summarizes the performance-based RSUs granted 561,788 RSUs that vest based on the passage of time. The granted RSUs vest as follows:
•263,180 RSUs vest and settle ratably over a three‑year period from the grant date;
•189,215 RSUs vest and settle ratably over eight quarterly periods from the grant date;
•53,341 RSUs vest and settle on the fourth anniversary of the grant date;
•33,351 RSUs vest and settle on the third anniversary of the grant date;
•14,192 RSUs vested on December 31, 2021 and settled in January 2022; and
•8,509 RSUs, one-third of which vest and settle on the second anniversary of the grant date and the remainder of which vest and settle on the fourth anniversary.
Duringduring the year ended December 31, 2021 we granted 298,492 performance-based RSUs which vest as follows:2021:
•244,259 RSUs vest and settle on the third anniversary of the grant date, contingent upon the achievement of performance goals for the years 2021 to 2023;
•53,341 RSUs vest and settle on the fourth anniversary of the grant date, contingent upon the achievement of performance goals for the years 2021 to 2025; and
•892 RSUs vested and settled immediately as a result of our level of achievement with respect to performance‑based RSUs granted in 2018.
The actual number of performance‑based RSUs that could vest will range from 0% to 200% of the 297,600 RSUs which did not vest immediately, depending upon our level of achievement with respect to the performance goals. During the year ended December 31, 2021, we also granted 39,738 RSUs to our non‑employee directors. These consisted of 36,681 RSUs for the 2021‑2022 board service year, 1,372 for an initial grant to a new member of our board of directors and 1,685 for a pro‑rata annual grant to the same new member. While RSUs granted to our board of directors vest immediately, annual grants settle on the third anniversary of the grant date and initial grants settle upon separation from the board.
During the year ended December 31, 2020 we granted 1,084,883 RSUs that vest based on the passage of time. The granted RSUs vest as follows:
•607,198 RSUs vest and settle ratably over a three‑year period from the grant date;
•359,713 RSUs vest and settle ratably over 11 quarterly periods from the grant date;
•104,167 RSUs vest and settle ratably over a four-year period from the grant date; and
•13,805 RSUs vest and settle on the third anniversary of the grant date.
During the year ended December 31, 2020 we granted 579,413 performance-based RSUs which vest as follows:
•499,285 RSUs vest and settle on the third anniversary of the grant date, contingent upon the achievement of performance goals for the years 2020 to 2022 and
•80,128 RSUs vest and settle on the fourth anniversary of the grant date, contingent upon the achievement of performance goals for the years 2020 to 2023, all of which were subsequently forfeited.
The actual number of performance‑based RSUs that could vest will range from 0% to 200% of the 499,285 remaining RSUs granted, depending upon our level of achievement with respect to the performance goals. In May 2020, we made an annual grant of 103,434 RSUs to our non‑employee directors for the 2020-2021 board service year, which units vested immediately and will settle in shares of our common stock on the third anniversary of the date of the grant. | | | | | | | | | | | | | | | | | | | | | | | | | | |
No. of RSUs Granted | | | | Performance Period | | Potential Vesting Range |
| Vesting Terms | | | Minimum | | Maximum |
| 244,259 | | RSUs will vest and be settled on the third anniversary of the grant | | 2021 to 2023 | | — | % | | 200 | % |
| 53,341 | | RSUs will vest and be settled on the fourth anniversary of the grant date | | 2021 to 2025 | | — | % | | 200 | % |
| 892 | | RSUs vested and settled immediately as a result of our level of achievement with respect to performance‑based RSUs granted in 2018 | | | | | | |
Included in the aforementioned aggregate numbers of2022 and 2021 time-based RSUs granted in 2022, 2021 and 2020RSU grants were 53,716 189,215 and 359,713189,215 RSUs, respectively, awardedgranted to our former Executive Chairman. The RSUs granted inFurthermore, of the total 2022 and 2020 were each scheduled to vest ratably over 11 quarterly periods, while the RSUs granted in 2021 were schedule to vest ratably over eight quarterly periods. Additionally, in the aforementioned aggregate number of performance-based RSUs, 53,716 were also granted in 2022 were 53,716to him. These RSUs awarded to our former Executive Chairman. The unvested portion of these grants vested and settled in October 2022, ahead of their scheduled vesting dates, in accordance with the disability provisions of theour stock incentive plan. The performance-based awards vested at 100%.
Compensation costs related to our stock-based compensation arrangements for the years ended December 31, 2023, 2022 and 2021 and 2020 included $46 million, $45 million and $42 million and $30 million of expensepre-tax compensation costs related to our RSUs, respectively. At December 31, 2022,2023, there were $33$42 million of total unrecognized compensation costs related to RSUs. These costs are expected to be recognized over a weighted average period of 1.82.1 years.
For certain of the performance-based RSU grants, the number of units that will ultimately vest is subject to adjustment based on the achievement of a market-based condition. The fair value of these RSUs is estimated through the use of a Monte Carlo simulation. Significant inputs used in our valuation of these RSUs included the following:
| | Years Ended December 31, |
| 2022 | | 2021 | | 2020 |
| | Years Ended December 31, | | | | Years Ended December 31, |
| | 2023 | | | | 2023 | | 2022 | | 2021 |
| Expected volatility | Expected volatility | | 39.6% - 68.1% | | 65.2% - 79.3% | | 54.7% | Expected volatility | | 53.6% - 65.6% | | 39.6% - 68.1% | | 65.2% - 79.3% |
| | Risk-free interest rate | Risk-free interest rate | | 1.0% - 1.7% | | 0.1% - 0.6% | | 1.2% |
| Risk-free interest rate | |
| Risk-free interest rate | | | 4.2% - 4.8% | | 1.0% - 1.7% | | 0.1% - 0.6% |
USPI Management Equity Plan
2015 USPI Management Equity Plan
In 2015, USPI adopted the USPI Holding Company, Inc. 2015 Stock Incentive Plan (“2015 USPImaintains a separate restricted stock plan (the “USPI Management Equity Plan”) under which it granted non-qualified options to purchase nonvoting shares of USPI’s outstanding common stock to eligible plan participants, allowing the recipient to participate in incremental growth in the value of USPI from the applicable grant date. Under the 2015 USPI Management Equity Plan, the total pool of options consisted of approximately 10% of USPI’s fully diluted outstanding common stock. Options had an exercise price equal to the estimated fair market value of USPI’s common stock on the date of grant. The option awards were structured such that they had a three or four year vesting period in which half of the award vested in equal pro-rata amounts over the applicable vesting period and the remaining half vested at the end of the applicable three or four year period. Any unvested awards were forfeited upon the participant’s termination of service with USPI, and vested options were required to have been exercised within 90 days of termination. Once an award was exercised and the requisite holding period met, the participant was eligible to sell the underlying shares to USPI at their estimated fair market value. Payment for USPI’s purchase of any eligible nonvoting common shares could be made in cash or in shares of Tenet’s common stock.
In February 2020, the 2015 USPI Management Equity Plan and all unvested options granted under the plan were terminated in accordance with the terms of the plan. USPI repurchased all vested options and all shares of USPI stock acquired upon exercise of an option for approximately $35 million.
2020 USPI Management Equity Plan
In February 2020, USPI adopted the USPI Holding Company, Inc. Restricted Stock Plan (“USPI Management Equity Plan”) to replace the terminated 2015 USPI Management Equity Plan. Under the USPI Management Equity Plan, USPI grants RSUs representing a contractual right to receive one share of USPI’s non‑voting common stock in the future. The vesting of RSUs granted under the plan varies based on the terms of the underlying award agreement. Once the RSUs have vested and the subsequent requisite holding period is met, during specified times, the participant can sell the underlying shares to USPI at their estimated fair market value. At our sole discretion, the purchase of any non‑voting common shares can be made in cash or in shares of Tenet’s common stock.
The following table summarizes RSU activity under USPI’s management equity planthe USPI Management Equity Plan during the years ended December 31, 2023, 2022 2021 and 2020:2021:
| | Restricted
Stock Units | | Wtd. Avg. Grant Date Fair
Value Per Unit |
| Inception of Plan | | | | |
| Granted | | 2,556,353 | | | $ | 34.13 | |
| Forfeited | | (531,297) | | | $ | 34.13 | |
| | Restricted
Stock Units | | | | Restricted
Stock Units | | Wtd. Avg. Grant Date Fair
Value Per Unit |
| Unvested at December 31, 2020 | Unvested at December 31, 2020 | | 2,025,056 | | | $ | 34.13 | |
| Granted | Granted | | 76,990 | | | $ | 34.13 | |
| Vested | Vested | | (388,588) | | | $ | 34.13 | |
| Forfeited | Forfeited | | (218,576) | | | $ | 34.13 | |
| Unvested at December 31, 2021 | Unvested at December 31, 2021 | | 1,494,882 | | | $ | 34.13 | |
| | Vested | Vested | | (369,691) | | | $ | 34.13 | |
| Vested | |
| Vested | |
| Forfeited | Forfeited | | (202,351) | | | $ | 34.13 | |
| Unvested at December 31, 2022 | Unvested at December 31, 2022 | | 922,840 | | | $ | 34.13 | |
| | Vested | |
| Vested | |
| Vested | |
| Forfeited | |
| Unvested at December 31, 2023 | |
USPI did not make any grants under the USPI Management Equity Plan during the yearyears ended December 31, 2023 and 2022. During the year ended December 31, 2021, USPI granted 76,990 RSUs under its management equity plan. Twenty percent of these RSUs vests on each of the first and second anniversaries of the grant date, and the remaining 60% vests on the third
anniversary of the grant date. In 2020, USPI granted 2,556,333 RSUs, 20% of which vest in each of the first three years on the anniversary of the grant date with the remaining 40% vesting on the fourth anniversary of the grant date.
During the years ended December 31, 2022 and 2021, USPI paid $11 million and $9 million, respectively, to repurchase portions of the non‑voting common stock shares issued under the USPI management equity plan. No shares were repurchased during the year ended December 31, 2020. At December 31, 2022, there were 98,374 outstanding vested shares of non‑voting common stock eligible to be sold to USPI.
At December 31, 2022, 922,8402023, 607,984 RSUs were outstanding under USPI’s management equity plan,the USPI Management Equity Plan, all of which are expected to vest. The accompanying Consolidated Statements of Operations for the years ended December 31, 2023, 2022 and 2021 and 2020 included $20 million, $11 million $13 million and $12$13 million, respectively, of pre-tax compensation costs related to USPI’s management equity plans.plan. During the years ended December 31, 2023, 2022 and 2021, USPI paid $13 million, $11 million and $9 million, respectively, to repurchase a portion of the non‑voting common stock previously issued under the USPI Management Equity Plan. At December 31, 2023, there were 51 thousand outstanding vested shares of non‑voting common stock eligible to be sold to USPI.
Other Employee Benefit and Retirement Plans
Employee Stock Purchase Plan
We have an employee stock purchase plan under which we are currently authorized to issue up to 4,070,3634,070 thousand shares of common stock to our eligible employees. As of December 31, 2022,2023, there were approximately 2.6 million2,501 thousand shares available for issuance under our employee stock purchase plan. Under the terms of the plan, eligible employees may elect to have between 1% and 10% of their base earnings withheld each quarter to purchase shares of our common stock. Shares are purchased at a price equal to 95% of the closing price on the last day of the quarter. The plan requires a one‑year holding period for all shares issued. The holding period does not apply upon termination of employment. Under the plan, no individual may purchase, in any year, shares with a fair market value in excess of $25,000. The plan is currently not considered to be compensatory.
We issued the following numbers of shares under our employee stock purchase plan:
| | | | | Years Ended December 31, | | | Years Ended December 31, |
| | | | 2022 | | 2021 | | 2020 | | | 2023 | | 2022 | | 2021 |
| Number of shares | | 98,498 | | | 89,865 | | | 254,767 | |
| Number of shares (in thousands) | |
| Weighted average price | Weighted average price | | $ | 54.19 | | | $ | 63.01 | | | $ | 19.97 | |
EmployeeDefined Contribution Retirement Plans
We maintain various other defined contribution plans for the benefit of our employees. During the years ended December 31, 2023, 2022 and 2021, we incurred total expenses from these plans of $126 million, $86 million and $98 million, respectively, primarily related to our contributions to the plans.
Substantially all of our employees, upon qualification, are eligible to participate in our defined contribution 401(k) plans. Under the plans, employees may contribute a portion of their eligible compensation, which we may match with employer contributions at our discretion. Employer matching contributions will vary depending on which of our subsidiaries employs the participant and whether the employee is covered under a collective bargaining agreement. Plan expenses, primarily related to our contributions to the plans, were $86 million, $98 million and $119 million for the years ended December 31, 2022, 2021 and 2020, respectively. Such amounts are reflected in salaries, wages and benefits in the accompanying Consolidated Statements
Defined Benefit Retirement Plans
We maintain three frozen non‑qualified defined benefit pension plans (“SERPs”) that provide supplemental retirement benefits to certain of our current and former executives. These plans are not funded, and plan obligations for these plans are paid from our working capital. Pension benefits are generally based on years of service and compensation. Upon completing the acquisition of Vanguard Health Systems, Inc. on October 1, 2013, we assumed a frozen qualified defined benefit plan (“DMC Pension Plan”) covering substantially all of the employees of our Detroit market that were hired prior to June 1, 2003. The benefits paid under the DMC Pension Plan are primarily based on years of service and final average earnings. During the year ended December 31, 2019, the Society of Actuaries issued a new mortality base table (Pri‑2012), which we incorporated into the estimates of our defined benefit plan obligations beginning December 31, 2019. During the year ended December 31, 2020, the Society of Actuaries issued the MP-2020 mortality improvement scale, which we incorporated into the estimates of our defined benefit plan obligations at December 31, 2020. During the year ended December 31, 2021, the Society of Actuaries issued the MP‑2021 mortality improvement scale, which we incorporated into the estimates of our defined benefit plan obligations at December 31, 20222023 and 2021.
The following tables summarize the balance sheet impact, as well as the benefit obligations, funded status and rate assumptions associated with the SERPs and the DMC Pension Plan based on actuarial valuations prepared:
| | | | | December 31, | | | December 31, |
| | | | 2022 | | 2021 | | | 2023 | | 2022 |
| Reconciliation of funded status of plans and the amounts included in the Consolidated Balance Sheets: | Reconciliation of funded status of plans and the amounts included in the Consolidated Balance Sheets: | | | | | Reconciliation of funded status of plans and the amounts included in the Consolidated Balance Sheets: | | |
Projected benefit obligations(1) | Projected benefit obligations(1) | | | | | Projected benefit obligations(1) | | |
| Beginning obligations | Beginning obligations | | $ | (1,313) | | | $ | (1,429) | |
| | Interest cost | Interest cost | | (37) | | | (36) | |
| Actuarial gain | | 265 | | | 42 | |
| Interest cost | |
| Interest cost | |
| Actuarial gain (loss) | |
| Benefits paid | Benefits paid | | 83 | | | 110 | |
| | Annuity purchase | |
| Special termination benefit costs | |
| Ending obligations | Ending obligations | | (1,002) | | | (1,313) | |
| Fair value of plans assets | Fair value of plans assets | | | | | Fair value of plans assets | | |
| Beginning plan assets | Beginning plan assets | | 867 | | | 869 | |
| Gain (loss) on plan assets | Gain (loss) on plan assets | | (161) | | | 62 | |
| Employer contribution | Employer contribution | | 2 | | | 22 | |
| Benefits paid | Benefits paid | | (60) | | | (86) | |
| Annuity purchase | |
| Ending plan assets | Ending plan assets | | 648 | | | 867 | |
| Funded status of plans | Funded status of plans | | $ | (354) | | | $ | (446) | |
| | Amounts recognized in the Consolidated Balance Sheets consist of: | |
| Amounts recognized in the Consolidated Balance Sheets consist of: | |
| Amounts recognized in the Consolidated Balance Sheets consist of: | | | |
| Other current liability | |
| Other long-term liability | |
| Accumulated other comprehensive loss | |
| | SERP Assumptions: | |
| SERP Assumptions: | |
| SERP Assumptions: | | | |
| Discount rate | | Discount rate | | 5.50 | % | | 5.75 | % |
| Compensation increase rate | | Compensation increase rate | | 3.00 | % | | 3.00 | % |
| Measurement date | | Measurement date | | December 31, 2023 | | December 31, 2022 |
| | DMC Pension Plan Assumptions: | |
| DMC Pension Plan Assumptions: | |
| DMC Pension Plan Assumptions: | | | |
| Discount rate | | Discount rate | | 5.25 | % | | 5.51 | % |
| Compensation increase rate | | Compensation increase rate | | Frozen |
| Measurement date | | Measurement date | | December 31, 2023 | | December 31, 2022 |
(1)The accumulated benefit obligation at December 31, 20222023 and 20212022 was approximately $1.002 billion$951 million and $1.311$1.002 billion, respectively.
| | | | | | | | | | | | | | |
| | | December 31, |
| | | 2022 | | 2021 |
| | | | |
| | | | |
| | | | |
| | | | |
| | | | |
| | | | |
| | | | |
| | | | |
| | | | |
| | | | |
| | | | |
| | | | |
| | | | |
| | | | |
| | | | |
| | | | |
| | | | |
| Amounts recognized in the Consolidated Balance Sheets consist of: | | | | |
| Other current liability | | $ | (23) | | | $ | (25) | |
| Other long-term liability | | $ | (331) | | | $ | (421) | |
| Accumulated other comprehensive loss | | $ | 222 | | | $ | 294 | |
| | | | |
| SERP Assumptions: | | | | |
| Discount rate | | 5.75 | % | | 3.00 | % |
| Compensation increase rate | | 3.00 | % | | 3.00 | % |
| Measurement date | | December 31, 2022 | | December 31, 2021 |
| | | | |
| DMC Pension Plan Assumptions: | | | | |
| Discount rate | | 5.51 | % | | 2.89 | % |
| Compensation increase rate | | Frozen | | Frozen |
| Measurement date | | December 31, 2022 | | December 31, 2021 |
The components of net periodic benefit costs and related assumptions are as follows:
| | | | | Years Ended December 31, | | | Years Ended December 31, |
| | | | 2022 | | 2021 | | 2020 | | | 2023 | | 2022 | | 2021 |
| | Interest costs | Interest costs | | $ | 37 | | | $ | 36 | | | $ | 47 | |
| Interest costs | |
| Interest costs | |
| Expected return on plan assets | Expected return on plan assets | | (42) | | | (53) | | | (48) | |
| Amortization of net actuarial loss | Amortization of net actuarial loss | | 9 | | | 11 | | | 9 | |
| | Special termination benefit costs | |
| Net periodic benefit cost (income) | Net periodic benefit cost (income) | | $ | 4 | | | $ | (6) | | | $ | 8 | |
| | SERP Assumptions: | |
| SERP Assumptions: | |
| SERP Assumptions: | SERP Assumptions: | | | | | | | | |
| Discount rate | Discount rate | | 3.00 | % | | 2.75 | % | | 3.50 | % | Discount rate | | 5.75 | % | | 3.00 | % | | 2.75 | % |
| | Compensation increase rate | Compensation increase rate | | 3.00 | % | | 3.00 | % | | 3.00 | % |
| Compensation increase rate | |
| Compensation increase rate | | | 3.00 | % | | 3.00 | % | | 3.00 | % |
| Measurement date | Measurement date | | January 1, 2022 | | January 1, 2021 | | January 1, 2020 | Measurement date | | January 1, 2023 | | January 1, 2022 | | January 1, 2021 |
| Census date | Census date | | January 1, 2022 | | January 1, 2021 | | January 1, 2020 | Census date | | January 1, 2023 | | January 1, 2022 | | January 1, 2021 |
| | DMC Pension Plan Assumptions: | |
| DMC Pension Plan Assumptions: | |
| DMC Pension Plan Assumptions: | DMC Pension Plan Assumptions: | | | | | | | | |
| Discount rate | Discount rate | | 2.89 | % | | 2.53 | % | | 3.60 | % | Discount rate | | 5.51 | % | | 2.89 | % | | 2.53 | % |
| Long-term rate of return on assets | Long-term rate of return on assets | | 5.00 | % | | 6.25 | % | | 6.25 | % | Long-term rate of return on assets | | 5.75 | % | | 5.00 | % | | 6.25 | % |
| Compensation increase rate | Compensation increase rate | | Frozen | | Frozen | | Frozen | Compensation increase rate | | Frozen |
| Measurement date | Measurement date | | January 1, 2022 | | January 1, 2021 | | January 1, 2020 | Measurement date | | January 1, 2023 | | January 1, 2022 | | January 1, 2021 |
| Census date | Census date | | January 1, 2022 | | January 1, 2021 | | January 1, 2020 | Census date | | January 1, 2023 | | January 1, 2022 | | January 1, 2021 |
Net periodic benefit costs for the current year are based on assumptions determined at the valuation date of the prior year for the SERPs and the DMC Pension Plan.
We recorded gain (loss) adjustments of $(2) million, $72 million $61 million and $(32)$61 million in other comprehensive income in the years ended December 31, 2023, 2022 2021 and 2020,2021, respectively, to recognize changes in the funded status of our SERPs and the DMC Pension Plan. Changes in the funded status are recorded as a direct increase or decrease to shareholders’ equity through accumulated other comprehensive loss. Net actuarial gains (losses) of $(9) million, $63 million $50 million and $(41)$50 million were recognized during the years ended December 31, 2023, 2022 2021 and 2020,2021, respectively, and the amortization of net actuarial loss of $7 million, $9 million $11 million and $9$11 million for the years ended December 31, 2023, 2022 2021 and 2020,2021, respectively, were recognized in other comprehensive income. Actuarial gains (losses) affecting the benefit obligation during the years ended December 31, 2023, 2022 2021 and 20202021 are primarily attributable to changes in the discount rate utilized for the SERP and DMC Pension Plan. Cumulative net actuarial losses totaled $224 million, $222 million $294 million and $355$294 million as of December 31, 2023, 2022 2021 and 2020,2021, respectively. There were no unrecognized prior service costs at December 31, 2023, 2022 2021 and 20202021 that had not yet been recognized as components of net periodic benefit cost.
To develop the expected long‑term rate of return on plan assets assumption, the DMC Pension Plan considers the current level of expected returns on risk‑free investments (primarily government bonds), the historical level of risk premium associated with the other asset classes in which the portfolio is invested and the expectations for future returns on each asset class. The expected return for each asset class is then weighted based on the target asset allocation to develop the expected long‑term rate of return on assets assumption for the portfolio.
The weighted‑average asset allocations by asset category as of December 31, 2022,2023, were as follows:
| | Target | | Actual |
| | Target | | | | Target | | Actual |
| Cash and cash equivalents | Cash and cash equivalents | | — | % | | 1 | % | Cash and cash equivalents | | — | % | | 1 | % |
| | Equity securities | Equity securities | | 20 | % | | 14 | % |
| Equity securities | |
| Equity securities | | | 20 | % | | 6 | % |
| Debt securities | Debt securities | | 73 | % | | 70 | % | Debt securities | | 73 | % | | 75 | % |
| Alternative investments | Alternative investments | | 7 | % | | 15 | % | Alternative investments | | 7 | % | | 18 | % |
The DMC Pension Plan assets are invested in public commingled vehicles, segregated separately managed accounts, and private commingled vehicles, all of which are managed by professional investment management firms. The objective for all asset categories is to maximize total return without assuming undue risk exposure. The DMC Pension Plan maintains a well‑diversified asset allocation that meets these objectives. The DMC Pension Plan assets are largely comprised of cash and cash equivalents, including but not limited to money market funds and repurchase agreements secured by U.S. Treasury or federal agency obligations, equity securities, including but not limited to the publicly traded shares of U.S. companies with
various market capitalizations in addition to international and convertible securities, debt securities including, but not limited to,
domestic and foreign government obligations, corporate bonds, and mortgage‑backed securities, and alternative investments. Alternative investments is a broadly defined asset category with the objective of diversifying the overall portfolio, complementing traditional equity and fixed‑income securities and improving the overall performance consistency of the portfolio. Alternative investments may include, but are not limited to, diversified hedge funds in the form of professionally managed pooled limited partnership investments and investments in private markets via professionally managed pooled limited partnership interests.
In each investment account, the DMC Pension Plan investment managers are responsible for monitoring and reacting to economic indicators, such as gross domestic product, consumer price index and U.S. monetary policy that may affect the performance of their account. The performance of all managers and the aggregate asset allocation are formally reviewed on a quarterly basis. The current asset allocation objective is to maintain a certain percentage within each asset class allowing for deviation within the established range for each asset class. The portfolio is rebalanced on an as‑needed basis to keep these allocations within the accepted ranges.
In general, fair values determined by Level 1 inputs utilize quoted prices (unadjusted) in active markets for identical assets or liabilities. We consider a security that trades at least weekly to have an active market. Fair values determined by Level 2 inputs utilize data points that are observable, such as quoted prices for similar assets, interest rates and yield curves. Fair values determined by Level 3 inputs areutilize unobservable data points for the asset or liability, and include situations where there is little, if any, market activity for the asset or liability.
The following tables summarize the DMC Pension Plan assets measured at fair value on a recurring basis as of December 31, 20222023 and 2021,2022, aggregated by the level in the fair value hierarchy within which those measurements are determined.
| | | | | | | | | | | | | | | | | | | | | | | | | | |
| | | December 31, 2022 | | Level 1 | | Level 2 | | Level 3 |
| Cash and cash equivalents | | $ | 7 | | | $ | 7 | | | $ | — | | | $ | — | |
| Equity securities | | 89 | | | 89 | | | — | | | — | |
| Debt Securities: | | | | | | | | |
| U.S. government obligations | | 200 | | | 200 | | | — | | | — | |
| Corporate debt securities | | 249 | | | 249 | | | — | | | — | |
| Alternative investments: | | | | | | | | |
| Private equity securities | | 78 | | | — | | | — | | | 78 | |
| Hedge funds | | 25 | | | — | | | — | | | 25 | |
| | | $ | 648 | | | $ | 545 | | | $ | — | | | $ | 103 | |
| | | | | | | | | | | | | | | | | | | | | | | | | | |
| | | December 31, 2021 | | Level 1 | | Level 2 | | Level 3 |
| Cash and cash equivalents | | $ | 11 | | | $ | 11 | | | $ | — | | | $ | — | |
| Equity securities | | 242 | | | 242 | | | — | | | — | |
| Debt Securities: | | | | | | | | |
| U.S. government obligations | | 67 | | | 67 | | | — | | | — | |
| Corporate debt securities | | 448 | | | 448 | | | — | | | — | |
| Alternative investments: | | | | | | | | |
| Private equity securities | | 57 | | | — | | | — | | | 57 | |
| Real estate securities | | 16 | | | 16 | | | — | | | — | |
| Hedge funds | | 26 | | | — | | | — | | | 26 | |
| | | $ | 867 | | | $ | 784 | | | $ | — | | | $ | 83 | |
| | | | | | | | | | | | | | | | | | | | | | | | | | |
| | Total | | Level 1 | | Level 2 | | Level 3 |
| | | | | | | | |
| As of December 31, 2023: | | | | | | | | |
| Cash and cash equivalents | | $ | 6 | | | $ | 6 | | | $ | — | | | $ | — | |
| Equity securities | | 39 | | | 39 | | | — | | | — | |
| Fixed income funds | | 442 | | | 442 | | | — | | | — | |
| Alternative investments: | | | | | | | | |
| Private equity securities | | 97 | | | — | | | — | | | 97 | |
| Hedge funds | | 8 | | | — | | | — | | | 8 | |
| | | $ | 592 | | | $ | 487 | | | $ | — | | | $ | 105 | |
| | | | | | | | |
| As of December 31, 2022: | | | | | | | | |
| Cash and cash equivalents | | $ | 7 | | | $ | 7 | | | $ | — | | | $ | — | |
| Equity securities | | 89 | | | 89 | | | — | | | — | |
| Debt Securities: | | | | | | | | |
| U.S. government obligations | | 200 | | | 200 | | | — | | | — | |
| Corporate debt securities | | 249 | | | 249 | | | — | | | — | |
| Alternative investments: | | | | | | | | |
| Private equity securities | | 78 | | | — | | | — | | | 78 | |
| | | | | | | | |
| Hedge funds | | 25 | | | — | | | — | | | 25 | |
| | $ | 648 | | | $ | 545 | | | $ | — | | | $ | 103 | |
The following table presents the estimated future benefit payments to be made from the SERPs and the DMC Pension Plan, a portion of which will be funded from plan assets, for the next five years and in the aggregate for the five years thereafter:
| | | | | | | | | | | | | | | | | | | | | | | | | | | | | | | | | | | | | | | | | | | | |
| | | | | Years Ending December 31, | | Five Years Thereafter |
| | | Total | | 2023 | | 2024 | | 2025 | | 2026 | | 2027 | |
| Estimated benefit payments | | $ | 822 | | | $ | 85 | | | $ | 85 | | | $ | 85 | | | $ | 85 | | | $ | 84 | | | $ | 398 | |
| | | | | | | | | | | | | | | | | | | | | | | | | | | | | | | | | | | | | | | | | | | | |
| | | | | Years Ending December 31, | | Five Years Thereafter |
| | | Total | | 2024 | | 2025 | | 2026 | | 2027 | | 2028 | |
| Estimated benefit payments | | $ | 789 | | | $ | 84 | | | $ | 84 | | | $ | 83 | | | $ | 82 | | | $ | 81 | | | $ | 375 | |
The SERP and DMC Pension Plan obligations of $354$359 million at December 31, 20222023 are classified in the accompanying Consolidated Balance Sheet as an other current liability of $23$24 million and defined benefit plan obligations of $331$335 million based on an estimate of the expected payment patterns. We expect to make total contributions to the plans of approximately $23$24 million for the year ending December 31, 2023.2024.
NOTE 11. PROPERTY AND EQUIPMENT
The principal components of property and equipment are shown in the table below:
| | | | December 31, | | December 31, |
| | | 2022 | | 2021 | | 2023 | | 2022 |
| Land | Land | $ | 661 | | | $ | 635 | |
| Buildings and improvements | Buildings and improvements | 6,646 | | | 6,652 | |
| Construction in progress | Construction in progress | 195 | | | 166 | |
| Equipment | Equipment | 4,748 | | | 4,455 | |
| Finance lease assets | Finance lease assets | 413 | | | 479 | |
| | | 12,663 | | | 12,387 | |
| Accumulated depreciation and amortization | Accumulated depreciation and amortization | (6,201) | | | (5,960) | |
| Net property and equipment | Net property and equipment | $ | 6,462 | | | $ | 6,427 | |
Property and equipment is stated at cost, less accumulated depreciation and amortization and impairment write‑downs related to assets held and used. We recognized depreciation expense of $696 million, $669 million $667 million and $685$667 million in the accompanying Consolidated Statements of Operations for the years ended December 31, 2023, 2022 2021 and 2020,2021, respectively.
NOTE 12. GOODWILL AND OTHER INTANGIBLE ASSETS
The following table provides information on changes in the carrying amount of goodwill:
| | December 31, | | | December 31, |
| | | | 2023 | | 2022 |
| Hospital Operations | | Hospital Operations | | | |
| Goodwill at beginning of period, net of accumulated impairment losses | |
| | | December 31, |
| | | 2022 | | 2021 |
| Hospital Operations | | | |
| Goodwill at beginning of period: | | | |
| Goodwill | $ | 5,238 | | | $ | 5,375 | |
| Accumulated impairment losses | (2,430) | | | (2,430) | |
| Goodwill acquired during the year | |
| | 2,808 | | | 2,945 | |
| Goodwill acquired during the year and purchase price allocation adjustments | 1 | | | — | |
| Goodwill transferred from Ambulatory Care segment | — | | | 41 | |
| | Goodwill acquired during the year | |
| | Goodwill acquired during the year | |
| | Goodwill related to assets held for sale and disposed | Goodwill related to assets held for sale and disposed | (3) | | | (178) | |
| Goodwill at end of period | $ | 2,806 | | | $ | 2,808 | |
| Goodwill related to assets held for sale and disposed | |
| Goodwill related to assets held for sale and disposed | |
| Goodwill at end of period, net of accumulated impairment losses | |
| | Goodwill at end of period: | | | |
| Goodwill | $ | 5,236 | | | $ | 5,238 | |
| Accumulated impairment losses | (2,430) | | | (2,430) | |
| Goodwill at end of period | $ | 2,806 | | | $ | 2,808 | |
| | Ambulatory Care | |
| | Ambulatory Care | |
| | | Ambulatory Care | Ambulatory Care | |
| Goodwill at beginning of period | Goodwill at beginning of period | $ | 5,848 | | | $ | 5,258 | |
| Goodwill at beginning of period | |
| Goodwill at beginning of period | |
| Goodwill acquired during the year and purchase price allocation adjustments | Goodwill acquired during the year and purchase price allocation adjustments | 866 | | | 664 | |
| Goodwill transferred to Hospital Operations segment | — | | | (41) | |
| | Goodwill related to assets held for sale and disposed or deconsolidated facilities | |
| Goodwill related to assets held for sale and disposed or deconsolidated facilities | |
| Goodwill related to assets held for sale and disposed or deconsolidated facilities | Goodwill related to assets held for sale and disposed or deconsolidated facilities | (2) | | | (33) | |
| Goodwill at end of period | Goodwill at end of period | $ | 6,712 | | | $ | 5,848 | |
| | Conifer | |
| Goodwill at beginning of period | $ | 605 | | | $ | 605 | |
| | Goodwill at end of period | $ | 605 | | | $ | 605 | |
|
There were no$2.430 billion of accumulated impairment losses related to the goodwill inof our Hospital Operations segment at both December 31, 2023 and 2022. There were no accumulated goodwill impairment losses related to our Ambulatory Care and Conifer segments at December 31, 2022 and 2021.segment in either period.
The following tables providetable provides information regarding other intangible assets:assets, which were included in the accompanying Consolidated Balance Sheets:
| | | | Gross
Carrying
Amount | | Accumulated
Amortization | | Net Book
Value | | Gross
Carrying
Amount | | Accumulated
Amortization | | Net Book
Value |
| At December 31, 2022: | | | | | |
| At December 31, 2023: | | At December 31, 2023: | | | |
| Other intangible assets with finite useful lives: | Other intangible assets with finite useful lives: | |
| Capitalized software costs | |
| Capitalized software costs | |
| Capitalized software costs | Capitalized software costs | $ | 1,751 | | | $ | (1,206) | | | $ | 545 | |
| Contracts | Contracts | 295 | | | (146) | | | 149 | |
| Other | Other | 92 | | | (76) | | | 16 | |
| Other intangible assets with finite lives | Other intangible assets with finite lives | 2,138 | | | (1,428) | | | 710 | |
| | Other intangible assets with indefinite useful lives: | Other intangible assets with indefinite useful lives: | |
| Other intangible assets with indefinite useful lives: | |
| Other intangible assets with indefinite useful lives: | |
| Trade names | |
| Trade names | |
| Trade names | Trade names | 105 | | | — | | | 105 | |
| Contracts | Contracts | 603 | | | — | | | 603 | |
| Other | Other | 6 | | | — | | | 6 | |
| Other intangible assets with indefinite lives | Other intangible assets with indefinite lives | 714 | | | — | | | 714 | |
| Other intangible assets, net | Other intangible assets, net | $ | 2,852 | | | $ | (1,428) | | | $ | 1,424 | |
| | | At December 31, 2021: | |
| At December 31, 2022: | |
| | At December 31, 2022: | |
| | At December 31, 2022: | |
| Other intangible assets with finite useful lives: | Other intangible assets with finite useful lives: | |
| Other intangible assets with finite useful lives: | |
| Other intangible assets with finite useful lives: | |
| Capitalized software costs | |
| Capitalized software costs | |
| Capitalized software costs | Capitalized software costs | $ | 1,770 | | | $ | (1,165) | | | $ | 605 | |
| Contracts | Contracts | 295 | | | (128) | | | 167 | |
| Other | Other | 95 | | | (81) | | | 14 | |
| Total other intangible assets with finite lives | Total other intangible assets with finite lives | 2,160 | | | (1,374) | | | 786 | |
| | Other intangible assets with indefinite useful lives: | Other intangible assets with indefinite useful lives: | |
| Other intangible assets with indefinite useful lives: | |
| Other intangible assets with indefinite useful lives: | |
| Trade names | |
| Trade names | |
| Trade names | Trade names | 102 | | | — | | | 102 | |
| Contracts | Contracts | 602 | | | — | | | 602 | |
| Other | Other | 7 | | | — | | | 7 | |
| Total other intangible assets with indefinite lives | Total other intangible assets with indefinite lives | 711 | | | — | | | 711 | |
| Total other intangible assets | $ | 2,871 | | | $ | (1,374) | | | $ | 1,497 | |
| Total other intangible assets, net | |
Estimated future amortization of intangiblesintangible assets with finite useful lives as ofat December 31, 20222023 was as follows:
| | | | | | | | | | | | | | | | | | | | | | | | | | | | | | | | | | | | | | | | | |
| | Total | | Years Ending December 31, | | Later Years |
| | | 2023 | | 2024 | | 2025 | | 2026 | | 2027 | |
| Amortization of intangible assets | $ | 710 | | | $ | 141 | | | $ | 117 | | | $ | 98 | | | $ | 81 | | | $ | 64 | | | $ | 209 | |
| | | | | | | | | | | | | | | | | | | | | | | | | | | | | | | | | | | | | | | | | |
| | Total | | Years Ending December 31, | | Later Years |
| | | 2024 | | 2025 | | 2026 | | 2027 | | 2028 | |
| Amortization of intangible assets | $ | 650 | | | $ | 132 | | | $ | 124 | | | $ | 99 | | | $ | 84 | | | $ | 61 | | | $ | 150 | |
We recognized amortization expense of $174 million, $172 million $188 million and $172$188 million in the accompanying Consolidated Statements of Operations for the years ended December 31, 2023, 2022 2021 and 2020,2021, respectively.
NOTE 13. OTHER ASSETS
The principal components of other current assets in the accompanying Consolidated Balance Sheets were as follows:
| | December 31, |
| | December 31, | | | | December 31, |
| | | | 2022 | | 2021 | | | 2023 | | 2022 |
| Prepaid expenses | Prepaid expenses | | $ | 400 | | | $ | 252 | |
| Contract assets | Contract assets | | 200 | | | 199 | |
| California provider fee program receivables | California provider fee program receivables | | 367 | | | 370 | |
| Receivables from other government programs | Receivables from other government programs | | 187 | | | 257 | |
| Guarantees | Guarantees | | 143 | | | 104 | |
| Non-patient receivables | Non-patient receivables | | 390 | | | 321 | |
| Other | Other | | 88 | | | 54 | |
| Other current assets | | $ | 1,775 | | | $ | 1,557 | |
| Total other current assets | |
The principal components of investments and other assets in the accompanying Consolidated Balance Sheets were as follows:
| | | | December 31, | | December 31, |
| | | 2022 | | 2021 | | 2023 | | 2022 |
| Marketable securities | Marketable securities | $ | 30 | | | $ | 9 | |
| Equity investments in unconsolidated healthcare entities | Equity investments in unconsolidated healthcare entities | 1,599 | | | 1,806 | |
| Total investments | Total investments | 1,629 | | | 1,815 | |
| Cash surrender value of life insurance policies | Cash surrender value of life insurance policies | 37 | | | 47 | |
| Long-term deposits | Long-term deposits | 56 | | | 57 | |
| California provider fee program receivables | California provider fee program receivables | 197 | | | 213 | |
| Operating lease assets | Operating lease assets | 1,129 | | | 1,002 | |
| Other long-term receivables and other assets | Other long-term receivables and other assets | 99 | | | 120 | |
| Investments and other assets | $ | 3,147 | | | $ | 3,254 | |
| Total investments and other assets | |
NOTE 14. ACCUMULATED OTHER COMPREHENSIVE LOSS
OurThe table below presents our accumulated other comprehensive loss was comprised of the following:by component:
| | | | December 31, | | December 31, |
| | | 2022 | | 2021 | | 2023 | | 2022 |
| Adjustments for defined benefit plans | Adjustments for defined benefit plans | $ | (178) | | | $ | (232) | |
| Foreign currency translation adjustments and other | — | | | (1) | |
| Unrealized gains on investments | Unrealized gains on investments | (3) | | | — | |
| | Accumulated other comprehensive loss | Accumulated other comprehensive loss | $ | (181) | | | $ | (233) | |
| Accumulated other comprehensive loss | |
| Accumulated other comprehensive loss | |
The following table presents the income tax expense (benefit) allocated to the adjustments forfrom each component of our defined benefit plans and unrealized gains on investments were approximately $18 million and $(1) million, respectively, for the year ended December 31, 2022, and the income tax expense allocated to the adjustments for our defined benefit plans was $14 million for the year ended December 31, 2021.other comprehensive income:
| | | | | | | | | | | |
| | December 31, |
| | 2023 | | 2022 |
| Adjustments for defined benefit plans | $ | — | | | $ | 18 | |
| | | |
| Foreign currency translation adjustments and other | — | | | (1) | |
| Net income tax expense related to items of other comprehensive income | $ | — | | | $ | 17 | |
NOTE 15. NET OPERATING REVENUES
Net operating revenues for our Hospital Operations and Ambulatory Care segments primarily consist of net patient service revenues, principally for patients covered by Medicare, Medicaid, managed care and other health plans, as well as certain uninsured patients under our Compact and other uninsured discount and charity programs. Net operating revenues for our ConiferHospital Operations segment primarily consist ofalso includes revenues from providing revenue cycle management and value‑based care services to hospitals, health systems, individual hospitalsphysician practices, employers and physician practices.other clients.
The table below showspresents our sources of net operating revenues from continuing operations:revenues:
| | Years Ended December 31, |
| 2022 | | 2021 | | 2020 |
| | Years Ended December 31, | | | | Years Ended December 31, |
| | 2023 | | | | 2023 | | 2022 | | 2021 |
| Hospital Operations: | Hospital Operations: | | | | | | |
| Net patient service revenues from hospitals and related outpatient facilities: | Net patient service revenues from hospitals and related outpatient facilities: | |
| Net patient service revenues from hospitals and related outpatient facilities: | |
| Net patient service revenues from hospitals and related outpatient facilities: | |
| Medicare | |
| Medicare | |
| Medicare | Medicare | | $ | 2,369 | | | $ | 2,615 | | | $ | 2,695 | |
| Medicaid | Medicaid | | 946 | | | 1,254 | | | 1,081 | |
| Managed care | Managed care | | 9,730 | | | 9,985 | | | 9,022 | |
| Uninsured | Uninsured | | 141 | | | 199 | | | 162 | |
| Indemnity and other | Indemnity and other | | 661 | | | 706 | | | 658 | |
| Total | Total | | 13,847 | | | 14,759 | | | 13,618 | |
Other revenues(1) | Other revenues(1) | | 1,214 | | | 1,223 | | | 1,172 | |
| Hospital Operations total prior to inter-segment eliminations | | 15,061 | | | 15,982 | | | 14,790 | |
| Total Hospital Operations | |
| Ambulatory Care | Ambulatory Care | | 3,248 | | | 2,718 | | | 2,072 | |
| Conifer | | 1,316 | | | 1,267 | | | 1,306 | |
| Inter-segment eliminations | | (451) | | | (482) | | | (528) | |
| | Net operating revenues | Net operating revenues | | $ | 19,174 | | | $ | 19,485 | | | $ | 17,640 | |
| | Net operating revenues | |
| | Net operating revenues | |
| | | | | | | | |
| | |
| (1) | Primarily revenue from physician practices revenues.and revenue cycle management. Revenue from revenue cycle management services is included in other revenues for all periods presented to conform with our new reporting segment structure. |
Revenues related to the Texas Comprehensive Hospital Increase Reimbursement Program (“CHIRP”) are presented in managed care net patient service revenues in the table above. Amounts we were assessed to support CHIRP following its approval in 2022 were presented in Medicaid revenues during that period, but have been reclassified to managed care revenues to conform to the current‑year presentation in the same payer group as the revenues to more clearly reflect the results of our participation in this program. Assessments to support CHIRP totaled $126 million and $123 million during the years ended December 31, 2023 and 2022, respectively.
Adjustments for prior‑year cost reports and related valuation allowances, principally related to Medicare and Medicaid, increased revenues in the years ended December 31, 2023, 2022 and 2021 and 2020 by $24 million, $10 million $26 million and $6$26 million, respectively. Estimated cost report settlements and valuation allowances were included in accounts receivable in the accompanying Consolidated Balance Sheets (see Note 3). We believe that we have made adequate provision for any adjustments that may result from final determination of amounts earned under all the above arrangements with Medicare and Medicaid.
The following table below showspresents the composition of net operating revenues for our Ambulatory Care segment:
| | | | | | | | | | | | | | | | | | | | |
| | Years Ended December 31, |
| | 2022 | | 2021 | | 2020 |
| Net patient service revenues | | $ | 3,115 | | | $ | 2,604 | | | $ | 1,960 | |
| Management fees | | 110 | | | 86 | | | 86 | |
| Revenue from other sources | | 23 | | | 28 | | | 26 | |
| Net operating revenues | | $ | 3,248 | | | $ | 2,718 | | | $ | 2,072 | |
The table below shows the composition of net operating revenues for our Conifer segment:
| | | | | | | | | | | | | | | | | | | | |
| | Years Ended December 31, |
| | 2022 | | 2021 | | 2020 |
| Revenue cycle services – Tenet | | $ | 439 | | | $ | 467 | | | $ | 514 | |
| Revenue cycle services – other customers | | 786 | | | 705 | | | 700 | |
| Other services – Tenet | | 12 | | | 15 | | | 14 | |
| Other services – other customers | | 79 | | | 80 | | | 78 | |
| Net operating revenues | | $ | 1,316 | | | $ | 1,267 | | | $ | 1,306 | |
| | | | | | | | | | | | | | | | | | | | |
| | Years Ended December 31, |
| | 2023 | | 2022 | | 2021 |
| | | | | | |
| Net patient service revenues | | $ | 3,713 | | | $ | 3,115 | | | $ | 2,604 | |
| Management fees | | 123 | | | 110 | | | 86 | |
| Revenue from other sources | | 29 | | | 23 | | | 28 | |
| Net operating revenues | | $ | 3,865 | | | $ | 3,248 | | | $ | 2,718 | |
Performance Obligations
The following table includes Conifer’s revenue from revenue cycle management services that is expected to be recognized in the future related to performance obligations that are unsatisfied, or partially unsatisfied, at the end of the reporting period. The amounts in the table primarily consist of revenue cycle management fixed fees, which are typically recognized ratably as the performance obligation is satisfied. The estimated revenue does not include volume‑ or contingency‑based contracts, variable‑based escalators, performance incentives, penalties or other variable consideration that is considered constrained. Conifer’sOur contract with Catholic Health Initiatives (“CHI”), a minority interest owner of Conifer Health Solutions, LLC, represents the majority of the fixed‑fee revenue related to remaining performance obligations. Conifer’s contract term with CHI ends December 31, 2032.
| | | | | | | | | | | | | | | | | | | | | | | | | | | | | | | | | | | | | | | | | | | | |
| | | | | Years Ending December 31, | | Later Years |
| | | Total | | 2023 | | 2024 | | 2025 | | 2026 | | 2027 | |
| Performance obligations | | $ | 5,729 | | | $ | 642 | | | $ | 565 | | | $ | 565 | | | $ | 565 | | | $ | 565 | | | $ | 2,827 | |
| | | | | | | | | | | | | | | | | | | | | | | | | | | | | | | | | | | | | | | | | | | | |
| | | | | Years Ending December 31, | | Later Years |
| | | Total | | 2024 | | 2025 | | 2026 | | 2027 | | 2028 | |
| Performance obligations | | $ | 6,026 | | | $ | 685 | | | $ | 684 | | | $ | 683 | | | $ | 683 | | | $ | 683 | | | $ | 2,608 | |
NOTE 16. INSURANCE
Property Insurance
We have property, business interruption and related insurance coverage to mitigate the financial impact of catastrophic events or perils that is subject to deductible provisions based on the terms of the policies. These policies are issued on an occurrence basis. For the policy period of April 1, 20222023 through March 31, 2023,2024, we have coverage totaling $850 million per occurrence, after deductibles and exclusions, with annual aggregate sub‑limits of $100 million for floods, $200 million for earthquakes in California, $200 million for all other earthquakes and a per‑occurrence sub‑limit of $200 million forper named windstormswindstorm with no annual aggregate. With respect to fires and other perils, excluding floods, earthquakes and named windstorms, the total $850 million limit of coverage per occurrence applies. Deductibles are 5% of insured values up to a maximum of $25 million for California earthquakes $25 million for floodsin California and named windstorms, and 2% of insured values for earthquakes in the New Madrid fault earthquakes,zone, each with a maximum per‑deductible per claim deductible of $25 million. Floods and certainAll other covered losses including fires and other perils, haveare subject to a minimum deductible of $5 million.million per occurrence.
We also purchase cyber liability insurance from third parties. In April 2022, we experienced a cybersecurity incident that temporarily disrupted a subset of our acute carehospital operations and involved the exfiltration of certain confidential company and patient information (the “Cybersecurity Incident”).information. We estimate that the Cybersecurity Incident had an adverse pre‑tax impactreceived $41 million and $14 million of approximately $100 millioninsurance recoveries related to this cybersecurity incident during the yearyears ended December 31, 2022. This estimate includes the costs to remediate the issues, lost revenues from the associated business interruption2023 and other related expenses. We have filed a claim within our policy limits. Insurance recoveries2022, respectively; of $14these amounts, we recorded $34 million related to this claim were received during the year ended December 31, 2022,and $6 million of which were recorded as net operating revenues.revenues during 2023 and 2022, respectively.
Professional and General Liability Reserves
We are self‑insured for the majority of our professional and general liability claims, and we purchase insurance from third‑parties to cover catastrophic claims. At both December 31, 20222023 and 2021,2022, the aggregate current and long‑term professional and general liability reserves in the accompanying Consolidated Balance Sheets was $1.046 billion and $1.045 billion.billion, respectively. These reservesaccruals include the reserves recorded by our captive insurance subsidiaries and our self‑insured retention reserves recorded based on modeled estimates for the portion of our professional and general liability risks, including incurred but not reported claims, for which we do not have insurance coverage.
Commercial insurance we purchase is subject to per‑claim and policy period aggregate limits. If the policy period aggregate limit of any of our policies is exhausted, in whole or in part, it could deplete or reduce the limits available to pay other material claims applicable to that policy period.
Malpractice expense of $369 million, $276 million $355 million and $320$355 million was included in other operating expenses, net, in the accompanying Consolidated Statements of Operations for the years ended December 31, 2023, 2022 2021 and 2020,2021, respectively, of which $116 million, $74 million $131 million and $120$131 million, respectively, related to adverse claims development for prior years.
NOTE 17. CLAIMS AND LAWSUITS
We operate in a highly regulated and litigious industry. Healthcare companies are subject to numerous investigations by various governmental agencies. Further, private parties have the right to bring qui tam or “whistleblower” lawsuits against companies that allegedly submit false claims for payments to, or improperly retain overpayments from, the government and, in some states, private payers. We and our subsidiaries have received inquiries in recent years from government agencies, and we may receive similar inquiries in future periods. We are also subject to class action lawsuits, employment‑related claims and other legal actions in the ordinary course of business. Some of these actions may involve large demands, as well as substantial
defense costs. We cannot predict the outcome of current or future legal actions against us or the effect that judgments or settlements in such matters may have on us.
We record accruals for estimated losses relating to claims and lawsuits when available information indicates that a loss is probable and we can reasonably estimate the amount of the loss or a range of loss. Significant judgment is required in both the determination of the probability of a loss and the determination as to whether a loss is reasonably estimable. These determinations are updated at least quarterly and are adjusted to reflect the effects of negotiations, settlements, rulings, advice of legal counsel and technical experts, and other information and events pertaining to a particular matter, but are subject to significant uncertainty regarding numerous factors that could affect the ultimate loss levels. If a loss on a material matter is reasonably possible and estimable, we disclose an estimate of the loss or a range of loss. In cases where we have not disclosed an estimate, we have concluded that the loss is either not reasonably possible or the loss, or a range of loss, is not reasonably estimable, based on available information. Given the inherent uncertainties associated with these matters, especially those involving governmental agencies, and the indeterminate damages sought in some cases, we are unable to predict the ultimate liability we may incur from these matters, and an adverse outcome in one or more of these matters could be material to our results of operations or cash flows for any particular reporting period.
Government Investigation of Detroit Medical Center
Detroit Medical Center (“DMC”) is subject to an ongoing investigation commenced in October 2017 by the U.S. Attorney’s Office for the Eastern District of Michigan and the Civil Division of the U.S. Department of Justice (“DOJ”) for potential violations of the Stark law, the Medicare and Medicaid anti‑kickback and antifraud and abuse amendments codified under Section 1128B(b) of the Social Security Act, and the federal False Claims Act related to DMC’s employment of nurse practitioners and physician assistants (“Mid‑Level Practitioners”) from 2006 through 2017. As previously disclosed, a media report was published in August 2017 alleging that 14 Mid‑Level Practitioners were terminated by DMC earlier in 2017 due to compliance concerns. The DOJ issued a civil investigative demand to DMC for documents and interrogatories in September 2021. In January 2023, we reached a settlement in principle with the DOJ to resolve this matter, subject to certain conditions, and were fully reserved for such potential settlement at December 31, 2022.
Other Matters
In July 2019, certain of the entities that purchased the operations of Hahnemann University Hospital and St. Christopher’s Hospital for Children in Philadelphia from us commenced Chapter 11 bankruptcy proceedings. In the three months ended December 31, 2021, we established a reserve of $23 million for certain obligations related to the sale of the hospitals and the subsequent bankruptcy proceedings of the buyers. In the six months ended June 30, 2022, we made advance payments of approximately $1 million. In the three months ended September 30, 2022, the bankruptcy court approved a final settlement among the parties, and we made the remaining $22 million in payments to fully resolve this matter.
We are also subject to claims and lawsuits arising in the ordinary course of business, including potential claims related to, among other things, the care and treatment provided at our hospitals and outpatient facilities, the application of various federal and state labor and privacy laws, tax audits and other matters. Although the resultsSome of these claims and lawsuitsactions may involve large demands, as well as substantial defense costs. We cannot be predicted with certainty,predict the outcome of current or future legal actions against us or the effect that judgments or settlements in such matters may have on us; however, we believe that the ultimate resolution of these ordinary our existing ordinary‑course claims and lawsuits will not have a material effect on our business or financial condition.
New claims or inquiries may be initiated against us from time to time. These matters could (1) require us to pay substantial damages or amounts in judgments or settlements, which, individually or in the aggregate, could exceed amounts, if any, that may be recovered under our insurance policies where coverage applies and is available, (2) cause us to incur substantial expenses, (3) require significant time and attention from our management, and (4) cause us to close or sell hospitals or otherwise modify the way we conduct business.
We record accruals for estimated losses relating to claims and lawsuits when available information indicates that a loss is probable and we can reasonably estimate the amount of the loss or a range of loss. Significant judgment is required in both the determination of the probability of a loss and the determination as to whether a loss is reasonably estimable. These
determinations are updated at least quarterly and are adjusted to reflect the effects of negotiations, settlements, rulings, advice of legal counsel and technical experts, and other information and events pertaining to a particular matter, but are subject to significant uncertainty regarding numerous factors that could affect the ultimate loss levels. If a loss on a material matter is reasonably possible and estimable, we disclose an estimate of the loss or a range of loss. We do not disclose an estimate when we have concluded that a loss is either not reasonably possible or a loss, or a range of loss, is not reasonably estimable, based on available information. Given the inherent uncertainties associated with material legal matters, especially those involving governmental agencies, and the indeterminate damages sought in some cases, we are unable to predict the ultimate liability we may incur from such matters, and an adverse outcome in one or more of these matters could be material to our results of operations or cash flows for any particular reporting period.
The following table presents reconciliations of the beginning and ending liability balances in connection with legal settlements and related costs recorded in continuing operations:costs:
| | | | | | | | | | | | | | | | | | | | | | | | | | | | | |
| | Balances at
Beginning
of Period | | Litigation and
Investigation
Costs | | Cash
Payments | | Other | | Balances at
End of
Period |
| Year Ended December 31, 2022 | $ | 78 | | | $ | 70 | | | $ | (100) | | | $ | 3 | | | $ | 51 | |
| Year Ended December 31, 2021 | $ | 26 | | | $ | 116 | | | $ | (59) | | | $ | (5) | | | $ | 78 | |
| Year Ended December 31, 2020 | $ | 86 | | | $ | 44 | | | $ | (108) | | | $ | 4 | | | $ | 26 | |
| | | | | | | | | | | | | | | | | | | | | | | | | | | | | |
| | Balances at
Beginning
of Period | | Litigation and
Investigation
Costs | | Cash
Payments | | Other | | Balances at
End of
Period |
| Year Ended December 31, 2023 | $ | 51 | | | $ | 47 | | | $ | (59) | | | $ | 1 | | | $ | 40 | |
| Year Ended December 31, 2022 | $ | 78 | | | $ | 70 | | | $ | (100) | | | $ | 3 | | | $ | 51 | |
| Year Ended December 31, 2021 | $ | 26 | | | $ | 116 | | | $ | (59) | | | $ | (5) | | | $ | 78 | |
NOTE 18. REDEEMABLE NONCONTROLLING INTERESTS IN EQUITY OF CONSOLIDATED SUBSIDIARIES
OurWe had a put/call agreement (the “Baylor Put/Call Agreement”) with Baylor that contained put and call options with respect to the 5% voting ownership interest Baylor previously held in USPI until June 30, 2022. The Baylor Put/Call Agreement gave Baylor the option to annually put up to one-third of its total shares in USPI (the “Baylor Shares”) over a period of three years beginning in 2021. We had the right to call the difference between the number of shares Baylor put each year and the maximum number of shares it could have put.USPI. Based on the nature of the Baylor Put/Call Agreement, Baylor’s minority interest in USPI was classified as a redeemable noncontrolling interest in the accompanying Consolidated Balance Sheet at December 31, 2021. During the years ended December 31, 2022 and 2021, we recognized accretion totaling $102 million and $8 million, respectively, and a corresponding decrease in additional paid-in capital related to Baylor’s minority interest in USPI.our consolidated balance sheet.
In each of 2021 and 2022, we notified Baylor of our intention to exercise our call option to purchase 33.3% of the Baylor Shares for that year (66.6% in total). In June 2022, we entered into an agreement with Baylor (the “Share Purchase Agreement”) to complete the purchase of the Baylor Shares we called in 2021 and 2022 and to accelerate the acquisition of the remaining Baylor Shares eligible to be put/called in 2023. Under the terms of the Share Purchase Agreement, we agreed to pay Baylor $406 million to buy itsBaylor’s entire 5% voting ownership interest in USPI.for $406 million. We paid $11 million upon execution of the Share Purchase Agreementshare purchase agreement and are obligated to make a total of 35 additional non-interest bearingnon-interest-bearing monthly payments of approximately $11 million, which payments commenced in August 2022. WeIn June 2022, we recorded the present value of the purchase price as a liability on our balance sheet, with an offset to redeemable noncontrolling interest of $365 million for the carrying amount of the shares and $23 million to additional paid‑in capital for the difference between the carrying value and present value of the purchase price for the shares. At both December 31, 2023 and 2022, we had liabilitiesa liability of $135 million recorded in other current liabilities in the accompanying Consolidated Balance Sheets for the purchase of these shares. The long-term portion of our obligation related to the share repurchase was $63 million and $190 million at December 31, 2023 and 2022, respectively, which amounts were included in other long-term liabilities in the accompanying Consolidated Balance Sheet for the purchase of these shares.Sheets.
The following table shows the changes in redeemable noncontrolling interests in equity of consolidated subsidiaries:
| | | | December 31, | | December 31, |
| | | 2022 | | 2021 | | 2023 | | 2022 |
Balances at beginning of period | Balances at beginning of period | $ | 2,203 | | | $ | 1,952 | |
| Net income | Net income | 348 | | | 336 | |
| Distributions paid to noncontrolling interests | Distributions paid to noncontrolling interests | (331) | | | (217) | |
| Accretion of redeemable noncontrolling interests | Accretion of redeemable noncontrolling interests | 104 | | | 11 | |
| Purchases and sales of businesses and noncontrolling interests, net | Purchases and sales of businesses and noncontrolling interests, net | (175) | | | 121 | |
Balances at end of period | Balances at end of period | $ | 2,149 | | | $ | 2,203 | |
The following tables show the composition by segment of our redeemable noncontrolling interests balances, as well as our net income available to redeemable noncontrolling interests:
| | | | | | | | | | | | | | |
| | December 31, |
| | | 2022 | | 2021 |
| Hospital Operations | | $ | 233 | | | $ | 297 | |
| Ambulatory Care | | 1,357 | | | 1,425 | |
| Conifer | | 559 | | | 481 | |
| Redeemable noncontrolling interests | | $ | 2,149 | | | $ | 2,203 | |
| | | | Years Ended December 31, |
| | December 31, | | | | December 31, |
| | | | 2022 | | 2021 | | 2020 | | | 2023 | | 2022 |
| Hospital Operations | Hospital Operations | | $ | 23 | | | $ | 24 | | | $ | (33) | |
| Ambulatory Care | Ambulatory Care | | 248 | | | 243 | | | 153 | |
| Conifer | | 77 | | | 69 | | | 66 | |
| Net income available to redeemable noncontrolling interests | | $ | 348 | | | $ | 336 | | | $ | 186 | |
| | Redeemable noncontrolling interests | |
| Redeemable noncontrolling interests | |
| Redeemable noncontrolling interests | |
| | | | | | | | | | | | | | | | | | | | |
| | | Years Ended December 31, |
| | | 2023 | | 2022 | | 2021 |
| Hospital Operations | | $ | 84 | | | $ | 100 | | | $ | 93 | |
| Ambulatory Care | | 282 | | | 248 | | | 243 | |
| | | | | | |
| Net income available to redeemable noncontrolling interests | | $ | 366 | | | $ | 348 | | | $ | 336 | |
NOTE 19. INCOME TAXES
The provision for income taxes for continuing operations for the years ended December 31, 2023, 2022 2021 and 20202021 consisted of the following:
| | | | Years Ended December 31, | | Years Ended December 31, |
| | | 2022 | | 2021 | | 2020 | | 2023 | | 2022 | | 2021 |
| Current tax expense: | Current tax expense: | | | | | | Current tax expense: | | | |
| Federal | Federal | $ | 78 | | | $ | 50 | | | $ | — | |
| State | State | 57 | | | 111 | | | 30 | |
| | | 135 | | | 161 | | | 30 | |
| Deferred tax expense (benefit): | Deferred tax expense (benefit): | | | | | | Deferred tax expense (benefit): | | | |
| Federal | Federal | 174 | | | 267 | | | (131) | |
| State | State | 35 | | | (17) | | | 4 | |
| | | 209 | | | 250 | | | (127) | |
| | | $ | 344 | | | $ | 411 | | | $ | (97) | |
A reconciliation between the amount of reported income tax expense (benefit) and the amount computed by multiplying income from continuing operations before income taxes by the statutory federal tax rate is presented below. Foreign pre-tax loss was $3 million, $8 million $5 million and $13$5 million for the years ended December 31, 2023, 2022 2021 and 2020,2021, respectively.
| | | | Years Ended December 31, | | Years Ended December 31, |
| | | 2022 | | 2021 | | 2020 | | 2023 | | 2022 | | 2021 |
| Tax expense at statutory federal rate of 21% | Tax expense at statutory federal rate of 21% | $ | 282 | | | $ | 396 | | | $ | 141 | |
| State income taxes, net of federal income tax benefit | State income taxes, net of federal income tax benefit | 64 | | | 77 | | | 33 | |
| | Tax benefit attributable to noncontrolling interests | Tax benefit attributable to noncontrolling interests | (122) | | | (114) | | | (75) | |
| Tax benefit attributable to noncontrolling interests | |
| Tax benefit attributable to noncontrolling interests | |
| Nondeductible goodwill | Nondeductible goodwill | 1 | | | 35 | | | — | |
| Nondeductible executive compensation | Nondeductible executive compensation | 10 | | | 8 | | | 6 | |
| Impact of change in state filing method, net of change in unrecognized tax benefit | |
| Nondeductible litigation costs | Nondeductible litigation costs | — | | | 1 | | | — | |
| Expired charitable contribution carryforward | — | | | — | | | 1 | |
| | Stock-based compensation tax benefit | Stock-based compensation tax benefit | (6) | | | (5) | | | (2) | |
| | Stock-based compensation tax benefit | |
| | Stock-based compensation tax benefit | |
| Changes in valuation allowance | Changes in valuation allowance | 120 | | | 2 | | | (226) | |
| | Prior-year provision to return adjustments and other changes in deferred taxes | Prior-year provision to return adjustments and other changes in deferred taxes | (12) | | | 8 | | | 14 | |
| Other items | Other items | 7 | | | 3 | | | 10 | |
| Income tax expense (benefit) | $ | 344 | | | $ | 411 | | | $ | (97) | |
| Income tax expense | |
A change in the business interest expense disallowance rules took effect in 2022, resulting in a larger amount of interest disallowance compared to prior years.
The COVID Acts included a significant number of tax provisions applicable to individuals and businesses. For businesses, the COVID Acts made changes to the U.S. tax code relating to, among other things: (1) the business interest expense disallowance rules for 2019 and 2020; (2) net operating loss rules; (3) charitable contribution limitations; and (4) the realization of corporate alternative minimum tax credits. As a result of the change in the business interest expense disallowance rules, we recorded an income tax benefit of $88 million during the year ended December 31, 2020 to decrease the valuation allowance for interest expense carryforwards due to the additional deduction of interest expense.
In September 2020, we filed an application with the Internal Revenue Service (“IRS”) to change our method of accounting for certain capitalized costs on our 2019 tax return. This change in tax accounting method resulted in additional interest expense being allowed on the 2019 and 2020 tax returns. We reduced our valuation allowance by an additional $126 million in the year ended December 31, 2020 related to the change in accounting method.
Deferred income taxes reflect the tax effects of temporary differences between the carrying amount of assets and liabilities for financial reporting purposes and the amount used for income tax purposes. The following table discloses those significant components of our deferred tax assets and liabilities, including any valuation allowance:
| | | | December 31, 2022 | | December 31, 2021 | | December 31, 2023 | | December 31, 2022 |
| | | Assets | | Liabilities | | Assets | | Liabilities | | Assets | | Liabilities | | Assets | | Liabilities |
| Depreciation and fixed-asset differences | Depreciation and fixed-asset differences | $ | — | | | $ | 436 | | | $ | — | | | $ | 532 | |
| Reserves related to discontinued operations and restructuring charges | Reserves related to discontinued operations and restructuring charges | 5 | | | — | | | 2 | | | — | |
| Receivables (doubtful accounts and adjustments) | Receivables (doubtful accounts and adjustments) | 246 | | | — | | | 215 | | | — | |
| Medicare advance payments | Medicare advance payments | — | | | — | | | 209 | | | — | |
| Accruals for retained insurance risks | Accruals for retained insurance risks | 227 | | | — | | | 234 | | | — | |
| Intangible assets | Intangible assets | — | | | 416 | | | — | | | 396 | |
| Other long-term liabilities | Other long-term liabilities | 27 | | | — | | | 23 | | | — | |
| Benefit plans | Benefit plans | 207 | | | — | | | 242 | | | — | |
| Other accrued liabilities | Other accrued liabilities | 30 | | | — | | | 56 | | | — | |
| Investments and other assets | Investments and other assets | — | | | 112 | | | — | | | 92 | |
| Interest expense limitation | Interest expense limitation | 133 | | | — | | | 10 | | | — | |
| Net operating loss carryforwards | Net operating loss carryforwards | 74 | | | — | | | 99 | | | — | |
| Stock-based compensation | Stock-based compensation | 13 | | | — | | | 12 | | | — | |
| Right-of-use lease assets and obligations | Right-of-use lease assets and obligations | 192 | | | 173 | | | 208 | | | 208 | |
| Other items | Other items | 11 | | | 49 | | | 48 | | | 44 | |
| | | 1,165 | | | 1,186 | | | 1,358 | | | 1,272 | |
| Valuation allowance | Valuation allowance | (177) | | | — | | | (57) | | | — | |
| | | $ | 988 | | | $ | 1,186 | | | $ | 1,301 | | | $ | 1,272 | |
Below is a reconciliation of the deferred tax assets and liabilities and the corresponding amounts reported in the accompanying Consolidated Balance Sheets.Sheets:
| | | | December 31, | | December 31, |
| | | 2022 | | 2021 | | 2023 | | 2022 |
| Deferred income tax assets | Deferred income tax assets | $ | 19 | | | $ | 65 | |
| Deferred tax liabilities | Deferred tax liabilities | (217) | | | (36) | |
| Net deferred tax asset (liability) | $ | (198) | | | $ | 29 | |
| Net deferred tax liability | |
During the year ended December 31, 2023, the valuation allowance increased by $71 million, including an increase of $73 million due to limitations on the tax deductibility of interest expense, and a decrease of $2 million due to changes in the expected realizability of deferred tax assets. The balance in the valuation allowance as of December 31, 2023 was $248 million.
During the year ended December 31, 2022, the valuation allowance increased by $120 million, including an increase of $123 million due to limitations on the tax deductibility of interest expense, a decrease of $1 million due to the expiration or worthlessness of unutilized net operating loss carryovers, and a decrease of $2 million due to changes in the expected realizability of deferred tax assets. The balance in the valuation allowance as of December 31, 2022 was $177 million.
During the year ended December 31, 2021, the valuation allowance increased by $2 million, including an increase of $2 million due to limitations on the tax deductibility of interest expense, a decrease of $2 million due to the expiration or worthlessness of unutilized state net operating loss carryovers, and an increase of $2 million due to changes in the expected realizability of deferred tax assets. The remaining balance in the valuation allowance at December 31, 2021 was $57 million. During the year ended December 31, 2020, the valuation allowance decreased by $226 million, including a decrease of $211 million due to limitations on the tax deductibility of interest expense, a decrease of $1 million due to the expiration or worthlessness of unutilized net operating loss carryovers, and a decrease of $14 million due to changes in expected realizability of deferred tax assets. The remaining balance in the valuation allowance as of December 31, 2020 was $55 million. Deferred tax assets relating to interest expense limitations under Internal Revenue Code Section 163(j) have a full valuation allowance because the interest expense carryovers are not expected to be utilized in the foreseeable future.
We account for uncertain tax positions in accordance with FASB ASC 740-10-25, which prescribes a comprehensive model for the financial statement recognition, measurement, presentation and disclosure of uncertain tax positions taken or expected to be taken in income tax returns. The following table summarizes the total changes in unrecognized tax benefits in continuing operations during the years ended December 31, 2023, 2022 2021 and 2020.2021. There were no such changes in discontinued operations. The additions and reductions for tax positions include the impact of items for which the ultimate deductibility is highly certain, but for which there is uncertainty about the timing of such deductions. Such amounts include unrecognized tax benefits that have impacted deferred tax assets and liabilities at December 31, 2023, 2022 2021 and 2020.2021.
| | | | | |
| | Continuing
Operations |
Balance At December 31, 20192020 | $ | 31 | |
| Reductions due to a lapse of statute of limitations | 3 | |
| Balance At December 31, 2021 | $ | 34 | |
| Reductions due to a lapse of statute of limitations | — | |
Balance At December 31, 2020 | $ | 31 | |
Reductions due to a lapse of statute of limitations | 3 | |
Balance At December 31, 2021 | $ | 34 | |
Increases due to tax positions taken in prior periods | — | |
| Balance At December 31, 2022 | $ | 34 | |
| Increases due to tax positions taken in prior periods | 31 | |
| Reductions due to a lapse of statute of limitations | (1) | |
| Balance At December 31, 2023 | $ | 64 | |
The total amount of unrecognized tax benefits as of December 31, 2023 was $64 million, of which $63 million, if recognized, would affect our effective tax rate and income tax benefit from continuing operations. Income tax expense in the year ended December 31, 2023 included expense of $24 million in continuing operations attributable an increase in our estimated liabilities for uncertain tax positions, net of related deferred tax effects. The total amount of unrecognized tax benefits as of December 31, 2022 was $34 million, of which $32 million, if recognized, would affect our effective tax rate and income tax benefit from continuing operations. In the year ended December 31, 2022, there was no change in our estimated liabilities for uncertain tax positions, net of related deferred tax effects. The total amount of unrecognized tax benefits as of December 31, 2021 was $34 million, of which $32 million, if recognized, would affect our effective tax rate and income tax benefit from continuing operations. Income tax expense in the year ended December 31, 2021 included expense of $3 million in continuing operations attributable to an increase in our estimated liabilities for uncertain tax positions, net of related deferred tax effects. The total amount of unrecognized tax benefits as of December 31, 2020 was $31 million, of which $29 million, if recognized, would affect our effective tax rate and income tax benefit from continuing operations. In the year ended December 31, 2020, there was no change in our estimated liabilities for uncertain tax positions.
Our practice is to recognize interest and penalties related to income tax matters in income tax expense in our consolidated statements of operations. Approximately $1$2 million of interest and penalties related to accrued liabilities for uncertain tax positions are included in the accompanying Consolidated Statement of Operations for the year ended December 31, 2022.2023. Total accrued interest or penalties on unrecognized tax benefits as of December 31, 20222023 was $1$2 million.
The IRS has completed audits of our tax returns for all tax years ended on or before December 31, 2007. All disputed issues with respect to these audits have been resolved and all related tax assessments (including interest) have been paid. Our tax returns for years ended after December 31, 2007 and USPI’s tax returns for years ended after December 31, 20182020 remain subject to audit by the IRS.
As of December 31, 2022,2023, no significant changes in unrecognized federal and state tax benefits are expected in the next 12 months as a result of the settlement of audits, the filing of amended tax returns or the expiration of statutes of limitations.
At December 31, 2022,2023, our carryforwards available to offset future taxable income consisted of (1) federal net operating loss (“NOL”) carryforwards of approximately $100$41 million pre‑tax, $40$39 million of which expires in 20242026 to 2037 and $60$2 million of which has no expiration date, (2) charitable contribution carryforwards of approximately $45$52 million expiring in 2025 through 2027 and (3) state NOL carryforwards of approximately $3.106$3.339 billion expiring in 20232024 through 20422043 for which the associated deferred tax benefit, net of valuation allowance and federal tax impact, is $42approximately $35 million. Our ability to utilize NOL carryforwards to reduce future taxable income may be limited under Section 382 of the Internal Revenue Code if certain ownership changes in our company occur during a rolling three‑year period. These ownership changes include purchases of common stock under share repurchase programs, the offering of stock by us, the purchase or sale of our stock by 5% shareholders, as defined in the Treasury regulations, or the issuance or exercise of rights to acquire our stock. If such ownership changes by 5% shareholders result in aggregate increases that exceed 50 percentage points during the three‑year period, then Section 382 imposes an annual limitation on the amount of our taxable income that may be offset by the NOL carryforwards or tax credit carryforwards at the time of ownership change.
NOTE 20. EARNINGS PER COMMON SHARE
The following table is a reconciliation of the numerators and denominators of our basic and diluted earnings per common share calculations for our continuing operations. Net income available to our common shareholders is expressed in millions and weighted average shares are expressed in thousands.
| | | | Net Income Available to Common Shareholders (Numerator) | | Weighted
Average Shares
(Denominator) | | Per-Share
Amount | | Net Income Available to Common Shareholders (Numerator) | | Weighted
Average Shares
(Denominator) | | Per-Share
Amount |
| Year Ended December 31, 2023 | | Year Ended December 31, 2023 | | | |
| Net income available to Tenet Healthcare Corporation common shareholders for basic earnings per share | |
| Effect of dilutive stock options, restricted stock units, deferred compensation units, convertible instruments and dividends on preferred stock | |
| Net income available to Tenet Healthcare Corporation common shareholders for diluted earnings per share | |
| Year Ended December 31, 2022 | Year Ended December 31, 2022 | | | | | | Year Ended December 31, 2022 | | | |
| Net income available to Tenet Healthcare Corporation common shareholders for basic earnings per share | Net income available to Tenet Healthcare Corporation common shareholders for basic earnings per share | $ | 410 | | | 106,929 | | | $ | 3.83 | |
| Effect of dilutive stock options, restricted stock units, deferred compensation units, convertible instruments and dividends on preferred stock | Effect of dilutive stock options, restricted stock units, deferred compensation units, convertible instruments and dividends on preferred stock | 8 | | | 3,587 | | | (0.05) | |
| Net income available to Tenet Healthcare Corporation common shareholders for diluted earnings per share | Net income available to Tenet Healthcare Corporation common shareholders for diluted earnings per share | $ | 418 | | | 110,516 | | | $ | 3.78 | |
| Year Ended December 31, 2021 | Year Ended December 31, 2021 | | | | | | Year Ended December 31, 2021 | | | |
| Net income available to Tenet Healthcare Corporation common shareholders for basic earnings per share | Net income available to Tenet Healthcare Corporation common shareholders for basic earnings per share | $ | 915 | | | 106,833 | | | $ | 8.56 | |
| Effect of dilutive stock options, restricted stock units and deferred compensation units | Effect of dilutive stock options, restricted stock units and deferred compensation units | — | | | 1,738 | | | (0.13) | |
| Net income available to Tenet Healthcare Corporation common shareholders for diluted earnings per share | Net income available to Tenet Healthcare Corporation common shareholders for diluted earnings per share | $ | 915 | | | 108,571 | | | $ | 8.43 | |
| Year Ended December 31, 2020 | | | | | |
| Net income available to Tenet Healthcare Corporation common shareholders for basic loss per share | $ | 399 | | | 105,010 | | | $ | 3.80 | |
| Effect of dilutive stock options, restricted stock units and deferred compensation units | — | | | 1,253 | | | (0.05) | |
| Net income available to Tenet Healthcare Corporation common shareholders for diluted loss per share | $ | 399 | | | 106,263 | | | $ | 3.75 | |
During the yearyears ended December 31, 2023 and 2022, our convertible instruments consisted of an agreement related to the ownership interest in a Hospital Operations segment joint venture and RSUs issued under the USPI Management Equity Plan. Prior toPlan; however, during the first six months of 2022, our purchase of all of the shares underlyingconvertible instruments also included the Baylor Put/Call Agreement in June 2022, that agreement was also included in our convertible instruments.Agreement. Additional information about the RSUs issued under the USPI Management Equity Plan and our purchase of the shares underlying the Baylor Put/Call Agreement is included in Notes 10 and 18, respectively.
NOTE 21. FAIR VALUE MEASUREMENTS
We are required to provide additional disclosures about fair value measurements as part of our financial statements for each major category of assets and liabilities measured at fair value. In general, fair values determined by Level 1 inputs utilize quoted prices (unadjusted) in active markets for identical assets or liabilities, which generally are not applicable to non‑financial assets and liabilities. Fair values determined by Level 2 inputs utilize data points that are observable, such as definitive sales agreements, appraisals or established market values of comparable assets. Fair values determined by Level 3 inputs areutilize unobservable data points for the asset or liability and include situations where there is little, if any, market activity for the asset or liability, such as internal estimates of future cash flows.
Non-Recurring Fair Value Measurements
Our non‑financial assets and liabilities not permitted or required to be measured at fair value on a recurring basis typically relate to long‑lived assets held and used, long‑lived assets held for sale and goodwill.
The following table presents this information about assets measured at fair value at December 31, 2023 and 2022 and indicates the fair value hierarchy of the valuation techniques we utilized to determine such fair values:
| | | | | | | | | | | | | | | | | | | | | | | | | | |
| | | Total | | Quoted Prices
in Active
Markets for
Identical Assets
(Level 1) | | Significant Other
Observable Inputs
(Level 2) | | Significant
Unobservable
Inputs
(Level 3) |
| December 31, 2023 | | | | | | | | |
| Long-lived assets held for sale | | $ | 775 | | | $ | — | | | $ | 775 | | | $ | — | |
| | | | | | | | |
| | | | | | | | |
| | | | | | | | |
| | | | | | | | |
| December 31, 2022 | | | | | | | | |
| | | | | | | | |
| Long-lived assets held and used | | $ | 167 | | | $ | — | | | $ | 167 | | | $ | — | |
| | | | | | | | |
| | | | | | | | |
| | | | | | | | |
| | | | | | | | |
| | | | | | | | |
As discussed in Note 6, we recognized an impairment charge of $82 million to write down certain long‑lived assets located in one of our markets to their estimated fair value during the year ended December 31, 2022. Based on our evaluation, we estimated the fair value of the long‑lived assets to be $167 million. The inputs used to establish this fair value are considered to be Level 2 inputs, which include inputs other than quoted prices included in Level 1 that are observable, either directly or indirectly.
Financial Instruments
The fair value of our long‑term debt (except for borrowings under the Credit Agreement) is based on quoted market prices (Level 1). The inputs used to establish the fair value of the borrowings outstanding under the Credit Agreement are considered to be Level 2 inputs. At December 31, 20222023 and 2021,2022, the estimated fair value of our long‑term debt was approximately 92.8%96.9% and 103.3%92.8%, respectively, of the carrying value of the debt.
NOTE 22. ACQUISITIONS
In December 2023, we purchased 55% of the ownership interest held by NextCare, Inc. and certain of its affiliates (“NextCare”) in NextCare Arizona I JV, LLC (“NextCare JV I”), a joint venture established to own and operate 41 UCCs and a telehealth center in Arizona. We paid $75 million from cash on hand on the acquisition date and retained an additional $10 million in escrow pending NextCare’s compliance with certain conditions. We recognized goodwill of $133 million from our acquisition of NextCare JV I. This transaction allowed us to expand our existing network in Arizona with UCCs which are already established and operational. NextCare JV I is included in our Hospital Operations segment.
During the year ended December 31, 2023, we acquired controlling ownership interests in 20 ambulatory surgery centers through a series of transactions. In addition, we acquired controlling ownership interests in 11 previously unconsolidated ambulatory surgery centers during 2023. We paid an aggregate of $149 million to acquire controlling ownership interests in all of the aforementioned facilities.
In July 2022, we acquired controlling ownership interests in 19 fully operational ambulatory surgery centers and three centers then in development from United Urology Group. We paid $104 million, net of cash acquired, for our ownership interests in these facilities and recognized goodwill of $316 million. The aggregate acquisition date fair value of the non‑controlling interests in the facilities we acquired was $223 million. The acquisition of these facilities provided us with access to new markets and further diversified our ambulatory care services portfolio.
We acquired controlling interests in an additional 11 ambulatory surgery centers through a series of transactions during the year ended December 31, 2022. We paid an aggregate purchase price of $65 million, net of cash acquired, for these facilities. During 2022, we also acquired controlling interests in 23 ambulatory surgery centers in which we previously owned a noncontrolling interest for an aggregate purchase price of $65 million.
In December 2021, subsidiaries of USPI acquired ownership interests in 86 ambulatory surgery centers and related ambulatory support services (collectively, the “2021 SCD“SCD Centers”) from Surgical Center Development #3, LLC and Surgical Center Development #4, LLC (“SCD”(together, “SCD”). Of these, we acquired controlling interests in 15 ambulatory surgery centers, noncontrolling interests in 57 centers and interests in 14 centers still in the development stage. The newly acquired facilities augmented our Ambulatory Care segment’s existing musculoskeletal service line and expanded the number of markets it serves. We made a cash payment of $1.125 billion, net of cash acquired, to acquire these facilities.
In addition to the 2021 SCD Centers, we paid an aggregate purchase price of $74 million to acquire controlling interests in 11 outpatient businesses and various physician practices during the year ended December 31, 2021. During 2021, we also acquired controlling interests in three surgical hospitals and two ambulatory surgery centers in which we previously owned a noncontrolling interest for $21 million.
In December 2020, USPI acquired controlling interests in 45 ambulatory surgery centers (collectively, the “2020 SCD Centers”) from SurgCenter Development and physician owners. The fair value
In addition to the 2020 SCD Centers, we acquired ownership interests in 10 outpatient businesses (all of which are in our Ambulatory Care segment), and various physician practices during the year ended December 31, 2020. The aggregate purchase price for these acquisitions was $80 million.
We are required to allocate the purchase prices of acquired businesses to assets acquired or liabilities assumed and, if applicable, noncontrolling interests based on their fair values. The excess of the purchase price allocated over those fair values is recorded as goodwill. The purchase price allocations for certain acquisitions completed in 20222023 are preliminary. We are in process of assessing working capital balances as well as obtaining and evaluating valuations of the acquired property and equipment, management contracts and other intangible assets, and noncontrolling interests. Therefore, those purchase price allocations, including goodwill, recorded in the accompanying consolidated financial statements are subject to adjustment once the assessments and valuation work are completed and evaluated. Such adjustments will be recorded as soon as practical and within the measurement period as defined by the accounting literature. During the year ended December 31, 2022,2023, we adjusted the initial purchase allocation of certain acquisitions completed in 20212022 based on the results of completed valuations. These adjustments resulted in a net increasedecrease in our Ambulatory Care segment’s goodwill of $7$18 million.
Preliminary or final purchase price allocations for all the acquisitions made during the years ended December 31, 2023, 2022 2021 and 20202021 are as follows:
| | Years Ended December 31, |
| Years Ended December 31, | | | Years Ended December 31, |
| | | 2022 | | 2021 | | 2020 | | 2023 | | 2022 | | 2021 |
| Current assets | Current assets | $ | 38 | | | $ | 59 | | | $ | 67 | |
| Property and equipment | Property and equipment | 54 | | | 88 | | | 63 | |
| Other intangible assets | Other intangible assets | 2 | | | 8 | | | 14 | |
| Goodwill | Goodwill | 860 | | | 664 | | | 1,581 | |
| Other long-term assets | Other long-term assets | 99 | | | 796 | | | 38 | |
| Previously held equity method investments | Previously held equity method investments | (207) | | | (43) | | | — | |
| Current liabilities | Current liabilities | (41) | | | (25) | | | (45) | |
| Long-term liabilities | Long-term liabilities | (118) | | | (70) | | | (43) | |
| Redeemable noncontrolling interests in equity of consolidated subsidiaries | Redeemable noncontrolling interests in equity of consolidated subsidiaries | (180) | | | (139) | | | (478) | |
| Noncontrolling interests | Noncontrolling interests | (273) | | | (95) | | | (20) | |
| Cash paid, net of cash acquired | Cash paid, net of cash acquired | (234) | | | (1,220) | | | (1,177) | |
| Gains on consolidations | Gains on consolidations | $ | — | | | $ | 23 | | | $ | — | |
AllWith the exception of NextCare JV I, which is included in our Hospital Operations segment, all of the facilities described above are included in our Ambulatory Care segment. The majority of the goodwill generated from our 20222023 and 2021 acquisitions will not be deductible for income tax purposes; however, the majority of the goodwill generated from our 2021 and 20202022 transactions will not be. The goodwill generated from these transactions can be attributed to the benefits that we expect to realize from operating efficiencies and growth strategies. Approximately $15 million, $14 million $20 million and $14$20 million in transaction costs related to prospective and closed acquisitions were expensed during the years ended December 31, 2023, 2022 2021 and 2020,2021, respectively, and are included in impairment and restructuring charges, and acquisition‑related costs in the accompanying Consolidated Statements of Operations.
During the year ended December 31, 2023 and 2021, we recognized gains totaling $16 million and $23 million, respectively, associated with stepping up our ownership interests in previously held equity investments, which we began consolidating after we acquired controlling interests. No such gainsgain or losses wereloss was recognized in the years ended December 31, 2022 or 2020.
Pro Forma Information - Unaudited
The following table provides certain pro forma information for Tenet as if the 2021 SCD Centers acquisition had occurred at the beginning of the year ended December 31, 2020:2022.
| | | | | | | | | | | |
| | Year Ended December 31, |
| | 2021 | | 2020 |
| Net operating revenues | $ | 19,627 | | | $ | 17,752 | |
| Equity in earnings of unconsolidated affiliates | $ | 258 | | | $ | 192 | |
| Net income available to Tenet Healthcare Corporation common shareholders | $ | 941 | | | $ | 416 | |
Diluted earnings per share available to Tenet Healthcare Corporation common shareholders | $ | 8.66 | | | $ | 3.92 | |
NOTE 23. SEGMENT INFORMATION
OurAt December 31, 2022, our business consists ofwas organized into three separate reporting segments: Hospital Operations and other, Ambulatory Care and Conifer. During the three months ended December 31, 2023, we combined our Hospital Operations and other and Conifer segments into a single reporting segment our Ambulatory Care segmentnamed Hospital Operations and our Conifer segment. The factorsServices (Hospital Operations). See Note 1 for determining the reportable segments include the manner in which management evaluates operating performance combined with the natureadditional discussion of the individual business activities.this change.
Our Hospital Operations segment is comprised of our acute care and specialty hospitals, imaging centers, ancillaryphysician practices and outpatient facilities, micro‑hospitals and physician practices.facilities. At December 31, 2022,2023, our subsidiaries operated 61 hospitals, serving primarily urban and suburban communities in nine states, includingas well as 164 outpatient facilities, primarily imaging centers, UCCs, ancillary emergency facilities and micro-hospitals. The following transactions changed the new acute care hospital we openednumber of facilities in Septemberour Hospital Operations segment during the years ended December 31, 2023, 2022 in South Carolina. and 2021:
•On April 1, 2021, we transferred 24 imaging centers from our Ambulatory Care segment to our Hospital Operations segment. Thesegment; the total assets associated with the imaging centers transferred to our Hospital Operations segment constituted less than 1% of our consolidated total assets at March 31, 2021. 2021;
•Also in April 2021, we completed the sale of the majority of the urgent care centersUCCs then held by our Hospital Operations segment to an unaffiliated urgent care provider. In addition, weprovider;
•We completed the sale of the Miami Hospitals in August 2021,2021;
•In September 2022, we opened Piedmont Medical Center Fort Mill, a new hospital located in South Carolina; and
•In December 2023, we acquired a controlling interest in NextCare JV I and a minority interest in NextCare Arizona II JV, LLC. Through these transactions, we acquired a controlling interest in 41 fully operational UCCs and a telehealth center and a noncontrolling interest in an additional 15 fully operational UCCs, all of which were held by ourlocated in Arizona.
Our Hospital Operations segment.
Our Ambulatory Care segment is comprised of the operations of USPI. At December 31, 2022, USPI had ownership interests in 442 ambulatory surgery centers (300 consolidated) and 24 surgical hospitals (eight consolidated) in 35 states. In April 2021, we completed the sale of 40 urgent care centers then held by our Ambulatory Care segment to an unaffiliated urgent care provider and, as noted above, transferred 24 imaging centers from our Ambulatory Care segment to our Hospital Operations segment. Effective June 30, 2022, we purchased all of the shares previously held by Baylor in USPI for $406 million, which increased our ownership interest in USPI’s voting shares from 95% to 100%. See Note 18 for additional information about this transaction.
Our Conifer segmentalso provides revenue cycle management and value‑based care services to hospitals, health systems, physician practices, employers and other clients.
Our Ambulatory Care segment is comprised of the operations of USPI. At December 31, 2022, Conifer provided services to approximately 660 Tenet2023, USPI had ownership interests in 461 ambulatory surgery centers (322 consolidated) and non‑Tenet24 surgical hospitals and other clients nationwide.(eight consolidated) in 35 states. We have entered into an agreement documentingcompleted the terms and conditionsdivestiture of various services Conifer provides to Tenet hospitals (“RCM Agreement”), as well as an agreement documenting certain administrative services40 UCCs held by our Hospital OperationsAmbulatory Care segment provides to Conifer. In March 2021, we entered into a month‑to‑month agreement amending the RCM Agreement effective Januaryon April 1, 2021 (“Amended RCM Agreement”) to update certain terms and conditions related to the revenue cycle management services Conifer provides to Tenet hospitals. We believe the pricing terms for the services provided under the Amended RCM Agreement are commercially reasonable and consistent with estimated third‑party terms. At December 31,2021. Effective June 30, 2022, we owned approximately 76%purchased all of Conifer Health Solutions, LLC,the shares in USPI that Baylor held on that date for $406 million, which is Conifer’s principal subsidiary.increased our ownership interest in USPI’s voting shares from 95% to 100% (see Note 18 for additional information about this transaction).
The following tables include amounts for each of our reportable segments and the reconciling items necessary to agree to amounts reported in the accompanying Consolidated Balance Sheets and Consolidated Statements of Operations, as applicable:
| | | | | | | | | | | | | | | | | |
| December 31, |
| | 2022 | | 2021 | | 2020 |
| Assets: | | | | | |
| Hospital Operations | $ | 15,682 | | | $ | 17,173 | | | $ | 18,048 | |
| Ambulatory Care | 10,557 | | | 9,473 | | | 8,048 | |
| Conifer | 917 | | | 933 | | | 1,010 | |
Total | $ | 27,156 | | | $ | 27,579 | | | $ | 27,106 | |
| | | | | | | | | | | | | | | | | |
| | Years Ended December 31, |
| | 2022 | | 2021 | | 2020 |
| Capital expenditures: | | | | | |
| Hospital Operations | $ | 668 | | | $ | 578 | | | $ | 467 | |
| Ambulatory Care | 75 | | | 66 | | | 51 | |
| Conifer | 19 | | | 14 | | | 22 | |
Total | $ | 762 | | | $ | 658 | | | $ | 540 | |
| | | | | |
| Net operating revenues: | | | | | |
| Hospital Operations total prior to inter-segment eliminations | $ | 15,061 | | | $ | 15,982 | | | $ | 14,790 | |
| Ambulatory Care | 3,248 | | | 2,718 | | | 2,072 | |
| Conifer | | | | | |
| Tenet | 451 | | | 482 | | | 528 | |
| Other clients | 865 | | | 785 | | | 778 | |
| Total Conifer revenues | 1,316 | | | 1,267 | | | 1,306 | |
| Inter-segment eliminations | (451) | | | (482) | | | (528) | |
Total | $ | 19,174 | | | $ | 19,485 | | | $ | 17,640 | |
| | | | | |
| Equity in earnings of unconsolidated affiliates: | | | | | |
| Hospital Operations | $ | 10 | | | $ | 25 | | | $ | 6 | |
| Ambulatory Care | 206 | | | 193 | | | 163 | |
Total | $ | 216 | | | $ | 218 | | | $ | 169 | |
| | | | | |
| | | | | |
| | | | | |
| | | | | |
| | | | | |
| | | | | |
| | | | | |
| | | | | |
| | | | | |
| | | | | |
| | | | | |
| | | | | |
| | | | | |
| | | | | |
| | | | | |
| | | | | |
| | | | | |
| | | | | |
| | | | | |
| | | | | |
| | | | | |
| | | | | |
| | | | | |
| | | | | |
| | | | | | | | | | | | | | | | | |
| December 31, |
| | 2023 | | 2022 | | 2021 |
| Assets: | | | | | |
| Hospital Operations | $ | 17,268 | | | $ | 16,599 | | | $ | 18,106 | |
| Ambulatory Care | 11,044 | | | 10,557 | | | 9,473 | |
| | | | | |
Total | $ | 28,312 | | | $ | 27,156 | | | $ | 27,579 | |
| | | | | | | | | | | | | | | | | |
| Years Ended December 31, |
| 2022 | | 2021 | | 2020 |
| | | | | |
| | | | | |
| | | | | |
| | | | | |
| | | | | |
| Adjusted EBITDA: | | | | | |
| Hospital Operations | $ | 1,777 | | | $ | 1,931 | | | $ | 1,911 | |
| Ambulatory Care | 1,327 | | | 1,197 | | | 868 | |
| Conifer | 365 | | | 355 | | | 367 | |
| Total | $ | 3,469 | | | $ | 3,483 | | | $ | 3,146 | |
| | | | | |
| Depreciation and amortization: | | | | | |
| Hospital Operations | $ | 692 | | | $ | 722 | | | $ | 739 | |
| Ambulatory Care | 112 | | | 95 | | | 81 | |
| Conifer | 37 | | | 38 | | | 37 | |
| Total | $ | 841 | | | $ | 855 | | | $ | 857 | |
| | | | | |
| Adjusted EBITDA | $ | 3,469 | | | $ | 3,483 | | | $ | 3,146 | |
| Income (loss) from divested and closed businesses | — | | | (1) | | | 20 | |
| Depreciation and amortization | (841) | | | (855) | | | (857) | |
| Impairment and restructuring charges, and acquisition-related costs | (226) | | | (85) | | | (290) | |
| Litigation and investigation costs | (70) | | | (116) | | | (44) | |
| Interest expense | (890) | | | (923) | | | (1,003) | |
| Loss from early extinguishment of debt | (109) | | | (74) | | | (316) | |
| Other non-operating income, net | 10 | | | 14 | | | 1 | |
| Gains on sales, consolidation and deconsolidation of facilities | 1 | | | 445 | | | 14 | |
| Income from continuing operations, before income taxes | $ | 1,344 | | | $ | 1,888 | | | $ | 671 | |
| | | | | | | | | | | | | | | | | |
| | Years Ended December 31, |
| | 2023 | | 2022 | | 2021 |
| Capital expenditures: | | | | | |
| Hospital Operations | $ | 671 | | | $ | 687 | | | $ | 592 | |
| Ambulatory Care | 80 | | | 75 | | | 66 | |
| | | | | |
Total | $ | 751 | | | $ | 762 | | | $ | 658 | |
| | | | | |
| Net operating revenues: | | | | | |
| Hospital Operations | $ | 16,683 | | | $ | 15,926 | | | $ | 16,767 | |
| Ambulatory Care | 3,865 | | | 3,248 | | | 2,718 | |
| | | | | |
| | | | | |
| | | | | |
| | | | | |
| | | | | |
Total | $ | 20,548 | | | $ | 19,174 | | | $ | 19,485 | |
| | | | | |
| Equity in earnings of unconsolidated affiliates: | | | | | |
| Hospital Operations | $ | 10 | | | $ | 10 | | | $ | 25 | |
| Ambulatory Care | 218 | | | 206 | | | 193 | |
Total | $ | 228 | | | $ | 216 | | | $ | 218 | |
| | | | | |
| Adjusted EBITDA: | | | | | |
| Hospital Operations | $ | 1,997 | | | $ | 2,142 | | | $ | 2,286 | |
| Ambulatory Care | 1,544 | | | 1,327 | | | 1,197 | |
| | | | | |
Total | $ | 3,541 | | | $ | 3,469 | | | $ | 3,483 | |
| | | | | |
| Depreciation and amortization: | | | | | |
| Hospital Operations | $ | 750 | | | $ | 729 | | | $ | 760 | |
| Ambulatory Care | 120 | | | 112 | | | 95 | |
| | | | | |
Total | $ | 870 | | | $ | 841 | | | $ | 855 | |
| | | | | |
| | | | | |
| | | | | |
| | | | | |
| | | | | |
| | | | | |
| | | | | |
| | | | | |
| | | | | |
| | | | | |
| | | | | |
| | | | | | | | | | | | | | | | | |
| Years Ended December 31, |
| 2023 | | 2022 | | 2021 |
| | | | | |
| | | | | |
| | | | | |
| | | | | |
| | | | | |
| | | | | |
| | | | | |
| | | | | |
| | | | | |
| | | | | |
| | | | | |
| | | | | |
| | | | | |
| | | | | |
| | | | | |
| | | | | |
| | | | | |
| Adjusted EBITDA | $ | 3,541 | | | $ | 3,469 | | | $ | 3,483 | |
| Loss from divested and closed businesses | — | | | — | | | (1) | |
| Depreciation and amortization | (870) | | | (841) | | | (855) | |
| Impairment and restructuring charges, and acquisition-related costs | (137) | | | (226) | | | (85) | |
| Litigation and investigation costs | (47) | | | (70) | | | (116) | |
| Interest expense | (901) | | | (890) | | | (923) | |
| Loss from early extinguishment of debt | (11) | | | (109) | | | (74) | |
| Other non-operating income, net | 19 | | | 10 | | | 14 | |
| Gains on sales, consolidation and deconsolidation of facilities | 23 | | | 1 | | | 445 | |
| Income from continuing operations, before income taxes | $ | 1,617 | | | $ | 1,344 | | | $ | 1,888 | |
NOTE 24. RECENT ACCOUNTING STANDARDS
Recently Issued Accounting Standards
In November 2023, the FASB issued ASU 2023-07, “Improvements to Reportable Segment Disclosures” (“ASU 2023-07”). The standard expands reportable segment disclosure requirements by requiring disclosures of significant reportable segment expenses that are regularly provided to the chief operating decision maker (“CODM”) and included within each reported measure of a segment's profit or loss. The ASU also requires disclosure of the title and position of the individual identified as the CODM and an explanation of how the CODM uses the reported measures of a segment's profit or loss in assessing segment performance and deciding how to allocate resources. Additionally, ASU 2023-07 requires all segment profit or loss and assets disclosures to be provided on an annual and interim basis. ASU 2023-07 is effective for fiscal years beginning after December 15, 2023, and interim periods within fiscal years beginning one year later. Early adoption is permitted and the amendments must be applied retrospectively to all prior periods presented. The adoption of this guidance will not affect our consolidated results of operations, financial position or cash flows and we are currently evaluating the effect the guidance will have on our disclosures.
In August 2023, the FASB issued ASU 2023-05, “Business Combinations – Joint Venture Formations (Subtopic 805-60): Recognition and Initial Measurement” (“ASU 2023-05”), which clarifies the business combination accounting for joint venture formations. The amendments in the ASU seek to reduce diversity in practice that has resulted from a lack of authoritative guidance regarding the accounting for the formation of joint ventures in separate financial statements. The amendments also seek to clarify the initial measurement of joint venture net assets, including businesses contributed to a joint venture. The guidance is applicable to all entities involved in the formation of a joint venture. ASU 2023-05 is effective prospectively for all joint venture formations with a formation date on or after January 1, 2025. Early adoption and retrospective application of the amendments are permitted. We do not expect adoption of the new guidance to have a material impact on our consolidated financial statements and disclosures.
The FASB issued ASU 2022‑03, “Fair Value Measurement (Topic 820) – Fair Value Measurement of Equity Securities Subject to Contractual Sale Restrictions” (“ASU 2022‑03”) in June 2022. Through ASU 2022‑03 the FASB clarified that an entity should measure the fair value of an equity security subject to contractual sale restriction the same way it measures an identical equity security that is not subject to such a restriction. Under this approach the contractual restriction on the sale of an equity security is not considered part of the unit of account of the equity security and therefore, should not affect its fair value. ASU 2022‑03 also enhanced the disclosure requirements related to these instruments. The ASU is effective for public entities for fiscal years beginning after December 15, 2023, including interim periods within those fiscal years, and early adoption is permitted. For non‑investment companies, ASU 2022‑03 will be applied prospectively with adjustments resulting from the initial adoption recognized in earnings and disclosed.
The amendments in We do not expect adoption of ASU 2022‑03 primarily affect the RSUs granted to have a material impact on our non‑employee directors as part of their annual compensation, which vest immediately but cannot be sold until a three‑year holding period has lapsed. Upon adoption, we expect to recognize an immaterial amount of incremental stock compensation expense related to these awards.
In October 2021, the FASB issued ASU 2021-08, “Business Combinations (Topic 805) – Accounting for Contract Assetsconsolidated financial statements and Contract Liabilities from Contracts with Customers” (“ASU 2021-08”). The standard addresses diversity in practice related to the recognition and measurement of contract assets and contract liabilities acquired in a business combination. The guidance requires an acquirer to recognize and measure contract assets and liabilities acquired in a business combination in accordance with Topic 606 – Revenue from Contracts with Customers as if the acquirer had originated the contracts, as opposed to at their fair value on the acquisition date. ASU 2021-08 is effective for us beginning in 2023, with early adoption permitted. We are currently evaluating the impact of this standard to our financial statements.disclosures.
Recently Adopted Accounting Standards
As further discussed in Note 1, we adopted ASU 2020-06 effective January 1, 2022 and adopted ASU 2016‑13 effective January 1, 2020.2022. We applied the modified retrospective transition approach as of the period of adoptionadoption.
NOTE 25. SUBSEQUENT EVENT
In January 2024, we entered into a definitive agreement for both ASU 2020-06the sale of four hospitals and ASU 2016‑13.related operations in Orange County and Los Angeles County, California, all of which are in our Hospital Operations segment. We anticipate the transaction will close in early 2024, subject to customary regulatory approvals, clearances and closing conditions.
ITEM 9. CHANGES IN AND DISAGREEMENTS WITH ACCOUNTANTS ON ACCOUNTING AND FINANCIAL DISCLOSURE
None.
ITEM 9A. CONTROLS AND PROCEDURES
We carried out an evaluation of the effectiveness of the design and operation of our disclosure controls and procedures as defined by Rules 13a‑15(e) and 15d‑15(e) under the Exchange Act, as of the end of the period covered by this report. The evaluation was performed under the supervision and with the participation of management, including our chief executive officer and chief financial officer. Based upon that evaluation, our chief executive officer and chief financial officer concluded that our disclosure controls and procedures are effective as of December 31, 2023 to ensure that material information is recorded, processed, summarized and reported by management on a timely basis in order to comply with our disclosure obligations under the Exchange Act and the SEC rules thereunder.
Management’s report on internal control over financial reporting is set forth on page 7980 and is incorporated herein by reference. The independent registered public accounting firm that audited the financial statements included in this report has issued an attestation report on our internal control over financial reporting as set forth on page 8081 herein. Management has evaluated the changes in our internal control over financial reporting that occurred during the quarter ended December 31, 2022. In that period, management migrated our primary payroll processing system to a new human resource management system. We have appropriately considered the potential impact to our control design and related tests of operating effectiveness of internal control over financial reporting as of December 31, 2022.
Other than as described above, thereThere were no changes toin our internal control over financial reporting during the quarter ended December 31, 20222023 that have materially affected, or are reasonably likely to materially affect, our internal control over financial reporting.
ITEM 9B. OTHER INFORMATION
None.During the three months ended December 31, 2023, none of our directors or Section 16 officers adopted or terminated a “Rule 10b5‑1 trading arrangement” or “non‑Rule 10b5‑1 trading arrangement,” as each term is defined in Item 408 of the SEC’s Regulation S‑K.
ITEM 9C. DISCLOSURE REGARDING FOREIGN JURISDICTIONS THAT PREVENT INSPECTIONS
Not applicable.
PART III.
ITEM 10. DIRECTORS, EXECUTIVE OFFICERS AND CORPORATE GOVERNANCE
The information required by this Item regarding the identity and business experience of our directors is set forth under the subsections “Nominees for Election to the Board of Directors,” “Director Nomination and Qualifications” and “Director Nominees’ Qualifications and Experience” under the heading “Proposal 1 – Election of Directors,” and the information required by this Item regarding the identity and business experience of our executive officers is set forth under the heading “Executive Officers,” in each case in the definitive proxy materials we will file in connection with our 20232024 Annual Meeting of Shareholders. All such information is incorporated herein by reference in accordance with General Instruction G(3) to Form 10‑K.
Information on our Audit Committee and Audit Committee Financial Experts required by this Item is set forth under the caption “Corporate Governance and Board Practices – Committees” in the definitive proxy materials we will file in connection with our 20232024 Annual Meeting of Shareholders and is incorporated herein by reference in accordance with General Instruction G(3) to Form 10‑K.
Information concerning our Code of Conduct, by which all of our employees and officers, including our chief executive officer, chief financial officer and principal accounting officer, are required to abide appears under Item 1, Business – Compliance and Ethics, of Part I of this report.report, and is incorporated herein by reference.
ITEM 11. EXECUTIVE COMPENSATION
The information required by this Item is set forth under the headings “Executive Compensation Tables,” “Corporate Governance and Board Practices – Committees – HR Committee Interlocks and Insider Participation” and “Human Resources Committee Report” in the definitive proxy materials we will file in connection with our 20232024 Annual Meeting of Shareholders and is incorporated herein by reference in accordance with General Instruction G(3) to Form 10‑K.
ITEM 12. SECURITY OWNERSHIP OF CERTAIN BENEFICIAL OWNERS AND MANAGEMENT AND RELATED STOCKHOLDER MATTERS
Information about security ownership of certain beneficial owners required by this Item is set forth under the headings “Securities Ownership” and “Securities Authorized for Issuance Under Equity Compensation Plans” in the definitive proxy materials we will file in connection with our 20232024 Annual Meeting of Shareholders and is incorporated herein by reference in accordance with General Instruction G(3) to Form 10‑K.
ITEM 13. CERTAIN RELATIONSHIPS AND RELATED TRANSACTIONS, AND DIRECTOR INDEPENDENCE
The information required by this Item is set forth under the headings “Corporate Governance and Board Practices – Certain Relationships and Related Person Transactions” and “Proposal 1 – Election of Directors – Director Nominees’ Qualifications and Experience – Director Independence” in the definitive proxy materials we will file in connection with our 20232024 Annual Meeting of Shareholders and is incorporated herein by reference in accordance with General Instruction G(3) to Form 10‑K.
ITEM 14. PRINCIPAL ACCOUNTING FEES AND SERVICES
The information required by this Item is set forth under the heading “Proposal 43 – Ratification of the Selection of Independent Registered Public Accountants” in the definitive proxy materials we will file in connection with our 20232024 Annual Meeting of Shareholders and is incorporated herein by reference in accordance with General Instruction G(3) to Form 10‑K.
PART IV.
ITEM 15. EXHIBITS, FINANCIAL STATEMENT SCHEDULES
FINANCIAL STATEMENTS
The Consolidated Financial Statements and notes thereto can be found on pages 8384 through 130131. FINANCIAL STATEMENT SCHEDULES
Schedule II—Valuation and Qualifying Accounts (included on page 141143). All other schedules and financial statements of the Registrant are omitted because they are not applicable or not required or because the required information is included in the Consolidated Financial Statements or notes thereto.
EXHIBITS
Unless otherwise indicated, the following exhibits are filed with this report:
| | | | | | | | | | | |
| (3) | | Articles of Incorporation and Bylaws |
| | | |
| | (a) | |
| | | |
| | (b) | |
| | | |
| | (c) | |
| | | |
| | | | | | | | | | | |
| (4) | | Instruments Defining the Rights of Security Holders, Including Indentures |
| | | |
| | (a) | |
| | | |
| | (b) | |
| | | |
| | (c) | |
| | | |
| | (d) | |
| | | |
| | (e) | |
| | | |
| | (f) | |
| | | |
| | (g) | |
| | | |
| | (h)(e) | |
| | | |
| | (i)(f) | |
| | | |
| | (j)(g) | |
| | | |
| | (k)(h) | |
| | | |
| | | | | | | | | | | |
| (10) | | Material Contracts |
| | | |
| | (a) | Amendment No. 7,, dated as of March 16, 2022,, to that certain Amended and Restated Credit Agreement, dated as of October 19, 2010, among the Registrant, the lenders and issuers party thereto and Citicorp USA, Inc., as administrative agent, including as Exhibit A thereto a copy of the Amended and Restated Credit Agreement reflecting all amendments and restatements through March 16, 2022 (Incorporated by reference to Exhibit 10.1 to Registrant’s Current Report on Form 8-K filed March 17, 2022) |
| | | |
| | (b) | |
| | | |
| | (c)(b) | Amendment No. 1,6, dated as of September 15, 2016, to the Letter of Credit Facility Agreement, dated as of March 7, 2014, among the Registrant, certain financial institutions party thereto from time to time as letter of credit participants and issuers, and Barclays Bank PLC, as administrative agent (Incorporated by reference to Exhibit 10.1 to Registrant’s Current Report on Form 8-K dated filed September 16, 2016) |
| | | |
| | (d) | Amendment No. 3, dated as of September 12, 2019,2023, to the Letter of Credit Facility Agreement, dated as of March 7, 2014, by and among the Registrant, the LC participants and issuers party thereto, and Barclays Bank PLC, as administrative agent, including as Exhibit A thereto a copy of the Letter of Credit Facility Agreement reflecting all amendments through September 7, 2023 (Incorporated by reference to Exhibit10.2 10.1 to Registrant’s Current Report on Form 8-K filed September13,2019) 8, 2023) |
| | | |
| | (e) | |
| | | |
| | (f) | Amendment No. 5, dated as of July 29, 2020, to the Letter of Credit Facility Agreement, dated as of March 7, 2014, by and among the Registrant, the LC participants and issuers party thereto, and Barclays Bank PLC, as administrative agent (Incorporated by reference to Exhibit 10(a) to Registrant’s Quarterly Report on Form 10-Q for the quarter ended June30,2020, filed August3,2020) |
| | | |
| | (g)(c) | |
| | | |
| | (h)(d) | |
| | | |
| | (i)(e) | First Amendment to Stock Pledge Agreement, dated as of May 8, 2009, by and among the Registrant, as pledgor, The Bank of New York Mellon Trust Company, N.A., as collateral trustee, and the other pledgors party thereto (Incorporated by reference to Exhibit 10(h) to Registrant’s Annual Report on Form 10-K for the year ended December 31, 2015, filed February 22, 2016) |
| | | |
| | | | | | | | | | | |
| | (j)(f) | |
| | | |
| | (k)(g) | Third Amendment to Stock Pledge Agreement, dated as of March 7, 2014, by and among the Registrant, as pledgor, The Bank of New York Mellon Trust Company, N.A., as collateral trustee, and the other pledgors party thereto (Incorporated by reference to Exhibit 10(j) to Registrant’s Annual Report on Form 10-K for the year ended December 31, 2015, filed February 22, 2016) |
| | | |
| | (l)(h) | Fourth Amendment to Stock Pledge Agreement, dated as of March 23, 2015, by and among the Registrant, as pledgor, The Bank of New York Mellon Trust Company, N.A., as collateral trustee, and the other pledgors party thereto (Incorporated by reference to Exhibit 10(k) to Registrant’s Annual Report on Form 10-K for the year ended December 31, 2015, filed February 22, 2016) |
| | | |
| | (m)(i) | Fifth Amendment to Stock Pledge Agreement, dated as of December 1, 2016, by and among the Registrant, as pledgor, The Bank of New York Mellon Trust Company, N.A., as collateral trustee, and the other pledgors party thereto (Incorporated by reference to Exhibit 10(m) to Registrant’s Annual Report on Form 10-K for the year ended December 31, 2018, filed February 25, 2019) |
| | | |
| | (n)(j) | Sixth Amendment to Stock Pledge Agreement, dated as of July 14, 2017, by and among the Registrant, as pledgor, The Bank of New York Mellon Trust Company, N.A., as collateral trustee, and the other pledgors party thereto (Incorporated by reference to Exhibit 10(n) to Registrant’s Annual Report on Form 10-K for the year ended December 31, 2018, filed February 25, 2019) |
| | | |
| | | | | | | | | | | |
| | (o)(k) | Seventh Amendment to Stock Pledge Agreement, dated as of February 5, 2019, by and among the Registrant, as pledgor, The Bank of New York Mellon Trust Company, N.A., as collateral trustee, and the other pledgors party thereto (Incorporated by reference to Exhibit 10(o) to Registrant’s Annual Report on Form 10-K for the year December 31, 2018, filed February 25, 2019) |
| | | |
| | (l) | | | Eighth Amendment to Stock Pledge Agreement, dated as of August 26, 2019, Ninth Amendment to Stock Pledge Agreement, dated as of April 7, 2020, Tenth Amendment to Stock Pledge Agreement, dated as of June 16, 2020, Eleventh Amendment to Stock Pledge Agreement, dated as of June 2, 2021, Twelfth Amendment to Stock Pledge Agreement, dated as of December 1, 2021, Thirteenth Amendment to Stock Pledge Agreement, dated as of June 15, 2022, and Fourteenth Amendment to Stock Pledge Agreement, dated as of May 16, 2023, all by and among the Registrant, as pledgor, The Bank of New York Mellon Trust Company, N.A., as collateral trustee, and the other pledgors party thereto |
| | | |
| | (p)(m) | |
| | | |
| | (q) | |
| | | |
| | (r)(n) | |
| | | |
| | (s)(o) | |
| | | |
| | (t)(p) | |
| | | |
| | (u) | |
| | | |
| | (v)(q) | |
| | | |
| | (w)(r) | |
| | | |
| | (x)(s) | |
| | | |
| | | | | | | | | | | |
| | (y)(t) | |
| | | |
| | (z)(u) | |
| | | |
| | (aa)(v) | |
| | | |
| | (bb)(w) | |
| | | |
| | (cc)(x) | |
| | | |
| | | | | | | | | | | |
| | (dd)(y) | |
| | | |
| | (ee)(z) | |
| | | |
| | (ff)(aa) | |
| | | |
| | (gg)(bb) | |
| | | |
| | (hh)(cc) | |
| | | |
| | (ii) | |
| | | |
| | (jj)(dd) | |
| | | |
| | (kk)(ee) | |
| | | |
| | (ff) | | | |
| | | |
| | (ll)(gg) | |
| | | |
| | (mm)(hh) | |
| | | |
| | | | | | | | | | | |
| | (pp)(ll) | |
| | | |
| | (qq) | |
| | | |
| | (rr)(mm) | |
| | | |
| | (nn) | | | |
| | | |
| | (ss)(oo) | |
| | | |
| | (tt)(pp) | |
| | | |
| | (uu)(qq) | |
| | | |
| | (vv)(rr) | |
| | | |
| | (ww)(ss) | |
| | | |
| (21) | | |
| | | |
| (23) | | |
| | | |
| | |
| | | |
| (31) | | Rule 13a-14(a)/15d-14(a) Certifications |
| | | |
| | (a) | |
| | | |
| | (b) | |
| | | |
| (32) | | |
| | | |
| (97) | | |
| | | |
| (101 SCH) | | Inline XBRL Taxonomy Extension Schema Document |
| | | |
| (101 CAL) | | Inline XBRL Taxonomy Extension Calculation Linkbase Document |
| | | |
| (101 DEF) | | Inline XBRL Taxonomy Extension Definition Linkbase Document |
| | |
| (101 LAB) | | Inline XBRL Taxonomy Extension Label Linkbase Document |
| | |
| (101 PRE) | | Inline XBRL Taxonomy Extension Presentation Linkbase Document |
| | | |
| | | | | | | | | | | |
| (101 INS) | | Inline XBRL Taxonomy Extension Instance Document – the instance document does not appear in the interactive data file because its XBRL tags are embedded within the inline XBRL document |
| | | |
| (104) | | | Cover page from the Registrant’s Annual Report on Form 10-K for the year ended December 31, 20222023 formatted in Inline XBRL (included in Exhibit 101) |
| | | |
| * Management contract or compensatory plan or arrangement |
ITEM 16. FORM 10-K SUMMARY
Not applicable.None.
SIGNATURES
Pursuant to the requirements of Section 13 or 15(d) of the Securities Exchange Act of 1934, the Registrant has duly caused this report to be signed on its behalf by the undersigned, thereunto duly authorized.
| | | | | | | | |
| | | TENET HEALTHCARE CORPORATION
(Registrant) |
Date: February 17, 202316, 2024 | By: | /s/ R. SCOTT RAMSEY |
| | | R. Scott Ramsey Senior Vice President, Controller (Principal Accounting Officer) |
Pursuant to the requirements of the Securities Exchange Act of 1934, this report has been signed below by the following persons on behalf of the Registrant and in the capacities and on the dates indicated.
| | | | | | | | |
Date: February 17, 202316, 2024 | By: | /s/ SAUMYA SUTARIA |
| | Saumya Sutaria, M.D. Chairman of the Board and Chief Executive Officer and Director (Principal Executive Officer) |
Date: February 17, 202316, 2024 | By: | /s/ DANIEL J. CANCELMISUN PARK |
| | | Daniel J. CancelmiSun Park
Executive Vice President and Chief Financial Officer (Principal Financial Officer) |
Date: February 17, 202316, 2024 | By: | /s/ R. SCOTT RAMSEY |
| | | R. Scott Ramsey Senior Vice President, Controller (Principal Accounting Officer) |
| | |
| | |
| Date: February 16, 2024 | By: | /s/ VINEETA AGARWALA |
| | Vineeta Agarwala, M.D., PhD
Director |
Date: February 17, 202316, 2024 | By: | /s/ JAMES L. BIERMAN |
| | | James L. Bierman
Director |
Date: February 17, 202316, 2024 | By: | /s/ ROY D. BLUNT |
| | Roy D. Blunt
Director |
| Date: February 16, 2024 | By: | /s/ RICHARD FISHER |
| | | Richard Fisher
Director |
Date: February 17, 202316, 2024 | By: | /s/ MEGHAN M. FITZGERALD |
| | | Meghan M. FitzGerald, DrPH
Director |
Date: February 17, 202316, 2024 | By: | /s/ CECIL D. HANEY |
| | Cecil D. Haney
Director |
Date: February 17, 202316, 2024 | By: | /s/ J. ROBERT KERREY |
| | | J. Robert Kerrey
Director |
Date: February 17, 202316, 2024 | By: | /s/ CHRIS LYNCH |
| | | Chris Lynch
Director |
Date: February 17, 202316, 2024 | By: | /s/ RICHARD MARK |
| | | Richard Mark
Director |
| | | | | | | | |
Date: February 17, 202316, 2024 | By: | /s/ TAMMY ROMO |
| | Tammy Romo
Director |
Date: February 17, 202316, 2024 | By: | /s/ STEPHEN H. RUSCKOWSKI |
| | Stephen H. Rusckowski
Director |
| Date: February 16, 2024 | By: | /s/ NADJA WEST |
| | | Nadja West, M.D.
Director |
SCHEDULE II—VALUATION AND QUALIFYING ACCOUNTS
(In Millions)
| | | | Balance at
Beginning
of Period | |
Costs and Expenses(1) | | Deductions | | Other
Items | | Balance at
End of
Period | | Balance at
Beginning
of Period | |
Costs and Expenses(1) | | Deductions | | Other
Items | | Balance at
End of
Period |
| | Valuation allowance for deferred tax assets: | Valuation allowance for deferred tax assets: | | | | | | | | | |
| | Valuation allowance for deferred tax assets: | |
| | Valuation allowance for deferred tax assets: | | | | |
| Year ended December 31, 2023 | |
| Year ended December 31, 2022 | Year ended December 31, 2022 | $ | 57 | | | $ | 120 | | | $ | — | | | $ | — | | | $ | 177 | |
| Year ended December 31, 2021 | Year ended December 31, 2021 | $ | 55 | | | $ | 2 | | | $ | — | | | $ | — | | | $ | 57 | |
| Year ended December 31, 2020 | $ | 281 | | | $ | (226) | | | $ | — | | | $ | — | | | $ | 55 | |
| | | | | | | | |
| | |
| (1) | Includes amounts recorded in discontinued operations. |