UNITED STATES
SECURITIES AND EXCHANGE COMMISSION
Washington, D.C. 20549
FORM 10-K
(Mark One)
|
| |
[P] | ANNUAL REPORT PURSUANT TO SECTION 13 OR 15(d) OF THE SECURITIES EXCHANGE ACT OF 1934 For the fiscal year ended December 31, 20112012 |
or
|
| |
| [ ] | TRANSITION REPORT PURSUANT TO SECTION 13 OR 15(d) OF THE SECURITIES EXCHANGE ACT OF 1934 |
For the transition period from to
Commission file number:
1-6523
Exact name of registrant as specified in its charter:
Bank of America Corporation
State or other jurisdiction of incorporation or organization:
Delaware
IRS Employer Identification No.:
56-0906609
Address of principal executive offices:
Bank of America Corporate Center
100 North Tryon Street
Charlotte, North Carolina 28255
Registrant’s telephone number, including area code:
(704) 386-5681
SECURITIES REGISTERED PURSUANT TO SECTION 12(b) OF THE ACT:
|
| | | | |
| | Title of each class | | Name of each exchange on which registered | |
| | Common Stock, par value $0.01 per share | | New York Stock Exchange | |
| | | | London Stock Exchange | |
| | | | Tokyo Stock Exchange | |
| | Warrants to purchase Common Stock (expiring October 28, 2018) | | New York Stock Exchange | |
| Warrants to purchase Common Stock (expiring January 16, 2019) | | New York Stock Exchange | |
| Depositary Shares, each Representingrepresenting a 1/1,000th interest in a share of 6.204% Non-Cumulative Preferred Stock, Series D | | New York Stock Exchange | |
| | Depositary Shares, each Representingrepresenting a 1/1,000th interest in a share of Floating Rate Non-Cumulative Preferred Stock, Series E | | New York Stock Exchange | |
| | Depositary Shares, each Representingrepresenting a 1/1,000th Interest in a share of 8.20% Non-Cumulative Preferred Stock, Series H | | New York Stock Exchange | |
| | Depositary Shares, each Representingrepresenting a 1/1,000th interest in a share of 6.625% Non-Cumulative Preferred Stock, Series I | | New York Stock Exchange | |
| | Depositary Shares, each Representingrepresenting a 1/1,000th interest in a share of 7.25% Non-Cumulative Preferred Stock, Series J | | New York Stock Exchange | |
| | 7.25% Non-Cumulative Perpetual Convertible Preferred Stock, Series L | | New York Stock Exchange | |
|
| | | | |
| Title of each class | | Name of each exchange on which registered | |
| | Depositary Shares, each representing a 1/1,200th interest in a share of Bank of America Corporation Floating Rate Non-Cumulative Preferred Stock, Series 1 | | New York Stock Exchange | |
|
| | | | |
| Title of each class | | Name of each exchange on which registered | |
| | Depositary Shares, each representing a 1/1,200th interest in a share of Bank of America Corporation Floating Rate Non-Cumulative Preferred Stock, Series 2 | | New York Stock Exchange | |
| | Depositary Shares, each representing a 1/1,200th interest in a share of Bank of America Corporation 6.375% Non-Cumulative Preferred Stock, Series 3 | | New York Stock Exchange | |
| | Depositary Shares, each representing a 1/1,200th interest in a share of Bank of America Corporation Floating Rate Non-Cumulative Preferred Stock, Series 4 | | New York Stock Exchange | |
| | Depositary Shares, each representing a 1/1,200th interest in a share of Bank of America Corporation Floating Rate Non-Cumulative Preferred Stock, Series 5 | | New York Stock Exchange | |
| | Depositary Shares, each representing a 1/40th interest in a share of Bank of America Corporation 6.70% Non-cumulativeNon-Cumulative Perpetual Preferred Stock, Series 6 | | New York Stock Exchange | |
| | Depositary Shares, each representing a 1/40th interest in a share of Bank of America Corporation 6.25% Non-cumulativeNon-Cumulative Perpetual Preferred Stock, Series 7 | | New York Stock Exchange | |
| | Depositary Shares, each representing a 1/1,200th interest in a share of Bank of America Corporation 8.625% Non-Cumulative Preferred Stock, Series 8 | | New York Stock Exchange | |
| | 6.75% Trust Preferred Securities of Countrywide Capital IV (and the guarantees related thereto) | | New York Stock Exchange | |
| | 7.00% Capital Securities of Countrywide Capital V (and the guarantees related thereto) | | New York Stock Exchange | |
| | Capital Securities of BAC Capital Trust I (and the guarantee related thereto) | | New York Stock Exchange | |
| Capital Securities of BAC Capital Trust II (and the guarantee related thereto) | | New York Stock Exchange | |
| Capital Securities of BAC Capital Trust III (and the guarantee related thereto) | | New York Stock Exchange | |
| 57/8% Capital Securities of BAC Capital Trust IV (and the guarantee related thereto)
| | New York Stock Exchange | |
| 6% Capital Securities of BAC Capital Trust V (and the guarantee related thereto) | | New York Stock Exchange | |
| 6% Capital Securities of BAC Capital Trust VIII (and the guarantee related thereto) | | New York Stock Exchange | |
| 61/4% Capital Securities of BAC Capital Trust X (and the guarantee related thereto)
| | New York Stock Exchange | |
| 67/8% Capital Securities of BAC Capital Trust XII (and the guarantee related thereto)
| | New York Stock Exchange | |
| | Floating Rate Preferred Hybrid Income Term Securities of BAC Capital Trust XIII (and the guarantee related thereto) | | New York Stock Exchange | |
| | 5.63% Fixed to Floating Rate Preferred Hybrid Income Term Securities of BAC Capital Trust XIV (and the guarantee related thereto) | | New York Stock Exchange | |
| | MBNA Capital A 8.278% Capital Securities, Series A (and the guarantee related thereto) | | New York Stock Exchange | |
| MBNA Capital B Floating Rate Capital Securities, Series B (and the guarantee related thereto) | | New York Stock Exchange | |
| MBNA Capital D 8.125% Trust Preferred Securities, Series D (and the guarantee related thereto) | | New York Stock Exchange | |
| MBNA Capital E 6.10% Trust Originated Preferred Securities, Series E (and the guarantee related thereto) | | New York Stock Exchange | |
| Preferred Securities of Fleet Capital Trust VIII (and the guarantee related thereto) | | New York Stock Exchange | |
| Preferred Securities of Fleet Capital Trust IX (and the guarantee related thereto) | | New York Stock Exchange | |
| 61/2% Subordinated InterNotesSM, due 2032
| | New York Stock Exchange | |
| 51/2% Subordinated InterNotesSM, due 2033
| | New York Stock Exchange | |
| 57/8% Subordinated InterNotesSM, due 2033
| | New York Stock Exchange | |
| 6% Subordinated InterNotesSM, due 2034
| | New York Stock Exchange | |
| Market-Linked Step Up Notes Linked to the S&P 500® Index, due November 26, 2012 | | NYSE Arca, Inc. | |
| | Market Index Target-Term Securities® Linked to the Dow Jones Industrial AverageSM due December 2, 2014 | | NYSE Arca, Inc. | |
| Market-Linked Step Up Notes Linked to the S&P 500® Index, due December 23, 2011 | | NYSE Arca, Inc. | |
| | Market Index Target-Term Securities® Linked to the S&P 500® Index, due September 27, 2013 | | NYSE Arca, Inc. | |
| | Leveraged Index Return Notes®Linked to the S&P 500® Index, due July 27, 2012
| | NYSE Arca, Inc. | |
| Market Index Target-Term Securities® Linked to the S&P 500® Index, due July 26, 2013 | | NYSE Arca, Inc. | |
| Leveraged Index Return Notes®Linked to the S&P 500® Index, due June 29, 2012
| | NYSE Arca, Inc. | |
| Leveraged Index Return Notes®Linked to the S&P 500® Index, due June 1, 2012
| | NYSE Arca, Inc. | |
| | Market Index Target-Term Securities® Linked to the Dow Jones Industrial AverageSM, due May 31, 2013 | | NYSE Arca, Inc. | |
| | Market Index Target-Term Securities® Linked to the S&P 500® Index, due April 25, 2014 | | NYSE Arca, Inc. | |
| | Market Index Target-Term Securities® Linked to the S&P 500® Index, due March 28, 2014 | | NYSE Arca, Inc. | |
| | Market Index Target-Term Securities® Linked to the S&P 500® Index, due February 28, 2014 | | NYSE Arca, Inc. | |
| | Market Index Target-Term Securities® Linked to the Dow Jones Industrial AverageSM, due January 30, 2015 | | NYSE Arca, Inc. | |
| | Market Index Target-Term Securities® Linked to the S&P 500® Index, due February 27, 2015 | | NYSE Arca, Inc. | |
|
| | | | |
| Title of each class | | Name of each exchange on which registered | |
| Capped Leveraged Return Notes®Linked to the S&P 500® Index, due February 24, 2012
| | NYSE Arca, Inc. | |
| Market-Linked Step Up Notes Linked to the S&P 500® Index, due February 25, 2013 | | NYSE Arca, Inc. | |
| | Market Index Target-Term Securities® Linked to the Dow Jones Industrial AverageSM, due March 27, 2015 | | NYSE Arca, Inc. | |
| | Capped Leveraged Index Return Notes®Linked to the S&P 500® Index, due March 30, 2012
| | NYSE Arca, Inc. | |
| Market Index Target-Term Securities® Linked to the Dow Jones Industrial AverageSM, due April 24, 2015 | | NYSE Arca, Inc. | |
| Capped Leveraged Index Return Notes®Linked to the S&P 500® Index, due April 27, 2012
| | NYSE Arca, Inc. | |
| Capped Leveraged Index Return Notes®Linked to the S&P 500® Index, due May 25, 2012
| | NYSE Arca, Inc. | |
| | Market Index Target-Term Securities® Linked to the Dow Jones Industrial AverageSM, due May 29, 2015 | | NYSE Arca, Inc. | |
| | Market Index Target-Term Securities® Linked to the Dow Jones Industrial AverageSM, due June 26, 2015 | | NYSE Arca, Inc. | |
| | Capped Leveraged Index Return Notes®Linked to the S&P 500® Index, due June 29, 2012
| | NYSE Arca, Inc. | |
| Capped Leveraged Index Return Notes®Linked to the S&P 500® Index, due July 27, 2012
| | NYSE Arca, Inc. | |
| Market Index Target-Term Securities® Linked to the S&P 500® Index, due July 31, 2015 | | NYSE Arca, Inc. | |
| Capped Leveraged Index Return Notes®Linked to the S&P 500® Index, due August 31, 2012
| | NYSE Arca, Inc. | |
Securities registered pursuant to Section 12(g) of the Act: None
Indicate by check mark if the registrant is a well-known seasoned issuer, as defined in Rule 405 of the Securities Act. Yes ü No
Indicate by check mark if the registrant is not required to file reports pursuant to Section 13 or Section 15(d) of the Act. Yes No ü
Indicate by check mark whether the registrant: (1) has filed all reports required to be filed by Section 13 or 15(d) of the Securities Exchange Act of 1934 during the preceding 12 months (or for such shorter period that the registrant was required to file such reports), and (2) has been subject to such filing requirements for the past 90 days. Yes ü No
Indicate by check mark whether the registrant has submitted electronically and posted on its corporate Web site, if any, every Interactive Data File required to be submitted and posted pursuant to Rule 405 of Regulation S-T during the preceding 12 months (or for such shorter period that the registrant was required to submit and post such files). Yes ü No
Indicate by check mark if disclosure of delinquent filers pursuant to Item 405 of Regulation S-K is not contained herein, and will not be contained, to the best of registrant’s knowledge, in definitive proxy or information statements incorporated by reference in Part III of this Form 10-K or any amendment to this Form 10-K.
Indicate by check mark whether the registrant is a large accelerated filer, an accelerated filer, a non-accelerated filer, or a smaller reporting company. See the definitions of “large accelerated filer,” “accelerated filer” and “smaller reporting company” in Rule 12b-2 of the Exchange Act. (Check one):
|
| | | | | | |
Large accelerated filer P | | Accelerated filer | | Non-accelerated filer | | Smaller reporting company |
| | | | | (do not check if a smaller reporting company) | | |
Indicate by check mark whether the registrant is a shell company (as defined in Rule 12b-2 of the Act). Yes No ü
The aggregate market value of the registrant’s common stock (“Common Stock”) held on June 30, 20112012 by non-affiliates was approximately $111,017,740,050$88,154,790,629 (based on the June 30, 20112012 closing price of Common Stock of $10.96$8.18 per share as reported on the New York Stock Exchange). As of February 17, 201225, 2013, there were 10,732,388,50110,820,274,944 shares of Common Stock outstanding.
Documents Incorporatedincorporated by reference: Portions of the definitive proxy statement relating to the registrant’s annual meeting of stockholders scheduled to be held on May 9, 20128, 2013 are incorporated by reference in this Form 10-K in response to itemsItems 10, 11, 12, 13 and 14 of Part III.
Table of Contents
Bank of America Corporation and Subsidiaries
Part I
Bank of America Corporation and Subsidiaries
Item 1. Business
General
Bank of America Corporation (together, with its consolidated subsidiaries, Bank of America, the Corporation, we or us) is a Delaware corporation, a bank holding company and a financial holding company. When used in this report, “the Corporation” may refer to theBank of America Corporation individually, theBank of America Corporation and its subsidiaries, or certain of theBank of America Corporation’s subsidiaries or affiliates. As part of our efforts to streamline the Corporation’s organizational structure, reduce complexity and costs, the Corporation has reduced and intends to continue to reduce the number of its corporate subsidiaries, including through intercompany mergers.
Bank of America is one of the world’s largest financial institutions, serving individual consumers, small- and middle-market businesses, institutional investors, large corporations and governments with a full range of banking, investing, asset management and other financial and risk management products and services. Our principal executive offices are located in the Bank of America Corporate Center, 100 North Tryon Street, Charlotte, North Carolina 28255.
Bank of America’s website is www.bankofamerica.com. Our Annual Reports on Form 10-K, Quarterly Reports on Form 10-Q, Current Reports on Form 8-K and amendments to those reports filed or furnished pursuant to Section 13(a) or 15(d) of the Securities Exchange Act of 1934 are available on our website at http://investor.bankofamerica.com under the heading U.S. Securities and Exchange Commission (SEC) Filings as soon as reasonably practicable after we electronically file such reports with, or furnish them to, the SEC. In addition, we make available on http://investor.bankofamerica.com under the heading Corporate Governance: (i) our Code of Ethics (including our insider trading policy); (ii) our Corporate Governance Guidelines; and (iii) the charter of each committee of our Board of Directors (the Board) (accessible by clicking on the committee names under the Committee Composition link), and we also intend to disclose any amendments to our Code of Ethics, or waivers of our Code of Ethics on behalf of our Chief Executive Officer, Chief Financial Officer or Chief Accounting Officer, on our website. All of these corporate governance materials are also available free of charge in print to stockholders who request them in writing to: Bank of America Corporation, Attention: Shareholder Relations,Office of the Corporate Secretary, Hearst Tower, 214 North Tryon Street, NC1-027-20-05, Charlotte, North Carolina 28202.
Segments
Through our banking and various nonbanking subsidiaries throughout the United StatesU.S. and in international markets, we provide a diversified range of banking and nonbanking financial services and products through sixfive business segments: Deposits, Card Services,Consumer & Business Banking (CBB), Consumer Real Estate Services (CRES), Global Commercial Banking, Global Banking & Markets (GBAM) and Global Wealth & Investment Management (GWIM), with the remaining operations recorded in All Other. Additional information related to our business segments and the products and services they provide is included in the information set forth on pages 3937 through 5553 of Item 7,7. Management’s Discussion and Analysis of Financial Condition and Results of Operations (MD&A), and Note 26 – Business Segment Information to the Consolidated Financial Statements in Item 8,8. Financial Statements and Supplementary Data (Consolidated Financial Statements).
Competition
We operate in a highly competitive environment. Our competitors include banks, thrifts, credit unions, investment banking firms, investment advisory firms, brokerage firms, investment companies, insurance companies, mortgage banking companies, credit card issuers, mutual fund companies and e-commerce and other internet-based companies. We compete with some of these competitors globally and with others on a regional or product basis.
Competition is based on a number of factors including, among others, customer service, quality and range of products and services offered, price, reputation, interest rates on loans and deposits, lending limits and customer convenience. Our ability to continue to compete effectively also depends in large part on our ability to attract new employees and retain and motivate our existing employees, while managing compensation and other costs.
Employees
As of December 31, 20112012, we had approximately 282,000267,000 full-time equivalent employees. None of our domestic employees isare subject to a collective bargaining agreement. Management considers our employee relations to be good.
Government Supervision and Regulation
The following discussion describes, among other things, elements of an extensive regulatory framework applicable to bank holding companies, financial holding companies, banks and banks,broker/dealers, including specific information about Bank of America. U.S. federal regulation of banks, bank holding companies and financial holding companies is intended primarily for the protection of depositors and the Deposit Insurance Fund (DIF) rather than for the protection of stockholders and creditors. For additional information about recent regulatory programs, initiatives and legislation that impact us, see Regulatory Matters in the MD&A on page 6664.
General
We are subject to an extensive regulatory framework applicable to bank holding companies, financial holding companies and banks.
As a registered financial holding company and bank holding company, Bank of America Corporation is subject to the supervision of, and regular inspection by, the Board of Governors of the Federal Reserve System (Federal Reserve). Our banking subsidiaries (the Banks) organized as national banking associations are subject to regulation, supervision and examination by the Office of the Comptroller of the Currency (OCC), the Federal Deposit Insurance Corporation (FDIC) and the Federal Reserve. The Bureau of Consumer Financial Protection Bureau (CFPB) regulates consumer financial products and services.
U.S. financial holding companies, and the companies under their control, are permitted to engage in activities considered “financial in nature” as defined by the Gramm-Leach-Bliley Act and related Federal Reserve interpretations. Unless otherwise limited by the Federal Reserve, a financial holding company may engage directly or indirectly in activities considered financial in nature provided the financial holding company gives the Federal Reserve after-the-fact notice of the new activities. The Gramm-Leach-Bliley Act also permits national banks to engage in activities considered financial in nature through a financial subsidiary, subject to certain conditions and limitations and with the approval of the OCC. If the Federal Reserve finds that any of theour Banks is not “well-capitalized” or “well-managed,” we would be required to enter into an agreement with the Federal Reserve to comply with all applicable capital and management requirements, which may contain additional limitations or conditions relating to our activities.
The Riegle-Neal Interstate Banking and Branching Efficiency Act of 1994 permits bank holding companies to acquire banks located in states other than their home state without regard to state law, subject to certain conditions, including the condition that the bank holding company, after and as a result of the acquisition, controls no more than 10 percent of the total amount of deposits of insured depository institutions in the United StatesU.S. and no more than 30 percent or such lesser or greater amount set by state law of such deposits in that state. The Dodd-Frank Wall Street Reform and Consumer Protection Act (Financial Reform Act) restricts acquisitions by financial companies if, as a result of the acquisition, the total liabilities of the financial company would exceed 10 percent of the total liabilities of all financial companies. At December 31, 2011,2012, we held approximately 12 percent of the total amount of deposits of insured depository institutions in the U.S.
We are also subject to various other laws and regulations, as well as supervision and examination by other regulatory agencies,
all of which directly or indirectly affect our operations and
management and our ability to make distributions to stockholders. Our U.S. broker/dealer subsidiaries are subject to regulation by and supervision of the SEC, New York Stock Exchange and Financial Industry Regulatory Authority; our commodities businesses in the U.S. are subject to regulation by and supervision of the U.S. CommoditiesCommodity Futures Trading Commission (CFTC); our derivatives activity is generally subject to regulation and supervision of the CFTC and National Futures Association or the SEC, and, in the case of the Banks, certain banking regulators; and our insurance activities are subject to licensing and regulation by state insurance regulatory agencies.
Our non-U.S. businesses are also subject to extensive regulation by various non-U.S. regulators, including governments, securities exchanges, central banks and other regulatory bodies, in the jurisdictions in which those businesses operate. Our financial services operations in the U.K. are subject to regulation by and supervision of the Financial Services Authority (FSA). In July of 2010, the U.K. proposed abolishing the FSA and replacing it with the Financial Policy Committee within the Bank of England (FPC) and two new regulators, the Prudential Regulatory Authority (PRA) and the Consumer Protection and Markets Authority (CPMA). OurAuthority. Under the proposal, our U.K. regulated entities will be subject to the supervision of the FPC and the PRA for prudential matters and the CPMA for conduct of business matters. The new financial regulatory structure is intendedscheduled to be in place by the end of 2012.formally established on April 1, 2013. We continue to monitor the development and potential impact of this regulatory restructuring.
Financial Reform Act
On July 21, 2010, the Financial Reform Act was signed into law. As a result of the Financial Reform Act, several significant regulatory developments occurred in 2011,2012, and additional regulatory developments may occur in 20122013 and beyond. The Financial Reform Act has had,impacted and will continue to have, a significant and negative impact on our earnings through fee reductions, higher costs and imposition of new restrictions.restrictions on us. For a description of significant developments, see Regulatory Matters – Financial Reform Act in the MD&A on page 6664.
Capital and Operational Requirements
The Federal Deposit Insurance Corporation Improvement Act of 1991 (FDICIA), among other things, identifies five capital categories for insured depository institutions (“well-capitalized,” “adequately capitalized,” “undercapitalized,” “significantly undercapitalized” and “critically undercapitalized”) and requires the respective federal regulatory agencies to implement systems for “prompt corrective action” for insured depository institutions that do not meet minimum capital requirements within such categories. FDICIA imposes progressively restrictive constraints on operations, management and capital distributions, depending on the category in which an institution is classified. Failure to meet the capital guidelines could also subject a banking institution to capital-raising requirements. An “undercapitalized” bank must develop a capital restoration plan and its parent holding company must guarantee that bank’s compliance with the plan.
As a financial services holding company, we and our banking subsidiaries are subject to the risk-based capital guidelines issued by the Federal Reserve (Basel I) and risk-based capital guidelines issued by other U.S. banking regulators. Underregulators, including the FDIC and the OCC. These capital rules are complex and are evolving as U.S. and international regulatory authorities propose enhanced capital rules in response to the financial crisis and pursuant to legislation, including the Financial Reform Act. The Corporation seeks to manage its capital position to maintain sufficient capital to meet these regulatory guidelines we measureand to support our business activities. These evolving capital adequacy based on Tier 1 capital, Tier 2rules are likely to influence our regulatory capital and Totalliquidity planning processes, and may impose additional operational and compliance costs on the Corporation.
For a discussion of regulatory capital (Tier 1 plus Tier 2 capital). rules, capital composition, and pending or proposed regulatory capital changes, see Capital ratiosManagement – Regulatory Capital and Capital Management – Regulatory Capital Changes in the MD&A on pages 70 and 72, and Note 17 – Regulatory Requirements and Restrictionsto the Consolidated Financial Statements, which are calculatedincorporated by dividing each capital amount by risk-weighted assets. Under Basel I, the minimum Tier 1 capital ratio is four percent and the minimum total capital ratio is eight percent. A “well-capitalized” institution must generallyreference in this Item 1.
|
| | |
2 Bank of America 20112012 | | |
maintain capital ratios an additional two percentage points higher than these minimum guidelines.
While not an explicit requirement of law or regulation, bank regulatory agencies have stated that they expect common equity to be the primary component of a financial holding company’s Tier 1 capital and that financial holding companies should maintain a Tier 1 common capital ratio of at least four percent.
The Tier 1 leverage ratio is determined by dividing Tier 1 capital by adjusted quarterly average total assets, after certain adjustments. “Well-capitalized” bank holding companies must have a minimum Tier 1 leverage ratio of four percent and not be subject to a Federal Reserve directive to maintain higher capital levels. “Well-capitalized” national banks must maintain a Tier 1 leverage ratio of at least five percent and not be subject to a Federal Reserve directive to maintain higher capital levels. We are currently classified as “well-capitalized” under Basel I.
The Basel II Final Rule (Basel II) was published in December 2007 and established requirements for U.S. implementation of Basel II and provided detailed requirements for a new regulatory capital framework. This regulatory capital framework includes requirements related to credit and operational risk (Pillar 1), supervisory requirements (Pillar 2) and disclosure requirements (Pillar 3). We are currently in the Basel II parallel period.
On December 16, 2010, the Basel Committee on Banking Supervision (Basel Committee) issued “Basel III: A global regulatory framework for more resilient banks and banking systems” (Basel III), proposing a January 2013 implementation date for Basel III. If implemented by U.S. banking regulators as proposed, Basel III could significantly increase our capital requirements. Basel III and the Financial Reform Act propose the disqualification of qualifying trust preferred securities from Tier 1 capital, with the Financial Reform Act proposing that the disqualification be phased in from 2013 through 2015. Basel III also proposes the deduction of certain assets from capital (including deferred tax assets, mortgage servicing rights (MSRs), investments in financial firms and pension assets, among others, within prescribed limitations), the inclusion of accumulated other comprehensive income (OCI) in capital, increased capital requirements for counterparty credit risk, and new minimum capital and buffer requirements. The phase-in period for the capital deductions is proposed to occur in 20 percent increments from 2014 through 2018 with full implementation by December 31, 2018. An increase in capital requirements for counterparty credit is proposed to be effective January 2013. The phase-in period for the new minimum capital requirements and related buffers is proposed to occur between 2013 and 2019. U.S. banking regulators have not yet issued proposed regulations that will implement these requirements.
On December 29, 2011, U.S. regulators issued a notice of proposed rulemaking (NPR) that would amend a December 2010 NPR on the Market Risk Rules. This amended NPR is expected to increase the capital requirements for our trading assets and liabilities. We continue to evaluate the capital impact of the proposed rules and currently anticipate that we will be in compliance with any final rules by the projected implementation date in late 2012.
On June 17, 2011, U.S. banking regulators proposed rules requiring all large bank holding companies (BHCs) to submit a comprehensive capital plan to the Federal Reserve as part of an annual Comprehensive Capital Analysis and Review (CCAR). The proposed regulations require BHCs to demonstrate adequate capital to support planned capital actions, such as dividends,
share repurchases or other forms of distributing capital. CCAR submissions are subject to approval by the Federal Reserve. The Federal Reserve may require BHCs to provide prior notice under certain circumstances before making a capital distribution.
On July 19, 2011, the Basel Committee published the consultative document “Globally systemic important banks: Assessment methodology and the additional loss absorbency requirement” which sets out measures for global, systemically important financial institutions including the methodology for measuring systemic importance, the additional capital required (the SIFI buffer), and the arrangements by which they will be phased in. As proposed, the SIFI buffer would be met with additional Tier 1 common equity ranging from one percent to 2.5 percent, and in certain circumstances, 3.5 percent. This will be phased in from 2016 through 2018. U.S. banking regulators have not yet provided similar rules for U.S. implementation of a SIFI buffer.
In addition to the capital proposals, in December 2010 the Basel Committee proposed two measures of liquidity risk. The Liquidity Coverage Ratio (LCR) identifies the amount of unencumbered, high-quality liquid assets a financial institution holds that can be used to offset the net cash outflows the institution would encounter under an acute 30-day stress scenario. The Net Stable Funding Ratio (NSFR) measures the amount of longer-term, stable sources of funding employed by a financial institution relative to the liquidity profiles of the assets funded and the potential for contingent calls on funding liability arising from off-balance sheet commitments and obligations, over a one-year period. These two minimum liquidity measures are also considered part of Basel III.
Given that the U.S. regulatory agencies have issued neither proposed rulemaking nor supervisory guidance on Basel III, significant uncertainty exists regarding the ultimate impacts of Basel III on U.S. financial institutions, including us.
For additional information about our calculation of regulatory capital and capital composition, see Capital Management – Regulatory Capital in the MD&A on page 72, and Note 18 – Regulatory Requirements and Restrictionsto the Consolidated Financial Statements. For more information about regulatory capital changes, see Capital Management – Regulatory Capital Changes in the MD&A on page 73.
Distributions
We are subject to various regulatory policies and requirements relating to the payment of dividends, including requirements to maintain capital above regulatory minimums. The appropriate federal regulatory authority is authorized to determine, under certain circumstances relating to the financial condition of a bank or bank holding company, that the payment of dividends would be an unsafe or unsound practice and to prohibit payment thereof. For instance, under proposed rules, we are required to submit to the Federal Reserve a capital plan as part of an annual CCAR (theComprehensive Capital Plan)Analysis and Review (CCAR). Supervisory review of the CCAR has a stated purpose of assessing the capital planning process of major U.S. bank holding companies, including any planned capital actions such as the payment of dividends on common stock. For additional information regarding the restrictions on our ability to receive dividends or other distributions from the Banks, see Item 1A. Risk Factors.
In addition, our ability to pay dividends is affected by the various minimum capital requirements and the capital and non-capital standards established under FDICIA, as described above.the Federal Deposit Insurance Corporation Improvement Act of 1991 (FDICIA). The right
of the Corporation, our stockholders and our creditors to participate in any distribution of the assets or earnings of our subsidiaries is further subject to the prior claims of creditors of the respective subsidiaries.
For additional information regarding the requirements relating to the payment of dividends, including the minimum capital requirements, see Note 1514 – Shareholders’ Equity and Note 1817 – Regulatory Requirements and Restrictions to the Consolidated Financial Statements.
Source of Strength
According to the Financial Reform Act and Federal Reserve policy, bank holding companies are expected to act as a source of financial strength to each subsidiary bank and to commit resources to support each such subsidiary. Similarly, under the cross-guarantee provisions of the FDICIA, in the event of a loss suffered or anticipated by the FDIC, - either as a result of default of a banking subsidiary or related to FDIC assistance provided to such a subsidiary in danger of default, - the affiliate banks of such a subsidiary may be assessed for the FDIC’s loss, subject to certain exceptions. For additional information about our calculation of regulatory capital and capital composition, and proposed capital rules, see Capital Management – Regulatory Capital in the MD&A on page 7270, and Note 1817 – Regulatory Requirements and Restrictions to the Consolidated Financial Statements.
Deposit Insurance
Deposits placed at U.S. domiciled Banksbanks (U.S. Banks)banks) are insured by the FDIC, subject to limits and conditions of applicable law and the FDIC’s regulations. Pursuant to the Financial Reform Act, FDIC insurance coverage limits were permanently increased to $250,000
$250,000 per customer. The Financial Reform Act also provides for unlimited FDIC insurance coverage for noninterest-bearing demand deposit accounts for a two-year period beginning on December 31, 2010 and ending on January 1, 2013. All insured depository institutions are required to pay assessments to the FDIC in order to fund the DIF.
The FDIC is required to maintain at least a designated minimum ratio of the DIF to insured deposits in the U.S. The Financial Reform Act requires the FDIC to assess insured depository institutions to achieve a DIF ratio of at least 1.35 percent by September 30, 2020. The FDIC has adopted new regulations that establish a long-term target DIF ratio of greater than two percent. The DIF ratio is currently below the required targets and the FDIC has adopted a restoration plan that will result in substantially higher deposit insurance assessments for all depository institutions over the coming years. Deposit insurance assessment rates are subject to change by the FDIC and will be impacted by the overall economy and the stability of the banking industry as a whole. For additional information regarding deposit insurance, see Item 1A. Risk Factors – Regulatory and Legal Risk on page 1412 and Regulatory Matters – Financial Reform Act and Regulatory Matters – FDIC Deposit Insurance Assessments in the MD&A on pages 6664 and 6765.
Transactions with Affiliates
U.S.The Banks are subject to restrictions under federal law that limit certain types of transactions between the Banks and their non-bank affiliates. In general, U.S. Banks are subject to quantitative and qualitative limits on extensions of credit, purchases of assets and certain other transactions involving Bank of America and its non-bank affiliates. Transactions between the U.S. Banks and their
non-bank affiliates are required to be on arm’s length terms. For additional information regarding transactions with affiliates, see Regulatory Matters – Transactions with Affiliates in the MD&A on page 6866.
Privacy and Information Security
We are subject to many U.S. federal, state and international laws and regulations governing requirements for maintaining policies and procedures to protect the non-public confidential information of our customers. The Gramm-Leach-Bliley Act requires the Banks to periodically disclose Bank of America’s privacy policies and practices relating to sharing such information and enables retail customers to opt out of our ability to marketshare information with unaffiliated third parties under certain circumstances. Other laws and regulations, at both the federal and state level, impact our ability to share certain information with affiliates and non-affiliates under certain circumstances.for marketing and/or non-marketing purposes, or to contact customers with marketing offers. The Gramm-Leach-Bliley Act also requires the Banks to implement a comprehensive information security program that includes administrative, technical, and physical safeguards to ensure the security and confidentiality of customer records and information. These security and privacy policies and procedures for the protection of personal and confidential information are in effect across all businesses and geographic locations.
Item 1A. Risk Factors
In the course of conducting our business operations, we are exposed to a variety of risks, some of which are inherent in the financial services industry and others of which are more specific to our own businesses. The following discussion below addresses the most significant factors, of which we are aware, that could affect our businesses, results of operations and financial condition. Additional factors that could affect our businesses, results of operations and financial condition and operations are discussed in Forward-looking Statements in the MD&A on page 25.“Forward-looking Statements.” However, other factors not discussed below or elsewhere in this Annual Report on Form 10-K could also adversely affect our businesses, results of operations and financial condition. Therefore, the risk factors below should not be considered a complete list of potential risks that we may face.
Any risk factor described in this Annual Report on Form 10-K or in any of our other SEC filings could by itself, or together with other factors, materially adversely affect our liquidity, cash flows, competitive position, business, results of operations or financial condition.
General Economic and Market Conditions Risk
Our businesses and results of operations have been, and may continue to be materially and adversely affected by the U.S. and international financial markets and economic conditions generally.
Our businesses and results of operations are materially affected by the financial markets and general economic conditions in the U.S. and abroad, including factors such as the level and volatility of short-term and long-term interest rates, inflation, home prices, unemployment and under-employment levels, bankruptcies, household income, consumer spending, fluctuations in both debt and equity capital markets, liquidity of the global financial markets, the availability and cost of capital and credit, investor sentiment and confidence in the financial markets, European sovereign debt risks and the strength of the U.S. economy and the non-U.S. economies in which we operate. The deterioration of any of these conditions cancould adversely affect our consumer and commercial businesses and securities portfolios, our level of charge-offs and provision for credit losses, the carrying value of our deferred tax assets, our capital levels and liquidity, and our results of operations.
Although the U.S. economy continued its modest recovery in 2011,Continued elevated unemployment, under-employment and household debt, along with continued stress in the consumer real estate market and certain commercial real estate markets, in the U.S. pose
challenges for domestic economic performance and the financial services industry. The sustained high unemployment rate and the lengthy duration of unemployment have directly impaired consumer finances and pose risks to the financial services industry. TheContinued uncertainty in the housing market remains weakmarkets and elevated levels of distressed and delinquent mortgages pose further risks to the housing market. In addition, the public perception of certain financial services firms and practices appeared to decline during 2011. The current environment of heightened scrutiny of financial institutions has resulted in increased public awareness of and sensitivity to banking fees and practices. Mortgage and housing market-related risks may be accentuated by attempts to forestall foreclosure proceedings, as well as state and federal investigations into foreclosure practices by mortgage servicers. Each of these factors may adversely affect our fees and costs.
For additional information about economic conditions and challenges discussed above, see Executive Summary – 20112012 Economic and Business Environment in the MD&A on page 2726.
Mortgage and Housing Market-Related Risk
Our mortgage loan repurchase obligations or claims from third parties could result in additional material losses.
We and our legacy companies have been, and expect to continue to be, required to repurchasesold significant amounts of residential mortgage loans and/or reimbursedirectly to government-sponsored enterprises, Fannie Mae (FNMA) and Freddie Mac (FHLMC) (collectively, the GSEs), and monolines for losses due to claims related to representations and warranties made in connection with sales of residential mortgage-backed securities (RMBS) and mortgage loans, and have received similar claims, and may receive additional claims, from whole-loan purchasers, private-label securitization investors and private-label securitization trustees, monolines and others. The ultimate resolution of these exposures could have a material adverse effect on our cash flows, financial condition and results of operations.
In connection with residential mortgage loans sold to GSEs and first-lien residential mortgage and home equity loans sold to investors other than GSEs as whole loans or private-label securitizations. In connection with these sales, we or certain of our subsidiaries or legacy companies make or have made various representations and warranties. Breacheswarranties, breaches of these representations and warrantieswhich may result in a requirement that we repurchase the mortgage loans, or indemnifyotherwise make whole or provide other remedies to counterparties (collectively, repurchases)counterparties. For example, we and such legacy companies sold over $2 trillion of such loans originated between 2004 and 2008.
On January 6, 2013, we entered into agreements with FNMA (FNMA Settlement) to resolve substantially all outstanding and potential repurchase and certain other claims relating to the origination, sale and delivery of residential mortgage loans originated and sold directly to FNMA from January 1, 2000 through December 31, 2008 by entities related to legacy Countrywide Financial Corporation (Countrywide) and Bank of America, N.A. (BANA). The Corporation and legacy Countrywide sold approximately $1.1 trillionFNMA Settlement extinguished substantially all of loans originated from 2004 through 2008 to the GSEs. In addition, legacy companies and certain subsidiaries sold loans originated from 2004 through 2008 with an original principal balance of $963 billion to investors other than GSEs.
The amount of our total unresolved repurchase claims from all sources totaledFNMA, as well as any future representations and warranties repurchase claims, associated with such loans, subject to certain exceptions which we do not expect to be material.
At December 31, 2012, the total notional amount of our unresolved representations and warranties repurchase claims was approximately $14.3$28.3 billion, which included $12.2 billion resolved by the FNMA Settlement, compared to $12.6 billion at December 31, 2011. The total amount of our recorded liability related to representations and warranties repurchase exposure was $15.9 billion at December 31, 2011.
Our estimated liability at December 31, 2011 for obligations under representations and warranties with respect to GSE exposures is necessarily dependent on, and limited by, our historical claims experience with the GSEs. It includes our understanding of our agreements with the GSEs and projections of future defaults, as well as certain other assumptions and judgmental factors. The GSEs’ repurchase requests, standards for rescission of repurchase requests and resolution processes have become increasingly inconsistent with the GSEs’ own past conduct and our interpretation of our contractual obligations. These developments have resulted in an increase in claims outstanding
from the GSEs. We are not able to predict changes in the behavior of the GSEs based on our past experiences. Therefore, it is not possible to reasonably estimate a possible loss or range of possible loss with respect to any such potential impact in excess of current accrued liabilities.
Beginning in February 2012, we are no longer delivering purchase money and non-Making Home Affordable Program (MHA) refinance first-lien residential mortgage products into FNMA mortgage-backed securities (MBS) pools because of the expiration and mutual non-renewal of certain contractual delivery commitments and variances that permit efficient delivery of such loans to FNMA. While we continue to have a valid agreement with FNMA permitting the delivery of purchase money and non-MHA refinance first-lien residential mortgage products without such contractual delivery commitments and variances, the delivery of such products without such contractual variances would involve time and expense to implement the necessary operational and systems changes and otherwise present practical operational issues. The non-renewal of these contractual delivery commitments and variances was influenced, in part, by our ongoing differences with FNMA in other contexts, including repurchase claims. We continue to deliver MHA refinancing products into FNMA MBS pools, and continue to engage in dialogue to attempt to address these differences.
While we are seeking to resolve our differences with the GSEs concerning each party’s interpretation of the requirements of the governing contracts, whether we will be able to achieve a resolution of these differences on acceptable terms and timing thereof, is subject to significant uncertainty.
In addition to repurchase claims, we receive notices from mortgage insurance (MI) companies of claim denials, cancellations or coverage rescission (collectively, MI rescission notices) and the amountnumber of such notices havehas remained elevated. As of December 31, 2011, 742012, 68 percent of the MI rescission notices we have received hadhave not yet been resolved. On June 30, 2011,The FNMA issued an announcement requiring servicers to report, effective October 1, 2011, all MI rescission noticesSettlement clarified the parties’ obligations with respect to loans soldMI, including establishing timeframes for certain payments and other actions, setting parameters for potential bulk settlements and providing for cooperation in future dealings with mortgage insurers. As a result, we will be required to FNMA. The announcement also confirmed FNMA’s viewremit to FNMA the amount of its position thatcertain MI coverage as a result of MI claims rescissions in advance of collection from the mortgage insurance company’s issuancecompanies and, in certain cases, we may not ultimately collect all such amounts from the mortgage insurance companies.
The total amount of a MI rescission notice constitutes a breach of the lender’sour recorded liability related to representations and warranties and permits FNMArepurchase exposures (which includes exposures related to require the lender to repurchase the mortgage loan or promptly remit a make-whole payment covering FNMA’s loss even if the lender is contesting the mortgage insurer’s rescission.MI rescission notices) was $19.0 billion at December 31, 2012. We have informed FNMA that we do not believecurrently estimate that the new policy is valid under our relevant contracts with FNMA and that we do not intend to repurchase loans under the terms set forth in the new policy. If we are required to abide by the termsrange of the new FNMA policy, ourpossible loss for representations and warranties liability will likely increase.exposures could be up to $4 billion over accruals at December 31, 2012. This range of possible loss reflects the impact of the FNMA Settlement and covers principally non-GSE exposures. Our estimated range of possible loss does not represent a probable loss.
Our estimated liability and range of possible loss with respect to non-GSEfor representations and warranties exposures is based on then-currently available information and is necessarily dependent on, and limited by a number of factors, including our historical claims and settlement experience, with non-GSE counterpartiesincluding the FNMA Settlement,
projections of future defaults and, for private-label securitizations, the implied repurchase experience based on the pending Bank of New York Mellon settlement (BNY Mellon Settlement), as well as significant judgment and a number of assumptions that are subject to change, including the assumption that the conditions to the BNY Mellon Settlement are satisfied. As a result, our liability and estimated range of possible loss related to our representations and warranties exposures may materially change in the future based on factors beyond our control. Future provisions and/or estimated ranges of possible loss for non-GSE representations and warranties may be significantly impacted if actual experiences are different from our assumptions in our predictive models, including, without limitation, those regarding ultimate resolution of the Bank of New YorkBNY Mellon settlement (BNY Mellon Settlement),Settlement, estimated repurchase rates, economic conditions, estimated home prices, consumer and counterparty behavior, and a variety of other judgmental factors. In addition, we have not recorded any
representations and warranties liability for certain potential monoline exposures and certain potential whole-loan and other private-label securitization exposures. We currently estimate that the range of possible loss relatedand whole-loan exposures where we have little to non-GSE representations and warranties exposure as of December 31, 2011 could be up to $5.0 billion over existing accruals. Reservesno claim experience. Additionally, reserves for certain potential monoline exposureexposures are considered in our litigation reserves. This estimated range of possible loss for non-GSE representations and warranties does not represent a probable loss, is based on currently available information, significant judgment and a number of assumptions that are subject to change, including the assumption that the conditions to the BNY Mellon Settlement are satisfied.
Adverse developments with respect to one or more of the assumptions underlying the liability for non-GSE representations and warranties and the corresponding estimated range of possible loss could result in significant increases to future provisions and ourand/or the estimated range of possible loss. For example, if courts, in the context of claims brought by private-label securitization trustees, were to disagree with our interpretation that the underlying agreements require a claimant to prove that the representations and warranties breach was the cause of the loss, it could significantly impact the estimated range of possible loss. Additionally, if recent court rulings related to monoline litigation, including one related to us, that have allowed sampling of loan files instead of requiring a loan-by-loan review to determine if a representations and warranties breach has occurred, are followed generally by the courts in other monoline litigation, private-label securitization counterparties may view litigation as a more attractive alternative compared to a loan-by-loan review.
If future representations and warranties losses occur in excess of our recorded liability for GSE exposures and in excess of our recorded liability and estimated range of possible loss, for non-GSE exposures, including as a result of the factors set forth above, such losses could have a material adverse effect on our cash flows, financial condition and results of operations. The liability for obligations under representations and warranties with respect to GSE and non-GSE exposures and the corresponding estimated range of possible loss related to non-GSE representations and warranties exposures do not includeconsider any losses related to litigation matters, including litigation brought by monoline insurers, disclosed in Note 1413 – Commitments and Contingencies to the Consolidated Financial Statements, nor do they include any separate foreclosure costs and related costs, assessments and compensatory fees or any other possible losses related to potential claims for breaches of performance of servicing obligations (except as such losses are included as potential costs of the BNY Mellon settlement)Settlement), potential securities law or fraud claims or potential indemnity or other claims against us, including claims related to loans guaranteedinsured by the Federal Housing Administration (FHA). We are not able to reasonably estimate the amount of any possible loss with respect to any such servicing, securities law, (exceptfraud or other claims against us, except to the extent reflected in the aggregate range of possible loss for litigation and regulatory matters disclosed in Note 1413 – Commitments and Contingencies to the Consolidated Financial Statements), fraud or other claims against us;; however,
such loss could have a material adverse effect on our cash flows,
financial condition and results of operations.
For additional information about our representations and warranties exposure, see Off-Balance Sheet Arrangements and Contractual Obligations – Representations and Warranties in the MD&A on page 5654, Consumer Portfolio Credit Risk Management in the MD&A on page 8180 and Note 98 – Representations and Warranties Obligations and Corporate Guarantees to the Consolidated Financial Statements.
If final court approval is not obtained with respect to the BNY Mellon Settlement to resolve nearly all of the legacy Countrywide-issued first-lien non-GSE RMBS repurchase exposures of the 2004-2008 vintages, or if the Corporation and legacy Countrywide determine to withdraw from the BNY Mellon Settlement in accordance with its terms, the Corporation’s futureOur representations and warranties losses could be substantially higher than existing accruals and the existing estimated range of possible loss over existing accruals,for representations and consequently could have a material adverse effect on our cash flows, financial condition and resultswarranties liability if court approval of operations.the BNY Mellon Settlement is not obtained or if it is otherwise abandoned.
The BNY Mellon Settlement is subject to final court approval and certain other conditions. It is notAlthough the final court hearings on the settlement are scheduled to begin on May 30, 2013, we cannot currently possible to predict the timing or ultimate outcome of the court approval process, which can include appeals and could take a substantial period of time. There can be no assurance that final court approval of the settlementBNY Mellon Settlement will be obtained, that all conditions will be satisfied (including the receipt of private letter rulings from the IRS and other tax rulings and opinions) or, that, if certain conditions into the BNY Mellon Settlement permitting withdrawal are met, that the Corporation and legacy Countrywide will not determine to withdraw from the BNY Mellon Settlement agreement.
If final court approval is not obtained with respect to the BNY Mellon Settlement, or if the Corporation and legacy Countrywide determine to withdraw from the BNY Mellon Settlement agreement in accordance with its terms, the Corporation’s future representations and warranties losses with respect to non-GSEs could substantially exceed our non-GSE reserve, together with our estimated range of reasonably possible loss related to non-GSEfor all representations and warranties exposureexposures of up to $5.0$4 billion over existing accruals at December 31, 2011.2012. Developments with respect to one or more of the assumptions underlying the estimated range of possible loss for non-GSE representations and warranties (including the timing and ultimate outcome of the court approval process relating to the BNY Mellon Settlement) could result in significant increases in our non-GSE reserve and/or to this estimated range of possible loss, and such increases could have a material adverse effect on our cash flows, financial condition and results of operations. loss.
For additional information regarding the BNY Mellon Settlement, see Off-Balance Sheet Arrangements and Contractual ObligationsNote 8 – Representations and Warranties inObligations and Corporate Guaranteesto the MD&A on page 56Consolidated Financial Statements.
Further weakness inIf the U.S. housing market includingweakens, or home prices may adversely affectdecline, our consumer loan portfolios, credit quality, credit losses, representations and have a significant adverse effect on our financial conditionwarranties exposures, and results of operations.earnings may be adversely affected.
Economic weakness in 2011 was accompanied by continued stress in theAlthough U.S. housing market, including declines in home prices. These declines in the housing market, with falling home prices and elevated foreclosures, have shown signs of improvement during 2012, the declines over the past several years negatively impacted the demand for many of our products and the credit performance of our consumer mortgage portfolios. Additionally, our mortgage loan production volume is generally influenced by the rate of growth in residential mortgage debt outstanding and the size of the residential mortgage market, which has declined due to reduced activity in the housing market. Continued high unemployment rates in the U.S. have challenged U.S. consumers and further compounded these stresses in the U.S. housing market as employment conditions may be compelling some consumers to delay new home purchases or miss payments on existing mortgages.
Conditions in the U.S. housing market haveover the past several years also resulted in significant write-downs of asset values in several asset classes, notably MBSmortgage-backed securities (MBS), and exposure to monolines. These conditions may negatively affectIf the U.S. housing market were to weaken, the value of real estate could decline, which could negatively affect our exposure to representations and warranties. While there were continued indications throughout the past yearin 2012 that the U.S. economy is stabilizing, the performance of our overall consumer portfolios may not significantly improve in the near future. A protracted continuation or worsening of these difficult housing market conditions may exacerbate the adverse effects outlined above and have a significant adverse effect on our financial condition and results of operations.
|
| | |
| | 6Bank of America 201120125
| | |
We temporarily suspended our foreclosure sales nationallynot significantly improve in 2010 to conduct an assessmentthe near future. A protracted continuation or worsening of our foreclosure processes. Subsequently, numerous statedifficult housing market conditions may exacerbate the adverse effects outlined above and federal investigations of foreclosure processes across our industry have been initiated. Those investigations and any irregularities that might be found in our foreclosure processes, along with any remedial steps taken in response to governmental investigations or to our own internal assessment, could have a materialsignificant adverse effect on our financial condition and results of operations.
In addition, our home equity portfolio, which makes up approximately 30 percent of our total home loans portfolio, contains a significant percentage of loans in second-lien or more junior-lien positions, and such loans have elevated risk characteristics. Our home equity portfolio had an outstanding balance of $108.0 billion as of December 31, 2012, including $91.3 billion of home equity lines of credit, $15.3 billion of home equity loans and $1.4 billion of reverse mortgages. Of the total home equity portfolio at December 31, 2012, $21.1 billion, or 20 percent, were in first-lien positions (21 percent excluding the Countrywide PCI home equity portfolio) and $86.9 billion, or 80 percent (79 percent excluding the Countrywide PCI home equity portfolio) were in second-lien or more junior-lien positions.
Continued mortgage foreclosure delays and investigations into our residential mortgage foreclosure practices and our compliance with regulatory orders related to past and current servicing and foreclosure activities may significantly increase our costs. In addition, mortgage foreclosure proceedings have been slow in certain states due to a high volume of pending proceedings, which may cause us to have higher credit losses.
We temporarily suspended foreclosure sales in 2010 while we and regulatory authorities examined our foreclosure processes. Although we have resumed foreclosure sales in nearly all states, our progress on foreclosure sales in states where foreclosure requires a court order (judicial states) has been much slower than in those states where foreclosure does not require a court order (non-judicial states). While we have resumed foreclosure proceedings in nearly all states where a court order is required (judicial states), our progress on foreclosure sales in judicial states has been much slower than in non-judicial states. The pace of foreclosure sales in judicial states increased significantly by the fourth quarter of 2011. However, thereThere continues to be a backlog of foreclosure inventory in judicial states.states as the process of obtaining a court order can significantly increase the time required to complete a foreclosure. Excluding fully-insured portfolios, approximately 30 percent of our residential mortgage loan portfolio, including 36 percent of nonperforming residential mortgage loans, and 36 percent of our home equity portfolio, including 44 percent of nonperforming home equity loans, were in judicial states as of December 31, 2012.
The implementation of changes in procedures and controls, including loss mitigation procedures related to our ability to recover on FHA insurance-related claims, and governmental, regulatory and judicial actions, may result in continuing delays in foreclosure proceedings and foreclosure sales and create obstacles to the collection of certain fees and expenses, in both judicial and non-judicial foreclosures.foreclosures, which could cause us to have higher credit losses.
We entered into a consent order with the Federal Reserve and Bank of America, N.A. (BANA)BANA entered into a consent order with the OCC on April 13, 2011.2011 (2011 OCC Consent Order). The 2011 OCC consent orderConsent Order required that we retain an independent consultant, approved by the OCC, to conduct a review of all foreclosure actions pending, or foreclosure sales that occurred, between January 1, 2009 and December 31, 2010, and submit a plan to the OCC to remediate all financial injury to borrowers caused by any identified foreclosure deficiencies identified throughfollowing an independent foreclosure review (IFR). On January 7, 2013, we and other mortgage servicing companies reached an agreement in principle with the review.Federal Reserve and the OCC to cease the IFR and replace it with an accelerated remediation process (2013 IFR Acceleration Agreement). Under the 2013 IFR Acceleration Agreement, we made a cash payment of $1.1 billion and agreed to provide approximately $1.8 billion of borrower
assistance in the form of loan modifications and other foreclosure prevention actions.
In March 2012, we entered into settlement agreements with the U.S. Department of Justice, various federal regulatory agencies and 49 state Attorneys General; the U.S. Department of Housing and Urban Development (HUD); and the Federal Reserve and the OCC (collectively, the National Mortgage Settlement). The review is comprised of two parts:National Mortgage Settlement became final upon a sample file review conducted by the independent consultant, which beganU.S. District Court order in October 2011,April 2012 and file reviews by the independent consultant based upon requests for review from customers with in-scope foreclosures. We began outreach to those customers in November 2011(1) resolved federal and additional outreach efforts are underway. Because the review process is available to a large number of potentially eligible borrowers and involves an examination of many details and documents, each review could take several months to complete. We cannot yet determine how many borrowers will ultimately request a review, how many borrowers will meet the eligibility requirements or how much in compensation might ultimately be paid to eligible borrowers.
We continue to be subject to additional borrower and non-borrower litigation and governmental and regulatory scrutiny related to our past and currentstate investigations into certain origination, servicing and foreclosure activities, including thosepractices, (2) resolved certain HUD claims relating to the origination of FHA-insured mortgage loans, primarily by Countrywide prior to and for a period following our acquisition of that lender, and (3) imposed civil monetary penalties by both the Federal Reserve and the OCC related to conduct that was the subject of the 2011 OCC Consent Order. The National Mortgage Settlement did not covered by the Servicing Resolution Agreements, defined below. This scrutiny may extend beyond our pending foreclosure matters to issuescover claims arising out of alleged irregularitiessecuritization (including representations made to investors with respect to previously completedMBS), criminal claims, private claims by borrowers, claims by certain states for injunctive relief or actual economic damages to borrowers related to Mortgage Electronic Registration Systems, Inc. (MERS), and claims by the GSEs (including repurchase demands), among other items. Under the terms of the National Mortgage Settlement, we must establish certain uniform servicing standards and make available approximately $7.6 billion in borrower assistance in the form of, among other things, principal reduction, short sales and deeds-in-lieu of foreclosure, activities. The current environmentand approximately $1.0 billion in refinancing assistance. We also entered into agreements with several states under which we committed to perform certain minimum levels of heightened regulatory scrutiny hasprincipal reduction and related activities within those states.
As part of the potentialFNMA Settlement, we agreed to subject usmake a cash payment to inquiries or investigations that could significantly adversely affect our reputation. Such investigations by stateFNMA to settle substantially all of FNMA’s outstanding and federal authorities, as well as any other governmental or regulatory scrutinyfuture claims for compensatory fees arising out of ourpast foreclosure processes, could result in material fines, penalties, equitable remedies, additional default servicing requirements and process changes, or other enforcement actions, and could result in significant legal costs in responding to governmental
investigations and additional litigation and, accordingly, could have a material adverse effect on our financial condition and results of operation.
Wedelays. Notwithstanding the FNMA Settlement, we expect that mortgage-related assessments and waiverswaiver costs, including compensatory fees, assessed by the GSEs and other costs associated with foreclosures will remain elevated as additional loans are delayed in the foreclosure process. This will likely result in continued higherelevated noninterest expense, including higher default servicing costs and legal expenses, in CRES. In addition,which may be partially offset by the impact of MSR sales. Contributing to the elevated default servicing costs are required process changes, including those required under the consent orders with federal bank regulators, are likely to result in further increases in our default servicing costs over the longer term.regulators. Delays in foreclosure sales may result in additional costs associated with the maintenance of properties or possible home price declines, result in a greater number of nonperforming loans and increased servicing advances and may adversely impact the collectability of such advances and the value of our MSR asset, MBS and real estate owned properties. With respect to GSE MBS, the valuation of certain MBS could be negatively affected under certain scenarios due to changes in the timing of cash flows. With respect to non-GSE MBS, under certain scenarios the timing and amount of cash flows could be negatively affected.
We continue to be subject to additional borrower and non-borrower litigation and governmental and regulatory scrutiny related to our past and current servicing and foreclosure activities, including those claims not covered by the National Mortgage Settlement. This scrutiny may extend beyond our pending foreclosure matters to issues arising out of alleged irregularities with respect to previously completed foreclosure activities. The current environment of heightened regulatory scrutiny has the potential to subject us to inquiries or investigations that could
adversely affect our reputation. Such investigations by state and federal authorities, as well as any other governmental or regulatory scrutiny of our foreclosure processes, could result in fines, penalties, equitable remedies, additional default servicing requirements and process changes, or other enforcement actions, and could result in higher legal costs in responding to governmental investigations and additional litigation.
For additional information regarding the temporary suspension of our foreclosure sales, see Off-Balance Sheet Arrangements and Contractual Obligations – Other Mortgage-related Matters in the MD&A on page 6361.
We reached an agreement in principle (AIP) with the U.S. Department of Justice (DOJ), various federal agencies and 49 state attorneys general, to resolve various investigations into our foreclosure, servicing and certain mortgage origination practices. We also reached an agreement in principle with the FHA to resolve certain claims relating to the origination of FHA-insured mortgage loans and agreements in principle with the Federal Reserve and OCC regarding civil monetary penalties. These agreements are subject to ongoing discussions among the parties and the completion and execution of definitive documentation, as well as required regulatory and court approvals. Failure to finalize the documentation or to obtain the required approvals with respect to these agreements in principle, and failure to meet certain borrower assistance and refinancing assistance commitment goals in the agreements in principle which would trigger additional monetary payments and exposure to claims not covered by the agreements in principle, could have a material adverse effect on our financial condition or results of operations.
On February 9, 2012, we reached agreements in principle (collectively, the Servicing Resolution Agreements) with (1) the DOJ, various federal regulatory agencies and 49 attorneys general to resolve federal and state investigations into certain origination, servicing and foreclosure practices (the Global AIP), (2) the FHA to resolve certain claims relating to the origination of FHA-insured mortgage loans, primarily by Countrywide prior to and for a period following our acquisition of that lender (the FHA AIP) and (3) each of the Federal Reserve and the OCC regarding civil monetary penalties related to conduct that was the subject of consent orders entered into with the banking regulators in April 2011 (the Consent Order AIPs).
The Servicing Resolution Agreements are subject to ongoing discussions among the parties and completion and execution of definitive documentation, as well as required regulatory and court approvals. The Global AIP is subject to, among other things, Federal court approval in the United States District Court in the District of Columbia and regulatory approvals of the United States
Department of the Treasury and other federal agencies. The Consent Order AIPs are subject to, among other things, the finalization of the Global AIP. There can be no assurance as to when or whether binding settlement agreements will be reached, that they will be on terms consistent with the agreements in principle, or as to when or whether the necessary approvals will be obtained and the settlements will be finalized.
The Global AIP calls for the establishment of certain uniform servicing standards, upfront cash payments of approximately $1.9 billion to the state and federal governments and for borrower restitution, approximately $7.6 billion in borrower assistance in the form of, among other things, principal reduction, short sales and deeds-in-lieu of foreclosure, and approximately $1.0 billion in refinancing assistance. We could be required to make additional payments if we fail to meet our borrower assistance and refinancing assistance commitments over a three-year period. In addition, we could be required to pay an additional $350 million if we fail to meet certain first-lien principal reduction thresholds over a three-year period. We also entered into agreements with several states under which we committed to perform certain minimum levels of principal reduction and related activities within those states as part of the Global AIP, and under which we could be required to make additional payments if we fail to meet such minimum levels. We expect to recognize the refinancing assistance as lower interest income in future periods as qualified borrowers pay reduced interest rates on loans refinanced. We may also incur additional operating costs (e.g., servicing costs) to implement certain terms of the Global AIP in future periods.
The FHA AIP provides for an upfront cash payment by us of $500 million. We would have the obligation to pay an additional $500 million if we fail to meet certain principal reduction thresholds over a three-year period.
Pursuant to an agreement in principle, the OCC agreed to hold in abeyance the imposition of a civil monetary penalty of $164 million. Pursuant to a separate agreement in principle, the Federal Reserve will assess a civil monetary penalty in the amount of $176 million against us. Satisfying our payment, borrower assistance and remediation obligations under the Global AIP will satisfy any civil monetary penalty obligations arising under these agreements in principle. If, however, we do not make certain required payments or undertake certain required actions under the Global AIP, the OCC will assess, and the Federal Reserve will require us to pay, the difference between the aggregate value of the payments and actions under these agreements in principle and the penalty amounts.
The Servicing Resolution Agreements do not cover claims arising out of securitization (including representations made to investors respecting MBS), criminal claims, private claims by borrowers, claims by certain states for injunctive relief or actual economic damages to borrowers related to Mortgage Electronic Registration Systems, Inc. (MERS), and claims by the GSEs (including repurchase demands), among other items. Failure to finalize the documentation related to the Servicing Resolution Agreements, to obtain the required court and regulatory approvals, to meet our borrower and refinancing commitments or other adverse developments with respect to the foregoing could have a material adverse effect on our financial condition and results of operations. For additional information regarding the temporary suspension of our foreclosure sales, see Off-Balance Sheet Arrangements and Contractual Obligations – Other Mortgage-related Matters in the MD&A on page 63.
Failure to satisfy our obligations as servicer in the residential mortgage securitization process, including obligations related to residential mortgage foreclosure actions,obligations, along with other losses we could incur in our capacity as servicer, could have a material adverse effect oncause significant losses.
We and our financial condition and results of operations.
Bank of America and its legacy companies have securitized a significant portion of the residential mortgage loans that they havewe originated or acquired. The Corporation servicesWe service a large portion of the loans it or its subsidiarieswe have securitized and also servicesservice loans on behalf of third-party securitization vehicles and other investors. In addition to identifying specific servicing criteria, pooling and servicing arrangements entered into in connection with a securitization or whole loan sale typically impose standards of care on the servicer with respect to its activities, that may include the obligation to adhere to the accepted servicing practices of prudent mortgage lenders and/or to exercise the degree of care and skill that the servicer employs when servicing loans for its own account.
Many non-GSE residential mortgage-backed securitizations and whole-loan servicing agreements also require us to indemnify the trustee or other investor for or against failures by us to perform our servicing obligations or acts or omissions that involve willful malfeasance, bad faith or gross negligence in the performance of, or reckless disregard of, our duties. Servicing agreements with the GSEs generally provide the GSEs with broader rights relative to the servicer than are found in servicing agreements with private investors. Each GSE typically claims the right to demand that we repurchase loans that breach the seller’s representations and warranties made in connection with the initial sale of the loans, even if we were not the seller. The GSEs also claim that they have the contractual right to demand indemnification or loan repurchase for certain servicing breaches. The GSEs’ first mortgage seller/servicer guides provide for timelines to resolve delinquent loans through workout efforts or liquidation, if necessary, and purport to require the imposition of compensatory fees if those deadlines are not satisfied except for reasons beyond our control. We believe that the governing contracts, our course of dealing and collective past practices and understandings should inform resolution of these matters. Beginning in 2010, the GSEs increased the level of compensatory fees imposed and have recently amended those servicing guides retroactively to impose significantly new and more stringent requirements relating to default activities, which could increase our exposure to claims for compensatory fees. We have informedAs part of the GSEs thatFNMA Settlement, we do not believe that the new policies, or their retroactive application, are valid under the relevant contracts,agreed to make a cash payment to FNMA to settle substantially all of FNMA’s outstanding and that we do not agree that the newly articulated policies are the proper methodfuture claims for the assessment of any compensatory fees under the termsarising out of the relevant contracts.past foreclosure delays.
With regard to alleged irregularities in foreclosure process-related activities referred to above, we may incur costs or losses if we elect or are required to re-execute or re-file documents or take other action in connection with pending or completed foreclosures. We may also incur costs or losses if the validity of a foreclosure action is challenged by a borrower, or overturned by a court because of errors or deficiencies in the foreclosure process. These costs and liabilities may not be reimbursable to
us. We may also incur costs or losses relating to delays or alleged deficiencies in processing documents necessary to comply with state law governing foreclosures. We may be subject to deductions by insurers for MI or guarantee benefits relating to delays or alleged deficiencies. Additionally, if we commit a material breach of our servicing obligations that is not cured within specified timeframes,
including those related to default servicing and foreclosure, we could be terminated as servicer under servicing agreements underin certain circumstances. Any of these actions may harm our reputation or increase our servicing costs.
Mortgage notes, assignments or other documents are often required to be maintained and are often necessary to enforce mortgages loans. There has been significant public commentary regarding the common industry practice of recording mortgages in the name of MERS, as nominee on behalf of the note holder, and whether securitization trusts own the loans purported to be conveyed to them and have valid liens securing those loans. We currently use the MERS system for a substantial portion of the residential mortgage loans that we originate, including loans that have been sold to investors or securitization trusts. A component of the 2011 OCC consent orderConsent Order requires significant changes in the manner in which we service loans identifying MERS as the mortgagee. Additionally, certain local and state governments have commenced legal actions against us, MERS, and other MERS members, questioning the validity of the MERS model. Other challenges have also been made to the process for transferring mortgage loans to securitization trusts, asserting that having a mortgagee of record that is different than the holder of the mortgage note could “break the chain of title” and cloud the ownership of the loan. In order to foreclose on a mortgage loan, in certain cases it may be necessary or prudent for an assignment of the mortgage to be made to the holder of the note, which in the case of a mortgage held in the name of MERS as nominee would need to be completed by a MERS signing officer. As such, our practice is to obtain assignments of mortgages from MERS prior to instituting foreclosure. If certain required documents are missing or defective, or if the use of MERS is found not to be valid, we could be obligated to cure certain defects or in some circumstances be subject to additional costs and expenses. Our use of MERS as nominee for the mortgage may also create reputational and other risks for us.
These costs and liabilitiesIn addition to the adverse impact these factors could directly have a material adverse effect on our cash flows, financial condition and results of operations. Weus, we may also face negative reputational costs from these servicing risks, which could reduce our future business opportunities in this area or cause that business to be on less favorable terms to us.
For additional information, concerning our servicing risks, see Recent EventsOff-Balance Sheet Arrangements and Contractual Obligations in the MD&A on page 28. For additional information regarding the temporary suspension of our foreclosure sales, see Off-Balance Sheet Arrangements and Contractual Obligations – Other Mortgage-related Matters in the MD&A on page 6354.
Liquidity Risk
Liquidity Risk is the Potential Inability to Meet Our Contractual and Contingent Financial Obligations, On- or Off-balance Sheet, as they Become Due.
Adverse changes to our credit ratings from the major credit rating agencies could have a material adverse effect on our liquidity, cash flows, competitive position, financial condition and results of operations by significantly limitinglimit our access to funding or the capital markets, increasingincrease our borrowing costs, or triggeringtrigger additional collateral or funding requirements.
Our borrowing costs and ability to raise funds are directly impacted by our credit ratings. In addition, credit ratings may be
important to customers or counterparties when we compete in certain markets and when we seek to engage in certain
transactions, including over-the-counter (OTC) derivatives. Credit ratings and outlooks are opinions expressed by rating agencies on our creditworthiness and that of our obligations or securities, including long-term debt, short-term borrowings, preferred stock and other securities, including asset securitizations. Our credit ratings are subject to ongoing review by the rating agencies which consider a number of factors, including our own financial strength, performance, prospects and operations as well as factors not under our control.
On DecemberJune 21, 2012, Moody’s Investors Service, Inc. (Moody’s) completed its previously-announced review for possible downgrade of financial institutions with global capital markets operations, downgrading the ratings of 15 2011, Fitch Ratings (Fitch) downgraded thebanks and securities firms, including our ratings. The Corporation’s long-term debt rating and BANA’s long-term and short-term debt ratings as a result of Fitch’s decision to lower its “support floor” for systemically important U.S. financial institutions. On November 29, 2011, Standard & Poor’s Ratings Services (S&P)were downgraded the Corporation’s long-term and short-term debt ratings as well as BANA’s long-term debt rating as a result of S&P’s implementation of revised methodologies for determining Banking Industry Country Risk Assessments and bank ratings. On September 21, 2011, Moody’s Investors Service, Inc. (Moody’s) downgraded the Corporation’s long-term and short-term debt ratings as well as BANA’s long-term debt rating as a result of Moody’s lowering the amount of uplift for potential U.S. government support it incorporates into ratings. On February 15, 2012, Moody’s placed the Corporation’s long-term debt ratings and BANA’s long-term and short-term debt ratings on review for possible downgradeone notch as part of this action. Each of the three major rating agencies downgraded the ratings for the Corporation and its review of financial institutions with global capital markets operations. Any adjustment to our ratings will be determined based on Moody’s review; however, the agency offered guidance that downgrades to our ratings, if any, would likely be limited to one notch.rated subsidiaries in late 2011.
Currently, the Corporation’s long-term/short-term senior debt ratings and outlooks expressed by the rating agencies are as follows: Baa1/Baa2/P-2 (negative) by Moody’s; A-/A-2 (negative) by S&P;Standard & Poor’s Ratings Services (S&P); and A/F1 (stable) by Fitch.Fitch Ratings (Fitch). The rating agencies could make further adjustments to our credit ratings at any time. There can be no assurance that additional downgrades will not occur.
A further reduction in certain of our credit ratings may have a material adverse effect oncould negatively affect our liquidity, access to credit markets, the related cost of funds, our businesses and on certain trading revenues, particularly in those businesses where counterparty creditworthiness is critical. If the short-term credit ratings of our parent company, bank or broker/dealer subsidiaries were downgraded by one or more levels, we may suffer the potential loss of access to short-term funding sources such as repo financing, and the effect on our incrementaland/or increased cost of funds and earnings could be material.funds.
In addition, under the terms of certain OTC derivative contracts and other trading agreements, in the event of a further downgrade of our credit ratings or certain subsidiaries’ credit ratings, counterparties to those agreements may require us or certain subsidiaries to provide additional collateral, terminate these contracts or agreements, or provide other remedies. At December 31, 2011,2012, if the rating agencies had downgraded their long-term senior debt ratings for us or certain subsidiaries by one incremental notch, the amount of additional collateral contractually required by derivative contracts and other trading agreements would have been approximately $1.63.3 billion comprised of $1.22.9 billion for BANA and $375418 million for Merrill Lynch & Co., Inc. (Merrill Lynch) and certain of its subsidiaries. If the agencies had downgraded their long-term senior debt ratings for these entities by a second incremental notch, approximately $1.14.4 billion in additional incremental collateral comprised of $871455 million for BANA and $269 million4.0 billion for Merrill Lynch and certain of its subsidiaries, would have been required.
Also, if the rating agencies had downgraded their long-term senior debt ratings for us or certain subsidiaries by one incremental notch, the derivative liability that would be subject to unilateral termination by counterparties as of December 31, 20112012 was $2.93.8 billion, against which $2.73.0 billion of collateral hadhas been
posted. If the rating agencies had downgraded their long-term senior debt ratings for us orand certain subsidiaries by a second incremental notch, the derivative liability that would be subject to unilateral termination by counterparties as of December 31, 20112012 was an incremental $5.61.7 billion, against which $5.41.1 billion of collateral hadhas been posted.
While certain potential impacts are contractual and quantifiable, the full consequences of a credit ratings downgrade to a financial institution are inherently uncertain, as they depend upon numerous dynamic, complex and inter-related factors and assumptions, including whether any downgrade of a firm’s long-term credit ratings precipitates downgrades to its short-term credit ratings, and assumptions about the potential behaviors of various customers, investors and counterparties.
For additional information about our credit ratings and their potential effects to our liquidity, see Liquidity Risk – Credit Ratings in the MD&A on page 7978 and Note 43 – Derivatives to the Consolidated Financial Statements.
Our liquidity, cash flows, financial condition and results of operations, and competitive position may be significantly adversely affected ifIf we are unable to access the capital markets, continue to raisemaintain deposits, sell assets on favorable terms, or if there is an increase in our borrowing costs.costs increase, our liquidity and competitive position will be negatively affected.
Liquidity is essential to our businesses. We fund our assets primarily with globally sourced deposits in our bank entities, as well as secured and unsecured liabilities transacted in the capital markets. We rely on certain secured funding sources, such as repo markets, which are typically short-term and credit-sensitive in nature. We also engage in asset securitization transactions, including with the GSEs, to fund consumer lending activities. Our liquidity could be significantly adversely affected by our abilityany inability to access the capital markets; illiquidity or volatility in the capital markets; unforeseen outflows of cash, including customer deposits, funding for commitments and contingencies, including Variable Rate Demand Notes; the ability to sell assets on favorable terms; increased liquidity requirements on our banking and nonbanking subsidiaries imposed by their home countries; or negative perceptions about our short- or long-term business prospects, including downgrades of our credit ratings. Several of these factors may arise due to circumstances beyond our control, such as a general market disruption, negative views about the financial services industry generally, changes in the regulatory environment, actions by credit rating agencies or an operational problem that affects third parties or us.
Our cost of obtaining funding is directly related to prevailing market interest rates and to our credit spreads. Credit spreads are the amount in excess of the interest rate of U.S. Treasury securities, or other benchmark securities, of the samea similar maturity that we need to pay to our funding providers. Increases in interest rates and our credit spreads can significantly increase the cost of our funding. Changes in our credit spreads are market-driven and may be influenced by market perceptions of our creditworthiness. Changes to interest rates and our credit spreads occur continuously and may be unpredictable and highly volatile.
For additional information about our liquidity position and other liquidity matters, including credit ratings and outlooks and the policies and procedures we use to manage our liquidity risks, see
Capital Management and Liquidity Risk in the MD&A on pages 7170 and 7675.
Bank of America Corporation is a holding company and as such we are dependentdepend upon our subsidiaries for liquidity, including our ability to pay dividends to stockholders. Applicable laws and regulations, including capital and liquidity requirements, may restrict our ability to transfer funds from our subsidiaries to Bank of America Corporation or other subsidiaries.
Bank of America Corporation, as the parent company, is a separate and distinct legal entity from our banking and nonbanking subsidiaries. We evaluate and manage liquidity on a legal entity basis. Legal entity liquidity is an important consideration as there are legal and other limitations on our ability to utilize liquidity from one legal entity to satisfy the liquidity requirements of another, including the parent company. For instance, the parent company depends on dividends, distributions and other payments from our banking and nonbanking subsidiaries to fund dividend payments on our common stock and preferred stock and to fund all payments on our other obligations, including debt obligations. Many of our subsidiaries, including our bank and broker/dealer subsidiaries, are subject to laws that restrict dividend payments or authorize regulatory bodies to block or reduce the flow of funds from those subsidiaries to the parent company or other subsidiaries. In addition, our bank and broker/dealer subsidiaries are subject to restrictions on their ability to lend or transact with affiliates and to minimum regulatory capital and liquidity requirements, as well as restrictions on their ability to use funds deposited with them in bank or brokerage accounts to fund their businesses.
Additional restrictions on related party transactions, increased capital and liquidity requirements and additional limitations on the use of funds on deposit in bank or brokerage accounts, as well as lower earnings, can reduce the amount of funds available to meet the obligations of the parent company and even require the parent company to provide additional funding to such subsidiaries. Regulatory action of that kind could impede access to funds we need to make payments on our obligations or dividend payments. In addition, our right to participate in a distribution of assets upon a subsidiary’s liquidation or reorganization is subject to the prior claims of the subsidiary’s creditors. For additional information regarding our ability to pay dividends, see Note 1514 – Shareholders’ Equity and Note 1817 – Regulatory Requirements and Restrictions to the Consolidated Financial Statements.
Credit Risk
Credit Risk is the Risk of Loss Arising from a Borrower, Obligor or Counterparty Default when a Borrower, Obligor or Counterparty does not Meet its Obligations.
Increased credit risk, due to economicEconomic or market disruptions, insufficient credit loss reserves or concentration of credit risk may necessitate increased provisionsan increase in the provision for credit losses, andwhich could have an adverse effect on our financial condition and results of operations.
When we loan money, commit to loan money or enter into a letter of credit or other contract with a counterparty, we incur credit risk, or the risk of losses if our borrowers do not repay their loans or our counterparties fail to perform according to the terms of their agreements. A number of our products expose us to credit risk, including loans, leases and lending commitments, derivatives, trading account assets and assets held-for-sale. As one of the
nation’s largest lenders, the credit quality of our consumer and commercial portfolios has a significant impact on our earnings.
Global and U.S. economic conditions continue to weigh onmay impact our credit portfolios. EconomicTo the extent economic or market disruptions areoccur, such disruptions would likely to increase our credit exposure to customers, obligors or other counterparties due to the increased risk that they may default on their obligations to us. These potential increases in delinquencies and default rates could adversely affect our consumer credit card, home equity, consumer real estate and purchased credit-impaired portfolios, through increased charge-offs and provisionsprovision for credit losses. In addition, despite improvement in the mix of our commercial portfolio,Additionally, increased credit risk could also adversely affect our commercial loan portfolios where we continue to experience elevated losses, particularly in our commercial real estate portfolios, reflecting continued stress across industries, property types and borrowers.portfolios.
We estimate and establish an allowance for credit losses for losses inherent in our lending activities (including unfunded lending commitments), excluding those measured at fair value, through a charge to earnings. The amount of allowance is determined based on our evaluation of the potential credit losses included within our loan portfolio. The process for determining the amount of the allowance, which is critical to our financial condition and results of operations, requires difficult, subjective and complex judgments, including forecasts of economic conditions and how our borrowers will react to those conditions. Our ability to assess future economic conditions or the creditworthiness of our customers, obligors or other counterparties is imperfect. The ability of our borrowers to repay their loans will likely be impacted by changes in economic conditions, which in turn could impact the accuracy of our forecasts.
As with any such assessments, there is also the chance that we will fail to identify the proper factors or that we will fail to accurately estimate the impacts of factors that we identify. We may suffer unexpected losses if the models and assumptions we use to establish reserves and make judgments in extending credit to our borrowers and other counterparties become less predictive of future events. Although we believe that our allowance for credit losses was in compliance with applicable accounting standards at December 31, 2011,2012, there is no guarantee that it will be sufficient to address future credit losses, particularly if economic conditions deteriorate. In such an event, we might need to increase the size of our allowance, which could adversely affectreduces our financial condition and results of operations.earnings.
In the ordinary course of our business, we also may be subject to a concentration of credit risk in a particular industry, country, counterparty, borrower or issuer. A deterioration in the financial condition or prospects of a particular industry or a failure or downgrade of, or default by, any particular entity or group of entities could have a material adverse effect onnegatively affect our businesses, and the processes by which we set limits and monitor the level of our credit exposure to individual entities, industries and countries may not function as we have anticipated. While our activities expose us to many different industries and counterparties, we routinely execute a high volume of transactions with counterparties in the financial services industry, including brokers/dealers, commercial banks, investment funds and insurers. This has resulted in significant credit concentration with respect to this industry. In the ordinary course of business, we also enter into transactions with sovereign nations, U.S. states and U.S. municipalities. Unfavorable
economic or political conditions, disruptions to capital markets, currency fluctuations, social instability and changes in government policies could impact the operating budgets or credit ratings of sovereign nations, U.S. states and U.S. municipalities and expose us to credit risk.
We also have a concentration of credit risk with respect to our consumer real estate, consumer credit card and commercial real estate portfolios, which represent a large percentage of our overall credit portfolio. The economic downturn has adversely affected
these portfolios and further exposed us to this concentration of risk. Continued economic weakness or deterioration in real estate values or household incomes could result in materially higher credit losses.
For additional information about our credit risk and credit risk management policies and procedures, see Credit Risk Management in the MD&A on page 8079 and Note 1 – Summary of Significant Accounting Principles to the Consolidated Financial Statements.
We could suffer losses and our ability to engage in routine trading and funding transactions could be adversely affected as a result of the actions of or deterioration in the commercial soundness of our counterparties and other financial services institutions.
We could suffer losses and our ability to engage in routine trading and funding transactions could be adversely affected by the actions and commercial soundness of other market participants. We have exposure to many different industries and counterparties, and we routinely execute transactions with counterparties in the financial services industry, including brokers/dealers, commercial banks, investment banks, mutual and hedge funds and other institutional clients. Financial services institutions and other counterparties are inter-related because of trading, funding, clearing or other relationships. As a result, defaults by, or even rumors or questions about, one or more financial services institutions, or the financial services industry generally, have led to market-wide liquidity problems and could lead to significant future liquidity problems, including losses or defaults by us or by other institutions. Many of these transactions expose us to credit risk in the event of default of a counterparty or client. In addition, our credit risk may be impacted when the collateral held by us cannot be realized or is liquidated at prices not sufficient to recover the full amount of the loan or derivatives exposure due us. Any such losses could materially adversely affect our financial condition and results of operations.
Our derivatives businesses may expose us to unexpected risks and potential losses.
We are party to a large number of derivatives transactions, including credit derivatives. Our derivatives businesses may expose us to unexpected market, credit and operational risks that could cause us to suffer unexpected losses and have an adverse effect on our financial condition and results of operations.losses. Severe declines in asset values, unanticipated credit events or unforeseen circumstances that may cause previously uncorrelated factors to become correlated (and vice versa) may create losses resulting from risks not appropriately taken into account in the development, structuring or pricing of a derivative instrument. The terms of certain of our OTC derivative contracts and other trading agreements provide that upon the occurrence of certain specified events, such as a change in our credit ratings, we may be required to provide additional collateral or to provide other remedies, or our counterparties may have the right to terminate or otherwise diminish our rights under these contracts or agreements.
Many derivative instruments are individually negotiated and non-standardized, which can make exiting, transferring or settling some positions difficult. Many derivatives require that we deliver to the counterparty the underlying security, loan or other obligation in order to receive payment. In a number of cases, we do not hold, and may not be able to obtain, the underlying security, loan or other obligation.
FollowingIn the event of a further downgrade of the Corporation’s credit ratings, of the Corporation, we have engaged in discussions with certain derivative and other counterparties regarding their rights under these agreements. In response to counterparties’ inquiries and requests,may request we have discussed and in some cases substitutedsubstitute BANA as counterparty for certain derivative contracts and other trading agreements, including naming BANA as the new counterparty.agreements. Our ability to substitute or make changes to these agreements to meet counterparties’ requests may be subject to certain limitations, including counterparty willingness, regulatory limitations on naming BANA as the new counterparty, and the type or amount of collateral required. It is possible that such limitations on our ability to substitute or make
changes to these agreements, including naming BANA as the new counterparty, could adversely affect our results of operations.
Derivatives contracts and other transactions entered into with third parties are not always confirmed by the counterparties or settled on a timely basis. While a transaction remains unconfirmed or during any delay in settlement, we are subject to heightened credit and operational risk and in the event of default may find it more difficult to enforce the contract. In addition, as new and more complex derivatives products have been created, covering a wider array of underlying credit and other instruments, disputes about the terms of the underlying contracts may arise, which could impair our ability to effectively manage our risk exposures from these products and subject us to increased costs.
For additional information on our derivatives exposure, see Note 43 – Derivatives to the Consolidated Financial Statements.
Market Risk
Market Risk is the Risk that Values of Assets and Liabilities or Revenues will be Adversely Affected by Changes in Market Conditions Such as Market Volatility. Market Risk is Inherent in the Financial Instruments Associated with our Operations, and Activities, Including Loans, Deposits, Securities, Short-term Borrowings, Long-term Debt, Trading Account Assets and Liabilities, and Derivatives.
Our businesses and results of operations have been, and may continue to be, significantly adversely affected byNegative changes in the levels of market volatility and by other financial or capital market conditions.conditions may increase our market risk.
Our businesses andliquidity, cash flows, competitive position, business, results of operations may be adverselyand financial condition are affected by market risk factors such as changes in interest and currency exchange rates, equity and futures prices, the implied volatility of interest rates, credit spreads and other economic and business factors. These market risks may adversely affect, among other things, (i) the value of our on- and off-balance sheet securities, trading assets other financial instruments, and MSRs, (ii) the cost of debt capital and our access to credit markets, (iii) the value of assets under management, which could reduce our(iv) fee income relating to those assets (iv)under management, (v) customer allocation of capital among investment alternatives, (v)(vi) the volume of client
activity in our trading operations, (vi)(vii) investment banking fees, and (vii)(viii) the general profitability and risk level of the transactions in which we engage. AnyFor example, the value of these developmentscertain of our assets is sensitive to changes in market interest rates. If the Federal Reserve changes or signals a change in its current mortgage securities repurchase program, market interest rates could have a significant adversebe affected, which could adversely impact on our financial condition and resultsthe value of operations.such assets.
We use various models and strategies to assess and control our market risk exposures but those are subject to inherent limitations. Our models, which rely on historical trends and assumptions, may not be sufficiently predictive of future results due to limited historical patterns, extreme or unanticipated market movements and illiquidity, especially during severe market downturns or stress events. The models that we use to assess and control our market risk exposures also reflect assumptions about the degree of correlation or lack thereof among prices of various asset classes or other market indicators.
In times of market stress or other unforeseen circumstances, such as the market conditions experienced in 2008 and 2009,
previously uncorrelated indicators may become correlated, or previously correlated indicators may move in different directions. These types of market movements have at times limited the effectiveness of our hedging strategies and have caused us to incur significant losses, and they may do so in the future. These changes in correlation can be exacerbated where other market participants are using risk or trading models with assumptions or algorithms that are similar to ours. In these and other cases, it may be difficult to reduce our risk positions due to the activity of other market participants or widespread market dislocations, including circumstances where asset values are declining significantly or no market exists for certain assets. To the extent that we own securities that do not have an established liquid trading market or are otherwise subject to restrictions on sale or hedging, we may not be able to reduce our positions and therefore reduce our risk associated with such positions. In addition, challenging market conditions may also adversely affect our investment banking fees.
For additional information about market risk and our market risk management policies and procedures, see Market Risk Management in the MD&A on page 112113.
Further downgrades in the U.S. government’s sovereign credit rating, or in the credit ratings of instruments issued, insured or guaranteed by related institutions, agencies or instrumentalities, could result in risks to the Corporation and its credit ratings and general economic conditions that we are not able to predict.
On August 2, 2011, Moody’s affirmed the U.S. government’s existing sovereign rating, but revised the rating outlook to negative. On August 5, 2011, S&P downgraded the U.S. government’s long-term sovereign credit rating to AA+ from AAA and stated that the outlook on the long-term rating is negative. On the same day,June 8, 2012, S&P affirmed its AA+ long-term and A-1+ short-term sovereign credit rating on the U.S. and removed it from CreditWatchgovernment. The outlook remains negative. On November 28, 2011,July 10, 2012, Fitch affirmed its AAA long-term and F1+ short-term sovereign credit rating on the U.S., but changed government. The outlook remains negative. Moody’s also rates the outlook from stable to negative. On the same day, Fitch affirmed its F1+ short-term rating on the U.S. government AAA with a negative outlook. All three rating agencies have indicated that they will continue to assess fiscal projections and consolidation measures, as well as the medium-term economic outlook for the United States.U.S.
There continues to be the perceived risk of a sovereign credit ratings downgrade of the U.S. government, including the ratings of U.S. Treasury securities and other government-backed securities. It is foreseeable that the ratings and perceived creditworthiness of instruments issued, insured or guaranteed by institutions, agencies or instrumentalities directly linked to the U.S. government could also be correspondingly
affected by any such downgrade. Instruments of this nature are key assets on the balance sheets of financial institutions, including the Corporation, and are widely used as collateral by financial institutions to meet their day-to-day cash flows in the short-term debt market. A downgrade of the sovereign credit ratings of the U.S. government and perceived creditworthiness of U.S. government-related obligations could impact our ability to obtain funding that is collateralized by affected instruments, as well as affecting the pricing of that funding when it is available. A downgrade may also adversely affect the market value of such instruments.
We cannot predict if, when or how any changes to the credit ratings or perceived creditworthiness of these organizations will affect economic conditions. Such ratings actions could result in a significant adverse impact to the Corporation. The credit rating agencies’ ratings for the Corporation or its subsidiaries could be directly or indirectly impacted by a downgrade of the U.S. government’s sovereign rating because the credit ratings of large systemically important financial institutions, including the Corporation, currently incorporate a degree of uplift due to assumptions concerning government support. In addition, the Corporation presently delivers a material portion of the residential mortgage loans it originates into GSEs,
agencies or instrumentalities (or instruments insured or guaranteed thereby). We cannot predict if, when or how any changes to the credit ratings of these organizations will affect their ability to finance residential mortgage loans. Such ratings actions, if any, could result in a significant change to the business operations of CRES.
A downgrade of the sovereign credit ratings of the U.S. government or the credit ratings of related institutions, agencies or instrumentalities would significantly exacerbate the other risks to which the Corporation is subject and any related adverse effects on our business, financial condition and results of operations, including those described under Risk Factors – Credit Risk – “We could suffer losses as a result of the actions of or deterioration in the commercial soundness of our counterparties and other financial services institutions,” Risk Factors – Market Risk – “Ouroperations.
Our businesses and results of operations have been, and may continue to be significantly adversely affected by changes in the levels of market volatility and by other financial or capital market conditions” and Risk Factors – Liquidity Risk – “Our liquidity, cash flows, financial condition and results of operations, and competitive position may be significantly adversely affected if we are unable to access capital markets, continue to raise deposits, sell assets on favorable terms, or if there is an increase in our borrowing costs.”
Uncertaintyuncertainty about the financial stability of several countries in the European Union (EU), countries, the increasing risk that those countries may default on their sovereign debt and related stresses on financial markets, the Euro and the EU could have a significant adverse effect on our business, financial condition and results of operations.EU.
In 2011, the financial crisis in Europe continued, triggered by high sovereign budget deficits and rising direct and contingent sovereign debt in Greece, Ireland, Italy, Portugal and Spain, which created concerns about the ability of these EU countries to continue to service their sovereign debt obligations. These conditions impacted financial markets and resulted in credit ratings downgrades for, and high and volatile bond yields on, the sovereign debt of many EU countries. Certain European countries continue to experience varying degrees of financial stress, and yields on government-issued bonds in Greece, Ireland, Italy,
Portugal and Spain have risen and remain volatile. Despite assistance packages to certain of these countries, the creation of a joint EU-IMF European Financial Stability Facility and additional expanded financial assistance to Greece, uncertainty over the outcome of the EU governments’ financial support programs and worries about sovereign finances and the stability of the Euro and EU persist. Market concerns over the direct and indirect exposure of certain European banks and insurers to these EU countries resulted in a widening of credit spreads and increased costs of funding for these financial institutions. While we have reduced our exposure to European financial institutions, the insolvency of one or more major European financial institutions could adversely impact financial markets and, consequently, our results of operations.
Risks and ongoing concerns about the debt crisis in Europe could have a detrimental impact on the global economic recovery, sovereign and non-sovereign debt in these countries and the financial condition of European financial institutions and international financial institutions with exposure to the region, including us. Market and economic disruptions have affected, and may continue to affect, consumer confidence levels and spending, personal bankruptcy rates, levels of incurrence and default on consumer debt and residential mortgages, and housing prices among other factors. There can be no assurance that the market disruptions in Europe, including the increased cost of funding for certain governments and financial institutions, and the possible loss of EU member states, will not spread, nor can there be any assurance that future assistance packages will be available or, even if provided, will be sufficient to stabilize the affected countries and markets in Europe or elsewhere. To the extent uncertainty regarding the European economic recovery uncertainty continues to negatively impact consumer confidence and consumer credit factors, or should the EU enter a deep recession, both the U.S. economy and our business and results of operations could be significantlyadversely affected.
The Corporation has substantial U.K. net deferred tax assets, which consist primarily of net operating losses (NOLs) that are realizable by a few non-U.S. subsidiaries that have a recent history of cumulative losses. These net deferred tax assets relate to NOLs that may be realized over an extended number of years. Management has concluded that no valuation allowance is necessary with respect to such net deferred tax assets, based in part on current expectations, including regarding the cessation of certain business activities, changes to capital and adversely affected. funding, forecasts of business activities and the indefinite period to carry forward NOLs. Significant changes to those expectations, such as would be caused by a substantial and prolonged worsening of the condition of Europe’s capital markets, could lead management to reassess its valuation allowance conclusions.
Global economic uncertainty, regulatory initiatives and reform have impacted, and will likely continue to impact, non-U.S. credit and trading portfolios. Our Regional Risk Committee, a subcommittee of our Credit Risk Committee, is seeking to address this risk but thereThere can be no assurance our risk mitigation efforts in this respect will be sufficient or successful. Our total sovereign and non-sovereign exposure to Greece, Italy, Ireland, Portugal and Spain, was $15.314.5 billion at December 31, 2012 compared to $15.2 billion at December 31, 2011 compared to $16.6 billion at December 31, 2010.. Our total net sovereign and non-sovereign exposure to these countries was $10.59.5 billion at December 31, 20112012 compared to $12.410.3 billion at December 31, 2010,2011, after taking into account net credit default protection. At December 31, 20112012 and 2010,2011, the fair value of net credit default protection purchased was $4.95.1 billion and $4.2 billion.$4.9 billion. Losses could still result because our credit protection contracts only pay out under certain scenarios.
For more information on our direct sovereign and non-sovereign exposures in Europe, see Executive Summary – 2011 Economic and Business Environment in the MD&A on page 27 and Non-U.S. Portfolio in the MD&A on page 104105.
Declines inWe may incur losses if the valuevalues of certain of our assets could have an adverse effect on our results of operations.decline.
We have a large portfolio of financial instruments, including, among others, certain corporate loans and loan commitments, loans held-for-sale, repurchase agreements, long-term deposits, trading account assets and liabilities, derivatives assets and liabilities, available-for-sale debt and marketable equity securities, consumer-related MSRs and certain other assets and liabilities that we measure at fair value. We determine the fair values of
these instruments based on the fair value hierarchy under applicable accounting guidance. The fair values of these financial instruments include adjustments for market liquidity, credit quality and other transaction-specific factors, where appropriate.
Gains or losses on these instruments can have a direct and significant impact on our results of operations, unless we have effectively hedged our exposures. Changes in loan prepayment speeds, which are influenced by interest rates, among other things, can impact the value of our MSRs and can result in substantially higher or lower mortgage banking income and earnings, depending upon our ability to fully hedge the performance of our MSRs. Fair values may be impacted by declining values of the underlying assets or the prices at which observable market transactions occur and the continued availability of these transactions. The financial strength of counterparties, such as monolines, with whom we have economically hedged some of our exposure to these assets, also will affect the fair value of these assets. Sudden declines and significant volatility in the prices of assets may substantially curtail or eliminate the trading activity for these assets, which may make it very difficult to sell, hedge or value such assets. The inability to sell or effectively hedge assets reduces our ability to limit losses in such positions and the difficulty in valuing assets may increase our risk-weighted assets, which requires us to maintain additional capital and increases our funding costs.
Asset values also directly impact revenues in our asset management businesses. We receive asset-based management fees based on the value of our clients’ portfolios or investments in funds managed by us and, in some cases, we also receive incentive fees based on increases in the value of such investments. Declines in asset values can reduce the value of our clients’ portfolios or fund assets, which in turn can result in lower fees earned for managing such assets.
For additional information about fair value measurements, see Note 2221 – Fair Value Measurements to the Consolidated Financial Statements. For additional information about our asset management businesses, see Business Segment Operations – Global Wealth & Investment Management in the MD&A on page 5250.
Changes to loanin interest rates, prepayment speeds and borrowers’ ability to refinance loans could reducehave an adverse affect on our net interest income and earnings.financial condition or results of operations.
Government officials and regulatory authorities have advanced various proposals to assist homeowners and the housing and mortgage markets more generally.markets. Certain of these proposals have included expanded access to residential mortgage loan refinancing options, including refinancing options for borrowers who may be current on their existing mortgage loans and for borrowers whose current mortgage principal balance may exceed the current appraised value of the mortgaged property. Expanded refinancing access may also result from our implementation ofimplementing the Servicing Resolution Agreementsborrower assistance and remediation programs under the National Mortgage Settlement discussed above. Adoption ofAdopting proposals of this nature could result in an increased number of mortgage refinancings, and accordingly, greater reductions in
interest rates and principal prepayments on the mortgage loans in our mortgage portfolio than we would otherwise expect to experienceexpected without those proposals. Reductions in interest rates and increases in mortgage prepayment speeds of this nature could adversely impact the value of our MSR asset, cause a significant acceleration of purchase premium amortization on our mortgage portfolio, adversely affect our net interest margin, and adversely affect our net interest incomemargin. Conversely, increases in interest rates and earnings.unavailability of expanded refinancing access may result in a decrease in residential mortgage loan originations.
For additional information about interest rate risk management, see Interest Rate Risk Management for Nontrading Activities in the MD&A on page 116117.
Changes in the method of determining the London Interbank Offered Rate (LIBOR) or other reference rates may adversely impact the value of debt securities and other financial instruments we hold or issue that are linked to LIBOR or other reference rates in ways that are difficult to predict and could adversely impact our financial condition or results of operations.
In recent years, concerns have been raised about the accuracy of the calculation of the daily LIBOR. The method for determining how LIBOR is formulated and its use in the market going forward may change, including, but not limited to, replacing the administrator of LIBOR, reducing the currencies and tenors for which LIBOR is calculated. and requiring banks to provide LIBOR submissions based on actual transaction data or otherwise changing the structure of LIBOR, each of which could impact the volatility of LIBOR. Similar changes may occur with respect to other reference rates. Accordingly, it is not currently possible to determine whether, or to what extent, any such changes would impact the value of any debt securities we hold or issue that are linked to LIBOR or other reference rates, or any loans, derivatives and other financial obligations or extensions of credit we hold or are due to us, or for which we are an obligor, that are linked to LIBOR or other reference rates, or whether, or to what extent, such changes would impact our financial condition or results of operations.
Regulatory and Legal Risk
Bank regulatory agencies may require us to hold higher levels of regulatory capital, increase our regulatory capital ratios or increase liquidity, which could result in the need to issue additional securities that qualify as regulatory capital or to sell company assets.
We are subject to the Federal Reserve’s risk-based capital guidelines issued by the Federal Reserve.guidelines. These guidelines establish regulatory capital requirements for banking institutions to meet minimum requirements as well as to qualify as a “well-capitalized” institution. (A “well-capitalized” institution must generally maintain capital ratios 200 basis points higher than the minimum guidelines.) The risk-based capital rules have been further supplemented by required leverage ratios, defined as Tier I (the highest grade) capital divided by quarterly average total assets, after certain adjustments. If any of our subsidiary insured depository institutions failsfail to maintain its status as “well-capitalized” under the applicable regulatory capital rules, of their primary federal regulator, the Federal Reserve will require us to enter into an agreementagree to bring the insured depository institution or institutions back into ato “well-capitalized” status. For the duration of such an agreement, the Federal Reserve may impose restrictions on the activities in which we may engage.our activities. If we were to fail to enter into such an agreement, or fail to comply with the terms of such agreement, the Federal Reserve may impose more severe restrictions on theour activities, in which we may engage, including requiring us to cease and desist in activities permitted under the Bank Holding Act.Company Act of 1956.
It is possible that increases in regulatory capital requirements, changes in how regulatory capital is calculated or increases to liquidity requirements may cause the loss of our “well-capitalized” status unless we increase our capital levels by issuing additional
common stock, thus diluting our existing shareholders, or by selling assets. On December 20, 2011, the Federal Reserve proposed rules relating to risk-based capital and leverage requirements, liquidity requirements, stress tests, single-counterparty credit limits and early remediation requirements. TheseOn October 12, 2012, the Federal Reserve issued final rules requiring covered entities to undergo annual stress tests conducted by the Federal Reserve and conduct their own “company-run” stress tests twice a year. Those rules, and the remaining rules, when finalized, are likely to influence our regulatory capital and liquidity planning process, and may impose additional operational and compliance costs on us. Any requirement that we increase our regulatory capital, regulatory capital ratios or liquidity could have a material adverse effect on our financial condition and results of operations, as we may needcause us to sell certain assets, perhaps on terms unfavorable to us and contrary to our business plans. Such a requirement could also compel us to issue additional securities, which could dilute our current common stockholders.
For additional information about the proposals described above and their potential effect on our required levels of regulatory capital, see Capital Management – Regulatory Capital in the MD&A on page 7270.
Government measures to regulate the financial industry, including the Financial Reform Act, either individually, in combination or in the aggregate, have increased and will continue to increase our compliance and operating costs and could require us to change certain of our business practices, impose significant additional costs on us, limit the products that we offer,our product offerings, limit our ability to efficiently pursue business opportunities, inrequire an efficient manner, require usincrease to increase our regulatory capital, impact the value of assets that we hold, significantlyasset values and reduce our revenues or otherwise materially and adversely affect our businesses, financial condition and results of operationsrevenues.
As a financial institution, we are heavily regulated at the state, federal and international levels. As a result ofFollowing the 2008-2009 financial crisis and related global economic downturn, we have faced and expect to continue to face increased public and legislative scrutiny as well as stricter and more comprehensive regulation of our businesses.business. These regulatory and legislative measures, either individually, in combination or in the aggregate, could require us to further change certain of our business practices, impose significant additional costs on us, limit the products that we offer,our product offerings, limit our ability to efficiently pursue business opportunities, inrequire an efficient manner, require us to increase in our regulatory capital, impact the value of assets that we hold, significantlyasset values and reduce our revenues or otherwise materiallyrevenues.
Federal banking and adversely affect our businesses, financial condition and results of operations.
On October 11, 2011, the Federal Reserve, the OCC, FDIC and the SEC, four of the fivesecurities regulatory agencies charged with promulgatinghave proposed regulations implementing limitations onunder the Financial Reform Act to limit proprietary trading as well as the sponsorship of or investment in hedge funds and private equity funds (the Volcker Rule) established by the Financial Reform Act, released for comment proposed regulations. On January 11, 2012, the CFTC, the fifth agency, released for comment its proposed regulations under the Volcker Rule.. The proposed regulations include clarifications to the definition of proprietary trading and distinctions between permitted and prohibited activities. The comment period for the first regulations proposed ended on February 13, 2012 andAlthough the comment period for these proposed regulations has expired, the CFTC regulations will end in March 2012.regulatory agencies have not finalized the Volcker Rule regulations.
The statutory provisions of the Volcker Rule will becomebecame effective on July 21, 2012 whether or not the final regulations are adopted, and it gives certaingave financial institutions two years from the effective date, with opportunitiesthe possibility for additional extensions for certain investments, to bring activities and investments into compliance.compliance with the statutory provisions and final regulations. Although GBAMGlobal Markets exited its stand-alone proprietary trading business as of June 30, 2011 in anticipation of the Volcker Rule and to further our initiative to optimize our balance sheet, the ultimate impact of the Volcker Rule on us remains uncertain.uncertain as the regulations implementing the Volcker Rule are not final. However, based on the contents of the proposed regulations, it is possible that the implementation of the Volcker Rule implementation could limit or restrict our remaining trading activities. Implementation ofIf exemptions in the Volcker Rule and the proposed regulations are not available, the Volcker Rule could also limit or restrict our ability to sponsor and hold ownership interests in hedge
funds, private equity funds, commodity pools and other subsidiary operations. Additionally, implementation of the Volcker Rule could increase our operational and compliance costs, and reduce our trading revenues, and adversely affect our results of operations. The date byon which final regulations will be issued is currently uncertain.
Additionally, the Financial Reform Act includes measures to broaden the scope of derivative instruments subject to regulation by requiring clearing and exchange trading of certain derivatives,derivatives; imposing new capital, margin, reporting, registration and business conduct requirements for certain market participantsparticipants; and imposing position limits on certain OTC derivatives. The Financial Reform Act grants the CFTC and the SEC substantial new authority and requires numerous rulemakings by these agencies. Swap dealers conducting dealing activity with U.S. persons above a specified dollar threshold were required to register with the CFTC on or before December 31, 2012. Upon registration, swap dealers became subject to additional CFTC rules relating to business conduct and reporting, and will continue to become subject to additional CFTC rules as and when such rules take effect.
The Financial Reform Act required regulators to promulgate the rulemakings necessary to implement these regulations by July 16, 2011. However, the rulemaking process was not completed as of that date, and is not expected to conclude until well into 2012.2013. Further, the regulators granted temporary relief from certain requirements that would have taken effect on July 16, 2011 absent any rulemaking. The SEC temporary relief is effective until final rules relevant to each requirement become effective. The CFTC
temporary relief islargely expired on December 31, 2012. The CFTC also granted relief from some of the rules that would have become effective untilduring the earlierfourth quarter of July 16, 2012, either completely suspending or delaying the date on whichapplication of some requirements.
While the CFTC has provided temporary exemptive relief from application of derivatives requirements of the Financial Reform Act for certain non-U.S. derivatives activity, there remains some uncertainty as to how the derivatives requirements of the Financial Reform Act will apply to non-U.S. derivatives activity because the CFTC has not yet adopted final cross-border guidance. The CFTC has completed much of its other rulemakings, with the exception of final margin, capital and exchange trading rules, relevant to each requirement become effective.while the SEC has finalized a small number of clearing-related rules. The ultimate impact of thesethe derivatives regulations that have not yet been finalized and the time it will take to comply continue to remain uncertain. The final regulations will impose additional operational and compliance costs on us and may require us to restructure certain businesses and may negatively impact our revenues and results of operations.
In April 2011, a new Financial Reform Act regulation became effective that implementsimplementing revisions to the FDIC’s assessment system mandated by the Financial Reform Act that increased our FDIC expense. In addition, the FDIC has broad discretionary authority to increase assessments on large and highly complex institutions on a case by case basis. Any future increases in required deposit insurance premiums or other bank industry fees could have an adverse impact on our financial condition and results of operations.
The Financial Reform Act provided for a new resolution authority to establish aestablished an orderly liquidation process to resolvein the event of the failure of a large systemically important financial institutions. As partinstitution. Specifically, when a systemically important financial institution such as the Corporation is in default or danger of thatdefault, the FDIC may be appointed receiver in order to conduct an orderly liquidation of such systemically important financial institution. In the event of such appointment, the FDIC could invoke a new form of resolution authority, the orderly liquidation authority, instead of the U.S. Bankruptcy Code, if the Secretary of the
Treasury makes certain financial distress and systemic risk determinations. Macroprudential systemic protection is the primary objective of the orderly liquidation authority, subject to minimum threshold protections for creditors. Accordingly, in certain circumstances under the orderly liquidation authority, the FDIC could permit payment of obligations it determines to be systemically significant (e.g., short-term creditors or operating creditors) in lieu of paying other obligations (e.g., long-term creditors) without the need to obtain creditors’ consent or prior court review. The insolvency and resolution process wecould also lead to a large reduction or total elimination of the value of a bank holding company’s outstanding equity. For example, the FDIC could follow a “single point of entry” approach and replace a distressed bank holding company with a bridge holding company, which could continue operations and result in an orderly resolution of the underlying bank, but whose equity is held solely for the benefit of creditors of the original bank holding company. Additionally, under the orderly liquidation authority, amounts owed to the U.S. government generally receive a statutory payment priority.
In addition, under the Financial Reform Act, all bank holding companies with assets of $50 billion or more are required to develop and implement asubmit resolution plan which will be subjectplans to review by the FDIC and the Federal Reserve, who will review such plans to determine whether they are credible. If the FDIC and the Federal Reserve determine that our plan is credible. Asnot credible and we fail to cure the deficiencies in a result oftimely manner, the FDIC and the Federal Reserve review, wemay jointly impose more stringent capital, leverage or liquidity requirements or restrictions on growth, activities or operations of the Corporation. We could be required to take certain actions over the next several years whichthat could impose operational costs and could potentially result in the divestiture or restructuring of certain businesses and subsidiaries.
In 2011, the Federal Reserve and FDIC jointly approved a final rule that requires the Corporation and other bank holding companies with assets of $50 billion or more, as well as companies designated as systemic by the Financial Stability Oversight Council, to periodically report to the FDIC and the Federal Reserve their plans for a rapid and orderly resolution in the event of material financial distress or failure. If the FDIC and the Federal Reserve determine that a company’s plan is not credible and the company fails to cure the deficiencies in a timely manner, then the FDIC and the Federal Reserve may jointly impose on the company, or on any of its subsidiaries, more stringent capital, leverage or liquidity requirements or restrictions on growth, activities or operations. The Corporation’s We submitted our initial plan is required to be submitted on or before July 1,in 2012, andwhich is to be updated annually.
Similarly, in the U.K., the FSA has issued proposed rules requiring the submission of significant information about certain U.K. incorporated subsidiaries and other financial institutions, as well as branches of non-U.K. banks located in the U.K., (including information on intra-group dependencies, and legal entity separation)separation and barriers to resolution) to allow the FSA to develop resolution plans. As a result of the FSA review, we could be required to take certain actions over the next several years which could impose operational costs and potentially could result in the restructuring of certain businesses and subsidiaries.
Under the Financial Reform Act, when a systemically important financial institution such as the Corporation is in default or danger of default, the FDIC may, in certain circumstances, be appointed receiver in order to conduct an orderly liquidation of such systemically important financial institution. In such a case, the FDIC could invoke a new form of resolution authority, called the orderly liquidation authority, instead of the U.S. Bankruptcy Code, if the Secretary of the Treasury makes certain financial distress and systemic risk determinations. The orderly liquidation authority is modeled in part on the Federal Deposit Insurance Act, but also adopts certain concepts from the U.S. Bankruptcy Code. However, the orderly liquidation authority contains certain differences from the U.S. Bankruptcy Code. Macroprudential systemic protection is the primary objective of the orderly liquidation authority, subject to minimum threshold protections for creditors. Accordingly, in
certain circumstances under the orderly liquidation authority, the FDIC could permit payment of obligations determined to be systemically significant (for example, short-term creditors or operating creditors) in lieu of the payment of other obligations (for example, long-term creditors) without the need to obtain creditors’ consent or prior court review. Additionally, under the orderly liquidation authority, amounts owed to the U.S. government generally enjoy a statutory payment priority.
The Financial Reform Act established the CFPB, to regulatewhich principally regulates the offering of consumer financial products or services under the federal consumer financial laws. In addition, under the Financial Reform Act,laws, and which has commenced its supervisory oversight. Through its rulemaking authority, the CFPB was granted general authority to prevent covered persons or service providers from committing or engaging in unfair, deceptive or abusive acts or practices under Federal law in connection with any transaction with ahas promulgated several proposed and final rules that will affect our consumer for a consumer financial product or service, or the offering of a consumer financial product or service. Pursuant to the Financial Reform Act, on July 21, 2011, certain federal consumer financial protection statutes and related regulatory authority were transferred to the CFPB. As a consequence of this transfer of authority, certain Federal consumer financial laws to which we are subject,businesses, including, but not limited to, establishing enhanced underwriting standards and new mortgage loan servicing standards. The CFPB has also proposed rules addressing items such as remittance transfer services, appraisal requirements and loan originator compensation requirements. The Corporation is evaluating the Equal Credit Opportunity Act, Home Mortgage Disclosure Act, Electronic Fund Transfers Act, Fair Credit Reporting Act, Truth in Lendingvarious CFPB rules and Truth in Savings Acts will be enforcedproposals and devoting substantial compliance, legal and operational business resources to facilitate compliance with these rules by their respective effective dates. We cannot predict the ultimate impact on us of the final and proposed CFPB rules, due to, among other things, uncertainty created by a recent court decision invalidating appointments to the National Labor Relations Board by President Obama, which, if upheld and applied to similar appointments to the CFPB, could call into question the validity of certain actions by the CFPB subject to certain statutory limitations. On January 4, 2012,or result in the subsequent invalidation
of such rules; however, it is possible that the final and proposed rules could have a Directorsignificant adverse impact on our results of the CFPB was appointed, via recess appointment, and accordingly, the CFPB was vested with full authority to exercise all supervisory, enforcement and rulemaking authorities granted to the CFPB under the Financial Reform Act, including its supervisory powers over non-bank financial institutions such as pay-day lenders and other types of non-bank financial institutions.operations.
On December 20, 2011, the Federal Reserve issued proposed rules to implement enhanced supervisory and prudential requirements and the early remediation requirements established under the Financial Reform Act. The enhanced standards include risk-based capital and leverage requirements, liquidity standards, requirements for overall risk management, single-counterparty credit limits, stress test requirements and a debt-to-equity limit for certain companies determined to pose a threat to financial stability. Comments onOn October 12, 2012, the proposedFederal Reserve issued final rules are duerequiring covered entities to undergo annual stress tests conducted by March 31, 2012,the Federal Reserve and finalconduct their own “company-run” stress tests twice a year. Final regulations willaddressing the remaining items have not be adopted until after that date.yet been adopted. The final rules are likely to influence our regulatory capital and liquidity planning process, and may impose additional operational and compliance costs on us.
Many of the provisions under the Financial Reform Act have only begun to be phasedimplemented or remain to be implemented in or will be phased in over the next several months or yearsfuture and will be subject both to further rulemaking and the discretion of applicable regulatory bodies. The Financial Reform Act will continue to have a significant and negative impact on our earnings through fee reductions, higher costs and imposition of new restrictions.restrictions on us. The Financial Reform Act may also continue to have a material adverse impact on the value of certain assets and liabilities held on our balance sheet. The ultimate impact of the Financial Reform Act on our businesses and results of operationsbusiness will depend on regulatory interpretation and rulemaking, as well as the success of any of our actions to mitigate the negative earnings impactimpacts of certain provisions.
In December 2010, the Basel Committee on Banking Supervision (Basel Committee) issued “Basel III:3: A global regulatory framework for more resilient banks and banking systems” and “International framework for liquidity risk measurement, standards and monitoring” (together, Basel III)3). If
implemented by U.S. banking regulators as proposed, Basel III’s3’s capital standards could significantly increase our capital requirements. Basel III3 and the Financial Reform Act propose the disqualification of trust preferred securities from Tier 1 capital, with the Financial Reform Act proposing that the disqualification be phased in from 2013 to 2015. Basel III3 also proposes the deduction of certain assets from capital (deferred tax assets, MSRs, investments in financial firms and pension assets, among others, within prescribed limitations), the inclusion of accumulated OCI in capital, increased capital requirements for counterparty credit risk, and new minimum capital and buffer requirements.
Basel III3 also proposes two minimum liquidity risk measures. The LCRliquidity coverage ratio (LCR) measures the amount of a financial institution’s unencumbered, high-quality, liquid assets relative to the net cash outflows the institution could encounter under an acutea significant 30-day stress scenario. The NSFRnet stable funding ratio (NSFR) measures the amount of longer-term, stable sources of funding employed by a financial institution relative to the liquidity profiles of the assets funded and the potential for contingent calls on funding liquidity arising from off-balance sheet commitments and obligations over a one-year period. The Basel Committee announced in January 2013 that the initial minimum LCR requirement of 60 percent will be implemented in January 2015, and will thereafter increase in 10 percent annual increments through January 2019. The Basel Committee is currently reviewing the NSFR and has indicated that it intends for the requirement to
be implemented by January 2018, following an observation period that is currently underway.
On July 19, 2011, the Basel Committee published the consultative document, “Globally systemic important banks: Assessment methodology and the additional loss absorbency requirement,” which sets out measures for global, systemically important financial institutions including the methodology for measuring systemic importance, the additional capital required (the SIFI buffer),systemically important financial institution buffer and the arrangements by which they will be phased in. As proposed, the SIFIsystemically important financial institution buffer would be met with additional Tier 1 common equity ranging from one percent to 2.5 percent,, and in certain circumstances, 3.5 percent.percent. This will be phased in from 2016 through 2018. U.S. banking regulatorsAs of December 31, 2012, we estimate our systemically important financial institution buffer would have not yet provided similar rules for U.S. implementationbeen 1.5 percent, based on the Financial Stability Board’s “Update of a SIFI buffer.group of global systemically important banks” issued on November 1, 2012.
Preparation for Basel III3 has influenced and when finalized, is likely to continue to influence our regulatory capital and liquidity planning process, and mayis expected to impose additional operational and compliance costs on us. Any requirement that we increase the amount, or change the composition, of our regulatory capital regulatory capital ratios or liquidity couldmay have a material adverse effectimpact on ourthe Corporation. These impacts could include, but are not limited to, potential dilution of existing stockholders, increased funding costs and competitive disadvantage compared to financial condition and results of operations, as we may need to liquidate certain assets, perhaps on terms unfavorable to us and contrary to our business plans. Such a requirement could also compel us to issue additional securities, which could dilute our current common stockholders.institutions not under the same regulatory framework.
For additional information about the regulatory initiatives discussed above, see Regulatory Matters in the MD&A on page 6664.
Changes in the structure of the GSEs and the relationship among the GSEs, the government and the private markets, or the conversion of the current conservatorship of the GSEs into receivership, could result in significant changes to theour business operations of CRES, and may adversely impact certain operations of GBAM.our business.
During the last ten years, the Corporation and its subsidiaries and legacy companieswe have sold over $2.0 trillion of loans to the GSEs. Each GSE is currently in a conservatorship, with its primary regulator, the Federal Housing Finance Agency, acting as conservator. We cannot predict if, when or how the conservatorships will end, or any associated changes to the GSEs’ business structure that could result. We also cannot predict whether the conservatorships will end in receivership. There are several proposed approaches to reform the GSEs which, if enacted, could change the structure of the GSEs and the relationship among
the GSEs, the government and the private markets, including the trading markets for agency conforming mortgage loans and markets for mortgage-related securities in which weGBAM participates.participate. We cannot predict the prospects for the enactment, timing or content of legislative or rulemaking proposals regarding the future status of the GSEs. Accordingly, there continues to be uncertainty regarding the future of the GSEs, including whether they will continue to exist in their current form. GSE reform, if enacted, could result in a significant change to the business operations of CRES and adversely impact certain operations of GBAM.
We face substantialare subject to significant financial and reputational risks from potential legal liability and significant regulatory action, which could have material adverse effects on our cash flows, financial condition and results of operations, or cause significant reputational harm to us.action.
We face significant legal risks in our businesses,business, and the volume of claims and amount of damages and penalties claimed in litigation and regulatory proceedings against us and other financial institutions remain high and are increasing. Increased litigation costs, substantial legal liability or significant regulatory action against us could have material adverse effects on our financial
condition and results of operations or cause significant reputational harm to us, which in turn could adversely impact our business prospects. In addition, we continue to face increased litigation risk and regulatory scrutiny. We have continuedcontinue to experience increased litigation and other disputes with counterparties regarding relative rights and responsibilities. Consumers, clients and other counterparties have grown more litigious. Our experience with certain regulatory authorities suggests a migration towards an increasing supervisory focus on enforcement, including in connection with alleged violations of law and customer harm. The current environment of additional regulation, increased regulatory compliance burdens, and enhanced regulatory enforcement, combined with ongoing uncertainty related to the continuing evolution of the regulatory environment, has resulted in significant operational and compliance costs and may limit our ability to continue providing certain products and services.
These litigation and regulatory matters and any related settlements could have a material adverse effect on our cash flows, financial condition and results of operations. They could also negatively impact our reputation and lead to volatility of our stock price. For a further discussion of litigation risks, see Note 1413 – Commitments and Contingencies to the Consolidated Financial Statements.
ChangesOur business prospects are vulnerable to changes in governmental fiscal and monetary policy could adversely affect our financial condition and results of operations.policy.
Our businesses and earnings are affected by domestic and international fiscal and monetary policy. The Federal Reserve regulates the supply of money and credit in the U.S. and its policies determine in large partaffect our cost of funds for lending, investing and capital raising activities and the return we earn on those loans and investments, both of which affect our net interest margin. The actions of the Federal ReserveReserve’s actions also can materially affect the value of financial instruments and other assets, such as debt securities and MSRs, and its policies also can affect our borrowers, potentially increasing the risk that they may fail to repay their loans. Our businesses and earnings are also affected by the fiscal or other policies that are adopted by the U.S. government, various U.S. regulatory authorities, and non-U.S. governments and regulatory authorities. Changes in domestic and international fiscal and monetary policies are beyond our control and difficult
to predict but could have an adverse impact on our capital requirements and the costs of running our businesses, in turnbusiness.
We may be adversely impacting our financial condition and results of operations.
Changesaffected by changes in U.S. and non-U.S. tax and other laws and regulations could adversely affect our financial condition and results of operations.regulations.
The U.S. Congress and the Administration have signaled growing interest in reforming the U.S. corporate income tax. While the timing of such reform is unclear, possibletax code. Possible approaches include lowering the 35 percent corporate tax rate, modifying the taxation of income earned outside of the U.S. and limiting or eliminating various other deductions, tax credits and/or other tax preferences. It is not possible at this time to quantify either the one-time impact from remeasuring deferred tax assets and liabilities that might result upon enactment of tax reform enactment or the ongoing impact reform might have on income tax expense, but either of these impacts could adversely affect our financial condition and results of operations.expense.
In addition, the income from certain non--U.S.non-U.S. subsidiaries has not been subject to U.S. income tax as a result of long-standing deferral provisions applicable to income that is derived in the active conduct of a banking and financing business abroad (active finance income). The U.S. Congress has extended the application of these deferral provisions several times, most recently in 2010.January 2013. These provisions now are set to expire for taxable years beginning on or after January 1, 2012.2014. Absent an extension of these provisions, active financing income earned by certain non-U.S. subsidiaries will generally be subject to a tax provision that considers incremental U.S. income tax. The impact of the expiration of these provisions would depend upon the amount, composition and geographic mix of our future earnings.
Other countries have also proposed and in some cases, adopted certain regulatory changes targeted at financial institutions or that otherwise affect us. The EU has adopted increased capital requirements and the U.K. has (i) increased liquidity requirements for local financial institutions, including regulated U.K. subsidiaries of non-U.K. bank holding companies and other financial institutions as well as branches of non-U.K. banks located in the U.K;U.K.; (ii) adopted a Bank Tax Levy which will apply to the aggregate balance sheet of branches and subsidiaries of non-U.K. banks and banking groups operating in the U.K.; and (iii) proposed the creation and production of recovery and resolution plans by U.K.-regulated entities.
On July 19, 2011,17, 2012, the U.K. 20112012 Finance Bill was enacted which reduced the corporate income tax rate one percent to 2624 percent beginning on April 1, 2011,2012, and then to 2523 percent effectivebeginning on April 1, 2012.2013. These rate reductions will favorably affect income tax expense on future U.K. earnings but also required us to remeasure our U.K. net deferred tax assets using the lower tax rates. The income tax benefit for 20112012 included a $782$788 million charge for the remeasurement, substantially all of which was recorded in GBAMGlobal Markets. If the corporate income tax ratesrate were to be reduced to 2321 percent by 2014 as suggested in U.K. Treasury announcements and assuming no change in the deferred tax asset balance, a charge to income tax expense of approximately $400 million for each one percent reduction in the rate would result in each period of enactment (for a total of approximately $800 million). We are also monitoring other international legislative proposals that could materially impact us, such as changes to corporate income tax laws. Currently, in the U.K., net operating lossNOL carryforwards (NOLs) have an indefinite life. Were the U.K.
taxing authorities to introduce limitations on the future utilization of NOLs and were the Corporation unable to document its continued ability to fully utilize its NOLs, we would be required to establish a valuation allowance by a charge to corporate income tax expense. Depending upon the nature of the limitations, such a charge could be material to our results of operations in the period of enactment.
Risk of the Competitive Environment in which We Operate
We face significant and increasing competition in the financial services industry.
We operate in a highly competitive environment. Over time, there has been substantial consolidation among companies in the financial services industry, and this trend accelerated in recent years. This trend has also hastened the globalization of the securities and financial services markets. We will continue to experience intensified competition as consolidation in and globalization of the financial services industry may result in larger, better-capitalized and more geographically diverse companies that are capable of offering a wider array of financial products and services at more competitive prices. To the extent we expand into new business areas and new geographic regions, we may face competitors with more experience and more established relationships with clients, regulators and industry participants in the relevant market, which could adversely affect our ability to compete. In addition, technological advances and the growth of e-commerce have made it possible for non-depository institutions to offer products and services that traditionally were banking products, and for financial institutions to compete with technology companies in providing electronic and internet-based financial solutions. Increased competition may negatively affect our results of operationsearnings by creating pressure to lower prices on our products and services andand/or reducing market share.
Damage to our reputation could significantly harm our businesses, including our competitive position and business prospects.
Our ability to attract and retain customers, clients, investors and employees is impacted by our reputation. Public perception of us and others in the financial services industry appeared to decline in 2011. We continue to face increased public and regulatory scrutiny resulting from the financial crisis and economic downturn as well as alleged irregularities in servicing, foreclosure, consumer collections, mortgage loan modifications and other practices, lending volumes, compensation practices, our acquisitions of Countrywide and Merrill Lynch and the suitability or reasonableness of recommending particular trading or investment strategies.
Significant harm to our reputation can also arise from other sources, including employee misconduct, unethical behavior, litigation or regulatory outcomes, failing to deliver minimum or required standards of service and quality, compliance failures, unintended disclosure of confidential information, and the activities of our clients, customers and counterparties, including vendors. Actions by the financial services industry generally or by certain members or individuals in the industry also can significantly adversely affect our reputation.
We are subject to complex and evolving laws and regulations regarding privacy, data protections and other matters. Principles concerning the appropriate scope of consumer and commercial
privacy vary considerably in different jurisdictions, and regulatory and public expectations regarding the definition and scope of consumer and commercial privacy may remain fluid intoin the future. It is possible that these laws may be interpreted and applied by various jurisdictions in a manner that is inconsistent with our current or future practices, or that is inconsistent with one another. We face regulatory, reputational and operational risks if personal, confidential or proprietary information of customers or clients in our possession is mishandled or misused.
We could suffer significant reputational harm if we fail to properly identify and manage potential conflicts of interest. Management of potential conflicts of interests has become increasingly complex as we expand our business activities through more numerous transactions, obligations and interests with and among our clients. The failure to adequately address, or the perceived failure to adequately address, conflicts of interest could affect the willingness of clients to deal with us, or give rise to litigation or enforcement actions, which could adversely affect our businesses.
Our actual or perceived failure to address these and other issues gives rise to reputational risk that could cause significant harm to us and our business prospects, including failure to properly address operational risks. Failure to appropriately address any of these issues could also give rise to additional regulatory restrictions, legal risks and reputational harm, which could, among other consequences, increase the size and number of litigation claims and damages asserted or subject us to enforcement actions, fines and penalties and cause us to incur related costs and expenses.
Our ability to attract and retain qualified employees is critical to the success of our businessesbusiness and failure to do so could adversely affecthurt our business prospects including ourand competitive position and results of operations.position.
Our performance is heavily dependent on the talents and efforts of highly skilled individuals. Competition for qualified personnel within the financial services industry and from businesses outside the financial services industry has been, and is expected to continue to be, intense. Our competitors include non-U.S.-based institutions and institutions otherwise not subject to different compensation and
hiring regulations than those imposed on U.S. institutions and financial institutions in particular.institutions. The difficulty we face in competing for key personnel is exacerbated in emerging markets, where we are often competing for qualified employees with entities that may have a significantly greater presence or more extensive experience in the region.
In order to attract and retain qualified personnel, we must provide market-level compensation. As a large financial and banking institution, we may be subject to limitations on compensation practices (which may or may not affect our competitors) by the Federal Reserve, the FDIC or other regulators around the world. Any future limitations on executive compensation imposed by legislation or regulation could adversely affect our ability to attract and maintain qualified employees. Furthermore, a substantial portion of our annual bonusincentive compensation paid to our senior employees has in recent years taken the form of long-term equity awards. TheTherefore, the ultimate value of long-term equity awards to senior employees generally has been negatively affected bythis compensation depends on the significant decline in the market price of our common stock.stock when the awards vest. If we are unable to continue to attract and retain qualified individuals, our business prospects including ourand competitive position and results of operations, could be adversely affected.
In addition, if we fail to retain the wealth advisors that we employ in GWIM, particularly those with significant client relationships, such failure could result in a significant loss of clients or the withdrawal of significant client assets. Any such loss or withdrawal could adversely impact GWIM’s business activities and our financial condition, results of operations and cash flows.
We may not be able to achieve expected cost savings from cost-saving initiatives, including from Project New BAC, or in accordance with currently anticipated time frames.
We are currently engaged in numerous efforts to achieve certain cost savings, including, among other things, Project New BAC.
Project New BAC is a two-phase, enterprise-wide initiative to simplify and streamline workflows and processes, align businesses and costs more closely with our overall strategic plan and operating principles, and increase revenues. Phase 1 focuses on the consumer businesses, including Deposits,, Card Services and CRES,, and related support, technology and operations functions. Phase 2 focuses on Global Commercial Banking, GBAMGlobal Markets and GWIM, and related support, technology and operations functions not subject to evaluation in Phase 1. All aspects of Phase 1 of Project New BAC are currently expected to be implemented by the end of 2014.2013, with the full cost savings impact expected to be realized in 2014, while Phase 2 is expected to be fully implemented by mid-2015.
We may be unable to fully realize the cost savings and other anticipated benefits from our cost saving initiatives or in accordance with currently anticipated timeframes.
Our inability to adapt our products and services to evolving industry standards and consumer preferences could harm our businesses.business.
Our business model is based on a diversified mix of businessesbusiness that provideprovides a broad range of financial products and services, delivered through multiple distribution channels. Our success depends in part, on our ability to adapt our products and services to evolving industry standards. There is increasing pressure by competitors to provide products and services at lower prices. This can reduce our net interest margin and revenues from our fee-based products and services. In addition, the widespread adoption of new technologies, including internet services, could require us to incur substantial expenditures to modify or adapt our existing products and services. We might not be successful in developing or introducing new products and services, responding or adapting to changes in consumer spending and saving habits, achieving
market acceptance of our products and services, or sufficiently developing and maintaining loyal customers.
Risks Related to Risk Management
Our risk management framework may not be effective in mitigating risk and reducing the potential for significant losses.
Our risk management framework is designed to minimize risk and loss to us. We seek to identify, measure, monitor, report and control our exposure to the types of risk to which we are subject, including strategic, credit, market, liquidity, compliance, operational and reputational risks, among others. While we employ a broad and diversified set of risk monitoring and mitigation techniques, those techniques are inherently limited because they cannot anticipate the existence or future development of currently unanticipated or unknown risks. Recent economic conditions, heightened legislative and regulatory scrutiny of the financial services industry and increases in the overall complexity of our operations, among other developments, have resulted in a heightened level of risk for us. Accordingly, we could suffer losses as a result of our failure to properly anticipate and manage these
risks, including all correlations and downstream secondary or follow-on effects that occur. risks.
For additional information about our risk management policies and procedures, see Managing Risk in the MD&A on page 6866.
A failure in or breach of our operational or security systems or infrastructure, or those of third parties with which we do business, including as a result of cyber attacks, could disrupt our businesses, result in the disclosure or misuse of confidential or proprietary information, damage our reputation, increase our costs and cause losses. Any such failure also could have a material adverse effect on our business, financial condition and results of operations.
Our businesses are highly dependent on our ability to process, record and monitor, on a continuous basis, a large number of transactions, many of which are highly complex, across numerous and diverse markets in many currencies. The potential for operational risk exposure exists throughout our organization includingand is not limited to operations functions. Operational risk exposures can impact our results of operations, such as losses resulting from unauthorized trades by any employees.employees, and their impact may extend beyond financial losses.
Integral to our performance is the continued efficacy of our internal processes, systems, relationships with third parties and the vast array of employees and key executives in our day-to-day and ongoing operations. With regard to the physical infrastructure and systems that support our operations, we have taken measures to implement backup systems and other safeguards, but our ability to conduct business may be adversely affected by any significant and widespread disruption to our infrastructure or systems. Our financial, accounting, data processing, backup or other operating systems and facilities may fail to operate properly or become disabled or damaged as a result of a number of factors including events that are wholly or partially beyond our control and adversely affect our ability to process these transactions or provide these services. There could be sudden increases in customer transaction volume; electrical or telecommunications outages; natural disasters such as earthquakes, tornadoes and hurricanes; disease pandemics; events arising from local or larger scale political or social matters, including terrorist acts; and cyber attacks. We continuously update these systems to support our operations and growth. This updating entails significant costs and creates risks associated with implementing new systems and integrating them with existing ones.
Information security risks for large financial institutions such as the Corporationlike us have significantly increased in recent years in part because of the proliferation of new technologies, the use of the Internet and telecommunications technologies to conduct financial transactions, and the increased sophistication and activities of organized crime, hackers, terrorists and other external parties, including foreign state actors. Our operations rely on the secure processing, transmission and storage of confidential, proprietary and other information in our computer systems and networks. Our banking, brokerage, investment advisory and capital markets businesses rely on our digital technologies, computer and email systems, software, and networks to conduct their operations. In addition, to access our products and services, our customers may use personal smartphones, PCs and other computing devices, tablet PCs and other mobile devices that are beyond our control systems. Our technologies, systems, networks and our customers’ devices have been subject to, and are likely to continue to be the target of, cyber attacks, computer viruses, malicious code, phishing attacks or information security breaches that could result in the unauthorized release, gathering, monitoring, misuse, loss or destruction of our or our customers’ confidential, proprietary and other information, or otherwise disrupt our or our customers’ or other third parties’
business operations. BecauseFor example, our websites have been subject to a series of distributed denial of service cyber security incidents. Although these incidents have not had a material impact on Bank of America, nor have they resulted in unauthorized access to our or our customers’ confidential, proprietary or other information, because of our prominence, we believe that such attacksincidents may continue.
Although to date we have not experienced any material losses relating to cyber attacks or other information security breaches, there can be no assurance that we will not suffer such losses in the future. Our risk and exposure to these matters remains heightened because of, among other things, the evolving nature of these threats, theour prominent size and scale of the Corporation and itsour role in the financial services industry, our plans to continue to implement our Internet banking and mobile banking channel strategies and develop additional remote connectivity solutions to serve our customers when and how they want to be served, our expanded geographic footprint and international presence, the outsourcing of some of our business operations, the continued uncertain global economic environment, threats of cyberterrorism, and system and customer account conversions. As a result, cybersecurity and the continued development and enhancement of our controls, processes and practices designed to protect our systems, computers, software, data and networks from attack, damage or unauthorized access remain a priority for us. As cyber threats continue to evolve, we may be required to expend significant additional resources to continue to modify or enhance our protective measures or to investigate and remediate any information security vulnerabilities.
In addition, we also face the risk of operational failure, termination or capacity constraints of any of the third parties with which we do business or that facilitate our business activities, including clearing agents, exchanges, clearing houses or other financial intermediaries we use to facilitate our securities transactions. In recent years, there has been significant consolidation among clearing agents, exchanges and clearing houses and increased interconnectivity of multiple financial institutions with central agents, exchanges and clearing houses. This consolidation and interconnectivity increases the risk of operational failure, on both individual and industry-wide bases, as
disparate complex systems need to be integrated, often on an accelerated basis. Any such failure, termination or constraint could adversely affect our ability to effect transactions, service our clients, manage our exposure to risk or expand our businesses, and could have a significantan adverse impact on our liquidity, financial condition and results of operations.
Disruptions or failures in the physical infrastructure or operating systems that support our businesses and customers, or cyber attacks or security breaches of the networks, systems or devices that our customers use to access our products and services could result in the loss of customers and business opportunities, legal liability,significant business disruption to the Corporation’s operations and business, misappropriation of the Corporation’s confidential information and/or that of its customers, or damage to the Corporation’s computers or systems and/or those of its customers and/or counterparties, and could result in violations of applicable privacy laws and other laws, litigation exposure, regulatory fines, penalties or intervention, loss of confidence in the Corporation’s security measures, reputational damage, reimbursement or other compensatory costs, and additional compliance costs, any of which could materially adversely affect our business, financial condition and results of operations.costs.
For more information on operational risks and our operational risk management, see Operational Risk Management in the MD&A on page 119120.
Risk of Being an International Business
We are subject to numerous political, economic, market, reputational, operational, legal, regulatory and other risks in the non-U.S. jurisdictions in which we operate which could adversely impact our businesses, financial condition and results of operations.operate.
We do business throughout the world, including in developing regions of the world commonly known as emerging markets. Our businesses and revenues derived from non-U.S. jurisdictions are subject to risk of loss from currency fluctuations, social or judicial instability, changes in governmental policies or policies of central banks, expropriation, nationalization and/or confiscation of assets, price controls, capital controls, exchange controls, other restrictive actions, unfavorable political and diplomatic developments, and changes in legislation. These risks are especially acute in emerging markets. Many non-U.S. jurisdictions in which we do business have been negatively impacted by recessionary conditions. While a number of these jurisdictions are showing signs of recovery, others continue to experience increasing levels of stress. In addition, the increasing potential risk of default on sovereign debt in some non-U.S. jurisdictions could expose us to substantial losses. Risks in one country can affect our operations in another country or countries, including our operations in the U.S. As a result, any such unfavorable conditions or developments could have an adverse impact on our businesses, financial condition and results of operations.company.
Our non-U.S. businesses are also subject to extensive regulation by various non-U.S. regulators, including governments, securities exchanges, central banks and other regulatory bodies, in the jurisdictions in which those businesses operate. In many countries, the laws and regulations applicable to the financial services and securities industries are uncertain and evolving, and it may be difficult for us to determine the exact requirements of local laws in every market or manage our relationships with multiple regulators in various jurisdictions. Our inability to remain in compliance with local laws in a particular market and manage our relationships with regulators could have a significant andan adverse effect not only on our businesses in that market but also on our reputation generally.
We also invest or trade in the securities of corporations and governments located in non-U.S. jurisdictions, including emerging markets. Revenues from the trading of non-U.S. securities may be subject to negative fluctuations as a result of the above factors. Furthermore, the impact of these fluctuations could be magnified, because non-U.S. trading markets, particularly in emerging market countries, are generally smaller, less liquid and more volatile than U.S. trading markets.
In addition to non-U.S. legislation, our international operations are also subject to U.S. legal requirements. For example, our international operations are subject to U.S. laws on foreign corrupt practices, the Office of Foreign Assets Control, and anti-money laundering regulations. Additionally, we are subject to Section 13(r) of the Securities Exchange Act of 1934, which requires a registrant to provide disclosure in its periodic reports and file a notice with the SEC if it or its affiliates knowingly engage in certain activities identified under the Iran Threat Reduction and Syria Human Rights Act of 2012. The SEC is required to report any such disclosure to the U.S. President and certain Congressional committees. The President thereafter is required to initiate an investigation into the reported activity and, within 180 days of initiating such an investigation, determine whether sanctions should be imposed. If we are required to report any such activities, whether or not any sanctions are actually imposed on us or our affiliates as a result of these activities, our reputation could be harmed and our results of operations could be adversely impacted.
We are subject to geopolitical risks, including acts or threats of terrorism, and actions taken by the U.S. or other governments in response thereto and/or military conflicts, that could adversely affect business and economic conditions abroad as well as in the U.S.
For more information on our non-U.S. credit and trading portfolio,portfolios, see Non-U.S. Portfolio in the MD&A on page 104105.
Risk from Accounting Changes
Changes in accounting standards or inaccurate estimates or assumptions in the application ofapplying accounting policies could adversely affect our financial condition and results of operations.us.
Our accounting policies and methods are fundamental to how we record and report our financial condition and results of operations. Some of these policies require use of estimates and assumptions that may affect the reported value of our assets or liabilities and results of operations and are critical because they require management to make difficult, subjective and complex judgments about matters that are inherently uncertain. If those assumptions, estimates or judgments were incorrectly made, we could be required to correct and restate prior period financial statements.
Accounting standard-setters and those who interpret the accounting standards (such as the Financial Accounting Standards Board (FASB), the SEC, banking regulators and our independent registered public accounting firm) may also amend or even reverse their previous interpretations or positions on how various standards should be applied. These changes canmay be difficult to predict and can materiallycould impact how we recordprepare and report our financial condition and results of operations.statements. In some cases, we could be required to apply a new or revised standard retroactively, resulting in the Corporation needing to revise and republish prior period financial statements.
The FASB issued on December 20, 2012 a proposed standard on accounting for expected credit losses. The standard would replace multiple existing impairment models, including replacing an “incurred loss” model for loans with an “expected credit loss” model. The FASB announced it will establish the effective date when it issues the final standard. We cannot predict whether or when a final standard will be issued, when it will be effective or what its final provisions will be. It is possible that the final standard could have a material adverse impact on our results of operations once it is issued and becomes effective.
For more information on some of our critical accounting policies and standards and recent accounting changes, see Complex Accounting Estimates in the MD&A on page 120121 and Note 1 – Summary of Significant Accounting Principles to the Consolidated Financial Statements.
Item 1B. Unresolved Staff Comments
None
|
| | |
| | | Bank of America 2012 2119 |
Item 1B. Unresolved Staff Comments
None
Item 2. Properties
As of December 31, 20112012, our principal offices and other materially important properties consisted of the following:
|
| | | | | | | | | | |
| | | | | | | | | | | |
| Facility Name | | Location | | General Character of the Physical Property | | Primary Business Segment | | Property Status | | Property Square Feet (1) |
| Corporate Center | | Charlotte, NC | | 60 Story Building | | Principal Executive Offices | | Owned | | 1,222,1291,200,392 |
| One Bryant Park | | New York, NY | | 54 Story Building | | GBAMGlobal Banking, GWIMGlobal Markets and Global Commercial BankingGWIM
| | Leased (2) | | 1,788,1821,798,373 |
| Bank of America Home Loans | | Calabasas, CA | | 3 Story Building | | CRES | | Owned | | 245,000 |
Merrill Lynch Financial CenterCentre | | London, UK | | 4 Building Campus | | GBAMGlobal Banking, Global Markets and GWIM
| | Leased | | 568,307568,256 |
| Nihonbashi 1-Chome Building | | Tokyo, Japan | | 24 Story Building | | GBAMGlobal Banking and Global Markets | | Leased | | 263,723208,498 |
| |
(1) | For leased properties, property square feet represents the square footage occupied by the Corporation. |
| |
(2) | The Corporation has a 49.9 percent joint venture interest in this property. |
We own or lease approximately 115.5108.8 million square feet in 25,91224,014 locations globally, including approximately 107.9101.9 million square feet in the United StatesU.S. (all 50 U.S. states, the District of Columbia, the U.S. Virgin Islands and Puerto Rico) and approximately 7.66.9 million square feet in 46 non-U.S.more than 40 countries.
We believe our owned and leased properties are adequate for our business needs and are well maintained. We continue to evaluate our owned and leased real estate and may determine from time to time that certain of our premises and facilities, or ownership structures, are no longer necessary for our operations. In connection therewith, we are evaluating the sale or sale/
leaseback of certain properties and we may incur costs in connection with any such transactions.
Item 3. Legal Proceedings
See Litigation and Regulatory Matters in Note 1413 – Commitments and Contingencies to the Consolidated Financial Statements, which is incorporated herein by reference.
Item 4. Mine Safety Disclosures
None
|
| | |
2220 Bank of America 20112012
| | |
Part II
Bank of America Corporation and Subsidiaries
Item 5. Market for Registrant’s Common Equity, Related Stockholder Matters and Issuer Purchases of Equity Securities
The principal market on which our common stock is traded is the New York Stock Exchange. Our common stock is also listed on the London Stock Exchange, and certain shares are listed on the Tokyo Stock Exchange. The table below sets forth the high and low closing sales prices of the common stock on the New York Stock Exchange for the periods indicated:
| | | | | | | | |
| | | Quarter | | High | | Low | |
| 2010 | | first | | $ | 18.04 |
| | $ | 14.45 |
| |
| | | second | | 19.48 |
| | 14.37 |
| | | | | | | | | | |
| | | third | | 15.67 |
| | 12.32 |
| | | | |
| | | fourth | | 13.56 |
| | 10.95 |
| | Quarter | | High | | Low |
| 2011 | | first | | 15.25 |
| | 13.33 |
| | first | | $ | 15.25 |
| | $ | 13.33 |
|
| | | second | | 13.72 |
| | 10.50 |
| | second | | 13.72 |
| | 10.50 |
|
| | | third | | 11.09 |
| | 6.06 |
| | third | | 11.09 |
| | 6.06 |
|
| | | fourth | | 7.35 |
| | 4.99 |
| | fourth | | 7.35 |
| | 4.99 |
|
| 2012 | | | first | | 9.93 |
| | 5.80 |
|
| | | | second | | 9.68 |
| | 6.83 |
|
| | | | third | | 9.55 |
| | 7.04 |
|
| | | | fourth | | 11.61 |
| | 8.93 |
|
As of February 17, 201225, 2013, there were 237,902226,396 registered shareholders of common stock. During 20102011 and 20112012, we paid
dividends on the common stock on a quarterly basis.
The table below sets forth dividends paid per share of our common stock for the periods indicated:
| | | | | | |
| | Quarter | Dividend | |
| 2010 | first | $ | 0.01 |
| |
| | second | 0.01 |
| | | | |
| | third | 0.01 |
| | |
| | fourth | 0.01 |
| Quarter | Dividend |
| 2011 | first | 0.01 |
| first | $ | 0.01 |
|
| | second | 0.01 |
| second | 0.01 |
|
| | third | 0.01 |
| third | 0.01 |
|
| | fourth | 0.01 |
| fourth | 0.01 |
|
| 2012 | | first | 0.01 |
|
| | | second | 0.01 |
|
| | | third | 0.01 |
|
| | | fourth | 0.01 |
|
For additional information regarding our ability to pay dividends, see Note 1514 – Shareholders’ Equity and Note 1817 – Regulatory Requirements and Restrictions to the Consolidated Financial Statements, which are incorporated herein by reference.
For information on our equity compensation plans, see Note 2019 – Stock-based Compensation Plans to the Consolidated Financial Statements and Item 12 on page 278285 of this report, which are incorporated herein by reference.
The table below presents share repurchase activity for the three months ended December 31, 20122011. We did not have any unregistered sales of our equity securities in 2012.
|
| | | | | | | | | | | | | | | | | |
| | | | | | | | | | | |
| | | Common Shares Repurchased (1) | | Weighted-Average Per Share Price | | Shares Purchased as
Part of Publicly
Announced Programs |
| | Remaining Buyback Authority |
| (Dollars in millions, except per share information; shares in thousands) | | | | | Amounts | | Shares |
| October 1 – 31, 2011 | | 281 |
| | $ | 6.15 |
| | — |
| | $ | — |
| | — |
|
| November 1 – 30, 2011 | | 3 |
| | 6.44 |
| | — |
| | — |
| | — |
|
| December 1 – 31, 2011 | | 80 |
| | 5.66 |
| | — |
| | — |
| | — |
|
| Three months ended December 31, 2011 | | 364 |
| | 6.05 |
| | |
| | |
| | |
|
|
| | | | | | | | | | | | | | | | | |
| | | | | | | | | | | |
| | | Common Shares Repurchased (1) | | Weighted-Average Per Share Price | | Shares Purchased as
Part of Publicly
Announced Programs |
| | Remaining Buyback Authority |
| (Dollars in millions, except per share information; shares in thousands) | | | | | Amounts | | Shares |
| October 1 - 31, 2012 | | 549 |
| | $ | 9.03 |
| | — |
| | $ | — |
| | — |
|
| November 1 - 30, 2012 | | 83 |
| | 9.28 |
| | — |
| | — |
| | — |
|
| December 1 - 31, 2012 | | 104 |
| | 9.31 |
| | — |
| | — |
| | — |
|
| Three months ended December 31, 2012 | | 736 |
| | 9.10 |
| | |
| | |
| | |
|
| |
(1) | Consists of shares acquired by the Corporation in connection with satisfaction of tax withholding obligations on vested restricted stock or restricted stock units and certain forfeitures from terminations of employment related to awards under equity incentive plans. |
We did not have any unregistered sales of our equity securities in 2011, except as previously disclosed on Form 8-K.
Item 6. Selected Financial Data
See Table 7 in the MD&A on page 3733 and Table XII of the Statistical Tables in the MD&A on page 139140, which are incorporated herein by reference.
|
| | |
| | | Bank of America 2012 2321 |
|
| | | | |
Item 7. Bank of America Corporation and Subsidiaries Management’s Discussion and Analysis of Financial Condition and Results of Operations |
| | | | | |
|
| | |
| Table of Contents | | |
| | | Page |
| | |
| | |
| | |
| | |
| | |
| | |
| | |
| | |
| | |
| | |
Consumer Real Estate Services | | |
| | |
| | |
| | |
| | |
| | |
| | |
| | |
| | |
| | |
| | |
| | |
| | |
| | |
| | |
| | |
| | |
| | |
| | |
| | |
| | |
| | |
| | |
| | |
| | |
| | |
| | |
| | |
| | |
Throughout the MD&A, we use certain acronyms and
abbreviations which are defined in the Glossary.
|
| | |
2422 Bank of America 20112012
| | |
Management’s Discussion and Analysis of Financial Condition and Results of Operations
This report on Form 10-K, the documents that it incorporates by reference and the documents into which it may be incorporated by reference may contain, and from time to time Bank of America Corporation (collectively with its subsidiaries, the Corporation) and its management may make certain statements that constitute forward-looking statements within the meaning of the Private Securities Litigation Reform Act of 1995. These statements can be identified by the fact that they do not relate strictly to historical or current facts. Forward-looking statements often use words such as “expects,” “anticipates,” “believes,” “estimates,” “targets,” “intends,” “plans,” “goal” and other similar expressions or future or conditional verbs such as “will,” “may,” “might,” “should,” “would” and “could.” The forward-looking statements made represent the current expectations, plans or forecasts of the Corporation regarding the Corporation’s future results and revenues, and future business and economic conditions more generally, including statements concerning: expectations regarding actions to be taken by the potential impactsFederal Reserve; transfers of servicing rights scheduled to occur in stages over the course of 2013 with the delinquent loans scheduled to be transferred after the current loans; that the criteria for inclusion in the Legacy Assets & Servicing portfolios will continue to be evaluated over time; the expectation that approximately $200 million in servicing fees recognized per quarter related to servicing transferred will decrease throughout 2013 as the servicing is transferred and that over time the impact on earnings will be negligible as expenses are expected to also decrease after servicing is transferred, especially the loans which are 60 days or more past due; the expectation that liability management actions taken in the fourth quarter of 2012 will result in pre-tax net interest income benefit of approximately $350 million in 2013; effects of the European Union sovereign debt crisis;FNMA Settlement and 2013 IFR Acceleration Agreement; the impactachievement of cost savings in certain noninterest expense categories as workflows continue to be streamlined, processes simplified and expenses aligned with the U.K. 2011 Finance Billoverall strategic plan and reviewoperating principles; projected New BAC Phase 1 annualized cost savings of more than $5 billion by the U.K. Financial Services Authority;fourth quarter of 2013 with the full impact expected to be realized in 2014; the expectation that New BAC Phase 2 will result in an additional $3 billion of annualized cost savings by mid-2015; that the Corporation may conduct additional redemptions, tender offers, exercises and other transactions in the future depending on prevailing market conditions, liquidity, regulatory and other factors; the expectation that the Corporation would record a charge to income for each onetax expense of approximately $800 million if the income tax rate were reduced to 21 percent reductionby 2014 as suggested in U.K. Treasury announcements and assuming no change in the U.K. corporate incomedeferred tax rate;asset balance; the agreementsgoal to manage interest rate sensitivity so that movements in principle with the state attorneys generalinterest rates do not significantly adversely affect earnings and U.S. Department of Justice are expected to result in programs that would extend additional relief to homeowners and make refinancing options available to more homeowners; the programs expected to be developed pursuant to the agreements in principle, including expanded mortgage modification solutions such as broader use of principal reduction, short sales and other additional assistance programs, expanded refinancing opportunities, the amount of our commitments under the agreements in principle, as well as expectations that further details about eligibility and implementation will be provided;capital; that the financial impactsale of the settlements isGWIM international wealth management business and the Japanese brokerage joint venture are not expected to cause any additional reserves over existing accruals ashave a significant impact on the Corporation’s balance sheet, results of December 31, 2011 based on our understanding of the terms of the agreements in principle, as well as the expected impact of refinancing assistance and operating costs; that certain amounts may be reduced by credits earned for principal reductions; that our payment obligations under agreements in principle with the Board of Governors of the Federal Reserve System (Federal Reserve) and the Office of the Comptroller of the Currency would be deemed satisfied by payments and provisions of relief under the agreements in principle;operations or capital ratios; the expectation that government entitiesthe Corporation will provide releases from further liability andmake at least $319 million of contributions to pension plans during 2013; the exclusions from the releases; expectations regarding reaching final agreements, obtaining necessary regulatory and court approvals and finalization of the settlements; the planned schedule and details for implementation and completion of, and the expected impact from, Phase 1 and Phase 2 of Project New BAC, including expected personnel reductions and estimated cost savings; the impact of and costs associated with each of the agreements with the Bank of New York Mellon (as trustee for certain legacy Countrywide Financial Corporation (Countrywide)expectation that unresolved repurchase claims related to private-label securitization trusts),trustees and eachthird-party securitization sponsors will continue to increase; the resolution of the government-sponsored enterprises, Fannie Mae (FNMA) and Freddie Mac (collectively, the GSEs), to resolve bulk representations and warranties repurchase and other claims; our expectation that the $1.7 billion in claims from private-label securitization investors in the covered trusts under the private-label securitization settlement with the Bank of New York Mellon (the BNY Mellon Settlement) would be extinguished upon
final court approvalresolution of the BNY Mellon Settlement; the belief that the provisions recorded in connection with the BNY Mellon Settlementestimates of liability and the additional non-GSE representations and warranties provisions recorded in 2011 have provided for a substantial portion of the Corporation’s non-GSE repurchase claims; the estimated range of possible loss for non-GSErepresentations and
warranties repurchase claims; the possibility that future representations and warranties exposure as of December 31, 2011 of up to $5 billion over existing accruals and the effect of adverse developments with respect to one or morelosses may occur in excess of the assumptions underlyingamounts recorded for those exposures; that the liabilityexpiration and mutual non-renewal of certain contractual delivery commitments and variances with Fannie Mae will not have a material impact on our CRES business, as the Corporation expects to rely on other sources of liquidity to actively extend mortgage credit to customers including continuing to deliver such products into Freddie Mac mortgage-backed securities pools; that there will likely be additional requests from monolines for non-GSEloan files in the future leading to repurchase claims; the belief that increases in requests for loan files from certain private-label securitization trustees and requests for tolling agreements to toll the applicable statutes of limitation related to representations and warranties repurchase claims will likely lead to an increase in repurchase claims from private-label securitization trustees with standing to bring such claims; the disposition and resolution of servicing matters; that implementation of uniform servicing standards is expected to contribute to elevated costs associated with the corresponding estimated range of possible loss;servicing process but is not expected to result in material delays or dislocation in the continually evolving behaviorperformance of the GSEs, and the Corporation’s intention to monitor and repurchase loans to the extent required under the contracts and standards that govern our relationships with the GSEs and update its processes related to these changing GSE behaviors; our expressed intention not to pay compensatory fees under the new GSEmortgage servicing guides; the adequacy of the liability for the remaining representations and warranties exposure to the GSEs and the future impact to earnings,obligations including the impact on such estimated liability arising from the announcement by FNMA regarding mortgage rescissions, cancellationscompletion of foreclosures; beliefs and claim denials; our beliefs regarding our ability to resolve rescissions before the expiration of the appeal period allowed by FNMA; our expectation that mortgage-related assessments and waivers costs and costs related to resources necessary to perform the foreclosure process assessments will remain elevated as additional loans are delayed in the foreclosure process; the expected repurchase claims on the 2004-2008 loan vintages, including the belief regarding reduced exposure related to loans originated after 2008; the Corporation’s intention to vigorously contest any requests for repurchase for which it concludes that a valid basis does not exist; future impact of complying with the terms of the consent orders with federal bank regulators regarding the foreclosure process;expectations concerning the impact of delaysthe National Mortgage Settlement; the Corporation’s belief that the decline in connectiondefault-related servicing costs will continue to accelerate in 2013; that swap dealers will continue to become subject to additional CFTC rules as and when such rules take effect; that the proposed rule regarding credit risk retention would likely have an adverse impact on the Corporation’s ability to engage in many types of the MBS and ABS securitizations conducted in CRES, Global Markets and other business segments, impose additional operational and compliance costs and negatively influence the value, liquidity and transferability of ABS or MBS, loans and other assets; that the Dodd-Frank Wall Street Reform and Consumer Protection Act (Financial Reform Act) will continue to have a significant and negative impact on earnings through fee reductions, higher costs and new restrictions as well as reductions to available capital; the substance and timing of the final rules implementing Basel 3; the expectation that the Corporation will comply with the Corporation’s temporary haltfinal Basel 3 rules when issued and effective; that estimates under the Basel 3 Advanced Approach will be refined over time as a result of foreclosure proceedings in late 2010; continued cooperation with investigations;further rulemaking or clarification by U.S. banking regulators and as its understanding and interpretation of the potential materiality of liability with respectrules evolve; that the final rules when adopted and fully implemented are likely to potential servicing-related claims; our estimates regarding the percentages of loans expected to prepay, default or reset in 2012influence regulatory capital and thereafter; the net recovery projections for credit default swaps with monoline financial guarantors; the impact on economic conditionsliquidity planning processes and may impose additional operational and compliance costs on the Corporation arising fromCorporation; the expectation that the Liquidity Coverage Ratio requirement will be implemented in January 2015 and the Net Stable Funding Ratio requirement in January 2018, following an observation period that began in 2011; the goal to seek to maintain safety and soundness at all times, including under adverse conditions, to take advantage of organic growth opportunities, maintain ready access to financial markets, continue to serve as a credit intermediary, remain a source of strength for the Corporation’s subsidiaries, and satisfy current and future regulatory capital requirements; the goal of mitigating refinancing risk by actively managing the amount of borrowings that will likely mature within any further changes tomonth or quarter; the objective of maintaining high-quality credit rating or perceived creditworthiness of instruments issued, insured or guaranteedratings; that, if the Corporation’s analytical models for capital measurement under Basel 3 are not approved by the U.S. government, or of institutions, agencies or instrumentalities directly linked to the U.S. government; the realizability of deferred tax assets prior to expiration of any carryforward periods; credit trends and conditions, including credit losses, credit reserves, the allowance for credit losses, the allowance for loan and lease losses, charge-offs, delinquency, collection and bankruptcy trends, and nonperforming asset levels, including continued expected reductions in the allowance for loan and lease losses in 2012; the role of non-core asset sales in our capital strategy; investment banking fees; sales and trading revenue; consumer and commercial service charges, including the impact of changes in the Corporation’s overdraft policy and the Corporation’s ability to mitigate a decline in revenues; the effects of new accounting pronouncements; capital levels determined by or established in accordance with accounting principles generally accepted in the United States of America and with the requirementsregulatory
|
| | |
| | | Bank of America 2012 2523 |
agencies, it would likely lead to an increase in the Corporation’s risk-weighted assets, which in some cases could be significant; that the Market Risk Final Rule and the Basel 3 Advanced Approach, if adopted as proposed, are expected to substantially increase the Corporation’s capital requirements; that results from using stress scenario assumptions provided by the Federal Reserve will be received from the Federal Reserve on March 14, 2013; that funding trading activities in broker/dealer subsidiaries is more cost-efficient and less sensitive to changes in credit ratings than unsecured financing; that VaR model results will be supplemented if risks associated with positions that are illiquid and/or unobservable are material; the cost and availability of various regulatory agencies,unsecured funding; the Corporation’s belief that it can quickly obtain cash for certain securities even in stressed market conditions, through repurchase agreements or outright sales; the Corporation’s belief that a portion of structured liability obligations will remain outstanding beyond the earliest put or redemption date; the Corporation’s anticipation that debt levels will continue to decline, primarily due to maturities, through 2013; that, of the loans in the pay option portfolio at December 31, 2012 that have not already experienced a payment reset, one percent are expected to reset in 2013 and approximately 23 percent thereafter, and that seven percent are expected to prepay and 69 percent are expected to default prior to being reset, most of which were severely delinquent as of December 31, 2012; effects of the ongoing debt crisis in Europe, including our ability to comply with any Basel capital requirements endorsed by U.S. regulators within any applicable regulatory timelines;the expectation of continued volatility as long as challenges remain, the expectation that the Corporation will meetcontinue to support client activities in the Basel III liquidity standards within regulatory timelines;region and that exposures may vary over time as the revenue impactCorporation monitors the situation and manages its risk profile; the impact on the value of our assets and liabilities resulting from, and any mitigation actions taken in response to, the Dodd-Frank Wall Street Reform and Consumer Protection Act (Financial Reform Act), including, but not limited to, the Durbin Amendment and the Volcker Rule; our expectations regarding the December 15, 2010 notice of proposed rulemaking on the Risk-based Capital Guidelines for Market Risk; our expectation that, our market share of mortgage originationsabsent unexpected deterioration in the economy, reductions in the allowance for loan and lease losses, excluding the valuation allowance for PCI loans, will continue to declinein the near term, though at a slower pace than in 2012; CRES’s ceasing to deliver purchase money first mortgage products into FNMA mortgage-backed securities poolsthe goal of mitigating market risk exposures by using techniques that encompass a variety of financial instruments in both the cash and our expectation that this cessation will not have a material impact on CRES’s business; our expectations regarding lossesderivatives markets; the accuracy of forward-looking forecasts of net interest income used in the event of legitimate mortgage insurance rescissions related to loans held for investment; our expressed intended actions in the response to repurchase requests with which we do not agree; the continued reduction of our debt footprint as appropriate through 2013; the estimated range of possible loss from and the impact of various legal proceedings discussed in “Litigation and Regulatory Matters” in Note 14 – Commitments and Contingenciesto the Consolidated Financial Statements; our management processes; credit protection maintained and the effects of certain events on those positions; our estimates of contributions to be made to pension plans; our expectations regarding probable losses related to unfunded lending commitments; our funding strategies including contingency plans; our trading risk management processes; our interest rate and mortgage banking risk management strategies and models; our expressed intention to build capital through retaining earnings, actively reducing legacy asset portfolios and implementing other capital-related initiatives, including focusing on reducing both higher risk-weighted assets and assets currently deducted or expected to be deducted under Basel III, from capital;management; and other matters relating to the Corporation and the securities that it may offer from time to time. The foregoing is not an exclusive list of all forward-looking statements the Corporation makes. These statements are not guarantees of future results or performance and involve certain risks, uncertainties and assumptions that are difficult to predict and are often beyond Bank of America’sthe Corporation’s control. Actual outcomes and results may differ materially from those expressed in, or implied by, any of these forward-looking statements.
You should not place undue reliance on any forward-looking statement and should consider the following uncertainties and risks, as well as the risks and uncertainties more fully discussed elsewhere in this report, under Item 1A. Risk Factors of this report and in any of the Corporation’s subsequent Securities and Exchange Commission filings: the Corporation’s timing and determinations regarding any revised comprehensive capital plan submission and the Federal Reserve’s response; the accuracy and variability of estimates and assumptions in determining the expected value of the loss-sharing reinsurance arrangement relating to the agreement with Assured Guaranty and the total cost of the agreement to the Corporation; the Corporation’s resolution of certain representations and warranties obligations with the GSEs and our ability to resolve the GSEs’ remaining claims; the Corporation’s ability to resolve its
representations and warranties obligations,repurchase claims made by monolines and private-label and other investors, including as a result of any adverse court rulings, and the chance that the Corporation could face related servicing, securities, fraud, indemnity or other claims withfrom one or more of the monolines andor private-label investors and other investors, including those monolines and investors from whom the Corporation has not yet received claims or with whom it has not yet reached any resolutions;investors; the Corporation’s resolution of remaining differences with the government-sponsored enterprises regarding representations and warranties repurchase claims, including in some cases with respect to mortgage modification policiesinsurance rescissions and foreclosure delays if future representations and warranties losses occur in excess of the Corporation’s recorded liability and estimated range of possible loss for its representations and warranties exposures; uncertainties about the financial stability of several countries in the EU, the increasing risk that those countries may default on their sovereign debt or exit the EU and related results;stresses on financial markets, the Euro and the EU and the Corporation’s exposures to such risks, including direct, indirect and operational; the uncertainty regarding the timing and amountfinal substance of any potential dividend increase,capital or liquidity standards, including any necessary approvals;the final Basel 3 requirements and their implementation for U.S. banks through rulemaking by the Federal Reserve, including anticipated requirements to hold higher levels of regulatory capital, liquidity and meet higher regulatory capital ratios as a result of final Basel 3 or other capital or liquidity standards; the negative impact of the Financial Reform Act on the Corporation’s businesses and earnings, including as a result of additional regulatory interpretation and rulemaking and the success of the Corporation’s actions to mitigate such impacts; the Corporation’s satisfaction of its borrower assistance programs under the National Mortgage Settlement with federal agencies and state Attorneys General and under the acceleration agreement with the OCC and the Federal Reserve; adverse changes to the Corporation’s credit ratings from the major credit rating agencies; estimates of the fair value of certain of the Corporation’s assets and liabilities; the identificationunexpected claims, damages and effectiveness of any initiatives to mitigate the negative impact of the Financial Reform Act;fines resulting from pending or future litigation and regulatory proceedings; the Corporation’s ability to limit liabilities acquired as a result offully realize the Merrill Lynch & Co., Inc.cost savings and Countrywide acquisitions;other anticipated benefits from Project New BAC, including in accordance with currently anticipated timeframes; and decisions to downsize, sell or close units or otherwise change the business mix of the Corporation.other similar matters.
Forward-looking statements speak only as of the date they are made, and the Corporation undertakes no obligation to update any forward-looking statement to reflect the impact of circumstances or events that arise after the date the forward-looking statement was made.
Notes to the Consolidated Financial Statements referred to in the Management’s Discussion and Analysis of Financial Condition and Results of Operations (MD&A) are incorporated by reference into the MD&A. Certain prior period amounts have been reclassified to conform to current period presentation. Throughout the MD&A, the Corporation uses certain acronyms and abbreviations which are defined in the Glossary.
Executive Summary
Business Overview
The Corporation is a Delaware corporation, a bank holding company and a financial holding company. When used in this report, “the Corporation” may refer to theBank of America Corporation individually, theBank of America Corporation and its subsidiaries, or certain of theBank of America Corporation’s subsidiaries or affiliates. Our principal executive offices are located in Charlotte, North Carolina. Through our banking and various nonbanking subsidiaries throughout the U.S. and in international markets, we provide a diversified range of banking and nonbanking financial services and products through sixfive business segments: DepositsConsumer & Business Banking (CBB),Card Services, Consumer Real Estate Services (CRES), Global Commercial Banking, Global Banking, &Global Markets (GBAM) and Global Wealth & Investment Management (GWIM), with the remaining operations recorded in
All Other. At December 31, 20112012, the Corporation had approximately $2.12.2 trillion in assets and approximately 282,000267,000 full-time equivalent employees.
As of December 31, 20112012, we operateoperated in all 50 states, the District of Columbia and more than 40 countries. Our retail banking footprint covers approximately 80 percent of the U.S. population and in the U.S., we serve approximately 57more than 53 million consumer and small business relationships with approximately 5,7005,500 banking centers, 17,75016,300 ATMs, nationwide call centers, and leading online and mobile banking platforms. We offer industry-leading support to approximately fourmore than three million small business owners. We are a global leader in corporate and investment banking and trading across a broad range of asset classes serving corporations, governments, institutions and individuals around the world.
Table 1 provides selected consolidated financial data for 20112012 and 20102011.
| | | | | | | | | |
| Table 1 | Selected Financial Data | | | | Selected Financial Data | |
| | | | | | | |
| (Dollars in millions, except per share information) | (Dollars in millions, except per share information) | 2011 | | 2010 | (Dollars in millions, except per share information) | 2012 | 2011 |
| Income statement | Income statement | |
| | |
| Income statement | |
| |
|
Revenue, net of interest expense (FTE basis) (1) | Revenue, net of interest expense (FTE basis) (1) | $ | 94,426 |
| | $ | 111,390 |
| Revenue, net of interest expense (FTE basis) (1) | $ | 84,235 |
| $ | 94,426 |
|
| Net income (loss) | 1,446 |
| | (2,238 | ) | |
| Net income | | Net income | 4,188 |
| 1,446 |
|
Net income, excluding goodwill impairment charges (2) | Net income, excluding goodwill impairment charges (2) | 4,630 |
| | 10,162 |
| Net income, excluding goodwill impairment charges (2) | 4,188 |
| 4,630 |
|
Diluted earnings (loss) per common share (3) | 0.01 |
| | (0.37 | ) | |
| Diluted earnings per common share | | Diluted earnings per common share | 0.25 |
| 0.01 |
|
Diluted earnings per common share, excluding goodwill impairment charges (2) | Diluted earnings per common share, excluding goodwill impairment charges (2) | 0.32 |
| | 0.86 |
| Diluted earnings per common share, excluding goodwill impairment charges (2) | 0.25 |
| 0.32 |
|
| Dividends paid per common share | Dividends paid per common share | 0.04 |
| | 0.04 |
| Dividends paid per common share | 0.04 |
| 0.04 |
|
| Performance ratios | Performance ratios | |
| | |
| Performance ratios | |
| |
|
| Return on average assets | Return on average assets | 0.06 | % | | n/m |
| Return on average assets | 0.19 | % | 0.06 | % |
Return on average assets, excluding goodwill impairment charges (2) | Return on average assets, excluding goodwill impairment charges (2) | 0.20 |
| | 0.42 | % | Return on average assets, excluding goodwill impairment charges (2) | 0.19 |
| 0.20 |
|
Return on average tangible shareholders’ equity (1) | Return on average tangible shareholders’ equity (1) | 0.96 |
| | n/m |
| Return on average tangible shareholders’ equity (1) | 2.60 |
| 0.96 |
|
Return on average tangible shareholders’ equity, excluding goodwill impairment charges (1, 2) | Return on average tangible shareholders’ equity, excluding goodwill impairment charges (1, 2) | 3.08 |
| | 7.11 |
| Return on average tangible shareholders’ equity, excluding goodwill impairment charges (1, 2) | 2.60 |
| 3.08 |
|
Efficiency ratio (FTE basis) (1) | Efficiency ratio (FTE basis) (1) | 85.01 |
| | 74.61 |
| Efficiency ratio (FTE basis) (1) | 85.59 |
| 85.01 |
|
Efficiency ratio (FTE basis), excluding goodwill impairment charges (1, 2) | Efficiency ratio (FTE basis), excluding goodwill impairment charges (1, 2) | 81.64 |
| | 63.48 |
| Efficiency ratio (FTE basis), excluding goodwill impairment charges (1, 2) | 85.59 |
| 81.64 |
|
| Asset quality | Asset quality | |
| | |
| Asset quality | |
| |
|
| Allowance for loan and lease losses at December 31 | Allowance for loan and lease losses at December 31 | $ | 33,783 |
| | $ | 41,885 |
| Allowance for loan and lease losses at December 31 | $ | 24,179 |
| $ | 33,783 |
|
Allowance for loan and lease losses as a percentage of total loans and leases outstanding at December 31 (4)(3) | Allowance for loan and lease losses as a percentage of total loans and leases outstanding at December 31 (4)(3) | 3.68 | % | | 4.47 | % | Allowance for loan and lease losses as a percentage of total loans and leases outstanding at December 31 (4)(3) | 2.69 | % | 3.68 | % |
Nonperforming loans, leases and foreclosed properties at December 31 (4)(3) | Nonperforming loans, leases and foreclosed properties at December 31 (4)(3) | $ | 27,708 |
| | $ | 32,664 |
| Nonperforming loans, leases and foreclosed properties at December 31 (4)(3) | $ | 23,555 |
| $ | 27,708 |
|
Net charge-offs | Net charge-offs | 20,833 |
| | 34,334 |
| Net charge-offs | 14,908 |
| 20,833 |
|
Net charge-offs as a percentage of average loans and leases outstanding (4) | 2.24 | % | | 3.60 | % | |
Net charge-offs as a percentage of average loans and leases outstanding excluding purchased credit-impaired loans (4) | 2.32 |
| | 3.73 |
| |
| Ratio of the allowance for loan and lease losses at December 31 to net charge-offs | 1.62 |
| | 1.22 |
| |
| Ratio of the allowance for loan and lease losses at December 31 to net charge-offs excluding purchased credit-impaired loans | 1.22 |
| | 1.04 |
| |
Net charge-offs as a percentage of average loans and leases outstanding (3, 4) | | Net charge-offs as a percentage of average loans and leases outstanding (3, 4) | 1.67 | % | 2.24 | % |
Net charge-offs as a percentage of average loans and leases outstanding, excluding the purchased credit-impaired loan portfolio (3) | | Net charge-offs as a percentage of average loans and leases outstanding, excluding the purchased credit-impaired loan portfolio (3) | 1.73 |
| 2.32 |
|
Net charge-offs and purchased credit-impaired write-offs as a percentage of average loans and leases outstanding (3, 5) | | Net charge-offs and purchased credit-impaired write-offs as a percentage of average loans and leases outstanding (3, 5) | 1.99 |
| 2.24 |
|
Ratio of the allowance for loan and lease losses at December 31 to net charge-offs (4) | | Ratio of the allowance for loan and lease losses at December 31 to net charge-offs (4) | 1.62 |
| 1.62 |
|
| Ratio of the allowance for loan and lease losses at December 31 to net charge-offs, excluding the purchased credit-impaired loan portfolio | | Ratio of the allowance for loan and lease losses at December 31 to net charge-offs, excluding the purchased credit-impaired loan portfolio | 1.25 |
| 1.22 |
|
Ratio of the allowance for loan and lease losses at December 31 to net charge-offs and purchased credit-impaired write-offs (5) | | Ratio of the allowance for loan and lease losses at December 31 to net charge-offs and purchased credit-impaired write-offs (5) | 1.36 |
| 1.62 |
|
| Balance sheet at year end | Balance sheet at year end | |
| | |
| Balance sheet at year end | |
| |
|
| Total loans and leases | Total loans and leases | $ | 926,200 |
| | $ | 940,440 |
| Total loans and leases | $ | 907,819 |
| $ | 926,200 |
|
| Total assets | Total assets | 2,129,046 |
| | 2,264,909 |
| Total assets | 2,209,974 |
| 2,129,046 |
|
| Total deposits | Total deposits | 1,033,041 |
| | 1,010,430 |
| Total deposits | 1,105,261 |
| 1,033,041 |
|
| Total common shareholders’ equity | Total common shareholders’ equity | 211,704 |
| | 211,686 |
| Total common shareholders’ equity | 218,188 |
| 211,704 |
|
| Total shareholders’ equity | Total shareholders’ equity | 230,101 |
| | 228,248 |
| Total shareholders’ equity | 236,956 |
| 230,101 |
|
| Capital ratios at year end | Capital ratios at year end | |
| | |
| Capital ratios at year end | |
| |
|
| Tier 1 common capital | Tier 1 common capital | 9.86 | % | | 8.60 | % | Tier 1 common capital | 11.06 | % | 9.86 | % |
| Tier 1 capital | Tier 1 capital | 12.40 |
| | 11.24 |
| Tier 1 capital | 12.89 |
| 12.40 |
|
| Total capital | Total capital | 16.75 |
| | 15.77 |
| Total capital | 16.31 |
| 16.75 |
|
| Tier 1 leverage | Tier 1 leverage | 7.53 |
| | 7.21 |
| Tier 1 leverage | 7.37 |
| 7.53 |
|
| |
(1) | Fully taxable-equivalent (FTE) basis, return on average tangible shareholders’ equity and the efficiency ratio are non-GAAP financial measures. Other companies may define or calculate these measures differently. For additional information on these measures and ratios, see Supplemental Financial Data on page 3835, and for a corresponding reconciliation to GAAP financial measures, see Statistical Table XV. |
| |
(2) | Net income, (loss), diluted earnings (loss) per common share, return on average assets, return on average tangible shareholders’ equity and the efficiency ratio have been calculated excluding the impact of the goodwill impairment charges of $3.2 billion and $12.4 billionin 2011 and 2010, and accordingly, these are non-GAAP financial measures. For additional information on these measures and ratios, see Supplemental Financial Data on page 3835, and for a corresponding reconciliation to GAAP financial measures, see Statistical Table XV. |
| |
(3) | Due to a net loss applicable to common shareholders in 2010, the impact of antidilutive equity instruments was excluded from diluted earnings (loss) per share and average diluted common shares. |
| |
(4)
| Balances and ratios do not include loans accounted for under the fair value option. For additional exclusions from nonperforming loans, leases and foreclosed properties, see Nonperforming Consumer Loans and Foreclosed Properties Activity on page 9293 and corresponding Table 3637, and Nonperforming Commercial Loans, Leases and Foreclosed Properties Activity on page 100101 and corresponding Table 4546. |
n/m = not meaningful
2011 Economic and Business Environment
The banking environment and markets in which we conduct our businesses will continue to be strongly influenced by developments in the U.S. and global economies, including the results of the European Union (EU) sovereign debt crisis, continued large budget imbalances in key developed nations, and the implementation and rulemaking associated with recent financial reform. The global economy expanded at a diminished pace in 2011, with the U.S., U.K., Europe and Japan all losing momentum, while economic growth in emerging nations diminished somewhat but remained robust.
United States
The U.S. economy expanded only modestly in 2011, as a promising beginning with an improving labor market gave way to an appreciable slowdown in domestic demand early in the year. By mid-year, the labor market had slowed once more, followed by a
sharp reversal in the stock market and in consumer sentiment. Increasing oil prices and supply chain disruptions stemming from Japan’s earthquake, along with continued financial market anxiety due to the European sovereign debt crisis and difficult and protracted U.S. budget negotiations related to the federal debt ceiling, contributed to the weakness. As some of these factors dissipated, domestic demand picked up in the second half of 2011, easing U.S. recession fears. In the fourth quarter, equities rebounded from their mid-year declines, consumer confidence edged up and labor markets showed clear signs of improvement. The unemployment rate ended the year at 8.5 percent compared to 9.4 percent at December 31, 2010.
Despite subdued U.S. economic growth, year-over-year inflation drifted higher over the first three quarters of 2011, lifted in part by the surge in energy costs, before edging lower in the fourth quarter. Fears of deflation, prevalent in 2010, faded as year-over-year core inflation, which began 2011 below one percent, moved
| |
(4) | Net charge-offs exclude $2.8 billion of write-offs in the Countrywide home equity purchased credit-impaired loan portfolio for 2012. These write-offs decreased the purchased credit-impaired valuation allowance included as part of the allowance for loan and lease losses. For information on purchased credit-impaired write-offs, see Countrywide Purchased Credit-impaired Loan Portfolio on page 90. |
| |
(5) | There were no write-offs of purchased credit-impaired loans in 2011. |
|
| | |
| | | Bank of America 2012 2725 |
2012 Economic and Business Environment
The U.S. economy began 2012 with momentum in consumer spending, led by stronger vehicle sales and supported by larger private payroll gains. However, over the course of the year, consumer spending slowed and business spending continued to above two percent byweaken following the expiration of 2011 tax incentives and ongoing uncertainties surrounding fiscal issues in the U.S. and Europe. Payroll gains steadied to a moderate pace, while business profits and cash flows continued to rise throughout the year. The unemployment rate ended the year end. Nevertheless,at 7.8 percent. Equity markets were volatile but finished with appreciable gains in 2012. The housing sector improved as new and existing home sales rose, home prices increased and residential building activity ended the year with its seventh consecutive quarterly rise.
After briefly rising early in the year, bond yields fell as the U.S. economy slowed and economic uncertainties in Europe intensified. The low bond yields also reflected the Board of Governors of the Federal Reserve System’s (Federal Reserve) monetary easing and related efforts to keep bond yields low. In December 2012, the Federal Reserve announced that it would purchase an additional $45 billion per month of long-term U.S. Treasury securities, in addition to its $40 billion per month in mortgage-backed securities (MBS) purchases, and that any policy rate increase would be tied to a 6.5 percent unemployment rate target as long as inflation did not exceed 2.5 percent.
Europe experienced financial market turmoil, numerous policy interventions and spreading recession in 2012. The European Central Bank’s (ECB) long-term refinancing operations helped calm markets for a time but proved insufficient as emerging stresses generated renewed turmoil. In response to sharply rising sovereign bond yields, the ECB announced its willingness to intervene in sovereign debt markets under specified conditions which drifted graduallycalmed markets and pushed down sovereign bond yields. Near year end, the benefits of structural reform, such as lower labor costs and smaller structural budget deficits, were becoming evident in select nations while sovereign spreads stabilized at lower levels. However, widespread recession persisted.
Although the Asian economy continued to expand in 2012, several key nations slowed during the year. China’s economic growth remained subdued in 2012, adversely impacting international trade and overall Asian economic performance. Japan’s economy expanded in the first half of 2011, fell during a volatile third quarter amid anxiety over the European sovereign debt crisis, exacerbated by the U.S. debt ceiling debate and fears of recession. Despite the Standard & Poor’s Rating Services (S&P) ratings downgrade of U.S. sovereign debt, mounting concerns about Europe’s financial crisis generated strong demand for U.S. government securities. The Federal Reserve completed its second round of quantitative easing near mid-year. Respondingyear but returned to sharp declines in equity markets, low consumer expectations and heightened worries about recession the Federal Reserve adopted another financial support program in September 2011 aimed at lowering bond yields. The program involved sales of $400 billion of shorter-term (less than three years) government securities and purchases of an equal volume of longer-term (six years and over) government bonds. Bonds yields held near all-time post-Great Depression lows at year end.
Housing activity remained at historically low levels in 2011 and the supply of unsold homes remained high. Meanwhile, corporate profits continued to grow at a robust pace in 2011, despite slowing from their initial sharp rebound. After bottoming in late 2010, commercial and industrial lending also accelerated in 2011.
Europe
Europe’s financial crisis escalated in 2011 despite a series of initiatives by policymakers, and several European nations were experiencing recessionary conditions in the fourth quarter. Europe’s problems involve unsustainably high public debt in some nations, including Greece and Portugal, slow growth and significant refinancing risk related to maturing sovereign debt in Italy, and excess household debt and sharp declines in wealth stemming from falling home values following unsustainable housing bubbles in other nations, including Spain and Ireland. These national challenges are closely intertwined with the problems facing Europe’s banks, which are some of the largest holders of the bonds of troubled European nations. During 2011, financial markets became increasingly skeptical that government policies would resolve these problems, and risk-averse investors reduced their exposures to bonds of troubled nations, driving up their bond yields and, to varying degrees, restricting access to capital markets. This exacerbated already onerous debt service burdens. In response, European policymakers provided financial support to troubled nations through the European Financial Stability Facility (EFSF) and purchases of sovereign debt by the European Central Bank (ECB). Despite these efforts, sharp increases in the bond yields of Spanish and Italian bonds further complicated Europe’s financial problems beyond the current capabilities of the EFSF. As the magnitude of the financial stresses rose, reflected in higher sovereign bond yields and mounting funding shortfalls at select banks, the ECB instituted new programs to provide low-cost, three-year loans to European banks, and expanded collateral eligibility. This served to alleviate bank funding pressures toward year end and provided greater liquidity in sovereign debt markets.
Asia
Japan’s economic environment in 2011 was marked by the trauma of its massive earthquake in early 2011 that caused a dramatic decline in economic activity followed by a quick rebound. A sharp decline in consumption and domestic demand was accompanied
by temporary production shutdowns of various intermediate and durable goods that disrupted supply chains throughout Asia and the world. The ripple effects were pronounced, although temporary, throughout Asia. China continued to grow rapidly throughout 2011, with real GDP growth exceeding nine percent, despite elevated inflation and government efforts to constrain price pressures through the tightening of monetary policy and bank credit, and regulations that limit speculation and price increases in real estate. China’s economic growth slowed modestly in the second half of the year, reflecting in part slower growth of exports to Europe and other destinations. China’s inflation also began to subside toward year end. Other Asian nations continued to experience strong growth rates.
For information on our non-U.S. portfolio, see Non-U.S. Portfolio on page 104 and Note 28 – Performance by Geographical Areato the Consolidated Financial Statements.year.
Recent Events
Mortgage Related MattersFannie Mae Settlement
Department of Justice/Attorney General Matters
On February 9, 2012,January 6, 2013, we reached agreements in principle (collectively, the Servicing Resolution Agreements)entered into an agreement with (1) the U.S. Department of Justice (DOJ), various federal regulatory agencies and 49 state attorneys generalFannie Mae (FNMA) to resolve federalsubstantially all outstanding and state investigations intopotential repurchase and certain origination, servicing and foreclosure practices (the Global AIP), (2) the Federal Housing Administration (FHA) to resolve certainother claims relating to the origination, sale and delivery of FHA-insuredresidential mortgage loans primarilyoriginated and sold directly to FNMA from January 1, 2000 through December 31, 2008 by Countrywide prior to and for a period following our acquisition of that lender (the FHA AIP) and (3) each of the Federal Reserve and the Office of the Comptroller of the Currency (OCC) regarding civil monetary penaltiesentities related to conduct that was the subject of consent orders entered into with the banking regulators in April 2011 (the Consent Order AIPs).
The Servicing Resolution Agreements are subject to ongoing discussions among the partieslegacy Countrywide Financial Corporation (Countrywide) and completion and execution of definitive documentation, as well as required regulatory and court approvals. The FHA AIP provides for an upfront cash payment and an additional cash payment if we fail to meet certain principal reduction thresholds over a three-year period. Under the terms of the Servicing Resolution Agreements, the federal and participating state governments would provide us with releases from liability for certain alleged residential mortgage origination, servicing and foreclosure deficiencies.
The financial impact of the Servicing Resolution Agreements is not expected to require any additional reserves over existing accruals as of December 31, 2011, based on our understanding of the terms of the Servicing Resolution Agreements. The refinancing assistance commitment under the Servicing Resolution Agreements is expected to be recognized as lower interest income in future periods as qualified borrowers pay reduced interest rates on loans refinanced. The Servicing Resolution Agreements do not cover claims arising out of securitization, including representations made to investors respecting mortgage-backed securities (MBS) and certain other claims. For additional information, see Item 1A. Risk Factors and Off-Balance Sheet Arrangements and Contractual Obligations – Other Mortgage-related Matters on page 63.
Private-label Securitization Settlement with the Bank of New York Mellon
On June 28, 2011, the Corporation, BAC Home Loans Servicing, LP (BAC HLS, which was subsequently merged with and into Bank of America, N.A. (BANA) in July 2011), and its legacy Countrywide affiliates entered into a settlement.
This agreement covers loans with BNY Mellon, as trustee (Trustee), to resolve all outstanding and potentialan aggregate original principal balance of approximately $1.4 trillion. Unresolved repurchase claims related tosubmitted by FNMA for alleged breaches of selling representations and warranties breaches (including repurchase claims), substantially all historical loan servicing claims and certain other historical claims with respect to these loans totaled 525$12.2 billion legacy Countrywide first-lienat December 31, 2012. This agreement extinguished
substantially all of those unresolved repurchase claims, as well as substantially all future representations and warranties
repurchase claims associated with the loans, subject to certain exceptions which we do not expect to be material.
In January 2013, we made a cash payment to FNMA of five second-lien non government-sponsored enterprise (GSE) residential mortgage-backed securitization trusts (the Covered Trusts) containing loans principally originated between 2004$3.6 billion and also repurchased for 2008$6.6 billion forcertain residential mortgage loans that had previously been sold to FNMA, which BNY Mellon acts as trustee or indenture trustee (the BNY Mellon Settlement). The BNY Mellon Settlement agreement is subject to final court approval and certain other conditions.we have valued at less than the purchase price.
An investor opposedThis agreement also clarified the parties’ obligations with respect to the settlement removed the proceeding to the U.S. District Courtmortgage insurance, including establishing timeframes for the Southern District of New York. On October 19, 2011, the district court denied BNY Mellon’s motion to remand the proceeding to state court. BNY Melloncertain payments and the Investor Group petitioned to appeal the denial of this motionother actions, setting parameters for potential bulk settlements and on December 27, 2011, the U.S. Court of Appealsproviding for the Second Circuit accepted the appeal and statedcooperation in an amended scheduling order that,future dealings with mortgage insurers.
In addition, pursuant to statute, it would decidea separate agreement, we settled substantially all of FNMA’s outstanding and future claims for compensatory fees arising out of past foreclosure delays.
Collectively, these agreements are the appeal by February 27, 2012. On November 4, 2011, the district court entered a written order setting a discovery schedule, and discovery is ongoing.
It is not currently possible to predict how many of the parties who have appeared in the court proceeding will ultimately object to the BNY Mellon Settlement, whether the objections will prevent receipt of final court approval or the ultimate outcome of the court approval process, which can include appeals and could take a substantial period of time. In particular, the conduct of discovery and the resolution of the objections to the settlement and any appeals could also take a substantial period of time and these factors, along with the removal of the proceedings to federal court and the associated appeal, could materially delay the timing of final court approval. Accordingly, it is not possible to predict when the court approval process will be completed.
FNMA Settlement. For additional information, about the BNY Mellon Settlement, see Off-Balance Sheet Arrangements and Contractual Obligations – Representations and Warranties on page 5654, and Note 8 – Representations and Warranties Obligations and Corporate Guaranteesto the Consolidated Financial Statements.
Independent Foreclosure Review Acceleration Agreement
On January 7, 2013, Bank of America and other mortgage servicing institutions entered into an agreement with the Office of the Comptroller of the Currency (OCC) and the Federal Reserve to cease the Independent Foreclosure Review (IFR) that had commenced pursuant to a consent order entered into by Bank of America with the Federal Reserve and by BANA with the OCC on April 13, 2011 (2011 OCC Consent Order) and replace it with an accelerated remediation process (2013 IFR Acceleration Agreement). Under the 2013 IFR Acceleration Agreement, the mortgage servicing institutions agreed to make aggregate cash payments totaling $3.8 billion and provide $6.0 billion of other assistance to help borrowers, such as loan modifications and forgiveness of deficiency judgments. The 2013 IFR Acceleration Agreement requires us to make a cash payment of $1.1 billion and provide $1.8 billion of borrower assistance in the form of loan modifications and other foreclosure prevention actions. For additional information, see Off-Balance Sheet Arrangements and Contractual Obligations – Other Mortgage-related Matters on page 63 and Note 9 – Representations and Warranties Obligations and Corporate Guaranteesto the Consolidated Financial Statements. For more information about the risks associated with the BNY Mellon Settlement, see Item 1A. Risk Factors61.
Capital Related MattersSales of Mortgage Servicing Rights
We continuedOn January 6, 2013, Bank of America entered into definitive agreements with two different counterparties, and on February 19, 2013 with an additional counterparty to sell the servicing rights on certain business unitsresidential mortgage loans serviced for FNMA, Freddie Mac (FHLMC), the Government National Mortgage Association (GNMA) and assets as part of our capital management and enterprise-wide initiatives. In November 2011, we sold an aggregate of approximately 10.4 billion common shares of China Construction Bank Corporation (CCB) through private transactions with investors resulting in an aggregate pre-tax gain of $2.9 billion. We currently hold approximately one percent of the outstanding common shares of CCB. The sale also generated approximately $2.9 billion of Tier 1 common capital and reduced our risk-weighted assets by $4.9
billion under Basel I, strengthening our Tier 1 common capital ratio by approximately 24 basis points (bps).
In December 2011, we sold our Canadian consumer card portfolio strengthening our Tier 1 common capital ratio by approximately seven bps.
In November and December 2011, we entered into separate agreements with certain institutional preferred and trust preferred security holders to exchange shares, or depositary shares representing fractional interests in shares, of various series of our outstanding preferred stock, or trust preferred or hybrid income term securities of various unconsolidated trusts, as applicable,private-label securitizations, with an aggregate liquidation preferenceunpaid principal balance of $5.8 billion for 400 million shares of our common stock and $2.3 billion aggregate principal amount of our senior notes. In connection with the exchanges of trust preferred securities, we recorded gains of $1.2approximately $317 billion. The exchangessales involve approximately 2.1 million loans currently serviced by us, including approximately 234,000 residential mortgage loans and approximately 24,000 home equity loans that were 60 days or more past due at December 31, 2012.
The transfers of servicing rights are scheduled to occur in aggregate resulted in an increase of $3.9 billion in Tier 1 common capitalstages throughout 2013 and increased our Tier 1 common capital ratio approximately 29 bps under Basel I. For additional information regarding these exchanges, see Note 13 – Long-term Debt and Note 15 – Shareholders’ Equityare subject to the Consolidated Financial Statements.
Overall during 2011, we generated 126 bpsapproval or consent of Tier 1 common capital and reduced risk-weighted assets by $172 billion, including as a result of, among other things, the exchanges of preferred stock and trust preferred or hybrid securities, our sales of CCB shares and the $5.0 billion investment in preferred stock and common stock warrant by Berkshire Hathaway, Inc. (Berkshire). For additional information on the Berkshire investment, see Note 15 – Shareholders’ Equityto the Consolidated Financial Statements.
As credit spreads for many financial institutions, including the Corporation, have widened during the past year due to global uncertainty and volatility, the market value of debt previously issued by financial institutions has decreased. This uncertainty in the market, evidenced by, among other things, volatility in credit spreads, makes it economically advantageous to consider purchasing and retiring certain of our outstanding debt instruments. In 2012, we completed a tender offer to purchase and retire certain subordinated notes for approximately $3.4 billion in cash and will consider additional purchases in the future depending upon prevailing market conditions, liquidity and other factors. If the purchase of any debt instrumentsthird parties. There is at an amount less than the carrying value, such purchases would be accretive to earnings and capital.
We intend to continue to build capital through retaining earnings, actively reducing legacy asset portfolios and implementing other capital related initiatives, including focusing on reducing both higher risk-weighted assets and assets currently deducted, or expected to be deducted under Basel III, from capital. We expect non-core asset sales to play a less prominent role in our capital strategy in future periods. We issued approximately 122 million of immediately tradable shares of common stock, or approximately $1.0 billion (after-tax) to certain employees in February 2012 in lieu of a portion of their 2011 year-end cash incentive. We may engage, from time to time, in privately negotiated transactions involving the issuance of common stock, cash or other consideration in exchange for preferred stock and certain trust preferred securities in amounts that are not expected to be material to us, either individually or in the aggregate.
Credit Ratings
On December 15, 2011, Fitch Ratings (Fitch) downgraded the Corporation’s and BANA’s long-term and short-term debt ratings as a result of Fitch’s decision to lower its “support floor” for systemically important U.S. financial institutions. On November 29, 2011, S&P downgraded our long-term and short-term debt ratings as well as BANA’s long-term debt rating as a result of S&P’s implementation of revised methodologies for determining Banking Industry Country Risk Assessments and bank ratings. On September 21, 2011, Moody’s Investors Service, Inc. (Moody’s) downgraded our long-term and short-term debt ratings as well as BANA’s long-term debt rating as a result of Moody’s lowering the amount of uplift for potential U.S. government support it incorporates into ratings. On February 15, 2012, Moody’s placed the Corporation’s long-term debt ratings and BANA’s long-term and short-term debt ratings on review for possible downgrade as part of its review of financial institutions with global capital markets operations. Any adjustment to our ratings will be determined based on Moody’s review; however, the agency offered guidance that downgrades to our ratings, if any, would likely be limited to one notch.
Currently, our long-term/short-term senior debt ratings and outlooks expressed by the rating agencies are as follows: Baa1/P-2 (negative) by Moody’s, A-/A-2 (negative) by S&P and A/F1 (stable) by Fitch. The rating agencies could make further adjustments to our ratings at any time and there can be no assurance that all the required approvals and consents will be obtained, and accordingly, some of these transfers may not be consummated. We may conduct additional downgrades will not occur.
Under the termssales of certain over-the-counter (OTC) derivative contracts and other trading agreements,mortgage servicing rights (MSRs) in the event of a downgrade of our credit ratings or certain subsidiaries’ credit ratings, counterparties to those agreements may require us or certain subsidiaries to provide additional collateral or to terminate those contracts or agreements or provide other remedies.
For information regarding the risks associated with adverse changes in our credit ratings, see Liquidity Risk – Credit Ratings on page 79, Note 4 – Derivativesto the Consolidated Financial Statements and Item 1A. Risk Factors.
European Union Sovereign Credit Risks
Certain European countries, including Greece, Ireland, Italy, Portugal and Spain, continue to experience varying degrees of financial stress. Uncertainty in the progress of debt restructuring negotiations and the lack of a clear resolution to the crisis has led to continued volatility in European as well as global financial markets, and if the situation worsens, may further adversely affect these markets. In December 2011, the European Central Bank announced initiatives to address European bank liquidity and funding concerns by providing low-cost, three-year loans to banks, and expanding collateral eligibility. While reducing systemic risk, there remains considerable uncertainty as to future developments regarding the European debt crisis. In early 2012, S&P, Fitch and
Moody’s downgraded the credit ratings of several European countries, and S&P downgraded the credit rating of the EFSF, adding to concerns about investor appetite for continued support in stabilizing the affected countries. Our total sovereign and non-sovereign exposure to Greece, Italy, Ireland, Portugal and Spain, was $15.3 billion at December 31, 2011 compared to $16.6 billion at December 31, 2010. Our total net sovereign and non-sovereign exposure to these countries was $10.5 billion at December 31, 2011 compared to $12.4 billion at December 31, 2010, after taking into account net credit default protection. At December 31, 2011 and 2010, the fair value of net credit default protection purchased was $4.9 billion and $4.2 billion. Losses could still result because our credit protection contracts only pay out under certain scenarios. For a further discussion of our direct sovereign and non-sovereign exposures in Europe, see Non-U.S. Portfolio on page 104 and for more information about the risks associated with our non-sovereign exposures in Europe, see Item 1A. Risk Factors.
Project New BAC
Project New BAC is a two-phase, enterprise-wide initiative to simplify and streamline workflows and processes, align businesses and expenses more closely with our overall strategic plan and operating principles, and increase revenues. Phase 1 evaluations, which were completed in September 2011, focused on the consumer businesses, including Deposits, Card Services and CRES, and related support, technology and operations functions. Phase 2 evaluations began in October 2011 and are focused on Global Commercial Banking, GBAM and GWIM, and related support, technology and operations functions not subject to evaluation in Phase 1. Phase 2 evaluations are expected to continue through April 2012.
Implementation of Phase 1 recommendations began in 2011. Phase 1 has a stated goal of a reduction of approximately 30,000 positions, with natural attrition and the elimination of unfilled positions expected to represent a significant part of the reduction. A stated goal of the full implementation of Phase 1 is to reduce certain costs by $5 billion per year by 2014 and we anticipate that more than 20 percent of these cost savings could be achieved by the end of 2012. As implementation of the Phase 1 recommendations continues and Phase 2 begins, reductions in staffing levels in the affected areas are expected to result in some incremental costs including severance.
Reductions in the areas subject to evaluation for Phase 2 have not yet been fully identified, and accordingly, potential cost savings cannot be estimated at this time; however, they are expected to be lower than Phase 1 because the businesses have lower headcount. All aspects of New BAC are expected to be implemented by the end of 2014. There were no material expenses related to New BAC recorded in 2011. For information about the risks associated with Project New BAC, see Item 1A. Risk Factors.future.
|
| | |
3026 Bank of America 20112012
| | |
At December 31, 2012, we included a positive $342 million in the valuation of our MSRs based on information in the offers we had received on portions of our MSR portfolio. We will recognize as gain on sale any additional increases over the book value of the MSR asset in future periods at the time of the servicing transfers. Our ability to recognize such expected additional increases is subject to the consummation of these servicing transfers and the amount of such benefit will be dependent upon certain factors such as interest rates.
Capital and Liquidity Related Matters
In the fourth quarter of 2012, we repurchased certain of our debt and trust preferred securities with an aggregate carrying value of $5.2 billion for $5.3 billion in cash resulting in a loss of $110 million upon redemption, partially offset by a related pre-tax net interest income benefit of $57 million. We expect that these liability management actions will result in a pre-tax net interest income benefit of approximately $350 million in 2013.
We may conduct additional redemptions, tender offers, exercises and other transactions in the future depending on prevailing market conditions, capital, liquidity and other factors.
Performance Overview
Net income was $1.44.2 billion, or $0.25 per diluted share in 20112012 compared to a net loss of $2.2 billion in 2010. After preferred stock dividends of $1.4 billion in both 2011 and 2010, net income applicable to common shareholders was $85 million, or $0.01 per diluted common share in 2011.
Net interest income on a fully taxable-equivalent (FTE) basis decreased$4.0 billion to $41.6 billion for 2012 compared to a net loss of $3.6 billion, or $0.37 per diluted common share in 20102011. The principal contributorsmost significant driver of the decline was lower consumer loan balances and yields partially offset by ongoing reductions in long-term debt.
Noninterest income decreased$6.2 billion to $42.7 billion. The most significant drivers of the pre-tax net income in 2011 were the following: gainsdecline included a decrease of $6.55.3 billion in equity investment income, negative fair value adjustments of $5.1 billion on the sale of CCB shares (we currently hold approximately one percent of the outstanding common shares), astructured liabilities in $7.4 billion2012 reduction in the allowance for credit losses, $3.4 billion of gains on sales of debt securities,compared to positive fair value adjustments of $3.3 billion related to our own credit spreadsin 2011 and debit valuation adjustment (DVA) losses on structured liabilities, aderivatives of $1.22.5 billion gain on the exchange, net of certain trust preferred securities for common stock and debt andhedges, compared to DVA gains on derivatives of $1.0 billion, net of hedges.hedges, in 2012 and 2011, respectively. These contributorsdeclines were partially offset by significantly lower representations and warranties provision of $3.9 billion in 2012 compared to $15.6 billion in representations2011.
The provision for credit losses decreased$5.2 billion in 2012 to $8.2 billion. The decline was primarily in the home loans portfolio due to improved portfolio trends and warranties provision, litigationincreasing home prices.
Noninterest expense decreased$8.2 billion to $72.1 billion. The most significant drivers of $5.6 billion,the decline were the absence of goodwill impairment charges ofin 2012 compared to $3.2 billion in 2011, $1.8and declines of $1.4 billion of mortgage-related assessments and waivers costs, and $1.11.3 billion in litigation and personnel expenses, respectively. These declines were partially offset by a provision of impairment charges on our merchant services joint venture.$1.1 billion in 2012 related to the 2013 IFR Acceleration Agreement.
Included in the income tax benefit for 2012 was a $1.7 billion tax benefit related to the recognition of certain foreign tax credits.
For summary information on the Corporation’s results, see Executive Summary – Financial Highlights below and Business Segment Results on page 32.
|
| | | | | | | | |
| | | | | |
| Table 2 | Summary Income Statement | | | |
| | | |
| (Dollars in millions) | 2011 | | 2010 |
Net interest income (FTE basis) (1) | $ | 45,588 |
| | $ | 52,693 |
|
| Noninterest income | 48,838 |
| | 58,697 |
|
Total revenue, net of interest expense (FTE basis) (1) | 94,426 |
| | 111,390 |
|
| Provision for credit losses | 13,410 |
| | 28,435 |
|
| Goodwill impairment | 3,184 |
| | 12,400 |
|
| All other noninterest expense | 77,090 |
| | 70,708 |
|
| Income (loss) before income taxes | 742 |
| | (153 | ) |
Income tax expense (benefit) (FTE basis) (1) | (704 | ) | | 2,085 |
|
| Net income (loss) | 1,446 |
| | (2,238 | ) |
| Preferred stock dividends | 1,361 |
| | 1,357 |
|
| Net income (loss) applicable to common shareholders | $ | 85 |
| | $ | (3,595 | ) |
| | | | | |
| Per common share information | | | |
| Earnings (loss) | $ | 0.01 |
| | $ | (0.37 | ) |
| Diluted earnings (loss) | 0.01 |
| | (0.37 | ) |
|
| | | | | | | | |
| | | | | |
| Table 2 | Summary Income Statement | | | |
| | | |
| (Dollars in millions) | 2012 | | 2011 |
Net interest income (FTE basis) (1) | $ | 41,557 |
| | $ | 45,588 |
|
| Noninterest income | 42,678 |
| | 48,838 |
|
Total revenue, net of interest expense (FTE basis) (1) | 84,235 |
| | 94,426 |
|
| Provision for credit losses | 8,169 |
| | 13,410 |
|
| Goodwill impairment | — |
| | 3,184 |
|
| All other noninterest expense | 72,093 |
| | 77,090 |
|
| Income before income taxes | 3,973 |
| | 742 |
|
Income tax benefit (FTE basis) (1) | (215 | ) | | (704 | ) |
| Net income | 4,188 |
| | 1,446 |
|
| Preferred stock dividends | 1,428 |
| | 1,361 |
|
| Net income applicable to common shareholders | $ | 2,760 |
| | $ | 85 |
|
| | | | | |
| Per common share information | | | |
| Earnings | $ | 0.26 |
| | $ | 0.01 |
|
| Diluted earnings | 0.25 |
| | 0.01 |
|
| |
(1) | Fully taxable-equivalent (FTE)FTE basis is a non-GAAP financial measure. Other companies may define or calculate this measure differently. For moreadditional information on this measure, see Supplemental Financial Data on page 3835, and for a corresponding reconciliation to a GAAP financial measure, see Statistical Table XV.
|
Net interest income on a FTE basis decreased$7.1 billion in 2011 to $45.6 billion. The decline was primarily due to lower consumer loan balances and yields and decreased investment security yields. Lower trading-related net interest income also negatively impacted 2011 results. These decreases were partially offset by ongoing reductions in our debt footprint and lower rates paid on deposits. The net interest yield on a FTE basis was 2.48 percent for 2011 compared to 2.78 percent for 2010.
Noninterest income decreased$9.9 billion in 2011 to $48.8 billion. The most significant contributors to the decline were lower mortgage banking income, down $11.6 billion largely due to higher representations and warranties provision, and a decrease of $3.4 billion in trading account profits. These declines were partially offset by the gains on the sale of CCB shares and higher positive fair value adjustments related to our own credit on structured liabilities in 2011. In addition, in connection with separate agreements with certain trust preferred security holders to exchange their holdings for common stock and senior notes, we recorded gains of $1.2 billion in 2011. For additional information on these exchange agreements, see Note 13 – Long-term Debtto the Consolidated Financial Statements.
The provision for credit losses decreased$15.0 billion in 2011 to $13.4 billion. The provision for credit losses was $7.4 billion lower than net charge-offs for 2011, resulting in a reduction in the allowance for credit losses, as portfolio trends continued to improve across most of the consumer and commercial businesses, particularly the Card Services and commercial real estate portfolios partially offset by additions to consumer purchased credit-impaired (PCI) loan portfolio reserves. This compared to a $5.9 billion reduction in the allowance for credit losses in 2010.
Noninterest expense decreased$2.8 billion in 2011 to $80.3 billion. The decline was driven by a $9.2 billion decrease in goodwill impairment charges and a $1.2 billion decline in merger and restructuring charges in 2011. Partially offsetting these decreases was a $4.9 billion increase in other general operating expense which included increases of $3.0 billion in litigation expense and $1.6 billion in mortgage-related assessments and waivers costs, and an increase of $1.8 billion in personnel costs due to the continued build-out of certain businesses, technology costs as well as increases in default-related servicing costs.
The income tax benefit on a FTE basis was $704 million on the pre-tax income of $742 million for 2011 compared to income tax expense on a FTE basis of $2.1 billion on the pre-tax loss of $153 million for 2010. For more information, see Financial Highlights – Income Tax Expense on page 34.
Segment Results
The following discussion provides an overview of the results of our business segments and All Other for 2011 compared to 2010. For additional information on these results, see Business Segment Operations on page 39.
|
| | | | | | | | | | | | | | | | |
| | | | | | | | | |
| Table 3 | Business Segment Results |
| | | | | | | | | |
| | | Total Revenue (1) | | Net Income (Loss) |
| (Dollars in millions) | 2011 | | 2010 | | 2011 | | 2010 |
| Deposits | $ | 12,689 |
| | $ | 13,562 |
| | $ | 1,192 |
| | $ | 1,362 |
|
| Card Services | 18,143 |
| | 22,340 |
| | 5,788 |
| | (6,980 | ) |
| Consumer Real Estate Services | (3,154 | ) | | 10,329 |
| | (19,529 | ) | | (8,947 | ) |
| Global Commercial Banking | 10,553 |
| | 11,226 |
| | 4,402 |
| | 3,218 |
|
| Global Banking & Markets | 23,618 |
| | 27,949 |
| | 2,967 |
| | 6,297 |
|
| Global Wealth & Investment Management | 17,376 |
| | 16,289 |
| | 1,635 |
| | 1,340 |
|
| All Other | 15,201 |
| | 9,695 |
| | 4,991 |
| | 1,472 |
|
| Total FTE basis | 94,426 |
| | 111,390 |
| | 1,446 |
| | (2,238 | ) |
| FTE adjustment | (972 | ) | | (1,170 | ) | | — |
| | — |
|
| Total Consolidated | $ | 93,454 |
| | $ | 110,220 |
| | $ | 1,446 |
| | $ | (2,238 | ) |
| |
(1)
| Total revenue is net of interest expense and is on a FTE basis which is a non-GAAP financial measure. For more information on this measure, see Supplemental Financial Data on page 38, and for a corresponding reconciliation to a GAAP financial measure, see Table XV.
|
Deposits net income decreased compared to the prior year due to a decline in revenue partially offset by lower noninterest expense. The decline in revenue was primarily driven by a decline in service charges reflecting the impact of overdraft policy changes in conjunction with Regulation E that were fully implemented during the third quarter of 2010, partially offset by an increase in net interest income as a result of a customer shift to more liquid products and continued pricing discipline. Noninterest expense decreased due to lower litigation and operating expenses partially offset by an increase in Federal Deposit Insurance Corporation (FDIC) expense.
Card Services net income increased compared to the prior year due primarily to a $10.4 billion non-cash, non-tax deductible goodwill impairment charge in 2010 and a decrease in the provision for credit losses. The decrease in revenue was driven by lower average loan balances and yields. Noninterest income decreased primarily due to the implementation of the Durbin Amendment, the absence of the gain on the sale of our MasterCard position in 2010 and the implementation of the Credit Card Accountability Responsibility and Disclosure Act of 2009 (CARD Act).
CRESnet lossincreased compared to the prior year primarily due to a decline in revenue and an increase in noninterest expense. Revenue declined due to an increase in representations and warranties provision, lower core production income and a decrease in insurance income due to the sale of Balboa Insurance Company’s lender-placed insurance business (Balboa). Noninterest expense increased due to higher litigation expense, increased mortgage-related assessments and waivers costs, higher default-related and other loss mitigation expenses and a higher non-cash, non-tax deductible goodwill impairment charge, partially offset by lower insurance and production expenses.
Global Commercial Banking net income increased compared to the prior year primarily due to an improvement in the provision for credit losses. Revenue decreased primarily driven by lower net interest income related to asset and liability management (ALM) activities and lower average loan balances, partially offset by an increase in average deposits. The decrease in the provision for credit losses was driven by improved economic conditions and an accelerated rate of loan resolutions in the commercial real estate portfolio.
GBAM net income decreased compared to the prior year driven by a decline in sales and trading revenue due to a challenging market environment, partially offset by DVA gains, net of hedges. Provision for credit losses decreased driven by the positive impact of the economic environment on the credit portfolio in 2011. Higher noninterest expense was driven primarily by increased costs related to investments in infrastructure. Income tax expense included a charge related to the U.K. corporate income tax rate changes enacted during the year to reduce the carrying value of the deferred tax assets.
GWIM net income increased compared to the prior year driven by higher net interest income, higher asset management fees and lower credit costs, partially offset by higher noninterest expense. Revenue increased driven by higher asset management fees from higher market levels and long-term assets under management (AUM) flows as well as higher net interest income. The provision for credit losses decreased driven by improving portfolio trends. Noninterest expense increased due to higher volume-driven expenses and personnel costs associated with the continued investment in the business.
All Other net income increased compared to the prior year primarily due to higher noninterest income and lower merger and restructuring charges. Noninterest income increased due to an increase in the positive fair value adjustments related to our own credit spreads on structured liabilities as well as the gain on the sale of CCB shares in 2011. The provision for credit losses decreased primarily due to divestitures, improvements in delinquencies, collections and insolvencies in the non-U.S. credit card portfolio and continued run-off in the legacy Merrill Lynch & Co., Inc. (Merrill Lynch) commercial portfolio.
Financial Highlights
Net Interest Income
Net interest income on a FTE basis decreased $7.14.0 billion to $45.641.6 billion for 20112012 compared to 20102011. The decline was primarily due to lower consumer loan balances and yields, the asset and liability management (ALM) portfolio recouponing to a lower yield and decreased investment security yields, including the acceleration of purchase premium amortization from an increase in modeled prepayment expectations, and increased hedge ineffectiveness.commercial loan yields. Lower trading-related net interest income also negatively impacted 20112012 results.
These decreases were partially offset by ongoing reductions in ourlong-term debt footprint and lower interest rates paid on deposits. The net interest yield on a FTE basis decreased 3013 bpsbasis points (bps) to 2.482.35 percent for 20112012 compared to 20102011 as the yield continuescontinued to be under pressure due to the aforementioned items and the low rate environment. We expect net interest income to continue to be muted based on the current forward yield curve in 2012.
Noninterest Income
|
| | | | | | | | |
| | | | | |
| Table 3 | Noninterest Income | | | |
| | | | | |
| (Dollars in millions) | 2012 | | 2011 |
| Card income | $ | 6,121 |
| | $ | 7,184 |
|
| Service charges | 7,600 |
| | 8,094 |
|
| Investment and brokerage services | 11,393 |
| | 11,826 |
|
| Investment banking income | 5,299 |
| | 5,217 |
|
| Equity investment income | 2,070 |
| | 7,360 |
|
| Trading account profits | 5,870 |
| | 6,697 |
|
| Mortgage banking income (loss) | 4,750 |
| | (8,830 | ) |
| Insurance income (loss) | (195 | ) | | 1,346 |
|
| Gains on sales of debt securities | 1,662 |
| | 3,374 |
|
| Other income (loss) | (1,839 | ) | | 6,869 |
|
| Net impairment losses recognized in earnings on AFS debt securities | (53 | ) | | (299 | ) |
| Total noninterest income | $ | 42,678 |
| | $ | 48,838 |
|
|
| | | | | | | | |
| | | | | |
| Table 4 | Noninterest Income | | | |
| | | | | |
| (Dollars in millions) | 2011 | | 2010 |
| Card income | $ | 7,184 |
| | $ | 8,108 |
|
| Service charges | 8,094 |
| | 9,390 |
|
| Investment and brokerage services | 11,826 |
| | 11,622 |
|
| Investment banking income | 5,217 |
| | 5,520 |
|
| Equity investment income | 7,360 |
| | 5,260 |
|
| Trading account profits | 6,697 |
| | 10,054 |
|
| Mortgage banking income (loss) | (8,830 | ) | | 2,734 |
|
| Insurance income | 1,346 |
| | 2,066 |
|
| Gains on sales of debt securities | 3,374 |
| | 2,526 |
|
| Other income | 6,869 |
| | 2,384 |
|
| Net impairment losses recognized in earnings on available-for-sale debt securities | (299 | ) | | (967 | ) |
| Total noninterest income | $ | 48,838 |
| | $ | 58,697 |
|
Noninterest income decreased $9.96.2 billion to $48.842.7 billion for 20112012 compared to 20102011. The following highlights the significant changes.
| |
| Ÿ | Card income decreased $924 million1.1 billion primarily due todriven by the implementation of new interchange fee rules under the Durbin Amendment, which became effective on October 1, 2011 and the CARD Act provisions that were implemented during 2010.2011. |
| |
| Ÿ | Service charges decreased $1.3 billion494 million largelyprimarily due to the impact of overdraft policy changes in conjunction with Regulation E, which became effective in the third quarter of 2010.lower accretion on acquired portfolios and reduced reimbursed merchant processing fees. |
| |
| Ÿ | Investment and brokerage services income decreased$433 million primarily driven by lower transactional volumes. |
| |
| Ÿ | Equity investment income increaseddecreased $2.15.3 billion. The results for 2012 included $1.6 billion of gains which primarily related to the sales of certain equity and strategic investments. The results for 2011 included $6.5 billion of gains on the sale of CCBChina Construction Bank (CCB) shares, $836 million of CCB dividends and a $377 million gain on the sale of our investment in BlackRock, Inc. (BlackRock), partially offset by $1.1 billion of impairment charges on our merchant services joint venture. The prior year included $2.5 billion of net gains which included the sales of certain strategic investments, $2.3 billion of gains in our Global Principal Investments (GPI) portfolio which included both cash gains and fair value adjustments, and $535 million of CCB dividends. |
| |
| Ÿ | Trading account profits decreased $3.4827 million. Net DVA losses on derivatives were $2.5 billion primarily due to adverse market conditions and extreme volatility in the credit markets2012 compared to the prior year.net DVA gains net of hedges, on derivatives were $1.0 billion in 2011. Excluding net DVA, trading account profits increased$2.7 billion in 2012 compared to $262 million2011 in 2010 as a result of a widening of our credit spreads. In conjunction with regulatory reform measures GBAM exited its stand-alone proprietary trading business as of June 30, 2011. Proprietary trading revenue was $434 million for the six months ended June 30, 2011 compareddue to $1.4 billion for 2010.an improved market environment. |
| |
| Ÿ | Mortgage banking income decreasedincreased $11.613.6 billion primarily due to an $8.8$11.7 billion increasedecrease in the representations and warranties provision. The 2012 results included $2.5 billion in provision which was largely related to the BNY Mellon Settlement. Also contributingFNMA Settlement, a $500 million provision for obligations to the decline was lower production income dueFNMA related to a reduction in new loan origination volumesmortgage insurance rescissions, partially offset by an increase in servicing income.income of $1.1 billion due to improved MSR results. The 2011 results included $15.6 billion in representations and warranties provision related to the agreement to resolve nearly all legacy Countrywide-issued first-lien non-government-sponsored enterprise (GSE) residential mortgage-backed securities (RMBS) repurchase exposures and other non-GSE exposures. |
| |
| Ÿ | Insurance income decreased$1.5 billion driven by the impact of the sale of the Balboa Insurance Company’s lender-placed insurance business (Balboa) in 2011 and an increase to the provision related to payment protection insurance in the U.K. in 2012. |
| |
| Ÿ | Other income increaseddecreased $4.58.7 billion primarily due to negative fair value adjustments on our structured liabilities of $5.1 billion compared to positive fair value adjustments of $3.3 billion related to widening of our own credit spreads on structured liabilities compared to $18 millionin 20102011. In addition, 20112012 included a $771 million1.6 billion of gains related to debt repurchases and exchanges of trust preferred securities compared to gains of $1.2 billion in the prior year. The prior year also included a net gain of $752 million on the sale of Balboa as well as a $1.2 billion gain on the exchange of certain trust preferred securities for common stock and debt.Balboa. |
Provision for Credit Losses
The provision for credit losses decreased $15.05.2 billion to $13.48.2 billion for 20112012 compared to 20102011. The provision for credit losses was $7.46.7 billion lower than net charge-offs for 20112012, resulting in a reduction in the allowance for credit losses driven primarily by lower delinquencies, improved collection ratesportfolio trends and fewerincreasing home prices in consumer real estate products, lower bankruptcy filings acrossand delinquencies affecting the Card Services portfolio, and improvement in overall credit quality within the core commercial portfolio (total commercial products excluding U.S. small business). Absent unexpected deterioration in the commercial real estate portfolio partially offset by additions to consumer PCI loan portfolio reserves. This compared to a $5.9 billion reduction in the allowance for credit losses in 2010. Weeconomy, we expect reductions in the allowance for credit losses, excluding the valuation allowance
for purchase credit-impaired (PCI) loans, to be lower in 2012.
The provision for credit losses related to our consumer portfolio decreased $11.1 billion to $14.3 billion for 2011 compared to 2010. The provision for credit losses related to our commercial portfolio including the provision for unfunded lending commitments decreased $3.9 billion to a benefit of $915 million for 2011 compared to 2010.
Net charge-offs totaled $20.8 billion, or 2.24 percent of average loans and leases for 2011 compared to $34.3 billion, or 3.60 percent for 2010. The decrease in net charge-offs was primarily driven by improvements in general economic conditions that resulted in lower delinquencies, improved collection rates and fewer bankruptcy filings across the Card Services portfolio as well as lower lossescontinue in the home equity portfolio driven primarily by fewer delinquent loans.near term, though at a slower pace than in 2012. For more information on the provision for credit losses, see Provision for Credit Losses on page 108109.
Net charge-offs totaled $14.9 billion, or 1.67 percent of average loans and leases for 2012 compared to $20.8 billion, or 2.24 percent for 2011. Included in 2012 net charge-offs was $596 million related to the impact of new regulatory guidance regarding the treatment of loans discharged in Chapter 7 bankruptcy and $435 million related to loans forgiven as a part of the National Mortgage Settlement. The decrease in net charge-offs was primarily driven by fewer delinquent loans and lower bankruptcy filings in the Card Services portfolio, as well as lower net charge-offs in the consumer real estate and core commercial portfolios in 2012.
Noninterest Expense
| | | | | | | | | | | |
| Table 5 | Noninterest Expense | | | | |
| Table 4 | | Noninterest Expense | | | |
| | | | | | | | | |
| (Dollars in millions) | (Dollars in millions) | 2011 | | 2010 | (Dollars in millions) | 2012 | | 2011 |
| Personnel | Personnel | $ | 36,965 |
| | $ | 35,149 |
| Personnel | $ | 35,648 |
| | $ | 36,965 |
|
| Occupancy | Occupancy | 4,748 |
| | 4,716 |
| Occupancy | 4,570 |
| | 4,748 |
|
| Equipment | Equipment | 2,340 |
| | 2,452 |
| Equipment | 2,269 |
| | 2,340 |
|
| Marketing | Marketing | 2,203 |
| | 1,963 |
| Marketing | 1,873 |
| | 2,203 |
|
| Professional fees | Professional fees | 3,381 |
| | 2,695 |
| Professional fees | 3,574 |
| | 3,381 |
|
| Amortization of intangibles | Amortization of intangibles | 1,509 |
| | 1,731 |
| Amortization of intangibles | 1,264 |
| | 1,509 |
|
| Data processing | Data processing | 2,652 |
| | 2,544 |
| Data processing | 2,961 |
| | 2,652 |
|
| Telecommunications | Telecommunications | 1,553 |
| | 1,416 |
| Telecommunications | 1,660 |
| | 1,553 |
|
| Other general operating | Other general operating | 21,101 |
| | 16,222 |
| Other general operating | 18,274 |
| | 21,101 |
|
| Goodwill impairment | Goodwill impairment | 3,184 |
| | 12,400 |
| Goodwill impairment | — |
| | 3,184 |
|
| Merger and restructuring charges | Merger and restructuring charges | 638 |
| | 1,820 |
| Merger and restructuring charges | — |
| | 638 |
|
| Total noninterest expense | Total noninterest expense | $ | 80,274 |
| | $ | 83,108 |
| Total noninterest expense | $ | 72,093 |
| | $ | 80,274 |
|
Noninterest expense decreased $2.88.2 billion to $80.372.1 billion for 20112012 compared to 20102011. with the decrease primarily driven by the absence of goodwill impairment charges in 2012 compared to $3.2 billion in 2011, a $2.8 billiondecrease in other general operating expense primarily related to lower litigation expense and mortgage-related assessments, waivers and similar costs related to foreclosure delays, partially offset by a provision of $1.1 billion in 2012 related to the 2013 IFR Acceleration Agreement. Personnel expense decreased$1.3 billion in 2012 as we continued to streamline processes and achieve cost savings. Partially offsetting the decreases were increases in professional fees and data processing expenses due to continuing default management activities in Legacy Assets & Servicing. The prior year also included goodwill impairment charges of $12.4 billion638 million comparedin merger and restructuring charges.
In connection with Project New BAC, we expect to $3.2 billion for 2011.
Personnelcontinue to achieve cost savings in certain noninterest expense increased$1.8 billion for 2011 attributablecategories as we continue to personnel costs related to thefurther streamline workflows, simplify processes and align expenses with our overall strategic plan and operating principles. During 2012, we continued build-outimplementation of Phase 1 initiatives, completed Phase 2 evaluations and began implementation of certain businesses, technology costs as well as increasesPhase 2 initiatives. With regard to Phase 1, we expect to realize more than $5 billion of annualized cost savings by the fourth quarter of 2013 with the full impact expected to be realized in default-2014. We expect that Phase 2 will result in an additional $3 billion of annualized cost savings by mid-2015.
|
| | |
28 Bank of America 2012 | | Bank of America33
|
related servicing. Additionally, professional fees increased$686 million related to consulting fees for regulatory initiatives as well as higher legal expenses. Other general operating expenses increased$4.9 billion largely as a result of a $3.0 billion increase in litigation expense, primarily mortgage-related, and an increase of $1.6 billion in mortgage-related assessments and waivers costs. Merger and restructuring expenses decreased$1.2 billion in 2011.
Income Tax ExpenseBenefit
The income tax benefit was $1.1 billion on pre-tax income of $3.1 billion for 2012 compared to an income tax benefit of $1.7 billion on the pre-tax loss of $230 million for 2011 compared to.
Included in the income tax benefit for expense2012 ofwas a $915 million on the pre-tax loss of $1.31.7 billion for 2010. These amounts are before FTE adjustments. Thetax benefit attributable to the excess of foreign tax credits recognized in the U.S. upon repatriation of the earnings of certain subsidiaries over the related U.S. tax liability. Also included in the income tax benefit was a $788 million charge to reduce the carrying value of certain U.K. deferred tax assets due to the two percent U.K. corporate income tax rate reduction enacted in 2012. Our effective tax rate for 20112012 excluding these two items was not meaningful due to a small pre-tax loss,benefit of seven percent and for 2010,differed from the statutory rate due to the impact of non-deductible goodwill impairment chargesour recurring tax preference items (e.g., affordable housing credits and tax-exempt income) on the level of $12.4 billion.pre-tax earnings.
The income tax benefit for 2011 was driven by our recurring tax preference items, such as tax-exempt income and affordable housing credits, a $1.0 billion benefit from the release of the remaining valuation allowance applicable to the Merrill Lynch &
Co., Inc. (Merrill Lynch) capital loss carryover deferred tax asset and a benefit of $823 million for planned realization of previously unrecognized deferred tax assets related to the tax basis in certain subsidiaries. These benefits were partially offset by thea $782 million tax charge for the two percent U.K. corporate income tax rate reductions referred to below.
reduction enacted in 2011. The $3.2 billion of goodwill impairment charges recorded in during 2011 were non-deductible.
The effective tax rate for 2010 excluding goodwill impairment charges from pre-tax income was 8.3 percent. In addition to our recurring tax preference items, this rate was driven by a $1.7 billion benefit from the release of a portion of the valuation allowance applicable to the Merrill Lynch capital loss carryover deferred tax asset, partially offset by the $392 million charge from a one percent reduction toOn July 17, 2012, the U.K. corporate income tax rate enacted during 2010.
On July 19, 2011, the U.K. 20112012 Finance Bill was enacted, which reduced the U.K. corporate income tax rate by two percent to 23 percent. The first one percent to 26 percent beginning on April 1, 2011, and then to 25 percentreduction was effective April 1, 2012.2012 and the second will be effective April 1, 2013. These rate reductions will favorably affect income tax expense on future U.K. earnings, but also required us to remeasure our U.K. net deferred tax assets using the lower tax rates. As noted above,If the income tax benefit for 2011 included a $782 million charge for the remeasurement, substantially all of which was recorded in GBAM. If corporate income tax ratesrate were to be reduced to 2321 percent by 2014 as suggested in U.K. Treasury announcements and assuming no change in the deferred tax asset balance, we would record a charge to income tax expense of approximately $400$800 million for each one percent reduction in the rate would result in each period of enactment, (for a total of approximately $800 million).which we expect to be in 2013.
Balance Sheet Overview
| | | | | | | | | | | | | | | | | | | |
| Table 6 | Selected Balance Sheet Data | | | | | | | | |
| Table 5 | | Selected Balance Sheet Data | | | | | | | |
| | | | | | | | | | | | | | | | | |
| | | December 31 | | Average Balance | | December 31 | | Average Balance |
| (Dollars in millions) | (Dollars in millions) | 2011 | | 2010 | | 2011 | | 2010 | (Dollars in millions) | 2012 | | 2011 | | 2012 | | 2011 |
| Assets | Assets | |
| | |
| | |
| | |
| Assets | |
| | |
| | |
| | |
|
| Federal funds sold and securities borrowed or purchased under agreements to resell | Federal funds sold and securities borrowed or purchased under agreements to resell | $ | 211,183 |
| | $ | 209,616 |
| | $ | 245,069 |
| | $ | 256,943 |
| Federal funds sold and securities borrowed or purchased under agreements to resell | $ | 219,924 |
| | $ | 211,183 |
| | $ | 236,042 |
| | $ | 245,069 |
|
| Trading account assets | Trading account assets | 169,319 |
| | 194,671 |
| | 187,340 |
| | 213,745 |
| Trading account assets | 237,226 |
| | 169,319 |
| | 182,359 |
| | 187,340 |
|
| Debt securities | Debt securities | 311,416 |
| | 338,054 |
| | 337,120 |
| | 323,946 |
| Debt securities | 336,387 |
| | 311,416 |
| | 337,653 |
| | 337,120 |
|
| Loans and leases | Loans and leases | 926,200 |
| | 940,440 |
| | 938,096 |
| | 958,331 |
| Loans and leases | 907,819 |
| | 926,200 |
| | 898,768 |
| | 938,096 |
|
| Allowance for loan and lease losses | Allowance for loan and lease losses | (33,783 | ) | | (41,885 | ) | | (37,623 | ) | | (45,619 | ) | Allowance for loan and lease losses | (24,179 | ) | | (33,783 | ) | | (29,843 | ) | | (37,623 | ) |
| All other assets | All other assets | 544,711 |
| | 624,013 |
| | 626,320 |
| | 732,260 |
| All other assets | 532,797 |
| | 544,711 |
| | 566,377 |
| | 626,320 |
|
| Total assets | Total assets | $ | 2,129,046 |
| | $ | 2,264,909 |
| | $ | 2,296,322 |
| | $ | 2,439,606 |
| Total assets | $ | 2,209,974 |
| | $ | 2,129,046 |
| | $ | 2,191,356 |
| | $ | 2,296,322 |
|
| Liabilities | Liabilities | |
| | |
| | |
| | |
| Liabilities | |
| | |
| | |
| | |
|
| Deposits | Deposits | $ | 1,033,041 |
| | $ | 1,010,430 |
| | $ | 1,035,802 |
| | $ | 988,586 |
| Deposits | $ | 1,105,261 |
| | $ | 1,033,041 |
| | $ | 1,047,782 |
| | $ | 1,035,802 |
|
| Federal funds purchased and securities loaned or sold under agreements to repurchase | Federal funds purchased and securities loaned or sold under agreements to repurchase | 214,864 |
| | 245,359 |
| | 272,375 |
| | 353,653 |
| Federal funds purchased and securities loaned or sold under agreements to repurchase | 293,259 |
| | 214,864 |
| | 281,899 |
| | 272,375 |
|
| Trading account liabilities | Trading account liabilities | 60,508 |
| | 71,985 |
| | 84,689 |
| | 91,669 |
| Trading account liabilities | 73,587 |
| | 60,508 |
| | 78,554 |
| | 84,689 |
|
| Commercial paper and other short-term borrowings | Commercial paper and other short-term borrowings | 35,698 |
| | 59,962 |
| | 51,894 |
| | 76,676 |
| Commercial paper and other short-term borrowings | 30,731 |
| | 35,698 |
| | 36,501 |
| | 51,894 |
|
| Long-term debt | Long-term debt | 372,265 |
| | 448,431 |
| | 421,229 |
| | 490,497 |
| Long-term debt | 275,585 |
| | 372,265 |
| | 316,393 |
| | 421,229 |
|
| All other liabilities | All other liabilities | 182,569 |
| | 200,494 |
| | 201,238 |
| | 205,290 |
| All other liabilities | 194,595 |
| | 182,569 |
| | 194,550 |
| | 201,238 |
|
| Total liabilities | Total liabilities | 1,898,945 |
| | 2,036,661 |
| | 2,067,227 |
| | 2,206,371 |
| Total liabilities | 1,973,018 |
| | 1,898,945 |
| | 1,955,679 |
| | 2,067,227 |
|
| Shareholders’ equity | Shareholders’ equity | 230,101 |
| | 228,248 |
| | 229,095 |
| | 233,235 |
| Shareholders’ equity | 236,956 |
| | 230,101 |
| | 235,677 |
| | 229,095 |
|
| Total liabilities and shareholders’ equity | Total liabilities and shareholders’ equity | $ | 2,129,046 |
| | $ | 2,264,909 |
| | $ | 2,296,322 |
| | $ | 2,439,606 |
| Total liabilities and shareholders’ equity | $ | 2,209,974 |
| | $ | 2,129,046 |
| | $ | 2,191,356 |
| | $ | 2,296,322 |
|
At December 31, 20112012, total assets were $2.12.2 trillion, aan decreaseincrease of $13680.9 billion, or sixfour percent, from December 31, 20102011. Average total assets decreased $143105.0 billion, or five percent, in2012 compared to 2011. At December 31, 20112012, total liabilities were $1.92.0 trillion, aan decreaseincrease of $13874.1 billion, or sevenfour percent, from December 31, 20102011. Average total liabilities decreased $139111.5 billion, or five percent, in2012 compared to 2011.
Period-endYear-end balance sheet amounts may vary from average balance sheet amounts due to liquidity and balance sheet management activities, primarily involving our portfolios of highly
liquid assets, that are designed to ensure the adequacy of capital while enhancing our ability to manage liquidity requirements for the Corporation and for our customers, and to position the balance sheet in accordance with the Corporation’s risk appetite. The execution of these activities requires the use of balance sheet and capital-related limits including spot, average and risk-weighted asset limits, particularly inwithin the market-making activities of our trading businesses. One of our key regulatory metrics, Tier 1 leverage ratio, is calculated based on adjusted quarterly average total assets.
|
| | |
| | 34Bank of America 2011201229
| | |
Assets
Federal Funds Sold and Securities Borrowed or Purchased Under Agreements to Resell
Federal funds transactions involve lending reserve balances on a short-term basis. Securities borrowed and securities purchased under agreements to resell are utilized to accommodate customer transactions, earn interest rate spreads, and obtain securities for settlement.settlement and for collateral. Year-end federal funds sold and securities borrowed under agreements to resell increased$8.7 billion due to increases in client short positions and increased collateral requirements. Average federal funds sold and securities borrowed or purchased under agreements to resell decreased $11.99.0 billion, or five percent, in 2011 attributable to an overall declinechanges in balance sheet usage.the investment composition of excess liquidity.
Trading Account Assets
Trading account assets consist primarily of fixed-income securities including government and corporate debt, and equity and convertible instruments. Year-end trading account assets decreasedincreased $25.467.9 billion in 2011 primarily due to actions to reduce risk on the balance sheet. Average trading account assets decreased$26.4 billion in 2011 primarily due to a reclassification of noninterest-earning equity securities from trading account assetsstrategic decision to other assets for average balance sheet purposes.increase U.S. Treasuries and agency securities.
Debt Securities
Debt securities primarily include U.S. Treasury and agency securities, MBS, principally agency MBS, foreign bonds, corporate bonds and municipal debt. We use the debt securities portfolio primarily to manage interest rate and liquidity risk and to take advantage of market conditions that create more economically attractive returns on these investments. Year-end balances of debt securities decreased$26.6 billion due to agency MBS sales in 2011. Average balances of debt securities increased $13.225.0 billion primarily due to net purchases of agency MBS purchases in the second half of 2010 and the first three quarters of 2011.MBS. For additional information on available-for-sale (AFS) debt securities, see Note 54 – Securities to the Consolidated Financial Statements.
Loans and Leases
Year-end and average loans and leases decreased $14.2 billion to $926.218.4 billion and $20.239.3 billion to $938.1 billion in 2011. The decrease wasdecreases were primarily due to consumer portfoliocontinued run-off outpacing new originations and loan portfolio sales,in targeted portfolios partially offset by growth in non-U.S. commercial growth as international demand continues to remain high.and U.S. commercial loans. For a more detailed discussion of the loan portfolio, see Note 6 – Outstanding Loans and LeasesCredit Risk Managementto the Consolidated Financial Statements on page 79.
Allowance for Loan and Lease Losses
Year-end and average allowance for loan and lease losses decreased $8.19.6 billion and $8.07.8 billion in 2011 primarily due to the impact of the improving economy partially offset byand reserve additionsreductions in the PCI portfolio throughout 2011.mostly related to the National Mortgage Settlement. For a more detailed discussion, of thesee Allowance for Loan and LeaseCredit Losses, see on page 109.
All Other Assets
Year-end and average other assets decreased $79.311.9 billion driven by lower cash and cash equivalent balances. Average other assets decreased$105.959.9 billion in 2011primarily driven primarily by the sale of strategic investments,asset sales, lower derivative dealer assets and a reduction in loans held-for-sale (LHFS) and lower.
mortgage servicing rights (MSRs). Average other assets was also impacted by lower cash balances held at the Federal Reserve.
Liabilities
Deposits
Year-end and average deposits increased $22.672.2 billion and $47.212.0 billion to $1.0 trillion in 2011. The increase wasincreases were attributable to growth in our noninterest-bearing deposits.deposits driven by higher client balances.
Federal Funds Purchased and Securities Loaned or Sold Under Agreements to Repurchase
Federal funds transactions involve borrowing reserve balances on a short-term basis. Securities loaned and securities sold under agreements to repurchase are collateralized borrowing transactions utilized to accommodate customer transactions, earn interest rate spreads and finance assets on the balance sheet. Year-end and average federal funds purchased and securities loaned or sold under agreements to repurchase decreasedincreased $30.578.4 billion and $81.39.5 billion in 2011 primarily due to planned funding reductions.of trading inventory resulting from customer demand.
Trading Account Liabilities
Trading account liabilities consist primarily of short positions in fixed-income securities including government and corporate debt, equity and convertible instruments. Year-end and averagetrading account liabilities increased$13.1 billion primarily due to higher trading activity in equity securities. Average trading account liabilities decreased $11.56.1 billion and $7.0 billionprimarily due to a decrease in 2011 in line with declines inbasis trading account assets.on government debt.
Commercial Paper and Other Short-term Borrowings
Commercial paper and other short-term borrowings provide an additional funding source. Year-end and average commercial paper and other short-term borrowings decreased $24.3 billion to $35.75.0 billion and $24.815.4 billion to $51.9 billion in 2011 due to planned reductions in wholesale borrowings. During 2011, we reducedFor additional information on Commercial Paper and Other Short-term Borrowings, see Note 11 – Federal Funds Sold, Securities Borrowed or Purchased Under Agreements to an insignificant amount our use of unsecured short-term borrowings including commercial paperResell and master notes.Short-term Borrowingsto the Consolidated Financial Statements.
Long-term Debt
Year-end and average long-term debt decreased $76.2 billion to $372.396.7 billion and $69.3104.8 billion to $421.2 billion in 2011. The decreases were attributable to the Corporation’s strategy to reduce our debt footprint.planned reductions in long-term debt. For additional information on long-term debt, see Note 1312 – Long-term Debt to the Consolidated Financial Statements.
All Other Liabilities
Year-end all other liabilities increased$12.0 billion primarily driven by an increase in customer margin credits. Average all other liabilities decreased $17.96.7 billion primarily driven by decreases in 2011 driven primarily by a decline in the liability related to collateral held, a decrease in lower customer margin creditsbank acceptances outstanding and liquidation of a consolidated variableaccrued interest entity (VIE).payable.
Shareholders’ Equity
Year-end and average shareholders’ equity increased $1.96.9 billion and $6.6 billion. The increase was driven primarily by the investment by Berkshire, exchanges of certain preferred securities for common stock and debt and positive earnings. Average shareholders’ equity decreased$4.1 billion in 2011increases were primarily driven by losses lateearnings, an increase in 2010.unrealized gains on available-for-sale (AFS) debt securities in other comprehensive income (OCI), and common stock issued under employee plans and in connection with exchanges of preferred stock and trust preferred securities.
|
| | |
30 Bank of America 2012 | | Bank of America35
|
Cash Flows Overview
The Corporation’s operating assets and liabilities support our global markets and lending activities. We believe that cash flows from operations, available cash balances and our ability to generate cash through short- and long-term debt are sufficient to fund our operating liquidity needs. Our investing activities primarily include the AFS securities portfolio and other short-term investments. Our financing activities reflect cash flows primarily related to increased customer deposits and net long-term debt repayments.reductions.
Cash and cash equivalents decreased$9.4 billion during 2012 due to net purchases of debt securities and planned reductions in long-term debt partially offset by higher federal funds purchased and securities loaned or sold under agreements to repurchase and growth in our deposits. Cash and cash equivalents increased $11.7 billion during 2011 due to sales of non-core assets and net sales of AFSdebt securities partially offset by repayment and maturities of certain long-term debt. Cash and
During 2012, net cash equivalentsused in operating activities was decreased$12.913.9 billion during 2010 due. The more significant adjustments to repayment and maturities of certain long-term debtnet income to arrive at cash used in operating activities included the net increase in
trading and net purchases of AFS securities partially offset by deposit growth.
derivative instruments and the provision for credit losses. During 2011, net cash provided by operating activities was $64.564.4 billion compared to $82.6 billion in 2010. The more significant adjustments to net income (loss) to arrive at cash provided by operating activities included the provision for credit losses, goodwill impairment charges and the net decrease in trading and derivative instruments.instruments and the provision for credit losses.
During 2012, net cash used in investing activities was $37.2 billion primarily driven by net purchases of debt securities. During 2011, net cash provided by investing activities increased towas $52.4 billion primarily driven by net sales of debt securities.
During 20102012, net cash provided by financing activities of $30.342.4 billion was usedprimarily reflected an increase in investing activities primarily for net purchases offederal funds purchased and securities loaned or sold under agreements to repurchase and growth in deposits partially offset by planned reductions in long-term debt securities.
as maturities outpaced new issuances. During 2011 and 2010, the net cash used in financing activities of $104.7 billion and $65.4 billionprimarily reflected the net decreasesplanned reductions in long-term debt as maturities outpaced new issuances.issuances as well as the decrease in federal funds purchased and securities loaned or sold under agreements to repurchase partially offset by growth in deposits.
Business Segment Results
The following discussion provides an overview of the results of our business segments and All Other for 2012 compared to 2011. For additional information on these results, see Business Segment Operations on page 37.
|
| | | | | | | | | | | | | | | | | | | | | | | | | | | | | | | | |
| | | | | | | | | | | | | | | | | |
| Table 6 | Business Segment Results |
| | | | | | | | | | | | | | | | | |
| | | Total Revenue (1) | | Provision for Credit Losses | | Noninterest Expense | | Net Income (Loss) |
| (Dollars in millions) | 2012 | | 2011 | | 2012 | | 2011 | | 2012 | | 2011 | | 2012 | | 2011 |
| Consumer & Business Banking | $ | 29,023 |
| | $ | 32,880 |
| | $ | 3,941 |
| | $ | 3,490 |
| | $ | 16,793 |
| | $ | 17,719 |
| | $ | 5,321 |
| | $ | 7,447 |
|
| Consumer Real Estate Services | 8,759 |
| | (3,154 | ) | | 1,442 |
| | 4,524 |
| | 17,306 |
| | 21,791 |
| | (6,507 | ) | | (19,465 | ) |
| Global Banking | 17,207 |
| | 17,312 |
| | (103 | ) | | (1,118 | ) | | 8,308 |
| | 8,884 |
| | 5,725 |
| | 6,046 |
|
| Global Markets | 13,519 |
| | 14,798 |
| | 3 |
| | (56 | ) | | 10,839 |
| | 12,244 |
| | 1,054 |
| | 988 |
|
| Global Wealth & Investment Management | 16,517 |
| | 16,495 |
| | 266 |
| | 398 |
| | 12,755 |
| | 13,383 |
| | 2,223 |
| | 1,718 |
|
| All Other | (790 | ) | | 16,095 |
| | 2,620 |
| | 6,172 |
| | 6,092 |
| | 6,253 |
| | (3,628 | ) | | 4,712 |
|
| Total FTE basis | 84,235 |
| | 94,426 |
| | 8,169 |
| | 13,410 |
| | 72,093 |
| | 80,274 |
| | 4,188 |
| | 1,446 |
|
| FTE adjustment | (901 | ) | | (972 | ) | | — |
| | — |
| | — |
| | — |
| | — |
| | — |
|
| Total Consolidated | $ | 83,334 |
| | $ | 93,454 |
| | $ | 8,169 |
| | $ | 13,410 |
| | $ | 72,093 |
| | $ | 80,274 |
| | $ | 4,188 |
| | $ | 1,446 |
|
| |
(1) | Total revenue is net of interest expense and is on a FTE basis which for consolidated revenue is a non-GAAP financial measure. For more information on this measure, see Supplemental Financial Data on page 35, and for a corresponding reconciliation to a GAAP financial measure, see Statistical Table XVI. |
CBB net income decreased compared to the prior year. Revenue decreased driven by lower average loan balances, the continued low rate environment, the full-year impact of the Durbin Amendment, lower gains on sales of portfolios and the impact of charges related to our consumer protection products. The provision for credit losses increased as portfolio trends stabilized during 2012. Noninterest expense declined due to lower Federal Deposit Insurance Corporation (FDIC) and operating expenses, partially offset by an increase in litigation expense.
CRESnet lossdecreased compared to the prior year. Revenue increased due to a significantly lower representations and warranties provision, an increase in servicing income and core production income, partially offset by a decrease in insurance income. The provision for credit losses decreased due to improved portfolio trends and increasing home prices in both the non-PCI and PCI home equity loan portfolios. Noninterest expense decreased due to a decline in litigation expense, the absence of a goodwill impairment charge and lower mortgage-related assessments, waivers and similar costs related to foreclosure delays, partially offset by higher default-related servicing costs and a provision for the 2013 IFR Acceleration Agreement.
Global Banking net income decreased compared to the prior year. Revenue decreased primarily driven by lower investment banking fees, lower net interest income as a result of spread compression and the benefit in the prior year from higher accretion on acquired portfolios, partially offset by the impact of higher average loan and deposit balances and gains from certain legacy portfolios. The provision for credit losses increased as a result of stabilization of asset quality, core commercial loan growth and the impact of a higher volume of loan resolutions in the commercial real estate portfolio in the prior year. Noninterest expense
decreased primarily due to lower personnel and operating expenses.
Global Markets net income increased compared to the prior year. Sales and trading revenue decreased due to net DVA losses compared to net DVA gains in the prior year. Excluding net DVA, sales and trading revenue increased primarily driven by our fixed income, currencies and commodities (FICC) business as a result of improved performance in our rates and currencies, and credit-related businesses due to an improved global economic climate, and a gain on the sale of an equity investment. Noninterest expense decreased largely due to a reduction in personnel-related expenses.
GWIM net income increased compared to the prior year. Revenue was relatively unchanged as higher asset management fees were offset by lower transactional revenue and lower net interest income driven by the impact of the continued low rate environment. The provision for credit losses decreased driven by lower delinquencies and improving portfolio trends within the residential mortgage portfolio. Noninterest expense decreased due to lower FDIC expense, lower litigation costs and other expense reductions, partially offset by higher production-related expenses.
All Other decreased to a net loss compared to net income in the prior year. The change was primarily due to negative fair value adjustments on structured liabilities compared to positive fair value adjustments in the prior year, a decrease in equity investment income and lower gains on sales of debt securities. Partially offsetting these items were a reduction in the provision for credit losses, net gains resulting from the repurchase of certain debt and trust preferred securities and a net income tax benefit related to the recognition of certain foreign tax credits.
|
| | |
3632 Bank of America 20112012
| | |
| | | | | | | | | | | | | | | | | | | | | | | |
| Table 7 | Five Year Summary of Selected Financial Data | | | | | | | | | | Five Year Summary of Selected Financial Data | | | | | | | | | |
| | | | | | | | | | | | | | | | | | | | | |
| (In millions, except per share information) | (In millions, except per share information) | 2011 | | 2010 | | 2009 | | 2008 | | 2007 | (In millions, except per share information) | 2012 | | 2011 | | 2010 | | 2009 | | 2008 |
| Income statement | Income statement | | | | | |
| | |
| | |
| Income statement | | | | | |
| | |
| | |
|
| Net interest income | Net interest income | $ | 44,616 |
| | $ | 51,523 |
| | $ | 47,109 |
| | $ | 45,360 |
| | $ | 34,441 |
| Net interest income | $ | 40,656 |
| | $ | 44,616 |
| | $ | 51,523 |
| | $ | 47,109 |
| | $ | 45,360 |
|
| Noninterest income | Noninterest income | 48,838 |
| | 58,697 |
| | 72,534 |
| | 27,422 |
| | 32,392 |
| Noninterest income | 42,678 |
| | 48,838 |
| | 58,697 |
| | 72,534 |
| | 27,422 |
|
| Total revenue, net of interest expense | Total revenue, net of interest expense | 93,454 |
| | 110,220 |
| | 119,643 |
| | 72,782 |
| | 66,833 |
| Total revenue, net of interest expense | 83,334 |
| | 93,454 |
| | 110,220 |
| | 119,643 |
| | 72,782 |
|
| Provision for credit losses | Provision for credit losses | 13,410 |
| | 28,435 |
| | 48,570 |
| | 26,825 |
| | 8,385 |
| Provision for credit losses | 8,169 |
| | 13,410 |
| | 28,435 |
| | 48,570 |
| | 26,825 |
|
| Goodwill impairment | Goodwill impairment | 3,184 |
| | 12,400 |
| | — |
| | — |
| | — |
| Goodwill impairment | — |
| | 3,184 |
| | 12,400 |
| | — |
| | — |
|
| Merger and restructuring charges | Merger and restructuring charges | 638 |
| | 1,820 |
| | 2,721 |
| | 935 |
| | 410 |
| Merger and restructuring charges | — |
| | 638 |
| | 1,820 |
| | 2,721 |
| | 935 |
|
All other noninterest expense (1) | All other noninterest expense (1) | 76,452 |
| | 68,888 |
| | 63,992 |
| | 40,594 |
| | 37,114 |
| All other noninterest expense (1) | 72,093 |
| | 76,452 |
| | 68,888 |
| | 63,992 |
| | 40,594 |
|
| Income (loss) before income taxes | Income (loss) before income taxes | (230 | ) | | (1,323 | ) | | 4,360 |
| | 4,428 |
| | 20,924 |
| Income (loss) before income taxes | 3,072 |
| | (230 | ) | | (1,323 | ) | | 4,360 |
| | 4,428 |
|
| Income tax expense (benefit) | Income tax expense (benefit) | (1,676 | ) | | 915 |
| | (1,916 | ) | | 420 |
| | 5,942 |
| Income tax expense (benefit) | (1,116 | ) | | (1,676 | ) | | 915 |
| | (1,916 | ) | | 420 |
|
| Net income (loss) | Net income (loss) | 1,446 |
| | (2,238 | ) | | 6,276 |
| | 4,008 |
| | 14,982 |
| Net income (loss) | 4,188 |
| | 1,446 |
| | (2,238 | ) | | 6,276 |
| | 4,008 |
|
| Net income (loss) applicable to common shareholders | Net income (loss) applicable to common shareholders | 85 |
| | (3,595 | ) | | (2,204 | ) | | 2,556 |
| | 14,800 |
| Net income (loss) applicable to common shareholders | 2,760 |
| | 85 |
| | (3,595 | ) | | (2,204 | ) | | 2,556 |
|
| Average common shares issued and outstanding | Average common shares issued and outstanding | 10,143 |
| | 9,790 |
| | 7,729 |
| | 4,592 |
| | 4,424 |
| Average common shares issued and outstanding | 10,746 |
| | 10,143 |
| | 9,790 |
| | 7,729 |
| | 4,592 |
|
Average diluted common shares issued and outstanding (2) | Average diluted common shares issued and outstanding (2) | 10,255 |
| | 9,790 |
| | 7,729 |
| | 4,596 |
| | 4,463 |
| Average diluted common shares issued and outstanding (2) | 10,841 |
| | 10,255 |
| | 9,790 |
| | 7,729 |
| | 4,596 |
|
| Performance ratios | Performance ratios | |
| | |
| | |
| | |
| | |
| Performance ratios | |
| | |
| | |
| | |
| | |
|
| Return on average assets | Return on average assets | 0.06 | % | | n/m |
| | 0.26 | % | | 0.22 | % | | 0.94 | % | Return on average assets | 0.19 | % | | 0.06 | % | | n/m |
| | 0.26 | % | | 0.22 | % |
| Return on average common shareholders’ equity | Return on average common shareholders’ equity | 0.04 |
| | n/m |
| | n/m |
| | 1.80 |
| | 11.08 |
| Return on average common shareholders’ equity | 1.27 |
| | 0.04 |
| | n/m |
| | n/m |
| | 1.80 |
|
Return on average tangible common shareholders’ equity (3) | Return on average tangible common shareholders’ equity (3) | 0.06 |
| | n/m |
| | n/m |
| | 4.72 |
| | 26.19 |
| Return on average tangible common shareholders’ equity (3) | 1.94 |
| | 0.06 |
| | n/m |
| | n/m |
| | 4.72 |
|
Return on average tangible shareholders’ equity (3) | Return on average tangible shareholders’ equity (3) | 0.96 |
| | n/m |
| | 4.18 |
| | 5.19 |
| | 25.13 |
| Return on average tangible shareholders’ equity (3) | 2.60 |
| | 0.96 |
| | n/m |
| | 4.18 |
| | 5.19 |
|
| Total ending equity to total ending assets | Total ending equity to total ending assets | 10.81 |
| | 10.08 | % | | 10.38 |
| | 9.74 |
| | 8.56 |
| Total ending equity to total ending assets | 10.72 |
| | 10.81 |
| | 10.08 | % | | 10.38 |
| | 9.74 |
|
| Total average equity to total average assets | Total average equity to total average assets | 9.98 |
| | 9.56 |
| | 10.01 |
| | 8.94 |
| | 8.53 |
| Total average equity to total average assets | 10.75 |
| | 9.98 |
| | 9.56 |
| | 10.01 |
| | 8.94 |
|
| Dividend payout | Dividend payout | n/m |
| | n/m |
| | n/m |
| | n/m |
| | 72.26 |
| Dividend payout | 15.86 |
| | n/m |
| | n/m |
| | n/m |
| | n/m |
|
| Per common share data | Per common share data | |
| | |
| | |
| | |
| | |
| Per common share data | |
| | |
| | |
| | |
| | |
|
| Earnings (loss) | Earnings (loss) | $ | 0.01 |
| | $ | (0.37 | ) | | $ | (0.29 | ) | | $ | 0.54 |
| | $ | 3.32 |
| Earnings (loss) | $ | 0.26 |
| | $ | 0.01 |
| | $ | (0.37 | ) | | $ | (0.29 | ) | | $ | 0.54 |
|
Diluted earnings (loss) (2) | Diluted earnings (loss) (2) | 0.01 |
| | (0.37 | ) | | (0.29 | ) | | 0.54 |
| | 3.29 |
| Diluted earnings (loss) (2) | 0.25 |
| | 0.01 |
| | (0.37 | ) | | (0.29 | ) | | 0.54 |
|
| Dividends paid | Dividends paid | 0.04 |
| | 0.04 |
| | 0.04 |
| | 2.24 |
| | 2.40 |
| Dividends paid | 0.04 |
| | 0.04 |
| | 0.04 |
| | 0.04 |
| | 2.24 |
|
| Book value | Book value | 20.09 |
| | 20.99 |
| | 21.48 |
| | 27.77 |
| | 32.09 |
| Book value | 20.24 |
| | 20.09 |
| | 20.99 |
| | 21.48 |
| | 27.77 |
|
Tangible book value (3) | Tangible book value (3) | 12.95 |
| | 12.98 |
| | 11.94 |
| | 10.11 |
| | 12.71 |
| Tangible book value (3) | 13.36 |
| | 12.95 |
| | 12.98 |
| | 11.94 |
| | 10.11 |
|
| Market price per share of common stock | Market price per share of common stock | |
| | |
| | |
| | |
| | |
| Market price per share of common stock | |
| | |
| |
|
| | |
| | |
|
| Closing | Closing | $ | 5.56 |
| | $ | 13.34 |
| | $ | 15.06 |
| | $ | 14.08 |
| | $ | 41.26 |
| Closing | $ | 11.61 |
| | $ | 5.56 |
| | $ | 13.34 |
| | $ | 15.06 |
| | $ | 14.08 |
|
| High closing | High closing | 15.25 |
| | 19.48 |
| | 18.59 |
| | 45.03 |
| | 54.05 |
| High closing | 11.61 |
| | 15.25 |
| | 19.48 |
| | 18.59 |
| | 45.03 |
|
| Low closing | Low closing | 4.99 |
| | 10.95 |
| | 3.14 |
| | 11.25 |
| | 41.10 |
| Low closing | 5.80 |
| | 4.99 |
| | 10.95 |
| | 3.14 |
| | 11.25 |
|
| Market capitalization | Market capitalization | $ | 58,580 |
| | $ | 134,536 |
| | $ | 130,273 |
| | $ | 70,645 |
| | $ | 183,107 |
| Market capitalization | $ | 125,136 |
| | $ | 58,580 |
| | $ | 134,536 |
| | $ | 130,273 |
| | $ | 70,645 |
|
| Average balance sheet | |
| | |
| | |
| | |
| | |
| |
| Total loans and leases | $ | 938,096 |
| | $ | 958,331 |
| | $ | 948,805 |
| | $ | 910,871 |
| | $ | 776,154 |
| |
| Total assets | 2,296,322 |
| | 2,439,606 |
| | 2,443,068 |
| | 1,843,985 |
| | 1,602,073 |
| |
| Total deposits | 1,035,802 |
| | 988,586 |
| | 980,966 |
| | 831,157 |
| | 717,182 |
| |
| Long-term debt | 421,229 |
| | 490,497 |
| | 446,634 |
| | 231,235 |
| | 169,855 |
| |
| Common shareholders’ equity | 211,709 |
| | 212,686 |
| | 182,288 |
| | 141,638 |
| | 133,555 |
| |
| Total shareholders’ equity | 229,095 |
| | 233,235 |
| | 244,645 |
| | 164,831 |
| | 136,662 |
| |
Asset quality (4) | |
| | |
| | |
| | |
| | |
| |
Allowance for credit losses (5) | $ | 34,497 |
| | $ | 43,073 |
| | $ | 38,687 |
| | $ | 23,492 |
| | $ | 12,106 |
| |
Nonperforming loans, leases and foreclosed properties (6) | 27,708 |
| | 32,664 |
| | 35,747 |
| | 18,212 |
| | 5,948 |
| |
Allowance for loan and lease losses as a percentage of total loans and leases outstanding (6) | 3.68 | % | | 4.47 | % | | 4.16 | % | | 2.49 | % | | 1.33 | % | |
Allowance for loan and lease losses as a percentage of total nonperforming loans and leases (6) | 135 |
| | 136 |
| | 111 |
| | 141 |
| | 207 |
| |
Allowance for loan and lease losses as a percentage of total nonperforming loans and leases excluding the PCI loan portfolio (6) | 101 |
| | 116 |
| | 99 |
| | 136 |
| | n/a |
| |
Amounts included in allowance that are excluded from nonperforming loans (7) | $ | 17,490 |
| | $ | 22,908 |
| | $ | 17,690 |
| | $ | 11,679 |
| | $ | 6,520 |
| |
Allowances as a percentage of total nonperforming loans and leases excluding the amounts included in the allowance that are excluded from nonperforming loans (7) | 65 | % | | 62 | % | | 58 | % | | 70 | % | | 91 | % | |
| Net charge-offs | $ | 20,833 |
| | $ | 34,334 |
| | $ | 33,688 |
| | $ | 16,231 |
| | $ | 6,480 |
| |
Net charge-offs as a percentage of average loans and leases outstanding (6) | 2.24 | % | | 3.60 | % | | 3.58 | % | | 1.79 | % | | 0.84 | % | |
Nonperforming loans and leases as a percentage of total loans and leases outstanding (6) | 2.74 |
| | 3.27 |
| | 3.75 |
| | 1.77 |
| | 0.64 |
| |
Nonperforming loans, leases and foreclosed properties as a percentage of total loans, leases and foreclosed properties (6) | 3.01 |
| | 3.48 |
| | 3.98 |
| | 1.96 |
| | 0.68 |
| |
| Ratio of the allowance for loan and lease losses at December 31 to net charge-offs | 1.62 |
| | 1.22 |
| | 1.10 |
| | 1.42 |
| | 1.79 |
| |
| Capital ratios (year end) | |
| | |
| | |
| | |
| | |
| |
| Risk-based capital: | |
| | |
| | |
| | |
| | |
| |
| Tier 1 common | 9.86 | % | | 8.60 | % | | 7.81 | % | | 4.80 | % | | 4.93 | % | |
| Tier 1 | 12.40 |
| | 11.24 |
| | 10.40 |
| | 9.15 |
| | 6.87 |
| |
| Total | 16.75 |
| | 15.77 |
| | 14.66 |
| | 13.00 |
| | 11.02 |
| |
| Tier 1 leverage | 7.53 |
| | 7.21 |
| | 6.88 |
| | 6.44 |
| | 5.04 |
| |
Tangible equity (3) | 7.54 |
| | 6.75 |
| | 6.40 |
| | 5.11 |
| | 3.73 |
| |
Tangible common equity (3) | 6.64 |
| | 5.99 |
| | 5.56 |
| | 2.93 |
| | 3.46 |
| |
| |
(1) | Excludes merger and restructuring charges and goodwill impairment charges. |
| |
(2) | Due to a net loss applicable to common shareholders for 2010 and 2009, the impact of antidilutive equity instruments was excluded from diluted earnings (loss) per share and average diluted common shares. |
| |
(3) | Tangible equity ratios and tangible book value per share of common stock are non-GAAP financial measures. Other companies may define or calculate these measures differently. For additional information on these ratios and corresponding reconciliations to GAAP financial measures, see Supplemental Financial Data on page 3835 and Statistical Table XV.XV on page 145. |
| |
(4) | For more information on the impact of the PCI loan portfolio on asset quality, see Consumer Portfolio Credit Risk Management on page 81 and Commercial Portfolio Credit Risk Management on page 9480. |
| |
(5) | Includes the allowance for loan and lease losses and the reserve for unfunded lending commitments. |
| |
(6) | Balances and ratios do not include loans accounted for under the fair value option. For additional exclusions onfrom nonperforming loans, leases and foreclosed properties, see Nonperforming Consumer Loans and Foreclosed Properties Activity on page 9293 and corresponding Table 3637, and Nonperforming Commercial Loans, Leases and Foreclosed Properties Activity on page 100101 and corresponding Table 4546. |
| |
(7) | Amounts included in allowance that are excluded from nonperforming loans primarily include amounts allocated to the U.S. credit card and unsecured consumer lending portfolios in Card ServicesCBB portfolios,, PCI loans and the non-U.S. credit card portfolio in All Other. |
| |
(8) | Net charge-offs exclude $2.8 billion of write-offs in the Countrywide home equity PCI loan portfolio for 2012. These write-offs decreased the PCI valuation allowance included as part of the allowance for loan and lease losses. For information on PCI write-offs, see Countrywide Purchased Credit-impaired Loan Portfolio on page 90. |
| |
(9) | There were no write-offs of PCI loans in 2011, 2010, 2009 and 2008. |
n/m = not meaningful
n/a = not applicable
|
| | |
| | | Bank of America 2012 3733 |
|
| | | | | | | | | | | | | | | | | | | | |
| | | | | | | | | | | |
| Table 7 | Five Year Summary of Selected Financial Data (continued) |
| | | | | | | | | | | |
| (Dollars in millions) | 2012 | | 2011 | | 2010 | | 2009 | | 2008 |
| Average balance sheet | |
| | |
| | |
| | |
| | |
|
| Total loans and leases | $ | 898,768 |
| | $ | 938,096 |
| | $ | 958,331 |
| | $ | 948,805 |
| | $ | 910,871 |
|
| Total assets | 2,191,356 |
| | 2,296,322 |
| | 2,439,606 |
| | 2,443,068 |
| | 1,843,985 |
|
| Total deposits | 1,047,782 |
| | 1,035,802 |
| | 988,586 |
| | 980,966 |
| | 831,157 |
|
| Long-term debt | 316,393 |
| | 421,229 |
| | 490,497 |
| | 446,634 |
| | 231,235 |
|
| Common shareholders’ equity | 216,996 |
| | 211,709 |
| | 212,686 |
| | 182,288 |
| | 141,638 |
|
| Total shareholders’ equity | 235,677 |
| | 229,095 |
| | 233,235 |
| | 244,645 |
| | 164,831 |
|
Asset quality (4) | |
| | |
| | |
| | |
| | |
|
Allowance for credit losses (5) | $ | 24,692 |
| | $ | 34,497 |
| | $ | 43,073 |
| | $ | 38,687 |
| | $ | 23,492 |
|
Nonperforming loans, leases and foreclosed properties (6) | 23,555 |
| | 27,708 |
| | 32,664 |
| | 35,747 |
| | 18,212 |
|
Allowance for loan and lease losses as a percentage of total loans and leases outstanding (6) | 2.69 | % | | 3.68 | % | | 4.47 | % | | 4.16 | % | | 2.49 | % |
Allowance for loan and lease losses as a percentage of total nonperforming loans and leases (6) | 107 |
| | 135 |
| | 136 |
| | 111 |
| | 141 |
|
Allowance for loan and lease losses as a percentage of total nonperforming loans and leases, excluding the PCI loan portfolio (6) | 82 |
| | 101 |
| | 116 |
| | 99 |
| | 136 |
|
Amounts included in allowance that are excluded from nonperforming loans and leases (7) | $ | 12,021 |
| | $ | 17,490 |
| | $ | 22,908 |
| | $ | 17,690 |
| | $ | 11,679 |
|
Allowance as a percentage of total nonperforming loans and leases, excluding amounts included in the allowance that are excluded from nonperforming loans and leases (7) | 54 | % | | 65 | % | | 62 | % | | 58 | % | | 70 | % |
Net charge-offs (8) | $ | 14,908 |
| | $ | 20,833 |
| | $ | 34,334 |
| | $ | 33,688 |
| | $ | 16,231 |
|
Net charge-offs as a percentage of average loans and leases outstanding (6, 8) | 1.67 | % | | 2.24 | % | | 3.60 | % | | 3.58 | % | | 1.79 | % |
Net charge-offs as a percentage of average loans and leases outstanding, excluding the PCI loan portfolio (6) | 1.73 |
| | 2.32 |
| | 3.73 |
| | 3.71 |
| | 1.83 |
|
Net charge-offs and PCI write-offs as a percentage of average loans and leases outstanding (6, 9) | 1.99 |
| | 2.24 |
| | 3.60 |
| | 3.58 |
| | 1.79 |
|
Nonperforming loans and leases as a percentage of total loans and leases outstanding (6) | 2.52 |
| | 2.74 |
| | 3.27 |
| | 3.75 |
| | 1.77 |
|
Nonperforming loans, leases and foreclosed properties as a percentage of total loans, leases and foreclosed properties (6) | 2.62 |
| | 3.01 |
| | 3.48 |
| | 3.98 |
| | 1.96 |
|
Ratio of the allowance for loan and lease losses at December 31 to net charge-offs (8) | 1.62 |
| | 1.62 |
| | 1.22 |
| | 1.10 |
| | 1.42 |
|
| Ratio of the allowance for loan and lease losses at December 31 to net charge-offs, excluding the PCI loan portfolio | 1.25 |
| | 1.22 |
| | 1.04 |
| | 1.00 |
| | 1.38 |
|
Ratio of the allowance for loan and lease losses at December 31 to net charge-offs and PCI write-offs (9) | 1.36 |
| | 1.62 |
| | 1.22 |
| | 1.10 |
| | 1.42 |
|
| Capital ratios (year end) | |
| | |
| | |
| | |
| | |
|
| Risk-based capital: | |
| | |
| | |
| | |
| | |
|
| Tier 1 common | 11.06 | % | | 9.86 | % | | 8.60 | % | | 7.81 | % | | 4.80 | % |
| Tier 1 | 12.89 |
| | 12.40 |
| | 11.24 |
| | 10.40 |
| | 9.15 |
|
| Total | 16.31 |
| | 16.75 |
| | 15.77 |
| | 14.66 |
| | 13.00 |
|
| Tier 1 leverage | 7.37 |
| | 7.53 |
| | 7.21 |
| | 6.88 |
| | 6.44 |
|
Tangible equity (3) | 7.62 |
| | 7.54 |
| | 6.75 |
| | 6.40 |
| | 5.11 |
|
Tangible common equity (3) | 6.74 |
| | 6.64 |
| | 5.99 |
| | 5.56 |
| | 2.93 |
|
For footnotes see page 33.
Table of Contents
Supplemental Financial Data
We view net interest income and related ratios and analyses on a FTE basis, which when presented on a consolidated basis, are non-GAAP financial measures. We believe managing the business with net interest income on a FTE basis provides a more accurate picture of the interest margin for comparative purposes. To derive the FTE basis, net interest income is adjusted to reflect tax-exempt income on an equivalent before-tax basis with a corresponding increase in income tax expense. For purposes of this calculation, we use the federal statutory tax rate of 35 percent. This measure ensures comparability of net interest income arising from taxable and tax-exempt sources.
As mentioned above, certainCertain performance measures including the efficiency ratio and net interest yield utilize net interest income (and thus total revenue) on a FTE basis. The efficiency ratio measures the costs expended to generate a dollar of revenue, and net interest yield measures the bps we earn over the cost of funds.
We also evaluate our business based on certain ratios that utilize tangible equity, a non-GAAP financial measure. Tangible equity represents an adjusted shareholders’ equity or common shareholders’ equity amount which has been reduced by goodwill and intangible assets (excluding MSRs), net of related deferred tax liabilities. These measures are used to evaluate our use of equity. In addition, profitability, relationship and investment models all use Returnreturn on average tangible shareholders’ equity (ROTE) as key measures to support our overall growth goals. These ratios are as follows:
| |
| Ÿ | Return on average tangible common shareholders’ equity measures our earnings contribution as a percentage of adjusted common shareholders’ equity plus any Common Equivalent Securities (CES).equity. The tangible common equity ratio represents adjusted common shareholders’ equity plus any CES divided by total assets less goodwill and intangible assets (excluding |
MSRs), net of related deferred tax liabilities.
| |
Ÿ | ROTE measures our earnings contribution as a percentage of adjusted average shareholders’ equity. The tangible equity ratio represents adjusted total shareholders’ equity divided by total assets less goodwill and intangible assets (excluding MSRs), net of related deferred tax liabilities. |
| |
| Ÿ | ROTE measures our earnings contribution as a percentage of adjusted average total shareholders’ equity. The tangible equity ratio represents adjusted total shareholders’ equity divided by |
total assets less goodwill and intangible assets (excluding MSRs), net of related deferred tax liabilities.
| |
| Ÿ | Tangible book value per common share represents adjusted ending common shareholders’ equity divided by ending common shares outstanding. |
The aforementioned supplemental data and performance measures are presented in Table 7 and Statistical Table XII. In addition, in Table 8 and Statistical Table XIV, we have excluded the impact of goodwill impairment charges of $3.2 billion and $12.4 billion recorded in 2011 and 2010 when presenting certain of these metrics. Accordingly, these are non-GAAP financial measures.
In addition, we evaluate our business segment results based on measures that utilize return on average economic capital, a non-GAAP financial measure, including the following:
| |
| Ÿ | Return on average economic capital for the segments is calculated as net income, adjusted for cost of funds and earnings credits and certain expenses related to intangibles, divided by average economic capital. |
| |
| Ÿ | Economic capital represents allocated equity less goodwill and a percentage of intangible assets (excluding MSRs). |
The aforementioned supplemental dataIn 2009, Common Equivalent Securities (CES) were reflected in our reconciliations given the expectation that the underlying Common Equivalent Junior Preferred Stock, Series S would convert into common stock following shareholder approval of additional authorized shares. Shareholders approved the increase in the number of authorized shares of common stock and performance measures are presented in Tables 7 and 8 and Statistical Tables XII and XIV. In addition, in Table 8 and Statistical Table XIV, we have excluded the impact of goodwill impairment charges of $3.2 billion and $12.4 billion recorded in 2011 and 2010 when presenting certain of these metrics. Accordingly, these are non-GAAP financial measures.Common Equivalent Stock converted into common stock on February 24, 2010.
Statistical Tables XV, XVI and XVII on pages 145, 146 and 148 provide reconciliations of these non-GAAP financial measures with GAAP financial measures defined by GAAP.measures. We believe the use of these non-GAAP financial measures provides additional clarity in assessing the results of the Corporation and our segments. Other companies may define or calculate these measures and ratios differently.
| | | | | | | | | | | | | | | | | | | | | | | |
| Table 8 | Five Year Supplemental Financial Data | | | | | | | | | | Five Year Supplemental Financial Data | | | | | | | | | |
| | | | | | | | | | | | | | | | | | | | | |
| (Dollars in millions, except per share information) | (Dollars in millions, except per share information) | 2011 | | 2010 | | 2009 | | 2008 | | 2007 | (Dollars in millions, except per share information) | 2012 | | 2011 | | 2010 | | 2009 | | 2008 |
| Fully taxable-equivalent basis data | Fully taxable-equivalent basis data | |
| | |
| | |
| | |
| | |
| Fully taxable-equivalent basis data | |
| | |
| | |
| | |
| | |
|
| Net interest income | Net interest income | $ | 45,588 |
| | $ | 52,693 |
| | $ | 48,410 |
| | $ | 46,554 |
| | $ | 36,190 |
| Net interest income | $ | 41,557 |
| | $ | 45,588 |
| | $ | 52,693 |
| | $ | 48,410 |
| | $ | 46,554 |
|
| Total revenue, net of interest expense | Total revenue, net of interest expense | 94,426 |
| | 111,390 |
| | 120,944 |
| | 73,976 |
| | 68,582 |
| Total revenue, net of interest expense | 84,235 |
| | 94,426 |
| | 111,390 |
| | 120,944 |
| | 73,976 |
|
| Net interest yield | Net interest yield | 2.48 | % | | 2.78 | % | | 2.65 | % | | 2.98 | % | | 2.60 | % | Net interest yield | 2.35 | % | | 2.48 | % | | 2.78 | % | | 2.65 | % | | 2.98 | % |
| Efficiency ratio | Efficiency ratio | 85.01 |
| | 74.61 |
| | 55.16 |
| | 56.14 |
| | 54.71 |
| Efficiency ratio | 85.59 |
| | 85.01 |
| | 74.61 |
| | 55.16 |
| | 56.14 |
|
Performance ratios, excluding goodwill impairment charges (1) | Performance ratios, excluding goodwill impairment charges (1) | |
| | |
| | |
| | |
| | |
| Performance ratios, excluding goodwill impairment charges (1) | |
| | |
| | |
| | |
| | |
|
| Per common share information | Per common share information | |
| | |
| | |
| | |
| | |
| Per common share information | |
| | |
| | |
| | |
| | |
|
| Earnings | Earnings | $ | 0.32 |
| | $ | 0.87 |
| | |
| | |
| | |
| Earnings | | | $ | 0.32 |
| | $ | 0.87 |
| | |
| | |
|
| Diluted earnings | Diluted earnings | 0.32 |
| | 0.86 |
| | |
| | |
| | |
| Diluted earnings | | | 0.32 |
| | 0.86 |
| | |
| | |
|
| Efficiency ratio | 81.64 | % | | 63.48 | % | | |
| | |
| | |
| |
| Efficiency ratio (FTE basis) | | Efficiency ratio (FTE basis) | | | 81.64 | % | | 63.48 | % | | |
| | |
|
| Return on average assets | Return on average assets | 0.20 |
| | 0.42 |
| | |
| | |
| | |
| Return on average assets | | | 0.20 |
| | 0.42 |
| | |
| | |
|
| Return on average common shareholders’ equity | Return on average common shareholders’ equity | 1.54 |
| | 4.14 |
| | |
| | |
| | |
| Return on average common shareholders’ equity | | | 1.54 |
| | 4.14 |
| | |
| | |
|
| Return on average tangible common shareholders’ equity | Return on average tangible common shareholders’ equity | 2.46 |
| | 7.03 |
| | |
| | |
| | |
| Return on average tangible common shareholders’ equity | | | 2.46 |
| | 7.03 |
| | |
| | |
|
| Return on average tangible shareholders’ equity | Return on average tangible shareholders’ equity | 3.08 |
| | 7.11 |
| | |
| | |
| | |
| Return on average tangible shareholders’ equity | | | 3.08 |
| | 7.11 |
| | |
| | |
|
| |
(1) | Performance ratios are calculated excluding the impact of goodwill impairment charges of $3.2 billion and $12.4 billion recorded during 2011 and 2010. |
|
| | |
| | 38Bank of America 2011201235
| | |
CoreNet Interest Income Excluding Trading-related Net Interest Income
We manage core net interest income which is reported net interest income on a FTE basis adjusted forand excluding the impact of market-basedtrading-related activities. As discussed in the GBAMGlobal Markets business segment section on page 4948, we evaluate our market-basedsales and trading results and strategies on a total market-based revenue approach by combining net interest income and noninterest income for GBAMGlobal Markets. An analysis of core net interest income, core average earning assets and core net interest yield on earning assets, all of which adjust for the impact of market-based activitiestrading-related net interest income from reported net interest income on a FTE basis, is shown below. We believe the use of this non-GAAP presentation in Table 9 provides additional clarity in assessing our results.
| | | | | | | | | | | |
| Table 9 | Core Net Interest Income | | | | Net Interest Income Excluding Trading-related Net Interest Income |
| | | | | | | | | |
| (Dollars in millions) | (Dollars in millions) | 2011 | | 2010 | (Dollars in millions) | 2012 | | 2011 |
| Net interest income (FTE basis) | Net interest income (FTE basis) | |
| | |
| Net interest income (FTE basis) | |
| | |
|
As reported (1) | As reported (1) | $ | 45,588 |
| | $ | 52,693 |
| As reported (1) | $ | 41,557 |
| | $ | 45,588 |
|
Impact of market-based net interest income (2) | (3,813 | ) | | (4,430 | ) | |
| Core net interest income | 41,775 |
| | 48,263 |
| |
Impact of trading-related net interest income (2) | | Impact of trading-related net interest income (2) | (3,308 | ) | | (3,690 | ) |
Net interest income excluding trading-related net interest income (3) | | Net interest income excluding trading-related net interest income (3) | $ | 38,249 |
| | $ | 41,898 |
|
| Average earning assets | Average earning assets | |
| | |
| Average earning assets | |
| | |
|
| As reported | As reported | 1,834,659 |
| | 1,897,573 |
| As reported | $ | 1,769,969 |
| | $ | 1,834,659 |
|
Impact of market-based earning assets (2) | (448,776 | ) | | (512,804 | ) | |
| Core average earning assets | $ | 1,385,883 |
| | $ | 1,384,769 |
| |
Impact of trading-related earning assets (2) | | Impact of trading-related earning assets (2) | (449,660 | ) | | (445,574 | ) |
Average earning assets excluding trading-related earning assets (3) | | Average earning assets excluding trading-related earning assets (3) | $ | 1,320,309 |
| | $ | 1,389,085 |
|
| Net interest yield contribution (FTE basis) | Net interest yield contribution (FTE basis) | |
| | |
| Net interest yield contribution (FTE basis) | |
| | |
|
As reported (1) | As reported (1) | 2.48 | % | | 2.78 | % | As reported (1) | 2.35 | % | | 2.48 | % |
Impact of market-based activities (2) | 0.53 |
| | 0.71 |
| |
| Core net interest yield on earning assets | 3.01 | % | | 3.49 | % | |
Impact of trading-related activities (2) | | Impact of trading-related activities (2) | 0.55 |
| | 0.54 |
|
Net interest yield on earning assets excluding trading-related activities (3) | | Net interest yield on earning assets excluding trading-related activities (3) | 2.90 | % | | 3.02 | % |
| |
(1) | NetFor 2012 and 2011, net interest income and net interest yield include fees earned on overnight deposits placed with the Federal Reserve and, for 2012, fees earned on deposits, primarily overnight, placed with certain non-U.S. central banks, of $186189 million and $368186 million for 2011 and 2010.
|
| |
(2) | Represents the impact of market-basedtrading-related amounts included in GBAMGlobal Markets. |
| |
(3) | Represents a non-GAAP financial measure. |
CoreNet interest income excluding trading-related net interest income decreased $6.53.6 billion to $41.838.2 billion for 20112012 compared to 20102011. The decline was primarily due to lower consumer loan balances and yields, the ALM portfolio recouponing to a lower yield and decreased investment securitycommercial loan yields, including the acceleration of purchase premium amortization from an increase in modeled prepayment expectations and increased hedge ineffectiveness. These decreases were partially offset by ongoing reductions in ourlong-term debt footprint and lower interest rates paid on deposits.
Core averageAverage earning assets excluding trading-related earning assets increaseddecreased $1.168.8 billion to $1,385.91,320.3 billion for 20112012 compared to 20102011. The increasedecrease was primarily due to growthdeclines in investmentconsumer loans, securities purchased under agreement to resell, time deposits placed and LHFS, partially offset by declinesan increase in consumercommercial loans.
Core netNet interest yield on earning assets excluding trading-related activities decreased 4812 bps to 3.012.90 percent for 20112012 compared to 20102011 primarily due to the factors noted above. In addition, theabove for net interest income. The yield curve flattened significantly in 2012 with long-term rates near historical lows at December 31, 2011.lows. This has resulted in net interest yield compression as assets have repriced down and liability yields have declined less significantly due to the absolute low level of short-end rates.
Business Segment Operations
Segment Description and Basis of Presentation
We report the results of our operations through sixfive business segments: Deposits, Card Services, CBB, CRES,, Global Commercial Banking,, GBAM Global Markets and GWIM, with the remaining operations recorded in All Other.
We prepare and evaluate segment results using certain non-GAAP financial measures, many of which are discussed in
measures. For additional information, see Supplemental Financial Data on page 3835. We begin by evaluating the operating results of the segments which by definition exclude merger and restructuring charges.
The management accounting and reporting process derives segment and business results by utilizing allocation methodologies for revenue and expense. The net income derived for the businesses is dependent upon revenue and cost allocations using an activity-based costing model, funds transfer pricing, and other methodologies and assumptions management believes are appropriate to reflect the results of the business.
Total revenue, net of interest expense, includes net interest income on a FTE basis and noninterest income. The adjustment of net interest income to a FTE basis results in a corresponding increase in income tax expense. The segment results also reflect certain revenue and expense methodologies that are utilized to determine net income. The net interest income of the businesses includes the results of a funds transfer pricing process that matches assets and liabilities with similar interest rate sensitivity and maturity characteristics. For presentation purposes, in segments where the total of liabilities and equity exceeds assets, which are generally deposit-taking segments, we allocate assets to match liabilities. Net interest income of the business segments also includes an allocation of net interest income generated by certain of our ALM activities.
Our ALM activities include an overall interest rate risk management strategy that incorporates the use of various derivatives and cash instruments to manage fluctuations in earnings and capital that are caused by interest rate volatility. Our
goal is to manage interest rate sensitivity so that movements in interest rates do not significantly adversely affect earnings and capital. The majority of our ALM activities are allocated to the business segments and fluctuate based on performance. ALM activities include external product pricing decisions including deposit pricing strategies, the effects of our internal funds transfer pricing process and the net effects of other ALM activities.
Certain expenses not directly attributable to a specific business segment are allocated to the segments. The most significant of these expenses include data and item processing costs and certain centralized or shared functions. Data processing costs are allocated to the segments based on equipment usage. Item processing costs are allocated to the segments based on the volume of items processed for each segment. The costs of certain other centralized or shared functions are allocated based on methodologies that reflect utilization.
Equity is allocatedWe allocate economic capital to the business segments and related businesses using a risk-adjusted methodology incorporating each segment’s credit, market, interest rate, strategic and operational risk components. TheSee Managing Risk on page 66 and Strategic Risk Management on page 70 for more information on the nature of these risks is discussed further on page 68.risks. A business segment’s allocated equity includes this economic capital allocation and also includes the portion of goodwill and intangibles specifically assigned to the business segment. We benefit from the diversification of risk across these components which is reflected as a reduction to allocated equity for each segment. The total amount of average allocated equity reflects both risk-based capital and the portion of goodwill and intangibles specifically assigned to the business segments. The risk-adjusted methodology is periodically refined and such refinements are reflected as changes to allocated equity in each segment.
For more information on selected financial information for the business segments and reconciliations to consolidated total revenue, net income (loss) and year-end total assets, see Note 26 – Business Segment Information to the Consolidated Financial Statements.
|
| | |
| | | Bank of America 2012 3937 |
DepositsConsumer & Business Banking
| | | | | | | | | | | | | | | | | | | | | | | | | | | | |
| | | | | | | | | Deposits | | Card Services | | Business Banking | | Total Consumer & Business Banking | | |
| (Dollars in millions) | (Dollars in millions) | 2011 | | 2010 | | % Change | (Dollars in millions) | 2012 | | 2011 | | 2012 | | 2011 | | 2012 | | 2011 | | 2012 | | 2011 | | % Change |
|
| Net interest income (FTE basis) | Net interest income (FTE basis) | $ | 8,471 |
| | $ | 8,278 |
| | 2 | % | Net interest income (FTE basis) | $ | 7,857 |
| | $ | 8,472 |
| | $ | 10,047 |
| | $ | 11,502 |
| | $ | 1,221 |
| | $ | 1,404 |
| | $ | 19,125 |
| | $ | 21,378 |
| | (11 | )% |
| Noninterest income: | Noninterest income: | | | | | | Noninterest income: | | | | | | | | | | | | | | | | | |
| Card income | | Card income | — |
| | — |
| | 5,261 |
| | 6,286 |
| | — |
| | — |
| | 5,261 |
| | 6,286 |
| | (16 | ) |
| Service charges | Service charges | 3,995 |
| | 5,057 |
| | (21 | ) | Service charges | 3,922 |
| | 4,000 |
| | 1 |
| | — |
| | 361 |
| | 524 |
| | 4,284 |
| | 4,524 |
| | (5 | ) |
| All other income | 223 |
| | 227 |
| | (2 | ) | |
| All other income (loss) | | All other income (loss) | 276 |
| | 224 |
| | (54 | ) | | 328 |
| | 131 |
| | 140 |
| | 353 |
| | 692 |
| | (49 | ) |
| Total noninterest income | Total noninterest income | 4,218 |
| | 5,284 |
| | (20 | ) | Total noninterest income | 4,198 |
| | 4,224 |
| | 5,208 |
| | 6,614 |
| | 492 |
| | 664 |
| | 9,898 |
| | 11,502 |
| | (14 | ) |
| Total revenue, net of interest expense | 12,689 |
| | 13,562 |
| | (6 | ) | |
| Total revenue, net of interest expense (FTE basis) | | Total revenue, net of interest expense (FTE basis) | 12,055 |
| | 12,696 |
| | 15,255 |
| | 18,116 |
| | 1,713 |
| | 2,068 |
| | 29,023 |
| | 32,880 |
| | (12 | ) |
| | | | | | | | | | | | | | | | | | | | | | | | | |
| Provision for credit losses | Provision for credit losses | 173 |
| | 201 |
| | (14 | ) | Provision for credit losses | 208 |
| | 173 |
| | 3,452 |
| | 3,072 |
| | 281 |
| | 245 |
| | 3,941 |
| | 3,490 |
| | 13 |
|
| Noninterest expense | Noninterest expense | 10,633 |
| | 11,196 |
| | (5 | ) | Noninterest expense | 10,409 |
| | 10,600 |
| | 5,496 |
| | 5,961 |
| | 888 |
| | 1,158 |
| | 16,793 |
| | 17,719 |
| | (5 | ) |
| Income before income taxes | Income before income taxes | 1,883 |
| | 2,165 |
| | (13 | ) | Income before income taxes | 1,438 |
| | 1,923 |
| | 6,307 |
| | 9,083 |
| | 544 |
| | 665 |
| | 8,289 |
| | 11,671 |
| | (29 | ) |
| Income tax expense (FTE basis) | Income tax expense (FTE basis) | 691 |
| | 803 |
| | (14 | ) | Income tax expense (FTE basis) | 521 |
| | 706 |
| | 2,246 |
| | 3,272 |
| | 201 |
| | 246 |
| | 2,968 |
| | 4,224 |
| | (30 | ) |
| Net income | Net income | $ | 1,192 |
| | $ | 1,362 |
| | (12 | ) | Net income | $ | 917 |
| | $ | 1,217 |
| | $ | 4,061 |
| | $ | 5,811 |
| | $ | 343 |
| | $ | 419 |
| | $ | 5,321 |
| | $ | 7,447 |
| | (29 | ) |
| | | | | | | | | | | | | | | | | | | | | | | | | |
| Net interest yield (FTE basis) | Net interest yield (FTE basis) | 2.02 | % | | 2.00 | % | | |
| Net interest yield (FTE basis) | 1.81 | % | | 2.02 | % | | 8.93 | % | | 9.04 | % | | 2.68 | % | | 3.23 | % | | 3.88 | % | | 4.45 | % | | |
| Return on average allocated equity | Return on average allocated equity | 5.02 |
| | 5.62 |
| | |
| Return on average allocated equity | 3.77 |
| | 5.13 |
| | 19.73 |
| | 27.50 |
| | 3.92 |
| | 5.20 |
| | 9.92 |
| | 14.07 |
| | |
Return on average economic capital (1) | 20.66 |
| | 21.97 |
| | |
| |
| Return on average economic capital | | Return on average economic capital | 14.35 |
| | 21.10 |
| | 40.20 |
| | 55.30 |
| | 5.16 |
| | 7.03 |
| | 23.01 |
| | 33.52 |
| | |
| Efficiency ratio (FTE basis) | Efficiency ratio (FTE basis) | 83.80 |
| | 82.55 |
| | |
| Efficiency ratio (FTE basis) | 86.34 |
| | 83.49 |
| | 36.03 |
| | 32.90 |
| | 51.81 |
| | 56.09 |
| | 57.86 |
| | 53.89 |
| | |
| | | | | | | | | | | | | | | | | | | | | | | | | |
| Balance Sheet | | |
| | |
| | |
| | | | | | | | | | | | | | | | | | |
| | | | | | | | | | | | | | | | | | | | | | | | | |
| Average | Average | |
| | |
| | |
| | | | | | | | | | | | | | | | | | |
| Total earning assets | $ | 419,445 |
| | $ | 413,595 |
| | 1 |
| |
| Total assets | 445,922 |
| | 440,030 |
| | 1 |
| |
| Total loans and leases | | Total loans and leases | n/m |
| | n/m |
| | $ | 111,642 |
| | $ | 126,083 |
| | $ | 23,764 |
| | $ | 26,889 |
| | $ | 136,171 |
| | $ | 153,641 |
| | (11 | ) |
Total earning assets (1) | | Total earning assets (1) | $ | 433,908 |
| | $ | 419,996 |
| | 112,489 |
| | 127,258 |
| | 45,549 |
| | 43,542 |
| | 492,965 |
| | 480,590 |
| | 3 |
|
Total assets (1) | | Total assets (1) | 460,074 |
| | 446,475 |
| | 118,763 |
| | 130,254 |
| | 52,690 |
| | 51,553 |
| | 532,546 |
| | 518,076 |
| | 3 |
|
| Total deposits | Total deposits | 421,106 |
| | 414,877 |
| | 2 |
| Total deposits | 434,261 |
| | 421,106 |
| | n/m |
| | n/m |
| | 42,837 |
| | 40,679 |
| | 477,440 |
| | 462,087 |
| | 3 |
|
| Allocated equity | Allocated equity | 23,735 |
| | 24,222 |
| | (2 | ) | Allocated equity | 24,329 |
| | 23,734 |
| | 20,578 |
| | 21,127 |
| | 8,739 |
| | 8,047 |
| | 53,646 |
| | 52,908 |
| | 1 |
|
Economic capital (1) | 5,786 |
| | 6,247 |
| | (7 | ) | |
| Economic capital | | Economic capital | 6,405 |
| | 5,786 |
| | 10,131 |
| | 10,538 |
| | 6,642 |
| | 5,949 |
| | 23,178 |
| | 22,273 |
| | 4 |
|
| | | | | | | | | | | | | | | | | | | | | | | | | |
| Year end | Year end | |
| | |
| | |
| | | | | | | | | | | | | | | | | | |
| Total earning assets | $ | 418,623 |
| | $ | 414,215 |
| | 1 |
| |
| Total assets | 445,680 |
| | 440,954 |
| | 1 |
| |
| Total loans and leases | | Total loans and leases | n/m |
| | n/m |
| | $ | 110,380 |
| | $ | 120,668 |
| | $ | 23,396 |
| | $ | 25,006 |
| | $ | 134,657 |
| | $ | 146,378 |
| | (8 | ) |
Total earning assets (1) | | Total earning assets (1) | $ | 455,999 |
| | $ | 419,215 |
| | 110,831 |
| | 121,991 |
| | 44,712 |
| | 46,516 |
| | 514,521 |
| | 480,972 |
| | 7 |
|
Total assets (1) | | Total assets (1) | 482,339 |
| | 446,274 |
| | 117,904 |
| | 127,623 |
| | 51,655 |
| | 53,950 |
| | 554,878 |
| | 521,097 |
| | 6 |
|
| Total deposits | Total deposits | 421,871 |
| | 415,189 |
| | 2 |
| Total deposits | 455,871 |
| | 421,871 |
| | n/m |
| | n/m |
| | 42,382 |
| | 41,519 |
| | 498,669 |
| | 464,264 |
| | 7 |
|
| Client brokerage assets | 66,576 |
| | 63,597 |
| | 5 |
| |
| |
(1) | Return on average economic capitalFor presentation purposes, in segments and economic capital are non-GAAP financial measures. For additional information on these measures, seebusinesses where the total of liabilities and equity exceeds assets, we allocate assets to match liabilities. As a result, total earning assets and total assets of the businesses may not equal total Supplemental Financial DataCBB on page 38 and for corresponding reconciliations to GAAP financial measures, see Statistical Table XVI..
|
n/m = not meaningful
DepositsCBB, which is comprised of Deposits, Card Services and Business Banking, offers a diversified range of credit, banking and investment products and services to consumers and businesses. Our customers and clients have access to a franchise network that stretches coast to coast through 32 states and the District of Columbia. The franchise network includes approximately 5,500 banking centers, 16,300 ATMs, nationwide call centers, and online and mobile platforms.
The Federal Reserve adopted a final rule with respect to the Durbin Amendment, which became effective October 1, 2011, that established the maximum allowable interchange fees a bank can receive for a debit card transaction. The interchange fee rules resulted in a reduction of debit card revenue of approximately $1.7 billion in 2012 compared to a $430 million reduction in 2011. For more information on the Durbin Amendment and the final interchange rules, see Regulatory Matters on page 64.
CBB Results
Net income for CBBdecreased$2.1 billion to $5.3 billion in 2012 compared to 2011 primarily due to lower revenue and higher provision for credit losses, partially offset by lower noninterest expense. Net interest income decreased$2.3 billion to $19.1 billion due to lower average loan balances primarily in Card Services as well as compressed deposit spreads due to the continued low rate environment. Noninterest income decreased$1.6 billion to $9.9 billion primarily due to a decline in Card Services. The provision for credit losses increased$451 million to $3.9 billion with the increase largely in Card Services. Noninterest expense decreased$926 million to $16.8 billion primarily due to lower FDIC and operating expenses, partially offset by an increase in litigation expense.
The return on average economic capital decreased primarily due to lower net income. For more information regarding economic capital, see Supplemental Financial Data on page 35.
Deposits
Deposits includes the results of consumer deposit activities which consist of a comprehensive range of products provided to consumers and small businesses. Our deposit products include traditional savings accounts, money market savings accounts, CDs and IRAs, noninterest- and interest-bearing checking accounts, as well as investment accounts and products. Deposit products provide a relatively stable source of funding and liquidity for the Corporation. We earn net interest spread revenue from investing this liquidity in earning assets through client-facing lending and ALM activities. The revenue is allocated to the deposit products using our funds transfer pricing process which takes into account thethat matches assets and liabilities with similar interest ratesrate sensitivity and implied maturity of the deposits.characteristics.
Deposits also generates fees such as account service fees, non-sufficient funds fees, overdraft charges and ATM fees, as well as investment and brokerage fees from Merrill Edge accounts. Merrill Edge is an integrated investing and banking service targeted at clients with less than $250,000 in totalinvestable assets. Merrill Edge provides team-based investment advice and guidance, brokerage services, a self-directed online investing platform and key banking capabilities including access to the Corporation’s network of banking centers and ATMs. Deposits includes the net impact of migrating customers and their related deposit balances between Deposits and Deposits GWIMand as well as other client-managed businesses. For more information on the migration of customer balances to or from GWIM, see GWIM on page 50.
Net income for Deposits decreased $170300 million to $1.2 billion917 million in 20112012 compared to 2010 due to a decrease in revenueprimarily driven by lower net interest income, partially offset by a decrease inlower noninterest expense. Revenue ofNet interest income declined$12.7615 million to $7.9 billion was down$873 million from a year ago primarily driven by a decline in service charges reflectingcompressed deposit spreads due to the impact of overdraft policy changes in conjunction with Regulation E that were fully implemented during the third quarter of 2010. This wascontinued low rate environment, partially offset by an increasegrowth in net interest income due todeposit balances, a customer shift to morehigher spread liquid products and continued pricing discipline. Noninterest income of $4.2 billion remained relatively unchanged. Noninterest expense decreased $563191 million, or five percent, to $10.610.4 billion due toas lower litigation and operating expensesFDIC expense was partially offset by an increase in FDIC expense.higher operating and litigation expenses.
Average deposits increased $6.213.2 billion from a year agoto $434.3 billion in 2012 driven by a customer shift to more liquid products in a low interest rate environment as checking, traditional savings and money market savings grew $23.6$23.9 billion. Growth in liquid products was partially offset by a decline in average time deposits of $17.4$10.7 billion. As a result of the shift in the mix of deposits and our continued pricing discipline, ratesthe rate paid on average deposits declined by 16seven bps to 27 bps in 2011 compared to 2010.20 bps.
|
| | | | | | | | | | | |
| | | | | | | |
| (Dollars in millions) | 2011 | | 2010 | | % Change |
| Net interest income (FTE basis) | $ | 11,507 |
| | $ | 14,413 |
| | (20 | )% |
| Noninterest income: | | | | | |
|
| Card income | 6,286 |
| | 7,049 |
| | (11 | ) |
| All other income | 350 |
| | 878 |
| | (60 | ) |
| Total noninterest income | 6,636 |
| | 7,927 |
| | (16 | ) |
| Total revenue, net of interest expense | 18,143 |
| | 22,340 |
| | (19 | ) |
| | | | | | |
| Provision for credit losses | 3,072 |
| | 10,962 |
| | (72 | ) |
| Goodwill impairment | — |
| | 10,400 |
| | n/m |
|
| All other noninterest expense | 6,024 |
| | 5,957 |
| | 1 |
|
| Income (loss) before income taxes | 9,047 |
| | (4,979 | ) | | n/m |
|
| Income tax expense (FTE basis) | 3,259 |
| | 2,001 |
| | 63 |
|
| Net income (loss) | $ | 5,788 |
| | $ | (6,980 | ) | | n/m |
|
| | | | | | | |
| Net interest yield (FTE basis) | 9.04 | % | | 9.85 | % | | |
|
| Return on average allocated equity | 27.40 |
| | n/m |
| | |
|
Return on average economic capital (1) | 55.08 |
| | 23.62 |
| | |
| Efficiency ratio (FTE basis) | 33.20 |
| | 73.22 |
| | |
|
| Efficiency ratio, excluding goodwill impairment charge (FTE basis) | 33.20 |
| | 26.66 |
| | |
|
| | | | | | | |
| Balance Sheet | | |
| | |
| | |
|
| | | | | | | |
| Average | |
| | |
| | |
|
| Total loans and leases | $ | 126,084 |
| | $ | 145,081 |
| | (13 | ) |
| Total earning assets | 127,259 |
| | 146,304 |
| | (13 | ) |
| Total assets | 130,266 |
| | 150,672 |
| | (14 | ) |
| Allocated equity | 21,128 |
| | 32,418 |
| | (35 | ) |
Economic capital (1) | 10,539 |
| | 14,774 |
| | (29 | ) |
| | | | | | | |
| Year end | |
| | |
| | |
|
| Total loans and leases | $ | 120,669 |
| | $ | 137,024 |
| | (12 | ) |
| Total earning assets | 121,992 |
| | 138,072 |
| | (12 | ) |
| Total assets | 127,636 |
| | 138,491 |
| | (8 | ) |
|
| | | | | | | |
| | | | |
| Key Statistics | | | |
| | | | |
| | 2012 | | 2011 |
Total deposit spreads (excludes noninterest costs) (1) | 1.81 | % | | 2.12 | % |
| | | | |
| Year end | | | |
| Client brokerage assets (in millions) | $ | 75,946 |
| | $ | 66,576 |
|
| Online banking active accounts (units in thousands) | 29,638 |
| | 29,870 |
|
| Mobile banking active accounts (units in thousands) | 12,013 |
| | 9,166 |
|
| Banking centers | 5,478 |
| | 5,702 |
|
| ATMs | 16,347 |
| | 17,756 |
|
| |
(1) | Return on average economic capitalTotal deposit spreads include the Deposits and economic capital are non-GAAP financial measures. For additional information on these measures, see Supplemental Financial Data on page 38 and for corresponding reconciliations to GAAP financial measures, see Statistical Table XVI.
Business Banking businesses. |
n/m = not meaningful
Mobile banking customers increased2.8 million in 2012 reflecting a change in our customers’ banking preferences. The number of banking centers declined224 and ATMs declined1,409 as we continue to improve our cost-to-serve and optimize our consumer banking network.
Card Services
Card Services is one of the leading issuers of credit and debit cards in the U.S. to consumers and small businesses providing a broad offering of lending products including co-branded and affinity products. During 2011, we sold our Canadian consumer card business and we are evaluating our remaining international consumer card operations. In light of these actions, the international consumer card business results were moved to All Other, prior period results have been reclassified and the Global Card Services business segment was renamed Card Services.
During 2010 and 2011, Card Services was negatively impacted by provisions of the CARD Act. The majority of the provisions of the CARD Act became effective on February 22, 2010, while certain provisions became effective in the third quarter of 2010. The CARD Act has negatively impactedU.S. In addition to earning net interest income due to restrictionsspread revenue on our ability to repriceits lending activities, Card Services generates interchange revenue from credit cards based on risk and card income due to restrictions imposed on certain fees.
On June 29, 2011, the Federal Reserve adopted a final rule with respect to the Durbin Amendment, effective October 1, 2011, that established the maximum allowable interchange fees a bank can receive for a debit card transaction. The Federal Reserve also adopted a rule to allow a debittransactions as well as annual credit card issuer to recover one cent per transaction for fraud prevention purposes if the issuer complies with certain fraud-related requirements, with which we are currently in compliance. In addition, the Federal Reserve approved rules governing routingfees and exclusivity, requiring issuers to offer two
unaffiliated networks for routing transactions on each debit or prepaid product, which are effective April 1, 2012. For more information on the final interchange rules, see Regulatory Matters on page 66. The new interchange fee rules resulted in a reduction of debit card revenue in the fourth quarter of 2011 of $430 million.other miscellaneous fees.
Net income for Card Services increaseddecreased $12.81.8 billion to $5.84.1 billion in 20112012 primarily due to the $10.4 billion goodwill impairment charge in 2010, and a $7.9 billiondecrease in the provision for credit losses in 2011. This was partially offsetdriven by a decrease in revenue of $4.2 billion, or 19 percent, to $18.1 billionand an increase in 2011 compared to 2010.
the provision for credit losses, partially offset by lower noninterest expense. Net interest income decreased $2.91.5 billion, or 20 percent, to $11.510.0 billion in 2011 compared to 2010 driven by lower average loan balances and yields. The net interest yield decreased 8111 bps to 9.048.93 percent due to charge-offs and paydowns of higher interest rate products. Noninterest income decreased $1.31.4 billion, or 16 percent, to $6.65.2 billion in 2011 compared to 2010primarily due to the implementationlower interchange fees as a result of implementing the Durbin Amendment, lower gains on October 1, 2011, the gain on the salesales of our MasterCard position in 2010portfolios and the implementationimpact of the CARD Act in 2010.charges related to our consumer protection products.
The provision for credit losses decreasedincreased $7.9 billion380 million to $3.13.5 billion in 20112012 compared to 2010 reflecting improving delinquencies and collections, and fewer bankruptcies as a result of improving economic conditions, and lower loan balances.portfolio trends stabilized during 2012. For more information, on the provision for credit losses, see Provision for Credit Losses on page 108109. Noninterest expense decreased$465 million to $5.5 billion primarily due to lower personnel and operating expenses.
Average loans decreased$14.4 billion to $111.6 billion in 2012 driven by the impact of portfolio sales, charge-offs and continued run-off of non-core portfolios.
|
| | | | | | | |
| | | | |
| Key Statistics | | | |
| | | | |
| (Dollars in millions) | 2012 | | 2011 |
| U.S. credit card | | | |
| Gross interest yield | 10.02 | % | | 10.25 | % |
| Risk-adjusted margin | 7.54 |
| | 5.81 |
|
| New accounts (in thousands) | 3,258 |
| | 3,035 |
|
| Purchase volumes | $ | 193,500 |
| | $ | 192,358 |
|
| Debit card purchase volumes | 258,363 |
| | 250,545 |
|
During 2012, the U.S. credit card risk-adjusted margin increased173 bps due to a decrease in net charge-offs driven by an improvement in credit quality. U.S. credit card new accounts grew by approximately 223,000 accounts to 3.3 million. During 2012, U.S. credit card purchase volumes increased$1.1 billion to $193.5 billion reflecting higher levels of consumer spending, partially offset by the impact of portfolio sales. Debit card purchase volumes increased$7.8 billion to $258.4 billion reflecting higher levels of consumer spending.
|
| | |
| | | Bank of America 2012 4139 |
The return on average economicBusiness Banking
Business Banking provides a wide range of lending-related products and services, integrated working capital increased duemanagement and treasury solutions to higher netclients through our network of offices and client relationship teams along with various product partners. Our clients include U.S.-based companies generally with annual sales of $1 million to $50 million. Our lending products and services include commercial loans, lines of credit and real estate lending. Our capital management and treasury solutions include treasury management, foreign exchange and short-term investing options. Business Banking also includes the results of our merchant services joint venture.
Net income and a decrease in average economic capital. Average economic capitalfor Business Banking decreased 29 percent$76 million due to $343 million in 2012 primarily driven by lower levels ofrevenue and an increase in the provision for credit risk from a decline inlosses, largely offset by lower
noninterest expense. Net interest income decreased$183 million to $1.2 billion driven by lower average loan balances as well as an improvement in credit quality. Average allocated equity balances. Noninterest income decreased$172 million to $492 million primarily due to the transfer of certain processing activities to our merchant services joint venture in 2012. The provision for credit losses increased$36 million to $10.4 billion281 million goodwill impairment chargeprimarily driven by a slower pace of improvement in credit quality than in the prior year. Noninterest expense 2010decreased$270 million as well as the same reasons as the decrease in economicto
capital. For more information regarding economic capital$888 million driven by lower FDIC and allocated equity, see Supplemental Financial Data on page 38.merchant processing expenses.
Average loans decreased $19.03.1 billion, or to 13 percent$23.8 billion, in 20112012 compared to 2010primarily driven by the net transfer of certain loans to other businesses, higher payments, charge-offs,prepayments and continued run-off of non-core portfoliosportfolios. Average deposits increased$2.2 billion to $42.8 billion in 2012 due to the current client preference for liquidity and the impactnet transfer of portfolio divestitures during 2011.certain deposits from other businesses.
|
| | |
4240 Bank of America 20112012
| | |
Consumer Real Estate Services
| | | | | | | | | | | | | | | | | | | | | | | |
| | | 2011 | | | | |
| Home Loans | | Legacy Assets & Servicing | | Total Consumer Real Estate Services | | |
| (Dollars in millions) | (Dollars in millions) | Home Loans | | Legacy Asset Servicing | | Other | | Total Consumer Real Estate Services | | 2010 | | % Change | (Dollars in millions) | 2012 | 2011 | | 2012 | 2011 | | 2012 | 2011 | | % Change |
| Net interest income (FTE basis) | Net interest income (FTE basis) | $ | 1,964 |
| | $ | 1,324 |
| | $ | (81 | ) | | $ | 3,207 |
| | $ | 4,662 |
| | (31 | )% | Net interest income (FTE basis) | $ | 1,361 |
| $ | 1,828 |
| | $ | 1,598 |
| $ | 1,379 |
| | $ | 2,959 |
| $ | 3,207 |
| | (8 | )% |
| Noninterest income: | Noninterest income: | | | | | | | | | | | | Noninterest income: | | | | | | | |
| Mortgage banking income (loss) | Mortgage banking income (loss) | 3,330 |
| | (12,176 | ) | | 653 |
| | (8,193 | ) | | 3,164 |
| | n/m |
| Mortgage banking income (loss) | 3,284 |
| 2,312 |
| | 2,247 |
| (10,505 | ) | | 5,531 |
| (8,193 | ) | | (168 | ) |
| Insurance income | Insurance income | 750 |
| | — |
| | — |
| | 750 |
| | 2,061 |
| | (64 | ) | Insurance income | 6 |
| 750 |
| | — |
| — |
| | 6 |
| 750 |
| | (99 | ) |
| All other income | 959 |
| | 123 |
| | — |
| | 1,082 |
| | 442 |
| | 145 |
| |
| All other income (loss) | | All other income (loss) | (5 | ) | 971 |
| | 268 |
| 111 |
| | 263 |
| 1,082 |
| | (76 | ) |
| Total noninterest income (loss) | Total noninterest income (loss) | 5,039 |
| | (12,053 | ) | | 653 |
| | (6,361 | ) | | 5,667 |
| | n/m |
| Total noninterest income (loss) | 3,285 |
| 4,033 |
| | 2,515 |
| (10,394 | ) | | 5,800 |
| (6,361 | ) | | (191 | ) |
| Total revenue, net of interest expense | 7,003 |
| | (10,729 | ) | | 572 |
| | (3,154 | ) | | 10,329 |
| | n/m |
| |
| Total revenue, net of interest expense (FTE basis) | | Total revenue, net of interest expense (FTE basis) | 4,646 |
| 5,861 |
| | 4,113 |
| (9,015 | ) | | 8,759 |
| (3,154 | ) | | n/m |
|
| | | | | | | | | | | | | | | | | | | | | |
| Provision for credit losses | Provision for credit losses | 234 |
| | 4,290 |
| | — |
| | 4,524 |
| | 8,490 |
| | (47 | ) | Provision for credit losses | 72 |
| 233 |
| | 1,370 |
| 4,291 |
| | 1,442 |
| 4,524 |
| | (68 | ) |
| Goodwill impairment | Goodwill impairment | — |
| | — |
| | 2,603 |
| | 2,603 |
| | 2,000 |
| | 30 |
| Goodwill impairment | — |
| — |
| | — |
| 2,603 |
| | — |
| 2,603 |
| | (100 | ) |
| All other noninterest expense | All other noninterest expense | 5,649 |
| | 13,642 |
| | (1 | ) | | 19,290 |
| | 12,886 |
| | 50 |
| All other noninterest expense | 3,171 |
| 4,563 |
| | 14,135 |
| 14,625 |
| | 17,306 |
| 19,188 |
| | (10 | ) |
| Income (loss) before income taxes | Income (loss) before income taxes | 1,120 |
| | (28,661 | ) | | (2,030 | ) | | (29,571 | ) | | (13,047 | ) | | 127 |
| Income (loss) before income taxes | 1,403 |
| 1,065 |
| | (11,392 | ) | (30,534 | ) | | (9,989 | ) | (29,469 | ) | | (66 | ) |
| Income tax expense (benefit) (FTE basis) | Income tax expense (benefit) (FTE basis) | 416 |
| | (10,689 | ) | | 231 |
| | (10,042 | ) | | (4,100 | ) | | 145 |
| Income tax expense (benefit) (FTE basis) | 511 |
| 396 |
| | (3,993 | ) | (10,400 | ) | | (3,482 | ) | (10,004 | ) | | (65 | ) |
| Net income (loss) | Net income (loss) | $ | 704 |
| | $ | (17,972 | ) | | $ | (2,261 | ) | | $ | (19,529 | ) | | $ | (8,947 | ) | | 118 |
| Net income (loss) | $ | 892 |
| $ | 669 |
| | $ | (7,399 | ) | $ | (20,134 | ) | | $ | (6,507 | ) | $ | (19,465 | ) | | (67 | ) |
| | | | | | | | | | | | | | | | | | | | | |
| Net interest yield (FTE basis) | Net interest yield (FTE basis) | 2.78 | % | | 1.96 | % | | (0.48 | )% | | 2.07 | % | | 2.52 | % | | | Net interest yield (FTE basis) | 2.41 | % | 2.59 | % | | 2.45 | % | 1.63 | % | | 2.43 | % | 2.07 | % | | |
| Efficiency ratio (FTE basis) | Efficiency ratio (FTE basis) | 80.67 |
| | n/m |
| | n/m |
| | n/m |
| | n/m |
| | | Efficiency ratio (FTE basis) | 68.25 |
| 77.85 |
| | n/m |
| n/m |
| | n/m |
| n/m |
| | |
| | | | | | | | | | | | | | | | | | | | | |
| Balance Sheet | | | | | | | | | | |
| | |
| | | | | | | | |
| | | | | | | | | | | | | | | | | | | | | |
| Average | | | | | | | | | | |
| | |
| | | | | | | | |
| Total loans and leases | Total loans and leases | $ | 54,784 |
| | $ | 65,036 |
| | $ | — |
| | $ | 119,820 |
| | $ | 129,234 |
| | (7 | ) | Total loans and leases | $ | 50,023 |
| $ | 54,663 |
| | $ | 54,731 |
| $ | 65,157 |
| | $ | 104,754 |
| $ | 119,820 |
| | (13 | ) |
| Total earning assets | Total earning assets | 70,612 |
| | 67,518 |
| | 16,760 |
| | 154,890 |
| | 185,344 |
| | (16 | ) | Total earning assets | 56,581 |
| 70,488 |
| | 65,288 |
| 84,402 |
| | 121,869 |
| 154,890 |
| | (21 | ) |
| Total assets | Total assets | 72,785 |
| | 83,140 |
| | 34,442 |
| | 190,367 |
| | 224,994 |
| | (15 | ) | Total assets | 57,550 |
| 71,508 |
| | 89,055 |
| 118,859 |
| | 146,605 |
| 190,367 |
| | (23 | ) |
| Allocated equity | Allocated equity | n/a |
| | n/a |
| | n/a |
| | 16,202 |
| | 26,016 |
| | (38 | ) | Allocated equity | n/a |
| n/a |
| | n/a |
| n/a |
| | 13,687 |
| 16,202 |
| | (16 | ) |
Economic capital (1) | Economic capital (1) | n/a |
| | n/a |
| | n/a |
| | 14,852 |
| | 21,214 |
| | (30 | ) | Economic capital (1) | n/a |
| n/a |
| | n/a |
| n/a |
| | 13,687 |
| 14,852 |
| | (8 | ) |
| | | | | | | | | | | | | | | | | | | | | |
| Year end | | | | | | | | | | |
| | | | | | | | | | |
| Total loans and leases | Total loans and leases | $ | 52,369 |
| | $ | 59,990 |
| | $ | — |
| | $ | 112,359 |
| | $ | 122,933 |
| | (9 | ) | Total loans and leases | $ | 47,742 |
| $ | 52,371 |
| | $ | 48,230 |
| $ | 59,988 |
| | $ | 95,972 |
| $ | 112,359 |
| | (15 | ) |
| Total earning assets | Total earning assets | 58,822 |
| | 63,331 |
| | 10,228 |
| | 132,381 |
| | 172,082 |
| | (23 | ) | Total earning assets | 54,394 |
| 58,819 |
| | 53,892 |
| 73,562 |
| | 108,286 |
| 132,381 |
| | (18 | ) |
| Total assets | Total assets | 61,417 |
| | 79,023 |
| | 23,272 |
| | 163,712 |
| | 212,412 |
| | (23 | ) | Total assets | 55,463 |
| 59,647 |
| | 76,925 |
| 104,065 |
| | 132,388 |
| 163,712 |
| | (19 | ) |
| |
(1)
| Average economic capital is a non-GAAP financial measure. For additional information on these measures, see Supplemental Financial Data on page 38 and for corresponding reconciliations to GAAP financial measures, see Statistical Table XVI.
|
n/m = not meaningful
n/a = not applicable
CRES operations include Home Loans and Legacy Assets & Servicing. Home Loans is responsible for ongoing loan production activities and the CRES was realigned effective January 1, 2011home equity loan portfolio not selected for inclusion in the Legacy Assets & Servicing owned portfolio. Legacy Assets & Servicing is responsible for all of our mortgage servicing activities related to loans serviced for others and its activities are nowloans held by the Corporation, including loans that have been designated as the Legacy Assets & Servicing Portfolios. The Legacy Assets & Servicing Portfolios (both owned and serviced), herein referred to as Home Loans,the Legacy AssetOwned and Legacy Serviced Portfolios, respectively, (together, the Legacy Portfolios), and as further defined below, include those loans that would not have been originated under our underwriting standards as of December 31, 2010. For additional information on our Legacy Portfolios, see page 43. In addition, Legacy Assets & Servicing is responsible for managing legacy exposures related to CRES (e.g., representations and Other.warranties). This realignmentalignment allows CRES management to lead the ongoing home loanHome Loans business while also providing greater focus and transparency on legacy mortgage issues.issues and servicing activities.
CRES, primarily through Home Loans operations, generates revenue by providing an extensive line of consumer real estate products and services to customers nationwide. CRES products offered by Home Loans include fixed- and adjustable-rate first-lien mortgage loans for home purchase and refinancing needs, home equity lines of credit (HELOC)(HELOCs) and home equity loans. First
mortgage products are either sold into the secondary mortgage market to investors, while we generally retain MSRs and the Bank of America customer relationships, or are held on ourthe balance sheet in All Other for ALM purposes. HELOCHome Loans is compensated for loans held for ALM purposes on a management accounting basis with the corresponding offset in All Other. Newly originated HELOCs and home equity loans are retained on the CRES balance sheet. CRES services mortgage loans, including those loans it owns, loans owned by other business segments and All Other, and loans owned by outside investors.
The financial results of the on-balance sheet loans are reported in the business segment that owns the loans or All Other. CRES is not impacted by the Corporation’s first mortgage production retention decisions as CRES is compensated for loans held for
ALM purposes on a management accounting basis, with a corresponding offset recorded in All Other, and for servicing loans owned by other business segments and All Other.Home Loans.
CRES includes the impact of transferring customers and their related loan balances between GWIM and CRES based on client segmentation thresholds.. For more information on the migration of customer balances, see GWIM on page 5250.
CRES Results
The net loss for CRESdecreased$13.0 billion to $6.5 billion for 2012 compared to 2011 primarily driven by mortgage banking income of $5.5 billion in 2012 compared to a loss of $8.2 billion in 2011. Also contributing to the decrease in the net loss was lower provision for credit losses and a decline in noninterest expense, partially offset by lower insurance income and other income. Mortgage banking income increased$13.7 billion due to an $11.7 billiondecrease in representations and warranties provision, and higher servicing income and core production revenue. The provision for credit losses decreased$3.1 billion driven by improved portfolio trends and increasing home prices in
both the non-PCI and PCI home equity loan portfolios. Noninterest expense decreased $4.5 billion primarily due to a decline in litigation expense, the absence of a goodwill impairment charge in 2012 compared to $2.6 billion in 2011, a decline in production and insurance expenses in Home Loans and a reduction in Legacy Assets & Servicing expenses.
Average economic capital decreased eight percent primarily due to a reduction in operational risk driven by the sale of Balboa and a reduction in credit risk. For more information regarding economic capital, see Supplemental Financial Data on page 35.
Home Loans
Home Loans products are available to our customers through our retail network of approximately 5,7005,500 banking centers, mortgage loan officers in approximately 500375 locations and a sales force offering our customers direct telephone and online access to our products. These products were also offered through our correspondent lending channel; however,channel which we exited this channel in late 2011. Inthe second half of 2011 we also exitedand the reverse mortgage origination business. In October 2010,business which we exited in the first mortgage wholesale acquisition channel.half of 2011. These strategic changes were made to allow greater focus on our direct to consumerdirect-to-consumer channels, deepen relationships with existing customers and use mortgage products to acquire new relationships.
Home Loans includesalso included the Balboa insurance operations through June 30, 2011, when the ongoing loaninsurance business was transferred to CBB following the sale of Balboa.
Net income for Home Loans increased $223 million to $892 million primarily driven by a decrease in noninterest expense and lower provision for credit losses, partially offset by a decline in revenue.
The $1.2 billiondecline in revenue was the result of a decrease of $744 million in insurance income as a result of the Balboa sale in 2011 and a $467 milliondecline in net interest income primarily driven by lower LHFS balances due to our exit from the correspondent lending channel and lower home equity balances. In addition, a net gain of $752 million on the sale of Balboa in 2011 contributed to the decline in revenue. These declines were partially offset by an increase of $972 million in mortgage banking income as higher retail margins more than offset lower originations.
The $161 milliondecline in the provision for credit losses was driven by improved portfolio trends and increasing home prices. The $1.4 billiondecline in noninterest expense was primarily due to lower insurance expense as a result of the sale of Balboa, lower production activities, certainexpense driven by lower retail originations and our exit from the correspondent lending channel.
Legacy Assets & Servicing
Legacy Assets & Servicing is responsible for all of our servicing activities related to the residential, home equity and discontinued real estate loan portfolios, including owned loans and loans serviced for others (collectively, the mortgage serviced portfolio). A portion of this portfolio has been designated as the Legacy Serviced Portfolio, which represents 39 percent, 42 percent and 49 percent of the total mortgage serviced portfolio, as measured by unpaid principal balance, at December 31, 2012, 2011 and 2010, respectively.
Legacy Assets & Servicing results reflect the net cost of legacy exposures that are included in the results of CRES, including
representations and warranties provision, litigation costs, financial results of the CREShome equity portfolio not originally selected for inclusion inas part of the Legacy Asset Servicing portfolioOwned Portfolio, the financial results of the servicing operations and the results of MSR activities, including net hedge results. The financial results of the servicing operations reflect certain revenues and expenses on loans serviced for others, including owned loans serviced for Home Loans, .GWIM and All Other.
Servicing activities include collecting cash for principal, interest and escrow payments from borrowers, and disbursing customer draws for lines of credit and accounting for and remitting principal and interest payments to investors and escrow payments to third parties along with responding to non-default related customer inquiries. Home LoansOur home retention efforts, including single point of contact resources, are also included insurance operations through June 30, 2011, whenpart of our servicing activities, along with supervising foreclosures and property dispositions. In an effort to help our customers avoid foreclosure, Legacy Assets & Servicing evaluates various workout options prior to foreclosure sales which, combined with our temporary halt of foreclosures announced in October 2010, has resulted in elongated default timelines. Although we have resumed foreclosure proceedings in all states, there continues to be significant inventory levels in judicial states. For additional information on our servicing activities, including the ongoing insurance business was transferredimpact of foreclosure delays, see Off-Balance Sheet Arrangements and Contractual Obligations – Other Mortgage-related Matters on page 61.
The net loss for Legacy Assets & Servicing decreased $12.7 billion to Card Services$7.4 billion followingdriven by an improvement in mortgage banking income, a decrease in noninterest expense and a decrease in the saleprovision for credit losses. The $12.8 billionincrease in mortgage banking income was primarily due to a decrease of Balboa.$11.7 billion in representations and warranties provision. The 2012 representations and warranties provision of $3.9 billion included $2.5 billion in provision related to the FNMA Settlement and $500 million for obligations to FNMA related to mortgage insurance rescissions. The 2011 representations and warranties provision of $15.6 billion included $8.6 billion in provision and other costs related to the settlement with Bank of New York Mellon (BNY Mellon Settlement) to resolve nearly all of the legacy Countrywide-issued first-lien non-GSE repurchase exposures, and $7.0 billion in provision related to other non-GSE, and to a lesser extent, GSE exposures. The provision for credit losses decreased $2.9 billion due to improved portfolio trends and increasing home prices in both the non-PCI and PCI home equity loan portfolios.
DueNoninterest expense decreased $3.1 billion primarily due to a $3.0 billiondecline in litigation expense, the realignmentabsence of a goodwill impairment charge in 2012 compared to CRES$2.6 billion, in 2011, and $1.0 billionlower mortgage-related assessments, waivers and similar costs related to foreclosure delays. These declines were partially offset by an increase of $2.4 billion in default-related servicing expenses and a $1.1 billion provision for the composition2013 IFR Acceleration Agreement. For more information on the 2013 IFR Acceleration Agreement, see Off-Balance Sheet Arrangements and Contractual Obligations – Servicing Matters and Foreclosure Processes on page 61. The increase in default-related servicing expenses was due to resources needed to implement new servicing standards mandated for the industry, including as part of the Home Loans loan portfolio does not currently reflect a normalized level of credit lossesNational Mortgage Settlement, other operational changes and noninterest expense which we expect will develop over time.costs due to delayed foreclosures.
Legacy Asset ServicingPortfolios
Legacy Asset Servicing is responsible for servicing and managing the exposures related to selected residential mortgage, home equity and discontinued real estate loan portfolios. These selected loan portfolios include owned loans and loans serviced for others, including loans held in other business segments and All Other (collectively, the Legacy Asset Servicing portfolio). The Legacy Asset Servicing portfolio includes residential mortgage loans, home equity loansPortfolios (both owned and discontinued real estateserviced) include those loans that would not have been originated under our underwriting standards at December 31, 2010. Countrywide loans that were impaired at the time of acquisition (theThe Countrywide PCI portfolio)portfolio as well as certain loans that met a pre-defined delinquency status or probability of default threshold as of January 1, 2011 are also included in the Legacy Asset Servicing portfolio.Portfolios. Since determining the pool of loans to be included in the Legacy Asset Servicing portfolioPortfolios as of January 1, 2011, the criteria have not changed for this portfolio. However, the criteria for inclusion of certain assets and liabilities in the Legacy Asset Servicing portfoliothese portfolios, but will continue to be evaluated over time.
Legacy Owned Portfolio
The Legacy Asset Servicing results reflectOwned Portfolio includes those loans that met the net cost of legacy exposures that is included incriteria as described above and are on the results of CRES, including representations and warranties provision, litigation costs, and financial resultsbalance sheet of the CRESCorporation. The home equity loan portfolio selected as partis held on the balance sheet of the Legacy Asset Servicing portfolio. In addition, certain revenues and expenses on loans serviced for others, including loans serviced for other business segments and All Other, are included in Legacy Asset Servicing results. The results ofAssets & Servicing; whereas, the Legacy Asset Servicing residential mortgage and discontinued real estate loan portfolios are recorded primarilyheld on the balance sheet of All Other. The financial results of the on-balance sheet loans are reported in the segment that owns the loans or in All Other.
Our home retention efforts are part of our servicing activities, along with supervising foreclosures and property dispositions. These default-related activities are performed by Legacy Asset Servicing. In an effort to help our customers avoid foreclosure, Legacy Asset Servicing evaluates various workout options prior to foreclosure sales which, combined with our temporary halt of foreclosures announced in October 2010, has resulted in elongated default timelines. For additional information on our servicing activities and foreclosures, see Off-Balance Sheet Arrangements and Contractual Obligations – Other Mortgage-related Matters on page 63
The During 2012, the total owned loans in the Legacy Asset Servicing portfolioOwned Portfolio decreased $15.723.8 billion in 2011 to $154.9131.1 billion at December 31, 20112012, of which $60.048.2 billion arewas reflected on the Legacy Assets & Servicing balance sheet
of Legacy Asset Servicing within CRES and the remainder arewas held on the balance sheet of All Other.
Other
The Other component within CRES includesdecline was primarily related to paydowns and payoffs, but also reflects forgiveness of loans in connection with the results of MSR activities, including net hedge results, together with any related assets or liabilities used as economic hedges. The changeNational Mortgage Settlement, and charge-offs recorded on loans discharged in the value of the MSRs reflects the change in discount rates and prepayment speed assumptions, as well as the effect of changes in other assumptions, including the cost to service. These amounts are not allocated between Home Loans and Legacy Asset Servicing since the MSRs are managed as a single asset.Chapter 7 bankruptcy under new regulatory guidance implemented during 2012. For additionalmore information on MSRs,the National Mortgage Settlement and the new regulatory guidance, see Note 25 – Mortgage Servicing Rightsto the Consolidated Financial Statements. Goodwill assigned to CRES was included in Other; however, the remaining balance of goodwill was written off in its entirety in 2011.
CRES Results
The CRESnet lossincreased$10.6 billion to $19.5 billion in 2011 compared to 2010. Revenue declined$13.5 billion to a loss of$3.2 billion due in large part to a decrease of $11.4 billion in mortgage banking income driven by an increase in representations and warranties provision of $8.8 billion and a decrease in core production income of $3.4 billion in 2011.
The representations and warranties provision in 2011 included $8.6 billion related to the BNY Mellon Settlement and $7.0 billion related to other exposures. For additional information on representations and warranties, see Off-Balance Sheet Arrangements and Contractual Obligations – Representations and WarrantiesConsumer Portfolio Credit Risk Management on page 5680.
Legacy Serviced Portfolio
The Legacy Serviced Portfolio includes the Legacy Owned Portfolio and those loans serviced for outside investors that met the criteria as described above. The following table summarizes the balances of the residential mortgage and discontinued real estate loans included in the Legacy Serviced Portfolio (collectively, the Legacy Residential Mortgage Serviced Portfolio) representing 39 percent, 41 percent and 48 percent of the total residential mortgage serviced portfolio, as measured by unpaid principal balance, of $1.2 trillion, $1.6 trillion and $1.9 trillion at December 31, 2012, 2011 and Note 9 – Representations and Warranties Obligations and Corporate Guaranteesto the Consolidated Financial Statements2010., respectively. Thedecrease in core production income was due to a decline in loan funding volume causedthe Legacy Residential Mortgage Serviced Portfolio was primarily by a drop in market share, which reflected decisionsrelated to price certain loan products in order to align the volume of new loan applications with our underwriting capacity in both the retailservicing transfers, paydowns and correspondent channels and our exit from the correspondent channel in late 2011. Also contributing to the decline in revenue was a $1.3 billiondecrease in insurance income due to the sale of Balboa in 2011 and a decline in net interest income primarily due to lower average LHFS balances. Revenue for 2011 also included a pre-tax gain on the sale of Balboa of $752 million, net of an inter-segment advisory fee.payoffs.
The provision for credit losses decreased$4.0 billion to $4.5 billion in 2011 compared to 2010 driven primarily by improving portfolio trends, including lower reserve additions in the Countrywide PCI home equity portfolio.
Noninterest expense increased$7.0 billion to $21.9 billion in 2011 compared to 2010 primarily due to a $3.6 billionincrease in litigation expense, $1.6 billion higher mortgage-related assessments and waivers costs, higher default-related and other loss mitigation servicing expenses and a non-cash, non-tax deductible goodwill impairment charge of $2.6 billion in 2011 compared to a $2.0 billion goodwill impairment charge in 2010.
In 2011, we recorded $1.8 billion of mortgage-related assessments and waivers costs, which included $1.3 billion for compensatory fees as a result of elongated default timelines. These increases were partially offset by a decrease of $1.1 billion in insurance expense due to the sale of Balboa and a decline of $640 million in production expense primarily due to lower origination volumes.
|
| | | | | | | | | | | | |
| | | | | | | |
Legacy Residential Mortgage Serviced Portfolio, a subset of the Residential Mortgage Serviced Portfolio (1) |
| | | | | | | |
| | | December 31 |
| (Dollars in billions) | | 2012 | | 2011 | | 2010 |
| Unpaid principal balance | | | | | | |
Residential mortgage loans (2) | | | | | | |
| Total | | $ | 467 |
| | $ | 659 |
| | $ | 912 |
|
| 60 days or more past due | | 137 |
| | 235 |
| | 312 |
|
| | | | | | | |
| Number of loans serviced (in thousands) | | | | | | |
Residential mortgage loans (2) | | | | | | |
| Total | | 2,542 |
| | 3,440 |
| | 4,660 |
|
| 60 days or more past due | | 649 |
| | 1,061 |
| | 1,373 |
|
|
| | |
44 Bank of America 2011(1)
| Excludes $57 billion, $84 billion and $99 billion of home equity loans and HELOCs at December 31, 2012, 2011 and 2010, respectively. |
| |
(2) | Includes discontinued real estate loans. |
As discussed above, Legacy Assets & Servicing is responsible for all of Contents
Compensatory fees are fees that we expect to be assessed byour servicing activities. The following table summarizes the government-sponsored enterprises, Fannie Mae (FNMA) and Freddie Mac (FHLMC) (collectively, the GSEs), as a result of foreclosure delays pursuant to first mortgage seller/servicer guides with the GSEs which provide timelines to complete the liquidation of delinquent loans. In instances where we fail to meet these timelines, our agreements provide the GSEs with the option to assess compensatory fees. The remainderbalances of the mortgage-related assessmentsresidential mortgage and waivers costsdiscontinued real estate loans that are out-of-pocket costs that we do not expect to recover. We expect these costs will remain elevated as additional loans are delayedincluded in the foreclosure process. We also expect that continued elevated costs, including costsLegacy Serviced Portfolio (the Non-Legacy Residential Mortgage Serviced Portfolio) representing 61 percent, 59 percent and 52 percent of the total residential mortgage serviced portfolio, as measured by unpaid principal balance, at December 31, 2012, 2011 and 2010, respectively. The decline in the Non-Legacy Residential Mortgage Serviced Portfolio was primarily related to resources necessary to perform the foreclosure process assessmentsservicing transfers, paydowns and to implement other operational changes, will continue.payoffs.
Average economic capital decreased 30 percent due to a reduction in credit risk driven by lower loan balances, and the sale of Balboa. Average allocated equity decreased for the same reasons as economic capital as well as the goodwill impairment charges in 2011 and 2010. For more information regarding economic capital and allocated equity, see Supplemental Financial Data on page 38. |
| | | | | | | | | | | | |
| | | | | | | |
Non-Legacy Residential Mortgage Serviced Portfolio, a subset of the Residential Mortgage Serviced Portfolio (1) |
| | | | | | | |
| | | December 31 |
| (Dollars in billions) | | 2012 | | 2011 | | 2010 |
| Unpaid principal balance | | | | | | |
Residential mortgage loans (2) | | | | | | |
| Total | | $ | 744 |
| | $ | 953 |
| | $ | 977 |
|
| 60 days or more past due | | 22 |
| | 17 |
| | 1 |
|
| | | | | | | |
| Number of loans serviced (in thousands) | | | | | | |
Residential mortgage loans (2) | | | | | | |
| Total | | 4,764 |
| | 5,731 |
| | 5,773 |
|
| 60 days or more past due | | 124 |
| | 95 |
| | — |
|
| |
(1) | Excludes $64 billion, $67 billion and $69 billion of home equity loans and HELOCs at December 31, 2012, 2011 and 2010, respectively. |
| |
(2) | Includes discontinued real estate loans. |
Mortgage Banking Income
CRES mortgage banking income (loss) is categorized into production and servicing income. Core production income is comprised of revenue from the fair value gains and losses recognized on our interest rate lock commitments (IRLCs) and LHFS, the related secondary market execution, and costs related to representations and warranties in the sales transactions along with other obligations incurred in the sales of mortgage loans. In addition, production income includes revenue, which is offset in All Other, for transfers of mortgage loans from CRES to the ALM portfolio related to the Corporation’s mortgage production retention decisions. Ongoing costs related to representations and warranties and other obligations that were incurred in the sales of mortgage loans in prior periods are also included in production income.
Servicing income includes income earned in connection with servicing activities and MSR valuation adjustments, net of economicresults from risk management activities used to hedge activities.certain market risks of the MSRs. The costs associated with our servicing activities are included in noninterest expense.
The table below summarizes the components of mortgage banking income.income (loss).
| | | | | | | | | |
| Mortgage Banking Income | | | | |
| Mortgage Banking Income (Loss) | | | | |
| | | | | | | |
| (Dollars in millions) | 2011 | | 2010 | 2012 | | 2011 |
| Production loss: | |
| | |
| |
| Production income (loss): | | | | |
| Core production revenue | $ | 2,797 |
| | $ | 6,182 |
| $ | 3,730 |
| | $ | 2,797 |
|
| Representations and warranties provision | (15,591 | ) | | (6,785 | ) | (3,939 | ) | | (15,591 | ) |
| Total production loss | (12,794 | ) | | (603 | ) | (209 | ) | | (12,794 | ) |
| Servicing income: | |
| | |
| | | |
| Servicing fees | 5,959 |
| | 6,475 |
| 4,734 |
| | 6,035 |
|
Impact of customer payments (1) | (2,621 | ) | | (3,759 | ) | (1,484 | ) | | (2,621 | ) |
Fair value changes of MSRs, net of economic hedge results (2) | 656 |
| | 376 |
| |
Fair value changes of MSRs, net of risk management activities used to hedge certain market risks (2) | | 1,845 |
| | 655 |
|
| Other servicing-related revenue | 607 |
| | 675 |
| 645 |
| | 532 |
|
| Total net servicing income | 4,601 |
| | 3,767 |
| 5,740 |
| | 4,601 |
|
Total CRES mortgage banking income (loss) | (8,193 | ) | | 3,164 |
| 5,531 |
| | (8,193 | ) |
Eliminations (3) | (637 | ) | | (430 | ) | (781 | ) | | (637 | ) |
| Total consolidated mortgage banking income (loss) | $ | (8,830 | ) | | $ | 2,734 |
| $ | 4,750 |
| | $ | (8,830 | ) |
| |
(1) | Represents the change in the market value of the MSR asset due to the impact of customer payments received during the year. |
| |
(2) | Includes salegains (losses) on sales of MSRs. |
| |
(3) | Includes the effect of transfers of mortgage loans from CRES to the ALM portfolio in All Other. |
CRES first mortgage loan originations declined$80.8 billion, or 58 percent, primarily as a result of our exit from the correspondent lending channel in 2011. CRES retail first mortgage loan originations were $58.5 billion in 2012 compared to $67.8 billion in 2011, excluding correspondent lending, reflecting a drop in estimated retail market share as the overall market for mortgages increased. Our decline in market share was primarily due to our decision to price loan products in order to manage our fulfillment capacity. Core production revenue ofincreased $2.8933 million to $3.7 billion in 2011 decreased$3.4 billionas the impact of our exit from 2010 due primarily to lower new loan origination volumes. The 52 percent decline in new loan originations was caused primarily by a drop in market share, as previously discussed, combined withthe correspondent lending channel and the decline in the overall marketretail originations were more than offset by higher retail margins. On an industry-wide basis margins increased as historically low mortgage rates drove strong consumer demand for mortgages from 2010refinance transactions at a time when most lenders had capacity constraints which, combined with our pricing strategy, contributed to 2011. higher retail margins. In addition, a higher proportion of refinance transactions, particularly Home Affordable Refinance Programs (HARP), contributed to higher margins. During 2012, 84 percent of our first mortgage production volume was for refinance originations and 16 percent was for purchase originations compared to 60 percent and 40 percent in 2011.
The representations and warranties provision increaseddecreased $8.811.7 billion to $15.63.9 billion as described earlier in 2011 due to the BNY Mellon Settlement and other exposures.this section.
Net servicing income increased $834 million1.1 billion to $5.7 billion primarily due to $1.2 billion in 2011 due to a lower impact of customer payments partially offset by lower servicing fees driven by a decline in the servicing portfolio. Improvedimproved MSR results, net of hedges, also contributed and $1.1 billion in reduced impact of customer payments driven by a lower MSR asset, partially offset by a $1.3 billion decrease in servicing fees primarily due to a reduction in the size of the servicing portfolio. For additional information, see Note 24 – Mortgage Servicing Rightsto the increase in net servicing income.Consolidated Financial Statements.
| | | | | | | | | | | |
| Key Statistics | | | | | | | | |
| | | | | | | | | |
| (Dollars in millions, except as noted) | 2011 | | 2010 | | 2012 | | 2011 | |
| Loan production | |
| | |
| | |
| | |
| |
Total Corporation (1): | | | | | |
| First mortgage | | $ | 75,074 |
| | $ | 151,756 |
| |
| First mortgage (excluding correspondent lending) | | 75,074 |
| | 80,300 |
| |
| Home equity | | 3,585 |
| | 4,388 |
| |
| CRES: | |
| | |
| | |
| | |
| |
| First mortgage | $ | 139,273 |
| | $ | 287,236 |
| | $ | 58,518 |
| | $ | 139,273 |
| |
| Home equity | 3,694 |
| | 7,626 |
| | |
Total Corporation (1): | | | | | |
| First mortgage | 151,756 |
| | 298,038 |
| | |
| First mortgage (excluding correspondent lending) | | 58,518 |
| | 67,817 |
| |
| Home equity | 4,388 |
| | 8,437 |
| | 2,832 |
| | 3,694 |
| |
| | | | | | | | | |
| Year end | |
| | |
| | |
| | |
| |
Mortgage servicing portfolio (in billions) (2, 3) | $ | 1,763 |
| | $ | 2,057 |
| | |
Mortgage loans serviced for investors (in billions) (3) | 1,379 |
| | 1,628 |
| | |
Mortgage serviced portfolio (in billions) (2, 3) | | $ | 1,332 |
| | $ | 1,763 |
| |
| Mortgage loans serviced for investors (in billions) | | 1,045 |
| | 1,379 |
| |
| Mortgage servicing rights: | |
| | |
| | |
| | |
| |
| Balance | 7,378 |
| | 14,900 |
| | 5,716 |
| | 7,378 |
| |
Capitalized mortgage servicing rights (% of loans serviced for investors) | 54 |
| bps | 92 |
| bps | 55 |
| bps | 54 |
| bps |
| |
(1) | In addition to loan production in CRES, the remaining first mortgage and home equity loan production is primarily in GWIM. |
| |
(2) | Servicing of residential mortgage loans, home equity lines of credit,HELOCs, home equity loans and discontinued real estate mortgage loans. |
| |
(3) | The total Corporation mortgage servicingserviced portfolio included $1,029 billion in Home Loans and $734 billion in Legacy Asset Servicing at December 31, 2011. The total Corporation mortgage loans serviced for investors included $831 billion in Home Loans and $548 billion in Legacy Asset Servicing at December 31, 2011. 2010 was $2,057 billion. |
FirstRetailfirst mortgage production wasloan originations for the total Corporation were $151.875.1 billion infor 20112012 compared to $298.080.3 billion for 2011,
excluding correspondent lending. The decrease was primarily driven by our decision to price loan products in 2010 with the decrease primarily dueorder to a reduction in both the correspondent and retail sales channels. Additionally, the overall industry market demand for mortgages dropped by approximately 17 percent in 2011,
contributing to the decline in mortgage production. We expectmanage our market share of mortgage originations in 2012 to be lower than our market share in 2011, due to our exit from the correspondent channel.fulfillment capacity.
Home equity production was $4.43.6 billion infor 20112012 compared to $8.44.4 billion infor 20102011 with the decrease primarily due to a decline in reverse mortgage originations based on our decision to exit this business in 2011.
At December 31, 2011, the consumer MSR balance was $7.4 billion, which represented 54 bps of the related unpaid principal balance compared to $14.9 billion or 92 bps of the related unpaid principal balance at December 31, 2010. The decline in the consumer MSR balance was primarily driven by lowerreverse mortgage rates, which resulted in higher forecasted prepayment speeds combined with the impact of elevated expected costs to service delinquent loans, which reduced expected cash flows and the value of the MSRs, and MSR sales. In addition, the MSRs declined as a result of customer payments. These declines were partially offset by adjustments to prepayment models to reflect muted refinancing activity relative to historic norms and by the addition of new MSRs recorded in connection with sales of loans. During 2011, MSRs in the amount of $896 million were sold. Gains recognized on these transactions were not significant. These sales were undertaken to reduce the balance of MSRs, lower our default-related servicing costs and reduce risk in certain portfolios in preparation of the implementation of Basel III. For additional information on Basel III, see Capital Management – Regulatory Capital Changes on page 73 and for information on MSRs and the related hedge instruments, see Mortgage Banking Risk Management on page 119 and Note 25 – Mortgage Servicing Rightsto the Consolidated Financial Statements.business.
|
| | |
4644 Bank of America 20112012
| | |
Global Commercial BankingMortgage Servicing Rights
|
| | | | | | | | | | | |
| | | | | | | |
| (Dollars in millions) | 2011 | | 2010 | | % Change |
| Net interest income (FTE basis) | $ | 7,176 |
| | $ | 8,007 |
| | (10 | )% |
| Noninterest income: | | | | | |
|
| Service charges | 2,264 |
| | 2,340 |
| | (3 | ) |
| All other income | 1,113 |
| | 879 |
| | 27 |
|
| Total noninterest income | 3,377 |
| | 3,219 |
| | 5 |
|
| Total revenue, net of interest expense | 10,553 |
| | 11,226 |
| | (6 | ) |
| | | | | | |
| Provision for credit losses | (634 | ) | | 1,979 |
| | n/m |
|
| Noninterest expense | 4,234 |
| | 4,130 |
| | 3 |
|
| Income before income taxes | 6,953 |
| | 5,117 |
| | 36 |
|
| Income tax expense (FTE basis) | 2,551 |
| | 1,899 |
| | 34 |
|
| Net income | $ | 4,402 |
| | $ | 3,218 |
| | 37 |
|
| | | | | | |
| Net interest yield (FTE basis) | 2.65 | % | | 2.94 | % | | |
|
| Return on average allocated equity | 10.77 |
| | 7.38 |
| | |
|
Return on average economic capital (1) | 21.83 |
| | 14.07 |
| | |
|
| Efficiency ratio (FTE basis) | 40.12 |
| | 36.79 |
| | |
|
| | | | | | |
| Balance Sheet | | |
| | |
| | |
|
| | | | | | |
| Average | |
| | |
| | |
|
| Total loans and leases | $ | 189,415 |
| | $ | 203,824 |
| | (7 | ) |
| Total earning assets | 270,901 |
| | 272,401 |
| | (1 | ) |
| Total assets | 309,044 |
| | 309,326 |
| | — |
|
| Total deposits | 169,192 |
| | 148,638 |
| | 14 |
|
| Allocated equity | 40,867 |
| | 43,590 |
| | (6 | ) |
Economic capital (1) | 20,172 |
| | 22,906 |
| | (12 | ) |
| | | | | | |
| Year end | |
| | |
| | |
|
| Total loans and leases | $ | 188,262 |
| | $ | 194,038 |
| | (3 | ) |
| Total earning assets | 250,882 |
| | 274,624 |
| | (9 | ) |
| Total assets | 289,985 |
| | 312,807 |
| | (7 | ) |
| Total deposits | 176,941 |
| | 161,279 |
| | 10 |
|
| |
(1)
| Return on average economic capital and economic capital are non-GAAP financial measures. For additional information on these measures, see Supplemental Financial Data on page 38 and for corresponding reconciliations to GAAP financial measures, see Statistical Table XVI.
|
n/m = not meaningful
Global Commercial BankingAt provides a wide range of lending-related products and services, integrated working capital management and treasury solutions to clients through our network of offices and client relationship teams along with various product partners. Our clients include business banking and middle-market companies, commercial real estate firms and governments, and are generally defined as companies with annual sales up to $2 billion. Our lending products and services include commercial loans and commitment facilities, real estate lending, asset-based lending and indirect consumer loans. Our capital management and treasury solutions include treasury management, foreign exchange and short-term investing options.Effective in 2011, management responsibility for the merchant services joint venture, Banc of America Merchant Services, LLC, was moved from GBAM to Global Commercial Banking where it more closely aligns with the business model. Prior periods have been reclassified to reflect this change. In 2011, we recorded $1.1 billion of impairment charges on our investment in the joint venture. Because of the recent transfer of the joint venture to Global Commercial BankingDecember 31, 2012, the impairment chargesconsumer MSR balance was $5.7 billion, which represented 55 bps of the related unpaid principal balance compared to $7.4 billion or 54 bps of the related unpaid principal balance at December 31, 2011. The consumer MSR balance decreased$1.7 billion during 2012 primarily driven by lower mortgage rates, which resulted in higher forecasted prepayment speeds and the change in the MSR asset value due to customer payments received during the period. During 2012, the fair value changes of MSRs, net of results from risk management activities used to hedge certain market risks of the MSRs, were recordeda positive $1.8 billion as the positive hedge results more than offset the impact of the market valuation decline on the MSR balance. The hedges outperformed the MSRs due to significant upward price movements in All Other.the MBS market in the later part of 2012. For additional information on our servicing activities, see Off-Balance Sheet Arrangements and Contractual Obligations – Servicing Matters and Foreclosure Processes on page 61. For additional information on MSRs, see Note 524 – SecuritiesMortgage Servicing Rights to the Consolidated Financial Statements.
Sales of Mortgage Servicing Rights
Net incomeOn January 6, 2013, Bank of America entered into definitive agreements with two different counterparties, and on February 19, 2013 with an additional counterparty to sell the servicing rights on certain residential mortgage loans serviced for others, with an aggregate unpaid principal balance of approximately $317 billion. The sales involve approximately 2.1 million loans currently serviced by us, including approximately 234,000 residential mortgage loans and approximately 24,000 home equity loans that were 60 days or more past due at increased$1.2 billion to $4.4 billion in 2011 from 2010 primarily driven by an improvement in the provision for credit losses, offset by lower revenue and higher expenses.
Revenue decreased$673 million primarily driven by lower net interest income related to ALM activities and lower average loan balances, partially offset by an increase in average deposits as clients continue to maintain high levels of liquidity. Noninterest income increased$158 million largely due to a gain on the termination of a purchase contract, an increase in tax credit and commercial card income, and higher investment gains in the commercial real estate portfolio.
The provision for credit losses decreased $2.6 billion to a benefit of $634 million for 2011 compared to 2010December 31, 2012. The transfers of servicing rights are scheduled to occur in stages throughout 2013 with the delinquent loans scheduled to be transferred after the current loans. Currently, we recognize approximately decrease was driven by improved economic conditions and an accelerated rate of loan resolutions in the commercial real estate portfolio.
Noninterest expense increased$104200 million driven primarily by higher FDIC expense.
The returnin servicing revenues per quarter associated with these loans, which is expected to decrease throughout 2013 as we transfer the servicing rights. Over time we expect the impact on average economic capital increased dueearnings to higher net income andbe negligible as we expect expenses to also decrease after we transfer the 12 percent decrease in average economic capital. Economic capital decreased due to declining loan balances and improvements in credit quality. Average allocated equity decreased due to the same reasons as economic capital.servicing rights, especially for loans that are 60 days or more past due. For moreadditional information regarding economic capital and allocated equity,on servicing sales, see Supplemental Financial DataRecent Events– Sale of Mortgage Servicing Rights on page 3826.
|
| | |
| | | Bank of America 2012 4745 |
Global Banking
|
| | | | | | | | | | | |
| | | | | | | |
| (Dollars in millions) | 2012 | | 2011 | | % Change |
| Net interest income (FTE basis) | $ | 9,225 |
| | $ | 9,490 |
| | (3 | )% |
| Noninterest income: | | | | | |
| Service charges | 3,168 |
| | 3,420 |
| | (7 | ) |
| Investment banking fees | 2,787 |
| | 3,061 |
| | (9 | ) |
| All other income | 2,027 |
| | 1,341 |
| | 51 |
|
| Total noninterest income | 7,982 |
| | 7,822 |
| | 2 |
|
| Total revenue, net of interest expense (FTE basis) | 17,207 |
| | 17,312 |
| | (1 | ) |
| | | | | | |
| Provision for credit losses | (103 | ) | | (1,118 | ) | | (91 | ) |
| Noninterest expense | 8,308 |
| | 8,884 |
| | (6 | ) |
| Income before income taxes | 9,002 |
| | 9,546 |
| | (6 | ) |
| Income tax expense (FTE basis) | 3,277 |
| | 3,500 |
| | (6 | ) |
| Net income | $ | 5,725 |
| | $ | 6,046 |
| | (5 | ) |
| | | | | | |
| Net interest yield (FTE basis) | 3.01 | % | | 3.26 | % | | |
| Return on average allocated equity | 12.47 |
| | 12.76 |
| | |
| Return on average economic capital | 27.21 |
| | 26.59 |
| | |
| Efficiency ratio (FTE basis) | 48.28 |
| | 51.31 |
| | |
| | | | | | |
| Balance Sheet | | | | | | |
| | | | | | |
| Average | | | | | |
| Total loans and leases | $ | 272,625 |
| | $ | 265,568 |
| | 3 |
|
| Total earning assets | 306,724 |
| | 290,797 |
| | 5 |
|
| Total assets | 352,969 |
| | 337,337 |
| | 5 |
|
| Total deposits | 249,317 |
| | 237,312 |
| | 5 |
|
| Allocated equity | 45,907 |
| | 47,384 |
| | (3 | ) |
| Economic capital | 21,053 |
| | 22,761 |
| | (8 | ) |
| | | | | | |
| Year end | | | | | |
| Total loans and leases | $ | 288,261 |
| | $ | 278,177 |
| | 4 |
|
| Total earning assets | 315,638 |
| | 301,662 |
| | 5 |
|
| Total assets | 362,797 |
| | 348,773 |
| | 4 |
|
| Total deposits | 269,738 |
| | 246,360 |
| | 9 |
|
Global Banking, which includes Global Corporate and Global Commercial Banking, Revenue
and Investment Banking, provides a wide range of lending-related products and services, integrated working capital management and treasury solutions to clients, and underwriting and advisory services through our network of offices and client relationship teams. Our lending products and services include commercial loans, leases, commitment facilities, trade finance, real estate lending, asset-based lending and direct/indirect consumer loans. Our treasury solutions business includes treasury management, foreign exchange and short-term investing options. We also work with our clients to provide investment banking products such as debt and equity underwriting and distribution, and merger-related and other advisory services. Underwriting debt and equity issuances, fixed-income and equity research, and certain market-based activities are executed through our global broker/dealer affiliates which are our primary dealers in several countries. Within Global Banking, Global Commercial Banking revenue can also be categorized into treasury services revenue primarily from capital clients generally include middle-market companies, commercial real estate firms, auto dealerships, not-for-profit companies, federal and treasury management,state governments, and business lending revenue derived from credit related productsmunicipalities. Global Corporate Banking includes large global corporations, financial institutions and services as shown in the table below. |
| | | | | | | |
| | | | |
| Global Commercial Banking | | | |
| | | | |
| (Dollars in millions) | 2011 | | 2010 |
| Global Treasury Services | $ | 4,854 |
| | $ | 4,741 |
|
| Business Lending | 5,699 |
| | 6,485 |
|
| Total revenue, net of interest expense | $ | 10,553 |
| | $ | 11,226 |
|
| | | | |
| Total average deposits | $ | 169,192 |
| | $ | 148,638 |
|
| Total average loans and leases | 189,415 |
| | 203,824 |
|
Treasury services revenue increased $113 million to $4.9 billion, driven by increased net interest income from the funding benefit of increased deposits, partially offset by lower treasury service charges. As clients manage through current economic conditions, we have seen usage of certain treasury services decline and increased conversion of paper to electronic services. These actions combined with our clients leveraging compensating balances to offset fees have decreased treasury service charges.leasing clients.
Business lending revenueNet income for Global Bankingdecreased $786321 million to $5.7 billion duein 2012 compared to 2011 driven by an increase in the provision for credit losses, partially offset by lower net interest income related to ALM activities and lower loan balances. Average loan and lease balances noninterest expense.
Revenue decreased $14.4105 million in 2012 primarily due to lower investment banking fees, lower net interest income as a result of spread compression and the benefit in the prior year from higher accretion on acquired portfolios, partially offset by the impact of higher average loan and deposit balances and gains from certain legacy portfolios.
The provision for credit losses was a benefit of $103 million in 2012 compared to a benefit of $1.1 billion toin 2011. The $189.41.0 billion reduction in benefit was primarily as a result of stabilization of asset quality, core commercial loan growth and the impact of a higher volume of loan resolutions in the commercial real estate portfolio in the prior year.
Noninterest expense decreased$576 million in 2012 primarily due to lower personnel and operating expenses.
Average loans and leases increased$7.1 billion in 2012 primarily driven by growth in U.S. and non-U.S. commercial and industrial loans in large corporate and middle-market segments, specialized industries and trade finance, partially offset by managed reductions in commercial real estate. Average deposits increased$12.0 billion in 2012 as balances continued to grow from client liquidity, growth in international balances and limited alternative investment options.
The return on average economic capital increased in 2012 as a decrease in average economic capital was partially offset by lowernet paydowns and sales outpaced new originations and renewals.income. Average economic capital decreased primarily due to a reduction in credit risk driven by decreases in reservable
|
| | |
4846 Bank of America 20112012
| | |
Tablecriticized balances and NPAs. For more information regarding economic capital, see Supplemental Financial Data on page 35.
Global Corporate and Global Commercial Banking
Global Corporate and Global Commercial Banking includes Global Treasury Services and Business Lending activities. Global Treasury Services includes deposits, treasury management, credit card,
foreign exchange, short-term investment and custody solutions to corporate and commercial banking clients. Business Lending includes various loan-related products and services including commercial loans, leases, commitment facilities, trade finance, real estate lending, asset-based lending and direct/indirect consumer loans. The table below presents a summary of ContentsGlobal Corporate and Global Commercial Banking results.
|
| | | | | | | | | | | | | | | | | | | | | | | |
| | | | | | | | | | | | |
| Global Corporate and Global Commercial Banking | | | | | | | | | | |
| | | | | | | | | | |
| | Global Corporate Banking | | Global Commercial Banking | | Total |
| (Dollars in millions) | 2012 | | 2011 | | 2012 |
| 2011 | | 2012 | | 2011 |
| Revenue | | | | | | | | | | | |
| Business Lending | $ | 3,202 |
| | $ | 3,240 |
| | $ | 4,585 |
| | $ | 4,996 |
| | $ | 7,787 |
| | $ | 8,236 |
|
| Global Treasury Services | 2,629 |
| | 2,507 |
| | 3,561 |
| | 3,489 |
| | 6,190 |
| | 5,996 |
|
| Total revenue, net of interest expense | $ | 5,831 |
| | $ | 5,747 |
| | $ | 8,146 |
| | $ | 8,485 |
| | $ | 13,977 |
| | $ | 14,232 |
|
| |
| |
| |
| |
| |
| |
|
| Average | | | | | | | | | | | |
| Total loans and leases | $ | 110,109 |
| | $ | 101,956 |
| | $ | 161,951 |
| | $ | 162,526 |
| | $ | 272,060 |
| | $ | 264,482 |
|
| Total deposits | 114,185 |
| | 108,749 |
| | 135,096 |
| | 128,513 |
| | 249,281 |
| | 237,262 |
|
| | | | | | | | | | | | |
| Year end | | | | | | | | | | | |
| Total loans and leases | $ | 116,234 |
| | $ | 113,978 |
| | $ | 172,018 |
| | $ | 163,256 |
| | $ | 288,252 |
| | $ | 277,234 |
|
| Total deposits | 131,181 |
| | 110,898 |
| | 138,517 |
| | 135,423 |
| | 269,698 |
| | 246,321 |
|
Global Corporate and Global Commercial Banking revenue decreased$255 million to $14.0 billion in 2012 compared to 2011 primarily due to lower revenue in Business Lending that was partially offset by an increase in Global Treasury Services revenue.
Global Treasury Services revenue increased$122 million in Global Corporate Banking and $72 million in Global Commercial Banking in 2012 as growth in U.S. and non-U.S. deposit balances and higher service charges offset the impact of the low rate environment.
Business Lending revenue in Global Corporate Banking remained relatively unchanged in 2012 compared to 2011 as lower net interest income impacted by the low rate environment and lower accretion on acquired portfolios was offset by growth in the loan portfolio and gains on fair value option loans. Business Lending revenue decreased$411 million in Global Commercial Banking as managed reductions of commercial real estate criticized assets, run-off of a liquidating auto loan portfolio and lower accretion on acquired portfolios were partially offset by increases in the commercial and industrial loan portfolio.
Average loans and leases in Global Corporate and Global Commercial Banking increasedthree percent in 2012 driven by growth in U.S. and non-U.S. commercial and industrial loans from greater client demand, partially offset by managed reductions of commercial real estate criticized assets and run-off of a liquidating auto loan portfolio. Average deposits in Global Corporate and Global Commercial Banking increasedfive percent in 2012 compared to 2011 as balances continued to grow due to client liquidity, international growth and limited alternative investment options.
Investment Banking
Client teams and product specialists underwrite and distribute debt, equity and other loan products, and provide advisory services and tailored risk management solutions. The economics of certain investment banking and underwriting activities are shared primarily between Global Banking &and Global Markets based on the contribution by and involvement of each segment. To provide a complete discussion of our consolidated investment banking fees, the table below presents total Corporation investment banking fees as well as the portion attributable to Global Banking.
|
| | | | | | | | | | | | | | | |
| | | | | | | | |
| Investment Banking Fees | | | | |
| | | | | | |
| | Global Banking | | Total Corporation |
| (Dollars in millions) | 2012 |
| 2011 | | 2012 | | 2011 |
| Products | | | | | | | |
| Advisory | $ | 995 |
| | $ | 1,183 |
| | $ | 1,066 |
| | $ | 1,248 |
|
| Debt issuance | 1,385 |
| | 1,287 |
| | 3,362 |
| | 2,878 |
|
| Equity issuance | 407 |
| | 591 |
| | 1,026 |
| | 1,459 |
|
| Gross investment banking fees | $ | 2,787 |
| | $ | 3,061 |
| | $ | 5,454 |
| | $ | 5,585 |
|
| Self-led | (42 | ) | | (164 | ) | | (155 | ) | | (368 | ) |
| Total investment banking fees | $ | 2,745 |
| | $ | 2,897 |
| | $ | 5,299 |
| | $ | 5,217 |
|
Total Corporation investment banking fees, excluding self-led deals remained relatively unchanged in 2012 compared to 2011 as higher debt issuance fees partially offset lower equity issuance and advisory fees.
Global Markets
| | | | | | | | | | | | | | | |
| (Dollars in millions) | (Dollars in millions) | 2011 | | 2010 | | % Change | (Dollars in millions) | 2012 | | 2011 | | % Change |
| Net interest income (FTE basis) | Net interest income (FTE basis) | $ | 7,401 |
| | $ | 8,000 |
| | (7 | )% | Net interest income (FTE basis) | $ | 3,310 |
| | $ | 3,682 |
| | (10 | )% |
| Noninterest income: | Noninterest income: | | | | | | Noninterest income: | | | | | |
| Service charges | 1,730 |
| | 1,874 |
| | (8 | ) | |
| Investment and brokerage services | Investment and brokerage services | 2,345 |
| | 2,377 |
| | (1 | ) | Investment and brokerage services | 1,820 |
| | 2,249 |
| | (19 | ) |
| Investment banking fees | Investment banking fees | 5,242 |
| | 5,406 |
| | (3 | ) | Investment banking fees | 2,214 |
| | 2,214 |
| | — |
|
| Trading account profits | Trading account profits | 6,573 |
| | 9,689 |
| | (32 | ) | Trading account profits | 5,706 |
| | 6,417 |
| | (11 | ) |
| All other income | All other income | 327 |
| | 603 |
| | (46 | ) | All other income | 469 |
| | 236 |
| | 99 |
|
| Total noninterest income | Total noninterest income | 16,217 |
| | 19,949 |
| | (19 | ) | Total noninterest income | 10,209 |
| | 11,116 |
| | (8 | ) |
| Total revenue, net of interest expense | 23,618 |
| | 27,949 |
| | (15 | ) | |
| Total revenue, net of interest expense (FTE basis) | | Total revenue, net of interest expense (FTE basis) | 13,519 |
| | 14,798 |
| | (9 | ) |
| | | | | | | | | | | | | |
| Provision for credit losses | Provision for credit losses | (296 | ) | | (166 | ) | | 78 |
| Provision for credit losses | 3 |
| | (56 | ) | | n/m |
|
| Noninterest expense | Noninterest expense | 18,179 |
| | 17,535 |
| | 4 |
| Noninterest expense | 10,839 |
| | 12,244 |
| | (11 | ) |
| Income before income taxes | Income before income taxes | 5,735 |
| | 10,580 |
| | (46 | ) | Income before income taxes | 2,677 |
| | 2,610 |
| | 3 |
|
| Income tax expense (FTE basis) | Income tax expense (FTE basis) | 2,768 |
| | 4,283 |
| | (35 | ) | Income tax expense (FTE basis) | 1,623 |
| | 1,622 |
| | — |
|
| Net income | Net income | $ | 2,967 |
| | $ | 6,297 |
| | (53 | ) | Net income | $ | 1,054 |
| | $ | 988 |
| | 7 |
|
| | | | | | | | | | | | | |
| Return on average allocated equity | Return on average allocated equity | 7.97 | % | | 12.58 | % | | |
| Return on average allocated equity | 5.99 | % | | 4.36 | % | | |
Return on average economic capital (1) | 11.22 |
| | 15.82 |
| | |
| |
| Return on average economic capital | | Return on average economic capital | 8.20 |
| | 5.54 |
| | |
| Efficiency ratio (FTE basis) | Efficiency ratio (FTE basis) | 76.97 |
| | 62.74 |
| | |
| Efficiency ratio (FTE basis) | 80.18 |
| | 82.75 |
| | |
| | | | | | | | | | | | | |
| Balance Sheet | | | | | | | | | | | | |
| | | | | | | | | | | | | |
| Average | Average | | | | | |
| Average | | | | | |
Total trading-related assets (2) | $ | 473,861 |
| | $ | 507,830 |
| | (7 | ) | |
| Total loans and leases | 116,075 |
| | 98,593 |
| | 18 |
| |
Total earning assets (2) | 563,870 |
| | 601,084 |
| | (6 | ) | |
Total trading-related assets (1) | | Total trading-related assets (1) | $ | 466,045 |
| | $ | 472,446 |
| | (1 | ) |
Total earning assets (1) | | Total earning assets (1) | 449,660 |
| | 445,574 |
| | 1 |
|
| Total assets | Total assets | 725,177 |
| | 753,844 |
| | (4 | ) | Total assets | 588,459 |
| | 590,474 |
| | — |
|
| Total deposits | 116,088 |
| | 97,858 |
| | 19 |
| |
| Allocated equity | Allocated equity | 37,233 |
| | 50,037 |
| | (26 | ) | Allocated equity | 17,595 |
| | 22,671 |
| | (22 | ) |
Economic capital (1) | 26,583 |
| | 39,931 |
| | (33 | ) | |
| Economic capital | | Economic capital | 12,956 |
| | 18,046 |
| | (28 | ) |
| | | | | | | | | | | | | |
| Year end | Year end | | | | | | Year end | | | | | |
Total trading-related assets (2) | $ | 399,202 |
| | $ | 417,715 |
| | (4 | ) | |
| Total loans and leases | 133,126 |
| | 99,964 |
| | 33 |
| |
Total earning assets (2) | 493,340 |
| | 512,959 |
| | (4 | ) | |
Total trading-related assets (1) | | Total trading-related assets (1) | $ | 465,836 |
| | $ | 397,876 |
| | 17 |
|
Total earning assets (1) | | Total earning assets (1) | 474,335 |
| | 372,894 |
| | 27 |
|
| Total assets | Total assets | 637,754 |
| | 653,737 |
| | (2 | ) | Total assets | 615,297 |
| | 501,867 |
| | 23 |
|
| Total deposits | 122,296 |
| | 109,691 |
| | 11 |
| |
| |
(1) | Return on average economic capital and economic capital are non-GAAP financial measures. For additional information on these measures, see Supplemental Financial Data on page 38 and for corresponding reconciliations to GAAP financial measures, see Statistical Table XVI.
|
| |
(2)
| Trading-related assets includesinclude assets which are not considered earning assets (i.e., derivative assets). |
n/m = not meaningful
GBAMGlobal Markets offers sales and trading services, including research, to institutional clients across fixed-income, credit, currency, commodity and equity businesses. Global Markets product coverage includes securities and derivative products in both the primary and secondary markets. Global Markets provides advisory services,market-making, financing, securities clearing, settlement and custody services globally to our institutional investor clients in support of their investing and trading activities. We also work with our commercial and corporate clients to provide debt and equity underwriting and distribution capabilities, merger-related and other advisory services, and risk management products using interest rate, equity, credit, currency and commodity derivatives, foreign exchange, fixed-income and mortgage-related products. As a result of our market-making activities in these products, we may be required to manage positionsrisk in government securities, equity and equity-linked securities, high-grade and high-yield corporate debt securities, commercial paper, MBS, commodities and asset-backed securities (ABS). Underwriting debtIn addition, the economics of certain investment banking and equity issuances, fixed-income and equity research, and certain market-basedunderwriting activities are executed through our global broker/dealer affiliates which are our primary dealers in several countries.shared primarily between GBAMGlobal Markets isand Global Banking based on the activities performed by each segment. Global Banking originates certain deal-related transactions with our corporate and commercial clients that are executed and distributed by Global Markets. For additional information on investment banking fees on a leader in the global distribution of fixed-income, currency and energy commodity products and derivatives.consolidated basis, see page GBAM47 also has one of the largest equity trading operations in the world and is a leader in the origination.
and distribution of equity and equity-related products. Our corporate banking services provide a wide range of lending-related products and services, integrated working capital management and treasury solutions to clients through our network of offices and client relationship teams along with various product partners. Our corporate clients are generally defined as companies with annual sales greater than $2 billion.
Net income for decreasedGlobal Marketsincreased $3.3 billion66 million to $3.01.1 billion in 2012 compared to 2011. In 2012, net DVA losses were $2.4 billion compared to net DVA gains of $1.0 billion in 2011. Excluding net DVA, net income increased$2.2 billion to $2.6 billion primarily driven by a decline of $4.2 billion inhigher sales and trading revenue. The decrease in sales and trading revenue wasNoninterest expense decreased$1.4 billion to $10.8 billion due to a challenging market environment, partially offset by DVA gains, netreduction in personnel-related expenses, brokerage, clearing and exchange fees, and other operating expenses. The income tax expense in 2012 included a $781 million charge for remeasurement of hedges. In 2011, DVA gains, net of hedges, were $1.0 billioncertain deferred tax assets due to decreases in the U.K. corporate tax rate compared to $262 million in 2010 due to the widening of our credit spreads.
The provision for credit losses decreased$130 million to a benefitsimilar charge of $296774 million in 2011 from a benefit of.
Year-end assets increased$166 million113.4 billion in 20102012 to $615.3 billion at December 31, 2012 largely driven by increased client-facing activity in the positive impactequity business as well as increases in trading-related assets and securities borrowed transactions.
Average economic capital decreased due to a decline in the risk composition of thetrading-related balances. The return on average economic environment on the credit portfolio. Noninterest expensecapital increased$644 million primarily due to higher net income and a decline in average economic capital. For more information regarding economic capital, see Supplemental Financial Data driven primarily by higher costs related to investments in infrastructure.on page 35.
|
| | |
48 Bank of America 2012 | | Bank of America49
|
Income tax expense included a $774 million charge to reduce the carrying value of the deferred tax assets as a result of a reduction in the U.K. corporate income tax rate enacted during 2011 compared to a charge of $388 million for a rate reduction enacted in 2010. For additional information related to the U.K. corporate income tax rate reduction, see Financial Highlights – Income Tax Expense on page 34.
The return on average economic capital decreased due to lower net income partially offset by a 33 percentdecrease in average economic capital due to reductions in credit risk driven by improved risk ratings, lower counterparty credit risk and a decline in market risk-related trading exposures. Average allocated equity decreased due to the same reasons as economic capital. For more information regarding economic capital and allocated equity, see Supplemental Financial Data on page 38.
Sales and trading revenue and investment banking fees may continue to be adversely affected in 2012 by lower client activity and challenging market conditions as a result of, among other things, the European sovereign debt crisis, uncertainty regarding the outcome of the evolving domestic regulatory landscape, our credit ratings and market volatility.
Components of Global Banking & Markets
Sales and Trading Revenue
Sales and trading revenue includes unrealized and realized gains and losses on trading and other assets, net interest income, and fees primarily from commissions on equity securities. The table below and related discussion present total sales and trading revenue, substantially all of which is in Global Markets with the remainder in Global Banking. Sales and trading revenue is segregated into fixed income including(government debt obligations, investment and non-investment grade corporate debt obligations, commercial mortgage-backed securities, residential mortgage-backed securities (RMBS), swapsRMBS and collateralized debt obligations (CDOs);), currencies including interest(interest rate and foreign exchange contracts;contracts), commodities including primarily(primarily futures, forwards, swaps and options;options) and equity income from equity-linked derivatives and cash equity activity.
| | | | | | | | | |
Sales and Trading Revenue (1) | |
Sales and Trading Revenue (1, 2) | | Sales and Trading Revenue (1, 2) |
| | | | | | | |
| (Dollars in millions) | 2011 | | 2010 | 2012 | | 2011 |
| Sales and trading revenue | | | | |
| Fixed income, currencies and commodities | $ | 8,868 |
| | $ | 12,857 |
| $ | 8,812 |
| | $ | 8,897 |
|
| Equity income | 3,968 |
| | 4,155 |
| |
| Equities | | 3,014 |
| | 3,957 |
|
| Total sales and trading revenue | $ | 12,836 |
| | $ | 17,012 |
| $ | 11,826 |
| | $ | 12,854 |
|
| | | | | |
Sales and trading revenue, excluding net DVA (3) | | | | |
| Fixed income, currencies and commodities | | $ | 11,007 |
| | $ | 8,103 |
|
| Equities | | 3,267 |
| | 3,750 |
|
| Total sales and trading revenue, excluding net DVA | | $ | 14,274 |
| | $ | 11,853 |
|
| |
(1) | Includes a FTE adjustmentadjustments of $202219 million and $274204 million for 20112012 and 20102011. For additional information on sales and trading revenue, including sales and trading investment and brokerage services and net interest income, see Note 43 – Derivatives to the Consolidated Financial Statements. |
| |
(2) | Includes Global Banking sales and trading revenue of $521 million and $270 million for 2012 and 2011. |
| |
(3) | Sales and trading revenue, excluding DVA is a non-GAAP financial measure. Net DVA losses included in FICC revenue and equities revenue were $2.2 billion and $253 million in 2012 compared to net DVA gains of $794 million and $207 million in 2011. |
Fixed income,FICC revenue, including net DVA, remained relatively unchanged in 2012 compared to 2011. Excluding net DVA, FICC revenue increased$2.9 billion to $11.0 billion driven by our rates and currencies business as a result of stronger client flows and commodities (FICC)improved positioning, a gain on the sale of an equity investment, an improved global economic climate resulting in tightening of spreads in credit markets as well as higher trading volume reflecting an increase in investor confidence. This was partially offset by our exit from the stand-alone proprietary trading business in June 2011. Equities revenue, including net DVA, decreased$943 million to $3.0 billion. Excluding net DVA, equities revenue decreased $4.0 billion483 million, or 31 percent, to $8.93.3 billion in 2011 compared to 2010 primarily due to lower client activity and continued adverseas equity market conditionsvolumes remained at low levels impacting our mortgage products, credit, and rates and currencies businesses, partially offset by DVA gains, net of hedges. Equity income decreased$187 million, or five percent, to $4.0 billion in 2011 compared to 2010 primarily due to lower equity derivative trading volumes.commissions. Sales and trading revenue included total commissions and brokerage fee revenue of $2.31.8 billion ($2.2 billion from equities and $144 million from FICC) in 20112012 compared to $2.4 billion ($2.2 billion from equities and $148 million from FICC) in 2010.
In conjunction with regulatory reform measures and our initiative to optimize our balance sheet, we exited our stand-alone proprietary trading business as of June 30, 2011, which involved trading activities in a variety of products, including stocks, bonds, currencies and commodities. Proprietary trading revenue was $434 million for the six months ended June 30, 2011 compared
to $1.4 billion for 2010. For additional information on restrictions on proprietary trading, see Regulatory Matters – Limitations on Proprietary Trading on page 66.
Investment Banking Fees
Product specialists within GBAM provide advisory services, and underwrite and distribute debt and equity issuances and other loan products. The table below presents total investment banking fees for GBAM which represent a majority of the Corporation’s total investment banking income, with the remainder reported in GWIM and Global Commercial Banking.
|
| | | | | | | |
| | | | |
Investment Banking Fees (1) |
| | | | |
| (Dollars in millions) | 2011 | | 2010 |
Advisory (2) | $ | 1,246 |
| | $ | 1,018 |
|
| Debt issuance | 2,693 |
| | 3,059 |
|
| Equity issuance | 1,303 |
| | 1,329 |
|
| Total investment banking fees | $ | 5,242 |
| | $ | 5,406 |
|
| |
(1)
| Includes self-led deals of $372 million and $264 million for 2011 and 2010.
|
| |
(2)
| Advisory includes fees on debt and equity advisory services and mergers and acquisitions. |
Investment banking fees decreased$164 million in 2011 compared to 2010 primarily driven by lower debt issuance fees due to challenging market conditions partially offset by higher advisory fees.
Global Corporate Banking
Client relationship teams along with product partners work with our customers to provide a wide range of lending-related products and services, integrated working capital management and treasury solutions through the Corporation’s global network of offices. The table below presents total net revenue, total average deposits, and total average loans and leases for Global Corporate Banking.
|
| | | | | | | |
| | | | |
| Global Corporate Banking |
| | | | |
| (Dollars in millions) | 2011 | | 2010 |
| Global Treasury Services | $ | 2,448 |
| | $ | 2,259 |
|
| Business Lending | 3,092 |
| | 3,272 |
|
| Total revenue, net of interest expense | $ | 5,540 |
| | $ | 5,531 |
|
| | | | |
| Total average deposits | $ | 108,663 |
| | $ | 90,083 |
|
| Total average loans and leases | 97,346 |
| | 81,415 |
|
Global Corporate Banking revenue of $5.5 billion for 2011 remained in line with 2010. Global Treasury Services revenue increased$189 million in 2011 compared to 2010 as growth in U.S. and non-U.S. deposit volumes was partially offset by a challenging rate environment. Business Lending revenues decreased$180 million in 2011 as growth, substantially all from equities in loansboth years. The $429 milliondecrease in commissions and brokerage fee revenue was offset by a declining rate environment and lower accretion on acquired portfoliosprimarily due to the impact of prepayments in prior periods.lower equity market volumes.
Global Corporate Banking average deposits increased21 percent in 2011 compared to 2010 as balances continued to grow due to clients’ excess liquidity and limited alternative investment options. Average loan and lease balances in Global Corporate Banking increased20 percent in 2011 due to growth in the commercial loan and non-U.S. trade finance portfolios driven by continuing international demand and improved domestic momentum.
Collateralized Debt Obligation and Monoline Exposure
CDO vehicles hold diversified pools of fixed-income securities and issue multiple tranches of debt securities including commercial paper, and mezzanine and equity securities. Our CDO-related exposure can be divided into funded and unfunded super senior liquidity commitment exposure and other super senior exposure, including cash positions and derivative contracts. For more information on our CDO positions, see Note 8 – Securitizations and Other Variable Interest Entitiesto the Consolidated Financial Statements. Super senior exposure represents the most senior class of notes that are issued by the CDO vehicles and benefits from the subordination of all other securities issued by the CDO vehicles. In 2011, we recorded losses of $86 million from our CDO-related exposure compared to losses of $573 million in 2010.
At December 31, 2011, our super senior CDO exposure before consideration of insurance, net of write-downs, was $376 million, comprised solely of trading account assets, compared to $2.0 billion, comprised of $1.3 billion in trading account assets and $675 million in AFS debt securities at December 31, 2010. Of our super senior CDO exposure at December 31, 2011, $224 million was hedged and $152 million was unhedged compared to $772 million hedged and $1.2 billion unhedged at December 31, 2010. At December 31, 2011, there were no unrealized losses recorded in accumulated other comprehensive income (OCI) on super senior cash positions and retained positions from liquidated CDOs compared to $466 million at December 31, 2010. The change was the result of sales of ABS CDOs.
With the Merrill Lynch acquisition, we acquired a loan that is collateralized by U.S. super senior ABS CDOs and recorded in All Other. For additional information, see All Other on page 54.
Excluding amounts related to transactions with a single counterparty, which were transferred to other assets as discussed
below, the table below presents our original total notional, mark-to-market receivable and credit valuation adjustment for credit default swaps (CDS) and other positions with monolines. |
| | | | | | | |
| | | | |
| Credit Default Swaps with Monoline Financial Guarantors |
| | | | |
| | December 31 |
| (Dollars in millions) | 2011 | | 2010 |
| Notional | $ | 21,070 |
| | $ | 38,424 |
|
| | | | |
| Mark-to-market or guarantor receivable | $ | 1,766 |
| | $ | 9,201 |
|
| Credit valuation adjustment | (417 | ) | | (5,275 | ) |
| Total | $ | 1,349 |
| | $ | 3,926 |
|
| Credit valuation adjustment % | 24 | % | | 57 | % |
| Gains (losses) | $ | 116 |
| | $ | (24 | ) |
Total monoline exposure, net of credit valuation adjustments, decreased$2.6 billion to $1.3 billion at December 31, 2011 driven by terminated monoline contracts and the reclassification of certain exposures. During 2011, we terminated all of our monoline contracts referencing super senior ABS CDOs and reclassified net monoline exposure with a carrying value of $1.3 billion ($4.7 billion gross receivable less impairment) at December 31, 2011 from derivative assets to other assets because of the inherent default risk. Because these contracts no longer provide a hedge benefit, they are no longer considered derivative trading instruments. This exposure relates to a single counterparty and is recorded at fair value based on current net recovery projections. The net recovery projections take into account the present value of projected payments expected to be received from the counterparty.
|
| | |
| | | Bank of America 2012 5149 |
Global Wealth & Investment Management |
| | | | | | | | | | | |
| | | | | | | |
| (Dollars in millions) | 2011 | | 2010 | | % Change |
| Net interest income (FTE basis) | $ | 6,046 |
| | $ | 5,677 |
| | 6 | % |
| Noninterest income: | |
| | | | |
|
| Investment and brokerage services | 9,310 |
| | 8,660 |
| | 8 |
|
| All other income | 2,020 |
| | 1,952 |
| | 3 |
|
| Total noninterest income | 11,330 |
| | 10,612 |
| | 7 |
|
| Total revenue, net of interest expense | 17,376 |
| | 16,289 |
| | 7 |
|
| | | | | | |
| Provision for credit losses | 398 |
| | 646 |
| | (38 | ) |
| Noninterest expense | 14,395 |
| | 13,227 |
| | 9 |
|
| Income before income taxes | 2,583 |
| | 2,416 |
| | 7 |
|
| Income tax expense (FTE basis) | 948 |
| | 1,076 |
| | (12 | ) |
| Net income | $ | 1,635 |
| | $ | 1,340 |
| | 22 |
|
| | | | | | |
| Net interest yield (FTE basis) | 2.24 | % | | 2.31 | % | | |
|
| Return on average allocated equity | 9.19 |
| | 7.42 |
| | |
|
Return on average economic capital (1) | 23.44 |
| | 19.57 |
| | |
| Efficiency ratio (FTE basis) | 82.84 |
| | 81.20 |
| | |
|
| | | | | | |
| Balance Sheet | | |
| | |
| | |
|
| | | | | | |
| Average | |
| | |
| | |
|
| Total loans and leases | $ | 102,143 |
| | $ | 99,269 |
| | 3 |
|
| Total earning assets | 270,423 |
| | 246,236 |
| | 10 |
|
| Total assets | 290,357 |
| | 267,163 |
| | 9 |
|
| Total deposits | 254,777 |
| | 232,318 |
| | 10 |
|
| Allocated equity | 17,802 |
| | 18,068 |
| | (1 | ) |
Economic capital (1) | 7,106 |
| | 7,290 |
| | (3 | ) |
| | | | | | |
| Year end | |
| | |
| | |
|
| Total loans and leases | $ | 103,459 |
| | $ | 100,724 |
| | 3 |
|
| Total earning assets | 263,347 |
| | 275,260 |
| | (4 | ) |
| Total assets | 283,844 |
| | 296,251 |
| | (4 | ) |
| Total deposits | 253,029 |
| | 257,982 |
| | (2 | ) |
| |
(1)
| Return on average economic capital and economic capital are non-GAAP financial measures. For additional information on these measures, see Supplemental Financial Data on page 38 and for corresponding reconciliations to GAAP financial measures, see Statistical Table XVI.
|
|
| | | | | | | | | | | |
| | | | | | | |
| (Dollars in millions) | 2012 | | 2011 | | % Change |
| Net interest income (FTE basis) | $ | 5,827 |
| | $ | 5,885 |
| | (1 | )% |
| Noninterest income: | | | | | |
| Investment and brokerage services | 8,849 |
| | 8,750 |
| | 1 |
|
| All other income | 1,841 |
| | 1,860 |
| | (1 | ) |
| Total noninterest income | 10,690 |
| | 10,610 |
| | 1 |
|
| Total revenue, net of interest expense (FTE basis) | 16,517 |
| | 16,495 |
| | — |
|
| | | | | | |
| Provision for credit losses | 266 |
| | 398 |
| | (33 | ) |
| Noninterest expense | 12,755 |
| | 13,383 |
| | (5 | ) |
| Income before income taxes | 3,496 |
| | 2,714 |
| | 29 |
|
| Income tax expense (FTE basis) | 1,273 |
| | 996 |
| | 28 |
|
| Net income | $ | 2,223 |
| | $ | 1,718 |
| | 29 |
|
| | | | | | |
| Net interest yield (FTE basis) | 2.34 | % | | 2.26 | % | | |
| Return on average allocated equity | 12.53 |
| | 9.90 |
| | |
| Return on average economic capital | 30.52 |
| | 25.46 |
| | |
| Efficiency ratio (FTE basis) | 77.22 |
| | 81.13 |
| | |
| | | | | | |
| Balance Sheet | | | | | | |
| | | | | | |
| Average | | | | | |
| Total loans and leases | $ | 100,456 |
| | $ | 96,974 |
| | 4 |
|
| Total earning assets | 249,368 |
| | 260,479 |
| | (4 | ) |
| Total assets | 268,490 |
| | 279,815 |
| | (4 | ) |
| Total deposits | 242,384 |
| | 241,535 |
| | — |
|
| Allocated equity | 17,739 |
| | 17,352 |
| | 2 |
|
| Economic capital | 7,359 |
| | 6,866 |
| | 7 |
|
| | | | | | |
| Year end | |
| | |
| | |
|
| Total loans and leases | $ | 105,928 |
| | $ | 98,654 |
| | 7 |
|
| Total earning assets | 277,107 |
| | 253,407 |
| | 9 |
|
| Total assets | 297,330 |
| | 273,106 |
| | 9 |
|
| Total deposits | 266,188 |
| | 240,540 |
| | 11 |
|
GWIM consists of threetwo primary businesses: Merrill Lynch Global Wealth Management (MLGWM); andU.S. Trust, Bank of America Private Wealth Management (U.S. Trust); and Retirement Services.
MLGWM’s advisory business provides a high-touch client experience through a network of more than 17,000 financial advisors focused on clients with over $250,000 in total investable assets. MLGWM provides tailored solutions to meet our clients’ needs through a full set of brokerage, banking and retirement products in both domestic and international locations.products.
U.S. Trust,, together with MLGWM’s Private Banking & Investments Group, provides comprehensive wealth management solutions targeted atto wealthy and ultra-wealthy clients with investable assets of more than $5 million, as well as customized solutions to meet clients’ wealth structuring, investment management, trust and banking needs, including specialty asset management services.
In 2012, the Corporation entered into an agreement to sell the GWIM International Wealth Management (IWM) businesses based outside of the U.S., subject to regulatory approval in multiple jurisdictions, and the first of a series of closings occurred in February 2013. Also, in late 2012, the Corporation sold its investment in a Japanese brokerage joint venture which resulted in a gain of approximately $370 million. The IWM businesses and the Japanese brokerage joint venture had combined client balances of approximately $115 billion. These transactions will not have a significant impact on the Corporation’s balance sheet,
Retirement Servicesresults of operations or capital ratios. As a result of these actions, the results of these businesses were moved to All Other partners with financial advisorsand the prior periods have been reclassified.
Net income increased$505 million to provide institutional$2.2 billion in 2012 compared to 2011 driven by lower noninterest expense and personal retirement solutions including investmentlower provision for credit losses. Revenue was relatively unchanged as higher asset management administration, recordkeepingfees due to long-term assets under management (AUM) flows and custodial serviceshigher market levels were offset by lower transactional revenue and lower net interest income driven by the impact of the continued low rate environment. The provision for 401(k), pension, profit-sharing, equity awardcredit losses decreased$132 million to $266 million driven by lower delinquencies and non-qualified deferred compensation plansimproving portfolio trends within the residential mortgage portfolio. Noninterest expense . Retirement Servicesdecreased$628 million also provides comprehensive investment advisory services to individuals, small$12.8 billion due to large corporationslower FDIC expense, lower litigation costs and pension plans.other expense reductions, partially offset by higher production-related expenses.
In 20112012, revenue from MLGWM was $13.513.8 billion, up eightone percent from 2010 driven by an increase in asset management fees,, due to higher average market levels, and long-term AUM flows, as well as higher net interestnoninterest income. Revenue from U.S. Trust was $2.72.6 billion, which remained relatively unchanged from 2010downfour percent as an increase in asset management fees primarily from higher market levels was partially offset, driven by lower net interest income. Revenue from
The return on average economic capital Retirement Servicesincreased as higher net income offset the increase in average economic capital. Average economic capital was $1.0 billion, up11 percent compared to 2010higher primarily due to higher market levels.loan growth. For more information regarding economic capital, see Supplemental Financial Data on page 35.
|
| | |
5250 Bank of America 20112012
| | |
Migration Summary
GWIM results are impacted by the migration of clients and their related deposit and loan balances to or from DepositsCBB, CRES and the ALM portfolio, as presented in the Migration Summary table.table below. Migration in 2011 included the movement of balances to Merrill Edge, which is included in DepositsCBB. Subsequent to the date of the migration, the associated net interest income, noninterest income and noninterest expense are recorded in the business to which the clients migrated.
| | | | | | | | | |
| Migration Summary | | | | | | |
| | | | | | | |
| (Dollars in millions) | 2011 | | 2010 | 2012 | | 2011 |
| Average | |
| | |
| | | |
Total deposits – GWIM from / (to) Deposits | $ | (2,032 | ) | | $ | 2,486 |
| |
Total deposits – GWIM from / (to) CBB | | $ | 407 |
| | $ | (2,032 | ) |
Total loans – GWIM to CRES and the ALM portfolio | (174 | ) | | (1,405 | ) | (225 | ) | | (174 | ) |
| Year end | |
| | |
| | | |
Total deposits – GWIM from / (to) Deposits | $ | (2,918 | ) | | $ | 4,317 |
| |
Total deposits – GWIM from / (to) CBB | | $ | 1,170 |
| | $ | (2,918 | ) |
Total loans – GWIM to CRES and the ALM portfolio | (299 | ) | | (1,625 | ) | (335 | ) | | (299 | ) |
Net income increased$295 million, or 22 percent, to $1.6 billion in 2011 compared to 2010 driven by higher net interest income, higher asset management fees and lower credit costs, partially offset by higher noninterest expense. Net interest income increased$369 million, or six percent, to $6.0 billion as the impact of higher average deposit balances more than offset the impact of a lower rate environment. Noninterest income increased$718 million, or seven percent, to $11.3 billion primarily due to higher asset management fees driven by higher average market levels in
2011 compared to 2010 and continued long-term AUM flows. The provision for credit losses decreased$248 million, or 38 percent, to $398 million driven by improving portfolio trends. Noninterest expense increased$1.2 billion, or nine percent, to $14.4 billion due to increased volume-driven expenses and personnel costs associated with continued investment in the business.
Client Balances
The table below presents client balances which consist of AUM, client brokerage assets, assets in custody, client deposits, and loans and leases.
| | | | | | | | | |
| Client Balances by Type | | | | | | |
| | | | | | | |
| | December 31 | December 31 |
| (Dollars in millions) | 2011 | | 2010 | 2012 | | 2011 |
| Assets under management | $ | 647,126 |
| | $ | 643,343 |
| $ | 698,095 |
| | $ | 635,570 |
|
| Brokerage assets | 1,024,193 |
| | 1,064,516 |
| 975,388 |
| | 944,532 |
|
| Assets in custody | 107,989 |
| | 114,721 |
| 117,686 |
| | 107,982 |
|
| Deposits | 253,029 |
| | 257,982 |
| 266,188 |
| | 240,540 |
|
Loans and leases | 103,459 |
| | 100,724 |
| 109,305 |
| | 101,844 |
|
| Total client balances | $ | 2,135,796 |
| | $ | 2,181,286 |
| $ | 2,166,662 |
| | $ | 2,030,468 |
|
| |
(1) | Includes margin receivables which are classified in customer and other receivables on the Corporation’s Consolidated Balance Sheet. |
The decreaseincrease of $136.2 billion, or seven percent, in client balances was primarily driven by lower broad basedhigher market levels at December 31, 2011 compared to December 31, 2010 partially offset by clientand inflows particularly into long-term AUM.AUM, as well as increases in deposits and loans.
|
| | |
| | | Bank of America 2012 5351 |
All Other
| | | | | | | | | | | | | | | |
| (Dollars in millions) | (Dollars in millions) | 2011 | | 2010 | | % Change | (Dollars in millions) | 2012 | | 2011 | | % Change |
| Net interest income (FTE basis) | Net interest income (FTE basis) | $ | 1,780 |
| | $ | 3,656 |
| | (51 | )% | Net interest income (FTE basis) | $ | 1,111 |
| | $ | 1,946 |
| | (43 | )% |
| Noninterest income: | Noninterest income: | | | | | |
| Noninterest income: | | | | | |
| Card income | Card income | 465 |
| | 615 |
| | (24 | ) | Card income | 360 |
| | 465 |
| | (23 | ) |
| Equity investment income | Equity investment income | 7,037 |
| | 4,549 |
| | 55 |
| Equity investment income | 1,135 |
| | 7,105 |
| | (84 | ) |
| Gains on sales of debt securities | Gains on sales of debt securities | 3,098 |
| | 2,313 |
| | 34 |
| Gains on sales of debt securities | 1,510 |
| | 3,097 |
| | (51 | ) |
| All other income (loss) | All other income (loss) | 2,821 |
| | (1,438 | ) | | n/m |
| All other income (loss) | (4,906 | ) | | 3,482 |
| | n/m |
|
| Total noninterest income | 13,421 |
| | 6,039 |
| | 122 |
| |
| Total revenue, net of interest expense | 15,201 |
| | 9,695 |
| | 57 |
| |
| Total noninterest income (loss) | | Total noninterest income (loss) | (1,901 | ) | | 14,149 |
| | n/m |
|
| Total revenue, net of interest expense (FTE basis) | | Total revenue, net of interest expense (FTE basis) | (790 | ) | | 16,095 |
| | n/m |
|
| | | | | | | | | | | | | |
| Provision for credit losses | Provision for credit losses | 6,173 |
| | 6,323 |
| | (2 | ) | Provision for credit losses | 2,620 |
| | 6,172 |
| | (58 | ) |
| Goodwill impairment | Goodwill impairment | 581 |
| | — |
| | n/m |
| Goodwill impairment | — |
| | 581 |
| | (100 | ) |
| Merger and restructuring charges | Merger and restructuring charges | 638 |
| | 1,820 |
| | (65 | ) | Merger and restructuring charges | — |
| | 638 |
| | (100 | ) |
| All other noninterest expense | All other noninterest expense | 3,697 |
| | 3,957 |
| | (7 | ) | All other noninterest expense | 6,092 |
| | 5,034 |
| | 21 |
|
| Income (loss) before income taxes | Income (loss) before income taxes | 4,112 |
| | (2,405 | ) | | n/m |
| Income (loss) before income taxes | (9,502 | ) | | 3,670 |
| | n/m |
|
| Income tax benefit (FTE basis) | Income tax benefit (FTE basis) | (879 | ) | | (3,877 | ) | | (77 | ) | Income tax benefit (FTE basis) | (5,874 | ) | | (1,042 | ) | | n/m |
|
| Net income | $ | 4,991 |
| | $ | 1,472 |
| | n/m |
| |
| Net income (loss) | | Net income (loss) | $ | (3,628 | ) | | $ | 4,712 |
| | n/m |
|
| | | | | | | | | | | | | |
| Balance Sheet | | | | |
| | |
| | | | |
| | |
|
| | | | | | | | | | | | | |
| Average | Average | |
| | |
| | |
| Average | |
| | |
| | |
|
| Loans and leases: | Loans and leases: | | | | | | Loans and leases: | | | | | |
| Residential Mortgage | $ | 227,696 |
| | $ | 210,052 |
| | 8 |
| |
| Credit Card | 24,049 |
| | 28,013 |
| | (14 | ) | |
| Residential mortgage | | Residential mortgage | $ | 213,715 |
| | $ | 227,698 |
| | (6 | ) |
| Non-U.S. credit card | | Non-U.S. credit card | 13,549 |
| | 24,049 |
| | (44 | ) |
| Discontinued real estate | Discontinued real estate | 12,106 |
| | 13,830 |
| | (12 | ) | Discontinued real estate | 10,223 |
| | 12,106 |
| | (16 | ) |
| Other | Other | 20,039 |
| | 29,747 |
| | (33 | ) | Other | 20,525 |
| | 25,157 |
| | (18 | ) |
| Total loans and leases | Total loans and leases | 283,890 |
| | 281,642 |
| | 1 |
| Total loans and leases | 258,012 |
| | 289,010 |
| | (11 | ) |
Total assets (1) | Total assets (1) | 205,189 |
| | 293,577 |
| | (30 | ) | Total assets (1) | 302,287 |
| | 380,253 |
| | (21 | ) |
| Total deposits | Total deposits | 49,283 |
| | 67,945 |
| | (27 | ) | Total deposits | 43,083 |
| | 62,582 |
| | (31 | ) |
Allocated equity (2) | Allocated equity (2) | 72,128 |
| | 38,884 |
| | 85 |
| Allocated equity (2) | 87,103 |
| | 72,578 |
| | 20 |
|
| | | | | | | | | | | | | |
| Year end | Year end | |
| | |
| | |
| Year end | |
| | |
| | |
|
| Loans and leases: | Loans and leases: | | | | |
|
| Loans and leases: | | | | |
|
|
| Residential Mortgage | $ | 224,654 |
| | $ | 222,299 |
| | 1 |
| |
| Credit Card | 14,418 |
| | 27,465 |
| | (48 | ) | |
| Residential mortgage | | Residential mortgage | $ | 201,727 |
| | $ | 224,657 |
| | (10 | ) |
| Non-U.S. credit card | | Non-U.S. credit card | 11,697 |
| | 14,418 |
| | (19 | ) |
| Discontinued real estate | Discontinued real estate | 11,095 |
| | 13,108 |
| | (15 | ) | Discontinued real estate | 9,892 |
| | 11,095 |
| | (11 | ) |
| Other | Other | 17,454 |
| | 22,215 |
| | (21 | ) | Other | 17,351 |
| | 22,215 |
| | (22 | ) |
| Total loans and leases | Total loans and leases | 267,621 |
| | 285,087 |
| | (6 | ) | Total loans and leases | 240,667 |
| | 272,385 |
| | (12 | ) |
Total assets (1) | Total assets (1) | 180,435 |
| | 210,257 |
| | (14 | ) | Total assets (1) | 247,284 |
| | 320,491 |
| | (23 | ) |
| Total deposits | Total deposits | 32,870 |
| | 40,142 |
| | (18 | ) | Total deposits | 36,061 |
| | 45,532 |
| | (21 | ) |
| |
(1) | For presentation purposes, in segments where the total of liabilities and equity exceeds assets, which are generally deposit-taking segments, we allocate assets from All Otherto those segments to match liabilities (i.e., deposits) and allocated equity. Such allocated assets were $662.2$520.5 billion and $613.3 billion for 2011 and 2010$496.1 billion for 2012 and 2011, and $531.7554.4 billion and $476.5492.3 billion at December 31, 20112012 and 2010. The allocation can result in total assets of less than total loans and leases in All Other2011. |
| |
(2) | Represents the economic capital assigned to All Other as well as the remaining portion of equity not specifically allocated to the business segments. Allocated equity increased due to excess capital not being assigned to the business segments.disposition of certain assets, as previously disclosed. |
n/m = not meaningful
All Otherconsists of two broad groupings, Equity Investments and Other. Equity Investments includes GPI, Strategic and otherALM activities, equity investments, and Corporate Investments. Other includes liquidating businesses merger and restructuring charges,other. ALM functions such asactivities encompass the whole-loan residential mortgage portfolio and investment securities, interest rate and relatedforeign currency risk management activities including economic hedges andthe residual net interest income allocation, gains/losses on structured liabilities, and the impact of certain allocation methodologies and accounting hedge ineffectiveness. Other also includes certain residential mortgage and discontinued real estate loans that are managed by Legacy Asset Servicing within CRES. During 2011, we sold our Canadian consumer card business and we are evaluating our remaining international consumer card operations. As a result of these actions, we reclassified results from these businesses, including prior periods, from Card Services to All Other. For additional information on the other activities included in All Other, see Note 26 – Business Segment Informationto the Consolidated Financial
Statements.
All Other reported net income of $5.0 billion in 2011 compared to $1.5 billion in 2010 with the increase primarily due to higher noninterest income and lower merger and restructuring charges. Noninterest income increased due to positive fair value adjustments related to our own credit on structured liabilities of $3.3 billion in 2011 compared to $18 million in 2010. Equity investment income increased$2.5 billion as a result of a $6.5 billion gain from the sale of CCB shares (we currently hold approximately one percent of the outstanding common shares) partially offset by $1.1 billion of impairment charges on our merchant services joint venture and a decrease of $1.9 billion in GPI income. A non-cash, non-tax deductible goodwill impairment charge of $581 million was taken during the fourth quarter of 2011 as a result of a change in the estimated value of the European consumer card business. The prior year included $1.2 billion of gains on the sales of certain strategic investments. The provision
for credit losses decreased$150 million to $6.2 billion driven by lower balances due primarily to divestitures; improvements in delinquencies, collections and insolvencies in the non-U.S. credit card portfolio; and continued run-off in the legacy Merrill Lynch commercial portfolio. These increases were largely offset by reserve additions to the Countrywide PCI discontinued real estate and residential mortgage portfolios and higher credit costs related to the non-PCI residential mortgage portfolio due primarily to the continuing decline in home prices.
The income tax benefit was $879 million compared to a benefit of $3.9 billion for 2010. The factors affecting taxes in All Other are discussed more fully in Financial Highlights – Income Tax Expense on page 34.
With the Merrill Lynch acquisition, we acquired a loan that is collateralized by U.S. super senior ABS CDOs, with a current carrying value of $3.1 billion at December 31, 2011, down from $4.2 billion at December 31, 2010 primarily due to paydowns. The loan is recorded in All Other and all scheduled payments on the loan have been received to date. The loan matures in September 2023. For more information on our CDO exposure,ALM activities, see GBAM – Collateralized Debt Obligation and Monoline ExposureInterest Rate Risk Management for Nontrading Activities on page 51117.
The tables below present the components of the equity investments in All Other at December 31, 2011 and 2010, and also a reconciliation to the total consolidated equity investment income for 2011 and 2010.
|
| | | | | | | |
| | | | |
| Equity Investments | | | |
| | | | |
| | December 31 |
| (Dollars in millions) | 2011 | | 2010 |
| Global Principal Investments | $ | 5,627 |
| | $ | 11,640 |
|
| Strategic and other investments | 1,296 |
| | 22,545 |
|
Total equity investments included in All Other | $ | 6,923 |
| | $ | 34,185 |
|
|
| | | | | | | |
| | | | |
| Equity Investment Income | | | |
| | | | |
| (Dollars in millions) | 2011 | | 2010 |
| Global Principal Investments | $ | 392 |
| | $ | 2,299 |
|
| Strategic and other investments | 6,645 |
| | 2,543 |
|
| Corporate Investments | — |
| | (293 | ) |
Total equity investment income included in All Other | 7,037 |
| | 4,549 |
|
| Total equity investment income included in the business segments | 323 |
| | 711 |
|
| Total consolidated equity investment income | $ | 7,360 |
| | $ | 5,260 |
|
Equity investments included in All Otherdecreased$27.3 billion during 2011 consistent with our continued efforts to reduce non-core assets including reducing both higher risk-weighted assets and assets currently deducted, or expected to be deducted under Basel III, from regulatory capital. For more information, see Capital Management – Regulatory Capital Changes on page 73.
GPIinclude Global Principal Investments (GPI) which is comprised of a diversified portfolio of investments in private equity, real estate and other alternative investments. These investments are made either directly in a company or held through a fund with related income
recorded in equity investment income. GPI had unfundedEquity investments also include strategic investments, which include our investment in CCB in which we currently hold approximately one percent of the outstanding common shares, and certain other investments. Otherincludes certain residential mortgage and discontinued real estate loans that are managed by Legacy Assets & Servicing. In 2012, the Corporation entered into an agreement to sell the GWIM IWM businesses based outside of the U.S. and sold its Japanese brokerage joint venture. As a result of these actions, the IWM businesses and the Japanese brokerage joint venture results were moved from GWIM to All Other and the prior periods have been reclassified.
The net loss for All Other of $3.6 billion in 2012 compared to net income of $4.7 billion in 2011 was primarily due to negative fair value adjustments on structured liabilities of $5.1 billion related to the improvement in our credit spreads during 2012 compared to $3.3 billion of positive fair value adjustments in 2011, a $6.0 billiondecrease in equity commitmentsinvestment income and $1.6 billion of $710lower gains on sales of debt securities. Partially offsetting these items were a $3.6 billion reduction in the provision for credit losses, $1.6 billion of net gains resulting from repurchases of certain debt and trust preferred securities in 2012 and a net income tax benefit of $1.7 billion related to the recognition of certain foreign tax credits. Equity investment income decreased as 2011 included a $6.5 billion gain on the sale of a portion of our investment in CCB, an $836 million CCB dividend and $1.4a $377 million gain on the sale of our investment in BlackRock. Partially offsetting these items were an impairment write-down of $1.1 billion on our merchant services joint venture in 2011 and a $370 million gain related to the sale of the Japanese brokerage joint venture in 2012.
The provision for credit losses decreased$3.6 billion to $2.6 billion in 2012 primarily driven by continued improvement in credit quality in the residential mortgage portfolio and reserve reductions in 2012 compared to reserve additions in 2011 in the Countrywide PCI discontinued real estate and residential mortgage portfolios driven by an improved home price outlook.
All other noninterest expense increased$1.1 billion to $6.1 billion due to higher litigation expense primarily related to the costs associated with the settlement of a class action lawsuit during 2012 brought on behalf of investors who purchased or held Bank of America equity securities at the time we announced plans to acquire Merrill Lynch and other litigation, partially offset by a decrease in personnel expense. Excluding litigation expense, all other noninterest expense decreased compared to 2011. There were no merger and restructuring expenses for 2012 compared to $638 million in 2011. A goodwill impairment charge of $581 million was recorded during 2011 as a result of a change in the estimated value of the European consumer card business.
The income tax benefit was $5.9 billion in 2012 compared to a benefit of $1.0 billion in 2011. Included in the income tax benefit for 2012 was a $1.7 billion tax benefit attributable to the excess of foreign tax credits recognized in the U.S. upon repatriation of the earnings of certain subsidiaries over the related U.S. tax liability, and 2011 included the release of a valuation allowance applicable to a Merrill Lynch capital loss carryforward deferred tax asset.
The tables below present the components of equity investments in All Other at December 31, 20112012 and 20102011, and also a reconciliation to the total consolidated equity investment income for 2012 related to certain of these investments. The Corporation has actively reduced these commitments in a series of transactions involving its private equity fund investments.and 2011.
|
| | | | | | | |
| | | | |
| Equity Investments | | | |
| | | | |
| | December 31 |
| (Dollars in millions) | 2012 | | 2011 |
| Global Principal Investments | $ | 3,470 |
| | $ | 5,659 |
|
| Strategic and other investments | 2,038 |
| | 1,439 |
|
Total equity investments included in All Other | $ | 5,508 |
| | $ | 7,098 |
|
|
| | | | | | | |
| | | | |
| Equity Investment Income | | | |
| | | | |
| (Dollars in millions) | 2012 | | 2011 |
| Global Principal Investments | $ | 589 |
| | $ | 399 |
|
| Strategic and other investments | 546 |
| | 6,706 |
|
Total equity investment income included in All Other | 1,135 |
| | 7,105 |
|
| Total equity investment income included in the business segments | 935 |
| | 255 |
|
| Total consolidated equity investment income | $ | 2,070 |
| | $ | 7,360 |
|
Strategic and otherEquity investments included in All Other decreased $21.21.6 billion to $5.5 billion during 20112012. The, with the decrease was primarilydue to sales in the result of the sale of CCB shares and all of our investment in BlackRock during 2011.GPI portfolio. In connection with the sale of our investment in CCB,Corporation’s strategy to reduce risk-weighted assets, we recorded gainssold certain investments, including related commitments. GPI had unfunded equity commitments of $6.5 billion224 million. At at December 31, 2012 compared to $710 million at December 31, 2011. The increase in equity investment income in the business segments for 2012 was primarily driven by gains on the sale of an equity investment in Global Markets.
At December 31, 2012 and 20102011, we owned 2.0 billion shares and 25.6 billion shares representing approximately one percent and 10 percent of CCB. Sales restrictions on the remaining 2.0 billion CCBthese shares continue until August 2013 and accordingly2013. Because the sales restrictions on these shares will expire within one year, these securities are accounted for as AFS marketable equity securities and are carried at cost.fair value with the after-tax unrealized gain reflected in accumulated OCI. As a result, a pre-tax unrealized gain of $718 million, or $452 million after-tax, was reflected in accumulated OCI. At December 31, 2011 and 20102012, the cost basis of our total investment in CCB was $716 million and $9.2 billion, the carrying value was $716 million and $19.7 billion, and the fair value waswere $1.4 billion and $20.8 billion. During 2011, and 2010, we recorded dividends of $836 million and $535 million from CCB. During 2011, we sold 23.6 billion common shares of our remaining ownership interest of approximately 13.6 million preferred shares, or seven percent of BlackRock. In connection with the sale, weinvestment in CCB and recorded a pre-tax gain of $377 million. For more information, see Note 5 – Securitiesto the Consolidated Financial Statements.
During 2011, we recorded $1.16.5 billion of impairment charges on our merchant services joint venture. The joint venture had a carrying value of $3.4 billion and $4.7 billion at December 31, 2011 and 2010 with the reduction in carrying value primarily the result of the impairment charges. The impairment charges were based on the ongoing financial performance of the joint venture and updated forecasts of its long-term financial performance. Because of the recent transfer of the joint venture investment from GBAM to Global Commercial Banking, the impairment charges were recorded in All Other. For additional information, see Note 54 – Securities to the Consolidated Financial Statements.
|
| | |
| | | Bank of America 2012 5553 |
Off-Balance Sheet Arrangements and Contractual Obligations
We have contractual obligations to make future payments on debt and lease agreements. Additionally, in the normal course of business, we enter into contractual arrangements whereby we commit to future purchases of products or services from unaffiliated parties. Obligations that are legally binding agreements whereby we agree to purchase products or services with a specific minimum quantity defined at a fixed, minimum or variable price over a specified period of time are defined as purchase obligations. Included in purchase obligations are commitments to purchase loans of $2.51.3 billion and vendor contracts of $15.723.2 billion. The most significant vendor contracts include communication services, processing services and software contracts. Other long-term liabilities include our contractual funding obligations related to the Qualified Pension Plans, Non-U.S. Pension Plans, Nonqualified and Other Pension Plans, and Postretirement Health and Life Plans (the(collectively, the Plans). Obligations to the Plans are based on the current and projected
obligations of the Plans, performance of the Plans’ assets and any participant contributions, if applicable. During 20112012 and 20102011, we contributed $287381 million and $395287 million to the Plans, and we expect to make at least $337319 million of contributions during 20122013.
Debt, lease, equity and other obligations are more fully discussed in Note 1312 – Long-term Debt and Note 1413 – Commitments and Contingencies to the Consolidated Financial Statements. The Plans are more fully discussed in Note 1918 – Employee Benefit Plans to the Consolidated Financial Statements.
We enter into commitments to extend credit such as loan commitments, standby letters of credit (SBLCs) and commercial letters of credit to meet the financing needs of our customers. For a summary of the total unfunded, or off-balance sheet, credit extension commitment amounts by expiration date, see the table in Note 1413 – Commitments and Contingencies to the Consolidated Financial Statements.
Table 10 presents total long-term debt and otherincludes certain contractual obligations at December 31, 20112012.
| | | | | | | | | | | | | | | | | | | | | | | |
| Table 10 | Long-term Debt and Other Obligations | | | Contractual Obligations | | |
| | | | | | | | | | | | |
| | | | | | | | |
| | | December 31, 2011 | | December 31, 2012 |
| (Dollars in millions) | (Dollars in millions) | Due in One Year or Less | | Due After
One Year Through Three Years | | Due After
Three Years Through Five Years | | Due After Five Years | | Total | (Dollars in millions) | Due in One Year or Less | | Due After
One Year Through Three Years | | Due After
Three Years Through Five Years | | Due After Five Years | | Total |
| Long-term debt and capital leases | Long-term debt and capital leases | $ | 97,415 |
| | $ | 93,625 |
| | $ | 48,539 |
| | $ | 132,686 |
| | $ | 372,265 |
| Long-term debt and capital leases | $ | 55,197 |
| | $ | 73,009 |
| | $ | 63,909 |
| | $ | 83,470 |
| | $ | 275,585 |
|
| Operating lease obligations | Operating lease obligations | 3,008 |
| | 4,573 |
| | 2,903 |
| | 6,117 |
| | 16,601 |
| Operating lease obligations | 2,984 |
| | 4,573 |
| | 3,202 |
| | 6,237 |
| | 16,996 |
|
| Purchase obligations | Purchase obligations | 7,130 |
| | 4,781 |
| | 3,742 |
| | 4,206 |
| | 19,859 |
| Purchase obligations | 6,719 |
| | 8,420 |
| | 5,834 |
| | 4,208 |
| | 25,181 |
|
| Time deposits | Time deposits | 133,907 |
| | 14,228 |
| | 6,094 |
| | 3,197 |
| | 157,426 |
| Time deposits | 110,157 |
| | 11,598 |
| | 2,554 |
| | 2,671 |
| | 126,980 |
|
| Other long-term liabilities | Other long-term liabilities | 768 |
| | 991 |
| | 753 |
| | 1,128 |
| | 3,640 |
| Other long-term liabilities | 898 |
| | 1,037 |
| | 795 |
| | 1,133 |
| | 3,863 |
|
| Total long-term debt and other obligations | $ | 242,228 |
| | $ | 118,198 |
| | $ | 62,031 |
| | $ | 147,334 |
| | $ | 569,791 |
| |
Estimated interest expense on long-term debt and time deposits (1) | | Estimated interest expense on long-term debt and time deposits (1) | 5,703 |
| | 9,260 |
| | 7,894 |
| | 11,647 |
| | 34,504 |
|
| Total contractual obligations | | Total contractual obligations | $ | 181,658 |
| | $ | 107,897 |
| | $ | 84,188 |
| | $ | 109,366 |
| | $ | 483,109 |
|
| |
(1) | Represents estimated, forecasted net interest expense on long-term debt and time deposits. Forecasts are based on the contractual maturity dates of each liability, and are net of derivative hedges. |
Representations and Warranties
We securitize first-lien residential mortgage loans generally in the form of MBS guaranteed by the GSEs or by Government National Mortgage Association (GNMA)GNMA in the case of the FHA-insured,Federal Housing Administration (FHA)-insured, U.S. Department of Veterans Affairs (VA)-guaranteed and Rural Housing Service-guaranteed mortgage loans. In addition, in prior years, legacy companies and certain subsidiaries sold pools of first-lien residential mortgage loans and home equity loans as private-label securitizations (in certain of these securitizations, monolines or financial guarantee providers insured all or some of the securities), or in the form of whole loans. In connection with these transactions, we or certain of our subsidiaries or legacy companies make or have made various representations and warranties. Breaches of these representations and warranties may result in the requirement to repurchase mortgage loans or to otherwise make whole or provide other remedies to the GSEs, U.S. Department of Housing and Urban Development (HUD) with respect to FHA-insured loans, VA, whole-loan buyers,investors, securitization trusts, monoline insurers or other financial guarantors (collectively, repurchases). In all such cases, we would be exposed to any credit loss on the repurchased mortgage loans after accounting for any mortgage insurance (MI) or mortgage guarantyguarantee payments that we may receive.
Subject to the requirements and limitations of the applicable sales and securitization agreements, these representations and warranties can be enforced by the GSEs, HUD, VA, the whole-loan buyer,investor, the securitization trustee or others as governed by the applicable agreement or, in certain first-lien and home equity
securitizations where monoline insurers or other financial guarantee providers have insured all or some of the securities issued, by the monoline insurer or other financial guarantor.guarantor, where the contract so provides. In the case of loans sold to parties other than the GSEs or GNMA, the contractual liability to repurchase typically arises only if there is a breach of the representations and warranties that materially and adversely affects the interest of the investor, or investors, in the loan, or of the monoline insurer or other financial guarantor (as applicable). in the loan. Contracts with the GSEs do not contain equivalent language, while GNMA generally limits repurchases to loans that are not insured or guaranteed as required.
For additional information about accounting for representations and warranties and our representations and warranties repurchase claims and exposures, see Recent Events – Private-label Securitization Settlement with the Bank of New York Mellon, Complex Accounting Estimates – Representations and Warranties, Note 98 – Representations and Warranties Obligations and Corporate Guarantees and Note 1413 – Commitments and Contingencies to the Consolidated Financial Statements and Item 1A. Risk Factors.
Representations and Warranties Bulk Settlement Actions
Beginning in the fourth quarter of 2010, weWe have settled, or entered into agreements to settle, certain bulk representations and warranties claims (1) with a trustee (the Trustee) for certain legacy Countrywide private-label securitization trusts (the BNY Mellon Settlement), a; (2) with two monoline insurerinsurers, Assured Guaranty Ltd. and subsidiaries (the Assured Guaranty Settlement), and Syncora Guarantee Inc. and Syncora Holdings, Ltd. (the Syncora Settlement), (3) with each
of the GSEs (thein 2010 (2010 GSE Agreements). , and (4) with FNMA pursuant to the FNMA Settlement in 2013.
We have vigorously contested any request for repurchase when we conclude that a valid basis for repurchase does not exist and will continue to do so in the future. However, in an effort to resolve these legacy mortgage-related issues, we have reached bulk settlements, or agreements for bulk settlements, including settlement amounts which have been material, with the above-referenced counterparties in lieu of a loan-by-loan review process. We may reach other settlements in the future if opportunities arise on terms we believe to be advantageous. For a summaryHowever, there can be no assurance that we will reach future settlements or, if we do, that the terms of past settlements can be relied upon to predict the larger bulk settlement actions we have taken beginning in 2010 and the related impact on the representations and warranties provision and liability, see Note 9 – Representations and Warranties Obligations and Corporate Guaranteesto the Consolidated Financial Statements. As indicated in Note 9 – Representations and Warranties Obligations and Corporate Guarantees and Note 14 – Commitments and Contingenciesto the Consolidated Financial Statements, theseterms of future settlements. These bulk settlements generally dodid not cover all transactions with the relevant counterparties or all potential claims that may arise, including in some instances securities law, fraud and servicing claims, and our liability in connection with the transactions and claims not covered by these settlements could be material. For a summary of the larger bulk settlement actions taken in the past few years and the related impact on the representations and warranties provision and liability, see
Recent Developments Related Note 8 – Representations and Warranties Obligations and Corporate Guarantees and Note 13 – Commitments and Contingenciesto the Consolidated Financial Statements.
FNMA Settlement and 2010 GSE Agreements
On January 6, 2013, we entered into the FNMA Settlement to resolve substantially all outstanding and potential repurchase and certain other claims relating to the origination, sale and delivery of residential mortgage loans originated and sold directly to FNMA from January 1, 2000 through December 31, 2008 by entities related to legacy Countrywide and BANA.
The FNMA Settlement covers loans with an aggregate original principal balance of approximately $1.4 trillion and an aggregate outstanding principal balance of approximately $300 billion. Unresolved repurchase claims submitted by FNMA for alleged breaches of selling representations and warranties with respect to these loans totaled $12.2 billion of unpaid principal balance at December 31, 2012. The FNMA Settlement extinguished substantially all of those unresolved repurchase claims, as well as substantially all future representations and warranties repurchase claims associated with such loans, subject to certain exceptions which we do not expect to be material.
In January 2013, we made a cash payment to FNMA of $3.6 billion and also repurchased for $6.6 billion certain residential mortgage loans that had previously been sold to FNMA, which we have valued at less than the purchase price.
The FNMA Settlement also clarified the parties’ obligations with respect to MI including establishing timeframes for certain payments and other actions, setting parameters for potential bulk settlements and providing for cooperation in future dealings with mortgage insurers. For additional information, see Open Mortgage Insurance Rescission Notices on page 57.
In addition, we settled substantially all of FNMA’s outstanding and future claims for compensatory fees arising out of past foreclosure delays. For additional information, see Other Mortgage-related Matters – Impact of Foreclosure Delays on page 63.
On December 31, 2010, we entered into the 2010 GSE Agreements, which extinguished certain claims arising out of alleged breaches of selling representations and warranties related to loans sold directly by legacy Countrywide to the GSEs. The FHLMC agreement extinguished all such claims for loans sold to FHLMC through 2008, subject to certain exceptions, while the FNMA agreement substantially resolved the existing pipeline of such claims outstanding as of September 20, 2010.
Monoline Settlements
On July 17, 2012, we entered into a settlement with a monoline insurer, Syncora Guarantee Inc. and Syncora Holdings, Ltd. (Syncora), to resolve all of Syncora’s outstanding and potential claims related to alleged representations and warranties breaches involving eight first- and six second-lien private-label securitization trusts where it provided financial guarantee insurance. The settlement covers private-label securitization trusts that had an original principal balance of first-lien mortgages of approximately $9.6 billion and second-lien mortgages of approximately $7.7 billion. The settlement provided for a cash payment of $375 million to Syncora and other transactions to terminate certain other relationships among the parties.
On April 14, 2011, Bank of America, including our legacy Countrywide affiliates, entered into an agreement with Assured Guaranty Ltd. and subsidiaries (Assured Guaranty), to resolve all of the monoline insurer’s outstanding and potential repurchase claims related to alleged representations and warranties breaches involving 21 first- and eight second-lien RMBS trusts where Assured Guaranty provided financial guarantee insurance.
BNY Mellon Settlement
Under an order entered by the court in connection with theThe BNY Mellon Settlement potentially interested persons hadis subject to final court approval and certain other conditions. On August 10, 2012, the opportunity to give notice of intent to object toCourt issued an order setting a schedule for discovery and other proceedings, and setting May 30, 2013 as the date for the final court hearing on the settlement (including on the basis that more information was needed) until August 30, 2011. Approximately 44 groups or entities appeared prior to the deadline; two of those groups or entities have subsequently withdrawn from the proceeding and one motion to intervene was denied. Certain of these groups or entities filed notices of intent to object, made motions to intervene, or both filed notices of intent to object and made motions to intervene. The parties filing motions to intervene include the Attorneys General of the states of New York and Delaware, whose motions to intervene were granted. Parties who filed notices stating that they wished to obtain more information about the settlement include the FDIC and the Federal Housing Finance Agency.begin. We are not a party to the proceeding.
Certain of the motions to intervene and/or notices of intent to object allege various purported bases for opposition to the settlement, including challenges to the nature of the court proceeding and the lack of an opt-out mechanism, alleged conflicts of interest on the part of the institutional investor group and/or the Trustee, the inadequacy of the settlement amount and the method of allocating the settlement amount among the Covered Trusts, while other motions do not make substantive objections but state that they need more information about the settlement. An investor opposed to the settlement removed the proceeding to federal court. On October 19, 2011, the federal court denied BNY Mellon’s motion to remand the proceeding to state court. BNY Mellon, as well as the investors that have intervened in support of the BNY Mellon Settlement, petitioned to appeal the denial of this motion. On November 4, 2011, the district court entered a written order setting a discovery schedule, and discovery is ongoing. On December 27, 2011, the U.S. Court of Appeals for the Second Circuit accepted the appeal, and stated in an amended scheduling order that, pursuant to statute, it would rule on the appeal by February 27, 2012.
It is not currently possible to predict how many of the parties who have appeared in the court proceeding will ultimately object to the BNY Mellon Settlement, whether the objections will prevent receipt of final court approval or the ultimate outcome of the court approval process, which can include appeals and could take a substantial period of time. In particular, conduct of discovery and the resolution of the objections to the settlement and any appeals could take a substantial period of time and these factors could materially delay the timing of final court approval. Accordingly, it is not possible to predict when the court approval process will be completed.
If final court approval is not obtained by December 31, 2015, we and legacy Countrywide may withdraw from the BNY Mellon Settlement, if the Trustee consents. The BNY Mellon Settlement also provides that if Covered Trusts representingtrusts among the 525 legacy Countrywide first-lien and five second-lien non-GSE securitization trusts (Covered Trusts) holding loans with an unpaid principal balance exceeding a specified amount are excluded from the final BNY Mellon Settlement, based on investor objections or otherwise, we and legacy Countrywide have the option to withdraw from the BNY Mellon Settlement pursuant to the terms of the BNY Mellon Settlement agreement.
It is not currently possible to predict how many parties will ultimately object to the BNY Mellon Settlement, whether the objections will prevent receipt of final court approval or the ultimate outcome of the court approval process, which can include appeals and could take a substantial period of time. In particular, any appeals could take a substantial period of time and these factors could materially delay the timing of final court approval. Accordingly, it is not possible to predict when the court approval process will be completed.
There can be no assurance that final court approval of the BNY Mellon Settlement will be obtained, that all conditions to the BNY Mellon Settlement will be satisfied or, if certain conditions to the BNY Mellon Settlement permitting withdrawal are met, that we and legacy Countrywide will not determine to withdraw from the settlement. If final court approval is not obtained or if we and legacy Countrywide determine to withdraw from the BNY Mellon Settlement in accordance with its terms, our future representations and warranties losses could be substantially different than existing accruals and the estimated range of possible loss over existing accruals described under Off-Balance Sheet Arrangements and Contractual Obligations – Experience with Investors Other than Government-sponsored Enterprises on page 61.accruals. For more information about the risks associated with the BNY Mellon Settlement, see Item 1A. Risk Factors.
Unresolved Claims Status
Unresolved Repurchase Claims
AtPrior to the FNMA Settlement on December 31, 2011January 6, 2013, the total notional amount of our total unresolved representations and warranties repurchase claims werewas approximately $14.3 billion compared to $10.728.3 billion at December 31, 20102012 compared to $12.6 billion at December 31, 2011. These repurchase claims include $1.7 billion in demands from investors in the Covered Trusts received in 2010 but otherwise do not include any repurchase claims related to the Covered Trusts. Unresolved repurchase claims represent the notional amount of repurchase claims made by counterparties, typically the outstanding principal balance or the unpaid principal balance at the time of default. In the case of first-lien mortgages, the claim amount is often significantly greater than the expected loss amount due to the benefit of collateral and, in some cases, MI or mortgage guarantee payments. Claims received from a counterparty remain outstanding until the underlying loan is repurchased, the claim is rescinded by the counterparty or the claim is otherwise resolved. When a claim is denied and we do not receive a response from the counterparty, the claim remains in the unresolved repurchase claims balance until resolution.
The notional amount of unresolved GSE repurchase claims totaled $13.5 billion at December 31, 2012 compared to $6.2 billion at December 31, 2011. As a result of the FNMA Settlement, $12.2 billion of GSE repurchase claims outstanding at December 31, 2012 were resolved in January 2013.
The notional amount of unresolved monoline repurchase claims totaled $2.4 billion at December 31, 2012 compared to $3.1 billion at December 31, 2011. The decrease in unresolved repurchase claims was driven by resolution of claims through the Syncora Settlement. We have had limited loan-level repurchase claims experience with monoline insurers due to ongoing litigation. We have reviewed and declined to repurchase substantially all of the unresolved repurchase claims at December 31, 2012 based on an assessment of whether a breach exists that materially and adversely affected the insurer’s interest in the mortgage loan. Further, in our experience, the monolines have been generally unwilling to withdraw repurchase claims, regardless of whether and what evidence was offered to refute a claim. Substantially all of the unresolved monoline claims pertain to second-lien loans and are currently the subject of litigation.
The notional amount of unresolved repurchase claims from private-label securitization trustees, third-party securitization
sponsors, whole-loan investors and others increased to $12.3 billion at December 31, 2012 compared to $3.3 billion at December 31, 2011. The increase in the notional amount of unresolved repurchase claims is primarily due to increases in the submission of claims by private-label securitization trustees and a third-party securitization sponsor; the level of detail, support and analysis which impacts overall claim quality and, therefore, claims resolution; and the lack of an established process to resolve disputes related to these claims. We anticipated an increase in aggregate non-GSE claims at the time of the BNY Mellon Settlement in June 2011, and such increase in aggregate non-GSE claims was taken into consideration in developing the increase in our representations and warranties liability at that time. We expect unresolved repurchase claims related to private-label securitizations to continue to increase as claims continue to be submitted by private-label securitization trustees and third-party securitization sponsors and there is not an established process for the ultimate resolution of claims on which there is a disagreement.
During 20112012, we received $17.522.4 billion in new repurchase claims, including $14.310.3 billion in new repurchase claimssubmitted by FNMA and covered by the FNMA Settlement, $2.3 billion submitted by the GSEs for both legacy Countrywide originations not covered by the GSE Agreements and legacy Bank of America originations not covered by the 2010 GSE Agreements or the FNMA Settlement, $8.0 billion submitted by private-label securitization trustees, $1.5 billion from whole-loan investors, primarily third-party securitization sponsors, and $3.2 billion295 million in repurchase claims related to non-GSE transactions.submitted by monolines. During 2011,2012, $14.16.6 billion in claims were resolved, primarily with the GSEs and through the Assured GuarantySyncora Settlement. Of the resolved claims, resolved, $7.54.6 billion were resolved through rescissions and $6.62.0 billion were resolved through mortgage repurchaserepurchases and make-whole payments. For more information on repurchase claims received from the GSEs, monoline insurers, private-label securitization trustees, whole-loan investors and others, the resolution of such claims and for a table of unresolved repurchase claims, see Note 8 – Representations and Warranties Obligations and Corporate Guaranteesto the Consolidated Financial Statements.
In addition to the total unresolved repurchase claims, we have received repurchase demands from private-label securitization investors and a master servicer where we believe the claimants have not satisfied the contractual thresholds to direct the securitization trustee to take action and/or that these demands are otherwise procedurally or substantively invalid. The GSEs’ repurchase requests, standards for rescissiontotal amounts outstanding of repurchase requestssuch demands were $1.6 billion and resolution processes have become increasingly inconsistent$1.7 billion at December 31, 2012 and 2011. At December 31, 2011, the $1.7 billion of demands outstanding were related to Covered Trusts in the BNY Mellon Settlement of which $1.4 billion were subsequently resolved through the July 2012 dismissal of a lawsuit brought by Walnut Place (11 entities with the GSEs’ own past conductcommon name Walnut Place, including Walnut Place LLC, and our interpretation of contractual liabilities. These developments have resultedWalnut Place II LLC through Walnut Place XI LLC). Additional demands totaling $1.3 billion were received during 2012. We do not believe that the $1.6 billion in an increase indemands outstanding at December 31, 2012 are valid repurchase claims, outstanding fromand therefore it is not possible to predict the GSEs. Claims outstanding from the monolines declined as a result of the Assured Guaranty Settlement, and new claims from other monolines declined significantly during 2011, which we believe was due in partresolution with respect to the monolines focusing recent efforts towards litigation. Outstanding claims from whole loan, private-labelsuch demands.
|
| | |
56 Bank of America 2012 | | Bank of America57
|
securitization and other investors increased during 2011 primarily as a result of the increase in repurchase claims received from trustees in non-GSE transactions. Generally the volume of unresolved repurchase claims from the FHA and VA for loans in GNMA-guaranteed securities is not significant because the requests are limited in number and are typically resolved quickly. For additional information concerning FHA-insured loans, see Off-Balance Sheet Arrangements and Contractual Obligations – Other Mortgage-related Matters on page 63.Open Mortgage Insurance Rescission Notices
In addition to repurchase claims, we receive notices from mortgage insurance companies of claim denials, cancellations or coverage rescission (collectively, MI rescission notices) and the amountnumber of such notices havehas remained elevated. By way of background, mortgage insurance compensates lenders or investors for certain losses resulting from borrower default on a mortgage loan. When there is disagreement with the mortgage insurer as to the resolution of a MI rescission notice, meaningful dialogue and negotiation between the mortgage insurance company and the Corporation are generally necessary between the parties to reach a conclusionresolution on an individual notice. The level of engagement of the mortgage insurance companies varies and on-goingongoing litigation involving some of the mortgage insurance companies over individual and bulk rescissions or claims for rescission limits our ability to engage in constructive dialogue leading to resolution.
For loans sold to GSEs or private-label securitization trusts (including those wrapped by the monoline bond insurers), when we receive a MI rescission notice from a mortgage insurance company, it may give rise to a claim for breach of the applicable representations and warranties from the GSEs or private-label securitization trusts, depending on the governing salesales contracts. In those cases where the governing contracts contain acontract contains MI-related representationrepresentations and warrantywarranties, which upon rescission requiresrequire us to repurchase the affected loan or indemnify the investor for the related loss, we realize the loss without the benefit of MI. If we are required to repurchaseSee below for a loan or indemnifydiscussion of the investor as a resultimpact of a different breach of representations and warranties and there has been a MI rescission, or if we hold the loan for investment, we realize the loss without the benefit of MI.FNMA Settlement. In addition, mortgage insurance companies have in some cases asserted the ability to curtail MI payments as a result of alleged foreclosure delays, which in these casesif successful, would reduce the MI proceeds available to reduce suchthe loss on the loan. While a legitimate MI rescission may constitute a valid basis for repurchase or other remedies under the GSE agreements and a small number of private-label MBS securitizations, and a MI rescission notice may result in a repurchase request, we believe MI rescission notices in and of themselves are not valid repurchase requests.
At December 31, 20112012, we had approximately 90,000110,000 open MI rescission notices compared to 72,00090,000 at December 31, 20102011. Through, including 49,000 pertaining principally to first-lien mortgages serviced for others, 11,000 pertaining to loans held-for-investment (HFI), and 50,000 pertaining to ongoing litigation for second-lien mortgages. Approximately 27,000 of the open MI rescission notices pertaining to first-lien mortgages serviced for others are related to loans sold to FNMA. As of December 31, 20112012, 2632 percent of the MI rescission notices received have been resolved. Of those resolved, 2420 percent were resolved through our acceptance of the MI rescission, 4658 percent were resolved through reinstatement of coverage or payment of the claim by the mortgage insurance company, and 3022 percent were resolved on an aggregate basis through settlement, policy commutation or similar arrangement. As of December 31, 20112012, 7468 percent of the MI rescission notices we have received have not yet been resolved. Of those not yet resolved, 4846 percent are implicated by ongoing litigation where no loan-level review is currently contemplated (nornor required to preserve our legal rights).rights. In this litigation, the litigating mortgage insurance companies are also seeking bulk rescission of certain policies, separate and apart from loan-by-loan denials or rescissions. We are in the process of reviewing 1137 percent of the remaining open MI rescission notices, and we have reviewed and are contesting the MI rescission with respect to 8963 percent of these remaining open MI rescission notices. Of the remaining open MI rescission notices, 2940 percent
are also the subject of ongoing litigationlitigation; although, at present, these MI rescissions are being processed in a manner generally consistent with those not affected by litigation.
In addition to the discussion above, the FNMA Settlement resolved significant representations and warranties exposures
including unresolved and potential repurchase claims from FNMA resulting solely from MI rescission notices relating to loans covered by the FNMA Settlement. Our pipeline of unresolved repurchase claims from the GSEs resulting solely from MI rescission notices increased to $2.3 billion at December 31, 2012 from $1.2 billion at December 31, 2011. The FNMA Settlement resolved approximately $1.9 billion of such unresolved repurchase claims. In 2011, FNMA issued an announcement requiring servicers to report all MI rescission notices with respect to loans sold to FNMA and confirmed FNMA’s view of its position that a mortgage insurance company’s issuance of a MI rescission notice in and of itself constitutes a breach of the lender’s representations and warranties and permits FNMA to require the lender to repurchase the mortgage loan or promptly remit a make-whole payment covering FNMA’s loss even if the lender is contesting the MI rescission notice. We had informed FNMA that we did not believe that the new policy was valid under our contracts with FNMA. The parties resolved this and other MI-related issues as part of the FNMA Settlement, which clarified the parties’ obligations with respect to MI including establishing timeframes for certain payments and other actions, setting parameters for potential bulk settlements and providing for cooperation in future dealings with mortgage insurers. As a result, we will be required to remit to FNMA the amount of certain MI coverage as a result of MI claims rescissions in advance of collection from the mortgage insurance companies and, in certain cases, we may not ultimately collect all such amounts from the mortgage insurance companies. For additional information, see Note 8 – Representations and Warranties Obligations and Corporate Guaranteesto the Consolidated Financial Statements.
Representations and Warranties Liability
The liability for representations and warranties and corporate guarantees is included in accrued expenses and other liabilities on the Corporation’s Consolidated Balance Sheet and the related provision is included in mortgage banking income (loss). The methodology used toOur estimate of the liability for representations and warranties exposure and the corresponding range of possible loss is based on currently available information, significant judgment and a functionnumber of factors and assumptions that are subject to change. For additional information, see the Estimated Range of Possible Loss section below and Note 8 – Representations and Warranties Obligations and Corporate Guaranteesto the Consolidated Financial Statements and, for information related to the sensitivity of the assumptions used to estimate our liability for obligations under representations and warranties, see Complex Accounting Estimates – Representations and Warranties on page 126.
The liability for obligations under representations and warranties and the corresponding estimated range of possible loss for these representations and warranties exposures do not consider any losses related to litigation matters, including litigation brought by monoline insurers, nor do they include any separate foreclosure costs and related costs, assessments and compensatory fees or any other possible losses related to potential claims for breaches of performance of servicing obligations, except as such losses are included as potential costs of the BNY Mellon Settlement, potential securities law or fraud claims or potential indemnity or other claims against us, including claims related to loans insured by the FHA. We are not able to reasonably estimate the amount of any possible loss with respect to any such servicing, securities law, fraud or other claims against us, except to the extent reflected in the aggregate range of possible
loss for litigation and regulatory matters disclosed in Note 13 – Commitments and Contingenciesto the Consolidated Financial Statements; however, such loss could be material.
At December 31, 2012 and 2011, the liability for representations and warranties and corporate guarantees was $19.0 billion and $15.9 billion. For 2012, the provision for representations and warranties and corporate guarantees was $3.9 billion compared to $15.6 billion for 2011. The provision in 2012 included $2.5 billion in provision related to the FNMA Settlement and $500 million for obligations to FNMA related to MI rescissions. The provision in 2011 included $8.6 billion in provision and other expenses related to the BNY Mellon Settlement to resolve nearly all of the legacy Countrywide-issued first-lien non-GSE repurchase exposures, and $7.0 billion in provision related to other non-GSE, and to a lesser extent, GSE exposures.
Estimated Range of Possible Loss
Our estimated liability at December 31, 2012 for obligations under representations and warranties is necessarily dependent on, and limited by, a number of factors, including for private-label securitizations, the implied repurchase experience based on the BNY Mellon Settlement, as well as certain other assumptions and judgmental factors. Accordingly, future provisions associated with obligations under representations and warranties may be materially impacted if actual experiences are different from historical experience or our understandings, interpretations or assumptions.
In the case of non-GSE exposures, including private-label securitizations, our estimate of the representations and warranties givenliability and the corresponding range of possible loss considers, a variety of factors, which include depending on the counterparty, actual defaults, estimated future defaults, historical loss experience, estimated home prices,among other economic conditions, estimated probability that a repurchase claim will be received, consideration of whether presentation thresholds will be met, number of payments made by the borrower prior to default and estimated probability that a loan will be required to be repurchased as well as other relevant facts and circumstances, such as bulk settlements and identity of the counterparty or type of counterparty, as we believe appropriate. In the case of private-label securitizations, our estimate considers impliedthings, repurchase experience based on the BNY Mellon Settlement, adjusted to reflect differences between the Covered Trusts and the remainder of the population of private-label securitizations, and assumes that the conditions to the BNY Mellon Settlement will be met. Where relevant, we also take into account more recent experience, such as increased claims and other facts and circumstances, such as bulk settlements, as we believe appropriate.
The estimate of the liability for representations and warranties is based on currently available information, significant judgment and a number of factors, including those set forth above, that are subject to change.
At December 31, 2011 and 2010, the liability was $15.9 billion and $5.4 billion. For 2011, the provision for representations and warranties and corporate guarantees was $15.6 billion compared to $6.8 billion in 2010. Of the $15.6 billion provision recorded in 2011, $8.6 billion was attributable to the BNY Mellon Settlement and $7.0 billion was related to other exposures. The BNY Mellon Settlement led to the determination that we had sufficient experience to record a liability related torepresents our exposure on certain other private-label securitizations. This determination combined with higher estimated GSE repurchase rates were the primary drivers of the balance of the provision in 2011. GSE repurchase rates increased driven by higher than expected claims during 2011, including claims on loans that defaulted more than 18 months prior to the repurchase request and on loans where the borrower has made a significant number of payments (e.g., at least 25 payments), in each case in numbers that were not expected based on historical claims. Changes to any one of these factors could significantly impact thebest estimate of the liability and could have a material adverse impact on our results of operations for any particular period.
Estimated Range of Possible Loss
Government-sponsored Enterprises
Our estimated liabilityprobable incurred losses as of December 31, 20112012 for obligations under representations and warranties with respect to GSE exposures is necessarily dependent on, and limited by, our historical claims experience with the GSEs. It includes our understanding of our agreements with the GSEs and projections of future defaults as well as certain other assumptions, and judgmental factors. Accordingly, future provisions associated with obligations under representations and warranties made to the
GSEs may be materially impacted if actual experiences are different from our assumptions. The GSEs’ repurchase requests, standards for rescission of repurchase requests, and resolution processes have become increasingly inconsistent with the GSE’s own past conduct and the Corporation’s interpretation of its contractual obligations. These developments have resulted in an increase in claims outstanding from the GSEs. We intend to repurchase loans to the extent required under the contracts and standards that govern our relationships with the GSEs. While we are seeking to resolve our differences with the GSEs concerning each party’s interpretation of the requirements of the governing contracts, whether we will be able to achieve a resolution of these differences on acceptable terms, and timing thereof, is subject to significant uncertainty.
We are not able to predict changes in the behavior of the GSEs based on our past experiences. Therefore, it is not possible to reasonably estimate a possible loss or range of possible loss with respect to any such potential impact in excess of current accrued liabilities. See Complex Accounting Estimates – Representations and Warranties on page 125 for information related to the sensitivity of the assumptions used to estimate our liability for obligations under representations and warranties.
Non-Government-sponsored Enterprises
The population of private-label securitizations included in the BNY Mellon Settlement encompasses almost all legacy Countrywide first-lien private-label securitizations including loans originated principally in the 2004 through 2008 vintages. For the remainder of the population of private-label securitizations, we believe it is probable that other claimants in certain types of securitizations may come forward with claims that meet the requirements of the terms of the securitizations. We have seen an increased trend in requests for loan files from private-label securitization trustees and an increase in repurchase claims from private-label securitization trustees that meet the required standards. We believe that the provisions recorded in connection with the BNY Mellon Settlement and the additional non-GSE representations and warranties provisions recorded in 2011 have provided for a substantial portion of our non-GSE representations and warranties exposure.. However, it is reasonably possible that future representations and warranties losses may occur in excess of the amounts recorded for these exposures. In addition, we have not recorded any representations and warranties liability for certain potential monoline exposures and certain potential whole loan and other private-label securitization exposures.and whole-loan exposures where we have little to no claim experience. We currently estimate that the range of possible loss related to non-GSEfor representations and warranties exposure as ofexposures could be up to $4 billion over accruals at December 31, 20112012 could becompared to up to $5 billion over existing accruals.accruals at December 31, 2011 for only non-GSE representations and warranties exposures. The range of possible loss at December 31, 2012 reflects the impact of the FNMA Settlement and, as a result, addresses principally non-GSE exposures. The reduction in the range of possible loss from December 31, 2011 is the net impact of, among other changes, updated assumptions and other developments. The estimated range of possible loss for non-GSErelated to these representations and warranties exposures does not represent a probable loss, and is based on currently available information, significant judgment and a number of assumptions including those set forth below, that are subject to change.
The methodology used to estimate the non-GSE representations and warranties liability and the corresponding range of possible loss considers a variety of factors including our experience related to actual defaults, projected future defaults, historical loss experience, estimated home prices and other economic conditions. Among the factors that impact the non-GSE representations and warranties liability and the corresponding estimated range of possible loss are: (1) contractual loss causation requirements, (2) the representations and warranties provided, and (3) the requirement to meet certain presentation
thresholds. The first factor is based on our belief that a non-GSE contractual liability to repurchase a loan generally arises only if the counterparties prove there is a breach of representations and warranties that materially and adversely affects the interest of the investor or all investors, or the monoline insurer (as applicable), in a securitization trust, and accordingly, we believe that the repurchase claimants must prove that the alleged representations and warranties breach was the cause of the loss. The second factor is related to the fact that non-GSE securitizations include different types of representations and warranties than those provided to the GSEs. We believe the non-GSE securitizations’ representations and warranties are less rigorous and actionable than the explicit provisions of the comparable agreements with the GSEs without regard to any variations that may have arisen as a result of dealings with the GSEs. The third factor is related to the fact that certain presentation thresholds need to be met in order for any repurchase claim to be asserted on the initiative of investors under the non-GSE agreements. A securitization trustee may investigate or demand repurchase on its own action, and most agreements contain a threshold, for example 25 percent of the voting rights per trust, that allows investors to declare a servicing event of default under certain circumstances or to request certain action, such as requesting loan files, that the trustee may choose to accept and follow, exempt from liability, provided the trustee is acting in good faith. If there is an uncured servicing event of default, and the trustee fails to bring suit during a 60-day period, then, under most agreements, investors may file suit. In addition to this, most agreements also allow investors to direct the securitization trustee to investigate loan files or demand the repurchase of loans, if security holders hold a specified percentage, for example 25 percent, of the voting rights of each tranche of the outstanding securities. Although we continue to believe that presentation thresholds are a factor in the determination of probable loss, given the BNY Mellon Settlement, the estimated range of possible loss assumes that the presentation threshold can be met for all of the non-GSE securitization transactions.
In addition, in the case of private-label securitizations, our estimate considers implied repurchase experience based on the BNY Mellon Settlement, adjusted to reflect differences between the Covered Trusts and the remainder of the population of private-label securitizations, and assumes that the conditions to the BNY Mellon Settlement will be satisfied. For additional information about the methodology used to estimate the non-GSE representations and warranties liability and the corresponding range of possible loss, see Note 98 –
Representations and Warranties Obligations and Corporate Guarantees to the Consolidated Financial Statements.
Future provisions and/or ranges of possible loss for non-GSE representations and warranties may be significantly impacted if actual experiences are different from our assumptions in our predictive models, including, without limitation, those regarding ultimate resolution of the BNY Mellon Settlement, estimated repurchase rates, economic conditions, estimated home prices, consumer and counterparty behavior, and a variety of other judgmental factors. Adverse developments with respect to one or more of the assumptions underlying the liability for representations and warranties and the corresponding estimated range of possible loss could result in significant increases to future provisions and thisand/or the estimated range of possible loss. For example, if courts, in the context of claims brought by private-label securitization trustees, were to disagree with our interpretation that the underlying agreements require a claimant to prove that the representations and warranties breach was the cause of the loss, it could significantly impact this
the estimated range of possible loss. Additionally, if recent court rulings related to monoline litigation, including one related to us, that have allowed sampling of loan files instead of requiring a loan-by-loan review to determine if a representations and warranties breach has occurred, are followed generally by the courts in future monoline litigation, private-label securitization investorscounterparties may view litigation as a more attractive alternative as compared to a loan-by-loan review. For additional information regarding these issues, see MBIA litigation in Litigation and Regulatory Matters in Note 1413 – Commitments and Contingencies to the Consolidated Financial Statements. Finally, although we believe that the representations and warranties typically given in non-GSE transactions are less rigorous and actionable than those given in GSE transactions, we do not have significant experience resolving loan-level experienceclaims in non-GSE transactions to measure the impact of these differences on the probability that a loan will be required to be repurchased.
The liability for obligations under representations and warranties with respect to GSE and non-GSE exposures and the corresponding estimated range of possible loss for non-GSE representations and warranties exposures do not include any losses related to litigation matters disclosed in Note 14 – Commitments and Contingenciesto the Consolidated Financial Statements, nor do they include any separate foreclosure costs and related costs, assessments and compensatory fees or any possible losses related to potential claims for breaches of performance of servicing obligations (except as such losses are included as potential costs of the BNY Mellon Settlement), potential securities law or fraud claims or potential indemnity or other claims against us, including claims related to loans insured by the FHA. We are not able to reasonably estimate the amount of any possible loss with respect to any such servicing, securities law (except to the extent reflected in the aggregate range of possible loss for litigation and regulatory matters disclosed in Note 14 – Commitments and Contingenciesto the Consolidated Financial Statements), fraud or other claims against us; however, such loss could be material.
Government-sponsored Enterprises Experience
Our currentPrior to the FNMA Settlement, our repurchase claims experience with the GSEs is predominantlyhad been concentrated in the 2004 through 2008 origination vintages where we believebelieved that our exposure to representations and warranties liability iswas most significant. Our repurchase claims experience related to loans originated prior to 2004 has not been significant and we believe that the changes made to our operations and underwriting policies have reduced our exposure related to loans originated after 2008.
Bank of America and legacy Countrywide sold approximately $1.1 trillion of loans originated from 2004 through 2008 to the GSEs. As of December 31, 20112012, 1112 percent of the original funded balance of loans in these vintages havehad defaulted or arewere 180 days or more past due (severely delinquent). At least 25 payments have been made on approximately 65 percentAs of severely delinquent or defaulted loans. Through December 31, 20112012, we havehad received $32.443.5 billion in repurchase claims associated with these vintages, representing approximately threefour percent of the original funded balance of loans sold to the GSEs in these vintages. IncludingPrior to the agreement reached with FNMA on December 31, 2010,Settlement, we havehad resolved $25.729.6 billion of these claims with a net loss experience of approximately 3129 percent. The claims resolved and, after considering the loss rate do not include $839 million in claims extinguished as a resulteffect of the agreement with FHLMC due to the global nature of the agreement and, specifically, the absence of a formal apportionment of the agreement amount between current and future claims.collateral. Our collateral loss severity rate on approved repurchases hashad averaged approximately 4555 percent. The FNMA Settlement in January 2013 resolved an additional $12.2 billion in repurchase claims outstanding at December 31, 2012, primarily related to 55loans originated from 2004 percent.through 2008.
We and our subsidiaries have an established history of working with the GSEs on repurchase claims. In 2012, we continued to experience elevated levels of claims from FNMA, including claims on loans on which borrowers have made a significant number of payments (e.g., at least 25 payments) and, to a lesser extent, loans that defaulted more than 18 months prior to the repurchase request. The FNMA Settlement resolved substantially all of the
claims with respect to loans originated and sold to FNMA between January 1, 2000 and December 31, 2008, as well as substantially all future representations and warranties repurchase claims associated with these loans.
Table 11 highlights our experience with the GSEs related to loans originated from 2004 through 2008. Outstanding GSE claims increased to $6.3 billion, primarily attributable to $14.3 billion in new repurchase claims submitted by the GSEs for both legacy Countrywide originations not covered by the GSE Agreements and legacy Bank of America originations. The high level of new claims was partially offset by the resolution of claims with the GSEs.
| | | | | | | | | | | | | | | | | | | |
| Table 11 | Overview of GSE Balances – 2004-2008 Originations | Overview of GSE Balances – 2004-2008 Originations |
| | | | | | | | | | | | | | | | | |
| | | Legacy Originator | | Legacy Originator |
| (Dollars in billions) | (Dollars in billions) | Countrywide | | Other | | Total | | Percent of Total | (Dollars in billions) | Countrywide | | Other | | Total | | Percent of Total |
| Original funded balance | Original funded balance | $ | 846 |
| | $ | 272 |
| | $ | 1,118 |
| | |
| Original funded balance | $ | 846 |
| | $ | 272 |
| | $ | 1,118 |
| | |
|
| Principal payments | Principal payments | (452 | ) | | (153 | ) | | (605 | ) | | |
| Principal payments | (508 | ) | | (177 | ) | | (685 | ) | | |
|
| Defaults | Defaults | (56 | ) | | (9 | ) | | (65 | ) | | |
| Defaults | (77 | ) | | (14 | ) | | (91 | ) | | |
|
| Total outstanding balance at December 31, 2011 | $ | 338 |
| | $ | 110 |
| | $ | 448 |
| | |
| |
| Total outstanding balance at December 31, 2012 | | Total outstanding balance at December 31, 2012 | $ | 261 |
| | $ | 81 |
| | $ | 342 |
| | |
|
| Outstanding principal balance 180 days or more past due (severely delinquent) | Outstanding principal balance 180 days or more past due (severely delinquent) | $ | 50 |
| | $ | 12 |
| | $ | 62 |
| | |
| Outstanding principal balance 180 days or more past due (severely delinquent) | $ | 34 |
| | $ | 8 |
| | $ | 42 |
| | |
|
| Defaults plus severely delinquent | Defaults plus severely delinquent | 106 |
| | 21 |
| | 127 |
| | |
| Defaults plus severely delinquent | 111 |
| | 22 |
| | 133 |
| | |
|
| Payments made by borrower: | |
| | |
| | |
| | |
| |
| Payments made by borrower | | Payments made by borrower | |
| | |
| | |
| | |
|
| Less than 13 | Less than 13 | |
| | |
| | $ | 15 |
| | 12 | % | Less than 13 | |
| | |
| | $ | 15 |
| | 11 | % |
| 13-24 | 13-24 | |
| | |
| | 30 |
| | 23 |
| 13-24 | |
| | |
| | 31 |
| | 23 |
|
| 25-36 | 25-36 | |
| | |
| | 34 |
| | 27 |
| 25-36 | |
| | |
| | 34 |
| | 26 |
|
| More than 36 | More than 36 | |
| | |
| | 48 |
| | 38 |
| More than 36 | |
| | |
| | 53 |
| | 40 |
|
| Total payments made by borrower | Total payments made by borrower | |
| | |
| | $ | 127 |
| | 100 | % | Total payments made by borrower | |
| | |
| | $ | 133 |
| | 100 | % |
| Outstanding GSE representations and warranties claims (all vintages) | |
| | |
| | |
| | |
| |
| As of December 31, 2010 | |
| | |
| | $ | 2.8 |
| | |
| |
| Unresolved GSE representations and warranties repurchase claims (all vintages) | | Unresolved GSE representations and warranties repurchase claims (all vintages) | |
| | |
| | |
| | |
|
| As of December 31, 2011 | As of December 31, 2011 | |
| | |
| | 6.3 |
| | |
| As of December 31, 2011 | |
| | |
| | $ | 6.2 |
| | |
|
| As of December 31, 2012 | | As of December 31, 2012 | |
| | |
| | 13.5 |
| | |
|
| As of December 31, 2012 (pro forma reflecting the FNMA Settlement) | | As of December 31, 2012 (pro forma reflecting the FNMA Settlement) | | | | | 1.3 |
| | |
| Cumulative GSE representations and warranties losses (2004-2008 vintages) | Cumulative GSE representations and warranties losses (2004-2008 vintages) | |
| | |
| | $ | 9.2 |
| | |
| Cumulative GSE representations and warranties losses (2004-2008 vintages) | |
| | |
| | 9.8 |
| | |
|
The GSEs’ repurchase requests, standards for rescission of repurchase requests and resolution processes have become increasingly inconsistent with their past conduct as well as our interpretation of our contractual obligations. Notably, in recent periods we have been experiencing elevated levels of new claims from the GSEs, including claims on loans on which borrowers have made a significant number of payments (e.g., at least 25 payments) or on loans which had defaulted more than 18 months prior to the repurchase request, in each case, in numbers that were not expected based on historical experience. Also, the criteria and the processes by which the GSEs are ultimately willing to resolve claims have changed in ways that are unfavorable to us. These developments have resulted in an increase in claims outstanding from the GSEs. We intend to repurchase loans to the extent required under the contracts and standards that govern our relationships with the GSEs. While we are seeking to resolve our differences with the GSEs concerning each party’s interpretation of the requirements of the governing contracts, whether we will be able to achieve a resolution of these differences on acceptable terms and timing thereof, is subject to significant uncertainty.
Beginning in February 2012, we are no longerstopped delivering purchase money and non-MHAnon-Making Home Affordable (MHA) refinance first-lien residential mortgage products into FNMA MBS pools because of the expiration and mutual non-renewal of certain contractual delivery commitments and variances that permit efficient delivery of such loans to FNMA. While we continue to have a valid agreement with FNMA permitting the delivery of purchase money and non-MHA refinance first-lien residential mortgage products without such contractual variances, the delivery of such products without contractual delivery commitments and variances would involve time and expense to implement the necessary operational and systems changes and otherwise presentpresents practical operational issues. The non-renewal of these variances was influenced, in part, by our ongoing differences with FNMA in other contexts, including repurchase claims. We do not expect this change to have a material impact on our CRES business, as we expect to rely on other sources of liquidity to actively extend mortgage credit to our customers including continuing to deliver such products into FHLMC MBS pools. Additionally, we continue to deliver MHA refinancing products into FNMA MBS pools and continue to engage in dialogue to attempt to address these differences.
On June 30, 2011, FNMA issued an announcement requiring servicers to report, effective October 1, 2011, all MI rescission notices with respect to loans sold to FNMA. The announcement also confirmed FNMA’s view of its position that a mortgage insurance company’s issuance of a MI rescission notice constitutes a breach of the lender’s representations and warranties and permits FNMA to require the lender to repurchase the mortgage loan or promptly remit a make-whole payment covering FNMA’s loss even if the lender is contesting the MI rescission notice. A related announcement included a ban on bulk settlements with mortgage insurers that provide for loss sharing in lieu of rescission. According to FNMA’s announcement, through June 30, 2012, lenders have 90 days to appeal FNMA’s repurchase request and 30 days (or such other time frame specified by FNMA) to appeal after that date. According to FNMA’s announcement, in order to be successful in its appeal, a lender must provide documentation confirming reinstatement or continuation of coverage. This announcement could result in more repurchase requests from FNMA than the assumptions in our estimated liability contemplate. We also expect that in many cases (particularly in the context of individual or bulk rescissions being
contested through litigation), we will not be able to resolve MI rescission notices with the mortgage insurance companies before the expiration of the appeal period prescribed by the FNMA announcement. We have informed FNMA that we do not believe that the new policy is valid under our contracts with FNMA, and that we do not intend to repurchase loans under the terms set forth in the new policy. Our pipeline of outstanding repurchase claims from the GSEs resulting solely on MI rescission notices has increased during 2011 by $935 million to $1.2 billion at December 31, 2011. If we are required to abide by the terms of the new FNMA policy, our representations and warranties liability will likely increase.pools.
Experience with Investors Other than Government-sponsored Enterprises
In prior years, legacy companies and certain subsidiaries have sold pools of first-lien mortgage loans and home equity loans as private-label securitizations or in the form of whole loans. As detailed in Table 12, legacy companies and certain subsidiaries sold loans originated from 2004 through 2008 with an original principal balance of $963 billion to investors other than GSEs (although the GSEs are investors in certain private-label securitizations), of which approximately $506530 billion in principal has been paid and $239244 billion has defaulted or areis severely delinquent at December 31, 20112012.
As it relates to private-label securitizations, a contractual
liability to repurchase mortgage loans generally arises only if counterparties prove there is a breach of the representations and warranties that materially and adversely affects the interest of the investor or all investors in a securitization trust or of the monoline insurer or other financial guarantor (as applicable). We believe that the longer a loan performs, the less likely it is that an alleged representations and warranties breach had a material impact on the loan’s performance or that a breach even exists. Because the majority of the borrowers in this population would have made a significant number of payments if they are not yet 180 days or more past due, we believe that the principal balance at the greatest risk for repurchase claims in this population of private-label securitization investors is a combination ofsecuritizations are loans that have already defaulted and those that are currently severely delinquent. Additionally, the obligation to repurchase loans also requires thatonly counterparties havewith the contractual right to demand repurchase of a loan can present valid repurchase claims (in the loans (presentation thresholds)case of private-label securitization trust investors, they generally have to meet certain contractual thresholds in order to require trustees to present repurchase claims). While we believe the agreements for private-label securitizations generally contain less rigorous representations and warranties and place higher burdens on investors seeking repurchases than the explicit provisions of the comparable agreements with the GSEs without regard to any variations that may have arisen as a result of dealings with the GSEs, the agreements generally include a representation that underwriting practices were prudent and customary.
Any amounts paid related to repurchase claims from a monoline insurer are paid to the securitization trust and are applied in accordance with the terms of the governing securitization documents, which may include use by the securitization trust to repay any outstanding monoline advances or reduce future advances from the monolines. To the extent that a monoline has
not advanced funds or does not anticipate that it will be required to advance funds to the securitization trust, the likelihood of receiving a repurchase claim from a monoline may be reduced as the monoline would receive limited or no benefit from the payment of repurchase claims. Moreover, some monolines are not currently
performing their obligations under the financial guaranty policies they issued which may, in certain circumstances, impact their ability to present repurchase claims,claims; although in those circumstances, investors may be able totrustees can bring repurchase claims, including at the direction of investors if contractual thresholds are met.
Table 12 details the population of loans originated between 2004 and 2008 and the population of loans sold as whole loans or in non-agency securitizations by entity and product together with the defaulted and severely delinquent loans stratified by the
number of payments the borrower made prior to default or becoming severely delinquent atas of December 31, 20112012. As shown in Table 12, at least 25 payments have been made on
approximately 63 percent of the defaulted and severely delinquent loans. We believe many of the defaults observed in these securitizations have been, and continue to be, driven by external factors like the substantial depreciation in home prices, persistently high unemployment and other negative economic trends, diminishing the likelihood that any loan defect (assuming one exists at all) was the cause of a loan’s default. As of December 31, 20112012, approximately 25 percent of the loans sold to non-GSEs that were originated between 2004 and 2008 have defaulted or are severely delinquent. Of the original principal balance for Countrywide, $409 billion is included in the BNY Mellon Settlement.Settlement and of this amount $112 billion was defaulted or severely delinquent at December 31, 2012.
| | | | | | | | | | | | | | | | | | | | | | | | | | | | | | | | | | | | | | | |
| Table 12 | Overview of Non-Agency Securitization and Whole Loan Balances | Overview of Non-Agency Securitization and Whole Loan Balances |
| | | | | | | | | | | | | | | | | | | | | | | | | | | | | | | | | | | | | |
| | | Principal Balance | | Defaulted or Severely Delinquent | | Principal Balance | | Defaulted or Severely Delinquent |
(Dollars in billions)
By Entity | (Dollars in billions)
By Entity | Original Principal Balance | | Outstanding
Principal Balance December 31, 2011 | | Outstanding
Principal Balance 180 Days or More Past Due | | Defaulted Principal Balance | | Defaulted or Severely Delinquent | | Borrower Made less than 13 Payments | | Borrower
Made 13 to 24 Payments | | Borrower
Made 25 to 36 Payments | | Borrower
Made more than 36 Payments | (Dollars in billions)
By Entity | Original Principal Balance | | Outstanding
Principal Balance December 31, 2012 | | Outstanding
Principal Balance 180 Days or More Past Due | | Defaulted Principal Balance | | Defaulted or Severely Delinquent | | Borrower Made Less than 13 Payments | | Borrower
Made 13 to 24 Payments | | Borrower
Made 25 to 36 Payments | | Borrower
Made More than 36 Payments |
| Bank of America | Bank of America | $ | 100 |
| | $ | 28 |
| | $ | 5 |
| | $ | 4 |
| | $ | 9 |
| | $ | 1 |
| | $ | 2 |
| | $ | 2 |
| | $ | 4 |
| Bank of America | $ | 100 |
| | $ | 22 |
| | $ | 4 |
| | $ | 6 |
| | $ | 10 |
| | $ | 1 |
| | $ | 2 |
| | $ | 2 |
| | $ | 5 |
|
| Countrywide | Countrywide | 716 |
| | 252 |
| | 84 |
| | 100 |
| | 184 |
| | 24 |
| | 45 |
| | 46 |
| | 69 |
| Countrywide | 716 |
| | 204 |
| | 58 |
| | 131 |
| | 189 |
| | 25 |
| | 46 |
| | 46 |
| | 72 |
|
| Merrill Lynch | Merrill Lynch | 65 |
| | 19 |
| | 6 |
| | 12 |
| | 18 |
| | 3 |
| | 4 |
| | 3 |
| | 8 |
| Merrill Lynch | 65 |
| | 16 |
| | 4 |
| | 13 |
| | 17 |
| | 3 |
| | 4 |
| | 3 |
| | 7 |
|
| First Franklin | First Franklin | 82 |
| | 21 |
| | 7 |
| | 21 |
| | 28 |
| | 4 |
| | 6 |
| | 5 |
| | 13 |
| First Franklin | 82 |
| | 18 |
| | 5 |
| | 23 |
| | 28 |
| | 5 |
| | 6 |
| | 5 |
| | 12 |
|
Total (1, 2) | Total (1, 2) | $ | 963 |
| | $ | 320 |
| | $ | 102 |
| | $ | 137 |
| | $ | 239 |
| | $ | 32 |
| | $ | 57 |
| | $ | 56 |
| | $ | 94 |
| Total (1, 2) | $ | 963 |
| | $ | 260 |
| | $ | 71 |
| | $ | 173 |
| | $ | 244 |
| | $ | 34 |
| | $ | 58 |
| | $ | 56 |
| | $ | 96 |
|
| | | | | | | | | | | | | | | | | | | |
| By Product | By Product | |
| | |
| | |
| | |
| | |
| | |
| | |
| | |
| | |
| By Product | |
| | |
| | |
| | |
| | |
| | |
| | |
| | |
| | |
|
| Prime | Prime | $ | 302 |
| | $ | 102 |
| | $ | 17 |
| | $ | 15 |
| | $ | 32 |
| | $ | 2 |
| | $ | 6 |
| | $ | 7 |
| | $ | 17 |
| Prime | $ | 302 |
| | $ | 83 |
| | $ | 11 |
| | $ | 23 |
| | $ | 34 |
| | $ | 2 |
| | $ | 6 |
| | $ | 7 |
| | $ | 19 |
|
| Alt-A | Alt-A | 172 |
| | 71 |
| | 20 |
| | 28 |
| | 48 |
| | 7 |
| | 12 |
| | 12 |
| | 17 |
| Alt-A | 172 |
| | 58 |
| | 15 |
| | 35 |
| | 50 |
| | 8 |
| | 12 |
| | 12 |
| | 18 |
|
| Pay option | Pay option | 150 |
| | 56 |
| | 28 |
| | 28 |
| | 56 |
| | 5 |
| | 14 |
| | 16 |
| | 21 |
| Pay option | 150 |
| | 43 |
| | 19 |
| | 37 |
| | 56 |
| | 5 |
| | 14 |
| | 16 |
| | 21 |
|
| Subprime | Subprime | 245 |
| | 74 |
| | 34 |
| | 49 |
| | 83 |
| | 16 |
| | 19 |
| | 17 |
| | 31 |
| Subprime | 245 |
| | 63 |
| | 24 |
| | 58 |
| | 82 |
| | 17 |
| | 20 |
| | 17 |
| | 28 |
|
| Home Equity | Home Equity | 88 |
| | 15 |
| | 1 |
| | 16 |
| | 17 |
| | 2 |
| | 5 |
| | 4 |
| | 6 |
| Home Equity | 88 |
| | 12 |
| | — |
| | 18 |
| | 18 |
| | 2 |
| | 5 |
| | 4 |
| | 7 |
|
| Other | Other | 6 |
| | 2 |
| | 2 |
| | 1 |
| | 3 |
| | — |
| | 1 |
| | — |
| | 2 |
| Other | 6 |
| | 1 |
| | 2 |
| | 2 |
| | 4 |
| | — |
| | 1 |
| | — |
| | 3 |
|
| Total | Total | $ | 963 |
| | $ | 320 |
| | $ | 102 |
| | $ | 137 |
| | $ | 239 |
| | $ | 32 |
| | $ | 57 |
| | $ | 56 |
| | $ | 94 |
| Total | $ | 963 |
| | $ | 260 |
| | $ | 71 |
| | $ | 173 |
| | $ | 244 |
| | $ | 34 |
| | $ | 58 |
| | $ | 56 |
| | $ | 96 |
|
| |
(1) | Excludes transactions sponsored by Bank of America and Merrill Lynch where no representations or warranties were made. |
| |
(2) | Includes exposures on third-party sponsored transactions related to legacy entity originations. |
Monoline Insurers
Legacy companies sold $184.5 billion of loans originated between 2004 and 2008 into monoline-insured securitizations, which are included in Table 12, including $103.9 billion of first-lien mortgages and $80.6 billion of home equitysecond-lien mortgages. Of these balances, $45.948.9 billion of the first-lien mortgages and $50.451.8 billion of the home equitysecond-lien mortgages have been paid in full and $36.335.1 billion of the first-lien mortgages and $16.717.6 billion of the home equitysecond-lien mortgages have defaulted or are severely delinquent at December 31, 20112012. At least 25 payments have been made on approximately 6056 percent of the defaulted and severely delinquent loans. Of the first-lien mortgages sold, $39.1 billion, or 38 percent, were sold as whole loans to other institutions which subsequently included these loans with those of other originators in private-label securitization transactions in which the monolines typically insured one or more securities. Through
As of December 31, 20112012, we have received $6.0 billion of representations and warranties repurchase claims associated with these vintages from the monoline insurers related to the monoline-insured transactions, predominately second-lien transactions. Of these repurchase claims, $2.02.4 billion were resolved through the Assured Guaranty Settlement,and Syncora Settlements, $813816 million were resolved through repurchase or indemnification with losses of $703649 million, and $138302 million were rescinded by the investormonoline
insurers or paid in full. The majority of these resolved claims related to home equity mortgages. ExperienceOur limited experience with most of the monoline insurers has varied in terms of process, and experience with these counterparties has not been predictable. Our limited claims experience with the monoline insurers in the repurchase process is a result of these monoline insurers having instituted litigation against legacy Countrywide and/or Bank of America, which impacts our ability to enter into constructive dialogue with these monolines to resolve the open claims.
At December 31, 20112012, for loans originated between 2004 and 2008, the unpaid principal balance of loans related to unresolved monoline repurchase claims was $3.12.4 billion, substantially all of which we have reviewed and declined to repurchase based on an assessment of whether a material breach exists. At December 31, 20112012, the unpaid principal balance of loans in these vintages for which the monolines had requested loan files for review but for which no repurchase claim had been received was $6.15.3 billion, excluding loans that had been paid in full andor resolved through settlements. Of these file requests, for loans included in the trusts settled with Assured Guaranty.$4.0 billion are aged and subject to ongoing litigation. There will likely be additional requests for loan files in the future leading to repurchase claims. In addition, we have received claims from private-label securitization trustees and a third-party securitization sponsor related to first-lien third-party sponsored securitizations that include monoline insurance.
We have had limited experience with the monoline insurers, other than Assured Guaranty, in the repurchase process as each of these monoline insurers has instituted litigation against legacy Countrywide and/or Bank of America, which limits our ability to enter into constructive dialogue with these monolines to resolve the open claims.
It is not possible at this time to reasonably estimate probable future repurchase obligations with respect to those monolines with whom we have limited repurchase experience and, therefore, no representations and warranties liability has been recorded in connection with these monolines, other than a liability for repurchase claims where we have determined that there are valid loan defects.defects and determined that there is a breach of a representation and warranty and that any other requirements for repurchase have been met. Outside of the standard quality control process that is an integral part of our loan origination process, we do not generally review loan files until we receive a repurchase claim, including with respect to monoline exposures. Our estimated range
of possible loss related to non-GSE representations and warranties exposureexposures as of December 31, 20112012 includeddoes not include possible losses related to these monoline insurers. For additional information, see Note 13 – Commitments and Contingenciesto the Consolidated Financial Statements.
Whole Loans and Private-label Securitizations
Legacy entities, and to a lesser extent Bank of America, sold loans to investors as whole loans or via private-label securitizations. The majority of the loans sold were included in private-label securitizations, including third-party sponsored transactions. We provided representations and warranties to the whole-loan investors and these investors may retain those rights even when the whole loans were aggregated with other collateral into private-label securitizations sponsored by the whole-loan investors. The loans sold with a total principal balance of $778.2 billion, included in Table 12, were originated between 2004 and 2008, of which $409.4429.0 billion have been paid in full and $186.1191.4 billion are defaulted or severely delinquent at December 31, 20112012. In connection with these transactions, we provided representations and warranties, and the whole-loan investors may retain those rights even when the whole loans were aggregated with other collateral into private-label securitizations sponsored by the whole-loan investors. At least 25 payments have been made on approximately 64 percent of the defaulted and severely delinquent loans. We have received approximately $10.919.4 billion of representations and warranties repurchase claims from whole-loan investors, including third-party sponsors, and private-label securitization investors and trustees related to these vintages, including $6.1 billion from whole-loan investors, $2.210.5 billion from private-label securitization trustees, $1.78.0 billion in claims from private-label securitizationwhole-loan investors in the Covered Trusts received in 2010, and $819815 million from one private-label securitization counterparty which were submitted prior to 2008.counterparty. In private-label securitizations, certain representationpresentation thresholds need to be met in order for anyinvestors to direct a trustee to assert repurchase claimclaims. Recent increases in new private-label claims are primarily related to be asserted by the investors. The majority of the claims that we have received outside of those from the GSEs and monolines are from third-party whole-loan investors. However, the amount of claimsrepurchase requests received from trustees and third-party sponsors for private-label securitization trusteestransactions not included in the BNY Mellon Settlement, including claims related to first-lien third-party sponsored securitizations that meet the required standards has been increasing. In 2011, we received $2.1 billion of repurchase claims from private-label securitization trustees. In addition,include monoline insurance. Over time, there has been an increase in requests for loan files from certain private-label securitization trustees, as well as requests for tolling agreements to toll the applicable statutes of limitation relating to representations and warranties repurchase claims, and we believe it is likely that these requests will lead to an increase in repurchase claims from private-label securitization trustees that meet the required standards.with standing to bring such claims.
We have resolved $6.17.3 billion of the claims received from whole-loan investors and private-label securitization investors and trustees with losses of $1.41.6 billion. The majority of these resolved claims were from third-party whole-loan investors. Approximately $2.82.9 billion of these claims were resolved through repurchase or indemnification and $3.34.4 billion were rescinded by the investor. Claims outstanding related to these vintages totaledAt $4.8 billionDecember 31, 2012, includingfor loans originated between 2004 and 2008, the notional amount of unresolved repurchase claims
submitted by private-label securitization trustees and whole-loan investors was $2.812.2 billion. We have performed an initial review with respect to $10.9 billion that have been reviewed where it is believedof these claims and do not believe a valid defectbasis for repurchase has not been identified which would constitute an actionable breach of representationsestablished by the claimant and warranties and $2.0 billion that are still in the process of review.reviewing the remaining $1.3 billion of these claims.
Certain whole-loan investors have engaged with us in a consistent repurchase process and we have used that and other experience to record a liability related to existing and future claims from such counterparties. The BNY Mellon Settlement and subsequent activity with certain counterparties led to the determination in the second quarter of 2011 that we had sufficient experience to record a liability related to our exposure on certain other private-label securitizations. However, the BNY Mellon Settlementsecuritizations but did not provide sufficient experience related to certain private-label securitizations sponsored by third-party whole-loan investors. As it relates to certainthe other private-label securitizations sponsored by third-party whole-loan investors and certain other
whole loan sales, it is not possible to determine whether a loss has occurred or is probableprobable; and therefore, no representations and warranties liability has been recorded in connection with these transactions. Until we receive a repurchase claim, we generally have not reviewed loan files related to private-label securitizations sponsored by third-party whole-loan investors (and are not required by the governing documents to do so). Our estimated range of possible loss related to non-GSE representations and warranties exposureexposures as of December 31, 20112012 included possible losses related to these whole loan sales and private-label securitizations sponsored by third-party whole-loan investors.
Private-label securitization investors generally do not have the contractual right to demand repurchase of loans directly or the right to access loan files. The inclusion of theWe have received repurchase demands totaling $1.71.6 billion from private-label securitization investors and a master servicer where in outstanding claims noted on page 63 does not mean thateach case we believe these claims havethe claimant has not satisfied the contractual thresholds required for these investors to direct the securitization trustee to take action and/or that these claimsthe demands are otherwise procedurally or substantively valid. One of these claimants has filed litigation against us relating to certain of these claims; the claims in this litigation would be extinguished if there is final court approval of the BNY Mellon Settlement. Additionally, certain private-label securitizations are insured by the monoline insurers, which are not reflected in these amounts regarding whole loan sales and private-label securitizations.invalid.
Other Mortgage-related Matters
Servicing Matters and Foreclosure Processes
We service a large portion of the loans we or our subsidiaries have securitized and also service loans on behalf of third-party securitization vehicles and other investors. Our servicing obligations are set forth in servicing agreements with the applicable counterparty. These obligations may include, but are not limited to, loan repurchase requirements in certain circumstances, indemnifications, payment of fees, advances for foreclosure costs that are not reimbursable, or responsibility for losses in excess of guarantees for VA loans.
Servicing agreements with the GSEs generally provide the GSEs with broader rights relative to the servicer than are found in servicing agreements with private investors. For example, each GSE typically claims the right to demand that the servicer repurchase loans that breach the seller’s representations and warranties made in connection with the initial sale of the loans even if the servicer was not the seller. The GSEs also claim that they have the contractual right to demand indemnification or loan repurchase for certain servicing breaches. In addition, the GSEs’ firstfirst-lien mortgage seller/servicer guides provide for timelines to resolve delinquent loans through workout efforts or liquidation, if necessary, and purport to require the imposition of compensatory fees if those deadlines are not satisfied except for reasons beyond
the control of the servicer,servicer; although, we believe that the governing contracts, our course of dealing, and collective past practices and understandings should inform resolution of these matters. In addition, many non-agency RMBS and whole-loan servicing agreements requirestate that the servicer to indemnify the trustee or other investormay be liable for or against failures by the servicerfailure to perform its servicing obligations in keeping with industry standards or for acts or omissions that involve willful malfeasance, bad faith or gross negligence in the performance of, or reckless disregard of, the servicer’s duties.
It is not possible to reasonably estimate our liability with respect to potential servicing-related claims. While we have recorded certain accruals for servicing-related claims, the amount of potential liability in excess of existing accruals could be material.
In October 2010, we voluntarily stopped taking residential mortgage foreclosure proceedings to judgment in states where foreclosure requires a court order following a legal proceeding (judicial states) and stopped foreclosure sales in all states in order to complete an assessment of related business processes. We have resumed foreclosure sales in nearly all non-judicial states. While we have resumed foreclosure proceedings in nearly all judicial states, but our progress on foreclosure sales in judicial states
has been much slower than in non-judicial states. The pace ofstates where foreclosure sales in judicial states increased significantly by the fourth quarter of 2011. However, there continues to bedoes not require a backlog of foreclosure inventory in judicial states. The implementation of changes in procedurescourt order (non-judicial states).
2011 OCC Consent Order and controls, including loss mitigation procedures related to our ability to recover on FHA-insurance related claims, and governmental, regulatory and judicial actions, may result in continuing delays in foreclosure proceedings and foreclosure sales, and create obstacles to the collection of certain fees and expenses, in both judicial and non-judicial foreclosures.2013 IFR Acceleration Agreement
We entered into athe 2011 OCC Consent Order on April 13, 2011. This consent order with the Federal Reserve and BANA entered into a consent order with the OCC on April 13, 2011. These consent orders requirerequired servicers to make several enhancements to their servicing operations, including implementation of a single point of contact model for borrowers throughout the loss mitigation and foreclosure processes, adoption of measures designed to ensure that foreclosure activity is halted once a borrower has been approved for a modification unless the borrower fails to make payments under the modified loan and implementation of enhanced controls over third-party vendors that provide default servicing support services. In addition, the 2011 OCC consent orderConsent Order required that we retain an independent consultant, approved by the OCC, to conduct a review of all foreclosure actions pending, or foreclosure sales that occurred, between January 1, 2009 and December 31, 2010 and submit a plan to the OCC to remediate all financial injury to borrowers caused by any deficiencies identified through the review. The review is comprised of two parts: a sample file review conductedOn January 7, 2013, we and other mortgage servicing institutions entered into the 2013 IFR Acceleration Agreement with the Federal Reserve and the OCC to cease the case-by-case IFR program created by the independent consultant, which began2011 OCC Consent Order and replace it with an accelerated remediation process. The 2013 IFR Acceleration Agreement requires us to make a cash payment of $1.1 billion and provide $1.8 billion of borrower assistance in October 2011,the form of loan modifications and file reviewsother foreclosure prevention actions. The borrower assistance program is not expected to result in any incremental credit provision, as we believe that the existing allowance for credit losses is adequate to absorb any costs that have not already been recorded as charge-offs.
National Mortgage Settlement
In March 2012, we entered into settlement agreements (collectively, the National Mortgage Settlement) with (1) the U.S. Department of Justice, various federal regulatory agencies and 49 state Attorneys General to resolve federal and state investigations into certain residential mortgage origination, servicing and foreclosure practices, (2) HUD to resolve certain claims relating
to the origination of FHA-insured mortgage loans, primarily by Countrywide prior to and for a period following our acquisition of that lender, and (3) each of the Federal Reserve and the OCC regarding civil monetary penalties related to conduct that was the subject of consent orders entered into with the banking regulators in April 2011. The National Mortgage Settlement was entered by the independent consultant based upon requestscourt as a consent judgment on April 5, 2012. The National Mortgage Settlement provided for reviewthe establishment of certain uniform servicing standards, upfront cash payments of approximately $1.9 billion to the state and federal governments and for borrower restitution, approximately $7.6 billion in borrower assistance in the form of, among other things, credits earned for principal reduction, short sales, deeds-in-lieu of foreclosure and approximately $1.0 billion of credits earned for interest rate reduction modifications. In addition, the settlement with HUD provided for an upfront cash payment of $500 million to settle certain claims related to FHA-insured loans. We will also be obligated to provide additional cash payments of up to $850 million if we fail to earn an additional $850 million of credits stemming from customersincremental first-lien principal reductions over a three-year period.
The borrower assistance program did not result in any incremental credit provision during 2012, as we believe that the existing allowance for credit losses is adequate to absorb any costs that have not already been recorded as charge-offs. The interest rate modification program consisted of interest rate reductions on first-lien loans originated prior to January 1, 2009 that have a current loan-to-value (LTV) ratio greater than 100 percent and that meet certain eligibility criteria, including the requirement that all payments due for the last twelve months have been made in a timely manner. This program commits us to forego future interest payments that we may not otherwise have agreed to forego, and no loss has been recognized in the financial statements related to such forgone interest. Modifications of approximately 7,500 loans with in-scope foreclosures.an aggregate unpaid principal balance of $2.1 billion providing for an average interest rate reduction of approximately two percent were completed as of December 31, 2012, resulting in an estimated decrease in fair value of the modified loans of approximately $242 million. The interest rate modification program is expected to include approximately 20,000 to 25,000 loans with an aggregate unpaid principal balance of $5.4 billion to $6.8 billion. Assuming an average interest rate reduction of approximately two percent, the modifications are expected to result in a reduction of annual interest income of approximately $100 million to $130 million when the program is complete. Assuming a weighted-average loan life of approximately eight years, the fair value of loans in the program is expected to decrease by approximately $600 million to $800 million as a result of the interest rate reductions. The financial impact will vary depending on final terms of modifications offered and the rate of borrower acceptance. We began outreachdo not expect loans modified under the program to be accounted for as troubled debt restructurings (TDRs). If the program is expanded to include loans that do not meet specified underwriting criteria, such as maximum debt-to-income ratios or minimum FICO scores, the modifications of such loans will be accounted for as TDRs.
We could be required to make additional payments if we fail to meet our borrower assistance and rate reduction modification commitments over a three-year period, in an amount equal to 125 percent to 140 percent of the shortfall, dependent on the two- and three-year commitment target. We also entered into agreements with several states under which we committed to perform certain
minimum levels of principal reduction and related activities within those customersstates in November 2011,connection with the National Mortgage Settlement, and under which we could be required to make additional outreach efforts are underway. Because the review processpayments if we fail to meet such minimum levels.
We believe that it is available to a large number of potentially eligible borrowers and involves an examination of many details and documents, each review could take several months to complete. We cannot yet accurately determine how many borrowers will ultimately request a review, how many borrowerslikely that we will meet all borrower assistance, rate reduction modification and principal reduction commitments required under the eligibility requirementsNational Mortgage Settlement and, therefore, do not expect to be required to make additional cash payments. Although it is possible that the cost of fulfilling the commitments could increase, leading to an incremental credit provision, the amount of any such incremental provision is not reasonably estimable. Although we may incur additional operating costs such as servicing costs to implement parts of the National Mortgage Settlement in future periods, we do not expect that those costs will be material.
Under the terms of the National Mortgage Settlement, the federal and participating state governments agreed to release us from further liability for certain alleged residential mortgage origination, servicing and foreclosure deficiencies. In settling origination issues related to FHA-guaranteed loans originated on or how much in compensation might ultimatelybefore April 30, 2009, we received a release from further liability for all origination claims with respect to such loans if an insurance claim had been submitted to the FHA prior to January 1, 2012 and a release of multiple damages and penalties, but not single damages, if no such claim had been submitted. In addition, provided we meet our assistance and remediation commitments, the OCC agreed not to assess, and we will not be paidobligated to eligible borrowers.pay to the Federal Reserve, any civil monetary penalties.
WeThe National Mortgage Settlement does not cover certain claims arising out of origination, securitization (including representations made to investors with respect to MBS), criminal claims, private claims by borrowers, claims by certain states for injunctive relief or actual economic damages to borrowers related to the Mortgage Electronic Registration Systems, Inc. (MERS), and claims by the GSEs (including repurchase demands), among other items.
Additionally, we continue to be subject to additional borrower and non-borrower litigation and governmental and regulatory scrutiny related to our past and current origination, servicing and foreclosure activities, including those claims not covered by the Servicing Resolution Agreements, defined below.National Mortgage Settlement. This scrutiny may extend beyond our pending foreclosure matters to issues arising out of alleged irregularities with respect to previously completed foreclosure activities. The current environment of heightened regulatory scrutiny may subject us to inquiries or investigations that could significantly adversely affect our reputation and result in material costs to us.
Servicing Resolution Agreements
On February 9, 2012, we reached agreements in principle (collectively, the Servicing Resolution Agreements) with (1) the DOJ, various federal regulatory agencies and 49 state attorneys general to resolve federal and state investigations into certain origination, servicing and foreclosure practices (the Global AIP), (2) the Federal Housing Administration (the FHA) to resolve certain claims relating to the origination of FHA-insured mortgage loans, primarily by Countrywide prior to and for a period following our acquisition of that lender (the FHA AIP) and (3) each of the Federal
Reserve and the OCC regarding civil monetary penalties related to conduct that was the subject of consent orders entered into with the banking regulators in April 2011 (the Consent Order AIPs). The Servicing Resolution Agreements are subject to ongoing discussions among the parties and completion and execution of definitive documentation, as well as required regulatory and court approvals. There can be no assurance as to when or whether binding settlement agreements will be reached, that they will be on terms consistent with the Servicing Resolution Agreements, or as to when or whether the necessary approvals will be obtained and the settlements will be finalized.
The Global AIP calls for the establishment of certain uniform servicing standards, upfront cash payments of approximately $1.9 billion to the state and federal governments and for borrower restitution, approximately $7.6 billion in borrower assistance in the form of, among other things, principal reduction, short sales, deeds-in-lieu of foreclosure, and approximately $1.0 billion in refinancing assistance. We could be required to make additional payments if we fail to meet our borrower assistance and refinancing assistance commitments over a three-year period. In addition, we could be required to pay an additional $350 million if we fail to meet certain first-lien principal reduction thresholds over a three-year period. We also entered into agreements with several states under which we committed to perform certain minimum levels of principal reduction and related activities within those states as part of the Global AIP, and under which we could be required to make additional payments if we fail to meet such minimum levels.
The FHA AIP provides for an upfront cash payment of $500 million and the FHA would release us from all claims arising from loans originated on or before April 30, 2009 that were submitted for FHA insurance claim payments prior to January 1, 2012, and from multiple damages and penalties for loans that were originated on or before April 30, 2009, but had not been submitted for FHA insurance claim payment. An additional $500 million would be payable if we fail to meet certain principal reduction thresholds over a three-year period.
Pursuant to an agreement in principle, the OCC agreed to hold in abeyance the imposition of a civil monetary penalty of $164 million. Pursuant to a separate agreement in principle, the Federal Reserve will assess a civil monetary penalty in the amount of $176 million against us. Satisfying our payment, borrower assistance and remediation obligations under the Global AIP will satisfy any civil monetary penalty obligations arising under these agreements in principle. If, however, we do not make certain required payments or undertake certain required actions under the Global AIP, the OCC will assess, and the Federal Reserve will require us to pay, the difference between the aggregate value of the payments and actions under these agreements in principle and the penalty amounts.
Under the terms of the Global AIP, the federal and participating state governments would release us from further liability for certain alleged residential mortgage origination, servicing and foreclosure deficiencies. In settling origination issues related to FHA guaranteed loans originated on or before April 30, 2009, the FHA would provide us and our affiliates a release for all claims with respect to such loans if an insurance claim had been submitted to the FHA prior to January 1, 2012 and a release of multiple damages and penalties (but not single damages) if no such claim had been submitted.
The financial impact of the Servicing Resolution Agreements is not expected to require any additional reserves over existing accruals as of December 31, 2011, based on our understanding
of the terms of the Servicing Resolution Agreements. The refinancing assistance commitment under the Servicing Resolution Agreements is expected to be recognized as lower interest income in future periods as qualified borrowers pay reduced interest rates on loans refinanced. Although we may incur additional operating costs (e.g., servicing costs) to implement parts of the Servicing Resolution Agreements in future periods, it is expected that those costs will not be material.
The Servicing Resolution Agreements do not cover claims arising out of securitization (including representations made to investors respecting MBS), criminal claims, private claims by borrowers, claims by certain states for injunctive relief or actual economic damages to borrowers related to the Mortgage Electronic Registration Systems, Inc. (MERS), and claims by the GSEs (including repurchase demands), among other items. Failure to finalize the documentation related to the Servicing Resolution Agreements, to obtain the required court and regulatory approvals, to meet our borrower and refinancing commitments or other adverse developments with respect to the foregoing could have a material adverse effect on our financial condition and results of operations.
Mortgage Electronic Registration Systems, Inc.
Mortgage notes, assignments or other documents are often required to be maintained and are often necessary to enforce mortgage loans. There has been significant public commentary regarding the common industry practice of recording mortgages in the name of MERS, as nominee on behalf of the note holder, and whether securitization trusts own the loans purported to be conveyed to them and have valid liens securing those loans. We currently use the MERS system for a substantial portion of the residential mortgage loans that we originate, including loans that have been sold to investors or securitization trusts. A component of the OCC consent order requires significant changes in the
manner in which we service loans identifyingthat identify MERS as the mortgagee. Additionally, certain local and state governments have commenced legal actions against us, MERS and other MERS members, questioning the validity of the MERS model. Other challenges have also been made to the process for transferring mortgage loans to securitization trusts, asserting that having a mortgagee of record that is different than the holder of the mortgage note could “break the chain of title” and cloud the ownership of the loan. In order to foreclose on a mortgage loan, in certain cases it may be necessary or prudent for an assignment of the mortgage to be made to the holder of the note, which in the case of a mortgage held in the name of MERS as nominee would need to be completed by a MERS signing officer. As such, our practice is to obtain assignments of mortgages from MERS prior to instituting foreclosure. If certain required documents are missing or defective, or if the use of MERS is found not to be valid, we could be obligated to cure certain defects or in some circumstances be subject to additional costs and expenses. Our use of MERS as nominee for the mortgage may also create reputational risks for us.
Impact of Foreclosure Delays
InForeclosure delays impact our default-related servicing costs. We believe default-related servicing costs peaked during the third quarter of 20112012 and began to decline in the fourth quarter of 2012, and we incurredanticipate that this decline will accelerate in 2013. However, unexpected foreclosure delays in 2013 could impact the rate of decline. Default-related servicing costs include costs related to resources needed for implementing new servicing standards mandated for the industry, including as part of the National Mortgage Settlement, other operational changes and operational costs due to delayed foreclosures and do not include mortgage-related assessments, waivers and similar costs related to foreclosure delays.
Other areas of our operations are also impacted by foreclosure delays. In 2012, we recorded $1.8 billion867 million of mortgage-related assessments, waivers and waivers costs which included $1.3 billion for compensatory fees that we expect to be claimed by the GSEs as a result of foreclosure delays with the remainder being out-of-pocket costs that we do not expect to recover because of foreclosure delays. We expect that mortgage-related assessments and waivers costs,
compensatory fees assessed by the GSEs and other costs associated with foreclosures will remain elevated as additional loans are delayed in the foreclosure process, although we believe that the governing contracts, our course of dealing, and collective past practices and understandings should inform resolution of these matters. We also expect additionalsimilar costs related to resources necessary to perform the foreclosure process assessment and to implement other operational changes will continue. This will likely result in continued higher noninterest expense,delays, including higher default servicing costs and legal expenses in CRES$258 million, and has impacted and may continue to impact the value of our MSRs related to these serviced loans.compensatory fees as part of the FNMA Settlement. It is also possible that the delays in foreclosure sales may result in additional costs and expenses, including costs associated with the maintenance of properties or possible home price declines while foreclosures are delayed. In addition, required process changes, including those required under the consent orders with federal bank regulators, are likely to result in further increases in our default servicing costs over the longer term. Finally, the time to complete foreclosure sales may continue to be protracted, which may result in a greater number of nonperforming loans and increased servicing advances, and may impact the collectability of such advances and the value of our MSR asset, MBS and real estate owned properties.
An increase in Accordingly, the time to complete foreclosure sales also may increase the numberultimate resolution of severely delinquent loans in our mortgage servicing portfolio, result in increasing levels of consumer nonperforming loans and could have a dampening effect on net interest margin as nonperforming assets increase. Accordingly,disagreements with counterparties, delays in foreclosure sales including any delays beyond those currently anticipated, our continued process enhancements, including those required under the OCC and Federal Reserve consent orders and any issues that may arise out of alleged irregularities in our foreclosure process could significantly increase the costs associated with our mortgage operations.
Mortgage-related Settlements – Servicing Matters
In connection with the BNY Mellon Settlement, BANA has agreed to implement certain servicing changes. The Trustee and BANA have agreed to clarify and conform certain servicing standards related to loss mitigation. In particular, the BNY Mellon Settlement would clarifyclarifies that it is permissible to apply the same loss-mitigationloss mitigation strategies to the Covered Trusts as are applied to BANA affiliates’ held-for-investment (HFI)
HFI portfolios. This portion of the agreement was effective in the second quarter of 2011 and is not conditioned on final court approval.
BANA also agreed to transfer the servicing rights related to certain high-risk loans to qualified subservicers on a schedule that began with the signing of the BNY Mellon Settlement. This servicing transfer protocol will reduce the servicing fees payable to BANA in the future. Upon final court approval of the BNY Mellon Settlement, failure to meet the established benchmarking standards for loans not in subservicing arrangements can trigger the payment of agreed-upon fees. Additionally, we and legacy Countrywide have agreed to work to resolve with the Trustee certain mortgage documentation issues related to the enforceability of mortgages in foreclosure and to reimburse the related Covered Trust for any loss if BANA is unable to foreclose on the mortgage and the Covered Trust is not made whole by a title policy because of these documentation issues. These agreements will terminate if final court approval of the BNY Mellon Settlement is not obtained, although we could still have exposure under the pooling and servicing agreements related to
the mortgages in the Covered Trusts for these documentation issues.
We estimate that the costs associated with additional servicing obligations under the BNY Mellon Settlement contributed $400 million to the 2011 valuation charge related to the MSR asset. The additional servicing actions are consistent with the consent orders with the OCC and the Federal Reserve.
In addition, in connection with the Servicing Resolution Agreements,National Mortgage Settlement, BANA has agreed to implement certain additional servicing changes. The uniform servicing standards established under the Servicing Resolution AgreementsNational Mortgage Settlement are broadly consistent with the residential mortgage servicing practices imposed by the 2011 OCC consent order,Consent Order; however, they are more prescriptive and cover a broader range of our residential mortgage servicing activities. These standards are intended to strengthen procedural safeguards and documentation requirements associated with foreclosure, bankruptcy, and loss mitigation activities, as well as addressing the imposition of fees and the integrity of documentation, with a goal of ensuring greater transparency for borrowers. These uniform servicing standards also obligate us to implement compliance processes reasonably designed to provide assurance of the achievement of these objectives. Compliance with the uniform servicing standards will be assessed by a monitor based on the measurement of outcomes with respect to these objectives. Implementation of these uniform servicing standards is expected to incrementally increasecontribute to elevated costs associated with the servicing process, but is not expected to result in material delays or dislocation in the performance of our mortgage servicing obligations, including the completion of foreclosures.
Regulatory Matters
See Item 1A. Risk Factors and Note 1413 – Commitments and Contingencies to the Consolidated Financial Statements for additional information regarding regulatory matters and risks.
Financial Reform Act
The Dodd-Frank Wall Street Reform and Consumer Protection Act (Financial Reform Act), which was signed into law on July 21, 2010, enactsenacted sweeping financial regulatory reform and has altered and will continue to alter the way in which we conduct certain businesses, increase our costs and reduce our revenues. Many aspects of the Financial Reform Act remain subject to final rulemaking and will take effect over several years, making it difficult to anticipate the precise impact on the Corporation, our customers or the financial services industry.
Debit Interchange Fees
On June 29, 2011, the Federal Reserve adopted a final rule with respect to the Durbin Amendment effective on October 1, 2011 which, among other things, established a regulatory cap for many types of debit interchange transactions to equal no more than 21 cents plus five bps of the value of the transaction. The Federal Reserve also adopted a rule to allow a debit card issuer to recover one cent per transaction for fraud prevention purposes if the issuer complies with certain fraud-related requirements, with which we are currently in compliance. The Federal Reserve also approved rules governing routing and exclusivity, requiring issuers to offer two unaffiliated networks for routing transactions on each debit or prepaid product, which arebecame effective April 1, 2012. For additional information on the impact to revenue, see Card ServicesCBB on page 4138.
Limitations on Proprietary TradingTrading; Sponsorship and Investment in Hedge Funds and Private Equity Funds
On October 11, 2011, the Federal Reserve, OCC, FDIC and Securities and Exchange Commission (SEC), representing four of the five regulatory agencies charged with promulgating regulations implementing limitations on proprietary trading as well as the sponsorship of or investment in hedge funds and private equity funds (the Volcker Rule) established by the Financial Reform Act, released for comment proposed implementing regulations. On January 11, 2012, the Commodity Futures Trading Commission (CFTC), the fifth agency, released for comment its proposed regulations under the Volcker Rule. The proposed regulations include clarifications to the definition of proprietary trading and distinctions between permitted and prohibited activities. However, in light of the complexity of the proposed regulations and the large volume of comments received (the proposal requested comments on over 1,300 questions on 400 different topics), it is not possible to predict the content of the final regulations or when they will be issued.
The statutory provisions of the Volcker Rule will becomebecame effective on July 21, 2012 whether or not the final regulations are adopted, and it gives certaingave financial institutions two years from the effective date, with opportunitiesthe possibility for additional extensions for certain investments, to bring activities and investments into compliance.compliance with the statutory provisions and final regulations. Although GBAM eGlobal Markets xitedexited its stand-alone proprietary trading business as of June 30, 2011 in anticipation of the Volcker Rule and to further to our initiative to optimize our balance sheet, the ultimate impact of the Volcker Rule on us remains uncertain.uncertain as the regulations implementing the Volcker Rule are not final. However, based uponon the contentcontents of the proposed regulations, it is possible that the implementation of the Volcker Rule implementation could limit or restrict our remaining trading activities. Implementation ofIf exemptions in the Volcker Rule and the proposed regulations are not available, the Volcker Rule could also limit or restrict our ability to sponsor and hold ownership interests in hedge funds, private equity funds, commodity pools and other subsidiary operations,operations. Additionally, the Volcker Rule could increase our operational and compliance costs, reduce our trading revenues, and adversely affect our results of operations. The date on which final regulations will be issued is currently uncertain. For additional information about our trading business, see GBAMGlobal Markets on page 4948.
Derivatives
The Financial Reform Act includes measures to broaden the scope of derivative instruments subject to regulation by requiring clearing and exchange trading of certain derivatives; imposing new capital, margin, reporting, registration and business conduct requirements for certain market participants; and imposing position limits on certain OTCover-the-counter (OTC) derivatives. The Financial Reform Act grants the CFTC and the SEC substantial new authority and requires numerous rulemakings by these agencies. Swap dealers conducting dealing activity with U.S. persons above a specified dollar threshold were required regulators to promulgateregister with the rulemakings necessaryCFTC on or before December 31, 2012. We registered BANA, Merrill Lynch Commodities Inc., Merrill Lynch Capital Services Inc., Merrill Lynch Financial Markets Inc., Merrill Lynch International and Merrill Lynch International Bank Limited as swap dealers on December 31, 2012. Upon registration, swap dealers became subject to implement these regulations by July 16, 2011. However,additional CFTC rules relating to business conduct and reporting, and will continue to become subject to additional CFTC rules as and when such rules take effect. Those rules include, but are not limited to, measures that require clearing and exchange trading of certain derivatives, new capital and margin requirements for certain market participants, and additional reporting requirements for derivatives under the rulemaking process was not completed asjurisdiction of this date, and is not expected to conclude until well into 2012. Further, the regulatorsCFTC. The CFTC also granted temporary relief from certain requirementssome of the rules that would have taken effect on July 16, 2011 absent any rulemaking. The SECbecome effective during the fourth quarter of 2012, either completely suspending or delaying the application of some requirements.
While the CFTC has provided temporary exemptive relief is effective untilfrom application of derivatives requirements of the Financial Reform Act for certain non-U.S. derivatives activity, there remains some uncertainty as to how the derivatives requirements of the Financial Reform Act will apply to non-U.S. derivatives activity because the CFTC has not yet adopted final rules relevant to each requirement become effective. cross-border guidance. The CFTC temporary relief is effective untilhas completed much of its other rulemakings, with the earlierexception of July 16, 2012 orfinal margin, capital and exchange trading rules, while the date on which final rules relevant to each requirement become effective.SEC has finalized a small number of clearing-related rules. The ultimate impact of thesethe derivatives regulations that have not yet been finalized and the time it will take to comply continues to remain uncertain. The final regulations will impose additional operational and compliance costs on us and may require us to restructure certain businesses therebyand may negatively impactingimpact our revenues and results of operations.operations.
FDIC Deposit Insurance Assessments
In April 2011, a new regulation became effective that implements revisions to the assessment system mandated by the Financial Reform Act and increased our FDIC exposure. The regulation was reflected in the June 30, 2011 FDIC fund balance and in payments made beginning on September 30, 2011. Among other things, the regulation changed the assessment base for insured depository institutions from adjusted domestic deposits to average consolidated total assets during an assessment period, less average tangible equity capital during that assessment period. Additionally, the FDIC has broad discretionary authority to increase assessments on large and highly complex institutions on a case by case basis. Any future increases in required deposit insurance premiums or other bank industry fees could have an adverse impact on our financial condition and results of operations.
Recovery and Resolution Planning
On October 17, 2011, theThe Federal Reserve approved a ruleand the FDIC require that requires the Corporation and other bank holding companies (BHCs) with assets of $50 billion or more, as well as companies designated as systemically important by the Financial Stability Oversight Council, to periodically report to the FDIC and the Federal Reservesubmit annually their plans for a rapid and orderly resolution in the event of material financial distress or failure.
On January 17, 2012,A resolution plan is intended to be a detailed roadmap for the FDIC approved a final rule requiringorderly resolution plans for insured banks with total assets of $50 billionthe BHC and material entities pursuant to the U.S. Bankruptcy Code under one or more.more hypothetical scenarios assuming no extraordinary government assistance. If the FDIC and the Federal Reserve determine that a company’sour plan is not credible and the company failswe fail to cure the deficiencies in a timely manner, then the FDIC and
the Federal Reserve may jointly impose on the company, or any of its subsidiaries, more stringent capital, leverage or liquidity requirements or restrictions on growth, activities or operations. The Corporation’soperations of the Corporation. We submitted our initial plan in 2012, which is required to be submitted on or before July 1, 2012, and updated annually.
Similarly, in the U.K., the Financial Services Authority (FSA) has issued proposed rules requiring the submission of significant information about certain U.K. incorporated subsidiaries includingand other financial institutions, as well as branches of non-U.K. banks located in the U.K. (including information on intra-group dependencies, and legal entity separation and barriers to resolution) to allow the FSA to develop resolution plans. As a result of the FSA review, we could be required to take certain actions over the next several years which could impose operational costs and potentially result in the restructuring of certain business and subsidiaries.
Orderly Liquidation Authority
Under the Financial Reform Act, wherewhen a systemically important financial institution such as the Corporation is in default or danger of default, the FDIC may in certain circumstances, be appointed receiver in order to conduct an orderly liquidation of such systemically important financial institution. In the event of such a case,appointment, the FDIC could invoke a new form of resolution authority, called the orderly liquidation authority, instead of the U.S. Bankruptcy Code, if the Secretary of the Treasury makes certain financial distress and systemic risk determinations. The orderly liquidation authority is modeled in part on the Federal Deposit Insurance Act, but also adopts certain concepts from the U.S. Bankruptcy Code.
The orderly liquidation authority contains certain differences from the U.S. Bankruptcy Code. Macroprudential systemic protection is the primary objective of the orderly liquidation authority, subject to minimum threshold protections for creditors. Accordingly, in certain circumstances under the orderly liquidation authority, the FDIC could permit payment of obligations determined
it determines to be systemically significant (e.g., short-term creditors or operating creditors) in lieu of the payment ofpaying other obligations (e.g., long-term creditors) without the need to obtain creditors’ consent or prior court review. The insolvency and resolution process could also lead to a large reduction or total elimination of the value of a BHC’s outstanding equity. For example, the FDIC could follow a “single point of entry” approach and replace a distressed BHC with a bridge holding company, which could continue operations and result in an orderly resolution of the underlying bank, but whose equity is held solely for the benefit of creditors of the original BHC. Additionally, under the orderly liquidation authority, amounts owed to the U.S. government generally enjoyreceive a statutory payment priority.priority.
Credit Risk Retention
On March 29, 2011, federal regulators jointly issued a proposed rule regarding credit risk retention that would, among other things, require retention by sponsors ofto retain at least five percent of the credit risk of the assets underlying certain ABS and MBS securitizations and would limit the ability to transfer or hedge that credit risk. The proposed rule as currently written would likely have an adverse impact on our ability to engage in many types of the MBS and ABS securitizations conducted in CRES, GBAMGlobal Markets and other business segments, impose additional operational and compliance costs on us, and negatively influence the value, liquidity and transferability of ABS or MBS, loans and other assets. However, it remains unclear what requirements will be included in
the final rule and what the ultimate impact of the final rule will be on our CRES, GBAMGlobal Markets and other business segments or on our results of operations.
The Consumer Financial Protection Bureau
The Financial Reform Act established the Consumer Financial Protection Bureau (CFPB) to regulate, which principally regulates the offering of consumer financial products or services under federal consumer financial laws. In addition, the CFPB was granted general authority to prevent covered persons or service providers from committing or engaging in unfair, deceptive or abusive acts or practices under federal law in connection with any transaction with a consumer for a consumer financial product or service, or the offering of a consumer financial product or service. Pursuant to the Financial Reform Act, on July 21, 2011, certain federal consumer financial protection statuteslaws, and related regulatory authority were transferred to the CFPB. Consequently, certainwhich has commenced its supervisory oversight. Certain federal consumer financial laws to which the Corporation is subject including, but not limited to, the Equal Credit Opportunity Act, Home Mortgage Disclosure Act, Electronic Fund Transfers Act, Fair Credit Reporting Act, Truth in Lending and Truth in Savings Acts will beare enforced by the CFPB, subject to certain statutory limitations. On January 4, 2012, the CFPB’s first director was appointed, and accordingly, was vested with fullThrough its rulemaking authority, to exercise all supervisory, enforcement and rulemaking authorities granted to the CFPB underhas promulgated several proposed and final rules that will affect our consumer businesses. Among these initiatives is a recently-issued final rule implementing sections of the Financial Reform Act including its supervisory powers over non-bank financial institutionsestablishing “ability to repay” and “qualified mortgage” standards under the Truth in Lending Act. In addition, the CFPB issued a final rule establishing mortgage loan servicing standards through amendments to the Real Estate Settlement Procedures Act. The CFPB has also proposed rules addressing items such as pay-day lendersremittance transfer services, appraisal requirements and other types of non-bankloan originator compensation requirements. The Corporation is evaluating the various CFPB rules and proposals and devoting substantial compliance, legal and operational business resources to facilitate compliance with these rules by their respective effective dates. In addition, the Corporation has cooperated with the CFPB on several industry-related information collection requests involving consumer financial institutions.products and services, including overdraft fees and practices.
Certain Other Provisions
The Financial Reform Act also expands the role of state regulators in enforcing consumer protection requirements over banks and disqualifies trust preferred securities and other hybrid capital securities from Tier 1 capital. Many of the provisions under the Financial Reform Act have only begun to be phasedimplemented or remain to be implemented in or will be phased in over the next several months or yearsfuture and will be subject both to further rulemaking and the discretion of applicable regulatory bodies. For additional information regarding regulatory capital and other rules proposed by federal regulators, see Capital Management – Regulatory Capital Changes on page 7372.
The Financial Reform Act will continue to have a significant and negativean adverse impact on our earnings through fee reductions, higher costs and imposition of new restrictions as well as reductions to available capital.on us. The Financial Reform Act may also continue to have a material adverse impact on the value of certain assets and liabilities held on our balance sheet. The ultimate impact of the Financial Reform Act on our businesses and results of operations will depend on regulatory interpretation and rulemaking, as well as the success of any of our actions to mitigate the negative earnings impact of certain provisions. For information on the impact of the Financial Reform Act on our credit ratings, see Liquidity Risk on page 76.
Transactions with Affiliates
The terms of certain of our OTC derivative contracts and other trading agreements of the Corporation provide that upon the occurrence of certain specified events, such as a change in our credit ratings, Merrill Lynch and other non-bank affiliates may be required to provide additional collateral or to provide other remedies, or our counterparties may have the right to terminate
or otherwise diminish our rights under these contracts or agreements. FollowingIn the recent downgradeevent of further downgrades of the credit ratings of the Corporation and other non-bank affiliates, we have engagedmay engage in discussions with certain derivative and other counterparties regarding their rights under these agreements. In response to counterparties’ inquiries and requests, we have discussed and in some cases substituted derivative contracts and other trading agreements, including potentially naming BANA as the new counterparty.counterparties. Our ability to substitute or make changes to these agreements to meet counterparties’ requests may be subject to certain limitations, including counterparty willingness, regulatory limitations on naming BANA as the new counterparty, and the type or amount of collateral required. It is possible that such limitations on our ability to substitute or make changes to these agreements, including naming BANA as the new counterparty, could adversely affect our results of operations.
Other Matters
The Corporation has established guidelines and policies for managing capital across its subsidiaries. The guidance for the Corporation’s subsidiaries with regulatory capital requirements, including branch operations of banking subsidiaries, requires each entity to maintain satisfactory capital levels. This includes setting internal capital targets for the U.S. bank subsidiaries to exceed “well capitalized”“well-capitalized” levels. The U.K. has adopted increased capital and liquidity requirements for local financial institutions, including regulated U.K. subsidiaries of non-U.K. bank holding companiesBHCs and other financial institutions as well as branches of non-U.K. banks located in the U.K. In addition, the U.K. has proposed the creation and production of recovery and resolution plans, commonly referred to as living wills, by suchsignificant regulated legal entities. We are currently monitoring the impact of these initiatives.
Managing Risk
Overview
Risk is inherent in every material business activity that we undertake. Our business exposes us to strategic, credit, market, liquidity, compliance, operational and reputational risk.risks. We must manage these risks to maximize our long-term results by ensuring
the integrity of our assets and the quality of our earnings.
Strategic risk is the risk that results from adverse business decisions, ineffective or inappropriate business plans, or failure to respond to changes in the competitive environment, business cycles, customer preferences, product obsolescence, regulatory environment, business strategy execution, and/or other inherent risks of the business including reputational risk. Credit risk is the risk of loss arising from a borrower’s or counterparty’s inability to meet its obligations. Market risk is the risk that values of assets and liabilities or revenues will be adversely affected by changes in market conditions such as interest rate movements. Liquidity risk is the inability to meet contractual and contingent financial obligations, on-oron- or off-balance sheet, as they come due. Compliance risk is the risk that arises from the failure to adhere to laws, rules, regulations, or internal policies and procedures. Operational risk is the risk of loss resulting from inadequate or failed internal processes, people and systems, or external events. Reputational risk is the potential that negative publicity regarding an organization’s conduct or business practices will adversely affect its profitability, operations or customer base, or result in costly litigation or require other measures. Reputational risk is evaluated along with all of the risk categories and throughout the risk management process, and as such is not discussed separately herein. The following sections, Strategic Risk
Management on page 71,and Capital Management both on page 7170, Liquidity Risk on page 7675, Credit Risk Management on page 8079, Market Risk Management on page 112113, Compliance Risk Management and Operational Risk Management both on page 119120, address in more detail the specific procedures, measures and analyses of the major categories of risk that we manage.
In choosing when and how to take risks, we evaluate our capacity for risk and seek to protect our brand and reputation, our financial flexibility, the value of our assets and the strategic potential of the Corporation. We intend to maintain a strong and flexible financial position. We also intend to focus on maintaining our relevance and value to customers, employees and shareholders. As part of our efforts to achieve these objectives, we continue to build a comprehensive risk management culture and to implement governance and control measures to strengthen that culture.
We take a comprehensive approach to risk management. We have a defined risk framework and clearly articulated risk appetite which is approved annually by the Corporation’s Board of Directors (the Board). Risk management planning is integrated with strategic, financial and customer/client planning so that goals and responsibilities are aligned across the organization. Risk is managed in a systematic manner by focusing on the Corporation as a whole as well as managing risk across the enterprise and within individual business units, products, services and transactions, and across all geographic locations. We maintain a governance structure that delineates the responsibilities for risk management activities, as well as governance and oversight of those activities.
Executive management assesses, and thewith Board oversees,oversight, the risk-adjusted returns of each business segment. Management reviews and approves strategic and financial operating plans, and recommends to the Board for approval a financial plan annually. By allocating economic capital to and establishing a risk appetite for a business segment, we seek to effectively manage the ability to take on risk. Economic capital is assigned to each business segment using a risk-adjusted methodology incorporating each segment’s stand-alone credit, market, interest rate and operational
riskcomponents, and is used to measure risk-adjusted returns. We regularly evaluate these allocations as part of our overall governance processes as the businesses and the economic environment in which we operate continue to evolve.
In addition to reputational considerations, businesses operate within their credit, market, compliance and operational risk standards and limits in order to adhere to the risk appetite. These limits are based on analyses of risk and reward in each business, and executivebusiness. Executive management is responsible for tracking and reporting performance measurements as well as any exceptions to guidelines or limits. The Board, monitorsand its committees when appropriate, monitor financial performance, execution of the strategic and financial operating plans, compliance with the risk appetite and the adequacy of internal controls through its committees.controls.
The Board has completed its review of the Risk Framework and the Risk Appetite Statement for the Corporation, and both the Risk Framework and Risk Appetite Statement were approved in January 2012.2013. The Risk Framework defines the accountability of the Corporation and its employees and the Risk Appetite Statement defines the parameters under which we will take risk. Both documents are intended to enable us to maximize our long-term results and ensure the integrity of our assets and the quality of our earnings. The Risk Framework is designed to be used by our employees to understand risk management activities, including
their individual roles and accountabilities. It also defines how risk management is integrated into our core business processes, and it defines the risk management governance structure, including management’s involvement. The risk management responsibilities of the businesses, governance and control functions, and Corporate Audit are also clearly defined. The risk management process includes four critical elements: identify and measure risk, mitigate and control risk, monitor and test risk, and report and review risk, and is applied across all business activities to enable an integrated and comprehensive review of risk consistent with the Board’s Risk Appetite Statement.
Risk Management Processes and Methods
To support our corporate goals and objectives, risk appetite, and business and risk strategies, we maintain a governance structure that delineates the responsibilities for risk management activities, as well as governance and oversight of those activities, by management and the Board. All employees have accountability for risk management. Each employee’s risk management responsibilities falls into one of three major categories: businesses, governance and control, and Corporate Audit.
Business managers and employees are accountable for identifying, managing and escalating attention to all risks in their business units, including existing and emerging risks. Business managers must ensure that their business activities are conducted within the risk appetite defined by management and approved by the Board. The limits and controls for each business must be consistent with the Risk Appetite Statement. Employees in client and customer facing businesses are responsible for day-to-day business activities, including developing and delivering profitable products and services, fulfilling customer requests and maintaining desirable customer relationships. These employees are accountable for conducting their daily work in accordance with policies and procedures. It is the responsibility of each employee to protect the Corporation and defend the interests of the shareholders.
Governance and control functions are comprised of Global Risk Management, Global Compliance, Legal and the enterprise control functions and are tasked with independently overseeing and managing risk activities. Global Compliance (which included
includes Regulatory Relations) and Legal report to the Chief Legal, Compliance and Regulatory Relations Executive. Enterprise control functions consist of the Chief Financial Officer (CFO) Group, Global Technology and Operations, Global Human Resources, and Global Marketing and Corporate Affairs.
Global Risk Management is led by the Chief Risk Officer (CRO). The CRO leads senior management in managing risk, is independent from the Corporation’s businessbusinesses and enterprise control functions, and maintains sufficient autonomy to develop and implement meaningful risk management measures. This position serves to protect the Corporation and its shareholders. The CRO reports to the Chief Executive Officer (CEO) and is the management team lead or a participant in Board-level risk governance committees. The CRO has the mandate to ensure that appropriate risk management practices are in place, and are effective and consistent with our overall business strategy and risk appetite. Global Risk Management is comprised of two types of risk teams, Enterprise risk teams and independent business risk teams, which report to the CRO and are independent from the business and enterprise control functions.
Enterprise risk teams are responsible for setting and establishing enterprise policies, programs and standards, assessing program adherence, providing enterprise-level risk oversight, and reporting and monitoring for systemic and emerging risk issues. In addition, the Enterprise Risk Teamsenterprise risk teams are responsible for monitoring and ensuring that risk limits are reasonable and consistent with the risk appetite. These risk teams also carry out risk-based oversight of the enterprise control functions.
Independent business risk teams are responsible for establishing policies, limits, standards, controls, metrics and thresholds within the defined corporate standards for the businesses to which they are aligned. The independent business risk teams are also responsible for ensuring that risk limits and standards are reasonable and consistent with the risk appetite.
Enterprise control functions are independent of the businesses and have risk governance and control responsibilities for enterprise programs. In this role, they are responsible for setting policies, standards and limits; providing risk reporting; monitoring for systemic risk issues including existing and emerging; and implementing procedures and controls at the enterprise and business levels for their respective control functions.
The Corporate Audit function and the Corporate General Auditor maintainmaintains independence from the businesses and governance and control functions by reporting directly to the Audit Committee of the Board. Corporate Audit provides independent assessment and validation through testing of key processes and controls across the Corporation. Corporate Audit also provides an independent assessment of the Corporation’s management and internal control systems. Corporate Audit activities are designed to provide reasonable assurance that resources are adequately protected; significant financial, managerial and operating information is materially complete, accurate and reliable; and employees’ actions are in compliance with the Corporation’s policies, standards, procedures, and applicable laws and regulations.
To assist the Corporation in achieving its goals and objectives, risk appetite, and business and risk strategies, we utilize a risk management process that is applied across the execution of all business activities. This risk management process, which is an integral part of our Risk Framework, enables the Corporation to review risk in an integrated and comprehensive manner across all risk categories and make strategic and business decisions based on that comprehensive view. Corporate goals and objectives are
established by management, and management reflects these goals and objectives in our risk appetite which is approved by the Board and serves as a key driver for setting business and risk strategy.
One of the key tools of the risk management process is the use of Risk and Control Self Assessments (RCSAs). RCSAs are the primary method for facilitating the management of Business Environmentbusiness environment and Internal Control Factorinternal control factor data. The end-to-end RCSA process incorporates risk identification and assessment of the control environment; monitoring, reporting and escalating risk; quality assurance and data validation; and integration with the risk appetite. The RCSA process also incorporates documentation by either the business or governance and control functions of the business environment, risks, controls, and monitoring and reporting. This results in a comprehensive risk management view that enables understanding of and action on operational risks and controls for all of our processes, products, activities and systems.
The formal processes used to manage risk represent a part of our overall risk management process. Corporate culture and the actions of our employees are also critical to effective risk management. Through our Code of Ethics, we set a high standard for our employees. The Code of Ethics provides a framework for all of our employees to conduct themselves with the highest
integrity. We instill a strong and comprehensive risk management culture through communications, training, policies, procedures, and organizational roles and responsibilities. Additionally, we continue to strengthen the link between the employee performance management process and individual compensation to encourage employees to work toward enterprise-wide risk goals.
Enterprise-wide Stress Testing
As a part of our core risk management practices, we conduct enterprise-wide stress tests on a periodic basis to better understand balance sheet, earnings, capital and liquidity sensitivities to certain economic and business scenarios, including economic and market conditions that are more severe than anticipated. These enterprise-wide stress tests provide illustrative hypothetical potential impacts from our risk profile on our balance sheet, earnings, capital and liquidity and serve as a key component of our capital, liquidity and risk management practices. Scenarios are selected by the Asset Liability and Market Risk Committee (ALMRC) and approved by the CFO and the CRO. Impacts to each business from each scenario are then determined and analyzed, primarily by leveraging the models and processes utilized in everyday management routines. Impacts are assessed along with potential mitigating actions that may be taken. Analysis from such stress scenarios is compiled for and reviewed through our Chief Financial Officer Risk Committee (CFORC), ALMRC and the Board’s Enterprise Risk Committee.
Contingency Planning Routines
We have developed and maintain contingency plans that prepare us in advance to respond in the event of potential adverse outcomes and scenarios. These contingency planning routines include capital contingency planning, liquidity contingency funding plans, recovery planning and enterprise resiliency, and provide for monitoring, escalation routines, and response plans. Contingency response plans are designed to enable us to increase capital, access funding sources, and reduce risk through consideration of potential actions that includes asset sales, business sales, capital or debt issuances, and other de-risking strategies.
Board Oversight of Risk
The Board, comprised of a substantial majority of independent directors, including an independent Chairman of the Board, oversees the management of the Corporation through a governance structure that includes Board committees and management committees. The Board’s standing committees that oversee the management of the majority of the risks faced by the Corporation include the Audit and Enterprise Risk Committees, comprised of independent directors, and the Credit Committee, comprised of non-management directors. This governance structure is designed to align the interests of the Board and management with those of our stockholders and to foster integrity throughout the Corporation.
The chart below illustrates the inter-relationship betweenamong the Board, Board committees and management committees with the majority of risk oversight responsibilities for the Corporation.
| |
(1) | Compliance Risk activities, including Ethics Oversight, are required toChart is not comprehensive; there may be reviewed by the Audit Committee and Operational Risk activities are required to be reviewed by the Enterprise Risk Committee.additional subcommittees not represented in this chart. This presentation does not include committees for other legal entities. |
| |
(2) | The DisclosureReports through the Audit Committee assistsfor compliance and through the Enterprise Risk Committee for operational and reputational risk. |
| |
(3) | Reports to the CEO and CFO in fulfilling their responsibility for the accuracy and timeliness of the Corporation’s disclosures and reports the results of the process towith oversight by the Audit Committee. |
Our Board’s Audit, Credit and Enterprise Risk Committees have the principal responsibility for assisting the Board with enterprise-wide oversight of the Corporation’s management and handling of risk.
Our Audit Committee assists the Board in the oversight of, among other things, the integrity of our consolidated financial statements, our compliance with legal and regulatory requirements, and the overall effectiveness of our system of internal controls. Our Audit Committee also, taking into consideration the Board’s allocation of the review of risk among various committees of the Board, discusses with management guidelines and policies to govern the process by which risk assessment and risk management are undertaken, including the assessment of our major financial risk exposures and the steps management has taken to monitor and control such exposures.
Our Credit Committee oversees, among other things, the identification and management of our credit exposures on an enterprise-wide basis, our responses to trends affecting those exposures, the adequacy of the allowance for credit losses and our credit related policies.
Our Enterprise Risk Committee oversees, among other things, oversees our identification of, management of and planning for material risks on an enterprise-wide basis, including market risk, interest rate risk, liquidity risk, operational risk and reputational risk. Our Enterprise Risk Committee also oversees our capital management and liquidity planning.
Each of these committees regularly reports to our Board on risk-related matters within the committee’s responsibilities, which collectively provides our Board with integrated, thorough insight about our management of our enterprise-wide risks. At meetings of our Audit, Credit and Enterprise Risk Committees and our Board, directors receive updates from management regarding enterprise risk management, including our performance against our risk appetite.
Executive management develops for Board approval the Corporation’s Risk Framework, Risk Appetite Statement and financial operating plans. Management monitors, and the Board oversees, through the Credit, Enterprise Risk and Audit Committees, financial performance, execution of the strategic and financial operating plans, compliance with the risk appetite and the adequacy of internal controls.
Strategic Risk Management
Strategic risk is embedded in every business and is one of the major risk categories along with credit, market, liquidity, compliance, operational and reputational risks. It is the risk that results from adverse business decisions, ineffective or inappropriate business plans, or failure to respond to changes in the competitive environment, business cycles, customer preferences, product obsolescence, regulatory environment, business strategy execution and/or other inherent risks of the business. Other inherent risks of the business includinginclude reputational and operational risk. In the financial services industry, strategic risk is elevated due to changing customer, competitive and regulatory environments. Our appetite for strategic risk is assessed within the context of the strategic plan, with strategic risks selectively and carefully considered in the context of the evolving marketplace. Strategic risk is managed in the context of our overall financial condition
and assessed, managed and acted on by the CEO and executive management team. Significant strategic actions, such as material acquisitions or capital actions, require review and approval ofby the Board.
Executive management approves a strategic plan every two to three years.each year. Annually, executive management develops a financial operating plan that implements the strategic goals for that year, which is reviewed and approved by the Board reviews and approves the plan.Board. With oversight by the Board, executive management ensures that the plans are consistent withconsistency is applied while executing the Corporation’s strategic plan, core operating tenets and risk appetite. The following are assessed in their reviews: forecasted earnings and returns on capital, the current risk profile, current capital and liquidity requirements, staffing levels and changes required to support the plan, stress testing results, and other qualitative factors such as market growth rates and peer analysis. At the business level, as we introduce new products, we monitor their performance to evaluate expectations (e.g., for earnings and returns on capital). With oversight by the Board, executive management performs similar analyses throughout the year, and evaluates changes to the financial forecast or the risk, capital or liquidity positions as deemed appropriate to balance and optimize between achieving the targeted risk appetite, shareholder returns and maintaining the targeted financial strength.
We use proprietary models to measure the capital requirements for credit, country, market, operational and strategic risks. The economic capital assigned to each business is based on its unique risk exposures. With oversight by the Board, executive management assesses the risk-adjusted returns of each business in approving strategic and financial operating plans. The businesses use economic capital to define business strategies, price products and transactions, and evaluate client profitability. For additional information on how this measure is calculated, see Supplemental Financial Data on page 3835.
Capital Management
Bank of AmericaThe Corporation manages its capital position to ensuremaintain sufficient capital is sufficient to support our business activities and thatmaintain capital, risk and risk appetite are commensurate with one another, ensureanother. Additionally, we seek to maintain safety and soundness at all times including under adverse scenarios,conditions, take advantage of organic growth and strategic opportunities, maintain ready access to financial markets, continue to serve as a credit intermediary, remain a source of strength for itsour subsidiaries, and satisfy current and future regulatory capital requirements.
To determine the appropriate level of capital, we assess the results of our Internal Capital Adequacy Assessment Process (ICAAP), the current economic and market environment, and feedback from key stakeholders including investors, rating agencies and regulators. Based upon this analysis, we set capital guidelines for Tier 1 common capital and Tier 1 capitalratios to ensure we can maintain an adequate capital position, including in a severe adverse economic scenario. We also target to maintain capital in excess of the capital required per our economic capital measurement process. For additional information, see Economic Capital on page 75.scenarios. Management and the Board annually approve a comprehensive Capital Plancapital plan which documents the ICAAP and related results, analysis and support for the capital guidelines, and planned capital actions and capital adequacy assessment.actions.
The ICAAP incorporates capital forecasts, stress test results, economic capital, qualitative risk assessments and assessment of regulatory changes. WeThroughout the year, we generate monthly regulatory capital and economic capital forecasts that are aligned to the most recent earnings, balance sheet and risk forecasts. We utilize quarterly stress tests to assess the potential impacts to our balance sheet, earnings, capital and liquidity forof a variety of economic stress scenarios. We perform qualitative risk assessments to identify and assess material risks not fully captured in the forecasts, stress tests or economic capital. Given the significant proposed regulatory capital changes, we alsoWe regularly assess the potential capital impacts and monitor associated mitigation actions.of proposed changes to regulatory capital requirements. Management continuouslyregularly assesses ICAAP results and provides documented quarterly assessments of the adequacy of the capital guidelines and capital position to the Board or its committees.
Capital management is integrated into theour risk and governance processes, as capital is a key consideration in the development of the strategic plan, risk appetite and risk limits. Economic capital is allocated to each business unit and used to perform risk-adjusted return analysisanalyses at the business unit, client relationship and transaction levels.
Regulatory Capital
As a financial services holding company, we are subject to the risk-based capital guidelines (Basel I)1) issued by federal banking regulators. At December 31, 20112012, we operated banking activities primarily under two charters: BANA and FIA Card Services, N.A. (FIA). Under these guidelines, the Corporation and its affiliated banking entities measure capital adequacy based on Tier 1 common capital, Tier 1 capital and Total capital (Tier 1 plus Tier 2 capital). Capital ratios are calculated by dividing each capital amount by risk-weighted assets. Additionally, Tier 1 capital is divided by adjusted quarterly average total assets to derive the Tier 1 leverage ratio.
Tier 1 capital is calculated as the sum of “core capital elements.elements,” The predominatethe principal components of core capital elementswhich are qualifying common stockholders’shareholders’ equity and qualifying noncumulativenon-cumulative perpetual preferred stock. Also included in Tier 1 capital are qualifying trust preferred securities (Trust Securities), hybrid securities and qualifying non-controllingnoncontrolling interest in subsidiaries which are subject to the rules governing “restricted core capital elements.” Goodwill, other disallowed intangible assets, disallowed deferred tax assets and the cumulative changes in fair value of all financial liabilities accounted for under the fair value option that are included in retained earnings and are attributable to changes in the company’s own creditworthiness are deducted from the sum of the core capital elements. Total capital is the sum of Tier 1 plus supplementary Tier 2 capital elements such as qualifying subordinated debt, a limited portion of the allowance for loan and lease losses, and a portion of net unrealized gains on AFS marketable equity securities. Tier 1 common capital is not
an official regulatory ratio, but was introduced by the Federal Reserve during the Supervisory Capital Assessment Program in 2009. Tier 1 common capital is Tier 1 capital less preferred stock, Trust Securities, hybrid securities and qualifying non-controllingnoncontrolling interest in subsidiaries.
Risk-weighted assets are calculated for credit risk for all on- and off-balance sheet credit exposures and for market risk on trading assets and liabilities, including derivative exposures. Credit risk risk-weighted assets are calculated by assigning a prescribed risk-weight to all on-balance sheet assets and to the credit equivalent amount of certain off-balance sheet exposures. The risk-weight is defined in the regulatory rules based upon the obligor or guarantor type and collateral if applicable. Off-balance sheet exposures include financial guarantees, unfunded lending commitments, letters of credit and derivatives. Market risk risk-weighted assets are calculated using risk models for the trading account positions, including all foreign exchange and commodity positions regardless of the applicable accounting guidance. Under Basel I1 there are no risk-weighted assets calculated for operational risk. Any assets that are a direct deduction from the computation of capital are excluded from risk-weighted assets and adjusted average total assets consistent with regulatory guidance.
The Corporation has issued notes to certain unconsolidatedCertain corporate-sponsored trust companies which issuedissue Trust Securities and hybrid securities.are not consolidated. In accordance with Federal Reserve guidance effective March 31, 2011, Trust Securities continue to qualify as Tier 1 capital with revised quantitative limits. As a result, the Corporation includes qualifying Trust Securities in Basel 1 Tier 1 capital. The Financial Reform Act includes a provision under which Trust Securities will no longer qualify as Tier 1 capital. Under one of three notices of proposed rulemaking on Basel 3 issued by U.S. banking regulatory agencies, the Corporation’s previously issued and outstanding Trust Securities in the aggregate qualifying amount of $16.1$6.2 billion (approximately 12551 bps of Tier 1 capital) at December 31, 20112012, will be excludednot qualify as Tier 1 capital. While not yet final, the proposed rules provide a three-year transition period in which the exclusion of Trust Securities from Tier 1 capital with the exclusion towill be phased in incrementally overeach year.
The Federal Reserve requires BHCs to submit a three-year period beginning January 1, 2013. This amount excludes $633 million of hybrid Trust Securities that are expected to be converted to preferred stock priorcapital plan and requests for capital actions on an annual basis, consistent with the rules governing the Comprehensive Capital Analysis and Review (CCAR). The CCAR is the central element to the dateFederal Reserve’s approach to ensuring large BHCs have adequate capital and robust processes for managing their capital. In January 2012, we submitted our 2012 capital plan, and received results on March 13, 2012. The Federal Reserve’s stress scenario projections for the Corporation, based on the 2012 capital plan, estimated a minimum Basel 1 Tier 1 common capital ratio of implementation.5.9 percent under severe adverse economic conditions with all proposed capital actions through the end of 2013, exceeding the five percent reference rate for all institutions involved in the CCAR. The treatmentcapital
plan submitted by the Corporation to the Federal Reserve did not include a request to return capital to stockholders in 2012 above the current dividend rate. The Federal Reserve did not object to our 2012 capital plan. On January 7, 2013, we submitted our 2013 capital plan and related supervisory stress tests. The Federal Reserve has announced its intention to notify the 2013 CCAR participants of Trust Securities during the phase-in period is unknownsupervisory stress test results on March 7, 2013 and is subject to future rulemaking.the capital plan on March 14, 2013.
For additional information on these and other regulatory requirements, see Note 1817 – Regulatory Requirements and Restrictions to the Consolidated Financial Statements.
Capital Composition and Ratios
Under Basel 1, Tier 1 common capital increased $1.66.7 billion in 2012 to $126.7133.4 billion at December 31, 2011 compared to 20102012. The increase was primarily driven primarily by the sale of CCB shares, the exchanges of preferred shares, Trust Securities and hybrid securities for common stock and debt, and the warrants issuedearnings eligible to be included in connection withcapital, which positively impacted the investment made by Berkshire, partially offset by an increase in deferred tax assets disallowed for regulatory capital purposes. The sales related to CCB increased Tier 1 common capital $6.4
billion, or approximately 55 bps, while the exchanges increasedrepurchases of certain of our debt and Trust Securities. The Tier 1 common capital $3.9 billion, or approximately 29 bps. The warrants related to Berkshire, increased Tier 1ratio also benefited seven bps from the issuance of common capital approximately $2.1 billion, or 15 bps. The $8.1 billion increasestock in the deferred tax asset disallowance at December 31, 2011 compared to 2010 was primarily due to the expirationlieu of the longer look-forward period granted by regulators at the timecash for a portion of the Merrill Lynch acquisition and an increase in net deferred tax assets. Tier 1 capital andemployee incentive compensation. Total capital decreased $4.418.4 billion andin 2012 to $14.5196.7 billion at December 31, 20112012 comparedprimarily due to 2010. For additional information regarding the salea reduction in subordinated debt as a result of our investmentredemptions and a reduction in CCB, see Note 5 –Trust Securitiesto the Consolidated Financial Statements. For additional information regarding the exchanges from redemptions and the investment made by Berkshire, see Note 13 – Long-term Debt and Note 15 – Shareholders’ Equityto the Consolidated Financial Statements.exchanges.
Risk-weighted assets decreased $17278.5 billion in 2012 to $1,2841,206 billion at December 31, 2011 compared to 20102012. The decrease was primarily driven by decreases in partderivatives, letters of credit and other assets. These decreases positively impacted Tier 1 common, Tier 1 and Total capital ratios by our sale of CCB shares64 bps, 78 bps and our Canadian card business and is consistent with our continued efforts to reduce non-core assets and legacy loan portfolios.102 bps, respectively. The Tier 1 common capital ratio, the Tier 1 capital ratio and the Total capital ratio increased due to the decline in risk-weighted assets. The Tier 1
leverage ratio increaseddecreased16 compared tobps in 20102012 reflectingprimarily driven by the decrease in Tier 1 capital and a reduction in adjusted quarterly average total assets.capital.
Table 13 presents Bank of America Corporation’s capital ratios and related information in accordance with Basel 1 at December 31, 20112012 and 20102011.
| | | | | | | | | | | |
| Table 13 | Bank of America Corporation Regulatory Capital | Bank of America Corporation Regulatory Capital |
| | | | | | | | | |
| | | December 31 | | December 31 |
| (Dollars in billions) | (Dollars in billions) | 2011 | | 2010 | (Dollars in billions) | 2012 | | 2011 |
| Tier 1 common capital ratio | Tier 1 common capital ratio | 9.86 | % | | 8.60 | % | Tier 1 common capital ratio | 11.06 | % | | 9.86 | % |
| Tier 1 capital ratio | Tier 1 capital ratio | 12.40 |
| | 11.24 |
| Tier 1 capital ratio | 12.89 |
| | 12.40 |
|
| Total capital ratio | Total capital ratio | 16.75 |
| | 15.77 |
| Total capital ratio | 16.31 |
| | 16.75 |
|
| Tier 1 leverage ratio | Tier 1 leverage ratio | 7.53 |
| | 7.21 |
| Tier 1 leverage ratio | 7.37 |
| | 7.53 |
|
| Risk-weighted assets | Risk-weighted assets | $ | 1,284 |
| | $ | 1,456 |
| Risk-weighted assets | $ | 1,206 |
| | $ | 1,284 |
|
Adjusted quarterly average total assets (1) | Adjusted quarterly average total assets (1) | 2,114 |
| | 2,270 |
| Adjusted quarterly average total assets (1) | 2,111 |
| | 2,114 |
|
| |
(1) | Reflects adjusted average total assets for the three months ended December 31, 20112012 and |
20102011.
Table 14 presents the capital composition at December 31, 20112012 and 20102011.
| | | | | | | | | | | |
| Table 14 | Capital Composition | | | | Capital Composition | | | |
| | | | | | | | | |
| | | December 31 | | December 31 |
| (Dollars in millions) | (Dollars in millions) | 2011 | | 2010 | (Dollars in millions) | 2012 | | 2011 |
| Total common shareholders’ equity | Total common shareholders’ equity | $ | 211,704 |
| | $ | 211,686 |
| Total common shareholders’ equity | $ | 218,188 |
| | $ | 211,704 |
|
| Goodwill | Goodwill | (69,967 | ) | | (73,861 | ) | Goodwill | (69,976 | ) | | (69,967 | ) |
| Nonqualifying intangible assets (includes core deposit intangibles, affinity relationships, customer relationships and other intangibles) | Nonqualifying intangible assets (includes core deposit intangibles, affinity relationships, customer relationships and other intangibles) | (5,848 | ) | | (6,846 | ) | Nonqualifying intangible assets (includes core deposit intangibles, affinity relationships, customer relationships and other intangibles) | (4,994 | ) | | (5,848 | ) |
| Net unrealized gains or losses on AFS debt and marketable equity securities and net losses on derivatives recorded in accumulated OCI, net-of-tax | 682 |
| | (4,137 | ) | |
Net unrealized gains on AFS debt and marketable equity securities and net losses on derivatives recorded in accumulated OCI, net-of-tax | | Net unrealized gains on AFS debt and marketable equity securities and net losses on derivatives recorded in accumulated OCI, net-of-tax | (2,036 | ) | | 682 |
|
| Unamortized net periodic benefit costs recorded in accumulated OCI, net-of-tax | Unamortized net periodic benefit costs recorded in accumulated OCI, net-of-tax | 4,391 |
| | 3,947 |
| Unamortized net periodic benefit costs recorded in accumulated OCI, net-of-tax | 4,456 |
| | 4,391 |
|
Exclusion of fair value adjustment related to structured liabilities (1) | 944 |
| | 2,984 |
| |
Fair value adjustment related to structured liabilities (1) | | Fair value adjustment related to structured liabilities (1) | 4,084 |
| | 944 |
|
| Disallowed deferred tax asset | Disallowed deferred tax asset | (16,799 | ) | | (8,663 | ) | Disallowed deferred tax asset | (17,940 | ) | | (16,799 | ) |
| Other | Other | 1,583 |
| | 29 |
| Other | 1,621 |
| | 1,583 |
|
| Total Tier 1 common capital | Total Tier 1 common capital | 126,690 |
| | 125,139 |
| Total Tier 1 common capital | 133,403 |
| | 126,690 |
|
| Qualifying preferred stock | Qualifying preferred stock | 15,479 |
| | 16,562 |
| Qualifying preferred stock | 15,851 |
| | 15,479 |
|
| Trust preferred securities | Trust preferred securities | 16,737 |
| | 21,451 |
| Trust preferred securities | 6,207 |
| | 16,737 |
|
| Noncontrolling interest | 326 |
| | 474 |
| |
| Noncontrolling interests | | Noncontrolling interests | — |
| | 326 |
|
| Total Tier 1 capital | Total Tier 1 capital | 159,232 |
| | 163,626 |
| Total Tier 1 capital | 155,461 |
| | 159,232 |
|
| Long-term debt qualifying as Tier 2 capital | Long-term debt qualifying as Tier 2 capital | 38,165 |
| | 41,270 |
| Long-term debt qualifying as Tier 2 capital | 24,287 |
| | 38,165 |
|
| Allowance for loan and lease losses | Allowance for loan and lease losses | 33,783 |
| | 41,885 |
| Allowance for loan and lease losses | 24,179 |
| | 33,783 |
|
| Reserve for unfunded lending commitments | Reserve for unfunded lending commitments | 714 |
| | 1,188 |
| Reserve for unfunded lending commitments | 513 |
| | 714 |
|
| Allowance for loan and lease losses exceeding 1.25 percent of risk-weighted assets | Allowance for loan and lease losses exceeding 1.25 percent of risk-weighted assets | (18,159 | ) | | (24,690 | ) | Allowance for loan and lease losses exceeding 1.25 percent of risk-weighted assets | (9,459 | ) | | (18,159 | ) |
| 45 percent of the pre-tax net unrealized gains on AFS marketable equity securities | 45 percent of the pre-tax net unrealized gains on AFS marketable equity securities | 1 |
| | 4,777 |
| 45 percent of the pre-tax net unrealized gains on AFS marketable equity securities | 329 |
| | 1 |
|
| Other | Other | 1,365 |
| | 1,538 |
| Other | 1,370 |
| | 1,365 |
|
| Total capital | Total capital | $ | 215,101 |
| | $ | 229,594 |
| Total capital | $ | 196,680 |
| | $ | 215,101 |
|
| |
(1) | Represents loss on structured liabilities, net-of-tax, that is excluded from Tier 1 common capital, Tier 1 capital and Total capital for regulatory capital purposes. |
Regulatory Capital Changes
At December 31, 2012, we measured and reported our capital ratios and related information in accordance with Basel 1. We manage regulatory capital to adhere to internal capital guidelines and regulatory standards of capital adequacy based on our current understanding of the rules and the application of such rules to our business as currently conducted. See Capital Management on page 70 for additional information.
In June 2012, U.S. banking regulators issued the Market Risk Final Rule that amends the Basel 1 Market Risk rules (Market Risk Final Rule) effective January 1, 2013. The Market Risk Final Rule introduces new measures of market risk, a charge related to a stressed Value-at-Risk (VaR), an incremental risk charge and a comprehensive risk measure, as well as other technical modifications. As of December 31, 2012, the estimated impact of the Market Risk Final Rule would have been a 68 bps decrease in the Tier 1 common capital ratio to 10.38 percent as a result of a $78.8 billion increase in risk-weighted assets for market risk exposures.
The regulatory capital rules as written by the Basel Committee on Banking Supervision (Basel Committee) continue to expand and evolve.
In December 2007, U.S. banking regulators published final Basel 2 rules (Basel 2). We currently measure and report our capital ratios and related information in accordance withunder Basel I. See Capital Management2 on page 71 for additional information. Basel I has been subjecta confidential basis to revisions, which include final Basel II rules (Basel II) published in December 2007 by U.SU.S. banking regulators during the required parallel period, during which we provide the U.S. banking regulators both Basel 1 and Basel 2 related information in parallel. The parallel period will continue until we receive regulatory approval to exit parallel reporting and subsequently begin publicly reporting our Basel 2 regulatory capital results and related disclosures.
In June 2012, U.S. banking regulators issued three notices of proposed rulemaking (collectively, the Basel 3 NPRs) which, if adopted as proposed, would materially change Tier 1 common, Tier 1 and Total capital calculations. The Basel 3 NPRs also introduce new minimum capital ratios and buffer requirements,
III rules (Basel III) published byexpand and modify the calculation of risk-weighted assets for credit and market risk (the Advanced Approach) and introduce a Standardized Approach for the calculation of risk-weighted assets, which would replace Basel Committee in December 2010,1 and further amended in July 2011. We are currently in the Basel II parallel period.
On December 29, 2011, U.S. regulators issuedprovide a notice of proposed rulemaking (NPR) that would amend a December 2010 NPR on the Market Risk Rules. This amended NPR is expected to increase thefloor for minimum, adequately capitalized regulatory capital requirements for our trading assets and liabilities. We continue to evaluateunder the capital impactPrompt Corrective Action framework. The Prompt Corrective Action framework establishes categories of the proposed rules and currently anticipate that we will be in compliance with any final rules by the projected implementation date in late 2012.
If implemented bycapitalization, including “well-capitalized,” based on regulatory ratio requirements. U.S. banking regulators as proposed,are required to take certain mandatory actions depending on the category of capitalization. No mandatory actions are required under the Prompt Corrective Action framework for “well-capitalized” banking entities.
Under the Basel III could significantly increase our capital requirements. Basel III and the Financial Reform Act propose the disqualification of3 NPRs, Trust Securities fromwill be phased out of Tier 1 capital within equal annual installments over a three-year transition period. Many of the Financial Reform Act proposing that the disqualification be phased in from 2013 to 2015. Basel III also proposes the deduction of certain assets from capital (deferred tax assets, MSRs, investments in financial firms and pension assets, among others, within prescribed limitations), the inclusion of accumulated OCI in capital, increased capital for counterparty credit risk, and new minimum capital and buffer requirements. For additional information on deferred tax assets and MSRs, see Note 21 – Income TaxesandNote 25 – Mortgage Servicing Rightschanges to the Consolidated Financial Statements. The phase-incomposition of regulatory capital are subject to a transition period forwhere the capital deductionsimpact is proposed to occurrecognized in 20 percent increments, from 2014 through 2018 with full implementation by December 31, 2018. An increasephased in capital requirements for counterparty credit risk is proposed to be effective January 2013.incrementally each year over a five-year period. The phase-in period for the new minimum capital requirements and related buffers is proposed to occur between 2013 andfrom the effective date of the Basel 3 NPRs through 2019. On November 9, 2012, U.S. banking regulators announced that they did not expect any of the Basel 3 NPRs to become effective January 1, 2013. Final rules for Basel 3 have not yet been issued proposed regulations thatby U.S. banking regulators.
Under the Basel 3 NPRs we will implement these requirements.
Preparingbe subject to the Advanced Approach for the implementation of the new capital rules is a top strategic priority, and we expect to comply with the final rules when issued and effective. We intend to continue to build capital through retaining earnings, actively reducing legacy asset portfolios and implementing other capital related initiatives, including focusing on reducing both highermeasuring risk-weighted assets (Basel 3 Advanced Approach) when finalized and assets currently deducted, or expected to be deducted underimplemented. The Basel III, from capital. We expect non-core asset sales to play a less prominent role in our capital strategy in future periods.
On June 17, 2011,3 Advanced Approach also requires approval by the U.S. banking regulators proposed rules requiring all large bank holding companies (BHCs) to submit a comprehensive capital plan to the Federal Reserveregulatory agencies of analytical models used as part of capital measurement. If these models are not approved, it would likely lead to an annual Comprehensive Capital Analysis and Review (CCAR).increase in our risk-weighted assets, which in some cases could be significant. The Basel 3 Advanced Approach, if adopted as proposed, regulations require BHCsis expected to demonstrate adequatesubstantially increase our capital to support planned capital actions, suchrequirements as dividends, share repurchases or other forms of distributing capital. CCAR submissions are subject to the review and approval of the Federal Reserve. The Federal Reserve may require BHCs to provide prior notice under certain circumstances before making a capital distribution. On January 5, 2012, we submitted a capital plan to the Federal Reserve consistent with the proposed rules. The capital plan includes the ICAAP and related results, analysis and support for the capital guidelines, and planned capital actions. The ICAAP incorporates capital forecasts, stress test results, economic capital, qualitative risk assessments and assessmentdiscussed below.
of regulatory changes, all of which influence the capital adequacy assessment.
On July 19,In 2011, the Basel Committee published the consultative document “Globally systemic important banks: Assessment methodology and the additional loss absorbency requirement” which sets out measureson Banking Supervision (the Basel Committee) issued proposed guidance on capital requirements for global, systemically important financial institutions, of which we are one, including the methodology for measuring systemic importance, the additional capital required (the SIFI buffer), and the arrangements by which theythe guidance will be phased in. As proposed, the SIFI buffer would be met with additionalincrease minimum capital requirements for Tier 1 common equity rangingcapital from one percent to 2.5 percent, and in certain circumstances, 3.5 percent. This will be phasedAs of December 31, 2012, we estimate our SIFI buffer would have been 1.5 percent, in from 2016 through 2018.line with the Financial Stability Board’s report, “Update of Group of Global Systemically Important Banks,” issued on November 1, 2012. U.S. banking regulators have not yet provided similarissued proposed or final rules for U.S. implementation of arelated to the SIFI buffer.
Given that the U.S. regulatory agencies have issued neither proposed rulemaking nor supervisory guidance on Basel III, significant uncertainty exists regarding the eventual impacts of Basel III on U.S. financial institutions, including us. These regulatory changes also require approval by the U.S. regulatory agencies of analytical models used as part of our capital measurement and assessment, especially in the case of more complex models. If these more complex models are not approved, it could require financial institutions to hold additional capital, which in some cases could be significant.
Based on the assumed approval of these models and our current assessment of Basel III, continued focus on capital management, expectations of future performance and continued efforts to build a fortress balance sheet, we currently anticipate that our Tier 1 common equity ratio will be between 7.25 percent and 7.50 percent by the end of 2012, assuming phase-in per the regulations at that time of all deductions scheduled to occur between 2013 and 2019.
On December 20, 2011, the Federal Reserve issued proposed rules to implement enhanced supervisory and prudential requirements, and the early remediation requirements established under the Financial Reform Act. The enhanced standards include risk-based capital and leverage requirements, liquidity standards, requirements for overall risk management, single-counterparty credit limits, stress test requirements and a debt-to-equity limit for certain companies determined to pose a threat to financial stability. Comments on the proposed rules are due by March 31, 2012. The final rules, when adopted and fully implemented, are likely to influence our regulatory capital and liquidity planning process, and may impose additional operational and compliance costs on us.
Preparing for the implementation of the new capital rules is a top strategic priority, and we expect to comply with the final rules when issued and effective. Based on Basel 2, the Market Risk Final Rule and our current understanding of the Basel 3 Advanced Approach issued by U.S. banking regulators, we estimated our Basel 3 Advanced Approach Tier 1 common capital ratio, on a fully phased-in basis, to be 9.25 percent at December 31, 2012. As of December 31, 2012, we estimated that our Tier 1 common
capital would be $128.6 billion and total risk-weighted assets would be $1,391 billion, also on a fully phased-in basis. This assumes approval by U.S. banking regulators of our internal analytical models, but does not include the benefit of the removal of the surcharge applicable to the Comprehensive Risk Measure (CRM). The CRM is used to determine the risk-weighted assets for correlation trading positions. Under the Basel 3 NPRs, Tier 1 common capital includes components that exhibit heightened sensitivity to changes in interest rates, such as the cumulative change in the fair value of AFS debt securities and at least 10 percent of the fair value of MSRs recognized on the Corporation’s Consolidated Balance Sheet.
Important differences between Basel 1 and Basel 3 include capital deductions related to our MSRs, deferred tax assets and defined benefit pension assets, and the inclusion of unrealized gains and losses on debt and equity securities recognized in accumulated OCI, each of which will be impacted by future changes in interest rates, overall earnings performance or other Corporate actions. Our estimates under the Basel 3 Advanced Approach will be refined over time as a result of further rulemaking or clarification by U.S. banking regulators and as our understanding and interpretation of the rules evolve.
Basel 3 regulatory capital metrics are non-GAAP measures until they are fully adopted and required by U.S. banking regulators. Table 15 presents a reconciliation of our Basel 1 Tier 1 common capital and risk-weighted assets to our Basel 3 estimates at December 31, 2012, assuming fully phased-in measures according to the Basel 3 Advanced Approach.
For additional information regarding Basel II, Basel III,2, the Market Risk RulesFinal Rule, Basel 3 and other proposed regulatory capital changes, see Note 1817 – Regulatory Requirements and Restrictions to the Consolidated Financial Statements.
|
| | | | |
| | | |
| Table 15 | Basel 1 to Basel 3 (fully phased-in) Reconciliation | |
| | | |
| | | December 31 |
| (Dollars in millions) | 2012 |
| Regulatory capital – Basel 1 to Basel 3 (fully phased-in) | |
| Basel 1 Tier 1 capital | $ | 155,461 |
|
| Deduction of qualifying preferred stock and trust preferred securities | (22,058 | ) |
| Basel 1 Tier 1 common capital | 133,403 |
|
| Deduction of defined benefit pension assets | (737 | ) |
| Change in deferred tax assets and threshold deductions (deferred tax asset temporary differences, MSRs and significant investments) | (3,020 | ) |
| Change in all other deductions, net | (1,020 | ) |
| Basel 3 (fully phased-in) Tier 1 common capital | $ | 128,626 |
|
| | |
| Risk-weighted assets – Basel 1 to Basel 3 (fully phased-in) | |
| Basel 1 risk-weighted assets | $ | 1,205,976 |
|
| Net change in credit and other risk-weighted assets | 103,085 |
|
| Increase due to Market Risk Final Rule | 81,811 |
|
| Basel 3 (fully phased-in) risk-weighted assets | $ | 1,390,872 |
|
| | |
| Tier 1 common capital ratios | |
| Basel 1 | 11.06 | % |
| Basel 3 (fully phased-in) | 9.25 |
|
|
| | |
| | 74Bank of America 2011201273
| | |
Bank of America, N.A. and FIA Card Services, N.A. Regulatory Capital
Table 1516 presents regulatory capital information for BANA and FIA at December 31, 20112012 and 20102011.
| | | | | | | | | | | | | | | | | | | |
| Table 15 | Bank of America, N.A. and FIA Card Services, N.A. Regulatory Capital | | |
| Table 16 | | Bank of America, N.A. and FIA Card Services, N.A. Regulatory Capital | |
| | | | | | | | | | | | | | | | | |
| | | December 31 | | December 31 |
| | | 2011 | | 2010 | | 2012 | | 2011 |
| (Dollars in millions) | (Dollars in millions) | Ratio | | Amount | | Ratio | | Amount | (Dollars in millions) | Ratio | | Amount | | Ratio | | Amount |
| Tier 1 | | |
| | |
| | |
| | |
| | |
| | |
| | |
| | |
|
| Bank of America, N.A. | Bank of America, N.A. | 11.74 | % | | $ | 119,881 |
| | 10.78 | % | | $ | 114,345 |
| Bank of America, N.A. | 12.44 | % | | $ | 118,431 |
| | 11.74 | % | | $ | 119,881 |
|
| FIA Card Services, N.A. | FIA Card Services, N.A. | 17.63 |
| | 24,660 |
| | 15.30 |
| | 25,589 |
| FIA Card Services, N.A. | 17.34 |
| | 22,061 |
| | 17.63 |
| | 24,660 |
|
| Total | | |
| | |
| | |
| | |
| | |
| | |
| | |
| | |
|
| Bank of America, N.A. | Bank of America, N.A. | 15.17 |
| | 154,885 |
| | 14.26 |
| | 151,255 |
| Bank of America, N.A. | 14.76 |
| | 140,434 |
| | 15.17 |
| | 154,885 |
|
| FIA Card Services, N.A. | FIA Card Services, N.A. | 19.01 |
| | 26,594 |
| | 16.94 |
| | 28,343 |
| FIA Card Services, N.A. | 18.64 |
| | 23,707 |
| | 19.01 |
| | 26,594 |
|
| Tier 1 leverage | Tier 1 leverage | |
| | |
| | |
| | |
| Tier 1 leverage | |
| | |
| | |
| | |
|
| Bank of America, N.A. | Bank of America, N.A. | 8.65 |
| | 119,881 |
| | 7.83 |
| | 114,345 |
| Bank of America, N.A. | 8.59 |
| | 118,431 |
| | 8.65 |
| | 119,881 |
|
| FIA Card Services, N.A. | FIA Card Services, N.A. | 14.22 |
| | 24,660 |
| | 13.21 |
| | 25,589 |
| FIA Card Services, N.A. | 13.67 |
| | 22,061 |
| | 14.22 |
| | 24,660 |
|
BANA’s Tier 1 capital ratio increased 9670 bps to 11.7412.44 percent and the Total capital ratio increaseddecreased 9141 bps to 15.1714.76 percent at December 31, 20112012 compared to 2010. The increase in the ratios was driven by $9.6 billion in earnings generated during December 31, 2011. The Tier 1 leverage ratio increaseddecreased 82six bps to 8.658.59 percent, benefiting from at December 31, 2012 compared to December 31, 2011. The increase in the improvementTier 1 capital ratio was driven by earnings eligible to be included in capital of $12.3 billion and a decrease in risk-weighted assets of $69.1 billion compared to the prior year, largely offset by dividends paid to the Corporation of $14.1 billion during 2012. The decrease in the Total capital ratio was driven by a $12.0 billion decrease in qualifying subordinated debt, partially offset by the net impact of earnings eligible to be included in capital and a decrease in risk-weighted assets. The decrease in the Tier 1 leverage ratio was driven by a decrease in Tier 1 capital, combined withpartially offset by a $73.4 billion decrease in adjusted quarterly average total assets resulting from our continued efforts to reduce non-core assets and legacy loan portfolios.assets.
FIA’s Tier 1 capital ratio increaseddecreased 23329 bps to 17.6317.34 percent and the Total capital ratio increaseddecreased 20737 bps to 19.0118.64 percent at December 31, 20112012 compared to 2010December 31, 2011. The Tier 1 leverage ratio increaseddecreased 10155 bps to 14.2213.67 percent at December 31, 20112012 compared to 2010December 31, 2011. The increasedecrease in the Tier 1 capital and Total capital ratios was driven by $5.7 billion in earnings generated during 2011 and a reduction in risk-weighted assets.
During 2011, BANA paid dividendsreturns of $9.8capital of $6.6 billion to Bank of America Corporation. FIA returned capital of $7.0 billion to Bank of Americathe Corporation during 20112012, partially offset by earnings eligible to be included in capital of $4.2 billion and is anticipateda decrease in risk-weighted assets primarily due to return an additional $3.0 billiona decrease in 2012.loans. The decrease in the Tier 1 leverage ratio was driven by the decrease in Tier 1 capital, partially offset by a decrease in adjusted quarterly average total assets of $12.0 billion.
Broker/Dealer Regulatory Capital
The Corporation’s principal U.S. broker/dealer subsidiaries are Merrill Lynch, Pierce, Fenner & Smith (MLPF&S) and Merrill Lynch Professional Clearing Corp (MLPCC). MLPCC is a fully-guaranteed subsidiary of MLPF&S and provides clearing and settlement services. Both entities are subject to the net capital requirements of SEC Rule 15c3-1. Both entities are also registered as futures commission merchants and are subject to the CFTC Regulation 1.17.
MLPF&S has elected to compute the minimum capital requirement in accordance with the Alternative Net Capital Requirement as permitted by SEC Rule 15c3-1. At December 31, 2011
2012, MLPF&S’s regulatory net capital as defined by Rule 15c3-1 was $10.8$10.3 billion and exceeded the minimum requirement of $803$683 million by $10.0$9.7 billion. MLPCC’s net capital of $3.5$2.1 billion exceeded the minimum requirement of $168$236 million by approximately $3.3$1.8 billion.
In accordance with the Alternative Net Capital Requirements, MLPF&S is required to maintain tentative net capital in excess of $1$1.0 billion, net capital in excess of $500 million and notify the SEC in the event its tentative net capital is less than $5$5.0 billion. At December 31, 20112012, MLPF&S had tentative net capital and net capital in excess of the minimum and notification requirements.
Economic Capital
Our economic capital measurement process provides a risk-based measurement of the capital required for unexpected credit, market and operational losses over a one-year time horizon at a 99.97 percent confidence level. Economic capital is allocated to each business unit based upon its risk positions and contribution to enterprise risk, and is used for capital adequacy, performance measurement and risk management purposes. The strategic planning process utilizes economic capital with the goal of allocating risk appropriately and measuring returns consistently across all businesses and activities. Economic capital allocation plans are incorporated into the Corporation’s financial plan which is approved by the Board on an annual basis.
Credit Risk Capital
Economic capital for credit risk captures two types of risks: default risk, which represents the loss of principal due to outright default or the borrower’s inability to repay an obligation in full, and migration risk, which represents potential loss in market value due to credit deterioration over thea one-year capital time horizon. Credit risk is assessed and modeled for all on- and off-balance sheet credit exposures within sub-categories for commercial, retail, counterparty and investment securities. The economic capital methodology captures dimensions such as concentration and country risk and originated securitizations. The economic capital methodology is based on the probability of default, loss given default (LGD), exposure at default (EAD) and maturity for each credit exposure, and the portfolio correlations across exposures. See page 8079 for more information on Credit Risk Management.
|
| | |
74 Bank of America 2012 | | Bank of America75
|
Market Risk Capital
Market risk reflects the potential loss in the value of financial instruments or portfolios due to movements in interest and currency exchange rates, equity and futures prices, the implied volatility of interest rates, credit spreads, and other economic and business factors. Bank of America’sThe Corporation’s primary market risk exposures are in its trading portfolio, equity investments, MSRs and the interest rate exposure of itsour core balance sheet. Economic capital is determined by utilizing the same models the Corporation usedwe use to manage these risks including, for example, Value-at-Risk (VaR),VaR, simulation, stress testing and scenario analysis. See page 112113 for additional information on Market Risk Management.
Operational Risk Capital
We calculate operational risk capital at the business unit level using actuarial-based models and historical loss data. We supplement the calculations with scenario analysis and risk control assessments. See Operational Risk Management on page 119120 for more information.
Common Stock Dividends
Table 16 isFor a summary of our declared quarterly cash dividends on common stock during 20112012 and through February 23, 201228, 2013, see Note 14 – Shareholders’ Equityto the Consolidated Financial Statements. |
| | | | |
| | | | |
Table 16 | Common Stock Cash Dividend Summary |
| | | | |
Declaration Date | Record Date | Payment Date | Dividend Per Share |
January 11, 2012 | March 2, 2012 | March 23, 2012 | $0.01 |
November 18, 2011 | December 2, 2011 | December 23, 2011 | 0.01 |
August 22, 2011 | September 2, 2011 | September 23, 2011 | 0.01 |
May 11, 2011 | June 3, 2011 | June 24, 2011 | 0.01 |
January 26, 2011 | March 4, 2011 | March 25, 2011 | 0.01 |
Enterprise-wide Stress Testing
As a part of our core risk management practices, we conduct enterprise-wide stress tests on a periodic basis to better understand balance sheet, earnings, capital and liquidity sensitivities to certain economic and business scenarios, including economic and market conditions that are more severe than anticipated. These enterprise-wide stress tests provide an understanding of the potential impacts from our risk profile on our balance sheet, earnings, capital and liquidity and serve as a key component of our capital and risk management practices. Scenarios are selected by a group comprised of senior business, risk and finance executives. Impacts to each business from each scenario are then determined and analyzed, primarily by leveraging the models and processes utilized in everyday management routines. Impacts are assessed along with potential mitigating actions that may be taken. Analysis from such stress scenarios is compiled for and reviewed through our Chief Financial Officer Risk Committee (CFORC), Asset Liability and Market Risk Committee (ALMRC) and the Board’s Enterprise Risk Committee (ERC) and serves to inform decision making by management and the Board. We have made substantial investments to establish stress testing capabilities as a core business process.
Liquidity Risk
Funding and Liquidity Risk Management
We define liquidity risk as the potential inability to meet our contractual and contingent financial obligations, on- or off-balance sheet, as they come due. Our primary liquidity objective is to ensureprovide adequate funding for our businesses throughout market cycles, including periods of financial stress. To achieve that objective, we analyze and monitor our liquidity risk, maintain excess liquidity and access diverse funding sources including our stable deposit base. We define excess liquidity as readily available assets, limited to cash and high-quality, liquid, unencumbered securities that we can use to meet our funding requirements as those obligations arise.
Global funding and liquidity risk management activities are centralized within Corporate Treasury. We believe that a centralized approach to funding and liquidity risk management enhances our ability to monitor liquidity requirements, maximizes access to funding sources, minimizes borrowing costs and facilitates timely responses to liquidity events.
The Enterprise Risk Committee approves the Corporation’s liquidity policy and contingency funding plan, including establishing liquidity risk tolerance levels. The ALMRC in conjunction with the Board and its committees, monitors our liquidity position and reviews the impact of strategic decisions on our liquidity. ALMRC is responsible for managing liquidity risks and ensuringmaintaining exposures remain within the established tolerance levels. ALMRC delegates additional oversight responsibilities to the CFORC, which reports to the ALMRC. The CFORC reviews and monitors our liquidity position, cash flow forecasts, stress testing scenarios and results, and implements our liquidity limits and guidelines. For more information, see Board Oversight of Risk on page 7068. Under this governance framework, we have developed certain funding and liquidity risk management practices which include: maintaining excess liquidity at the parent company and selected subsidiaries, including our bank and broker/dealer
subsidiaries; determining what amounts of excess liquidity are appropriate for these entities based on analysis of debt maturities and other potential cash outflows, including those that we may experience during stressed market conditions; diversifying funding sources, considering our asset profile and legal entity structure; and performing contingency planning.
Global Excess Liquidity Sources and Other Unencumbered Assets
We maintain excess liquidity available to Bank of America Corporation, or the parent company, and selected subsidiaries in the form of cash and high-quality, liquid, unencumbered securities. These assets, which we call our Global Excess Liquidity Sources, serve as our primary means of liquidity risk mitigation. Our cash is primarily on deposit with the Federal Reserve and central banks such asoutside of the Federal Reserve.U.S. We limit the composition of high-quality, liquid, unencumbered securities to U.S. government securities, U.S. agency securities, U.S. agency MBS and a select group of non-U.S. government and supranational securities. We believe we can quickly obtain cash for these securities, even in stressed market conditions, through repurchase agreements or outright sales. We hold our Global Excess Liquidity Sources in entities that allow us to meet the liquidity requirements of our global businesses, and we consider the impact of potential regulatory, tax, legal and other restrictions that could limit the transferability of funds among entities.
Our Global Excess Liquidity Sources were increased$42372 billion toand $378 billion compared toat December 31, 20102012 and 2011 and were maintained as presented in Table 17. This increase was due primarily to liquidity generated by our bank subsidiaries through deposit growth, reductions in LHFS and other factors. Partially offsetting the increase were the results of our ongoing reductions of our debt footprint announced in 2010.
| | | | | | | | | | | |
| Table 17 | Global Excess Liquidity Sources | Average for
Three Months Ended
December 31, | Global Excess Liquidity Sources | |
| | | | | |
| | | December 31 | Average for
Three Months Ended
December 31, | | December 31 | Average for Three Months Ended December 31 2012 |
| (Dollars in billions) | (Dollars in billions) | 2011 | | 2010 | (Dollars in billions) | 2012 | | 2011 |
| Parent company | Parent company | $ | 125 |
| | $ | 121 |
| $ | 118 |
| Parent company | $ | 103 |
| | $ | 125 |
| $ | 99 |
|
| Bank subsidiaries | Bank subsidiaries | 222 |
| | 180 |
| 215 |
| Bank subsidiaries | 247 |
| | 222 |
| 264 |
|
| Broker/dealers | Broker/dealers | 31 |
| | 35 |
| 29 |
| Broker/dealers | 22 |
| | 31 |
| 25 |
|
| Total global excess liquidity sources | Total global excess liquidity sources | $ | 378 |
| | $ | 336 |
| $ | 362 |
| Total global excess liquidity sources | $ | 372 |
| | $ | 378 |
| $ | 388 |
|
As shown in Table 17, theparent company Global Excess Liquidity Sources available to the parent company totaled $125103 billion and $121125 billion at December 31, 20112012 and 20102011. The decrease in parent company liquidity was primarily due to reductions in long-term debt, partially offset by dividends and capital repayments from subsidiaries. Typically, parent company cash is deposited overnight with BANA.
Table 18 presents the composition of Global Excess Liquidity Sources at December 31, 2011 and 2010.
|
| | | | | | | | |
| | | | | |
| Table 18 | Global Excess Liquidity Sources Composition |
| | | |
| | | December 31 |
| (Dollars in billions) | 2011 | | 2010 |
| Cash on deposit | $ | 79 |
| | $ | 80 |
|
| U.S. treasuries | 48 |
| | 65 |
|
| U.S. agency securities and mortgage-backed securities | 228 |
| | 174 |
|
| Non-U.S. government and supranational securities | 23 |
| | 17 |
|
| Total global excess liquidity sources | $ | 378 |
| | $ | 336 |
|
Global Excess Liquidity Sources available to our bank subsidiaries attotaled December 31, 2011$247 billion and2010 totaled $222 billion at December 31, 2012and $180 billion2011. These amounts are distinct from the cash deposited by the parent company. The increase in liquidity available to our bank subsidiaries was primarily due to an increase in deposits, partially offset by capital returns to the parent company presentedand reductions in Table 17.debt. In addition to their Global Excess Liquidity Sources, our bank subsidiaries hold significant amounts of other unencumbered investment-grade securities that we believe could also be used to generate liquidity, primarily investment-grade MBS.liquidity. Our bank subsidiaries can also generate incremental liquidity by pledging a range of other unencumbered loans and securities to certain Federal Home Loan Banks (FHLBs) and the Federal Reserve Discount Window. The cash we could have obtained by borrowing against this pool of specifically-identified
eligible assets was approximately $189$194 billion and $170$189 billion at December 31, 20112012 and 20102011. We have established operational procedures to enable us to borrow against these assets, including regularly monitoring our total pool of eligible loans and securities collateral. Eligibility is defined by guidelines outlined by the FHLBs and the Federal Reserve and is subject to change at their discretion. Due to regulatory restrictions, liquidity generated by the bank subsidiaries can only be used to fund obligations within the bank subsidiaries and can only be transferred to the parent company or non-banknonbank subsidiaries with prior regulatory approval.
Global Excess Liquidity Sources available to our broker/dealer subsidiaries attotaled December 31, 2011$22 billion and2010 totaled $31 billion at December 31, 2012and $35 billion2011. Our broker/dealers also held significant amounts of other unencumbered investment-grade securities and equities that we believe could also be used to generate additional liquidity, including investment-grade securities and equities.liquidity. Liquidity held in a broker/dealer subsidiary
is only available to meet the obligations of that entity and can only be transferred to the parent company or to any other subsidiary with prior regulatory approval due to regulatory restrictions and minimum requirements.
Table 18 presents the composition of Global Excess Liquidity Sources at December 31, 2012 and 2011.
|
| | | | | | | | |
| | | | | |
| Table 18 | Global Excess Liquidity Sources Composition |
| | | |
| | | December 31 |
| (Dollars in billions) | 2012 | | 2011 |
| Cash on deposit | $ | 65 |
| | $ | 79 |
|
| U.S. treasuries | 21 |
| | 48 |
|
| U.S. agency securities and mortgage-backed securities | 271 |
| | 228 |
|
| Non-U.S. government and supranational securities | 15 |
| | 23 |
|
| Total global excess liquidity sources | $ | 372 |
| | $ | 378 |
|
Time to Required Funding and Stress Modeling
We use a variety of metrics to determine the appropriate amounts of excess liquidity to maintain at the parent company and our bank and broker/dealer subsidiaries. One metric we use to evaluate the appropriate level of excess liquidity at the parent company is “Time to Required Funding.” This debt coverage measure indicates the number of months that the parent company can continue to meet its unsecured contractual obligations as they come due using only its Global Excess Liquidity Sources without issuing any new debt or accessing any additional liquidity sources. We define unsecured contractual obligations for purposes of this metric as maturities of senior or subordinated debt issued or guaranteed by Bank of America Corporation or Merrill Lynch. These include certain unsecured debt instruments, primarily structured liabilities, which we may be required to settle for cash prior to maturity and issuances under the FDIC’s Temporary Liquidity Guarantee Program (TLGP), all of which will mature by June 30, 2012.maturity. The Corporation has established a target for Time to Required Funding of 21 months. Our Time to Required Funding was 33 months at December 31, 20112012 was 29 months.. For purposes of calculating Time to Required Funding forat December 31, 20112012, we have also included in the amount of unsecured contractual obligations the $8.6$8.6 billion liability related to the BNY Mellon Settlement. This settlementThe BNY Mellon Settlement is subject to final court approval and certain other conditions, and the timing of the payment is not certain.
We utilize liquidity stress models to assist us in determining the appropriate amounts of excess liquidity to maintain at the parent company and our bank and broker/dealer subsidiaries. These models are risk sensitive and have become increasingly important in analyzing our potential contractual and contingent cash outflows beyond those outflows considered in the Time to Required Funding analysis.
We evaluate the liquidity requirements under a range of scenarios with varying levels of severity and time horizons. TheseThe scenarios we consider and utilize incorporate market-wide and Corporation-specific events, including potential credit ratingsrating downgrades for the parent company and our subsidiaries. We considersubsidiaries, and utilize scenariosare based on historical experience, regulatory guidance, and both expected and unexpected future events.
The types of potential contractual and contingent cash outflows we consider in our scenarios may include, but are not limited to, upcoming contractual maturities of unsecured debt and reductions in new debt issuance; diminished access to secured financing markets; potential deposit withdrawals and reduced rollover of maturing term deposits by customers; increased draws on loan commitmentcommitments, liquidity facilities and liquidity facilities,letters of credit, including Variable Rate Demand Notes; additional collateral that counterparties could call if our credit ratings were further downgraded;downgraded further; collateral, margin and subsidiary capital requirements arising from losses; and potential liquidity required to maintain businesses and finance customer activities. Changes in certain market factors, including, but not limited to, credit rating downgrades, could negatively impact potential contractual and contingent outflows and the related financial instruments, and in some cases these impacts could be material to our financial results.
We consider all sources of funds that we could access during each stress scenario and focus particularly on matching available sources with corresponding liquidity requirements by legal entity. We also use the stress modeling results to manage our asset-liability profile and establish limits and guidelines on certain funding sources and businesses.
Basel III3 Liquidity Standards
In December 2010, the Basel Committee issued “International framework for liquidity risk measurement, standards and monitoring,” which includesproposed two proposed measures of liquidity risk. These two minimum liquidity measures were initially introduced in guidance in December 2009 andrisk which are considered part of Basel III.
3. The first proposed liquidity measure is the Liquidity Coverage Ratio (LCR), which is calculated as the amount of a financial institution’s unencumbered, high-quality, liquid assets relative to the net cash outflows the institution could encounter under an acutea significant 30-day stress scenario. The Basel Committee announced in January 2013 that an initial minimum LCR requirement of 60 percent will be implemented in January 2015, and will thereafter increase in 10 percent annual increments through January 2019. The second proposed liquidity measure is the Net Stable Funding Ratio (NSFR), which measures the amount of longer-term, stable sources of funding employed by a financial institution relative to the liquidity profiles of the assets funded and the potential for contingent calls on funding liquidity arising from off-balance sheet commitments and obligations over a one-year period. The Basel Committee expectsis currently reviewing the LCRNSFR requirement and intends for the requirement to be implemented in January 2015 and the NSFR requirement to be implemented inby January 2018, following an observation period that began in 2011.is currently underway. We continue to monitor the development and the potential impact of these proposals and assuming adoption by U.S. banking regulators, we expect to meet the final standards within the regulatory timelines.
Diversified Funding Sources
We fund our assets primarily with a mix of deposits and secured and unsecured liabilities through a globally coordinated funding strategy. We diversify our funding globally across products, programs, markets, currencies and investor groups.
We fund a substantial portion of our lending activities through our deposit base,deposits, which waswere $1,033 billion1.11 trillion and $1,010 billion1.03 trillion at December 31, 20112012 and 20102011. Deposits are primarily generated by our Deposits, Global Commercial BankingCBB, GWIM and GBAMGlobal Banking segments. These deposits are diversified by clients, product type and geography, and the majority of our U.S. deposits are insured by the FDIC. We consider a substantial portion of our deposits to be a stable, low-cost and consistent source of funding. We believe this deposit funding is generally less sensitive to interest rate changes, market volatility or changes in our credit ratings than wholesale funding sources. Our lending activities may also be financed through secured borrowings, including securitizations with GSEs, the FHA and private-label investors, as well as FHLB loans.
Our trading activities in broker/dealer subsidiaries are primarily funded on a secured basis through securities lending and repurchase agreements and these amounts will vary based on customer activity and market conditions. We believe funding these activities in the secured financing markets is more cost efficientcost-efficient and less sensitive to changes in our credit ratings than unsecured financing. Repurchase agreements are generally short-term and often overnight. Disruptions in secured financing markets for financial institutions have occurred in prior market cycles which resulted in adverse changes in terms or significant reductions in the availability of such financing. We manage the liquidity risks arising from secured funding by sourcing funding globally from a diverse group of counterparties, providing a range of securities collateral and pursuing longer durations, when appropriate.
We reduced our use of unsecured short-term borrowings at the parent company and broker/dealer subsidiaries, including commercial paper and master notes, to relatively insignificant amounts in 2011. These short-term borrowings were used to support customer activities, short-term financing requirements
and cash management objectives. For average and period-end balance discussions, see Balance Sheet Overview on page 34. For more information, see Note 12 – Federal Funds Sold, Securities Borrowed or Purchased Under Agreements to Resell and Short-term Borrowingsto the Consolidated Financial Statements.
Our mortgage business accesses a liquid market for the sale of newly originated mortgages through contracts with the GSEs and FHA. Contracts with the GSEs are subject to the seller/servicer guides issued by the GSEs.
We issue the majority of our long-term unsecured debt at the parent company. During 20112012, the parent company issued $21.0$17.6 billion of long-term unsecured debt.debt, including structured liabilities of $9.2 billion. We may also issue long-term unsecured debt atthrough BANA although there were no new issuances during 2011.
We issue long-term unsecured debt in a variety of maturities and currencies to achieve cost-efficient funding and to maintain an appropriate maturity profile.profile, although there were no new issuances through BANA during 2012. While the cost and availability of unsecured funding may be negatively impacted by general market conditions or by matters specific to the financial services industry or the Corporation, we seek to mitigate refinancing risk by actively managing the amount of our borrowings that we anticipate will mature within any month or quarter.
The primary benefits ofexpected from our centralized funding strategy include greater control, reduced funding costs, wider name recognition by investors and greater flexibility to meet the variable funding requirements of subsidiaries. Where regulations, time zone differences or other business considerations make parent company funding impractical, certain other subsidiaries may issue their own debt.
AtTable 19 presents our long-term debt by major currency at December 31, 20112012 and 2010, our long-term debt was in the currencies presented in Table 192011.
| | | | | | | | | | | |
| Table 19 | Long-term Debt by Major Currency | Long-term Debt by Major Currency |
| | | | | |
| | | December 31 | | December 31 |
| (Dollars in millions) | (Dollars in millions) | 2011 | | 2010 | (Dollars in millions) | 2012 | | 2011 |
| U.S. Dollar | U.S. Dollar | $ | 255,262 |
| | $ | 302,487 |
| U.S. Dollar | $ | 180,329 |
| | $ | 255,262 |
|
| Euro | Euro | 68,799 |
| | 87,482 |
| Euro | 58,985 |
| | 68,799 |
|
| Japanese Yen | Japanese Yen | 19,568 |
| | 19,901 |
| Japanese Yen | 12,749 |
| | 19,568 |
|
| British Pound | British Pound | 12,554 |
| | 16,505 |
| British Pound | 11,126 |
| | 12,554 |
|
| Canadian Dollar | | Canadian Dollar | 3,560 |
| | 4,621 |
|
| Australian Dollar | Australian Dollar | 4,900 |
| | 6,924 |
| Australian Dollar | 2,760 |
| | 4,900 |
|
| Canadian Dollar | 4,621 |
| | 6,628 |
| |
| Swiss Franc | Swiss Franc | 2,268 |
| | 3,069 |
| Swiss Franc | 1,917 |
| | 2,268 |
|
| Other | Other | 4,293 |
| | 5,435 |
| Other | 4,159 |
| | 4,293 |
|
| Total long-term debt | Total long-term debt | $ | 372,265 |
| | $ | 448,431 |
| Total long-term debt | $ | 275,585 |
| | $ | 372,265 |
|
Total long-term debt decreased $76.296.7 billion, or 1726 percent, in 20112012., primarily driven by maturities and liability management actions. This decrease reflects our ongoing initiative to reduce our debt footprintbalances over time and we anticipate that wedebt levels will continue to reduce our debt footprint as appropriatedecline from maturities through 2013. We may, from time to time, purchase outstanding debt securities in various transactions, depending on prevailing market conditions, liquidity and other factors. In addition, we alsoour broker/dealer subsidiaries may make markets in our debt instruments to provide liquidity for investors. For additional information on long-term debt funding, see Note 1312 – Long-term Debt to the Consolidated Financial Statements.
We use derivative transactions to manage the duration, interest rate and currency risks of our borrowings, considering the characteristics of the assets they are funding. For further details on our ALM activities, see Interest Rate Risk Management for Nontrading Activities on page 116117.
We also diversify our unsecured funding sources by issuing various types of debt instruments including structured liabilities, which are debt obligations that pay investors with returns linked to other debt or equity securities, indices, currencies or commodities. We typically hedge the returns we are obligated to pay on these liabilities with derivative positions and/or investments in the underlying instruments, so that from a funding perspective, the cost is similar to our other unsecured long-term debt. We could be required to settle certain structured liability obligations for cash or other securities immediatelyprior to maturity under certain circumstances, which we consider for liquidity planning purposes. We believe, however, that a portion of such borrowings will remain outstanding beyond the earliest put or redemption date. We had outstanding structured liabilities with a bookcarrying value of $50.9$51.7 billion and $61.1$50.9 billion at December 31, 20112012 and 20102011.
Substantially all of our senior and subordinated debt obligations contain no provisions that could trigger a requirement for an early repayment, require additional collateral support, result in changes to terms, accelerate maturity or create additional financial obligations upon an adverse change in our credit ratings, financial ratios, earnings, cash flows or stock price.
Prior to 2010, we participated in the TLGP,FDIC’s Temporary Liquidity Guarantee Program (TLGP), which allowed us to issue senior unsecured debt thatguaranteed by the FDIC guaranteed in return for a fee based on the amount and maturity of the debt. At December 31, 2012, there were no outstanding borrowings under the TLGP and we no longer issue debt under this program. At December 31, 2011, we had $23.9 billion outstanding under the program. We no longer issue debt under this program and all of ourthe debt issued under the TLGP will maturematured by June 30, 2012. TLGP issuances are included in the unsecured contractual obligations for the Time to Required Funding metric. Under this program, our debt received the highest long-term ratings from the major credit rating agencies which resulted in a lower total cost of issuance than if we had issued non-FDIC guaranteed long-term debt.
Contingency Planning
We maintain contingency funding plans that outline our potential responses to liquidity stress events at various levels of severity. These policies and plans are based on stress scenarios and include potential funding strategies and communication and notification procedures that we would implement in the event we experienced stressed liquidity conditions. We periodically review and test the contingency funding plans to validate efficacy and assess readiness.
Our U.S. bank subsidiaries can access contingency funding through the Federal Reserve Discount Window. Certain non-U.S. subsidiaries have access to central bank facilities in the jurisdictions in which they operate. While we do not rely on these sources in our liquidity modeling, we maintain the policies, procedures and governance processes that would enable us to access these sources if necessary.
Credit Ratings
Our borrowing costs and ability to raise funds are directly impacted by our credit ratings. In addition, credit ratings may be important to customers or counterparties when we compete in certain markets and when we seek to engage in certain transactions, including OTC derivatives. Thus, it is our objective to maintain high-quality credit ratings.
Credit ratings and outlooks are opinions expressed by rating agencies on our creditworthiness and that of our obligations or securities, including long-term debt, short-term borrowings, preferred stock and other securities, including asset securitizations. Our credit ratings are
subject to ongoing review by the rating agencies which consider a number of factors, including our own financial strength, performance, prospects and operations as well as factors not under our control. The rating agencies could make adjustments to our ratings at any time and they provide no assurances that they will maintain our ratings at current levels.
Other factors that influence our credit ratings include changes to the rating agencies’ methodologies for our industry or certain security types, the rating agencies’ assessment of the general operating environment for financial services companies, our mortgage exposures, our relative positions in the markets in which we compete, reputation, liquidity position, diversity of funding sources, funding costs, the level and volatility of earnings, corporate governance and risk management policies, capital position, capital management practices, and current or future regulatory and legislative initiatives.
On December 20, 2012, Standard & Poor’s Ratings Services (S&P) published a full credit analysis report on the Corporation, leaving the credit ratings for the company and its subsidiaries unchanged as of that date. On October 10, 2012, Fitch Ratings (Fitch) announced the results of its periodic review of its ratings for 12 large, complex securities trading and universal banks, including the Corporation. As part of this action, Fitch affirmed the
Corporation’s credit ratings. On June 21, 2012, Moody’s Investors Service Inc. (Moody’s) completed its previously-announced review for possible downgrade of financial institutions with global capital markets operations, downgrading the ratings of 15 banks and securities firms, including our ratings. The Corporation’s long-term debt rating and BANA’s long-term and short-term debt ratings were downgraded one notch as part of this action. The Moody’s downgrade has not had a material impact on our financial condition, results of operations or liquidity. Each of the three primarymajor rating agencies, Moody’s, S&P and Fitch, downgraded the ratings for the Corporation and its rated subsidiaries in late 2011. They
Currently, the Corporation’s long-term/short-term senior debt ratings and outlooks expressed by the rating agencies are as follows: Baa2/P-2 (negative) by Moody’s, A-/A-2 (negative) by S&P, and A/F1 (stable) by Fitch. BANA’s long-term/short-term senior debt ratings and outlooks are as follows: A3/P-2 (stable) by Moody’s, A/A-1 (negative) by S&P, and A/F1 (stable) by Fitch. The credit ratings of Merrill Lynch from the three major credit rating agencies are the same as those of the Corporation. The major credit rating agencies have indicated that the primary drivers of Merrill Lynch’s credit ratings are the Corporation’s credit ratings. MLPF&S’s long-term/short-term senior debt ratings and outlooks are A/A-1 (negative) by S&P and A/F1 (stable) by Fitch. Merrill Lynch International’s long-term/short-term senior debt rating is A/A-1 (negative) by S&P.
The major rating agencies have each also indicated that, as a systemically important financial institution, our credit ratings currently reflect their expectation that, if necessary, we would receive significant support from the U.S. government. They have indicatedgovernment, and that they will continue to assess this viewsuch support in the context of support assovereign financial services regulationsstrength and legislation evolve. On December 15, 2011, Fitch downgraded the Corporation’sregulatory and BANA’s long-term and short-term debt ratings as a result of Fitch’s decision to lower its “support floor” for systemically important U.S. financial institutions. This downgrade resolves the Rating Watch Negative Fitch placed on the Corporation’s ratings on October 22, 2010. On November 29, 2011, S&P downgraded the Corporation’s long-term and short-term debt ratings as well as BANA’s long-term debt rating as a result of S&P’s implementation of revised methodologies for determining Banking Industry Country Risk Assessments and bank ratings. On September 21, 2011, Moody’s downgraded the Corporation’s long-term and short-term debt ratings as well as BANA’s long-term debt rating as a result of Moody’s lowering the amount of uplift for potential U.S. government support it incorporates into ratings. On February 15, 2012, Moody’s placed the Corporation’s long-term debt ratings and BANA’s long-term and short-term debt ratings on review for possible downgrade as part of its review of financial institutions with global capital markets operations. Any adjustment to our ratings will be determined based on Moody’s review; however, the agency offered guidance that downgrades to our ratings, if any, would likely be limited to one notch. The rating agencies could make further adjustments to our ratings at any time and provide no assurances that they will maintain our ratings at current levels.legislative developments.
Currently, the Corporation’s long-term/short-term senior debt ratings and outlooks expressed by the rating agencies are as follows: Baa1/P-2 (negative) by Moody’s; A-/A-2 (negative) by S&P; and A/F1 (stable) by Fitch. BANA’s long-term/short-term senior debt ratings and outlooks currently are as follows: A2/P-1 (negative) by Moody’s; A/A-1 (negative) by S&P; and A/F1 (stable) by Fitch. MLPF&S’s long-term/short-term senior debt ratings and outlooks are A/A-1 (negative) by S&P and A/F1 (stable) by Fitch. Merrill Lynch International’s long-term/short-term senior debt ratings are A/A-1 (negative) by S&P. The credit ratings of Merrill Lynch from the three primary credit rating agencies are the same as those of Bank of America Corporation. The primary credit rating agencies have indicated that the major drivers of Merrill Lynch’s credit ratings are Bank of America Corporation’s credit ratings.
A further reduction in certain of our credit ratings or the ratings of certain asset-backed securitizations may have a material adverse effect on our liquidity, potential loss of access to credit markets, the related cost of funds, our businesses and on certain trading revenues, particularly in those businesses where counterparty creditworthiness is critical. In addition, under the terms of certain OTC derivative contracts and other trading agreements, in the event of further downgrades of our or our rated subsidiaries’ credit ratings, the counterparties to those agreements may require us to provide additional collateral, or to terminate these contracts or agreements, which could cause us to sustain losses and/or adversely impact our liquidity. If the short-term credit ratings of our parent company, bank or broker/dealer subsidiaries were downgraded by one or more levels, the potential loss of access to short-term funding sources such as repo financing and the effect on our incremental cost of funds could be material.
At December 31, 2011, 2012, if the rating agencies had downgraded their long-term senior debt ratings for the Corporation or certain subsidiaries by one incremental notch, the amount of additional collateral contractually required by derivative contracts and other trading agreements would have been approximately$1.63.3 billioncomprised of$1.22.9 billionfor BANA and approximately $375418 millionfor Merrill Lynch and certain of its subsidiaries. If the agencies had downgraded their long-term senior debt ratings for these entities by a second incremental notch, approximately$1.14.4 billionin additional incremental collateral comprised of$871455 millionfor BANA and$269 million4.0 billionfor Merrill Lynch and certain of its subsidiaries would have been required.
Also, if the rating agencies had downgraded their long-term senior debt ratings for the Corporation or certain subsidiaries by one incremental notch, the derivative liability that would be subject to unilateral termination by counterparties as ofDecember 31, 2011 2012was$2.93.8 billion, against which$2.73.0 billionof collateral hadhas been posted. If the rating agencies had downgraded their long-term senior debt ratings for the Corporation orand certain subsidiaries by a second incremental notch, the derivative liability that would be subject to unilateral termination by counterparties as ofDecember 31, 2011 2012was an incremental$5.61.7 billion, against which$5.41.1 billionof collateral hadhas been posted.
While certain potential impacts are contractual and quantifiable, the full scope of consequences of a credit ratings downgrade to a financial institution areis inherently uncertain, as they dependit depends upon numerous dynamic, complex and inter-related factors and assumptions, including whether any downgrade of a firm’s long-term credit ratings precipitates downgrades to its short-term credit ratings, and assumptions about the potential behaviors of various customers, investors and counterparties. For additional information on potential impacts of credit rating downgrades, see Time to Required Funding and Stress Modeling on page 76.
For information regarding the additional collateral and termination payments that could be required in connection with certain OTC derivative contracts and other trading agreements as a result of such a credit ratingsrating downgrade, seeNote 4 – Derivativesto the Consolidated Financial Statements and Item 1A. Risk Factors.
During the third quarter of 2011, Moody’s andOn June 8, 2012, S&P placed the sovereign rating of the United States on review for possible downgrade due to the possibility of a default on the government’s debt obligations because of a failure to increase the debt limit.
On August 2, 2011, Moody’s affirmed its Aaa ratingAA+ long-term and revised its outlook to negative. On August 5, 2011, S&P downgraded the long-termA-1+ short-term sovereign credit rating ofon the United States to AA+, and affirmed the short-term sovereign credit rating; theU.S. government. The outlook isremains negative. On November 28, 2011,July 10, 2012, Fitch affirmed its AAA long-term rating of the United States, but changed the outlook from stable to negative. On the same day, Fitch affirmed itsand F1+ short-term sovereign credit rating ofon the U.S. government. The outlook remains negative. Moody’s also rates the U.S. government AAA with a negative outlook. All three rating agencies have indicated that they will continue to assess fiscal projections and consolidation measures, as well as the medium-term economic outlook for the United States.U.S.
Credit Risk Management
Credit quality continued to improveimproved during 20112012. Continued due in part to improving economic stability and ourconditions. Our proactive credit risk management initiatives positively impacted the credit portfolio as charge-offs and delinquencies continued to improve across most portfolios and risk ratings improved in the commercial portfolios. However, global and national economic uncertainty, home price declines and regulatory reform continued to weigh on the credit portfolios through December 31, 2011. For more information, see Executive Summary – 20112012 Economic and Business Environment on page 2726.
Credit risk is the risk of loss arising from the inability or failure of a borrower or counterparty to meet its obligations. Credit risk can also arise from operational failures that result in an erroneous advance, commitment or investment of funds. We define the credit exposure to a borrower or counterparty as the loss potential arising from all product classifications including loans and leases, deposit overdrafts, derivatives, assets held-for-sale and unfunded lending commitments which include loan commitments, letters of credit and financial guarantees. Derivative positions are recorded at fair value and assets held-for-sale are recorded at either fair value or the lower of cost or fair value. Certain loans and unfunded commitments are accounted for under the fair value option. Credit risk for these categories of assets is not accounted for as part of the allowance for credit losses but as part of the fair value adjustments recorded in earnings. For derivative positions, our credit risk is measured as the net cost in the event the
counterparties with contracts in which we are in a gain position fail to perform under the terms of those contracts. We use the current mark-to-market value to represent credit exposure without giving consideration to future mark-to-market changes. The credit risk amounts take into consideration the effects of legally enforceable master netting agreements and cash collateral. Our consumer and commercial credit extension and review procedures take into account funded and unfunded credit exposures. For additional information on derivative and credit extension commitments, see Note 43 – Derivatives and Note 1413 – Commitments and Contingencies to the Consolidated Financial Statements.
We manage credit risk based on the risk profile of the borrower or counterparty, repayment sources, the nature of underlying collateral, and other support given current events, conditions and expectations. We classify our portfolios as either consumer or commercial and monitor credit risk in each as discussed below.
We proactively refine our underwriting and credit management practices as well as credit standards to meet the changing economic environment. To actively mitigate losses and enhance customer support in our consumer businesses, we have expanded collections,in place collection programs and loan modification and customer assistance infrastructures. We also have implementedutilize a number of actions to mitigate losses in the commercial businesses including increasing the frequency and intensity of portfolio monitoring, hedging activity and our practice of transferring management of deteriorating commercial exposures to independent special asset officers as credits enter criticized categories.
SinceIn January 2008, and through 2011, Bank of America and Countrywide have completed over one million loan modifications with customers. During 2011, we completed over 225,000 customer loan modifications with a total unpaid principal balance of approximately $49.9 billion, including approximately 104,000 permanent modifications under the government’s Making Home Affordable Program. Of the loan modifications completed2013, in 2011, in terms of both the volume of modifications and the unpaid principal balance associatedconnection with the underlyingFNMA Settlement, we repurchased for $6.6 billion certain residential mortgage loans most werethat had previously been sold to FNMA, which we have valued at less than the purchase price. The majority of these repurchased loans will be included in the portfolio serviced for investors and were not on our balance sheet. The most common types of modifications include a combination of rate reduction and capitalization of past due amounts which represent 60 percent of the volume of modifications completed in 2011, while principal forbearance represented 19 percent, principal reductions and forgiveness represented six percent and capitalization of past due amounts represented eight percent. These modification types are generally considered troubled debt restructurings (TDRs).PCI portfolio. For moreadditional information on TDRs and portfolio impacts,the FNMA Settlement, see Nonperforming Consumer LoansOff-Balance Sheet Arrangements and Foreclosed Properties ActivityContractual Obligations – Representations and Warranties on page 9254 and Note 68 – Representations and Warranties Obligations and Corporate Guaranteesto the Consolidated Financial Statements.
During 2012, new regulatory guidance issued regarding the treatment of loans discharged in Chapter 7 bankruptcy and regulatory interagency guidance issued on junior-lien consumer real estate loans adversely impacted the consumer portfolio’s nonperforming loan and net charge-off statistics. In addition, the National Mortgage Settlement adversely impacted net charge-offs but resulted in a corresponding reduction in nonperforming loans. For more information, see Consumer Portfolio Credit Risk Management on page 80 and Table 21.
Certain European countries, including Greece, Ireland, Italy, Portugal and Spain, have experienced varying degrees of financial stress in recent years. For additional information on our exposures and related risks in non-U.S. countries, see Non-U.S. Portfolio on page 105 and Item 1A. Risk Factors.
For information on our Credit Risk Management activities, see Consumer Portfolio Credit Risk Management on page 80, Commercial Portfolio Credit Risk Management on page 95, Non-U.S. Portfolio on page 105, Provision for Credit Losses and Allowance for Credit Losses both on page 109, Note 1 – Summary of Significant Accounting Principles and Note 5 – Outstanding Loans and Leases to the Consolidated Financial Statements.
Certain European countries, including Greece, Ireland, Italy, Portugal and Spain, continue to experience varying degrees of financial stress. In early 2012, S&P, Fitch and Moody’s downgraded the credit ratings of several European countries, and S&P downgraded the credit rating of the EFSF, adding to concerns about investor appetite for continued support in stabilizing the affected countries. Uncertainty in the progress of debt restructuring negotiations and the lack of a clear resolution to the crisis has led to continued volatility in the European financial markets, and if the situation worsens, may spread into the global financial markets. In December 2011, the ECB announced initiatives to address European bank liquidity and funding concerns by providing low-cost three-year loans to banks, and expanding collateral eligibility. While these initiatives may reduce systemic risk, there remains considerable uncertainty as to future developments regarding the European debt crisis. For additional information on our direct sovereign and non-sovereign exposures in non-U.S. countries, see Non-U.S. Portfolio on page 104 and Item 1A. Risk Factors.
Consumer Portfolio Credit Risk Management
Credit risk management for the consumer portfolio begins with initial underwriting and continues throughout a borrower’s credit cycle. Statistical techniques in conjunction with experiential judgment are used in all aspects of portfolio management including underwriting, product pricing, risk appetite, setting credit limits, and establishing operating processes and metrics to quantify and balance risks and returns. Statistical models are built using detailed behavioral information from external sources such as credit bureaus and/or internal historical experience. These models are a component of our consumer credit risk management process and are used in part to help make both new and existing credit decisions, andas well as portfolio management strategies, including authorizations and line management, collection practices and strategies, determination of the allowance for loan and lease losses, and economic capital allocations for credit risk.
Since January 2008, and through 2012, Bank of America and Countrywide have completed approximately 1.2 million loan modifications with customers. During 2012, we completed more than 156,000 customer loan modifications with a total unpaid principal balance of approximately $34 billion, including approximately 41,400 permanent modifications under the government’s Making Home Affordable Program. Of the loan modifications completed in 2012, in terms of both the volume of modifications and the unpaid principal balance associated with the underlying loans, most were in the portfolio serviced for investors and were not on our balance sheet. The most common types of modifications include a combination of rate reduction and/or capitalization of past due amounts which represented 54 percent of the volume of modifications completed in 2012, while principal forbearance represented 18 percent, principal reductions and forgiveness represented 17 percent and capitalization of past due amounts represented seven percent. For modified loans on our balance sheet, these modification types are generally considered TDRs. For more information on TDRs and portfolio impacts, see Nonperforming Consumer Loans and Foreclosed Properties Activity on page 93 and Note 5 – Outstanding Loans and Leasesto the Consolidated Financial Statements.
Consumer Credit Portfolio
Improvement in the U.S. economy, labor markets and home prices during 2012 resulted in lower credit losses across all major consumer portfolios. Although home prices have shown signs of improvement, the declines over the past several years continued to adversely impact the home loans portfolio.
Improved credit quality across the consumer portfolio and the impact of the National Mortgage Settlement, as discussed in the following section, drove an $8.6 billiondecrease in the consumer allowance for loan and lease losses to $21.1 billion at December 31, 2012. For more information, see Allowance for Credit Losses on page 109.
As a result of the National Mortgage Settlement in 2012, which among other things provided for borrower assistance, we recorded charge-offs of $435 million related to fully forgiven non-PCI loans in the home equity portfolio, which resulted in reductions of the same amount in nonperforming loans. Associated with the National Mortgage Settlement in 2012, we also fully forgave home
equity loans in the Countrywide PCI portfolio with a carrying value before reserves of $2.5 billion and an unpaid principal balance of $2.9 billion which resulted in a decrease in the corresponding allowance for loan and lease losses. These items had no impact on the provision for credit losses as these loans were fully reserved. For more information on the National Mortgage Settlement, see Off-Balance Sheet Arrangements and Contractual Obligations – Other Mortgage-related Matters on page 61.
In 2012, new regulatory guidance was issued addressing consumer real estate loans that have been discharged in Chapter 7 bankruptcy. In accordance with this new guidance, we now classify consumer real estate and other secured consumer loans that have been discharged in Chapter 7 bankruptcy and not reaffirmed by the borrower, as TDRs, irrespective of payment history or delinquency status, even if the repayment terms for the loan have not been otherwise modified. We continue to have a lien on the underlying collateral. Previously, such loans were classified as TDRs only if there had been a change in contractual payment terms that represented a concession to the borrower. The net impact upon implementation to the consumer real estate and other secured consumer portfolios of adopting this new regulatory guidance was a $551 million increase in net charge-offs as these loans were written-down to collateral value, and the full-year impact was a $596 million increase in net charge-offs in 2012. This also resulted in an increase of $3.6 billion in TDRs and $1.2 billion in net new nonperforming loans upon implementation, of which $1.1 billion of such loans were included in nonperforming loans at December 31, 2012. Of the $1.1 billion, $1.0 billion, or 92 percent, were current on their contractual payments. Of these contractually current nonperforming loans, more than 70 percent were discharged in Chapter 7 bankruptcy more than 12 months ago, and more than 40 percent were discharged 24 months or more ago. As subsequent cash payments are received, the interest component of the payments is generally recorded as interest income on a cash basis and the principal component is generally recorded as a reduction in the carrying value of the loan. For more information on the impacts to consumer loans as a result of this new regulatory guidance, see Note 5 – Outstanding Loans and Leasesto the Consolidated Financial Statements.
In 2012, the bank regulatory agencies jointly issued interagency supervisory guidance on nonaccrual status for junior-lien consumer real estate loans. In accordance with this regulatory interagency guidance, we now classify junior-lien home equity loans as nonperforming when the first-lien loan becomes 90 days past due even if the junior-lien loan is performing, and as a result, we reclassified $1.9 billion of performing home equity loans to nonperforming upon implementation, and $1.5 billion of such loans were included in nonperforming loans at December 31, 2012. The regulatory interagency guidance had no impact on our allowance for loan and lease losses or provision for credit losses as the delinquency status of the underlying first-lien was already considered in our reserving process. For more information, see Consumer Portfolio Credit Risk Management – Home Equity on page 87 and Table 21.
For further information on our accounting policies regarding delinquencies, nonperforming status, charge-offs and TDRs for the consumer portfolio, see Note 1 – Summary of Significant Accounting Principles to the Consolidated Financial Statements.
Consumer Credit Portfolio
Improvement in the U.S. economy and labor markets during 2011 resulted in lower credit losses in most consumer portfolios during 2011 compared to 2010. However, continued stress in the housing market, including declines in home prices, continued to adversely impact the home loans portfolio.
Table 20 presents our outstanding consumer loans and the Countrywide PCI loan portfolio. Loans that were acquired from Countrywide and considered credit-impaired were recorded at fair value upon acquisition. In addition to being included in the “Outstandings” columns in Table 20, these loans are also shown separately, net of purchase accounting adjustments, in the “Countrywide Purchased Credit-impaired Loan Portfolio” column. For additional information, see Note 65 – Outstanding Loans and Leases to the Consolidated Financial Statements. The impact of
the Countrywide PCI loan portfolio on certain credit statistics is reported where appropriate. See Countrywide Purchased Credit-impaired Loan Portfolio on page 8990 for more information. Under certain circumstances, loans that were originally classified as discontinued real estate loans upon acquisition have been subsequently modified from pay option or subprime loans into loans with more conventional terms and are now included in the residential mortgage portfolio, but continue to be classified as PCI loans as shown in Table 20.
| | | | | | | | | | | | | | | | | | | |
| Table 20 | Consumer Loans | | | | | | | | Consumer Loans | | | | | | | |
| | | | | | | | | | | | | | | | | |
| | | December 31 | | December 31 |
| | | Outstandings | | Countrywide Purchased Credit-impaired Loan Portfolio | | Outstandings | | Countrywide Purchased Credit-impaired Loan Portfolio |
| (Dollars in millions) | (Dollars in millions) | 2011 | | 2010 | | 2011 | | 2010 | (Dollars in millions) | 2012 | | 2011 | | 2012 | | 2011 |
Residential mortgage (1) | Residential mortgage (1) | $ | 262,290 |
| | $ | 257,973 |
| | $ | 9,966 |
| | $ | 10,592 |
| Residential mortgage (1) | $ | 243,181 |
| | $ | 262,290 |
| | $ | 8,737 |
| | $ | 9,966 |
|
| Home equity | Home equity | 124,699 |
| | 137,981 |
| | 11,978 |
| | 12,590 |
| Home equity | 107,996 |
| | 124,699 |
| | 8,547 |
| | 11,978 |
|
Discontinued real estate (2) | Discontinued real estate (2) | 11,095 |
| | 13,108 |
| | 9,857 |
| | 11,652 |
| Discontinued real estate (2) | 9,892 |
| | 11,095 |
| | 8,834 |
| | 9,857 |
|
| U.S. credit card | U.S. credit card | 102,291 |
| | 113,785 |
| | n/a |
| | n/a |
| U.S. credit card | 94,835 |
| | 102,291 |
| | n/a |
| | n/a |
|
| Non-U.S. credit card | Non-U.S. credit card | 14,418 |
| | 27,465 |
| | n/a |
| | n/a |
| Non-U.S. credit card | 11,697 |
| | 14,418 |
| | n/a |
| | n/a |
|
Direct/Indirect consumer (3) | Direct/Indirect consumer (3) | 89,713 |
| | 90,308 |
| | n/a |
| | n/a |
| Direct/Indirect consumer (3) | 83,205 |
| | 89,713 |
| | n/a |
| | n/a |
|
Other consumer (4) | Other consumer (4) | 2,688 |
| | 2,830 |
| | n/a |
| | n/a |
| Other consumer (4) | 1,628 |
| | 2,688 |
| | n/a |
| | n/a |
|
| Consumer loans excluding loans accounted for under the fair value option | Consumer loans excluding loans accounted for under the fair value option | 607,194 |
| | 643,450 |
| | 31,801 |
| | 34,834 |
| Consumer loans excluding loans accounted for under the fair value option | 552,434 |
| | 607,194 |
| | 26,118 |
| | 31,801 |
|
Loans accounted for under the fair value option (5) | Loans accounted for under the fair value option (5) | 2,190 |
| | n/a |
| | n/a |
| | n/a |
| Loans accounted for under the fair value option (5) | 1,005 |
| | 2,190 |
| | n/a |
| | n/a |
|
| Total consumer loans | Total consumer loans | $ | 609,384 |
| | $ | 643,450 |
| | $ | 31,801 |
| | $ | 34,834 |
| Total consumer loans | $ | 553,439 |
| | $ | 609,384 |
| | $ | 26,118 |
| | $ | 31,801 |
|
| |
(1) | Outstandings includesinclude non-U.S. residential mortgagesmortgage loans of $8593 million and $9085 million at December 31, 20112012 and 20102011. |
| |
(2) | Outstandings includesinclude $9.98.8 billion and $11.89.9 billion of pay option loans and $1.21.1 billion and $1.31.2 billion of subprime loans at December 31, 20112012 and 20102011. We no longer originate these products. |
| |
(3) | Outstandings includesinclude dealer financial services loans of $43.035.9 billion and $43.343.0 billion, consumer lending loans of $8.04.7 billion and $12.48.0 billion, U.S. securities-based lending margin loans of $23.628.3 billion and $16.623.6 billion, student loans of $6.04.8 billion and $6.86.0 billion, non-U.S. consumer loans of $7.68.3 billion and $8.07.6 billion, and other consumer loans of $1.51.2 billion and $3.21.5 billion at December 31, 20112012 and 20102011. |
| |
(4) | Outstandings includesinclude consumer finance loans of $1.71.4 billion and $1.91.7 billion, other non-U.S. consumer loans of $9295 million and $803929 million, and consumer overdrafts of $103177 million and $88103 million at December 31, 20112012 and 20102011. |
| |
(5) | Consumer loans accounted for under the fair value option include residential mortgage loans of $147 million and $906 million and discontinued real estate loans of $858 million and $1.3 billion at December 31, 2012 and 2011. There were no consumer loans accounted for under the fair value option at December 31, 2010. See Consumer Portfolio Credit Risk Management – Consumer Loans Accounted for Under the Fair Value Option on page 9293 and Note 2322 – Fair Value Option to the Consolidated Financial Statements for additional information on the fair value option. |
n/a = not applicable
Table 21 presents the impact of the National Mortgage Settlement, the impact of the new regulatory guidance on loans discharged in Chapter 7 bankruptcy and the impact of regulatory interagency guidance on nonaccrual status for junior-lien
consumer real estate loans for the Core and Legacy Assets & Servicing portfolios within the home loans portfolio and other secured consumer portfolio within direct/indirect consumer. These impacts are included in the following consumer credit discussions.
|
| | | | | | | | | | | | | | | | | | | | |
| | | | | | | | | | | |
| Table 21 | Impact of the National Mortgage Settlement and Regulatory Agency Guidance | | |
| | | | | |
| | | National Mortgage Settlement | | New Regulatory Guidance on Treatment of Bankruptcies | | Regulatory Interagency Guidance (1) |
| | | Nonperforming | | Net Charge-offs (2) | | Nonperforming | | Net Charge-offs (3) | | Nonperforming |
| (Dollars in millions) | December 31
2012 | | 2012 | | December 31
2012 | | 2012 | | December 31
2012 |
| Core portfolio | |
| | |
| | |
| | |
| | |
|
| Residential mortgage | $ | — |
| | $ | — |
| | $ | 190 |
| | $ | 11 |
| | $ | — |
|
| Home equity | (91 | ) | | 91 |
| | 170 |
| | 66 |
| | 457 |
|
| Total Core portfolio | (91 | ) | | 91 |
| | 360 |
| | 77 |
| | 457 |
|
| Legacy Assets & Servicing portfolio | | | |
| | |
| | |
| | |
| Residential mortgage | — |
| | — |
| | 382 |
| | 64 |
| | — |
|
| Home equity | (344 | ) | | 344 |
| | 308 |
| | 408 |
| | 1,000 |
|
| Discontinued real estate | — |
| | — |
| | 14 |
| | — |
| | — |
|
| Total Legacy Assets & Servicing portfolio | (344 | ) | | 344 |
| | 704 |
| | 472 |
| | 1,000 |
|
| Home loans portfolio | |
| | |
| | |
| | |
| | |
|
| Residential mortgage | — |
| | — |
| | 572 |
| | 75 |
| | — |
|
| Home equity | (435 | ) | | 435 |
| | 478 |
| | 474 |
| | 1,457 |
|
| Discontinued real estate | — |
| | — |
| | 14 |
| | — |
| | — |
|
| Total home loans portfolio | (435 | ) | | 435 |
| | 1,064 |
| | 549 |
| | 1,457 |
|
| Direct/Indirect consumer portfolio | n/a |
| | n/a |
| | 58 |
| | 47 |
| | n/a |
|
| Total consumer portfolio | $ | (435 | ) | | $ | 435 |
| | $ | 1,122 |
| | $ | 596 |
| | $ | 1,457 |
|
| |
(1) | In 2012, the bank regulatory agencies jointly issued interagency supervisory guidance on nonaccrual status for junior-lien consumer real estate loans. |
| |
(2) | Net charge-offs exclude $2.5 billion of write-offs in the Countrywide home equity PCI loan portfolio in connection with the National Mortgage Settlement in 2012. These write-offs decreased the PCI valuation allowance included as part of the allowance for loan and lease losses. For information on PCI write-offs, see Countrywide Purchased Credit-impaired Loan Portfolio on page 90. |
| |
(3) | Net charge-offs include $551 million of current or less than 60 days past due loans charged off as a result of the completion of implementation of new regulatory guidance on loans discharged in Chapter 7 bankruptcy and $45 million of loans charged off subsequent to the implementation. |
n/a = not applicable
Table 22 presents accruing consumer loans past due 90 days or more and consumer nonperforming loans. Nonperforming loans do not include past due consumer credit card loans, other unsecured loans and in general, consumer non-real estate-secured loans or unsecured consumer(excluding those loans discharged in Chapter 7 bankruptcy) as these loans are generallytypically charged off no later than the end of the month in which the loan becomes 180 days past due. Real estate-secured past due consumer loans which include loansthat are insured by the FHA andor individually insured under long-term stand-by agreements with FNMA and FHLMC (fully-insured(collectively, the fully-insured loan portfolio), are reported as accruing as opposed to nonperforming since the principal
principal repayment is insured. Fully-insured loans included in accruing past due 90 days or more are primarily related to our purchases of delinquent FHA loans pursuant to our servicing agreements. Additionally, nonperforming loans and accruing balances past due 90 days or more do not include the Countrywide PCI loan portfolio or loans accounted for under the fair value option even though the customer may be contractually past due. For additional information on FHA loans, see Off-Balance Sheet Arrangements and Contractual Obligations – Unresolved Claims StatusOther Mortgage-related Matters on page 5761.
| | | | | | | | | | | | | | | | | | | |
| Table 21 | Consumer Credit Quality | | | | | | | | |
| Table 22 | | Consumer Credit Quality | | | | | | | |
| | | | | | | | | | | | | | | | | |
| | | December 31 | | December 31 |
| | | Accruing Past Due
90 Days or More | | Nonperforming | | Accruing Past Due
90 Days or More | | Nonperforming |
| (Dollars in millions) | (Dollars in millions) | 2011 | | 2010 | | 2011 | | 2010 | (Dollars in millions) | 2012 | | 2011 | | 2012 (1) | | 2011 |
Residential mortgage (1)(2) | Residential mortgage (1)(2) | $ | 21,164 |
| | $ | 16,768 |
| | $ | 15,970 |
| | $ | 17,691 |
| Residential mortgage (1)(2) | $ | 22,157 |
| | $ | 21,164 |
| | $ | 14,808 |
| | $ | 15,970 |
|
| Home equity | Home equity | — |
| | — |
| | 2,453 |
| | 2,694 |
| Home equity | — |
| | — |
| | 4,281 |
| | 2,453 |
|
| Discontinued real estate | Discontinued real estate | — |
| | — |
| | 290 |
| | 331 |
| Discontinued real estate | — |
| | — |
| | 248 |
| | 290 |
|
| U.S. credit card | U.S. credit card | 2,070 |
| | 3,320 |
| | n/a |
| | n/a | U.S. credit card | 1,437 |
| | 2,070 |
| | n/a |
| | n/a |
| Non-U.S. credit card | Non-U.S. credit card | 342 |
| | 599 |
| | n/a |
| | n/a | Non-U.S. credit card | 212 |
| | 342 |
| | n/a |
| | n/a |
| Direct/Indirect consumer | Direct/Indirect consumer | 746 |
| | 1,058 |
| | 40 |
| | 90 |
| Direct/Indirect consumer | 545 |
| | 746 |
| | 92 |
| | 40 |
|
| Other consumer | Other consumer | 2 |
| | 2 |
| | 15 |
| | 48 |
| Other consumer | 2 |
| | 2 |
| | 2 |
| | 15 |
|
Total (2)(3) | Total (2)(3) | $ | 24,324 |
| | $ | 21,747 |
| | $ | 18,768 |
| | $ | 20,854 |
| Total (2)(3) | $ | 24,353 |
| | $ | 24,324 |
| | $ | 19,431 |
| | $ | 18,768 |
|
Consumer loans as a percentage of outstanding consumer loans (2)(3) | Consumer loans as a percentage of outstanding consumer loans (2)(3) | 4.01 | % | | 3.38 | % | | 3.09 | % | | 3.24 | % | Consumer loans as a percentage of outstanding consumer loans (2)(3) | 4.41 | % | | 4.01 | % | | 3.52 | % | | 3.09 | % |
Consumer loans as a percentage of outstanding loans excluding Countrywide PCI and fully-insured loan portfolios (2)(3) | Consumer loans as a percentage of outstanding loans excluding Countrywide PCI and fully-insured loan portfolios (2)(3) | 0.66 |
| | 0.92 |
| | 3.90 |
| | 3.85 |
| Consumer loans as a percentage of outstanding loans excluding Countrywide PCI and fully-insured loan portfolios (2)(3) | 0.50 |
| | 0.66 |
| | 4.46 |
| | 3.90 |
|
| |
(1) | Nonperforming loans include the impacts of the National Mortgage Settlement and guidance issued by regulatory agencies. For more information, see Consumer Portfolio Credit Risk Management on page 80 and Table 21. |
| |
(2) | Balances accruing past due 90 days or more are fully-insured loans. These balances include $17.017.8 billion and $8.317.0 billion of loans on which interest has been curtailed by the FHA, and therefore are no longer accruing interest, although principal is still insured and $4.24.4 billion and $8.54.2 billion of loans on which interest was still accruing at December 31, 20112012 and 20102011. |
| |
(2)(3)
| Balances exclude consumer loans accounted for under the fair value option. At December 31, 2012 and 2011, approximately$391 million and $713 million of loans accounted for under the fair value option were past due 90 days or more and not accruing interest. There were no consumer loans accounted for under the fair value option at December 31, 2010. |
n/a = not applicable
Table 2223 presents net charge-offs and related ratios for consumer loans and leases for 2011 and 2010.leases.
| | | | | | | | | | | | | | | | | | | |
| Table 22 | Consumer Net Charge-offs and Related Ratios | | | | | | | | |
| Table 23 | | Consumer Net Charge-offs and Related Ratios (1) | | | | | | | |
| | | | | | | | | | | | | | | | | |
| | | Net Charge-offs | | Net Charge-off Ratios (1) | | Net Charge-offs (2) | | Net Charge-off Ratios (2, 3) |
| (Dollars in millions) | (Dollars in millions) | 2011 | | 2010 | | 2011 | | 2010 | (Dollars in millions) | 2012 | | 2011 | | 2012 | | 2011 |
| Residential mortgage | Residential mortgage | $ | 3,832 |
| | $ | 3,670 |
| | 1.45 | % | | 1.49 | % | Residential mortgage | $ | 3,053 |
| | $ | 3,832 |
| | 1.21 | % | | 1.45 | % |
| Home equity | Home equity | 4,473 |
| | 6,781 |
| | 3.42 |
| | 4.65 |
| Home equity | 4,237 |
| | 4,473 |
| | 3.62 |
| | 3.42 |
|
| Discontinued real estate | Discontinued real estate | 92 |
| | 68 |
| | 0.75 |
| | 0.49 |
| Discontinued real estate | 63 |
| | 92 |
| | 0.61 |
| | 0.75 |
|
| U.S. credit card | U.S. credit card | 7,276 |
| | 13,027 |
| | 6.90 |
| | 11.04 |
| U.S. credit card | 4,632 |
| | 7,276 |
| | 4.88 |
| | 6.90 |
|
| Non-U.S. credit card | Non-U.S. credit card | 1,169 |
| | 2,207 |
| | 4.86 |
| | 7.88 |
| Non-U.S. credit card | 581 |
| | 1,169 |
| | 4.29 |
| | 4.86 |
|
| Direct/Indirect consumer | Direct/Indirect consumer | 1,476 |
| | 3,336 |
| | 1.64 |
| | 3.45 |
| Direct/Indirect consumer | 763 |
| | 1,476 |
| | 0.90 |
| | 1.64 |
|
| Other consumer | Other consumer | 202 |
| | 261 |
| | 7.32 |
| | 8.89 |
| Other consumer | 232 |
| | 202 |
| | 9.85 |
| | 7.32 |
|
| Total | Total | $ | 18,520 |
| | $ | 29,350 |
| | 2.94 |
| | 4.51 |
| Total | $ | 13,561 |
| | $ | 18,520 |
| | 2.36 |
| | 2.94 |
|
| |
(1) | Net charge-offs and related ratios for 2012 include the impacts of the National Mortgage Settlement and new regulatory guidance on loans discharged in Chapter 7 bankruptcy. For more information, see Consumer Portfolio Credit Risk Management on page 80 and Table 21. |
| |
(2) | Net charge-offs exclude $2.8 billion of write-offs in the Countrywide home equity PCI loan portfolio for 2012. These write-offs decreased the PCI valuation allowance included as part of the allowance for loan and lease losses. For information on PCI write-offs, see Countrywide Purchased Credit-impaired Loan Portfolio on page 90. |
| |
(3) | Net charge-off ratios are calculated as net charge-offs divided by average outstanding loans excluding loans accounted for under the fair value option. |
Net charge-off ratios, excluding the Countrywide PCI and fully-insured loan portfolios, were 2.272.02 percent and 1.862.27 percent for residential mortgage, 3.773.98 percent and 5.103.77 percent for home equity, 7.146.10 percent and 4.207.14 percent for discontinued real estate and 3.622.99 percent and 5.083.62 percent for the total consumer portfolio for 20112012 and 20102011. These are the only product classifications materially impacted by the Countrywide PCI and fully-insured loan portfolios for 20112012 and 20102011.
Legacy Asset Servicing withinNet charge-offs exclude CRES$2.8 billion manages our exposures to certain residential mortgage,of write-offs in the Countrywide home equity and discontinued real estate products. Legacy Asset Servicing manages both our owned loans, as well as loans servicedPCI loan portfolio for others, that meet certain criteria. The criteria generally represent home lending standards which we do not consider2012. These write-offs decreased the PCI valuation allowance included as part of our continuing core business.the allowance for loan and lease losses. The Legacy Asset Servicing portfolio includesnet charge-off ratio including the following:PCI write-offs for home equity was 6.02 percent in 2012. For information on PCI write-offs, see Countrywide Purchased Credit-impaired Loan Portfolio on page 90.
|
| | |
Ÿ | Discontinued real estate loans including subprime and pay option | Bank of America 201283 |
| |
Ÿ | Residential mortgage loans and home equity loans for products we no longer originate including reduced document loans and interest-only loans not underwritten to fully amortizing payment |
| |
Ÿ | Loans that would not have been originated under our underwriting standards at December 31, 2010 including conventional loans with an original loan-to-value (LTV) greater than 95 percent and government-insured loans for which the borrower has a FICO score less than 620 |
| |
Ÿ | Countrywide PCI loan portfolios |
| |
Ÿ | Certain loans that met a pre-defined delinquency and probability of default threshold as of January 1, 2011 |
For more information on Legacy Asset Servicing within CRES, see page 43.
Table 2324 presents outstandings, nonperforming balances, and net charge-offs, byallowance for loan and lease losses and provision for loan and lease losses for the Core portfolio and the Legacy AssetAssets & Servicing portfolio forwithin the home loans portfolio. For more information on Legacy Assets & Servicing, see page 41.
| | | | | | | | | | | | | | | | | | | | | | | | | |
| Table 23 | Home Loans Portfolio | | | |
| Table 24 | | Home Loans Portfolio | | | | |
| | | | | | | | | | | |
| | | December 31 | | | | December 31 | | | | |
| | | Outstandings | | Nonperforming | | Net
Charge-offs | | Outstandings | | Nonperforming | | Net Charge-offs (1) |
| (Dollars in millions) | (Dollars in millions) | 2011 | | 2010 | | 2011 | | 2010 | | 2011 | (Dollars in millions) | 2012 | | 2011 | | 2012 (2) | | 2011 | | 2012 (2) | | 2011 |
| Core portfolio | Core portfolio | |
| | |
| | |
| | |
| | |
| Core portfolio | |
| | |
| | |
| | |
| | |
| | |
| Residential mortgage | Residential mortgage | $ | 178,337 |
| | $ | 166,927 |
| | $ | 2,414 |
| | $ | 1,510 |
| | $ | 348 |
| Residential mortgage | $ | 170,116 |
| | $ | 178,337 |
| | $ | 3,190 |
| | $ | 2,414 |
| | $ | 544 |
| | $ | 348 |
|
| Home equity | Home equity | 67,055 |
| | 71,519 |
| | 439 |
| | 107 |
| | 501 |
| Home equity | 60,851 |
| | 67,055 |
| | 1,265 |
| | 439 |
| | 811 |
| | 501 |
|
| Legacy Asset Servicing portfolio | | | |
| | |
| | |
| | | |
Residential mortgage (1) | 83,953 |
| | 91,046 |
| | 13,556 |
| | 16,181 |
| | 3,484 |
| |
| Total Core portfolio | | Total Core portfolio | 230,967 |
| | 245,392 |
| | 4,455 |
| | 2,853 |
| | 1,355 |
| | 849 |
|
| Legacy Assets & Servicing portfolio | | Legacy Assets & Servicing portfolio | | | |
| | |
| | |
| | | | |
Residential mortgage (3) | | Residential mortgage (3) | 73,065 |
| | 83,953 |
| | 11,618 |
| | 13,556 |
| | 2,509 |
| | 3,484 |
|
| Home equity | Home equity | 57,644 |
| | 66,462 |
| | 2,014 |
| | 2,587 |
| | 3,972 |
| Home equity | 47,145 |
| | 57,644 |
| | 3,016 |
| | 2,014 |
| | 3,426 |
| | 3,972 |
|
Discontinued real estate (1) | 11,095 |
| | 13,108 |
| | 290 |
| | 331 |
| | 92 |
| |
Discontinued real estate (3) | | Discontinued real estate (3) | 9,892 |
| | 11,095 |
| | 248 |
| | 290 |
| | 63 |
| | 92 |
|
| Total Legacy Assets & Servicing portfolio | | Total Legacy Assets & Servicing portfolio | 130,102 |
| | 152,692 |
| | 14,882 |
| | 15,860 |
| | 5,998 |
| | 7,548 |
|
| Home loans portfolio | Home loans portfolio | |
| | |
| | |
| | |
| | |
| Home loans portfolio | |
| | |
| | |
| | |
| | |
| | |
|
| Residential mortgage | Residential mortgage | 262,290 |
| | 257,973 |
| | 15,970 |
| | 17,691 |
| | 3,832 |
| Residential mortgage | 243,181 |
| | 262,290 |
| | 14,808 |
| | 15,970 |
| | 3,053 |
| | 3,832 |
|
| Home equity | Home equity | 124,699 |
| | 137,981 |
| | 2,453 |
| | 2,694 |
| | 4,473 |
| Home equity | 107,996 |
| | 124,699 |
| | 4,281 |
| | 2,453 |
| | 4,237 |
| | 4,473 |
|
| Discontinued real estate | Discontinued real estate | 11,095 |
| | 13,108 |
| | 290 |
| | 331 |
| | 92 |
| Discontinued real estate | 9,892 |
| | 11,095 |
| | 248 |
| | 290 |
| | 63 |
| | 92 |
|
| Total home loans portfolio | Total home loans portfolio | $ | 398,084 |
| | $ | 409,062 |
| | $ | 18,713 |
| | $ | 20,716 |
| | $ | 8,397 |
| Total home loans portfolio | $ | 361,069 |
| | $ | 398,084 |
| | $ | 19,337 |
| | $ | 18,713 |
| | $ | 7,353 |
| | $ | 8,397 |
|
| | | | | | | | | | | | | | |
| | | | | | | | December 31 | | | | |
| | | | | | | | Allowance for loan and lease losses (4) | | Provision for loan and lease losses |
| | | | | | | | 2012 | | 2011 | | 2012 | | 2011 |
| Core portfolio | | Core portfolio | | | | | | | | | | | |
| Residential mortgage | | Residential mortgage | | | | | $ | 829 |
| | $ | 850 |
| | $ | 523 |
| | $ | 450 |
|
| Home equity | | Home equity | | | | | 1,269 |
| | 2,054 |
| | 256 |
| | 386 |
|
| Total Core portfolio | | Total Core portfolio | | | | | 2,098 |
| | 2,904 |
| | 779 |
| | 836 |
|
| Legacy Assets & Servicing portfolio | | Legacy Assets & Servicing portfolio | | | | | |
| | |
| | | | |
|
| Residential mortgage | | Residential mortgage | | | | | 4,175 |
| | 4,865 |
| | 1,842 |
| | 4,003 |
|
| Home equity | | Home equity | | | | | 6,576 |
| | 11,040 |
| | 1,492 |
| | 4,296 |
|
| Discontinued real estate | | Discontinued real estate | | | | | 2,084 |
| | 2,270 |
| | (40 | ) | | 1,165 |
|
| Total Legacy Assets & Servicing portfolio | | Total Legacy Assets & Servicing portfolio | | | | | 12,835 |
| | 18,175 |
| | 3,294 |
| | 9,464 |
|
| Home loans portfolio | | Home loans portfolio | | | | | |
| | |
| | |
| | |
|
| Residential mortgage | | Residential mortgage | | | | | 5,004 |
| | 5,715 |
| | 2,365 |
| | 4,453 |
|
| Home equity | | Home equity | | | | | 7,845 |
| | 13,094 |
| | 1,748 |
| | 4,682 |
|
| Discontinued real estate | | Discontinued real estate | | | | | 2,084 |
| | 2,270 |
| | (40 | ) | | 1,165 |
|
| Total home loans portfolio | | Total home loans portfolio | | | | | $ | 14,933 |
| | $ | 21,079 |
| | $ | 4,073 |
| | $ | 10,300 |
|
| |
(1) | Net charge-offs exclude $2.8 billion of write-offs in the Countrywide home equity PCI loan portfolio for 2012 which is included in the Legacy Assets & Servicing portfolio. |
| |
(2) | Nonperforming loans and net charge-offs include the impacts of the National Mortgage Settlement and guidance issued by regulatory agencies. For more information, see Consumer Portfolio Credit Risk Management on page 80 and Table 21. |
| |
(3) | Balances exclude consumer loans accounted for under the fair value option of $147 million and $906 million forof residential mortgage loans and $858 million and $1.3 billion forof discontinued real estate loans at December 31, 2012 and 2011. There were no consumer loans accounted for under the fair value option at December 31, 2010. See Consumer Portfolio Credit Risk Management – Consumer Loans Accounted for Under the Fair Value Option on page 93 and Note 2322 – Fair Value Option to the Consolidated Financial Statements for additional information on the fair value option. |
| |
(4) | The $2.8 billion of write-offs in the Countrywide home equity PCI loan portfolio for 2012 decreased the PCI valuation allowance included as part of the allowance for loan and lease losses. For information on PCI write-offs, see Countrywide Purchased Credit-impaired Loan Portfolio on page 90. |
We believe that the presentation of information adjusted to exclude the impact of the Countrywide PCI loan portfolio, the fully-insured loan portfolio and loans accounted for under the fair value option is more representative of the ongoing operations and credit quality of the business. As a result, in the following discussions of the residential mortgage, home equity and discontinued real
estate portfolios, we provide information that excludes the impact of the Countrywide PCI loan portfolio, the fully-insured loan portfolio and loans accounted for under the fair value option in certain credit quality statistics. We separately disclose information on the Countrywide PCI loan portfolios on page 8990.
Residential Mortgage
The residential mortgage portfolio, which for purposes of the consumer credit portfolio discussion and related tables excludes
the discontinued real estate portfolio acquired from Countrywide, makes up the largest percentage of our consumer loan portfolio at 4344 percent of consumer loans at December 31, 20112012. Approximately 1417 percent of the residential mortgage portfolio is in GWIM and represents residential mortgages that are originated for the home purchase and refinancing needs of our wealth management clients. The remaining portion of the portfolio is mostlyprimarily in All Other and is comprised of both originated loans, as well as purchased loans used in our overall ALM activities.activities, delinquent FHA loans repurchased pursuant to our servicing agreements with GNMA as well as loans repurchased related to our representations and warranties.
Outstanding balances in the residential mortgage portfolio, excluding $906147 million of loans accounted for under the fair value option, increaseddecreased $4.319.1 billion atin December 31, 2011 compared to December 31, 20102012 as new origination volume, the majority of which is fully-insured, was partially offset by paydowns, charge-offs
and transfers to foreclosed properties. In addition, repurchases of FHA delinquent loans pursuant toproperties more than offset new origination volume retained on our servicing agreements with GNMA also balance sheet.
increased the residential mortgage portfolio during 2011. At December 31, 20112012 and 20102011, the residential mortgage portfolio included $93.990.9 billion and $67.293.9 billion of outstanding fully-insured loans. On this portion of the residential mortgage portfolio, we are protected against principal loss as a result of either FHA insurance andor long-term stand-by agreements with FNMA and FHLMC. At December 31, 20112012 and 20102011, $24.0$66.6 billion and $20.1$69.5 billion were related to repurchases ofhad FHA delinquent loans pursuant to our servicing agreements with GNMAinsurance and the remainder of the fully-insured portfolio represents originations that were retained on-balance sheet.
At December 31, 2011 and 2010, principal balances of $23.8$24.3 billion and $12.9$24.4 billion were protected by long-term stand-by agreements. All of these loans are individually insured and therefore the Corporation does not record an allowance for credit losses.losses with respect to these loans.
At December 31, 2012 and 2011, $25.5 billion and $24.0 billion of the FHA-insured loan population were delinquent FHA loans repurchased pursuant to our servicing agreements with GNMA.
In addition to the abovementioned long-term stand-by agreements with FNMA and FHLMC, we have mitigated a portion
of our credit risk on the residential mortgage portfolio through the use of synthetic securitization vehicles as described in Note 65 – Outstanding Loans and Leases to the Consolidated Financial Statements.
At December 31, 20112012 and 20102011, the synthetic securitization vehicles referenced principal balances of $23.917.6 billion and $53.923.9 billion of residential mortgage loans and provided loss protection up to $783500 million and $1.1 billion783 million. At December 31, 20112012 and 20102011, the Corporation had a receivable of $359305 million and $722359 million from these vehicles for reimbursement of losses. The
Corporation records an allowance for credit losses on loans referenced by the synthetic securitization vehicles. The reported net charge-offs for the residential mortgage portfolio do not include the benefit of amounts reimbursable from these vehicles. Adjusting for the benefit of the credit protection from the synthetic securitizations, the residential mortgage net charge-off ratio, excluding the Countrywide PCI and fully-insured loan portfolios, for 20112012 would have been reduced by 13nine bps, and eight13 bps for 20102011.
Synthetic securitizations and the long-term stand-by agreements with FNMA and FHLMC together reduce our regulatory risk-weighted assets due to the transfer of a portion of our credit risk to unaffiliated parties. At December 31, 20112012 and 20102011, these programs had the cumulative effect of reducing our risk-weighted assets by $7.2 billion and $7.9 billion, and $8.2 billion, increasedincreasing our Tier 1 capital ratio by eight bps and six bps,for both periods, and our Tier 1 common capital ratio by sixseven bps and fivesix bps.
Table 2425 presents certain residential mortgage key credit statistics on both a reported basis excluding loans accounted for under the fair value option, and excluding the Countrywide PCI loan portfolio, the fully-insured loan portfolio and loans accounted for under the fair value option. We believe the presentation of information adjusted to exclude these loan portfolios is more representative of the credit risk in the residential mortgage loan portfolio. As such, the following discussion presents the residential mortgage portfolio excluding the Countrywide PCI loan portfolio, the fully-insured loan portfolio and loans accounted for under the fair value option. For more information on the Countrywide PCI loan portfolio, see page 8990.
| | | | | | | | | | | | | | | | | | | |
| Table 24 | Residential Mortgage – Key Credit Statistics | |
| Table 25 | | Residential Mortgage – Key Credit Statistics |
| | | | | | | | | | | | | | | | | |
| | | December 31 | | December 31 |
| | | Reported Basis (1) | | Excluding Countrywide
Purchased Credit-impaired
and Fully-insured Loans | | Reported Basis (1) | | Excluding Countrywide
Purchased Credit-impaired
and Fully-insured Loans |
| (Dollars in millions) | (Dollars in millions) | 2011 | | 2010 | | 2011 | | 2010 | (Dollars in millions) | 2012 | | 2011 | | 2012 | | 2011 |
| Outstandings | Outstandings | $ | 262,290 |
| | $ | 257,973 |
| | $ | 158,470 |
| | $ | 180,136 |
| Outstandings | $ | 243,181 |
| | $ | 262,290 |
| | $ | 143,590 |
| | $ | 158,470 |
|
| Accruing past due 30 days or more | Accruing past due 30 days or more | 28,688 |
| | 24,267 |
| | 3,950 |
| | 5,117 |
| Accruing past due 30 days or more | 28,780 |
| | 28,688 |
| | 3,082 |
| | 3,950 |
|
| Accruing past due 90 days or more | Accruing past due 90 days or more | 21,164 |
| | 16,768 |
| | n/a | | n/a | Accruing past due 90 days or more | 22,157 |
| | 21,164 |
| | n/a | | n/a |
Nonperforming loans | Nonperforming loans | 15,970 |
| | 17,691 |
| | 15,970 |
| | 17,691 |
| Nonperforming loans | 14,808 |
| | 15,970 |
| | 14,808 |
| | 15,970 |
|
| Percent of portfolio | Percent of portfolio | |
| | |
| | |
| | |
| Percent of portfolio | |
| | |
| | |
| | |
|
| Refreshed LTV greater than 90 but less than 100 | Refreshed LTV greater than 90 but less than 100 | 15 | % | | 15 | % | | 11 | % | | 11 | % | Refreshed LTV greater than 90 but less than 100 | 16 | % | | 15 | % | | 10 | % | | 11 | % |
| Refreshed LTV greater than 100 | Refreshed LTV greater than 100 | 33 |
| | 32 |
| | 26 |
| | 24 |
| Refreshed LTV greater than 100 | 28 |
| | 33 |
| | 20 |
| | 26 |
|
| Refreshed FICO below 620 | Refreshed FICO below 620 | 21 |
| | 20 |
| | 15 |
| | 15 |
| Refreshed FICO below 620 | 22 |
| | 21 |
| | 14 |
| | 15 |
|
2006 and 2007 vintages (2)(3) | 2006 and 2007 vintages (2)(3) | 27 |
| | 32 |
| | 37 |
| | 40 |
| 2006 and 2007 vintages (2)(3) | 24 |
| | 27 |
| | 34 |
| | 37 |
|
Net charge-off ratio (3) | 1.45 |
| | 1.49 |
| | 2.27 |
| | 1.86 |
| |
Net charge-off ratio (2, 4) | | Net charge-off ratio (2, 4) | 1.21 |
| | 1.45 |
| | 2.02 |
| | 2.27 |
|
| |
(1) | Outstandings, accruing past due, nonperforming loans and percentages of portfolio exclude loans accounted for under the fair value option. There were no$147 million and $906 million of residential mortgage loans accounted for under the fair value option at December 31, 20102012 and 2011. See Consumer Portfolio Credit Risk Management – Consumer Loans Accounted for Under the Fair Value Option on page 93 and Note 2322 – Fair Value Option to the Consolidated Financial Statements for additional information on the fair value option. |
| |
(2) | Nonperforming loans at December 31, 2012 and net charge-off ratios for 2012 include the impact of new regulatory guidance on loans discharged in Chapter 7 bankruptcy. For more information, see Consumer Portfolio Credit Risk Management on page 80 and Table 21. |
| |
(3) | These vintages of loans account for 6360 percent and 6763 percent of nonperforming residential mortgage loans at December 31, 20112012 and 20102011. These vintages of loans accounted for, and 7372 percent and 7773 percent of residential mortgage net charge-offs in 20112012 and 20102011. |
| |
(3)(4)
| Net charge-off ratios are calculated as net charge-offs divided by average outstanding loans excluding loans accounted for under the fair value option. |
n/a = not applicable
Nonperforming residential mortgage loans decreased $1.7 billion compared to December 31, 2010 as outflows outpaced new inflows, which continued to slow in 2011 due to favorable delinquency trends. Accruing loans past due 30 days or more decreased$1.2 billion in 2012 as paydowns, charge-offs and returns to $4.0 billionperforming status, outpaced new inflows. In addition, nonperforming residential mortgage loan balances at December 31, 20112012. included $572 million due to new regulatory guidance related to loans less than 60 days past due that were discharged in Chapter 7 bankruptcy. At December 31, 20112012, $11.4borrowers were current on contractual payments with respect to $3.5 billion, or 7124 percent of thenonperforming residential mortgage loans, and $8.7 billion, or
59 percent of nonperforming residential mortgage loans were 180 days or more past due and had been written down to the estimated fair value of the collateral less estimated costs to sell. Accruing loans past due 30 days or more decreased$868 million in 2012.
Net charge-offs increaseddecreased $162779 million to $3.83.1 billion in 20112012, or 2.272.02 percent of total average residential mortgage loans, compared to 1.86$3.8 billion, or 2.27 percent, for 20102011. This increasedecrease in net charge-offs for 20112012 was primarily driven by further deterioration in home pricesdecreased write-
downs on loans greater than 180 days past due which were written down to the estimated fair value of the collateral less estimated costs to sell, partially offset byand favorable delinquency trends. In addition, 2012 included $75 million in net charge-offs related to loans discharged in Chapter 7 bankruptcy that were written down to the underlying collateral value as a result of new regulatory guidance. For more information on the new regulatory guidance on loans discharged in Chapter 7 bankruptcy, see Consumer Portfolio Credit Risk Management on page 80 and Table 21. Net charge-off ratios were further impacted by lower loan balances primarily due to paydowns and charge-offs outpacing new originations.
Loans in the residential mortgage portfolio with certain characteristics have greater risk of loss than others. These characteristics include loans with a high refreshed LTV, loans originated at the peak of home prices in 2006 and 2007, interest-only loans and loans to borrowers located in California and Florida where we have concentrations and where significant declines in home prices have been experienced. Although the following disclosures in this section address each of these risk characteristics separately, there is significant overlap in loans with these characteristics, which contributed to a disproportionate share of the losses in the portfolio. The residential mortgage loans with all of these higher risk characteristics comprised four percent and six percent of the residential mortgage portfolio at both December 31, 20112012 and 20102011, butand accounted for 2320 percent of the residential mortgage net charge-offs in 20112012, and 2623 percent in 20102011.
Residential mortgage loans with a greater than 90 percent but less than 100 percent refreshed LTV represented 10 percent and 11 percent of the residential mortgage portfolio at both December 31, 20112012 and 20102011. Loans with a refreshed LTV greater than 100 percent represented 2620 percent and 2426 percent of the residential mortgage loan portfolio at December 31, 20112012 and 20102011. Of the loans with
a refreshed LTV greater than 100 percent, 92 percent and 88 percent were performing at both December 31, 20112012 and 20102011. Loans with a refreshed LTV greater than 100 percent reflect loans where the outstanding carrying value of the loan is greater than
the most recent valuation of the property securing the loan. The majority of these loans have a refreshed LTV greater than 100 percent primarily due primarily to home price deterioration over the past several years. Loans to borrowers with refreshed FICO scores below 620 represented 14 percent and 15 percent of the residential mortgage portfolio at both December 31, 20112012 and 20102011.
Of the $158.5143.6 billion and $180.1158.5 billion in total residential mortgage loans outstanding at December 31, 20112012 and 20102011, as shown in Table 2426, 4041 percent and 3840 percent were originated as interest-only loans. The outstanding balance of interest-only residential mortgage loans that have entered the amortization period was $13.3$13.7 billion, or 2123 percent, at December 31, 20112012. Residential mortgage loans that have entered the amortization period have experienced a higher rate of early stage delinquencies and nonperforming status compared to the residential mortgage portfolio as a whole. As of December 31, 20112012, $484$368 million, or fourthree percent of outstanding interest-only residential mortgages that had entered the amortization period were accruing past due 30 days or more compared to $4.0$3.1 billion, or two percent of accruing past due 30 days or more for the entire residential mortgage portfolio. In addition, at December 31, 20112012, $2.0$2.1 billion, or 1516 percent of outstanding interest-only residential mortgages that had entered the amortization period were nonperforming compared to $16.0$14.8 billion, or 10 percent of nonperforming loans for the entire residential mortgage portfolio. Loans in our interest-only residential mortgage portfolio have an interest-only period of three to 10 years and more than 8085 percent of these loans will not be required to make a fully-amortizing payment until 2015 or later.
Table 2526 presents outstandings, nonperforming loans and net charge-offs by certain state concentrations for the residential mortgage portfolio. The Los Angeles-Long Beach-Santa Ana Metropolitan Statistical Area (MSA) within California represented 12 percent and 13 percent of outstandings at both December 31, 20112012 and 20102011, but. Loans within this MSA comprised only eight percent and seven percent of net charge-offs for both 20112012 and 20102011.
| | | | | | | | | | | | | | | | | | | | | | | | | | | |
| Table 25 | Residential Mortgage State Concentrations | |
| Table 26 | | Residential Mortgage State Concentrations |
| | | | | | | | | | | | | | | | | | | | | | | | | |
| | | December 31 | | | | December 31 | | |
| | | Outstandings (1) | | Nonperforming (1) | | Net Charge-offs | | Outstandings (1) | | Nonperforming (1) | | Net Charge-offs |
| (Dollars in millions) | (Dollars in millions) | 2011 | | 2010 | | 2011 | | 2010 | | 2011 | | 2010 | (Dollars in millions) | 2012 | | 2011 | | 2012 (2) | | 2011 | | 2012 (2) | | 2011 |
| California | California | $ | 54,203 |
| | $ | 63,677 |
| | $ | 5,606 |
| | $ | 6,389 |
| | $ | 1,326 |
| | $ | 1,392 |
| California | $ | 48,281 |
| | $ | 54,203 |
| | $ | 4,510 |
| | $ | 5,606 |
| | $ | 1,117 |
| | $ | 1,326 |
|
| Florida | 12,338 |
| | 13,298 |
| | 1,900 |
| | 2,054 |
| | 595 |
| | 604 |
| |
| New York | 11,539 |
| | 12,198 |
| | 838 |
| | 772 |
| | 106 |
| | 44 |
| |
New York (3) | | New York (3) | 11,240 |
| | 11,539 |
| | 956 |
| | 838 |
| | 79 |
| | 106 |
|
Florida (3) | | Florida (3) | 10,994 |
| | 12,338 |
| | 1,729 |
| | 1,900 |
| | 372 |
| | 595 |
|
| Texas | Texas | 7,525 |
| | 8,466 |
| | 425 |
| | 492 |
| | 55 |
| | 52 |
| Texas | 6,885 |
| | 7,525 |
| | 488 |
| | 425 |
| | 51 |
| | 55 |
|
| Virginia | Virginia | 5,709 |
| | 6,441 |
| | 399 |
| | 450 |
| | 64 |
| | 72 |
| Virginia | 5,067 |
| | 5,709 |
| | 404 |
| | 399 |
| | 50 |
| | 64 |
|
| Other U.S./Non-U.S. | Other U.S./Non-U.S. | 67,156 |
| | 76,056 |
| | 6,802 |
| | 7,534 |
| | 1,686 |
| | 1,506 |
| Other U.S./Non-U.S. | 61,123 |
| | 67,156 |
| | 6,721 |
| | 6,802 |
| | 1,384 |
| | 1,686 |
|
Residential mortgage loans (2)(4) | Residential mortgage loans (2)(4) | $ | 158,470 |
| | $ | 180,136 |
| | $ | 15,970 |
| | $ | 17,691 |
| | $ | 3,832 |
| | $ | 3,670 |
| Residential mortgage loans (2)(4) | $ | 143,590 |
| | $ | 158,470 |
| | $ | 14,808 |
| | $ | 15,970 |
| | $ | 3,053 |
| | $ | 3,832 |
|
| Fully-insured loan portfolio | Fully-insured loan portfolio | 93,854 |
| | 67,245 |
| | |
| | |
| | |
| | |
| Fully-insured loan portfolio | 90,854 |
| | 93,854 |
| | |
| | |
| | |
| | |
|
| Countrywide purchased credit-impaired residential mortgage loan portfolio | Countrywide purchased credit-impaired residential mortgage loan portfolio | 9,966 |
| | 10,592 |
| | |
| | |
| | |
| | |
| Countrywide purchased credit-impaired residential mortgage loan portfolio | 8,737 |
| | 9,966 |
| | |
| | |
| | |
| | |
|
| Total residential mortgage loan portfolio | Total residential mortgage loan portfolio | $ | 262,290 |
| | $ | 257,973 |
| | |
| | |
| | |
| | |
| Total residential mortgage loan portfolio | $ | 243,181 |
| | $ | 262,290 |
| | |
| | |
| | |
| | |
|
| |
(1) | Outstandings and nonperforming amounts exclude loans accounted for under the fair value option at December 31, 2011.option. There were no$147 million and $906 million of residential mortgage loans accounted for under the fair value option at December 31, 20102012 and 2011. See Consumer Portfolio Credit Risk Management – Consumer Loans Accounted for Under the Fair Value Option on page 93 and Note 2322 – Fair Value Option to the Consolidated Financial Statements for additional information on the fair value option. |
| |
(2) | Nonperforming loans and net charge-offs include the impact of new regulatory guidance on loans discharged in Chapter 7 bankruptcy. For more information, see Consumer Portfolio Credit Risk Management on page 80 and Table 21. |
| |
(3) | In these states, foreclosure requires a court order following a legal proceeding (judicial states). |
| |
(4) | Amount excludes the Countrywide PCI residential mortgage and fully-insured loan portfolios. |
The Community Reinvestment Act (CRA) encourages banks to meet the credit needs of their communities for housing and other purposes, particularly in neighborhoods with low or moderate incomes. At December 31, 20112012 and 20102011, our CRA portfolio was $12.5
$11.3 billion and $13.8$12.5 billion, or eight percent of the residential mortgage loan balances for both periods. The CRA portfolio included $2.5 billion and $3.0 billion of nonperforming loans at both December 31, 20112012 and 20102011 representing 17 percent and 15 percent and 17 percentof
total nonperforming residential mortgage loans. Net charge-offs related to the CRA portfolio were $732$643 million and $857$732 million for 20112012 and 20102011, or 1921 percent and 2319 percent of total net charge-offs for the residential mortgage portfolio.
For information on representations and warranties related to our residential mortgage portfolio, see Off-Balance Sheet Arrangements and Contractual Obligations – Representations and Warranties on page 5654 and Note 98 – Representations and Warranties Obligations and Corporate Guarantees to the Consolidated Financial Statements.
Home Equity
The home equity portfolio makes up 20 percent of the consumer portfolio and is comprised of HELOCs, home equity loans and reverse mortgages. As of December 31, 20112012, our HELOC portfolio had an outstanding balance of $103.4$91.3 billion, or 8385 percent of the total home equity portfolio. HELOCs generally have an initial draw period of 10 years with approximately 11nine percent of the portfolio having a draw period of five years with a five-year renewal option. During the initial draw period, the borrowers are only required to pay the interest due on the loans on a monthly basis. After the initial draw period ends, the loans generally convert to 15-year amortizing loans.
As of December 31, 20112012, our home equity loan portfolio had an outstanding balance of $20.2$15.3 billion, or 1614 percent of the total home equity portfolio. Home equity loans are almost all fixed-rate loans
with amortizing payment terms of 10 to 30 years and approximately 5251 percent of these loans have 25 to 30-year terms.
As of December 31, 20112012, our reverse mortgage portfolio had an outstanding balance of $1.1$1.4 billion, or one percent of the total home equity portfolio. In 2011, we exited the reverse mortgage origination business.
At December 31, 20112012, approximately 88 percent of the home equity portfolio was included in CRES while the remainder of the portfolio was primarily in GWIM. Outstanding balances in the home equity portfolio decreased $13.316.7 billion in 20112012 primarily due to paydowns and charge-offs outpacing new originations and draws on existing lines. In addition, in 2012, $2.9 billion of loans, including $2.5 billion of Countrywide PCI loans in the home equity portfolio, were forgiven in connection with the National Mortgage Settlement. Of the total home equity portfolio at December 31, 20112012 and 20102011,$21.1 billion, or 20 percent, and $24.5 billion, or 20 percent, and $24.8 billion, or 18 percent, were in first-lien positions (22(21 percent and 2022 percent excluding the Countrywide PCI home equity portfolio)portfolio at December 31, 2012 and 2011). As of December 31, 20112012, outstanding balances in the home equity portfolio that were in a second-lien or more junior-lien position and where we also held the first-lien loan totaled $37.2$29.8 billion, or 3330 percent of our total home equity portfolio excluding the Countrywide PCI loan portfolio.
Unused HELOCs totaled $67.5$60.9 billion at December 31, 2012 compared to $67.5 billion at December 31, 2011 compared to $80.1 billion at December 31, 2010. This decrease was primarily due primarily to customers choosing to close accounts as well as line management initiatives on deteriorating accounts, which more than offset new production. The HELOC utilization rate was 60 percent at December 31, 2012 compared to 61 percent at December 31, 2011 compared to 59 percent at December 31, 2010.
Table 2627 presents certain home equity portfolio key credit statistics on both a reported basis as well as excluding the Countrywide PCI loan portfolio. We believe the presentation of information adjusted to exclude the impact of the Countrywide PCI loan portfolio is more representative of the credit risk in this portfolio.
| | | | | | | | | | | | | | | | | | | |
| Table 26 | Home Equity – Key Credit Statistics | |
| Table 27 | | Home Equity – Key Credit Statistics |
| | | | | | | | | | | | | | | | | |
| | | December 31 | | December 31 |
| | | Reported Basis | | Excluding Countrywide Purchased
Credit-impaired Loans | | Reported Basis | | Excluding Countrywide Purchased
Credit-impaired Loans |
| (Dollars in millions) | (Dollars in millions) | 2011 | | 2010 | | 2011 | | 2010 | (Dollars in millions) | 2012 | | 2011 | | 2012 | | 2011 |
| Outstandings | Outstandings | $ | 124,699 |
| | $ | 137,981 |
| | $ | 112,721 |
| | $ | 125,391 |
| Outstandings | $ | 107,996 |
| | $ | 124,699 |
| | $ | 99,449 |
| | $ | 112,721 |
|
Accruing past due 30 days or more (1) | Accruing past due 30 days or more (1) | 1,658 |
| | 1,929 |
| | 1,658 |
| | 1,929 |
| Accruing past due 30 days or more (1) | 1,098 |
| | 1,658 |
| | 1,098 |
| | 1,658 |
|
Nonperforming loans (1) | 2,453 |
| | 2,694 |
| | 2,453 |
| | 2,694 |
| |
Nonperforming loans (1, 2) | | Nonperforming loans (1, 2) | 4,281 |
| | 2,453 |
| | 4,281 |
| | 2,453 |
|
| Percent of portfolio | Percent of portfolio | |
| | |
| | |
| | |
| Percent of portfolio | |
| | |
| | |
| | |
|
| Refreshed combined LTV greater than 90 but less than 100 | Refreshed combined LTV greater than 90 but less than 100 | 10 | % | | 11 | % | | 11 | % | | 11 | % | Refreshed combined LTV greater than 90 but less than 100 | 10 | % | | 10 | % | | 10 | % | | 11 | % |
| Refreshed combined LTV greater than 100 | Refreshed combined LTV greater than 100 | 36 |
| | 34 |
| | 32 |
| | 30 |
| Refreshed combined LTV greater than 100 | 31 |
| | 36 |
| | 29 |
| | 32 |
|
Refreshed FICO below 620 | Refreshed FICO below 620 | 13 |
| | 14 |
| | 12 |
| | 12 |
| Refreshed FICO below 620 | 9 |
| | 11 |
| | 8 |
| | 9 |
|
2006 and 2007 vintages (2)(4) | 2006 and 2007 vintages (2)(4) | 50 |
| | 50 |
| | 46 |
| | 47 |
| 2006 and 2007 vintages (2)(4) | 48 |
| | 50 |
| | 46 |
| | 46 |
|
Net charge-off ratio (3) | 3.42 |
| | 4.65 |
| | 3.77 |
| | 5.10 |
| |
Net charge-off ratio (2, 5) | | Net charge-off ratio (2, 5) | 3.62 |
| | 3.42 |
| | 3.98 |
| | 3.77 |
|
| |
(1) | Accruing past due 30 days or more includes $609321 million and $662609 million and nonperforming loans includes $703824 million and $480703 million of loans where we serviced the underlying first-lien at December 31, 20112012 and 20102011. |
| |
(2) | Nonperforming loans at December 31, 2012 and net charge-off ratios for 2012 include the impacts of the National Mortgage Settlement and guidance issued by regulatory agencies. For more information, see Consumer Portfolio Credit Risk Management on page 80 and Table 21. |
| |
(3) | Beginning in 2012, home equity FICO metrics reflected an updated scoring model that is more representative of the credit risk of our borrowers. Prior period amounts were adjusted to reflect these updates. |
| |
(4) | These vintages of loans have higher refreshed combined LTV ratios and accounted for 5451 percent and 5754 percent of nonperforming home equity loans at December 31, 20112012 and 20102011. These vintages of loans, and accounted for 6560 percent and 6665 percent of net charge-offs in 20112012 and 20102011. |
| |
(3)(5)
| Net charge-off ratios are calculated as net charge-offs divided by average outstanding loans. |
The following discussion presents the home equity portfolio excluding the Countrywide PCI loan portfolio.
Nonperforming outstanding balances in the home equity portfolio decreasedincreased $2411.8 billion in 2012 due to the reclassification to nonperforming of junior-lien loans less than 90 days past due that have a senior-lien loan that is 90 days or more past due which
resulted in a $1.5 billion increase as of December 31, 2012, and the reclassification to nonperforming of loans less than 60 days past due that were discharged in Chapter 7 bankruptcy which resulted in an increase of $478 million at December 31, 2012, in both cases pursuant to new regulatory guidance.
These additions to nonperforming loans were partially offset by the $435 million of loans forgiven related to the National Mortgage Settlement. Excluding the impact of these items, nonperforming loans increased compared to December 31, 2010 driven primarily by charge-offs and nonperforming loans returning to performing status which together outpaced
delinquency inflows, which continued to slow during 2011 due to favorable early stage delinquency trends. Accruing outstanding balances past due 30 days or more decreased$271 millionas inflows outpaced outflows in 20112012. At December 31, 20112012, $1.1on $2.0 billion, or 4346 percent of the nonperforming home equity portfolio wasloans, the borrowers were current on contractual payments and $1.2 billion, or 28 percent of nonperforming home equity loans, were 180 days or more past due and had been written down to theirthe estimated fair values.value of the collateral less estimated costs to sell. Outstanding balances accruing past due 30 days or more decreased$560 million during 2012 driven in part by the reclassification of junior-lien home equity loans to nonperforming in accordance with regulatory interagency guidance. For more information on the changes as a result of regulatory guidance and the National Mortgage Settlement, see Consumer Portfolio Credit Risk Management on page 80.
In some cases, the junior-lien home equity outstanding balance that we hold is current,performing, but the underlying first-lien is not. For outstanding balances in the home equity portfolio in which we service the first-lien loan, we are able to track whether the first-lien loan is in default. For loans in whichwhere the first-lien is serviced by a third party, we utilize credit bureau data to estimate the delinquency status of the first-lien. Given that the credit bureau database we use does not include a property address for the mortgages, we are unable to identify with certainty whether a reported delinquent firstfirst-lien mortgage pertains to the same property for which we hold a second- or more junior-lien loan. As ofAt December 31, 20112012, we estimate that $4.7$2.6 billion of current second- or moreand $559 million of 30 to 89 days past due junior-lien loans were behind a delinquent first-lien loan. We service the first-lien loans on $1.3 billion$958 million of that amount,these combined amounts, with the remaining $3.4$2.2 billion serviced by third parties. Of the $4.7$3.2 billion current second-liento 89 days past due junior-lien loans, we estimate based on available credit bureau data as discussed aboveand our own internal servicing data, we estimate that approximately $2.5$1.5 billion had first-lien loans that were 12090 days or more past due, of which approximately $2.1 billion had first-lien loans serviced by third parties.due.
Net charge-offs decreased $2.3236 million to $4.2 billion, or 3.98 percent of the total average home equity portfolio, for 2012 compared to $4.5 billion, or 3.77 percent of the total average home equity portfolio,, for 2011 compared to $6.8 billion, or 5.10 percent, for 2010 primarily driven by favorable portfolio trends due in part to improvement in the U.S. economy. In addition, the net charge-off amounts duringeconomy partially offset by 2010$435 million were impacted by the implementation of regulatory guidance on collateral-dependent modified loans which resulted in $822 million in net charge-offs.charge-offs associated with the National Mortgage Settlement and $474 million in net charge-offs related to loans discharged in Chapter 7 bankruptcy that were written down to the underlying collateral value due to new regulatory guidance. Net charge-off ratios were further impacted by lower outstanding balances primarily as a result of paydowns and charge-offs outpacing new originations and draws on existing lines.
There are certain characteristics of the outstanding loan balances in the home equity portfolio that have contributed to higher losses including those loans with a high refreshed combined loan-to-value (CLTV), loans that were originated at the peak of home prices in 2006 and 2007, and loans in geographic areas that have experienced the most significant declines in home prices. Home price declines coupled with the fact that most home equity outstandings are secured by second-lien positions have significantly reduced and, in some cases, eliminated all collateral value after consideration of the first-lien position. Although the disclosures belowin this section address each of these risk characteristics separately, there is significant overlap in outstanding balances with these characteristics, which has contributed to a disproportionate share of losses in the portfolio. Outstanding balances in the home equity portfolio with
all of these higher risk characteristics comprised eight percent and 10 percent of the total home equity portfolio at both December 31, 20112012 and 20102011, but haveand accounted for 2824 percent of the home equity net charge-offs in 2011 and 292012 compared to 28 percent in 20102011.
Outstanding balances in the home equity portfolio with greater than 90 percent but less than 100 percent refreshed CLTVs comprised 10 percent and 11 percent of the home equity portfolio at both December 31, 20112012 and 20102011. Outstanding balances with refreshed CLTVs greater than 100 percent comprised 3229 percent and 3032 percent of the home equity portfolio at December 31, 20112012 and 20102011. Outstanding balances in the home equity portfolio with a refreshed CLTV greater than 100 percent reflect loans where the carrying value and available line of credit of the combined loans are equal to or greater than the most recent valuation of the property securing the loan. Depending on the value of the property, there may be collateral in excess of the first-lien that is available to reduce the severity of loss on the second-lien. Home price deterioration over the past several years has contributed to an increase in CLTV ratios. Of those outstanding balances with a refreshed CLTV greater than 100 percent, 95 percent of the customers were current at December 31, 20112012. For and 92 percent of second-lien loans with a refreshed CLTV greater than 100 percent that are current, 89 percent were also current on theboth their second-lien and underlying first-lien loans at December 31, 20112012. Outstanding balances in the home equity portfolio to borrowers with a refreshed FICO score below 620 represented 12eight percent and nine percent of the home equity portfolio at both December 31, 20112012 and 20102011.
Of the$99.4 billion and $112.7 billion in total home equity portfolio outstandings 78 percent and 75 percent at December 31, 20112012 and 20102011, 79 percent and 78 percent were originated as interest-only loans, almost all of which were HELOCs. The outstanding balance of HELOCs that have entered the amortization period was $1.6$2.1 billion, or two percent of total HELOCs, at December 31, 20112012. The HELOCs that have entered the amortization period have experienced a higher percentage of early stage delinquencies and nonperforming status when compared to the HELOC portfolio as a whole. As of December 31, 20112012, $49$72 million, or three percent of outstanding HELOCs that had entered the amortization period were accruing past due 30 days or more compared to $1.4 billion,$972 million, or one percent of outstanding accruing past due 30 days or more for the entire HELOC portfolio. In addition, at December 31, 20112012, $57$131 million, or foursix percent of outstanding HELOCs that had entered the amortization period were nonperforming compared to $2.0$3.7 billion, or twofour percent of outstandings that were nonperforming for the entire HELOC portfolio. Loans in our HELOC portfolio generally have an initial draw period of 10 years and more than 85 percent of these loans will not be required to make a fully-amortizing payment until 2015 or later.
Although we do not actively track how many of our home equity customers pay only the minimum amount due on their home equity loans and lines, we can infer some of this information through a review of our HELOC portfolio that we service and that is still in its revolving period (i.e., customers may draw on and repay their line of credit, but are generally only required to pay interest on a monthly basis). During 20112012, approximately 5150 percent of these customers did not pay down any principal on their HELOCs.
Table 2728 presents outstandings, nonperforming balances and net charge-offs by certain state concentrations for the home equity portfolio. In the New York area, the New York-Northern New Jersey-Long Island MSA made up 11 percent of the outstanding home equity portfolio at both December 31, 20112012 and 20102011. This MSA comprised seveneight percent and sixseven percent of net charge-offs for in
20112012 and 20102011. The Los Angeles-Long Beach-Santa Ana MSA within California made up 12 percent and 11 percent of the outstanding home equity portfolio at both December 31, 2012 and 2011 and
2010. This MSA comprised 1211 percent and 1112 percent of net charge-offs forin 20112012 and 20102011.
For information on representations and warranties related to our home equity portfolio, see Off-Balance Sheet Arrangements and Contractual Obligations – Representations and Warranties on page 5654 and Note 98 – Representations and Warranties Obligations and Corporate Guarantees to the Consolidated Financial Statements.
| | | | | | | | | | | | | | | | | | | | | | | | | | | |
| Table 27 | Home Equity State Concentrations | |
| Table 28 | | Home Equity State Concentrations |
| | | | | | | | | | | | | | | | | | | | | | | | | |
| | | December 31 | | | | December 31 | | |
| | | Outstandings | | Nonperforming | | Net Charge-offs | | Outstandings | | Nonperforming | | Net Charge-offs |
| (Dollars in millions) | (Dollars in millions) | 2011 | | 2010 | | 2011 | | 2010 | | 2011 | | 2010 | (Dollars in millions) | 2012 | | 2011 | | 2012 (1) | | 2011 | | 2012 (1, 2) | | 2011 |
| California | California | $ | 32,398 |
| | $ | 35,426 |
| | $ | 627 |
| | $ | 708 |
| | $ | 1,481 |
| | $ | 2,341 |
| California | $ | 28,728 |
| | $ | 32,398 |
| | $ | 1,127 |
| | $ | 627 |
| | $ | 1,333 |
| | $ | 1,481 |
|
Florida | Florida | 13,450 |
| | 15,028 |
| | 411 |
| | 482 |
| | 853 |
| | 1,420 |
| Florida | 11,898 |
| | 13,450 |
| | 706 |
| | 411 |
| | 602 |
| | 853 |
|
New Jersey | New Jersey | 7,483 |
| | 8,153 |
| | 175 |
| | 169 |
| | 164 |
| | 219 |
| New Jersey | 6,788 |
| | 7,483 |
| | 312 |
| | 175 |
| | 210 |
| | 164 |
|
New York | New York | 7,423 |
| | 8,061 |
| | 242 |
| | 246 |
| | 196 |
| | 273 |
| New York | 6,734 |
| | 7,423 |
| | 419 |
| | 242 |
| | 222 |
| | 196 |
|
| Massachusetts | Massachusetts | 4,919 |
| | 5,657 |
| | 67 |
| | 71 |
| | 71 |
| | 102 |
| Massachusetts | 4,381 |
| | 4,919 |
| | 140 |
| | 67 |
| | 91 |
| | 71 |
|
| Other U.S./Non-U.S. | Other U.S./Non-U.S. | 47,048 |
| | 53,066 |
| | 931 |
| | 1,018 |
| | 1,708 |
| | 2,426 |
| Other U.S./Non-U.S. | 40,920 |
| | 47,048 |
| | 1,577 |
| | 931 |
| | 1,779 |
| | 1,708 |
|
Home equity loans (1)(4) | Home equity loans (1)(4) | $ | 112,721 |
| | $ | 125,391 |
| | $ | 2,453 |
| | $ | 2,694 |
| | $ | 4,473 |
| | $ | 6,781 |
| Home equity loans (1)(4) | $ | 99,449 |
| | $ | 112,721 |
| | $ | 4,281 |
| | $ | 2,453 |
| | $ | 4,237 |
| | $ | 4,473 |
|
| Countrywide purchased credit-impaired home equity portfolio | Countrywide purchased credit-impaired home equity portfolio | 11,978 |
| | 12,590 |
| | |
| | |
| | |
| | |
| Countrywide purchased credit-impaired home equity portfolio | 8,547 |
| | 11,978 |
| | |
| | |
| | |
| | |
|
| Total home equity loan portfolio | Total home equity loan portfolio | $ | 124,699 |
| | $ | 137,981 |
| | |
| | |
| | |
| | |
| Total home equity loan portfolio | $ | 107,996 |
| | $ | 124,699 |
| | |
| | |
| | |
| | |
|
| |
(1) | Nonperforming loans and net charge-offs include the impacts of the National Mortgage Settlement and guidance issued by regulatory agencies. For more information, see Consumer Portfolio Credit Risk Management on page 80 and Table 21. |
| |
(2) | Net charge-offs exclude $2.8 billion of write-offs in the Countrywide home equity PCI loan portfolio for 2012. These write-offs decreased the PCI valuation allowance included as part of the allowance for loan and lease losses. For information on PCI write-offs, see Countrywide Purchased Credit-impaired Loan Portfolio on page 90. |
| |
(3) | In these states, foreclosure requires a court order following a legal proceeding (judicial states). |
| |
(4) | Amount excludes the Countrywide PCI home equity loan portfolio. |
Discontinued Real Estate
The discontinued real estate portfolio, excluding $1.3 billion858 million of loans accounted for under the fair value option, totaled $11.19.9 billion at December 31, 20112012 and consists of pay option and subprime loans acquired in the Countrywide acquisition. Upon acquisition, the majority of the discontinued real estate portfolio was considered credit-impaired and written down to fair value. At December 31, 20112012, the Countrywide PCI loan portfolio was $9.98.8 billion, or 89 percent of the total discontinued real estate portfolio. This portfolio is included in All Other and is managed as part of our overall ALM activities. See Countrywide Purchased Credit-impaired Loan Portfolio on page 8990 for more information on the discontinued real estate portfolio.
At December 31, 20112012, the purchased discontinued real estate portfolio that was not credit-impaired was $1.21.1 billion. Loans with greater than 90 percent refreshed LTVs and CLTVs comprised 2832 percent of the portfolio and those with refreshed FICO scores below 620 represented 4441 percent of the portfolio. The Los Angeles-Long Beach-Santa Ana MSA within California made up 16 percent of outstanding discontinued real estate loans at December 31, 20112012.
Pay option adjustable-rate mortgages (ARMs), which are included in the discontinued real estate portfolio, have interest rates that adjust monthly and minimum required payments that adjust annually, subject to resetting of the loan if minimum payments are made and deferred interest limits are reached. Annual payment adjustments are subject to a 7.5 percent maximum change. To ensure that contractual loan payments are adequate to repay a loan, the fully-amortizing loan payment amount is re-established after the initial five- or 10-year period and again every five years thereafter. These payment adjustments are not subject to the 7.5 percent limit and may be substantial due to changes in interest rates and the addition of unpaid interest to the loan balance. Payment advantage ARMs have interest rates that are fixed for an initial period of five years. Payments are subject to reset if the minimum payments are made and deferred interest
limits are reached. If interest deferrals cause a loan’s principal balance to
reach a certain level within the first 10 years of the life of the loan, the payment is reset to the interest-only payment; then at the 10-year point, the fully-amortizing payment is required.
The difference between the frequency of changes in a loan’s interest rates and payments along with a limitation on changes in the minimum monthly payments of 7.5 percent per year can result in payments that are not sufficient to pay all of the monthly interest charges (i.e., negative amortization). Unpaid interest is added to the loan balance until the loan balance increases to a specified limit, which can be no more than 115 percent of the original loan amount, at which time a new monthly payment amount adequate to repay the loan over its remaining contractual life is established.
At December 31, 20112012, the unpaid principal balance of pay option loans was $11.7$9.4 billion, with a carrying amount of $9.9$8.8 billion, including $9.0$8.1 billion of loans that were credit-impaired upon acquisition, and accordingly, are reserved forthe reserve is based on a life-of-loan loss estimate. The total unpaid principal balance of pay option loans with accumulated negative amortization was $9.5$6.4 billion including $672$464 million of negative amortization. For those borrowers who are making payments in accordance with their contractual terms, the percentage electing17 percent and 22 percent at December 31, 2012 and 2011 elected to make only the minimum payment on option ARMs was 72 percent at December 31, 2011 and 69 percent at December 31, 2010.ARMs. We believe the majority of borrowers are now making scheduled payments primarily because the low rate environment has caused the fully indexed rates to be affordable to more borrowers. We continue to evaluate our exposure to payment resets on the acquired negative-amortizing loans including the Countrywide PCI pay option loan portfolio and have taken into consideration several assumptions regarding this evaluation including prepayment and default rates. Of the loans in the pay option portfolio at December 31, 20112012 that have not already experienced a payment reset, sevenone percent are expected to reset in 20122013 and approximately 1723 percent are expected to reset thereafter. In addition, approximately seven percent are expected to prepay and approximately 69 percent are expected to default prior to being reset, most of which were severely delinquent as of December 31, 20112012.
|
| | |
| | 88Bank of America 2011201289
| | |
Countrywide Purchased Credit-impaired Loan Portfolio
Loans acquired with evidence of credit quality deterioration since origination and for which it is probable at purchase that we will be unable to collect all contractually required payments are accounted for under the accounting guidance for PCI loans, which addresses accounting for differences between contractual and expected cash flows to be collected from the purchaser’s initial investment in loans if those differences are attributable, at least in part, to credit quality. Evidence of credit quality deterioration as of the acquisition
date may include statistics such as past due status, refreshed FICO scores and refreshed LTVs. PCI loans are recorded at fair value upon acquisition and the applicable accounting guidance prohibits carrying over or recording a valuation allowance in the initial accounting.
PCI loans that have similar risk characteristics, primarily credit risk, collateral type and interest rate risk, are pooled and accounted for as a single asset with a single composite interest rate and an
aggregate expectation of cash flows. Once a pool is assembled, it is considered as if it were one loan for purposes of applying the accounting guidance for PCI loans. An individual loan is removed from a PCI loan pool if it is sold, foreclosed, forgiven or the expectation of any future proceeds is remote. When a loan is removed from a PCI loan pool and the foreclosure or recovery value of the loan is less than the loan’s carrying value, the difference is first applied against the PCI pool’s nonaccretable difference. If the nonaccretable difference has been fully utilized, only then is the PCI pool’s basis applicable to that loan written-off against its valuation reserve; however, the integrity of the pool is maintained and it continues to be accounted for as if it were one loan.
Table 2829 presents the unpaid principal balance, carrying value, related valuation allowance and the net carrying value as a percentage of the unpaid principal balance for the Countrywide PCI loan portfolio at December 31, 2011 and 2010.portfolio.
| | | | | | | | | | | | | | | | | | | | | | | |
| Table 28 | Countrywide Purchased Credit-impaired Loan Portfolio | |
| Table 29 | | Countrywide Purchased Credit-impaired Loan Portfolio |
| | | | | | | | | | | | | | | | | | | | | |
| | | December 31, 2011 | | December 31, 2012 |
| (Dollars in millions) | (Dollars in millions) | Unpaid
Principal
Balance | | Carrying
Value | | Related
Valuation
Allowance | | Carrying
Value Net of
Valuation
Allowance | | % of Unpaid
Principal
Balance | (Dollars in millions) | Unpaid
Principal
Balance | | Carrying
Value | | Related
Valuation
Allowance | | Carrying
Value Net of
Valuation
Allowance | | Percent of Unpaid
Principal
Balance |
| Residential mortgage | Residential mortgage | $ | 10,426 |
| | $ | 9,966 |
| | $ | 1,331 |
| | $ | 8,635 |
| | 82.82 | % | Residential mortgage | $ | 8,898 |
| | $ | 8,737 |
| | $ | 1,061 |
| | $ | 7,676 |
| | 86.27 | % |
| Home equity | Home equity | 12,516 |
| | 11,978 |
| | 5,129 |
| | 6,849 |
| | 54.72 |
| Home equity | 8,324 |
| | 8,547 |
| | 2,428 |
| | 6,119 |
| | 73.51 |
|
| Discontinued real estate | Discontinued real estate | 11,891 |
| | 9,857 |
| | 1,999 |
| | 7,858 |
| | 66.08 |
| Discontinued real estate | 9,281 |
| | 8,834 |
| | 2,047 |
| | 6,787 |
| | 73.13 |
|
| Total Countrywide purchased credit-impaired loan portfolio | Total Countrywide purchased credit-impaired loan portfolio | $ | 34,833 |
| | $ | 31,801 |
| | $ | 8,459 |
| | $ | 23,342 |
| | 67.01 |
| Total Countrywide purchased credit-impaired loan portfolio | $ | 26,503 |
| | $ | 26,118 |
| | $ | 5,536 |
| | $ | 20,582 |
| | 77.66 |
|
| | | | | | | | | | | | | | | | | | | | | |
| | | December 31, 2010 | | December 31, 2011 |
| Residential mortgage | Residential mortgage | $ | 11,481 |
| | $ | 10,592 |
| | $ | 663 |
| | $ | 9,929 |
| | 86.48 | % | Residential mortgage | $ | 10,426 |
| | $ | 9,966 |
| | $ | 1,111 |
| | $ | 8,855 |
| | 84.93 | % |
| Home equity | Home equity | 15,072 |
| | 12,590 |
| | 4,467 |
| | 8,123 |
| | 53.89 |
| Home equity | 12,516 |
| | 11,978 |
| | 5,129 |
| | 6,849 |
| | 54.72 |
|
| Discontinued real estate | Discontinued real estate | 14,893 |
| | 11,652 |
| | 1,204 |
| | 10,448 |
| | 70.15 |
| Discontinued real estate | 11,891 |
| | 9,857 |
| | 2,219 |
| | 7,638 |
| | 64.23 |
|
| Total Countrywide purchased credit-impaired loan portfolio | Total Countrywide purchased credit-impaired loan portfolio | $ | 41,446 |
| | $ | 34,834 |
| | $ | 6,334 |
| | $ | 28,500 |
| | 68.76 |
| Total Countrywide purchased credit-impaired loan portfolio | $ | 34,833 |
| | $ | 31,801 |
| | $ | 8,459 |
| | $ | 23,342 |
| | 67.01 |
|
The total Countrywide PCI unpaid principal balance decreased$8.3 billion, or 24 percent, in 2012 to $26.5 billion at December 31, 2012 primarily driven by liquidations, paydowns and payoffs. In addition, the decline includes loans with an unpaid principal balance of $2.9 billion within the home equity portfolio that were forgiven in connection with the National Mortgage Settlement of which 92 percent were 180 days or more past due. For more information on the National Mortgage Settlement, see Consumer Portfolio Credit Risk Management on page 80.
Of the unpaid principal balance of $26.5 billionat December 31, 20112012, $12.7$7.3 billion was 180 days or more past due, including $9.0$6.5 billion of first-lien and $3.7 billion$795 million of home equity.equity loans. Of the $22.1$19.2 billion that iswas less than 180 days past due, $19.1$17.1 billion, or 8689 percent of the total unpaid principal balance, was current based on the contractual terms while $1.6$1.3 billion, or seven percent, was in early stage delinquency. The home equity 180 days or more past due balances declined $2.9 billion, or 79 percent, during 2012, due primarily to the loans forgiven as discussed above.
During 20112012, we recorded $2.1 billiona provision benefit of provision for credit losses$103 million for the Countrywide PCI loan portfolio including $1.1 billiona benefit of $88 million for discontinued real estate, $667a benefit of $27 million for residential mortgage loans and a provision expense of $12 million for home equity loans and $355 million for residential mortgage.equity. This compared to a total provision of $2.3$2.1 billion in 20102011. Provision expenseThe decline in provision in 20112012 was primarily driven primarilyby an improvement in our home price outlook.
The Countrywide PCI allowance declined$2.9 billion during 2012 driven by a more negative$2.7 billion reduction in the Countrywide PCI home price outlook versus previous expectations.equity allowance primarily as a result of liquidations including the forgiveness of $2.5 billion of fully reserved home equity loans in connection with the National Mortgage Settlement. For further information on the Countrywide PCI loan portfolio, see Note 65 – Outstanding Loans and Leases to the Consolidated Financial Statements.
In January 2013, in connection with the FNMA Settlement, we repurchased for $6.6 billion certain residential mortgage loans that had previously been sold to FNMA, which we have valued at less than the purchase price. The majority of these loans were classified as PCI loans when they were recorded in January 2013. For additional information, see Off-Balance Sheet Arrangements and Contractual Obligations – Representations and Warranties on page 54.
Additional information is provided in the following sections on the Countrywide PCI residential mortgage, home equity and discontinued real estate loan portfolios.portfolios is provided in the following sections.
Purchased Credit-impaired Residential Mortgage Loan Portfolio
The Countrywide PCI residential mortgage loan portfolio comprised 3133 percent of the total Countrywide PCI loan portfolio.portfolio at December 31, 2012. Those loans to borrowers with a refreshed FICO score below 620 represented 3837 percent of the Countrywide
PCI residential mortgage loan portfolio at December 31, 20112012. Loans with a refreshed LTV greater than 90 percent, represented 62 percent of the
Countrywide PCI residential mortgage loan portfolio after consideration of purchase accounting adjustments and the related valuation allowance, represented 60 percent of the Countrywide PCI residential mortgage loan portfolio and 8480 percent based on the unpaid principal balance at December 31, 20112012. Those loans that were originally classified as Countrywide PCI discontinued real estate loans upon acquisition and have been subsequently modified are now included in the Countrywide PCI residential mortgage outstandings. Table 2930 presents outstandings net of purchase accounting adjustments and before the related valuation allowance, by certain state concentrations.
|
| | | | | | | | |
| | | | | |
| Table 29 | Outstanding Countrywide Purchased Credit-impaired Loan Portfolio – Residential Mortgage State Concentrations |
| | | | | |
| | | December 31 |
| (Dollars in millions) | 2011 | | 2010 |
| California | $ | 5,535 |
| | $ | 5,882 |
|
| Florida | 757 |
| | 779 |
|
| Virginia | 532 |
| | 579 |
|
| Maryland | 258 |
| | 271 |
|
| Texas | 130 |
| | 164 |
|
| Other U.S./Non-U.S. | 2,754 |
| | 2,917 |
|
| Total Countrywide purchased credit-impaired residential mortgage loan portfolio | $ | 9,966 |
| | $ | 10,592 |
|
|
| | | | | | | | |
| | | | | |
| Table 30 | Outstanding Countrywide Purchased Credit-impaired Loan Portfolio – Residential Mortgage State Concentrations |
| | | | | |
| | | December 31 |
| (Dollars in millions) | 2012 | | 2011 |
| California | $ | 4,762 |
| | $ | 5,509 |
|
Florida (1) | 693 |
| | 779 |
|
| Virginia | 479 |
| | 535 |
|
| Maryland | 239 |
| | 262 |
|
| Texas | 107 |
| | 130 |
|
| Other U.S./Non-U.S. | 2,457 |
| | 2,751 |
|
| Total | $ | 8,737 |
| | $ | 9,966 |
|
|
| | |
| | Bank of America89(1)
| In this state, foreclosure requires a court order following a legal proceeding (judicial state). |
Purchased Credit-impaired Home Equity Loan Portfolio
The Countrywide PCI home equity portfolio comprised 3833 percent of the total Countrywide PCI loan portfolio.portfolio at December 31, 2012. Those loans with a refreshed FICO score below 620 represented 2723 percent of the Countrywide PCI home equity portfolio at December 31, 20112012. Loans with a refreshed CLTV greater than 90 percent, represented 81 percent of the Countrywide PCI home equity portfolio after consideration of purchase accounting adjustments and the related valuation allowance, represented 76 percent of the Countrywide PCI home equity portfolio and 8377 percent based on the unpaid principal balance at December 31, 20112012. Table 3031 presents outstandings net of purchase accounting adjustments and before the related valuation allowance, by certain state concentrations.
| | | | | | | | | | | |
| Table 30 | Outstanding Countrywide Purchased Credit-impaired Loan Portfolio – Home Equity State Concentrations | |
| Table 31 | | Outstanding Countrywide Purchased Credit-impaired Loan Portfolio – Home Equity State Concentrations |
| | | | | | | | | |
| | | December 31 | | December 31 |
| (Dollars in millions) | (Dollars in millions) | 2011 | | 2010 | (Dollars in millions) | 2012 | | 2011 |
| California | California | $ | 3,999 |
| | $ | 4,178 |
| California | $ | 2,614 |
| | $ | 4,051 |
|
Florida | Florida | 734 |
| | 750 |
| Florida | 509 |
| | 840 |
|
| Virginia | | Virginia | 380 |
| | 467 |
|
| Arizona | Arizona | 501 |
| | 520 |
| Arizona | 294 |
| | 422 |
|
| Virginia | 496 |
| | 532 |
| |
| Colorado | Colorado | 337 |
| | 375 |
| Colorado | 260 |
| | 335 |
|
| Other U.S./Non-U.S. | Other U.S./Non-U.S. | 5,911 |
| | 6,235 |
| Other U.S./Non-U.S. | 4,490 |
| | 5,863 |
|
| Total Countrywide purchased credit-impaired home equity portfolio | $ | 11,978 |
| | $ | 12,590 |
| |
| Total | | Total | $ | 8,547 |
| | $ | 11,978 |
|
| |
(1) | In this state, foreclosure requires a court order following a legal proceeding (judicial state). |
Purchased Credit-impaired Discontinued Real Estate Loan Portfolio
The Countrywide PCI discontinued real estate loan portfolio comprised 3134 percent of the total Countrywide PCI loan portfolio.portfolio at December 31, 2012. Those loans to borrowers with a refreshed
FICO score below 620 represented 6162 percent of the Countrywide PCI discontinued real estate loan portfolio at December 31, 20112012. Loans with a refreshed LTV, or CLTV in the case of second-liens, greater than 90 percent, represented 40 percent of the Countrywide PCI discontinued real estate loan portfolio after consideration of purchase accounting adjustments and the related valuation allowance, represented 42 percent of the Countrywide PCI discontinued real estate loan portfolio and 8481 percent based on the unpaid principal balance at December 31, 20112012. Those loans that were originally classified as discontinued real estate loans upon acquisition and have been subsequently modified are now excluded from this portfolio and included in the Countrywide PCI residential mortgage loan portfolio, but remain in the PCI loan pool. Table 3132 presents outstandings net of purchase accounting adjustments and before the related valuation adjustment, by certain state concentrations.
|
| | | | | | | | |
| | | | | |
| Table 32 | Outstanding Countrywide Purchased Credit-impaired Loan Portfolio – Discontinued Real Estate State Concentrations |
| | | | | |
| | | December 31 |
| (Dollars in millions) | 2012 | | 2011 |
| California | $ | 4,492 |
| | $ | 5,285 |
|
Florida (1) | 1,119 |
| | 1,041 |
|
| Washington | 282 |
| | 311 |
|
| Virginia | 240 |
| | 273 |
|
| Arizona | 202 |
| | 241 |
|
| Other U.S./Non-U.S. | 2,499 |
| | 2,706 |
|
| Total | $ | 8,834 |
| | $ | 9,857 |
|
|
| | | | | | | | |
| | | | | |
| Table 31 | Outstanding Countrywide Purchased Credit-impaired Loan Portfolio – Discontinued Real Estate State Concentrations |
| | | | | |
| | | December 31 |
| (Dollars in millions) | 2011 | | 2010 |
| California | $ | 5,262 |
| | $ | 6,322 |
|
| Florida | 958 |
| | 1,121 |
|
| Washington | 331 |
| | 368 |
|
| Virginia | 277 |
| | 344 |
|
| Arizona | 251 |
| | 339 |
|
| Other U.S./Non-U.S. | 2,778 |
| | 3,158 |
|
| Total Countrywide purchased credit-impaired discontinued real estate loan portfolio | $ | 9,857 |
| | $ | 11,652 |
|
| |
(1) | In this state, foreclosure requires a court order following a legal proceeding (judicial state). |
U.S. Credit Card
The consumer U.S. credit card portfolio is managed in Card ServicesCBB. Outstandings in the U.S. credit card loan portfolio decreased $11.57.5 billion compared toin December 31, 20102012 due to higher payment rates,payments, charge-offs and portfolio divestitures. For 2011, netsales. Net charge-offs decreased $5.82.6 billion to $7.34.6 billion compared toin 20102012 due to improvements in delinquencies collections and bankruptcies as a result of an improved economic environment, account management on higher risk accounts and the impact of higher credit quality originations. U.S. credit card loans 30 days or more past due and still accruing interest decreased $2.11.1 billion while loans 90 days or more past due and still accruing interest decreased $1.3 billion633 million
in compared to December 31, 20102012 due to improvement in the U.S. economy. Table 3233 presents certain key credit statistics for the consumer U.S. credit card portfolio.
| | | | | | | | | | | |
| Table 32 | U.S. Credit Card – Key Credit Statistics | |
| Table 33 | | U.S. Credit Card – Key Credit Statistics |
| | | | | |
| | | December 31 | | December 31 |
| (Dollars in millions) | (Dollars in millions) | 2011 | | 2010 | (Dollars in millions) | 2012 | | 2011 |
| Outstandings | Outstandings | $ | 102,291 |
| | $ | 113,785 |
| Outstandings | $ | 94,835 |
| | $ | 102,291 |
|
| Accruing past due 30 days or more | Accruing past due 30 days or more | 3,823 |
| | 5,913 |
| Accruing past due 30 days or more | 2,748 |
| | 3,823 |
|
| Accruing past due 90 days or more | Accruing past due 90 days or more | 2,070 |
| | 3,320 |
| Accruing past due 90 days or more | 1,437 |
| | 2,070 |
|
| | | | | | | | | |
| | | 2011 | | 2010 | | 2012 | | 2011 |
| Net charge-offs | Net charge-offs | $ | 7,276 |
| | $ | 13,027 |
| Net charge-offs | $ | 4,632 |
| | $ | 7,276 |
|
Net charge-off ratios (1) | Net charge-off ratios (1) | 6.90 | % | | 11.04 | % | Net charge-off ratios (1) | 4.88 | % | | 6.90 | % |
| |
(1) | Net charge-off ratios are calculated as net charge-offs divided by average outstanding loans. |
Unused lines of credit for U.S. credit card totaled $335.5 billion and $368.1 billion at December 31, 2012 and 2011. The $32.6 billion decrease was driven by closure of inactive accounts and account management initiatives on higher risk accounts.
Table 34 presents certain state concentrations for the U.S. credit card portfolio.
|
| | | | | | | | | | | | | | | | | | | | | | | | |
| | | | | | | | | | | | | |
| Table 34 | U.S. Credit Card State Concentrations |
| | | | | | | | | | | | | |
| | | December 31 | | |
| | | Outstandings | | Accruing Past Due
90 Days or More | | Net Charge-offs |
| (Dollars in millions) | 2012 | | 2011 | | 2012 | | 2011 | | 2012 | | 2011 |
| California | $ | 14,101 |
| | $ | 15,246 |
| | $ | 235 |
| | $ | 352 |
| | $ | 840 |
| | $ | 1,402 |
|
| Florida | 7,469 |
| | 7,999 |
| | 149 |
| | 221 |
| | 512 |
| | 838 |
|
| Texas | 6,448 |
| | 6,885 |
| | 92 |
| | 131 |
| | 290 |
| | 429 |
|
| New York | 5,746 |
| | 6,156 |
| | 91 |
| | 126 |
| | 263 |
| | 403 |
|
| New Jersey | 3,959 |
| | 4,183 |
| | 60 |
| | 86 |
| | 178 |
| | 275 |
|
| Other U.S. | 57,112 |
| | 61,822 |
| | 810 |
| | 1,154 |
| | 2,549 |
| | 3,929 |
|
| Total U.S. credit card portfolio | $ | 94,835 |
| | $ | 102,291 |
| | $ | 1,437 |
| | $ | 2,070 |
| | $ | 4,632 |
| | $ | 7,276 |
|
Non-U.S. Credit Card
Outstandings in the non-U.S. credit card portfolio, which are recorded in All Other, decreased$2.7 billion in 2012 due to transfers to LHFS, lower origination volume and charge-offs. Net charge-offs decreased$588 million to $581 million in 2012 due to the sale of the Canadian consumer credit card portfolio in 2011 and improvement in delinquencies.
Unused lines of credit for non-U.S. credit card decreased $1.1 billion to $35.7 billion in 2012 driven by a decline in the number of outstanding accounts primarily offset by strengthening of the British Pound against the U.S. Dollar.
Table 35 presents certain key credit statistics for the non-U.S. credit card portfolio.
|
| | | | | | | | |
| | | | | |
| Table 35 | Non-U.S. Credit Card – Key Credit Statistics |
| | | |
| | | December 31 |
| (Dollars in millions) | 2012 | | 2011 |
| Outstandings | $ | 11,697 |
| | $ | 14,418 |
|
| Accruing past due 30 days or more | 403 |
| | 610 |
|
| Accruing past due 90 days or more | 212 |
| | 342 |
|
| | | | |
| | 2012 | | 2011 |
| Net charge-offs | $ | 581 |
| | $ | 1,169 |
|
Net charge-off ratios (1) | 4.29 | % | | 4.86 | % |
| |
(1) | Net charge-off ratios are calculated as net charge-offs divided by average outstanding loans and leases. |
Unused lines of credit for U.S. credit card totaled $368.1 billion and $399.7 billion at December 31, 2011 and 2010. The $31.6 billion decrease was driven by portfolio divestitures, closure of inactive accounts and account management initiatives on higher risk accounts.
Table 33 presents certain state concentrations for the U.S. credit card portfolio.
|
| | | | | | | | | | | | | | | | | | | | | | | | |
| | | | | | | | | | | | | |
| Table 33 | U.S. Credit Card State Concentrations |
| | | | | | | | | | | | | |
| | | December 31 | | |
| | | Outstandings | | Accruing Past Due
90 Days or More | | Net Charge-offs |
| (Dollars in millions) | 2011 | | 2010 | | 2011 | | 2010 | | 2011 | | 2010 |
| California | $ | 15,246 |
| | $ | 17,028 |
| | $ | 352 |
| | $ | 612 |
| | $ | 1,402 |
| | $ | 2,752 |
|
| Florida | 7,999 |
| | 9,121 |
| | 221 |
| | 376 |
| | 838 |
| | 1,611 |
|
| Texas | 6,885 |
| | 7,581 |
| | 131 |
| | 207 |
| | 429 |
| | 784 |
|
| New York | 6,156 |
| | 6,862 |
| | 126 |
| | 192 |
| | 403 |
| | 694 |
|
| New Jersey | 4,183 |
| | 4,579 |
| | 86 |
| | 132 |
| | 275 |
| | 452 |
|
| Other U.S. | 61,822 |
| | 68,614 |
| | 1,154 |
| | 1,801 |
| | 3,929 |
| | 6,734 |
|
| Total U.S. credit card portfolio | $ | 102,291 |
| | $ | 113,785 |
| | $ | 2,070 |
| | $ | 3,320 |
| | $ | 7,276 |
| | $ | 13,027 |
|
Non-U.S. Credit Card
During 2011, we sold our Canadian consumer card business and we are evaluating our remaining international consumer card portfolios. In light of these actions, the international consumer card portfolios were moved from Card Services to All Other.
Outstandings in the non-U.S. credit card portfolio decreased$13.0 billion in 2011 primarily due to the sale of the Canadian consumer credit card portfolio, lower origination volume and charge-offs. Net charge-offs decreased$1.0 billion in 2011 to $1.2 billion due to the sale of previously charged-off loans, portfolio sales, and improvements in delinquencies, collections and insolvencies.
Unused lines of credit for non-U.S. credit card totaled $36.8 billion and $60.3 billion at December 31, 2011 and 2010. The $23.5 billion decrease was driven primarily by the sale of the Canadian consumer credit card portfolio.
Table 34 presents certain key credit statistics for the non-U.S. credit card portfolio.
|
| | | | | | | | |
| | | | | |
| Table 34 | Non-U.S. Credit Card – Key Credit Statistics |
| | | |
| | | December 31 |
| (Dollars in millions) | 2011 | | 2010 |
| Outstandings | $ | 14,418 |
| | $ | 27,465 |
|
| Accruing past due 30 days or more | 610 |
| | 1,354 |
|
| Accruing past due 90 days or more | 342 |
| | 599 |
|
| | | | |
| | 2011 | | 2010 |
| Net charge-offs | $ | 1,169 |
| | $ | 2,207 |
|
Net charge-off ratios (1) | 4.86 | % | | 7.88 | % |
| |
(1)
| Net charge-off ratios are calculated as net charge-offs divided by average outstanding loans and leases. |
Direct/Indirect Consumer
At December 31, 20112012, approximately 4843 percent of the direct/indirect portfolio was included in Global Commercial Banking (dealer financial
services - automotive, marine, aircraft and recreational vehicle loans), 3639 percent was included in GWIM (principally other non-real estate-secured, unsecured personal loans and securities-based lending margin loans and unsecured personal loans), nine12 percent was included in Card ServicesAll Other (the IWM business based outside of the U.S. that was moved from GWIM and student loans) and the remaining portion was in CBB (consumer personal loans) and the remainder was in All Other (student loans).
Outstanding loans and leases decreased $595 million to $89.76.5 billion in 20112012 due to run-off of an auto loan portfolio, an auto loan sale and securitization within the dealer financial services portfolio and lower outstandings in the Card Services unsecured consumer lending portfoliopartially offset by growth in securities-based lending and product transfers from U.S. commercial.lending. For 20112012, net charge-offs decreased $1.9 billion713 million to $1.5 billion763 million, or 1.640.90 percent of total average direct/indirect loans compared to 3.451.64 percent for 20102011. This decrease was primarily driven by improvements in delinquencies, collections and bankruptcies in the unsecured consumer lending portfolio as a result of an improved economic environment as well as reduced outstandings. An additional driverPartially offsetting this decline was lower$47 million of net charge-offs related to other secured consumer loans discharged in the dealer financial services portfolio due to the impactChapter 7 bankruptcy as a result of higher credit quality originationsnew regulatory guidance. For more information, see Consumer Portfolio Credit Risk Management on page 80 and higher resale values.Table 21.
Net charge-offs in the unsecured consumer lending portfolio decreased $1.6 billion$610 million to $1.1 billion$485 million in 20112012, or 10.937.68 percent of total average unsecured consumer lending loans compared to 17.2410.93 percent for 20102011. Net charge-offs in the dealer financial services portfolio decreased $199 million to $293 million in 2011, or 0.69 percent of total average dealer financial services loans compared to 1.08 percent for 2010. Direct/indirect loans that were past due 30 days or more and still accruing interest declined $745$537 million to $1.9$1.4 billion atin December 31, 2011 compared to $2.6 billion at December 31, 20102012 due to improvements in both the unsecured consumer lending and dealer financial services portfolios.
Table 3536 presents certain state concentrations for the direct/indirect consumer loan portfolio.
| | | | | | | | | | | | | | | | | | | | | | | | | | | |
| Table 35 | Direct/Indirect State Concentrations | |
| Table 36 | | Direct/Indirect State Concentrations |
| | | | | | | | | | | | | | | | | | | | | | | | | |
| | | December 31 | | | | December 31 | | |
| | | Outstandings | | Accruing Past Due
90 Days or More | | Net Charge-offs | | Outstandings | | Accruing Past Due
90 Days or More | | Net Charge-offs |
| (Dollars in millions) | (Dollars in millions) | 2011 | | 2010 | | 2011 | | 2010 | | 2011 | | 2010 | (Dollars in millions) | 2012 | | 2011 | | 2012 | | 2011 | | 2012 | | 2011 |
| California | California | $ | 11,152 |
| | $ | 10,558 |
| | $ | 81 |
| | $ | 132 |
| | $ | 222 |
| | $ | 591 |
| California | $ | 10,793 |
| | $ | 11,152 |
| | $ | 53 |
| | $ | 81 |
| | $ | 102 |
| | $ | 222 |
|
| Florida | | Florida | 7,363 |
| | 7,456 |
| | 37 |
| | 55 |
| | 88 |
| | 148 |
|
| Texas | Texas | 7,882 |
| | 7,885 |
| | 54 |
| | 78 |
| | 117 |
| | 262 |
| Texas | 7,239 |
| | 7,882 |
| | 41 |
| | 54 |
| | 64 |
| | 117 |
|
| Florida | 7,456 |
| | 6,725 |
| | 55 |
| | 80 |
| | 148 |
| | 343 |
| |
| New York | New York | 5,160 |
| | 4,770 |
| | 40 |
| | 56 |
| | 79 |
| | 183 |
| New York | 4,794 |
| | 5,160 |
| | 28 |
| | 40 |
| | 43 |
| | 79 |
|
| Georgia | Georgia | 2,828 |
| | 2,814 |
| | 38 |
| | 44 |
| | 61 |
| | 126 |
| Georgia | 2,491 |
| | 2,828 |
| | 31 |
| | 38 |
| | 30 |
| | 61 |
|
| Other U.S./Non-U.S. | Other U.S./Non-U.S. | 55,235 |
| | 57,556 |
| | 478 |
| | 668 |
| | 849 |
| | 1,831 |
| Other U.S./Non-U.S. | 50,525 |
| | 55,235 |
| | 355 |
| | 478 |
| | 436 |
| | 849 |
|
| Total direct/indirect loan portfolio | Total direct/indirect loan portfolio | $ | 89,713 |
| | $ | 90,308 |
| | $ | 746 |
| | $ | 1,058 |
| | $ | 1,476 |
| | $ | 3,336 |
| Total direct/indirect loan portfolio | $ | 83,205 |
| | $ | 89,713 |
| | $ | 545 |
| | $ | 746 |
| | $ | 763 |
| | $ | 1,476 |
|
Other Consumer
At December 31, 20112012, approximately 9687 percent of the $2.71.6 billion other consumer portfolio was associated with certain consumer finance businesses that we previously exited and non-U.S. consumer loan portfolios that are included in All Other. The remainder is primarily deposit overdrafts included in DepositsCBB.
Consumer Loans Accounted for Under the Fair Value Option
Outstanding consumer loans accounted for under the fair value option were $2.21.0 billion at December 31, 20112012 and includeincluded $1.3 billion858 million of discontinued real estate loans and $906147 million of residential mortgage loans as a result of the consolidation of VIEs.in consolidated variable interest entities (VIEs). During 20112012, we recorded lossesgains of $837$57 million resulting from changes in the fair value of the loan portfolio. These losses were offset by gainslosses recorded on the related long-term debt.
Nonperforming Consumer Loans and Foreclosed Properties Activity
Table 3637 presents nonperforming consumer loans and foreclosed properties activity during 20112012 and 20102011. Nonperforming LHFS are excluded from nonperforming loans as they are recorded at either fair value or the lower of cost or fair value. Nonperforming loans do not include past due consumer credit card loans, other unsecured loans and in general, past due consumer non-real estate-secured loans not secured by real estate(excluding those loans discharged in Chapter 7 bankruptcy), as these loans are generallytypically charged off no later than the end of the month in which the loan becomes 180 days past due. The fully-insured loan portfolio is not reported as nonperforming as principal repayment is insured. Additionally, nonperforming loans do not include the Countrywide PCI loan portfolio or loans that we accountaccounted for under the fair value option. For further information on nonperforming loans, see Note 1 – Summary of Significant Accounting Principles to the Consolidated Financial Statements.
Nonperforming loans declinedincreased$663 million in 2012 to $18.819.4 billion at. During 2012, we reclassified to nonperforming $1.9 billion of junior-lien loans less than 90 days past due that have a senior-lien loan that is 90 days or more past due and December 31, 2011 compared to $20.91.2 billion at of loans less than 60 days past due that were discharged in Chapter 7
December 31, 2010. Delinquency inflowsbankruptcy upon implementation of new regulatory guidance. These additions to nonperforming loans slowed comparedwere partially offset by $435 million of nonperforming loans forgiven in connection with the National Mortgage Settlement. Excluding the impact of these items, nonperforming loans declined in 2012 as outflows outpaced new inflows which continued to the prior yearimprove due to favorable portfolio trendsdelinquency trends. For more information on the impacts related to the National Mortgage Settlement and were more than offsetguidance issued by charge-offs, nonperforming loans returning to performing status,regulatory agencies, see Consumer Portfolio Credit Risk Management on page 80 and paydowns and payoffs.Table 21.
The outstanding balance of a real estate-secured loan that is in excess of the estimated property value, after reducing the estimated property value for estimated costs to sell, is charged off no later than the end of the month in which the loan becomes
180 days past due unless repayment of the loan is fully insured. At December 31, 20112012, $14.6$10.7 billion, or 7154 percent, of nonperforming consumer real estate loans and foreclosed properties had been written down to their estimated property value less estimated costs to sell, including $12.6$10.1 billion of nonperforming loans 180 days or more past due and $2.0 billion$650 million of foreclosed properties.
Foreclosed properties increaseddecreased $742 million1.3 billion in 20112012 as additionsliquidations outpaced liquidations.additions. PCI loans are excluded from nonperforming loans as these loans were written down to fair value at the acquisition date. However,date; however, once the underlying real estate is acquired by the Corporation upon foreclosure of the delinquent PCI loan, it is included in foreclosed properties. Net changes toCountrywide PCI related foreclosed properties related to PCI loans increased $411decreased $322 million in 20112012. Not included in foreclosed properties at December 31, 20112012 was $1.4$2.5 billion of real estate that was acquired upon foreclosure of delinquent FHA-insured loans. We hold this real estate on our balance sheet until we convey these properties to the FHA. We exclude these amounts from our nonperforming loans and foreclosed properties activity as we will be reimbursed once the property is conveyed to the FHA for principal and, up to certain limits, costs incurred during the foreclosure process and interest incurred during the holding period. For additional information on the review of our foreclosure processes, see Off-Balance Sheet Arrangements and Contractual Obligations – Other Mortgage-related Matters on page 6361.
Restructured Loans
Nonperforming loans also include certain loans that have been modified in TDRs where economic concessions have been granted to borrowers experiencing financial difficulties. These concessions typically result from the Corporation’s loss mitigation activities and could include reductions in the interest rate, payment extensions, forgiveness of principal, forbearance or other actions. Certain
TDRs are classified as nonperforming at the time of restructuring and may only be returned to performing status after considering the borrower’s sustained repayment performance under revised payment terms for a reasonable period, generally six months. Nonperforming TDRs, excluding those modified loans in the Countrywide PCI loan portfolio, are included in Table 3637.
As a result of accounting guidance on PCI loans, beginning January 1, 2010, modifications of loans in the PCI loan portfolio do not result in removal of the loan from the PCI loan pool. TDRs in the consumer real estate portfolio that were removed from the
PCI loan portfolio prior to the adoption of this accounting guidance were $1.9 billion and $2.1 billion at December 31, 2011 and 2010, of which $477 million and $426 million were nonper-forming. These nonperforming loans are excluded from Table 36.
Nonperforming consumer real estate TDRs as a percentage of total nonperforming consumer loans and foreclosed properties increased to 26 percent at December 31, 2011 from 16 percent at December 31, 2010.
| | | | | | | | | | | |
| Table 36 | Nonperforming Consumer Loans and Foreclosed Properties Activity (1) | |
| Table 37 | | Nonperforming Consumer Loans and Foreclosed Properties Activity (1) |
| | | | | | | | | |
| (Dollars in millions) | (Dollars in millions) | 2011 | | 2010 | (Dollars in millions) | 2012 | | 2011 |
| Nonperforming loans, January 1 | Nonperforming loans, January 1 | $ | 20,854 |
| | $ | 20,839 |
| Nonperforming loans, January 1 | $ | 18,768 |
| | $ | 20,854 |
|
| Additions to nonperforming loans: | Additions to nonperforming loans: | | | | Additions to nonperforming loans: | | | |
New nonperforming loans (2) | New nonperforming loans (2) | 15,723 |
| | 21,584 |
| New nonperforming loans (2) | 13,084 |
| | 15,723 |
|
Implementation of change in treatment of loans discharged in bankruptcies (2) | | Implementation of change in treatment of loans discharged in bankruptcies (2) | 1,162 |
| | n/a |
|
Implementation of regulatory interagency guidance (3) | | Implementation of regulatory interagency guidance (3) | 1,853 |
| | n/a |
|
| Reductions to nonperforming loans: | Reductions to nonperforming loans: | | | | Reductions to nonperforming loans: | | | |
| Paydowns and payoffs | Paydowns and payoffs | (3,318 | ) | | (2,809 | ) | Paydowns and payoffs | (3,801 | ) | | (3,318 | ) |
Returns to performing status (3) | (4,741 | ) | | (7,647 | ) | |
Charge-offs (4) | (8,095 | ) | | (9,772 | ) | |
| Transfers to foreclosed properties | (1,655 | ) | | (1,341 | ) | |
| Sales | | Sales | (47 | ) | | — |
|
Returns to performing status (4) | | Returns to performing status (4) | (4,203 | ) | | (4,741 | ) |
Charge-offs (5) | | Charge-offs (5) | (6,544 | ) | | (8,095 | ) |
Transfers to foreclosed properties (6) | | Transfers to foreclosed properties (6) | (841 | ) | | (1,655 | ) |
| Total net additions (reductions) to nonperforming loans | Total net additions (reductions) to nonperforming loans | (2,086 | ) | | 15 |
| Total net additions (reductions) to nonperforming loans | 663 |
| | (2,086 | ) |
Total nonperforming loans, December 31 (5) | 18,768 |
| | 20,854 |
| |
| Foreclosed properties, January 1 | 1,249 |
| | 1,428 |
| |
Total nonperforming loans, December 31 (7) | | Total nonperforming loans, December 31 (7) | 19,431 |
| | 18,768 |
|
Foreclosed properties, January 1 (8) | | Foreclosed properties, January 1 (8) | 1,991 |
| | 1,249 |
|
| Additions to foreclosed properties: | Additions to foreclosed properties: | | | | Additions to foreclosed properties: | | | |
| New foreclosed properties | 2,996 |
| | 2,337 |
| |
New foreclosed properties (6) | | New foreclosed properties (6) | 1,129 |
| | 2,996 |
|
| Reductions to foreclosed properties: | Reductions to foreclosed properties: | | | | Reductions to foreclosed properties: | | | |
| Sales | Sales | (1,993 | ) | | (2,327 | ) | Sales | (2,283 | ) | | (1,993 | ) |
| Write-downs | Write-downs | (261 | ) | | (189 | ) | Write-downs | (187 | ) | | (261 | ) |
| Total net additions (reductions) to foreclosed properties | Total net additions (reductions) to foreclosed properties | 742 |
| | (179 | ) | Total net additions (reductions) to foreclosed properties | (1,341 | ) | | 742 |
|
| Total foreclosed properties, December 31 | Total foreclosed properties, December 31 | 1,991 |
| | 1,249 |
| Total foreclosed properties, December 31 | 650 |
| | 1,991 |
|
| Nonperforming consumer loans and foreclosed properties, December 31 | Nonperforming consumer loans and foreclosed properties, December 31 | $ | 20,759 |
| | $ | 22,103 |
| Nonperforming consumer loans and foreclosed properties, December 31 | $ | 20,081 |
| | $ | 20,759 |
|
Nonperforming consumer loans as a percentage of outstanding consumer loans (6) | 3.09 | % | | 3.24 | % | |
Nonperforming consumer loans and foreclosed properties as a percentage of outstanding consumer loans and foreclosed properties (6) | 3.41 |
| | 3.43 |
| |
Nonperforming consumer loans as a percentage of outstanding consumer loans (9) | | Nonperforming consumer loans as a percentage of outstanding consumer loans (9) | 3.52 | % | | 3.09 | % |
Nonperforming consumer loans and foreclosed properties as a percentage of outstanding consumer loans and foreclosed properties (9) | | Nonperforming consumer loans and foreclosed properties as a percentage of outstanding consumer loans and foreclosed properties (9) | 3.63 |
| | 3.41 |
|
| |
(1) | Balances do not include nonperforming LHFS of $659676 million and $1.0 billion659 million and nonaccruing TDRs removed from the Countrywide PCI portfolio prior to January 1, 2010 of $521 million and $477 million at December 31, 20112012 and 20102011 as well as loans accruing past due 90 days or more as presented in Table 2122 and Note 65 – Outstanding Loans and Leases to the Consolidated Financial Statements. |
| |
(2) | 2010In 2012, we added $1.2 billion includes $448 million ofto nonperforming loans as a result of the consolidation of variable interest entities.new regulatory guidance on loans discharged in Chapter 7 bankruptcy. For more information, see Consumer Portfolio Credit Risk Management on page 80 and Table 21.
|
| |
(3) | As a result of the regulatory interagency guidance, we reclassified $1.9 billion of performing home equity loans to nonperforming during 2012. For more information, see Consumer Portfolio Credit Risk Management on page 80. |
| |
(4) | Consumer loans may be returned to performing status when all principal and interest is current and full repayment of the remaining contractual principal and interest is expected, or when the loan otherwise becomes well-secured and is in the process of collection. Certain TDRs are classified as nonperforming at the time of restructuring and may only be returned to performing status after considering the borrower’s sustained repayment performance for a reasonable period, generally six months. |
| |
(4)(5)
| Our policy is to not classify consumer credit card and non-bankruptcy related consumer loans not secured by real estate as nonperforming; therefore, the charge-offs on these loans have no impact on nonperforming activity and accordingly are excluded from this table. |
| |
(5)(6)
| New foreclosed properties represents transfers of nonperforming loans to foreclosed properties net of charge-offs taken during the first 90 days after transfer of a loan to foreclosed properties. New foreclosed properties also includes properties obtained upon foreclosure of delinquent PCI loans, properties repurchased due to representations and warranties exposure and properties acquired with newly consolidated subsidiaries. |
| |
(7) | At December 31, 20112012, 6752 percent of nonperforming loans were 180 days or more past due and were written down through charge-offs to 6462 percent of the unpaid principal balance. |
| |
(6)(8)
| Foreclosed property balances do not include loans that are insured by the FHA and have entered foreclosure of $2.5 billion and $1.4 billion at December 31, 2012 and 2011. |
| |
(9) | Outstanding consumer loans exclude loans accounted for under the fair value option. |
n/a = not applicable
Our policy is to record any losses in the value of foreclosed properties as a reduction in the allowance for loan and lease losses during the first 90 days after transfer of a loan to foreclosed properties. Thereafter, all gains andfurther losses in value are recorded in noninterest expense. New foreclosed properties included in Table 3637 are net of $352$261 million and $575$352 million of charge-offs for 20112012 and 20102011, recorded during the first 90 days after transfer.
In 2012, new regulatory guidance was issued addressing secured consumer loans that have been discharged in Chapter 7
bankruptcy, and as a result, $3.6 billion of loans were included in TDRs at December 31, 2012, of which $1.2 billion were current or less than 60 days past due upon implementation. Of the $3.6 billion of TDRs, approximately 27 percent, 41 percent and 32 percent had been discharged in Chapter 7 bankruptcy in 2012, 2011 and prior years, respectively. For more information, see Consumer Portfolio Credit Risk Management on page 80 and Table 21.
Table 38 presents TDRs for the home loans portfolio. Performing TDR balances are excluded from nonperforming loans in Table 37.
|
| | | | | | | | | | | | | | | | | | | | | | | | |
| | | | | | | | | | | | | |
| Table 38 | Home Loans Troubled Debt Restructurings |
| | | | | | | | | | | | | |
| | | December 31 |
| | | 2012 | | 2011 |
| (Dollars in millions) | Total | | Nonperforming | | Performing | | Total | | Nonperforming | | Performing |
Residential mortgage (1, 2) | $ | 27,758 |
| | $ | 8,806 |
| | $ | 18,952 |
| | $ | 19,287 |
| | $ | 5,034 |
| | $ | 14,253 |
|
Home equity (3) | 2,125 |
| | 1,242 |
| | 883 |
| | 1,776 |
| | 543 |
| | 1,233 |
|
Discontinued real estate (4) | 367 |
| | 234 |
| | 133 |
| | 399 |
| | 214 |
| | 185 |
|
| Total home loans troubled debt restructurings | $ | 30,250 |
| | $ | 10,282 |
| | $ | 19,968 |
| | $ | 21,462 |
| | $ | 5,791 |
| | $ | 15,671 |
|
| |
(1) | Residential mortgage TDRs deemed collateral dependent totaled $9.1 billion and $5.3 billion, and included $6.2 billion and $2.2 billion of loans classified as nonperforming and $2.9 billion and $3.1 billion of loans classified as performing at December 31, 2012 and 2011. |
| |
(2) | Residential mortgage performing TDRs included $11.9 billion and $7.0 billion of loans that were fully-insured at December 31, 2012 and 2011. |
| |
(3) | Home equity TDRs deemed collateral dependent totaled $1.4 billion and $824 million, and included $1.0 billion and $282 million of loans classified as nonperforming and $348 million and $542 million of loans classified as performing at December 31, 2012 and 2011. |
| |
(4) | Discontinued real estate TDRs deemed collateral dependent totaled $253 million and $230 million, and included $170 million and $118 million of loans classified as nonperforming and $83 million and $112 million as performing at December 31, 2012 and 2011. |
We also work with customers that are experiencing financial difficulty by modifying credit card and other consumer loans, while complying with Federal Financial Institutions Examination Council (FFIEC) guidelines. Substantially all of our credit card and other consumer loan modifications involve a reduction in the cardholder’scustomer’s interest rate on the account and placing the customer on a fixed payment plan not exceeding 60 months, allboth of which are considered to be TDRs (the renegotiated TDR portfolio). We make modifications primarily through internal renegotiation programs utilizing direct customer contact, but may also utilize external renegotiation programs. The renegotiated TDR portfolio is generally excluded from Table 3637, as substantially all of thesethe loans remain on accrual status until either charged-offcharged off or paid in full. AtThe renegotiated TDR portfolio included
$58 million of non-real estate-secured loans at December 31, 2012 that were discharged in Chapter 7 bankruptcy as a result of new regulatory guidance and classified as nonperforming loans. At December 31, 2012 and 2011, our renegotiated TDR portfolio was $3.9 billion and $7.1 billion, of which $3.1 billion and $5.5 billion was current or less than 30 days past due under the modified terms compared to $11.4 billion at December 31, 2010, of which $8.7 billion waswere current or less than 30 days past due under the modified terms. The decline in the renegotiated TDR portfolio was primarily driven by attrition throughout 2011paydowns and charge-offs as well as lower new program enrollments. For more information on the renegotiated TDR portfolio, see Note 65 – Outstanding Loans and Leases to the Consolidated Financial Statements.
As a result of new accounting guidance on TDRs, loans that are participating in or that have been offered a binding trial modification are classified as TDRs. At December 31, 2011, we classified an additional $2.6 billion of home loans as TDRs that were participating in or had been offered a trial modification. These home loans had an aggregate allowance for credit losses of $154 million at December 31, 2011. For additional information, see Note 1 – Summary of Significant Accounting Principlesto the Consolidated Financial Statements.
Table 37 presents TDRs for the home loans portfolio. Performing TDR balances are excluded from nonperforming loans in Table 36.
|
| | | | | | | | | | | | | | | | | | | | | | | | |
| | | | | | | | | | | | | |
| Table 37 | Home Loans Troubled Debt Restructurings |
| | | | | | | | | | | | | |
| | | December 31 |
| | | 2011 | | 2010 |
| (Dollars in millions) | Total | | Nonperforming | | Performing | | Total | | Nonperforming | | Performing |
Residential mortgage (1, 2) | $ | 19,287 |
| | $ | 5,034 |
| | $ | 14,253 |
| | $ | 11,788 |
| | $ | 3,297 |
| | $ | 8,491 |
|
Home equity (3) | 1,776 |
| | 543 |
| | 1,233 |
| | 1,721 |
| | 541 |
| | 1,180 |
|
Discontinued real estate (4) | 399 |
| | 214 |
| | 185 |
| | 395 |
| | 206 |
| | 189 |
|
| Total home loans troubled debt restructurings | $ | 21,462 |
| | $ | 5,791 |
| | $ | 15,671 |
| | $ | 13,904 |
| | $ | 4,044 |
| | $ | 9,860 |
|
| |
(1)
| Residential mortgage TDRs deemed collateral dependent totaled $5.3 billion and $3.2 billion, and included $2.2 billion and $921 million of loans classified as nonperforming and $3.1 billion and $2.3 billion of loans classified as performing at December 31, 2011 and 2010.
|
| |
(2)
| Residential mortgage performing TDRs included $7.0 billion and $2.5 billion of loans that were fully-insured at December 31, 2011 and 2010.
|
| |
(3)
| Home equity TDRs deemed collateral dependent totaled $824 million and $796 million, and included $282 million and $245 million of loans classified as nonperforming and $542 million and $551 million of loans classified as performing at December 31, 2011 and 2010.
|
| |
(4)
| Discontinued real estate TDRs deemed collateral dependent totaled $230 million and $213 million, and included $118 million and $97 million of loans classified as nonperforming and $112 million and $116 million as performing at December 31, 2011 and 2010.
|
Commercial Portfolio Credit Risk Management
Credit risk management for the commercial portfolio begins with an assessment of the credit risk profile of the borrower or counterparty based on an analysis of its financial position. As part of the overall credit risk assessment, our commercial credit exposures are assigned a risk rating and are subject to approval based on defined credit approval standards. Subsequent to loan origination, risk ratings are monitored on an ongoing basis, and if necessary, adjusted to reflect changes in the financial condition,
cash flow, risk profile or outlook of a borrower or counterparty. In making credit decisions, we consider risk rating, collateral, country, industry and single name concentration limits while also balancing the total borrower or counterparty relationship. Our business and risk management personnel use a variety of tools to continuously monitor the ability of a borrower or counterparty to perform under its obligations. We use risk rating aggregations to measure and evaluate concentrations within portfolios. In addition, risk ratings are a factor in determining the level of assigned economic capital and the allowance for credit losses.
For information on our accounting policies regarding delinquencies, nonperforming status and net charge-offs for the commercial portfolio, see Note 1 – Summary of Significant Accounting Principles to the Consolidated Financial Statements.
Management of Commercial Credit Risk
Concentrations
Commercial credit risk is evaluated and managed with the goal that concentrations of credit exposure do not result in undesirable levels of risk. We review, measure and manage concentrations of credit exposure by industry, product, geography, customer relationship and loan size. We also review, measure and manage commercial real estate loans by geographic location and property type. In addition, within our international portfolio, we evaluate exposures by region and by country. Tables 4243, 4748, 5356 and 5457 summarize our concentrations. We also utilize syndications of exposure to third parties, loan sales, hedging and other risk mitigation techniques to manage the size and risk profile of the commercial credit portfolio.
As part of our ongoing risk mitigation initiatives, we attempt to work with clients experiencing financial difficulty to modify their loans to terms that better align with their current ability to pay. In situations where an economic concession has been granted to a borrower experiencing financial difficulty, we identify these loans as TDRs.
We account for certain large corporate loans and loan commitments, including issued but unfunded letters of credit which are considered utilized for credit risk management purposes, that exceed our single name credit risk concentration guidelines under the fair value option. Lending commitments, both funded and unfunded, are actively managed and monitored, and as appropriate, credit risk for these lending relationships may be mitigated through the use of credit derivatives, with the Corporation’s credit view and market perspectives determining the size and timing of the hedging activity. In addition, we purchase credit protection to cover the funded portion as well as the unfunded portion of certain other credit exposures. To lessen the
cost of obtaining our desired credit protection levels, credit exposure may be added within an industry, borrower or counterparty group by selling protection. These credit derivatives do not meet the requirements for treatment as accounting hedges. They are carried at fair value with changes in fair value recorded in other income (loss).
Commercial Credit Portfolio
During 2011, credit quality in the commercial loans portfolio showed improvement relative to 2010. Commercial loans increased in 2011 primarily due to growth in commercial and industrial lending. Non-U.S. commercial loan growth, centered in corporate loans and trade finance, was driven by higher client demand, enterprise-wide initiatives, regional economic conditions and disruption in debt and equity markets leading to higher utilization. Growth in U.S. commercial loans was driven by domestic economic momentum. This was partially offset by declines in commercial real estate loans as net paydowns and sales outpaced new originations and renewals.
Reservable criticized balances, net charge-offs and nonperforming loans, leases and foreclosed property balances in the commercial credit portfolio declined in 2011. The reductions in reservable criticized and nonperforming loans, leases and foreclosed property were primarily in the commercial real estate and U.S. commercial portfolios. Commercial real estate continued to show improvement during 2011 compared to 2010 in both the homebuilder and non-homebuilder portfolios. However, levels of
stressed commercial real estate loans remain elevated. The reduction in reservable criticized U.S. commercial loans was driven by broad-based improvements in terms of clients, industries and businesses. Most other credit indicators across the remaining commercial portfolios also improved.
Table 3839 presents our commercial loans and leases, and related credit quality information at December 31, 20112012 and 20102011.
| | | | | | | | | | | | | | | | | | | | | | | | | | | |
| Table 38 | Commercial Loans and Leases | |
| Table 39 | | Commercial Loans and Leases |
| | | | | |
| | | December 31 | | December 31 |
| | | Outstandings | | Nonperforming | | Accruing Past Due 90 Days or More | | Outstandings | | Nonperforming | | Accruing Past Due 90 Days or More |
| (Dollars in millions) | (Dollars in millions) | 2011 | | 2010 | | 2011 | | 2010 | | 2011 | | 2010 | (Dollars in millions) | 2012 | | 2011 | | 2012 | | 2011 | | 2012 | | 2011 |
| U.S. commercial | U.S. commercial | $ | 179,948 |
| | $ | 175,586 |
| | $ | 2,174 |
| | $ | 3,453 |
| | $ | 75 |
| | $ | 236 |
| U.S. commercial | $ | 197,126 |
| | $ | 179,948 |
| | $ | 1,484 |
| | $ | 2,174 |
| | $ | 65 |
| | $ | 75 |
|
Commercial real estate (1) | Commercial real estate (1) | 39,596 |
| | 49,393 |
| | 3,880 |
| | 5,829 |
| | 7 |
| | 47 |
| Commercial real estate (1) | 38,637 |
| | 39,596 |
| | 1,513 |
| | 3,880 |
| | 29 |
| | 7 |
|
| Commercial lease financing | Commercial lease financing | 21,989 |
| | 21,942 |
| | 26 |
| | 117 |
| | 14 |
| | 18 |
| Commercial lease financing | 23,843 |
| | 21,989 |
| | 44 |
| | 26 |
| | 15 |
| | 14 |
|
| Non-U.S. commercial | Non-U.S. commercial | 55,418 |
| | 32,029 |
| | 143 |
| | 233 |
| | — |
| | 6 |
| Non-U.S. commercial | 74,184 |
| | 55,418 |
| | 68 |
| | 143 |
| | — |
| | — |
|
| | | 296,951 |
| | 278,950 |
| | 6,223 |
| | 9,632 |
| | 96 |
| | 307 |
| | 333,790 |
| | 296,951 |
| | 3,109 |
| | 6,223 |
| | 109 |
| | 96 |
|
U.S. small business commercial (2) | U.S. small business commercial (2) | 13,251 |
| | 14,719 |
| | 114 |
| | 204 |
| | 216 |
| | 325 |
| U.S. small business commercial (2) | 12,593 |
| | 13,251 |
| | 115 |
| | 114 |
| | 120 |
| | 216 |
|
| Commercial loans excluding loans accounted for under the fair value option | Commercial loans excluding loans accounted for under the fair value option | 310,202 |
| | 293,669 |
| | 6,337 |
| | 9,836 |
| | 312 |
| | 632 |
| Commercial loans excluding loans accounted for under the fair value option | 346,383 |
| | 310,202 |
| | 3,224 |
| | 6,337 |
| | 229 |
| | 312 |
|
Loans accounted for under the fair value option (3) | Loans accounted for under the fair value option (3) | 6,614 |
| | 3,321 |
| | 73 |
| | 30 |
| | — |
| | — |
| Loans accounted for under the fair value option (3) | 7,997 |
| | 6,614 |
| | 11 |
| | 73 |
| | — |
| | — |
|
| Total commercial loans and leases | Total commercial loans and leases | $ | 316,816 |
| | $ | 296,990 |
| | $ | 6,410 |
| | $ | 9,866 |
| | $ | 312 |
| | $ | 632 |
| Total commercial loans and leases | $ | 354,380 |
| | $ | 316,816 |
| | $ | 3,235 |
| | $ | 6,410 |
| | $ | 229 |
| | $ | 312 |
|
| |
(1) | Includes U.S. commercial real estate loans of $37.837.2 billion and $46.937.8 billion and non-U.S. commercial real estate loans of $1.81.5 billion and $2.51.8 billion at December 31, 20112012 and 20102011. |
| |
(2) | Includes card-related products. |
| |
(3) | Commercial loans accounted for under the fair value option include U.S. commercial loans of $2.22.3 billion and $1.62.2 billion, and non-U.S. commercial loans of $4.45.7 billion and $1.74.4 billion, and commercial real estate loans of $0 and $79 million at December 31, 20112012 and 20102011. See Note 2322 – Fair Value Option to the Consolidated Financial Statements for additional information on the fair value option. |
Outstanding commercial loans and leases increased$37.6 billion in 2012, primarily in non-U.S. commercial and U.S. commercial. During 2012, credit quality in the commercial loan portfolio continued to show improvement relative to the prior year. Reservable criticized balances and nonperforming loans, leases and foreclosed property balances in the commercial credit portfolio declined during 2012 and the declines were primarily in the commercial real estate and U.S. commercial portfolios. Commercial real estate continued to show improvement in both the residential and non-residential portfolios. The reduction in reservable criticized U.S. commercial loans was driven by broad-based improvements in terms of clients, industries and businesses. Most other credit indicators across the remaining commercial portfolios also improved in 2012. The allowance for loan and lease losses declined $1.0 billion from December 31, 2011 to $3.1 billion at December 31, 2012 due to improvements
in the core commercial portfolio (total commercial products excluding U.S. small business). For more information, see Allowance for Credit Losses on page 109.
Nonperforming commercial loans and leases as a percentage of outstanding commercial loans and leases werewas 0.91 percent and 2.02 percent and 3.32 percent(2.040.93 percent and 3.352.04 percent excluding loans accounted for under the fair value option) at December 31, 20112012 and 20102011. Accruing commercial loans and leases past due 90 days or more as a percentage of outstanding commercial loans and leases werewas 0.06 percent and 0.10 percent and 0.21 percent (0.10 percent and 0.22 percent excluding loans accounted for under the fair value option) at December 31, 20112012 and 20102011.
Table 3940 presents net charge-offs and related ratios for our
commercial loans and leases for 20112012 and 20102011. Improving portfolio trends drove lower charge-offs and higher recoveries across most of the portfolio. Commercial real estate net charge-offs during 2011declined in both the homebuilder and non-homebuilder portfolios. U.S. small business commercial net charge-offs declined primarily due to improvements in delinquencies, collections and bankruptcies. U.S. commercial charge-offs decreased during 2011 due to broad-based declines from improvements in client profiles, industries and businesses.
| | | | | | | | | | | | | | | | | | | |
| Table 39 | Commercial Net Charge-offs and Related Ratios | |
| Table 40 | | Commercial Net Charge-offs and Related Ratios |
| | | | | | | | | | | | | | | | | |
| | | Net Charge-offs | | Net Charge-off Ratios (1) | | Net Charge-offs | | Net Charge-off Ratios (1) |
| (Dollars in millions) | (Dollars in millions) | 2011 | | 2010 | | 2011 | | 2010 | (Dollars in millions) | 2012 | | 2011 | | 2012 | | 2011 |
| U.S. commercial | U.S. commercial | $ | 195 |
| | $ | 881 |
| | 0.11 | % | | 0.50 | % | U.S. commercial | $ | 242 |
| | $ | 195 |
| | 0.13 | % | | 0.11 | % |
| Commercial real estate | Commercial real estate | 947 |
| | 2,017 |
| | 2.13 |
| | 3.37 |
| Commercial real estate | 384 |
| | 947 |
| | 1.01 |
| | 2.13 |
|
| Commercial lease financing | Commercial lease financing | 24 |
| | 57 |
| | 0.11 |
| | 0.27 |
| Commercial lease financing | (6 | ) | | 24 |
| | (0.03 | ) | | 0.11 |
|
| Non-U.S. commercial | Non-U.S. commercial | 152 |
| | 111 |
| | 0.36 |
| | 0.39 |
| Non-U.S. commercial | 28 |
| | 152 |
| | 0.05 |
| | 0.36 |
|
| | | 1,318 |
| | 3,066 |
| | 0.46 |
| | 1.07 |
| | 648 |
| | 1,318 |
| | 0.21 |
| | 0.46 |
|
| U.S. small business commercial | U.S. small business commercial | 995 |
| | 1,918 |
| | 7.12 |
| | 12.00 |
| U.S. small business commercial | 699 |
| | 995 |
| | 5.46 |
| | 7.12 |
|
| Total commercial | Total commercial | $ | 2,313 |
| | $ | 4,984 |
| | 0.77 |
| | 1.64 |
| Total commercial | $ | 1,347 |
| | $ | 2,313 |
| | 0.43 |
| | 0.77 |
|
| |
(1) | Net charge-off ratios are calculated as net charge-offs divided by average outstanding loans and leases excluding loans accounted for under the fair value option. |
|
| | |
96 Bank of America 2012 | | Bank of America95
|
Table 4041 presents commercial credit exposure by type for utilized, unfunded and total binding committed credit exposure. Commercial utilized credit exposure includes SBLCs and financial guarantees, bankers’ acceptances and commercial letters of credit for which the Corporation iswe are legally bound to advance funds under prescribed conditions, during a specified period. Although funds have not yet been advanced, these exposure types are considered utilized for credit risk management purposes. Total commercial committed credit exposure increased $10.416.5 billion atin December 31, 20112012 compared to December 31, 2010primarily driven primarily by increases in loans and leases,LHFS, partially offset by decreases in derivative assets, and SBLCs LHFS and bankers’ acceptances.financial guarantees.
Total commercial utilized credit exposure increased $6.15.2 billion in 20112012 primarily driven by the same factors as total commercial committed exposure as described in the previous paragraph. The decrease in derivatives relates primarily by increases in loans and leases, partially offset by decreases in SBLCs, LHFS and bankers’ acceptances. Utilized loans and leases increased primarilyto a lower valuation of existing trades due to growth and higher revolver utilization in our international franchise, and were partially offset by run-off in the commercial real estate portfolio and the transfer of securities-based lending exposures from our U.S. commercial portfolio to the consumer portfolio during 2011.interest rate decreases along with reduced trading volume. The utilization rate for loans and leases, SBLCs and financial guarantees, commercial letters of credit and bankers’ acceptances was 58 percent and 57 percent at both December 31, 20112012 and 20102011.
| | | | | | | | | | | | | | | | | | | | | | | | | | | |
| Table 40 | Commercial Credit Exposure by Type | |
| Table 41 | | Commercial Credit Exposure by Type |
| | | | | | | | | | | | | | | | | | | | | | | | | |
| | | December 31 | | December 31 |
| | | Commercial Utilized (1) | | Commercial Unfunded (2, 3) | | Total Commercial Committed | | Commercial Utilized (1) | | Commercial Unfunded (2, 3) | | Total Commercial Committed |
| (Dollars in millions) | (Dollars in millions) | 2011 | | 2010 | | 2011 | | 2010 | | 2011 | | 2010 | (Dollars in millions) | 2012 | | 2011 | | 2012 | | 2011 | | 2012 | | 2011 |
| Loans and leases | Loans and leases | $ | 316,816 |
| | $ | 296,990 |
| | $ | 276,195 |
| | $ | 272,172 |
| | $ | 593,011 |
| | $ | 569,162 |
| Loans and leases | $ | 354,380 |
| | $ | 316,816 |
| | $ | 281,915 |
| | $ | 276,195 |
| | $ | 636,295 |
| | $ | 593,011 |
|
Derivative assets (4) | Derivative assets (4) | 73,023 |
| | 73,000 |
| | — |
| | — |
| | 73,023 |
| | 73,000 |
| Derivative assets (4) | 53,497 |
| | 73,023 |
| | — |
| | — |
| | 53,497 |
| | 73,023 |
|
| Standby letters of credit and financial guarantees | Standby letters of credit and financial guarantees | 55,384 |
| | 62,745 |
| | 1,592 |
| | 1,511 |
| | 56,976 |
| | 64,256 |
| Standby letters of credit and financial guarantees | 41,036 |
| | 55,384 |
| | 2,119 |
| | 1,592 |
| | 43,155 |
| | 56,976 |
|
Debt securities and other investments (5) | Debt securities and other investments (5) | 11,108 |
| | 10,216 |
| | 5,147 |
| | 4,546 |
| | 16,255 |
| | 14,762 |
| Debt securities and other investments (5) | 10,937 |
| | 11,108 |
| | 6,914 |
| | 5,147 |
| | 17,851 |
| | 16,255 |
|
| Loans held-for-sale | Loans held-for-sale | 5,006 |
| | 10,380 |
| | 229 |
| | 242 |
| | 5,235 |
| | 10,622 |
| Loans held-for-sale | 7,928 |
| | 5,006 |
| | 3,763 |
| | 229 |
| | 11,691 |
| | 5,235 |
|
| Commercial letters of credit | Commercial letters of credit | 2,411 |
| | 2,654 |
| | 832 |
| | 1,179 |
| | 3,243 |
| | 3,833 |
| Commercial letters of credit | 2,065 |
| | 2,411 |
| | 564 |
| | 832 |
| | 2,629 |
| | 3,243 |
|
| Bankers’ acceptances | Bankers’ acceptances | 797 |
| | 3,706 |
| | 28 |
| | 23 |
| | 825 |
| | 3,729 |
| Bankers’ acceptances | 185 |
| | 797 |
| | 3 |
| | 28 |
| | 188 |
| | 825 |
|
Foreclosed properties and other (6)(5) | Foreclosed properties and other (6)(5) | 1,964 |
| | 731 |
| | — |
| | — |
| | 1,964 |
| | 731 |
| Foreclosed properties and other (6)(5) | 1,699 |
| | 1,964 |
| | — |
| | — |
| | 1,699 |
| | 1,964 |
|
| Total | Total | $ | 466,509 |
| | $ | 460,422 |
| | $ | 284,023 |
| | $ | 279,673 |
| | $ | 750,532 |
| | $ | 740,095 |
| | $ | 471,727 |
| | $ | 466,509 |
| | $ | 295,278 |
| | $ | 284,023 |
| | $ | 767,005 |
| | $ | 750,532 |
|
| |
(1) | Total commercial utilized exposure at December 31, 20112012 and 20102011 includes loans and issued letters of credit and is comprised of loans outstanding of$8.0 billion and $6.6 billion and $3.3 billion andcommercial letters of credit with a notional value of $1.3 billion$672 million and $1.4$1.3 billion accounted for under the fair value option. |
| |
(2) | Total commercial unfunded exposure at December 31, 20112012 and 20102011 includes loan commitments with a notional value of $17.6 billion and $24.4 billion accounted for under the fair value option with a notional value of $24.4 billion and $25.9 billion.option. |
| |
(3) | Excludes unused business card lines which are not legally binding. |
| |
(4) | Derivative assets are carried at fair value, reflect the effects of legally enforceable master netting agreements and have been reduced by cash collateral of $58.958.1 billion and $58.358.9 billion at December 31, 20112012 and 20102011. Not reflected in utilized and committed exposure is additional derivative collateral held of $16.1$18.7 billion and $17.7$16.1 billion which consists primarily of other marketable securities. |
| |
(5) | Total commercial committed exposure consists of $16.3 billion and $14.2 billion of debt securities and $0 and $590 million of other investments at December 31, 2011 and 2010.
|
| |
(6)
| Includes $1.3 billion of net monoline exposure at both December 31, 2012 and 2011, as discussed in Monoline and Related Exposure on page 101103. |
Table 4142 presents commercial utilized reservable criticized exposure by product type. Criticized exposure corresponds to the Special Mention, Substandard and Doubtful asset categories as defined by regulatory authorities. Total commercial utilized reservable criticized exposure decreased $15.411.3 billion, or 3642 percent, in 20112012 due to broad-based decreases across most portfolios, primarily in commercial real estate and U.S. commercial
commercial property types driven largely by continued paydowns, salesrating upgrades, charge-offs and ratings upgradessales outpacing downgrades. Despite the improvements, utilized reservable criticized levels remain elevated, particularly in commercial real estate and U.S. small business commercial. At December 31, 20112012, approximately 8582 percent of commercial utilized reservable criticized exposure was secured compared to 8885 percent at December 31, 20102011.
| | | | | | | | | | | | | | | | | | | |
| Table 41 | Commercial Utilized Reservable Criticized Exposure | |
| Table 42 | | Commercial Utilized Reservable Criticized Exposure |
| | | | | | | | | | | | | | | | | |
| | | December 31 | | December 31 |
| | | 2011 | | 2010 | | 2012 | | 2011 |
| (Dollars in millions) | (Dollars in millions) | Amount (1) | | Percent (2) | | Amount (1) | | Percent (2) | (Dollars in millions) | Amount (1) | | Percent (2) | | Amount (1) | | Percent (2) |
| U.S. commercial | U.S. commercial | $ | 11,731 |
| | 5.16 | % | | $ | 17,195 |
| | 7.44 | % | U.S. commercial | $ | 8,631 |
| | 3.72 | % | | $ | 11,731 |
| | 5.16 | % |
| Commercial real estate | Commercial real estate | 11,525 |
| | 27.13 |
| | 20,518 |
| | 38.88 |
| Commercial real estate | 3,782 |
| | 9.24 |
| | 11,525 |
| | 27.13 |
|
| Commercial lease financing | Commercial lease financing | 1,140 |
| | 5.18 |
| | 1,188 |
| | 5.41 |
| Commercial lease financing | 969 |
| | 4.06 |
| | 1,140 |
| | 5.18 |
|
| Non-U.S. commercial | Non-U.S. commercial | 1,524 |
| | 2.44 |
| | 2,043 |
| | 5.01 |
| Non-U.S. commercial | 1,614 |
| | 2.02 |
| | 1,524 |
| | 2.44 |
|
| | | 25,920 |
| | 7.32 |
| | 40,944 |
| | 11.81 |
| | 14,996 |
| | 3.98 |
| | 25,920 |
| | 7.32 |
|
| U.S. small business commercial | U.S. small business commercial | 1,327 |
| | 10.01 |
| | 1,677 |
| | 11.37 |
| U.S. small business commercial | 940 |
| | 7.45 |
| | 1,327 |
| | 10.01 |
|
| Total commercial utilized reservable criticized exposure | Total commercial utilized reservable criticized exposure | $ | 27,247 |
| | 7.41 |
| | $ | 42,621 |
| | 11.80 |
| Total commercial utilized reservable criticized exposure | $ | 15,936 |
| | 4.10 |
| | $ | 27,247 |
| | 7.41 |
|
| |
(1) | Total commercial utilized reservable criticized exposure at December 31, 20112012 and 20102011 includes loans and leases of $25.3$14.6 billion and $39.8$25.3 billion and commercial letters of credit of $1.9$1.3 billion and $2.8$1.9 billion. |
| |
(2) | Percentages are calculated as commercial utilized reservable criticized exposure divided by total commercial utilized reservable exposure for each exposure category. |
U.S. Commercial
At December 31, 20112012, 5868 percent of the U.S. commercial loan portfolio, excluding small business, was managed in GlobalCommercial Banking, and 3010 percent in GBAMGlobal Markets. The remaining 12, 10 percent was mostly in CBB and the remainder primarily inGWIM (business-purpose loans for wealthy
clients). U.S. commercial loans, excluding loans accounted for under the fair value option, increased $4.417.2 billion, or 10 percent, in 20112012 primarily due to continuedgreater client demand in middle-market segments, dealer financing and specialized industries, and growth and higher revolver utilization across the portfolio. This increase was net of a product reclassification forin certain trade loans to non-U.S. commercial in 2011, as well as
the transfer of securities-basedasset-backed lending loans to the consumer portfolio earlier in 2011, which together totaled $5.3 billion.products. Reservable criticized balances and nonperforming loans and leases declined $5.53.1 billion and $1.3 billion690 million in 20112012. The declines were broad-based in terms of clients and industries and were driven by improved client credit profiles and liquidity. Net charge-offs decreasedincreased $68647 million in 20112012 due primarily to broad-based declines from credit quality improvements mentioned above, driving lower charge-offs and higher recoveries.recoveries compared to 2011.
Commercial Real Estate
The commercial real estate portfolio is predominantly managed in Global Commercial Banking and consists of loans made primarily to public and
private developers, homebuilders and commercial real estate firms. Outstanding loans decreased $9.8 billion959 million, or two percent, in 20112012 due to paydowns and sales, which outpacedoutpacing new originations and renewals. Over 90 percent of this decrease occurred within reservable criticized.
The portfolio remains diversified across property types and geographic regions. California represented the largest state concentration at 23 percent and 20 percentof commercial real estate loans and leases at 20 percentDecember 31, 2012 and 18 percent at December 31, 2011 and 2010. For more information on geographic and property concentrations, see
Table 42.
Credit quality for commercialCommercial real estate continued to show signs of improvement; however, we expect that elevated unemployment and ongoing pressure on vacancy and rental rates will continue to affect primarily the non-homebuilder portfolio.credit quality improved significantly during 2012. Nonperforming commercial real estate loans and foreclosed properties decreased 31$2.7 billion, or 61 percent, in 20112012, split evenly across the homebuilder and non-homebuilder portfolios. The decline in nonperforming loans and foreclosed properties primarily in the non-homebuilder portfolio was driven by decreases in the shopping centers/retail, land and land development, and office property types.non-residential portfolio. Reservable criticized balances decreased $9.07.7 billion, or 67 percent, primarily due to declines in the office, shopping centers/retail and multi-family rental property types in the non-homebuilder portfolio and improvement in the homebuildernon-residential portfolio. Net charge-offs declined $1.1 billion563 million in 20112012 compared to 2011 due to improvement in both the homebuilderresidential and non-homebuilder portfolio.non-residential portfolios.
Table 4243 presents outstanding commercial real estate loans by geographic region, which is based on the geographic location of the collateral, and by property type. Commercial real estate primarily includes commercial loans and leases secured by non-owner-occupied real estate which is dependent on the sale or lease of the real estate as the primary source of repayment.
| | | | | | | | | | | |
| Table 42 | Outstanding Commercial Real Estate Loans | |
| Table 43 | | Outstanding Commercial Real Estate Loans |
| | | | | | | | | |
| | | December 31 | | December 31 |
| (Dollars in millions) | (Dollars in millions) | 2011 | | 2010 | (Dollars in millions) | 2012 | | 2011 |
| By Geographic Region | By Geographic Region | |
| | |
| By Geographic Region | |
| | |
|
| California | California | $ | 7,957 |
| | $ | 9,012 |
| California | $ | 8,792 |
| | $ | 7,957 |
|
| Northeast | Northeast | 6,554 |
| | 7,639 |
| Northeast | 7,315 |
| | 6,554 |
|
| Southwest | Southwest | 5,243 |
| | 6,169 |
| Southwest | 4,612 |
| | 5,243 |
|
| Southeast | Southeast | 4,844 |
| | 5,806 |
| Southeast | 4,440 |
| | 4,844 |
|
| Midwest | Midwest | 4,051 |
| | 5,301 |
| Midwest | 3,421 |
| | 4,051 |
|
| Florida | Florida | 2,502 |
| | 3,649 |
| Florida | 2,148 |
| | 2,502 |
|
| Midsouth | | Midsouth | 1,980 |
| | 1,751 |
|
| Illinois | Illinois | 1,871 |
| | 2,811 |
| Illinois | 1,700 |
| | 1,871 |
|
| Midsouth | 1,751 |
| | 2,627 |
| |
| Northwest | Northwest | 1,574 |
| | 2,243 |
| Northwest | 1,553 |
| | 1,574 |
|
| Non-U.S. | Non-U.S. | 1,824 |
| | 2,515 |
| Non-U.S. | 1,483 |
| | 1,824 |
|
Other (1) | Other (1) | 1,425 |
| | 1,701 |
| Other (1) | 1,193 |
| | 1,425 |
|
Total outstanding commercial real estate loans (2) | $ | 39,596 |
| | $ | 49,473 |
| |
| Total outstanding commercial real estate loans | | Total outstanding commercial real estate loans | $ | 38,637 |
| | $ | 39,596 |
|
| By Property Type | By Property Type | |
| | |
| By Property Type | |
| | |
|
| Non-homebuilder | | | | |
| Non-residential | | Non-residential | | | |
| Office | Office | $ | 7,571 |
| | $ | 9,688 |
| Office | $ | 9,324 |
| | $ | 7,571 |
|
| Multi-family rental | Multi-family rental | 6,105 |
| | 7,721 |
| Multi-family rental | 5,893 |
| | 6,105 |
|
| Shopping centers/retail | Shopping centers/retail | 5,985 |
| | 7,484 |
| Shopping centers/retail | 5,780 |
| | 5,985 |
|
| Industrial/warehouse | Industrial/warehouse | 3,988 |
| | 5,039 |
| Industrial/warehouse | 3,839 |
| | 3,988 |
|
| Hotels/motels | | Hotels/motels | 3,095 |
| | 2,653 |
|
| Multi-use | Multi-use | 3,218 |
| | 4,266 |
| Multi-use | 2,186 |
| | 3,218 |
|
| Hotels/motels | 2,653 |
| | 2,650 |
| |
| Land and land development | Land and land development | 1,599 |
| | 2,376 |
| Land and land development | 1,157 |
| | 1,599 |
|
| Other | Other | 6,050 |
| | 5,950 |
| Other | 5,722 |
| | 6,050 |
|
| Total non-homebuilder | 37,169 |
| | 45,174 |
| |
| Homebuilder | 2,427 |
| | 4,299 |
| |
Total outstanding commercial real estate loans (2) | $ | 39,596 |
| | $ | 49,473 |
| |
| Total non-residential | | Total non-residential | 36,996 |
| | 37,169 |
|
| Residential | | Residential | 1,641 |
| | 2,427 |
|
| Total outstanding commercial real estate loans | | Total outstanding commercial real estate loans | $ | 38,637 |
| | $ | 39,596 |
|
| |
(1) | Other states primarily representsIncludes unsecured outstandings to real estate investment trusts and national home builders whose portfolios of properties span multiple geographic regions and properties in the states of Colorado, Utah, Hawaii, Wyoming and Montana. |
| |
(2)
| Includes commercial real estate loans accounted for under the fair value option of $79 million at December 31, 2010, none at December 31, 2011.
|
During 20112012, we continued to see improvementimprovements in both the homebuilder portfolio. Certainresidential and non-residential portfolios; however, portions of the non-homebuildernon-residential portfolio remain at risk as occupancy rates, rental rates and commercial property prices remain under pressure.in certain markets may be subject to additional risk. We use a number of proactive risk mitigation initiatives to reduce utilized
and potential exposure in the
commercial real estate portfolios including ongoing refinement of our credit standards, additional transfers of deteriorating exposures to management by independent special asset officers and the pursuit of alternative resolution methodsloan restructurings or asset sales to achieve the best results for our customers and the Corporation.
|
| | |
98 Bank of America 2012 | | Bank of America97
|
Tables 4344 and 4445 present commercial real estate credit quality data by non-homebuildernon-residential and homebuilderresidential property types. The homebuilderresidential portfolio presented in Tables 4243, 4344 and 4445 includes condominiums and other residential real estate. Other property
types in Tables 4243, 4344 and 4445 primarily include special purpose, nursing/retirement homes, medical facilities and restaurants, as well as unsecured loans to borrowers whose primary business is commercial real estate.
| | | | | | | | | | | | | | | | | | | |
| Table 43 | Commercial Real Estate Credit Quality Data | |
| Table 44 | | Commercial Real Estate Credit Quality Data |
| | | | | | | | | | | | | | | | | |
| | | December 31 | | December 31 |
| | | Nonperforming Loans and Foreclosed Properties (1) | | Utilized Reservable Criticized Exposure (2) | | Nonperforming Loans and Foreclosed Properties (1) | | Utilized Reservable Criticized Exposure (2) |
| (Dollars in millions) | (Dollars in millions) | | 2011 | | 2010 | | 2011 | | 2010 | (Dollars in millions) | 2012 | | 2011 | | 2012 | | 2011 |
| Non-homebuilder | | |
| | |
| | |
| | |
| |
| Non-residential | | Non-residential | |
| | |
| | |
| | |
|
| Office | Office | | $ | 807 |
| | $ | 1,061 |
| | $ | 2,375 |
| | $ | 3,956 |
| Office | $ | 295 |
| | $ | 807 |
| | $ | 914 |
| | $ | 2,375 |
|
| Multi-family rental | Multi-family rental | | 339 |
| | 500 |
| | 1,604 |
| | 2,940 |
| Multi-family rental | 109 |
| | 339 |
| | 375 |
| | 1,604 |
|
| Shopping centers/retail | Shopping centers/retail | | 561 |
| | 1,000 |
| | 1,378 |
| | 2,837 |
| Shopping centers/retail | 230 |
| | 561 |
| | 464 |
| | 1,378 |
|
| Industrial/warehouse | Industrial/warehouse | | 521 |
| | 420 |
| | 1,317 |
| | 1,878 |
| Industrial/warehouse | 160 |
| | 521 |
| | 324 |
| | 1,317 |
|
| Hotels/motels | | Hotels/motels | 45 |
| | 173 |
| | 202 |
| | 716 |
|
| Multi-use | Multi-use | | 345 |
| | 483 |
| | 971 |
| | 1,316 |
| Multi-use | 123 |
| | 345 |
| | 309 |
| | 971 |
|
| Hotels/motels | | 173 |
| | 139 |
| | 716 |
| | 1,191 |
| |
| Land and land development | Land and land development | | 530 |
| | 820 |
| | 749 |
| | 1,420 |
| Land and land development | 321 |
| | 530 |
| | 359 |
| | 749 |
|
| Other | Other | | 223 |
| | 168 |
| | 997 |
| | 1,604 |
| Other | 87 |
| | 223 |
| | 301 |
| | 997 |
|
| Total non-homebuilder | | 3,499 |
| | 4,591 |
| | 10,107 |
| | 17,142 |
| |
| Homebuilder | | 993 |
| | 1,963 |
| | 1,418 |
| | 3,376 |
| |
| Total non-residential | | Total non-residential | 1,370 |
| | 3,499 |
| | 3,248 |
| | 10,107 |
|
| Residential | | Residential | 393 |
| | 993 |
| | 534 |
| | 1,418 |
|
| Total commercial real estate | Total commercial real estate | | $ | 4,492 |
| | $ | 6,554 |
| | $ | 11,525 |
| | $ | 20,518 |
| Total commercial real estate | $ | 1,763 |
| | $ | 4,492 |
| | $ | 3,782 |
| | $ | 11,525 |
|
| |
(1) | Includes commercial foreclosed properties of $612250 million and $725612 million at December 31, 20112012 and 20102011. |
| |
(2) | Includes loans, excluding thoseSBLCs and bankers’ acceptances and excludes loans accounted for under the fair value option, SBLCs and bankers’ acceptances.option. |
| | | | | | | | | | | | | | | | | | | |
| Table 44 | Commercial Real Estate Net Charge-offs and Related Ratios | |
| Table 45 | | Commercial Real Estate Net Charge-offs and Related Ratios |
| | | | | | | | | | | | | | | | | |
| | | Net Charge-offs | | Net Charge-off Ratios (1) | | Net Charge-offs | | Net Charge-off Ratios (1) |
| (Dollars in millions) | (Dollars in millions) | 2011 | | 2010 | | 2011 | | 2010 | (Dollars in millions) | 2012 | | 2011 | | 2012 | | 2011 |
| Non-homebuilder | |
| | |
| | |
| | |
| |
| Non-residential | | Non-residential | |
| | |
| | |
| | |
|
| Office | Office | $ | 126 |
| | $ | 273 |
| | 1.51 | % | | 2.49 | % | Office | $ | 106 |
| | $ | 126 |
| | 1.36 | % | | 1.51 | % |
| Multi-family rental | Multi-family rental | 36 |
| | 116 |
| | 0.52 |
| | 1.21 |
| Multi-family rental | 13 |
| | 36 |
| | 0.23 |
| | 0.52 |
|
| Shopping centers/retail | Shopping centers/retail | 184 |
| | 318 |
| | 2.69 |
| | 3.56 |
| Shopping centers/retail | 57 |
| | 184 |
| | 1.00 |
| | 2.69 |
|
| Industrial/warehouse | Industrial/warehouse | 88 |
| | 59 |
| | 1.94 |
| | 1.07 |
| Industrial/warehouse | 49 |
| | 88 |
| | 1.31 |
| | 1.94 |
|
| Hotels/motels | | Hotels/motels | 11 |
| | 23 |
| | 0.39 |
| | 0.86 |
|
| Multi-use | Multi-use | 61 |
| | 143 |
| | 1.63 |
| | 2.92 |
| Multi-use | 66 |
| | 61 |
| | 2.46 |
| | 1.63 |
|
| Hotels/motels | 23 |
| | 45 |
| | 0.86 |
| | 1.02 |
| |
| Land and land development | Land and land development | 152 |
| | 377 |
| | 7.58 |
| | 13.04 |
| Land and land development | (23 | ) | | 152 |
| | (1.73 | ) | | 7.58 |
|
| Other | Other | 19 |
| | 220 |
| | 0.33 |
| | 3.14 |
| Other | 31 |
| | 19 |
| | 0.51 |
| | 0.33 |
|
| Total non-homebuilder | 689 |
| | 1,551 |
| | 1.67 |
| | 2.86 |
| |
| Homebuilder | 258 |
| | 466 |
| | 8.00 |
| | 8.26 |
| |
| Total non-residential | | Total non-residential | 310 |
| | 689 |
| | 0.86 |
| | 1.67 |
|
| Residential | | Residential | 74 |
| | 258 |
| | 3.74 |
| | 8.00 |
|
| Total commercial real estate | Total commercial real estate | $ | 947 |
| | $ | 2,017 |
| | 2.13 |
| | 3.37 |
| Total commercial real estate | $ | 384 |
| | $ | 947 |
| | 1.01 |
| | 2.13 |
|
| |
(1) | Net charge-off ratios are calculated as net charge-offs divided by average outstanding loans excluding loans accounted for under the fair value option. |
At December 31, 20112012, total committed non-homebuildernon-residential exposure was $53.1$54.5 billion compared to $64.2$53.1 billion at December 31, 20102011, with the decrease due to exposure reductions in all non-homebuilder property types. Non-homebuilderof which $37.0 billion and $37.2 billion were funded secured loans. Non-residential nonperforming loans and foreclosed properties were $3.51.4 billion and $4.63.5 billion at December 31, 20112012 and 20102011, which represented 9.293.68 percent and 10.089.29 percent of total non-homebuildernon-residential loans and foreclosed properties. Non-homebuilderThe decline in nonperforming loans and foreclosed properties in the non-residential portfolio was driven by decreases in the office, industrial/warehouse, shopping centers/retail and multi-family rental property types. Non-residential utilized reservable criticized exposure decreased to $10.13.2 billion, or 25.348.27 percent of non-homebuildernon-residential utilized reservable exposure, at December 31, 20112012 compared to $17.110.1 billion, or 35.5525.34 percent, at December 31, 20102011. primarily driven by repayments and an overall improvement in credit quality. The decrease in reservable criticized exposure was primarily driven primarily by office, multi-family rental, industrial/warehouse and shopping centers/retail and multi-family rental property types.types in the non-residential portfolio. For the non-homebuildernon-residential portfolio, net charge-offs decreased $862379 million in 2011 due in part to resolution of criticized assets through payoffs and sales.2012
compared to 2011 primarily due to improving appraisal values, improved borrower credit profiles and higher recoveries.
AtDecember 31, 2012, total committed residential exposure was $3.2 billion compared to $3.9 billion at December 31, 2011, we had committed homebuilder exposure of $3.9 billion compared to $6.0 billion at December 31, 2010, of which $2.4$1.6 billion and $4.3$2.4 billion were funded secured loans. The decline in homebuilderresidential committed exposure was due to repayments, net charge-offs, reductions in new home construction and continued risk reduction and mitigation initiatives in line with market conditions providing fewer origination opportunities to offset the reductions. Homebuilderour portfolio strategy. Residential nonperforming loans and foreclosed properties decreased $970600 million in 2012 due to repayments, a decline in the volume of loans being downgraded to nonaccrual status and net charge-offs. HomebuilderResidential utilized reservable criticized exposure decreased $2.0 billion884 million to $1.4 billion534 million due to repayments and net charge-offs. The nonperforming loans, leases and foreclosed properties and the utilized reservable criticized ratios for the homebuilderresidential portfolio were 23.33 percent and 31.56 percent at December 31, 2012 compared to 38.89 percent and 54.65 percent at December 31, 2011 compared to 42.80 percent and 74.27 percent at December 31, 2010. Net charge-offs for the homebuilderresidential portfolio decreased $208184 million in 20112012. compared to 2011.
|
| | |
| | 98Bank of America 2011201299
| | |
At December 31, 20112012 and 20102011, the commercial real estate loan portfolio included $6.7 billion and $10.9 billion and $19.1 billion of funded construction and land development loans that were originated to fund the construction and/or rehabilitation of commercial properties. The decline in construction and land development loans was driven by repayments, net charge-offs, and continued risk mitigation initiatives which outpacedand a reduced emphasis on new originations. This portfolio is mostly secured and diversified across property types and geographic regions but faces continuing challenges in the housing and rental markets. Weak rental demand and cash flows along with depressed property valuations of land have contributed to elevated levels of reservable criticized exposure, nonperforming loans and foreclosed properties,and net charge-offs. Reservable criticized construction and land development loans totaled $4.9$1.5 billion and $10.5$4.9 billion, and nonperforming construction and land development loans and foreclosed properties totaled $2.1 billion$730 million and $4.0$2.1 billion at December 31, 20112012 and 20102011. During a property’s construction phase, interest income is typically paid from interest reserves that are established at the inception of the loan. As construction is completed and the property is put into service, these interest reserves are depleted and interest payments from operating cash flows begin. Loans generally continue to be classified as construction loans until theyoperating cash flows reach appropriate levels or the loans are refinanced. We do not recognize interest income on nonperforming loans regardless of the existence of an interest reserve.
Non-U.S. Commercial
TheAt December 31, 2012, 72 percent of the non-U.S. commercial loan portfolio iswas managed primarily in GBAMGlobal Banking and 28 percent in Global Markets. Outstanding loans, excluding loans accounted for under the fair value option, increased $23.418.8 billion in 20112012 from continued growth in corporate loansprimarily due to increased client financing activity, structured lending and trade finance dueexposures. Net charge-offs decreased$124 million in 2012 compared to client demand, enterprise-wide initiatives, regional economic conditions and disruption in debt and equity markets, along with the product reclassification from U.S. commercial in 2011. For additional information on the non-U.S. commercial portfolio, see Non-U.S. Portfolio on page 104105.
U.S. Small Business Commercial
The U.S. small business commercial loan portfolio is comprised of small business card and small business loans managed in Card ServicesCBB. Card-related products were 45 percent and 46 percent of the U.S.
small business commercial portfolio at December 31, 2012 and Global Commercial Banking2011. U.S. small business commercial net charge-offs declineddecreased $923296 million in2012 compared to 2011 driven by improvements in delinquencies, collections and bankruptcies resulting from an improved economic environment as well as the reduction of higher risk vintages and the impact of higher credit quality originations. Of the U.S. small business commercial net charge-offs, 7458 percent were credit card-related products forin 20112012 compared to 7974 percent forin 20102011.
Commercial Loans Carried atAccounted for Under the Fair ValueOption
The portfolio of commercial loans accounted for under the fair value option is managed primarily in GBAMGlobal Banking. Outstanding commercial loans accounted for under the fair value option increased $3.31.4 billion to an aggregate fair value of $6.68.0 billion at December 31, 20112012 primarily due primarily to increased corporate borrowings under bank credit facilities. We recorded net gains of $213 million in 2012 compared to net losses of $174$174 million in 2011 resulting from changes in the fair value of the loan portfolio during 2011 compared to net gains of $82 million in 2010.portfolio. These amounts were primarily attributable to changes in instrument-specific credit risk, were recorded in other income (loss) and do not reflect the results of hedging activities.
In addition, unfunded lending commitments and letters of credit accounted for under the fair value option had an aggregate fair value of $1.2 billion528 million and $866 million1.2 billion at December 31, 20112012 and 20102011 which was recorded in accrued expenses and other liabilities. The associated aggregate notional amount of unfunded lending commitments and letters of credit accounted for under the fair value option was $25.718.3 billion and $27.325.7 billion at December 31, 20112012 and 20102011. During 2011 weWe recorded net lossesgains of $429704 million from changes in the fair value of commitments and letters of credit during 2012compared to net gainslosses of $23429 million in 20102011. resulting from maturities and terminations at par value and changes in the fair value of the loan portfolio. These amounts were primarily attributable to changes in instrument-specific credit risk, were recorded in other income (loss) and do not reflect the results of hedging activities.
|
| | |
100 Bank of America 2012 | | Bank of America99
|
Nonperforming Commercial Loans, Leases and Foreclosed Properties Activity
Table 4546 presents the nonperforming commercial loans, leases and foreclosed properties activity during 20112012 and 20102011. Nonperforming commercial loans and leases decreased $3.53.1 billion during 2011 to $6.33.2 billion at December 31, 20112012 driven by paydowns, charge-offs returns to performing status and sales partially offset byoutpacing new nonaccrual loans in the commercial real
estate and U.S. commercial portfolios.nonperforming loans. Approximately 9694 percent of commercial nonperforming loans,
leases and foreclosed properties are secured and approximately 5145 percent are contractually current. In addition, commercialCommercial nonperforming loans are carried at approximately 6876 percent of their unpaid principal balance before consideration of the allowance for loan and lease losses as the carrying value of these loans has been reduced to the estimated property value less estimated costs to sell.
| | | | | | | | | | | |
| Table 45 | Nonperforming Commercial Loans, Leases and Foreclosed Properties Activity (1, 2) | |
| Table 46 | | Nonperforming Commercial Loans, Leases and Foreclosed Properties Activity (1, 2) |
| | | | | | | | | |
| (Dollars in millions) | (Dollars in millions) | 2011 | | 2010 | (Dollars in millions) | 2012 | | 2011 |
| Nonperforming loans and leases, January 1 | Nonperforming loans and leases, January 1 | $ | 9,836 |
| | $ | 12,703 |
| Nonperforming loans and leases, January 1 | $ | 6,337 |
| | $ | 9,836 |
|
| Additions to nonperforming loans and leases: | Additions to nonperforming loans and leases: | |
| | |
| Additions to nonperforming loans and leases: | |
| | |
|
| New nonperforming loans and leases | New nonperforming loans and leases | 4,656 |
| | 7,809 |
| New nonperforming loans and leases | 2,334 |
| | 4,656 |
|
| Advances | Advances | 157 |
| | 330 |
| Advances | 85 |
| | 157 |
|
| Reductions in nonperforming loans and leases: | |
| | |
| |
| Paydowns and payoffs | (3,457 | ) | | (3,938 | ) | |
| Reductions to nonperforming loans and leases: | | Reductions to nonperforming loans and leases: | |
| | |
|
| Paydowns | | Paydowns | (2,372 | ) | | (3,457 | ) |
| Sales | Sales | (1,153 | ) | | (841 | ) | Sales | (840 | ) | | (1,153 | ) |
Returns to performing status (3) | Returns to performing status (3) | (1,183 | ) | | (1,607 | ) | Returns to performing status (3) | (808 | ) | | (1,183 | ) |
Charge-offs (4) | Charge-offs (4) | (1,576 | ) | | (3,221 | ) | Charge-offs (4) | (1,164 | ) | | (1,576 | ) |
Transfers to foreclosed properties | Transfers to foreclosed properties | (774 | ) | | (1,045 | ) | Transfers to foreclosed properties | (302 | ) | | (774 | ) |
| Transfers to loans held-for-sale | Transfers to loans held-for-sale | (169 | ) | | (354 | ) | Transfers to loans held-for-sale | (46 | ) | | (169 | ) |
| Total net reductions to nonperforming loans and leases | Total net reductions to nonperforming loans and leases | (3,499 | ) | | (2,867 | ) | Total net reductions to nonperforming loans and leases | (3,113 | ) | | (3,499 | ) |
| Total nonperforming loans and leases, December 31 | Total nonperforming loans and leases, December 31 | 6,337 |
| | 9,836 |
| Total nonperforming loans and leases, December 31 | 3,224 |
| | 6,337 |
|
| Foreclosed properties, January 1 | Foreclosed properties, January 1 | 725 |
| | 777 |
| Foreclosed properties, January 1 | 612 |
| | 725 |
|
| Additions to foreclosed properties: | Additions to foreclosed properties: | |
| | |
| Additions to foreclosed properties: | |
| | |
|
New foreclosed properties | New foreclosed properties | 507 |
| | 818 |
| New foreclosed properties | 222 |
| | 507 |
|
| Reductions in foreclosed properties: | |
| | |
| |
| Reductions to foreclosed properties: | | Reductions to foreclosed properties: | |
| | |
|
| Sales | Sales | (539 | ) | | (780 | ) | Sales | (516 | ) | | (539 | ) |
| Write-downs | Write-downs | (81 | ) | | (90 | ) | Write-downs | (68 | ) | | (81 | ) |
| Total net reductions to foreclosed properties | Total net reductions to foreclosed properties | (113 | ) | | (52 | ) | Total net reductions to foreclosed properties | (362 | ) | | (113 | ) |
| Total foreclosed properties, December 31 | Total foreclosed properties, December 31 | 612 |
| | 725 |
| Total foreclosed properties, December 31 | 250 |
| | 612 |
|
| Nonperforming commercial loans, leases and foreclosed properties, December 31 | Nonperforming commercial loans, leases and foreclosed properties, December 31 | $ | 6,949 |
| | $ | 10,561 |
| Nonperforming commercial loans, leases and foreclosed properties, December 31 | $ | 3,474 |
| | $ | 6,949 |
|
Nonperforming commercial loans and leases as a percentage of outstanding commercial loans and leases (5)(6) | Nonperforming commercial loans and leases as a percentage of outstanding commercial loans and leases (5)(6) | 2.04 | % | | 3.35 | % | Nonperforming commercial loans and leases as a percentage of outstanding commercial loans and leases (5)(6) | 0.93 | % | | 2.04 | % |
Nonperforming commercial loans, leases and foreclosed properties as a percentage of outstanding commercial loans, leases and foreclosed properties (5)(6) | Nonperforming commercial loans, leases and foreclosed properties as a percentage of outstanding commercial loans, leases and foreclosed properties (5)(6) | 2.24 |
| | 3.59 |
| Nonperforming commercial loans, leases and foreclosed properties as a percentage of outstanding commercial loans, leases and foreclosed properties (5)(6) | 1.00 |
| | 2.24 |
|
| |
(1) | Balances do not include nonperforming LHFS of $1.1 billion$437 million and $1.5$1.1 billion at December 31, 20112012 and 20102011. |
| |
(2) | Includes U.S. small business commercial activity. |
| |
(3) | Commercial loans and leases may be returned to performing status when all principal and interest is current and full repayment of the remaining contractual principal and interest is expected or when the loan otherwise becomes well-secured and is in the process of collection. TDRs are generally classified as performing after a sustained period of demonstrated payment performance. |
| |
(4) | BusinessSmall business card loans are not classified as nonperforming; therefore, the charge-offs on these loans have no impact on nonperforming activity and accordingly are excluded from this table. |
| |
(5) | New foreclosed properties represents transfers of nonperforming loans to foreclosed properties net of charge-offs recorded during the first 90 days after transfer of a loan to foreclosed properties. |
| |
(6) | Excludes loans accounted for under the fair value option. |
As a result of the retrospective application of new accounting guidance on TDRs effective September 30, 2011, the Corporation classified $1.1 billion of commercial loan modifications as TDRs that in previous periods had not been classified as TDRs. These loans were newly identified as TDRs typically because the Corporation was not able to demonstrate that the modified rate of interest, although significantly higher than the rate prior to
modification, was a market rate of interest. These newly identified TDRs did not have a significant impact on the allowance for credit losses or the provision for credit losses. Included in this amount was $402 million of performing commercial loans at December 31, 2011 that were not previously considered to be impaired loans. For additional information, see Note 1 – Summary of Significant Accounting Principlesto the Consolidated Financial Statements.
Table 4647 presents our commercial TDRs by product type and performing status. U.S. small business commercial TDRs are comprised of renegotiated small business card loans and are not classified as nonperforming as they are charged off no later than
the end of the month in which the loan becomes 180 days past due. For additional information on TDRs, see Note 5 – Outstanding Loans and Leasesto the Consolidated Financial Statements.
| | | | | | | | | | | | | | | | | | | | | | | | | | | |
| Table 46 | Commercial Troubled Debt Restructurings | |
| Table 47 | | Commercial Troubled Debt Restructurings |
| | | | | |
| | | December 31 | | December 31 |
| | | 2011 | | 2010 | | 2012 | | 2011 |
| (Dollars in millions) | (Dollars in millions) | Total | | Nonperforming | | Performing | | Total | | Nonperforming | | Performing | (Dollars in millions) | Total | | Nonperforming | | Performing | | Total | | Nonperforming | | Performing |
| U.S. commercial | U.S. commercial | $ | 1,329 |
| | $ | 531 |
| | $ | 798 |
| | $ | 356 |
| | $ | 175 |
| | $ | 181 |
| U.S. commercial | $ | 1,328 |
| | $ | 565 |
| | $ | 763 |
| | $ | 1,329 |
| | $ | 531 |
| | $ | 798 |
|
| Commercial real estate | Commercial real estate | 1,675 |
| | 1,076 |
| | 599 |
| | 815 |
| | 770 |
| | 45 |
| Commercial real estate | 1,391 |
| | 740 |
| | 651 |
| | 1,675 |
| | 1,076 |
| | 599 |
|
| Non-U.S. commercial | Non-U.S. commercial | 54 |
| | 38 |
| | 16 |
| | 19 |
| | 7 |
| | 12 |
| Non-U.S. commercial | 100 |
| | 15 |
| | 85 |
| | 54 |
| | 38 |
| | 16 |
|
| U.S. small business commercial | U.S. small business commercial | 389 |
| | — |
| | 389 |
| | 688 |
| | — |
| | 688 |
| U.S. small business commercial | 202 |
| | — |
| | 202 |
| | 389 |
| | — |
| | 389 |
|
| Total commercial troubled debt restructurings | Total commercial troubled debt restructurings | $ | 3,447 |
| | $ | 1,645 |
| | $ | 1,802 |
| | $ | 1,878 |
| | $ | 952 |
| | $ | 926 |
| Total commercial troubled debt restructurings | $ | 3,021 |
| | $ | 1,320 |
| | $ | 1,701 |
| | $ | 3,447 |
| | $ | 1,645 |
| | $ | 1,802 |
|
Industry Concentrations
Table 4748 presents commercial committed and utilized credit exposure by industry and the total net credit default protection purchased to cover the funded and unfunded portions of certain credit exposures. Our commercial credit exposure is diversified across a broad range of industries. Total committed commercial credit exposure increased$16.5 billion, or two percent, to $767.0 billion at December 31, 2012. The increase in commercial committed exposure of $10.4 billion in 2011was concentrated in banks,food, beverage and tobacco, banking, energy, diversified financials, and energy,real estate, partially offset by lower real estate, insurance (including monolines)exposure to government and other committed exposure.public education.
Industry limits are used internally to manage industry concentrations and are based on committed exposures and capital usage that are allocated on an industry-by-industry basis. A risk management framework is in place to set and approve industry limits as well as to provide ongoing monitoring. Management’s Credit Risk Committee (CRC) oversees industry limit governance.
Diversified financials, our largest industry concentration, experienced an increase in committed exposure of $8.24.7 billion, or ninefive percent, in 20112012 primarily driven primarily by increases in consumer financemargin loans and certain asset-backed lending and traded products, partially offset by a decrease in derivative exposure.
Real estate, our second largest industry concentration, experienced aan decreaseincrease in committed exposure of $9.43.1 billion, or 13five percent, in 20112012 primarily due primarily to paydowns and sales which outpaced new originations and renewals.renewals outpacing paydowns and sales. Real estate construction and land development exposure represented 20 percent and 2714 percent of the total real estate industry committed exposure at December 31, 20112012 and, down from 20 percent at 2010December 31, 2011. For more information on the
commercial real estate and related portfolios, see Commercial Real Estate on page 9798.
Committed exposure in the bankingfood, beverage and tobacco industry increaseincreasedd $9.16.8 billion, or 3122 percent, in 20112012 primarily duerelated to increases in trade finance as a result of momentum from regional economiesshort-term acquisition financing. Government and growth initiatives in foreign markets.
Energy committed exposure increased $5.7 billion, or 22 percent, in 2011 due to increases in working capital lines for state-related enterprises and increases in large investment-grade energy companies.
Insurance, including monolinespublic education committed exposure decreased $8.36.7 billion, or 3412 percent, in 20112012 due primarily to the settlement/termination of monoline positions. For more information on our monoline exposure, see Monolinedriven by decreases in loans and Related Exposure below.
OtherSBLCs. Banking committed exposure decreasedincreased $6.06.5 billion, or 44
17 percent, in 20112012 dueprimarily driven by loans to reductions primarilymortgage finance companies and trade finance activity with non-U.S. banks. Energy committed exposure increased$6.4 billion, or 20 percent, in traded products exposure.2012 reflecting loan growth in the exploration and production, and integrated oil sectors.
The Corporation’sOur committed state and municipal exposure of $46.1$38.0 billion at December 31, 20112012 consisted of $34.4$30.9 billion of commercial utilized exposure (including $18.6$17.6 billion of funded loans, $11.3$8.9 billion of SBLCs and $4.1$3.6 billion of derivative assets) and unutilizedunfunded commercial exposure of $11.7$7.2 billion (primarily unfunded loan commitments and letters of credit) and is reported in the Governmentgovernment and public education industry in Table 4748. Economic conditions continueWhile the slow economic recovery continues to impact debt issued bypressure budgets, most U.S. state and local municipalitiesgovernments have implemented offsetting fiscal adjustments and certain exposurescontinue to these municipalities.honor debt obligations as agreed. While historical default rates have been low, as part of our overall and ongoing risk management processes, we continually monitor these exposures through a rigorous review process. Additionally, internal communications surrounding certain at-risk counterparties and/or sectors are regularly circulated ensuringto maintain exposure levels and are in compliance with established concentration guidelines.
|
| | | | | | | | | | | | | | | | |
| | | | | | | | | |
| Table 48 | Commercial Credit Exposure by Industry (1) |
| | | | | | | | | |
| | | December 31 |
| | | Commercial Utilized | | Total Commercial Committed |
| (Dollars in millions) | 2012 | | 2011 | | 2012 | | 2011 |
| Diversified financials | $ | 66,201 |
| | $ | 64,957 |
| | $ | 99,673 |
| | $ | 94,969 |
|
Real estate (2) | 47,479 |
| | 48,138 |
| | 65,639 |
| | 62,566 |
|
| Government and public education | 41,449 |
| | 43,090 |
| | 50,285 |
| | 57,021 |
|
| Capital goods | 25,071 |
| | 24,025 |
| | 49,196 |
| | 48,013 |
|
| Retailing | 28,065 |
| | 25,478 |
| | 47,719 |
| | 46,290 |
|
| Healthcare equipment and services | 29,396 |
| | 31,298 |
| | 45,488 |
| | 48,141 |
|
| Banking | 40,245 |
| | 35,231 |
| | 45,238 |
| | 38,735 |
|
| Materials | 21,809 |
| | 19,384 |
| | 40,493 |
| | 38,070 |
|
| Energy | 17,684 |
| | 15,151 |
| | 38,464 |
| | 32,074 |
|
| Food, beverage and tobacco | 14,738 |
| | 15,904 |
| | 37,344 |
| | 30,501 |
|
| Consumer services | 23,093 |
| | 24,445 |
| | 36,367 |
| | 38,498 |
|
| Commercial services and supplies | 19,020 |
| | 20,089 |
| | 30,257 |
| | 30,831 |
|
| Utilities | 8,410 |
| | 8,102 |
| | 23,432 |
| | 24,552 |
|
| Media | 13,091 |
| | 11,447 |
| | 21,705 |
| | 21,158 |
|
| Transportation | 13,791 |
| | 12,683 |
| | 20,255 |
| | 19,036 |
|
| Individuals and trusts | 13,916 |
| | 14,993 |
| | 17,801 |
| | 19,001 |
|
| Insurance, including monolines | 8,519 |
| | 10,090 |
| | 14,145 |
| | 16,157 |
|
| Software and services | 5,549 |
| | 4,304 |
| | 12,125 |
| | 9,579 |
|
| Pharmaceuticals and biotechnology | 3,854 |
| | 4,141 |
| | 11,409 |
| | 11,328 |
|
| Technology hardware and equipment | 5,118 |
| | 5,247 |
| | 11,108 |
| | 12,173 |
|
| Telecommunication services | 4,029 |
| | 4,297 |
| | 10,297 |
| | 10,424 |
|
| Religious and social organizations | 6,850 |
| | 8,536 |
| | 9,107 |
| | 11,160 |
|
| Consumer durables and apparel | 4,246 |
| | 4,505 |
| | 8,438 |
| | 8,965 |
|
| Automobiles and components | 3,312 |
| | 2,813 |
| | 7,675 |
| | 7,178 |
|
| Food and staples retailing | 3,528 |
| | 3,273 |
| | 6,838 |
| | 6,476 |
|
| Other | 3,264 |
| | 4,888 |
| | 6,507 |
| | 7,636 |
|
| Total commercial credit exposure by industry | $ | 471,727 |
| | $ | 466,509 |
| | $ | 767,005 |
| | $ | 750,532 |
|
Net credit default protection purchased on total commitments (3) | |
| | |
| | $ | (14,657 | ) | | $ | (19,356 | ) |
| |
(1) | Includes U.S. small business commercial exposure. |
| |
(2) | Industries are viewed from a variety of perspectives to best isolate the perceived risks. For purposes of this table, the real estate industry is defined based on the borrowers’ or counterparties’ primary business activity using operating cash flows and primary source of repayment as key factors. |
| |
(3) | Represents net notional credit protection purchased. See Risk Mitigation on page 104 for additional information. |
Monoline and Related Exposure
Monoline exposure is reported in the insurance industry and managed under insurance portfolio industry limits.
We have indirect exposure to monolines primarily in the form of guarantees supporting our loans, investment portfolios, securitizations and credit-enhanced securities as part of our public finance business and other selected products. Such indirect exposure exists when we purchase credit protection from monolines to hedge all or a portion of the credit risk on certain credit exposures including loans and CDOs. We underwrite our public finance exposure by evaluating the underlying securities.
We also have indirect exposure to monolines in the form of guarantees supporting our mortgage and other loan sales. Indirect exposure may exist when credit protection was purchased from monolines to hedge all or a portion of the credit risk on certain mortgage and other loan exposures. A loss may occur when we are required to repurchase a loan and the market value of the loan has declined, or we are required to indemnify or provide recourse for a guarantor’s loss. For additional information regarding our exposure to representations and warranties, see Off-Balance Sheet Arrangements and Contractual Obligations – Representations and Warranties on page 5654 and Note 98 – Representations and Warranties Obligations and Corporate Guarantees to the Consolidated Financial Statements.
Table 49 presents the notional amount of our monoline derivative credit exposure, mark-to-market adjustment and the counterparty credit valuation adjustment.
|
| | | | | | | | |
| | | | | |
| Table 49 | Derivative Credit Exposures |
| | | | | |
| | | December 31 |
| (Dollars in millions) | 2012 | | 2011 |
| Notional amount of monoline exposure | $ | 13,547 |
| | $ | 21,070 |
|
| | | | | |
| Mark-to-market | $ | 898 |
| | $ | 1,766 |
|
| Counterparty credit valuation adjustment | (118 | ) | | (417 | ) |
| Net mark-to-market | $ | 780 |
| | $ | 1,349 |
|
| | | | | |
| | | 2012 | | 2011 |
| Gains (losses) from credit valuation changes | $ | 213 |
| | $ | (1,000 | ) |
The notional amount of monoline exposure at December 31, 2012decreased$7.5 billion from December 31, 2011 due to terminations, paydowns and maturities of monoline contracts. In addition, $1.3 billion of monoline exposure with a single counterparty ($4.9 billion gross receivable less impairment) was included in other assets at December 31, 2012 and 2011. The contracts are no longer considered to be derivative trading instruments because of the inherent default risk and they no longer
|
| | |
| | | Bank of America 2012 101103 |
During 2011, we terminated all of our monoline contracts referencing super senior ABS CDOs and reclassified net monoline exposure with a carrying value of $1.3 billion ($4.7 billion gross receivable less impairment) at December 31, 2011 from derivative assets to other assets because of the inherent default risk. Because these contracts no longer provide a hedge benefit, they are no longer considered derivative trading instruments. This exposure relates to a single counterparty and is recorded at fair value based on current net recovery projections. The net recovery projections take into account the present value of projected payments expected to be received from the counterparty.
Monoline derivative credit exposure had a notional value of $21.1 billion and $38.4 billion at December 31, 2011 and 2010. Mark-to-market monoline derivative credit exposure was $1.8 billion and $9.2 billion at December 31, 2011 and 2010 with the decrease driven by positive valuation adjustments on legacy assets, terminated monoline contracts and the reclassification of net monoline exposure to other assets mentioned above. The counterparty credit valuation adjustment related to monoline derivative exposure was $417 million and $5.3 billion at December 31, 2011 and 2010. This adjustment reduced our net
mark-to-market exposure to $1.3 billion at December 31, 2011 compared to $3.9 billion at December 31, 2010 and covered 24 percent of the mark-to-market exposure at December 31, 2011, down from 57 percent at December 31, 2010. We do not hold collateral against these derivative exposures. For more information on our monoline exposure, termination of certain monoline contracts and the transfer of monoline exposure to other assets, see GBAM on page 49.
benefit. We also have indirectpotential representations and warranties exposure to monolines as we invest in securities wherewith the issuers have purchased wraps. For example, municipalities and corporations purchase insurance in order to reduce their cost of borrowing. If the rating agencies downgrade the monolines, the credit rating of the bond may fall and may have an adverse impact on the market value of the security. In the case of default, we first look to the underlying securities and then to the purchased insurance for recovery. Investments in securities with purchased wraps issued by municipalities and corporations had a notional amount of $150 million and $2.4 billion at December 31, 2011 and 2010. Mark-to-market investment exposure was $89 million at December 31, 2011 compared to $2.2 billion at December 31, 2010.same counterparty.
|
| | | | | | | | | | | | | | | | |
| | | | | | | | | |
| Table 47 | Commercial Credit Exposure by Industry (1) |
| | | | | | | | | |
| | | December 31 |
| | | Commercial Utilized | | Total Commercial Committed |
| (Dollars in millions) | 2011 | | 2010 | | 2011 | | 2010 |
| Diversified financials | $ | 64,957 |
| | $ | 58,698 |
| | $ | 94,969 |
| | $ | 86,750 |
|
Real estate (2) | 48,138 |
| | 58,531 |
| | 62,566 |
| | 72,004 |
|
| Government and public education | 43,090 |
| | 44,131 |
| | 57,021 |
| | 59,594 |
|
| Healthcare equipment and services | 31,298 |
| | 30,420 |
| | 48,141 |
| | 47,569 |
|
| Capital goods | 24,025 |
| | 21,940 |
| | 48,013 |
| | 46,087 |
|
| Retailing | 25,478 |
| | 24,660 |
| | 46,290 |
| | 43,950 |
|
| Banks | 35,231 |
| | 26,831 |
| | 38,735 |
| | 29,667 |
|
| Consumer services | 24,445 |
| | 24,759 |
| | 38,498 |
| | 39,694 |
|
| Materials | 19,384 |
| | 15,873 |
| | 38,070 |
| | 33,046 |
|
| Energy | 15,151 |
| | 9,765 |
| | 32,074 |
| | 26,328 |
|
| Commercial services and supplies | 20,089 |
| | 20,056 |
| | 30,831 |
| | 30,517 |
|
| Food, beverage and tobacco | 15,904 |
| | 14,777 |
| | 30,501 |
| | 28,126 |
|
| Utilities | 8,102 |
| | 6,990 |
| | 24,552 |
| | 24,207 |
|
| Media | 11,447 |
| | 11,611 |
| | 21,158 |
| | 20,619 |
|
| Transportation | 12,683 |
| | 12,070 |
| | 19,036 |
| | 18,436 |
|
| Individuals and trusts | 14,993 |
| | 18,316 |
| | 19,001 |
| | 22,937 |
|
| Insurance, including monolines | 10,090 |
| | 17,263 |
| | 16,157 |
| | 24,417 |
|
| Technology hardware and equipment | 5,247 |
| | 4,373 |
| | 12,173 |
| | 10,932 |
|
| Pharmaceuticals and biotechnology | 4,141 |
| | 3,859 |
| | 11,328 |
| | 11,009 |
|
| Religious and social organizations | 8,536 |
| | 8,409 |
| | 11,160 |
| | 10,823 |
|
| Telecommunication services | 4,297 |
| | 3,823 |
| | 10,424 |
| | 9,321 |
|
| Software and services | 4,304 |
| | 3,837 |
| | 9,579 |
| | 9,531 |
|
| Consumer durables and apparel | 4,505 |
| | 4,297 |
| | 8,965 |
| | 8,836 |
|
| Automobiles and components | 2,813 |
| | 2,090 |
| | 7,178 |
| | 5,941 |
|
| Food and staples retailing | 3,273 |
| | 3,222 |
| | 6,476 |
| | 6,161 |
|
| Other | 4,888 |
| | 9,821 |
| | 7,636 |
| | 13,593 |
|
| Total commercial credit exposure by industry | $ | 466,509 |
| | $ | 460,422 |
| | $ | 750,532 |
| | $ | 740,095 |
|
Net credit default protection purchased on total commitments (3) | |
| | |
| | $ | (19,356 | ) | | $ | (20,118 | ) |
| |
(1)
| Includes U.S. small business commercial exposure. |
| |
(2)
| Industries are viewed from a variety of perspectives to best isolate the perceived risks. For purposes of this table, the real estate industry is defined based on the borrowers’ or counterparties’ primary business activity using operating cash flows and primary source of repayment as key factors. |
| |
(3)
| Represents net notional credit protection purchased. See Risk Mitigation below for additional information. |
Risk Mitigation
We purchase credit protection to cover the funded portion as well as the unfunded portion of certain credit exposures. To lower the cost of obtaining our desired credit protection levels, credit exposure may be added within an industry, borrower or counterparty group by selling protection.
At December 31, 20112012 and 20102011, net notional credit default protection purchased in our credit derivatives portfolio to hedge our funded and unfunded exposures for which we elected the fair value option, as well as certain other credit exposures, was $19.414.7 billion and $20.119.4 billion. The mark-to-market effects including the costresulted in net losses of net credit default protection hedging our credit exposure, resulted$1.0 billion in2012 compared to net gains of $121 million in 2011 compared. The gains and losses related to netthese instruments are offset by gains and losses of $546 million inon the exposures. 2010Table 50.
The presents the average VaR for these credit derivative hedges was $60 million in 2011 compared to $53 million in 2010. The average VaR for the related credit exposure was $74 million in 2011 compared to $65 million in 2010. There is a diversification effect between the net credit default protection hedging our credit exposure and the related credit exposure such that the combined average VaR was $38 million in 2011 compared to $41 million in 2010.derivatives. See Trading Risk Management on page 113114 for a description of our VaR calculation for the market-based trading portfolio.
|
| | | | | | | | |
| | | | | |
| Table 50 | Credit Derivative Value-at-Risk |
| | | | | |
| (Dollars in millions) | 2012 | | 2011 |
| Average | $ | 52 |
| | $ | 60 |
|
| Credit exposure average | 79 |
| | 74 |
|
Combined average (1) | 24 |
| | 38 |
|
| |
(1) | Reflects the diversification effect between net credit default protection hedging our credit exposure and the related credit exposure. |
Tables 4851 and 4952 present the maturity profiles and the credit exposure debt ratings of the net credit default protection portfolio at December 31, 20112012 and 20102011. The distribution of debt ratings for net notional credit default protection purchased is shown as a negative amount.
|
| | | | | | |
| | | | | |
| Table 51 | Net Credit Default Protection by Maturity |
| | | | | |
| | | December 31 |
| | 2012 | | 2011 |
| Less than or equal to one year | 21 | % | | 16 | % |
| Greater than one year and less than or equal to five years | 75 |
| | 77 |
|
| Greater than five years | 4 |
| | 7 |
|
| Total net credit default protection | 100 | % | | 100 | % |
|
| | | | | | |
| | | | | |
| Table 48 | Net Credit Default Protection by Maturity Profile |
| | | | | |
| | | December 31 |
| | 2011 | | 2010 |
| Less than or equal to one year | 16 | % | | 14 | % |
| Greater than one year and less than or equal to five years | 77 |
| | 80 |
|
| Greater than five years | 7 |
| | 6 |
|
| Total net credit default protection | 100 | % | | 100 | % |
| | | | | | | | | | | | | | | | | | | |
| Table 49 | Net Credit Default Protection by Credit Exposure Debt Rating | |
| Table 52 | | Net Credit Default Protection by Credit Exposure Debt Rating |
| | | | | | | | | | | | | | | | | |
| | | December 31 | | December 31 |
| | | 2011 | | 2010 | | 2012 | | 2011 |
| (Dollars in millions) | (Dollars in millions) | Net Notional | | Percent of Total | | Net Notional | | Percent of Total | (Dollars in millions) | Net Notional (1) | | Percent of Total | | Net Notional (1) | | Percent of Total |
Ratings (1, 2) | |
| | |
| | |
| | |
| |
Ratings (2, 3) | | Ratings (2, 3) | |
| | |
| | |
| | |
|
| AAA | AAA | $ | (32 | ) | | 0.2 | % | | $ | — |
| | — | % | AAA | $ | (120 | ) | | 0.8 | % | | $ | (32 | ) | | 0.2 | % |
| AA | AA | (779 | ) | | 4.0 |
| | (188 | ) | | 0.9 |
| AA | (474 | ) | | 3.2 |
| | (779 | ) | | 4.0 |
|
| A | A | (7,184 | ) | | 37.1 |
| | (6,485 | ) | | 32.2 |
| A | (5,861 | ) | | 40.0 |
| | (7,184 | ) | | 37.1 |
|
| BBB | BBB | (7,436 | ) | | 38.4 |
| | (7,731 | ) | | 38.4 |
| BBB | (6,067 | ) | | 41.4 |
| | (7,436 | ) | | 38.4 |
|
| BB | BB | (1,527 | ) | | 7.9 |
| | (2,106 | ) | | 10.5 |
| BB | (1,101 | ) | | 7.5 |
| | (1,527 | ) | | 7.9 |
|
| B | B | (1,534 | ) | | 7.9 |
| | (1,260 | ) | | 6.3 |
| B | (937 | ) | | 6.4 |
| | (1,534 | ) | | 7.9 |
|
| CCC and below | CCC and below | (661 | ) | | 3.4 |
| | (762 | ) | | 3.8 |
| CCC and below | (247 | ) | | 1.7 |
| | (661 | ) | | 3.4 |
|
NR (3)(4) | NR (3)(4) | (203 | ) | | 1.1 |
| | (1,586 | ) | | 7.9 |
| NR (3)(4) | 150 |
| | (1.0 | ) | | (203 | ) | | 1.1 |
|
| Total net credit default protection | Total net credit default protection | $ | (19,356 | ) | | 100.0 | % | | $ | (20,118 | ) | | 100.0 | % | Total net credit default protection | $ | (14,657 | ) | | 100.0 | % | | $ | (19,356 | ) | | 100.0 | % |
| |
(1) | Represents net credit default protection (purchased) sold. |
| |
(2) | Ratings are refreshed on a quarterly basis. |
| |
(2)(3)
| The Corporation considers ratingsRatings of BBB- or higher are considered to meet the definition of investment grade. |
| |
(3)(4)
| In addition to“NR” is comprised of names whichthat have not been rated, “NR” includes $(15) million and $(1.5) billion in net credit default swap index positions at December 31, 2011 and 2010. While index positions are principally investment grade, credit default swap indices include names in and across each of the ratings categories.
rated. |
In addition to our net notional credit default protection purchased to cover the funded and unfunded portion of certain credit exposures, credit derivatives are used for market-making activities for clients and establishing positions intended to profit from directional or relative value changes. We execute the majority of our credit derivative trades in the OTC market with large, multinational financial institutions, including broker/dealers and, to a lesser degree, with a variety of other investors. Because these transactions are executed in the OTC market, we are subject to
settlement risk. We are also subject to credit risk in the event that these counterparties fail to perform under the terms of these contracts. In most cases, credit derivative transactions are executed on a daily margin basis. Therefore, events such as a
credit downgrade, depending on the ultimate rating level, or a breach of credit covenants would typically require an increase in the amount of collateral required of the counterparty, where applicable, and/or allow us to take additional protective measures such as early termination of all trades.
Table 5053 presents the total contract/notional amount of credit derivatives outstanding and includes both purchased and written credit derivatives. The credit risk amounts are measured as the net replacement costasset exposure by counterparty, taking into consideration all contracts and collateral with that counterparty. The contract/notional amounts of credit derivatives decreased primarily due to portfolio optimization and increased utilization of clearinghouses in the event the counterparties with contracts in a gain positionrelation to us fail to perform under the termscertain regulatory initiatives and refinement of those contracts.risk mitigation activities. For information on our written credit derivatives,
see Note 43 – Derivatives to the Consolidated Financial Statements.
The credit risk amounts discussed above and presented in Table 5053 take into consideration the effects of legally enforceable master netting agreements, while amounts disclosed in Note 43 – Derivatives to the Consolidated Financial Statements are shown
on a gross basis. Credit risk reflects the potential benefit from offsetting exposure to non-credit derivative products with the same counterparties that may be netted upon the occurrence of certain events, thereby reducing our overall exposure.
| | | | | | | | | | | | | | | | | | | |
| Table 50 | Credit Derivatives | |
| Table 53 | | Credit Derivatives |
| | | | | | | | | | | | | | | | | |
| | | December 31 | | December 31 |
| | | 2011 | | 2010 | | 2012 | | 2011 |
| (Dollars in millions) | (Dollars in millions) | Contract/ Notional | | Credit Risk | | Contract/ Notional | | Credit Risk | (Dollars in millions) | Contract/ Notional | | Credit Risk | | Contract/ Notional | | Credit Risk |
| Purchased credit derivatives: | Purchased credit derivatives: | |
| | |
| | |
| | |
| Purchased credit derivatives: | |
| | |
| | |
| | |
|
| Credit default swaps | Credit default swaps | $ | 1,944,764 |
| | $ | 14,163 |
| | $ | 2,184,703 |
| | $ | 18,150 |
| Credit default swaps | $ | 1,559,472 |
| | $ | 8,987 |
| | $ | 1,944,764 |
| | $ | 14,163 |
|
| Total return swaps/other | Total return swaps/other | 17,519 |
| | 776 |
| | 26,038 |
| | 1,013 |
| Total return swaps/other | 43,489 |
| | 402 |
| | 17,519 |
| | 776 |
|
| Total purchased credit derivatives | Total purchased credit derivatives | 1,962,283 |
| | 14,939 |
| | 2,210,741 |
| | 19,163 |
| Total purchased credit derivatives | $ | 1,602,961 |
| | $ | 9,389 |
| | $ | 1,962,283 |
| | $ | 14,939 |
|
| Written credit derivatives: | Written credit derivatives: | |
| | |
| | |
| | |
| Written credit derivatives: | |
| | |
| | |
| | |
|
| Credit default swaps | Credit default swaps | 1,885,944 |
| | n/a |
| | 2,133,488 |
| | n/a |
| Credit default swaps | $ | 1,531,504 |
| | n/a |
| | $ | 1,885,944 |
| | n/a |
|
| Total return swaps/other | Total return swaps/other | 17,838 |
| | n/a |
| | 22,474 |
| | n/a |
| Total return swaps/other | 68,811 |
| | n/a |
| | 17,838 |
| | n/a |
|
| Total written credit derivatives | Total written credit derivatives | 1,903,782 |
| | n/a |
| | 2,155,962 |
| | n/a |
| Total written credit derivatives | $ | 1,600,315 |
| | n/a |
| | $ | 1,903,782 |
| | n/a |
|
| Total credit derivatives | $ | 3,866,065 |
| | $ | 14,939 |
| | $ | 4,366,703 |
| | $ | 19,163 |
| |
n/a = not applicable
Counterparty Credit Risk Valuation Adjustments
We record a counterparty credit risk valuation adjustmentadjustments (CVA) on certain derivative assets, including our credit default protection purchased, in order to properly reflect the credit qualityrisk of the counterparty. These adjustments are necessaryWe calculate CVA based on a modeled expected exposure that incorporates current market risk factors including changes in market spreads and non-credit related market factors that affect the value of a derivative. The exposure also takes into consideration credit mitigants such as the market quotes on derivatives do not fully reflect the credit risk of the counterparties to the derivative assets. We consider collateral and legally enforceable master netting agreements that mitigate ourand collateral. Table 54 presents credit exposure to each counterparty in determining the counterparty credit risk valuation adjustment. All or a portiongains (losses), net of these counterparty credit risk valuation adjustments are subsequently adjusted due to changes in the value of the derivative contract, collateral and creditworthiness of the counterparty.
Duringhedges, for 20112012 and 20102011. In 2012, creditwe refined our methodology for CVA on derivatives on a prospective basis. We no longer consider the probability of default for both the counterparty and the Corporation when calculating the counterparty CVA and now only consider the probability of the counterparty defaulting for CVA. For more information, see Note 3 – Derivativesto the Consolidated Financial Statements. The effect of this change in estimate on CVA is reflected in the table below. Credit valuation gains (losses) offor $(1.9) billion2012 and $731 million ($(606) million and $(8) million, net of hedges) forwere due to improved counterparty credit risk were recognized in trading account profits for counterparty credit risk related to derivative assets.creditworthiness, partially offset by hedge results. For information on our monoline counterparty credit risk, see GBAM–Collateralized Debt Obligation and Monoline Exposure on page 51 and Monoline and Related Exposure on page 101103.
|
| | | | | | | | | | | | | | | | | | | | |
| | | | | | | | | |
| Table 54 | Credit Valuation Gains and Losses |
| | | | | | | | | |
| | | 2012 | | 2011 |
| (Dollars in millions) | Gross | Hedge | Net | | Gross | Hedge | Net |
| Credit valuation gains (losses) | $ | 1,022 |
| $ | (731 | ) | $ | 291 |
| | $ | (1,863 | ) | $ | 1,257 |
| $ | (606 | ) |
Non-U.S. Portfolio
Our non-U.S. credit and trading portfolios are subject to country risk. We define country risk as the risk of loss from unfavorable economic and political conditions, currency fluctuations, social instability and changes in government policies. A risk management
framework is in place to measure, monitor and manage non-U.S. risk and exposures. Management oversight of country risk, including cross-border risk, is provided by the RegionalCountry Credit Risk Committee, a subcommittee of the CRC. In addition to the direct risk of doing business in a country, we also are exposed to indirect country risks (for example, related to the collateral received on secured financing transactions or related to client clearing activities). These indirect exposures are managed in the normal course of business through credit, market and operational risk governance, rather than through the country risk governance.
Table 5155 sets forthpresents our total non-U.S. exposure broken out by region at December 31, 20112012 and 20102011. Non-U.S. exposure is presented on an internal risk management basis and includes sovereign and non-sovereign credit exposure, net of local liabilities, securities and other investments issued by or domiciled in countries other than the U.S. Total non-U.S. exposureRisk assignments by country can be adjusted for externally guaranteed loans outstanding and certain collateral types. Exposures which are subject to external guarantees are reported under the country of the guarantor. Exposures with tangible collateral are reflected in the country where the collateral is held. For securities received, other than cross-border resale agreements, outstandings are assigned to the domicile of the issuer of the securities. Resale agreements are generally presented based on the domicile of the counterparty consistent with FFIEC reporting requirements.
| | | | | | | | | | | |
| Table 51 | Regional Non-U.S. Exposure (1, 2, 3) | |
| Table 55 | | Total Non-U.S. Exposure by Region |
| | | | | | | | | |
| | | December 31 | | December 31 |
| (Dollars in millions) | (Dollars in millions) | 2011 | | 2010 | (Dollars in millions) | 2012 | | 2011 |
| Europe | Europe | $ | 115,914 |
| | $ | 148,078 |
| Europe | $ | 137,778 |
| | $ | 121,778 |
|
| Asia Pacific | Asia Pacific | 74,577 |
| | 73,255 |
| Asia Pacific | 92,412 |
| | 75,828 |
|
| Latin America | Latin America | 17,415 |
| | 14,848 |
| Latin America | 21,246 |
| | 15,133 |
|
| Middle East and Africa | Middle East and Africa | 4,614 |
| | 3,688 |
| Middle East and Africa | 8,200 |
| | 5,533 |
|
Other | Other | 20,101 |
| | 22,188 |
| Other | 22,014 |
| | 18,795 |
|
| Total | Total | $ | 232,621 |
| | $ | 262,057 |
| Total | $ | 281,650 |
| | $ | 237,067 |
|
| |
(1) | Local funding or liabilities are subtracted from local exposures consistent with FFIEC reporting requirements. |
| |
(2)
| Derivative assets included in theOther includes Canada exposure amounts have been reduced by the amount of cash collateral applied of $45.620.3 billion and $44.2$16.9 billion at December 31, 20112012 and 20102011.
|
| |
(3)
| Cross-border resale agreements where the underlying securities are U.S. Treasury securities, in which case the domicile is the U.S., are excluded from this presentation. |
|
| | |
| | 104Bank of America 20112012105
| | |
Our total non-U.S. exposure was $232.6281.7 billion at December 31, 20112012, aan decreaseincrease of $29.444.6 billion from December 31, 20102011. The increase in non-U.S. exposure was driven by our strategy to grow non-U.S. business in select countries and diversify risk globally. Our non-U.S. exposure remained concentrated in Europe which accounted for $115.9137.8 billion, or 5049 percent, of total non-U.S. exposure. The European exposure was mostly in Western Europe and was distributed across a variety of industries. The decrease of $32.2 billion in Europe was primarily driven by our efforts to reduce risk in countries affected by the ongoing debt crisis in the Eurozone. Select European countries are further detailed in Table 5457. Asia Pacific was our second largest non-U.S. exposure at $74.692.4 billion, or 3233 percent. The $1.3 billionincrease in Asia Pacific was driven by increases in securities and local exposure in Japan and increases in the emerging markets, predominately in local exposure, loans and securities offset by the sale of CCB shares. For more information on our CCB investment, see Note 5 – Securitiesto the Consolidated Financial Statements.total non-U.S. exposure. Latin America accounted for $17.421.2 billion, or seveneight percent, of total non-U.S. exposure. The $2.6 billionincrease in Latin America was primarily driven by an increase in Brazil in securities and local country exposure. Middle East and Africa increased$926 million toaccounted for $4.68.2 billion, representingor twothree percent of total non-U.S. exposure. Other non-U.S. exposure wasaccounted for $20.122.0 billion ator approximately December 31, 2011,
a decrease of $2.1 billion in 2011 resulting primarily from a decrease in local exposure as a result of the sale of our Canadian consumer card business. For more information on our Asia Pacific and Latin America exposure, see non-U.S. exposure to selected countries defined as emerging markets on page 106.
Table 52 presents countries where total cross-border exposure exceeded one percent of our total assets. At December 31, 2011, the United Kingdom and Japan were the only countries where total cross-border exposure exceeded one percent of our total assets. At December 31, 2011, Canada and France had total cross-border exposure of $16.9 billion and $16.1 billion representing 0.79 percent and 0.75seven percent of total assets. Canadanon-U.S. exposure. For information on country specific exposures, see Tables 56 and France were57.
Funded loans and loan equivalents include loans, leases and other extensions of credit or funds including letters of credit and due from placements, which have not been reduced by collateral or credit default protection. Funded loans are reported net of charge-offs but prior to any allowance for loan and lease losses. Unfunded commitments are the onlyundrawn portion of legally binding commitments related to loans and loan equivalents.
Net counterparty exposure includes the fair value of derivatives, including the counterparty risk associated with credit default swaps (CDS) and secured financing transactions. Derivative
exposures are reported net of collateral, which is predominantly cash, pledged under legally enforceable netting agreements. Secured financing transaction exposures have been reduced by eligible cash or securities pledged as collateral. Counterparty exposure has not been reduced by hedges or credit default protection.
Securities and other countriesinvestments are marked-to-market and long positions are netted against short positions with the same underlying issuer to, but not below, zero (i.e., negative issuer exposures are reported as zero). Other investments includes our GPI portfolio and strategic investments.
Net country exposure represents country exposure less hedges and credit default protection purchased, net of credit default protection sold. We hedge certain of our country exposures with credit default protection primarily in the form of single-name, as well as index and tranche CDS. The exposures associated with these hedges represent the amount that had total cross-border exposurewould be realized upon the isolated default of an individual issuer in the relevant country assuming a zero recovery rate for that exceeded individual issuer, and are calculated based on the CDS notional amount less any fair value receivable or payable. Changes in the assumption of an isolated default can produce different results in a particular tranche.
Table 560.75 presents our 20 largest, non-U.S. country exposures. These exposures accounted for 89 percent of our total assetsnon-U.S. exposure at December 31, 20112012.
Exposure includes cross-border claims by our non-U.S. offices including loans, acceptances, time deposits placed, trading account assets, securities, derivative assets, other interest-earning investments and other monetary assets. Amounts also include unused commitments, SBLCs, commercial letters of credit and formal guarantees. Sector definitions are consistent with FFIEC reporting requirements for preparing the Country Exposure Report.
|
| | | | | | | | | | | | | | | | | | | | | |
| | | | | | | | | | | | | |
| Table 52 | Total Cross-border Exposure Exceeding One Percent of Total Assets (1) |
| | | | | | | | | | | | | |
| (Dollars in millions) | December 31 | | Public Sector | | Banks | | Private Sector | | Cross-border Exposure | | Exposure as a
Percentage of Total Assets |
| United Kingdom | 2011 | | $ | 6,401 |
| | $ | 4,424 |
| | $ | 18,056 |
| | $ | 28,881 |
| | 1.36 | % |
| | 2010 | | 101 |
| | 5,544 |
| | 32,354 |
| | 37,999 |
| | 1.68 |
|
Japan (2) | 2011 | | 4,603 |
| | 10,383 |
| | 8,060 |
| | 23,046 |
| | 1.08 |
|
| |
(1)
| Total cross-border exposure for the United Kingdom and Japan included derivatives exposure of $5.9 billion and $3.5 billion at December 31, 2011 and $2.3 billion and $2.8 billion at December 31, 2010 which has been reduced by the amount of cash collateral applied of $9.3 billion and $1.2 billion at December 31, 2011 and $13.0 billion and $1.6 billion at December 31, 2010. Derivative assets were collateralized by other marketable securities of $242 million and $1.7 billion at December 31, 2011 and $96 million and $743 million at December 31, 2010.
|
| |
(2)
| At December 31, 2010, total cross-border exposure for Japan was $17.0 billion, representing 0.75 percent of total assets.
|
As presented in Table 53, non-U.S. exposure to borrowers or counterparties in emerging markets decreased$3.4 billion compared to $61.6 billion88 percent at December 31, 2011. The decrease was due to the sale of CCB shares, partially offset by growth in the rest of
Asia Pacific and other regions. Non-U.S. exposure to borrowers or counterparties in emerging markets represented 26 percent and 25 percent of total non-U.S. exposure at December 31, 2011 and 2010.
|
| | | | | | | | | | | | | | | | | | | | | | | | | | | | | | | | |
| | | | | | | | | | | | | | | | | |
| Table 53 | Selected Emerging Markets (1) |
| | | | | | | | | | | | | | | | | |
| (Dollars in millions) | Loans and
Leases, and
Loan Commitments | | Other Financing (2) | | Derivative Assets (3) | | Securities/
Other Investments (4) | | Total Cross-
border Exposure (5) | | Local Country
Exposure Net
of Local Liabilities (6) | | Total Selected Emerging Market
Exposure at
December 31, 2011( | | Increase
(Decrease)
From
December 31, 2010 |
| Region/Country | |
| | |
| | |
| | |
| | |
| | |
| | |
| | |
|
| Asia Pacific | |
| | |
| | |
| | |
| | |
| | |
| | |
| | |
|
| India | $ | 4,737 |
| | $ | 1,686 |
| | $ | 1,078 |
| | $ | 2,272 |
| | $ | 9,773 |
| | $ | 712 |
| | $ | 10,485 |
| | $ | 2,217 |
|
| South Korea | 1,642 |
| | 1,228 |
| | 690 |
| | 2,207 |
| | 5,767 |
| | 1,795 |
| | 7,562 |
| | 2,283 |
|
| China | 3,907 |
| | 315 |
| | 1,276 |
| | 1,751 |
| | 7,249 |
| | 83 |
| | 7,332 |
| | (16,596 | ) |
| Hong Kong | 417 |
| | 276 |
| | 179 |
| | 1,074 |
| | 1,946 |
| | 1,259 |
| | 3,205 |
| | 1,163 |
|
| Singapore | 514 |
| | 130 |
| | 479 |
| | 1,932 |
| | 3,055 |
| | — |
| | 3,055 |
| | 509 |
|
| Taiwan | 573 |
| | 35 |
| | 80 |
| | 672 |
| | 1,360 |
| | 1,191 |
| | 2,551 |
| | 696 |
|
| Thailand | 29 |
| | 8 |
| | 44 |
| | 613 |
| | 694 |
| | — |
| | 694 |
| | 25 |
|
Other Asia Pacific (7) | 663 |
| | 356 |
| | 174 |
| | 682 |
| | 1,875 |
| | 35 |
| | 1,910 |
| | 1,196 |
|
| Total Asia Pacific | $ | 12,482 |
| | $ | 4,034 |
| | $ | 4,000 |
| | $ | 11,203 |
| | $ | 31,719 |
| | $ | 5,075 |
| | $ | 36,794 |
| | $ | (8,507 | ) |
| Latin America | | | |
| | |
| | |
| | |
| | |
| | |
| | |
| Brazil | $ | 1,965 |
| | $ | 374 |
| | $ | 436 |
| | $ | 3,346 |
| | $ | 6,121 |
| | $ | 3,010 |
| | $ | 9,131 |
| | $ | 3,325 |
|
| Mexico | 2,381 |
| | 305 |
| | 309 |
| | 996 |
| | 3,991 |
| | — |
| | 3,991 |
| | (394 | ) |
| Chile | 1,100 |
| | 180 |
| | 314 |
| | 22 |
| | 1,616 |
| | 29 |
| | 1,645 |
| | 119 |
|
| Colombia | 360 |
| | 114 |
| | 15 |
| | 29 |
| | 518 |
| | — |
| | 518 |
| | (159 | ) |
Other Latin America (7) | 255 |
| | 218 |
| | 32 |
| | 334 |
| | 839 |
| | 154 |
| | 993 |
| | (385 | ) |
| Total Latin America | $ | 6,061 |
| | $ | 1,191 |
| | $ | 1,106 |
| | $ | 4,727 |
| | $ | 13,085 |
| | $ | 3,193 |
| | $ | 16,278 |
| | $ | 2,506 |
|
| Middle East and Africa | | | |
| | |
| | |
| | |
| | |
| | |
| | |
| United Arab Emirates | $ | 1,134 |
| | $ | 87 |
| | $ | 461 |
| | $ | 12 |
| | $ | 1,694 |
| | $ | — |
| | $ | 1,694 |
| | $ | 518 |
|
| Bahrain | 79 |
| | 1 |
| | 2 |
| | 907 |
| | 989 |
| | 3 |
| | 992 |
| | (168 | ) |
| South Africa | 498 |
| | 53 |
| | 48 |
| | 54 |
| | 653 |
| | — |
| | 653 |
| | 82 |
|
Other Middle East and Africa (7) | 759 |
| | 71 |
| | 116 |
| | 303 |
| | 1,249 |
| | 26 |
| | 1,275 |
| | 494 |
|
| Total Middle East and Africa | $ | 2,470 |
| | $ | 212 |
| | $ | 627 |
| | $ | 1,276 |
| | $ | 4,585 |
| | $ | 29 |
| | $ | 4,614 |
| | $ | 926 |
|
| Central and Eastern Europe | | | |
| | |
| | |
| | |
| | |
| | |
| | |
| Russian Federation | $ | 1,596 |
| | $ | 145 |
| | $ | 22 |
| | $ | 96 |
| | $ | 1,859 |
| | $ | 17 |
| | $ | 1,876 |
| | $ | 1,340 |
|
| Turkey | 553 |
| | 81 |
| | 10 |
| | 344 |
| | 988 |
| | 217 |
| | 1,205 |
| | 705 |
|
Other Central and Eastern Europe (7) | 109 |
| | 143 |
| | 290 |
| | 328 |
| | 870 |
| | — |
| | 870 |
| | (383 | ) |
| Total Central and Eastern Europe | $ | 2,258 |
| | $ | 369 |
| | $ | 322 |
| | $ | 768 |
| | $ | 3,717 |
| | $ | 234 |
| | $ | 3,951 |
| | $ | 1,662 |
|
| Total emerging market exposure | $ | 23,271 |
| | $ | 5,806 |
| | $ | 6,055 |
| | $ | 17,974 |
| | $ | 53,106 |
| | $ | 8,531 |
| | $ | 61,637 |
| | $ | (3,413 | ) |
|
| | | | | | | | | | | | | | | | | | | | | | | | | | | | | | | | |
| | | | | | | | | | | | | | | | | |
| Table 56 | Top 20 Non-U.S. Countries Exposure |
| | | | | | | | | | | | | | | | | |
| (Dollars in millions) | Funded Loans and Loan Equivalents | | Unfunded Loan Commitments | | Net Counterparty Exposure | | Securities/
Other Investments | | Country Exposure at December 31
2012 | | Hedges and Credit Default Protection | | Net Country Exposure at December 31
2012 | | Increase (Decrease) from December 31
2011 |
| United Kingdom | $ | 28,820 |
| | $ | 10,593 |
| | $ | 4,823 |
| | $ | 6,082 |
| | $ | 50,318 |
| | $ | (3,126 | ) | | $ | 47,192 |
| | $ | (613 | ) |
| Japan | 16,939 |
| | 488 |
| | 2,156 |
| | 6,150 |
| | 25,733 |
| | (1,894 | ) | | 23,839 |
| | 6,760 |
|
| Canada | 6,197 |
| | 7,298 |
| | 1,772 |
| | 5,074 |
| | 20,341 |
| | (1,365 | ) | | 18,976 |
| | 3,082 |
|
| France | 6,723 |
| | 6,295 |
| | 1,332 |
| | 4,616 |
| | 18,966 |
| | (2,675 | ) | | 16,291 |
| | 4,504 |
|
| India | 8,696 |
| | 604 |
| | 342 |
| | 4,330 |
| | 13,972 |
| | (254 | ) | | 13,718 |
| | 2,444 |
|
| Brazil | 8,251 |
| | 494 |
| | 517 |
| | 3,617 |
| | 12,879 |
| | (376 | ) | | 12,503 |
| | 4,548 |
|
| Germany | 4,407 |
| | 5,392 |
| | 3,008 |
| | 3,334 |
| | 16,141 |
| | (5,121 | ) | | 11,020 |
| | 6,020 |
|
| Netherlands | 6,177 |
| | 2,257 |
| | 614 |
| | 2,850 |
| | 11,898 |
| | (1,216 | ) | | 10,682 |
| | 6,054 |
|
| Singapore | 3,003 |
| | 5,112 |
| | 434 |
| | 1,725 |
| | 10,274 |
| | (100 | ) | | 10,174 |
| | 4,379 |
|
| Australia | 4,816 |
| | 2,905 |
| | 646 |
| | 2,109 |
| | 10,476 |
| | (747 | ) | | 9,729 |
| | 578 |
|
| China | 6,864 |
| | 329 |
| | 707 |
| | 2,382 |
| | 10,282 |
| | (1,095 | ) | | 9,187 |
| | 634 |
|
| South Korea | 4,766 |
| | 691 |
| | 319 |
| | 2,618 |
| | 8,394 |
| | (1,245 | ) | | 7,149 |
| | (735 | ) |
| Switzerland | 2,476 |
| | 3,199 |
| | 509 |
| | 605 |
| | 6,789 |
| | (969 | ) | | 5,820 |
| | 1,450 |
|
| Hong Kong | 3,770 |
| | 550 |
| | 147 |
| | 1,084 |
| | 5,551 |
| | (108 | ) | | 5,443 |
| | 735 |
|
| Russian Federation | 3,187 |
| | 1,398 |
| | 87 |
| | 678 |
| | 5,350 |
| | (438 | ) | | 4,912 |
| | 3,297 |
|
| Italy | 2,858 |
| | 2,825 |
| | 2,295 |
| | 521 |
| | 8,499 |
| | (3,661 | ) | | 4,838 |
| | (17 | ) |
| Mexico | 2,335 |
| | 596 |
| | 181 |
| | 1,080 |
| | 4,192 |
| | (533 | ) | | 3,659 |
| | 567 |
|
| Taiwan | 2,012 |
| | 64 |
| | 159 |
| | 999 |
| | 3,234 |
| | (12 | ) | | 3,222 |
| | 445 |
|
| United Arab Emirates | 2,134 |
| | 412 |
| | 186 |
| | 116 |
| | 2,848 |
| | (96 | ) | | 2,752 |
| | 1,217 |
|
| Spain | 1,899 |
| | 1,018 |
| | 192 |
| | 604 |
| | 3,713 |
| | (1,059 | ) | | 2,654 |
| | 117 |
|
| Total top 20 non-U.S. countries exposure | $ | 126,330 |
| | $ | 52,520 |
| | $ | 20,426 |
| | $ | 50,574 |
| | $ | 249,850 |
| | $ | (26,090 | ) | | $ | 223,760 |
| | $ | 45,466 |
|
| |
(1)
| There is no generally accepted definition of emerging markets. The definition that we use includes all countries in Asia Pacific excluding Japan, Australia and New Zealand; all countries in Latin America excluding Cayman Islands and Bermuda; all countries in Middle East and Africa; and all countries in Central and Eastern Europe. At December 31, 2011 and 2010, there was $1.7 billion and $460 million in emerging market exposure accounted for under the fair value option.
|
| |
(2)
| Includes acceptances, due froms, SBLCs, commercial letters of credit and formal guarantees. |
| |
(3)
| Derivative assets are carried at fair value and have been reduced by the amount of cash collateral applied of $1.2 billion at both December 31, 2011 and 2010. At December 31, 2011 and 2010, there were $353 million and $408 million of other marketable securities collateralizing derivative assets.
|
| |
(4)
| Generally, cross-border resale agreements are presented based on the domicile of the counterparty, consistent with FFIEC reporting requirements. Cross-border resale agreements where the underlying securities are U.S. Treasury securities, in which case the domicile is the U.S., are excluded from this presentation. |
| |
(5)
| Cross-border exposure includes amounts payable to the Corporation by borrowers or counterparties with a country of residence other than the one in which the credit is booked, regardless of the currency in which the claim is denominated, consistent with FFIEC reporting requirements. |
| |
(6)
| Local country exposure includes amounts payable to the Corporation by borrowers with a country of residence in which the credit is booked regardless of the currency in which the claim is denominated. Local funding or liabilities are subtracted from local exposures consistent with FFIEC reporting requirements. Total amount of available local liabilities funding local country exposure was $18.7 billion and $15.7 billion at December 31, 2011 and 2010. Local liabilities at December 31, 2011 in Asia Pacific, Latin America, and Middle East and Africa were $17.3 billion, $1.0 billion and $278 million, respectively, of which $9.2 billion was in Singapore, $2.3 billion in China, $2.2 billion in Hong Kong, $1.3 billion in India, $973 million in Mexico and $804 million in Korea. There were no other countries with available local liabilities funding local country exposure greater than $500 million.
|
| |
(7)
| No country included in Other Asia Pacific, Other Latin America, Other Middle East and Africa, and Other Central and Eastern Europe had total non-U.S. exposure of more than $500 million.
|
|
| | |
106 Bank of America 20112012 | | |
At December 31, 2011 and 2010, 60 percent and 70 percent of our emerging markets exposure was in Asia Pacific. Emerging markets exposure in Asia Pacific decreased by $8.5 billion driven by a $19.0 billion decrease related to the sale of CCB shares, partially offset by increases in loans and securities predominately in India, China (excluding CCB) and South Korea.
At December 31, 2011 and 2010, 26 percent and 21 percent of our emerging markets exposure was in Latin America. Latin America emerging markets exposure increased$2.5 billion driven by increases in securities and local exposure in Brazil.
At December 31, 2011 and 2010, eight percent and six percent of our emerging markets exposure was in Middle East and Africa, with an increase of $926 million primarily driven by increases in loans and derivatives in United Arab Emirates, and by increases in loans in Other Middle East and Africa. At December 31, 2011 and 2010, six percent and three percent of the emerging markets exposure was in Central and Eastern Europe, with the increase driven by an increase in loans in the Russian Federation.
Certain European countries, including Greece, Ireland, Italy, Portugal and Spain, have experienced varying degrees of financial stress.stress in recent years. Risks from the continuedongoing debt crisis in Europethese countries could continue to disrupt the financial markets which could have a detrimental impact on global economic conditions and sovereign and non-sovereign debt in these countries. UncertaintyIn the fourth quarter of 2012, European policymakers continued to make incremental progress toward greater fiscal and monetary unity; however, fundamental issues of competitiveness, growth and fiscal solvency remain as challenges. As a result, volatility is expected to continue. We expect to continue to support client activities in the progress of debt restructuring negotiationsregion and our exposures may vary over time as we monitor the lack of a clear resolution to the crisis have led to continued volatility in European financial markets, as well as global financial markets. In December 2011, the ECB announced initiatives to address European bank liquiditysituation and funding concerns by providing low-cost, three-year loans to banks, and expanding collateral eligibility. In early 2012, S&P, Fitch and Moody’s downgraded the credit ratings of several European countries, and S&P downgraded the credit rating of the EFSF, adding to concerns about investor appetite for continued support in stabilizing the affected countries.manage our risk profile.
Table 5457 showspresents our direct sovereign and non-sovereign exposures excluding consumer credit card exposure, in these countries at December 31, 20112012. Our total sovereign and non-sovereign exposure to these countries was $15.314.5 billion at December 31, 2012 compared to $15.2 billion at December 31, 2011 compared to $16.6 billion at December 31, 2010.. The total exposure to these countries, net of all hedges, was
$10.59.5 billion at December 31, 2012 compared to $10.3 billion at December 31, 2011 compared to $12.4 billion at December 31, 2010, of which $252280 million and $91362 million was total sovereign exposure. At December 31, 20112012 and 2010,2011, the fair value of nethedges and credit default protection purchased, net of credit default protection sold, was$5.1 billion and $4.9 billion and $4.2 billion..
We hedge certain of our selected European country exposure with credit default protection in the form of CDS.
|
| | | | | | | | | | | | | | | | | | | | | | | | | | | | | | | | |
| | | | | | | | | | | | | | | | | |
| Table 57 | Select European Countries |
| | | | | | | | | | | | | | | | | |
| (Dollars in millions) | Funded Loans and Loan Equivalents | | Unfunded Loan Commitments | | Net Counterparty Exposure (1) | | Securities/Other Investments (2) | | Country Exposure at December 31
2012 | | Hedges and Credit Default Protection (3) | | Net Country Exposure at December 31 2012 | | Increase (Decrease) from December 31
2011 |
| Greece | |
| | |
| | |
| | |
| | |
| | |
| | |
| | |
| Sovereign | $ | — |
| | $ | — |
| | $ | — |
| | $ | 2 |
| | $ | 2 |
| | $ | — |
| | $ | 2 |
| | $ | (27 | ) |
| Financial institutions | — |
| | — |
| | — |
| | 6 |
| | 6 |
| | (11 | ) | | (5 | ) | | (2 | ) |
| Corporates | 173 |
| | 139 |
| | 19 |
| | 2 |
| | 333 |
| | (24 | ) | | 309 |
| | (125 | ) |
| Total Greece | $ | 173 |
| | $ | 139 |
| | $ | 19 |
| | $ | 10 |
| | $ | 341 |
| | $ | (35 | ) | | $ | 306 |
| | $ | (154 | ) |
| Ireland | |
| | |
| | |
| | |
| | |
| | |
| | |
| | |
| Sovereign | $ | 19 |
| | $ | — |
| | $ | 27 |
| | $ | 22 |
| | $ | 68 |
| | $ | (10 | ) | | $ | 58 |
| | $ | (63 | ) |
| Financial institutions | 437 |
| | 31 |
| | 106 |
| | 40 |
| | 614 |
| | (22 | ) | | 592 |
| | (206 | ) |
| Corporates | 587 |
| | 300 |
| | 32 |
| | 33 |
| | 952 |
| | (23 | ) | | 929 |
| | (566 | ) |
| Total Ireland | $ | 1,043 |
| | $ | 331 |
| | $ | 165 |
| | $ | 95 |
| | $ | 1,634 |
| | $ | (55 | ) | | $ | 1,579 |
| | $ | (835 | ) |
| Italy | |
| | |
| | |
| | |
| | |
| | |
| | |
| | |
| Sovereign | $ | 14 |
| | $ | — |
| | $ | 1,843 |
| | $ | 58 |
| | $ | 1,915 |
| | $ | (1,885 | ) | | $ | 30 |
| | $ | (184 | ) |
| Financial institutions | 1,373 |
| | 18 |
| | 200 |
| | 85 |
| | 1,676 |
| | (599 | ) | | 1,077 |
| | (654 | ) |
| Corporates | 1,471 |
| | 2,807 |
| | 252 |
| | 378 |
| | 4,908 |
| | (1,177 | ) | | 3,731 |
| | 821 |
|
| Total Italy | $ | 2,858 |
| | $ | 2,825 |
| | $ | 2,295 |
| | $ | 521 |
| | $ | 8,499 |
| | $ | (3,661 | ) | | $ | 4,838 |
| | $ | (17 | ) |
| Portugal | |
| | |
| | |
| | |
| | |
| | |
| | |
| | |
| Sovereign | $ | — |
| | $ | — |
| | $ | 31 |
| | $ | ��� |
| | $ | 31 |
| | $ | (68 | ) | | $ | (37 | ) | | $ | (28 | ) |
| Financial institutions | 4 |
| | — |
| | 1 |
| | 49 |
| | 54 |
| | (16 | ) | | 38 |
| | 34 |
|
| Corporates | 194 |
| | 43 |
| | 4 |
| | 8 |
| | 249 |
| | (164 | ) | | 85 |
| | 24 |
|
| Total Portugal | $ | 198 |
| | $ | 43 |
| | $ | 36 |
| | $ | 57 |
| | $ | 334 |
| | $ | (248 | ) | | $ | 86 |
| | $ | 30 |
|
| Spain | |
| | |
| | |
| | |
| | |
| | |
| | |
| | |
| Sovereign | $ | 35 |
| | $ | — |
| | $ | 64 |
| | $ | 182 |
| | $ | 281 |
| | $ | (54 | ) | | $ | 227 |
| | $ | 220 |
|
| Financial institutions | 42 |
| | 7 |
| | 69 |
| | 162 |
| | 280 |
| | (122 | ) | | 158 |
| | (504 | ) |
| Corporates | 1,822 |
| | 1,011 |
| | 59 |
| | 260 |
| | 3,152 |
| | (883 | ) | | 2,269 |
| | 401 |
|
| Total Spain | $ | 1,899 |
| | $ | 1,018 |
| | $ | 192 |
| | $ | 604 |
| | $ | 3,713 |
| | $ | (1,059 | ) | | $ | 2,654 |
| | $ | 117 |
|
| Total | |
| | |
| | |
| | |
| | |
| | |
| | |
| | |
| Sovereign | $ | 68 |
| | $ | — |
| | $ | 1,965 |
| | $ | 264 |
| | $ | 2,297 |
| | $ | (2,017 | ) | | $ | 280 |
| | $ | (82 | ) |
| Financial institutions | 1,856 |
| | 56 |
| | 376 |
| | 342 |
| | 2,630 |
| | (770 | ) | | 1,860 |
| | (1,332 | ) |
| Corporates | 4,247 |
| | 4,300 |
| | 366 |
| | 681 |
| | 9,594 |
| | (2,271 | ) | | 7,323 |
| | 555 |
|
| Total select European exposure | $ | 6,171 |
| | $ | 4,356 |
| | $ | 2,707 |
| | $ | 1,287 |
| | $ | 14,521 |
| | $ | (5,058 | ) | | $ | 9,463 |
| | $ | (859 | ) |
| |
(1) | Net counterparty exposure includes the fair value of derivatives including the counterparty risk associated with credit default protection and secured financing transactions. Derivatives are presented net of $3.1 billion in collateral, predominantly in cash, pledged under legally enforceable netting agreements. Secured financing transactions are presented net of eligible cash or securities pledged. The notional amount of reverse repurchase transactions was $1.3 billion at December 31, 2012. Counterparty exposure is not presented net of hedges or credit default protection. |
| |
(2) | Long securities exposures have been netted on a single-name basis to, but not below, zero by short positions of $6.5 billion and net CDS purchased of $1.8 billion, consisting of $2.0 billion of net single-name CDS purchased and $207 million of net index and tranched CDS sold. |
| |
(3) | Represents credit default protection purchased, net of credit default protection sold, which is used to mitigate the Corporation’s risk to country exposures as listed, including $2.7 billion, consisting of $3.0 billion in net single-name CDS purchased and $346 million in net index and tranched CDS sold, to hedge loans and securities, $2.3 billion in additional credit default protection purchased to hedge derivative assets and $60 million in other short positions. |
The majority of our CDS contracts on reference assets in Greece, Ireland, Italy, Portugal and Spain are with highly-rated financial institutions primarily outside of the Eurozone and we work to limit or eliminate correlated CDS. Due to our engagement in market-making activities, our CDS portfolio contains contracts with various maturities to a diverse set of counterparties. We work to
In addition
limit mismatches in maturities between our exposures and the CDS we use to our direct sovereignhedge them. However, there may be instances where the protection purchased has a different maturity from the exposure for which the protection was purchased, in which case, those exposures and non-sovereign exposures, a significant deteriorationhedges are subject to more active monitoring and management.
Table 58 presents the notional and fair value amounts of single-name CDS purchased and sold on reference assets in Greece, Ireland, Italy, Portugal and Spain. Table 58 includes only single-name CDS netted at the European debt crisis could result in material reductions incounterparty level, whereas, Table 57 includes single-name, indexed and tranched CDS positions netted by the value of sovereign debtreference asset that they are intended to hedge; therefore, CDS purchased and other asset classes, disruptions in capital markets, widening of credit spreads, loss of investor confidence in the financial services industry, a slowdown in global economic activity and other adverse developments. For additionalsold information on the debt crisis in Europe, see Item 1A. Risk Factors.is not comparable between tables.
|
| | | | | | | | | | | | | | | | |
| | | | | | | | | |
| Table 58 | Single-Name CDS with Reference Assets in Greece, Ireland, Italy, Portugal and Spain (1) |
| | | | | | | | | |
| | | December 31, 2012 |
| | | Notional | | Fair Value |
| (Dollars in billions) | Purchased | | Sold | | Purchased | | Sold |
| Greece | | | | | | | |
| Aggregate | $ | 1.8 |
| | $ | 1.7 |
| | $ | 0.2 |
| | $ | 0.2 |
|
After legally netting (2) | 0.4 |
| | 0.4 |
| | 0.1 |
| | 0.1 |
|
| Ireland | | | | | | | |
| Aggregate | 3.0 |
| | 2.8 |
| | 0.2 |
| | 0.2 |
|
After legally netting (2) | 1.4 |
| | 1.2 |
| | 0.1 |
| | 0.1 |
|
| Italy | | | | | | | |
| Aggregate | 47.4 |
| | 42.1 |
| | 3.5 |
| | 2.8 |
|
After legally netting (2) | 11.0 |
| | 5.7 |
| | 1.3 |
| | 0.5 |
|
| Portugal | | | | | | | |
| Aggregate | 8.1 |
| | 8.0 |
| | 0.5 |
| | 0.5 |
|
After legally netting (2) | 1.3 |
| | 1.2 |
| | 0.1 |
| | 0.1 |
|
| Spain | | | | | | | |
| Aggregate | 22.7 |
| | 22.3 |
| | 1.0 |
| | 1.0 |
|
After legally netting (2) | 4.0 |
| | 3.7 |
| | 0.2 |
| | 0.2 |
|
| |
(1) | The majority of our CDS contracts on reference assets in Greece, Ireland, Italy, Portugal and Spain are primarily with non-Eurozone counterparties. |
| |
(2) | Amounts listed are after consideration of legally enforceable counterparty master netting agreements. |
Losses could still result even if there is credit default protection purchased because the purchased credit protection contracts only pay out under certain scenarios and thus not all losses may be covered by the credit protection contracts. The effectiveness of our CDS protection as a hedge of these risks is influenced by a number of factors, including the contractual terms of the CDS.
Generally, only the occurrence of a credit event as defined by the CDS terms (which may include, among other events, the failure to pay by, or restructuring of, the reference entity) results in a payment under the purchased credit protection contracts. The determination as to whether a credit event has occurred is made by the relevant International Swaps and Derivatives Association, Inc. (ISDA) Determination Committee (comprised of various ISDA member firms) based on the terms of the CDS and facts and circumstances for the event. Accordingly, uncertainties exist as to whether any particular strategy or policy action for addressing the European debt crisis would constitute a credit event under the CDS. A voluntary restructuring may not trigger a credit event under CDS terms and consequently may not trigger a payment under the CDS contract.
In addition to our direct sovereign and non-sovereign exposures, a significant deterioration of the European debt crisis could result in material reductions in the value of sovereign debt and other asset classes, disruptions in capital markets, widening of credit spreads of U.S. and other financial institutions, loss of investor confidence in the financial services industry, a slowdown in global economic activity and other adverse developments. For additional information on the debt crisis in Europe, see Item 1A. Risk Factors. |
| | |
| | Bank of America107Table 59 presents countries where total cross-border exposure exceeded one percent of our total assets. Cross-border exposures are calculated using FFIEC guidelines and not our internal risk management view; therefore, exposures are not comparable between tables. Exposure includes cross-border claims by our non-U.S. offices including loans, acceptances, time deposits placed, trading account assets, securities, derivative assets, other interest-earning investments and other monetary assets. Amounts also include unfunded commitments, letters of credit and financial guarantees, and the notional value of cash lent under secured financing transactions. Sector definitions are consistent with FFIEC reporting requirements for preparing the Country Exposure Report. At December 31, 2012, the United Kingdom, France and Canada were the only countries where total cross-border exposure exceeded one percent of our total assets. No other countries had exposure exceeding 0.75 percent of our total assets.
|
|
| | | | | | | | | | | | | | | | | | | | | | | | | | | | | | | | |
| | | | | | | | | | | | | | | | | |
| Table 54 | Selected European Countries |
| | | | | | | | | | | | | | | | | |
| (Dollars in millions) | Funded Loans and Loan Equivalents (1) | | Unfunded Loan Commitments | | Derivative Assets (2) | | Securities/Other Investments (3) | | Country Exposure at December 31, 2011 | | Hedges and Credit Default Protection (4) | | Net Country Exposure at December 31, 2011 (5) | | Increase (Decrease) from December 31, 2010( |
| Greece | |
| | |
| | |
| | |
| | |
| | |
| | |
| | |
| Sovereign | $ | 1 |
| | $ | — |
| | $ | — |
| | $ | 34 |
| | $ | 35 |
| | $ | (6 | ) | | $ | 29 |
| | $ | (69 | ) |
| Financial Institutions | — |
| | — |
| | 3 |
| | 10 |
| | 13 |
| | (19 | ) | | (6 | ) | | (31 | ) |
| Corporates | 322 |
| | 97 |
| | 33 |
| | 7 |
| | 459 |
| | (25 | ) | | 434 |
| | 62 |
|
| Total Greece | $ | 323 |
| | $ | 97 |
| | $ | 36 |
| | $ | 51 |
| | $ | 507 |
| | $ | (50 | ) | | $ | 457 |
| | $ | (38 | ) |
| Ireland | |
| | |
| | |
| | |
| | |
| | |
| | |
| | |
| Sovereign | $ | 18 |
| | $ | — |
| | $ | 12 |
| | $ | 24 |
| | $ | 54 |
| | $ | (1 | ) | | $ | 53 |
| | $ | (357 | ) |
| Financial Institutions | 120 |
| | 20 |
| | 173 |
| | 470 |
| | 783 |
| | (33 | ) | | 750 |
| | (36 | ) |
| Corporates | 1,235 |
| | 154 |
| | 100 |
| | 57 |
| | 1,546 |
| | (35 | ) | | 1,511 |
| | (474 | ) |
| Total Ireland | $ | 1,373 |
| | $ | 174 |
| | $ | 285 |
| | $ | 551 |
| | $ | 2,383 |
| | $ | (69 | ) | | $ | 2,314 |
| | $ | (867 | ) |
| Italy | |
| | |
| | |
| | |
| | |
| | |
| | |
| | |
| Sovereign | $ | — |
| | $ | — |
| | $ | 1,542 |
| | $ | 29 |
| | $ | 1,571 |
| | $ | (1,399 | ) | | $ | 172 |
| | $ | 206 |
|
| Financial Institutions | 2,077 |
| | 76 |
| | 139 |
| | 83 |
| | 2,375 |
| | (705 | ) | | 1,670 |
| | (567 | ) |
| Corporates | 1,560 |
| | 1,813 |
| | 541 |
| | 259 |
| | 4,173 |
| | (1,181 | ) | | 2,992 |
| | 790 |
|
| Total Italy | $ | 3,637 |
| | $ | 1,889 |
| | $ | 2,222 |
| | $ | 371 |
| | $ | 8,119 |
| | $ | (3,285 | ) | | $ | 4,834 |
| | $ | 429 |
|
| Portugal | |
| | |
| | |
| | |
| | |
| | |
| | |
| | |
| Sovereign | $ | — |
| | $ | — |
| | $ | 41 |
| | $ | — |
| | $ | 41 |
| | $ | (50 | ) | | $ | (9 | ) | | $ | 49 |
|
| Financial Institutions | 34 |
| | — |
| | 2 |
| | 35 |
| | 71 |
| | (80 | ) | | (9 | ) | | (354 | ) |
| Corporates | 159 |
| | 73 |
| | 21 |
| | 15 |
| | 268 |
| | (207 | ) | | 61 |
| | 19 |
|
| Total Portugal | $ | 193 |
| | $ | 73 |
| | $ | 64 |
| | $ | 50 |
| | $ | 380 |
| | $ | (337 | ) | | $ | 43 |
| | $ | (286 | ) |
| Spain | |
| | |
| | |
| | |
| | |
| | |
| | |
| | |
| Sovereign | $ | 74 |
| | $ | 6 |
| | $ | 71 |
| | $ | 2 |
| | $ | 153 |
| | $ | (146 | ) | | $ | 7 |
| | $ | 332 |
|
| Financial Institutions | 459 |
| | 7 |
| | 143 |
| | 487 |
| | 1,096 |
| | (138 | ) | | 958 |
| | (958 | ) |
| Corporates | 1,586 |
| | 871 |
| | 112 |
| | 121 |
| | 2,690 |
| | (835 | ) | | 1,855 |
| | (588 | ) |
| Total Spain | $ | 2,119 |
| | $ | 884 |
| | $ | 326 |
| | $ | 610 |
| | $ | 3,939 |
| | $ | (1,119 | ) | | $ | 2,820 |
| | $ | (1,214 | ) |
| Total | |
| | |
| | |
| | |
| | |
| | |
| | |
| | |
| Sovereign | $ | 93 |
| | $ | 6 |
| | $ | 1,666 |
| | $ | 89 |
| | $ | 1,854 |
| | $ | (1,602 | ) | | $ | 252 |
| | $ | 161 |
|
| Financial Institutions | 2,690 |
| | 103 |
| | 460 |
| | 1,085 |
| | 4,338 |
| | (975 | ) | | 3,363 |
| | (1,946 | ) |
| Corporates | 4,862 |
| | 3,008 |
| | 807 |
| | 459 |
| | 9,136 |
| | (2,283 | ) | | 6,853 |
| | (191 | ) |
| Total selected European exposure | $ | 7,645 |
| | $ | 3,117 |
| | $ | 2,933 |
| | $ | 1,633 |
| | $ | 15,328 |
| | $ | (4,860 | ) | | $ | 10,468 |
| | $ | (1,976 | ) |
|
| | | | | | | | | | | | | | | | | | | | | |
| | | | | | | | | | | | | |
| Table 59 | Total Cross-border Exposure Exceeding One Percent of Total Assets |
| | | | | | | | | | | | | |
| (Dollars in millions) | December 31 | | Public Sector | | Banks | | Private Sector | | Cross-border
Exposure | | Exposure as a
Percentage of
Total Assets |
| United Kingdom | 2012 | | $ | 95 |
| | $ | 5,656 |
| | $ | 31,595 |
| | $ | 37,346 |
| | 1.69 | % |
| | 2011 | | 6,401 |
| | 4,424 |
| | 18,056 |
| | 28,881 |
| | 1.36 |
|
France (1) | 2012 | | 2,556 |
| | 3,215 |
| | 17,639 |
| | 23,410 |
| | 1.06 |
|
Canada (2) | 2012 | | 1,325 |
| | 3,314 |
| | 18,427 |
| | 23,066 |
| | 1.04 |
|
| |
(1) | Includes loans, leases, overdrafts, acceptances, due froms, SBLCs, commercial letters of credit and formal guarantees, which have not been reduced by collateral, hedges or credit default protection. Previously classified local exposures are no longer offset by local liabilities, which totaled $939 million at At December 31, 2011. Of the $939 million previously applied2011, total cross-border exposure for exposure reduction, $562 millionFrance was in Ireland, $217 million in Italy, $126 million in Spain and $34 million in Greece.$16.1 billion, representing 0.75 percent of total assets. |
| |
(2) | Derivative assets are carried at fair value and have been reduced by the amount of cash collateral applied of $3.5 billion at December 31, 2011. At December 31, 2011 there, total cross-border exposure for Canada was $83 million$16.9 billion, representing 0.79 percent of other marketable securities collateralizing derivativetotal assets. Derivative assets have not been reduced by hedges or credit default protection. |
| |
(3)
| Includes $369 million in notional value of reverse repurchase agreements, which are presented based on the domicile of the counterparty consistent with FFIEC reporting requirements. Cross-border resale agreements where the underlying collateral is U.S. Treasury securities are excluded from this presentation. Securities exposures are reduced by hedges and short positions on a single-name basis to, but not less than zero. |
| |
(4)
| Represents the fair value of credit default protection purchased, including $(3.4) billion in net credit default protection purchased to hedge loans and securities, $(1.4) billion in additional credit default protection to hedge derivative assets and $(74) million in other short positions. |
| |
(5)
| Represents country exposure less the fair value of hedges and credit default protection. |
Provision for Credit Losses
The provision for credit losses decreased$15.0 billion to $13.4 billion for 2011 compared to 2010. The provision for credit losses was $7.4 billion lower than net charge-offs for 2011, resulting in a reduction in the allowance for credit losses driven primarily by lower delinquencies, improved collection rates and fewer bankruptcy filings across the Card Services portfolio, and improvement in overall credit quality in the commercial real estate portfolio partially offset by additions to consumer PCI loan portfolio reserves. This compared to a $5.9 billion reduction in the allowance for credit losses in 2010.
The provision for credit losses for the consumer portfolio decreased $11.1 billion to $14.3 billion for 2011 compared to 2010 reflecting improving economic conditions and improvement in the current and projected levels of delinquencies, collections and bankruptcies in the U.S. consumer credit card and unsecured consumer lending portfolios. Also contributing to the decrease
were lower credit costs in the non-PCI home equity loan portfolio due to improving portfolio trends, partially offset by higher credit costs in the residential mortgage portfolio primarily reflecting further deterioration in home prices. For the consumer PCI loan portfolios, updates to our expected cash flows resulted in an increase in reserves of $2.2 billion in 2011 due primarily to our updated home price outlook. Reserve increases related to the consumer PCI loan portfolios in 2010 were also $2.2 billion.
The provision for credit losses for the commercial portfolio, including the provision for unfunded lending commitments, decreased $3.9 billion to a benefit of $915 million in 2011 compared to 2010 due to continued economic improvement and the resulting impact on property values in the commercial real estate portfolio, lower current and projected levels of delinquencies and bankruptcies in the U.S. small business commercial portfolio and improvement in borrower credit profiles across the remainder of the commercial portfolio.
|
| | |
108 Bank of America 20112012 | | |
Provision for Credit Losses
The provision for credit losses decreased$5.2 billion to $8.2 billion for 2012 compared to 2011. The provision for credit losses was $6.7 billion lower than net charge-offs for 2012, resulting in a reduction in the allowance for credit losses due to improved portfolio trends and increasing home prices in the consumer real estate portfolios, lower bankruptcy filings and delinquencies affecting the Card Services portfolio, and improvement in overall credit quality within the core commercial portfolio (total commercial products excluding U.S. small business). Absent unexpected deterioration in the economy, we expect reductions in the allowance for credit losses, excluding the valuation allowance for PCI loans, to continue in the near term, though at a slower pace than in 2012.
The provision for credit losses for the consumer portfolio decreased$6.4 billion to $8.0 billion for 2012 compared to 2011. The improvement was primarily in the consumer real estate loan portfolios due to improved portfolio trends and an improved home price outlook in our PCI portfolios. The provision for credit losses related to the PCI loan portfolios was a provision benefit of $103 million in 2012 as the home price outlook improved, compared to a provision expense of $2.2 billion in 2011.
The provision for credit losses for the commercial portfolio, including the unfunded lending commitments, increased$1.1 billion to $197 million in 2012 compared to 2011 due to stabilization of credit quality, loan growth and a higher volume of loan resolutions in the prior year, all within the core commercial portfolio.
Allowance for Credit Losses
Allowance for Loan and Lease Losses
The allowance for loan and lease losses is comprised of two components,components. The first component covers nonperforming commercial loans and TDRs. The second component covers loans and leases on which there are incurred losses that are not yet individually identifiable, as described below.well as incurred losses that may not be represented in the loss forecast models. We evaluate the adequacy of the allowance for loan and lease losses based on the total of these two components.components, each of which is described in more detail below. The allowance for loan and lease losses excludes LHFS and loans accounted for under the fair value option as the fair value reflects a credit risk component.
The first component of the allowance for loan and lease losses covers both the nonperforming commercial loans and performing commercial loans that have been modified in a TDR, consumer real estate loans that have been modified in a TDR, renegotiated credit card, and renegotiated unsecuredall TDRs within the consumer and small business loans.commercial portfolios. These loans are subject to impairment measurement based on the present value of expectedprojected future cash flows discounted at the loan’s original effective interest rate, or in certain circumstances, impairment may also be based upon the collateral value or the loan’s observable market price if available. Impairment measurement for the renegotiated credit card, unsecured consumer and small business TDR portfolios is based on the present value of projected cash flows discounted using the average portfolio contractual interest rate, excluding promotionally priced loans, in effect prior to restructuring and prior to any risk-based or penalty-based increase in rate on the restructured loans.restructuring. For purposes of computing this specific loss component of the allowance, larger impaired loans are evaluated individually and smaller impaired loans are evaluated as a pool using historical loss experience for the respective product types and risk ratings of the loans.
The second component of the allowance for loan and lease
losses covers the remaining consumer and commercial loans and leases that have incurred losses butwhich are not yet individually identifiable. The allowance for consumer and certain homogeneous commercial loan and lease products is based on aggregated portfolio evaluations, generally by product type. Loss forecast models are utilized that consider a variety of factors including, but not limited to, historical loss experience, estimated defaults or foreclosures based on portfolio trends, delinquencies, economic trends and credit scores. Our consumer real estate loss forecast model estimates the portion of loans that will default based on individual loan attributes, the most significant of which are refreshed LTV or CLTV, and borrower credit score as well as vintage and geography, all of which are further broken down into current delinquency status. Additionally, we incorporate the delinquency status of underlying first-lien loans on our junior-lien home equity portfolio in our allowance process. Incorporating refreshed LTV and CLTV into our probability of default allows us to factor the impact of changes in home prices into our allowance for loan and lease losses. These loss forecast models are updated on a quarterly basis to incorporate information reflecting the current economic environment. As of December 31, 20112012, the loss forecast process resulted in reductions in the allowance for mostall major consumer portfolios, particularly the credit card and direct/indirect portfolios.
The allowance for commercial loan and lease losses is established by product type after analyzing historical loss experience by internal risk rating, current economic conditions, industry performance trends, geographic and obligor concentrations within each portfolio and any other pertinent information. The statistical models for commercial loans are generally updated annually and utilize our historical database of actual defaults and other data. The loan risk ratings and composition of the commercial portfolios used to calculate the allowance are updated at least
quarterly to incorporate the most recent data reflecting the current economic environment. For risk-rated commercial loans, we estimate the probability of default and the LGD based on our historical experience of defaults and credit losses. Factors considered when assessing the internal risk rating include the value of the underlying collateral, if applicable, the industry in which the obligor operates, the obligor’s liquidity and other financial indicators, and other quantitative and qualitative factors relevant to the obligor’s credit risk. When estimating the allowance for loan and lease losses, management relies not only on models derived from historical experience but also on its judgment in considering the effect on probable losses inherent in the portfolios due to the current macroeconomic environment and trends, inherent uncertainty in models and other qualitative factors. As of December 31, 20112012, updates to the loan risk ratings and portfolio composition resulted in reductions in the allowance for allthe commercial real estate, U.S. commercial and commercial lease financing portfolios.
Also included within thisthe second component of the allowance for loan and lease losses and determined separately from the procedures outlined above are reserves to cover losses that are maintainedincurred but, in our assessment, may not be adequately represented in the historical loss data used in the loss forecast models. For example, factors that we consider include, among others, changes in lending policies and procedures, changes in economic and business conditions, changes in the nature and size of the portfolio, changes in the volume and severity of past due loans and nonaccrual loans and the effect of external factors such as competition, and legal and regulatory requirements. We also consider factors that are applicable to coverunique portfolio segments. For example, we consider the risk of uncertainty in our loss forecasting models related to junior-lien home equity loans that are current, but have first-lien loans that we do not service that are 30 days or more past due. In addition, we consider the inherent uncertainty in mathematical models that are built upon historical data.
During 2012, the factors that impacted the allowance for loan and lease losses included significant overall improvements in the credit quality of the portfolios driven by improvements in the U.S. economy and labor markets, proactive credit risk management initiatives and the impact of recent higher credit quality originations. Additionally, the resolution of uncertainties through current recognition of net charge-offs, specifically in the home loans portfolios, has impacted the amount of reserve needed in that affectportfolio. Evidencing the improvements in the U.S. economy and labor markets are modest growth in consumer spending, improvements in unemployment levels, a decrease in the absolute level and our estimateshare of probable losses including domesticnational consumer bankruptcy filings, a rise in both residential building activity and global economic uncertainty, large single name defaults, significant events which could disruptoverall home prices. In addition to these improvements, paydowns, charge-offs and returns to performing status and upgrades out of criticized continued to outpace new nonaccrual consumer loans and reservable criticized commercial loans, but such loans remained elevated relative to levels experienced prior to the financial markets and model imprecision.crisis.
We monitor differences between estimated and actual incurred loan and lease losses. This monitoring process includes periodic assessments by senior management of loan and lease portfolios and the models used to estimate incurred losses in those portfolios.
Additions to, or reductions of, the allowance for loan and lease losses generally are recorded through charges or credits to the provision for credit losses. Credit exposures deemed to be uncollectible are charged against the allowance for loan and lease losses. Recoveries of previously charged off amounts are credited to the allowance for loan and lease losses.
The allowance for loan and lease losses for the consumer portfolio, as presented in Table 5661, was $29.621.1 billion at December 31, 20112012, a decrease of $5.18.6 billion from December 31, 20102011. ThisThe decrease in the home equity and residential mortgage allowance was primarily driven by improved delinquencies and home prices as evidenced by improving LTV statistics as presented in Tables 25 and 27. In addition, the home equity allowance declined due to reduced exposures to current junior-lien loans that we estimate had a first-lien loan that was 90 days or more past due. Also, the home equity allowance related to the PCI portfolio declined $2.7 billion primarily due to improving economic conditions and improvementthe
forgiveness of fully reserved home equity loans in connection with the National Mortgage Settlement.
The decrease in the current and projected levels of delinquencies, collections and bankruptcies inallowance related to the U.S. consumer credit card and unsecured consumer lending portfolios. With respect to the consumer PCI loan portfolios updates to our expected cash flows resulted in an increase in reserves through provision of $2.2 billion in 2011CBB, within the discontinued real estate, home equity and residential mortgage portfolios, was primarily due to our updated home price outlook. Reserve increases relatedimprovement in delinquencies and bankruptcies. For example, in the U.S. credit card portfolio, accruing loans 30 days or more past due decreased to the consumer PCI loan portfolios in 2010$2.7 billion were also $2.2 billion.at December 31, 2012 from $3.8 billion (to 2.90 percent from 3.74 percent of outstanding U.S. credit card loans) at December 31, 2011, and accruing loans 90 days or more past due decreased to $1.4 billion at December 31, 2012 from $2.1 billion (to 1.52 percent from 2.02 percent of outstanding U.S. credit card loans) over the same period. See Tables 22, 23, 25, 27, 33 and 35 for additional details on key consumer credit statistics.
The allowance for loan and lease losses for the commercial portfolio as presented in Table 61was $4.13.1 billion at December 31, 20112012, a decrease of $3.01.0 billiondecrease from December 31, 20102011. The decrease was driven by continued improvement in the economy andcredit quality of the resulting impact on property values incore commercial portfolio. For example, the commercial real estate portfolio, improvement in projected delinquencies in the U.S. small businessutilized reservable criticized exposure decreased to $15.9 billion at December 31, 2012 from $27.2 billion (to 4.10 percent from 7.41 percent of total commercial portfolio, mostly withinutilized reservable exposure) at Card ServicesDecember 31, 2011. Similarly, nonperforming commercial loans declined to $3.2 billion at December 31, 2012 from $6.3 billion (to 0.93 percent from 2.04 percent of outstanding commercial loans) at December 31, 2011. See Tables 39, and stronger borrower credit profiles in the U.S. commercial portfolios, primarily in Global Commercial Banking40 and GBAM42. for additional details on key commercial credit statistics.
The allowance for loan and lease losses as a percentage of total loans and leases outstanding was 2.69 percent at December 31, 2012 compared to 3.68 percent at December 31, 2011 compared to 4.47 percent at December 31, 2010. The decrease in the ratio was largely due to improved credit quality anddriven by improved economic conditions and the home equity PCI loans that were forgiven which led to the reduction in the
allowance for credit losses discussed above. The December 31, 20112012 and 20102011 ratios above include the PCI loan portfolio. Excluding the PCI loan portfolio, the allowance for loan and lease losses as a percentage of total loans and leases outstanding was 2.14 percent at December 31, 2012 compared to 2.86 percent at December 31, 2011 compared to 3.94 percent at December 31, 2010.
Absent unexpected deterioration in the economy, we expect
reductions in the allowance for loan and lease losses to continue in |
| | |
110 Bank of America 2012. However, in both consumer and commercial portfolios, we expect these reductions to be less than those in 2011 and 2010. | | |
Table 5560 presents a rollforward of the allowance for credit losses for 20112012 and 20102011.
| | | | | | | | | | | |
| Table 55 | Allowance for Credit Losses | | | | |
| Table 60 | | Allowance for Credit Losses | | | |
| | | | | | | | | |
| (Dollars in millions) | (Dollars in millions) | 2011 | | 2010 | (Dollars in millions) | 2012 | | 2011 |
Allowance for loan and lease losses, January 1 (1) | Allowance for loan and lease losses, January 1 (1) | $ | 41,885 |
| | $ | 47,988 |
| Allowance for loan and lease losses, January 1 (1) | $ | 33,783 |
| | $ | 41,885 |
|
| Loans and leases charged off | Loans and leases charged off | | | | Loans and leases charged off | | | |
| Residential mortgage | Residential mortgage | (4,195 | ) | | (3,779 | ) | Residential mortgage | (3,211 | ) | | (4,195 | ) |
| Home equity | Home equity | (4,990 | ) | | (7,059 | ) | Home equity | (4,566 | ) | | (4,990 | ) |
| Discontinued real estate | Discontinued real estate | (106 | ) | | (77 | ) | Discontinued real estate | (72 | ) | | (106 | ) |
| U.S. credit card | U.S. credit card | (8,114 | ) | | (13,818 | ) | U.S. credit card | (5,360 | ) | | (8,114 | ) |
| Non-U.S. credit card | Non-U.S. credit card | (1,691 | ) | | (2,424 | ) | Non-U.S. credit card | (835 | ) | | (1,691 | ) |
| Direct/Indirect consumer | Direct/Indirect consumer | (2,190 | ) | | (4,303 | ) | Direct/Indirect consumer | (1,258 | ) | | (2,190 | ) |
| Other consumer | Other consumer | (252 | ) | | (320 | ) | Other consumer | (274 | ) | | (252 | ) |
| Total consumer charge-offs | Total consumer charge-offs | (21,538 | ) | | (31,780 | ) | Total consumer charge-offs | (15,576 | ) | | (21,538 | ) |
U.S. commercial (2)(1) | U.S. commercial (2)(1) | (1,690 | ) | | (3,190 | ) | U.S. commercial (2)(1) | (1,309 | ) | | (1,690 | ) |
| Commercial real estate | Commercial real estate | (1,298 | ) | | (2,185 | ) | Commercial real estate | (719 | ) | | (1,298 | ) |
| Commercial lease financing | Commercial lease financing | (61 | ) | | (96 | ) | Commercial lease financing | (32 | ) | | (61 | ) |
| Non-U.S. commercial | Non-U.S. commercial | (155 | ) | | (139 | ) | Non-U.S. commercial | (36 | ) | | (155 | ) |
| Total commercial charge-offs | Total commercial charge-offs | (3,204 | ) | | (5,610 | ) | Total commercial charge-offs | (2,096 | ) | | (3,204 | ) |
| Total loans and leases charged off | Total loans and leases charged off | (24,742 | ) | | (37,390 | ) | Total loans and leases charged off | (17,672 | ) | | (24,742 | ) |
| Recoveries of loans and leases previously charged off | Recoveries of loans and leases previously charged off | | | | Recoveries of loans and leases previously charged off | | | |
| Residential mortgage | Residential mortgage | 363 |
| | 109 |
| Residential mortgage | 158 |
| | 363 |
|
| Home equity | Home equity | 517 |
| | 278 |
| Home equity | 329 |
| | 517 |
|
| Discontinued real estate | Discontinued real estate | 14 |
| | 9 |
| Discontinued real estate | 9 |
| | 14 |
|
| U.S. credit card | U.S. credit card | 838 |
| | 791 |
| U.S. credit card | 728 |
| | 838 |
|
| Non-U.S. credit card | Non-U.S. credit card | 522 |
| | 217 |
| Non-U.S. credit card | 254 |
| | 522 |
|
| Direct/Indirect consumer | Direct/Indirect consumer | 714 |
| | 967 |
| Direct/Indirect consumer | 495 |
| | 714 |
|
| Other consumer | Other consumer | 50 |
| | 59 |
| Other consumer | 42 |
| | 50 |
|
| Total consumer recoveries | Total consumer recoveries | 3,018 |
| | 2,430 |
| Total consumer recoveries | 2,015 |
| | 3,018 |
|
U.S. commercial (3)(2) | U.S. commercial (3)(2) | 500 |
| | 391 |
| U.S. commercial (3)(2) | 368 |
| | 500 |
|
| Commercial real estate | Commercial real estate | 351 |
| | 168 |
| Commercial real estate | 335 |
| | 351 |
|
| Commercial lease financing | Commercial lease financing | 37 |
| | 39 |
| Commercial lease financing | 38 |
| | 37 |
|
| Non-U.S. commercial | Non-U.S. commercial | 3 |
| | 28 |
| Non-U.S. commercial | 8 |
| | 3 |
|
| Total commercial recoveries | Total commercial recoveries | 891 |
| | 626 |
| Total commercial recoveries | 749 |
| | 891 |
|
| Total recoveries of loans and leases previously charged off | Total recoveries of loans and leases previously charged off | 3,909 |
| | 3,056 |
| Total recoveries of loans and leases previously charged off | 2,764 |
| | 3,909 |
|
| Net charge-offs | Net charge-offs | (20,833 | ) | | (34,334 | ) | Net charge-offs | (14,908 | ) | | (20,833 | ) |
| Provision for loan and lease losses | Provision for loan and lease losses | 13,629 |
| | 28,195 |
| Provision for loan and lease losses | 8,310 |
| | 13,629 |
|
Other (4) | (898 | ) | | 36 |
| |
| Write-offs of home equity PCI loans | | Write-offs of home equity PCI loans | (2,820 | ) | | — |
|
Other (3) | | Other (3) | (186 | ) | | (898 | ) |
| Allowance for loan and lease losses, December 31 | Allowance for loan and lease losses, December 31 | 33,783 |
| | 41,885 |
| Allowance for loan and lease losses, December 31 | 24,179 |
| | 33,783 |
|
| Reserve for unfunded lending commitments, January 1 | Reserve for unfunded lending commitments, January 1 | 1,188 |
| | 1,487 |
| Reserve for unfunded lending commitments, January 1 | 714 |
| | 1,188 |
|
| Provision for unfunded lending commitments | Provision for unfunded lending commitments | (219 | ) | | 240 |
| Provision for unfunded lending commitments | (141 | ) | | (219 | ) |
Other (5) | (255 | ) | | (539 | ) | |
Other (4) | | Other (4) | (60 | ) | | (255 | ) |
| Reserve for unfunded lending commitments, December 31 | Reserve for unfunded lending commitments, December 31 | 714 |
| | 1,188 |
| Reserve for unfunded lending commitments, December 31 | 513 |
| | 714 |
|
| Allowance for credit losses, December 31 | Allowance for credit losses, December 31 | $ | 34,497 |
| | $ | 43,073 |
| Allowance for credit losses, December 31 | $ | 24,692 |
| | $ | 34,497 |
|
| |
(1) | TheIncludes U.S. small business commercial charge-offs of 2010$799 million balance includesand $10.81.1 billion of allowance for loanin 2012 and lease losses related to the adoption of new consolidation guidance.2011.
|
| |
(2) | Includes U.S. small business commercial charge-offsrecoveries of $1.1 billion100 million and $2.0 billion106 million in 20112012 and 20102011. |
| |
(3) | Includes U.S. small business commercial recoveriesPrimarily represents the net impact of $106 millionportfolio sales, consolidations and $107 million in 2011deconsolidations, and 2010.
|
| |
(4)
| The foreign currency translation adjustments. In addition, the 2011 amount includes a $449 million reduction in the allowance for loan and lease losses related to Canadian consumer card loans that were transferred to LHFS.
|
| |
(5)(4)
| The 2011 and 2010 amounts primarily representPrimarily represents accretion of the Merrill Lynch purchase accounting adjustment and the impact of funding previously unfunded positions.
|
|
| | |
| | 110Bank of America 20112012111
| | |
| | | | | | | | | | | |
| Table 55 | Allowance for Credit Losses (continued) | | | | |
| Table 60 | | Allowance for Credit Losses (continued) | | | |
| | | | | | | | | |
| (Dollars in millions) | (Dollars in millions) | 2011 | | 2010 | (Dollars in millions) | 2012 | | 2011 |
| Loan and allowance ratios: | Loan and allowance ratios: | | | | Loan and allowance ratios: | | | |
Loans and leases outstanding at December 31 (5) | Loans and leases outstanding at December 31 (5) | $ | 917,396 |
| | $ | 937,119 |
| Loans and leases outstanding at December 31 (5) | $ | 898,817 |
| | $ | 917,396 |
|
Allowance for loan and lease losses as a percentage of total loans and leases and outstanding at December 31 (5) | Allowance for loan and lease losses as a percentage of total loans and leases and outstanding at December 31 (5) | 3.68 | % | | 4.47 | % | Allowance for loan and lease losses as a percentage of total loans and leases and outstanding at December 31 (5) | 2.69 | % | | 3.68 | % |
Consumer allowance for loan and lease losses as a percentage of total consumer loans outstanding at December 31 (6) | Consumer allowance for loan and lease losses as a percentage of total consumer loans outstanding at December 31 (6) | 4.88 |
| | 5.40 |
| Consumer allowance for loan and lease losses as a percentage of total consumer loans outstanding at December 31 (6) | 3.81 |
| | 4.88 |
|
Commercial allowance for loan and lease losses as a percentage of total commercial loans and leases outstanding at December 31 (7) | Commercial allowance for loan and lease losses as a percentage of total commercial loans and leases outstanding at December 31 (7) | 1.33 |
| | 2.44 |
| Commercial allowance for loan and lease losses as a percentage of total commercial loans and leases outstanding at December 31 (7) | 0.90 |
| | 1.33 |
|
Average loans and leases outstanding (5) | Average loans and leases outstanding (5) | $ | 929,661 |
| | $ | 954,278 |
| Average loans and leases outstanding (5) | $ | 890,337 |
| | $ | 929,661 |
|
Net charge-offs as a percentage of average loans and leases outstanding (5) | 2.24 | % | | 3.60 | % | |
Allowance for loan and lease losses as a percentage of total nonperforming loans and leases at December 31 (5, 8) | 135 |
| | 136 |
| |
| Ratio of the allowance for loan and lease losses at December 31 to net charge-offs | 1.62 |
| | 1.22 |
| |
Amounts included in allowance for loan and lease losses that are excluded from nonperforming loans and leases at December 31 (9) | $ | 17,490 |
| | $ | 22,908 |
| |
Allowance for loan and lease losses as a percentage of total nonperforming loans and leases excluding amounts included in the allowance for loan and lease losses that are excluded from nonperforming loans and leases at December 31 (9) | 65 | % | | 62 | % | |
| Loan and allowance ratios excluding purchased credit-impaired loans: | |
| | | |
Net charge-offs as a percentage of average loans and leases outstanding (5, 8) | | Net charge-offs as a percentage of average loans and leases outstanding (5, 8) | 1.67 | % | | 2.24 | % |
Net charge-offs and PCI write-offs as a percentage of average loans and leases outstanding (5, 9) | | Net charge-offs and PCI write-offs as a percentage of average loans and leases outstanding (5, 9) | 1.99 |
| | 2.24 |
|
Allowance for loan and lease losses as a percentage of total nonperforming loans and leases at December 31 (5, 10) | | Allowance for loan and lease losses as a percentage of total nonperforming loans and leases at December 31 (5, 10) | 107 |
| | 135 |
|
Ratio of the allowance for loan and lease losses at December 31 to net charge-offs (8) | | Ratio of the allowance for loan and lease losses at December 31 to net charge-offs (8) | 1.62 |
| | 1.62 |
|
Ratio of the allowance for loan and lease losses at December 31 to net charge-offs and PCI write-offs (9) | | Ratio of the allowance for loan and lease losses at December 31 to net charge-offs and PCI write-offs (9) | 1.36 |
| | 1.62 |
|
Amounts included in the allowance for loan and lease losses that are excluded from nonperforming loans and leases at December 31 (11) | | Amounts included in the allowance for loan and lease losses that are excluded from nonperforming loans and leases at December 31 (11) | $ | 12,021 |
| | $ | 17,490 |
|
Allowance for loan and lease losses as a percentage of total nonperforming loans and leases excluding amounts included in the allowance for loan and lease losses that are excluded from nonperforming loans and leases at December 31 (11) | | Allowance for loan and lease losses as a percentage of total nonperforming loans and leases excluding amounts included in the allowance for loan and lease losses that are excluded from nonperforming loans and leases at December 31 (11) | 54 | % | | 65 | % |
Loan and allowance ratios excluding PCI loans and the related valuation allowance: (12) | | Loan and allowance ratios excluding PCI loans and the related valuation allowance: (12) | |
| | |
Allowance for loan and lease losses as a percentage of total loans and leases outstanding at December 31 (5) | Allowance for loan and lease losses as a percentage of total loans and leases outstanding at December 31 (5) | 2.86 | % | | 3.94 | % | Allowance for loan and lease losses as a percentage of total loans and leases outstanding at December 31 (5) | 2.14 | % | | 2.86 | % |
Consumer allowance for loan and lease losses as a percentage of total consumer loans outstanding at December 31 (6) | Consumer allowance for loan and lease losses as a percentage of total consumer loans outstanding at December 31 (6) | 3.68 |
| | 4.66 |
| Consumer allowance for loan and lease losses as a percentage of total consumer loans outstanding at December 31 (6) | 2.95 |
| | 3.68 |
|
Commercial allowance for loan and lease losses as a percentage of total commercial loans and leases outstanding at December 31 (7) | 1.33 |
| | 2.44 |
| |
Net charge-offs as a percentage of average loans and leases outstanding (5) | Net charge-offs as a percentage of average loans and leases outstanding (5) | 2.32 |
| | 3.73 |
| Net charge-offs as a percentage of average loans and leases outstanding (5) | 1.73 |
| | 2.32 |
|
Allowance for loan and lease losses as a percentage of total nonperforming loans and leases at December 31 (5, 8) | 101 |
| | 116 |
| |
Allowance for loan and lease losses as a percentage of total nonperforming loans and leases at December 31 (5, 10) | | Allowance for loan and lease losses as a percentage of total nonperforming loans and leases at December 31 (5, 10) | 82 |
| | 101 |
|
| Ratio of the allowance for loan and lease losses at December 31 to net charge-offs | Ratio of the allowance for loan and lease losses at December 31 to net charge-offs | 1.22 |
| | 1.04 |
| Ratio of the allowance for loan and lease losses at December 31 to net charge-offs | 1.25 |
| | 1.22 |
|
| |
(5) | Outstanding loan and lease balances and ratios do not include loans accounted for under the fair value option. Loans accounted for under the fair value option were $8.89.0 billion and $3.38.8 billion at December 31, 20112012 and 20102011. Average loans accounted for under the fair value option were $8.4 billion andin both $4.1 billion in 20112012 and 20102011. |
| |
(6) | Excludes consumer loans accounted for under the fair value option of $1.0 billion and $2.2 billion at December 31, 2012 and 2011. There were no consumer loans accounted for under the fair value option at December 31, 2010. |
| |
(7) | Excludes commercial loans accounted for under the fair value option of $6.68.0 billion and $3.36.6 billion at December 31, 20112012 and 20102011. |
| |
(8) | Net charge-offs exclude $2.8 billion of write-offs in the Countrywide home equity PCI loan portfolio for 2012. These write-offs decreased the PCI valuation allowance included as part of the allowance for loan and lease losses. For information on PCI write-offs, see Countrywide Purchased Credit-impaired Loan Portfolio on page 90. |
| |
(9) | There were no write-offs of PCI loans in 2011. |
| |
(10) | For more information on our definition of nonperforming loans, see pages 9293 and 100101. |
| |
(9)(11)
| Primarily includes amounts allocated to U.S. credit card and unsecured consumer lending portfolios in Card ServicesCBB portfolios,, PCI loans and the non-U.S. credit card portfolio in All Other. |
| |
(12) | For more information on the PCI loan portfolio and the valuation allowance for PCI loans, see Note 5 – Outstanding Loans and Leases and Note 6 – Allowance for Credit Lossesto the Consolidated Financial Statements. |
For reporting purposes, we allocate the allowance for credit losses across products. However, the allowance is generally available to absorb any credit losses without restriction. Table 5661 presents our allocation by product type.
| | | | | | | | | | | | | | | | | | | | | | | | | | | |
| Table 56 | Allocation of the Allowance for Credit Losses by Product Type | |
| Table 61 | | Allocation of the Allowance for Credit Losses by Product Type |
| | | | | | | | | |
| | | December 31, 2011 | | December 31, 2010 | | December 31, 2012 | | December 31, 2011 |
| (Dollars in millions) | (Dollars in millions) | Amount | | Percent of Total | | Percent of
Loans and
Leases Outstanding (1) | | Amount | | Percent of Total | | Percent of
Loans and
Leases Outstanding (1) | (Dollars in millions) | Amount | | Percent of Total | | Percent of
Loans and
Leases Outstanding (1) | | Amount | | Percent of Total | | Percent of
Loans and
Leases Outstanding (1) |
| Allowance for loan and lease losses | Allowance for loan and lease losses | |
| | |
| | |
| | |
| | |
| | |
| Allowance for loan and lease losses | |
| | |
| | |
| | |
| | |
| | |
|
| Residential mortgage | Residential mortgage | $ | 5,935 |
| | 17.57 | % | | 2.26 | % | | $ | 5,082 |
| | 12.14 | % | | 1.97 | % | Residential mortgage | $ | 5,004 |
| | 20.69 | % | | 2.06 | % | | $ | 5,715 |
| | 16.92 | % | | 2.18 | % |
| Home equity | Home equity | 13,094 |
| | 38.76 |
| | 10.50 |
| | 12,887 |
| | 30.77 |
| | 9.34 |
| Home equity | 7,845 |
| | 32.45 |
| | 7.26 |
| | 13,094 |
| | 38.76 |
| | 10.50 |
|
| Discontinued real estate | Discontinued real estate | 2,050 |
| | 6.07 |
| | 18.48 |
| | 1,283 |
| | 3.06 |
| | 9.79 |
| Discontinued real estate | 2,084 |
| | 8.62 |
| | 21.07 |
| | 2,270 |
| | 6.72 |
| | 20.46 |
|
| U.S. credit card | U.S. credit card | 6,322 |
| | 18.71 |
| | 6.18 |
| | 10,876 |
| | 25.97 |
| | 9.56 |
| U.S. credit card | 4,718 |
| | 19.51 |
| | 4.97 |
| | 6,322 |
| | 18.71 |
| | 6.18 |
|
| Non-U.S. credit card | Non-U.S. credit card | 946 |
| | 2.80 |
| | 6.56 |
| | 2,045 |
| | 4.88 |
| | 7.45 |
| Non-U.S. credit card | 600 |
| | 2.48 |
| | 5.13 |
| | 946 |
| | 2.80 |
| | 6.56 |
|
| Direct/Indirect consumer | Direct/Indirect consumer | 1,153 |
| | 3.41 |
| | 1.29 |
| | 2,381 |
| | 5.68 |
| | 2.64 |
| Direct/Indirect consumer | 718 |
| | 2.97 |
| | 0.86 |
| | 1,153 |
| | 3.41 |
| | 1.29 |
|
| Other consumer | Other consumer | 148 |
| | 0.44 |
| | 5.50 |
| | 161 |
| | 0.38 |
| | 5.67 |
| Other consumer | 104 |
| | 0.43 |
| | 6.40 |
| | 148 |
| | 0.44 |
| | 5.50 |
|
| Total consumer | Total consumer | 29,648 |
| | 87.76 |
| | 4.88 |
| | 34,715 |
| | 82.88 |
| | 5.40 |
| Total consumer | 21,073 |
| | 87.15 |
| | 3.81 |
| | 29,648 |
| | 87.76 |
| | 4.88 |
|
U.S. commercial (2) | U.S. commercial (2) | 2,441 |
| | 7.23 |
| | 1.26 |
| | 3,576 |
| | 8.54 |
| | 1.88 |
| U.S. commercial (2) | 1,885 |
| | 7.80 |
| | 0.90 |
| | 2,441 |
| | 7.23 |
| | 1.26 |
|
| Commercial real estate | Commercial real estate | 1,349 |
| | 3.99 |
| | 3.41 |
| | 3,137 |
| | 7.49 |
| | 6.35 |
| Commercial real estate | 846 |
| | 3.50 |
| | 2.19 |
| | 1,349 |
| | 3.99 |
| | 3.41 |
|
| Commercial lease financing | Commercial lease financing | 92 |
| | 0.27 |
| | 0.42 |
| | 126 |
| | 0.30 |
| | 0.57 |
| Commercial lease financing | 78 |
| | 0.32 |
| | 0.33 |
| | 92 |
| | 0.27 |
| | 0.42 |
|
| Non-U.S. commercial | Non-U.S. commercial | 253 |
| | 0.75 |
| | 0.46 |
| | 331 |
| | 0.79 |
| | 1.03 |
| Non-U.S. commercial | 297 |
| | 1.23 |
| | 0.40 |
| | 253 |
| | 0.75 |
| | 0.46 |
|
Total commercial (3) | Total commercial (3) | 4,135 |
| | 12.24 |
| | 1.33 |
| | 7,170 |
| | 17.12 |
| | 2.44 |
| Total commercial (3) | 3,106 |
| | 12.85 |
| | 0.90 |
| | 4,135 |
| | 12.24 |
| | 1.33 |
|
| Allowance for loan and lease losses | Allowance for loan and lease losses | 33,783 |
| | 100.00 | % | | 3.68 |
| | 41,885 |
| | 100.00 | % | | 4.47 |
| Allowance for loan and lease losses | 24,179 |
| | 100.00 | % | | 2.69 |
| | 33,783 |
| | 100.00 | % | | 3.68 |
|
| Reserve for unfunded lending commitments | Reserve for unfunded lending commitments | 714 |
| | | | | | 1,188 |
| | |
| | |
| Reserve for unfunded lending commitments | 513 |
| | | | | | 714 |
| | |
| | |
|
Allowance for credit losses (4) | Allowance for credit losses (4) | $ | 34,497 |
| | | | | | $ | 43,073 |
| | |
| | |
| Allowance for credit losses (4) | $ | 24,692 |
| | | | | | $ | 34,497 |
| | |
| | |
|
| |
(1) | Ratios are calculated as allowance for loan and lease losses as a percentage of loans and leases outstanding excluding loans accounted for under the fair value option. Consumer loans accounted for under the fair value option included residential mortgage loans of $147 million and $906 million and discontinued real estate of $858 million and $1.3 billion at December 31, 2012 and 2011. There were no consumer loans accounted for under the fair value option at December 31, 2010. Commercial loans accounted for under the fair value option included U.S. commercial loans of $2.22.3 billion and $1.62.2 billion, and non-U.S. commercial loans of $4.45.7 billion and $1.74.4 billion and commercial real estate loans of $0 and $79 million at December 31, 20112012 and 20102011. |
| |
(2) | Includes allowance for loan and lease losses for U.S. small business commercial loans of $893642 million and $1.5 billion893 million at December 31, 20112012 and 20102011. |
| |
(3) | Includes allowance for loan and lease losses for impaired commercial loans of $545330 million and $1.1 billion545 million at December 31, 20112012 and 20102011. |
| |
(4) | Includes $8.55.5 billion and $6.48.5 billion of valuation reservesallowance presented with the allowance for credit losses related to PCI loans at December 31, 20112012 and 20102011. |
|
| | |
112 Bank of America 2012 | | Bank of America111
|
Reserve for Unfunded Lending Commitments
In addition to the allowance for loan and lease losses, we also estimate probable losses related to unfunded lending commitments such as letters of credit, financial guarantees, unfunded bankers’ acceptances and binding loan commitments, excluding commitments accounted for under the fair value option. Unfunded lending commitments are subject to the same assessment as funded loans, including estimates of probability of default and LGD. Due to the nature of unfunded commitments, the estimate of probable losses must also consider utilization. To estimate the portion of these undrawn commitments that is likely to be drawn by a borrower at the time of estimated default, analyses of the Corporation’s historical experience are applied to the unfunded commitments to estimate the funded EAD. The expected loss for unfunded lending commitments is the product of the probability of default, the LGD and the EAD, adjusted for any qualitative factors including economic uncertainty and inherent imprecision in models.
The reserve for unfunded lending commitments at December 31, 20112012 was $714513 million, $474201 million lower than December 31, 20102011 driven by improved credit quality in the unfunded portfolio and accretion of purchase accounting adjustments on acquired Merrill Lynch unfunded positions and improved credit quality in the unfunded portfolio.positions.
Market Risk Management
Market risk is the risk that values of assets and liabilities or revenues will be adversely affected by changes in market conditions. This risk is inherent in the financial instruments associated with our operations and/or activities including loans, deposits, securities, short-term borrowings, long-term debt, trading account assets and liabilities, and derivatives. Market-sensitive assets and liabilities are generated through loans and deposits associated with our traditional banking business, customer and other trading operations, the ALM process, credit risk mitigation activities and mortgage banking activities. In the event of market volatility, factors such as underlying market movements and liquidity have an impact on the results of the Corporation.
Our traditional banking loan and deposit products are nontrading positions and are generally reported at amortized cost for assets or the amount owed for liabilities (historical cost). However, these positions are still subject to changes in economic value based on varying market conditions, primarily changes in the levels of interest rates. The risk of adverse changes in the economic value of our nontrading positions is managed through our ALM activities. We have elected to account for certain assets and liabilities under the fair value option. For further information on the fair value of certain financial assets and liabilities, see Note 2221 – Fair Value Measurements to the Consolidated Financial Statements.
Our trading positions are reported at fair value with changes currently reflected in income. Trading positions are subject to various risk factors, which include exposures to interest rates and foreign exchange rates, as well as mortgage, equity, commodity, issuer, credit and market liquidity risk factors. We seek to mitigate these risk exposures by using techniques that encompass a variety of financial instruments in both the cash and derivatives markets. The following discusses the key risk components along with respective risk mitigation techniques.
Interest Rate Risk
Interest rate risk represents exposures to instruments whose values vary with the level or volatility of interest rates. These instruments include, but are not limited to, loans, debt securities, certain trading-related assets and liabilities, deposits, borrowings and derivatives. Hedging instruments used to mitigate these risks include derivatives such as options, futures, forwards and swaps.
Foreign Exchange Risk
Foreign exchange risk represents exposures to changes in the values of current holdings and future cash flows denominated in currencies other than the U.S. dollar. The types of instruments exposed to this risk include investments in non-U.S. subsidiaries, foreign currency-denominated loans and securities, future cash flows in foreign currencies arising from foreign exchange transactions, foreign currency-denominated debt and various foreign exchange derivatives whose values fluctuate with changes in the level or volatility of currency exchange rates or non-U.S. interest rates. Hedging instruments used to mitigate this risk include foreign exchange options, currency swaps, futures, forwards, foreign currency-denominated debt and deposits.
Mortgage Risk
Mortgage risk represents exposures to changes in the value of mortgage-related instruments. The values of these instruments are sensitive to prepayment rates, mortgage rates, agency debt ratings, default, market liquidity, government participation and interest rate volatility. Our exposure to these instruments takes several forms. First, we trade and engage in market-making activities in a variety of mortgage securities including whole loans, pass-through certificates, commercial mortgages and collateralized mortgage obligations including CDOs using mortgages as underlying collateral. Second, we originate a variety of MBS which involves the accumulation of mortgage-related loans in anticipation of eventual securitization. Third, we may hold positions in mortgage securities and residential mortgage loans as part of the ALM portfolio. Fourth, we create MSRs as part of our mortgage origination activities. See Note 1 – Summary of Significant Accounting Principles and Note 2524 – Mortgage Servicing Rights to the Consolidated Financial Statements for additional information on MSRs. Hedging instruments used to mitigate this risk include foreign exchangecontracts and derivatives such as options, currency swaps, futures forwards and foreign currency-denominated debt.forwards.
Equity Market Risk
Equity market risk represents exposures to securities that represent an ownership interest in a corporation in the form of domestic and foreign common stock or other equity-linked instruments. Instruments that would lead to this exposure include, but are not limited to, the following: common stock, exchange-traded funds, American Depositary Receipts, convertible bonds, listed equity options (puts and calls), OTC equity options, equity total return swaps, equity index futures and other equity derivative products. Hedging instruments used to mitigate this risk include options, futures, swaps, convertible bonds and cash positions.
|
| | |
| | 112Bank of America 20112012113
| | |
Commodity Risk
Commodity risk represents exposures to instruments traded in the petroleum, natural gas, power and metals markets. These instruments consist primarily of futures, forwards, swaps and options. Hedging instruments used to mitigate this risk include options, futures and swaps in the same or similar commodity product, as well as cash positions.
Issuer Credit Risk
Issuer credit risk represents exposures to changes in the creditworthiness of individual issuers or groups of issuers. Our portfolio is exposed to issuer credit risk where the value of an asset may be adversely impacted by changes in the levels of credit spreads, by credit migration or by defaults. Hedging instruments used to mitigate this risk include bonds, CDS and other credit fixed-income instruments.
Market Liquidity Risk
Market liquidity risk represents the risk that the level of expected market activity changes dramatically and, in certain cases, may even cease. This exposes us to the risk that we will not be able to transact business and execute trades in an orderly manner which may impact our results. This impact could be further be exacerbated if expected hedging or pricing correlations are compromised by disproportionate demand or lack of demand for certain instruments. We utilize various risk mitigating techniques as discussed in more detail in Trading Risk Management.
Trading Risk Management
Trading-related revenues represent the amount earned from trading positions, including market-based net interest income, which are taken in a diverse range of financial instruments and markets. Trading account assets and liabilities and derivative positions are reported at fair value. For more information on fair value, see Note 2221 – Fair Value Measurements to the Consolidated Financial Statements. Trading-related revenues can be volatile and are largely driven by general market conditions and customer demand. Also, trading-related revenues are dependent on the volume and type of transactions, the level of risk assumed, and the volatility of price and rate movements at any given time within the ever-changing market environment.
The Global Markets Risk Committee (GRC)(GMRC), chaired by the Global Markets Risk Executive, has been designated by ALMRC as the primary governance authority for global markets risk management including trading risk management. The GRC’sGMRC’s focus is to take a forward-looking view of the primary credit and market risks impacting GBAMGlobal Markets and prioritize those that need a proactive risk mitigation strategy. Market risks that impact businesses outside of GBAMGlobal Markets are monitored and governed by their respective governance authorities.
The GRCGMRC monitors significant daily revenues and losses by business and the primary drivers of the revenues or losses. Thresholds are in place for each of our businesses in order to determine if the revenue or loss is considered to be significant for that business. If any of the thresholds are exceeded, an explanation of the variance is provided to the GRC.GMRC. The thresholds are developed in coordination with the respective risk managers to highlight those revenues or losses that exceed what is considered to be normal daily income statement volatility.
|
| | |
114 Bank of America 2012 | | Bank of America113
|
The histogram below is a graphic depiction of trading volatility and illustrates the daily level of trading-related revenue for 20112012 and 20102011. During 20112012, positive trading-related revenue was recorded for 98 percent, or 243 of the 249 trading days of which 80 percent (199 days) were daily trading gains of over $25 million, less than one percent (1 day) of the trading days had losses greater
than $25 million and the largest loss was $50 million. This is compared to 2011, where positive trading-related revenue was recorded for 86 percent, (214 days)or 214 of the 250 trading days of which 66 percent (165 days) were daily trading gains of over $25 million, five percent (12 days) of the trading days had losses greater than
$25 $25 million and the largest loss was $119 million. This is compared to 2010, where positive trading-related revenue was recorded for 90 percent (225 days) of the trading days of which 75 percent (187 days) were daily trading gains of over $25 million, four percent (nine days) of the trading days had losses greater than $25 million and the largest loss was $102 million.
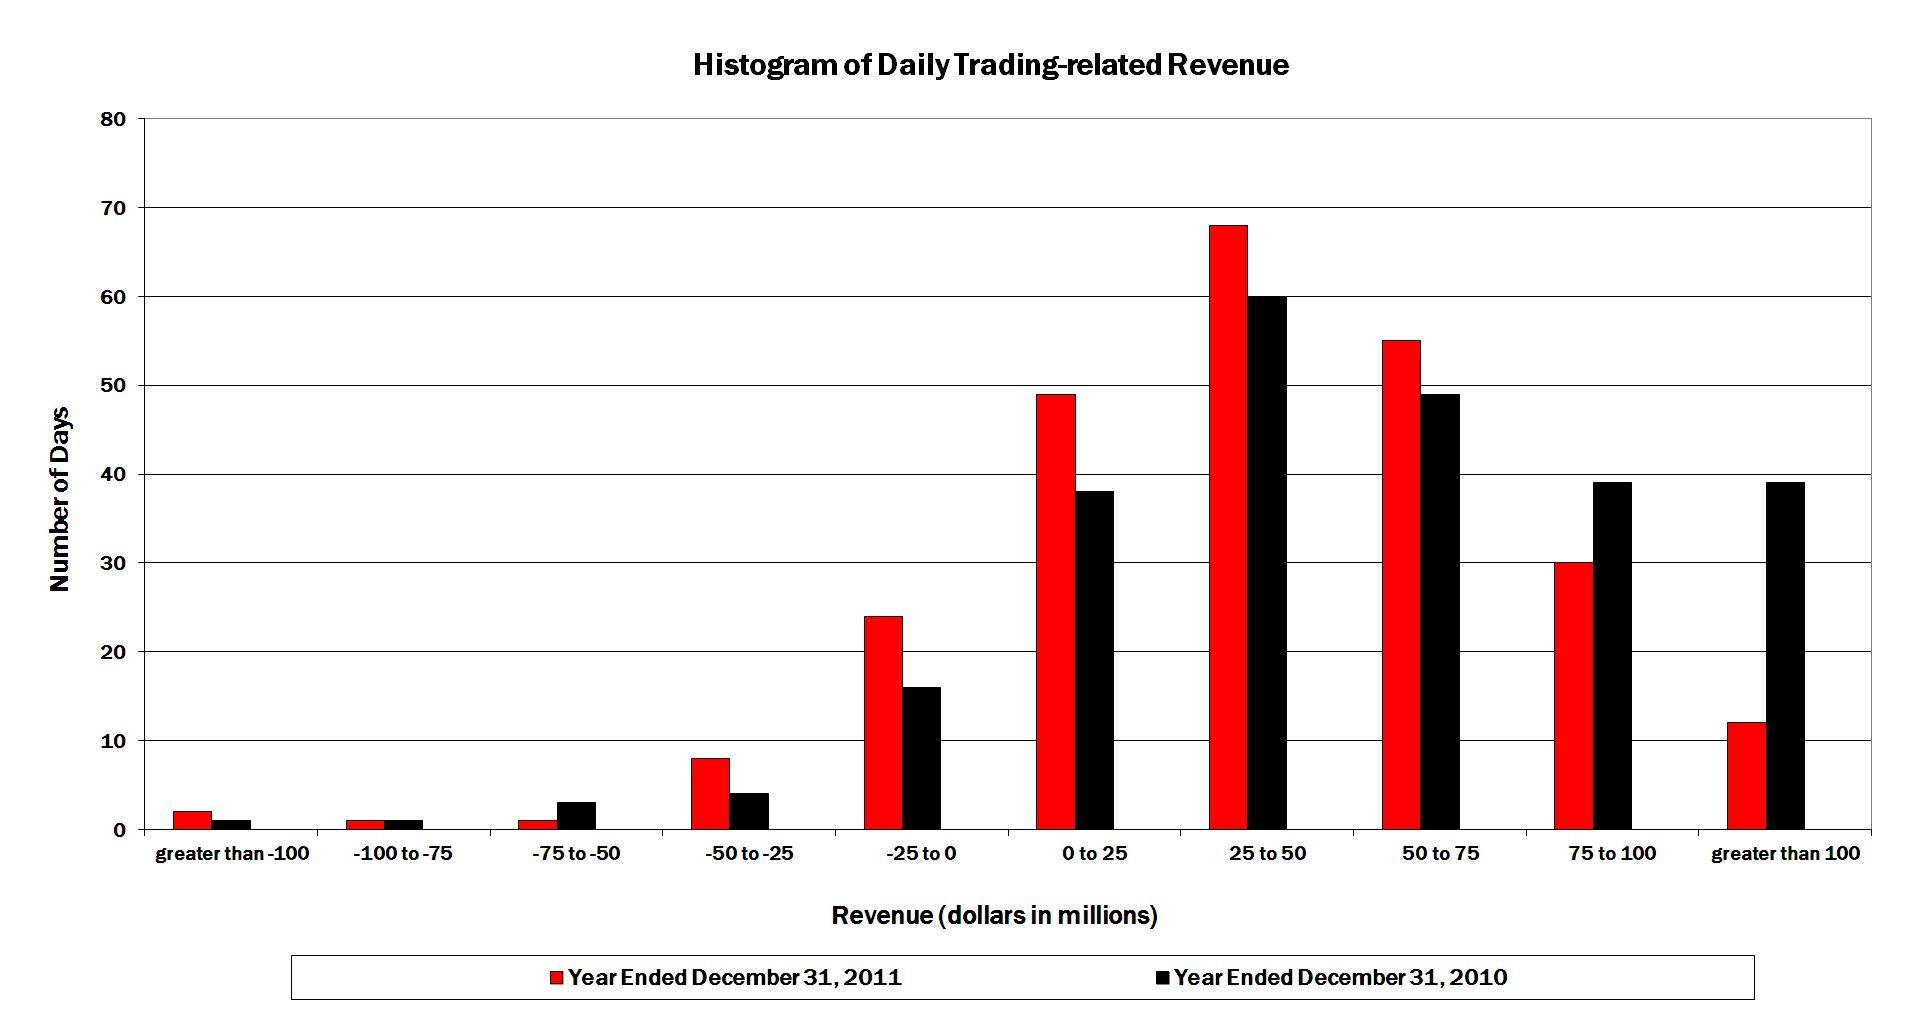
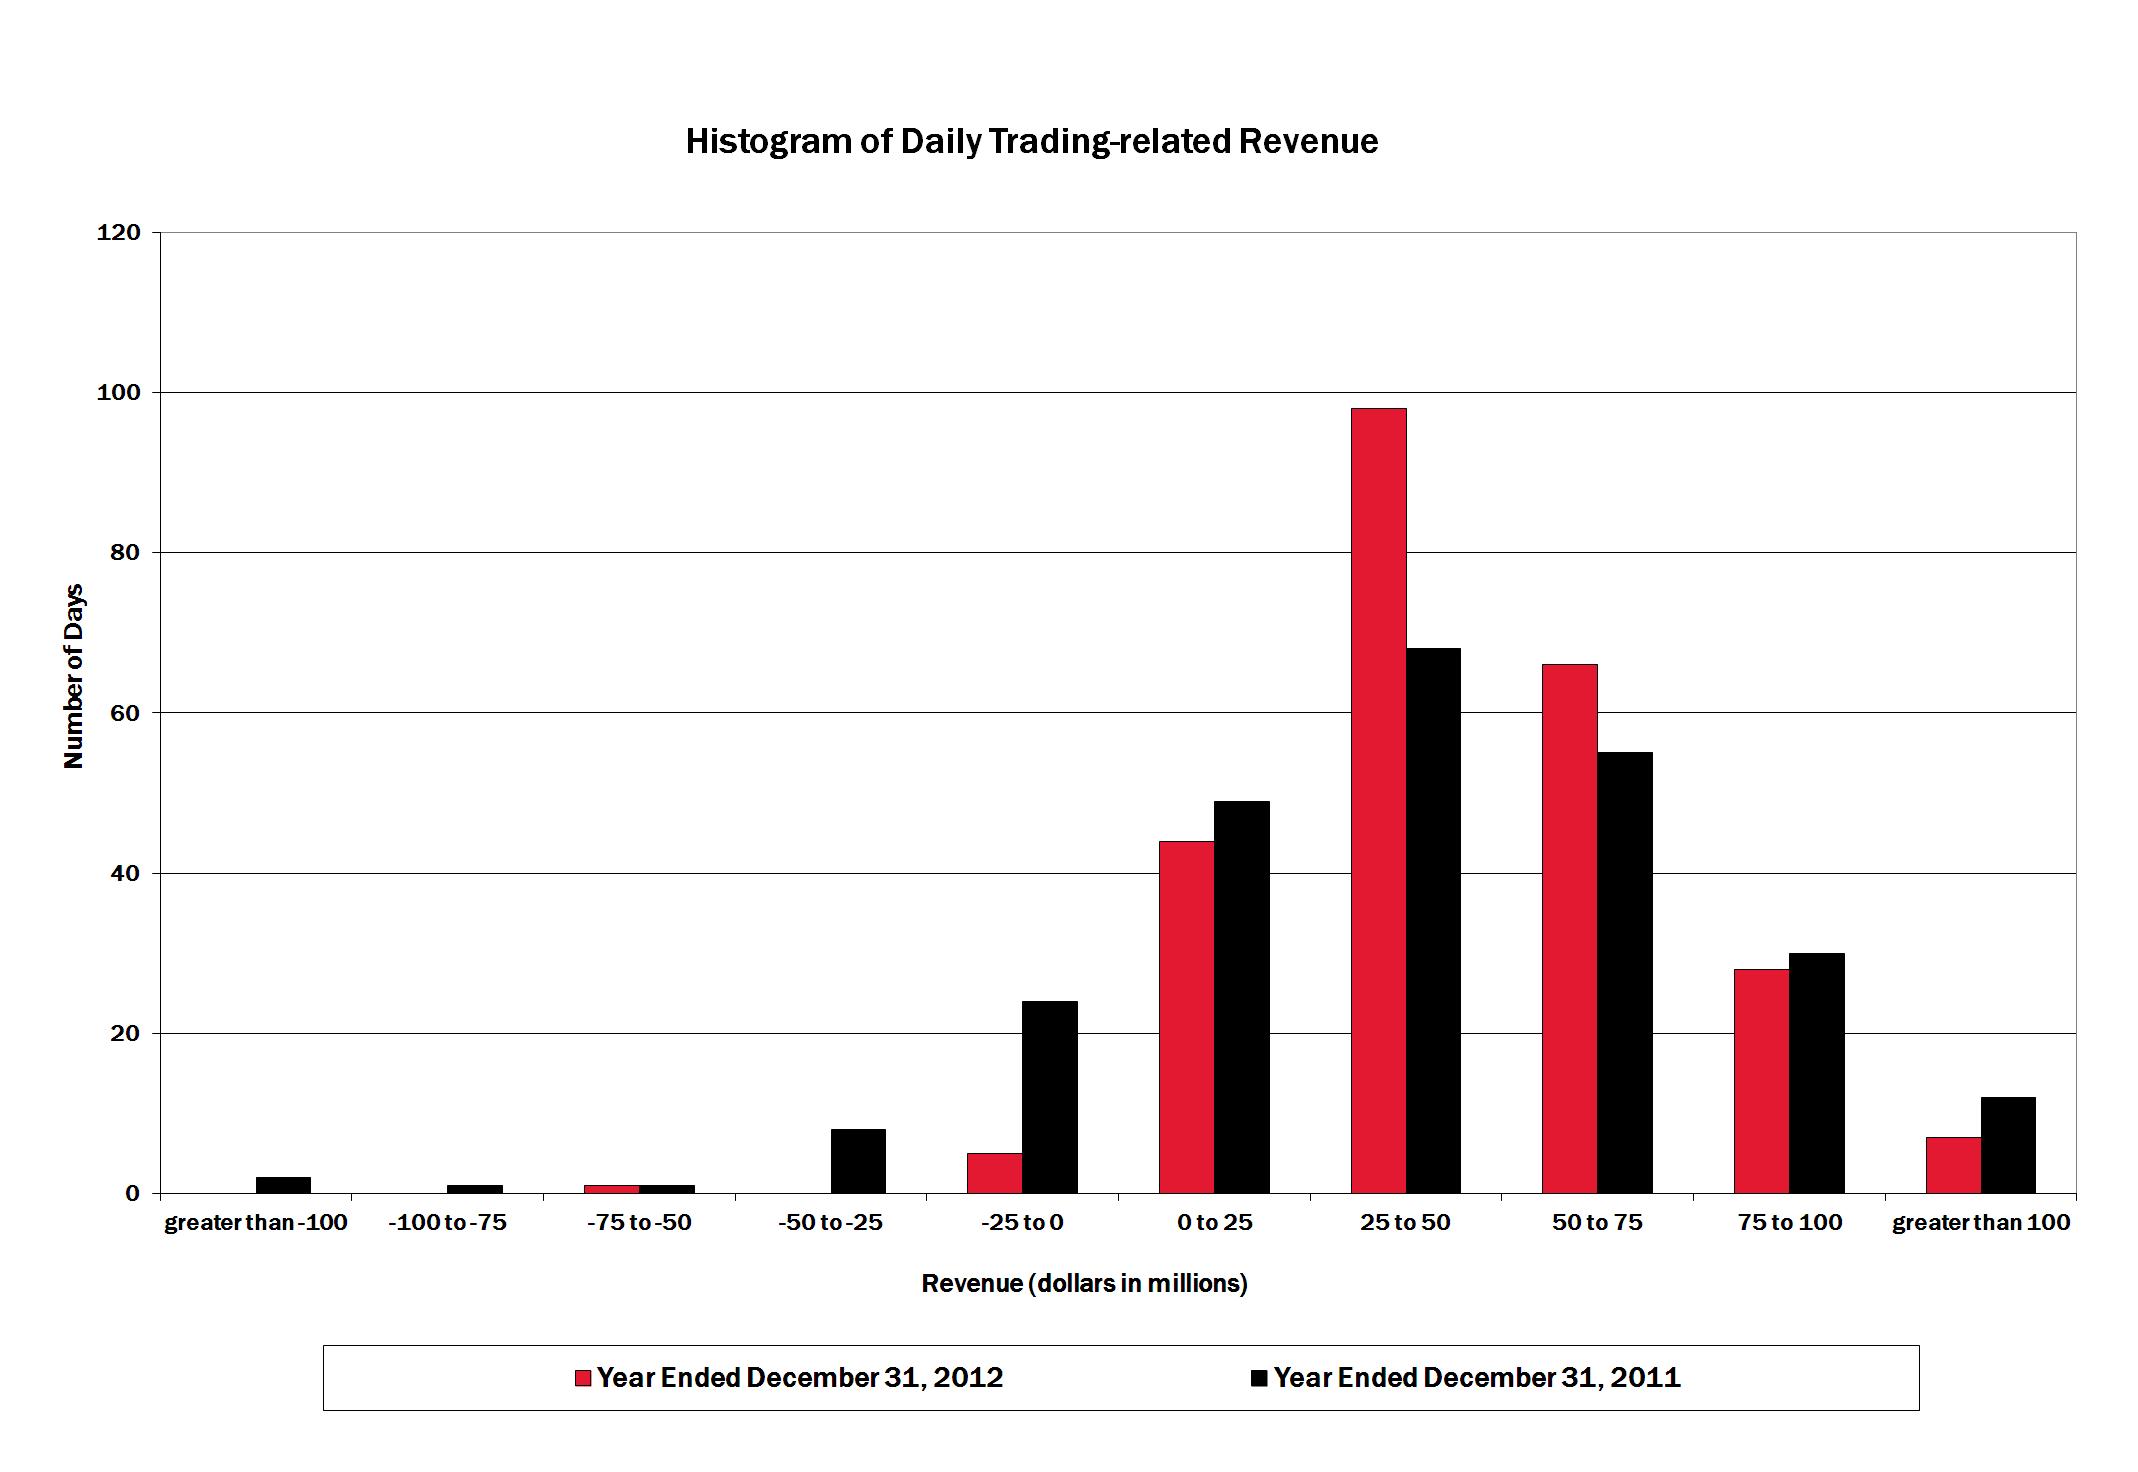
To evaluate risk in our trading activities, we focus on the actual and potential volatility of individual positions as well as portfolios. VaR is a key statistic used to measure market risk. In order to manage day-to-day risks, VaR is subject to trading limits both for our overall trading portfolio and within individual businesses. All trading limit excesses are communicated to management for review.
A VaR model simulates the value of a portfolio under a range of hypothetical scenarios in order to generate a distribution of potential gains and losses. VaR represents the worst loss the portfolio is expected to experience within a given confidence level based on historical trends with a given level of confidence and depends on the volatility of the positions in the portfolio and on how strongly their risks are correlated. Withindata. With any VaR model, there are significant and numerous assumptions that will differ from company to company. In addition, the accuracy of a VaR model depends on the availability and quality of historical data for each of the positions in the portfolio. A VaR model may require additional modeling assumptions for new products that do not have extensive historical price data or for illiquid positions for which accurate daily prices are not consistently available.
A VaR model is an effective tool in estimating ranges of potential gains and losses on our trading portfolios. There are, however, many limitations inherent in a VaR model as it utilizes historical results over a defined time period to estimate future performance. Historical results may not always be indicative of future results and changes in market conditions or in the composition of the underlying portfolio could have a material impact on the accuracy of the VaR model. In order for the VaR model to reflect current market conditions, we update the historical data underlying our VaR model on a bi-weekly basis and regularly review the assumptions underlying the model. Our VaR model utilizes three years of historical data. This time period was chosen to ensure that the VaR reflects both a broad range of market movements as well as being sensitive to recent changes in market volatility. In addition, certain types of risks associated with positions that are illiquid and/or unobservable are not included in VaR. If these risks are determined to be material, the VaR model results will be supplemented.
We continually review, evaluate and enhance our VaR model so that it reflects the material risks in our trading portfolio. Changes to the VaR model are reviewed and approved prior to implementation and any material changes are reported to management through the appropriate governance committees. Nevertheless, due to the limitations previously discussed, we have historically used the VaR model as only one of the components in managing our trading risk and also use other techniques such as stress testing and desk level limits. Periods of extreme market stress influence the reliability of these techniques to varying degrees.
The accuracy of the VaR methodology is reviewed by backtesting which involves comparing actualcompares the VaR results against expectations derived from historical data the VaR results against the actual daily profit and loss. Graphic representation of the backtesting results with additional explanation of backtesting excesses are reported to the GRC.GMRC. Backtesting excesses occur when trading losses exceed VaR. Senior management reviews and evaluates the results of these tests. In periods of market stress,
the GRCGMRC members communicate daily to discuss losses and VaR limit excesses. As a result of this process, the businesses may selectively reduce risk. Where economically feasible, positions are sold or macroeconomic hedges are executed to reduce the exposure.
OurWe use one VaR model that uses a historical simulation approach based on three years of historical data and an expected shortfall methodology equivalent to a 99 percent confidence level. Statistically, this means that losses will exceed VaR, on average, one out of 100 trading days, or two to three times each year. The number of actual backtesting excesses observed is dependent on current market performance relative to historic market volatility. For most of 2011, the three years of historical market data utilized for VaR included the volatile fourth quarter of 2008. Subsequent market volatility has generally been lower, and as a result, the size of the largest trading losses experienced since then has been lower than would be expected based on the VaR measure. Actual losses did not exceed daily trading VaR in 20112012 or 20102011. The graph below shows daily trading-related revenue and VaR for 20112012. The large gains in daily trading-related revenue reflected near the end of the year, are due in part to above average activity in the markets leading up to news about the fiscal cliff.
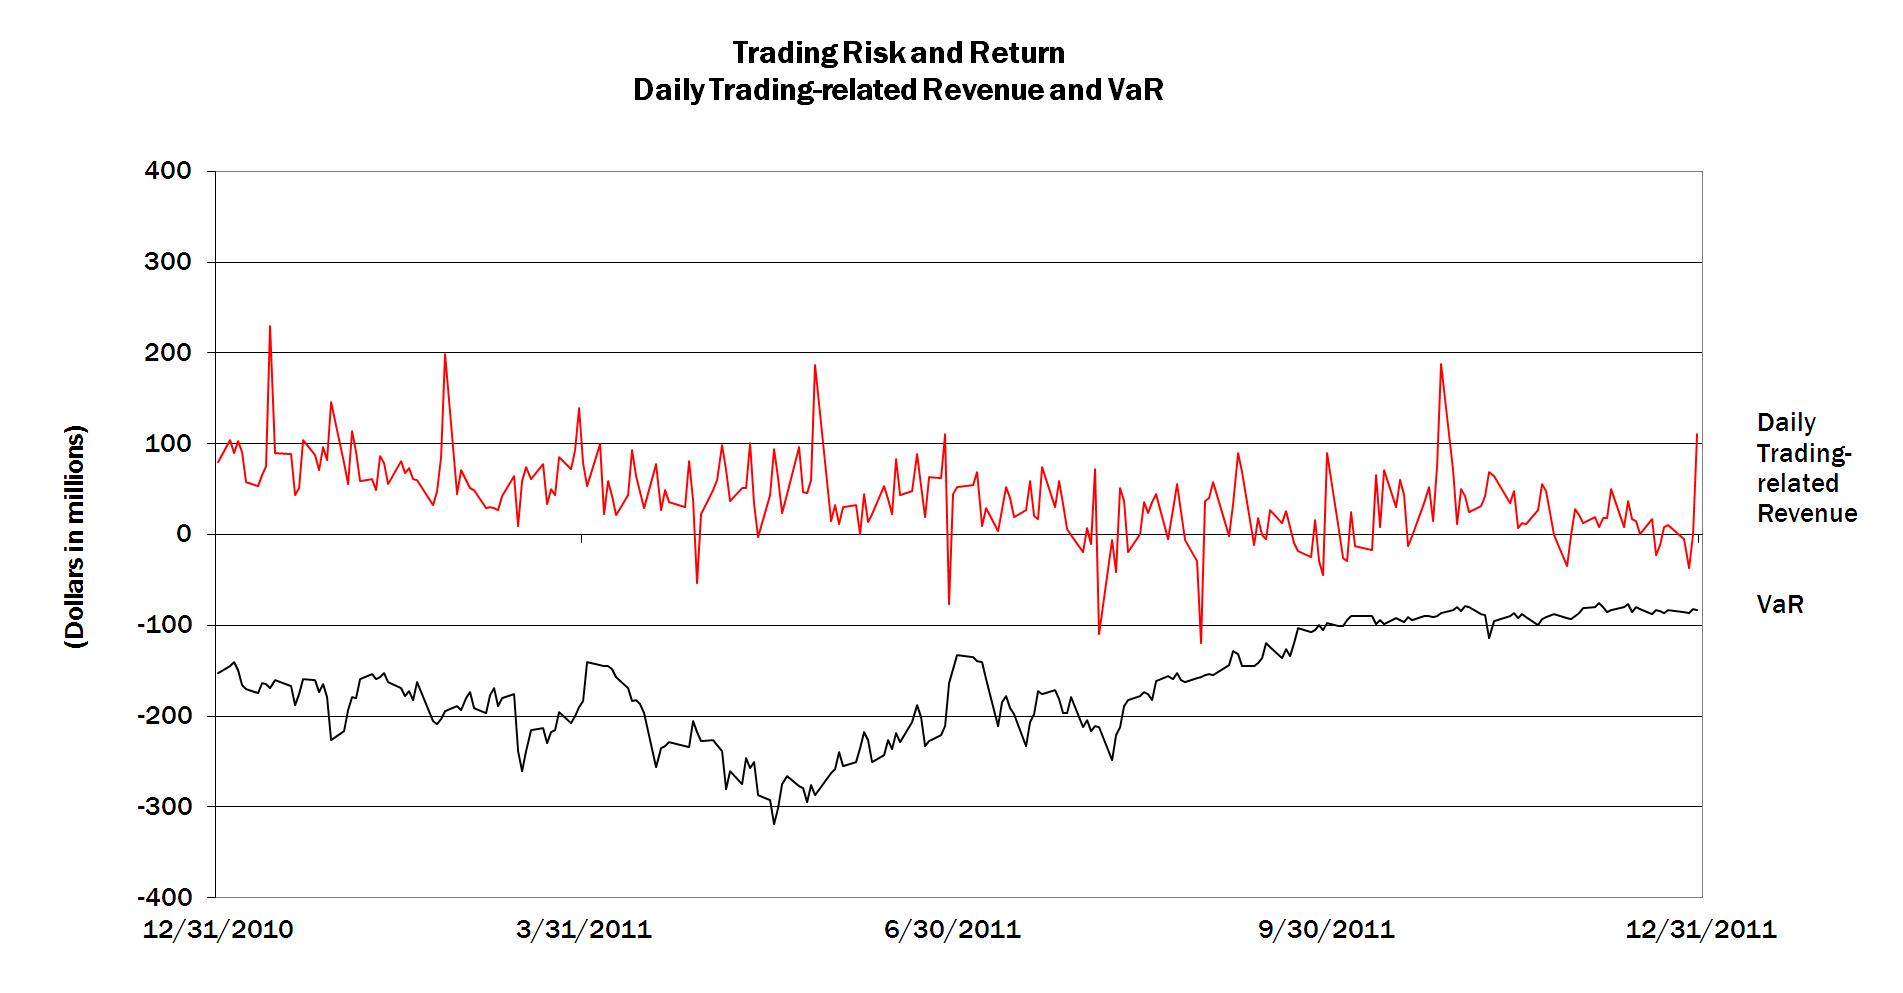
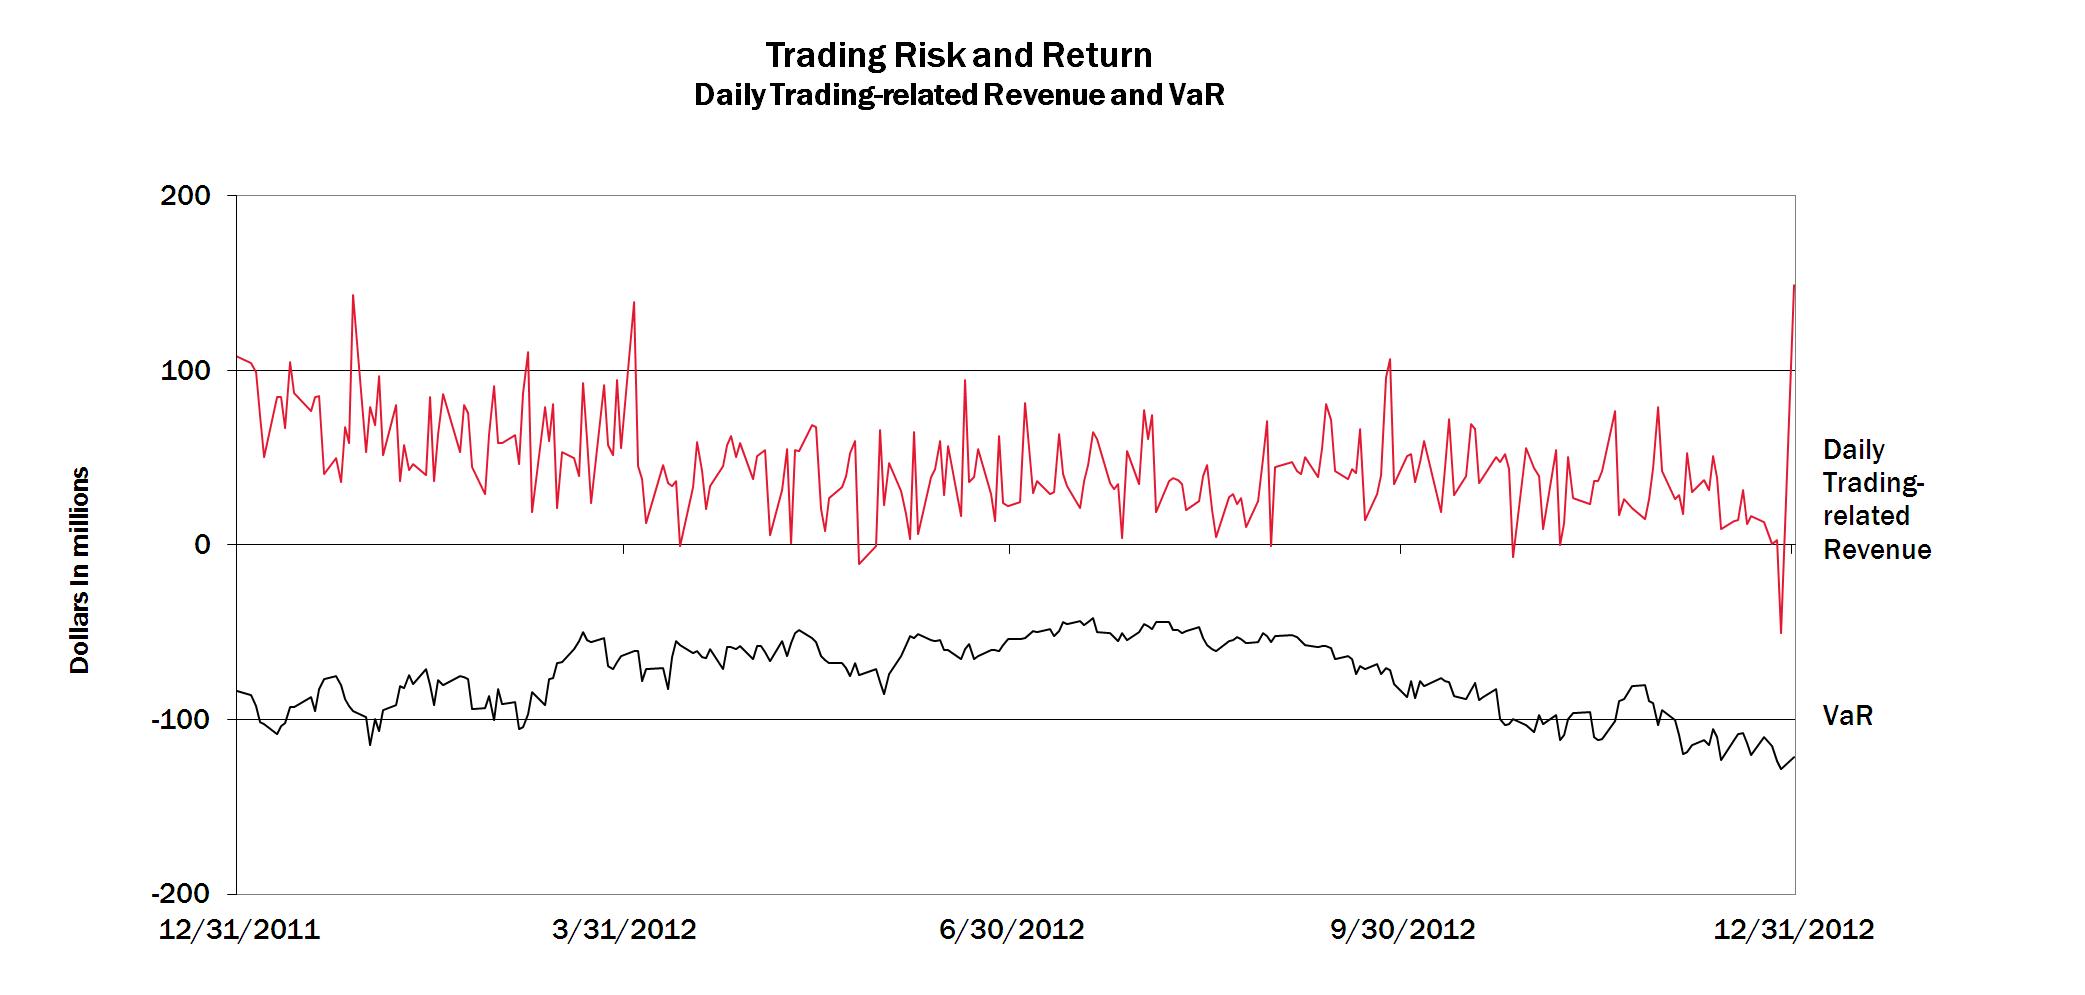
Table 5762 presents average, high and low daily trading VaR for 20112012 and 20102011.
| | | | | | | | | | | | | | | | | | | | | | | | | | | |
| Table 57 | Market Risk VaR for Trading Activities | | | | | |
| Table 62 | | Market Risk VaR for Trading Activities | | | | |
| | | | | | | | | | | | | | | | | | | | | | | | | |
| | | 2011 | | 2010 | | 2012 | | 2011 |
| (Dollars in millions) | (Dollars in millions) | Average | | High (1) | | Low (1) | | Average | | High (1) | | Low (1) | (Dollars in millions) | Average | | High (1) | | Low (1) | | Average | | High (1) | | Low (1) |
| Foreign exchange | Foreign exchange | $ | 20.0 |
| | $ | 48.6 |
| | $ | 5.6 |
| | $ | 23.8 |
| | $ | 73.1 |
| | $ | 4.9 |
| Foreign exchange | $ | 21.4 |
| | $ | 34.3 |
| | $ | 11.5 |
| | $ | 20.0 |
| | $ | 48.6 |
| | $ | 5.6 |
|
| Interest rate | Interest rate | 50.6 |
| | 82.7 |
| | 29.2 |
| | 64.1 |
| | 128.3 |
| | 33.2 |
| Interest rate | 46.3 |
| | 75.3 |
| | 29.8 |
| | 50.6 |
| | 82.7 |
| | 29.2 |
|
| Credit | Credit | 109.9 |
| | 155.3 |
| | 54.8 |
| | 171.5 |
| | 287.2 |
| | 122.9 |
| Credit | 49.5 |
| | 80.7 |
| | 31.1 |
| | 109.9 |
| | 155.3 |
| | 54.8 |
|
| Real estate/mortgage | Real estate/mortgage | 80.0 |
| | 139.5 |
| | 31.5 |
| | 83.1 |
| | 138.5 |
| | 42.9 |
| Real estate/mortgage | 34.1 |
| | 45.0 |
| | 27.6 |
| | 80.0 |
| | 139.5 |
| | 31.5 |
|
| Equities | Equities | 50.5 |
| | 88.9 |
| | 25.1 |
| | 39.4 |
| | 90.9 |
| | 20.8 |
| Equities | 27.8 |
| | 54.8 |
| | 14.6 |
| | 50.5 |
| | 88.9 |
| | 25.1 |
|
| Commodities | Commodities | 18.9 |
| | 33.8 |
| | 8.4 |
| | 19.9 |
| | 31.7 |
| | 12.8 |
| Commodities | 13.0 |
| | 17.7 |
| | 7.2 |
| | 18.9 |
| | 33.8 |
| | 8.4 |
|
| Portfolio diversification | Portfolio diversification | (163.1 | ) | | — |
| | — |
| | (200.5 | ) | | — |
| | — |
| Portfolio diversification | (117.1 | ) | | — |
| | — |
| | (163.1 | ) | | — |
| | — |
|
| Total market-based trading portfolio | Total market-based trading portfolio | $ | 166.8 |
| | $ | 318.6 |
| | $ | 75.0 |
| | $ | 201.3 |
| | $ | 375.2 |
| | $ | 123.0 |
| Total market-based trading portfolio | $ | 75.0 |
| | $ | 128.1 |
| | $ | 41.9 |
| | $ | 166.8 |
| | $ | 318.6 |
| | $ | 75.0 |
|
| |
(1) | The high and low for the total portfolio may not equal the sum of the individual components as the highs or lows of the individual portfolios may have occurred on different trading days. |
The $35 million decrease in average VaR during 2011 was primarily due to a reduction in risk during the year. This was driven primarily by a decrease in credit exposures where average VaR decreased $62 million compared to 2010. In addition, for 2010
and 2011, data from the more volatile periods of 2007 and 2008 were no longer included in our three-year historical dataset. These impacts were partially offset by a reduction in portfolio diversification VaR of $37 million.
|
| | |
116 Bank of America 2012 | | Bank of America115
|
The $92 million decrease in average VaR during 2012 was driven by reduced risk across most asset classes, with the largest reductions coming from the credit, real estate/mortgage and equities asset classes. In addition, volatile market data from 2008, which was a material contribution to the 2011 average, was no longer included in the three-year historical dataset for the 2012 average.
Counterparty credit risk is an adjustment to the mark-to-market value of our derivative exposures to reflect the impact of the credit quality of counterparties on our derivative assets. Since counterparty credit exposure is not included in the VaR component of the regulatory capital allocation, we do not include it in our trading VaR, and it is therefore not included in the daily trading-related revenue illustrated in our histogram or used for backtesting.
Trading Portfolio Stress Testing
Because the very nature of a VaR model suggests results can exceed our estimates and it is dependent on a limited lookback window, we also “stress test”stress test our portfolio. Stress testing estimates the value change in our trading portfolio that may result from abnormal market movements. Various scenarios, categorized as either historical or hypothetical, are regularly run and reported for the overall trading portfolio and individual businesses. Historical scenarios simulate the impact of price changes that occurred during a set of extended historical market events. Generally, a 10-business-day window or longer, representing the most severe point during a crisis, is selected for each historical scenario. Hypothetical scenarios provide simulations of anticipated shocks from pre-defined market stress events. These stress events include shocks to underlying market risk variables which may be well beyond the shocks found in the historical data used to calculate VaR. As with the historical scenarios, the hypothetical scenarios are designed to represent a short-term market disruption. Scenarios are reviewed and updated as necessary in light of changing positions and new economic or political information. For example, we currently include stress tests that contemplate a full or partial break-up of the Eurozone. In addition to the value afforded by the results themselves, this information provides senior management with a clear picture of the trend of risk being taken given the relatively static nature of the shocks applied. Stress testing for the trading portfolio is also integrated with enterprise-wide stress testing and incorporated into the limits framework. A process is in place to promote consistency between the scenarios used for the trading portfolio and those used for enterprise-wide stress testing. The scenarios used for enterprise-wide stress testing purposes differ from the typical trading portfolio scenarios in that they have a longer time horizon and the results are forecasted over multiple periods for use in consolidated capital
and liquidity planning. For additional information on enterprise-wide stress testing, see page 7668.
Interest Rate Risk Management for Nontrading Activities
The following discussion presents net interest income excluding the impact of trading-related activities.
Interest rate risk represents the most significant market risk exposure to our nontrading balance sheet. Interest rate risk is measured as the potential volatility in our core net interest income caused by changes in market interest rates. Client-facing activities, primarily lending and deposit-taking, create interest rate sensitive positions on our balance sheet.
We prepare forward-looking forecasts of core net interest income. The baseline forecast takes into consideration expected future business growth, ALM positioning and the direction of interest rate movements as implied by the market-based forward curve. We then measure and evaluate the impact that alternative interest rate scenarios have on the baseline forecast in order to assess interest rate sensitivity under varied conditions. The core net interest income forecast is frequently updated for changing
assumptions and differing outlooks based on economic trends, market conditions and business strategies. Thus, we continually monitor our balance sheet position in orderan effort to maintain an acceptable level of exposure to interest rate changes.
The interest rate scenarios that we analyze incorporate balance sheet assumptions such as loan and deposit growth and pricing, changes in funding mix, product repricing and maturity characteristics, but do not include the impact of hedge ineffectiveness. The prepayment impact on amortization is reflected in the period in which a prepayment is forecasted to occur. Our overall goal is to manage interest rate risk so that movements in interest rates do not significantly adversely affect core net interest income and capital.
Periodically, we evaluate the scenarios presented to ensure that they provide a comprehensive view of the Corporation’s interest rate risk exposure and are meaningful in the context of the current rate environment. Given the low level of short-end rates, we have determined that gradual downward shifts of 50 bps applied to the short-end of the market-based forward curve provide a more realistic view of potential exposure resulting from changes in interest rates. This replaced the 100 bps downward shift scenarios applied to the short-end of the market-based forward curve previously presented. In addition, a long-end flattener of (50) bps was added for comparability purposes.
The spot and 12-month forward monthly rates used in our baseline forecast at December 31, 20112012 and 20102011 are presented in Table 5863.
|
| | | | | | | | | |
| | | | | | | |
| Table 63 | Forward Rates | | | | | |
| | | | | | | |
| | | December 31, 2012 |
| | | Federal Funds | | Three-Month LIBOR | | 10-Year Swap |
| Spot rates | 0.25 | % | | 0.31 | % | | 1.84 | % |
| 12-month forward rates | 0.25 |
| | 0.37 |
| | 2.10 |
|
| | | | | | | |
| | | December 31, 2011 |
| Spot rates | 0.25 | % | | 0.58 | % | | 2.03 | % |
| 12-month forward rates | 0.25 |
| | 0.75 |
| | 2.29 |
|
|
| | | | | | | | | |
| | | | | | | |
| Table 58 | Forward Rates | | | | | |
| | | | | | | |
| | | December 31, 2011 |
| | | Federal Funds | | Three-Month LIBOR | | 10-Year Swap |
| Spot rates | 0.25 | % | | 0.58 | % | | 2.03 | % |
| 12-month forward rates | 0.25 |
| | 0.75 |
| | 2.29 |
|
| | | | | | | |
| | | December 31, 2010 |
| Spot rates | 0.25 | % | | 0.30 | % | | 3.39 | % |
| 12-month forward rates | 0.25 |
| | 0.72 |
| | 3.86 |
|
Table 59 shows the pre-tax dollar impact to forecasted core net interest income over the next twelve months from December 31, 2011 and 2010, resulting from a gradual parallel increase and non-parallel shocks to the market-based forward curve. For further discussion of core net interest income, see page 39.
|
| | | | | | | | | | | | | | |
| | | | | | | | | |
| Table 59 | Estimated Core Net Interest Income |
| | | | | | | | | |
| (Dollars in millions) | Short Rate (bps) | | Long Rate (bps) | | December 31 |
| Curve Change | | | 2011 | | 2010 |
| +100 bps Parallel shift | +100 |
| | +100 |
| | $ | 1,505 |
| | $ | 601 |
|
| -50 bps Parallel shift | -50 |
| | -50 |
| | (1,061 | ) | | (499 | ) |
| Flatteners | |
| | |
| | |
| | |
|
| Short end | +100 |
| | — |
| | 588 |
| | 136 |
|
| Long end | — |
| | -50 |
| | (581 | ) | | (280 | ) |
| Long end | — |
| | -100 |
| | (1,199 | ) | | (637 | ) |
| Steepeners | |
| | |
| | |
| | |
|
| Short end | –50 |
| | — |
| | (478 | ) | | (209 | ) |
| Long end | — |
| | +100 |
| | 929 |
| | 493 |
|
|
| | |
| | 116Bank of America 20112012117
| | |
Table 64 shows the pre-tax dollar impact to forecasted net interest income over the next 12 months from December 31, 2012 and 2011, resulting from instantaneous parallel and non-parallel shocks to the market-based forward curve. Periodically we evaluate the scenarios presented to ensure that they are meaningful in the context of the current rate environment. For more information, see Net Interest Income Excluding Trading-related Net Interest Income on page 36.
|
| | | | | | | | | | | | | | |
| | | | | | | | | |
| Table 64 | Estimated Net Interest Income Excluding Trading-related Net Interest Income |
| | | | | | | | | |
| (Dollars in millions) | Short Rate (bps) | | Long Rate (bps) | | December 31 |
| Curve Change | | | 2012 | | 2011 |
| Parallel Shifts | | | | | | | |
+100 bps instantaneous shift | +100 | | +100 | | $ | 4,232 |
| | $ | 2,883 |
|
-50 bps instantaneous shift | --50 |
| | --50 |
| | (2,250 | ) | | (1,795 | ) |
| Flatteners | |
| | |
| | |
| | |
|
Short end instantaneous change | +100 | | — |
| | 2,159 |
| | 979 |
|
Long end instantaneous change | — |
| | --50 |
| | (1,597 | ) | | (1,319 | ) |
| Steepeners | |
| | |
| | |
| | |
|
Short end instantaneous change | --50 |
| | — |
| | (655 | ) | | (464 | ) |
Long end instantaneous change | — |
| | +100 | | 2,091 |
| | 1,935 |
|
The sensitivity analysis in Table 5964 assumes that we take no action in response to these rate shifts over the indicated periods.shocks. Our core net interest income was asset sensitive to a parallel move in interest rates at both December 31, 20112012 and 20102011. As part of our ALM activities, we use securities, residential mortgages, and interest rate and foreign exchange derivatives in managing interest rate sensitivity. The significant decline in long-end rates contributed to the increase in asset sensitivity between 2011 and 2010.
Securities
The securities portfolio is an integral part of our ALM positionpositioning and is primarily comprised of debt securities including MBS and to a lesser extent U.S. Treasury, corporate, municipal and other debt securities. At December 31, 20112012 and 20102011, we held AFS debt securities with a fair value of$286.9 billion and $276.2 billion and $337.6 billion. During 20112012 and 20102011, we purchased AFS debt and other securities of $99.5164.5 billion and $199.299.5 billion, sold $116.872.4 billion and $97.5116.8 billion, and had maturities and received paydowns of $56.771.5 billion and $70.956.7 billion. We realized $3.41.7 billion and $2.53.4 billion in net gains on sales of debt securities during 20112012 and 20102011. We securitized no mortgage loans into MBS duringAt 2011 compared to $2.4 billion in 2010, which we retained.
During December 31, 2012 and 2011, we purchased approximatelyheld $35.649.5 billion and $35.3 billion of U.S. agency MBS which areheld-to-maturity securities and $14.5 billion of other securities classified as held-to-maturity securities. The purchases of theseother assets. There were no securities are part of our long-term investment activities which include holding these securities to maturity. The classification of these securitiesclassified as held-to-maturity also mitigates accumulated OCI volatility and possible negative impacts on our regulatory capital requirements under the Basel III capital standards. The contractual maturities of the held-to-maturity securities are greater than 10 years and they are subject to prepayment by the issuers.other assets during 2011.
Accumulated OCI included after-tax net unrealized gains of $3.14.4 billion and $7.43.1 billion on AFS debt securities and $462 million and $3 million on AFS marketable equity securities at December 31, 20112012 and 20102011, comprised primarily. For additional information on accumulated OCI, see Note 15 – Accumulated Other Comprehensive Income (Loss)to the Consolidated Financial Statements. The amount of after-taxpre-tax net unrealized gains of $3.1 billion and $714 million related toon AFS debt securities and after-tax net unrealized gains ofincreased $3 million and $6.72.1 billion relatedduring 2012 to AFS marketable equity securities. The December 31, 2010$7.0 billion unrealized gain, primarily due to the impact of lower rates. For additional information on marketable equityour securities was related to our investment in CCB. Seeportfolio, see Note 54 – Securities to the Consolidated Financial Statements for further discussion on marketable equity securities. The net unrealized gains in accumulated OCI related to AFS debt securities increased $3.9 billion during 2011 to $5.0 billion, primarily due to a lower interest rate environment..
We recognized $29953 million of other-than-temporary impairment (OTTI) losses in earnings on AFS debt securities in 20112012 compared to $970$299 million on AFS debt and marketable equity securities in 20102011. The recognition of OTTI losses on AFS debt and marketable equity securities is based on a variety of factors, including the length of time and extent to which the market value has been less than amortized cost, the financial condition of the issuer of the security including credit ratings and any specific events affecting the operations of the issuer, underlying assets that collateralize the debt security, other industry and macroeconomic conditions, and our intent and ability to hold the security to recovery.
Residential Mortgage Portfolio
At December 31, 20112012 and 20102011, our residential mortgage portfolio was $243.2 billion and $262.3 billion (which excludeswhich excluded $906 million9.9 billion inand
residential mortgage$11.1 billion of discontinued real estate loans and $1.0 billion and $2.2 billion of consumer loans accounted for under the fair value option) and $258.0 billion.option. For more information on consumer fair value option loans, see Consumer Portfolio Credit Risk Management – Consumer Loans Accounted for Under the Fair Value Option on page 9293. Outstanding residential mortgage loansThe increased$19.1 billion $4.3 billiondecrease in 20112012 as new origination volume was partially offset bydue to paydowns, charge-offs and transfers to foreclosed properties. In addition,properties which more than offset new origination volume and repurchases of delinquent FHA loans pursuant to our servicing agreements with GNMA.
During 2012, CRES and GWIM originated $35.4 billion in first-lien mortgages that we retained compared to $45.5 billion in 2011. Additionally, we repurchased $7.8$8.2 billion of delinquent FHA loans pursuant to our servicing agreements with GNMA which also increased the residential mortgage portfolio during 2011.
During 2011 and 2010, we retained $45.5 billion and $63.8compared to repurchases of $7.8 billion in first-lien mortgages originated by CRES and GWIM.2011. We received paydowns of $42.3$53.0 billion and $38.2in 2012 compared to paydowns of $42.3 billion in 2011 and 2010. There were no loans securitized in 2011 compared to $2.4 billion of loans securitized into MBS which we retained in 2010. We recognized gains of $68 million on the securitizations completed in 2010. We purchased $72 millionpurchases of residential mortgages related to ALM activities in 20112012 compared to none$72 million in 20102011. We sold $109 million and $443$305 million of residential mortgages in 20112012 and 2010, of which all of thecompared to $109 million in 2011 sales, all of which were originated residential mortgages and $432 millionmortgages. Gains recognized on the sales of the 2010 sales were originated residential mortgages and $11 million were previously purchased from third parties. Net gains on these transactionsin both periods were minimal.
Interest Rate and Foreign Exchange Derivative Contracts
Interest rate and foreign exchange derivative contracts are utilized in our ALM activities and serve as an efficient tool to manage our interest rate and foreign exchange risk. We use derivatives to hedge the variability in cash flows or changes in fair value on our balance sheet due to interest rate and foreign exchange components. For additional information on our hedging activities, see Note 43 – Derivatives to the Consolidated Financial Statements.
Our interest rate contracts are generally non-leveraged generic interest rate and foreign exchange basis swaps, options, futures and forwards. In addition, we use foreign exchange contracts, including cross-currency interest rate swaps, foreign currency forward contracts and options to mitigate the foreign exchange risk associated with foreign currency-denominated assets and liabilities.
Changes to the composition of our derivatives portfolio during 20112012 reflect actions taken for interest rate and foreign exchange rate risk management. The decisions to reposition our derivatives portfolio are based uponon the current assessment of economic and financial conditions including the interest rate and foreign currency environments, balance sheet composition and trends, the asset sensitivity of our balance sheet and the relative mix of our cash and derivative positions.
Table 6065 includespresents derivatives utilized in our ALM activities including those designated as accounting and economicmarket risk hedging instruments and shows the notional amount, fair value, weighted-average receive-fixed and pay-fixed rates, expected maturity and
average estimated durations of our open ALM derivatives at December 31, 20112012 and 2010. Our interest rate swap positions, including foreign exchange contracts, were a net receive-fixed position of $67.9 billion and $6.4 billion at December 31, 2011 and 2010. The notional amount of our foreign exchange basis swaps was $262.4 billion and $235.2 billion at December 31, 2011 and 2010. Our futures and forwards notional position, which reflects the net of long and short positions, was a long position of $12.2 billion at December 31, 2011 compared to a short position of $280 million at
December 31, 2010. These changes in notional amounts are the result of ongoing interest rate and currency risk management positioning.do not include derivative hedges on our MSRs.
The fair value of net ALM contracts decreased$7.9 billion to a gain of $4.7 billion at December 31, 2011 compared to $12.6 billion at December 31, 2010. The decrease was primarily
attributable to changes in the value of U.S. dollar-denominated pay-fixed interest rate swaps of $9.7 billion, foreign exchange contracts of $1.8 billion and foreign exchange basis swaps of $1.4 billion. The decrease was partially offset by a gain from the changes in the value of U.S. dollar-denominated receive-fixed interest rate swaps of $6.6 billion.
| | | | | | | | | | | | | | | | | | | | | | | | | | | | | | | | | | | | | | | |
| Table 60 | Asset and Liability Management Interest Rate and Foreign Exchange Contracts | |
| Table 65 | | Asset and Liability Management Interest Rate and Foreign Exchange Contracts |
| | | | | | | | | | | | | |
| | | | | December 31, 2011 | | | | | | December 31, 2012 | | |
| | | | | Expected Maturity | | | | | | Expected Maturity | | |
| (Dollars in millions, average estimated duration in years) | (Dollars in millions, average estimated duration in years) | Fair Value | | Total | | 2012 | | 2013 | | 2014 | | 2015 | | 2016 | | Thereafter | | Average
Estimated Duration | (Dollars in millions, average estimated duration in years) | Fair Value | | Total | | 2013 | | 2014 | | 2015 | | 2016 | | 2017 | | Thereafter | | Average
Estimated Duration |
Receive-fixed interest rate swaps (1, 2) | Receive-fixed interest rate swaps (1, 2) | $ | 13,989 |
| | |
| | |
| | |
| | |
| | |
| | |
| | |
| | 5.99 |
| Receive-fixed interest rate swaps (1, 2) | $ | 10,491 |
| | |
| | |
| | |
| | |
| | |
| | |
| | |
| | 5.30 |
|
| Notional amount | Notional amount | |
| | $ | 105,938 |
| | $ | 22,422 |
| | $ | 8,144 |
| | $ | 7,604 |
| | $ | 10,774 |
| | $ | 11,660 |
| | $ | 45,334 |
| | |
| Notional amount | |
| | $ | 85,899 |
| | $ | 7,175 |
| | $ | 7,604 |
| | $ | 11,785 |
| | $ | 11,362 |
| | $ | 19,693 |
| | $ | 28,280 |
| | |
|
| Weighted-average fixed-rate | Weighted-average fixed-rate | |
| | 4.09 | % | | 2.65 | % | | 3.70 | % | | 3.79 | % | | 4.01 | % | | 3.96 | % | | 4.98 | % | | |
| Weighted-average fixed-rate | |
| | 4.12 | % | | 4.06 | % | | 3.79 | % | | 3.56 | % | | 3.98 | % | | 3.89 | % | | 4.67 | % | | |
|
Pay-fixed interest rate swaps (1, 2) | Pay-fixed interest rate swaps (1, 2) | (13,561 | ) | | |
| | |
| | |
| | |
| | |
| | |
| | |
| | 12.17 |
| Pay-fixed interest rate swaps (1, 2) | (4,903 | ) | | |
| | |
| | |
| | |
| | |
| | |
| | |
| | 15.47 |
|
| Notional amount | Notional amount | |
| | $ | 77,985 |
| | $ | 2,150 |
| | $ | 1,496 |
| | $ | 1,750 |
| | $ | 15,026 |
| | $ | 8,951 |
| | $ | 48,612 |
| | |
| Notional amount | |
| | $ | 26,548 |
| | $ | 27 |
| | $ | 3,989 |
| | $ | 520 |
| | $ | 1,025 |
| | $ | 1,527 |
| | $ | 19,460 |
| | |
|
| Weighted-average fixed-rate | Weighted-average fixed-rate | |
| | 3.29 | % | | 1.45 | % | | 2.68 | % | | 1.80 | % | | 2.35 | % | | 3.13 | % | | 3.76 | % | | |
| Weighted-average fixed-rate | |
| | 3.09 | % | | 6.91 | % | | 0.79 | % | | 2.30 | % | | 1.65 | % | | 1.84 | % | | 3.75 | % | | |
|
Same-currency basis swaps (3) | Same-currency basis swaps (3) | 61 |
| | |
| | |
| | |
| | |
| | |
| | |
| | |
| | |
| Same-currency basis swaps (3) | 45 |
| | |
| | |
| | |
| | |
| | |
| | |
| | |
| | |
|
| Notional amount | Notional amount | |
| | $ | 222,641 |
| | $ | 44,898 |
| | $ | 83,248 |
| | $ | 35,678 |
| | $ | 14,134 |
| | $ | 17,113 |
| | $ | 27,570 |
| | |
| Notional amount | |
| | $ | 213,458 |
| | $ | 82,716 |
| | $ | 54,534 |
| | $ | 19,995 |
| | $ | 20,361 |
| | $ | 13,542 |
| | $ | 22,310 |
| | |
|
Foreign exchange basis swaps (2, 4, 5) | Foreign exchange basis swaps (2, 4, 5) | 3,409 |
| | |
| | |
| | |
| | |
| | |
| | |
| | |
| | |
| Foreign exchange basis swaps (2, 4, 5) | 431 |
| | |
| | |
| | |
| | |
| | |
| | |
| | |
| | |
|
| Notional amount | Notional amount | |
| | 262,428 |
| | 60,359 |
| | 49,161 |
| | 55,111 |
| | 20,401 |
| | 43,360 |
| | 34,036 |
| | |
| Notional amount | |
| | 191,925 |
| | 32,590 |
| | 44,732 |
| | 27,569 |
| | 15,965 |
| | 20,134 |
| | 50,935 |
| | |
|
Option products (6) | Option products (6) | (1,875 | ) | | |
| | |
| | |
| | |
| | |
| | |
| | |
| | |
| Option products (6) | (147 | ) | | |
| | |
| | |
| | |
| | |
| | |
| | |
| | |
|
Notional amount (7) | Notional amount (7) | |
| | 10,413 |
| | 1,500 |
| | 2,950 |
| | 600 |
| | 300 |
| | 458 |
| | 4,605 |
| | |
| Notional amount (7) | |
| | 4,218 |
| | 4,000 |
| | — |
| | — |
| | — |
| | — |
| | 218 |
| | |
|
Foreign exchange contracts (2, 5, 8) | Foreign exchange contracts (2, 5, 8) | 2,522 |
| | |
| | |
| | |
| | |
| | |
| | |
| | |
| | |
| Foreign exchange contracts (2, 5, 8) | 5,636 |
| | |
| | |
| | |
| | |
| | |
| | |
| | |
| | |
|
Notional amount (7) | Notional amount (7) | | | 52,328 |
| | 20,470 |
| | 3,556 |
| | 10,165 |
| | 2,071 |
| | 2,603 |
| | 13,463 |
| | |
| Notional amount (7) | | | (1,200 | ) | | (23,438 | ) | | 8,615 |
| | 1,303 |
| | 582 |
| | 6,183 |
| | 5,555 |
| | |
|
| Futures and forward rate contracts | Futures and forward rate contracts | 153 |
| | |
| | |
| | |
| | |
| | |
| | |
| | |
| | |
| Futures and forward rate contracts | 24 |
| | |
| | |
| | |
| | |
| | |
| | |
| | |
| | |
|
Notional amount (7) | Notional amount (7) | |
| | 12,160 |
| | 12,160 |
| | — |
| | — |
| | — |
| | — |
| | — |
| | |
| Notional amount (7) | |
| | (11,595 | ) | | (11,595 | ) | | — |
| | — |
| | — |
| | — |
| | — |
| | |
|
| Net ALM contracts | Net ALM contracts | $ | 4,698 |
| | |
| | |
| | |
| | |
| | |
| | |
| | |
| | |
| Net ALM contracts | $ | 11,577 |
| | |
| | |
| | |
| | |
| | |
| | |
| | |
| | |
|
| | | | | | | | | | | | | | | | | | | | | | | | | | | | | | | | | | | | | |
| | | | | December 31, 2010 | | | | | | December 31, 2011 | | |
| | | | | Expected Maturity | | | | | | Expected Maturity | | |
| (Dollars in millions, average estimated duration in years) | (Dollars in millions, average estimated duration in years) | Fair Value | | Total | | 2011 | | 2012 | | 2013 | | 2014 | | 2015 | | Thereafter | | Average Estimated Duration | (Dollars in millions, average estimated duration in years) | Fair Value | | Total | | 2012 | | 2013 | | 2014 | | 2015 | | 2016 | | Thereafter | | Average Estimated Duration |
Receive-fixed interest rate swaps (1, 2) | Receive-fixed interest rate swaps (1, 2) | $ | 7,364 |
| | |
| | |
| | |
| | |
| | |
| | |
| | |
| | 4.45 |
| Receive-fixed interest rate swaps (1, 2) | $ | 13,989 |
| | |
| | |
| | |
| | |
| | |
| | |
| | |
| | 5.99 |
|
| Notional amount | Notional amount | |
| | $ | 104,949 |
| | $ | 8 |
| | $ | 36,201 |
| | $ | 7,909 |
| | $ | 7,270 |
| | $ | 8,094 |
| | $ | 45,467 |
| | |
| Notional amount | |
| | $ | 105,938 |
| | $ | 22,422 |
| | $ | 8,144 |
| | $ | 7,604 |
| | $ | 10,774 |
| | $ | 11,660 |
| | $ | 45,334 |
| | |
|
| Weighted-average fixed-rate | Weighted-average fixed-rate | |
| | 3.94 | % | | 1.00 | % | | 2.49 | % | | 3.90 | % | | 3.66 | % | | 3.71 | % | | 5.19 | % | | |
| Weighted-average fixed-rate | |
| | 4.09 | % | | 2.65 | % | | 3.70 | % | | 3.79 | % | | 4.01 | % | | 3.96 | % | | 4.98 | % | | |
|
Pay-fixed interest rate swaps (1, 2) | Pay-fixed interest rate swaps (1, 2) | (3,827 | ) | | |
| | |
| | |
| | |
| | |
| | |
| | |
| | 6.03 |
| Pay-fixed interest rate swaps (1, 2) | (13,561 | ) | | |
| | |
| | |
| | |
| | |
| | |
| | |
| | 12.17 |
|
| Notional amount | Notional amount | |
| | $ | 156,067 |
| | $ | 50,810 |
| | $ | 16,205 |
| | $ | 1,207 |
| | $ | 4,712 |
| | $ | 10,933 |
| | $ | 72,200 |
| | |
| Notional amount | |
| | $ | 77,985 |
| | $ | 2,150 |
| | $ | 1,496 |
| | $ | 1,750 |
| | $ | 15,026 |
| | $ | 8,951 |
| | $ | 48,612 |
| | |
|
| Weighted-average fixed-rate | Weighted-average fixed-rate | |
| | 3.02 | % | | 2.37 | % | | 2.15 | % | | 2.88 | % | | 2.40 | % | | 2.75 | % | | 3.76 | % | | |
| Weighted-average fixed-rate | |
| | 3.29 | % | | 1.45 | % | | 2.68 | % | | 1.80 | % | | 2.35 | % | | 3.13 | % | | 3.76 | % | | |
|
Same-currency basis swaps (3) | Same-currency basis swaps (3) | 103 |
| | |
| | |
| | |
| | |
| | |
| | |
| | |
| | |
| Same-currency basis swaps (3) | 61 |
| | |
| | |
| | |
| | |
| | |
| | |
| | |
| | |
|
| Notional amount | Notional amount | |
| | $ | 152,849 |
| | $ | 13,449 |
| | $ | 49,509 |
| | $ | 31,503 |
| | $ | 21,085 |
| | $ | 11,431 |
| | $ | 25,872 |
| | |
| Notional amount | |
| | $ | 222,641 |
| | $ | 44,898 |
| | $ | 83,248 |
| | $ | 35,678 |
| | $ | 14,134 |
| | $ | 17,113 |
| | $ | 27,570 |
| | |
|
Foreign exchange basis swaps (2, 4, 5) | Foreign exchange basis swaps (2, 4, 5) | 4,830 |
| | |
| | |
| | |
| | |
| | |
| | |
| | |
| | |
| Foreign exchange basis swaps (2, 4, 5) | 3,409 |
| | |
| | |
| | |
| | |
| | |
| | |
| | |
| | |
|
| Notional amount | Notional amount | |
| | 235,164 |
| | 21,936 |
| | 39,365 |
| | 46,380 |
| | 41,003 |
| | 23,430 |
| | 63,050 |
| | |
| Notional amount | |
| | 262,428 |
| | 60,359 |
| | 49,161 |
| | 55,111 |
| | 20,401 |
| | 43,360 |
| | 34,036 |
| | |
|
Option products (6) | Option products (6) | (120 | ) | | |
| | |
| | |
| | |
| | |
| | |
| | |
| | |
| Option products (6) | (1,875 | ) | | |
| | |
| | |
| | |
| | |
| | |
| | |
| | |
|
Notional amount (7) | Notional amount (7) | |
| | 6,572 |
| | (1,180 | ) | | 2,092 |
| | 2,390 |
| | 603 |
| | 311 |
| | 2,356 |
| | |
| Notional amount (7) | |
| | 10,413 |
| | 1,500 |
| | 2,950 |
| | 600 |
| | 300 |
| | 458 |
| | 4,605 |
| | |
|
Foreign exchange contracts (2, 5, 8) | Foreign exchange contracts (2, 5, 8) | 4,272 |
| | |
| | |
| | |
| | |
| | |
| | |
| | |
| | |
| Foreign exchange contracts (2, 5, 8) | 2,522 |
| | |
| | |
| | |
| | |
| | |
| | |
| | |
| | |
|
Notional amount (7) | Notional amount (7) | |
| | 109,544 |
| | 59,508 |
| | 5,427 |
| | 10,048 |
| | 13,035 |
| | 2,372 |
| | 19,154 |
| | |
| Notional amount (7) | |
| | 52,328 |
| | 20,470 |
| | 3,556 |
| | 10,165 |
| | 2,071 |
| | 2,603 |
| | 13,463 |
| | |
|
| Futures and forward rate contracts | Futures and forward rate contracts | (21 | ) | | |
| | |
| | |
| | |
| | |
| | |
| | |
| | |
| Futures and forward rate contracts | 153 |
| | |
| | |
| | |
| | |
| | |
| | |
| | |
| | |
|
Notional amount (7) | Notional amount (7) | |
| | (280 | ) | | (280 | ) | | — |
| | — |
| | — |
| | — |
| | — |
| | |
| Notional amount (7) | |
| | 12,160 |
| | 12,160 |
| | — |
| | — |
| | — |
| | — |
| | — |
| | |
|
| Net ALM contracts | Net ALM contracts | $ | 12,601 |
| | |
| | |
| | |
| | |
| | |
| | |
| | |
| | |
| Net ALM contracts | $ | 4,698 |
| | |
| | |
| | |
| | |
| | |
| | |
| | |
| | |
|
| |
(1) | At both December 31, 2011 and 2010, the receive-fixed interest rate swap notional amounts that represented forward starting swaps and which will not be effective until their respective contractual start dates totaled $1.7 billion.billion compared to none at December 31, 2012. The forward starting pay-fixed swap positions at December 31, 20112012 and 20102011 were $8.8 billion$520 million and $34.5$8.8 billion. |
| |
(2) | Does not include basis adjustments on either fixed-rate debt issued by the Corporation or AFS debt securities which are hedged using derivatives designated as fair value hedging instruments that substantially offset the fair values of these derivatives. |
| |
(3) | At December 31, 20112012 and 20102011, the notional amount of same-currency basis swaps consisted of $222.6213.5 billion and $152.8222.6 billion in both foreign currency and U.S. dollar-denominated basis swaps in which both sides of the swap are in the same currency. |
| |
(4) | Foreign exchange basis swaps consisted of cross-currency variable interest rate swaps used separately or in conjunction with receive-fixed interest rate swaps. |
| |
(5) | Does not include foreign currency translation adjustments on certain non-U.S. debt issued by the Corporation that substantially offset the fair values of these derivatives. |
| |
(6) | The notional amount of option products of $4.2 billion at December 31, 2012 were comprised of $18 million in purchased caps/floors and $4.2 billion in swaptions. Option products of $10.4 billion at December 31, 2011 were comprised of $30 million in purchased caps/floors and $10.4 billion in swaptions and $0 in foreign exchange options. Option products of $6.6 billion at December 31, 2010 were comprised of $160 million in purchased caps/floors, $8.2 billion in swaptions and $(1.8) billion in foreign exchange options.swaptions. |
| |
(7) | Reflects the net of long and short positions. |
| |
(8) | The notional amount of foreign exchange contracts of $(1.2) billion at December 31, 2012 was comprised of $41.9 billion in foreign currency-denominated and cross-currency receive-fixed swaps, $10.5 billion in foreign currency-denominated pay-fixed swaps, and $(32.6) billion in net foreign currency forward rate contracts. Foreign exchange contracts of $52.3 billion at December 31, 2011 waswere comprised of $40.6 billion in foreign currency-denominated and cross-currency receive-fixed swaps, $647 million in foreign currency-denominated pay-fixed swaps and $12.4 billion in net foreign currency forward rate contracts. Foreign exchange contracts of $109.5 billion at December 31, 2010 were comprised of $57.6 billion in foreign currency-denominated and cross-currency receive-fixed swaps and $52.0 billion in net foreign currency forward rate contracts. There were no foreign currency-denominated pay-fixed swaps at December 31, 2010. |
|
| | |
| | 118Bank of America 20112012119
| | |
We use interest rate derivative instruments to hedge the variability in the cash flows of our assets and liabilities and other forecasted transactions (collectively referred to as cash flow hedges). The net losses on both open and terminated cash flow hedge derivative instruments recorded in accumulated OCI, net-of-tax, were $3.82.9 billion and $3.23.8 billion at December 31, 20112012 and 20102011. These net losses are expected to be reclassified into earnings in the same period as the hedged cash flows affect earnings and will decrease income or increase expense on the respective hedged cash flows. Assuming no change in open cash flow derivative hedge positions and no changes in prices or interest rates beyond what is implied in forward yield curves at December 31, 20112012, the pre-tax net losses are expected to be reclassified into earnings as follows: $1.5$1.0 billion, or 2622 percent within the next year, 5558 percent in years two through five, and 1213 percent in years six through ten, with the remaining seven percent thereafter. For more information on derivatives designated as cash flow hedges, see Note 43 – Derivatives to the Consolidated Financial Statements.
We hedge our net investment in non-U.S. operations determined to have functional currencies other than the U.S. dollar using forward foreign exchange contracts that typically settle in less than 180 days, cross-currency basis swaps, foreign exchange options and foreign currency-denominated debt. We recorded after-tax gains on derivatives and foreign currency-denominated debt in accumulated OCI associated with net investment hedges which were offset by losses on our net investments in consolidated non-U.S. entities at December 31, 20112012.
Mortgage Banking Risk Management
We originate, fund and service mortgage loans, which subject us to credit, liquidity and interest rate risks, among others. We determine whether loans will be HFI or held-for-sale at the time of commitment and manage credit and liquidity risks by selling or securitizing a portion of the loans we originate.
Interest rate risk and market risk can be substantial in the mortgage business. Fluctuations in interest rates drive consumer demand for new mortgages and the level of refinancing activity, which in turn, affects total origination and service fee income. Typically, a decline in mortgage interest rates will lead to an increase in mortgage originations and fees and a decrease in the value of the MSRs driven by higher prepayment expectations. Hedging the various sources of interest rate risk in mortgage banking is a complex process that requires complex modeling and ongoing monitoring. IRLCs and the related residential first mortgage LHFS are subject to interest rate risk between the date of the IRLC and the date the loans are sold to the secondary market. To hedge interest rate risk, we utilize forward loan sale commitments and other derivative instruments including purchased options. These instruments are used as economic hedgesto hedge certain market risks of IRLCs and residential first mortgage LHFS. At December 31, 20112012 and 20102011, the notional amount of derivatives economically hedging the IRLCs and residential first mortgage LHFS was $14.7$31.1 billion and $129.0$14.7 billion.
MSRs are nonfinancial assets created when the underlying mortgage loan is sold to investors and we retain the right to service the loan. We use certain derivatives such as interest rate options, interest rate swaps, forward rate agreements,settlement contracts and Eurodollar and U.S. Treasury futures, as well as mortgage-backedMBS and U.S. Treasury securities as economic hedgesTreasuries to hedge certain market risks of MSRs. The notional amounts of the derivative
contracts and principal value of other securities designated as economic hedges ofhedging the MSRs were $2.5 trillion and $31.3 billion at December 31, 2012 compared to $2.6 trillion and $46.3 billion at
December 31, 2011 compared to $1.6 trillion and $60.3 billion at December 31, 2010. In 20112012, we recorded gains in mortgage banking income of $6.3$2.3 billion related to the change in fair value of these economic hedgesthe derivative contracts and other securities used to hedge the market risks of the MSRs compared to $5.0$6.3 billion for 20102011. For additional information on MSRs, see Note 2524 – Mortgage Servicing Rights to the Consolidated Financial Statements and for more information on mortgage banking income, see CRES on page 4341.
Compliance Risk Management
Compliance risk arisesis the risk of legal or regulatory sanctions, material financial loss or damage to the reputation of the Corporation arising from the failure to adherecomply with requirements applicable to banking and financial services laws, rules regulations, and internal policies and procedures. Compliance risk can expose the Corporation to reputational risks as well as fines, civil money penalties or payment of damages and can lead to diminished business opportunities and diminished ability to expand key operations.regulations. Compliance is at the core of the Corporation’s culture and is a key component of risk management discipline.
The Global Compliance organization is responsible for driving a culture of compliance,compliance; establishing compliance program standardsrequirements and related policies; executing the monitoring and testing of business controls; performing risk assessments on the businesses’ adherence to laws, rules and standardsregulations as well as the effectiveness of business controls; deliveringoverseeing remediation of compliance risk reporting;risks and ensuringissues executed by the businesses and supporting the identification, escalation and timely mitigationreporting of current, emerging and existingreputational compliance risks.risk matters to senior management and the Board (or appropriate committee). Global Compliance is also responsible for facilitating processes to effectively manage regulatory changes and influence the dynamic regulatory environment and buildmaintain constructive relationships with regulators.
The Board provides oversight of compliance risks through its Audit Committee.
Operational Risk Management
The Corporation defines operational risk as the risk of loss resulting from inadequate or failed internal processes, people and systems or from external events. Operational risk may occur anywhere in the Corporation, not solely in operations functions, and its effects may extend beyond financial losses. Operational risk includes legal risk. Successful operational risk management is particularly important to diversified financial services companies because of the nature, volume and complexity of the financial services business. Global banking guidelines and country-specific requirements for managing operational risk were established in Basel II2 which requirerequires that the Corporation has internal operational risk management processes to assess and measure operational risk exposure and to set aside appropriate capital to address those exposures.
Under the advanced measurement rules of the Basel II Rules,2 Framework, an operational loss event is an event that results in a loss and is associated with any of the following seven operational loss event categories: internal fraud; external fraud; employment practices and workplace safety; clients, products and business practices; damage to physical assets; business disruption and system failures; and execution, delivery and process management. Specific examples of loss events include robberies, credit card fraud, processing errors and physical losses from natural disasters.
Under our Operational Risk Management Program, we
We approach operational risk management from two perspectives to best manage operational risk within the structure of the Corporation: (1) at the enterprise level to provide independent, integrated management of operational risk across the organization, and (2) at
the business and enterprise control function levels to address operational risk in revenue producing and non-revenue producing units. The Operational Risk Management Program incorporates the overarching processes for identifying, measuring, mitigating, controlling, monitoring, testing, reviewing operational risk, and reporting operational risk information to management and the Board. A sound internal governance structure enhances the effectiveness of the Corporation’s Operational Risk Management Program and is accomplished at the enterprise level through formal oversight by the Board, the CRO and a variety of management committees and risk oversight groups aligned to the Corporation’s overall risk governance framework and practices. Of these, the Compliance and Operational Risk Committee (ORC)(CORC) oversees and approves the Corporation’s policies and processes for sound operational risk management. The ORCCORC also serves as an escalation point for critical operational risk matters within the Corporation. The ORCCORC reports operational risk activities to the Enterprise Risk Committee of the Board.
Within the Global Risk Management organization, the Corporate Operational Risk team develops and guides the strategies, policies, practices, controls and monitoring tools for assessing and managing operational risks across the organization and reports results to the businesses, enterprise control functions, senior management, governance committees and the Board.
Corporate Audit provides independent assessment and validation through testing of key processes and controls across the Corporation. An annual Audit Plan ensures that coverage activities address the significant aspects of the Corporation’s risk profile. Risk assessments incorporating operational risk are completed within the audit planning process.
The business and enterprise control functions are responsible for managing all the risks within the business line,their units, including operational risks. In addition to enterprise risk management tools such as loss reporting, scenario analysis and RCSAs, operational risk executives, working in conjunction with senior business executives, have developed key tools to help identify, measure, mitigate and monitor risk in each business and enterprise control function. Examples of these include personnel management practices,practices; data reconciliation processes,processes; fraud management units,units; transaction processing, monitoring and analysis,analysis; business recovery planningplanning; and new product introduction processes. The business and enterprise control functions are also responsible for consistently implementing, and monitoring adherence to, corporate practices.
Business and enterprise control function management uses the enterprise risk and control self-assessmentRCSA process to identify and evaluate the status of risk and control issues, including mitigation plans, as appropriate. The goalgoals of this process isare to assess changing market and business conditions, to evaluate key risks impacting each business and enterprise control function and assess the controls in place to mitigate the risks. The risk and control self-assessmentRCSA process is documented at periodic intervals. Key operational risk indicators for these risks have been developed and are used to help identify trends and issues on an enterprise, business and enterprise control function level. Independent review and challenge to the Corporation’s overall operational risk management framework is performed by the Corporate Operational Risk Validation Team.
Enterprise control functions have risk governance and control responsibilities for their enterprise programs (e.g., Global Technology and Operations Group, Chief Financial Officer Group, Global Marketing and Corporate Affairs, Global Human Resources). They provide insights on day-to-day risk activities throughout the Company by overseeing and managing the performance of their functions against Company-wide expectations. The enterprise control functions participate in the operational risk management process in two ways. First, these organizations manage risk in their functional department. Second, they provide specialized risk management services (e.g., information management, vendor management) within their area of expertise to the enterprise, and the businesses and other enterprise control functions they support. These groups also work with business and risk executives to develop and guide appropriate strategies, policies, practices, controls and monitoring tools for each business and enterprise control function relative to these programs.
Additionally, where appropriate, insurance policies are purchased to mitigate the impact of operational losses when and if they occur.losses. These insurance policies are explicitly incorporated in the structural features of operational risk evaluation. As
insurance recoveries, especially given recent market events, are subject to legal and financial uncertainty, the inclusion of these insurance policies is subject to reductions in their expected mitigating benefits.
Complex Accounting Estimates
Our significant accounting principles, as described in Note 1 – Summary of Significant Accounting Principles to the Consolidated Financial Statements are essential in understanding the Management’s Discussion and Analysis of Financial Condition and Results of Operations.MD&A. Many of our significant accounting principles require complex judgments to estimate the values of assets and liabilities. We have procedures and processes in place to facilitate making these judgments.
The more judgmental estimates are summarized in the following discussion. We have identified and described the development of the variables most important in the estimation processes that with the exception of accrued taxes, involve mathematical models to derive the estimates. In many cases, there are numerous alternative judgments that could be used in the process of determining the inputs to the models. Where alternatives exist, we have used the factors that we believe represent the most reasonable value in developing the inputs. Actual performance that differs from our estimates of the key variables could impact our results of operations. Separate from the possible future impact to our results of operations from input and model variables, the value of our lending portfolio and market-sensitive assets and liabilities may change subsequent to the balance sheet date, often significantly, due to the nature and magnitude of future credit and market conditions. Such credit and market conditions may change quickly and in unforeseen ways and the resulting volatility could have a significant, negative effect on future operating results. These fluctuations would not be indicative of deficiencies in our models or inputs.
Allowance for Credit Losses
The allowance for credit losses, which includes the allowance for loan and lease losses and the reserve for unfunded lending commitments, represents management’s estimate of probable losses inherent in the Corporation’s loan portfolio excluding those loans accounted for under the fair value option. Changes to the allowance for credit losses are reported in the Corporation’s Consolidated Statement of Income in the provision for credit
losses. Our process for determining the allowance for credit losses is discussed in Note 1 – Summary of Significant Accounting Principles to the Consolidated Financial Statements. We evaluate our allowance at the portfolio segment level and our portfolio segments are home loans, credit cardHome Loans, Credit Card and other consumer,Other Consumer, and commercial.Commercial. Due to the variability in the drivers of the assumptions used in this process, estimates of the portfolio’s inherent risks and overall collectability change with changes in the economy, individual industries, countries, and borrowers’ or counterparties’ ability and willingness to repay their obligations. The degree to which any particular assumption affects the allowance for credit losses depends on the severity of the change and its relationship to the other assumptions.
Key judgments used in determining the allowance for credit losses include risk ratings for pools of commercial loans and leases, market and collateral values and discount rates for individually evaluated loans, product type classifications for consumer and commercial loans and leases, loss rates used for
consumer and commercial loans and leases, adjustments made to address current events and conditions, considerations regarding domestic and global economic uncertainty, and overall credit conditions.
Our estimate for the allowance for loan and lease losses is sensitive to the loss rates and expected cash flows from our home loans,Home Loans and credit cardCredit Card and other consumerOther Consumer portfolio segments.segments, as well as our U.S. small business commercial portfolio within the Commercial portfolio segment. For each one percent increase in the loss rates on loans collectively evaluated for impairment in our home loansHome Loans portfolio segment, excluding PCI loans, coupled with a one percent decrease in the discounted cash flows on those loans individually evaluated for impairment within this portfolio segment, the allowance for loan and lease losses at December 31, 20112012 would have increased by $156$147 million. PCI loans within our home loansHome Loans portfolio segment are initially recorded at fair value. Applicable accounting guidance prohibits carry-over or creation of valuation allowances in the initial accounting. However, subsequent decreases in the expected cash flows from the date of acquisition result in a charge to the provision for credit losses and a corresponding increase to the allowance for loan and lease losses. We subject our PCI portfolio to stress scenarios to evaluate the potential impact given certain events. A one percent decrease in the expected cash flows could result in a $241$208 million impairment of the portfolio, of which $115$99 million would be related to our discontinued real estate portfolio. For each one percent increase in the loss rates on loans collectively evaluated for impairment within our credit cardCredit Card and other consumerOther Consumer portfolio segment and U.S. small business commercial portfolio coupled with a one percent decrease in the expected cash flows on those loans individually evaluated for impairment within thisthe portfolio segment and the U.S. small business commercial portfolio, the allowance for loan and lease losses at December 31, 20112012 would have increased by $84$60 million.
Our allowance for loan and lease losses is sensitive to the risk ratings assigned to loans and leases within ourthe Commercial portfolio segment (excluding the U.S. small business commercial portfolio segment.portfolio). Assuming a downgrade of one level in the internal risk ratings for commercial loans and leases, except loans and leases already risk-rated Doubtful as defined by regulatory authorities, the allowance for loan and lease losses would have increased by $3.1$2.2 billion at December 31, 20112012.
The allowance for loan and lease losses as a percentage of total loans and leases at December 31, 20112012 was 3.682.69 percent and these hypothetical increases in the allowance would raise the ratio to 4.002.98 percent.
These sensitivity analyses do not represent management’s expectations of the deterioration in risk ratings or the increases in loss rates but are provided as hypothetical scenarios to assess the sensitivity of the allowance for loan and lease losses to changes in key inputs. We believe the risk ratings and loss severities currently in use are appropriate and that the probability of the alternative scenarios outlined above occurring within a short period of time is remote.
The process of determining the level of the allowance for credit losses requires a high degree of judgment. It is possible that others, given the same information, may at any point in time reach different reasonable conclusions.
Mortgage Servicing Rights
MSRs are nonfinancial assets that are created when a mortgage loan is sold and we retain the right to service the loan. We account for consumer MSRs at fair value with changes in fair value recorded in the Corporation’s Consolidated Statement of Income in mortgage banking income. Commercial-relatedincome (loss). Commercial and residential reverse mortgage
MSRs are accounted for using the amortization method, lower of amortized cost or fairmarket value, with impairment recognized as a reduction of mortgage banking income.income (loss). At December 31, 20112012, our total MSR balance was $7.55.9 billion.
We determine the fair value of our consumer MSRs using a valuation model that calculates the present value of estimated future net servicing income. The model incorporates key economic assumptions including estimates of prepayment rates and resultant weighted-average lives of the MSRs, and the option-adjusted spread levels. These variables can, and generally do, change from quarter to quarter as market conditions and projected interest rates change. These assumptions are subjective in nature and changes in these assumptions could materially affect our operating results. For example, decreasing the prepayment rate assumption used in the valuation of our consumer MSRs by 10 percent while keeping all other assumptions unchanged could have resulted in an estimated increase of $639510 million in MSRs and mortgage banking income (loss) at December 31, 20112012. This impact does not reflect any hedge strategies that may be undertaken to mitigate such risk.
We manage potential changes in the fair value of MSRs through a comprehensive risk management program. The intent is to mitigate the effects of changes in the fair value of MSRs through the use of risk management instruments. To reduce the sensitivity of earnings to interest rate and market value fluctuations, securities including MBS and U.S. Treasuries, as well as certain derivatives such as options and interest rate swaps may be used as economic hedgesto hedge certain market risks of the MSRs, but are not designated as accounting hedges. These instruments are carried at fair value with changes in fair value recognized in mortgage banking income.income (loss). For more information, see Mortgage Banking Risk Management on page 119120.
For additional information on MSRs, including the sensitivity of weighted-average lives and the fair value of MSRs to changes in modeled assumptions, see Note 2524 – Mortgage Servicing Rights to the Consolidated Financial Statements.
Fair Value of Financial Instruments
We determineclassify the fair values of financial instruments based on the fair value hierarchy under applicable accounting guidance which requires an entity to maximize the use of observable inputs and minimize the use of unobservable inputs when measuring fair value. Applicable accounting guidance establishes three levels of inputs used to measure fair value. We carry trading account assets and liabilities, derivative assets and liabilities, AFS debt and marketable equity securities, certain MSRs and certain other assets at fair value. Also, we account for certain corporate loans and loan commitments, LHFS, other short-term borrowings, securities financing agreements, asset-backed secured financings, long-term deposits and long-term debt under the fair value option. For more information, see Note 2221 – Fair Value Measurements and Note 2322 – Fair Value Option to the Consolidated Financial Statements.
The fair values of assets and liabilities may include adjustments, forsuch as market liquidity and credit quality, and other deal specific factors, where appropriate. Valuations of products using models or other techniques are sensitive to assumptions used for the significant inputs. Where market data is available, the inputs used for valuation reflect that information as of our valuation date. Inputs to valuation models are considered unobservable if they are supported by little or no market activity. In periods of extreme volatility, lessened liquidity or in illiquid markets, there may be
more variability in market pricing or a lack of market data to use in the valuation process. In keeping with the prudent application of estimates and management judgment in determining the fair value of assets and liabilities, we have in place various processes and controls that include: a model validation policy that requires review and approval of quantitative models used for deal pricing, financial statement fair value determination and risk quantification; a trading product valuation policy that requires verification of all traded product valuations; and a periodic review and substantiation of daily profit and loss reporting for all traded products. Primarily through validation controls, we utilize both broker and pricing service inputs which can and do include both market-observable and internally-modeled values and/or valuation inputs. Our reliance on this information is tempered by the knowledge of how the broker and/or pricing service develops its data with a higher degree of reliance applied to those that are more directly observable and lesser reliance applied to those developed through their own internal modeling. Similarly, broker quotes that are executable are given a higher level of reliance than indicative broker quotes, which are not executable. These processes and controls are performed independently of the business.
Trading account assets and liabilities are carried at fair value based primarily on actively traded markets where prices are from either direct market quotes or observed transactions. Liquidity is a significant factor in the determination of the fair value of trading account assets and liabilities. Market price quotes may not be readily available for some positions, or positions within a market sector where trading activity has slowed significantly or ceased. Situations of illiquidity generally are triggered by market perception of credit uncertainty regarding a single company or a specific market sector. In these instances, fair value is determined based on limited available market information and other factors,
principally from reviewing the issuer’s financial statements and changes in credit ratings made by one or more of the rating agencies.
Trading account profits, which represent the net amount earned from our trading positions, can be volatile and are largely driven by general market conditions and customer demand. Trading account profits are dependent on the volume and type of transactions, the level of risk assumed, and the volatility of price and rate movements at any given time within the ever-changing market environment. To evaluate risk in our trading activities, we focus on the actual and potential volatility of individual positions as well as portfolios. At a portfolio and corporate level, we use
trading limits, stress testing and tools such as VaR modeling, which estimates a potential daily loss that we do not expect to exceed with a specified confidence level, to measure and manage market risk. For more information on VaR, see Trading Risk Management on page 113114.
The fair values of derivative assets and liabilities traded in the OTC market are determined using quantitative models that require the use of multiple market inputs including interest rates, prices and indices to generate continuous yield or pricing curves and volatility factors, which are used to value the positions. The majority of market inputs are actively quoted and can be validated through external sources including brokers, market transactions and third-party pricing services. Estimation risk is greater for derivative asset and liability positions that are either option-based or have longer maturity dates where observable market inputs are less readily available or are unobservable, in which case quantitative-based extrapolations of rate, price or index scenarios are used in determining fair values. The Corporation incorporates within its fair value measurements of OTC derivatives a valuation adjustment to reflect the credit risk associated with the net position. Positions are netted by counterparty and fair value for net long exposures is adjusted for counterparty credit risk while the fair value for net short exposures is adjusted for our own credit risk. The credit adjustments are determined by reference to existing direct market reference costs of credit, or where direct references are not available, a proxy is applied consistent with direct references for other counterparties that are similar in credit risk. An estimate of severity of loss is also used in the determination of fair value, primarily based on market implied experience adjusted for any more recent name specific expectations.
Level 3 Assets and Liabilities
Financial assets and liabilities whose values are based on valuation techniques that require inputs that are both unobservable and are significant to the overall fair value measurement are classified as Level 3 under the fair value hierarchy established in applicable accounting guidance. The Level 3 financial assets and liabilities include consumer MSRs,certain loans, MBS, ABS, CDOs and structured liabilities, as well as highly structured, complex or long-dated derivative contracts, and private equity investments as well as certain loans, MBS, ABS, structured liabilities and CDOs.consumer MSRs. The fair value of these Level 3 financial assets and liabilities is determined using pricing models, discounted cash flow methodologies or similar techniques for which the determination of fair value requires significant management judgment or estimation.
|
| | |
| | 122Bank of America 20112012123
| | |
| | | | | | | | | | | | | | | | | | | | | | | | | | | |
| Table 61 | Level 3 Asset and Liability Summary | | | | | | | | | | | | |
| Table 66 | | Level 3 Asset and Liability Summary | | | | | | | | | | | |
| | | | | | | | | | | | | | | | | | | | | | | | | |
| | | December 31, 2011 | | December 31, 2010 | | December 31, 2012 | | December 31, 2011 |
| (Dollars in millions) | (Dollars in millions) | Level 3 Fair Value | | As a %
of Total
Level 3 Assets | | As a %
of Total Assets | | Level 3 Fair Value | | As a %
of Total
Level 3 Assets | | As a %
of Total Assets | (Dollars in millions) | Level 3 Fair Value | | As a %
of Total
Level 3 Assets | | As a %
of Total Assets | | Level 3 Fair Value | | As a %
of Total
Level 3 Assets | | As a %
of Total Assets |
| Trading account assets | Trading account assets | $ | 11,455 |
| | 22.21 | % | | 0.54 | % | | $ | 15,525 |
| | 19.56 | % | | 0.69 | % | Trading account assets | $ | 9,559 |
| | 26.13 | % | | 0.43 | % | | $ | 11,455 |
| | 22.21 | % | | 0.54 | % |
| Derivative assets | Derivative assets | 14,366 |
| | 27.85 |
| | 0.67 |
| | 18,773 |
| | 23.65 |
| | 0.83 |
| Derivative assets | 8,073 |
| | 22.06 |
| | 0.37 |
| | 14,366 |
| | 27.85 |
| | 0.67 |
|
| AFS securities | 8,012 |
| | 15.53 |
| | 0.38 |
| | 15,873 |
| | 19.99 |
| | 0.70 |
| |
| AFS debt securities | | AFS debt securities | 5,091 |
| | 13.91 |
| | 0.23 |
| | 8,012 |
| | 15.53 |
| | 0.38 |
|
| All other Level 3 assets at fair value | All other Level 3 assets at fair value | 17,744 |
| | 34.41 |
| | 0.83 |
| | 29,217 |
| | 36.80 |
| | 1.29 |
| All other Level 3 assets at fair value | 13,865 |
| | 37.90 |
| | 0.63 |
| | 17,744 |
| | 34.41 |
| | 0.83 |
|
Total Level 3 assets at fair value (1) | Total Level 3 assets at fair value (1) | $ | 51,577 |
| | 100.00 | % | | 2.42 | % | | $ | 79,388 |
| | 100.00 | % | | 3.51 | % | Total Level 3 assets at fair value (1) | $ | 36,588 |
| | 100.00 | % | | 1.66 | % | | $ | 51,577 |
| | 100.00 | % | | 2.42 | % |
| | | Level 3 Fair Value | | As a %
of Total
Level 3 Liabilities | | As a %
of Total Liabilities | | Level 3 Fair Value | | As a %
of Total
Level 3 Liabilities | | As a %
of Total Liabilities | | Level 3 Fair Value | | As a %
of Total
Level 3 Liabilities | | As a %
of Total Liabilities | | Level 3 Fair Value | | As a %
of Total
Level 3 Liabilities | | As a %
of Total Liabilities |
| Derivative liabilities | Derivative liabilities | $ | 8,500 |
| | 73.46 | % | | 0.45 | % | | $ | 11,028 |
| | 70.90 | % | | 0.54 | % | Derivative liabilities | $ | 6,605 |
| | 73.51 | % | | 0.33 | % | | $ | 8,500 |
| | 73.46 | % | | 0.45 | % |
| Long-term debt | Long-term debt | 2,943 |
| | 25.43 |
| | 0.15 |
| | 2,986 |
| | 19.20 |
| | 0.15 |
| Long-term debt | 2,301 |
| | 25.61 |
| | 0.12 |
| | 2,943 |
| | 25.43 |
| | 0.15 |
|
| All other Level 3 liabilities at fair value | All other Level 3 liabilities at fair value | 128 |
| | 1.11 |
| | 0.01 |
| | 1,541 |
| | 9.90 |
| | 0.07 |
| All other Level 3 liabilities at fair value | 79 |
| | 0.88 |
| | 0.01 |
| | 128 |
| | 1.11 |
| | 0.01 |
|
Total Level 3 liabilities at fair value (1) | Total Level 3 liabilities at fair value (1) | $ | 11,571 |
| | 100.00 | % | | 0.61 | % | | $ | 15,555 |
| | 100.00 | % | | 0.76 | % | Total Level 3 liabilities at fair value (1) | $ | 8,985 |
| | 100.00 | % | | 0.46 | % | | $ | 11,571 |
| | 100.00 | % | | 0.61 | % |
| |
(1) | Level 3 total assets and liabilities are shown before the impact of counterparty netting related to our derivative positions. |
During 20112012, we recognized net gains of $451136 million on Level 3 assets and liabilities. The net gains during the year were primarily ingains on trading account profits combined with gains on IRLCs, partiallyassets, LHFS, and loans and leases, offset by losses on MSRs.MSRs, long-term debt and net derivative assets. Unrealized gains on trading account assets were primarily due to mark-to-market gains on collateralized loan obligation positions due to strong market conditions, as well as mark-to-market gains on secondary loan positions held in inventory. Unrealized gains on LHFS were due to improved market conditions for mortgage whole loans in EMEA. Unrealized gains on loans and leases were due to an overall improvement in housing prices and lower loss severity. Unrealized losses on MSRs were primarily due to the impact of the decline in interest rates on forecasted prepayments. Unrealized losses on long-term debt were the result of improved credit spreads throughout the year. Losses on net derivative assets were primarily due to tightening spreads on credit derivatives and in the RMBS indices, as well as mark-to-market movement in various equity instruments, offset by mortgage production gains. There were net unrealized gains of $1965 million in accumulated OCI on Level 3 assets and liabilities at December 31, 20112012. For additional information on the components of net realized and unrealized gains and losses during 2012, see Note 21 – Fair Value Measurementsto the Consolidated Financial Statements.
Level 3 financial instruments, such as our consumer MSRs, may be economically hedged with derivatives classified as Level 1 or 2; therefore, gains or losses associated with Level 3 financial instruments may be offset by gains or losses associated with financial instruments classified in other levels of the fair value hierarchy. The Level 3 gains and losses recorded in earnings did not have a significant impact on our liquidity or capital resources.
We conduct a review of our fair value hierarchy classifications on a quarterly basis. Transfers into or out of Level 3 are made if the significant inputs used in the financial models measuring the fair values of the assets and liabilities became unobservable or observable, respectively, in the current marketplace. These transfers are considered to be effective as of the beginning of the quarter in which they occur. For additional information on the significant transfers into and out of Level 3 during 20112012, see Note 2221 – Fair Value Measurements to the Consolidated Financial Statements.
Global Principal Investments
GPI is included within Equity Investments in All Other on page 5452. GPI is comprised of a diversified portfolio of private equity, real estate and other alternative investments in both privately-held and publicly-traded companies. These investments are made either directly in a company or held through a fund. At December 31, 20112012, this portfolio totaled $5.63.5 billion including $4.3$2.2 billion of non-public investments.
Certain equity investments in the portfolio are subject to investment company accounting under applicable accounting guidance, and accordingly, are carried at fair value with changes
in fair value reported in equity investment income. Initially the transaction price of the investment is generally considered to be the best indicator of fair value. Thereafter, valuation of direct investments is based on an assessment of each individual investment using methodologies that include publicly-traded comparables derived by multiplying a key performance metric (e.g., earnings before interest, taxes, depreciation and amortization) of the portfolio company by the relevant valuation multiple observed for comparable companies, acquisition comparables, entry-level multiples and discounted cash flows, and are subject to appropriate discounts for lack of liquidity or marketability. Certain factors that may influence changes in fair value include but are not limited to, recapitalizations, subsequent rounds of financing and offerings in the equity or debt capital markets. For fund investments, we generally record the fair value of our proportionate interest in the fund’s capital as reported by the fund’s respective managers.
Accrued Income Taxes and Deferred Tax Assets
Accrued income taxes, reported as a component of accrued expenses and other liabilities on ourthe Corporation’s Consolidated Balance Sheet, represent the net amount of current income taxes we expect to pay to or receive from various taxing jurisdictions attributable to our operations to date. We currently file income tax returns in more than 100 jurisdictions and consider many factors, including statutory, judicial and regulatory guidance, in estimating the appropriate accrued income taxes for each jurisdiction.
In applying the applicable accounting guidance, we monitor relevant tax authorities and change our estimate of accrued income taxes due to changes in income tax laws and their interpretation by the courts and regulatory authorities. These revisions of our estimate of accrued income taxes, which also may result from our income tax planning and from the resolution of income tax controversies, may be material to our operating results for any given period.
Net deferred tax assets, reported as a component of other assets on ourthe Corporation’s Consolidated Balance Sheet, represent the net decrease in taxes expected to be paid in the future because of net operating loss (NOL) and tax credit carryforwards and because of future reversals of temporary differences in the bases of assets and liabilities as measured by tax laws and their bases as reported in the financial statements. NOL and tax credit carryforwards result in reductions to future tax liabilities, and many of these attributes can expire if not utilized within certain periods. We consider the need for valuation allowances to reduce net deferred tax assets to the amounts we estimate are more-likely-than-not to be realized.
While we have established some valuation allowances for certain state and non-U.S. deferred tax assets, we have concluded that our various estimates of future taxable income by jurisdiction will be sufficient to realize all U.S. federal and U.K. deferred tax assets, including NOL and tax credit carryforwards, that are not subject to any special limitations (such as change-in-control limitations) prior to any expiration. The majority of our U.K. net deferred tax assets, which consist primarily of NOLs, are realizable by subsidiaries that have a recent history of cumulative losses. These deferred tax assets related to NOLs will be realized over an extended number of years. Significant decreases to our estimateestimates of future taxable income by jurisdiction could materially change our conclusions about how much of our tax attributes and other deferred tax assets are more-likely-than-not to be realized prior to their expiration. See Note 2120 – Income Taxes to the Consolidated Financial Statements for a table of significant tax attributes and additional information.
Goodwill and Intangible Assets
Background
The nature of and accounting for goodwill and intangible assets are discussed in Note 1 – Summary of Significant Accounting Principles and Note 109 – Goodwill and Intangible Assets to the Consolidated Financial Statements. Goodwill is reviewed for potential impairment at the reporting unit level on an annual basis, which for the Corporation is performed as of June 30, and in interim periods if events or circumstances indicate a potential impairment. A reporting unit is an operating segment or one level below. As reporting units are determined after an acquisition or evolve with changes in business strategy, goodwill is assigned to reporting units and it no longer retains its association with a particular acquisition. All of the revenue streams and related activities of a reporting unit, whether acquired or organic, are available to support the value of the goodwill.
We use the reporting units’ allocated equity as a proxy for the carrying amount of equity for each reporting unit in our goodwill impairment tests as we do not maintain a record of equity as defined under GAAP at the reporting unit level. Allocated equity includes economic capital, goodwill and a percentage of intangible assets allocated to the reporting units. The allocation of economic capital to the reporting units utilized for goodwill impairment
testing has the same basis as the allocation of economic capital to our operating segments. Economic capital allocation plans are incorporated into the Corporation’s financial plan which is approved by the Board on an annual basis. Allocated equity is updated on a quarterly basis.
The Corporation’s common stock price remained volatilelow during 20112012 and 2010 primarily due to the continued uncertainty in the economy and in the financial services industry, as well as adverse developments related to our mortgage business and increased regulation.2011. During these periods, our market capitalization remained below our recorded book value. We estimate that the fair value of all reporting units with assigned goodwill in aggregate as of the June 30, 20112012 annual goodwill impairment test was $210.2$219.5 billion and the
aggregate carrying value of all reporting units with assigned goodwill, as measured by allocated equity was $138.4 billion. The common stock market capitalization of the Corporation as of that dateat June 30, 2012 was $111.188.2 billion ($58.6125.1 billion at December 31, 20112012). As none of our reporting units are publicly-traded, individual reporting unit fair value determinations do not directly correlate to the Corporation’s stock price. Although we believe it is reasonable to conclude that market capitalization could be an indicator of fair value over time, we do not believe that recent fluctuations in our current market capitalization reflectreflects the aggregate fair value of our individual reporting units.
Estimating the fair value of reporting units is a subjective process that involves the use of estimates and judgments, particularly related to cash flows, the appropriate discount rates and an applicable control premium. We determined the fair values of the reporting units using a combination of valuation techniques consistent with the market approach and the income approach and included the use ofalso utilized independent valuation specialists.
The market approach we used estimates the fair value of the individual reporting units by incorporating any combination of the tangible capital, book capital and earnings multiples from comparable publicly-traded companies in industries similar to that of the reporting unit. The relative weight assigned to these multiples varies among the reporting units based on qualitative and quantitative characteristics, primarily the size and relative profitability of the reporting unit as compared to the comparable publicly-traded companies. Since the fair values determined under the market approach are representative of a noncontrolling interest, we added a control premium was added to arrive at the reporting units’ estimated fair values on a controlling basis.
For purposes of the income approach, we calculated discounted cash flows by taking the net present value of estimated future cash flows and an appropriate terminal value. Our discounted cash flow analysis employs a capital asset pricing model in estimating the discount rate (i.e., cost of equity financing) for each reporting unit. The inputs to this model include the risk-free rate of return, beta, which is a measure of the level of non-diversifiable risk associated with comparable companies for each specific reporting unit, market equity risk premium and in certain cases an unsystematic (company-specific) risk factor. The unsystematic risk factor is the input that specifically addresses uncertainty related to our projections of earnings and growth, including the uncertainty related to loss expectations. We utilized discount rates that we believe adequately reflect the risk and uncertainty in the financial markets generally and specifically in our internally developed forecasts. We estimated expected rates of equity returns based on historical market returns and risk/return rates for similar industries of theeach reporting unit. We use our internal forecasts to estimate future cash flows and actual results may differ from forecasted results.
International Consumer Card Businesses
Of the $1.9 billion of goodwill associated with the international consumer card businesses, $526 million of goodwill was allocated, on a relative fair value basis, to the Canadian consumer card business which was sold on December 1, 2011.
During the three months ended December 31, 2011, a goodwill impairment test was performed for the European consumer card businesses reporting unit as it was likely that the carrying amount of the business exceeded the fair value due to a decrease in future growth projections. We concluded that goodwill was impaired, and accordingly, recorded a non-cash, non-tax deductible goodwill impairment charge of $581 million for the European consumer card businesses.
|
| | |
| | 124Bank of America 20112012125
| | |
Consumer Real Estate Services
In2012, the IWM businesses within GWIM, including $230 million of goodwill, were moved to All Other in connection with the sale of Balboa on June 1, 2011,agreement we allocated, on a relative fair value basis, entered into during 2012 to sell these businesses. Prior periods have been reclassified.
$193 million2012 of CRES goodwill to the business in determining the gain on the sale.Annual Impairment Test
During the three months ended June 30, 2011, as a consequence of the BNY Mellon Settlement entered into by the Corporation on June 28, 2011, the adverse impact of the incremental mortgage-related charges and the continued economic slowdown in the mortgage business, we performed a goodwill impairment test for the CRES reporting unit. We concluded that the remaining balance of goodwill of $2.6 billion was impaired, and accordingly, recorded a non-cash, non-tax deductible goodwill impairment charge to reduce the carrying value of the goodwill in CRES to zero.
2011 Annual Impairment Test
During the three months ended September 30, 2011,2012, we completed our annual goodwill impairment test as of June 30, 20112012 for all of our reporting units which had goodwill. Additionally, we also evaluated the U.K. Card business within All Other as the U.K. Card business comprises the majority of the goodwill included in All Other. In performing the first step of the annual goodwill impairment analysis,test, we compared the fair value of each reporting unit to its currentestimated carrying value as measured by allocated equity, including goodwill. To determine fair value, we utilized a combination of the market approach and income approach. Under the market approach, we compared earnings and equity multiples of the individual reporting units to multiples of public companies comparable to the individual reporting units. The control premiumspremium used in the June 30, 20112012 annual goodwill impairment test ranged from 25was 35 percent to 35 percent.for all reporting units. Under the income approach, we updated our assumptions to reflect the current market environment. The discount rates used in the June 30, 20112012 annual goodwill impairment test ranged from 11 percent to 1614 percent depending on the relative risk of a reporting unit. Growth rates developed by management for individual revenue and expense items in each reporting unit ranged from 0.7(0.2) percent to 6.77.2 percent. For certain revenue and expense items that have been significantly affected by the current economic environment, and financial reform, management developed separate long-term forecasts.
Based on the results of step one of the annual goodwill impairment test, we determined that step two was not required for any of the reporting units as their respective fair valuevalues exceeded their carrying valuevalues indicating there was no impairment.
20102011 Impairment Tests
During the three months ended September 30, 2010, we performedDecember 31, 2011, a goodwill impairment test was performed for the European consumer card
businesses reporting unit within Card Services All Other as it was likely that the carrying amount of the reporting unit exceeded the fair value due to the continued stress on the business and the uncertain debit card interchange provisions under the Financial Reform Act.a decrease in estimated future growth projections. We concluded that goodwill was impaired, and accordingly, recorded a non-cash, non-tax deductible goodwill impairment charge of $10.4 billion to reduce the carrying value of the goodwill in Card Services581 million.
During the three months ended December 31, 2010,June 30, 2011, as a consequence of the BNY Mellon Settlement entered into by the Corporation on June 28, 2011, the adverse impact of the incremental mortgage-related charges and the continued economic slowdown in the mortgage business, we performed a goodwill impairment test for the CRES reporting unit as it was likely that there was a decline in its fair value as a result of increased uncertainties, including existing and potential litigation exposure and other related risks, higher servicing costs including those related to loss mitigation, foreclosure related issues and the redeployment of centralized sales resources.unit. We concluded
that the remaining balance of goodwill of $2.6 billion was impaired, and accordingly, recorded a non-cash, non-tax deductible goodwill impairment charge to reduce the carrying value of $2.0 billionthe goodwill in CRES to zero.
Representations and Warranties
The methodology used to estimate the liability for obligations under representations and warranties related to transfers of residential mortgage loans is a function of the representations and warranties given and considers a variety of factors. Depending upon the counterparty, these factors include actual defaults, estimated future defaults, historical loss experience, estimated home prices, other economic conditions, estimated probability that we will receive a repurchase request, including consideration of whether presentation thresholds will be met, number of payments made by the borrower prior to default and estimated probability that we will be required to repurchase a loan and the experience with and the behavior of the counterparty.loan. It also considers other relevant facts and circumstances, such as bulk settlements and identity of the counterparty or type of counterparty, as appropriate. The estimate of the liability for obligations under representations and warranties is based upon currently available information, significant judgment, and a number of factors, including those set forth above, that are subject to change. Changes to any one of these factors could significantly impact the estimate of our liability.
The provision for representations and warranties provision may vary significantly each period as the methodology used to estimate the expense continues to be refined based on the level and type of repurchase requests presented, defects identified, the latest experience gained on repurchase requests, and other relevant facts and circumstances. The estimated rangeestimate of possible loss related to non-GSEthe liability for representations and warranties exposure has been disclosed. Foris sensitive to future defaults, loss severity and the GSE claims where we have established a representations and warranties liability as discussed in Note 9 – Representations and Warranties Obligations and Corporate Guaranteesto the Consolidated Financial Statements, annet repurchase rate. An assumed simultaneous increase or decrease of 10 percent in estimated future defaults, loss severity and the net repurchase rate would result in an increase of approximately $850 million or decrease of approximately $800750 million in the representations and warranties liability as of December 31, 20112012. Viewed from, excluding amounts related to the perspective of home prices, for each one percent change in home prices, the liability for representations and warranties on unsettled GSE originations is estimated to be impacted by $125 million based on projected collateral losses and defect rates.FNMA Settlement. These sensitivities are hypothetical and are intended to provide an indication of the impact of a significant change in these key assumptions on the representations and warranties liability. In reality, changes in one assumption may result in changes in other assumptions, which may or may not counteract the sensitivity.
For additional information on representations and warranties exposure and the corresponding range of possible loss, see Off-Balance Sheet Arrangements and Contractual Obligations – Representations and Warranties on page 5654, as well as Note 98 – Representations and Warranties Obligations and Corporate Guarantees and Note 1413 – Commitments and Contingencies to the Consolidated Financial Statements.
Litigation Reserve
In accordance with applicable accounting guidance, the Corporation establishes an accrued liability for litigation and regulatory matters when those matters present loss contingencies that are both probable and estimable. In such cases, there may be an exposure to loss in excess of any amounts accrued. When a loss contingency is not both probable and estimable, the Corporation does not establish an accrued liability. As a litigation or regulatory matter develops, the Corporation, in conjunction with any outside counsel handling the matter, evaluates on an ongoing basis whether such matter presents a loss contingency that is both probable and estimable. If, at the time of evaluation, the loss contingency related to a litigation or regulatory matter is not both probable and estimable, the matter will continue to be monitored for further developments that would make such loss contingency both probable and estimable. Once the loss contingency related to a litigation or regulatory matter is deemed to be both probable and estimable, the Corporation will establish an accrued liability with respect to such loss contingency and record a corresponding amount of litigation-related expense. The Corporation will continue to monitor the matter for further developments that could affect the amount of the accrued liability that has been previously established.
For a limited number of the matters disclosed in Note 1413 – Commitments and Contingencies to the Consolidated Financial Statements for which a loss is probable or reasonably possible in future periods, whether in excess of a related accrued liability or where there is no accrued liability, we are able to estimate a range of possible loss. In determining whether it is possible to provide an estimate of loss or range of possible loss, the Corporation reviews and evaluates its material litigation and regulatory matters on an ongoing basis, in conjunction with any outside counsel handling the matter, in light of potentially relevant factual and legal developments. These may include information learned through the discovery process, rulings on dispositive motions, settlement discussions, and other rulings by courts, arbitrators or others. In cases in which the Corporation possesses sufficient information to develop an estimate of loss or range of possible loss, that estimate is aggregated and disclosed in Note 1413 – Commitments and Contingencies to the Consolidated Financial Statements. For other disclosed matters for which a loss is probable or reasonably possible, such an estimate is not possible. Those matters for which an estimate is not possible are not included within this estimated range. Therefore, the estimated range of possible loss represents what we believe to be an estimate of possible loss only for certain matters meeting these criteria. It does not represent the Corporation’s maximum loss exposure. Information is provided
in Note 1413 – Commitments and Contingencies to the Consolidated Financial Statements regarding the nature of all of these contingencies and, where specified, the amount of the claim associated with these loss contingencies.
Consolidation and Accounting for Variable Interest Entities
In accordance with applicable accounting guidance, an entity that has a controlling financial interest in a VIE is referred to as the primary beneficiary and consolidates the VIE. The Corporation is deemed to have a controlling financial interest and is the primary beneficiary of a VIE if it has both the power to direct the activities of the VIE that most significantly impact the VIE’s economic performance and an obligation to absorb losses or the right to receive benefits that could potentially be significant to the VIE.
Determining whether an entity has a controlling financial interest in a VIE requires significant judgment. An entity must assess the purpose and design of the VIE, including explicit and implicit contractual arrangements, and the entity’s involvement in both the design of the VIE and its ongoing activities. The entity must then determine which activities have the most significant impact on the economic performance of the VIE and whether the entity has the power to direct such activities. For VIEs that hold financial assets, the party that services the assets or makes investment management decisions may have the power to direct the most significant activities of a VIE. Alternatively, a third party that has the unilateral right to replace the servicer or investment manager or to liquidate the VIE may be deemed to be the party with power. If there are no significant ongoing activities, the party that was responsible for the design of the VIE may be deemed to have power. If the entity determines that it has the power to direct the most significant activities of the VIE, then the entity must determine if it has either an obligation to absorb losses or the right to receive benefits that could potentially be significant to the VIE. Such economic interests may include investments in debt or equity instruments issued by the VIE, liquidity commitments, and explicit and implicit guarantees.
On a quarterly basis, we reassess whether we have a controlling financial interest and are the primary beneficiary of a VIE. The quarterly reassessment process considers whether we have acquired or divested the power to direct the activities of the VIE through changes in governing documents or other circumstances. The reassessment also considers whether we have acquired or disposed of a financial interest that could be significant to the VIE, or whether an interest in the VIE has become significant or is no longer significant. The consolidation status of the VIEs with which we are involved may change as a result of such reassessments. Changes in consolidation status are applied prospectively, with assets and liabilities of a newly consolidated VIE initially recorded at fair value. A gain or loss may be recognized upon deconsolidation of a VIE depending on the carrying amounts of deconsolidated assets and liabilities compared to the fair value of retained interests and ongoing contractual arrangements.
|
| | |
| | 126Bank of America 20112012127
| | |
20102011 Compared to 20092010
The following discussion and analysis provides a comparison of our results of operations for 20102011 and 20092010. This discussion should be read in conjunction with the Consolidated Financial Statements and related Notes. Tables 7 and 8 contain financial data to supplement this discussion.
Overview
Net Income/LossIncome (Loss)
Net income was $1.4 billion in 2011 compared to a net loss totaledof $2.2 billion in 2010 compared to net income of $6.3 billion in 2009. Including preferred stock dividends, the net lossincome applicable to common shareholders was $3.6 billion85 million, or $(0.37)0.01 per diluted share. Those results compared to a net loss applicable to common shareholders of $2.23.6 billion, or $(0.29)0.37 per diluted share for 20092010.
Net Interest Income
Net interest income on a FTE basis increased $4.3 billion towas $52.745.6 billion for 20102011, a decrease of $7.1 billion compared to 20092010. The increasedecline was primarily due to lower consumer loan balances and yields and decreased investment security yields, including the impactacceleration of deposit pricingpurchase premium amortization from an increase in modeled prepayment expectations, and the adoption of new consolidation guidance which contributed $10.5 billion toincreased hedge ineffectiveness. Lower trading-related net interest income in 2010. The increase wasalso negatively impacted 2011 results. These decreases were partially offset by lower commercial and consumer loan levels, the sale of First Republicongoing reductions in 2010our debt footprint and lower interest rates paid on core assets and trading assets and liabilities, including derivative exposures.deposits. The net interest yield on a FTE basis increased 13 bps towas 2.782.48 percent for 20102011, a decrease of 30 bps compared to 20092010 as the yield continued to be under pressure due to the factors described above.aforementioned items and the low rate environment.
Noninterest Income
Noninterest income decreasedwas $13.8 billion to $58.748.8 billion in 20102011, a decrease of $9.9 billion compared to 20092010. Card income decreased $245 million due to the implementation of the CARD Act partially offset by the impact of the new consolidation guidance and higher interchange income. Service charges decreased $1.6 billion largely due to the impact of overdraft policy changes in conjunction with Regulation E, which became effective in the third quarter of 2010 and the impact of our overdraft policy changes implemented in late 2009. Equity investment income decreased $4.8 billion, as net gains on the sales of certain strategic investments during 2010 were less than gains in 2009 that included a $7.3 billion gain related to the sale of a portion of our investment in CCB. Trading account profits decreased $2.2 billion due to more favorable market conditions in 2009 and investor concerns regarding sovereign debt fears and regulatory uncertainty. DVA gains, net of hedges, on derivative liabilities of $262 million for 2010 compared to losses of $662 million for 2009. Mortgage banking income decreased $6.1 billion due to an increase of $4.9 billion in representations and warranties provision and lower volume and margins. Gains on sales of debt securities decreased $2.2 billion driven by a lower volume of sales of debt securities. The decrease also included the impact of losses in 2010 related to portfolio restructuring activities. Other income (loss) improved by $2.4 billion. 2009 included a net negative fair value adjustment related to our own credit of $4.9 billion on structured liabilities compared to a net positive adjustment of $18 million in 2010, and 2009 also included a $3.8 billion gain on the contribution of our merchant services business to a joint venture. Legacy asset write-downs included in other income (loss) were $1.7 billion in 2009 compared to net gains of $256 million in 2010. Impairment losses recognized in earnings on AFS debt
| |
| Ÿ | Card income decreased $924 million primarily due to the implementation of new interchange fee rules under the Durbin Amendment, which became effective on October 1, 2011 and the Credit Card Accountability Responsibility and Disclosure Act of 2009 (CARD Act) provisions that were implemented during 2010. |
| |
| Ÿ | Service charges decreased $1.3 billion largely due to the impact of overdraft policy changes in conjunction with Regulation E, which became effective in the third quarter of 2010. |
| |
| Ÿ | Equity investment income increased $2.1 billion. The results for 2011 included $6.5 billion of gains on the sale of CCB shares, partially offset by $1.1 billion of impairment charges on our merchant services joint venture. The prior year included $2.5 billion of net gains which included the sales of certain strategic investments, $2.3 billion of gains in our GPI portfolio and $535 million of CCB dividends. |
| |
| Ÿ | Trading account profits decreased $3.4 billion primarily due to adverse market conditions and extreme volatility in the credit markets compared to the prior year. Net DVA gains on derivatives were $1.0 billion in 2011 compared to $262 million in 2010 as a result of a widening of our credit spreads. Proprietary trading revenue was $434 million for the six months ended June 30, 2011 compared to $1.4 billion for 2010 due to Global Markets exiting its stand-alone proprietary trading business as of June 30, 2011. |
securities decreased $1.9 billion reflecting lower impairment write-downs on non-agency RMBS and CDOs.
| |
| Ÿ | Mortgage banking income decreased $11.6 billion primarily due to an $8.8 billion increase in the representations and warranties provision which was largely related to the BNY Mellon Settlement. Also contributing to the decline was lower production income due to a reduction in new loan origination volumes partially offset by an increase in servicing income. |
| |
| Ÿ | Other income increased $4.5 billion primarily due to positive fair value adjustments of $3.3 billion related to widening of our own credit spreads on structured liabilities compared to $18 million in 2010. In addition, 2011 included a $771 million gain on the sale of Balboa as well as $1.2 billion of gains on the exchange of certain trust preferred securities for common stock and debt. |
Provision for Credit Losses
The provision for credit losses decreasedwas $20.1 billion to $28.413.4 billion for 20102011, a decrease of $15.0 billion compared to 2009 due to improving portfolio trends across the consumer and commercial portfolios. Net charge-offs totaled $34.3 billion, or 3.60 percent of average loans and leases for 2010 compared to $33.7 billion, or 3.58 percent for 2009.
Noninterest Expense
Noninterest expense increased $16.4 billion to $83.1 billion for 2010 compared to 2009 largely due to goodwill impairment charges of $12.4 billion. The increase was also driven by a $3.6 billion increase in personnel costs reflecting the build out of several businesses, the recognition of expense on proportionally larger 2009 incentive deferrals and the U.K. payroll tax on certain year-end incentive payments, as well as a $1.6 billion increase in litigation costs. These increases were partially offset by a $901 million decline in merger and restructuring charges compared to 2009. Noninterest expense for 2009 included a special FDIC assessment of $724 million.
Income Tax Expense
Income tax expense was $915 million for 2010 compared to a benefit of $1.9 billion for 2009. The effective tax rate in 2010 was not meaningful due to the impact of non-deductible goodwill impairment charges of $12.4 billion. The effective tax rate for 2010 excluding goodwill impairment charges was 8.3 percent compared to (44.0) percent in 2009. The change in the effective tax rate from the prior year was primarily driven by an increase in pre-tax income excluding the non-deductible goodwill impairment charges. Also impacting the 2010 effective tax rate was a $392 million charge from a U.K. law change and a $1.7 billion tax benefit from the release of a portion of the deferred tax asset valuation allowance related to acquired capital loss carryforward tax benefits compared to $650 million in 2009.
Business Segment Operations
Deposits
Net income decreased $1.3 billion to $1.4 billion in 2010 due to a decline in revenue and higher noninterest expense. Net interest income increased $1.1 billion to $8.3 billion as a result of a customer shift to more liquid products and continued pricing discipline, partially offset by a lower net interest income allocation related to ALM activities. Noninterest income decreased $1.8 billion to $5.3 billion driven by the impact of overdraft policy changes in conjunction with Regulation E, which was effective in the third quarter of 2010, and our overdraft policy changes implemented in late 2009. Noninterest expense increased $1.5 billion to $11.2 billion as a higher proportion of banking center sales and service costs was aligned to Deposits from the other segments, and increased litigation expenses partially offset by a decrease in FDIC expenses as 2009 included a special assessment.
Card Services
Card Services recorded a net loss of $7.0 billion primarily due to a $10.4 billion goodwill impairment charge. Net interest income decreased $2.1 billion to $14.4 billion driven by a decrease in average loans and yields partially offset by lower funding costs. Noninterest income decreased $348 million to $7.9 billion driven by lower card income primarily due to the implementation of the CARD Act partially offset by higher interchange income during 2010 and the gain on the sale of our MasterCard position. The provision for credit losses improved $15.4was $7.4 billion to $11.0 billion due to lower delinquencies and bankruptcies as a result of the improved economic environment, which resultedthan net charge-offs for 2011, resulting in a reduction in the allowance for credit losses in 2010 compared to an increase in 2009. Noninterest expense increased $9.8 billion to $16.4 billionprimarily due to the goodwill impairment charge.
Consumer Real Estate Services
CRES net loss increased $5.1 billion to a net loss of $8.9 billion in 2010 primarily due to a $4.9 billion increase in representations and warranties provision and a $2.0 billion goodwill impairment charge, partially offset by a decline in the provision for credit losses driven by improving portfolio trends. Mortgage banking income declined driven bylower delinquencies, improved collection rates and fewer bankruptcy filings across the increased representationsU.S. credit card and warranties provisionunsecured consumer lending portfolios, and lower production volume reflecting a dropimprovement in the overall size of the mortgage market. The provision for credit losses decreased $2.8 billion to $8.5 billion driven by improving portfolio trends which led to lower reserve additions, including those associated with the Countrywide PCI home equity portfolio. Noninterest expense increased $3.4 billion to $14.9 billion due to the goodwill impairment charge, higher litigation expense and an increase in default-related servicing expense, partially offset by lower production expense and insurance losses.
Global Commercial Banking
Net income increased $1.0 billion to $3.2 billion in 2010. Net interest income remained relatively flat as growth in average deposits was offset by a lower net interest income allocation related to ALM activities. Noninterest income decreased $4.2 billion to $3.2 billion largely due to the 2009 gain of $3.8 billion related to the contribution of the merchant services business into a joint venture. The provision for credit losses decreased $5.8 billion to $2.0 billion driven by improvements from stabilizing valuesquality in the commercial real estate portfolio and improved borrower credit profiles in the U.S. commercial portfolio.
Global Banking & Markets
Net income decreased $1.4 billion to $6.3 billion in 2010 driven by lower sales and trading revenue due to more favorable market conditions in 2009, partially offset by credit valuation gains on derivative liabilities and gains on legacy assetsadditions to consumer PCI loan portfolio reserves. This compared to a $5.9 billion reduction in the allowance for credit losses in 2010.
in 2009. SalesNet charge-offs totaled $20.8 billion, or 2.24 percent of average loans and trading revenue wasleases for $17.0 billion in 20102011 compared to $17.6$34.3 billion, or 3.60 percent for 2010. The decrease in net charge-offs was primarily driven by improvements in general economic conditions that resulted in lower delinquencies, improved collection rates and fewer bankruptcy filings across the U.S. credit card and unsecured
consumer lending portfolios, as well as lower losses in the home equity portfolio primarily driven by fewer delinquent loans.
Noninterest Expense
Noninterest expense was $80.3 billion for 2011, a decrease of $2.8 billion compared to 2010. Goodwill impairment charges were $3.2 billion for 2011 compared to $12.4 billion in 2009due to increased investor risk aversion and more favorable market conditions in 2009. Noninterestthe prior year. Personnel expense increased $2.3$1.8 billion for 2011 attributable to $17.5personnel costs related to the continued build-out of certain businesses, technology costs as well as increases in default-related servicing. Additionally, professional fees increased $686 million related to consulting fees for regulatory initiatives as well as higher legal expenses. Other general operating expenses increased $4.9 billion driven by higher compensation costs largely as a result of a $3.0 billion increase in litigation expense, primarily mortgage-related, and an increase of $1.6 billion in mortgage-related assessments and waivers costs. Merger and restructuring expenses decreased $1.2 billion in 2011.
Income Tax Expense
The income tax benefit was $1.7 billion on the recognitionpre-tax loss of expense on a proportionally larger amount of prior year incentive deferrals and investments in infrastructure and personnel associated with further development of the business. Income$230 million for 2011 compared to income tax expense was adversely affected by a charge related toof $915 million on the U.K. tax rate reduction impacting the carrying valuepre-tax loss of deferred tax assets.
Global Wealth & Investment Management
Net income decreased $329 million to $1.3 billion in 2010 driven by higher noninterest expense and the tax-related effect of the sale of the Columbia Management long-term asset management business partially offset by higher noninterest income and lower credit costs. Net interest income decreased $205 million to $5.7 billion as the positive impact of higher deposit levels was more than offset by lower revenue from corporate ALM activity. Noninterest income increased $708 million to $10.6 billion primarily due to higher asset management fees driven by stronger markets, continued long-term AUM flows and higher transactional activity. The provision for credit losses decreased $414 million to $646 million driven by improving portfolio trends and the recognition of a single large commercial charge-off in 2009. Noninterest expense increased $1.1 billion to $13.2 billion due primarily to higher revenue-related expenses, support costs and personnel costs associated with further investment in the business.
All Other
Net income increased $293 million to $1.5 billion in 2010. Net interestThese amounts are before FTE adjustments. The income decreased $1.9 billion to $3.7 billiontax benefit for 2011 was driven by recurring tax preference items, a $1.4$1.0 billion lower funding differential on certain securitizations andbenefit from the impactrelease of capital raises occurring throughout 2009 that were not allocatedthe remaining valuation allowance applicable to the businesses. Noninterest income decreased $5.7 billion to $6.0 billion as the prior year includedMerrill Lynch capital loss carryover deferred tax asset, and a $7.3 billion gain resulting from a salebenefit of shares$823 million for planned realization of CCB and an increase of $1.4 billion on net gains on the sale of debt securities. This was offset by net negative fair value adjustmentspreviously unrecognized deferred tax assets related to our own credit of $4.9 billion on structured liabilitiesthe tax basis in 2009 compared to a net positive adjustment of $18 million in 2010 and higher valuation adjustments and gains on sales of select investments in GPI. Also, in 2010, we sold our investments in Itaú Unibanco and Santander certainresulting in a net gain of approximately $800 million, as well as the gains on CCB and BlackRock. The provision for credit losses decreased $4.9 billion to $6.3 billion due to improving portfolio trends in the residential mortgage portfolio partially offset by further deterioration in the Countrywide PCI discontinued real estate portfolio.
|
| | |
128 Bank of America 20112012 | | |
subsidiaries. These benefits were partially offset by the $782 million tax charge related to the enactment of a two percent reduction in the U.K. corporate income tax rate. The effective tax rate for 2010 excluding goodwill impairment charges was 8.3 percent. In addition to our recurring tax preference items, this rate was driven by a $1.7 billion benefit from the release of a portion of the valuation allowance applicable to the Merrill Lynch capital loss carryover deferred tax asset, partially offset by the $392 million charge from a one percent reduction to the U.K. corporate income tax rate enacted during 2010.
Business Segment Operations
CBB recorded net income of Contents$7.4 billion in 2011 compared to a net loss of $5.1 billion in 2010 primarily due to a $10.4 billion goodwill impairment charge in 2010 and a decrease in the provision for credit losses, partially offset by a decline in revenue. The decline in revenue was primarily driven by lower average loan balances and yields, lower service charges reflecting the impact of overdraft policy changes in conjunction with Regulation E that were fully implemented during the third quarter of 2010, the implementation of the Durbin Amendment in the fourth quarter of 2011, the gain on the sale of our MasterCard position in 2010 and the implementation of the CARD Act. The provision for credit losses decreased $8.2 billion to $3.5 billion reflecting improving economic conditions and lower loan balances. Noninterest expense decreased $10.9 billion to $17.7 billion primarily due to the goodwill impairment charge in 2010 and lower litigation and operating expenses, partially offset by an increase in FDIC expense.
Consumer Real Estate Services
CRES recorded a net loss of $19.5 billion in 2011 compared to $8.9 billion in 2010 primarily due to an increase in representations and warranties provision, lower core production income, a decrease in insurance income due to the sale of Balboa in 2011, and an increase in noninterest expense. Mortgage banking income declined driven by the increased representations and warranties provision and lower core production income due to a drop in market share combined with the decline in the overall market demand for mortgages in 2011. The provision for credit losses decreased $4.0 billion to $4.5 billion primarily driven by improving portfolio trends, including lower reserve additions in the Countrywide PCI home equity portfolio. Noninterest expense increased $7.0 billion to $21.8 billion due to higher litigation expense, increased mortgage-related assessments and waivers costs, higher default-related and other loss mitigation expenses and a higher goodwill impairment charge, partially offset by lower insurance and production expenses.
Global Banking
Global Banking recorded net income of $6.0 billion in 2011 compared to $4.9 billion in 2010 primarily driven by lower provision for credit losses, partially offset by lower revenue. Revenue decreased $432 million to $17.3 billion primarily driven by lower net interest income related to ALM activities and lower accretion on acquired portfolios, partially offset by the impact of higher
average loan and deposit balances. The provision for credit losses improved $2.4 billion to a benefit of $1.1 billion driven by the positive impact of the economic environment on the credit portfolio and an accelerated rate of loan resolutions in the commercial real estate portfolio. Noninterest expense increased $215 million to $8.9 billion as higher FDIC expense was partially offset by lower personnel and occupancy expenses.
Global Markets
Global Markets recorded net income of $1.0 billion in 2011 compared to $4.3 billion in 2010 driven by a decline in sales and trading revenue due to a challenging market environment, partially offset by net DVA gains. Sales and trading revenue, excluding net DVA, was $11.8 billion in 2011 compared to $16.4 billion in 2010. Noninterest expense increased $470 million to $12.2 billion primarily driven by increased costs related to investments in infrastructure. Income tax expense included a $774 million charge to reduce the carrying value of the deferred tax assets as a result of a reduction in the U.K. corporate income tax rate enacted during 2011 compared to a charge of $388 million for a rate reduction enacted in 2010.
Global Wealth & Investment Management
GWIM recorded net income of $1.7 billion in 2011 compared to $1.3 billion in 2010 driven by higher asset management fees, higher net interest income and lower credit costs, partially offset by higher noninterest expense. Net interest income increased $338 million to $5.9 billion as the impact of higher average deposit balances more than offset the impact of a lower rate environment. Noninterest income increased $774 million to $10.6 billion primarily due to higher asset management fees driven by higher average markets levels in 2011 compared to 2010 and continued long-term AUM flows. The provision for credit losses decreased $248 million to $398 million driven by improving portfolio trends. Noninterest expense increased $1.1 billion to $13.4 billion due primarily to higher volume-driven expenses and personnel costs associated with the continued investment in the business.
All Other
All Other recorded net income of $4.7 billion in 2011 compared to $1.3 billion in 2010 primarily due to higher noninterest income and lower merger and restructuring charges. Noninterest income increased $7.3 billion to $14.1 billion due to positive fair value adjustments related to our own credit spreads on structured liabilities of $3.3 billion in 2011 compared to $18 million in 2010. Equity investment income increased $2.5 billion as a result of a $6.5 billion gain from the sale of CCB shares partially offset by $1.1 billion of impairment charges on our merchant services joint venture and a decrease of $1.9 billion in GPI income. A goodwill impairment charge of $581 million was recorded during 2011 as a result of a change in the estimated value of the European consumer card business. The prior year included $1.2 billion of gains on the sales of certain strategic investments. The provision for credit losses decreased $152 million to $6.2 billion primarily due to divestitures, improvements in the non-U.S. credit card portfolio and run-off, partially offset by the impact of a continuing decline in home prices.
Statistical Tables
| | | | | | | | | | | | | | | | | | | | | | | | | | | | | | | | | | | | | |
Table I Average Balances and Interest Rates – FTE Basis | Table I Average Balances and Interest Rates – FTE Basis | Table I Average Balances and Interest Rates – FTE Basis |
| | | | | | | | | | | | | | | | | | | | | | | | | | | | | | | | | | | |
| | 2011 | | 2010 | | 2009 | 2012 | | 2011 | | 2010 |
| (Dollars in millions) | Average
Balance | | Interest
Income/
Expense | | Yield/
Rate | | Average
Balance | | Interest
Income/
Expense | | Yield/
Rate | | Average
Balance | | Interest
Income/
Expense | | Yield/
Rate | Average
Balance | | Interest
Income/
Expense | | Yield/
Rate | | Average
Balance | | Interest
Income/
Expense | | Yield/
Rate | | Average
Balance | | Interest
Income/
Expense | | Yield/
Rate |
| Earning assets | |
| | |
| | |
| | |
| | |
| | |
| | |
| | |
| | |
| |
| | |
| | |
| | |
| | |
| | |
| | |
| | |
| | |
|
Time deposits placed and other short-term investments (1) | $ | 28,242 |
| | $ | 366 |
| | 1.29 | % | | $ | 27,419 |
| | $ | 292 |
| | 1.06 | % | | $ | 27,465 |
| | $ | 334 |
| | 1.22 | % | $ | 22,888 |
| | $ | 237 |
| | 1.03 | % | | $ | 28,242 |
| | $ | 366 |
| | 1.29 | % | | $ | 27,419 |
| | $ | 292 |
| | 1.06 | % |
| Federal funds sold and securities borrowed or purchased under agreements to resell | 245,069 |
| | 2,147 |
| | 0.88 |
| | 256,943 |
| | 1,832 |
| | 0.71 |
| | 235,764 |
| | 2,894 |
| | 1.23 |
| 236,042 |
| | 1,502 |
| | 0.64 |
| | 245,069 |
| | 2,147 |
| | 0.88 |
| | 256,943 |
| | 1,832 |
| | 0.71 |
|
| Trading account assets | 187,340 |
| | 6,142 |
| | 3.28 |
| | 213,745 |
| | 7,050 |
| | 3.30 |
| | 217,048 |
| | 8,236 |
| | 3.79 |
| 182,359 |
| | 5,306 |
| | 2.91 |
| | 187,340 |
| | 6,142 |
| | 3.28 |
| | 213,745 |
| | 7,050 |
| | 3.30 |
|
Debt securities (2) | 337,120 |
| | 9,602 |
| | 2.85 |
| | 323,946 |
| | 11,850 |
| | 3.66 |
| | 271,048 |
| | 13,224 |
| | 4.88 |
| 337,653 |
| | 8,798 |
| | 2.61 |
| | 337,120 |
| | 9,602 |
| | 2.85 |
| | 323,946 |
| | 11,850 |
| | 3.66 |
|
Loans and leases (3): | |
| | |
| | |
| | |
| | |
| | |
| | |
| | |
| | |
| |
| | |
| | |
| | |
| | |
| | |
| | |
| | |
| | |
|
Residential mortgage (4) | 265,546 |
| | 11,096 |
| | 4.18 |
| | 245,727 |
| | 11,736 |
| | 4.78 |
| | 249,335 |
| | 13,535 |
| | 5.43 |
| 253,050 |
| | 9,470 |
| | 3.74 |
| | 265,546 |
| | 11,096 |
| | 4.18 |
| | 245,727 |
| | 11,736 |
| | 4.78 |
|
| Home equity | 130,781 |
| | 5,041 |
| | 3.85 |
| | 145,860 |
| | 5,990 |
| | 4.11 |
| | 154,761 |
| | 6,736 |
| | 4.35 |
| 117,197 |
| | 4,418 |
| | 3.77 |
| | 130,781 |
| | 5,041 |
| | 3.85 |
| | 145,860 |
| | 5,990 |
| | 4.11 |
|
| Discontinued real estate | 14,730 |
| | 501 |
| | 3.40 |
| | 13,830 |
| | 527 |
| | 3.81 |
| | 17,340 |
| | 1,082 |
| | 6.24 |
| 11,256 |
| | 383 |
| | 3.40 |
| | 14,730 |
| | 501 |
| | 3.40 |
| | 13,830 |
| | 527 |
| | 3.81 |
|
| U.S. credit card | 105,478 |
| | 10,808 |
| | 10.25 |
| | 117,962 |
| | 12,644 |
| | 10.72 |
| | 52,378 |
| | 5,666 |
| | 10.82 |
| 94,863 |
| | 9,504 |
| | 10.02 |
| | 105,478 |
| | 10,808 |
| | 10.25 |
| | 117,962 |
| | 12,644 |
| | 10.72 |
|
| Non-U.S. credit card | 24,049 |
| | 2,656 |
| | 11.04 |
| | 28,011 |
| | 3,450 |
| | 12.32 |
| | 19,655 |
| | 2,122 |
| | 10.80 |
| 13,549 |
| | 1,572 |
| | 11.60 |
| | 24,049 |
| | 2,656 |
| | 11.04 |
| | 28,011 |
| | 3,450 |
| | 12.32 |
|
Direct/Indirect consumer (5) | 90,163 |
| | 3,716 |
| | 4.12 |
| | 96,649 |
| | 4,753 |
| | 4.92 |
| | 99,993 |
| | 6,016 |
| | 6.02 |
| 84,424 |
| | 2,900 |
| | 3.44 |
| | 90,163 |
| | 3,716 |
| | 4.12 |
| | 96,649 |
| | 4,753 |
| | 4.92 |
|
Other consumer (6) | 2,760 |
| | 176 |
| | 6.39 |
| | 2,927 |
| | 186 |
| | 6.34 |
| | 3,303 |
| | 237 |
| | 7.17 |
| 2,359 |
| | 140 |
| | 5.95 |
| | 2,760 |
| | 176 |
| | 6.39 |
| | 2,927 |
| | 186 |
| | 6.34 |
|
| Total consumer | 633,507 |
| | 33,994 |
| | 5.37 |
| | 650,966 |
| | 39,286 |
| | 6.04 |
| | 596,765 |
| | 35,394 |
| | 5.93 |
| 576,698 |
| | 28,387 |
| | 4.92 |
| | 633,507 |
| | 33,994 |
| | 5.37 |
| | 650,966 |
| | 39,286 |
| | 6.04 |
|
| U.S. commercial | 192,524 |
| | 7,360 |
| | 3.82 |
| | 195,895 |
| | 7,909 |
| | 4.04 |
| | 223,813 |
| | 8,883 |
| | 3.97 |
| 201,352 |
| | 6,979 |
| | 3.47 |
| | 192,524 |
| | 7,360 |
| | 3.82 |
| | 195,895 |
| | 7,909 |
| | 4.04 |
|
Commercial real estate (7) | 44,406 |
| | 1,522 |
| | 3.43 |
| | 59,947 |
| | 2,000 |
| | 3.34 |
| | 73,349 |
| | 2,372 |
| | 3.23 |
| 37,982 |
| | 1,332 |
| | 3.51 |
| | 44,406 |
| | 1,522 |
| | 3.43 |
| | 59,947 |
| | 2,000 |
| | 3.34 |
|
| Commercial lease financing | 21,383 |
| | 1,001 |
| | 4.68 |
| | 21,427 |
| | 1,070 |
| | 4.99 |
| | 21,979 |
| | 990 |
| | 4.51 |
| 21,879 |
| | 874 |
| | 4.00 |
| | 21,383 |
| | 1,001 |
| | 4.68 |
| | 21,427 |
| | 1,070 |
| | 4.99 |
|
| Non-U.S. commercial | 46,276 |
| | 1,382 |
| | 2.99 |
| | 30,096 |
| | 1,091 |
| | 3.62 |
| | 32,899 |
| | 1,406 |
| | 4.27 |
| 60,857 |
| | 1,594 |
| | 2.62 |
| | 46,276 |
| | 1,382 |
| | 2.99 |
| | 30,096 |
| | 1,091 |
| | 3.62 |
|
| Total commercial | 304,589 |
| | 11,265 |
| | 3.70 |
| | 307,365 |
| | 12,070 |
| | 3.93 |
| | 352,040 |
| | 13,651 |
| | 3.88 |
| 322,070 |
| | 10,779 |
| | 3.35 |
| | 304,589 |
| | 11,265 |
| | 3.70 |
| | 307,365 |
| | 12,070 |
| | 3.93 |
|
| Total loans and leases | 938,096 |
| | 45,259 |
| | 4.82 |
| | 958,331 |
| | 51,356 |
| | 5.36 |
| | 948,805 |
| | 49,045 |
| | 5.17 |
| 898,768 |
| | 39,166 |
| | 4.36 |
| | 938,096 |
| | 45,259 |
| | 4.82 |
| | 958,331 |
| | 51,356 |
| | 5.36 |
|
| Other earning assets | 98,792 |
| | 3,506 |
| | 3.55 |
| | 117,189 |
| | 3,919 |
| | 3.34 |
| | 130,063 |
| | 5,105 |
| | 3.92 |
| 92,259 |
| | 3,103 |
| | 3.36 |
| | 98,792 |
| | 3,506 |
| | 3.55 |
| | 117,189 |
| | 3,919 |
| | 3.34 |
|
Total earning assets (8) | 1,834,659 |
| | 67,022 |
| | 3.65 |
| | 1,897,573 |
| | 76,299 |
| | 4.02 |
| | 1,830,193 |
| | 78,838 |
| | 4.31 |
| 1,769,969 |
| | 58,112 |
| | 3.28 |
| | 1,834,659 |
| | 67,022 |
| | 3.65 |
| | 1,897,573 |
| | 76,299 |
| | 4.02 |
|
Cash and cash equivalents (1) | 112,616 |
| | 186 |
| | |
| | 174,621 |
| | 368 |
| | |
| | 196,237 |
| | 379 |
| | |
| 115,739 |
| | 189 |
| | |
| | 112,616 |
| | 186 |
| | |
| | 174,621 |
| | 368 |
| | |
|
| Other assets, less allowance for loan and lease losses | 349,047 |
| | |
| | |
| | 367,412 |
| | |
| | |
| | 416,638 |
| | |
| | |
| 305,648 |
| | |
| | |
| | 349,047 |
| | |
| | |
| | 367,412 |
| | |
| | |
|
| Total assets | $ | 2,296,322 |
| | |
| | |
| | $ | 2,439,606 |
| | |
| | |
| | $ | 2,443,068 |
| | |
| | |
| $ | 2,191,356 |
| | |
| | |
| | $ | 2,296,322 |
| | |
| | |
| | $ | 2,439,606 |
| | |
| | |
|
| Interest-bearing liabilities | |
| | |
| | |
| | |
| | |
| | |
| | |
| | |
| | |
| |
| | |
| | |
| | |
| | |
| | |
| | |
| | |
| | |
|
| U.S. interest-bearing deposits: | |
| | |
| | |
| | |
| | |
| | |
| | |
| | |
| | |
| |
| | |
| | |
| | |
| | |
| | |
| | |
| | |
| | |
|
| Savings | $ | 40,364 |
| | $ | 100 |
| | 0.25 | % | | $ | 36,649 |
| | $ | 157 |
| | 0.43 | % | | $ | 33,671 |
| | $ | 215 |
| | 0.64 | % | $ | 41,453 |
| | $ | 45 |
| | 0.11 | % | | $ | 40,364 |
| | $ | 100 |
| | 0.25 | % | | $ | 36,649 |
| | $ | 157 |
| | 0.43 | % |
| NOW and money market deposit accounts | 470,519 |
| | 1,060 |
| | 0.23 |
| | 441,589 |
| | 1,405 |
| | 0.32 |
| | 358,712 |
| | 1,557 |
| | 0.43 |
| 466,096 |
| | 693 |
| | 0.15 |
| | 470,519 |
| | 1,060 |
| | 0.23 |
| | 441,589 |
| | 1,405 |
| | 0.32 |
|
| Consumer CDs and IRAs | 110,922 |
| | 1,045 |
| | 0.94 |
| | 142,648 |
| | 1,723 |
| | 1.21 |
| | 218,041 |
| | 5,054 |
| | 2.32 |
| 95,559 |
| | 693 |
| | 0.73 |
| | 110,922 |
| | 1,045 |
| | 0.94 |
| | 142,648 |
| | 1,723 |
| | 1.21 |
|
| Negotiable CDs, public funds and other time deposits | 17,227 |
| | 120 |
| | 0.70 |
| | 17,683 |
| | 226 |
| | 1.28 |
| | 37,796 |
| | 473 |
| | 1.25 |
| |
| Negotiable CDs, public funds and other deposits | | 20,928 |
| | 128 |
| | 0.61 |
| | 17,227 |
| | 120 |
| | 0.70 |
| | 17,683 |
| | 226 |
| | 1.28 |
|
| Total U.S. interest-bearing deposits | 639,032 |
| | 2,325 |
| | 0.36 |
| | 638,569 |
| | 3,511 |
| | 0.55 |
| | 648,220 |
| | 7,299 |
| | 1.13 |
| 624,036 |
| | 1,559 |
| | 0.25 |
| | 639,032 |
| | 2,325 |
| | 0.36 |
| | 638,569 |
| | 3,511 |
| | 0.55 |
|
| Non-U.S. interest-bearing deposits: | |
| | |
| | |
| | |
| | |
| | |
| | |
| | |
| | |
| |
| | |
| | |
| | |
| | |
| | |
| | |
| | |
| | |
|
| Banks located in non-U.S. countries | 20,563 |
| | 138 |
| | 0.67 |
| | 18,102 |
| | 144 |
| | 0.80 |
| | 18,688 |
| | 145 |
| | 0.78 |
| 14,644 |
| | 94 |
| | 0.64 |
| | 20,563 |
| | 138 |
| | 0.67 |
| | 18,102 |
| | 144 |
| | 0.80 |
|
| Governments and official institutions | 1,985 |
| | 7 |
| | 0.35 |
| | 3,349 |
| | 10 |
| | 0.28 |
| | 6,270 |
| | 16 |
| | 0.26 |
| 1,019 |
| | 4 |
| | 0.35 |
| | 1,985 |
| | 7 |
| | 0.35 |
| | 3,349 |
| | 10 |
| | 0.28 |
|
| Time, savings and other | 61,851 |
| | 532 |
| | 0.86 |
| | 55,059 |
| | 332 |
| | 0.60 |
| | 57,045 |
| | 347 |
| | 0.61 |
| 53,411 |
| | 333 |
| | 0.62 |
| | 61,851 |
| | 532 |
| | 0.86 |
| | 55,059 |
| | 332 |
| | 0.60 |
|
| Total non-U.S. interest-bearing deposits | 84,399 |
| | 677 |
| | 0.80 |
| | 76,510 |
| | 486 |
| | 0.64 |
| | 82,003 |
| | 508 |
| | 0.62 |
| 69,074 |
| | 431 |
| | 0.62 |
| | 84,399 |
| | 677 |
| | 0.80 |
| | 76,510 |
| | 486 |
| | 0.64 |
|
| Total interest-bearing deposits | 723,431 |
| | 3,002 |
| | 0.42 |
| | 715,079 |
| | 3,997 |
| | 0.56 |
| | 730,223 |
| | 7,807 |
| | 1.07 |
| 693,110 |
| | 1,990 |
| | 0.29 |
| | 723,431 |
| | 3,002 |
| | 0.42 |
| | 715,079 |
| | 3,997 |
| | 0.56 |
|
| Federal funds purchased, securities loaned or sold under agreements to repurchase and other short-term borrowings | 324,269 |
| | 4,599 |
| | 1.42 |
| | 430,329 |
| | 3,699 |
| | 0.86 |
| | 488,644 |
| | 5,512 |
| | 1.13 |
| 318,400 |
| | 3,572 |
| | 1.12 |
| | 324,269 |
| | 4,599 |
| | 1.42 |
| | 430,329 |
| | 3,699 |
| | 0.86 |
|
| Trading account liabilities | 84,689 |
| | 2,212 |
| | 2.61 |
| | 91,669 |
| | 2,571 |
| | 2.80 |
| | 72,207 |
| | 2,075 |
| | 2.87 |
| 78,554 |
| | 1,763 |
| | 2.24 |
| | 84,689 |
| | 2,212 |
| | 2.61 |
| | 91,669 |
| | 2,571 |
| | 2.80 |
|
| Long-term debt | 421,229 |
| | 11,807 |
| | 2.80 |
| | 490,497 |
| | 13,707 |
| | 2.79 |
| | 446,634 |
| | 15,413 |
| | 3.45 |
| 316,393 |
| | 9,419 |
| | 2.98 |
| | 421,229 |
| | 11,807 |
| | 2.80 |
| | 490,497 |
| | 13,707 |
| | 2.79 |
|
Total interest-bearing liabilities (8) | 1,553,618 |
| | 21,620 |
| | 1.39 |
| | 1,727,574 |
| | 23,974 |
| | 1.39 |
| | 1,737,708 |
| | 30,807 |
| | 1.77 |
| 1,406,457 |
| | 16,744 |
| | 1.19 |
| | 1,553,618 |
| | 21,620 |
| | 1.39 |
| | 1,727,574 |
| | 23,974 |
| | 1.39 |
|
| Noninterest-bearing sources: | |
| | |
| | |
| | |
| | |
| | |
| | |
| | |
| | |
| |
| | |
| | |
| | |
| | |
| | |
| | |
| | |
| | |
|
| Noninterest-bearing deposits | 312,371 |
| | |
| | |
| | 273,507 |
| | |
| | |
| | 250,743 |
| | |
| | |
| 354,672 |
| | |
| | |
| | 312,371 |
| | |
| | |
| | 273,507 |
| | |
| | |
|
| Other liabilities | 201,238 |
| | |
| | |
| | 205,290 |
| | |
| | |
| | 209,972 |
| | |
| | |
| 194,550 |
| | |
| | |
| | 201,238 |
| | |
| | |
| | 205,290 |
| | |
| | |
|
| Shareholders’ equity | 229,095 |
| | |
| | |
| | 233,235 |
| | |
| | |
| | 244,645 |
| | |
| | |
| 235,677 |
| | |
| | |
| | 229,095 |
| | |
| | |
| | 233,235 |
| | |
| | |
|
| Total liabilities and shareholders’ equity | $ | 2,296,322 |
| | |
| | |
| | $ | 2,439,606 |
| | |
| | |
| | $ | 2,443,068 |
| | |
| | |
| $ | 2,191,356 |
| | |
| | |
| | $ | 2,296,322 |
| | |
| | |
| | $ | 2,439,606 |
| | |
| | |
|
| Net interest spread | |
| | |
| | 2.26 | % | | |
| | |
| | 2.63 | % | | |
| | |
| | 2.54 | % | |
| | |
| | 2.09 | % | | |
| | |
| | 2.26 | % | | |
| | |
| | 2.63 | % |
| Impact of noninterest-bearing sources | |
| | |
| | 0.21 |
| | |
| | |
| | 0.13 |
| | |
| | |
| | 0.08 |
| |
| | |
| | 0.25 |
| | |
| | |
| | 0.21 |
| | |
| | |
| | 0.13 |
|
Net interest income/yield on earning assets (1) | |
| | $ | 45,402 |
| | 2.47 | % | | |
| | $ | 52,325 |
| | 2.76 | % | | |
| | $ | 48,031 |
| | 2.62 | % | |
| | $ | 41,368 |
| | 2.34 | % | | |
| | $ | 45,402 |
| | 2.47 | % | | |
| | $ | 52,325 |
| | 2.76 | % |
| |
(1) | For this presentation, fees earned on overnight deposits placed with the Federal Reserve are included in the cash and cash equivalents line, consistent with the Corporation’s Consolidated Balance Sheet presentation of these deposits. In addition, for 2012, fees earned on deposits, primarily overnight, placed with certain non-U.S. central banks, which are included in the time deposits placed and other short-term investments line in prior periods, have been included in the cash and cash equivalents line. Net interest income and net interest yield in the table are calculated excluding these fees. |
| |
(2) | Yields on AFS debt securities are calculated based on fair value rather than the cost basis. The use of fair value does not have a material impact on net interest yield. |
| |
(3) | Nonperforming loans are included in the respective average loan balances. Income on these nonperforming loans is recognized on a cashcost recovery basis. PCI loans were recorded at fair value upon acquisition and accrete interest income over the remaining life of the loan. |
| |
(4) | Includes non-U.S. residential mortgage loans of $9190 million, $41091 million and $622410 million in 20112012, 20102011 and 20092010, respectively. |
| |
(5) | Includes non-U.S. consumer loans of $8.57.8 billion, $7.98.5 billion and $8.07.9 billion in 20112012, 20102011 and 20092010, respectively. |
| |
(6) | Includes consumer finance loans of $1.81.5 billion, $2.11.8 billion and $2.42.1 billion; other non-U.S. consumer loans of $878699 million, $731878 million and $657731 million; and consumer overdrafts of $93128 million, $11193 million and $217111 million in 20112012, 20102011 and 20092010, respectively. |
| |
(7) | Includes U.S. commercial real estate loans of $42.136.4 billion, $57.342.1 billion and $70.757.3 billion; and non-U.S. commercial real estate loans of $2.31.6 billion, $2.72.3 billion and $2.7 billion in 20112012, 20102011 and 20092010, respectively. |
| |
(8) | Interest income includes the impact of interest rate risk management contracts, which decreased interest income on the underlying assets by $754 million, $2.6 billion, and $1.4 billion and $456 millionin 20112012, 20102011 and 20092010, respectively. Interest expense includes the impact of interest rate risk management contracts, which decreased interest expense on the underlying liabilities by $2.3 billion, $2.6 billion, and $3.5 billion and $3.0 billionin 20112012, 20102011 and 20092010, respectively. For further information on interest rate contracts, see Interest Rate Risk Management for Nontrading Activities on page 116117. |
|
| | |
130 Bank of America 2012 | | Bank of America129
|
| | | | | | | | | | | | | | | | | | | | | | | | | |
Table II Analysis of Changes in Net Interest Income – FTE Basis | Table II Analysis of Changes in Net Interest Income – FTE Basis | Table II Analysis of Changes in Net Interest Income – FTE Basis |
| | | | | | | | | | | | | | | | | | | | | | | |
| | From 2010 to 2011 | | From 2009 to 2010 | From 2011 to 2012 | | From 2010 to 2011 |
| | Due to Change in (1) | | | | Due to Change in (1) | | | Due to Change in (1) | | | | Due to Change in (1) | | |
| (Dollars in millions) | Volume | | Rate | | Net Change | | Volume | | Rate | | Net Change | Volume | | Rate | | Net Change | | Volume | | Rate | | Net Change |
| Increase (decrease) in interest income | |
| | |
| | |
| | |
| | |
| | |
| |
| | |
| | |
| | |
| | |
| | |
|
Time deposits placed and other short-term investments (2) | $ | 7 |
| | $ | 67 |
| | $ | 74 |
| | $ | 1 |
| | $ | (43 | ) | | $ | (42 | ) | $ | (71 | ) | | $ | (58 | ) | | $ | (129 | ) | | $ | 7 |
| | $ | 67 |
| | $ | 74 |
|
| Federal funds sold and securities borrowed or purchased under agreements to resell | (92 | ) | | 407 |
| | 315 |
| | 266 |
| | (1,328 | ) | | (1,062 | ) | (70 | ) | | (575 | ) | | (645 | ) | | (92 | ) | | 407 |
| | 315 |
|
| Trading account assets | (868 | ) | | (40 | ) | | (908 | ) | | (135 | ) | | (1,051 | ) | | (1,186 | ) | (161 | ) | | (675 | ) | | (836 | ) | | (868 | ) | | (40 | ) | | (908 | ) |
| Debt securities | 489 |
| | (2,737 | ) | | (2,248 | ) | | 2,585 |
| | (3,959 | ) | | (1,374 | ) | 21 |
| | (825 | ) | | (804 | ) | | 489 |
| | (2,737 | ) | | (2,248 | ) |
| Loans and leases: | |
| | |
| | | | |
| | |
| | |
| |
| | |
| | | | |
| | |
| | |
|
| Residential mortgage | 957 |
| | (1,597 | ) | | (640 | ) | | (192 | ) | | (1,607 | ) | | (1,799 | ) | (519 | ) | | (1,107 | ) | | (1,626 | ) | | 957 |
| | (1,597 | ) | | (640 | ) |
| Home equity | (615 | ) | | (334 | ) | | (949 | ) | | (391 | ) | | (355 | ) | | (746 | ) | (529 | ) | | (94 | ) | | (623 | ) | | (615 | ) | | (334 | ) | | (949 | ) |
| Discontinued real estate | 34 |
| | (60 | ) | | (26 | ) | | (219 | ) | | (336 | ) | | (555 | ) | (118 | ) | | — |
| | (118 | ) | | 34 |
| | (60 | ) | | (26 | ) |
| U.S. credit card | (1,337 | ) | | (499 | ) | | (1,836 | ) | | 7,097 |
| | (119 | ) | | 6,978 |
| (1,085 | ) | | (219 | ) | | (1,304 | ) | | (1,337 | ) | | (499 | ) | | (1,836 | ) |
| Non-U.S. credit card | (487 | ) | | (307 | ) | | (794 | ) | | 903 |
| | 425 |
| | 1,328 |
| (1,160 | ) | | 76 |
| | (1,084 | ) | | (487 | ) | | (307 | ) | | (794 | ) |
| Direct/Indirect consumer | (317 | ) | | (720 | ) | | (1,037 | ) | | (198 | ) | | (1,065 | ) | | (1,263 | ) | (238 | ) | | (578 | ) | | (816 | ) | | (317 | ) | | (720 | ) | | (1,037 | ) |
| Other consumer | (11 | ) | | 1 |
| | (10 | ) | | (27 | ) | | (24 | ) | | (51 | ) | (25 | ) | | (11 | ) | | (36 | ) | | (11 | ) | | 1 |
| | (10 | ) |
| Total consumer | |
| | |
| | (5,292 | ) | | |
| | |
| | 3,892 |
| |
| | |
| | (5,607 | ) | | |
| | |
| | (5,292 | ) |
| U.S. commercial | (131 | ) | | (418 | ) | | (549 | ) | | (1,106 | ) | | 132 |
| | (974 | ) | 332 |
| | (713 | ) | | (381 | ) | | (131 | ) | | (418 | ) | | (549 | ) |
| Commercial real estate | (517 | ) | | 39 |
| | (478 | ) | | (436 | ) | | 64 |
| | (372 | ) | (219 | ) | | 29 |
| | (190 | ) | | (517 | ) | | 39 |
| | (478 | ) |
| Commercial lease financing | (3 | ) | | (66 | ) | | (69 | ) | | (24 | ) | | 104 |
| | 80 |
| 23 |
| | (150 | ) | | (127 | ) | | (3 | ) | | (66 | ) | | (69 | ) |
| Non-U.S. commercial | 584 |
| | (293 | ) | | 291 |
| | (121 | ) | | (194 | ) | | (315 | ) | 438 |
| | (226 | ) | | 212 |
| | 584 |
| | (293 | ) | | 291 |
|
| Total commercial | |
| | |
| | (805 | ) | | |
| | |
| | (1,581 | ) | |
| | |
| | (486 | ) | | |
| | |
| | (805 | ) |
| Total loans and leases | |
| | |
| | (6,097 | ) | | |
| | |
| | 2,311 |
| |
| | |
| | (6,093 | ) | | |
| | |
| | (6,097 | ) |
| Other earning assets | (619 | ) | | 206 |
| | (413 | ) | | (511 | ) | | (675 | ) | | (1,186 | ) | (231 | ) | | (172 | ) | | (403 | ) | | (619 | ) | | 206 |
| | (413 | ) |
| Total interest income | |
| | |
| | $ | (9,277 | ) | | |
| | |
| | $ | (2,539 | ) | |
| | |
| | $ | (8,910 | ) | | |
| | |
| | $ | (9,277 | ) |
| Increase (decrease) in interest expense | |
| | |
| | |
| | |
| | |
| | |
| |
| | |
| | |
| | |
| | |
| | |
|
| U.S. interest-bearing deposits: | |
| | |
| | |
| | |
| | |
| | |
| |
| | |
| | |
| | |
| | |
| | |
|
| Savings | $ | 17 |
| | $ | (74 | ) | | $ | (57 | ) | | $ | 20 |
| | $ | (78 | ) | | $ | (58 | ) | $ | 4 |
| | $ | (59 | ) | | $ | (55 | ) | | $ | 17 |
| | $ | (74 | ) | | $ | (57 | ) |
| NOW and money market deposit accounts | 101 |
| | (446 | ) | | (345 | ) | | 342 |
| | (494 | ) | | (152 | ) | 12 |
| | (379 | ) | | (367 | ) | | 101 |
| | (446 | ) | | (345 | ) |
| Consumer CDs and IRAs | (381 | ) | | (297 | ) | | (678 | ) | | (1,745 | ) | | (1,586 | ) | | (3,331 | ) | (147 | ) | | (205 | ) | | (352 | ) | | (381 | ) | | (297 | ) | | (678 | ) |
| Negotiable CDs, public funds and other time deposits | (5 | ) | | (101 | ) | | (106 | ) | | (252 | ) | | 5 |
| | (247 | ) | |
| Negotiable CDs, public funds and other deposits | | 26 |
| | (18 | ) | | 8 |
| | (5 | ) | | (101 | ) | | (106 | ) |
| Total U.S. interest-bearing deposits | |
| | |
| | (1,186 | ) | | |
| | |
| | (3,788 | ) | |
| | |
| | (766 | ) | | |
| | |
| | (1,186 | ) |
| Non-U.S. interest-bearing deposits: | |
| | |
| | |
| | |
| | |
| | |
| |
| | |
| | |
| | |
| | |
| | |
|
| Banks located in non-U.S. countries | 21 |
| | (27 | ) | | (6 | ) | | (4 | ) | | 3 |
| | (1 | ) | (40 | ) | | (4 | ) | | (44 | ) | | 21 |
| | (27 | ) | | (6 | ) |
| Governments and official institutions | (4 | ) | | 1 |
| | (3 | ) | | (7 | ) | | 1 |
| | (6 | ) | (3 | ) | | — |
| | (3 | ) | | (4 | ) | | 1 |
| | (3 | ) |
| Time, savings and other | 39 |
| | 161 |
| | 200 |
| | (11 | ) | | (4 | ) | | (15 | ) | (73 | ) | | (126 | ) | | (199 | ) | | 39 |
| | 161 |
| | 200 |
|
| Total non-U.S. interest-bearing deposits | |
| | |
| | 191 |
| | |
| | |
| | (22 | ) | |
| | |
| | (246 | ) | | |
| | |
| | 191 |
|
| Total interest-bearing deposits | |
| | |
| | (995 | ) | | |
| | |
| | (3,810 | ) | |
| | |
| | (1,012 | ) | | |
| | |
| | (995 | ) |
| Federal funds purchased, securities loaned or sold under agreements to repurchase and other short-term borrowings | (910 | ) | | 1,810 |
| | 900 |
| | (649 | ) | | (1,164 | ) | | (1,813 | ) | (78 | ) | | (949 | ) | | (1,027 | ) | | (910 | ) | | 1,810 |
| | 900 |
|
| Trading account liabilities | (200 | ) | | (159 | ) | | (359 | ) | | 556 |
| | (60 | ) | | 496 |
| (162 | ) | | (287 | ) | | (449 | ) | | (200 | ) | | (159 | ) | | (359 | ) |
| Long-term debt | (1,955 | ) | | 55 |
| | (1,900 | ) | | 1,509 |
| | (3,215 | ) | | (1,706 | ) | (2,948 | ) | | 560 |
| | (2,388 | ) | | (1,955 | ) | | 55 |
| | (1,900 | ) |
| Total interest expense | |
| | |
| | (2,354 | ) | | |
| | |
| | (6,833 | ) | |
| | |
| | (4,876 | ) | | |
| | |
| | (2,354 | ) |
Net increase (decrease) in interest income (2) | |
| | |
| | $ | (6,923 | ) | | |
| | |
| | $ | 4,294 |
| |
Net decrease in interest income (2) | | |
| | |
| | $ | (4,034 | ) | | |
| | |
| | $ | (6,923 | ) |
| |
(1) | The changes for each category of interest income and expense are divided between the portion of change attributable to the variance in volume and the portion of change attributable to the variance in rate for that category. The unallocated change in rate or volume variance is allocated between the rate and volume variances. |
| |
(2) | For this presentation, fees earned on overnight deposits placed with the Federal Reserve are included in the cash and cash equivalents line, consistent with the Corporation'sCorporation’s Consolidated Balance Sheet presentation of these deposits. In addition, for 2012, fees earned on deposits, primarily overnight, placed with certain non-U.S. central banks, which are included in the time deposits placed and other short-term investments line in prior periods, have been included in the cash and cash equivalents line. Net interest income in the table is calculated excluding these fees. |
|
| | |
| | 130Bank of America 20112012131
| | |
| | | | | | | | | | | | | | | |
Table III Preferred Stock Cash Dividend Summary (as of February 23, 2012) | |
Table III Preferred Stock Cash Dividend Summary (as of February 28, 2013) | | Table III Preferred Stock Cash Dividend Summary (as of February 28, 2013) |
| | | | | | | | | | | | | |
| | December 31, 2011 | | | | | December 31, 2012 | | | | |
| Preferred Stock | | Outstanding
Notional
Amount (in millions) | | Declaration Date | | Record Date | | Payment Date | | Per Annum Dividend Rate | | Dividend Per Share | | Outstanding
Notional
Amount (in millions) | | Declaration Date | | Record Date | | Payment Date | | Per Annum Dividend Rate | | Dividend Per Share |
Series B (1) | | $ | 1 |
| | January 11, 2012 | | April 11, 2012 | | April 25, 2012 | | 7.00 | % | | $ | 1.75 |
| | $ | 1 |
| | January 23, 2013 | | April 11, 2013 | | April 25, 2013 | | 7.00 | % | | $ | 1.75 |
|
| | | | | November 18, 2011 | | January 11, 2012 | | January 25, 2012 | | 7.00 |
| | 1.75 |
| | | | October 24, 2012 | | January 11, 2013 | | January 25, 2013 | | 7.00 |
| | 1.75 |
|
| | | |
| | August 22, 2011 | | October 11, 2011 | | October 25, 2011 | | 7.00 |
| | 1.75 |
| | |
| | July 11, 2012 | | October 11, 2012 | | October 25, 2012 | | 7.00 |
| | 1.75 |
|
| | | |
| | May 11, 2011 | | July 11, 2011 | | July 25, 2011 | | 7.00 |
| | 1.75 |
| | |
| | April 11, 2012 | | July 11, 2012 | | July 25, 2012 | | 7.00 |
| | 1.75 |
|
| | | |
| | January 26, 2011 | | April 11, 2011 | | April 25, 2011 | | 7.00 |
| | 1.75 |
| | |
| | January 11, 2012 | | April 11, 2012 | | April 25, 2012 | | 7.00 |
| | 1.75 |
|
Series D (2) | | $ | 654 |
| | | January 4, 2012 | | February 29, 2012 | | March 14, 2012 | | 6.204 | % | | $ | 0.38775 |
| | $ | 654 |
| | January 3, 2013 | | February 28, 2013 | | March 14, 2013 | | 6.204 | % | | $ | 0.38775 |
|
| | | |
| | October 4, 2011 | | November 30, 2011 | | December 14, 2011 | | 6.204 |
| | 0.38775 |
| | |
| | October 1, 2012 | | November 30, 2012 | | December 14, 2012 | | 6.204 |
| | 0.38775 |
|
| | | |
| | July 5, 2011 | | August 31, 2011 | | September 14, 2011 | | 6.204 |
| | 0.38775 |
| | |
| | July 3, 2012 | | August 31, 2012 | | September 14, 2012 | | 6.204 |
| | 0.38775 |
|
| | | |
| | April 4, 2011 | | May 31, 2011 | | June 14, 2011 | | 6.204 |
| | 0.38775 |
| | | | April 3, 2012 | | May 31, 2012 | | June 14, 2012 | | 6.204 |
| | 0.38775 |
|
| | | |
| | January 4, 2011 | | February 28, 2011 | | March 14, 2011 | | 6.204 |
| | 0.38775 |
| | | | January 4, 2012 | | February 29, 2012 | | March 14, 2012 | | 6.204 |
| | 0.38775 |
|
Series E (2) | | $ | 340 |
| | January 4, 2012 | | January 31, 2012 | | February 15, 2012 | | Floating |
| | $ | 0.25556 |
| | $ | 317 |
| | January 3, 2013 | | January 31, 2013 | | February 15, 2013 | | Floating |
| | $ | 0.25556 |
|
| | | |
| | October 4, 2011 | | October 31, 2011 | | November 15, 2011 | | Floating |
| | 0.25556 |
| | | | October 1, 2012 | | October 31, 2012 | | November 15, 2012 | | Floating |
| | 0.25556 |
|
| | | | |
| | July 3, 2012 | | July 31, 2012 | | August 15, 2012 | | Floating |
| | 0.25556 |
|
| | | | | | April 3, 2012 | | April 30, 2012 | | May 15, 2012 | | Floating |
| | 0.25000 |
|
| | | | | | January 4, 2012 | | January 31, 2012 | | February 15, 2012 | | Floating |
| | 0.25556 |
|
| Series F | | | $ | 141 |
| | January 3, 2013 | | February 28, 2013 | | March 15, 2013 | | Floating |
| | $ | 1,000.00 |
|
| | | | | | October 1, 2012 | | November 30, 2012 | | December 17, 2012 | | Floating |
| | 1,011.11 |
|
| | | | | | July 3, 2012 | | August 31, 2012 | | September 17, 2012 | | Floating |
| | 1,022.22 |
|
| | | | | | April 3, 2012 | | May 31, 2012 | | June 15, 2012 | | Floating |
| | 1,022.22 |
|
| Series G | | | $ | 493 |
| | January 3, 2013 | | February 28, 2013 | | March 15, 2013 | | Adjustable |
| | $ | 1,000.00 |
|
| | | |
| | July 5, 2011 | | July 29, 2011 | | August 15, 2011 | | Floating |
| | 0.25556 |
| | | | October 1, 2012 | | November 30, 2012 | | December 17, 2012 | | Adjustable |
| | 1,011.11 |
|
| | | |
| | April 4, 2011 | | April 29, 2011 | | May 16, 2011 | | Floating |
| | 0.24722 |
| | | | July 3, 2012 | | August 31, 2012 | | September 17, 2012 | | Adjustable |
| | 1,022.22 |
|
| | | |
| | January 4, 2011 | | January 31, 2011 | | February 15, 2011 | | Floating |
| | 0.25556 |
| | | | April 3, 2012 | | May 31, 2012 | | June 15, 2012 | | Adjustable |
| | 1,022.22 |
|
Series H (2) | | $ | 2,862 |
| | | January 4, 2012 | | January 15, 2012 | | February 1, 2012 | | 8.20 | % | | $ | 0.51250 |
| | $ | 2,862 |
| | January 3, 2013 | | January 15, 2013 | | February 1, 2013 | | 8.20 | % | | $ | 0.51250 |
|
| | | |
| | October 4, 2011 | | October 15, 2011 | | November 1, 2011 | | 8.20 |
| | 0.51250 |
| | |
| | October 1, 2012 | | October 15, 2012 | | November 1, 2012 | | 8.20 |
| | 0.51250 |
|
| | | |
| | July 5, 2011 | | July 15, 2011 | | August 1, 2011 | | 8.20 |
| | 0.51250 |
| | |
| | July 3, 2012 | | July 15, 2012 | | August 1, 2012 | | 8.20 |
| | 0.51250 |
|
| | | |
| | April 4, 2011 | | April 15, 2011 | | May 2, 2011 | | 8.20 |
| | 0.51250 |
| | |
| | April 3, 2012 | | April 15, 2012 | | May 1, 2012 | | 8.20 |
| | 0.51250 |
|
| | | |
| | January 4, 2011 | | January 15, 2011 | | February 1, 2011 | | 8.20 |
| | 0.51250 |
| | |
| | January 4, 2012 | | January 15, 2012 | | February 1, 2012 | | 8.20 |
| | 0.51250 |
|
Series I (2) | | $ | 365 |
| | January 4, 2012 | | March 15, 2012 | | April 2, 2012 | | 6.625 | % | | $ | 0.41406 |
| | $ | 365 |
| | January 3, 2013 | | March 15, 2013 | | April 1, 2013 | | 6.625 | % | | $ | 0.41406 |
|
| | | |
| | October 4, 2011 | | December 15, 2011 | | January 2, 2012 | | 6.625 |
| | 0.41406 |
| | |
| | October 1, 2012 | | December 15, 2012 | | January 2, 2013 | | 6.625 |
| | 0.41406 |
|
| | | |
| | July 5, 2011 | | September 15, 2011 | | October 3, 2011 | | 6.625 |
| | 0.41406 |
| | |
| | July 3, 2012 | | September 15, 2012 | | October 1, 2012 | | 6.625 |
| | 0.41406 |
|
| | | |
| | April 4, 2011 | | June 15, 2011 | | July 1, 2011 | | 6.625 |
| | 0.41406 |
| | |
| | April 3, 2012 | | June 15, 2012 | | July 2, 2012 | | 6.625 |
| | 0.41406 |
|
| | | |
| | January 4, 2011 | | March 15, 2011 | | April 1, 2011 | | 6.625 |
| | 0.41406 |
| | |
| | January 4, 2012 | | March 15, 2012 | | April 2, 2012 | | 6.625 |
| | 0.41406 |
|
Series J (2) | | $ | 951 |
| | | January 4, 2012 | | January 15, 2012 | | February 1, 2012 | | 7.25 | % | | $ | 0.45312 |
| | $ | 951 |
| | January 3, 2013 | | January 15, 2013 | | February 1, 2013 | | 7.25 | % | | $ | 0.45312 |
|
| | | |
| | October 4, 2011 | | October 15, 2011 | | November 1, 2011 | | 7.25 |
| | 0.45312 |
| | |
| | October 1, 2012 | | October 15, 2012 | | November 1, 2012 | | 7.25 |
| | 0.45312 |
|
| | | |
| | July 5, 2011 | | July 15, 2011 | | August 1, 2011 | | 7.25 |
| | 0.45312 |
| | |
| | July 3, 2012 | | July 15, 2012 | | August 1, 2012 | | 7.25 |
| | 0.45312 |
|
| | | |
| | April 4, 2011 | | April 15, 2011 | | May 2, 2011 | | 7.25 |
| | 0.45312 |
| | |
| | April 3, 2012 | | April 15, 2012 | | May 1, 2012 | | 7.25 |
| | 0.45312 |
|
| | | |
| | January 4, 2011 | | January 15, 2011 | | February 1, 2011 | | 7.25 |
| | 0.45312 |
| | |
| | January 4, 2012 | | January 15, 2012 | | February 1, 2012 | | 7.25 |
| | 0.45312 |
|
Series K (3, 4) | | $ | 1,544 |
| | January 4, 2012 | | January 15, 2012 | | January 30, 2012 | | Fixed-to-floating |
| | $ | 40.00 |
| | $ | 1,544 |
| | January 3, 2013 | | January 15, 2013 | | January 30, 2013 | | Fixed-to-floating |
| | $ | 40.00 |
|
| | | |
| | July 5, 2011 | | July 15, 2011 | | August 1, 2011 | | Fixed-to-floating |
| | 40.00 |
| | |
| | July 3, 2012 | | July 15, 2012 | | July 30, 2012 | | Fixed-to-floating |
| | 40.00 |
|
| | | |
| | January 4, 2011 | | January 15, 2011 | | January 31, 2011 | | Fixed-to-floating |
| | 40.00 |
| | |
| | January 4, 2012 | | January 15, 2012 | | January 30, 2012 | | Fixed-to-floating |
| | 40.00 |
|
| Series L | | $ | 3,080 |
| | | December 16, 2011 | | January 1, 2012 | | January 30, 2012 | | 7.25 | % | | $ | 18.125 |
| | $ | 3,080 |
| | December 17, 2012 | | January 1, 2013 | | January 30, 2013 | | 7.25 | % | | $ | 18.125 |
|
| | | |
| | September 16, 2011 | | October 1, 2011 | | October 31, 2011 | | 7.25 |
| | 18.125 |
| | |
| | September 17, 2012 | | October 1, 2012 | | October 30, 2012 | | 7.25 |
| | 18.125 |
|
| | | |
| | June 17, 2011 | | July 1, 2011 | | August 1, 2011 | | 7.25 |
| | 18.125 |
| | |
| | June 15, 2012 | | July 1, 2012 | | July 30, 2012 | | 7.25 |
| | 18.125 |
|
| | | |
| | March 17, 2011 | | April 1, 2011 | | May 2, 2011 | | 7.25 |
| | 18.125 |
| | |
| | March 16, 2012 | | April 1, 2012 | | April 30, 2012 | | 7.25 |
| | 18.125 |
|
Series M (3, 4) | | $ | 1,310 |
| | October 4, 2011 | | October 31, 2011 | | November 15, 2011 | | Fixed-to-floating |
| | $ | 40.625 |
| | $ | 1,310 |
| | October 1, 2012 | | October 31, 2012 | | November 15, 2012 | | Fixed-to-floating |
| | $ | 40.625 |
|
| | | |
| | April 4, 2011 | | April 30, 2011 | | May 16, 2011 | | Fixed-to-floating |
| | 40.625 |
| | |
| | April 3, 2012 | | April 30, 2012 | | May 15, 2012 | | Fixed-to-floating |
| | 40.625 |
|
Series T (1) | | $ | 5,000 |
| | | December 16, 2011 | | December 26, 2011 | | January 10, 2012 | | 6.00 | % | | $ | 1,500.00 |
| | $ | 5,000 |
| | December 17, 2012 | | December 31, 2012 | | January 10, 2013 | | 6.00 | % | | $ | 1,500.00 |
|
| | | | | September 21, 2011 | | September 25, 2011 | | October 11, 2011 | | 6.00 |
| | 650.00 |
| | | | September 17, 2012 | | September 24, 2012 | | October 10, 2012 | | 6.00 |
| | 1,500.00 |
|
| | | | | | June 15, 2012 | | June 25, 2012 | | July 10, 2012 | | 6.00 |
| | 1,500.00 |
|
| | | | | | March 16, 2012 | | March 26, 2012 | | April 10, 2012 | | 6.00 |
| | 1,500.00 |
|
| |
(1) | Dividends are cumulative. |
| |
(2) | Dividends per depositary share, each representing a 1/1,000th interest in a share of preferred stock. |
| |
(3) | Initially pays dividends semi-annually. |
| |
(4) | Dividends per depositary share, each representing a 1/25th interest in a share of preferred stock. |
|
| | |
132 Bank of America 2012 | | Bank of America131
|
| | | | | | | | | | | | | | | |
Table III Preferred Stock Cash Dividend Summary (as of February 23, 2012) (continued) | |
Table III Preferred Stock Cash Dividend Summary (as of February 28, 2013) (continued) | | Table III Preferred Stock Cash Dividend Summary (as of February 28, 2013) (continued) |
| | | | | | | | | | | | | |
| | December 31, 2011 | | | | | December 31, 2012 | | | | |
| Preferred Stock | | Outstanding
Notional
Amount (in millions) | | Declaration Date | | Record Date | | Payment Date | | Per Annum Dividend Rate | | Dividend Per Share | | Outstanding
Notional
Amount (in millions) | | Declaration Date | | Record Date | | Payment Date | | Per Annum Dividend Rate | | Dividend Per Share |
Series 1 (5) | | $ | 109 |
| | January 4, 2012 | | February 15, 2012 | | February 28, 2012 | | Floating |
| | $ | 0.19167 |
| | $ | 98 |
| | January 3, 2013 | | February 15, 2013 | | February 28, 2013 | | Floating |
| | $ | 0.18750 |
|
| | | |
| | October 4, 2011 | | November 15, 2011 | | November 28, 2011 | | Floating |
| | 0.19167 |
| | | | October 1, 2012 | | November 15, 2012 | | November 28, 2012 | | Floating |
| | 0.18750 |
|
| | | |
| | July 5, 2011 | | August 15, 2011 | | August 30, 2011 | | Floating |
| | 0.19167 |
| | |
| | July 3, 2012 | | August 15, 2012 | | August 28, 2012 | | Floating |
| | 0.18750 |
|
| | | |
| | April 4, 2011 | | May 15, 2011 | | May 31, 2011 | | Floating |
| | 0.18542 |
| | | | April 3, 2012 | | May 15, 2012 | | May 29, 2012 | | Floating |
| | 0.18750 |
|
| | | |
| | January 4, 2011 | | February 15, 2011 | | February 28, 2011 | | Floating |
| | 0.19167 |
| | | | January 4, 2012 | | February 15, 2012 | | February 28, 2012 | | Floating |
| | 0.19167 |
|
Series 2 (5) | | $ | 363 |
| | | January 4, 2012 | | February 15, 2012 | | February 28, 2012 | | Floating |
| | $ | 0.19167 |
| | $ | 299 |
| | January 3, 2013 | | February 15, 2013 | | February 28, 2013 | | Floating |
| | $ | 0.19167 |
|
| | | |
| | October 4, 2011 | | November 15, 2011 | | November 28, 2011 | | Floating |
| | 0.19167 |
| | | | October 1, 2012 | | November 15, 2012 | | November 28, 2012 | | Floating |
| | 0.19167 |
|
| | | |
| | July 5, 2011 | | August 15, 2011 | | August 30, 2011 | | Floating |
| | 0.19167 |
| | |
| | July 3, 2012 | | August 15, 2012 | | August 28, 2012 | | Floating |
| | 0.19167 |
|
| | | |
| | April 4, 2011 | | May 15, 2011 | | May 31, 2011 | | Floating |
| | 0.18542 |
| | | | April 3, 2012 | | May 15, 2012 | | May 29, 2012 | | Floating |
| | 0.18750 |
|
| | | |
| | January 4, 2011 | | February 15, 2011 | | February 28, 2011 | | Floating |
| | 0.19167 |
| | | | January 4, 2012 | | February 15, 2012 | | February 28, 2012 | | Floating |
| | 0.19167 |
|
Series 3 (5) | | $ | 653 |
| | January 4, 2012 | | February 15, 2012 | | February 28, 2012 | | 6.375 | % | | $ | 0.39843 |
| | $ | 653 |
| | January 3, 2013 | | February 15, 2013 | | February 28, 2013 | | 6.375 | % | | $ | 0.39843 |
|
| | | |
| | October 4, 2011 | | November 15, 2011 | | November 28, 2011 | | 6.375 |
| | 0.39843 |
| | |
| | October 1, 2012 | | November 15, 2012 | | November 28, 2012 | | 6.375 |
| | 0.39843 |
|
| | | |
| | July 5, 2011 | | August 15, 2011 | | August 29, 2011 | | 6.375 |
| | 0.39843 |
| | |
| | July 3, 2012 | | August 15, 2012 | | August 28, 2012 | | 6.375 |
| | 0.39843 |
|
| | | |
| | April 4, 2011 | | May 15, 2011 | | May 31, 2011 | | 6.375 |
| | 0.39843 |
| | |
| | April 3, 2012 | | May 15, 2012 | | May 29, 2012 | | 6.375 |
| | 0.39843 |
|
| | | |
| | January 4, 2011 | | February 15, 2011 | | February 28, 2011 | | 6.375 |
| | 0.39843 |
| | |
| | January 4, 2012 | | February 15, 2012 | | February 28, 2012 | | 6.375 |
| | 0.39843 |
|
Series 4 (5) | | $ | 323 |
| | | January 4, 2012 | | February 15, 2012 | | February 28, 2012 | | Floating |
| | $ | 0.25556 |
| | $ | 210 |
| | January 3, 2013 | | February 15, 2013 | | February 28, 2013 | | Floating |
| | $ | 0.25556 |
|
| | | |
| | October 4, 2011 | | November 15, 2011 | | November 28, 2011 | | Floating |
| | 0.25556 |
| | | | October 1, 2012 | | November 15, 2012 | | November 28, 2012 | | Floating |
| | 0.25556 |
|
| | | |
| | July 5, 2011 | | August 15, 2011 | | August 30, 2011 | | Floating |
| | 0.25556 |
| | |
| | July 3, 2012 | | August 15, 2012 | | August 28, 2012 | | Floating |
| | 0.25556 |
|
| | | |
| | April 4, 2011 | | May 15, 2011 | | May 31, 2011 | | Floating |
| | 0.24722 |
| | | | April 3, 2012 | | May 15, 2012 | | May 29, 2012 | | Floating |
| | 0.25000 |
|
| | | |
| | January 4, 2011 | | February 15, 2011 | | February 28, 2011 | | Floating |
| | 0.25556 |
| | | | January 4, 2012 | | February 15, 2012 | | February 28, 2012 | | Floating |
| | 0.25556 |
|
Series 5 (5) | | $ | 507 |
| | January 4, 2012 | | February 1, 2012 | | February 21, 2012 | | Floating |
| | $ | 0.25556 |
| | $ | 422 |
| | January 3, 2013 | | February 1, 2013 | | February 21, 2013 | | Floating |
| | $ | 0.25556 |
|
| | | |
| | October 4, 2011 | | November 1, 2011 | | November 21, 2011 | | Floating |
| | 0.25556 |
| | | | October 1, 2012 | | November 1, 2012 | | November 21, 2012 | | Floating |
| | 0.25556 |
|
| | | |
| | July 5, 2011 | | August 1, 2011 | | August 22, 2011 | | Floating |
| | 0.25556 |
| | |
| | July 3, 2012 | | August 1, 2012 | | August 21, 2012 | | Floating |
| | 0.25556 |
|
| | | |
| | April 4, 2011 | | May 1, 2011 | | May 23, 2011 | | Floating |
| | 0.24722 |
| | | | April 3, 2012 | | May 1, 2012 | | May 21, 2012 | | Floating |
| | 0.25000 |
|
| | | |
| | January 4, 2011 | | February 1, 2011 | | February 22, 2011 | | Floating |
| | 0.25556 |
| | | | January 4, 2012 | | February 1, 2012 | | February 21, 2012 | | Floating |
| | 0.25556 |
|
Series 6 (6) | | $ | 60 |
| | | January 4, 2012 | | March 15, 2012 | | March 30, 2012 | | 6.70 | % | | $ | 0.41875 |
| | $ | 59 |
| | January 3, 2013 | | March 15, 2013 | | March 29, 2013 | | 6.70 | % | | $ | 0.41875 |
|
| | | |
| | October 4, 2011 | | December 15, 2011 | | December 30, 2011 | | 6.70 |
| | 0.41875 |
| | | | October 1, 2012 | | December 14, 2012 | | December 28, 2012 | | 6.70 |
| | 0.41875 |
|
| | | |
| | July 5, 2011 | | September 15, 2011 | | September 30, 2011 | | 6.70 |
| | 0.41875 |
| | |
| | July 3, 2012 | | September 14, 2012 | | September 28, 2012 | | 6.70 |
| | 0.41875 |
|
| | | |
| | April 4, 2011 | | June 15, 2011 | | June 30, 2011 | | 6.70 |
| | 0.41875 |
| | | | April 3, 2012 | | June 15, 2012 | | June 29, 2012 | | 6.70 |
| | 0.41875 |
|
| | | |
| | January 4, 2011 | | March 15, 2011 | | March 30, 2011 | | 6.70 |
| | 0.41875 |
| | | | January 4, 2012 | | March 15, 2012 | | March 30, 2012 | | 6.70 |
| | 0.41875 |
|
Series 7 (6) | | $ | 17 |
| | January 4, 2012 | | March 15, 2012 | | March 30, 2012 | | 6.25 | % | | $ | 0.39062 |
| | $ | 17 |
| | January 3, 2013 | | March 15, 2013 | | March 29, 2013 | | 6.25 | % | | $ | 0.39062 |
|
| | | |
| | October 4, 2011 | | December 15, 2011 | | December 30, 2011 | | 6.25 |
| | 0.39062 |
| | |
| | October 1, 2012 | | December 14, 2012 | | December 28, 2012 | | 6.25 |
| | 0.39062 |
|
| | | |
| | July 5, 2011 | | September 15, 2011 | | September 30, 2011 | | 6.25 |
| | 0.39062 |
| | |
| | July 3, 2012 | | September 14, 2012 | | September 28, 2012 | | 6.25 |
| | 0.39062 |
|
| | | |
| | April 4, 2011 | | June 15, 2011 | | June 30, 2011 | | 6.25 |
| | 0.39062 |
| | |
| | April 3, 2012 | | June 15, 2012 | | June 29, 2012 | | 6.25 |
| | 0.39062 |
|
| | | |
| | January 4, 2011 | | March 15, 2011 | | March 30, 2011 | | 6.25 |
| | 0.39062 |
| | |
| | January 4, 2012 | | March 15, 2012 | | March 30, 2012 | | 6.25 |
| | 0.39062 |
|
Series 8 (5) | | $ | 2,673 |
| | | January 4, 2012 | | February 15, 2012 | | February 28, 2012 | | 8.625 | % | | $ | 0.53906 |
| | $ | 2,673 |
| | January 3, 2013 | | February 15, 2013 | | February 28, 2013 | | 8.625 | % | | $ | 0.53906 |
|
| | | |
| | October 4, 2011 | | November 15, 2011 | | November 28, 2011 | | 8.625 |
| | 0.53906 |
| | |
| | October 1, 2012 | | November 15, 2012 | | November 28, 2012 | | 8.625 |
| | 0.53906 |
|
| | | |
| | July 5, 2011 | | August 15, 2011 | | August 29, 2011 | | 8.625 |
| | 0.53906 |
| | |
| | July 3, 2012 | | August 15, 2012 | | August 28, 2012 | | 8.625 |
| | 0.53906 |
|
| | | |
| | April 4, 2011 | | May 15, 2011 | | May 31, 2011 | | 8.625 |
| | 0.53906 |
| | |
| | April 3, 2012 | | May 15, 2012 | | May 29, 2012 | | 8.625 |
| | 0.53906 |
|
| | | |
| | January 4, 2011 | | February 15, 2011 | | February 28, 2011 | | 8.625 |
| | 0.53906 |
| | |
| | January 4, 2012 | | February 15, 2012 | | February 28, 2012 | | 8.625 |
| | 0.53906 |
|
| |
(5) | Dividends per depositary share, each representing a 1/1,200th interest in a share of preferred stock. |
| |
(6) | Dividends per depositary share, each representing a 1/40th interest in a share of preferred stock. |
|
| | |
| | 132Bank of America 20112012133
| | |
| | | | | | | | | | | | | | | | | | | | | |
Table IV Outstanding Loans and Leases | Table IV Outstanding Loans and Leases | Table IV Outstanding Loans and Leases |
| | | | | | | | | | | | | | | | | | | |
| | December 31 | December 31 |
| (Dollars in millions) | 2011 | | 2010 (1) | | 2009 | | 2008 | | 2007 | 2012 (1) | | 2011 (1) | | 2010 (1) | | 2009 | | 2008 |
| Consumer | |
| | |
| | |
| | |
| | |
| |
| | |
| | |
| | |
| | |
|
Residential mortgage (2) | $ | 262,290 |
| | $ | 257,973 |
| | $ | 242,129 |
| | $ | 248,063 |
| | $ | 274,949 |
| $ | 243,181 |
| | $ | 262,290 |
| | $ | 257,973 |
| | $ | 242,129 |
| | $ | 248,063 |
|
| Home equity | 124,699 |
| | 137,981 |
| | 149,126 |
| | 152,483 |
| | 114,820 |
| 107,996 |
| | 124,699 |
| | 137,981 |
| | 149,126 |
| | 152,483 |
|
Discontinued real estate (3) | 11,095 |
| | 13,108 |
| | 14,854 |
| | 19,981 |
| | n/a |
| 9,892 |
| | 11,095 |
| | 13,108 |
| | 14,854 |
| | 19,981 |
|
| U.S. credit card | 102,291 |
| | 113,785 |
| | 49,453 |
| | 64,128 |
| | 65,774 |
| 94,835 |
| | 102,291 |
| | 113,785 |
| | 49,453 |
| | 64,128 |
|
| Non-U.S. credit card | 14,418 |
| | 27,465 |
| | 21,656 |
| | 17,146 |
| | 14,950 |
| 11,697 |
| | 14,418 |
| | 27,465 |
| | 21,656 |
| | 17,146 |
|
Direct/Indirect consumer (4) | 89,713 |
| | 90,308 |
| | 97,236 |
| | 83,436 |
| | 76,538 |
| 83,205 |
| | 89,713 |
| | 90,308 |
| | 97,236 |
| | 83,436 |
|
Other consumer (5) | 2,688 |
| | 2,830 |
| | 3,110 |
| | 3,442 |
| | 4,170 |
| 1,628 |
| | 2,688 |
| | 2,830 |
| | 3,110 |
| | 3,442 |
|
| Total consumer loans | 607,194 |
| | 643,450 |
| | 577,564 |
| | 588,679 |
| | 551,201 |
| 552,434 |
| | 607,194 |
| | 643,450 |
| | 577,564 |
| | 588,679 |
|
Consumer loans accounted for under the fair value option (6) | 2,190 |
| | — |
| | — |
| | — |
| | — |
| 1,005 |
| | 2,190 |
| | — |
| | — |
| | — |
|
| Total consumer | 609,384 |
| | 643,450 |
| | 577,564 |
| | 588,679 |
| | 551,201 |
| 553,439 |
| | 609,384 |
| | 643,450 |
| | 577,564 |
| | 588,679 |
|
| Commercial | | | | | | | | | | | | | | | | | | |
U.S. commercial (7) | 193,199 |
| | 190,305 |
| | 198,903 |
| | 219,233 |
| | 208,297 |
| 209,719 |
| | 193,199 |
| | 190,305 |
| | 198,903 |
| | 219,233 |
|
Commercial real estate (8) | 39,596 |
| | 49,393 |
| | 69,447 |
| | 64,701 |
| | 61,298 |
| 38,637 |
| | 39,596 |
| | 49,393 |
| | 69,447 |
| | 64,701 |
|
| Commercial lease financing | 21,989 |
| | 21,942 |
| | 22,199 |
| | 22,400 |
| | 22,582 |
| 23,843 |
| | 21,989 |
| | 21,942 |
| | 22,199 |
| | 22,400 |
|
| Non-U.S. commercial | 55,418 |
| | 32,029 |
| | 27,079 |
| | 31,020 |
| | 28,376 |
| 74,184 |
| | 55,418 |
| | 32,029 |
| | 27,079 |
| | 31,020 |
|
| Total commercial loans | 310,202 |
| | 293,669 |
| | 317,628 |
| | 337,354 |
| | 320,553 |
| 346,383 |
| | 310,202 |
| | 293,669 |
| | 317,628 |
| | 337,354 |
|
Commercial loans accounted for under the fair value option (6) | 6,614 |
| | 3,321 |
| | 4,936 |
| | 5,413 |
| | 4,590 |
| 7,997 |
| | 6,614 |
| | 3,321 |
| | 4,936 |
| | 5,413 |
|
| Total commercial | 316,816 |
| | 296,990 |
| | 322,564 |
| | 342,767 |
| | 325,143 |
| 354,380 |
| | 316,816 |
| | 296,990 |
| | 322,564 |
| | 342,767 |
|
| Total loans and leases | $ | 926,200 |
| | $ | 940,440 |
| | $ | 900,128 |
| | $ | 931,446 |
| | $ | 876,344 |
| $ | 907,819 |
| | $ | 926,200 |
| | $ | 940,440 |
| | $ | 900,128 |
| | $ | 931,446 |
|
| |
(1) | 2012, 2011 and 2010 periods are presented in accordance with new consolidation guidance.guidance that was effective January 1, 2010. |
| |
(2) | Includes non-U.S. residential mortgagesmortgage loans of$93 million, $85 million, $90 million and $552$552 million at December 31, 2012, 2011, 2010 and 2009, respectively. There were no material non-U.S. residential mortgage loans prior to January 1, 2009. |
| |
(3) | Includes $8.8 billion, $9.9 billion, $11.8 billion, $13.4$13.4 billion and $18.2$18.2 billion of pay option loans, and$1.1 billion, $1.2 billion, $1.3 billion, $1.5$1.5 billion and $1.8$1.8 billion of subprime loans at December 31, 2012, 2011, 2010, 2009 and 2008, respectively. We no longer originate these products. |
| |
(4) | Includes dealer financial services loans of $35.9 billion, $43.0 billion, $43.3 billion, $41.6$41.6 billion $40.1 and $40.1 billion and $37.2 billion;, consumer lending loans of$4.7 billion, $8.0 billion, $12.4 billion, $19.7$19.7 billion $28.2 and $28.2 billion and $24.4 billion;, U.S. securities-based lending margin loans of$28.3 billion, $23.6 billion, $16.6 billion, $12.9$12.9 billion $0 and $0;$0, student loans of$4.8 billion, $6.0 billion, $6.8 billion, $10.8$10.8 billion $8.3 and $8.3 billion and $4.7 billion;, non-U.S. consumer loans of$8.3 billion, $7.6 billion, $8.0 billion, $8.0$8.0 billion $1.8 and $1.8 billion and $3.4 billion;, and other consumer loans of$1.2 billion, $1.5 billion, $3.2 billion, $4.2$4.2 billion $5.0 and $5.0 billion and $6.8 billion at December 31, 2012, 2011, 2010, 2009, and 2008 and 2007, respectively. |
| |
(5) | Includes consumer finance loans of $1.4 billion, $1.7 billion, $1.9 billion, $2.3$2.3 billion $2.6 and $2.6 billion and $3.0 billion,, other non-U.S. consumer loans of$5 million, $929 million, $803 million, $709$709 million $618 and $618 million and $829 million,, and consumer overdrafts of$177 million, $103 million, $88 million, $144$144 million $211 and $211 million and $320 million at December 31, 2012, 2011, 2010, 2009, and 2008 and 2007, respectively. |
| |
(6) | Certain consumerConsumer loans are accounted for under the fair value option and includewere residential mortgage loans of $147 million and $906 million and, discontinued real estate loans of$858 million and $1.3 billion at December 31, 2012 and 2011. There were no consumer loans accounted for under the fair value option prior to 2011. Certain commercialCommercial loans are accounted for under the fair value option and includewere U.S. commercial loans of$2.3 billion, $2.2 billion, $1.6 billion, $3.0$3.0 billion $3.5 and $3.5 billion and $3.5 billion,, commercial real estate loans of $0, $0, $79 million, $90$90 million $203 and $203 million and $304 million, and non-U.S. commercial loans of$5.7 billion, $4.4 billion, $1.7 billion, $1.9$1.9 billion $1.7 and $1.7 billion and $790 million at December 31, 2012, 2011, 2010, 2009, and 2008 and 2007, respectively.
|
| |
(7) | Includes U.S. small business commercial loans, including card-related products, of $13.3$12.6 billion $14.7, $13.3 billion $17.5, $14.7 billion $19.1, $17.5 billion and $19.3$19.1 billion at December 31, 2012, 2011, 2010, 2009, and 2008 and 2007, respectively. |
| |
(8) | Includes U.S. commercial real estate loans of $37.2 billion, $37.8 billion, $46.9 billion, $66.5$66.5 billion $63.7 and $63.7 billion and $60.2 billion,, and non-U.S. commercial real estate loans of$1.5 billion, $1.8 billion, $2.5 billion, $3.0$3.0 billion $979 and $979 million and $1.1 billion at December 31, 2012, 2011, 2010, 2009, and 2008 and 2007, respectively. |
n/a = not applicable
|
| | |
134 Bank of America 2012 | | Bank of America133
|
| | | | | | | | | | | | | | | | | | | | | |
Table V Nonperforming Loans, Leases and Foreclosed Properties (1) | Table V Nonperforming Loans, Leases and Foreclosed Properties (1) | Table V Nonperforming Loans, Leases and Foreclosed Properties (1) |
| | | | | | | | | | | | | | | | | | | |
| | December 31 | December 31 |
| (Dollars in millions) | 2011 | | 2010 | | 2009 | | 2008 | | 2007 | 2012 | | 2011 | | 2010 | | 2009 | | 2008 |
| Consumer | |
| | |
| | |
| | |
| | |
| |
| | |
| | |
| | |
| | |
|
| Residential mortgage | $ | 15,970 |
| | $ | 17,691 |
| | $ | 16,596 |
| | $ | 7,057 |
| | $ | 1,999 |
| $ | 14,808 |
| | $ | 15,970 |
| | $ | 17,691 |
| | $ | 16,596 |
| | $ | 7,057 |
|
| Home equity | 2,453 |
| | 2,694 |
| | 3,804 |
| | 2,637 |
| | 1,340 |
| 4,281 |
| | 2,453 |
| | 2,694 |
| | 3,804 |
| | 2,637 |
|
| Discontinued real estate | 290 |
| | 331 |
| | 249 |
| | 77 |
| | n/a |
| 248 |
| | 290 |
| | 331 |
| | 249 |
| | 77 |
|
| Direct/Indirect consumer | 40 |
| | 90 |
| | 86 |
| | 26 |
| | 8 |
| 92 |
| | 40 |
| | 90 |
| | 86 |
| | 26 |
|
| Other consumer | 15 |
| | 48 |
| | 104 |
| | 91 |
| | 95 |
| 2 |
| | 15 |
| | 48 |
| | 104 |
| | 91 |
|
Total consumer (2) | 18,768 |
| | 20,854 |
| | 20,839 |
| | 9,888 |
| | 3,442 |
| 19,431 |
| | 18,768 |
| | 20,854 |
| | 20,839 |
| | 9,888 |
|
| Commercial | |
| | |
| | |
| | |
| | |
| |
| | |
| | |
| | |
| | |
|
| U.S. commercial | 2,174 |
| | 3,453 |
| | 4,925 |
| | 2,040 |
| | 852 |
| 1,484 |
| | 2,174 |
| | 3,453 |
| | 4,925 |
| | 2,040 |
|
| Commercial real estate | 3,880 |
| | 5,829 |
| | 7,286 |
| | 3,906 |
| | 1,099 |
| 1,513 |
| | 3,880 |
| | 5,829 |
| | 7,286 |
| | 3,906 |
|
| Commercial lease financing | 26 |
| | 117 |
| | 115 |
| | 56 |
| | 33 |
| 44 |
| | 26 |
| | 117 |
| | 115 |
| | 56 |
|
| Non-U.S. commercial | 143 |
| | 233 |
| | 177 |
| | 290 |
| | 19 |
| 68 |
| | 143 |
| | 233 |
| | 177 |
| | 290 |
|
| | 6,223 |
| | 9,632 |
| | 12,503 |
| | 6,292 |
| | 2,003 |
| 3,109 |
| | 6,223 |
| | 9,632 |
| | 12,503 |
| | 6,292 |
|
| U.S. small business commercial | 114 |
| | 204 |
| | 200 |
| | 205 |
| | 152 |
| 115 |
| | 114 |
| | 204 |
| | 200 |
| | 205 |
|
Total commercial (3) | 6,337 |
| | 9,836 |
| | 12,703 |
| | 6,497 |
| | 2,155 |
| 3,224 |
| | 6,337 |
| | 9,836 |
| | 12,703 |
| | 6,497 |
|
| Total nonperforming loans and leases | 25,105 |
| | 30,690 |
| | 33,542 |
| | 16,385 |
| | 5,597 |
| 22,655 |
| | 25,105 |
| | 30,690 |
| | 33,542 |
| | 16,385 |
|
| Foreclosed properties | 2,603 |
| | 1,974 |
| | 2,205 |
| | 1,827 |
| | 351 |
| 900 |
| | 2,603 |
| | 1,974 |
| | 2,205 |
| | 1,827 |
|
Total nonperforming loans, leases and foreclosed properties (4) | $ | 27,708 |
| | $ | 32,664 |
| | $ | 35,747 |
| | $ | 18,212 |
| | $ | 5,948 |
| $ | 23,555 |
| | $ | 27,708 |
| | $ | 32,664 |
| | $ | 35,747 |
| | $ | 18,212 |
|
| |
(1) | Balances do not include PCI loans even though the customer may be contractually past due. Loans accounted for as PCI loans were written down torecorded at fair value upon acquisition and accrete interest income over the remaining life of the loan. In addition, the fully insured loan portfolio is also excluded from nonperforming loans andbalances do not include foreclosed properties sincethat are insured by the principal repayments are insured.FHA of $2.5 billion and $1.4 billion at December 31, 2012 and 2011. |
| |
(2) | In 20112012, $2.6$2.7 billion in interest income was estimated to be contractually due on consumer loans classified as nonperforming at December 31, 2011 provided that these loans had been paying according to their terms and conditions, including TDRs of which $15.7 billion were performing at December 31, 2011 and not included in the table above. Approximately $985 million of the estimated $2.6 billion in contractual interest was received and included in earnings for 2011. |
| |
(3)
| In 2011, $379 million in interest income was estimated to be contractually due on commercial loans and leases classified as nonperforming at December 31, 20112012 provided that these loans and leases had been paying according to their terms and conditions, including TDRs of which $1.820.0 billion were performing at December 31, 20112012 and not included in the table above. Approximately $123 million$1.2 billion of the estimated $379 million$2.7 billion in contractual interest was received and included in earnings for 20112012.
|
| |
(4)(3)
| Balances do not includeIn 2012, $266 million in interest income was estimated to be contractually due on commercial loans accounted for under the fair value option. Atand leases classified as nonperforming at December 31, 20112012, there were provided that these loans and leases had been paying according to their terms and conditions, including TDRs of which $7861.7 billion were performing at December 31, 2012 and not included in the table above. Approximately $106 million of loans accountedthe estimated $266 million in contractual interest was received and included in earnings for under the fair value option that were 90 days or more past due and not accruing interest.2012.
|
n/a = not applicable
| | | | | | | | | | | | | | | | | | | | | |
Table VI Accruing Loans and Leases Past Due 90 Days or More (1) | Table VI Accruing Loans and Leases Past Due 90 Days or More (1) | Table VI Accruing Loans and Leases Past Due 90 Days or More (1) |
| | | | | | | | | | | | | | | | | | | |
| | December 31 | December 31 |
| (Dollars in millions) | 2011 | | 2010 | | 2009 | | 2008 | | 2007 | 2012 | | 2011 | | 2010 | | 2009 | | 2008 |
| Consumer | |
| | |
| | |
| | |
| | |
| |
| | |
| | |
| | |
| | |
|
Residential mortgage (2) | $ | 21,164 |
| | $ | 16,768 |
| | $ | 11,680 |
| | $ | 372 |
| | $ | 237 |
| $ | 22,157 |
| | $ | 21,164 |
| | $ | 16,768 |
| | $ | 11,680 |
| | $ | 372 |
|
| U.S. credit card | 2,070 |
| | 3,320 |
| | 2,158 |
| | 2,197 |
| | 1,855 |
| 1,437 |
| | 2,070 |
| | 3,320 |
| | 2,158 |
| | 2,197 |
|
| Non-U.S. credit card | 342 |
| | 599 |
| | 515 |
| | 368 |
| | 272 |
| 212 |
| | 342 |
| | 599 |
| | 515 |
| | 368 |
|
| Direct/Indirect consumer | 746 |
| | 1,058 |
| | 1,488 |
| | 1,370 |
| | 745 |
| 545 |
| | 746 |
| | 1,058 |
| | 1,488 |
| | 1,370 |
|
| Other consumer | 2 |
| | 2 |
| | 3 |
| | 4 |
| | 4 |
| 2 |
| | 2 |
| | 2 |
| | 3 |
| | 4 |
|
| Total consumer | 24,324 |
| | 21,747 |
| | 15,844 |
| | 4,311 |
| | 3,113 |
| 24,353 |
| | 24,324 |
| | 21,747 |
| | 15,844 |
| | 4,311 |
|
| Commercial | |
| | |
| | | | |
| | |
| |
| | |
| | | | |
| | |
|
| U.S. commercial | 75 |
| | 236 |
| | 213 |
| | 381 |
| | 119 |
| 65 |
| | 75 |
| | 236 |
| | 213 |
| | 381 |
|
| Commercial real estate | 7 |
| | 47 |
| | 80 |
| | 52 |
| | 36 |
| 29 |
| | 7 |
| | 47 |
| | 80 |
| | 52 |
|
| Commercial lease financing | 14 |
| | 18 |
| | 32 |
| | 23 |
| | 25 |
| 15 |
| | 14 |
| | 18 |
| | 32 |
| | 23 |
|
| Non-U.S. commercial | — |
| | 6 |
| | 67 |
| | 7 |
| | 16 |
| — |
| | — |
| | 6 |
| | 67 |
| | 7 |
|
| | 96 |
| | 307 |
| | 392 |
| | 463 |
| | 196 |
| 109 |
| | 96 |
| | 307 |
| | 392 |
| | 463 |
|
| U.S. small business commercial | 216 |
| | 325 |
| | 624 |
| | 640 |
| | 427 |
| 120 |
| | 216 |
| | 325 |
| | 624 |
| | 640 |
|
| Total commercial | 312 |
| | 632 |
| | 1,016 |
| | 1,103 |
| | 623 |
| 229 |
| | 312 |
| | 632 |
| | 1,016 |
| | 1,103 |
|
Total accruing loans and leases past due 90 days or more (3) | $ | 24,636 |
| | $ | 22,379 |
| | $ | 16,860 |
| | $ | 5,414 |
| | $ | 3,736 |
| $ | 24,582 |
| | $ | 24,636 |
| | $ | 22,379 |
| | $ | 16,860 |
| | $ | 5,414 |
|
| |
(1) | Our policy is to classify consumer real estate-secured loans as nonperforming at 90 days past due, except the Countrywide PCI loan portfolio, the fully-insured loan portfolio and loans accounted for under the fair value option as referenced in footnote 3. |
| |
(2) | Balances are fully-insured loans. |
| |
(3) | Balances do not includeexclude loans accounted for under the fair value option. At December 31, 2012, 2011, 2010 and 20102008, there were no loans past due 90 days or more still accruing interest accounted for under the fair value option. At December 31, 2009, there was $87 million of loansoption that were past due 90 days or more and still accruing interestinterest. At December 31, 2009, approximately $87 million of loans accounted for under the fair value option.option were past due 90 days or more and still accruing interest. |
|
| | |
| | 134Bank of America 20112012135
| | |
| | | | | | | | | | | | | | | | | | | | | |
Table VII Allowance for Credit Losses | Table VII Allowance for Credit Losses | Table VII Allowance for Credit Losses |
| | | | | | | | | | | | | | | | | | | |
| (Dollars in millions) | 2011 | | 2010 | | 2009 | | 2008 | | 2007 | 2012 | | 2011 | | 2010 | | 2009 | | 2008 |
Allowance for loan and lease losses, January 1 (1) | $ | 41,885 |
| | $ | 47,988 |
| | $ | 23,071 |
| | $ | 11,588 |
| | $ | 9,016 |
| $ | 33,783 |
| | $ | 41,885 |
| | $ | 47,988 |
| | $ | 23,071 |
| | $ | 11,588 |
|
| Loans and leases charged off | | | | | |
| | |
| | |
| | | | | |
| | |
| | |
|
| Residential mortgage | (4,195 | ) | | (3,779 | ) | | (4,436 | ) | | (964 | ) | | (78 | ) | (3,211 | ) | | (4,195 | ) | | (3,779 | ) | | (4,436 | ) | | (964 | ) |
| Home equity | (4,990 | ) | | (7,059 | ) | | (7,205 | ) | | (3,597 | ) | | (286 | ) | (4,566 | ) | | (4,990 | ) | | (7,059 | ) | | (7,205 | ) | | (3,597 | ) |
| Discontinued real estate | (106 | ) | | (77 | ) | | (104 | ) | | (19 | ) | | n/a |
| (72 | ) | | (106 | ) | | (77 | ) | | (104 | ) | | (19 | ) |
| U.S. credit card | (8,114 | ) | | (13,818 | ) | | (6,753 | ) | | (4,469 | ) | | (3,410 | ) | (5,360 | ) | | (8,114 | ) | | (13,818 | ) | | (6,753 | ) | | (4,469 | ) |
| Non-U.S. credit card | (1,691 | ) | | (2,424 | ) | | (1,332 | ) | | (639 | ) | | (453 | ) | (835 | ) | | (1,691 | ) | | (2,424 | ) | | (1,332 | ) | | (639 | ) |
| Direct/Indirect consumer | (2,190 | ) | | (4,303 | ) | | (6,406 | ) | | (3,777 | ) | | (1,885 | ) | (1,258 | ) | | (2,190 | ) | | (4,303 | ) | | (6,406 | ) | | (3,777 | ) |
| Other consumer | (252 | ) | | (320 | ) | | (491 | ) | | (461 | ) | | (346 | ) | (274 | ) | | (252 | ) | | (320 | ) | | (491 | ) | | (461 | ) |
| Total consumer charge-offs | (21,538 | ) | | (31,780 | ) | | (26,727 | ) | | (13,926 | ) | | (6,458 | ) | (15,576 | ) | | (21,538 | ) | | (31,780 | ) | | (26,727 | ) | | (13,926 | ) |
U.S. commercial (2) | (1,690 | ) | | (3,190 | ) | | (5,237 | ) | | (2,567 | ) | | (1,135 | ) | (1,309 | ) | | (1,690 | ) | | (3,190 | ) | | (5,237 | ) | | (2,567 | ) |
| Commercial real estate | (1,298 | ) | | (2,185 | ) | | (2,744 | ) | | (895 | ) | | (54 | ) | (719 | ) | | (1,298 | ) | | (2,185 | ) | | (2,744 | ) | | (895 | ) |
| Commercial lease financing | (61 | ) | | (96 | ) | | (217 | ) | | (79 | ) | | (55 | ) | (32 | ) | | (61 | ) | | (96 | ) | | (217 | ) | | (79 | ) |
| Non-U.S. commercial | (155 | ) | | (139 | ) | | (558 | ) | | (199 | ) | | (28 | ) | (36 | ) | | (155 | ) | | (139 | ) | | (558 | ) | | (199 | ) |
| Total commercial charge-offs | (3,204 | ) | | (5,610 | ) | | (8,756 | ) | | (3,740 | ) | | (1,272 | ) | (2,096 | ) | | (3,204 | ) | | (5,610 | ) | | (8,756 | ) | | (3,740 | ) |
| Total loans and leases charged off | (24,742 | ) | | (37,390 | ) | | (35,483 | ) | | (17,666 | ) | | (7,730 | ) | (17,672 | ) | | (24,742 | ) | | (37,390 | ) | | (35,483 | ) | | (17,666 | ) |
| Recoveries of loans and leases previously charged off | | | | | |
| | |
| | |
| | | | | |
| | |
| | |
|
| Residential mortgage | 363 |
| | 109 |
| | 86 |
| | 39 |
| | 22 |
| 158 |
| | 363 |
| | 109 |
| | 86 |
| | 39 |
|
| Home equity | 517 |
| | 278 |
| | 155 |
| | 101 |
| | 12 |
| 329 |
| | 517 |
| | 278 |
| | 155 |
| | 101 |
|
| Discontinued real estate | 14 |
| | 9 |
| | 3 |
| | 3 |
| | n/a |
| 9 |
| | 14 |
| | 9 |
| | 3 |
| | 3 |
|
| U.S. credit card | 838 |
| | 791 |
| | 206 |
| | 308 |
| | 347 |
| 728 |
| | 838 |
| | 791 |
| | 206 |
| | 308 |
|
| Non-U.S. credit card | 522 |
| | 217 |
| | 93 |
| | 88 |
| | 74 |
| 254 |
| | 522 |
| | 217 |
| | 93 |
| | 88 |
|
| Direct/Indirect consumer | 714 |
| | 967 |
| | 943 |
| | 663 |
| | 512 |
| 495 |
| | 714 |
| | 967 |
| | 943 |
| | 663 |
|
| Other consumer | 50 |
| | 59 |
| | 63 |
| | 62 |
| | 68 |
| 42 |
| | 50 |
| | 59 |
| | 63 |
| | 62 |
|
| Total consumer recoveries | 3,018 |
| | 2,430 |
| | 1,549 |
| | 1,264 |
| | 1,035 |
| 2,015 |
| | 3,018 |
| | 2,430 |
| | 1,549 |
| | 1,264 |
|
U.S. commercial (3) | 500 |
| | 391 |
| | 161 |
| | 118 |
| | 128 |
| 368 |
| | 500 |
| | 391 |
| | 161 |
| | 118 |
|
| Commercial real estate | 351 |
| | 168 |
| | 42 |
| | 8 |
| | 7 |
| 335 |
| | 351 |
| | 168 |
| | 42 |
| | 8 |
|
| Commercial lease financing | 37 |
| | 39 |
| | 22 |
| | 19 |
| | 53 |
| 38 |
| | 37 |
| | 39 |
| | 22 |
| | 19 |
|
| Non-U.S. commercial | 3 |
| | 28 |
| | 21 |
| | 26 |
| | 27 |
| 8 |
| | 3 |
| | 28 |
| | 21 |
| | 26 |
|
| Total commercial recoveries | 891 |
| | 626 |
| | 246 |
| | 171 |
| | 215 |
| 749 |
| | 891 |
| | 626 |
| | 246 |
| | 171 |
|
| Total recoveries of loans and leases previously charged off | 3,909 |
| | 3,056 |
| | 1,795 |
| | 1,435 |
| | 1,250 |
| 2,764 |
| | 3,909 |
| | 3,056 |
| | 1,795 |
| | 1,435 |
|
| Net charge-offs | (20,833 | ) | | (34,334 | ) | | (33,688 | ) | | (16,231 | ) | | (6,480 | ) | (14,908 | ) | | (20,833 | ) | | (34,334 | ) | | (33,688 | ) | | (16,231 | ) |
| Provision for loan and lease losses | 13,629 |
| | 28,195 |
| | 48,366 |
| | 26,922 |
| | 8,357 |
| 8,310 |
| | 13,629 |
| | 28,195 |
| | 48,366 |
| | 26,922 |
|
| Write-offs of home equity PCI loans | | (2,820 | ) | | — |
| | — |
| | — |
| | — |
|
Other (4) | (898 | ) | | 36 |
| | (549 | ) | | 792 |
| | 695 |
| (186 | ) | | (898 | ) | | 36 |
| | (549 | ) | | 792 |
|
| Allowance for loan and lease losses, December 31 | 33,783 |
| | 41,885 |
| | 37,200 |
| | 23,071 |
| | 11,588 |
| 24,179 |
| | 33,783 |
| | 41,885 |
| | 37,200 |
| | 23,071 |
|
| Reserve for unfunded lending commitments, January 1 | 1,188 |
| | 1,487 |
| | 421 |
| | 518 |
| | 397 |
| 714 |
| | 1,188 |
| | 1,487 |
| | 421 |
| | 518 |
|
| Provision for unfunded lending commitments | (219 | ) | | 240 |
| | 204 |
| | (97 | ) | | 28 |
| (141 | ) | | (219 | ) | | 240 |
| | 204 |
| | (97 | ) |
Other (5) | (255 | ) | | (539 | ) | | 862 |
| | — |
| | 93 |
| (60 | ) | | (255 | ) | | (539 | ) | | 862 |
| | — |
|
| Reserve for unfunded lending commitments, December 31 | 714 |
| | 1,188 |
| | 1,487 |
| | 421 |
| | 518 |
| 513 |
| | 714 |
| | 1,188 |
| | 1,487 |
| | 421 |
|
| Allowance for credit losses, December 31 | $ | 34,497 |
| | $ | 43,073 |
| | $ | 38,687 |
| | $ | 23,492 |
| | $ | 12,106 |
| $ | 24,692 |
| | $ | 34,497 |
| | $ | 43,073 |
| | $ | 38,687 |
| | $ | 23,492 |
|
| |
(1) | The 2010 balance includes $10.8 billion of allowance for loan and lease losses related to the adoption of new consolidation guidance.guidance that was effective January 1, 2010. |
| |
(2) | Includes U.S. small business commercial charge-offs of $799 million, $1.1 billion, $2.0$2.0 billion,, $3.0 billion and $2.0 billion and $931 million in2012, 2011, 2010, 2009, and 2008 and 2007, respectively. |
| |
(3) | Includes U.S. small business commercial recoveries of $106100 million, $107106 million, $107 million, $65 million and $39 million and $51 million in2012, 2011, 2010, 2009, and 2008 and 2007, respectively. |
| |
(4) | The 2012 and 2011 amounts primarily represent the net impact of portfolio sales, consolidations and deconsolidations, and foreign currency translation adjustments. In addition, the 2011 amount includes a $449 million reserve reduction in the allowance for loan and lease losses related to Canadian consumer card loans that were transferred to LHFS. The 2009 amount includes a $750 million reduction in the allowance for loan and lease losses related to credit card loans of $8.5 billion which were exchanged for $7.8 billion in held-to-maturity debt securities that were issued by the Corporation’s U.S. Credit Card Securitization Trust and retained by the Corporation. The 2008 amount includes the $1.2 billion addition to the Countrywide allowance for loan losses as of July 1, 2008. The 2007 amount includes $750 million of additions to the allowance for loan losses for certain acquisitions. |
| |
(5) | The 2012, 2011 and 2010 amounts primarily represent accretion of the Merrill Lynch purchase accounting adjustment and the impact of funding previously unfunded positions. The 2009 amount includes the remaining balance of the acquired Merrill Lynch reserve excluding those commitments accounted for under the fair value option, net of accretion, and the impact of funding previously unfunded positions. The 2007 amount includes a $124 million addition for reserve for unfunded lending commitments for a prior acquisition. |
n/a = not applicable
|
| | |
136 Bank of America 2012 | | Bank of America135
|
|
| | | | | | | | | | | | | | | | | | | |
| | | | | | | | | | |
Table VII Allowance for Credit Losses (continued) |
| | | | | | | | | | |
| (Dollars in millions) | 2011 | | 2010 | | 2009 | | 2008 | | 2007 |
| Loan and allowance ratios: | | | | | | | | | |
Loans and leases outstanding at December 31 (5) | $ | 917,396 |
| | $ | 937,119 |
| | $ | 895,192 |
| | $ | 926,033 |
| | $ | 871,754 |
|
Allowance for loan and lease losses as a percentage of total loans and leases outstanding at December 31 (5) | 3.68 | % | | 4.47 | % | | 4.16 | % | | 2.49 | % | | 1.33 | % |
Consumer allowance for loan and lease losses as a percentage of total consumer loans outstanding at December 31 (6) | 4.88 |
| | 5.40 |
| | 4.81 |
| | 2.83 |
| | 1.23 |
|
Commercial allowance for loan and lease losses as a percentage of total commercial loans and leases outstanding at December 31 (7) | 1.33 |
| | 2.44 |
| | 2.96 |
| | 1.90 |
| | 1.51 |
|
Average loans and leases outstanding (5) | $ | 929,661 |
| | $ | 954,278 |
| | $ | 941,862 |
| | $ | 905,944 |
| | $ | 773,142 |
|
Net charge-offs as a percentage of average loans and leases outstanding (5) | 2.24 | % | | 3.60 | % | | 3.58 | % | | 1.79 | % | | 0.84 | % |
Allowance for loan and lease losses as a percentage of total nonperforming loans and leases at December 31 (5, 8) | 135 |
| | 136 |
| | 111 |
| | 141 |
| | 207 |
|
| Ratio of the allowance for loan and lease losses at December 31 to net charge-offs | 1.62 |
| | 1.22 |
| | 1.10 |
| | 1.42 |
| | 1.79 |
|
Amounts included in allowance for loan and lease losses that are excluded from nonperforming loans and leases at December 31 (9) | $ | 17,490 |
| | $ | 22,908 |
| | $ | 17,690 |
| | $ | 11,679 |
| | $ | 6,520 |
|
Allowance for loan and lease losses as a percentage of total nonperforming loans and leases excluding amounts included in the allowance for loan and lease losses that are excluded from nonperforming loans and leases at December 31 (9) | 65 | % | | 62 | % | | 58 | % | | 70 | % | | 91 | % |
| Loan and allowance ratios excluding purchased credit-impaired loans: | | | | | | | | | |
|
Allowance for loan and lease losses as a percentage of total loans and leases outstanding at December 31 (5) | 2.86 | % | | 3.94 | % | | 3.88 | % | | 2.53 | % | | n/a |
|
Consumer allowance for loan and lease losses as a percentage of total consumer loans outstanding at December 31 (6) | 3.68 |
| | 4.66 |
| | 4.43 |
| | 2.91 |
| | n/a |
|
Commercial allowance for loan and lease losses as a percentage of total commercial loans and leases outstanding at December 31 (7) | 1.33 |
| | 2.44 |
| | 2.96 |
| | 1.90 |
| | n/a |
|
Net charge-offs as a percentage of average loans and leases outstanding (5) | 2.32 |
| | 3.73 |
| | 3.71 |
| | 1.83 |
| | n/a |
|
Allowance for loan and lease losses as a percentage of total nonperforming loans and leases at December 31 (5, 8) | 101 |
| | 116 |
| | 99 |
| | 136 |
| | n/a |
|
| Ratio of the allowance for loan and lease losses at December 31 to net charge-offs | 1.22 |
| | 1.04 |
| | 1.00 |
| | 1.38 |
| | n/a |
|
|
| | | | | | | | | | | | | | | | | | | |
| | | | | | | | | | |
Table VII Allowance for Credit Losses (continued) |
| | | | | | | | | | |
| (Dollars in millions) | 2012 | | 2011 | | 2010 | | 2009 | | 2008 |
| Loan and allowance ratios: | | | | | | | | | |
Loans and leases outstanding at December 31 (6) | $ | 898,817 |
| | $ | 917,396 |
| | $ | 937,119 |
| | $ | 895,192 |
| | $ | 926,033 |
|
Allowance for loan and lease losses as a percentage of total loans and leases outstanding at December 31 (6) | 2.69 | % | | 3.68 | % | | 4.47 | % | | 4.16 | % | | 2.49 | % |
Consumer allowance for loan and lease losses as a percentage of total consumer loans outstanding at December 31 (7) | 3.81 |
| | 4.88 |
| | 5.40 |
| | 4.81 |
| | 2.83 |
|
Commercial allowance for loan and lease losses as a percentage of total commercial loans and leases outstanding at December 31 (8) | 0.90 |
| | 1.33 |
| | 2.44 |
| | 2.96 |
| | 1.90 |
|
Average loans and leases outstanding (6) | $ | 890,337 |
| | $ | 929,661 |
| | $ | 954,278 |
| | $ | 941,862 |
| | $ | 905,944 |
|
Net charge-offs as a percentage of average loans and leases outstanding (6, 9) | 1.67 | % | | 2.24 | % | | 3.60 | % | | 3.58 | % | | 1.79 | % |
Net charge-offs and PCI write-offs as a percentage of average loans and leases outstanding (6, 10) | 1.99 |
| | 2.24 |
| | 3.60 |
| | 3.58 |
| | 1.79 |
|
Allowance for loan and lease losses as a percentage of total nonperforming loans and leases at December 31 (6, 11) | 107 |
| | 135 |
| | 136 |
| | 111 |
| | 141 |
|
Ratio of the allowance for loan and lease losses at December 31 to net charge-offs (9) | 1.62 |
| | 1.62 |
| | 1.22 |
| | 1.10 |
| | 1.42 |
|
Ratio of the allowance for loan and lease losses at December 31 to net charge-offs and PCI write-offs (10) | 1.36 |
| | 1.62 |
| | 1.22 |
| | 1.10 |
| | 1.42 |
|
Amounts included in the allowance for loan and lease losses that are excluded from nonperforming loans and leases at December 31 (12) | $ | 12,021 |
| | $ | 17,490 |
| | $ | 22,908 |
| | $ | 17,690 |
| | $ | 11,679 |
|
Allowance for loan and lease losses as a percentage of total nonperforming loans and leases, excluding amounts included in the allowance for loan and lease losses that are excluded from nonperforming loans and leases at December 31 (12) | 54 | % | | 65 | % | | 62 | % | | 58 | % | | 70 | % |
Loan and allowance ratios excluding PCI loans and the related valuation allowance: (13) | | | | | | | | | |
|
Allowance for loan and lease losses as a percentage of total loans and leases outstanding at December 31 (6) | 2.14 | % | | 2.86 | % | | 3.94 | % | | 3.88 | % | | 2.53 | % |
Consumer allowance for loan and lease losses as a percentage of total consumer loans outstanding at December 31 (7) | 2.95 |
| | 3.68 |
| | 4.66 |
| | 4.43 |
| | 2.91 |
|
Net charge-offs as a percentage of average loans and leases outstanding (6) | 1.73 |
| | 2.32 |
| | 3.73 |
| | 3.71 |
| | 1.83 |
|
Allowance for loan and lease losses as a percentage of total nonperforming loans and leases at December 31 (6, 11) | 82 |
| | 101 |
| | 116 |
| | 99 |
| | 136 |
|
| Ratio of the allowance for loan and lease losses at December 31 to net charge-offs | 1.25 |
| | 1.22 |
| | 1.04 |
| | 1.00 |
| | 1.38 |
|
| |
(5)(6)
| Outstanding loan and lease balances and ratios do not include loans accounted for under the fair value option. Loans accounted for under the fair value option were $8.89.0 billion, $3.38.8 billion, $3.3 billion, $4.9 billion $5.4 billion and $4.6$5.4 billion at December 31, 2012, 2011, 2010, 2009, and 2008 and 2007, respectively. Average loans accounted for under the fair value option were $8.4 billion, $4.18.4 billion, $4.1 billion, $6.9 billion and $4.9 billion and $3.0 billion for2012, 2011, 2010, 2009, and 2008 and 2007, respectively. |
| |
(6)(7)
| Excludes consumer loans accounted for under the fair value option of $1.0 billion and $2.2 billion at December 31, 2012 and 2011. There were no consumer loans accounted for under the fair value option prior to 2011. |
| |
(7)(8)
| Excludes commercial loans accounted for under the fair value option of $6.68.0 billion, $3.36.6 billion, $3.3 billion, $4.9 billion $5.4 billion and $4.6$5.4 billion at December 31, 2012, 2011, 2010, 2009, and 2008 and 2007, respectively. |
| |
(8)(9)
| Net charge-offs exclude $2.8 billion of write-offs in the Countrywide home equity PCI loan portfolio for 2012. These write-offs decreased the PCI valuation allowance included as part of the allowance for loan and lease losses. For information on PCI write-offs, see Countrywide Purchased Credit-impaired Loan Portfolio on page 90. |
| |
(10) | There were no write-offs of PCI loans in 2011, 2010, 2009 and 2008. |
| |
(11) | For more information on our definition of nonperforming loans, see pages 9293 and 100101. |
| |
(9)(12)
| Primarily includes amounts allocated to the U.S. credit card and unsecured lending portfolios in Card Services CBBportfolios,, PCI loans and the non-U.S. credit portfolio in All Other. |
n/a = not applicable
| |
(13) | For more information on the PCI loan portfolio and the valuation allowance for PCI loans, see Note 5 – Outstanding Loans and Leases and Note 6 – Allowance for Credit Lossesto the Consolidated Financial Statements. |
|
| | |
| | 136Bank of America 20112012137
| | |
| | | | | | | | | | | | | | | | | | | | | | | | | | | | | | | | | | | | | | | | | |
Table VIII Allocation of the Allowance for Credit Losses by Product Type | Table VIII Allocation of the Allowance for Credit Losses by Product Type | Table VIII Allocation of the Allowance for Credit Losses by Product Type |
| | | | | | | | | | | | | | | | | | | | | | | | | | | | | | | | | | | | | | | |
| | December 31 | December 31 |
| | 2011 | | 2010 | | 2009 | | 2008 | | 2007 | 2012 | | 2011 | | 2010 | | 2009 | | 2008 |
| (Dollars in millions) | Amount | | Percent of Total | | Amount | | Percent of Total | | Amount | | Percent of Total | | Amount | | Percent of Total | | Amount | | Percent of Total | Amount | | Percent of Total | | Amount | | Percent of Total | | Amount | | Percent of Total | | Amount | | Percent of Total | | Amount | | Percent of Total |
| Allowance for loan and lease losses | |
| | |
| | |
| | |
| | |
| | |
| | |
| | |
| | |
| | |
| |
| | |
| | |
| | |
| | |
| | |
| | |
| | |
| | |
| | |
|
| Residential mortgage | $ | 5,935 |
| | 17.57 | % | | $ | 5,082 |
| | 12.14 | % | | $ | 4,773 |
| | 12.83 | % | | $ | 1,382 |
| | 5.99 | % | | $ | 207 |
| | 1.79 | % | $ | 5,004 |
| | 20.69 | % | | $ | 5,715 |
| | 16.92 | % | | $ | 4,923 |
| | 11.76 | % | | $ | 4,692 |
| | 12.61 | % | | $ | 1,382 |
| | 5.99 | % |
| Home equity | 13,094 |
| | 38.76 |
| | 12,887 |
| | 30.77 |
| | 10,116 |
| | 27.19 |
| | 5,385 |
| | 23.34 |
| | 963 |
| | 8.31 |
| 7,845 |
| | 32.45 |
| | 13,094 |
| | 38.76 |
| | 12,887 |
| | 30.77 |
| | 10,116 |
| | 27.19 |
| | 5,385 |
| | 23.34 |
|
| Discontinued real estate | 2,050 |
| | 6.07 |
| | 1,283 |
| | 3.06 |
| | 867 |
| | 2.33 |
| | 658 |
| | 2.85 |
| | n/a |
| | n/a |
| 2,084 |
| | 8.62 |
| | 2,270 |
| | 6.72 |
| | 1,442 |
| | 3.44 |
| | 948 |
| | 2.55 |
| | 658 |
| | 2.85 |
|
| U.S. credit card | 6,322 |
| | 18.71 |
| | 10,876 |
| | 25.97 |
| | 6,017 |
| | 16.18 |
| | 3,947 |
| | 17.11 |
| | 2,919 |
| | 25.19 |
| 4,718 |
| | 19.51 |
| | 6,322 |
| | 18.71 |
| | 10,876 |
| | 25.97 |
| | 6,017 |
| | 16.18 |
| | 3,947 |
| | 17.11 |
|
| Non-U.S. credit card | 946 |
| | 2.80 |
| | 2,045 |
| | 4.88 |
| | 1,581 |
| | 4.25 |
| | 742 |
| | 3.22 |
| | 441 |
| | 3.81 |
| 600 |
| | 2.48 |
| | 946 |
| | 2.80 |
| | 2,045 |
| | 4.88 |
| | 1,581 |
| | 4.25 |
| | 742 |
| | 3.22 |
|
| Direct/Indirect consumer | 1,153 |
| | 3.41 |
| | 2,381 |
| | 5.68 |
| | 4,227 |
| | 11.36 |
| | 4,341 |
| | 18.81 |
| | 2,077 |
| | 17.92 |
| 718 |
| | 2.97 |
| | 1,153 |
| | 3.41 |
| | 2,381 |
| | 5.68 |
| | 4,227 |
| | 11.36 |
| | 4,341 |
| | 18.81 |
|
| Other consumer | 148 |
| | 0.44 |
| | 161 |
| | 0.38 |
| | 204 |
| | 0.55 |
| | 203 |
| | 0.88 |
| | 151 |
| | 1.30 |
| 104 |
| | 0.43 |
| | 148 |
| | 0.44 |
| | 161 |
| | 0.38 |
| | 204 |
| | 0.55 |
| | 203 |
| | 0.88 |
|
| Total consumer | 29,648 |
| | 87.76 |
| | 34,715 |
| | 82.88 |
| | 27,785 |
| | 74.69 |
| | 16,658 |
| | 72.20 |
| | 6,758 |
| | 58.32 |
| 21,073 |
| | 87.15 |
| | 29,648 |
| | 87.76 |
| | 34,715 |
| | 82.88 |
| | 27,785 |
| | 74.69 |
| | 16,658 |
| | 72.20 |
|
U.S. commercial (1) | 2,441 |
| | 7.23 |
| | 3,576 |
| | 8.54 |
| | 5,152 |
| | 13.85 |
| | 4,339 |
| | 18.81 |
| | 3,194 |
| | 27.56 |
| 1,885 |
| | 7.80 |
| | 2,441 |
| | 7.23 |
| | 3,576 |
| | 8.54 |
| | 5,152 |
| | 13.85 |
| | 4,339 |
| | 18.81 |
|
| Commercial real estate | 1,349 |
| | 3.99 |
| | 3,137 |
| | 7.49 |
| | 3,567 |
| | 9.59 |
| | 1,465 |
| | 6.35 |
| | 1,083 |
| | 9.35 |
| 846 |
| | 3.50 |
| | 1,349 |
| | 3.99 |
| | 3,137 |
| | 7.49 |
| | 3,567 |
| | 9.59 |
| | 1,465 |
| | 6.35 |
|
| Commercial lease financing | 92 |
| | 0.27 |
| | 126 |
| | 0.30 |
| | 291 |
| | 0.78 |
| | 223 |
| | 0.97 |
| | 218 |
| | 1.88 |
| 78 |
| | 0.32 |
| | 92 |
| | 0.27 |
| | 126 |
| | 0.30 |
| | 291 |
| | 0.78 |
| | 223 |
| | 0.97 |
|
| Non-U.S. commercial | 253 |
| | 0.75 |
| | 331 |
| | 0.79 |
| | 405 |
| | 1.09 |
| | 386 |
| | 1.67 |
| | 335 |
| | 2.89 |
| 297 |
| | 1.23 |
| | 253 |
| | 0.75 |
| | 331 |
| | 0.79 |
| | 405 |
| | 1.09 |
| | 386 |
| | 1.67 |
|
Total commercial (2) | 4,135 |
| | 12.24 |
| | 7,170 |
| | 17.12 |
| | 9,415 |
| | 25.31 |
| | 6,413 |
| | 27.80 |
| | 4,830 |
| | 41.68 |
| 3,106 |
| | 12.85 |
| | 4,135 |
| | 12.24 |
| | 7,170 |
| | 17.12 |
| | 9,415 |
| | 25.31 |
| | 6,413 |
| | 27.80 |
|
| Allowance for loan and lease losses | 33,783 |
| | 100.00 | % | | 41,885 |
| | 100.00 | % | | 37,200 |
| | 100.00 | % | | 23,071 |
| | 100.00 | % | | 11,588 |
| | 100.00 | % | 24,179 |
| | 100.00 | % | | 33,783 |
| | 100.00 | % | | 41,885 |
| | 100.00 | % | | 37,200 |
| | 100.00 | % | | 23,071 |
| | 100.00 | % |
| Reserve for unfunded lending commitments | 714 |
| | | | 1,188 |
| | |
| | 1,487 |
| | | | 421 |
| | | | 518 |
| | | 513 |
| | | | 714 |
| | |
| | 1,188 |
| | | | 1,487 |
| | | | 421 |
| | |
Allowance for credit losses (3) | $ | 34,497 |
| | | | $ | 43,073 |
| | |
| | $ | 38,687 |
| | | | $ | 23,492 |
| | | | $ | 12,106 |
| | | $ | 24,692 |
| | | | $ | 34,497 |
| | |
| | $ | 43,073 |
| | | | $ | 38,687 |
| | | | $ | 23,492 |
| | |
| |
(1) | Includes allowance for loan and lease losses for U.S. small business commercial loans of $893642 million, $1.5 billion893 million, $2.4$1.5 billion, $2.4 billion and $1.4$2.4 billion at December 31, 2012, 2011, 2010, 2009, and 2008 and 2007, respectively. |
| |
(2) | Includes allowance for loan and lease losses for impaired commercial loans of $545330 million, $1.1 billion545 million, $1.1 billion, $1.2 billion $691 million and $123$691 million at December 31, 2012, 2011, 2010, 2009, and 2008 and 2007, respectively. |
| |
(3) | Includes $8.55.5 billion, $6.48.5 billion, $6.4 billion, $3.9 billion and $750 million of valuation reservesallowance presented with the allowance for credit losses related to PCI loans at December 31, 2012, 2011, 2010, 2009 and 2008, respectively. |
n/a = not applicable
| | | | | | | | | | | | | | | | | |
Table IX Selected Loan Maturity Data (1, 2) | Table IX Selected Loan Maturity Data (1, 2) | Table IX Selected Loan Maturity Data (1, 2) |
| | | | | | | | | | | | | | | |
| | December 31, 2011 | December 31, 2012 |
| (Dollars in millions) | Due in One Year or Less | | Due After
One Year
Through Five Years | | Due After Five Years | | Total | Due in One Year or Less | | Due After
One Year
Through Five Years | | Due After Five Years | | Total |
| U.S. commercial | $ | 57,572 |
| | $ | 94,860 |
| | $ | 42,955 |
| | $ | 195,387 |
| $ | 60,018 |
| | $ | 108,191 |
| | $ | 43,760 |
| | $ | 211,969 |
|
| U.S. commercial real estate | 14,073 |
| | 19,164 |
| | 4,533 |
| | 37,770 |
| 9,043 |
| | 23,037 |
| | 5,075 |
| | 37,155 |
|
Non-U.S. and other (3) | 53,636 |
| | 8,257 |
| | 707 |
| | 62,600 |
| 63,326 |
| | 12,605 |
| | 5,482 |
| | 81,413 |
|
| Total selected loans | $ | 125,281 |
| | $ | 122,281 |
| | $ | 48,195 |
| | $ | 295,757 |
| $ | 132,387 |
| | $ | 143,833 |
| | $ | 54,317 |
| | $ | 330,537 |
|
| Percent of total | 42 | % | | 41 | % | | 17 | % | | 100 | % | 40 | % | | 44 | % | | 16 | % | | 100 | % |
| Sensitivity of selected loans to changes in interest rates for loans due after one year: | |
| | |
| | |
| | |
| |
| | |
| | |
| | |
|
| Fixed interest rates | |
| | $ | 11,480 |
| | $ | 24,553 |
| | |
| |
| | $ | 10,531 |
| | $ | 27,378 |
| | |
|
| Floating or adjustable interest rates | |
| | 110,801 |
| | 23,642 |
| | |
| |
| | 133,302 |
| | 26,939 |
| | |
|
| Total | |
| | $ | 122,281 |
| | $ | 48,195 |
| | |
| |
| | $ | 143,833 |
| | $ | 54,317 |
| | |
|
| |
(1) | Loan maturities are based on the remaining maturities under contractual terms. |
| |
(2) | Includes loans accounted for under the fair value option. |
| |
(3) | Includes other consumer,Loan maturities include non-U.S. commercial and commercial real estate and non-U.S. commercial loans. |
|
| | | | | | | |
| | | | |
Table X Non-exchange Traded Commodity Contracts |
| | | | |
| | December 31, 2012 |
| (Dollars in millions) | Asset Positions | | Liability Positions |
| Net fair value of contracts outstanding, January 1, 2012 | $ | 5,508 |
| | $ | 4,585 |
|
| Effects of legally enforceable master netting agreements | 8,399 |
| | 8,399 |
|
| Gross fair value of contracts outstanding, January 1, 2012 | 13,907 |
| | 12,984 |
|
| Contracts realized or otherwise settled | (8,755 | ) | | (7,926 | ) |
| Fair value of new contracts | 4,364 |
| | 4,294 |
|
| Other changes in fair value | (365 | ) | | (265 | ) |
| Gross fair value of contracts outstanding, December 31, 2012 | 9,151 |
| | 9,087 |
|
| Effects of legally enforceable master netting agreements | (5,110 | ) | | (5,110 | ) |
| Net fair value of contracts outstanding, December 31, 2012 | $ | 4,041 |
| | $ | 3,977 |
|
|
| | | | | | | |
| | | | |
Table XI Non-exchange Traded Commodity Contract Maturities |
| | | | |
| | December 31, 2012 |
| (Dollars in millions) | Asset
Positions | | Liability
Positions |
| Less than one year | $ | 5,494 |
| | $ | 5,229 |
|
| Greater than or equal to one year and less than three years | 2,103 |
| | 2,383 |
|
| Greater than or equal to three years and less than five years | 603 |
| | 519 |
|
| Greater than or equal to five years | 951 |
| | 956 |
|
| Gross fair value of contracts outstanding | 9,151 |
| | 9,087 |
|
| Effects of legally enforceable master netting agreements | (5,110 | ) | | (5,110 | ) |
| Net fair value of contracts outstanding | $ | 4,041 |
| | $ | 3,977 |
|
|
| | |
| | | Bank of America 2012 137139 |
|
| | | | | | | |
| | | | |
Table X Non-exchange Traded Commodity Contracts |
| | | | |
| | December 31, 2011 |
| (Dollars in millions) | Asset Positions | | Liability Positions |
| Net fair value of contracts outstanding, January 1, 2011 | $ | 4,773 |
| | $ | 4,677 |
|
| Effects of legally enforceable master netting agreements | 10,756 |
| | 10,756 |
|
| Gross fair value of contracts outstanding, January 1, 2011 | 15,529 |
| | 15,433 |
|
| Contracts realized or otherwise settled | (9,976 | ) | | (10,300 | ) |
| Fair value of new contracts | 5,770 |
| | 5,907 |
|
| Other changes in fair value | 2,584 |
| | 1,944 |
|
| Gross fair value of contracts outstanding, December 31, 2011 | 13,907 |
| | 12,984 |
|
| Effects of legally enforceable master netting agreements | (8,399 | ) | | (8,399 | ) |
| Net fair value of contracts outstanding, December 31, 2011 | $ | 5,508 |
| | $ | 4,585 |
|
|
| | | | | | | |
| | | | |
Table XI Non-exchange Traded Commodity Contract Maturities |
| | | | |
| | December 31, 2011 |
| (Dollars in millions) | Asset
Positions | | Liability
Positions |
| Less than one year | $ | 9,052 |
| | $ | 8,219 |
|
| Greater than or equal to one year and less than three years | 2,624 |
| | 2,723 |
|
| Greater than or equal to three years and less than five years | 861 |
| | 900 |
|
| Greater than or equal to five years | 1,370 |
| | 1,142 |
|
| Gross fair value of contracts outstanding | 13,907 |
| | 12,984 |
|
| Effects of legally enforceable master netting agreements | (8,399 | ) | | (8,399 | ) |
| Net fair value of contracts outstanding | $ | 5,508 |
| | $ | 4,585 |
|
| | | | | | | | | | | | | | | | | | | | | | | | | | | | | | | | | |
Table XII Selected Quarterly Financial Data | Table XII Selected Quarterly Financial Data | Table XII Selected Quarterly Financial Data |
| | | | | | | | | | | | | | | | | | | | | | | | | | | | | | | |
| | 2011 Quarters | | 2010 Quarters | 2012 Quarters | | 2011 Quarters |
| (In millions, except per share information) | Fourth | | Third | | Second | | First | | Fourth | | Third | | Second | | First | Fourth | | Third | | Second | | First | | Fourth | | Third | | Second | | First |
| Income statement | |
| | |
| | |
| | |
| | |
| | |
| | |
| | |
| |
| | |
| | |
| | |
| | |
| | |
| | |
| | |
|
| Net interest income | $ | 10,701 |
| | $ | 10,490 |
| | $ | 11,246 |
| | $ | 12,179 |
| | $ | 12,439 |
| | $ | 12,435 |
| | $ | 12,900 |
| | $ | 13,749 |
| $ | 10,324 |
| | $ | 9,938 |
| | $ | 9,548 |
| | $ | 10,846 |
| | $ | 10,701 |
| | $ | 10,490 |
| | $ | 11,246 |
| | $ | 12,179 |
|
| Noninterest income | 14,187 |
| | 17,963 |
| | 1,990 |
| | 14,698 |
| | 9,959 |
| | 14,265 |
| | 16,253 |
| | 18,220 |
| 8,336 |
| | 10,490 |
| | 12,420 |
| | 11,432 |
| | 14,187 |
| | 17,963 |
| | 1,990 |
| | 14,698 |
|
| Total revenue, net of interest expense | 24,888 |
| | 28,453 |
| | 13,236 |
| | 26,877 |
| | 22,398 |
| | 26,700 |
| | 29,153 |
| | 31,969 |
| 18,660 |
| | 20,428 |
| | 21,968 |
| | 22,278 |
| | 24,888 |
| | 28,453 |
| | 13,236 |
| | 26,877 |
|
| Provision for credit losses | 2,934 |
| | 3,407 |
| | 3,255 |
| | 3,814 |
| | 5,129 |
| | 5,396 |
| | 8,105 |
| | 9,805 |
| 2,204 |
| | 1,774 |
| | 1,773 |
| | 2,418 |
| | 2,934 |
| | 3,407 |
| | 3,255 |
| | 3,814 |
|
| Goodwill impairment | 581 |
| | — |
| | 2,603 |
| | — |
| | 2,000 |
| | 10,400 |
| | — |
| | — |
| — |
| | — |
| | — |
| | — |
| | 581 |
| | — |
| | 2,603 |
| | — |
|
| Merger and restructuring charges | 101 |
| | 176 |
| | 159 |
| | 202 |
| | 370 |
| | 421 |
| | 508 |
| | 521 |
| — |
| | — |
| | — |
| | — |
| | 101 |
| | 176 |
| | 159 |
| | 202 |
|
All other noninterest expense (1) | 18,840 |
| | 17,437 |
| | 20,094 |
| | 20,081 |
| | 18,494 |
| | 16,395 |
| | 16,745 |
| | 17,254 |
| 18,360 |
| | 17,544 |
| | 17,048 |
| | 19,141 |
| | 18,840 |
| | 17,437 |
| | 20,094 |
| | 20,081 |
|
| Income (loss) before income taxes | 2,432 |
| | 7,433 |
| | (12,875 | ) | | 2,780 |
| | (3,595 | ) | | (5,912 | ) | | 3,795 |
| | 4,389 |
| (1,904 | ) | | 1,110 |
| | 3,147 |
| | 719 |
| | 2,432 |
| | 7,433 |
| | (12,875 | ) | | 2,780 |
|
| Income tax expense (benefit) | 441 |
| | 1,201 |
| | (4,049 | ) | | 731 |
| | (2,351 | ) | | 1,387 |
| | 672 |
| | 1,207 |
| (2,636 | ) | | 770 |
| | 684 |
| | 66 |
| | 441 |
| | 1,201 |
| | (4,049 | ) | | 731 |
|
| Net income (loss) | 1,991 |
| | 6,232 |
| | (8,826 | ) | | 2,049 |
| | (1,244 | ) | | (7,299 | ) | | 3,123 |
| | 3,182 |
| 732 |
| | 340 |
| | 2,463 |
| | 653 |
| | 1,991 |
| | 6,232 |
| | (8,826 | ) | | 2,049 |
|
| Net income (loss) applicable to common shareholders | 1,584 |
| | 5,889 |
| | (9,127 | ) | | 1,739 |
| | (1,565 | ) | | (7,647 | ) | | 2,783 |
| | 2,834 |
| 367 |
| | (33 | ) | | 2,098 |
| | 328 |
| | 1,584 |
| | 5,889 |
| | (9,127 | ) | | 1,739 |
|
| Average common shares issued and outstanding | 10,281 |
| | 10,116 |
| | 10,095 |
| | 10,076 |
| | 10,037 |
| | 9,976 |
| | 9,957 |
| | 9,177 |
| 10,777 |
| | 10,776 |
| | 10,776 |
| | 10,651 |
| | 10,281 |
| | 10,116 |
| | 10,095 |
| | 10,076 |
|
Average diluted common shares issued and outstanding (2) | 11,125 |
| | 10,464 |
| | 10,095 |
| | 10,181 |
| | 10,037 |
| | 9,976 |
| | 10,030 |
| | 10,005 |
| 10,885 |
| | 10,776 |
| | 11,556 |
| | 10,762 |
| | 11,125 |
| | 10,464 |
| | 10,095 |
| | 10,181 |
|
| Performance ratios | |
| | |
| | |
| | |
| | |
| | |
| | |
| | |
| |
| | |
| | |
| | |
| | |
| | |
| | |
| | |
|
| Return on average assets | 0.36 | % | | 1.07 | % | | n/m |
| | 0.36 | % | | n/m |
| | n/m |
| | 0.50 | % | | 0.51 | % | 0.13 | % | | 0.06 | % | | 0.45 | % | | 0.12 | % | | 0.36 | % | | 1.07 | % | | n/m |
| | 0.36 | % |
Four quarter trailing return on average assets (3) | 0.06 |
| | n/m |
| | n/m |
| | n/m |
| | n/m |
| | n/m |
| | 0.21 |
| | 0.21 |
| 0.19 |
| | 0.25 |
| | 0.51 |
| | n/m |
| | 0.06 |
| | n/m |
| | n/m |
| | n/m |
|
| Return on average common shareholders’ equity | 3.00 |
| | 11.40 |
| | n/m |
| | 3.29 |
| | n/m |
| | n/m |
| | 5.18 |
| | 5.73 |
| 0.67 |
| | n/m |
| | 3.89 |
| | 0.62 |
| | 3.00 |
| | 11.40 |
| | n/m |
| | 3.29 |
|
Return on average tangible common shareholders’ equity (4) | 4.72 |
| | 18.30 |
| | n/m |
| | 5.28 |
| | n/m |
| | n/m |
| | 9.19 |
| | 9.79 |
| 1.01 |
| | n/m |
| | 5.95 |
| | 0.95 |
| | 4.72 |
| | 18.30 |
| | n/m |
| | 5.28 |
|
Return on average tangible shareholders’ equity (4) | 5.20 |
| | 17.03 |
| | n/m |
| | 5.54 |
| | n/m |
| | n/m |
| | 8.98 |
| | 9.55 |
| 1.77 |
| | 0.84 |
| | 6.16 |
| | 1.67 |
| | 5.20 |
| | 17.03 |
| | n/m |
| | 5.54 |
|
| Total ending equity to total ending assets | 10.81 |
| | 10.37 |
| | 9.83 | % | | 10.15 |
| | 10.08 | % | | 9.85 | % | | 9.85 |
| | 9.80 |
| 10.72 |
| | 11.02 |
| | 10.92 |
| | 10.66 |
| | 10.81 |
| | 10.37 |
| | 9.83 | % | | 10.15 |
|
| Total average equity to total average assets | 10.34 |
| | 9.66 |
| | 10.05 |
| | 9.87 |
| | 9.94 |
| | 9.83 |
| | 9.36 |
| | 9.14 |
| 10.79 |
| | 10.86 |
| | 10.73 |
| | 10.63 |
| | 10.34 |
| | 9.66 |
| | 10.05 |
| | 9.87 |
|
| Dividend payout | 6.60 |
| | 1.73 |
| | n/m |
| | 6.06 |
| | n/m |
| | n/m |
| | 3.63 |
| | 3.57 |
| 29.33 |
| | n/m |
| | 5.60 |
| | 34.97 |
| | 6.60 |
| | 1.73 |
| | n/m |
| | 6.06 |
|
| Per common share data | |
| | |
| | |
| | |
| | |
| | |
| | |
| | |
| |
| | |
| | |
| | |
| | |
| | |
| | |
| | |
|
| Earnings (loss) | $ | 0.15 |
| | $ | 0.58 |
| | $ | (0.90 | ) | | $ | 0.17 |
| | $ | (0.16 | ) | | $ | (0.77 | ) | | $ | 0.28 |
| | $ | 0.28 |
| $ | 0.03 |
| | $ | 0.00 |
| | $ | 0.19 |
| | $ | 0.03 |
| | $ | 0.15 |
| | $ | 0.58 |
| | $ | (0.90 | ) | | $ | 0.17 |
|
Diluted earnings (loss) (2) | 0.15 |
| | 0.56 |
| | (0.90 | ) | | 0.17 |
| | (0.16 | ) | | (0.77 | ) | | 0.27 |
| | 0.28 |
| 0.03 |
| | 0.00 |
| | 0.19 |
| | 0.03 |
| | 0.15 |
| | 0.56 |
| | (0.90 | ) | | 0.17 |
|
| Dividends paid | 0.01 |
| | 0.01 |
| | 0.01 |
| | 0.01 |
| | 0.01 |
| | 0.01 |
| | 0.01 |
| | 0.01 |
| 0.01 |
| | 0.01 |
| | 0.01 |
| | 0.01 |
| | 0.01 |
| | 0.01 |
| | 0.01 |
| | 0.01 |
|
| Book value | 20.09 |
| | 20.80 |
| | 20.29 |
| | 21.15 |
| | 20.99 |
| | 21.17 |
| | 21.45 |
| | 21.12 |
| 20.24 |
| | 20.40 |
| | 20.16 |
| | 19.83 |
| | 20.09 |
| | 20.80 |
| | 20.29 |
| | 21.15 |
|
Tangible book value (4) | 12.95 |
| | 13.22 |
| | 12.65 |
| | 13.21 |
| | 12.98 |
| | 12.91 |
| | 12.14 |
| | 11.70 |
| 13.36 |
| | 13.48 |
| | 13.22 |
| | 12.87 |
| | 12.95 |
| | 13.22 |
| | 12.65 |
| | 13.21 |
|
| Market price per share of common stock | |
| | |
| | |
| | |
| | |
| | |
| | |
| | |
| |
| | |
| | |
| | |
| | |
| | |
| | |
| | |
|
| Closing | $ | 5.56 |
| | $ | 6.12 |
| | $ | 10.96 |
| | $ | 13.33 |
| | $ | 13.34 |
| | $ | 13.10 |
| | $ | 14.37 |
| | $ | 17.85 |
| $ | 11.61 |
| | $ | 8.83 |
| | $ | 8.18 |
| | $ | 9.57 |
| | $ | 5.56 |
| | $ | 6.12 |
| | $ | 10.96 |
| | $ | 13.33 |
|
| High closing | 7.35 |
| | 11.09 |
| | 13.72 |
| | 15.25 |
| | 13.56 |
| | 15.67 |
| | 19.48 |
| | 18.04 |
| 11.61 |
| | 9.55 |
| | 9.68 |
| | 9.93 |
| | 7.35 |
| | 11.09 |
| | 13.72 |
| | 15.25 |
|
| Low closing | 4.99 |
| | 6.06 |
| | 10.50 |
| | 13.33 |
| | 10.95 |
| | 12.32 |
| | 14.37 |
| | 14.45 |
| 8.93 |
| | 7.04 |
| | 6.83 |
| | 5.80 |
| | 4.99 |
| | 6.06 |
| | 10.50 |
| | 13.33 |
|
| Market capitalization | $ | 58,580 |
| | $ | 62,023 |
| | $ | 111,060 |
| | $ | 135,057 |
| | $ | 134,536 |
| | $ | 131,442 |
| | $ | 144,174 |
| | $ | 179,071 |
| $ | 125,136 |
| | $ | 95,163 |
| | $ | 88,155 |
| | $ | 103,123 |
| | $ | 58,580 |
| | $ | 62,023 |
| | $ | 111,060 |
| | $ | 135,057 |
|
| Average balance sheet | |
| | |
| | |
| | |
| | |
| | |
| | |
| | |
| |
| Total loans and leases | $ | 932,898 |
| | $ | 942,032 |
| | $ | 938,513 |
| | $ | 938,966 |
| | $ | 940,614 |
| | $ | 934,860 |
| | $ | 967,054 |
| | $ | 991,615 |
| |
| Total assets | 2,207,567 |
| | 2,301,454 |
| | 2,339,110 |
| | 2,338,538 |
| | 2,370,258 |
| | 2,379,397 |
| | 2,494,432 |
| | 2,516,590 |
| |
| Total deposits | 1,032,531 |
| | 1,051,320 |
| | 1,035,944 |
| | 1,023,140 |
| | 1,007,738 |
| | 973,846 |
| | 991,615 |
| | 981,015 |
| |
| Long-term debt | 389,557 |
| | 420,273 |
| | 435,144 |
| | 440,511 |
| | 465,875 |
| | 485,588 |
| | 497,469 |
| | 513,634 |
| |
| Common shareholders’ equity | 209,324 |
| | 204,928 |
| | 218,505 |
| | 214,206 |
| | 218,728 |
| | 215,911 |
| | 215,468 |
| | 200,380 |
| |
| Total shareholders’ equity | 228,235 |
| | 222,410 |
| | 235,067 |
| | 230,769 |
| | 235,525 |
| | 233,978 |
| | 233,461 |
| | 229,891 |
| |
Asset quality (5) | |
| | |
| | |
| | |
| | |
| | |
| | |
| | |
| |
Allowance for credit losses (6) | $ | 34,497 |
| | $ | 35,872 |
| | $ | 38,209 |
| | $ | 40,804 |
| | $ | 43,073 |
| | $ | 44,875 |
| | $ | 46,668 |
| | $ | 48,356 |
| |
Nonperforming loans, leases and foreclosed properties (7) | 27,708 |
| | 29,059 |
| | 30,058 |
| | 31,643 |
| | 32,664 |
| | 34,556 |
| | 35,598 |
| | 35,925 |
| |
Allowance for loan and lease losses as a percentage of total loans and leases outstanding (7) | 3.68 | % | | 3.81 | % | | 4.00 | % | | 4.29 | % | | 4.47 | % | | 4.69 | % | | 4.75 | % | | 4.82 | % | |
Allowance for loan and lease losses as a percentage of total nonperforming loans and leases (7) | 135 |
| | 133 |
| | 135 |
| | 135 |
| | 136 |
| | 135 |
| | 137 |
| | 139 |
| |
Allowance for loan and lease losses as a percentage of total nonperforming loans and leases excluding the purchased credit-impaired loan portfolio (6) | 101 |
| | 101 |
| | 105 |
| | 108 |
| | 116 |
| | 118 |
| | 121 |
| | 124 |
| |
Amounts included in allowance that are excluded from nonperforming loans (8) | $ | 17,490 |
| | $ | 18,317 |
| | $ | 19,935 |
| | $ | 22,110 |
| | $ | 22,908 |
| | $ | 23,661 |
| | $ | 24,338 |
| | $ | 26,199 |
| |
Allowance as a percentage of total nonperforming loans and leases excluding the amounts included in the allowance that are excluded from nonperforming loans (8) | 65 | % | | 63 | % | | 63 | % | | 60 | % | | 62 | % | | 62 | % | | 63 | % | | 61 | % | |
| Net charge-offs | $ | 4,054 |
| | $ | 5,086 |
| | $ | 5,665 |
| | $ | 6,028 |
| | $ | 6,783 |
| | $ | 7,197 |
| | $ | 9,557 |
| | $ | 10,797 |
| |
Annualized net charge-offs as a percentage of average loans and leases outstanding (7) | 1.74 | % | | 2.17 | % | | 2.44 | % | | 2.61 | % | | 2.87 | % | | 3.07 | % | | 3.98 | % | | 4.44 | % | |
Nonperforming loans and leases as a percentage of total loans and leases outstanding (7) | 2.74 |
| | 2.87 |
| | 2.96 |
| | 3.19 |
| | 3.27 |
| | 3.47 |
| | 3.48 |
| | 3.46 |
| |
Nonperforming loans, leases and foreclosed properties as a percentage of total loans, leases and foreclosed properties (7) | 3.01 |
| | 3.15 |
| | 3.22 |
| | 3.40 |
| | 3.48 |
| | 3.71 |
| | 3.73 |
| | 3.69 |
| |
| Ratio of the allowance for loan and lease losses at period end to annualized net charge-offs | 2.10 |
| | 1.74 |
| | 1.64 |
| | 1.63 |
| | 1.56 |
| | 1.53 |
| | 1.18 |
| | 1.07 |
| |
| Capital ratios (period end) | |
| | |
| | |
| | |
| | |
| | |
| | |
| | |
| |
| Risk-based capital: | |
| | |
| | |
| | |
| | |
| | |
| | |
| | |
| |
| Tier 1 common | 9.86 | % | | 8.65 | % | | 8.23 | % | | 8.64 | % | | 8.60 | % | | 8.45 | % | | 8.01 | % | | 7.60 | % | |
| Tier 1 | 12.40 |
| | 11.48 |
| | 11.00 |
| | 11.32 |
| | 11.24 |
| | 11.16 |
| | 10.67 |
| | 10.23 |
| |
| Total | 16.75 |
| | 15.86 |
| | 15.65 |
| | 15.98 |
| | 15.77 |
| | 15.65 |
| | 14.77 |
| | 14.47 |
| |
| Tier 1 leverage | 7.53 |
| | 7.11 |
| | 6.86 |
| | 7.25 |
| | 7.21 |
| | 7.21 |
| | 6.68 |
| | 6.44 |
| |
Tangible equity (4) | 7.54 |
| | 7.16 |
| | 6.63 |
| | 6.85 |
| | 6.75 |
| | 6.54 |
| | 6.14 |
| | 6.02 |
| |
Tangible common equity (4) | 6.64 |
| | 6.25 |
| | 5.87 |
| | 6.10 |
| | 5.99 |
| | 5.74 |
| | 5.35 |
| | 5.22 |
| |
| |
(1) | Excludes goodwill impairment charges and merger and restructuring charges and goodwill impairment charges. |
| |
(2) | Due to a net loss applicable to common shareholders for the third quarter of 2012 and the second quarter of 2011, and the fourth and third quarters of 2010, the impact of antidilutive equity instruments was excluded from diluted earnings (loss) per share and average diluted common shares. |
| |
(3) | Calculated as total net income (loss) for four consecutive quarters divided by annualized average assets for the period.four consecutive quarters. |
| |
(4) | Tangible equity ratios and tangible book value per share of common stock are non-GAAP financial measures. Other companies may define or calculate these measures differently. For additional information on these ratios and for corresponding reconciliations to GAAP financial measures, see Supplemental Financial Data on page 3835 and Statistical Table XVII. |
| |
(5) | For more information on the impact of the PCI loan portfolio on asset quality, see Consumer Portfolio Credit Risk Management on page 81 and Commercial Portfolio Credit Risk Management on page 9480. |
| |
(6) | Includes the allowance for loan and lease losses and the reserve for unfunded lending commitments. |
| |
(7) | Balances and ratios do not include loans accounted for under the fair value option. For additional exclusions onfrom nonperforming loans, leases and foreclosed properties, see Nonperforming Consumer Loans and Foreclosed Properties Activity on page 9293 and corresponding Table 3637, and Nonperforming Commercial Loans, Leases and Foreclosed Properties Activity on page 100101 and corresponding Table 4546. |
| |
(8) | Amounts included in allowance that are excluded from nonperforming loans primarily includePrimarily includes amounts allocated to the U.S. credit card and unsecured consumer lending portfolios in Card ServicesCBB portfolio,, PCI loans and the non-U.S. credit card portfolio in All Other.
|
| |
(9) | Net charge-offs exclude $1.1 billion and $1.7 billion of write-offs in the Countrywide home equity PCI loan portfolio for the fourth and third quarters of 2012. These write-offs decreased the PCI valuation allowance included as part of the allowance for loan and lease losses. For information on PCI write-offs, see Countrywide Purchased Credit-impaired Loan Portfolio on page 90. |
| |
(10) | There were no write-offs of PCI loans in the second and first quarters of 2012, and in each of the quarters in 2011. |
n/m = not meaningful
|
| | | | | | | | | | | | | | | | | | | | | | | | | | | | | | | |
| | | | | | | | | | | | | | | | |
Table XII Selected Quarterly Financial Data (continued) |
| | | | | | | | | | | | | | | | |
| | 2012 Quarters | | 2011 Quarters |
| (Dollars in millions) | Fourth | | Third | | Second | | First | | Fourth | | Third | | Second | | First |
| Average balance sheet | |
| | |
| | |
| | |
| | |
| | |
| | |
| | |
|
| Total loans and leases | $ | 893,166 |
| | $ | 888,859 |
| | $ | 899,498 |
| | $ | 913,722 |
| | $ | 932,898 |
| | $ | 942,032 |
| | $ | 938,513 |
| | $ | 938,966 |
|
| Total assets | 2,210,365 |
| | 2,173,312 |
| | 2,194,563 |
| | 2,187,174 |
| | 2,207,567 |
| | 2,301,454 |
| | 2,339,110 |
| | 2,338,538 |
|
| Total deposits | 1,078,076 |
| | 1,049,697 |
| | 1,032,888 |
| | 1,030,112 |
| | 1,032,531 |
| | 1,051,320 |
| | 1,035,944 |
| | 1,023,140 |
|
| Long-term debt | 277,894 |
| | 291,684 |
| | 333,173 |
| | 363,518 |
| | 389,557 |
| | 420,273 |
| | 435,144 |
| | 440,511 |
|
| Common shareholders’ equity | 219,744 |
| | 217,273 |
| | 216,782 |
| | 214,150 |
| | 209,324 |
| | 204,928 |
| | 218,505 |
| | 214,206 |
|
| Total shareholders’ equity | 238,512 |
| | 236,039 |
| | 235,558 |
| | 232,566 |
| | 228,235 |
| | 222,410 |
| | 235,067 |
| | 230,769 |
|
Asset quality (5) | |
| | |
| | |
| | |
| | |
| | |
| | |
| | |
|
Allowance for credit losses (6) | $ | 24,692 |
| | $ | 26,751 |
| | $ | 30,862 |
| | $ | 32,862 |
| | $ | 34,497 |
| | $ | 35,872 |
| | $ | 38,209 |
| | $ | 40,804 |
|
Nonperforming loans, leases and foreclosed properties (7) | 23,555 |
| | 24,925 |
| | 25,377 |
| | 27,790 |
| | 27,708 |
| | 29,059 |
| | 30,058 |
| | 31,643 |
|
Allowance for loan and lease losses as a percentage of total loans and leases outstanding (7) | 2.69 | % | | 2.96 | % | | 3.43 | % | | 3.61 | % | | 3.68 | % | | 3.81 | % | | 4.00 | % | | 4.29 | % |
Allowance for loan and lease losses as a percentage of total nonperforming loans and leases (7) | 107 |
| | 111 |
| | 127 |
| | 126 |
| | 135 |
| | 133 |
| | 135 |
| | 135 |
|
Allowance for loan and lease losses as a percentage of total nonperforming loans and leases, excluding the PCI loan portfolio (6) | 82 |
| | 81 |
| | 90 |
| | 91 |
| | 101 |
| | 101 |
| | 105 |
| | 108 |
|
Amounts included in allowance that are excluded from nonperforming loans and leases (8) | $ | 12,021 |
| | $ | 13,978 |
| | $ | 16,327 |
| | $ | 17,006 |
| | $ | 17,490 |
| | $ | 18,317 |
| | $ | 19,935 |
| | $ | 22,110 |
|
Allowance as a percentage of total nonperforming loans and leases, excluding amounts included in the allowance that are excluded from nonperforming loans and leases (8) | 54 | % | | 52 | % | | 59 | % | | 60 | % | | 65 | % | | 63 | % | | 63 | % | | 60 | % |
Net charge-offs (9) | $ | 3,104 |
| | $ | 4,122 |
| | $ | 3,626 |
| | $ | 4,056 |
| | $ | 4,054 |
| | $ | 5,086 |
| | $ | 5,665 |
| | $ | 6,028 |
|
Annualized net charge-offs as a percentage of average loans and leases outstanding (7, 9) | 1.40 | % | | 1.86 | % | | 1.64 | % | | 1.80 | % | | 1.74 | % | | 2.17 | % | | 2.44 | % | | 2.61 | % |
Annualized net charge-offs as a percentage of average loans and leases outstanding, excluding the PCI loan portfolio (7) | 1.44 |
| | 1.93 |
| | 1.69 |
| | 1.87 |
| | 1.81 |
| | 2.25 |
| | 2.54 |
| | 2.71 |
|
Annualized net charge-offs and PCI write-offs as a percentage of average loans and leases outstanding (7, 10) | 1.90 |
| | 2.63 |
| | 1.64 |
| | 1.80 |
| | 1.74 |
| | 2.17 |
| | 2.44 |
| | 2.61 |
|
Nonperforming loans and leases as a percentage of total loans and leases outstanding (7) | 2.52 |
| | 2.68 |
| | 2.70 |
| | 2.85 |
| | 2.74 |
| | 2.87 |
| | 2.96 |
| | 3.19 |
|
Nonperforming loans, leases and foreclosed properties as a percentage of total loans, leases and foreclosed properties (7) | 2.62 |
| | 2.81 |
| | 2.87 |
| | 3.10 |
| | 3.01 |
| | 3.15 |
| | 3.22 |
| | 3.40 |
|
Ratio of the allowance for loan and lease losses at period end to annualized net charge-offs (9) | 1.96 |
| | 1.60 |
| | 2.08 |
| | 1.97 |
| | 2.10 |
| | 1.74 |
| | 1.64 |
| | 1.63 |
|
| Ratio of the allowance for loan and lease losses at period end to annualized net charge-offs, excluding the PCI loan portfolio | 1.51 |
| | 1.17 |
| | 1.46 |
| | 1.43 |
| | 1.57 |
| | 1.33 |
| | 1.28 |
| | 1.31 |
|
Ratio of the allowance for loan and lease losses at period end to annualized net charge-offs and PCI write-offs (10) | 1.44 |
| | 1.13 |
| | 2.08 |
| | 1.97 |
| | 2.10 |
| | 1.74 |
| | 1.64 |
| | 1.63 |
|
| Capital ratios (period end) | |
| | |
| | |
| | |
| | |
| | |
| | |
| | |
|
| Risk-based capital: | |
| | |
| | |
| | |
| | |
| | |
| | |
| | |
|
| Tier 1 common | 11.06 | % | | 11.41 | % | | 11.24 | % | | 10.78 | % | | 9.86 | % | | 8.65 | % | | 8.23 | % | | 8.64 | % |
| Tier 1 | 12.89 |
| | 13.64 |
| | 13.80 |
| | 13.37 |
| | 12.40 |
| | 11.48 |
| | 11.00 |
| | 11.32 |
|
| Total | 16.31 |
| | 17.16 |
| | 17.51 |
| | 17.49 |
| | 16.75 |
| | 15.86 |
| | 15.65 |
| | 15.98 |
|
| Tier 1 leverage | 7.37 |
| | 7.84 |
| | 7.84 |
| | 7.79 |
| | 7.53 |
| | 7.11 |
| | 6.86 |
| | 7.25 |
|
Tangible equity (4) | 7.62 |
| | 7.85 |
| | 7.73 |
| | 7.48 |
| | 7.54 |
| | 7.16 |
| | 6.63 |
| | 6.85 |
|
Tangible common equity (4) | 6.74 |
| | 6.95 |
| | 6.83 |
| | 6.58 |
| | 6.64 |
| | 6.25 |
| | 5.87 |
| | 6.10 |
|
For footnotes see page 140.
|
| | |
| | | Bank of America 2012 139141 |
| | | | | | | | | | | | | | | | | | | | | | | | | |
Table XIII Quarterly Average Balances and Interest Rates – FTE Basis | Table XIII Quarterly Average Balances and Interest Rates – FTE Basis | Table XIII Quarterly Average Balances and Interest Rates – FTE Basis |
| | | | | | | | | | | | | | | | | | | | | | | |
| | Fourth Quarter 2011 | | Third Quarter 2011 | Fourth Quarter 2012 | | Third Quarter 2012 |
| (Dollars in millions) | Average Balance | | Interest
Income/ Expense | | Yield/ Rate | | Average Balance | | Interest
Income/ Expense | | Yield/ Rate | Average Balance | | Interest
Income/ Expense | | Yield/ Rate | | Average Balance | | Interest
Income/ Expense | | Yield/ Rate |
| Earning assets | |
| | |
| | |
| | |
| | |
| | |
| |
| | |
| | |
| | |
| | |
| | |
|
Time deposits placed and other short-term investments (1) | $ | 27,688 |
| | $ | 85 |
| | 1.19 | % | | $ | 26,743 |
| | $ | 87 |
| | 1.31 | % | $ | 16,967 |
| | $ | 50 |
| | 1.14 | % | | $ | 15,849 |
| | $ | 58 |
| | 1.47 | % |
| Federal funds sold and securities borrowed or purchased under agreements to resell | 237,453 |
| | 449 |
| | 0.75 |
| | 256,143 |
| | 584 |
| | 0.90 |
| 241,950 |
| | 329 |
| | 0.54 |
| | 234,955 |
| | 353 |
| | 0.60 |
|
| Trading account assets | 161,848 |
| | 1,354 |
| | 3.33 |
| | 180,438 |
| | 1,543 |
| | 3.40 |
| 195,800 |
| | 1,362 |
| | 2.77 |
| | 177,075 |
| | 1,243 |
| | 2.80 |
|
Debt securities (2) | 332,990 |
| | 2,245 |
| | 2.69 |
| | 344,327 |
| | 1,744 |
| | 2.02 |
| 339,779 |
| | 2,123 |
| | 2.50 |
| | 340,773 |
| | 2,036 |
| | 2.39 |
|
Loans and leases (3): | | | | | | | |
| | |
| | |
| | | | | | | |
| | |
| | |
|
Residential mortgage (4) | 266,144 |
| | 2,596 |
| | 3.90 |
| | 268,494 |
| | 2,856 |
| | 4.25 |
| 245,879 |
| | 2,202 |
| | 3.58 |
| | 250,505 |
| | 2,317 |
| | 3.70 |
|
| Home equity | 126,251 |
| | 1,207 |
| | 3.80 |
| | 129,125 |
| | 1,238 |
| | 3.81 |
| 110,105 |
| | 1,067 |
| | 3.86 |
| | 116,184 |
| | 1,097 |
| | 3.77 |
|
| Discontinued real estate | 14,073 |
| | 128 |
| | 3.65 |
| | 15,923 |
| | 134 |
| | 3.36 |
| 10,850 |
| | 91 |
| | 3.36 |
| | 10,956 |
| | 95 |
| | 3.45 |
|
| U.S. credit card | 102,241 |
| | 2,603 |
| | 10.10 |
| | 103,671 |
| | 2,650 |
| | 10.14 |
| 92,849 |
| | 2,336 |
| | 10.01 |
| | 93,292 |
| | 2,353 |
| | 10.04 |
|
| Non-U.S. credit card | 15,981 |
| | 420 |
| | 10.41 |
| | 25,434 |
| | 697 |
| | 10.88 |
| 13,081 |
| | 383 |
| | 11.66 |
| | 13,329 |
| | 385 |
| | 11.48 |
|
Direct/Indirect consumer (5) | 90,861 |
| | 863 |
| | 3.77 |
| | 90,280 |
| | 915 |
| | 4.02 |
| 82,583 |
| | 662 |
| | 3.19 |
| | 82,635 |
| | 704 |
| | 3.39 |
|
Other consumer (6) | 2,751 |
| | 41 |
| | 6.14 |
| | 2,795 |
| | 43 |
| | 6.07 |
| 1,602 |
| | 19 |
| | 4.57 |
| | 2,654 |
| | 40 |
| | 6.03 |
|
| Total consumer | 618,302 |
| | 7,858 |
| | 5.06 |
| | 635,722 |
| | 8,533 |
| | 5.34 |
| 556,949 |
| | 6,760 |
| | 4.84 |
| | 569,555 |
| | 6,991 |
| | 4.89 |
|
| U.S. commercial | 196,778 |
| | 1,798 |
| | 3.63 |
| | 191,439 |
| | 1,809 |
| | 3.75 |
| 209,496 |
| | 1,729 |
| | 3.28 |
| | 201,072 |
| | 1,752 |
| | 3.47 |
|
Commercial real estate (7) | 40,673 |
| | 343 |
| | 3.34 |
| | 42,931 |
| | 360 |
| | 3.33 |
| 38,192 |
| | 341 |
| | 3.55 |
| | 36,929 |
| | 329 |
| | 3.54 |
|
| Commercial lease financing | 21,278 |
| | 204 |
| | 3.84 |
| | 21,342 |
| | 240 |
| | 4.51 |
| 22,839 |
| | 184 |
| | 3.23 |
| | 21,545 |
| | 202 |
| | 3.75 |
|
| Non-U.S. commercial | 55,867 |
| | 395 |
| | 2.80 |
| | 50,598 |
| | 349 |
| | 2.73 |
| 65,690 |
| | 433 |
| | 2.62 |
| | 59,758 |
| | 401 |
| | 2.67 |
|
| Total commercial | 314,596 |
| | 2,740 |
| | 3.46 |
| | 306,310 |
| | 2,758 |
| | 3.58 |
| 336,217 |
| | 2,687 |
| | 3.18 |
| | 319,304 |
| | 2,684 |
| | 3.35 |
|
| Total loans and leases | 932,898 |
| | 10,598 |
| | 4.52 |
| | 942,032 |
| | 11,291 |
| | 4.77 |
| 893,166 |
| | 9,447 |
| | 4.21 |
| | 888,859 |
| | 9,675 |
| | 4.34 |
|
| Other earning assets | 91,109 |
| | 904 |
| | 3.95 |
| | 91,452 |
| | 814 |
| | 3.54 |
| 101,274 |
| | 849 |
| | 3.34 |
| | 92,764 |
| | 792 |
| | 3.40 |
|
Total earning assets (8) | 1,783,986 |
| | 15,635 |
| | 3.49 |
| | 1,841,135 |
| | 16,063 |
| | 3.47 |
| 1,788,936 |
| | 14,160 |
| | 3.16 |
| | 1,750,275 |
| | 14,157 |
| | 3.22 |
|
Cash and cash equivalents (1) | 94,287 |
| | 36 |
| | | | 102,573 |
| | 38 |
| | |
| 111,671 |
| | 42 |
| | | | 122,716 |
| | 48 |
| | |
|
| Other assets, less allowance for loan and lease losses | 329,294 |
| | | | | | 357,746 |
| | |
| | |
| 309,758 |
| | | | | | 300,321 |
| | |
| | |
|
| Total assets | $ | 2,207,567 |
| | | | | | $ | 2,301,454 |
| | |
| | |
| $ | 2,210,365 |
| | | | | | $ | 2,173,312 |
| | |
| | |
|
| Interest-bearing liabilities | |
| | |
| | |
| | |
| | |
| | |
| |
| | |
| | |
| | |
| | |
| | |
|
| U.S. interest-bearing deposits: | |
| | |
| | |
| | |
| | |
| | |
| |
| | |
| | |
| | |
| | |
| | |
|
| Savings | $ | 39,609 |
| | $ | 16 |
| | 0.16 | % | | $ | 41,256 |
| | $ | 21 |
| | 0.19 | % | $ | 41,294 |
| | $ | 6 |
| | 0.06 | % | | $ | 41,581 |
| | $ | 11 |
| | 0.10 | % |
| NOW and money market deposit accounts | 454,249 |
| | 192 |
| | 0.17 |
| | 473,391 |
| | 248 |
| | 0.21 |
| 479,130 |
| | 146 |
| | 0.12 |
| | 465,679 |
| | 173 |
| | 0.15 |
|
| Consumer CDs and IRAs | 103,488 |
| | 220 |
| | 0.84 |
| | 108,359 |
| | 244 |
| | 0.89 |
| 91,256 |
| | 156 |
| | 0.68 |
| | 94,140 |
| | 172 |
| | 0.73 |
|
| Negotiable CDs, public funds and other time deposits | 22,413 |
| | 34 |
| | 0.60 |
| | 18,547 |
| | 5 |
| | 0.12 |
| |
| Negotiable CDs, public funds and other deposits | | 19,904 |
| | 27 |
| | 0.54 |
| | 19,587 |
| | 30 |
| | 0.61 |
|
| Total U.S. interest-bearing deposits | 619,759 |
| | 462 |
| | 0.30 |
| | 641,553 |
| | 518 |
| | 0.32 |
| 631,584 |
| | 335 |
| | 0.21 |
| | 620,987 |
| | 386 |
| | 0.25 |
|
| Non-U.S. interest-bearing deposits: | | | | | | | |
| | |
| | |
| | | | | | | |
| | |
| | |
|
| Banks located in non-U.S. countries | 20,454 |
| | 29 |
| | 0.55 |
| | 21,037 |
| | 34 |
| | 0.65 |
| 11,964 |
| | 22 |
| | 0.71 |
| | 13,883 |
| | 19 |
| | 0.56 |
|
| Governments and official institutions | 1,466 |
| | 1 |
| | 0.36 |
| | 2,043 |
| | 2 |
| | 0.32 |
| 876 |
| | 1 |
| | 0.29 |
| | 1,019 |
| | 1 |
| | 0.31 |
|
| Time, savings and other | 57,814 |
| | 124 |
| | 0.85 |
| | 64,271 |
| | 150 |
| | 0.93 |
| 53,655 |
| | 80 |
| | 0.60 |
| | 52,175 |
| | 78 |
| | 0.59 |
|
| Total non-U.S. interest-bearing deposits | 79,734 |
| | 154 |
| | 0.77 |
| | 87,351 |
| | 186 |
| | 0.85 |
| 66,495 |
| | 103 |
| | 0.62 |
| | 67,077 |
| | 98 |
| | 0.58 |
|
| Total interest-bearing deposits | 699,493 |
| | 616 |
| | 0.35 |
| | 728,904 |
| | 704 |
| | 0.38 |
| 698,079 |
| | 438 |
| | 0.25 |
| | 688,064 |
| | 484 |
| | 0.28 |
|
| Federal funds purchased, securities loaned or sold under agreements to repurchase and other short-term borrowings | 284,766 |
| | 921 |
| | 1.28 |
| | 303,234 |
| | 1,152 |
| | 1.51 |
| 336,341 |
| | 855 |
| | 1.01 |
| | 325,023 |
| | 893 |
| | 1.09 |
|
| Trading account liabilities | 70,999 |
| | 411 |
| | 2.29 |
| | 87,841 |
| | 547 |
| | 2.47 |
| 80,084 |
| | 420 |
| | 2.09 |
| | 77,528 |
| | 418 |
| | 2.14 |
|
| Long-term debt | 389,557 |
| | 2,764 |
| | 2.80 |
| | 420,273 |
| | 2,959 |
| | 2.82 |
| 277,894 |
| | 1,934 |
| | 2.77 |
| | 291,684 |
| | 2,243 |
| | 3.07 |
|
Total interest-bearing liabilities (8) | 1,444,815 |
| | 4,712 |
| | 1.29 |
| | 1,540,252 |
| | 5,362 |
| | 1.39 |
| 1,392,398 |
| | 3,647 |
| | 1.04 |
| | 1,382,299 |
| | 4,038 |
| | 1.16 |
|
| Noninterest-bearing sources: | | | | | | | |
| | |
| | |
| | | | | | | |
| | |
| | |
|
| Noninterest-bearing deposits | 333,038 |
| | | | | | 322,416 |
| | |
| | |
| 379,997 |
| | | | | | 361,633 |
| | |
| | |
|
| Other liabilities | 201,479 |
| | | | | | 216,376 |
| | |
| | |
| 199,458 |
| | | | | | 193,341 |
| | |
| | |
|
| Shareholders’ equity | 228,235 |
| | | | | | 222,410 |
| | |
| | |
| 238,512 |
| | | | | | 236,039 |
| | |
| | |
|
| Total liabilities and shareholders’ equity | $ | 2,207,567 |
| | | | | | $ | 2,301,454 |
| | |
| | |
| $ | 2,210,365 |
| | | | | | $ | 2,173,312 |
| | |
| | |
|
| Net interest spread | | | | | 2.20 | % | | |
| | |
| | 2.08 | % | | | | | 2.12 | % | | |
| | |
| | 2.06 | % |
| Impact of noninterest-bearing sources | | | | | 0.24 |
| | |
| | |
| | 0.23 |
| | | | | 0.22 |
| | |
| | |
| | 0.25 |
|
Net interest income/yield on earning assets (1) | | | $ | 10,923 |
| | 2.44 | % | | |
| | $ | 10,701 |
| | 2.31 | % | | | $ | 10,513 |
| | 2.34 | % | | |
| | $ | 10,119 |
| | 2.31 | % |
| |
(1) | For this presentation, fees earned on overnight deposits placed with the Federal Reserve are included in the cash and cash equivalents line, consistent with the Corporation’s Consolidated Balance Sheet presentation of these deposits. In addition, beginning in the third quarter of 2012, fees earned on deposits, primarily overnight, placed with certain non-U.S. central banks, which are included in the time deposits placed and other short-term investments line in prior periods, have been included in the cash and cash equivalents line. Net interest income and net interest yield in the table are calculated excluding these fees. |
| |
(2) | Yields on AFS debt securities are calculated based on fair value rather than the cost basis. The use of fair value does not have a material impact on net interest yield. |
| |
(3) | Nonperforming loans are included in the respective average loan balances. Income on these nonperforming loans is recognized on a cashcost recovery basis. PCI loans were recorded at fair value upon acquisition and accrete interest income over the remaining life of the loan. |
| |
(4) | Includes non-U.S. residential mortgage loans of $8893 million, $9192 million, $9489 million and $9286 million in the fourth, third, second and first quarters of 20112012, and $9688 million in the fourth quarter of 20102011, respectively. |
| |
(5) | Includes non-U.S. consumer loans of $8.48.1 billion, $8.67.8 billion, $8.77.8 billion and $8.27.5 billion in the fourth, third, second and first quarters of 20112012, and $7.98.4 billion in the fourth quarter of 20102011, respectively. |
| |
(6) | Includes consumer finance loans of $1.71.4 billion, $1.81.5 billion, $1.81.6 billion and $1.91.6 billion in the fourth, third, second and first quarters of 20112012, and $2.01.7 billion in the fourth quarter of 20102011, respectively; other non-U.S. consumer loans of $9594 million, $932997 million, $840895 million and $777903 million in the fourth, third, second and first quarters of 20112012, and $791959 million in the fourth quarter of 20102011, respectively; and consumer overdrafts of $107156 million, $107158 million, $79108 million and $7690 million in the fourth, third, second and first quarters of 20112012, and $34107 million in the fourth quarter of 20102011, respectively. |
| |
(7) | Includes U.S. commercial real estate loans of $38.736.7 billion, $40.735.4 billion, $43.436.0 billion and $45.737.4 billion in the fourth, third, second and first quarters of 20112012, and $49.038.7 billion in the fourth quarter of 20102011, respectively; and non-U.S. commercial real estate loans of $1.91.5 billion, $2.21.5 billion, $2.31.6 billion and $2.71.8 billion in the fourth, third, second and first quarters of 20112012, and $2.61.9 billion in the fourth quarter of 20102011, respectively. |
| |
(8) | Interest income includes the impact of interest rate risk management contracts, which decreased interest income on the underlying assets by $427146 million, $1.0 billion136 million, $739366 million and $388106 million in the fourth, third, second and first quarters of 20112012, and $29427 million in the fourth quarter of 20102011, respectively. Interest expense includes the impact of interest rate risk management contracts, which decreased interest expense on the underlying liabilities by $763598 million, $631454 million, $625591 million and $621658 million in the fourth, third, second and first quarters of 20112012, and $672763 million in the fourth quarter of 20102011, respectively. For further information on interest rate contracts, see Interest Rate Risk Management for Nontrading Activities on page 116117. |
|
| | |
140142 Bank of America 20112012
| | |
| | | | | | | | | | | | | | | | | | | | | | | | | | | | | | | | | | | | | |
Table XIII Quarterly Average Balances and Interest Rates – FTE Basis (continued) | Table XIII Quarterly Average Balances and Interest Rates – FTE Basis (continued) | Table XIII Quarterly Average Balances and Interest Rates – FTE Basis (continued) |
| | | | | | | | | | | | | | | | | | | | | | | | | | | | | | | | | | | |
| | Second Quarter 2011 | | First Quarter 2011 | | Fourth Quarter 2010 | Second Quarter 2012 | | First Quarter 2012 | | Fourth Quarter 2011 |
| (Dollars in millions) | Average Balance | | Interest
Income/ Expense | | Yield/ Rate | | Average Balance | | Interest
Income/ Expense | | Yield/ Rate | | Average Balance | | Interest
Income/ Expense | | Yield/ Rate | Average Balance | | Interest
Income/ Expense | | Yield/ Rate | | Average Balance | | Interest
Income/ Expense | | Yield/ Rate | | Average Balance | | Interest
Income/ Expense | | Yield/ Rate |
| Earning assets | |
| | |
| | |
| | |
| | |
| | |
| | |
| | |
| | |
| |
| | |
| | |
| | |
| | |
| | |
| | |
| | |
| | |
|
Time deposits placed and other short-term investments (1) | $ | 27,298 |
| | $ | 106 |
| | 1.56 | % | | $ | 31,294 |
| | $ | 88 |
| | 1.14 | % | | $ | 28,141 |
| | $ | 75 |
| | 1.07 | % | $ | 27,476 |
| | $ | 64 |
| | 0.94 | % | | $ | 31,404 |
| | $ | 65 |
| | 0.83 | % | | $ | 27,688 |
| | $ | 85 |
| | 1.19 | % |
| Federal funds sold and securities borrowed or purchased under agreements to resell | 259,069 |
| | 597 |
| | 0.92 |
| | 227,379 |
| | 517 |
| | 0.92 |
| | 243,589 |
| | 486 |
| | 0.79 |
| 234,148 |
| | 360 |
| | 0.62 |
| | 233,061 |
| | 460 |
| | 0.79 |
| | 237,453 |
| | 449 |
| | 0.75 |
|
| Trading account assets | 186,760 |
| | 1,576 |
| | 3.38 |
| | 221,041 |
| | 1,669 |
| | 3.05 |
| | 216,003 |
| | 1,710 |
| | 3.15 |
| 180,694 |
| | 1,302 |
| | 2.89 |
| | 175,778 |
| | 1,399 |
| | 3.19 |
| | 161,848 |
| | 1,354 |
| | 3.33 |
|
Debt securities (2) | 335,269 |
| | 2,696 |
| | 3.22 |
| | 335,847 |
| | 2,917 |
| | 3.49 |
| | 341,867 |
| | 3,065 |
| | 3.58 |
| 342,244 |
| | 1,907 |
| | 2.23 |
| | 327,758 |
| | 2,732 |
| | 3.33 |
| | 332,990 |
| | 2,245 |
| | 2.69 |
|
Loans and leases (3): | |
| | |
| | |
| | |
| | |
| | |
| | |
| | |
| | |
| |
| | |
| | |
| | |
| | |
| | |
| | |
| | |
| | |
|
Residential mortgage (4) | 265,420 |
| | 2,763 |
| | 4.16 |
| | 262,049 |
| | 2,881 |
| | 4.40 |
| | 254,051 |
| | 2,857 |
| | 4.50 |
| 255,349 |
| | 2,462 |
| | 3.86 |
| | 260,573 |
| | 2,489 |
| | 3.82 |
| | 266,144 |
| | 2,596 |
| | 3.90 |
|
| Home equity | 131,786 |
| | 1,261 |
| | 3.83 |
| | 136,089 |
| | 1,335 |
| | 3.96 |
| | 139,772 |
| | 1,410 |
| | 4.01 |
| 119,657 |
| | 1,090 |
| | 3.66 |
| | 122,933 |
| | 1,164 |
| | 3.80 |
| | 126,251 |
| | 1,207 |
| | 3.80 |
|
| Discontinued real estate | 15,997 |
| | 129 |
| | 3.22 |
| | 12,899 |
| | 110 |
| | 3.42 |
| | 13,297 |
| | 118 |
| | 3.57 |
| 11,144 |
| | 94 |
| | 3.36 |
| | 12,082 |
| | 103 |
| | 3.42 |
| | 14,073 |
| | 128 |
| | 3.65 |
|
| U.S. credit card | 106,164 |
| | 2,718 |
| | 10.27 |
| | 109,941 |
| | 2,837 |
| | 10.47 |
| | 112,673 |
| | 3,040 |
| | 10.70 |
| 95,018 |
| | 2,356 |
| | 9.97 |
| | 98,334 |
| | 2,459 |
| | 10.06 |
| | 102,241 |
| | 2,603 |
| | 10.10 |
|
| Non-U.S. credit card | 27,259 |
| | 760 |
| | 11.18 |
| | 27,633 |
| | 779 |
| | 11.43 |
| | 27,457 |
| | 815 |
| | 11.77 |
| 13,641 |
| | 396 |
| | 11.68 |
| | 14,151 |
| | 408 |
| | 11.60 |
| | 15,981 |
| | 420 |
| | 10.41 |
|
Direct/Indirect consumer (5) | 89,403 |
| | 945 |
| | 4.24 |
| | 90,097 |
| | 993 |
| | 4.47 |
| | 91,549 |
| | 1,088 |
| | 4.72 |
| 84,198 |
| | 733 |
| | 3.50 |
| | 88,321 |
| | 801 |
| | 3.65 |
| | 90,861 |
| | 863 |
| | 3.77 |
|
Other consumer (6) | 2,745 |
| | 47 |
| | 6.76 |
| | 2,753 |
| | 45 |
| | 6.58 |
| | 2,796 |
| | 45 |
| | 6.32 |
| 2,565 |
| | 41 |
| | 6.41 |
| | 2,617 |
| | 40 |
| | 6.24 |
| | 2,751 |
| | 41 |
| | 6.14 |
|
| Total consumer | 638,774 |
| | 8,623 |
| | 5.41 |
| | 641,461 |
| | 8,980 |
| | 5.65 |
| | 641,595 |
| | 9,373 |
| | 5.81 |
| 581,572 |
| | 7,172 |
| | 4.95 |
| | 599,011 |
| | 7,464 |
| | 5.00 |
| | 618,302 |
| | 7,858 |
| | 5.06 |
|
| U.S. commercial | 190,479 |
| | 1,827 |
| | 3.85 |
| | 191,353 |
| | 1,926 |
| | 4.08 |
| | 193,608 |
| | 1,894 |
| | 3.88 |
| 199,644 |
| | 1,742 |
| | 3.51 |
| | 195,111 |
| | 1,756 |
| | 3.62 |
| | 196,778 |
| | 1,798 |
| | 3.63 |
|
Commercial real estate (7) | 45,762 |
| | 382 |
| | 3.35 |
| | 48,359 |
| | 437 |
| | 3.66 |
| | 51,617 |
| | 432 |
| | 3.32 |
| 37,627 |
| | 323 |
| | 3.46 |
| | 39,190 |
| | 339 |
| | 3.48 |
| | 40,673 |
| | 343 |
| | 3.34 |
|
| Commercial lease financing | 21,284 |
| | 235 |
| | 4.41 |
| | 21,634 |
| | 322 |
| | 5.95 |
| | 21,363 |
| | 250 |
| | 4.69 |
| 21,446 |
| | 216 |
| | 4.02 |
| | 21,679 |
| | 272 |
| | 5.01 |
| | 21,278 |
| | 204 |
| | 3.84 |
|
| Non-U.S. commercial | 42,214 |
| | 339 |
| | 3.22 |
| | 36,159 |
| | 299 |
| | 3.35 |
| | 32,431 |
| | 289 |
| | 3.53 |
| 59,209 |
| | 369 |
| | 2.50 |
| | 58,731 |
| | 391 |
| | 2.68 |
| | 55,867 |
| | 395 |
| | 2.80 |
|
| Total commercial | 299,739 |
| | 2,783 |
| | 3.72 |
| | 297,505 |
| | 2,984 |
| | 4.06 |
| | 299,019 |
| | 2,865 |
| | 3.81 |
| 317,926 |
| | 2,650 |
| | 3.35 |
| | 314,711 |
| | 2,758 |
| | 3.52 |
| | 314,596 |
| | 2,740 |
| | 3.46 |
|
| Total loans and leases | 938,513 |
| | 11,406 |
| | 4.87 |
| | 938,966 |
| | 11,964 |
| | 5.14 |
| | 940,614 |
| | 12,238 |
| | 5.18 |
| 899,498 |
| | 9,822 |
| | 4.38 |
| | 913,722 |
| | 10,222 |
| | 4.49 |
| | 932,898 |
| | 10,598 |
| | 4.52 |
|
| Other earning assets | 97,616 |
| | 866 |
| | 3.56 |
| | 115,336 |
| | 922 |
| | 3.24 |
| | 113,325 |
| | 923 |
| | 3.23 |
| 88,508 |
| | 719 |
| | 3.26 |
| | 86,382 |
| | 743 |
| | 3.46 |
| | 91,109 |
| | 904 |
| | 3.95 |
|
Total earning assets (8) | 1,844,525 |
| | 17,247 |
| | 3.75 |
| | 1,869,863 |
| | 18,077 |
| | 3.92 |
| | 1,883,539 |
| | 18,497 |
| | 3.90 |
| 1,772,568 |
| | 14,174 |
| | 3.21 |
| | 1,768,105 |
| | 15,621 |
| | 3.55 |
| | 1,783,986 |
| | 15,635 |
| | 3.49 |
|
Cash and cash equivalents (1) | 115,956 |
| | 49 |
| | |
| | 138,241 |
| | 63 |
| | |
| | 136,967 |
| | 63 |
| | |
| 116,025 |
| | 52 |
| | |
| | 112,512 |
| | 47 |
| | |
| | 94,287 |
| | 36 |
| | |
|
| Other assets, less allowance for loan and lease losses | 378,629 |
| | |
| | |
| | 330,434 |
| | |
| | |
| | 349,752 |
| | |
| | |
| 305,970 |
| | |
| | |
| | 306,557 |
| | |
| | |
| | 329,294 |
| | |
| | |
|
| Total assets | $ | 2,339,110 |
| | |
| | |
| | $ | 2,338,538 |
| | |
| | |
| | $ | 2,370,258 |
| | |
| | |
| $ | 2,194,563 |
| | |
| | |
| | $ | 2,187,174 |
| | |
| | |
| | $ | 2,207,567 |
| | |
| | |
|
| Interest-bearing liabilities | |
| | |
| | |
| | |
| | |
| | |
| | |
| | |
| | |
| |
| | |
| | |
| | |
| | |
| | |
| | |
| | |
| | |
|
| U.S. interest-bearing deposits: | |
| | |
| | |
| | |
| | |
| | |
| | |
| | |
| | |
| |
| | |
| | |
| | |
| | |
| | |
| | |
| | |
| | |
|
| Savings | $ | 41,668 |
| | $ | 31 |
| | 0.30 | % | | $ | 38,905 |
| | $ | 32 |
| | 0.34 | % | | $ | 37,145 |
| | $ | 35 |
| | 0.36 | % | $ | 42,394 |
| | $ | 14 |
| | 0.13 | % | | $ | 40,543 |
| | $ | 14 |
| | 0.14 | % | | $ | 39,609 |
| | $ | 16 |
| | 0.16 | % |
| NOW and money market deposit accounts | 478,690 |
| | 304 |
| | 0.25 |
| | 475,954 |
| | 316 |
| | 0.27 |
| | 464,531 |
| | 333 |
| | 0.28 |
| 460,788 |
| | 188 |
| | 0.16 |
| | 458,649 |
| | 186 |
| | 0.16 |
| | 454,249 |
| | 192 |
| | 0.17 |
|
| Consumer CDs and IRAs | 113,728 |
| | 281 |
| | 0.99 |
| | 118,306 |
| | 300 |
| | 1.03 |
| | 124,855 |
| | 338 |
| | 1.07 |
| 96,858 |
| | 171 |
| | 0.71 |
| | 100,044 |
| | 194 |
| | 0.78 |
| | 103,488 |
| | 220 |
| | 0.84 |
|
| Negotiable CDs, public funds and other time deposits | 13,842 |
| | 42 |
| | 1.22 |
| | 13,995 |
| | 39 |
| | 1.11 |
| | 16,334 |
| | 47 |
| | 1.16 |
| |
| Negotiable CDs, public funds and other deposits | | 21,661 |
| | 35 |
| | 0.65 |
| | 22,586 |
| | 36 |
| | 0.64 |
| | 22,413 |
| | 34 |
| | 0.60 |
|
| Total U.S. interest-bearing deposits | 647,928 |
| | 658 |
| | 0.41 |
| | 647,160 |
| | 687 |
| | 0.43 |
| | 642,865 |
| | 753 |
| | 0.46 |
| 621,701 |
| | 408 |
| | 0.26 |
| | 621,822 |
| | 430 |
| | 0.28 |
| | 619,759 |
| | 462 |
| | 0.30 |
|
| Non-U.S. interest-bearing deposits: | |
| | |
| | |
| | |
| | |
| | |
| | |
| | |
| | |
| |
| | |
| | |
| | |
| | |
| | |
| | |
| | |
| | |
|
| Banks located in non-U.S. countries | 19,234 |
| | 37 |
| | 0.77 |
| | 21,534 |
| | 38 |
| | 0.72 |
| | 16,827 |
| | 38 |
| | 0.91 |
| 14,598 |
| | 25 |
| | 0.69 |
| | 18,170 |
| | 28 |
| | 0.62 |
| | 20,454 |
| | 29 |
| | 0.55 |
|
| Governments and official institutions | 2,131 |
| | 2 |
| | 0.38 |
| | 2,307 |
| | 2 |
| | 0.35 |
| | 1,560 |
| | 2 |
| | 0.42 |
| 895 |
| | 1 |
| | 0.37 |
| | 1,286 |
| | 1 |
| | 0.41 |
| | 1,466 |
| | 1 |
| | 0.36 |
|
| Time, savings and other | 64,889 |
| | 146 |
| | 0.90 |
| | 60,432 |
| | 112 |
| | 0.76 |
| | 58,746 |
| | 101 |
| | 0.69 |
| 52,584 |
| | 85 |
| | 0.65 |
| | 55,241 |
| | 90 |
| | 0.66 |
| | 57,814 |
| | 124 |
| | 0.85 |
|
| Total non-U.S. interest-bearing deposits | 86,254 |
| | 185 |
| | 0.86 |
| | 84,273 |
| | 152 |
| | 0.73 |
| | 77,133 |
| | 141 |
| | 0.73 |
| 68,077 |
| | 111 |
| | 0.65 |
| | 74,697 |
| | 119 |
| | 0.64 |
| | 79,734 |
| | 154 |
| | 0.77 |
|
| Total interest-bearing deposits | 734,182 |
| | 843 |
| | 0.46 |
| | 731,433 |
| | 839 |
| | 0.46 |
| | 719,998 |
| | 894 |
| | 0.49 |
| 689,778 |
| | 519 |
| | 0.30 |
| | 696,519 |
| | 549 |
| | 0.32 |
| | 699,493 |
| | 616 |
| | 0.35 |
|
| Federal funds purchased, securities loaned or sold under agreements to repurchase and other short-term borrowings | 338,692 |
| | 1,342 |
| | 1.59 |
| | 371,573 |
| | 1,184 |
| | 1.29 |
| | 369,738 |
| | 1,142 |
| | 1.23 |
| 318,909 |
| | 943 |
| | 1.19 |
| | 293,056 |
| | 881 |
| | 1.21 |
| | 284,766 |
| | 921 |
| | 1.28 |
|
| Trading account liabilities | 96,108 |
| | 627 |
| | 2.62 |
| | 83,914 |
| | 627 |
| | 3.03 |
| | 81,313 |
| | 561 |
| | 2.74 |
| 84,728 |
| | 448 |
| | 2.13 |
| | 71,872 |
| | 477 |
| | 2.67 |
| | 70,999 |
| | 411 |
| | 2.29 |
|
| Long-term debt | 435,144 |
| | 2,991 |
| | 2.75 |
| | 440,511 |
| | 3,093 |
| | 2.84 |
| | 465,875 |
| | 3,254 |
| | 2.78 |
| 333,173 |
| | 2,534 |
| | 3.05 |
| | 363,518 |
| | 2,708 |
| | 2.99 |
| | 389,557 |
| | 2,764 |
| | 2.80 |
|
Total interest-bearing liabilities (8) | 1,604,126 |
| | 5,803 |
| | 1.45 |
| | 1,627,431 |
| | 5,743 |
| | 1.43 |
| | 1,636,924 |
| | 5,851 |
| | 1.42 |
| 1,426,588 |
| | 4,444 |
| | 1.25 |
| | 1,424,965 |
| | 4,615 |
| | 1.30 |
| | 1,444,815 |
| | 4,712 |
| | 1.29 |
|
| Noninterest-bearing sources: | |
| | |
| | |
| | |
| | |
| | |
| | |
| | |
| | |
| |
| | |
| | |
| | |
| | |
| | |
| | |
| | |
| | |
|
| Noninterest-bearing deposits | 301,762 |
| | |
| | |
| | 291,707 |
| | |
| | |
| | 287,740 |
| | |
| | |
| 343,110 |
| | |
| | |
| | 333,593 |
| | |
| | |
| | 333,038 |
| | |
| | |
|
| Other liabilities | 198,155 |
| | |
| | |
| | 188,631 |
| | |
| | |
| | 210,069 |
| | |
| | |
| 189,307 |
| | |
| | |
| | 196,050 |
| | |
| | |
| | 201,479 |
| | |
| | |
|
| Shareholders’ equity | 235,067 |
| | |
| | |
| | 230,769 |
| | |
| | |
| | 235,525 |
| | |
| | |
| 235,558 |
| | |
| | |
| | 232,566 |
| | |
| | |
| | 228,235 |
| | |
| | |
|
| Total liabilities and shareholders’ equity | $ | 2,339,110 |
| | |
| | |
| | $ | 2,338,538 |
| | |
| | |
| | $ | 2,370,258 |
| | |
| | |
| $ | 2,194,563 |
| | |
| | |
| | $ | 2,187,174 |
| | |
| | |
| | $ | 2,207,567 |
| | |
| | |
|
| Net interest spread | |
| | |
| | 2.30 | % | | |
| | |
| | 2.49 | % | | |
| | |
| | 2.48 | % | |
| | |
| | 1.96 | % | | |
| | |
| | 2.25 | % | | |
| | |
| | 2.20 | % |
| Impact of noninterest-bearing sources | |
| | |
| | 0.19 |
| | |
| | |
| | 0.17 |
| | |
| | |
| | 0.18 |
| |
| | |
| | 0.24 |
| | |
| | |
| | 0.25 |
| | |
| | |
| | 0.24 |
|
Net interest income/yield on earning assets (1) | |
| | $ | 11,444 |
| | 2.49 | % | | |
| | $ | 12,334 |
| | 2.66 | % | | |
| | $ | 12,646 |
| | 2.66 | % | |
| | $ | 9,730 |
| | 2.20 | % | | |
| | $ | 11,006 |
| | 2.50 | % | | |
| | $ | 10,923 |
| | 2.44 | % |
For footnotes see page 140142.
|
| | |
| | | Bank of America 2012 141143 |
| | | | | | | | | | | | | | | | | | | | | | | | | | | | | | | | | |
Table XIV Quarterly Supplemental Financial Data (1) | Table XIV Quarterly Supplemental Financial Data (1) | Table XIV Quarterly Supplemental Financial Data (1) |
| | | | | | | | | | | | | | | | | | | | | | | | | | | | | | | |
| | 2011 Quarters | | 2010 Quarters | 2012 Quarters | | 2011 Quarters |
| (Dollars in millions, except per share information) | Fourth | | Third | | Second | | First | | Fourth | | Third | | Second | | First | Fourth | | Third | | Second | | First | | Fourth | | Third | | Second | | First |
| Fully taxable-equivalent basis data | |
| | |
| | |
| | |
| | |
| | |
| | |
| | |
| |
| | |
| | |
| | |
| | |
| | |
| | |
| | |
|
| Net interest income | $ | 10,959 |
| | $ | 10,739 |
| | $ | 11,493 |
| | $ | 12,397 |
| | $ | 12,709 |
| | $ | 12,717 |
| | $ | 13,197 |
| | $ | 14,070 |
| $ | 10,555 |
| | $ | 10,167 |
| | $ | 9,782 |
| | $ | 11,053 |
| | $ | 10,959 |
| | $ | 10,739 |
| | $ | 11,493 |
| | $ | 12,397 |
|
| Total revenue, net of interest expense | 25,146 |
| | 28,702 |
| | 13,483 |
| | 27,095 |
| | 22,668 |
| | 26,982 |
| | 29,450 |
| | 32,290 |
| 18,891 |
| | 20,657 |
| | 22,202 |
| | 22,485 |
| | 25,146 |
| | 28,702 |
| | 13,483 |
| | 27,095 |
|
Net interest yield (2) | 2.45 | % | | 2.32 | % | | 2.50 | % | | 2.67 | % | | 2.69 | % | | 2.72 | % | | 2.77 | % | | 2.93 | % | 2.35 | % | | 2.32 | % | | 2.21 | % | | 2.51 | % | | 2.45 | % | | 2.32 | % | | 2.50 | % | | 2.67 | % |
| Efficiency ratio | 77.64 |
| | 61.37 |
| | n/m |
| | 74.86 |
| | 92.04 |
| | 100.87 |
| | 58.58 |
| | 55.05 |
| 97.19 |
| | 84.93 |
| | 76.79 |
| | 85.13 |
| | 77.64 |
| | 61.37 |
| | n/m |
| | 74.86 |
|
Performance ratios, excluding goodwill impairment charges (3) | |
| | |
| | |
| | |
| | |
| | |
| | |
| | |
| |
| | |
| | |
| | |
| | |
| | |
| | |
| | |
|
| Per common share information | |
| | |
| | |
| | |
| | |
| | |
| | |
| | |
| |
| | |
| | |
| | |
| | |
| | |
| | |
| | |
|
| Earnings (loss) | $ | 0.21 |
| | | | $ | (0.65 | ) | | | | $ | 0.04 |
| | $ | 0.27 |
| | |
| | |
| | | | | | | | | $ | 0.21 |
| | | | $ | (0.65 | ) | | |
|
| Diluted earnings (loss) | 0.20 |
| | | | (0.65 | ) | | | | 0.04 |
| | 0.27 |
| | |
| | |
| | | | | | | | | 0.20 |
| | | | (0.65 | ) | | |
|
| Efficiency ratio | 75.33 | % | | | | n/m |
| | | | 83.22 | % | | 62.33 | % | | |
| | |
| |
| Efficiency ratio (FTE basis) | | | | | |
|
| | | | 75.33 | % | | | | n/m |
| | |
|
| Return on average assets | 0.46 |
| | | | n/m |
| | | | 0.13 |
| | 0.52 |
| | |
| | |
| | | | |
|
| | | | 0.46 |
| | | | n/m |
| | |
|
Four quarter trailing return on average assets (4) | 0.20 |
| | | | n/m |
| | |
| | 0.42 |
| | 0.38 |
| | |
| | |
| | | | | | | |
| | 0.20 |
| | | | n/m |
| | |
|
| Return on average common shareholders’ equity | 4.10 |
| | | | n/m |
| | | | 0.79 |
| | 5.06 |
| | |
| | |
| | | | |
|
| | | | 4.10 |
| | | | n/m |
| | |
|
| Return on average tangible common shareholders’ equity | 6.46 |
| | | | n/m |
| | | | 1.27 |
| | 8.67 |
| | |
| | |
| | | | |
|
| | | | 6.46 |
| | | | n/m |
| | |
|
| Return on average tangible shareholders’ equity | 6.72 |
| | | | n/m |
| | | | 1.96 |
| | 8.54 |
| | |
| | |
| | | | |
|
| | | | 6.72 |
| | | | n/m |
| | |
|
| |
(1) | Supplemental financial data on a FTE basis and performance measures and ratios excluding the impact of goodwill impairment charges are non-GAAP financial measures. Other companies may define or calculate these measures differently. For additional information on these performance measures and ratios, see Supplemental Financial Data on page 3835 and for corresponding reconciliations to GAAP financial measures, see Statistical Table XVII. |
| |
(2) | Calculation includes fees earned on overnight deposits placed with the Federal Reserve and, beginning in the third quarter of 2012, fees earned on deposits, primarily overnight, placed with certain non-U.S. central banks of $3642 million, $3848 million, $4952 million and $6347 million for the fourth, third, second and first quarters of 20112012, and $6336 million, $107$38 million, $106$49 million and $92$63 million for the fourth, third, second and first quarters of 20102011, respectively. |
| |
(3) | Performance ratios are calculated excluding the impact of the goodwill impairment charges of $581 million and $2.6 billion recorded during the fourth and second quarters of 2011 and $2.0 billion and $10.4 billion recorded during the fourth and third quarters of 2010, respectively.2011. |
| |
(4) | Calculated as total net income for four consecutive quarters divided by annualized average assets for the period.four consecutive quarters. |
n/m = not meaningful
|
| | |
142144 Bank of America 20112012
| | |
| | | | | | | | | | | | | | | | | | | | | |
Table XV Five Year Reconciliations to GAAP Financial Measures (1) | Table XV Five Year Reconciliations to GAAP Financial Measures (1) | Table XV Five Year Reconciliations to GAAP Financial Measures (1) |
| | | | | | | | | | | | | | | | | | | |
| (Dollars in millions, except per share information) | 2011 | | 2010 | | 2009 | | 2008 | | 2007 | |
| (Dollars in millions, shares in thousands) | | 2012 | | 2011 | | 2010 | | 2009 | | 2008 |
| Reconciliation of net interest income to net interest income on a fully taxable-equivalent basis | |
| | |
| | |
| | |
| | |
| |
| | |
| | |
| | |
| | |
|
| Net interest income | $ | 44,616 |
| | $ | 51,523 |
| | $ | 47,109 |
| | $ | 45,360 |
| | $ | 34,441 |
| $ | 40,656 |
| | $ | 44,616 |
| | $ | 51,523 |
| | $ | 47,109 |
| | $ | 45,360 |
|
| Fully taxable-equivalent adjustment | 972 |
| | 1,170 |
| | 1,301 |
| | 1,194 |
| | 1,749 |
| 901 |
| | 972 |
| | 1,170 |
| | 1,301 |
| | 1,194 |
|
| Net interest income on a fully taxable-equivalent basis | $ | 45,588 |
| | $ | 52,693 |
| | $ | 48,410 |
| | $ | 46,554 |
| | $ | 36,190 |
| $ | 41,557 |
| | $ | 45,588 |
| | $ | 52,693 |
| | $ | 48,410 |
| | $ | 46,554 |
|
| Reconciliation of total revenue, net of interest expense to total revenue, net of interest expense on a fully taxable-equivalent basis | |
| | |
| | |
| | |
| | |
| |
| | |
| | |
| | |
| | |
|
| Total revenue, net of interest expense | $ | 93,454 |
| | $ | 110,220 |
| | $ | 119,643 |
| | $ | 72,782 |
| | $ | 66,833 |
| $ | 83,334 |
| | $ | 93,454 |
| | $ | 110,220 |
| | $ | 119,643 |
| | $ | 72,782 |
|
| Fully taxable-equivalent adjustment | 972 |
| | 1,170 |
| | 1,301 |
| | 1,194 |
| | 1,749 |
| 901 |
| | 972 |
| | 1,170 |
| | 1,301 |
| | 1,194 |
|
| Total revenue, net of interest expense on a fully taxable-equivalent basis | $ | 94,426 |
| | $ | 111,390 |
| | $ | 120,944 |
| | $ | 73,976 |
| | $ | 68,582 |
| $ | 84,235 |
| | $ | 94,426 |
| | $ | 111,390 |
| | $ | 120,944 |
| | $ | 73,976 |
|
| Reconciliation of total noninterest expense to total noninterest expense, excluding goodwill impairment charges | |
| | |
| | |
| | |
| | |
| |
| | |
| | |
| | |
| | |
|
| Total noninterest expense | $ | 80,274 |
| | $ | 83,108 |
| | $ | 66,713 |
| | $ | 41,529 |
| | $ | 37,524 |
| $ | 72,093 |
| | $ | 80,274 |
| | $ | 83,108 |
| | $ | 66,713 |
| | $ | 41,529 |
|
| Goodwill impairment charges | (3,184 | ) | | (12,400 | ) | | — |
| | — |
| | — |
| — |
| | (3,184 | ) | | (12,400 | ) | | — |
| | — |
|
| Total noninterest expense, excluding goodwill impairment charges | $ | 77,090 |
| | $ | 70,708 |
| | $ | 66,713 |
| | $ | 41,529 |
| | $ | 37,524 |
| $ | 72,093 |
| | $ | 77,090 |
| | $ | 70,708 |
| | $ | 66,713 |
| | $ | 41,529 |
|
| Reconciliation of income tax expense (benefit) to income tax expense (benefit) on a fully taxable-equivalent basis | |
| | |
| | |
| | |
| | |
| |
| | |
| | |
| | |
| | |
|
| Income tax expense (benefit) | $ | (1,676 | ) | | $ | 915 |
| | $ | (1,916 | ) | | $ | 420 |
| | $ | 5,942 |
| $ | (1,116 | ) | | $ | (1,676 | ) | | $ | 915 |
| | $ | (1,916 | ) | | $ | 420 |
|
| Fully taxable-equivalent adjustment | 972 |
| | 1,170 |
| | 1,301 |
| | 1,194 |
| | 1,749 |
| 901 |
| | 972 |
| | 1,170 |
| | 1,301 |
| | 1,194 |
|
| Income tax expense (benefit) on a fully taxable-equivalent basis | $ | (704 | ) | | $ | 2,085 |
| | $ | (615 | ) | | $ | 1,614 |
| | $ | 7,691 |
| $ | (215 | ) | | $ | (704 | ) | | $ | 2,085 |
| | $ | (615 | ) | | $ | 1,614 |
|
| Reconciliation of net income (loss) to net income, excluding goodwill impairment charges | |
| | |
| | |
| | |
| | |
| |
| | |
| | |
| | |
| | |
|
| Net income (loss) | $ | 1,446 |
| | $ | (2,238 | ) | | $ | 6,276 |
| | $ | 4,008 |
| | $ | 14,982 |
| $ | 4,188 |
| | $ | 1,446 |
| | $ | (2,238 | ) | | $ | 6,276 |
| | $ | 4,008 |
|
| Goodwill impairment charges | 3,184 |
| | 12,400 |
| | — |
| | — |
| | — |
| — |
| | 3,184 |
| | 12,400 |
| | — |
| | — |
|
| Net income, excluding goodwill impairment charges | $ | 4,630 |
| | $ | 10,162 |
| | $ | 6,276 |
| | $ | 4,008 |
| | $ | 14,982 |
| $ | 4,188 |
| | $ | 4,630 |
| | $ | 10,162 |
| | $ | 6,276 |
| | $ | 4,008 |
|
| Reconciliation of net income (loss) applicable to common shareholders to net income (loss) applicable to common shareholders, excluding goodwill impairment charges | |
| | |
| | |
| | |
| | |
| |
| | |
| | |
| | |
| | |
|
| Net income (loss) applicable to common shareholders | $ | 85 |
| | $ | (3,595 | ) | | $ | (2,204 | ) | | $ | 2,556 |
| | $ | 14,800 |
| $ | 2,760 |
| | $ | 85 |
| | $ | (3,595 | ) | | $ | (2,204 | ) | | $ | 2,556 |
|
| Goodwill impairment charges | 3,184 |
| | 12,400 |
| | — |
| | — |
| | — |
| — |
| | 3,184 |
| | 12,400 |
| | — |
| | — |
|
| Net income (loss) applicable to common shareholders, excluding goodwill impairment charges | $ | 3,269 |
| | $ | 8,805 |
| | $ | (2,204 | ) | | $ | 2,556 |
| | $ | 14,800 |
| $ | 2,760 |
| | $ | 3,269 |
| | $ | 8,805 |
| | $ | (2,204 | ) | | $ | 2,556 |
|
| Reconciliation of average common shareholders’ equity to average tangible common shareholders’ equity | |
| | |
| | |
| | |
| | |
| |
| | |
| | |
| | |
| | |
|
| Common shareholders’ equity | $ | 211,709 |
| | $ | 212,686 |
| | $ | 182,288 |
| | $ | 141,638 |
| | $ | 133,555 |
| $ | 216,996 |
| | $ | 211,709 |
| | $ | 212,686 |
| | $ | 182,288 |
| | $ | 141,638 |
|
| Common Equivalent Securities | — |
| | 2,900 |
| | 1,213 |
| | — |
| | — |
| — |
| | — |
| | 2,900 |
| | 1,213 |
| | — |
|
| Goodwill | (72,334 | ) | | (82,600 | ) | | (86,034 | ) | | (79,827 | ) | | (69,333 | ) | (69,974 | ) | | (72,334 | ) | | (82,600 | ) | | (86,034 | ) | | (79,827 | ) |
| Intangible assets (excluding MSRs) | (9,180 | ) | | (10,985 | ) | | (12,220 | ) | | (9,502 | ) | | (9,566 | ) | (7,366 | ) | | (9,180 | ) | | (10,985 | ) | | (12,220 | ) | | (9,502 | ) |
| Related deferred tax liabilities | 2,898 |
| | 3,306 |
| | 3,831 |
| | 1,782 |
| | 1,845 |
| 2,593 |
| | 2,898 |
| | 3,306 |
| | 3,831 |
| | 1,782 |
|
| Tangible common shareholders’ equity | $ | 133,093 |
| | $ | 125,307 |
| | $ | 89,078 |
| | $ | 54,091 |
| | $ | 56,501 |
| $ | 142,249 |
| | $ | 133,093 |
| | $ | 125,307 |
| | $ | 89,078 |
| | $ | 54,091 |
|
| Reconciliation of average shareholders’ equity to average tangible shareholders’ equity | |
| | |
| | |
| | |
| | |
| |
| | |
| | |
| | |
| | |
|
| Shareholders’ equity | $ | 229,095 |
| | $ | 233,235 |
| | $ | 244,645 |
| | $ | 164,831 |
| | $ | 136,662 |
| $ | 235,677 |
| | $ | 229,095 |
| | $ | 233,235 |
| | $ | 244,645 |
| | $ | 164,831 |
|
| Goodwill | (72,334 | ) | | (82,600 | ) | | (86,034 | ) | | (79,827 | ) | | (69,333 | ) | (69,974 | ) | | (72,334 | ) | | (82,600 | ) | | (86,034 | ) | | (79,827 | ) |
| Intangible assets (excluding MSRs) | (9,180 | ) | | (10,985 | ) | | (12,220 | ) | | (9,502 | ) | | (9,566 | ) | (7,366 | ) | | (9,180 | ) | | (10,985 | ) | | (12,220 | ) | | (9,502 | ) |
| Related deferred tax liabilities | 2,898 |
| | 3,306 |
| | 3,831 |
| | 1,782 |
| | 1,845 |
| 2,593 |
| | 2,898 |
| | 3,306 |
| | 3,831 |
| | 1,782 |
|
| Tangible shareholders’ equity | $ | 150,479 |
| | $ | 142,956 |
| | $ | 150,222 |
| | $ | 77,284 |
| | $ | 59,608 |
| $ | 160,930 |
| | $ | 150,479 |
| | $ | 142,956 |
| | $ | 150,222 |
| | $ | 77,284 |
|
| Reconciliation of year-end common shareholders’ equity to year-end tangible common shareholders’ equity | |
| | |
| | |
| | |
| | |
| |
| | |
| | |
| | |
| | |
|
| Common shareholders’ equity | $ | 211,704 |
| | $ | 211,686 |
| | $ | 194,236 |
| | $ | 139,351 |
| | $ | 142,394 |
| $ | 218,188 |
| | $ | 211,704 |
| | $ | 211,686 |
| | $ | 194,236 |
| | $ | 139,351 |
|
| Common Equivalent Securities | — |
| | — |
| | 19,244 |
| | — |
| | — |
| — |
| | — |
| | — |
| | 19,244 |
| | — |
|
| Goodwill | (69,967 | ) | | (73,861 | ) | | (86,314 | ) | | (81,934 | ) | | (77,530 | ) | (69,976 | ) | | (69,967 | ) | | (73,861 | ) | | (86,314 | ) | | (81,934 | ) |
| Intangible assets (excluding MSRs) | (8,021 | ) | | (9,923 | ) | | (12,026 | ) | | (8,535 | ) | | (10,296 | ) | (6,684 | ) | | (8,021 | ) | | (9,923 | ) | | (12,026 | ) | | (8,535 | ) |
| Related deferred tax liabilities | 2,702 |
| | 3,036 |
| | 3,498 |
| | 1,854 |
| | 1,855 |
| 2,428 |
| | 2,702 |
| | 3,036 |
| | 3,498 |
| | 1,854 |
|
| Tangible common shareholders’ equity | $ | 136,418 |
| | $ | 130,938 |
| | $ | 118,638 |
| | $ | 50,736 |
| | $ | 56,423 |
| $ | 143,956 |
| | $ | 136,418 |
| | $ | 130,938 |
| | $ | 118,638 |
| | $ | 50,736 |
|
| Reconciliation of year-end shareholders’ equity to year-end tangible shareholders’ equity | |
| | |
| | |
| | |
| | |
| |
| | |
| | |
| | |
| | |
|
| Shareholders’ equity | $ | 230,101 |
| | $ | 228,248 |
| | $ | 231,444 |
| | $ | 177,052 |
| | $ | 146,803 |
| $ | 236,956 |
| | $ | 230,101 |
| | $ | 228,248 |
| | $ | 231,444 |
| | $ | 177,052 |
|
| Goodwill | (69,967 | ) | | (73,861 | ) | | (86,314 | ) | | (81,934 | ) | | (77,530 | ) | (69,976 | ) | | (69,967 | ) | | (73,861 | ) | | (86,314 | ) | | (81,934 | ) |
| Intangible assets (excluding MSRs) | (8,021 | ) | | (9,923 | ) | | (12,026 | ) | | (8,535 | ) | | (10,296 | ) | (6,684 | ) | | (8,021 | ) | | (9,923 | ) | | (12,026 | ) | | (8,535 | ) |
| Related deferred tax liabilities | 2,702 |
| | 3,036 |
| | 3,498 |
| | 1,854 |
| | 1,855 |
| 2,428 |
| | 2,702 |
| | 3,036 |
| | 3,498 |
| | 1,854 |
|
| Tangible shareholders’ equity | $ | 154,815 |
| | $ | 147,500 |
| | $ | 136,602 |
| | $ | 88,437 |
| | $ | 60,832 |
| $ | 162,724 |
| | $ | 154,815 |
| | $ | 147,500 |
| | $ | 136,602 |
| | $ | 88,437 |
|
| Reconciliation of year-end assets to year-end tangible assets | |
| | |
| | |
| | |
| | |
| |
| | |
| | |
| | |
| | |
|
| Assets | $ | 2,129,046 |
| | $ | 2,264,909 |
| | $ | 2,230,232 |
| | $ | 1,817,943 |
| | $ | 1,715,746 |
| $ | 2,209,974 |
| | $ | 2,129,046 |
| | $ | 2,264,909 |
| | $ | 2,230,232 |
| | $ | 1,817,943 |
|
| Goodwill | (69,967 | ) | | (73,861 | ) | | (86,314 | ) | | (81,934 | ) | | (77,530 | ) | (69,976 | ) | | (69,967 | ) | | (73,861 | ) | | (86,314 | ) | | (81,934 | ) |
| Intangible assets (excluding MSRs) | (8,021 | ) | | (9,923 | ) | | (12,026 | ) | | (8,535 | ) | | (10,296 | ) | (6,684 | ) | | (8,021 | ) | | (9,923 | ) | | (12,026 | ) | | (8,535 | ) |
| Related deferred tax liabilities | 2,702 |
| | 3,036 |
| | 3,498 |
| | 1,854 |
| | 1,855 |
| 2,428 |
| | 2,702 |
| | 3,036 |
| | 3,498 |
| | 1,854 |
|
| Tangible assets | $ | 2,053,760 |
| | $ | 2,184,161 |
| | $ | 2,135,390 |
| | $ | 1,729,328 |
| | $ | 1,629,775 |
| $ | 2,135,742 |
| | $ | 2,053,760 |
| | $ | 2,184,161 |
| | $ | 2,135,390 |
| | $ | 1,729,328 |
|
| Reconciliation of year-end common shares outstanding to year-end tangible common shares outstanding | |
| | |
| | |
| | |
| | |
| |
| | |
| | |
| | |
| | |
|
| Common shares outstanding | 10,535,938 |
| | 10,085,155 |
| | 8,650,244 |
| | 5,017,436 |
| | 4,437,885 |
| 10,778,264 |
| | 10,535,938 |
| | 10,085,155 |
| | 8,650,244 |
| | 5,017,436 |
|
Assumed conversion of common equivalent shares (2) | — |
| | — |
| | 1,286,000 |
| | — |
| | — |
| — |
| | — |
| | — |
| | 1,286,000 |
| | — |
|
| Tangible common shares outstanding | 10,535,938 |
| | 10,085,155 |
| | 9,936,244 |
| | 5,017,436 |
| | 4,437,885 |
| 10,778,264 |
| | 10,535,938 |
| | 10,085,155 |
| | 9,936,244 |
| | 5,017,436 |
|
| |
(1) | Presents reconciliations of non-GAAP financial measures to GAAP financial measures. We believe the use of these non-GAAP financial measures provides additional clarity in assessing the results of the Corporation. Other companies may define or calculate non-GAAP financialthese measures differently. For more information on non-GAAP financial measures and ratios we use in assessing the results of the Corporation, see Supplemental Financial Data on page 3835. |
| |
(2) | On February 24, 2010, the common equivalent shares converted into common shares. |
|
| | |
| | | Bank of America 2012 143145 |
| | | | | | | | | |
Table XVI Two Year Reconciliations to GAAP Financial Measures (1) | Table XVI Two Year Reconciliations to GAAP Financial Measures (1) | Table XVI Two Year Reconciliations to GAAP Financial Measures (1) |
| | | | | | | |
| (Dollars in millions) | 2011 | | 2010 | 2012 | | 2011 |
| Deposits | |
| | |
| |
| Consumer & Business Banking | | |
| | |
|
| Reported net income | $ | 1,192 |
| | $ | 1,362 |
| $ | 5,321 |
| | $ | 7,447 |
|
Adjustment related to intangibles (2) | 3 |
| | 10 |
| 13 |
| | 20 |
|
| Adjusted net income | $ | 1,195 |
| | $ | 1,372 |
| |
| | | | | |
| Average allocated equity | $ | 23,735 |
| | $ | 24,222 |
| |
| Adjustment related to goodwill and a percentage of intangibles | (17,949 | ) | | (17,975 | ) | |
| Average economic capital | $ | 5,786 |
| | $ | 6,247 |
| |
| | | | | |
| Card Services | | | | |
| Reported net income (loss) | $ | 5,788 |
| | $ | (6,980 | ) | |
Adjustment related to intangibles (2) | 17 |
| | 70 |
| |
| Goodwill impairment charge | — |
| | 10,400 |
| |
| Adjusted net income | $ | 5,805 |
| | $ | 3,490 |
| $ | 5,334 |
| | $ | 7,467 |
|
| | | | | | | |
| Average allocated equity | $ | 21,128 |
| | $ | 32,418 |
| $ | 53,646 |
| | $ | 52,908 |
|
| Adjustment related to goodwill and a percentage of intangibles | (10,589 | ) | | (17,644 | ) | (30,468 | ) | | (30,635 | ) |
| Average economic capital | $ | 10,539 |
| | $ | 14,774 |
| $ | 23,178 |
| | $ | 22,273 |
|
| | | | | | | |
| Consumer Real Estate Services | | | | | | |
| Reported net loss | $ | (19,529 | ) | | $ | (8,947 | ) | $ | (6,507 | ) | | $ | (19,465 | ) |
Adjustment related to intangibles (2) | — |
| | 3 |
| — |
| | — |
|
| Goodwill impairment charges | 2,603 |
| | 2,000 |
| |
| Goodwill impairment charge | | — |
| | 2,603 |
|
| Adjusted net loss | $ | (16,926 | ) | | $ | (6,944 | ) | $ | (6,507 | ) | | $ | (16,862 | ) |
| | | | | | | |
| Average allocated equity | $ | 16,202 |
| | $ | 26,016 |
| $ | 13,687 |
| | $ | 16,202 |
|
| Adjustment related to goodwill and a percentage of intangibles (excluding MSRs) | (1,350 | ) | | (4,802 | ) | — |
| | (1,350 | ) |
| Average economic capital | $ | 14,852 |
| | $ | 21,214 |
| $ | 13,687 |
| | $ | 14,852 |
|
| | | | | | | |
| Global Commercial Bank | | | | |
| Global Banking | | | | |
| Reported net income | $ | 4,402 |
| | $ | 3,218 |
| $ | 5,725 |
| | $ | 6,046 |
|
Adjustment related to intangibles (2) | 2 |
| | 5 |
| 4 |
| | 6 |
|
| Adjusted net income | $ | 4,404 |
| | $ | 3,223 |
| $ | 5,729 |
| | $ | 6,052 |
|
| | | | | | | |
| Average allocated equity | $ | 40,867 |
| | $ | 43,590 |
| $ | 45,907 |
| | $ | 47,384 |
|
| Adjustment related to goodwill and a percentage of intangibles | (20,695 | ) | | (20,684 | ) | (24,854 | ) | | (24,623 | ) |
| Average economic capital | $ | 20,172 |
| | $ | 22,906 |
| $ | 21,053 |
| | $ | 22,761 |
|
| | | | | | | |
| Global Banking and Markets | | | | |
| Global Markets | | | | |
| Reported net income | $ | 2,967 |
| | $ | 6,297 |
| $ | 1,054 |
| | $ | 988 |
|
Adjustment related to intangibles (2) | 17 |
| | 19 |
| 9 |
| | 12 |
|
| Adjusted net income | $ | 2,984 |
| | $ | 6,316 |
| $ | 1,063 |
| | $ | 1,000 |
|
| | | | | | | |
| Average allocated equity | $ | 37,233 |
| | $ | 50,037 |
| $ | 17,595 |
| | $ | 22,671 |
|
| Adjustment related to goodwill and a percentage of intangibles | (10,650 | ) | | (10,106 | ) | (4,639 | ) | | (4,625 | ) |
| Average economic capital | $ | 26,583 |
| | $ | 39,931 |
| $ | 12,956 |
| | $ | 18,046 |
|
| | | | | | | |
| Global Wealth and Investment Management | | | | |
| Global Wealth & Investment Management | | | | |
| Reported net income | $ | 1,635 |
| | $ | 1,340 |
| $ | 2,223 |
| | $ | 1,718 |
|
Adjustment related to intangibles (2) | 30 |
| | 86 |
| 23 |
| | 30 |
|
| Adjusted net income | $ | 1,665 |
| | $ | 1,426 |
| $ | 2,246 |
| | $ | 1,748 |
|
| | | | | | | |
| Average allocated equity | $ | 17,802 |
| | $ | 18,068 |
| $ | 17,739 |
| | $ | 17,352 |
|
| Adjustment related to goodwill and a percentage of intangibles | (10,696 | ) | | (10,778 | ) | (10,380 | ) | | (10,486 | ) |
| Average economic capital | $ | 7,106 |
| | $ | 7,290 |
| $ | 7,359 |
| | $ | 6,866 |
|
| |
(1) | Presents reconciliations of non-GAAP financial measures to GAAP financial measures. We believe the use of these non-GAAP financial measures provides additional clarity in assessing the results of the Corporation and our segments. Other companies may define or calculate these measures differently. For more information on non-GAAP financial measures and ratios we use in assessing the results of the Corporation, see Supplemental Financial Data on page 35. |
| |
(2) | Represents cost of funds, earnings credits and certain expenses related to intangibles. |
|
| | | | | | | |
| | | | |
Table XVI Two Year Reconciliations to GAAP Financial Measures (continued) (1) |
| | | | |
| (Dollars in millions) | 2012 | | 2011 |
| Consumer & Business Banking | |
| | |
|
| Deposits | | | |
| Reported net income | $ | 917 |
| | $ | 1,217 |
|
Adjustment related to intangibles (2) | 1 |
| | 3 |
|
| Adjusted net income | $ | 918 |
| | $ | 1,220 |
|
| | | | |
| Average allocated equity | $ | 24,329 |
| | $ | 23,734 |
|
| Adjustment related to goodwill and a percentage of intangibles | (17,924 | ) | | (17,948 | ) |
| Average economic capital | $ | 6,405 |
| | $ | 5,786 |
|
| | | | |
| Card Services | | | |
| Reported net income | $ | 4,061 |
| | $ | 5,811 |
|
Adjustment related to intangibles (2) | 12 |
| | 17 |
|
| Adjusted net income | $ | 4,073 |
| | $ | 5,828 |
|
| | | | |
| Average allocated equity | $ | 20,578 |
| | $ | 21,127 |
|
| Adjustment related to goodwill and a percentage of intangibles | (10,447 | ) | | (10,589 | ) |
| Average economic capital | $ | 10,131 |
| | $ | 10,538 |
|
| | | | |
| Business Banking | | | |
| Reported net income | $ | 343 |
| | $ | 419 |
|
Adjustment related to intangibles (2) | — |
| | — |
|
| Adjusted net income | $ | 343 |
| | $ | 419 |
|
| | | | |
| Average allocated equity | $ | 8,739 |
| | $ | 8,047 |
|
| Adjustment related to goodwill and a percentage of intangibles | (2,097 | ) | | (2,098 | ) |
| Average economic capital | $ | 6,642 |
| | $ | 5,949 |
|
For footnotes see page 146.
|
| | | | | | | | | | | | | | | | | | | | | | | | | | | | | | | |
| | | | | | | | | | | | | | | | |
Table XVII Quarterly Reconciliations to GAAP Financial Measures (1) |
| | | | | | | | | | | | | | | | |
| | 2012 Quarters | | 2011 Quarters |
| (Dollars in millions) | Fourth | | Third | | Second | | First | | Fourth | | Third | | Second | | First |
| Reconciliation of net interest income to net interest income on a fully taxable-equivalent basis | |
| | |
| | |
| | |
| | |
| | |
| | |
| | |
|
| Net interest income | $ | 10,324 |
| | $ | 9,938 |
| | $ | 9,548 |
| | $ | 10,846 |
| | $ | 10,701 |
| | $ | 10,490 |
| | $ | 11,246 |
| | $ | 12,179 |
|
| Fully taxable-equivalent adjustment | 231 |
| | 229 |
| | 234 |
| | 207 |
| | 258 |
| | 249 |
| | 247 |
| | 218 |
|
| Net interest income on a fully taxable-equivalent basis | $ | 10,555 |
| | $ | 10,167 |
| | $ | 9,782 |
| | $ | 11,053 |
| | $ | 10,959 |
| | $ | 10,739 |
| | $ | 11,493 |
| | $ | 12,397 |
|
| Reconciliation of total revenue, net of interest expense to total revenue, net of interest expense on a fully taxable-equivalent basis | |
| | |
| | |
| | |
| | |
| | |
| | |
| | |
|
| Total revenue, net of interest expense | $ | 18,660 |
| | $ | 20,428 |
| | $ | 21,968 |
| | $ | 22,278 |
| | $ | 24,888 |
| | $ | 28,453 |
| | $ | 13,236 |
| | $ | 26,877 |
|
| Fully taxable-equivalent adjustment | 231 |
| | 229 |
| | 234 |
| | 207 |
| | 258 |
| | 249 |
| | 247 |
| | 218 |
|
| Total revenue, net of interest expense on a fully taxable-equivalent basis | $ | 18,891 |
| | $ | 20,657 |
| | $ | 22,202 |
| | $ | 22,485 |
| | $ | 25,146 |
| | $ | 28,702 |
| | $ | 13,483 |
| | $ | 27,095 |
|
| Reconciliation of total noninterest expense to total noninterest expense, excluding goodwill impairment charges | |
| | |
| | |
| | |
| | |
| | |
| | |
| | |
|
| Total noninterest expense | $ | 18,360 |
| | $ | 17,544 |
| | $ | 17,048 |
| | $ | 19,141 |
| | $ | 19,522 |
| | $ | 17,613 |
| | $ | 22,856 |
| | $ | 20,283 |
|
| Goodwill impairment charges | — |
| | — |
| | — |
| | — |
| | (581 | ) | | — |
| | (2,603 | ) | | — |
|
| Total noninterest expense, excluding goodwill impairment charges | $ | 18,360 |
| | $ | 17,544 |
| | $ | 17,048 |
| | $ | 19,141 |
| | $ | 18,941 |
| | $ | 17,613 |
| | $ | 20,253 |
| | $ | 20,283 |
|
| Reconciliation of income tax expense (benefit) to income tax expense (benefit) on a fully taxable-equivalent basis | |
| | |
| | |
| | |
| | |
| | |
| | |
| | |
|
| Income tax expense (benefit) | $ | (2,636 | ) | | $ | 770 |
| | $ | 684 |
| | $ | 66 |
| | $ | 441 |
| | $ | 1,201 |
| | $ | (4,049 | ) | | $ | 731 |
|
| Fully taxable-equivalent adjustment | 231 |
| | 229 |
| | 234 |
| | 207 |
| | 258 |
| | 249 |
| | 247 |
| | 218 |
|
| Income tax expense (benefit) on a fully taxable-equivalent basis | $ | (2,405 | ) | | $ | 999 |
| | $ | 918 |
| | $ | 273 |
| | $ | 699 |
| | $ | 1,450 |
| | $ | (3,802 | ) | | $ | 949 |
|
| Reconciliation of net income (loss) to net income (loss), excluding goodwill impairment charges | |
| | |
| | |
| | |
| | |
| | |
| | |
| | |
|
| Net income (loss) | $ | 732 |
| | $ | 340 |
| | $ | 2,463 |
| | $ | 653 |
| | $ | 1,991 |
| | $ | 6,232 |
| | $ | (8,826 | ) | | $ | 2,049 |
|
| Goodwill impairment charges | — |
| | — |
| | — |
| | — |
| | 581 |
| | — |
| | 2,603 |
| | — |
|
| Net income (loss), excluding goodwill impairment charges | $ | 732 |
| | $ | 340 |
| | $ | 2,463 |
| | $ | 653 |
| | $ | 2,572 |
| | $ | 6,232 |
| | $ | (6,223 | ) | | $ | 2,049 |
|
| Reconciliation of net income (loss) applicable to common shareholders to net income (loss) applicable to common shareholders, excluding goodwill impairment charges | |
| | |
| | |
| | |
| | |
| | |
| | |
| | |
|
| Net income (loss) applicable to common shareholders | $ | 367 |
| | $ | (33 | ) | | $ | 2,098 |
| | $ | 328 |
| | $ | 1,584 |
| | $ | 5,889 |
| | $ | (9,127 | ) | | $ | 1,739 |
|
| Goodwill impairment charges | — |
| | — |
| | — |
| | — |
| | 581 |
| | — |
| | 2,603 |
| | — |
|
| Net income (loss) applicable to common shareholders, excluding goodwill impairment charges | $ | 367 |
| | $ | (33 | ) | | $ | 2,098 |
| | $ | 328 |
| | $ | 2,165 |
| | $ | 5,889 |
| | $ | (6,524 | ) | | $ | 1,739 |
|
| Reconciliation of average common shareholders’ equity to average tangible common shareholders’ equity | |
| | |
| | |
| | |
| | |
| | |
| | |
| | |
|
| Common shareholders’ equity | $ | 219,744 |
| | $ | 217,273 |
| | $ | 216,782 |
| | $ | 214,150 |
| | $ | 209,324 |
| | $ | 204,928 |
| | $ | 218,505 |
| | $ | 214,206 |
|
| Goodwill | (69,976 | ) | | (69,976 | ) | | (69,976 | ) | | (69,967 | ) | | (70,647 | ) | | (71,070 | ) | | (73,748 | ) | | (73,922 | ) |
| Intangible assets (excluding MSRs) | (6,874 | ) | | (7,194 | ) | | (7,533 | ) | | (7,869 | ) | | (8,566 | ) | | (9,005 | ) | | (9,394 | ) | | (9,769 | ) |
| Related deferred tax liabilities | 2,490 |
| | 2,556 |
| | 2,626 |
| | 2,700 |
| | 2,775 |
| | 2,852 |
| | 2,932 |
| | 3,035 |
|
| Tangible common shareholders’ equity | $ | 145,384 |
| | $ | 142,659 |
| | $ | 141,899 |
| | $ | 139,014 |
| | $ | 132,886 |
| | $ | 127,705 |
| | $ | 138,295 |
| | $ | 133,550 |
|
| |
(1) | Presents reconciliations of non-GAAP financial measures to GAAP financial measures. We believe the use of these non-GAAP financial measures provides additional clarity in assessing the results of the Corporation. Other companies may define or calculate non-GAAP financialthese measures differently. For more information on non-GAAP financial measures and ratios we use in assessing the results of the Corporation, see Supplemental Financial Data on page 3835. |
| |
(2)
| Represents cost of funds, earnings credit and certain expenses related to intangibles. |
|
| | |
144148 Bank of America 20112012
| | |
|
| | | | | | | | | | | | | | | | | | | | | | | | | | | | | | | |
| | | | | | | | | | | | | | | | |
Table XVII Quarterly Reconciliations to GAAP Financial Measures (1) |
| | | | | | | | | | | | | | | | |
| | 2011 Quarters | | 2010 Quarters |
| (Dollars in millions, except per share information) | Fourth | | Third | | Second | | First | | Fourth | | Third | | Second | | First |
| Reconciliation of net interest income to net interest income on a fully taxable-equivalent basis | |
| | |
| | |
| | |
| | |
| | |
| | |
| | |
|
| Net interest income | $ | 10,701 |
| | $ | 10,490 |
| | $ | 11,246 |
| | $ | 12,179 |
| | $ | 12,439 |
| | $ | 12,435 |
| | $ | 12,900 |
| | $ | 13,749 |
|
| Fully taxable-equivalent adjustment | 258 |
| | 249 |
| | 247 |
| | 218 |
| | 270 |
| | 282 |
| | 297 |
| | 321 |
|
| Net interest income on a fully taxable-equivalent basis | $ | 10,959 |
| | $ | 10,739 |
| | $ | 11,493 |
| | $ | 12,397 |
| | $ | 12,709 |
| | $ | 12,717 |
| | $ | 13,197 |
| | $ | 14,070 |
|
| Reconciliation of total revenue, net of interest expense to total revenue, net of interest expense on a fully taxable-equivalent basis | |
| | |
| | |
| | |
| | |
| | |
| | |
| | |
|
| Total revenue, net of interest expense | $ | 24,888 |
| | $ | 28,453 |
| | $ | 13,236 |
| | $ | 26,877 |
| | $ | 22,398 |
| | $ | 26,700 |
| | $ | 29,153 |
| | $ | 31,969 |
|
| Fully taxable-equivalent adjustment | 258 |
| | 249 |
| | 247 |
| | 218 |
| | 270 |
| | 282 |
| | 297 |
| | 321 |
|
| Total revenue, net of interest expense on a fully taxable-equivalent basis | $ | 25,146 |
| | $ | 28,702 |
| | $ | 13,483 |
| | $ | 27,095 |
| | $ | 22,668 |
| | $ | 26,982 |
| | $ | 29,450 |
| | $ | 32,290 |
|
| Reconciliation of total noninterest expense to total noninterest expense, excluding goodwill impairment charges | |
| | |
| | |
| | |
| | |
| | |
| | |
| | |
|
| Total noninterest expense | $ | 19,522 |
| | $ | 17,613 |
| | $ | 22,856 |
| | $ | 20,283 |
| | $ | 20,864 |
| | $ | 27,216 |
| | $ | 17,253 |
| | $ | 17,775 |
|
| Goodwill impairment charges | (581 | ) | | — |
| | (2,603 | ) | | — |
| | (2,000 | ) | | (10,400 | ) | | — |
| | — |
|
| Total noninterest expense, excluding goodwill impairment charges | $ | 18,941 |
| | $ | 17,613 |
| | $ | 20,253 |
| | $ | 20,283 |
| | $ | 18,864 |
| | $ | 16,816 |
| | $ | 17,253 |
| | $ | 17,775 |
|
| Reconciliation of income tax expense (benefit) to income tax expense (benefit) on a fully taxable-equivalent basis | |
| | |
| | |
| | |
| | |
| | |
| | |
| | |
|
| Income tax expense (benefit) | $ | 441 |
| | $ | 1,201 |
| | $ | (4,049 | ) | | $ | 731 |
| | $ | (2,351 | ) | | $ | 1,387 |
| | $ | 672 |
| | $ | 1,207 |
|
| Fully taxable-equivalent adjustment | 258 |
| | 249 |
| | 247 |
| | 218 |
| | 270 |
| | 282 |
| | 297 |
| | 321 |
|
| Income tax expense (benefit) on a fully taxable-equivalent basis | $ | 699 |
| | $ | 1,450 |
| | $ | (3,802 | ) | | $ | 949 |
| | $ | (2,081 | ) | | $ | 1,669 |
| | $ | 969 |
| | $ | 1,528 |
|
| Reconciliation of net income (loss) to net income (loss), excluding goodwill impairment charges | |
| | |
| | |
| | |
| | |
| | |
| | |
| | |
|
| Net income (loss) | $ | 1,991 |
| | $ | 6,232 |
| | $ | (8,826 | ) | | $ | 2,049 |
| | $ | (1,244 | ) | | $ | (7,299 | ) | | $ | 3,123 |
| | $ | 3,182 |
|
| Goodwill impairment charges | 581 |
| | — |
| | 2,603 |
| | — |
| | 2,000 |
| | 10,400 |
| | — |
| | — |
|
| Net income (loss), excluding goodwill impairment charges | $ | 2,572 |
| | $ | 6,232 |
| | $ | (6,223 | ) | | $ | 2,049 |
| | $ | 756 |
| | $ | 3,101 |
| | $ | 3,123 |
| | $ | 3,182 |
|
| Reconciliation of net income (loss) applicable to common shareholders to net income (loss) applicable to common shareholders, excluding goodwill impairment charges | |
| | |
| | |
| | |
| | |
| | |
| | |
| | |
|
| Net income (loss) applicable to common shareholders | $ | 1,584 |
| | $ | 5,889 |
| | $ | (9,127 | ) | | $ | 1,739 |
| | $ | (1,565 | ) | | $ | (7,647 | ) | | $ | 2,783 |
| | $ | 2,834 |
|
| Goodwill impairment charges | 581 |
| | — |
| | 2,603 |
| | — |
| | 2,000 |
| | 10,400 |
| | — |
| | — |
|
| Net income (loss) applicable to common shareholders, excluding goodwill impairment charges | $ | 2,165 |
| | $ | 5,889 |
| | $ | (6,524 | ) | | $ | 1,739 |
| | $ | 435 |
| | $ | 2,753 |
| | $ | 2,783 |
| | $ | 2,834 |
|
| Reconciliation of average common shareholders’ equity to average tangible common shareholders’ equity | |
| | |
| | |
| | |
| | |
| | |
| | |
| | |
|
| Common shareholders’ equity | $ | 209,324 |
| | $ | 204,928 |
| | $ | 218,505 |
| | $ | 214,206 |
| | $ | 218,728 |
| | $ | 215,911 |
| | $ | 215,468 |
| | $ | 200,380 |
|
| Common Equivalent Securities | — |
| | — |
| | — |
| | — |
| | — |
| | — |
| | — |
| | 11,760 |
|
| Goodwill | (70,647 | ) | | (71,070 | ) | | (73,748 | ) | | (73,922 | ) | | (75,584 | ) | | (82,484 | ) | | (86,099 | ) | | (86,334 | ) |
| Intangible assets (excluding MSRs) | (8,566 | ) | | (9,005 | ) | | (9,394 | ) | | (9,769 | ) | | (10,211 | ) | | (10,629 | ) | | (11,216 | ) | | (11,906 | ) |
| Related deferred tax liabilities | 2,775 |
| | 2,852 |
| | 2,932 |
| | 3,035 |
| | 3,121 |
| | 3,214 |
| | 3,395 |
| | 3,497 |
|
| Tangible common shareholders’ equity | $ | 132,886 |
| | $ | 127,705 |
| | $ | 138,295 |
| | $ | 133,550 |
| | $ | 136,054 |
| | $ | 126,012 |
| | $ | 121,548 |
| | $ | 117,397 |
|
|
| | | | | | | | | | | | | | | | | | | | | | | | | | | | | | | |
| | | | | | | | | | | | | | | | |
Table XVII Quarterly Reconciliations to GAAP Financial Measures (1) (continued) |
| | | | | | | | | | | | | | | | |
| | 2012 Quarters | | 2011 Quarters |
| (Dollars in millions) | Fourth | | Third | | Second | | First | | Fourth | | Third | | Second | | First |
| Reconciliation of average shareholders’ equity to average tangible shareholders’ equity | |
| | |
| | |
| | |
| | |
| | |
| | |
| | |
|
| Shareholders’ equity | $ | 238,512 |
| | $ | 236,039 |
| | $ | 235,558 |
| | $ | 232,566 |
| | $ | 228,235 |
| | $ | 222,410 |
| | $ | 235,067 |
| | $ | 230,769 |
|
| Goodwill | (69,976 | ) | | (69,976 | ) | | (69,976 | ) | | (69,967 | ) | | (70,647 | ) | | (71,070 | ) | | (73,748 | ) | | (73,922 | ) |
| Intangible assets (excluding MSRs) | (6,874 | ) | | (7,194 | ) | | (7,533 | ) | | (7,869 | ) | | (8,566 | ) | | (9,005 | ) | | (9,394 | ) | | (9,769 | ) |
| Related deferred tax liabilities | 2,490 |
| | 2,556 |
| | 2,626 |
| | 2,700 |
| | 2,775 |
| | 2,852 |
| | 2,932 |
| | 3,035 |
|
| Tangible shareholders’ equity | $ | 164,152 |
| | $ | 161,425 |
| | $ | 160,675 |
| | $ | 157,430 |
| | $ | 151,797 |
| | $ | 145,187 |
| | $ | 154,857 |
| | $ | 150,113 |
|
| Reconciliation of period-end common shareholders’ equity to period-end tangible common shareholders’ equity | |
| | |
| | |
| | |
| | |
| | |
| | |
| | |
|
| Common shareholders’ equity | $ | 218,188 |
| | $ | 219,838 |
| | $ | 217,213 |
| | $ | 213,711 |
| | $ | 211,704 |
| | $ | 210,772 |
| | $ | 205,614 |
| | $ | 214,314 |
|
| Goodwill | (69,976 | ) | | (69,976 | ) | | (69,976 | ) | | (69,976 | ) | | (69,967 | ) | | (70,832 | ) | | (71,074 | ) | | (73,869 | ) |
| Intangible assets (excluding MSRs) | (6,684 | ) | | (7,030 | ) | | (7,335 | ) | | (7,696 | ) | | (8,021 | ) | | (8,764 | ) | | (9,176 | ) | | (9,560 | ) |
| Related deferred tax liabilities | 2,428 |
| | 2,494 |
| | 2,559 |
| | 2,628 |
| | 2,702 |
| | 2,777 |
| | 2,853 |
| | 2,933 |
|
| Tangible common shareholders’ equity | $ | 143,956 |
| | $ | 145,326 |
| | $ | 142,461 |
| | $ | 138,667 |
| | $ | 136,418 |
| | $ | 133,953 |
| | $ | 128,217 |
| | $ | 133,818 |
|
| Reconciliation of period-end shareholders’ equity to period-end tangible shareholders’ equity | |
| | |
| | |
| | |
| | |
| | |
| | |
| | |
|
| Shareholders’ equity | $ | 236,956 |
| | $ | 238,606 |
| | $ | 235,975 |
| | $ | 232,499 |
| | $ | 230,101 |
| | $ | 230,252 |
| | $ | 222,176 |
| | $ | 230,876 |
|
| Goodwill | (69,976 | ) | | (69,976 | ) | | (69,976 | ) | | (69,976 | ) | | (69,967 | ) | | (70,832 | ) | | (71,074 | ) | | (73,869 | ) |
| Intangible assets (excluding MSRs) | (6,684 | ) | | (7,030 | ) | | (7,335 | ) | | (7,696 | ) | | (8,021 | ) | | (8,764 | ) | | (9,176 | ) | | (9,560 | ) |
| Related deferred tax liabilities | 2,428 |
| | 2,494 |
| | 2,559 |
| | 2,628 |
| | 2,702 |
| | 2,777 |
| | 2,853 |
| | 2,933 |
|
| Tangible shareholders’ equity | $ | 162,724 |
| | $ | 164,094 |
| | $ | 161,223 |
| | $ | 157,455 |
| | $ | 154,815 |
| | $ | 153,433 |
| | $ | 144,779 |
| | $ | 150,380 |
|
| Reconciliation of period-end assets to period-end tangible assets | |
| | |
| | |
| | |
| | |
| | |
| | |
| | |
|
| Assets | $ | 2,209,974 |
| | $ | 2,166,162 |
| | $ | 2,160,854 |
| | $ | 2,181,449 |
| | $ | 2,129,046 |
| | $ | 2,219,628 |
| | $ | 2,261,319 |
| | $ | 2,274,532 |
|
| Goodwill | (69,976 | ) | | (69,976 | ) | | (69,976 | ) | | (69,976 | ) | | (69,967 | ) | | (70,832 | ) | | (71,074 | ) | | (73,869 | ) |
| Intangible assets (excluding MSRs) | (6,684 | ) | | (7,030 | ) | | (7,335 | ) | | (7,696 | ) | | (8,021 | ) | | (8,764 | ) | | (9,176 | ) | | (9,560 | ) |
| Related deferred tax liabilities | 2,428 |
| | 2,494 |
| | 2,559 |
| | 2,628 |
| | 2,702 |
| | 2,777 |
| | 2,853 |
| | 2,933 |
|
| Tangible assets | $ | 2,135,742 |
| | $ | 2,091,650 |
| | $ | 2,086,102 |
| | $ | 2,106,405 |
| | $ | 2,053,760 |
| | $ | 2,142,809 |
| | $ | 2,183,922 |
| | $ | 2,194,036 |
|
| |
(1)For footnote see page 148.
| Presents reconciliations of non-GAAP financial measures to GAAP financial measures. We believe the use of these non-GAAP financial measures provides additional clarity in assessing the results of the Corporation. Other companies may define or calculate non-GAAP financial measures differently. For more information on non-GAAP financial measures and ratios we use in assessing the results of the Corporation, see Supplemental Financial Data on page 38.
|
|
| | |
| | | Bank of America 2012 145149 |
|
| | | | | | | | | | | | | | | | | | | | | | | | | | | | | | | |
| | | | | | | | | | | | | | | | |
Table XVII Quarterly Reconciliations to GAAP Financial Measures (1) (continued) |
| | | | | | | | | | | | | | | | |
| | 2011 Quarters | | 2010 Quarters |
| (Dollars in millions, except per share information) | Fourth | | Third | | Second | | First | | Fourth | | Third | | Second | | First |
| Reconciliation of average shareholders’ equity to average tangible shareholders’ equity | |
| | |
| | |
| | |
| | |
| | |
| | |
| | |
|
| Shareholders’ equity | $ | 228,235 |
| | $ | 222,410 |
| | $ | 235,067 |
| | $ | 230,769 |
| | $ | 235,525 |
| | $ | 233,978 |
| | $ | 233,461 |
| | $ | 229,891 |
|
| Goodwill | (70,647 | ) | | (71,070 | ) | | (73,748 | ) | | (73,922 | ) | | (75,584 | ) | | (82,484 | ) | | (86,099 | ) | | (86,334 | ) |
| Intangible assets (excluding MSRs) | (8,566 | ) | | (9,005 | ) | | (9,394 | ) | | (9,769 | ) | | (10,211 | ) | | (10,629 | ) | | (11,216 | ) | | (11,906 | ) |
| Related deferred tax liabilities | 2,775 |
| | 2,852 |
| | 2,932 |
| | 3,035 |
| | 3,121 |
| | 3,214 |
| | 3,395 |
| | 3,497 |
|
| Tangible shareholders’ equity | $ | 151,797 |
| | $ | 145,187 |
| | $ | 154,857 |
| | $ | 150,113 |
| | $ | 152,851 |
| | $ | 144,079 |
| | $ | 139,541 |
| | $ | 135,148 |
|
| Reconciliation of period-end common shareholders’ equity to period-end tangible common shareholders’ equity | |
| | |
| | |
| | |
| | |
| | |
| | |
| | |
|
| Common shareholders’ equity | $ | 211,704 |
| | $ | 210,772 |
| | $ | 205,614 |
| | $ | 214,314 |
| | $ | 211,686 |
| | $ | 212,391 |
| | $ | 215,181 |
| | $ | 211,859 |
|
| Goodwill | (69,967 | ) | | (70,832 | ) | | (71,074 | ) | | (73,869 | ) | | (73,861 | ) | | (75,602 | ) | | (85,801 | ) | | (86,305 | ) |
| Intangible assets (excluding MSRs) | (8,021 | ) | | (8,764 | ) | | (9,176 | ) | | (9,560 | ) | | (9,923 | ) | | (10,402 | ) | | (10,796 | ) | | (11,548 | ) |
| Related deferred tax liabilities | 2,702 |
| | 2,777 |
| | 2,853 |
| | 2,933 |
| | 3,036 |
| | 3,123 |
| | 3,215 |
| | 3,396 |
|
| Tangible common shareholders’ equity | $ | 136,418 |
| | $ | 133,953 |
| | $ | 128,217 |
| | $ | 133,818 |
| | $ | 130,938 |
| | $ | 129,510 |
| | $ | 121,799 |
| | $ | 117,402 |
|
| Reconciliation of period-end shareholders’ equity to period-end tangible shareholders’ equity | |
| | |
| | |
| | |
| | |
| | |
| | |
| | |
|
| Shareholders’ equity | $ | 230,101 |
| | $ | 230,252 |
| | $ | 222,176 |
| | $ | 230,876 |
| | $ | 228,248 |
| | $ | 230,495 |
| | $ | 233,174 |
| | $ | 229,823 |
|
| Goodwill | (69,967 | ) | | (70,832 | ) | | (71,074 | ) | | (73,869 | ) | | (73,861 | ) | | (75,602 | ) | | (85,801 | ) | | (86,305 | ) |
| Intangible assets (excluding MSRs) | (8,021 | ) | | (8,764 | ) | | (9,176 | ) | | (9,560 | ) | | (9,923 | ) | | (10,402 | ) | | (10,796 | ) | | (11,548 | ) |
| Related deferred tax liabilities | 2,702 |
| | 2,777 |
| | 2,853 |
| | 2,933 |
| | 3,036 |
| | 3,123 |
| | 3,215 |
| | 3,396 |
|
| Tangible shareholders’ equity | $ | 154,815 |
| | $ | 153,433 |
| | $ | 144,779 |
| | $ | 150,380 |
| | $ | 147,500 |
| | $ | 147,614 |
| | $ | 139,792 |
| | $ | 135,366 |
|
| Reconciliation of period-end assets to period-end tangible assets | |
| | |
| | |
| | |
| | |
| | |
| | |
| | |
|
| Assets | $ | 2,129,046 |
| | $ | 2,219,628 |
| | $ | 2,261,319 |
| | $ | 2,274,532 |
| | $ | 2,264,909 |
| | $ | 2,339,660 |
| | $ | 2,368,384 |
| | $ | 2,344,634 |
|
| Goodwill | (69,967 | ) | | (70,832 | ) | | (71,074 | ) | | (73,869 | ) | | (73,861 | ) | | (75,602 | ) | | (85,801 | ) | | (86,305 | ) |
| Intangible assets (excluding MSRs) | (8,021 | ) | | (8,764 | ) | | (9,176 | ) | | (9,560 | ) | | (9,923 | ) | | (10,402 | ) | | (10,796 | ) | | (11,548 | ) |
| Related deferred tax liabilities | 2,702 |
| | 2,777 |
| | 2,853 |
| | 2,933 |
| | 3,036 |
| | 3,123 |
| | 3,215 |
| | 3,396 |
|
| Tangible assets | $ | 2,053,760 |
| | $ | 2,142,809 |
| | $ | 2,183,922 |
| | $ | 2,194,036 |
| | $ | 2,184,161 |
| | $ | 2,256,779 |
| | $ | 2,275,002 |
| | $ | 2,250,177 |
|
For footnotes see page 145.
Glossary
Alt-A Mortgage– A type of U.S. mortgage that, for various reasons, is considered riskier than A-paper, or “prime,” and less risky than “subprime,” the riskiest category. Alt-A interest rates, which are determined by credit risk, therefore tend to be between those of prime and subprime home loans. Typically, Alt-A mortgages are characterized by borrowers with less than full documentation, lower credit scores and higher LTVs.
Assets in Custody – Consist largely of custodial and non-discretionary trust assets excluding brokerage assets administered for clients. Trust assets encompass a broad range of asset types including real estate, private company ownership interest, personal property and investments.
Assets Under Management (AUM) – The total market value of assets under the investment advisory and discretion of GWIM which generate asset management fees based on a percentage of the assets’ market values. AUM reflects assets that are generally managed for institutional, high net-worth and retail clients, and are distributed through various investment products including mutual funds, other commingled vehicles and separate accounts.
Carrying Value (with respect to loans) – The amount at which a loan is recorded on the balance sheet. For loans recorded at amortized cost, carrying value is the unpaid principal balance net of unamortized deferred loan origination fees and costs, and unamortized purchase premium or discount. For loans that are or have been on nonaccrual status, the carrying value is also reduced by any net charge-offs that have been recorded and the amount of interest payments applied as a reduction of principal under the cost recovery method. For PCI loans, the carrying value equals fair value upon acquisition adjusted for subsequent cash collections and yield accreted to date. For credit card loans, the carrying value also includes interest that has been billed to the customer. For loans classified as held-for-sale, carrying value is the lower of carrying value as described in the sentences above, or fair value. For loans for which we have elected the fair value option, the carrying value is fair value.
Client Brokerage Assets – Include client assets which are held in brokerage accounts. This includes non-discretionary brokerage and fee-based assets which generate brokerage income and asset management fee revenue.
Committed Credit Exposure – Includes any funded portion of a facility plus the unfunded portion of a facility on which the lender is legally bound to advance funds during a specified period under prescribed conditions.
Core Net Interest Income– Net interest income on a FTE basis excluding the impact of market-based activities.
Credit Card Accountability Responsibility and Disclosure Act of 2009 (CARD Act)– Legislation signed into law on May 22, 2009 that changes credit card industry practices including significantly restricting credit card issuers’ ability to change interest rates and assess fees to reflect individual consumer risk, changes the way payments are applied and changes consumer credit card
disclosures. The majority of the provisions became effective on February 22, 2010, while certain provisions became effective in the third quarter of 2010.
Credit Derivatives – Contractual agreements that provide protection against a credit event on one or more referenced obligations. The nature of a credit event is established by the protection purchaser and protection seller at the inception of the transaction, and such events generally include bankruptcy or insolvency of the referenced credit entity, failure to meet payment obligations when due, as well as acceleration of indebtedness and payment repudiation or moratorium. The purchaser of the credit
derivative pays a periodic fee in return for a payment by the protection seller upon the occurrence, if any, of such a credit event. A credit default swap is a type of a credit derivative.
Credit Valuation Adjustment (CVA) – A portfolio adjustment required to properly reflect the counterparty credit risk exposure as part of the fair value of derivative instruments.
Debit Valuation Adjustment (DVA)– A portfolio adjustment required to properly reflect the Corporation’s own credit risk exposure as part of the fair value of derivative instruments.
Interest Rate Lock Commitment (IRLC) – Commitment with a loan applicant in which the loan terms, including interest rate and price, are guaranteed for a designated period of time subject to credit approval.
Letter of Credit – A document issued on behalf of a customer to a third party promising to pay the third party upon presentation of specified documents. A letter of credit effectively substitutes the issuer’s credit for that of the customer.
Loan-to-value (LTV) – A commonly used credit quality metric that is reported in terms of ending and average LTV. Ending LTV is calculated as the outstanding carrying value of the loan at the end of the period divided by the estimated value of the property securing the loan. Estimated property values are primarily determined by utilizing the Case-Schiller Home Index, a widely used index based on data from repeat sales of single family homes. Case-Schiller indices are updated quarterly and are reported on a three-month or one-quarter lag. An additional metric related to LTV iscombined loan-to-value (CLTV)which is similar to the LTV metric, yet combines the outstanding balance on the residential mortgage loan and the outstanding carrying value on the home equity loan or available line of credit, both of which are secured by the same property, divided by the estimated value of the property. A LTV of 100 percent reflects a loan that is currently secured by a property valued at an amount exactly equal to the carrying value or available line of the loan. Under certain circumstances, estimated values can also be determined by utilizing an automated valuation method (AVM) or Mortgage Risk Assessment Corporation (MRAC) index. An AVM is a tool that estimates the value of a property by reference to large volumes of market data including sales of comparable properties and price trends specific to the MSA in which the property being valued is located. The MRAC index is similar to the Case-Schiller Home Index in that it is an index that is based on data from repeat sales of single family homes and is reported on a lag.
Margin Receivables– An extension of credit secured by eligible securities in certain brokerage accounts.
Mortgage Servicing Right (MSR) – The right to service a mortgage loan when the underlying loan is sold or securitized. Servicing includes collections for principal, interest and escrow payments from borrowers and accounting for and remitting principal and interest payments to investors.
|
| | |
150 Bank of America 2012 | | Bank of America147
|
Net Interest Yield – Net interest income divided by average total interest-earning assets.
Nonperforming Loans and Leases – Includes loans and leases that have been placed on nonaccrual status, including nonaccruing loans whose contractual terms have been restructured in a manner that grants a concession to a borrower experiencing financial difficulties (TDRs). Loans accounted for under the fair value option, PCI loans and LHFS are not reported as nonperforming loans and leases. Consumer credit card loans, business card loans, consumer loans not secured by real estate,personal property (except for certain secured consumer loans, including those that have been modified in a troubled debt restructuring), and consumer loans secured by real estate which include loansthat are insured by the FHA and individually insuredor through long-term credit protection agreements with FNMA and FHLMC (fully-insured loan portfolio), are not placed on nonaccrual status and are, therefore, not reported as nonperforming loans and leases.
Purchased Credit-impaired (PCI) Loan – A loan purchased as an individual loan, in a portfolio of loans or in a business combination with evidence of deterioration in credit quality since origination for which it is probable, upon acquisition, that the investor will be unable to collect all contractually required payments. These loans are recorded at fair value upon acquisition.
Subprime Loans – Although a standard industry definition for subprime loans (including subprime mortgage loans) does not exist, the Corporation defines subprime loans as specific product offerings for higher risk borrowers, including individuals with one or a combination of high credit risk factors, such as low FICO scores, high debt to income ratios and inferior payment history.
Super Senior CDO Exposure– Represents the most senior class of commercial paper or notes that are issued by CDO vehicles. These financial instruments benefit from the subordination of all other securities, including AAA-rated securities, issued by CDO vehicles.
Tier 1 Common Capital – Tier 1 capital including any CES, less preferred stock, qualifying trust preferred securities, hybrid securities and qualifying noncontrolling interest in subsidiaries.
Troubled Debt Restructurings (TDRs) – Loans whose contractual terms have been restructured in a manner that grants a concession to a borrower experiencing financial difficulties. Certain consumer loans for which a binding offer to restructure has been extended are also classified as TDRs. Concessions could include a reduction in the interest rate to a rate that is below market on the loan, payment extensions, forgiveness of principal, forbearance, loans discharged in bankruptcy or other actions intended to maximize collection. Secured consumer loans that have been discharged in Chapter 7 bankruptcy and have not been reaffirmed by the borrower are classified as TDRs at the time of discharge from bankruptcy. TDRs are generally reported as nonperforming loans and leases while on nonaccrual status. Nonperforming TDRs may be returned to accrual status when, among other criteria, payment in full of all amounts due under the restructured terms is expected and the borrower has demonstrated a sustained period of repayment performance, typically six months. TDRs that are on accrual status are reported as performing TDRs through the end of the calendar year in which the restructuring occurred or the year in which they are returned to accrual status. In addition, if accruing TDRs bear less than a market rate of interest at the time of modification, they are reported as performing TDRs throughout their remaining lives unless and until they cease to perform in accordance with their modified contractual terms, at which time they would be placed on nonaccrual status and reported as nonperforming TDRs.
Value-at-Risk (VaR) – VaR is a model that simulates the value of a portfolio under a range of hypothetical scenarios in order to generate a distribution of potential gains and losses. VaR represents the worst loss athe portfolio is expected to experience with a given confidence level based on historical trends with a given level of confidence, and depends on the volatility of the positions in the portfolio and on how strongly their risks are correlated.data. A VaR model is an effective tool in estimating ranges of potential gains and losses on our trading portfolios and is a key statistic used to measure and manage market risk.portfolios.
|
| | |
| | 148Bank of America 20112012151
| | |
Acronyms
|
| |
| ABS | Asset-backed securities |
| AFS | Available-for-sale |
| ALM | Asset and liability management |
| ALMRC | Asset Liability Market Risk Committee |
| ARM | Adjustable-rate mortgage |
| BHC | Bank holding company |
| CDO | Collateralized debt obligation |
| CLO | Collateralized loan obligation |
| CES | Common Equivalent Securities |
| CMBS | Commercial mortgage-backed securities |
| CORC | Compliance and Operational Risk Committee |
| CRA | Community Reinvestment Act |
| CRC | Credit Risk Committee |
DVA | Debit valuation adjustment |
| EAD | Exposure at default |
| EU | European Union |
| FDIC | Federal Deposit Insurance Corporation |
| FFIEC | Federal Financial Institutions Examination Council |
| FHA | Federal Housing Administration |
| FHFA | Federal Housing Finance Agency |
| FHLMC | Freddie Mac |
| FICC | Fixed income, currencies and commodities |
| FICO | Fair Isaac Corporation (credit score) |
| FNMA | Fannie Mae |
| FTE | Fully taxable-equivalent |
| GAAP | Accounting principles generally accepted in the United States of America |
| GNMA | Government National Mortgage Association |
GRCGMRC | Global Markets Risk Committee |
| GSE | Government-sponsored enterprise |
| HELOC | Home equity lines of credit |
| HFI | Held-for-investment |
HPI | Home Price Index |
| HUD | U.S. Department of Housing and Urban Development |
| IPO | Initial public offering |
| LCR | Liquidity Coverage Ratiocoverage ratio |
| LGD | Loss given default |
| LHFS | Loans held-for-sale |
| LIBOR | London InterBank Offered Rate |
| MBS | Mortgage-backed securities |
| MD&A | Management’s Discussion and Analysis of Financial Condition and Results of Operations |
| MI | Mortgage Insuranceinsurance |
| MSA | Metropolitan statistical area |
| NSFR | Net Stable Funding Ratiostable funding ratio |
| OCC | Office of the Comptroller of the Currency |
| OCI | Other comprehensive income |
ORC | Operational Risk Committee |
| OTC | Over-the-counter |
| OTTI | Other-than-temporary impairment |
| PPI | Payment protection insurance |
| RMBS | Residential mortgage-backed securities |
| ROTE | Return on average tangible shareholders’ equity |
| SBLCs | Standby letters of credit |
| SEC | Securities and Exchange Commission |
| TLGP | Temporary Liquidity Guarantee Program |
| VA | U.S. Department of Veterans Affairs |
|
| | |
152 Bank of America 2012 | | Bank of America149
|
Item 7A. Quantitative and Qualitative Disclosures About Market Risk
See Market Risk Management on page 112113 in the MD&A and the sections referenced therein for Quantitative and Qualitative Disclosures about Market Risk.
Item 8. Financial Statements and Supplementary Data
|
| | |
| | | |
| Table of Contents | | |
| | | Page |
| | |
Consolidated Balance Sheet | | |
Consolidated Statement of Changes in Shareholders’ Equity | | |
| | |
| | |
| | |
| | |
| | |
| | |
Note 3 – Trading Account Assets and Liabilities | | |
| | |
| | |
Note 6 – Outstanding Loans and Leases | | |
| | |
| | |
| | |
| | |
| | |
| | |
| | |
| | |
| | |
| | |
Note 16 – Accumulated Other Comprehensive Income | | |
Note 17 – Earnings Per Common Share | | |
| | |
| | |
| | |
| | |
| | |
Note 21 – Income Taxes | | |
Note 22 – Fair Value Measurements | | |
| | |
| | |
| | |
| | |
Note 25 – Mortgage Servicing Rights | | |
Note 26 – Business Segment Information | | |
Note 27 – Parent Company Information | | |
| | |
| | |
| | |
| | |
| | |
|
| | |
| | 150Bank of America 20112012153
| | |
Report of Management on Internal Control Over Financial Reporting
The management of Bank of America Corporation is responsible for establishing and maintaining adequate internal control over financial reporting.
The Corporation’s internal control over financial reporting is a process designed to provide reasonable assurance regarding the reliability of financial reporting and the preparation of financial statements for external purposes in accordance with accounting principles generally accepted in the United States of America. The Corporation’s internal control over financial reporting includes those policies and procedures that (i) pertain to the maintenance of records that, in reasonable detail, accurately and fairly reflect the transactions and dispositions of the assets of the Corporation; (ii) provide reasonable assurance that transactions are recorded as necessary to permit preparation of financial statements in accordance with accounting principles generally accepted in the United States of America, and that receipts and expenditures of the Corporation are being made only in accordance with authorizations of management and directors of the Corporation; and (iii) provide reasonable assurance regarding prevention or timely detection of unauthorized acquisition, use, or disposition of the Corporation’s assets that could have a material effect on the financial statements.
Because of its inherent limitations, internal control over financial reporting may not prevent or detect misstatements. Also, projections of any evaluation of effectiveness to future periods are subject to the risk that controls may become inadequate because of changes in conditions, or that the degree of compliance with the policies or procedures may deteriorate.
Management assessed the effectiveness of the Corporation’s internal control over financial reporting as of December 31, 20112012 based on the framework set forth by the Committee of Sponsoring Organizations of the Treadway Commission in Internal Control – Integrated Framework. Based on that assessment, management concluded that, as of December 31, 20112012, the Corporation’s internal control over financial reporting is effective based on the criteria established in Internal Control – Integrated Framework.
The Corporation’s internal control over financial reporting as of December 31, 20112012 has been audited by PricewaterhouseCoopers, LLP, an independent registered public accounting firm, as stated in their accompanying report which expresses an unqualified opinion on the effectiveness of the Corporation’s internal control over financial reporting as of December 31, 20112012.
Brian T. Moynihan
Chief Executive Officer and President
Bruce R. Thompson
Chief Financial Officer
|
| | |
154 Bank of America 2012 | | Bank of America151
|
Report of Independent Registered Public Accounting Firm
To the Board of Directors and Shareholders of Bank of America Corporation:
In our opinion, the accompanying Consolidated Balance Sheet and the related Consolidated Statement of Income, Consolidated Statement of Comprehensive Income, Consolidated Statement of Changes in Shareholders’ Equity and Consolidated Statement of Cash Flows present fairly, in all material respects, the financial position of Bank of America Corporation and its subsidiaries at December 31, 20112012 and 20102011, and the results of their operations and their cash flows for each of the three years in the period ended December 31, 20112012 in conformity with accounting principles generally accepted in the United States of America. Also in our opinion, the Corporation maintained, in all material respects, effective internal control over financial reporting as of December 31, 20112012, based on criteria established in Internal Control – Integrated Framework issued by the Committee of Sponsoring Organizations of the Treadway Commission (COSO). The Corporation’s management is responsible for these financial statements, for maintaining effective internal control over financial reporting and for its assessment of the effectiveness of internal control over financial reporting, included in the accompanying Report of Management on Internal Control Over Financial Reporting. Our responsibility is to express opinions on these financial statements and on the Corporation’s internal control over financial reporting based on our integrated audits. We conducted our audits in accordance with the standards of the Public Company Accounting Oversight Board (United States). Those standards require that we plan and perform the audits to obtain reasonable assurance about whether the financial statements are free of material misstatement and whether effective internal control over financial reporting was maintained in all material respects. Our audits of the financial statements included examining, on a test basis, evidence supporting the amounts and disclosures in the financial statements, assessing the accounting principles used and significant estimates made by management, and evaluating the overall financial statement presentation. Our audit of internal control over financial reporting included obtaining an
understanding of internal control over financial reporting, assessing the risk that a material weakness exists, and testing and evaluating the design and operating effectiveness of internal control based on the assessed risk. Our audits also included performing such other procedures as we considered necessary in the circumstances. We believe that our audits provide a reasonable basis for our opinions.
A company’s internal control over financial reporting is a process designed to provide reasonable assurance regarding the reliability of financial reporting and the preparation of financial statements for external purposes in accordance with generally accepted accounting principles. A company’s internal control over financial reporting includes those policies and procedures that (i) pertain to the maintenance of records that, in reasonable detail, accurately and fairly reflect the transactions and dispositions of the assets of the company; (ii) provide reasonable assurance that transactions are recorded as necessary to permit preparation of financial statements in accordance with generally accepted accounting principles, and that receipts and expenditures of the company are being made only in accordance with authorizations of management and directors of the company; and (iii) provide reasonable assurance regarding prevention or timely detection of unauthorized acquisition, use, or disposition of the company’s assets that could have a material effect on the financial statements.
Because of its inherent limitations, internal control over financial reporting may not prevent or detect misstatements. Also, projections of any evaluation of effectiveness to future periods are subject to the risk that controls may become inadequate because of changes in conditions, or that the degree of compliance with the policies or procedures may deteriorate.
Charlotte, North Carolina
February 23, 201228, 2013
|
| | |
| | 152Bank of America 20112012155
| | |
Bank of America Corporation and Subsidiaries | | | | | | | | | | | | | |
Consolidated Statement of Income | | | | | | | | | | | | |
| (Dollars in millions, except per share information) | 2011 | | 2010 | | 2009 | 2012 | | 2011 | | 2010 |
| Interest income | |
| | |
| | |
| |
| | |
| | |
|
| Loans and leases | $ | 44,966 |
| | $ | 50,996 |
| | $ | 48,703 |
| $ | 38,880 |
| | $ | 44,966 |
| | $ | 50,996 |
|
| Debt securities | 9,521 |
| | 11,667 |
| | 12,947 |
| 8,776 |
| | 9,521 |
| | 11,667 |
|
| Federal funds sold and securities borrowed or purchased under agreements to resell | 2,147 |
| | 1,832 |
| | 2,894 |
| 1,502 |
| | 2,147 |
| | 1,832 |
|
| Trading account assets | 5,961 |
| | 6,841 |
| | 7,944 |
| 5,094 |
| | 5,961 |
| | 6,841 |
|
| Other interest income | 3,641 |
| | 4,161 |
| | 5,428 |
| 3,148 |
| | 3,641 |
| | 4,161 |
|
| Total interest income | 66,236 |
| | 75,497 |
| | 77,916 |
| 57,400 |
| | 66,236 |
| | 75,497 |
|
| | | | | | | | | | | |
| Interest expense | |
| | |
| | |
| |
| | |
| | |
|
| Deposits | 3,002 |
| | 3,997 |
| | 7,807 |
| 1,990 |
| | 3,002 |
| | 3,997 |
|
| Short-term borrowings | 4,599 |
| | 3,699 |
| | 5,512 |
| 3,572 |
| | 4,599 |
| | 3,699 |
|
| Trading account liabilities | 2,212 |
| | 2,571 |
| | 2,075 |
| 1,763 |
| | 2,212 |
| | 2,571 |
|
| Long-term debt | 11,807 |
| | 13,707 |
| | 15,413 |
| 9,419 |
| | 11,807 |
| | 13,707 |
|
| Total interest expense | 21,620 |
| | 23,974 |
| | 30,807 |
| 16,744 |
| | 21,620 |
| | 23,974 |
|
| Net interest income | 44,616 |
| | 51,523 |
| | 47,109 |
| 40,656 |
| | 44,616 |
| | 51,523 |
|
| | | | | | | | | | | |
| Noninterest income | |
| | |
| | |
| |
| | |
| | |
|
| Card income | 7,184 |
| | 8,108 |
| | 8,353 |
| 6,121 |
| | 7,184 |
| | 8,108 |
|
| Service charges | 8,094 |
| | 9,390 |
| | 11,038 |
| 7,600 |
| | 8,094 |
| | 9,390 |
|
| Investment and brokerage services | 11,826 |
| | 11,622 |
| | 11,919 |
| 11,393 |
| | 11,826 |
| | 11,622 |
|
| Investment banking income | 5,217 |
| | 5,520 |
| | 5,551 |
| 5,299 |
| | 5,217 |
| | 5,520 |
|
| Equity investment income | 7,360 |
| | 5,260 |
| | 10,014 |
| 2,070 |
| | 7,360 |
| | 5,260 |
|
| Trading account profits | 6,697 |
| | 10,054 |
| | 12,235 |
| 5,870 |
| | 6,697 |
| | 10,054 |
|
| Mortgage banking income (loss) | (8,830 | ) | | 2,734 |
| | 8,791 |
| 4,750 |
| | (8,830 | ) | | 2,734 |
|
| Insurance income | 1,346 |
| | 2,066 |
| | 2,760 |
| |
| Insurance income (loss) | | (195 | ) | | 1,346 |
| | 2,066 |
|
| Gains on sales of debt securities | 3,374 |
| | 2,526 |
| | 4,723 |
| 1,662 |
| | 3,374 |
| | 2,526 |
|
| Other income (loss) | 6,869 |
| | 2,384 |
| | (14 | ) | (1,839 | ) | | 6,869 |
| | 2,384 |
|
| Other-than-temporary impairment losses on available-for-sale debt securities: | |
| | |
| | |
| |
| | |
| | |
|
| Total other-than-temporary impairment losses | (360 | ) | | (2,174 | ) | | (3,508 | ) | (57 | ) | | (360 | ) | | (2,174 | ) |
| Less: Portion of other-than-temporary impairment losses recognized in other comprehensive income | 61 |
| | 1,207 |
| | 672 |
| 4 |
| | 61 |
| | 1,207 |
|
| Net impairment losses recognized in earnings on available-for-sale debt securities | (299 | ) | | (967 | ) | | (2,836 | ) | (53 | ) | | (299 | ) | | (967 | ) |
| Total noninterest income | 48,838 |
| | 58,697 |
| | 72,534 |
| 42,678 |
| | 48,838 |
| | 58,697 |
|
| Total revenue, net of interest expense | 93,454 |
| | 110,220 |
| | 119,643 |
| 83,334 |
| | 93,454 |
| | 110,220 |
|
| | | | | | | | | | | |
| Provision for credit losses | 13,410 |
| | 28,435 |
| | 48,570 |
| 8,169 |
| | 13,410 |
| | 28,435 |
|
| | | | | | | | | | | |
| Noninterest expense | |
| | |
| | | |
| | |
| | |
| Personnel | 36,965 |
| | 35,149 |
| | 31,528 |
| 35,648 |
| | 36,965 |
| | 35,149 |
|
| Occupancy | 4,748 |
| | 4,716 |
| | 4,906 |
| 4,570 |
| | 4,748 |
| | 4,716 |
|
| Equipment | 2,340 |
| | 2,452 |
| | 2,455 |
| 2,269 |
| | 2,340 |
| | 2,452 |
|
| Marketing | 2,203 |
| | 1,963 |
| | 1,933 |
| 1,873 |
| | 2,203 |
| | 1,963 |
|
| Professional fees | 3,381 |
| | 2,695 |
| | 2,281 |
| 3,574 |
| | 3,381 |
| | 2,695 |
|
| Amortization of intangibles | 1,509 |
| | 1,731 |
| | 1,978 |
| 1,264 |
| | 1,509 |
| | 1,731 |
|
| Data processing | 2,652 |
| | 2,544 |
| | 2,500 |
| 2,961 |
| | 2,652 |
| | 2,544 |
|
| Telecommunications | 1,553 |
| | 1,416 |
| | 1,420 |
| 1,660 |
| | 1,553 |
| | 1,416 |
|
| Other general operating | 21,101 |
| | 16,222 |
| | 14,991 |
| 18,274 |
| | 21,101 |
| | 16,222 |
|
| Goodwill impairment | 3,184 |
| | 12,400 |
| | — |
| — |
| | 3,184 |
| | 12,400 |
|
| Merger and restructuring charges | 638 |
| | 1,820 |
| | 2,721 |
| — |
| | 638 |
| | 1,820 |
|
| Total noninterest expense | 80,274 |
| | 83,108 |
| | 66,713 |
| 72,093 |
| | 80,274 |
| | 83,108 |
|
| Income (loss) before income taxes | (230 | ) | | (1,323 | ) | | 4,360 |
| 3,072 |
| | (230 | ) | | (1,323 | ) |
| Income tax expense (benefit) | (1,676 | ) | | 915 |
| | (1,916 | ) | (1,116 | ) | | (1,676 | ) | | 915 |
|
| Net income (loss) | $ | 1,446 |
| | $ | (2,238 | ) | | $ | 6,276 |
| $ | 4,188 |
| | $ | 1,446 |
| | $ | (2,238 | ) |
| Preferred stock dividends and accretion | 1,361 |
| | 1,357 |
| | 8,480 |
| |
| Preferred stock dividends | | 1,428 |
| | 1,361 |
| | 1,357 |
|
| Net income (loss) applicable to common shareholders | $ | 85 |
| | $ | (3,595 | ) | | $ | (2,204 | ) | $ | 2,760 |
| | $ | 85 |
| | $ | (3,595 | ) |
| | | | | | | | | | | |
| Per common share information | |
| | |
| | |
| |
| | |
| | |
|
| Earnings (loss) | $ | 0.01 |
| | $ | (0.37 | ) | | $ | (0.29 | ) | $ | 0.26 |
| | $ | 0.01 |
| | $ | (0.37 | ) |
| Diluted earnings (loss) | 0.01 |
| | (0.37 | ) | | (0.29 | ) | 0.25 |
| | 0.01 |
| | (0.37 | ) |
| Dividends paid | 0.04 |
| | 0.04 |
| | 0.04 |
| 0.04 |
| | 0.04 |
| | 0.04 |
|
| Average common shares issued and outstanding (in thousands) | 10,142,625 |
| | 9,790,472 |
| | 7,728,570 |
| 10,746,028 |
| | 10,142,625 |
| | 9,790,472 |
|
| Average diluted common shares issued and outstanding (in thousands) | 10,254,824 |
| | 9,790,472 |
| | 7,728,570 |
| 10,840,854 |
| | 10,254,824 |
| | 9,790,472 |
|
See accompanying Notes to Consolidated Financial Statements.
|
| | |
156 Bank of America 2012 | | Bank of America153
|
Bank of America Corporation and Subsidiaries
|
| | | | | | | |
| | | | |
| Consolidated Balance Sheet |
| | |
| | December 31 |
| (Dollars in millions) | 2011 | | 2010 |
| Assets | |
| | |
|
| Cash and cash equivalents | $ | 120,102 |
| | $ | 108,427 |
|
| Time deposits placed and other short-term investments | 26,004 |
| | 26,433 |
|
Federal funds sold and securities borrowed or purchased under agreements to resell (includes $87,453 and $78,599 measured at fair value) | 211,183 |
| | 209,616 |
|
Trading account assets (includes $80,130 and $89,165 pledged as collateral) | 169,319 |
| | 194,671 |
|
Derivative assets (includes $58,891 and $58,297 pledged as collateral) | 73,023 |
| | 73,000 |
|
| Debt securities: | |
| | |
|
Available-for-sale (includes $69,021 and $99,925 pledged as collateral) | 276,151 |
| | 337,627 |
|
Held-to-maturity, at cost (fair value - $35,442 and $427; $24,009 pledged as collateral in 2011) | 35,265 |
| | 427 |
|
| Total debt securities | 311,416 |
| | 338,054 |
|
Loans and leases (includes $8,804 and $3,321 measured at fair value and $73,463 and $91,730 pledged as collateral) | 926,200 |
| | 940,440 |
|
| Allowance for loan and lease losses | (33,783 | ) | | (41,885 | ) |
| Loans and leases, net of allowance | 892,417 |
| | 898,555 |
|
| Premises and equipment, net | 13,637 |
| | 14,306 |
|
Mortgage servicing rights (includes $7,378 and $14,900 measured at fair value) | 7,510 |
| | 15,177 |
|
| Goodwill | 69,967 |
| | 73,861 |
|
| Intangible assets | 8,021 |
| | 9,923 |
|
Loans held-for-sale (includes $7,630 and $25,942 measured at fair value) | 13,762 |
| | 35,058 |
|
| Customer and other receivables | 66,999 |
| | 85,704 |
|
Other assets (includes $37,084 and $70,531 measured at fair value) | 145,686 |
| | 182,124 |
|
| Total assets | $ | 2,129,046 |
| | $ | 2,264,909 |
|
| | | | |
| | | | |
| | | | |
| Assets of consolidated VIEs included in total assets above (substantially all pledged as collateral) | |
| | |
|
| Trading account assets | $ | 8,595 |
| | $ | 19,627 |
|
| Derivative assets | 1,634 |
| | 2,027 |
|
| Available-for-sale debt securities | — |
| | 2,601 |
|
| Loans and leases | 140,194 |
| | 145,469 |
|
| Allowance for loan and lease losses | (5,066 | ) | | (8,935 | ) |
| Loans and leases, net of allowance | 135,128 |
| | 136,534 |
|
| Loans held-for-sale | 1,635 |
| | 1,953 |
|
| All other assets | 4,769 |
| | 7,086 |
|
| Total assets of consolidated VIEs | $ | 151,761 |
| | $ | 169,828 |
|
|
| | | | | | | | | | | |
| | | | | | |
| Consolidated Statement of Comprehensive Income |
| | | | | | |
| (Dollars in millions) | 2012 | | 2011 | | 2010 |
| Net income (loss) | $ | 4,188 |
| | $ | 1,446 |
| | $ | (2,238 | ) |
| Other comprehensive income, net-of-tax: | | | | | |
| Net change in available-for-sale debt and marketable equity securities | 1,802 |
| | (4,270 | ) | | 5,872 |
|
| Net change in derivatives | 916 |
| | (549 | ) | | (701 | ) |
| Employee benefit plan adjustments | (65 | ) | | (444 | ) | | 145 |
|
| Net change in foreign currency translation adjustments | (13 | ) | | (108 | ) | | 237 |
|
| Other comprehensive income (loss) | 2,640 |
| | (5,371 | ) | | 5,553 |
|
| Comprehensive income (loss) | $ | 6,828 |
| | $ | (3,925 | ) | | $ | 3,315 |
|
See accompanying Notes to Consolidated Financial Statements.
Bank of America Corporation and Subsidiaries
|
| | | | | | | |
| | | | |
| Consolidated Balance Sheet (continued) |
| | |
| | December 31 |
| (Dollars in millions) | 2011 | | 2010 |
| Liabilities | |
| | |
|
| Deposits in U.S. offices: | |
| | |
|
| Noninterest-bearing | $ | 332,228 |
| | $ | 285,200 |
|
Interest-bearing (includes $3,297 and $2,732 measured at fair value) | 624,814 |
| | 645,713 |
|
| Deposits in non-U.S. offices: | | | |
|
| Noninterest-bearing | 6,839 |
| | 6,101 |
|
| Interest-bearing | 69,160 |
| | 73,416 |
|
| Total deposits | 1,033,041 |
| | 1,010,430 |
|
Federal funds purchased and securities loaned or sold under agreements to repurchase (includes $34,235 and $37,424 measured at fair value) | 214,864 |
| | 245,359 |
|
| Trading account liabilities | 60,508 |
| | 71,985 |
|
| Derivative liabilities | 59,520 |
| | 55,914 |
|
Commercial paper and other short-term borrowings (includes $6,558 and $7,178 measured at fair value) | 35,698 |
| | 59,962 |
|
Accrued expenses and other liabilities (includes $15,743 and $33,229 measured at fair value and $714 and $1,188 of reserve for unfunded lending commitments) | 123,049 |
| | 144,580 |
|
Long-term debt (includes $46,239 and $50,984 measured at fair value) | 372,265 |
| | 448,431 |
|
| Total liabilities | 1,898,945 |
| | 2,036,661 |
|
Commitments and contingencies (Note 8 – Securitizations and Other Variable Interest Entities, Note 9 – Representations and Warranties Obligations and Corporate Guarantees and Note 14 – Commitments and Contingencies) |
|
| |
|
|
| Shareholders’ equity | |
| | |
|
Preferred stock, $0.01 par value; authorized – 100,000,000 shares; issued and outstanding – 3,689,084 and 3,943,660 shares | 18,397 |
| | 16,562 |
|
Common stock and additional paid-in capital, $0.01 par value; authorized – 12,800,000,000 shares; issued and outstanding – 10,535,937,957 and 10,085,154,806 shares | 156,621 |
| | 150,905 |
|
| Retained earnings | 60,520 |
| | 60,849 |
|
| Accumulated other comprehensive income (loss) | (5,437 | ) | | (66 | ) |
| Other | — |
| | (2 | ) |
| Total shareholders’ equity | 230,101 |
| | 228,248 |
|
| Total liabilities and shareholders’ equity | $ | 2,129,046 |
| | $ | 2,264,909 |
|
| | | | |
| Liabilities of consolidated VIEs included in total liabilities above | |
| | |
|
Commercial paper and other short-term borrowings (includes $650 and $706 of non-recourse liabilities) | $ | 5,777 |
| | $ | 6,742 |
|
Long-term debt (includes $44,976 and $66,309 of non-recourse debt) | 49,054 |
| | 71,013 |
|
All other liabilities (includes $225 and $382 of non-recourse liabilities) | 1,116 |
| | 9,141 |
|
| Total liabilities of consolidated VIEs | $ | 55,947 |
| | $ | 86,896 |
|
See accompanying Notes to Consolidated Financial Statements.
|
| | |
| | | Bank of America 2012 155157 |
Bank of America Corporation and Subsidiaries
|
| | | | | | | | | | | | | | | | | | | | | | | | | | | | | | |
| | | | | | | | | | | | | | | | |
| Consolidated Statement of Changes in Shareholders’ Equity |
| | | | | | | | | | | | | | | | |
| | Preferred Stock | | Common Stock and Additional Paid-in Capital | | Retained Earnings | | Accumulated
Other Comprehensive Income (Loss) | | Other | | Total Shareholders’ Equity | | Comprehensive Income (Loss) |
| (Dollars in millions, shares in thousands) | | Shares | | Amount | | | | | |
| | | | | | | | | | | | | | | | |
| Balance, December 31, 2008 | $ | 37,701 |
| | 5,017,436 |
| | $ | 76,766 |
| | $ | 73,823 |
| | $ | (10,825 | ) | | $ | (413 | ) | | $ | 177,052 |
| | |
| Cumulative adjustment for accounting change – Other-than-temporary impairments on debt securities | |
| | |
| | |
| | 71 |
| | (71 | ) | | |
| |
|
| | $ | (71 | ) |
| Net income | |
| | |
| | |
| | 6,276 |
| | |
| | |
| | 6,276 |
| | 6,276 |
|
| Net change in available-for-sale debt and marketable equity securities | |
| | |
| | |
| | |
| | 3,593 |
| | |
| | 3,593 |
| | 3,593 |
|
| Net change in derivatives | |
| | |
| | |
| | |
| | 923 |
| | |
| | 923 |
| | 923 |
|
| Employee benefit plan adjustments | |
| | |
| | |
| | |
| | 550 |
| | |
| | 550 |
| | 550 |
|
| Net change in foreign currency translation adjustments | |
| | |
| | |
| | |
| | 211 |
| | |
| | 211 |
| | 211 |
|
| Dividends paid: | |
| | |
| | |
| | |
| | |
| | |
| | |
| | |
|
| Common | |
| | |
| | |
| | (326 | ) | | |
| | |
| | (326 | ) | | |
|
| Preferred | |
| | |
| | |
| | (4,537 | ) | | |
| | |
| | (4,537 | ) | | |
|
| Issuance of preferred stock and warrants | 26,800 |
| | |
| | 3,200 |
| | |
| | |
| | |
| | 30,000 |
| | |
|
| Repayment of preferred stock | (41,014 | ) | | |
| | |
| | (3,986 | ) | | |
| | |
| | (45,000 | ) | | |
|
| Issuance of Common Equivalent Securities | 19,244 |
| | |
| | |
| | |
| | |
| | |
| | 19,244 |
| | |
|
| Stock issued in acquisition | 8,605 |
| | 1,375,476 |
| | 20,504 |
| | |
| | |
| | |
| | 29,109 |
| | |
|
| Issuance of common stock | |
| | 1,250,000 |
| | 13,468 |
| | |
| | |
| | |
| | 13,468 |
| | |
|
| Exchange of preferred stock | (14,797 | ) | | 999,935 |
| | 14,221 |
| | 576 |
| | |
| | |
| |
|
| | |
|
| Common stock issued under employee plans and related tax effects | |
| | 7,397 |
| | 575 |
| | |
| | |
| | 308 |
| | 883 |
| | |
|
| Other | 669 |
| | |
| | |
| | (664 | ) | | |
| | (7 | ) | | (2 | ) | | |
|
| Balance, December 31, 2009 | 37,208 |
| | 8,650,244 |
| | 128,734 |
| | 71,233 |
| | (5,619 | ) | | (112 | ) | | 231,444 |
| | 11,482 |
|
| Cumulative adjustments for accounting changes: | |
| | |
| | |
| | | | | | |
| | | | |
| Consolidation of certain variable interest entities | |
| | |
| |
|
| | (6,154 | ) | | (116 | ) | | |
| | (6,270 | ) | | (116 | ) |
| Credit-related notes | |
| | |
| | |
| | (229 | ) | | 229 |
| | |
| |
|
| | 229 |
|
| Net loss | |
| | |
| | |
| | (2,238 | ) | |
|
| | |
| | (2,238 | ) | | (2,238 | ) |
| Net change in available-for-sale debt and marketable equity securities | |
| | |
| | |
| | |
| | 5,759 |
| | |
| | 5,759 |
| | 5,759 |
|
| Net change in derivatives | |
| | |
| | |
| | |
| | (701 | ) | | |
| | (701 | ) | | (701 | ) |
| Employee benefit plan adjustments | |
| | |
| | |
| | |
| | 145 |
| | |
| | 145 |
| | 145 |
|
| Net change in foreign currency translation adjustments | |
| | |
| | |
| |
|
| | 237 |
| | |
| | 237 |
| | 237 |
|
| Dividends paid: | |
| | |
| | |
| | | | |
| | |
| | | | |
|
| Common |
|
| | |
| |
|
| | (405 | ) | | |
| | |
| | (405 | ) | | |
|
| Preferred |
|
| | |
| | |
| | (1,357 | ) | | |
| | |
| | (1,357 | ) | | |
|
| Common stock issued under employee plans and related tax effects |
|
| | 98,557 |
| | 1,385 |
| | |
| | |
| | 103 |
| | 1,488 |
| | |
|
| Mandatory convertible preferred stock conversion | (1,542 | ) | | 50,354 |
| | 1,542 |
| | |
| | |
| | |
| |
|
| | |
|
| Common Equivalent Securities conversion | (19,244 | ) | | 1,286,000 |
| | 19,244 |
| | |
| | |
| | |
| |
|
| | |
|
| Other | 140 |
| | |
| | |
| | (1 | ) | | |
| | 7 |
| | 146 |
| | |
|
| Balance, December 31, 2010 | 16,562 |
| | 10,085,155 |
| | 150,905 |
| | 60,849 |
| | (66 | ) | | (2 | ) | | 228,248 |
| | 3,315 |
|
| Net income |
|
| |
|
| |
|
| | 1,446 |
| |
|
| |
|
| | 1,446 |
| | 1,446 |
|
| Net change in available-for-sale debt and marketable equity securities |
|
| |
|
| |
|
| |
|
| | (4,270 | ) | |
|
| | (4,270 | ) | | (4,270 | ) |
| Net change in derivatives |
|
| |
|
| |
|
| |
|
| | (549 | ) | |
|
| | (549 | ) | | (549 | ) |
| Employee benefit plan adjustments |
|
| |
|
| |
|
| |
|
| | (444 | ) | |
|
| | (444 | ) | | (444 | ) |
| Net change in foreign currency translation adjustments |
|
| |
|
| |
|
| |
|
| | (108 | ) | |
|
| | (108 | ) | | (108 | ) |
| Dividends paid: | | | | | | | | | | | | | | | |
| Common |
|
| |
|
| |
|
| | (413 | ) | |
|
| |
|
| | (413 | ) | |
|
|
| Preferred |
|
| |
|
| |
|
| | (1,325 | ) | |
|
| |
|
| | (1,325 | ) | |
|
|
Issuance of preferred stock and warrants | 2,918 |
| |
|
| | 2,082 |
| |
|
| |
|
| |
|
| | 5,000 |
| |
|
|
| Common stock issued in exchange for preferred stock and trust preferred securities | (1,083 | ) | | 400,000 |
| | 2,754 |
| | (36 | ) | |
|
| |
|
| | 1,635 |
| |
|
|
| Common stock issued under employee plans and related tax effects |
|
| | 50,783 |
| | 880 |
| |
|
| |
|
| | 2 |
| | 882 |
| |
|
|
| Other |
|
| |
|
| |
|
| | (1 | ) | |
|
| |
|
| | (1 | ) | |
|
|
| Balance, December 31, 2011 | $ | 18,397 |
| | 10,535,938 |
| | $ | 156,621 |
| | $ | 60,520 |
| | $ | (5,437 | ) | | $ | — |
| | $ | 230,101 |
| | $ | (3,925 | ) |
|
| | | | | | | |
| | | | |
| Consolidated Balance Sheet |
| | |
| | December 31 |
| (Dollars in millions) | 2012 | | 2011 |
| Assets | |
| | |
|
| Cash and cash equivalents | $ | 110,752 |
| | $ | 120,102 |
|
| Time deposits placed and other short-term investments | 18,694 |
| | 26,004 |
|
Federal funds sold and securities borrowed or purchased under agreements to resell (includes $98,670 and $87,453 measured at fair value) | 219,924 |
| | 211,183 |
|
Trading account assets (includes $115,821 and $80,130 pledged as collateral) | 237,226 |
| | 169,319 |
|
| Derivative assets | 53,497 |
| | 73,023 |
|
| Debt securities: | |
| | |
|
Available-for-sale (includes $63,342 and $69,021 pledged as collateral) | 286,906 |
| | 276,151 |
|
Held-to-maturity, at cost (fair value – $50,270 and $35,442; $22,461 and $24,009 pledged as collateral) | 49,481 |
| | 35,265 |
|
| Total debt securities | 336,387 |
| | 311,416 |
|
Loans and leases (includes $9,002 and $8,804 measured at fair value and $50,289 and $73,463 pledged as collateral) | 907,819 |
| | 926,200 |
|
| Allowance for loan and lease losses | (24,179 | ) | | (33,783 | ) |
| Loans and leases, net of allowance | 883,640 |
| | 892,417 |
|
| Premises and equipment, net | 11,858 |
| | 13,637 |
|
Mortgage servicing rights (includes $5,716 and $7,378 measured at fair value) | 5,851 |
| | 7,510 |
|
| Goodwill | 69,976 |
| | 69,967 |
|
| Intangible assets | 6,684 |
| | 8,021 |
|
Loans held-for-sale (includes $11,659 and $7,630 measured at fair value) | 19,413 |
| | 13,762 |
|
| Customer and other receivables | 71,467 |
| | 66,999 |
|
Other assets (includes $40,983 and $37,084 measured at fair value) | 164,605 |
| | 145,686 |
|
| Total assets | $ | 2,209,974 |
| | $ | 2,129,046 |
|
| | | | |
| | | | |
| | | | |
| Assets of consolidated variable interest entities included in total assets above (isolated to settle the liabilities of the variable interest entities) |
| Trading account assets | $ | 7,906 |
| | $ | 8,595 |
|
| Derivative assets | 333 |
| | 1,634 |
|
| Loans and leases | 123,227 |
| | 140,194 |
|
| Allowance for loan and lease losses | (3,658 | ) | | (5,066 | ) |
| Loans and leases, net of allowance | 119,569 |
| | 135,128 |
|
| Loans held-for-sale | 1,969 |
| | 1,635 |
|
| All other assets | 4,654 |
| | 4,769 |
|
| Total assets of consolidated variable interest entities | $ | 134,431 |
| | $ | 151,761 |
|
See accompanying Notes to Consolidated Financial Statements.
|
| | |
156158 Bank of America 20112012
| | |
Bank of America Corporation and Subsidiaries
|
| | | | | | | | | | | |
| | | | | | |
| Consolidated Statement of Cash Flows |
| | | | | | |
| (Dollars in millions) | 2011 | | 2010 | | 2009 |
| Operating activities | |
| | |
| | |
|
| Net income (loss) | $ | 1,446 |
| | $ | (2,238 | ) | | $ | 6,276 |
|
| Reconciliation of net income (loss) to net cash provided by operating activities: | |
| | |
| | |
|
| Provision for credit losses | 13,410 |
| | 28,435 |
| | 48,570 |
|
| Goodwill impairment | 3,184 |
| | 12,400 |
| | — |
|
| Gains on sales of debt securities | (3,374 | ) | | (2,526 | ) | | (4,723 | ) |
| Depreciation and premises improvements amortization | 1,976 |
| | 2,181 |
| | 2,336 |
|
| Amortization of intangibles | 1,509 |
| | 1,731 |
| | 1,978 |
|
| Deferred income taxes | (1,949 | ) | | 608 |
| | 370 |
|
| Net decrease in trading and derivative instruments | 20,230 |
| | 20,775 |
| | 59,822 |
|
| Net decrease in other assets | 50,230 |
| | 5,213 |
| | 28,553 |
|
| Net increase (decrease) in accrued expenses and other liabilities | (18,124 | ) | | 14,069 |
| | (16,601 | ) |
| Other operating activities, net | (4,048 | ) | | 1,946 |
| | 3,150 |
|
| Net cash provided by operating activities | 64,490 |
| | 82,594 |
| | 129,731 |
|
| Investing activities | |
| | |
| | |
|
| Net (increase) decrease in time deposits placed and other short-term investments | 105 |
| | (2,154 | ) | | 19,081 |
|
| Net (increase) decrease in federal funds sold and securities borrowed or purchased under agreements to resell | (1,567 | ) | | (19,683 | ) | | 31,369 |
|
| Proceeds from sales of available-for-sale debt securities | 120,125 |
| | 100,047 |
| | 164,155 |
|
| Proceeds from paydowns and maturities of available-for-sale debt securities | 56,732 |
| | 70,868 |
| | 59,949 |
|
| Purchases of available-for-sale debt securities | (99,536 | ) | | (199,159 | ) | | (185,145 | ) |
| Proceeds from maturities of held-to-maturity debt securities | 602 |
| | 11 |
| | 2,771 |
|
| Purchases of held-to-maturity debt securities | (35,552 | ) | | (100 | ) | | (3,914 | ) |
| Proceeds from sales of loans and leases | 2,409 |
| | 8,046 |
| | 7,592 |
|
| Other changes in loans and leases, net | (6,059 | ) | | (2,550 | ) | | 21,257 |
|
| Net purchases of premises and equipment | (1,307 | ) | | (987 | ) | | (2,240 | ) |
| Proceeds from sales of foreclosed properties | 2,532 |
| | 3,107 |
| | 1,997 |
|
| Cash received upon acquisition, net | — |
| | — |
| | 31,804 |
|
| Cash received due to impact of adoption of consolidation guidance | — |
| | 2,807 |
| | — |
|
| Other investing activities, net | 13,945 |
| | 9,400 |
| | 9,249 |
|
| Net cash provided by (used in) investing activities | 52,429 |
| | (30,347 | ) | | 157,925 |
|
| Financing activities | |
| | |
| | |
|
| Net increase in deposits | 22,611 |
| | 36,598 |
| | 10,507 |
|
| Net decrease in federal funds purchased and securities loaned or sold under agreements to repurchase | (30,495 | ) | | (9,826 | ) | | (62,993 | ) |
| Net decrease in commercial paper and other short-term borrowings | (24,264 | ) | | (31,698 | ) | | (126,426 | ) |
| Proceeds from issuance of long-term debt | 26,001 |
| | 52,215 |
| | 67,744 |
|
| Retirement of long-term debt | (101,814 | ) | | (110,919 | ) | | (101,207 | ) |
| Proceeds from issuance of preferred stock and warrants | 5,000 |
| | — |
| | 49,244 |
|
| Repayment of preferred stock | — |
| | — |
| | (45,000 | ) |
| Proceeds from issuance of common stock | — |
| | — |
| | 13,468 |
|
| Cash dividends paid | (1,738 | ) | | (1,762 | ) | | (4,863 | ) |
| Other financing activities, net | 3 |
| | 5 |
| | (42 | ) |
| Net cash used in financing activities | (104,696 | ) | | (65,387 | ) | | (199,568 | ) |
| Effect of exchange rate changes on cash and cash equivalents | (548 | ) | | 228 |
| | 394 |
|
| Net increase (decrease) in cash and cash equivalents | 11,675 |
| | (12,912 | ) | | 88,482 |
|
| Cash and cash equivalents at January 1 | 108,427 |
| | 121,339 |
| | 32,857 |
|
| Cash and cash equivalents at December 31 | $ | 120,102 |
| | $ | 108,427 |
| | $ | 121,339 |
|
| Supplemental cash flow disclosures | |
| | |
| | |
|
| Interest paid | $ | 25,207 |
| | $ | 21,166 |
| | $ | 37,602 |
|
| Income taxes paid | 1,653 |
| | 1,465 |
| | 2,964 |
|
| Income taxes refunded | (781 | ) | | (7,783 | ) | | (31 | ) |
|
| | | | | | | |
| | | | |
| Consolidated Balance Sheet (continued) |
| | |
| | December 31 |
| (Dollars in millions) | 2012 | | 2011 |
| Liabilities | |
| | |
|
| Deposits in U.S. offices: | |
| | |
|
| Noninterest-bearing | $ | 372,546 |
| | $ | 332,228 |
|
Interest-bearing (includes $2,262 and $3,297 measured at fair value) | 654,332 |
| | 624,814 |
|
| Deposits in non-U.S. offices: | | | |
|
| Noninterest-bearing | 7,573 |
| | 6,839 |
|
| Interest-bearing | 70,810 |
| | 69,160 |
|
| Total deposits | 1,105,261 |
| | 1,033,041 |
|
Federal funds purchased and securities loaned or sold under agreements to repurchase (includes $42,639 and $34,235 measured at fair value) | 293,259 |
| | 214,864 |
|
| Trading account liabilities | 73,587 |
| | 60,508 |
|
| Derivative liabilities | 46,016 |
| | 59,520 |
|
Commercial paper and other short-term borrowings (includes $4,074 and $6,558 measured at fair value) | 30,731 |
| | 35,698 |
|
Accrued expenses and other liabilities (includes $16,594 and $15,743 measured at fair value and $513 and $714 of reserve for unfunded lending commitments) | 148,579 |
| | 123,049 |
|
Long-term debt (includes $49,161 and $46,239 measured at fair value) | 275,585 |
| | 372,265 |
|
| Total liabilities | 1,973,018 |
| | 1,898,945 |
|
Commitments and contingencies (Note 7 – Securitizations and Other Variable Interest Entities, Note 8 – Representations and Warranties Obligations and Corporate Guarantees and Note 13 – Commitments and Contingencies) |
|
| |
|
|
| Shareholders’ equity | |
| | |
|
Preferred stock, $0.01 par value; authorized – 100,000,000 shares; issued and outstanding – 3,685,410 and 3,689,084 shares | 18,768 |
| | 18,397 |
|
Common stock and additional paid-in capital, $0.01 par value; authorized – 12,800,000,000 shares; issued and outstanding – 10,778,263,628 and 10,535,937,957 shares | 158,142 |
| | 156,621 |
|
| Retained earnings | 62,843 |
| | 60,520 |
|
| Accumulated other comprehensive income (loss) | (2,797 | ) | | (5,437 | ) |
| Total shareholders’ equity | 236,956 |
| | 230,101 |
|
| Total liabilities and shareholders’ equity | $ | 2,209,974 |
| | $ | 2,129,046 |
|
| | | | |
| Liabilities of consolidated variable interest entities included in total liabilities above | |
| | |
|
Commercial paper and other short-term borrowings (includes $872 and $650 of non-recourse liabilities) | $ | 3,731 |
| | $ | 5,777 |
|
Long-term debt (includes $29,476 and $44,976 of non-recourse debt) | 34,256 |
| | 49,054 |
|
All other liabilities (includes $149 and $225 of non-recourse liabilities) | 360 |
| | 1,116 |
|
| Total liabilities of consolidated variable interest entities | $ | 38,347 |
| | $ | 55,947 |
|
See accompanying Notes to Consolidated Financial Statements.
Bank of America Corporation and Subsidiaries
|
| | | | | | | | | | | | | | | | | | | | | | | | | | |
| | | | | | | | | | | | | | |
| Consolidated Statement of Changes in Shareholders’ Equity |
| | | | | | | | | | | | | | |
| | Preferred Stock | | Common Stock and Additional Paid-in Capital | | Retained Earnings | | Accumulated
Other Comprehensive Income (Loss) | | Other | | Total Shareholders’ Equity |
| (Dollars in millions, shares in thousands) | | Shares | | Amount | | | | |
| | | | | | | | | | | | | | |
| Balance, December 31, 2009 | $ | 37,208 |
| | 8,650,244 |
| | $ | 128,734 |
| | $ | 71,233 |
| | $ | (5,619 | ) | | $ | (112 | ) | | $ | 231,444 |
|
| Cumulative adjustments for accounting changes: | |
| | |
| | |
| | | | | | |
| | |
| Consolidation of certain variable interest entities | |
| | |
| | | | (6,154 | ) | | (116 | ) | | |
| | (6,270 | ) |
| Credit-related notes | |
| | |
| | |
| | (229 | ) | | 229 |
| | |
| | |
| Net loss | |
| | |
| | |
| | (2,238 | ) | | | | |
| | (2,238 | ) |
| Net change in available-for-sale debt and marketable equity securities | |
| | |
| | |
| | |
| | 5,759 |
| | |
| | 5,759 |
|
| Net change in derivatives | |
| | |
| | |
| | |
| | (701 | ) | | |
| | (701 | ) |
| Employee benefit plan adjustments | |
| | |
| | |
| | |
| | 145 |
| | |
| | 145 |
|
| Net change in foreign currency translation adjustments | |
| | |
| | |
| | | | 237 |
| | |
| | 237 |
|
| Dividends paid: | |
| | |
| | |
| | | | |
| | |
| | |
| Common | | | |
| | | | (405 | ) | | |
| | |
| | (405 | ) |
| Preferred | | | |
| | |
| | (1,357 | ) | | |
| | |
| | (1,357 | ) |
| Common stock issued under employee plans and related tax effects | | | 98,557 |
| | 1,385 |
| | |
| | |
| | 103 |
| | 1,488 |
|
| Mandatory convertible preferred stock conversion | (1,542 | ) | | 50,354 |
| | 1,542 |
| | |
| | |
| | |
| | |
| Common Equivalent Securities conversion | (19,244 | ) | | 1,286,000 |
| | 19,244 |
| | |
| | |
| | |
| | |
| Other | 140 |
| | |
| | |
| | (1 | ) | | |
| | 7 |
| | 146 |
|
| Balance, December 31, 2010 | 16,562 |
| | 10,085,155 |
| | 150,905 |
| | 60,849 |
| | (66 | ) | | (2 | ) | | 228,248 |
|
| Net income | | | | | | | 1,446 |
| | | | | | 1,446 |
|
| Net change in available-for-sale debt and marketable equity securities | | | | | | | | | (4,270 | ) | | | | (4,270 | ) |
| Net change in derivatives | | | | | | | | | (549 | ) | | | | (549 | ) |
| Employee benefit plan adjustments | | | | | | | | | (444 | ) | | | | (444 | ) |
| Net change in foreign currency translation adjustments | | | | | | | | | (108 | ) | | | | (108 | ) |
| Dividends paid: | | | | | | | | | | | | | |
| Common | | | | | | | (413 | ) | | | | | | (413 | ) |
| Preferred | | | | | | | (1,325 | ) | | | | | | (1,325 | ) |
Issuance of preferred stock and warrants | 2,918 |
| | | | 2,082 |
| | | | | | | | 5,000 |
|
| Common stock issued in connection with exchanges of preferred stock and trust preferred securities | (1,083 | ) | | 400,000 |
| | 2,754 |
| | (36 | ) | | | | | | 1,635 |
|
| Common stock issued under employee plans and related tax effects | | | 50,783 |
| | 880 |
| | | | | | 2 |
| | 882 |
|
| Other | | | | | | | (1 | ) | | | | | | (1 | ) |
| Balance, December 31, 2011 | 18,397 |
| | 10,535,938 |
| | 156,621 |
| | 60,520 |
| | (5,437 | ) | | — |
| | 230,101 |
|
| Net income | | | | | | | 4,188 |
| | | | | | 4,188 |
|
| Net change in available-for-sale debt and marketable equity securities | | | | | | | | | 1,802 |
| | | | 1,802 |
|
| Net change in derivatives | | | | | | | | | 916 |
| | | | 916 |
|
| Employee benefit plan adjustments | | | | | | | | | (65 | ) | | | | (65 | ) |
| Net change in foreign currency translation adjustments | | | | | | | | | (13 | ) | | | | (13 | ) |
| Dividends paid: | | | | | | | | | | | | | |
| Common | | | | | | | (437 | ) | | | | | | (437 | ) |
| Preferred | | | | | | | (1,472 | ) | | | | | | (1,472 | ) |
| Net issuance of preferred stock | 667 |
| | | | | | | | | | | | 667 |
|
| Common stock issued in connection with exchanges of preferred stock and trust preferred securities | (296 | ) | | 49,867 |
| | 412 |
| | 44 |
| | | | | | 160 |
|
| Common stock issued under employee plans and related tax effects | | | 192,459 |
| | 1,109 |
| | | | | | | | 1,109 |
|
| Balance, December 31, 2012 | $ | 18,768 |
| | 10,778,264 |
| | $ | 158,142 |
| | $ | 62,843 |
| | $ | (2,797 | ) | | $ | — |
| | $ | 236,956 |
|
See accompanying Notes to Consolidated Financial Statements.
Bank of America Corporation and Subsidiaries
|
| | | | | | | | | | | |
| | | | | | |
| Consolidated Statement of Cash Flows |
| | | | | | |
| (Dollars in millions) | 2012 | | 2011 | | 2010 |
| Operating activities | |
| | |
| | |
|
| Net income (loss) | $ | 4,188 |
| | $ | 1,446 |
| | $ | (2,238 | ) |
| Reconciliation of net income (loss) to net cash provided by (used in) operating activities: | |
| | |
| | |
|
| Provision for credit losses | 8,169 |
| | 13,410 |
| | 28,435 |
|
| Goodwill impairment | — |
| | 3,184 |
| | 12,400 |
|
| Gains on sales of debt securities | (1,662 | ) | | (3,374 | ) | | (2,526 | ) |
| Fair value adjustments on structured liabilities | 5,107 |
| | (3,320 | ) | | (18 | ) |
| Depreciation and premises improvements amortization | 1,774 |
| | 1,976 |
| | 2,181 |
|
| Amortization of intangibles | 1,264 |
| | 1,509 |
| | 1,731 |
|
| Deferred income taxes | (2,735 | ) | | (1,949 | ) | | 608 |
|
| Net (increase) decrease in trading and derivative instruments | (48,225 | ) | | 20,230 |
| | 20,775 |
|
| Net (increase) decrease in other assets | (13,330 | ) | | 50,230 |
| | 5,213 |
|
| Net increase (decrease) in accrued expenses and other liabilities | 24,061 |
| | (18,124 | ) | | 14,069 |
|
| Other operating activities, net | 7,531 |
| | (770 | ) | | 1,911 |
|
| Net cash provided by (used in) operating activities | (13,858 | ) | | 64,448 |
| | 82,541 |
|
| Investing activities | |
| | |
| | |
|
| Net (increase) decrease in time deposits placed and other short-term investments | 7,310 |
| | 105 |
| | (2,154 | ) |
| Net increase in federal funds sold and securities borrowed or purchased under agreements to resell | (8,741 | ) | | (1,567 | ) | | (19,683 | ) |
| Proceeds from sales of available-for-sale and other debt securities | 74,068 |
| | 120,125 |
| | 100,047 |
|
| Proceeds from paydowns and maturities of available-for-sale and other debt securities | 71,509 |
| | 56,732 |
| | 70,868 |
|
| Purchases of available-for-sale and other debt securities | (164,491 | ) | | (99,536 | ) | | (199,159 | ) |
| Proceeds from maturities of held-to-maturity debt securities | 6,261 |
| | 602 |
| | 11 |
|
| Purchases of held-to-maturity debt securities | (20,991 | ) | | (35,552 | ) | | (100 | ) |
| Proceeds from sales of loans and leases | 1,673 |
| | 2,409 |
| | 8,046 |
|
| Other changes in loans and leases, net | (6,457 | ) | | (6,059 | ) | | (2,550 | ) |
| Net sales (purchases) of premises and equipment | 5 |
| | (1,307 | ) | | (987 | ) |
| Proceeds from sales of foreclosed properties | 2,799 |
| | 2,532 |
| | 3,107 |
|
| Cash received due to impact of adoption of consolidation guidance | — |
| | — |
| | 2,807 |
|
| Proceeds from sales of investments | 198 |
| | 14,840 |
| | 10,856 |
|
| Other investing activities, net | (320 | ) | | (895 | ) | | (1,456 | ) |
| Net cash provided by (used in) investing activities | (37,177 | ) | | 52,429 |
| | (30,347 | ) |
| Financing activities | |
| | |
| | |
|
| Net increase in deposits | 72,220 |
| | 22,611 |
| | 36,598 |
|
| Net increase (decrease) in federal funds purchased and securities loaned or sold under agreements to repurchase | 78,395 |
| | (30,495 | ) | | (9,826 | ) |
| Net decrease in commercial paper and other short-term borrowings | (5,017 | ) | | (24,264 | ) | | (31,698 | ) |
| Proceeds from issuance of long-term debt | 22,200 |
| | 26,001 |
| | 52,215 |
|
| Retirement of long-term debt | (124,389 | ) | | (101,814 | ) | | (110,919 | ) |
| Proceeds from issuance of preferred stock and warrants | 667 |
| | 5,000 |
| | — |
|
| Cash dividends paid | (1,909 | ) | | (1,738 | ) | | (1,762 | ) |
| Excess tax benefits on share-based payments | 13 |
| | 42 |
| | 53 |
|
| Other financing activities, net | 236 |
| | 3 |
| | 5 |
|
| Net cash provided by (used in) financing activities | 42,416 |
| | (104,654 | ) | | (65,334 | ) |
| Effect of exchange rate changes on cash and cash equivalents | (731 | ) | | (548 | ) | | 228 |
|
| Net increase (decrease) in cash and cash equivalents | (9,350 | ) | | 11,675 |
| | (12,912 | ) |
| Cash and cash equivalents at January 1 | 120,102 |
| | 108,427 |
| | 121,339 |
|
| Cash and cash equivalents at December 31 | $ | 110,752 |
| | $ | 120,102 |
| | $ | 108,427 |
|
| Supplemental cash flow disclosures | |
| | |
| | |
|
| Interest paid | $ | 18,268 |
| | $ | 25,207 |
| | $ | 21,166 |
|
| Income taxes paid | 1,372 |
| | 1,653 |
| | 1,465 |
|
| Income taxes refunded | (338 | ) | | (781 | ) | | (7,783 | ) |
During 2011, the Corporation entered into an agreement with Assured Guaranty Ltd. and subsidiaries which resulted in non-cash increases to loans of $2.2 billion, other assets of $82 million and long-term debt of $2.3 billion.
During 2011, the Corporation exchanged preferred stock, with a carrying value of $1.1 billion, for 92 million common shares valued at $522 million and senior notes valued at $360 million.
During 2011, the Corporation exchanged trust preferred securities for 308 million common shares valued at $1.7 billion and senior notes valued at $2.0 billion. The trust preferred securities, and underlying junior subordinated notes and stock purchase agreements, with a carrying value of $5.2 billion, were immediately canceled.
During 2010, and 2009, the Corporation securitized $2.4 billion and $14.0 billion of residential mortgage loans into mortgage-backed securities which were retained by the Corporation. There were no residential mortgage loans securitized into mortgage-backed securities which were retained by the Corporation during 2012 and 2011.
During 2010, the Corporation sold First Republic Bank in a non-cash transaction that reduced assets and liabilities by $19.5 billion and $18.1 billion.
During 2009, the Corporation exchanged $14.8 billion of preferred stock by issuing approximately 1.0 billion in shares of common stock valued at $11.5 billion.
During 2009, the Corporation exchanged credit card loans of $8.5 billion and the related allowance for loan and lease losses of $750 million for a $7.8 billion held-to-maturity debt security that was issued by the Corporation’s U.S. credit card securitization trust and retained by the Corporation.
The acquisition-date fair values of non-cash assets acquired and liabilities assumed in the Merrill Lynch & Co., Inc. (Merrill Lynch) acquisition were $619.1 billion and $626.8 billion.
Approximately 1.4 billion shares of common stock valued at approximately $20.5 billion and 376 thousand shares of preferred stock valued at approximately $8.6 billion were issued in connection with the Merrill Lynch acquisition.
See accompanying Notes to Consolidated Financial Statements.
|
| | |
| | | Bank of America 2012 157161 |
Bank of America Corporation and Subsidiaries
Notes to Consolidated Financial Statements
NOTE 1 Summary of Significant Accounting Principles
Bank of America Corporation (collectively(together with its consolidated subsidiaries, the Corporation), a bank holding company (BHC) and a financial holding company, provides a diverse range of financial services and products throughout the U.S. and in certain international markets. The term “the Corporation” as used herein may refer to theBank of America Corporation individually, theBank of America Corporation and its subsidiaries, or certain of theBank of America Corporation’s subsidiaries or affiliates.
The Corporation conducts its activities through banking and nonbanking subsidiaries. The Corporation operates its banking activities primarily under two charters: Bank of America, National Association (Bank of America, N.A. or BANA) and FIA Card Services, National Association (FIA Card Services, N.A.) or FIA).
Principles of Consolidation and Basis of Presentation
The Consolidated Financial Statements include the accounts of the Corporation and its majority-owned subsidiaries, and those variable interest entities (VIEs) where the Corporation is the primary beneficiary. Intercompany accounts and transactions have been eliminated. Results of operations of acquired companies are included from the dates of acquisition and for VIEs, from the dates that the Corporation became the primary beneficiary. Assets held in an agency or fiduciary capacity are not included in the Consolidated Financial Statements. The Corporation accounts for investments in companies for which it owns a voting interest and for which it has the ability to exercise significant influence over operating and financing decisions using the equity method of accounting or at fair value under the fair value option. These investments are included in other assets. Equity method investments are subject to impairment testing and the Corporation’s proportionate share of income or loss is included in equity investment income.
The preparation of the Consolidated Financial Statements in conformity with accounting principles generally accepted in the United States of America requires management to make estimates and assumptions that affect reported amounts and disclosures. Realized results could differ from those estimates and assumptions.
The Corporation evaluates subsequent events through the date of filing with the Securities and Exchange Commission (SEC). Certain prior period amounts have been reclassified to conform to current period presentation.
New Accounting Pronouncements
In April 2011, the Financial Accounting Standards Board (FASB) issued new accounting guidance on troubled debt restructurings (TDRs), including criteria to determine whether a loan modification represents a concession and whether the debtor is experiencing financial difficulties. This new accounting guidance was effective for the Corporation as of September 30, 2011 with retrospective application back to January 1, 2011. As a result of the
retrospective application, the Corporation classified $1.1 billion of commercial loan modifications as TDRs that in previous periods had not been classified as TDRs. These loans were newly identified as TDRs typically because the Corporation was not able to demonstrate that the modified rate of interest, although significantly higher than the rate prior to modification, was a market rate of interest. These loans include $402 million of performing commercial loans that had an aggregate allowance for credit losses of $27 million at December 31, 2011. Also, as a result of the new accounting guidance, loans that are participating in or that have been offered a binding trial modification are classified as TDRs. At December 31, 2011, the Corporation classified an additional $2.6 billion of home loans, with an aggregate allowance for credit losses of $154 million, as TDRs that were participating in or had been offered a trial modification.
In April 2011, the FASB issued new accounting guidance that addresses effective control in repurchase agreements and eliminates the requirement for entities to consider whether the transferor/seller has the ability to repurchase the financial assets in a repurchase agreement. This new accounting guidance was effective, on a prospective basis, for new transactions or modifications to existing transactions on January 1, 2012. The adoption of this guidance willdid not have a material impact on the Corporation’s consolidated financial position or results of operations.
In May 2011,
Effective January 1, 2012, the Corporation adopted amendments from the FASB issued amendments to the fair value accounting guidance. The amendments clarify the application of the highest and best use, and valuation premise concepts, preclude the application of blockage factors“blockage factors” in the valuation of all financial instruments and include criteria for applying the fair value measurement principles to portfolios of financial instruments. The amendments additionallyalso prescribe enhanced financial statementadditional disclosures for Level 3 fair value measurements. The new amendments were effective on January 1, 2012.measurements and financial instruments not carried at fair value. The adoption of this guidance willdid not have a material impact on the Corporation’s consolidated financial position or results of operations. For the related disclosures, see Note 21 – Fair Value Measurements and Note 23 – Fair Value of Financial Instruments.
In June 2011,Effective January 1, 2012, the FASB issuedCorporation adopted new accounting guidance from the FASB on the presentation of comprehensive income in financial statements. The Corporation adopted the new guidance requires entities to reportby reporting the components of comprehensive income in either a continuous statement of comprehensive income or two separate but consecutive statements. ThisFor the new statement and related information, see the Consolidated Statement of Comprehensive Income and Note 15 – Accumulated Other Comprehensive Income (Loss).
Effective January 1, 2013, the Corporation will be required to retrospectively adopt new accounting guidance is effective for the Corporation for the three months ended March 31, 2012.
In September 2011,from the FASB issued new accounting guidance that simplifies goodwill impairment testing. The new guidance permits entities to make a qualitative assessment of whether it is likely that the fair value of a reporting unit is less than its carrying value. If, under this assessment, it is likely that the fair value of a reporting unit is less than the carrying amount, an entity is required to perform the two-step impairment test. The Corporation early adopted the new accounting guidance for certain goodwill impairment tests during the three months ended September 30, 2011.
In December 2011, the FASB issued new accounting guidance that requiresrequiring additional disclosures on the effect of netting arrangements on an entity’s financial instrumentsposition. The disclosures relate to derivatives and derivative instrumentssecurities financing agreements that are either offset in accordance withon the balance sheet under existing accounting guidance or are subject to ana legally enforceable master netting arrangement or similar agreement. The new requirements do not change the accounting guidance on netting, but rather enhance the disclosures to more clearly show the impact of netting arrangements on a company’s financial position. This new guidance addresses only disclosures, and accordingly, will have no impact on the Corporation’s consolidated financial position or results of operations.
In December 2012, the FASB issued a proposed standard on accounting guidancefor expected credit losses. It would replace multiple existing impairment models, including an “incurred loss” model for loans, with an “expected credit loss” model. The FASB announced it would establish the effective date when it issues the final standard. The Corporation cannot predict at this time whether or when a final standard will be issued, when it will be effective or what its final provisions will be. It is possible that the final standard could have a material adverse impact on a retrospective basis for all comparative periods presented, beginning on January 1, 2013.the Corporation’s results of operations once it is issued and becomes effective.
Cash and Cash Equivalents
Cash and cash equivalents include cash on hand, cash items in the process of collection, and amounts due from correspondent banks and the Federal Reserve Bank.
Securities Financing Agreements
Securities borrowed or purchased under agreements to resell and securities loaned or sold under agreements to repurchase (securities financing agreements) are treated as collateralized financing transactions. These agreements are recorded at the amounts at which the securities were acquired or sold plus accrued interest, except for certain securities financing agreements that the Corporation accounts for under the fair value option. Changes in the fair value of securities financing agreements that are accounted for under the fair value option are recorded in other income.trading
account profits in the Consolidated Statement of Income. For more information on securities financing agreements that the Corporation accounts for under the fair value option, see Note 2322 – Fair Value Option.
The Corporation’s policy is to obtain possession of collateral with a market value equal to or in excess of the principal amount loaned under resale agreements. To ensure that the market value of the underlying collateral remains sufficient, collateral is generally valued daily and the Corporation may require counterparties to deposit additional collateral or may return collateral pledged when appropriate. Securities financing agreements give rise to negligible credit risk as a result of these collateral provisions, and accordingly, no allowance for loan losses is considered necessary.
Substantially all repurchase and resale activities are transacted under legally enforceable master repurchase agreements that give the Corporation, in the event of default by the counterparty, the right to liquidate securities held and to offset receivables and payables with the same counterparty. The Corporation offsets repurchase and resale transactions with the same counterparty on the Consolidated Balance Sheet where it has such a legally enforceable master agreement and the transactions have the same maturity date.
In transactions where the Corporation acts as the lender in a securities lending agreement and receives securities that can be pledged or sold as collateral, it recognizes an asset on the Consolidated Balance Sheet at fair value, representing the securities received, and a liability for the same amount, representing the obligation to return those securities.
In repurchase transactions, typically, the termination date for a repurchase agreement is before the maturity date of the underlying security. However, in certain situations, the Corporation may enter into repurchase agreements where the termination date of the repurchase transaction is the same as the maturity date of the underlying security and these transactions are referred to as
“repo-to-maturity” “repo-to-maturity” (RTM) transactions. In accordance with applicable accounting guidance, the Corporation accounts for RTM transactions as sales and purchases when the transferred securities are highly liquid. In instances where securities are considered sold or purchased, the Corporation removes or recognizes the securities from the Consolidated Balance Sheet and, in the case of sales, recognizes a gain or loss, where applicable, in the Consolidated Statement of Income. At December 31, 20112012 and 20102011, the Corporation had no outstanding RTM transactions that had been accounted for as sales and an immaterial amount of transactions that had been accounted for as purchases.
Collateral
The Corporation accepts securities as collateral that it is permitted by contract or custom to sell or repledge. At December 31, 20112012 and 20102011, the fair value of this collateral was $393.9513.2 billion and $401.7393.9 billion of which $287.7362.0 billion and $257.6287.7 billion was sold or repledged. The primary sourcessource of this collateral are repurchaseis securities borrowed or purchased under agreements and securities borrowed.to resell. The Corporation also pledges firm-owned securities and loans as collateral in transactions that include repurchase agreements, securities loaned, public and trust deposits, U.S. Treasury tax and loan notes, and other short-term borrowings. This collateral, which in some cases can be sold or repledged by the counterparties to
the transactions, is parenthetically disclosed on the Consolidated Balance Sheet.
In certain cases, the Corporation has transferred assets to consolidated VIEs where those restricted assets serve as collateral for the interests issued by the VIEs. These assets are disclosedincluded on the Consolidated Balance Sheet asin Assets of Consolidated VIEs.
In addition, the Corporation obtains collateral in connection with its derivative contracts. Required collateral levels vary depending on the credit risk rating and the type of counterparty. Generally, the Corporation accepts collateral in the form of cash, U.S. Treasury securities and other marketable securities. Based on provisions contained in legalmaster netting agreements, the Corporation nets cash collateral received against the applicable derivative fair value.assets. The Corporation also pledges collateral on its own derivative positions which can be applied against derivative liabilities.
Trading Instruments
Financial instruments utilized in trading activities are carried at fair value. Fair value is generally based on quoted market prices or quoted market prices for similar assets and liabilities. If these market prices are not available, fair values are estimated based on dealer quotes, pricing models, discounted cash flow methodologies, or similar techniques where the determination of fair value may require significant management judgment or estimation. Realized and unrealized gains and losses are recognized in trading account profits (losses).profits.
Derivatives and Hedging Activities
Derivatives are entered into on behalf of customers, and for trading as economic hedges or asrisk management activities. Derivatives used in risk management activities include derivatives that are both designated in qualifying accounting hedges.hedge relationships and derivatives used to hedge market risks in relationships that are not designated in qualifying accounting hedge relationships (referred to as other risk management activities). Derivatives utilized by the Corporation include swaps, financial futures and forward settlement contracts, and option contracts. A swap agreement is a contract between two parties to exchange cash flows based on specified underlying notional amounts, assets and/or indices. Financial futures and forward settlement
contracts are agreements to buy or sell a quantity of a financial instrument, index, currency or commodity at a predetermined future date, and rate or price. An option contract is an agreement that conveys to the purchaser the right, but not the obligation, to buy or sell a quantity of a financial instrument (including another derivative financial instrument), index, currency or commodity at a predetermined rate or price during a period or at a date in the future. Option agreements can be transacted on organized exchanges or directly between parties.
All derivatives are recorded on the Consolidated Balance Sheet at fair value, taking into consideration the effects of legally enforceable master netting agreements that allow the Corporation to settle positive and negative positions and offset cash collateral held with the same counterparty on a net basis. For exchange-traded contracts, fair value is based on quoted market prices. For non-exchange traded contracts, fair value is based on dealer quotes, pricing models, discounted cash flow methodologies or similar techniques for which the determination of fair value may require significant management judgment or estimation.
Valuations of derivative assets and liabilities reflect the value of the instrument including counterparty credit risk. These values also take into account the Corporation’s own credit standing, thus including in the valuation of the derivative instrument the value of the net credit differential between the counterparties to the derivative contract.standing.
Trading Derivatives and Economic HedgesOther Risk Management Activities
Derivatives held for trading purposes are included in derivative assets or derivative liabilities on the Consolidated Balance Sheet with changes in fair value included in trading account profits (losses).profits.
Derivatives used as economic hedges, because either they did not qualify for or were not designated as an accounting hedge,other risk management activities are also included in derivative assets or derivative liabilities. ChangesDerivatives used in other risk management activities have not been designated in a qualifying accounting hedge relationship because they did not qualify or the risk that is being mitigated pertains to an item that is reported at fair value through earnings so that the effect of measuring the derivative instrument and the asset or liability to which the risk exposure pertains will offset in the Consolidated Statement of Income to the extent effective. The changes in the fair value of derivatives that serve as economic hedges ofto mitigate certain risks associated with mortgage servicing rights (MSRs), interest rate lock commitments (IRLCs) and first mortgage loans held-for-sale (LHFS) that are originated by the Corporation are recorded in mortgage banking income.income (loss). Changes in the fair value of derivatives that serve as economic hedges of credit exposures,to mitigate interest rate risk and foreign currency exposuresrisk are included in other income (loss). Credit derivatives are also used by the Corporation as economic hedges do not qualify as accounting hedges but canto protect the Corporation from various credit exposures as economic hedges, andexposures. The changes in the fair value of these derivatives are included in other income (loss).
Derivatives Used For Hedge Accounting Purposes (Accounting Hedges)
For accounting hedges, the Corporation formally documents at inception all relationships between hedging instruments and hedged items, as well as the risk management objectives and strategies for undertaking various accounting hedges. Additionally, the Corporation primarily uses regression analysis at the inception of a hedge and for each reporting period thereafter to assess whether the derivative used in a hedging transaction is expected to be and has been highly effective in offsetting changes in the fair value or cash flows of a hedged item.item or forecasted transaction. The Corporation discontinues hedge accounting when it is determined that a derivative is not expected to be or has ceased to be highly effective as a hedge, and then reflects changes in fair value of the derivative in earnings after termination of the hedge relationship.
The Corporation uses its accounting hedges as either fair value hedges, cash flow hedges or hedges of net investments in foreign operations. The Corporation manages interest rate and foreign currency exchange rate sensitivity predominantly through the use of derivatives. Fair value hedges are used to protect against changes in the fair value of the Corporation’s assets and liabilities that are attributable to interest rate or foreign exchange volatility. Cash flow hedges are used primarily to minimize the variability in cash flows of assets or liabilities, or forecasted transactions caused by interest rate or foreign exchange fluctuations. For terminated cash flow hedges, the maximum length of time over which forecasted transactions are hedged is approximately 25 years, with a substantial portion of the hedged transactions being less than 10 years. For open or future cash flow hedges, the maximum length of time over which forecasted transactions are or will be hedged is less than seven years.
Changes in the fair value of derivatives designated as fair value hedges are recorded in earnings, together and in the same income statement line item with changes in the fair value of the related hedged item. Changes in the fair value of derivatives designated
as cash flow hedges are recorded in accumulated other comprehensive income (OCI) and are reclassified into the line item in the income statement in which the hedged item is recorded and in the same period the hedged item affects earnings. Hedge ineffectiveness and gains and losses on the excluded component of a derivative in assessing hedge effectiveness are recorded in earnings in the same income statement line item. The Corporation records changes in the fair value of derivatives used as hedges of the net investment in foreign operations, to the extent effective, as a component of accumulated OCI.
If a derivative instrument in a fair value hedge is terminated or the hedge designation removed, the previous adjustments to the carrying amount of the hedged asset or liability are subsequently accounted for in the same manner as other components of the carrying amount of that asset or liability. For interest-earning assets and interest-bearing liabilities, such adjustments are amortized to earnings over the remaining life of the respective asset or liability. If a derivative instrument in a cash flow hedge is terminated or the hedge designation is removed, related amounts in accumulated OCI are reclassified into earnings in the same period or periods during which the hedged forecasted transaction affects earnings. If it is probable that a forecasted transaction will not occur, any related amounts in accumulated OCI are reclassified into earnings in that period.
Interest Rate Lock Commitments
The Corporation enters into IRLCs in connection with its mortgage banking activities to fund residential mortgage loans at specified times in the future. IRLCs that relate to the origination of mortgage loans that will be held-for-sale are considered derivative instruments under applicable accounting guidance. As such, these IRLCs are recorded at fair value with changes in fair value recorded in mortgage banking income.income (loss), typically resulting in recognition of a gain when the Corporation enters into IRLCs.
In estimating the fair value of an IRLC, the Corporation assigns a probability tothat the loan commitment based on an expectation that it will be exercised and the loan will be funded. The fair value of the commitments is derived from the fair value of related mortgage loans which is based on observable market data and includes the expected net future cash flows related to servicing of the loans. Changes to the fair value of IRLCs are recognized based on interest rate changes, changes in the probability that the commitment will
be exercised and the passage of time. Changes from the expected future cash flows related to the customer relationship are excluded from the valuation of IRLCs.
Outstanding IRLCs expose the Corporation to the risk that the price of the loans underlying the commitments might decline from inception of the rate lock to funding of the loan. To protect againstmanage this risk, the Corporation utilizes forward loan sales commitments and other derivative instruments, including interest rate swaps and options, to economically hedge the risk of potential changes in the value of the loans that would result from the commitments. The changes in the fair value of these derivatives are recorded in mortgage banking income.income (loss).
Securities
Debt securities are recorded on the Consolidated Balance Sheet as of their trade date. Debt securities bought principally with the intent to buy and sell in the short term as part of the Corporation’s trading activities are reported at fair value in trading account assets with unrealized gains and losses included in trading
account profits (losses). Debt securities purchased for longer term investment purposes, as part of asset and liability management (ALM) and other strategic activities are generally reported at fair value as available-for-sale (AFS) securities with net unrealized gains and losses included in accumulated OCIOCI. Certain debt securities purchased for ALM and presented as available-for-sale (AFS) securities. Certain debtother strategic purposes are reported in other assets at fair value with unrealized gains and losses reported in other income (loss). Debt securities which management has the intent and ability to hold to maturity (HTM) are reported at amortized cost and presented as HTM securities.cost. Other debt securities purchased for use in other risk management activities, such as economic hedgeshedging certain market risks related to MSRs, are reported in other assets at fair value with unrealized gains and losses reported in the same line item in the Consolidated Statement of Income as unrealized gains and losses on the item being hedged are reported.hedged.
The Corporation regularly evaluates each AFS and HTM debt security where the value has declined below amortized cost to assess whether the decline in fair value is other-than-temporary.other than temporary. In determining whether an impairment is other-than-temporary,other than temporary, the Corporation considers the severity and duration of the decline in fair value, the length of time expected for recovery, the financial condition of the issuer, and other qualitative factors, as well as whether the Corporation either plans to sell the security or it is more-likely-than-not that it will be required to sell the security before recovery of its amortized cost. If the impairment of the AFS or HTM debt security is credit-related, an other-than-temporary impairment (OTTI) is recorded in earnings. For AFS debt securities, the non-credit-related impairment is recognized in accumulated OCI. If the Corporation intends to sell an AFS debt security or believes it will more-likely-than-not be required to sell a security, the Corporation records the full amount of the impairment as an OTTI.
Interest on debt securities, including amortization of premiums and accretion of discounts, is included in interest income. Realized gains and losses from the sales of debt securities which are included in gains (losses) on sales of debt securities, are determined using the specific identification method.
Marketable equity securities are classified based on management’s intention on the date of purchase and recorded on the Consolidated Balance Sheet as of the trade date. Marketable equity securities that are bought and held principally for the purpose of resale in the near term are classified as trading and are carried at fair value with unrealized gains and losses included in trading account profits (losses).profits. Other marketable equity securities are accounted for as AFS and classified in other assets. All AFS marketable equity securities are carried at fair value with
net unrealized gains and losses included in accumulated OCI on an after-tax basis. If there is an other-than-temporary decline in the fair value of any individual AFS marketable equity security, the cost basis is reduced and the Corporation reclassifies the associated net unrealized loss out of accumulated OCI with a corresponding charge to equity investment income. Dividend income on AFS marketable equity securities is included in equity investment income. Realized gains and losses on the sale of all AFS marketable equity securities, which are recorded in equity investment income, are determined using the specific identification method.
Certain equity investments held by Global Principal Investments (GPI), the Corporation’s diversified equity investor in private equity, real estate and other alternative investments, are subject to investment company accounting under applicable accounting guidance, and accordingly, are carried at fair value with changes in fair value reported in equity investment income. These investments are included in other assets. Initially, the transaction price of the investment is generally considered to be the best
indicator of fair value. Thereafter, valuation of direct investments is based on an assessment of each individual investment using methodologies that include publicly-traded comparables derived by multiplying a key performance metric (e.g., earnings before interest, taxes, depreciation and amortization) of the portfolio company by the relevant valuation multiple observed for comparable companies, acquisition comparables, entry level multiples and discounted cash flows,flow analyses, and are subject to appropriate discounts for lack of liquidity or marketability. Certain factors that may influence changes in fair value include but are not limited to recapitalizations, subsequent rounds of financing and offerings in the equity or debt capital markets. For fund investments, the Corporation generally records the fair value of its proportionate interest in the fund’s capital as reported by the funds’ respective fund managers.
Other investments held by GPI are accounted for under either the equity method or at cost, depending on the Corporation’s ownership interest, and are reported in other assets.
Loans and Leases
Loans measured at historical cost are reported at their outstanding principal balances net of any unearned income, charge-offs, unamortized deferred fees and costs on originated loans, and for purchased loans, net of any unamortized premiums or discounts. Loan origination fees and certain direct origination costs are deferred and recognized as adjustments to interest income over the lives of the related loans. Unearned income, discounts and premiums are amortized to interest income using a level yield methodology. The Corporation elects to account for certain consumer and commercial loans under the fair value option with changes in fair value reported in other income for consumer and commercial loans.(loss).
Under applicable accounting guidance, for reporting purposes, the loan and lease portfolio is categorized by portfolio segment and, within each portfolio segment, by class of financing receivables. A portfolio segment is defined as the level at which an entity develops and documents a systematic methodology to determine the allowance for credit losses, and a class of financing receivables is defined as the level of disaggregation of portfolio segments based on the initial measurement attribute, risk characteristics and methods for assessing risk. The Corporation’s three portfolio segments are home loans, credit cardHome Loans, Credit Card and other consumer,Other Consumer, and commercial.Commercial. The classes within the home loans
Home Loans portfolio segment are core portfolio residential mortgage, Legacy AssetAssets & Servicing residential mortgage, Countrywide Financial Corporation (Countrywide) residential mortgage purchased credit-impaired (PCI), core portfolio home equity, Legacy AssetAssets & Servicing home equity, Countrywide home equity PCI, Legacy AssetAssets & Servicing discontinued real estate and Countrywide discontinued real estate PCI. The classes within the credit cardCredit Card and other consumerOther Consumer portfolio segment are U.S. credit card, non-U.S. credit card, direct/indirect consumer and other consumer. The classes within the commercialCommercial portfolio segment are U.S. commercial, commercial real estate, commercial lease financing, non-U.S. commercial and U.S. small business commercial.
Purchased Credit-impaired Loans
The Corporation purchases loans with and without evidence of credit quality deterioration since origination. Evidence of credit quality deterioration as of the purchase date may include statistics such as past due status, refreshed borrower credit scores and refreshed loan-to-value (LTV) ratios, some of which are not
immediately available as of the purchase date. Purchased loans with evidence of credit quality deterioration for which it is probable that the Corporation will not receive all contractually required payments receivable are accounted for as PCI loans. The excess of the cash flows expected to be collected on PCI loans, measured as of the acquisition date, over the estimated fair value is referred to as the accretable yield and is recognized in interest income over the remaining life of the loan using a level yield methodology. The difference between contractually required payments as of the acquisition date and the cash flows expected to be collected is referred to as the nonaccretable difference. PCI loans that have similar risk characteristics, primarily credit risk, collateral type and interest rate risk, are pooled and accounted for as a single asset with a single composite interest rate and an aggregate expectation of cash flows. Once a pool is assembled, it is treated as if it was one loan for purposes of applying the accounting guidance for PCI loans. An individual loan is removed from a PCI loan pool if it is sold, foreclosed, forgiven or the expectation of any future proceeds is remote. When a loan is removed from a PCI loan pool and the foreclosure or recovery value of the loan is less than the loan’s carrying value, the difference is first applied against the PCI pool’s nonaccretable difference. If the nonaccretable difference has been fully utilized, only then is the PCI pool’s basis applicable to that loan written-off against its valuation reserve; however, the integrity of the pool is maintained and it continues to be accounted for as if it was one loan.
The Corporation continues to estimate cash flows expected to be collected over the life of the loanPCI loans using internal credit risk, interest rate and prepayment risk models that incorporate management’s best estimate of current key assumptions such as default rates, loss severity and payment speeds. If, upon subsequent evaluation, the Corporation determines it is probable that the present value of the expected cash flows havehas decreased, the PCI loan is considered to be further impaired resulting in a charge to the provision for credit losses and a corresponding increase to a valuation allowance included in the allowance for loan and lease losses. If, upon subsequent evaluation, it is probable that there is an increase in the present value of the expected cash flows, the Corporation reduces any remaining valuation allowance. If there is no remaining valuation allowance, the Corporation recalculates the amount of accretable yield as the excess of the revised expected cash flows over the current carrying value resulting in a reclassification from nonaccretable difference to accretable yield. The present value of the expected cash flows is determined using the PCI loans’ effective interest rate, adjusted for changes in the PCI loans’ interest rate indexes.indices.
Loan disposals, which may include sales of loans, receipt of payments in full from the borrower or foreclosure, result in removal of the loan from the PCI loan pool. Write-downs are not recorded on the PCI loan pool until actual losses exceed the remaining nonaccretable difference. To date, no write-downs have been recorded for any of the PCI loan pools.
Leases
The Corporation provides equipment financing to its customers through a variety of lease arrangements. Direct financing leases are carried at the aggregate of lease payments receivable plus estimated residual value of the leased property less unearned income. Leveraged leases, which are a form of financing leases, are carried net of nonrecoursenon-recourse debt. Unearned income on leveraged and direct financing leases is accreted to interest income over the lease terms using methods that approximate the interest method.
Allowance for Credit Losses
The allowance for credit losses, which includes the allowance for loan and lease losses and the reserve for unfunded lending
commitments, represents management’s estimate of probable losses inherent in the Corporation’s lending activities. The allowance for loan and lease losses and the reserve for unfunded lending commitments exclude amounts for loans and unfunded lending commitments accounted for under the fair value option as the fair values of these instruments reflect a credit component. The allowance for loan and lease losses does not include amounts related to accrued interest receivable, other than billed interest and fees on credit card receivables, as accrued interest receivable is reversed when a loan is placed on nonaccrual status. The allowance for loan and lease losses represents the estimated probable credit losses on funded consumer and commercial loans and leases while the reserve for unfunded lending commitments, including standby letters of credit (SBLCs) and binding unfunded loan commitments, represents estimated probable credit losses on these unfunded credit instruments based on utilization assumptions. CreditLending-related credit exposures deemed to be uncollectible, excluding derivative assets, trading account assets and loans carried at fair value, are charged against these accounts. Write-offs on PCI loans on which there is a valuation allowance are written-off against the valuation allowance. For additional information, see Purchased Credit-impaired Loans. Cash recovered on previously charged off amounts is recorded as a recovery to these accounts. Management evaluates the adequacy of the allowance for credit losses based on the combined total of the allowance for loan and lease losses and the reserve for unfunded lending commitments.
The Corporation performs periodic and systematic detailed reviews of its lending portfolios to identify credit risks and to assess the overall collectability of those portfolios. The allowance on certain homogeneous consumer loan portfolios, which generally consist of consumer real estate within the home loansHome Loans portfolio segment and credit card loans within the credit cardCredit Card and other consumerOther Consumer portfolio segment, is based on aggregated portfolio segment evaluations generally by product type. Loss forecast models are utilized for these portfolios which consider a variety of factors including, but not limited to, historical loss experience, estimated defaults or foreclosures based on portfolio trends, delinquencies, bankruptcies, economic conditions and credit scores.
The Corporation’s home loansHome Loans portfolio segment is comprised primarily of large groups of homogeneous consumer loans secured by residential real estate. The amount of losses incurred in the homogeneous loan pools is estimated based upon how many of the loans will default and the loss in the event of default. Using statistically valid modeling methodologies, the Corporation estimates how many of the homogeneous loans will default based on the individual loans’ attributes aggregated into pools of homogeneous loans with similar attributes. The attributes that are most significant to the probability of default and are used to
estimate default include refreshed LTV or in the case of a subordinated lien, refreshed combined loan-to-value (CLTV), borrower credit score, months since origination (referred to as vintage) and geography, all of which are further broken down by present collection status (whether the loan is current, delinquent, in default or in bankruptcy). This estimate is based on the Corporation’s historical experience with the loan portfolio. The estimate is adjusted to reflect an assessment of environmental factors not yet reflected in the historical data underlying the loss estimates, such as changes in real estate values, local and national economies, underwriting standards and the regulatory environment. The probability of default on a loan is based on an analysis of the movement of loans with the measured attributes from either current or any of the delinquency categories
to default over a twelve-month period. On home equity loans where the Corporation holds only a second-lien position and foreclosure is not the best alternative, the loss severity is estimated at 100 percent.
The allowance on certain commercial loans (except business card and certain small business loans) is calculated using loss rates delineated by risk rating and product type. Factors considered when assessing loss rates include the value of the underlying collateral, if applicable, the industry of the obligor, and the obligor’s liquidity and other financial indicators along with certain qualitative factors. These statistical models are updated regularly for changes in economic and business conditions. Included in the analysis of consumer and commercial loan portfolios are reserves which are maintained to cover uncertainties that affect the Corporation’s estimate of probable losses including domestic and global economic uncertainty and large single name defaults.
The remaining commercial portfolios, including nonperforming commercial loans, as well as consumer real estateand commercial loans modified in a TDR, renegotiated credit card, unsecured consumer and small business loanstroubled debt restructuring (TDR) are reviewed in accordance with applicable accounting guidance on impaired loans and TDRs. If necessary, a specific allowance is established for these loans if they are deemed to be impaired. A loan is considered impaired when, based on current information and events, it is probable that the Corporation will be unable to collect all amounts due, including principal and/or interest, according toin accordance with the contractual terms of the agreement, and once a loan has been identified as impaired, management measures impairment. Impaired loans and TDRs are primarily measured based on the present value of payments expected to be received, discounted at the loans’ original effective contractual interest rates, or discounted at the portfolio average contractual annual percentage rate, excluding promotionally priced loans, in effect prior to restructuring for the renegotiated TDR portfolio.restructuring. Impaired loans and TDRs may also be measured based on observable market prices, or for loans that are solely dependent on the collateral for repayment, the estimated fair value of the collateral less estimated costs to sell. If the recorded investment in impaired loans exceeds this amount, a specific allowance is established as a component of the allowance for loan and lease losses unless these are secured consumer real estate loans that are solely dependent on the collateral for repayment, in which case the initial amount that exceeds the fair value of the collateral is charged off.
Generally, when determining the fair value of the collateral securing consumer real estate-secured loans that are solely dependent on the collateral for repayment, prior to performing a detailed property valuation including a walk-through of a property, the Corporation initially estimates the fair value of the collateral securing these consumer loans that are solely dependent on the collateral for repayment
using an automated valuation method (AVM). An AVM is a tool that estimates the value of a property by reference to market data including sales of comparable properties and price trends specific to the Metropolitan Statistical Area in which the property being valued is located. In the event that an AVM value is not available, the Corporation utilizes publicized indices or if these methods provide less reliable valuations, the Corporation uses appraisals or broker price opinions to estimate the fair value of the collateral. While there is inherent imprecision in these valuations, the Corporation believes that they are representative of the portfolio in the aggregate.
In addition to the allowance for loan and lease losses, the Corporation also estimates probable losses related to unfunded lending commitments, such as letters of credit and financial guarantees, and binding unfunded loan commitments. The reserve for unfunded lending commitments excludes commitments
accounted for under the fair value option. Unfunded lending commitments are subject to individual reviews and are analyzed and segregated by risk according to the Corporation’s internal risk rating scale. These risk classifications, in conjunction with an analysis of historical loss experience, utilization assumptions, current economic conditions, performance trends within the portfolio and any other pertinent information, result in the estimation of the reserve for unfunded lending commitments.
The allowance for credit losses related to the loan and lease portfolio is reported separately on the Consolidated Balance Sheet whereas the reserve for unfunded lending commitments is reported on the Consolidated Balance Sheet in accrued expenses and other liabilities. The provision for credit losses related to the loan and lease portfolio and unfunded lending commitments is reported in the Consolidated Statement of Income.
Nonperforming Loans and Leases, Charge-offs and Delinquencies
Nonperforming loans and leases generally include loans and leases that have been placed on nonaccrual status, including nonaccruing loans whose contractual terms have been restructured in a manner that grants a concession to a borrower experiencing financial difficulties. Loans accounted for under the fair value option, PCI loans and LHFS are not reported as nonperforming loans and leases.
In accordance with the Corporation’s policies, credit card loans where the borrower is not deceased or in bankruptcy and unsecured consumer loans are charged off no later than the end of the month in which the account becomes 180 days past due. The outstanding balance of real estate-secured loans, that is in excess of the estimated property value, less estimated costs to sell, is charged off no later than the end of the month in which the account becomes 180including residential mortgages and home equity loans, are generally placed on nonaccrual status and classified as nonperforming at 90 days past due unless repayment of the loan is insured by the Federal Housing Administration (FHA) or through individually insured long-term standby agreements with Fannie Mae (FNMA) andor Freddie Mac (FHLMC) (the fully-insured portfolio). The estimated property value, less estimated costs to sell, is determined using the same process as described for impairedResidential mortgage loans in the Allowance for Credit Losses section of this Note on page 162. Personal property-secured loans are charged off no later than the end of the month in which the account becomes 120 days past due. Unsecured accounts associated with borrowers who became deceased or are in bankruptcy, including credit cards, are charged off 60 days after receipt of notification. For secured products, accounts in bankruptcy are written down to
the collateral value, less costs to sell, by the end of the month in which the account becomes 60 days past due. Consumer credit card loans, consumer loans secured by personal property and unsecured consumer loans are not placed on nonaccrual status prior to charge-off and therefore are not reported as nonperforming loans. Real estate-secured loans are generally placed on nonaccrual status and classified as nonperforming at 90 days past due. However, consumer loans secured by real estate in the fully-insured portfolio are not placed on nonaccrual status and, therefore, are not reported as nonperforming loans. Junior-lien home equity loans are placed on nonaccrual status and classified as nonperforming when the underlying first-lien mortgage loan becomes 90 days past due even if the junior-lien loan is current. Accrued interest receivable is reversed when a consumer loan is placed on nonaccrual status. Interest collections on nonaccruing consumer loans for which the ultimate collectability of principal is uncertain are generally applied as principal reductions; otherwise, such collections are credited to interest income when received. These loans may be restored to accrual status when all principal and interest is current and full repayment of the remaining contractual principal and interest is expected, or when the loan otherwise becomes well-secured and is in the process of collection. The outstanding balance of real estate-secured loans that is in excess of the estimated property value, less estimated costs to sell, is charged off no later than the end of the month in which the account becomes 180 days past due unless the loan is fully insured. The estimated property value, less estimated costs to sell, is determined using the same process as described for impaired loans in the Allowance for Credit Losses section of this Note.
Consumer loans whose contractual termssecured by personal property, credit card loans and other unsecured consumer loans are not placed on nonaccrual status prior to charge-off and, therefore, are not reported as nonperforming loans, except for certain secured consumer loans, including those that have been modified in a TDR and are current at the time of restructuring remain on accrual status if there is demonstrated performance prior to the restructuring and payment in full under the restructured terms is expected. Otherwise, theTDR. Personal property-secured loans are placed on nonaccrual status and reported as nonperforming until there is sustained repayment performance for a reasonable period, generally six months. Consumer TDRs that are on accrual status are reported as performing TDRs throughcharged off to collateral value no later than the end of the calendar yearmonth in which the restructuring occurredaccount becomes 120
days past due or, for loans in bankruptcy, 60 days past due. Credit card and other unsecured consumer loans are charged off no later than the yearend of the month in which the loans are returned to accrual status. In addition, if accruing consumer TDRs bear less than a market rateaccount becomes 180 days past due or within 60 days after receipt of interest at the timenotification of modification, they are reported as performing TDRs throughout their remaining lives unless and until they cease to perform in accordance with their modified contractual terms, at which time they would be placed on nonaccrual status and reported as nonperforming TDRs.death or bankruptcy.
Commercial loans and leases, excluding business card loans, that are past due 90 days or more as to principal or interest, or where reasonable doubt exists as to timely collection, including loans that are individually identified as being impaired, are generally placed on nonaccrual status and classified as nonperforming unless well-secured and in the process of collection. Commercial loans and leases whose contractual terms have been modified in a TDR are typically placed on nonaccrual status and reported as nonperforming until the loans have performed for an adequate period of time under the restructured agreement, generally six months. If the borrower had demonstrated performance under the previous terms and the underwriting process shows the capacity to continue to perform under the modified terms, the loans and leases may remain on accrual status. Accruing commercial TDRs are reported as performing TDRs through the end of the calendar year in which the loans are returned to accrual status. In addition, if accruing commercial TDRs bear less than a market rate of interest at the time of modification, they are reported as performing TDRs throughout their remaining lives unless and until they cease to perform in accordance with their modified contractual terms, at which time they would be placed on nonaccrual status and reported as nonperforming TDRs.
Accrued interest receivable is reversed when a commercial loan isloans and leases are placed on nonaccrual status. Interest collections on nonaccruing
commercial loans and leases for which the ultimate collectability of principal is uncertain are applied as principal reductions; otherwise, such collections are credited to income when received. Commercial loans and leases may be restored to accrual status when all principal and interest is current and full repayment of the remaining contractual principal and interest is expected, or when the loan otherwise becomes well-secured and is in the process of collection. Business card loans are charged off no later than the end of the month in which the account becomes 180 days past due or 60 days after receipt of notification of death or bankruptcy filing. These loans are not placed on nonaccrual status prior to charge-off and, therefore, are not reported as nonperforming loans. Other commercial loans and leases are generally charged off when all or a portion of the principal amount is determined to be uncollectible.
The entire balance of a consumer andloan or commercial loan or lease is contractually delinquent if the minimum payment is not received by the specified due date on the customer’s billing statement. Interest and fees continue to accrue on past due loans and leases until the date the loan goes intois placed on nonaccrual status, if applicable.
PCI loans are recorded at fair value at the acquisition date. Although the PCI loans may be contractually delinquent, the Corporation does not classify these loans as nonperforming as the loans were written down to fair value at the acquisition date and the accretable yield is recognized in interest income over the remaining life of the loan. In addition, reported net charge-offs exclude write-downswrite-offs on PCI loan poolsloans as the fair value already considers the estimated credit losses.
Troubled Debt Restructurings
Consumer loans and commercial loans and leases whose contractual terms have been restructured in a manner that grants a concession to a borrower experiencing financial difficulties are classified as TDRs. Concessions could include a reduction in the interest rate to a rate that is below market on the loan, payment extensions, forgiveness of principal, forbearance, or other actions designed to maximize collections. Secured consumer loans that have been discharged in Chapter 7 bankruptcy and have not been reaffirmed by the borrower are classified as TDRs at the time of discharge. Consumer real estate-secured loans for which a binding offer to restructure has been extended are also classified as TDRs. Loans classified as TDRs are considered impaired loans. Loans that are carried at fair value, LHFS and PCI loans are not classified as TDRs.
Secured consumer loans whose contractual terms have been modified in a TDR and are current at the time of restructuring generally remain on accrual status if there is demonstrated performance prior to the restructuring and payment in full under the restructured terms is expected. Otherwise, the loans are placed on nonaccrual status and reported as nonperforming, except for the fully-insured loans, until there is sustained repayment performance for a reasonable period, generally six months. If accruing consumer TDRs cease to perform in accordance with their modified contractual terms, they are placed on nonaccrual status and reported as nonperforming TDRs. Consumer TDRs that bear a below-market rate of interest are generally reported as TDRs throughout their remaining lives. Secured consumer loans that have been discharged in Chapter 7 bankruptcy are placed on nonaccrual status and written down to the collateral value, less estimated costs to sell, no later than the time of discharge. Interest collections on these loans are generally recorded in interest income on a cash basis. Credit card and other unsecured consumer loans that have been renegotiated in a TDR are not placed on nonaccrual status. Credit card and other unsecured consumer loans that have been renegotiated and placed on a fixed payment plan after July 1, 2012 are generally charged off no later than the end of the month in which the account becomes 120 days past due.
Commercial loans and leases whose contractual terms have been modified in a TDR are typically placed on nonaccrual status and reported as nonperforming until the loans or leases have performed for an adequate period of time under the restructured agreement, generally six months. If the borrower had demonstrated performance under the previous terms and the underwriting process shows the capacity to continue to perform under the modified terms, the loan may remain on accrual status. Accruing commercial TDRs are reported as performing TDRs through the end of the calendar year in which the loans are returned to accrual status. In addition, if accruing commercial TDRs bear less than a market rate of interest at the time of modification, they are reported as performing TDRs throughout their remaining lives unless and until they cease to perform in accordance with their modified contractual terms, at which time they are placed on nonaccrual status and reported as nonperforming TDRs.
A loan that had previously been modified in a TDR and is subsequently refinanced under current underwriting standards at a market rate with no concessionary terms is accounted for as a new loan and is no longer reported as a TDR.
Loans Held-for-sale
Loans that are intended to be sold in the foreseeable future, including residential mortgages, loan syndications, and to a lesser degree, commercial real estate, consumer finance and other loans, are reported as LHFS and are carried at the lower of aggregate cost or fair value. The Corporation accounts for certain LHFS, including first mortgage LHFS, under the fair value option. Mortgage loan origination costs related to LHFS that the Corporation accounts for under the fair value option are recognized
in noninterest expense when incurred. Mortgage loan origination costs for LHFS carried at the lower of cost or fair value are capitalized as part of the carrying amount of the loans and recognized as a reduction of mortgage banking income upon the sale of such loans. LHFS that are on nonaccrual status and are reported as nonperforming, as defined in the policy above,herein, are reported separately from nonperforming loans and leases.
Premises and Equipment
Premises and equipment are carried at cost less accumulated depreciation and amortization. Depreciation and amortization are recognized using the straight-line method over the estimated useful lives of the assets. Estimated lives range up to 40 years for buildings, up to 12 years for furniture and equipment, and the shorter of lease term or estimated useful life for leasehold improvements.
The Corporation capitalizes the costs associated with certain computer hardware, software and internally developed software, and amortizes the costs over the expected useful life. Direct project costs of internally developed software are capitalized when it is probable that the project will be completed and the software will be used for its intended function.
Mortgage Servicing Rights
The Corporation accounts for consumer-related MSRs at fair value with changes in fair value recorded in mortgage banking income (loss), while commercial-related and residential reverse mortgage MSRs are accounted for using the amortization method (lower of amortized cost or fair value) with impairment recognized as a reduction in mortgage banking income.income (loss). To reduce the volatility of earnings related to interest rate and market value fluctuations, U.S. Treasury securities, mortgage-backed securities (MBS) and derivatives such as options and interest rate swaps may be used as economic hedgesrisk management derivatives to hedge certain market risks of the MSRs, but are not designated as qualifying accounting hedges. These economic hedgesinstruments are carried at fair value with changes in fair value recognized in mortgage banking income.income (loss).
The Corporation estimates the fair value of the consumer MSRs using a valuation model that calculates the present value of estimated future net servicing income. Thisincome and, when available, quoted prices from independent parties. The present value calculation is accomplished through an option-adjusted spread (OAS) valuation approach that factors in prepayment risk. This approach consists of projecting servicing cash flows under multiple interest rate scenarios and discounting these cash flows using risk-adjusted discount rates. The key economic assumptions used in MSR valuations of MSRs include weighted-average lives of the MSRs and the OAS levels. The OAS represents the spread that is added to the discount rate so that the sum of the discounted cash flows equals the market price,price; therefore, it is a measure of the extra yield over
the reference discount factor that the Corporation expects to earn by holding the asset. These variables can, and generally do, change from quarter to quarter as market conditions and projected interest rates change, and could have an adverse impact on the value of the MSRs and could result in a corresponding reduction in mortgage banking income.
Goodwill and Intangible Assets
Goodwill is the purchase premium after adjusting for the fair value of net assets acquired. Goodwill is not amortized but is reviewed for potential impairment on an annual basis, or when events or circumstances indicate a potential impairment, at the reporting unit level. A reporting unit, as defined under applicable accounting guidance, is a business segment or one level below a business segment. The goodwill impairment analysis is a two-step test. During 2011, the Corporation early adopted new accounting guidance that simplifies goodwill impairment testing by permitting entities to make a qualitative assessment of whether it is likely that the fair value of a reporting unit is less than its carrying value. For additional information, see New Accounting Pronouncements in this Note on page 158. The first step of the goodwill impairment test involves comparing the fair value of each reporting unit with its carrying amount including goodwill.goodwill as measured by allocated equity. In certain circumstances, the first step may be performed using a qualitative assessment. If the fair value of the reporting unit exceeds its carrying amount, goodwill of the reporting unit is considered not
impaired; however, if the carrying amount of the reporting unit exceeds its fair value, the second step must be performed to measure potential impairment.
The second step involves calculating an implied fair value of goodwill for each reporting unit for which the first step indicated possible impairment. The implied fair value of goodwill is determined in the same manner as the amount of goodwill recognized in a business combination, which is the excess of the fair value of the reporting unit, as determined in the first step, over the aggregate fair values of the assets, liabilities and identifiable intangibles as if the reporting unit was being acquired in a business
combination. Measurement of the fair values of the assets and liabilities of a reporting unit is consistent with the requirements of the fair value measurements accounting guidance, which defines fair value as an exit price, meaning the price that would be received to sell an asset or paid to transfer a liability in an orderly transaction between market participants at the measurement date.described herein. The adjustments to measure the assets, liabilities and intangibles at fair value are for the purpose of measuring the implied fair value of goodwill and such adjustments are not reflected in the Consolidated Balance Sheet. If the implied fair value of goodwill exceeds the goodwill assigned to the reporting unit, there is no impairment. If the goodwill assigned to a reporting unit exceeds the implied fair value of goodwill, an impairment charge is recorded for the excess. An impairment loss recognized cannot exceed the amount of goodwill assigned to a reporting unit. An impairment loss establishes a new basis in the goodwill and subsequent reversals of goodwill impairment losses are not permitted under applicable accounting guidance.
For intangible assets subject to amortization, an impairment loss is recognized if the carrying amount of the intangible asset is not recoverable and exceeds fair value. The carrying amount of the intangible asset is considered not recoverable if it exceeds the sum of the undiscounted cash flows expected to result from the use of the asset.
Variable Interest Entities
A VIE is an entity that lacks equity investors or whose equity investors do not have a controlling financial interest in the entity through their equity investments. The entity that has a controlling financial interest in a VIE is referred to as the primary beneficiary and consolidates the VIE. The Corporation is deemed to have a controlling financial interest and is the primary beneficiary of a VIE if it has both the power to direct the activities of the VIE that most significantly impact the VIE’s economic performance and an obligation to absorb losses or the right to receive benefits that could potentially be significant to the VIE. On a quarterly basis, the Corporation reassesses whether it has a controlling financial interest in and is the primary beneficiary of a VIE. The quarterly reassessment process considers whether the Corporation has acquired or divested the power to direct the activities of the VIE through changes in governing documents or other circumstances. The reassessment also considers whether the Corporation has acquired or disposed of a financial interest that could be significant to the VIE, or whether an interest in the VIE has become significant or is no longer significant. The consolidation status of the VIEs with which the Corporation is involved may change as a result of such reassessments. Changes in consolidation status are applied prospectively, with assets and liabilities of a newly consolidated VIE initially recorded at fair value. A gain or loss may be recognized upon deconsolidation of a VIE depending on the carrying amounts of deconsolidated assets and liabilities compared to the fair value of retained interests and ongoing contractual arrangements.
The Corporation primarily uses VIEs for its securitization activities, in which the Corporation transfers whole loans or debt securities into a trust or other vehicle such that the assets are legally isolated from the creditors of the Corporation. Assets held in a trust can only be used to settle obligations of the trust. The creditors of these trusts typically have no recourse to the Corporation except in accordance with the Corporation’s obligations under standard representations and warranties.
When the Corporation is the servicer of whole loans held in a securitization trust, including non-agency residential mortgages, home equity loans, credit cards, automobile loans and student loans, the Corporation has the power to direct the most significant activities of the trust. The Corporation does not have the power to direct the most significant activities of a residential mortgage agency trust unless the Corporation holds substantially all of the issued securities and has the unilateral right to liquidate the trust. The power to direct the most significant activities of a commercial mortgage securitization trust is typically held by the special servicer or by the party holding specific subordinate securities which embody certain controlling rights. The Corporation consolidates a whole-loan securitization trust if it has the power to direct the most significant activities and also holds securities issued by the trust or has other contractual arrangements, other than standard representations and warranties, that could potentially be significant to the trust.
The Corporation may also transfer trading account securities and AFS securities into municipal bond or resecuritization trusts. The Corporation consolidates a municipal bond or resecuritization trust if it has control over the ongoing activities of the trust such as the remarketing of the trust’s liabilities or, if there are no ongoing activities, sole discretion over the design of the trust, including the identification of securities to be transferred in and the structure of securities to be issued, and also retains securities or has liquidity or other commitments that could potentially be significant to the trust. The Corporation does not consolidate a municipal bond or resecuritization trust if one or a limited number of third-party investors share responsibility for the design of the trust or have control over the significant activities of the trust through liquidation or other substantive rights.
Other VIEs used by the Corporation include collateralized debt obligations (CDOs), investment vehicles created on behalf of customers and other investment vehicles. The Corporation does not routinely serve as collateral manager for CDOs and, therefore, does not typically have the power to direct the activities that most significantly impact the economic performance of a CDO. However, following an event of default, if the Corporation is a majority holder of senior securities issued by a CDO and acquires the power to manage the assets of the CDO, the Corporation consolidates the CDO.
The Corporation consolidates a customer or other investment vehicle if it has control over the initial design of the vehicle or manages the assets in the vehicle and also absorbs potentially significant gains or losses through an investment in the vehicle, derivative contracts or other arrangements. The Corporation does not consolidate an investment vehicle if a single investor controlled the initial design of the vehicle or manages the assets in the vehicles or if the Corporation does not have a variable interest that could potentially be significant to the vehicle.
Retained interests in securitized assets are initially recorded at fair value. In addition, the Corporation may invest in debt securities issued by unconsolidated VIEs. Quoted market prices are primarily used to obtain fairFair values of these debt securities, which are AFS debt securities or trading account assets.assets,
are based primarily on quoted market prices. Generally, quoted market prices for retained residual interests are not available,available; therefore, the Corporation estimates fair values based on the present value of the associated expected future cash flows. This may require management to estimate credit losses, prepayment speeds, forward interest yield curves, discount rates and other factors that impact the value of retained interests. Retained residual interests in unconsolidated securitization trusts
are classified in trading account assets or other assets with changes in fair value recorded in income. The Corporation may also enter into derivatives with unconsolidated VIEs, which are carried at fair value with changes in fair value recorded in income.
Fair Value
The Corporation measures the fair values of its financial instruments in accordance with accounting guidance that requires an entity to base fair value on exit price, and maximizeprice. A three-level hierarchy for inputs is utilized in measuring fair value which maximizes the use of observable inputs and minimizeminimizes the use of unobservable inputs by requiring that observable inputs be used to determine the exit price.price when available. Under applicable accounting guidance, the Corporation categorizes its financial instruments, based on the priority of inputs to the valuation technique, into athis three-level hierarchy, as described below. Trading account assets and liabilities, derivative assets and liabilities, AFS debt and marketable equity securities, MSRs and certain other assets are carried at fair value in accordance with applicable accounting guidance. The Corporation has also elected to account for certain assets and liabilities under the fair value option, including certain corporatecommercial and consumer loans and loan commitments, LHFS, other short-term borrowings, securities financing agreements, asset-backed secured financings, long-term deposits and long-term debt. The following describes the three-level hierarchy.
| |
| Level 1 | Unadjusted quoted prices in active markets for identical assets or liabilities. Level 1 assets and liabilities include debt and equity securities and derivative contracts that are traded in an active exchange market, as well as certain U.S. Treasury securities that are highly liquid and are actively traded in over-the-counter (OTC) markets. |
| |
| Level 2 | Observable inputs other than Level 1 prices, such as quoted prices for similar assets or liabilities, quoted prices in markets that are not active, or other inputs that are observable or can be corroborated by observable market data for substantially the full term of the assets or liabilities. Level 2 assets and liabilities include debt securities with quoted prices that are traded less frequently than exchange-traded instruments and derivative contracts where fair value is determined using a pricing model with inputs that are observable in the market or can be derived principally from or corroborated by observable market data. This category generally includes U.S. government and agency mortgage-backed debt securities, corporate debt securities, derivative contracts, residential mortgage loans and certain LHFS. |
| |
| Level 3 | Unobservable inputs that are supported by little or no market activity and that are significant to the overall fair value of the assets or liabilities. Level 3 assets and liabilities include financial instruments for which the determination of fair value requires significant management judgment or estimation. The fair value for such assets and liabilities is generally determined using pricing models, market comparables, discounted cash flow methodologies or similar techniques that incorporate the assumptions a market participant would use in pricing the asset or liability. This category generally includes certain private equity investments and other principal investments, retained residual interests in securitizations, residential MSRs, asset-backed securities (ABS), highly structured, complex or long-dated derivative contracts, certain LHFS, IRLCs and certain |
|
| | |
166170 Bank of America 20112012
| | |
such assets and liabilities is generally determined using pricing models, market comparables, discounted cash flow methodologies or similar techniques that incorporate the assumptions a market participant would use in pricing the asset or liability. This category generally includes certain private equity investments and other principal investments, retained residual interests in securitizations, residential MSRs, asset-backed securities (ABS), highly structured, complex or long-dated derivative contracts, certain LHFS, IRLCs and certain CDOs where independent pricing information cannot be obtained for a significant portion of the underlying assets.
Income Taxes
There are two components of income tax expense: current and deferred. Current income tax expense approximatesreflects taxes to be paid or refunded for the current period. Deferred income tax expense results from changes in deferred tax assets and liabilities between periods. These gross deferred tax assets and liabilities represent decreases or increases in taxes expected to be paid in the future because of future reversals of temporary differences in the bases of assets and liabilities as measured by tax laws and their bases as reported in the financial statements. Deferred tax assets are also recognized for tax attributes such as net operating loss (NOL) carryforwards and tax credit carryforwards. Valuation allowances are recorded to reduce deferred tax assets to the amounts management concludes are more-likely-than-not to be realized.
Income tax benefits are recognized and measured based upon a two-step model: 1)first, a tax position must be more-likely-than-not to be sustained based solely on its technical merits in order to be recognized, and 2)second, the benefit is measured as the largest dollar amount of that position that is more-likely-than-not to be sustained upon settlement. The difference between the benefit recognized and the tax benefit claimed on a tax return is referred to as an unrecognized tax benefit (UTB). The Corporation records income tax-related interest and penalties, if applicable, within income tax expense.
Retirement Benefits
The Corporation has established retirement plans covering substantially all full-time and certain part-time employees. Pension expense under these plans is charged to current operations and consists of several components of net pension cost based on various actuarial assumptions regarding future experience under the plans.
In addition, the Corporation has established unfunded supplemental benefit plans and supplemental executive retirement plans (SERPs) for selected officers of the Corporation and its subsidiaries that provide benefits that cannot be paid from a qualified retirement plan due to Internal Revenue Code restrictions. The Corporation’s current executive officers do not earn additional retirement income under SERPs. These plans are nonqualified under the Internal Revenue Code and assets used to fund benefit payments are not segregated from other assets of the Corporation; therefore, in general, a participant’s or beneficiary’s claim to benefits under these plans is as a general creditor. In addition, the Corporation has established several postretirement healthcare and life insurance benefit plans.
In connection with a redesign of the retirement plans, on January 24, 2012, the Corporation froze benefits earned in the
Qualified Pension Plans effective June 30, 2012. As a result of this action, a curtailment was triggered and a remeasurement of the qualified pension obligations and plan assets occurred as of January 24, 2012. For additional information, see Note 18 – Employee Benefit Plans.
Accumulated Other Comprehensive Income
The Corporation records unrealized gains and losses on AFS debt and marketable equity securities, gains and losses on cash flow accounting hedges, unrecognized actuarial gains and losses, transition obligation and prior service costs on pension and postretirement plans,certain employee benefit plan adjustments, foreign currency translation adjustments and related hedges of net investments in foreign operations and the cumulative adjustment related to certain accounting changes in accumulated OCI, net-of-tax. Unrealized gains and losses on AFS debt and marketable equity securities are reclassified to earnings as the gains or losses are realized upon sale of the securities. Unrealized losses on AFS securities deemed to represent OTTI are
reclassified to earnings at the time of the impairment charge. For AFS debt securities that the Corporation does not intend to sell or it is not more-likely-than-not that it will be required to sell, only the credit component of an unrealized loss is reclassified to earnings. Gains or losses on derivatives accounted for as cash flow hedges are reclassified to earnings when the hedged transaction affects earnings. Translation gains or losses on foreign currency translation adjustments are reclassified to earnings upon the substantial sale or liquidation of investments in foreign operations.
Revenue Recognition
The following summarizes the Corporation’s revenue recognition policies as they relate to certain noninterest income line items in the Consolidated Statement of Income.
Card income is derived from fees such as interchange, cash advance, annual, late, over-limit and other miscellaneous fees, which are recorded as revenue when earned, primarily on an accrual basis. Uncollected fees are included in the customer card receivables balances with an amount recorded in the allowance for loan and lease losses for estimated uncollectible card receivables. Uncollected fees are written off when a card receivable reaches 180 days past due.
Service charges include fees for insufficient funds, overdrafts and other banking services and are recorded as revenue when earned. Uncollected fees are included in outstanding loan balances with an amount recorded for estimated uncollectible service fees receivable. Uncollected fees are written off when a fee receivable reaches 60 days past due.
Investment and brokerage services revenue consists primarily of asset management fees and brokerage income that is recognized over the period the services are provided or when commissions are earned. Asset management fees consist primarily of fees for investment management and trust services and are generally based on the dollar amount of the assets being managed. Brokerage income is generally derived from commissions and fees earned on the sale of various financial products.
Investment banking income consists primarily of advisory and underwriting fees that are recognized in income as the services are provided and no contingencies exist. Revenues are generally recognized net of any direct expenses. Non-reimbursed expenses are recorded as noninterest expense.
Earnings Per Common Share
Earnings per common share (EPS) is computed by dividing net income (loss) allocated to common shareholders by the weighted-average common shares outstanding, except that it does not include unvested common shares subject to repurchase or cancellation. Net income (loss) allocated to common shareholders represents net income (loss) applicable to common shareholders which is net income (loss) adjusted for preferred stock dividends including dividends declared, accretion of discounts on preferred stock including accelerated accretion when preferred stock is repaid early, and cumulative dividends related to the current dividend period that have not been declared as of period end, less income allocated to participating securities (see below for additional information). Diluted EPS is computed by dividing income (loss) allocated to common shareholders plus dividends on dilutive convertible preferred stock and preferred stock that can be tendered to exercise warrants by the weighted-average
common shares outstanding plus amounts representing the dilutive effect of stock options outstanding, restricted stock, restricted stock units (RSUs), outstanding warrants and the dilution resulting from the conversion of convertible preferred stock, if applicable. Certain warrants may be exercised, at the option of the holder, through tendering of the Corporation’s 6% Cumulative Perpetual Preferred Stock, Series T (the Series T Preferred Stock) or cash. Because it is currently more economical for the warrant holder to tender the Series T preferred stock, the common shares underlying these warrants are considered outstanding and the dividends on the preferred stock are added back to income (loss) allocable to common shareholders in computing diluted EPS, unless the effect is antidilutive.
Unvested share-based payment awards that contain nonforfeitable rights to dividends are participating securities that are included in computing EPS using the two-class method. The two-class method is an earnings allocation formula under which EPS is calculated for common stock and participating securities according to dividends declared and participating rights in undistributed earnings. Under this method, all earnings, distributed and undistributed, are allocated to participating securities and common shares based on their respective rights to receive dividends.
In an exchange of non-convertible preferred stock, income allocated to common shareholders is adjusted for the difference between the carrying value of the preferred stock and the fair value of the consideration exchanged. In an induced conversion of convertible preferred stock, income allocated to common shareholders is reduced by the excess of the fair value of the consideration exchanged over the fair value of the common stock that would have been issued under the original conversion terms.
Foreign Currency Translation
Assets, liabilities and operations of foreign branches and subsidiaries are recorded based on the functional currency of each entity. For certain of the foreign operations, the functional currency is the local currency, in which case the assets, liabilities and operations are translated, for consolidation purposes, from the local currency to the U.S. dollar reporting currency at period-end rates for assets and liabilities and generally at average rates for results of operations. The resulting unrealized gains or losses as well as gains and losses from certain hedges, are reported as a component of accumulated OCI, on an after-tax basis.net-of-tax. When the foreign entity’s functional currency is determined to be the U.S. dollar, the resulting remeasurement currency gains or losses on
foreign currency-denominated assets or liabilities are included in earnings.
Credit Card and Deposit Arrangements
Endorsing Organization Agreements
The Corporation contracts with other organizations to obtain their endorsement of the Corporation’s loan and deposit products. This endorsement may provide to the Corporation exclusive rights to market to the organization’s members or to customers on behalf of the Corporation. These organizations endorse the Corporation’s loan and deposit products and provide the Corporation with their mailing lists and marketing activities. These agreements generally have terms that range from two to five years. The Corporation typically pays royalties in exchange for the endorsement. Compensation costs related to the credit card agreements are recorded as contra-revenue in card income.
Cardholder Reward Agreements
The Corporation offers reward programs that allow its cardholders to earn points that can be redeemed for a broad range of rewards including cash, travel and discounted products. The Corporation establishes a rewards liability based upon the points earned that are expected to be redeemed and the average cost per point redeemed. The points to be redeemed are estimated based on past redemption behavior, card product type, account transaction activity and other historical card performance. The liability is reduced as the points are redeemed. The estimated cost of the rewards programs is recorded as contra-revenue in card income.
Insurance Income and Insurance Expense
Property and casualty and credit life and disability premiums are generally recognized over the term of the policies on a pro-rata basis for all policies except for certain of the lender-placed auto insurance and the guaranteed auto protection (GAP) policies. For lender-placed auto insurance, premiums are recognized when collections become probable due to high cancellation rates experienced early in the life of the policy. For GAP insurance, revenue recognition is correlated to the exposure and accelerated over the life of the contract. Mortgage reinsurance premiums are recognized as earned. Insurance expense includes insurance claims, commissions and premium taxes, all of which are recorded in other general operating expense.
Accounting Policies
All significant accounting policies are discussed either in this Note or included in the Notes herein listed below.
|
| |
| Page |
| Note 3 – Derivatives | 168 Bank of America 2011174 |
| Note 4 – Securities | |
| Note 5 – Outstanding Loans and Leases | |
| Note 7 – Securitizations and Other Variable Interest Entities | |
| Note 8 – Representations and Warranties Obligations and Corporate Guarantees | |
| Note 13 – Commitments and Contingencies | |
| Note 18 – Employee Benefit Plans | |
| Note 19 – Stock-based Compensation Plans | |
| Note 20 – Income Taxes | |
| Note 21 – Fair Value Measurements | |
| Note 24 – Mortgage Servicing Rights | |
NOTE 2 Merger and Restructuring Activity
Merger and restructuring charges are recorded in the Consolidated Statement of Income and include incremental costs to integrate the operations of the Corporation and its most recent acquisitions. These charges represent costs associated with these activities and do not represent ongoing costs of the fully integrated combined organization. The merger and restructuring charges table presents the components of merger and restructuring charges.
|
| | | | | | | | | | | |
| | | | | | |
| Merger and Restructuring Charges |
| | | | | | |
| (Dollars in millions) | 2011 | | 2010 | | 2009 |
| Severance and employee-related charges | $ | 226 |
| | $ | 455 |
| | $ | 1,351 |
|
| Systems integrations and related charges | 285 |
| | 1,137 |
| | 1,155 |
|
| Other | 127 |
| | 228 |
| | 215 |
|
| Total merger and restructuring charges | $ | 638 |
| | $ | 1,820 |
| | $ | 2,721 |
|
For 2011, all merger-related charges related to the Merrill Lynch & Co., Inc. (Merrill Lynch) acquisition. Included for 2010 and 2009 are merger-related charges of $1.6 billion and $1.8 billion related to the Merrill Lynch acquisition and $202 million and $940 million related to earlier acquisitions.
The restructuring reserves table presents the changes in restructuring reserves for 2011 and 2010. Restructuring reserves are established by a charge to merger and restructuring charges, and the restructuring charges are included in the merger and restructuring charges table. Substantially all of the amounts in the restructuring reserves table relate to the Merrill Lynch acquisition.
|
| | | | | | | |
| | | | |
| Restructuring Reserves |
| | |
| (Dollars in millions) | 2011 | | 2010 |
| Balance, January 1 | $ | 336 |
| | $ | 403 |
|
| Exit costs and restructuring charges: | |
| | |
|
| Merrill Lynch | 217 |
| | 375 |
|
| Other | — |
| | 54 |
|
| Cash payments and other | (319 | ) | | (496 | ) |
| Balance, December 31 | $ | 234 |
| | $ | 336 |
|
Amounts added to the restructuring reserves in 2011 and 2010 related to severance and other employee-related costs. Payments associated with the Merrill Lynch acquisition are anticipated to continue into 2012.
NOTE 32 Trading Account Assets and Liabilities
The table below presents the components of trading account assets and liabilities at December 31, 20112012 and 20102011.
| | | | | | | | | |
| | December 31 | December 31 |
| (Dollars in millions) | 2011 | | 2010 | 2012 | | 2011 |
| Trading account assets | |
| | |
| |
| | |
|
U.S. government and agency securities (1) | $ | 52,613 |
| | $ | 60,811 |
| $ | 86,974 |
| | $ | 52,613 |
|
| Corporate securities, trading loans and other | 36,571 |
| | 49,352 |
| 37,900 |
| | 36,571 |
|
| Equity securities | 23,674 |
| | 32,129 |
| 43,315 |
| | 23,674 |
|
| Non-U.S. sovereign debt | 42,946 |
| | 33,523 |
| 52,197 |
| | 42,946 |
|
| Mortgage trading loans and asset-backed securities | 13,515 |
| | 18,856 |
| 16,840 |
| | 13,515 |
|
| Total trading account assets | $ | 169,319 |
| | $ | 194,671 |
| $ | 237,226 |
| | $ | 169,319 |
|
| Trading account liabilities | |
| | |
| |
| | |
|
| U.S. government and agency securities | $ | 20,710 |
| | $ | 29,340 |
| $ | 23,430 |
| | $ | 20,710 |
|
| Equity securities | 14,594 |
| | 15,482 |
| 22,492 |
| | 14,594 |
|
| Non-U.S. sovereign debt | 17,440 |
| | 15,813 |
| 20,244 |
| | 17,440 |
|
| Corporate securities and other | 7,764 |
| | 11,350 |
| 7,421 |
| | 7,764 |
|
| Total trading account liabilities | $ | 60,508 |
| | $ | 71,985 |
| $ | 73,587 |
| | $ | 60,508 |
|
| |
(1) | Includes $27.330.6 billion and $29.727.3 billion of government-sponsored enterprise obligations at December 31, 20112012 and 20102011. |
|
| | |
| | | Bank of America 2012 169173 |
NOTE 43 Derivatives
Derivative Balances
Derivatives are entered into on behalf of customers, for trading, or to support risk management activities. Derivatives used in risk management activities include derivatives that may or may not be designated in qualifying hedge accounting relationships. Derivatives that are not designated in qualifying hedge accounting relationships are referred to as economic hedges or as qualifying accounting hedges.other risk management derivatives. For additional information on the Corporation’s derivatives and hedging activities, see Note 1 – Summary of Significant Accounting
Principles. The following tables identifypresent derivative instruments included on the Corporation’s Consolidated Balance Sheet in
derivative assets and liabilities at December 31, 20112012 and 20102011. Balances are presented on a gross basis, prior to the application of counterparty and cash collateral netting. Total derivative assets and liabilities are adjusted on an aggregate basis to take into consideration the effects of legally enforceable master netting agreements and have been reduced by the cash collateral applied.received or paid.
| | | | | | | | | | | | | | | | | | | | | | | | | | | | | |
| | | | December 31, 2011 | | | December 31, 2012 |
| | | | Gross Derivative Assets | | Gross Derivative Liabilities | | | Gross Derivative Assets | | Gross Derivative Liabilities |
| (Dollars in billions) | Contract/ Notional (1) | | Trading
Derivatives
and
Economic Hedges | | Qualifying
Accounting Hedges | | Total | | Trading
Derivatives
and
Economic Hedges | | Qualifying
Accounting Hedges (2) | | Total | Contract/ Notional (1) | | Trading Derivatives and Other Risk Management Derivatives | | Qualifying
Accounting Hedges | | Total | | Trading Derivatives and Other Risk Management Derivatives | | Qualifying
Accounting Hedges | | Total |
| Interest rate contracts | |
| | |
| | |
| | |
| | |
| | |
| | |
| |
| | |
| | |
| | |
| | |
| | |
| | |
|
| Swaps | $ | 40,473.7 |
| | $ | 1,490.7 |
| | $ | 15.9 |
| | $ | 1,506.6 |
| | $ | 1,473.0 |
| | $ | 12.3 |
| | $ | 1,485.3 |
| $ | 34,667.4 |
| | $ | 1,075.4 |
| | $ | 13.8 |
| | $ | 1,089.2 |
| | $ | 1,062.6 |
| | $ | 4.7 |
| | $ | 1,067.3 |
|
| Futures and forwards | 12,105.8 |
| | 2.9 |
| | 0.2 |
| | 3.1 |
| | 3.4 |
| | — |
| | 3.4 |
| 11,950.5 |
| | 2.8 |
| | — |
| | 2.8 |
| | 2.7 |
| | — |
| | 2.7 |
|
| Written options | 2,534.0 |
| | — |
| | — |
| | — |
| | 117.8 |
| | — |
| | 117.8 |
| 2,343.5 |
| | — |
| | — |
| | — |
| | 106.0 |
| | — |
| | 106.0 |
|
| Purchased options | 2,467.2 |
| | 120.0 |
| | — |
| | 120.0 |
| | — |
| | — |
| | — |
| 2,162.6 |
| | 105.5 |
| | — |
| | 105.5 |
| | — |
| | — |
| | — |
|
| Foreign exchange contracts | |
| | |
| | |
| | |
| | |
| | |
| | |
| |
| | |
| | |
| | |
| | |
| | |
| | |
|
| Swaps | 2,381.6 |
| | 48.3 |
| | 2.6 |
| | 50.9 |
| | 58.9 |
| | 2.2 |
| | 61.1 |
| 2,489.0 |
| | 47.4 |
| | 1.4 |
| | 48.8 |
| | 53.2 |
| | 1.8 |
| | 55.0 |
|
| Spot, futures and forwards | 2,548.8 |
| | 37.2 |
| | 1.3 |
| | 38.5 |
| | 39.2 |
| | 0.3 |
| | 39.5 |
| 3,023.0 |
| | 31.5 |
| | 0.4 |
| | 31.9 |
| | 30.5 |
| | 0.8 |
| | 31.3 |
|
| Written options | 368.5 |
| | — |
| | — |
| | — |
| | 9.4 |
| | — |
| | 9.4 |
| 363.3 |
| | — |
| | — |
| | — |
| | 7.3 |
| | — |
| | 7.3 |
|
| Purchased options | 341.0 |
| | 9.0 |
| | — |
| | 9.0 |
| | — |
| | — |
| | — |
| 321.8 |
| | 6.5 |
| | — |
| | 6.5 |
| | — |
| | — |
| | — |
|
| Equity contracts | |
| | |
| | |
| | |
| | |
| | |
| | |
| |
| | |
| | |
| | |
| | |
| | |
| | |
|
| Swaps | 75.5 |
| | 1.5 |
| | — |
| | 1.5 |
| | 1.7 |
| | — |
| | 1.7 |
| 127.1 |
| | 1.6 |
| | — |
| | 1.6 |
| | 2.0 |
| | — |
| | 2.0 |
|
| Futures and forwards | 52.1 |
| | 1.8 |
| | — |
| | 1.8 |
| | 1.5 |
| | — |
| | 1.5 |
| 58.4 |
| | 1.0 |
| | — |
| | 1.0 |
| | 1.0 |
| | — |
| | 1.0 |
|
| Written options | 367.1 |
| | — |
| | — |
| | — |
| | 17.7 |
| | — |
| | 17.7 |
| 295.3 |
| | — |
| | — |
| | — |
| | 20.2 |
| | — |
| | 20.2 |
|
| Purchased options | 360.2 |
| | 19.6 |
| | — |
| | 19.6 |
| | — |
| | — |
| | — |
| 271.0 |
| | 20.4 |
| | — |
| | 20.4 |
| | — |
| | — |
| | — |
|
| Commodity contracts | |
| | |
| | |
| | |
| | |
| | |
| | |
| |
| | |
| | |
| | |
| | |
| | |
| | |
|
| Swaps | 73.8 |
| | 4.9 |
| | 0.1 |
| | 5.0 |
| | 5.9 |
| | — |
| | 5.9 |
| 60.5 |
| | 2.5 |
| | 0.1 |
| | 2.6 |
| | 4.0 |
| | — |
| | 4.0 |
|
| Futures and forwards | 470.5 |
| | 5.3 |
| | — |
| | 5.3 |
| | 3.2 |
| | — |
| | 3.2 |
| 498.9 |
| | 4.8 |
| | — |
| | 4.8 |
| | 2.7 |
| | — |
| | 2.7 |
|
| Written options | 142.3 |
| | — |
| | — |
| | — |
| | 9.5 |
| | — |
| | 9.5 |
| 166.4 |
| | — |
| | — |
| | — |
| | 7.4 |
| | — |
| | 7.4 |
|
| Purchased options | 141.3 |
| | 9.5 |
| | — |
| | 9.5 |
| | — |
| | — |
| | — |
| 168.2 |
| | 7.1 |
| | — |
| | 7.1 |
| | — |
| | — |
| | — |
|
| Credit derivatives | |
| | |
| | |
| | |
| | |
| | |
| | |
| |
| | |
| | |
| | |
| | |
| | |
| | |
|
| Purchased credit derivatives: | |
| | |
| | |
| | |
| | |
| | |
| | |
| |
| | |
| | |
| | |
| | |
| | |
| | |
|
| Credit default swaps | 1,944.8 |
| | 95.8 |
| | — |
| | 95.8 |
| | 13.8 |
| | — |
| | 13.8 |
| 1,559.5 |
| | 35.6 |
| | — |
| | 35.6 |
| | 22.1 |
| | — |
| | 22.1 |
|
| Total return swaps/other | 17.5 |
| | 0.6 |
| | — |
| | 0.6 |
| | 0.3 |
| | — |
| | 0.3 |
| 43.5 |
| | 2.5 |
| | — |
| | 2.5 |
| | 2.9 |
| | — |
| | 2.9 |
|
| Written credit derivatives: | |
| | |
| | |
| | |
| | |
| | |
| | |
| |
| | |
| | |
| | |
| | |
| | |
| | |
|
| Credit default swaps | 1,885.9 |
| | 14.1 |
| | — |
| | 14.1 |
| | 90.5 |
| | — |
| | 90.5 |
| 1,531.5 |
| | 23.0 |
| | — |
| | 23.0 |
| | 32.6 |
| | — |
| | 32.6 |
|
| Total return swaps/other | 17.8 |
| | 0.5 |
| | — |
| | 0.5 |
| | 0.7 |
| | — |
| | 0.7 |
| 68.8 |
| | 0.2 |
| | — |
| | 0.2 |
| | 0.3 |
| | — |
| | 0.3 |
|
| Gross derivative assets/liabilities | |
| | $ | 1,861.7 |
| | $ | 20.1 |
| | $ | 1,881.8 |
| | $ | 1,846.5 |
| | $ | 14.8 |
| | $ | 1,861.3 |
| |
| | $ | 1,367.8 |
| | $ | 15.7 |
| | $ | 1,383.5 |
| | $ | 1,357.5 |
| | $ | 7.3 |
| | $ | 1,364.8 |
|
| Less: Legally enforceable master netting agreements | |
| | |
| | |
| | (1,749.9 | ) | | |
| | |
| | (1,749.9 | ) | |
| | |
| | |
| | (1,271.9 | ) | | |
| | |
| | (1,271.9 | ) |
| Less: Cash collateral applied | |
| | |
| | |
| | (58.9 | ) | | |
| | |
| | (51.9 | ) | |
| Less: Cash collateral received/paid | | |
| | |
| | |
| | (58.1 | ) | | |
| | |
| | (46.9 | ) |
| Total derivative assets/liabilities | |
| | |
| | |
| | $ | 73.0 |
| | |
| | |
| | $ | 59.5 |
| |
| | |
| | |
| | $ | 53.5 |
| | |
| | |
| | $ | 46.0 |
|
| |
(1) | Represents the total contract/notional amount of derivative assets and liabilities outstanding. |
| |
(2)
| Excludes $191 million of long-term debt designated as a hedge of foreign currency risk.
|
|
| | |
170174 Bank of America 20112012
| | |
| | | | | | | | | | | | | | | | | | | | | | | | | | | | | |
| | | | December 31, 2010 | | | December 31, 2011 |
| | | | Gross Derivative Assets | | Gross Derivative Liabilities | | | Gross Derivative Assets | | Gross Derivative Liabilities |
| (Dollars in billions) | Contract/ Notional (1) | | Trading
Derivatives
and
Economic Hedges | | Qualifying
Accounting Hedges | | Total | | Trading
Derivatives
and
Economic Hedges | | Qualifying
Accounting Hedges (2) | | Total | Contract/ Notional (1) | | Trading Derivatives and Other Risk Management Derivatives | | Qualifying
Accounting Hedges | | Total | | Trading Derivatives and Other Risk Management Derivatives | | Qualifying
Accounting Hedges | | Total |
| Interest rate contracts | |
| | |
| | |
| | |
| | |
| | |
| | |
| |
| | |
| | |
| | |
| | |
| | |
| | |
|
| Swaps | $ | 42,719.2 |
| | $ | 1,193.9 |
| | $ | 14.9 |
| | $ | 1,208.8 |
| | $ | 1,187.9 |
| | $ | 2.2 |
| | $ | 1,190.1 |
| $ | 40,473.7 |
| | $ | 1,490.7 |
| | $ | 15.9 |
| | $ | 1,506.6 |
| | $ | 1,473.0 |
| | $ | 12.3 |
| | $ | 1,485.3 |
|
| Futures and forwards | 9,939.2 |
| | 6.0 |
| | — |
| | 6.0 |
| | 4.7 |
| | — |
| | 4.7 |
| 12,105.8 |
| | 2.9 |
| | 0.2 |
| | 3.1 |
| | 3.4 |
| | — |
| | 3.4 |
|
| Written options | 2,887.7 |
| | — |
| | — |
| | — |
| | 82.8 |
| | — |
| | 82.8 |
| 2,534.0 |
| | — |
| | — |
| | — |
| | 117.8 |
| | — |
| | 117.8 |
|
| Purchased options | 3,026.2 |
| | 88.0 |
| | — |
| | 88.0 |
| | — |
| | — |
| | — |
| 2,467.2 |
| | 120.0 |
| | — |
| | 120.0 |
| | — |
| | — |
| | — |
|
| Foreign exchange contracts | |
| | |
| | |
| | |
| | |
| | |
| | |
| |
| | |
| | |
| | |
| | |
| | |
| | |
|
| Swaps | 630.1 |
| | 26.5 |
| | 3.7 |
| | 30.2 |
| | 28.5 |
| | 2.1 |
| | 30.6 |
| 2,381.6 |
| | 48.3 |
| | 2.6 |
| | 50.9 |
| | 58.9 |
| | 2.2 |
| | 61.1 |
|
| Spot, futures and forwards | 2,652.9 |
| | 41.3 |
| | — |
| | 41.3 |
| | 44.2 |
| | — |
| | 44.2 |
| 2,548.8 |
| | 37.2 |
| | 1.3 |
| | 38.5 |
| | 39.2 |
| | 0.3 |
| | 39.5 |
|
| Written options | 439.6 |
| | — |
| | — |
| | — |
| | 13.2 |
| | — |
| | 13.2 |
| 368.5 |
| | — |
| | — |
| | — |
| | 9.4 |
| | — |
| | 9.4 |
|
| Purchased options | 417.1 |
| | 13.0 |
| | — |
| | 13.0 |
| | — |
| | — |
| | — |
| 341.0 |
| | 9.0 |
| | — |
| | 9.0 |
| | — |
| | — |
| | — |
|
| Equity contracts | |
| | |
| | |
| | |
| | |
| | |
| | |
| |
| | |
| | |
| | |
| | |
| | |
| | |
|
| Swaps | 42.4 |
| | 1.7 |
| | — |
| | 1.7 |
| | 2.0 |
| | — |
| | 2.0 |
| 75.5 |
| | 1.5 |
| | — |
| | 1.5 |
| | 1.7 |
| | — |
| | 1.7 |
|
| Futures and forwards | 78.8 |
| | 2.9 |
| | — |
| | 2.9 |
| | 2.1 |
| | — |
| | 2.1 |
| 52.1 |
| | 1.8 |
| | — |
| | 1.8 |
| | 1.5 |
| | — |
| | 1.5 |
|
| Written options | 242.7 |
| | — |
| | — |
| | — |
| | 19.4 |
| | — |
| | 19.4 |
| 367.1 |
| | — |
| | — |
| | — |
| | 17.7 |
| | — |
| | 17.7 |
|
| Purchased options | 193.5 |
| | 21.5 |
| | — |
| | 21.5 |
| | — |
| | — |
| | — |
| 360.2 |
| | 19.6 |
| | — |
| | 19.6 |
| | — |
| | — |
| | — |
|
| Commodity contracts | |
| | |
| | |
| | |
| | |
| | |
| | |
| |
| | |
| | |
| | |
| | |
| | |
| | |
|
| Swaps | 90.2 |
| | 8.8 |
| | 0.2 |
| | 9.0 |
| | 9.3 |
| | — |
| | 9.3 |
| 73.8 |
| | 4.9 |
| | 0.1 |
| | 5.0 |
| | 5.9 |
| | — |
| | 5.9 |
|
| Futures and forwards | 413.7 |
| | 4.1 |
| | — |
| | 4.1 |
| | 2.8 |
| | — |
| | 2.8 |
| 470.5 |
| | 5.3 |
| | — |
| | 5.3 |
| | 3.2 |
| | — |
| | 3.2 |
|
| Written options | 86.3 |
| | — |
| | — |
| | — |
| | 6.7 |
| | — |
| | 6.7 |
| 142.3 |
| | — |
| | — |
| | — |
| | 9.5 |
| | — |
| | 9.5 |
|
| Purchased options | 84.6 |
| | 6.6 |
| | — |
| | 6.6 |
| | — |
| | — |
| | — |
| 141.3 |
| | 9.5 |
| | — |
| | 9.5 |
| | — |
| | — |
| | — |
|
| Credit derivatives | |
| | |
| | |
| | |
| | |
| | |
| | |
| |
| | |
| | |
| | |
| | |
| | |
| | |
|
| Purchased credit derivatives: | |
| | |
| | |
| | |
| | |
| | |
| | |
| |
| | |
| | |
| | |
| | |
| | |
| | |
|
| Credit default swaps | 2,184.7 |
| | 69.8 |
| | — |
| | 69.8 |
| | 34.0 |
| | — |
| | 34.0 |
| 1,944.8 |
| | 95.8 |
| | — |
| | 95.8 |
| | 13.8 |
| | — |
| | 13.8 |
|
| Total return swaps/other | 26.0 |
| | 0.9 |
| | — |
| | 0.9 |
| | 0.2 |
| | — |
| | 0.2 |
| 17.5 |
| | 0.6 |
| | — |
| | 0.6 |
| | 0.3 |
| | — |
| | 0.3 |
|
| Written credit derivatives: | |
| | |
| | |
| | |
| | |
| | |
| | |
| |
| | |
| | |
| | |
| | |
| | |
| | |
|
| Credit default swaps | 2,133.5 |
| | 33.3 |
| | — |
| | 33.3 |
| | 63.2 |
| | — |
| | 63.2 |
| 1,885.9 |
| | 14.1 |
| | — |
| | 14.1 |
| | 90.5 |
| | — |
| | 90.5 |
|
| Total return swaps/other | 22.5 |
| | 0.5 |
| | — |
| | 0.5 |
| | 0.5 |
| | — |
| | 0.5 |
| 17.8 |
| | 0.5 |
| | — |
| | 0.5 |
| | 0.7 |
| | — |
| | 0.7 |
|
| Gross derivative assets/liabilities | |
| | $ | 1,518.8 |
| | $ | 18.8 |
| | $ | 1,537.6 |
| | $ | 1,501.5 |
| | $ | 4.3 |
| | $ | 1,505.8 |
| |
| | $ | 1,861.7 |
| | $ | 20.1 |
| | $ | 1,881.8 |
| | $ | 1,846.5 |
| | $ | 14.8 |
| | $ | 1,861.3 |
|
| Less: Legally enforceable master netting agreements | |
| | |
| | |
| | (1,406.3 | ) | | |
| | |
| | (1,406.3 | ) | |
| | |
| | |
| | (1,749.9 | ) | | |
| | |
| | (1,749.9 | ) |
| Less: Cash collateral applied | |
| | |
| | |
| | (58.3 | ) | | |
| | |
| | (43.6 | ) | |
| Less: Cash collateral received/paid | | |
| | |
| | |
| | (58.9 | ) | | |
| | |
| | (51.9 | ) |
| Total derivative assets/liabilities | |
| | |
| | |
| | $ | 73.0 |
| | |
| | |
| | $ | 55.9 |
| |
| | |
| | |
| | $ | 73.0 |
| | |
| | |
| | $ | 59.5 |
|
| |
(1) | Represents the total contract/notional amount of derivative assets and liabilities outstanding. |
| |
(2)
| Excludes $4.1 billion of long-term debt designated as a hedge of foreign currency risk.
|
ALM and Risk Management Derivatives
The Corporation’s ALM and risk management activities include the use of derivatives to mitigate risk to the Corporation including derivatives designated asin qualifying hedge accounting hedgesrelationships and economic hedges.derivatives used in other risk management activities. Interest rate, commodity, credit and foreign exchange, equity, commodity and credit contracts are utilized in the Corporation’s ALM and risk management activities.
The Corporation maintains an overall interest rate risk management strategy that incorporates the use of interest rate contracts, which are generally non-leveraged generic interest rate and basis swaps, options, futures and forwards, to minimize significant fluctuations in earnings that are caused by interest rate volatility. The Corporation’s goal is to manage interest rate sensitivity and volatility so that movements in interest rates do not significantly adversely affect earnings or capital. As a result of interest rate fluctuations, hedged fixed-rate assets and liabilities appreciate or depreciate in fair value. Gains or losses on the derivative instruments that are linked to the hedged fixed-rate assets and liabilities are expected to substantially offset this unrealized appreciation or depreciation.
InterestMarket risk, including interest rate and market risk, can be substantial in the mortgage business. Market risk is the risk that values of mortgage assets or revenues will be adversely affected by changes in market
in market conditions such as interest rate movements. To hedgemitigate the interest rate risk in mortgage banking production income, the Corporation utilizes forward loan sale commitments and other derivative instruments including purchased options and certain debt securities. The Corporation also utilizes derivatives such as interest rate options, interest rate swaps, forward settlement contracts and Eurodollar futures as economic hedges of the fair valueto hedge certain market risks of MSRs. For additional information on MSRs, see Note 2524 – Mortgage Servicing Rights.
The Corporation uses foreign currencyexchange contracts to manage the foreign exchange risk associated with certain foreign currency-denominated assets and liabilities, as well as the Corporation’s investments in non-U.S. subsidiaries. Foreign exchange contracts, which include spot and forward contracts, represent agreements to exchange the currency of one country for the currency of another country at an agreed-upon price on an agreed-upon settlement date. Exposure to loss on these contracts will increase or decrease over their respective lives as currency exchange and interest rates fluctuate.
The Corporation enters into derivative commodity contracts such as futures, swaps, options and forwards as well as non-derivative commodity contracts to provide price risk management services to customers or to manage price risk associated with its physical and financial commodity positions. The non-derivative
|
| | |
| | | Bank of America 2012 171175 |
commodity contracts and physical inventories of commodities expose the Corporation to earnings volatility. Cash flow and fair value accounting hedges provide a method to mitigate a portion of this earnings volatility.
The Corporation purchases credit derivatives to manage credit risk related to certain funded and unfunded credit exposures. Credit derivatives include credit default swaps (CDS), total return swaps and swaptions. These derivatives are accounted for as economic hedges andrecorded on the Corporation’s Consolidated Balance Sheet at fair value with changes in fair value are recorded in other income (loss).
Derivatives Designated as Accounting Hedges
The Corporation uses various types of interest rate, commodity and foreign exchange derivative contracts to protect against changes in the fair value of its assets and liabilities due to
fluctuations in interest rates, commodity prices and exchange rates and commodity prices (fair value hedges). The Corporation also uses these types of contracts and equity derivatives to protect against changes in the cash flows of its assets and liabilities, and other forecasted transactions (cash flow hedges). The Corporation hedges its net
investment in consolidated non-U.S. operations determined to have functional currencies other than the U.S. dollar using forward exchange contracts and cross-currency basis swaps, and by issuing foreign currency-denominated debt (net investment hedges).
Fair Value Hedges
The table below summarizes certain information related to the Corporation’s derivatives designated as fair value hedges for 20112012, 20102011 and 20092010., including hedges of interest rate risk on long-term debt that were acquired as part of a business combination and redesignated. At redesignation, the fair value of the derivatives was negative. As the derivatives mature, the fair value will approach zero. As a result, ineffectiveness may occur and the fair value changes in the derivatives and the long-term debt being hedged may be directionally the same in certain scenarios. Based on a regression analysis, the derivatives continue to be highly effective at offsetting changes in the fair value of the long-term debt attributable to interest rate risk.
| | | | | | | | | |
| Fair Value Hedges | | | | | | |
| Derivatives Designated as Fair Value Hedges | | | | | | |
| | | | | | | | | | | |
| | | | 2011 | | | |
| Gains (losses) | | 2012 |
| (Dollars in millions) | Derivative | | Hedged Item | | Hedge Ineffectiveness | Derivative | | Hedged Item | | Hedge Ineffectiveness |
| Derivatives designated as fair value hedges | |
| | |
| | |
| |
Interest rate risk on long-term debt (1) | $ | 4,384 |
| | $ | (4,969 | ) | | $ | (585 | ) | $ | (195 | ) | | $ | (770 | ) | | $ | (965 | ) |
Interest rate and foreign currency risk on long-term debt (1) | 780 |
| | (1,057 | ) | | (277 | ) | (1,482 | ) | | 1,225 |
| | (257 | ) |
Interest rate risk on available-for-sale securities (2) | (11,386 | ) | | 10,490 |
| | (896 | ) | |
Interest rate risk on AFS securities (2) | | (4 | ) | | 91 |
| | 87 |
|
Commodity price risk on commodity inventory (3) | 16 |
| | (16 | ) | | — |
| (6 | ) | | 6 |
| | — |
|
| Total | $ | (6,206 | ) | | $ | 4,448 |
| | $ | (1,758 | ) | $ | (1,687 | ) | | $ | 552 |
| | $ | (1,135 | ) |
| | | | | | | | | | | |
| | 2010 | 2011 |
| Derivatives designated as fair value hedges | |
| | |
| | |
| |
Interest rate risk on long-term debt (1) | $ | 2,952 |
| | $ | (3,496 | ) | | $ | (544 | ) | $ | 4,384 |
| | $ | (4,969 | ) | | $ | (585 | ) |
Interest rate and foreign currency risk on long-term debt (1) | (463 | ) | | 130 |
| | (333 | ) | 780 |
| | (1,057 | ) | | (277 | ) |
Interest rate risk on available-for-sale securities (2) | (2,577 | ) | | 2,667 |
| | 90 |
| |
Interest rate risk on AFS securities (2) | | (11,386 | ) | | 10,490 |
| | (896 | ) |
Commodity price risk on commodity inventory (3) | 19 |
| | (19 | ) | | — |
| 16 |
| | (16 | ) | | — |
|
| Total | $ | (69 | ) | | $ | (718 | ) | | $ | (787 | ) | $ | (6,206 | ) | | $ | 4,448 |
| | $ | (1,758 | ) |
| | | | | | | | | | | |
| | 2009 | 2010 |
| Derivatives designated as fair value hedges | |
| | |
| | |
| |
Interest rate risk on long-term debt (1) | $ | (4,858 | ) | | $ | 4,082 |
| | $ | (776 | ) | $ | 2,952 |
| | $ | (3,496 | ) | | $ | (544 | ) |
Interest rate and foreign currency risk on long-term debt (1) | 932 |
| | (858 | ) | | 74 |
| (463 | ) | | 130 |
| | (333 | ) |
Interest rate risk on available-for-sale securities (2) | 791 |
| | (1,141 | ) | | (350 | ) | |
Interest rate risk on AFS securities (2) | | (2,577 | ) | | 2,667 |
| | 90 |
|
Commodity price risk on commodity inventory (3) | (51 | ) | | 51 |
| | — |
| 19 |
| | (19 | ) | | — |
|
| Total | $ | (3,186 | ) | | $ | 2,134 |
| | $ | (1,052 | ) | $ | (69 | ) | | $ | (718 | ) | | $ | (787 | ) |
| |
(1) | Amounts are recorded in interest expense on long-term debt and in other income.income (loss). |
| |
(2) | Amounts are recorded in interest income on AFSdebt securities. |
| |
(3) | Amounts relating to commodity inventory are recorded in trading account profits. |
|
| | |
172176 Bank of America 20112012
| | |
Cash Flow and Net Investment Hedges
The table below summarizes certain information related to the Corporation’s derivatives designated as cash flow hedges and net investment hedges for 20112012, 20102011 and 20092010. During the next 12 months, net losses in accumulated OCI of approximately $1.5 billion981 million ($1.0 billion618 million after-tax) on derivative instruments that qualify as cash flow hedges are expected to be reclassified into earnings. These net losses reclassified into earnings are expected to primarily reduce net interest income related to the respective hedged items. Amounts related to commodity price risk
reclassified from accumulated OCI are recorded in trading account
profits with the underlying hedged item. Amounts related to price risk on restricted stock awards reclassified from accumulated OCI are recorded in personnel expense. Amounts related to price risk on equity investments included in AFS securities reclassified from accumulated OCI are recorded in equity investment income with the underlying hedged item.
Amounts related to foreign exchange risk recognized in accumulated OCI on derivatives exclude pre-tax losses of $7 million, and pre-tax gains (losses) of $82 million, and $192 million and $(387) million related to long-term debt designated as a net investment hedge for 20112012, 20102011 and 20092010., respectively.
| | | | | | | | | | | | | |
| Cash Flow Hedges | | | | | | |
| Derivatives Designated as Cash Flow and Net Investment Hedges | | | | | | |
| | | | | | | | | | | |
| | 2011 | 2012 |
| (Dollars in millions, amounts pre-tax) | Gains (losses)
Recognized in
Accumulated OCI on Derivatives | | Gains (losses)
in Income
Reclassified from Accumulated OCI | | Hedge
Ineffectiveness and
Amounts Excluded
from Effectiveness Testing (1) | Gains (losses)
Recognized in
Accumulated OCI on Derivatives | | Gains (losses)
in Income
Reclassified from Accumulated OCI | | Hedge
Ineffectiveness and
Amounts Excluded
from Effectiveness Testing (1) |
| Derivatives designated as cash flow hedges | |
| | |
| | |
| |
| Cash flow hedges | | |
| | |
| | |
|
Interest rate risk on variable rate portfolios (2) | $ | (2,079 | ) | | $ | (1,392 | ) | | $ | (8 | ) | $ | 10 |
| | $ | (957 | ) | | $ | — |
|
| Price risk on restricted stock awards | | 420 |
| | (78 | ) | | — |
|
| Total | | $ | 430 |
| | $ | (1,035 | ) | | $ | — |
|
| Net investment hedges | | |
| | |
| | |
|
| Foreign exchange risk | | $ | (771 | ) | | $ | (26 | ) | | $ | (269 | ) |
| | | | | | | |
| | | 2011 |
| Cash flow hedges | | |
| | |
| | |
|
| Interest rate risk on variable rate portfolios | | $ | (2,079 | ) | | $ | (1,392 | ) | | $ | (8 | ) |
| Commodity price risk on forecasted purchases and sales | (3 | ) | | 6 |
| | (3 | ) | (3 | ) | | 6 |
| | (3 | ) |
| Price risk on restricted stock awards | (408 | ) | | (231 | ) | | — |
| (408 | ) | | (231 | ) | | — |
|
| Total | $ | (2,490 | ) | | $ | (1,617 | ) | | $ | (11 | ) | $ | (2,490 | ) | | $ | (1,617 | ) | | $ | (11 | ) |
| Net investment hedges | |
| | |
| | |
| |
| | |
| | |
|
| Foreign exchange risk | $ | 1,055 |
| | $ | 384 |
| | $ | (572 | ) | $ | 1,055 |
| | $ | 384 |
| | $ | (572 | ) |
| | | | | | | | | | | |
| | 2010 | 2010 |
| Derivatives designated as cash flow hedges | |
| | |
| | |
| |
| Cash flow hedges | | |
| | |
| | |
|
| Interest rate risk on variable rate portfolios | $ | (1,876 | ) | | $ | (410 | ) | | $ | (30 | ) | $ | (1,876 | ) | | $ | (410 | ) | | $ | (30 | ) |
| Commodity price risk on forecasted purchases and sales | 32 |
| | 25 |
| | 11 |
| 32 |
| | 25 |
| | 11 |
|
| Price risk on restricted stock awards | (97 | ) | | (33 | ) | | — |
| (97 | ) | | (33 | ) | | — |
|
| Price risk on equity investments included in available-for-sale securities | 186 |
| | (226 | ) | | — |
| |
| Price risk on equity investments included in AFS securities | | 186 |
| | (226 | ) | | — |
|
| Total | $ | (1,755 | ) | | $ | (644 | ) | | $ | (19 | ) | $ | (1,755 | ) | | $ | (644 | ) | | $ | (19 | ) |
| Net investment hedges | |
| | |
| | |
| |
| | |
| | |
|
| Foreign exchange risk | $ | (482 | ) | | $ | — |
| | $ | (315 | ) | $ | (482 | ) | | $ | — |
| | $ | (315 | ) |
| | | | | | | |
| | 2009 | |
| Derivatives designated as cash flow hedges | |
| | |
| | |
| |
| Interest rate risk on variable rate portfolios | $ | 502 |
| | $ | (1,293 | ) | | $ | 71 |
| |
| Commodity price risk on forecasted purchases and sales | 72 |
| | 70 |
| | (2 | ) | |
| Price risk on equity investments included in available-for-sale securities | (332 | ) | | — |
| | — |
| |
| Total | $ | 242 |
| | $ | (1,223 | ) | | $ | 69 |
| |
| Net investment hedges | |
| | |
| | |
| |
| Foreign exchange risk | $ | (2,997 | ) | | $ | — |
| | $ | (142 | ) | |
| |
(1) | Amounts related to derivatives designated as cash flow hedges represent hedge ineffectiveness and amounts related to net investment hedges represent amounts excluded from effectiveness testing. |
| |
(2)
| Losses reclassified from accumulated OCI to the Consolidated Statement of Income include $38 million, $0 and $44 million in 2011, 2010 and 2009 related to the discontinuance of certain cash flow hedges because it was no longer probable that the original forecasted transaction would occur.
|
The Corporation enteredenters into equity total return swaps to hedge a portion of RSUs granted to certain employees as part of their compensation in prior periods.compensation. Certain awards contain clawback provisions which permit the Corporation to cancel all or a portion of the award under specified circumstances, and certain awards may be settled in cash. These RSUs are accrued as liabilities over the vesting period and adjusted to fair value based on changes in the share price of the Corporation’s common stock. From time to time, the Corporation may enter into equity derivatives to minimize the change in the expense to the Corporation driven by fluctuations
the Corporation’s common stock during the vesting period of any RSUs that may be granted, if any, subject to similar or other terms and conditions. Certain of these derivatives are designated as cash flow hedges of unrecognized unvested awards with the changes in fair value of the hedge recorded in accumulated OCI and reclassified into earnings in the same period as the RSUs affect earnings. The remaining derivatives are accounted for as economic hedgesother risk management derivatives and changes in fair value are recorded in personnel expense. For more information on RSUs and related hedges, seeNote 2019 – Stock-based Compensation Plans.
|
| | |
| | | Bank of America 2012 173177 |
Other Risk Management Derivatives Accounted for as Economic Hedges
Derivatives accounted for as economicOther risk management derivatives are used by the Corporation to reduce certain risk exposures. These derivatives are not qualifying accounting hedges because either they did not qualify for or were not designated as accounting hedges, are used by the Corporation to reduce certain risk exposures.hedges. The table below presents gains (losses) on these derivatives for 20112012, 20102011 and 20092010. These gains (losses) are largely offset by the income or expense that is recorded on the economically hedged item.
| | | | | | | | | | | | | |
| Economic Hedges | | | | | | |
| Other Risk Management Derivatives | | | | | | |
| | | | | | | |
| Gains (losses) | | | | | | |
| | | | | | | | | | | |
| (Dollars in millions) | 2011 | | 2010 | | 2009 | 2012 | | 2011 | | 2010 |
Price risk on mortgage banking production income (1, 2) | $ | 2,852 |
| | $ | 9,109 |
| | $ | 8,898 |
| $ | 3,022 |
| | $ | 2,852 |
| | $ | 9,109 |
|
Interest rate risk on mortgage banking servicing income (1) | 3,612 |
| | 3,878 |
| | (4,264 | ) | |
Market-related risk on mortgage banking servicing income (1) | | 2,000 |
| | 3,612 |
| | 3,878 |
|
Credit risk on loans (3) | 30 |
| | (121 | ) | | (515 | ) | (95 | ) | | 30 |
| | (121 | ) |
Interest rate and foreign currency risk on long-term debt and other foreign exchange transactions (4) | (48 | ) | | (2,080 | ) | | 1,572 |
| 424 |
| | (48 | ) | | (2,080 | ) |
Other (5) | (329 | ) | | (109 | ) | | 16 |
| |
Price risk on restricted stock awards (5) | | 1,008 |
| | (610 | ) | | (151 | ) |
| Other | | 58 |
| | 281 |
| | 42 |
|
| Total | $ | 6,117 |
| | $ | 10,677 |
| | $ | 5,707 |
| $ | 6,417 |
| | $ | 6,117 |
| | $ | 10,677 |
|
| |
(1) | Gains (losses)Net gains on these derivatives are recorded in mortgage banking income.income (loss). |
| |
(2) | Includes net gains on interest rate lock commitments related to the origination of mortgage loans that are held-for-sale, which are considered derivative instruments, of $3.83.0 billion, $8.73.8 billion and $8.48.7 billion for 20112012, 20102011 and 20092010, respectively. |
| |
(3) | GainsNet gains (losses) on these derivatives are recorded in other income (loss). |
| |
(4) | The majority of the balance is related to the revaluation of economic hedges onderivatives used to mitigate risk related to foreign currency-denominated debt which is recorded in other income (loss). The offsetting revaluation of the foreign currency-denominated debt, while not included in the table above, is also recorded in other income (loss). |
| |
(5) | Gains (losses) on these derivatives are recorded in other income (loss), and personnel expense for hedges of certain RSUs, for 2011 and 2010. expense. |
Sales and Trading Revenue
The Corporation enters into trading derivatives to facilitate client transactions, for principal trading purposes, and to manage risk exposures arising from trading account assets and liabilities. It is the Corporation’s policy to include these derivative instruments in its trading activities which include derivatives and non-derivative cash instruments. The resulting risk from these derivatives is managed on a portfolio basis as part of the Corporation’s Global Banking & Markets (GBAM) business segment. The related sales and trading revenue generated within GBAMGlobal Markets is recorded in various income statement line items including trading account profits and net interest income as well as other revenue categories. However, the majority of income related to derivative instruments is recorded in trading account profits.
Sales and trading revenue includes changes in the fair value and realized gains and losses on the sales of trading and other assets, net interest income, and fees primarily from commissions on equity securities. Revenue is generated by the difference in the client price for an instrument and the price at which the trading
desk can execute the trade in the dealer market. For equity
securities, commissions related to purchases and sales are recorded in other income (loss) on the Consolidated Statement of Income.. Changes in the fair value of these securities are included in trading account profits. For debt securities, revenue, with the exception of interest associated with the debt securities, is typically included in trading account profits. Unlike commissions for equity securities, the initial revenue related to broker/dealer services for debt securities is typically included in the pricing of the instrument rather than being charged through separate fee arrangements. Therefore, this revenue is recorded in trading account profits as part of the initial mark to fair value. For derivatives, all revenue is included in trading account profits. In transactions where the Corporation acts as agent, which includesinclude exchange-traded futures and options, fees are recorded in other income (loss).
Gains (losses) on certain instruments, primarily loans, held inthat the GBAMGlobal Markets business segment thatshares with Global Banking are not considered trading instruments and are excluded from sales and trading revenue in their entirety.
|
| | |
174178 Bank of America 20112012
| | |
The table below, which includes both derivatives and non-derivative cash instruments, identifies the amounts in the respective income statement line items attributable to the Corporation’s sales and trading revenue in GBAMGlobal Markets, categorized by primary risk, for 20112012, 20102011 and 20092010. The difference between total trading account profits in the table below
and in the Corporation’s Consolidated Statement of Income relates torepresents trading activities in business segments other than GBAMGlobal Markets.Global Markets results inNote 26 – Business Segment Information are presented on a fully taxable-equivalent (FTE) basis. The table below is not presented on a FTE basis.
| | | | | | | | | | | | | | | | | |
| Sales and Trading Revenue | | | | | | | | | | | | | | |
| | | | | | | | | | | | | | | |
| | 2011 | 2012 |
| (Dollars in millions) | Trading Account Profits | | Other Income (Loss) (1, 2) | | Net Interest Income | | Total | Trading Account Profits | | Net Interest Income | | Other (1) | | Total |
| Interest rate risk | $ | 2,118 |
| | $ | (40 | ) | | $ | 923 |
| | $ | 3,001 |
| $ | 580 |
| | $ | 1,040 |
| | $ | (5 | ) | | $ | 1,615 |
|
| Foreign exchange risk | 1,088 |
| | (65 | ) | | 8 |
| | 1,031 |
| 909 |
| | 5 |
| | 7 |
| | 921 |
|
| Equity risk | 1,450 |
| | 2,390 |
| | 128 |
| | 3,968 |
| 1,181 |
| | (57 | ) | | 1,890 |
| | 3,014 |
|
| Credit risk | 1,141 |
| | 217 |
| | 2,850 |
| | 4,208 |
| 2,496 |
| | 2,321 |
| | 961 |
| | 5,778 |
|
| Other risk | 630 |
| | (21 | ) | | (183 | ) | | 426 |
| 540 |
| | (219 | ) | | (42 | ) | | 279 |
|
| Total sales and trading revenue | $ | 6,427 |
| | $ | 2,481 |
| | $ | 3,726 |
| | $ | 12,634 |
| $ | 5,706 |
| | $ | 3,090 |
| | $ | 2,811 |
| | $ | 11,607 |
|
| | | | | | | | | | | | | | | |
| | 2010 | 2011 |
| Interest rate risk | $ | 2,005 |
| | $ | 81 |
| | $ | 658 |
| | $ | 2,744 |
| $ | 2,118 |
| | $ | 923 |
| | $ | (63 | ) | | $ | 2,978 |
|
| Foreign exchange risk | 903 |
| | (63 | ) | | — |
| | 840 |
| 1,088 |
| | 8 |
| | (10 | ) | | 1,086 |
|
| Equity risk | 1,670 |
| | 2,469 |
| | 15 |
| | 4,154 |
| 1,482 |
| | 128 |
| | 2,346 |
| | 3,956 |
|
| Credit risk | 4,652 |
| | 224 |
| | 3,826 |
| | 8,702 |
| 1,096 |
| | 2,604 |
| | 553 |
| | 4,253 |
|
| Other risk | 366 |
| | 101 |
| | (169 | ) | | 298 |
| 633 |
| | (184 | ) | | (72 | ) | | 377 |
|
| Total sales and trading revenue | $ | 9,596 |
| | $ | 2,812 |
| | $ | 4,330 |
| | $ | 16,738 |
| $ | 6,417 |
| | $ | 3,479 |
| | $ | 2,754 |
| | $ | 12,650 |
|
| | | | | | | | | | | | | | | |
| | 2009 | 2010 |
| Interest rate risk | $ | 3,143 |
| | $ | (23 | ) | | $ | 1,134 |
| | $ | 4,254 |
| $ | 2,032 |
| | $ | 659 |
| | $ | 38 |
| | $ | 2,729 |
|
| Foreign exchange risk | 950 |
| | (3 | ) | | 26 |
| | 973 |
| 903 |
| | — |
| | (9 | ) | | 894 |
|
| Equity risk | 1,989 |
| | 2,509 |
| | 247 |
| | 4,745 |
| 1,650 |
| | 16 |
| | 2,447 |
| | 4,113 |
|
| Credit risk | 4,486 |
| | (2,956 | ) | | 4,883 |
| | 6,413 |
| 4,592 |
| | 3,557 |
| | 266 |
| | 8,415 |
|
| Other risk | 1,100 |
| | 53 |
| | (534 | ) | | 619 |
| 447 |
| | (172 | ) | | (4 | ) | | 271 |
|
| Total sales and trading revenue | $ | 11,668 |
| | $ | (420 | ) | | $ | 5,756 |
| | $ | 17,004 |
| $ | 9,624 |
| | $ | 4,060 |
| | $ | 2,738 |
| | $ | 16,422 |
|
| |
(1) | Represents amounts in investment and brokerage services and other income (loss) that are recorded in GBAMGlobal Markets thatand included in the Corporation includes in its definition of sales and trading revenue. |
| |
(2)
| Other income (loss) includes commissions Includes investment and brokerage feeservices revenue of$1.8 billion, $2.2 billion and $2.3 billion andfor $2.4 billion2012 for, 2011 and 2010, respectively, primarily included in equity risk.
|
Credit Derivatives
The Corporation enters into credit derivatives primarily to facilitate client transactions and to manage credit risk exposures. Credit derivatives derive value based on an underlying third-party referenced obligation or a portfolio of referenced obligations and generally require the Corporation, as the seller of credit protection, to make payments to a buyer upon the occurrence of a pre-defined credit event. Such credit events generally include bankruptcy of
the referenced credit entity and failure to pay under the obligation, as well as acceleration of indebtedness and payment repudiation or moratorium. For credit derivatives based on a portfolio of referenced credits or credit indices, the Corporation may not be required to make payment until a specified amount of loss has occurred and/or may only be required to make payment up to a specified amount.
|
| | |
| | | Bank of America 2012 175179 |
Credit derivative instruments where the Corporation is the seller of credit protection and their expiration are summarized at December 31, 2012 and 2011 and 2010 are summarized in the table below. These instruments are classified as investment and non-investment grade based on the credit quality of the underlying referencereferenced obligation. The Corporation considers ratings of BBB- or higher as investment grade. Non-investment grade includes non-rated credit derivative instruments.
| | | | | | | | | | | | | | | | | | | | | |
| Credit Derivative Instruments | | |
| | | |
| | December 31, 2011 | December 31, 2012 |
| | Carrying Value | Carrying Value |
| (Dollars in millions) | Less than One Year | | One to Three Years | | Three to Five Years | | Over Five Years | | Total | Less than One Year | | One to Three Years | | Three to Five Years | | Over Five Years | | Total |
| Credit default swaps | |
| | |
| | |
| | |
| | |
| |
| Credit default swaps: | | |
| | |
| | |
| | |
| | |
|
| Investment grade | $ | 795 |
| | $ | 5,011 |
| | $ | 17,271 |
| | $ | 7,325 |
| | $ | 30,402 |
| $ | 52 |
| | $ | 757 |
| | $ | 5,595 |
| | $ | 2,903 |
| | $ | 9,307 |
|
| Non-investment grade | 4,236 |
| | 11,438 |
| | 18,072 |
| | 26,339 |
| | 60,085 |
| 923 |
| | 4,403 |
| | 7,030 |
| | 10,959 |
| | 23,315 |
|
| Total | 5,031 |
| | 16,449 |
| | 35,343 |
| | 33,664 |
| | 90,487 |
| 975 |
| | 5,160 |
| | 12,625 |
| | 13,862 |
| | 32,622 |
|
| Total return swaps/other | |
| | |
| | |
| | |
| | |
| |
| Total return swaps/other: | | |
| | |
| | |
| | |
| | |
|
| Investment grade | — |
| | — |
| | 30 |
| | 1 |
| | 31 |
| 39 |
| | — |
| | — |
| | — |
| | 39 |
|
| Non-investment grade | 522 |
| | 2 |
| | 33 |
| | 128 |
| | 685 |
| 57 |
| | 104 |
| | 39 |
| | 37 |
| | 237 |
|
| Total | 522 |
| | 2 |
| | 63 |
| | 129 |
| | 716 |
| 96 |
| | 104 |
| | 39 |
| | 37 |
| | 276 |
|
| Total credit derivatives | $ | 5,553 |
| | $ | 16,451 |
| | $ | 35,406 |
| | $ | 33,793 |
| | $ | 91,203 |
| $ | 1,071 |
| | $ | 5,264 |
| | $ | 12,664 |
| | $ | 13,899 |
| | $ | 32,898 |
|
Credit-related notes (1) | |
| | |
| | |
| | |
| | |
| |
Credit-related notes: (1) | | |
| | |
| | |
| | |
| | |
|
| Investment grade | $ | — |
| | $ | 5 |
| | $ | 132 |
| | $ | 1,925 |
| | $ | 2,062 |
| $ | 4 |
| | $ | 12 |
| | $ | 441 |
| | $ | 3,849 |
| | $ | 4,306 |
|
| Non-investment grade | 124 |
| | 74 |
| | 108 |
| | 1,286 |
| | 1,592 |
| 116 |
| | 161 |
| | 314 |
| | 1,425 |
| | 2,016 |
|
| Total credit-related notes | $ | 124 |
| | $ | 79 |
| | $ | 240 |
| | $ | 3,211 |
| | $ | 3,654 |
| $ | 120 |
| | $ | 173 |
| | $ | 755 |
| | $ | 5,274 |
| | $ | 6,322 |
|
| | Maximum Payout/Notional | Maximum Payout/Notional |
| Credit default swaps | |
| | |
| | |
| | |
| | |
| |
| Credit default swaps: | | |
| | |
| | |
| | |
| | |
|
| Investment grade | $ | 182,137 |
| | $ | 401,914 |
| | $ | 477,924 |
| | $ | 127,570 |
| | $ | 1,189,545 |
| $ | 260,177 |
| | $ | 349,125 |
| | $ | 500,038 |
| | $ | 90,453 |
| | $ | 1,199,793 |
|
| Non-investment grade | 133,624 |
| | 228,327 |
| | 186,522 |
| | 147,926 |
| | 696,399 |
| 79,861 |
| | 99,043 |
| | 110,248 |
| | 42,559 |
| | 331,711 |
|
| Total | 315,761 |
| | 630,241 |
| | 664,446 |
| | 275,496 |
| | 1,885,944 |
| 340,038 |
| | 448,168 |
| | 610,286 |
| | 133,012 |
| | 1,531,504 |
|
| Total return swaps/other | |
| | |
| | |
| | |
| | |
| |
| Total return swaps/other: | | |
| | |
| | |
| | |
| | |
|
| Investment grade | — |
| | — |
| | 9,116 |
| | — |
| | 9,116 |
| 43,536 |
| | 15 |
| | — |
| | — |
| | 43,551 |
|
| Non-investment grade | 305 |
| | 2,023 |
| | 4,918 |
| | 1,476 |
| | 8,722 |
| 5,566 |
| | 11,028 |
| | 7,631 |
| | 1,035 |
| | 25,260 |
|
| Total | 305 |
| | 2,023 |
| | 14,034 |
| | 1,476 |
| | 17,838 |
| 49,102 |
| | 11,043 |
| | 7,631 |
| | 1,035 |
| | 68,811 |
|
| Total credit derivatives | $ | 316,066 |
| | $ | 632,264 |
| | $ | 678,480 |
| | $ | 276,972 |
| | $ | 1,903,782 |
| $ | 389,140 |
| | $ | 459,211 |
| | $ | 617,917 |
| | $ | 134,047 |
| | $ | 1,600,315 |
|
| | | | December 31, 2010 | | | | | | | | | | | |
| | Carrying Value | December 31, 2011 |
| (Dollars in millions) | Less than One Year | | One to Three Years | | Three to Five Years | | Over Five Years | | Total | Carrying Value |
| Credit default swaps | |
| | |
| | |
| | |
| | |
| |
| Credit default swaps: | | |
| | |
| | |
| | |
| | |
|
| Investment grade | $ | 158 |
| | $ | 2,607 |
| | $ | 7,331 |
| | $ | 14,880 |
| | $ | 24,976 |
| $ | 795 |
| | $ | 5,011 |
| | $ | 17,271 |
| | $ | 7,325 |
| | $ | 30,402 |
|
| Non-investment grade | 598 |
| | 6,630 |
| | 7,854 |
| | 23,106 |
| | 38,188 |
| 4,236 |
| | 11,438 |
| | 18,072 |
| | 26,339 |
| | 60,085 |
|
| Total | 756 |
| | 9,237 |
| | 15,185 |
| | 37,986 |
| | 63,164 |
| 5,031 |
| | 16,449 |
| | 35,343 |
| | 33,664 |
| | 90,487 |
|
| Total return swaps/other | |
| | |
| | |
| | |
| | |
| |
| Total return swaps/other: | | |
| | |
| | |
| | |
| | |
|
| Investment grade | — |
| | — |
| | 38 |
| | 60 |
| | 98 |
| — |
| | — |
| | 30 |
| | 1 |
| | 31 |
|
| Non-investment grade | 1 |
| | 2 |
| | 2 |
| | 415 |
| | 420 |
| 522 |
| | 2 |
| | 33 |
| | 128 |
| | 685 |
|
| Total | 1 |
| | 2 |
| | 40 |
| | 475 |
| | 518 |
| 522 |
| | 2 |
| | 63 |
| | 129 |
| | 716 |
|
| Total credit derivatives | $ | 757 |
| | $ | 9,239 |
| | $ | 15,225 |
| | $ | 38,461 |
| | $ | 63,682 |
| $ | 5,553 |
| | $ | 16,451 |
| | $ | 35,406 |
| | $ | 33,793 |
| | $ | 91,203 |
|
Credit-related notes (1, 2) | |
| | |
| | |
| | |
| | |
| |
Credit-related notes: (1) | | |
| | |
| | |
| | |
| | |
|
| Investment grade | $ | — |
| | $ | 136 |
| | $ | — |
| | $ | 3,525 |
| | $ | 3,661 |
| $ | — |
| | $ | 7 |
| | $ | 208 |
| | $ | 2,947 |
| | $ | 3,162 |
|
| Non-investment grade | 9 |
| | 33 |
| | 174 |
| | 2,423 |
| | 2,639 |
| 127 |
| | 85 |
| | 132 |
| | 1,732 |
| | 2,076 |
|
| Total credit-related notes | $ | 9 |
| | $ | 169 |
| | $ | 174 |
| | $ | 5,948 |
| | $ | 6,300 |
| $ | 127 |
| | $ | 92 |
| | $ | 340 |
| | $ | 4,679 |
| | $ | 5,238 |
|
| | Maximum Payout/Notional | Maximum Payout/Notional |
| Credit default swaps | |
| | |
| | |
| | |
| | |
| |
| Credit default swaps: | | |
| | |
| | |
| | |
| | |
|
| Investment grade | $ | 133,691 |
| | $ | 466,565 |
| | $ | 475,715 |
| | $ | 275,434 |
| | $ | 1,351,405 |
| $ | 182,137 |
| | $ | 401,914 |
| | $ | 477,924 |
| | $ | 127,570 |
| | $ | 1,189,545 |
|
| Non-investment grade | 84,851 |
| | 314,422 |
| | 178,880 |
| | 203,930 |
| | 782,083 |
| 133,624 |
| | 228,327 |
| | 186,522 |
| | 147,926 |
| | 696,399 |
|
| Total | 218,542 |
| | 780,987 |
| | 654,595 |
| | 479,364 |
| | 2,133,488 |
| 315,761 |
| | 630,241 |
| | 664,446 |
| | 275,496 |
| | 1,885,944 |
|
| Total return swaps/other | |
| | |
| | |
| | |
| | |
| |
| Total return swaps/other: | | |
| | |
| | |
| | |
| | |
|
| Investment grade | — |
| | 10 |
| | 15,413 |
| | 4,012 |
| | 19,435 |
| — |
| | — |
| | 9,116 |
| | — |
| | 9,116 |
|
| Non-investment grade | 113 |
| | 78 |
| | 951 |
| | 1,897 |
| | 3,039 |
| 305 |
| | 2,023 |
| | 4,918 |
| | 1,476 |
| | 8,722 |
|
| Total | 113 |
| | 88 |
| | 16,364 |
| | 5,909 |
| | 22,474 |
| 305 |
| | 2,023 |
| | 14,034 |
| | 1,476 |
| | 17,838 |
|
| Total credit derivatives | $ | 218,655 |
| �� | $ | 781,075 |
| | $ | 670,959 |
| | $ | 485,273 |
| | $ | 2,155,962 |
| $ | 316,066 |
| | $ | 632,264 |
| | $ | 678,480 |
| | $ | 276,972 |
| | $ | 1,903,782 |
|
| |
(1) | For credit-related notes, maximum payout/notional is the same as carrying value. |
| |
| For December 31, 2010, total credit-related note amounts have been revised from $3.6 billion (as previously reported) to $6.3 billion to reflect collateralized debt obligations and collateralized loan obligations held by certain consolidated VIEs.
|
|
| | |
176180 Bank of America 20112012
| | |
The notional amount represents the maximum amount payable by the Corporation for most credit derivatives. However, the Corporation does not solely monitor its exposure to credit derivatives based solely on the notional amount because this measure does not take into consideration the probability of occurrence. As such, the notional amount is not a reliable indicator of the Corporation’s exposure to these contracts. Instead, a risk framework is used to define risk tolerances and establish limits to help ensure that certain credit risk-related losses occur within acceptable, pre-definedpredefined limits.
The Corporation economically hedgesmanages its market risk exposure to credit derivatives by entering into a variety of offsetting derivative contracts and security positions. For example, in certain instances, the Corporation may purchase credit protection with identical underlying referenced names to offset its exposure. The carrying value and notional amount of written credit derivatives for which the Corporation held purchased credit derivatives with identical underlying referenced names and terms at December 31, 20112012 was$20.7 billion and $1.1 trillion compared to $48.0 billion and $1.0 trillion compared to $43.7 billion and $1.4 trillionat December 31, 20102011.
Credit-related notes in the table on page 176180 include investments in securities issued by CDO, collateralized loan obligation (CLO) and credit-linked note vehicles. These instruments are primarily classified as trading securities. The carrying value of these instruments equals the Corporation’s maximum exposure to loss. The Corporation is not obligated to make any payments to the entities under the terms of the securities owned. The Corporation discloses internal categorizations of investment grade and non-investment grade consistent with how risk is managed for these instruments.
Credit-related Contingent Features and Collateral
The Corporation executes the majority of its derivative contracts in the OTC market with large, international financial institutions, including broker/dealers and, to a lesser degree, with a variety of non-financial companies. Substantially all of the derivative transactions are executed on a daily margin basis. Therefore, events such as a credit rating downgrade (depending on the ultimate rating level) or a breach of credit covenants would typically require an increase in the amount of collateral required of the counterparty, where applicable, and/or allow the Corporation to take additional protective measures such as early termination of all trades. Further, as previously discussed on page 170174, the Corporation enters into legally enforceable master netting agreements which reduce risk by permitting the closeout and netting of transactions with the same counterparty upon the occurrence of certain events.
A majority of the Corporation’s derivative contracts contain credit risk related contingent features, primarily in the form of International Swaps and Derivatives Association, Inc. (ISDA) master netting agreements and credit support documentation that enhance the creditworthiness of these instruments compared to other obligations of the respective counterparty with whom the Corporation has transacted. These contingent features may be for the benefit of the Corporation as well as its counterparties with respect to changes in the Corporation’s creditworthiness and the mark-to-market exposure under the derivative transactions. At December 31, 20112012 and 20102011, the Corporation held cash and securities collateral of $87.785.6 billion and $86.187.7 billion, and posted cash and securities collateral of $86.574.1 billion and $66.986.5 billion in the normal course of business under derivative agreements.
In connection with certain OTC derivative contracts and other trading agreements, the Corporation can be required to provide additional collateral or to terminate transactions with certain counterparties in the event of a downgrade of the senior debt ratings of the Corporation or certain subsidiaries. The amount of additional collateral required depends on the contract and is usually a fixed incremental amount and/or the market value of the exposure.
At December 31, 20112012, the amount of collateral, calculated based on the terms of the contracts, that the Corporation and certain subsidiaries could be required to post to counterparties but had not yet posted to counterparties was approximately $5.02.2 billion. That amount includes collateral that could be required to be posted as a result, comprised of the downgrades by the rating agencies in 2011.$721 million for BANA and $1.5 billion for Merrill Lynch & Co., Inc. (Merrill Lynch) and certain of its subsidiaries.
Some counterparties are currently able to unilaterally terminate certain contracts, or the Corporation or certain subsidiaries may be required to take other action such as find a suitable replacement or obtain a guarantee. At December 31, 20112012, the current liability recorded for these derivative contracts was $947 million1.7 billion, against which the Corporation and certain subsidiaries had posted approximately $1.01.6 billion of collateral.
In addition, under the terms of certain OTC derivative contracts and other trading agreements, in the event of a further downgrade of the Corporation’s or certain subsidiaries’ credit ratings, counterparties to those agreements may require the Corporation or certain subsidiaries to provide additional collateral, terminate these contracts or agreements, or provide other remedies. At December 31, 20112012, if the rating agencies had downgraded their long-term senior debt ratings for the Corporation or certain subsidiaries by one incremental notch, the amount of additional collateral contractually required by derivative contracts and other trading agreements would have been approximately$1.63.3 billioncomprised of$1.22.9 billionfor BANA and approximately $375418 millionfor Merrill Lynch and certain of its subsidiaries. If the agencies had downgraded their long-term senior debt ratings for these entities by a second incremental notch, approximately$1.14.4 billionin additional incremental collateral comprised of$871455 millionfor BANA and$269 million4.0 billionfor Merrill Lynch and certain of its subsidiaries would have been required.
Also, if the rating agencies had downgraded their long-term senior debt ratings for the Corporation or certain subsidiaries by one incremental notch, the derivative liability that would be subject to unilateral termination by counterparties as ofDecember 31, 20112012was$2.93.8 billion, against which$2.73.0 billionof collateral has been posted. If the rating agencies had downgraded their long-term senior debt ratings for the Corporation and certain subsidiaries by a second incremental notch, the derivative liability that would be subject to unilateral termination by counterparties as ofDecember 31, 20112012was an incremental$5.61.7 billion, against which$5.41.1 billionof collateral has been posted.
Derivative Valuation Adjustments on Derivatives
The Corporation records counterparty credit risk valuation adjustments on derivative assetsderivatives in order to properly reflect the credit quality of the counterparties. Thesecounterparties and its own credit quality. The Corporation calculates valuation adjustments are necessary as the market quotes on derivatives do not fully reflect thebased on a modeled expected exposure that incorporates current market risk factors. The exposure also takes into consideration credit risk of the counterparties to the derivative assets. The Corporation considers collateral and legallymitigants such as enforceable master netting agreements and collateral. CDS spread data is used to estimate the default probabilities and severities that mitigate itsare applied to the exposures. Where no observable credit exposuredefault data is available for counterparties, the Corporation uses proxies and other market data to each counterpartyestimate default probabilities and severity.
Valuation adjustments on derivatives are affected by changes in determining the counterparty credit risk valuationmarket spreads, non-credit related market factors such as
|
| | |
| | | Bank of America 2012 177181 |
adjustment. All or a portion of theseinterest rate and currency changes that affect the expected exposure, and other factors like changes in collateral arrangements and partial payments. Credit spread changes and non-credit factors can move independently. For example, for an interest rate swap, changes in interest rates may increase the expected exposure which would increase the counterparty credit valuation adjustment (CVA). Independently, counterparty credit spreads may tighten, which would result in an offsetting decrease to CVA.
The Corporation may enter into risk management activities to offset market driven exposures. The Corporation often hedges the counterparty spread risk in CVA with CDS and often hedges the other market risks in both CVA and debit valuation adjustments are subsequently adjusted due to changes in(DVA) primarily with currency and interest rate swaps. Since the valuecomponents of the derivative contract, collateralvaluation adjustments on derivatives move independently and creditworthinessthe Corporation may not hedge all of the counterparties. During 2011 and 2010, credit valuation gains (losses)market driven exposures, the effect of $(1.9) billion and $731 million ($(606) million and $(8) million, net of hedges) for counterparty credit risk related to derivative assets were recognized in trading account profits. These credita hedge may increase the gross valuation adjustments were primarily related toon derivatives or may result in a gross positive valuation adjustment on derivatives becoming a negative adjustment (or the Corporation’s monoline exposure. At December 31, 2011 and 2010, the cumulative counterparty credit risk valuation adjustment
reverse).
reduced the derivative assets balance by $2.8 billion and $6.8 billion.
In addition, the fair value of the Corporation’s or its subsidiaries’ derivative liabilities is adjusted to reflect the impact of the Corporation’s credit quality. During 2011 and 20102012, the Corporation recordedrefined its methodology for calculating valuation adjustments on derivatives on a prospective basis. The Corporation no longer considers the probability of default for both the counterparty and the Corporation when calculating the counterparty CVA and DVA and now only considers the probability of the counterparty defaulting for CVA and the Corporation defaulting for DVA.
The table below presents CVA and DVA gains of $1.4 billion(losses) for the Corporation on a gross and$331 million ($1.0 billion and $262 million, net of interest rate and foreign exchange hedges)hedge basis, which are recorded in trading account profits for changes in the Corporation’s or its subsidiaries’ credit risk. At December 31, 2011 and 2010, the Corporation’s cumulative DVA reduced the derivative liabilities balance by $2.4 billion and $1.1profits.
|
| | | | | | | | | | | | | |
| | | | | | |
| Valuation Adjustments on Derivatives |
| | | | | | |
| | 2012 | | 2011 |
| (Dollars in millions) | Gross | Net | | Gross | Net |
Derivative assets (CVA) (1) | $ | 1,022 |
| $ | 291 |
| | $ | (1,863 | ) | $ | (606 | ) |
Derivative liabilities (DVA) (2) | (2,212 | ) | (2,477 | ) | | 1,385 |
| 1,000 |
|
| |
(1) | At December 31, 2012 and 2011, the cumulative CVA reduced the derivative assets balance by $2.4 billion and $2.8 billion. |
| |
(2) | At December 31, 2012 and 2011, the Corporation’s cumulative DVA reduced the derivative liabilities balance by $807 million and $2.4 billion. |
NOTE 54 Securities
The table below presents the amortized cost, gross unrealized gains and losses, in accumulated OCI, and fair value of debt and marketable equity securities at December 31, 20112012 and 20102011.
| | | | | | | | | | | | | | | | | |
| | | | | | | | | December 31, 2012 |
| (Dollars in millions) | Amortized Cost | | Gross
Unrealized Gains | | Gross
Unrealized Losses | | Fair Value | Amortized Cost | | Gross
Unrealized Gains | | Gross
Unrealized Losses | | Fair Value |
| Available-for-sale debt securities, December 31, 2011 | |
| | |
| | |
| | |
| |
| Available-for-sale debt securities | | | | | | | | |
| U.S. Treasury and agency securities | $ | 43,433 |
| | $ | 242 |
| | $ | (811 | ) | | $ | 42,864 |
| $ | 24,232 |
| | $ | 324 |
| | $ | (84 | ) | | $ | 24,472 |
|
| Mortgage-backed securities: | | | | | | | |
| | | | | | | |
|
| Agency | 138,073 |
| | 4,511 |
| | (21 | ) | | 142,563 |
| 183,247 |
| | 5,048 |
| | (146 | ) | | 188,149 |
|
| Agency collateralized mortgage obligations | 44,392 |
| | 774 |
| | (167 | ) | | 44,999 |
| |
| Agency-collateralized mortgage obligations | | 36,329 |
| | 1,427 |
| | (218 | ) | | 37,538 |
|
Non-agency residential (1) | 14,948 |
| | 301 |
| | (482 | ) | | 14,767 |
| 9,231 |
| | 391 |
| | (128 | ) | | 9,494 |
|
| Non-agency commercial | 4,894 |
| | 629 |
| | (1 | ) | | 5,522 |
| 3,576 |
| | 348 |
| | — |
| | 3,924 |
|
| Non-U.S. securities | 4,872 |
| | 62 |
| | (14 | ) | | 4,920 |
| 5,574 |
| | 50 |
| | (6 | ) | | 5,618 |
|
| Corporate bonds | 2,993 |
| | 79 |
| | (37 | ) | | 3,035 |
| |
| Other taxable securities, substantially all ABS | 12,889 |
| | 49 |
| | (60 | ) | | 12,878 |
| |
| Corporate/Agency bonds | | 1,415 |
| | 51 |
| | (16 | ) | | 1,450 |
|
| Other taxable securities, substantially all asset-backed securities | | 12,089 |
| | 54 |
| | (15 | ) | | 12,128 |
|
| Total taxable securities | 266,494 |
| | 6,647 |
| | (1,593 | ) | | 271,548 |
| 275,693 |
| | 7,693 |
| | (613 | ) | | 282,773 |
|
| Tax-exempt securities | 4,678 |
| | 15 |
| | (90 | ) | | 4,603 |
| 4,167 |
| | 13 |
| | (47 | ) | | 4,133 |
|
| Total available-for-sale debt securities | $ | 271,172 |
| | $ | 6,662 |
| | $ | (1,683 | ) | | $ | 276,151 |
| 279,860 |
| | 7,706 |
| | (660 | ) | | 286,906 |
|
Held-to-maturity debt securities (2) | 35,265 |
| | 181 |
| | (4 | ) | | 35,442 |
| |
| Held-to-maturity debt securities, substantially all U.S. agency mortgage-backed securities | | 49,481 |
| | 815 |
| | (26 | ) | | 50,270 |
|
| Total debt securities | $ | 306,437 |
| | $ | 6,843 |
| | $ | (1,687 | ) | | $ | 311,593 |
| $ | 329,341 |
| | $ | 8,521 |
| | $ | (686 | ) | | $ | 337,176 |
|
Available-for-sale marketable equity securities (3) | $ | 65 |
| | $ | 10 |
| | $ | (7 | ) | | $ | 68 |
| |
| Available-for-sale debt securities, December 31, 2010 | |
| | |
| | |
| | |
| |
Available-for-sale marketable equity securities (2) | | $ | 780 |
| | $ | 732 |
| | $ | — |
| | $ | 1,512 |
|
| | | | | | | | | |
| | | December 31, 2011 |
| Available-for-sale debt securities | | | | | | | | |
| U.S. Treasury and agency securities | $ | 49,413 |
| | $ | 604 |
| | $ | (912 | ) | | $ | 49,105 |
| $ | 43,433 |
| | $ | 242 |
| | $ | (811 | ) | | $ | 42,864 |
|
| Mortgage-backed securities: | |
| | |
| | |
| | |
| |
| | |
| | |
| | |
|
| Agency | 190,409 |
| | 3,048 |
| | (2,240 | ) | | 191,217 |
| 138,073 |
| | 4,511 |
| | (21 | ) | | 142,563 |
|
| Agency collateralized mortgage obligations | 36,639 |
| | 401 |
| | (23 | ) | | 37,017 |
| |
| Agency-collateralized mortgage obligations | | 44,392 |
| | 774 |
| | (167 | ) | | 44,999 |
|
Non-agency residential (1) | 23,458 |
| | 588 |
| | (929 | ) | | 23,117 |
| 14,948 |
| | 301 |
| | (482 | ) | | 14,767 |
|
| Non-agency commercial | 6,167 |
| | 686 |
| | (1 | ) | | 6,852 |
| 4,894 |
| | 629 |
| | (1 | ) | | 5,522 |
|
| Non-U.S. securities | 4,054 |
| | 92 |
| | (7 | ) | | 4,139 |
| 4,872 |
| | 62 |
| | (14 | ) | | 4,920 |
|
| Corporate bonds | 5,157 |
| | 144 |
| | (10 | ) | | 5,291 |
| |
| Other taxable securities, substantially all ABS | 15,514 |
| | 39 |
| | (161 | ) | | 15,392 |
| |
| Corporate/Agency bonds | | 2,993 |
| | 79 |
| | (37 | ) | | 3,035 |
|
| Other taxable securities, substantially all asset-backed securities | | 12,889 |
| | 49 |
| | (60 | ) | | 12,878 |
|
| Total taxable securities | 330,811 |
| | 5,602 |
| | (4,283 | ) | | 332,130 |
| 266,494 |
| | 6,647 |
| | (1,593 | ) | | 271,548 |
|
| Tax-exempt securities | 5,687 |
| | 32 |
| | (222 | ) | | 5,497 |
| 4,678 |
| | 15 |
| | (90 | ) | | 4,603 |
|
| Total available-for-sale debt securities | $ | 336,498 |
| | $ | 5,634 |
| | $ | (4,505 | ) | | $ | 337,627 |
| 271,172 |
| | 6,662 |
| | (1,683 | ) | | 276,151 |
|
Held-to-maturity debt securities (2) | 427 |
| | — |
| | — |
| | 427 |
| |
| Held-to-maturity debt securities, substantially all U.S. agency mortgage-backed securities | | 35,265 |
| | 181 |
| | (4 | ) | | 35,442 |
|
| Total debt securities | $ | 336,925 |
| | $ | 5,634 |
| | $ | (4,505 | ) | | $ | 338,054 |
| $ | 306,437 |
| | $ | 6,843 |
| | $ | (1,687 | ) | | $ | 311,593 |
|
Available-for-sale marketable equity securities (3) | $ | 8,650 |
| | $ | 10,628 |
| | $ | (13 | ) | | $ | 19,265 |
| |
Available-for-sale marketable equity securities (2) | | $ | 65 |
| | $ | 10 |
| | $ | (7 | ) | | $ | 68 |
|
| |
(1) | At December 31, 20112012 and 20102011, includes approximately 8991 percent and 9089 percent prime, bonds,six percent and nine percent Alt-A, and eightthree percent Alt-A bonds and two percent subprime bonds.subprime. |
| |
(2) | Substantially all U.S. agency securities. |
| |
(3)
| Classified in other assets on the Corporation’s Consolidated Balance Sheet. |
|
| | |
| | 178Bank of America 20112012183
| | |
At December 31, 20112012, the accumulated net unrealized gains on AFS debt securities included in accumulated OCI were $3.14.4 billion, net of the related income tax expense of $1.92.6 billion. At December 31, 20112012 and 20102011, the Corporation had nonperforming AFS debt securities of $14091 million and $44140 million.
The Corporation recorded OTTI losses on AFS debt securities for2012, 2011 and 2010 as presented in the table below. A debt security is impaired when its fair value is less than its amortized cost. If the Corporation intends or will more-likely-than-not be required to sell the debt securities prior to recovery, the entire impairment loss is recorded in the Corporation’s Consolidated Statement of Income. For debt securities the Corporation does not intend or will not more-likely-more-likely-than-not be required to sell, an
than-not be required to sell, an analysis is performed to determine if any of the impairment is due to credit or whether it is due to other factors (e.g., interest rate). Credit losses are considered unrecoverable and are recorded in the Corporation’s Consolidated Statement of Income with the remaining unrealized losses recorded in accumulated OCI. In certain instances, the credit loss on a debt security may exceed the total impairment, in which case, the portion of the credit loss that exceeds the total impairment is recorded as an unrealized gain in accumulated OCI. Balances in the table below exclude $5 million, $9 million and $51 million of unrealized gains recorded in accumulated OCI related to these securities for 2012, 2011 and 2010., respectively.
| | | | | | | | | | | | | | | | | | | | | | | | | |
| Net Impairment Losses Recognized in Earnings | Net Impairment Losses Recognized in Earnings | | | | | | | Net Impairment Losses Recognized in Earnings | | | | | | |
| | | | | | | | | | | | | | | | | | | | | | | |
| | 2011 | 2012 |
| (Dollars in millions) | Non-agency
Residential
MBS | | Non-agency
Commercial
MBS | | Non-U.S.
Securities | | Corporate
Bonds | | Other
Taxable
Securities | | Total | Non-agency
Residential
MBS | | Non-agency
Commercial
MBS | | Non-U.S.
Securities | | Corporate
Bonds | | Other
Taxable
Securities | | Total |
| Total OTTI losses (unrealized and realized) | $ | (348 | ) | | $ | (10 | ) | | $ | — |
| | $ | — |
| | $ | (2 | ) | | $ | (360 | ) | $ | (50 | ) | | $ | (7 | ) | | $ | — |
| | $ | — |
| | $ | — |
| | $ | (57 | ) |
| Unrealized OTTI losses recognized in accumulated OCI | 61 |
| | — |
| | — |
| | — |
| | — |
| | 61 |
| 4 |
| | — |
| | — |
| | — |
| | — |
| | 4 |
|
| Net impairment losses recognized in earnings | $ | (287 | ) | | $ | (10 | ) | | $ | — |
| | $ | — |
| | $ | (2 | ) | | $ | (299 | ) | $ | (46 | ) | | $ | (7 | ) | | $ | — |
| | $ | — |
| | $ | — |
| | $ | (53 | ) |
| | | | | | | | | | | | | | | | | | | | | | | |
| | 2010 | 2011 |
| Total OTTI losses (unrealized and realized) | $ | (1,305 | ) | | $ | (19 | ) | | $ | (276 | ) | | $ | (6 | ) | | $ | (568 | ) | | $ | (2,174 | ) | $ | (348 | ) | | $ | (10 | ) | | $ | — |
| | $ | — |
| | $ | (2 | ) | | $ | (360 | ) |
| Unrealized OTTI losses recognized in accumulated OCI | 817 |
| | 15 |
| | 16 |
| | 2 |
| | 357 |
| | 1,207 |
| 61 |
| | — |
| | — |
| | — |
| | — |
| | 61 |
|
| Net impairment losses recognized in earnings | $ | (488 | ) | | $ | (4 | ) | | $ | (260 | ) | | $ | (4 | ) | | $ | (211 | ) | | $ | (967 | ) | $ | (287 | ) | | $ | (10 | ) | | $ | — |
| | $ | — |
| | $ | (2 | ) | | $ | (299 | ) |
| | | | | | | | | | | | | | | | | | | | | | | |
| | 2009 | 2010 |
| Total OTTI losses (unrealized and realized) | $ | (2,240 | ) | | $ | (6 | ) | | $ | (360 | ) | | $ | (87 | ) | | $ | (815 | ) | | $ | (3,508 | ) | $ | (1,305 | ) | | $ | (19 | ) | | $ | (276 | ) | | $ | (6 | ) | | $ | (568 | ) | | $ | (2,174 | ) |
| Unrealized OTTI losses recognized in accumulated OCI | 672 |
| | — |
| | — |
| | — |
| | — |
| | 672 |
| 817 |
| | 15 |
| | 16 |
| | 2 |
| | 357 |
| | 1,207 |
|
| Net impairment losses recognized in earnings | $ | (1,568 | ) | | $ | (6 | ) | | $ | (360 | ) | | $ | (87 | ) | | $ | (815 | ) | | $ | (2,836 | ) | $ | (488 | ) | | $ | (4 | ) | | $ | (260 | ) | | $ | (4 | ) | | $ | (211 | ) | | $ | (967 | ) |
The Corporation’s net impairment losses recognized in earnings consist of write-downs to fair value on AFS securities the Corporation has the intent to sell or will more-likely-than-not be required to sell and all credit losses recognized on AFS and HTM securities the Corporation does not have the intent to sell or will not more-likely-than-not be required to sell.losses. The table below presents a
rollforward of the credit losses recognized in earnings in 2012, 2011 and 2010on AFS debt securities these losses as of December 31, 2011 and 2010 that the Corporation does not have the intent to sell or will not more-likely-than-not be required to sell.
| | | | | | | | | | | |
| Rollforward of Credit Losses Recognized | Rollforward of Credit Losses Recognized | | | Rollforward of Credit Losses Recognized | | | | |
| | | | | | | | | |
| (Dollars in millions) | 2011 | | 2010 | 2012 | | 2011 | | 2010 |
|
| Balance, January 1 | $ | 2,148 |
| | $ | 3,155 |
| $ | 310 |
| | $ | 2,148 |
| | $ | 3,155 |
|
| Additions for credit losses recognized on debt securities that had no previous impairment losses | 72 |
| | 487 |
| 7 |
| | 72 |
| | 487 |
|
| Additions for credit losses recognized on debt securities that had previously incurred impairment losses | 149 |
| | 421 |
| 46 |
| | 149 |
| | 421 |
|
| Reductions for debt securities sold or intended to be sold | (2,059 | ) | | (1,915 | ) | (120 | ) | | (2,059 | ) | | (1,915 | ) |
| Balance, December 31 | $ | 310 |
| | $ | 2,148 |
| $ | 243 |
| | $ | 310 |
| | $ | 2,148 |
|
The Corporation estimates the portion of a loss on a security that is attributable to credit using a discounted cash flow model and estimates the expected cash flows of the underlying collateral using internal credit, interest rate and prepayment risk models that incorporate management’s best estimate of current key assumptions such as default rates, loss severity and prepayment rates. Assumptions used for the underlying loans that support the MBS can vary widely from loan to loan and are influenced by such
factors as loan interest rate, geographicalgeographic location of the borrower, borrower characteristics and collateral type. TheBased on these assumptions, the Corporation then determines how the underlying collateral cash flows will be distributed to each securityMBS issued from the structure.applicable special purpose entity. Expected principal and interest cash flows on an impaired AFS debt security are discounted using the effective yield of each individual impaired AFS debt security.
Significant assumptions used in estimating the valuation ofexpected cash flows for measuring credit losses on non-agency residential mortgage-backed securities (RMBS) were as follows at December 31, 20112012.
| | | | | | | | | | | | | |
| Significant Valuation Assumptions | |
| Significant Assumptions | | Significant Assumptions |
| | | | | | | | | | | |
| | | | Range (1) | | | Range (1) |
| | Weighted- average | | 10th Percentile (2) | | 90th Percentile (2) | Weighted- average | | 10th Percentile (2) | | 90th Percentile (2) |
| Prepayment speed | 10 | % | | 3 | % | | 22 | % | 12.9 | % | | 3.1 | % | | 29.7 | % |
| Loss severity | 49 |
| | 15 |
| | 62 |
| 49.5 |
| | 24.2 |
| | 63.1 |
|
| Life default rate | 50 |
| | 2 |
| | 100 |
| 52.4 |
| | 2.4 |
| | 98.2 |
|
| |
(1) | Represents the range of inputs/assumptions based upon the underlying collateral. |
| |
(2) | The value of a variable below which the indicated percentile of observations will fall. |
Additionally, annualAnnual constant prepayment speed and loss severity rates are projected considering collateral characteristics such as LTV, creditworthiness of borrowers as measured using FICO scores and geographic concentrations. The weighted-average severity by collateral type was 4345.8 percent for prime, bonds, 5050.6 percent for Alt-A bonds and 6055.9 percent for subprime bonds at December 31, 20112012. Additionally, default rates are projected by considering collateral characteristics including, but not limited to,
LTV, FICO and geographic concentration. Weighted-average life default rates by collateral type were 3639.5 percent for prime, bonds, 6263.5 percent for Alt-A bonds and 7241.8 percent for subprime bonds at December 31, 20112012.
The table below presents the fair value and the associated gross unrealized losses on AFS securities with gross unrealized losses at December 31, 20112012 and 20102011, and whether these securities have had gross unrealized losses for less than twelve months or for twelve months or longer.
| | | | | | | | | | | | | | | | | | | | | | | | | |
| Temporarily impaired and Other-than-temporarily Impaired Securities | | | | | | | |
| Temporarily Impaired and Other-than-temporarily Impaired Securities | | Temporarily Impaired and Other-than-temporarily Impaired Securities | | | | | | |
| | | | | | | | | | | | | |
| | | | | | | | | | | | | December 31, 2012 |
| | Less than Twelve Months | | Twelve Months or Longer | | Total | Less than Twelve Months | | Twelve Months or Longer | | Total |
| (Dollars in millions) | Fair Value | | Gross Unrealized Losses | | Fair Value | | Gross Unrealized Losses | | Fair Value | | Gross Unrealized Losses | Fair Value | | Gross Unrealized Losses | | Fair Value | | Gross Unrealized Losses | | Fair Value | | Gross Unrealized Losses |
| Temporarily impaired available-for-sale debt securities at December 31, 2011 | |
| | |
| | |
| | |
| | |
| | |
| |
| Temporarily impaired available-for-sale debt securities | | |
| | |
| | |
| | |
| | |
| | |
|
| U.S. Treasury and agency securities | $ | — |
| | $ | — |
| | $ | 38,269 |
| | $ | (811 | ) | | $ | 38,269 |
| | $ | (811 | ) | $ | — |
| | $ | — |
| | $ | 5,608 |
| | $ | (84 | ) | | $ | 5,608 |
| | $ | (84 | ) |
| Mortgage-backed securities: | | | | | | | | | | | | | | | | | | | | | | |
| Agency | 4,679 |
| | (13 | ) | | 474 |
| | (8 | ) | | 5,153 |
| | (21 | ) | 15,593 |
| | (133 | ) | | 735 |
| | (13 | ) | | 16,328 |
| | (146 | ) |
| Agency collateralized mortgage obligations | 11,448 |
| | (134 | ) | | 976 |
| | (33 | ) | | 12,424 |
| | (167 | ) | |
| Agency-collateralized mortgage obligations | | 5,135 |
| | (121 | ) | | 4,994 |
| | (97 | ) | | 10,129 |
| | (218 | ) |
| Non-agency residential | | 592 |
| | (13 | ) | | 1,555 |
| | (110 | ) | | 2,147 |
| | (123 | ) |
| Non-U.S. securities | | 1,715 |
| | (1 | ) | | 563 |
| | (5 | ) | | 2,278 |
| | (6 | ) |
| Corporate/Agency bonds | | — |
| | — |
| | 277 |
| | (16 | ) | | 277 |
| | (16 | ) |
| Other taxable securities | | 1,678 |
| | (1 | ) | | 1,436 |
| | (14 | ) | | 3,114 |
| | (15 | ) |
| Total taxable securities | | 24,713 |
| | (269 | ) | | 15,168 |
| | (339 | ) | | 39,881 |
| | (608 | ) |
| Tax-exempt securities | | 1,609 |
| | (9 | ) | | 1,072 |
| | (38 | ) | | 2,681 |
| | (47 | ) |
| Total temporarily impaired available-for-sale debt securities | | 26,322 |
| | (278 | ) | | 16,240 |
| | (377 | ) | | 42,562 |
| | (655 | ) |
Other-than-temporarily impaired available-for-sale debt securities (1) | | | | | | | | | | | | |
| Non-agency residential mortgage-backed securities | | 14 |
| | (1 | ) | | 74 |
| | (4 | ) | | 88 |
| | (5 | ) |
Total temporarily impaired and other-than-temporarily impaired available-for-sale securities (2) | | $ | 26,336 |
| | $ | (279 | ) | | $ | 16,314 |
| | $ | (381 | ) | | $ | 42,650 |
| | $ | (660 | ) |
| | | | | | | | | | | | | |
| | | December 31, 2011 |
| Temporarily impaired available-for-sale debt securities | | | | | | | | | | | | |
| U.S. Treasury and agency securities | | $ | — |
| | $ | — |
| | $ | 38,269 |
| | $ | (811 | ) | | $ | 38,269 |
| | $ | (811 | ) |
| Mortgage-backed securities: | | | | | | | | | | | | |
| Agency | | 4,679 |
| | (13 | ) | | 474 |
| | (8 | ) | | 5,153 |
| | (21 | ) |
| Agency-collateralized mortgage obligations | | 11,448 |
| | (134 | ) | | 976 |
| | (33 | ) | | 12,424 |
| | (167 | ) |
| Non-agency residential | 2,112 |
| | (59 | ) | | 3,950 |
| | (350 | ) | | 6,062 |
| | (409 | ) | 2,112 |
| | (59 | ) | | 3,950 |
| | (350 | ) | | 6,062 |
| | (409 | ) |
| Non-agency commercial | 55 |
| | (1 | ) | | — |
| | — |
| | 55 |
| | (1 | ) | 55 |
| | (1 | ) | | — |
| | — |
| | 55 |
| | (1 | ) |
| Non-U.S. securities | 1,008 |
| | (13 | ) | | 165 |
| | (1 | ) | | 1,173 |
| | (14 | ) | 1,008 |
| | (13 | ) | | 165 |
| | (1 | ) | | 1,173 |
| | (14 | ) |
| Corporate bonds | 415 |
| | (29 | ) | | 111 |
| | (8 | ) | | 526 |
| | (37 | ) | |
| Corporate/Agency bonds | | 415 |
| | (29 | ) | | 111 |
| | (8 | ) | | 526 |
| | (37 | ) |
| Other taxable securities | 4,210 |
| | (41 | ) | | 1,361 |
| | (19 | ) | | 5,571 |
| | (60 | ) | 4,210 |
| | (41 | ) | | 1,361 |
| | (19 | ) | | 5,571 |
| | (60 | ) |
| Total taxable securities | $ | 23,927 |
| | $ | (290 | ) | | $ | 45,306 |
| | $ | (1,230 | ) | | $ | 69,233 |
| | $ | (1,520 | ) | 23,927 |
| | (290 | ) | | 45,306 |
| | (1,230 | ) | | 69,233 |
| | (1,520 | ) |
| Tax-exempt securities | 1,117 |
| | (25 | ) | | 2,754 |
| | (65 | ) | | 3,871 |
| | (90 | ) | 1,117 |
| | (25 | ) | | 2,754 |
| | (65 | ) | | 3,871 |
| | (90 | ) |
| Total temporarily impaired available-for-sale debt securities | 25,044 |
| | (315 | ) | | 48,060 |
| | (1,295 | ) | | 73,104 |
| | (1,610 | ) | 25,044 |
| | (315 | ) | | 48,060 |
| | (1,295 | ) | | 73,104 |
| | (1,610 | ) |
| Temporarily impaired available-for-sale marketable equity securities | 31 |
| | (1 | ) | | 6 |
| | (6 | ) | | 37 |
| | (7 | ) | 31 |
| | (1 | ) | | 6 |
| | (6 | ) | | 37 |
| | (7 | ) |
| Total temporarily impaired available-for-sale securities | 25,075 |
| | (316 | ) | | 48,066 |
| | (1,301 | ) | | 73,141 |
| | (1,617 | ) | 25,075 |
| | (316 | ) | | 48,066 |
| | (1,301 | ) | | 73,141 |
| | (1,617 | ) |
Other-than-temporarily impaired available-for-sale debt securities (1) | | | | | | | | | | | | | | | | | | | | | | |
| Non-agency residential mortgage-backed securities | 158 |
| | (28 | ) | | 489 |
| | (45 | ) | | 647 |
| | (73 | ) | 158 |
| | (28 | ) | | 489 |
| | (45 | ) | | 647 |
| | (73 | ) |
Total temporarily impaired and other-than-temporarily impaired securities (2) | $ | 25,233 |
| | $ | (344 | ) | | $ | 48,555 |
| | $ | (1,346 | ) | | $ | 73,788 |
| | $ | (1,690 | ) | |
| | | | | | | | | | | | | |
| Temporarily impaired available-for-sale debt securities at December 31, 2010 | | | | | | | | | | | | |
| U.S. Treasury and agency securities | $ | 27,384 |
| | $ | (763 | ) | | $ | 2,382 |
| | $ | (149 | ) | | $ | 29,766 |
| | $ | (912 | ) | |
| Mortgage-backed securities: | | | | | | | | | | | | |
| Agency | 85,517 |
| | (2,240 | ) | | — |
| | — |
| | 85,517 |
| | (2,240 | ) | |
| Agency collateralized mortgage obligations | 3,220 |
| | (23 | ) | | — |
| | — |
| | 3,220 |
| | (23 | ) | |
| Non-agency residential | 6,385 |
| | (205 | ) | | 2,245 |
| | (274 | ) | | 8,630 |
| | (479 | ) | |
| Non-agency commercial | 47 |
| | (1 | ) | | — |
| | — |
| | 47 |
| | (1 | ) | |
| Non-U.S. securities | — |
| | — |
| | 70 |
| | (7 | ) | | 70 |
| | (7 | ) | |
| Corporate bonds | 465 |
| | (9 | ) | | 22 |
| | (1 | ) | | 487 |
| | (10 | ) | |
| Other taxable securities | 3,414 |
| | (38 | ) | | 46 |
| | (7 | ) | | 3,460 |
| | (45 | ) | |
| Total taxable securities | $ | 126,432 |
| | $ | (3,279 | ) | | $ | 4,765 |
| | $ | (438 | ) | | $ | 131,197 |
| | $ | (3,717 | ) | |
| Tax-exempt securities | 2,325 |
| | (95 | ) | | 568 |
| | (119 | ) | | 2,893 |
| | (214 | ) | |
| Total temporarily impaired available-for-sale debt securities | 128,757 |
| | (3,374 | ) | | 5,333 |
| | (557 | ) | | 134,090 |
| | (3,931 | ) | |
| Temporarily impaired available-for-sale marketable equity securities | 7 |
| | (2 | ) | | 19 |
| | (11 | ) | | 26 |
| | (13 | ) | |
| Total temporarily impaired available-for-sale securities | 128,764 |
| | (3,376 | ) | | 5,352 |
| | (568 | ) | | 134,116 |
| | (3,944 | ) | |
Other-than-temporarily impaired available-for-sale debt securities (1) | | | | | | | | | | | | |
| Mortgage-backed securities: | | | | | | | | | | | | |
| Non-agency residential | 128 |
| | (11 | ) | | 530 |
| | (439 | ) | | 658 |
| | (450 | ) | |
| Other taxable securities | — |
| | — |
| | 223 |
| | (116 | ) | | 223 |
| | (116 | ) | |
| Tax-exempt securities | 68 |
| | (8 | ) | | — |
| | — |
| | 68 |
| | (8 | ) | |
Total temporarily impaired and other-than-temporarily impaired securities (2) | $ | 128,960 |
| | $ | (3,395 | ) | | $ | 6,105 |
| | $ | (1,123 | ) | | $ | 135,065 |
| | $ | (4,518 | ) | |
Total temporarily impaired and other-than-temporarily impaired available-for-sale securities (2) | | $ | 25,233 |
| | $ | (344 | ) | | $ | 48,555 |
| | $ | (1,346 | ) | | $ | 73,788 |
| | $ | (1,690 | ) |
| |
(1) | Includes other-than-temporarily impaired AFS debt securities on which a portion of thean OTTI loss remains in OCI. |
| |
(2) | At December 31, 20112012 and 20102011, the amortized cost of approximately 3,8002,600 and 8,5003,800 AFS securities exceeded their fair value by $1.7 billion660 million and $4.51.7 billion. |
|
| | |
| | 180Bank of America 20112012185
| | |
The amortized cost and fair value of the Corporation’s investment in AFS and held-to-maturityHTM debt securities from FNMA, the Government National Mortgage Association (GNMA), FHLMC and U.S. Treasury securities where the investment exceeded 10 percent of consolidated shareholders’ equity at December 31, 20112012 and 20102011 are presented in the table below.
| | | | | | | | | | | | | | | | | |
| Selected Securities Exceeding 10 Percent of Shareholders’ Equity | Selected Securities Exceeding 10 Percent of Shareholders’ Equity | | | Selected Securities Exceeding 10 Percent of Shareholders’ Equity | | |
| | | | | | | | | | | | | | | |
| | December 31 | December 31 |
| | 2011 | | 2010 | 2012 | | 2011 |
| (Dollars in millions) | Amortized Cost | | Fair Value | | Amortized Cost | | Fair Value | Amortized Cost | | Fair Value | | Amortized Cost | | Fair Value |
| Government National Mortgage Association | | $ | 124,348 |
| | $ | 127,541 |
| | $ | 102,960 |
| | $ | 106,200 |
|
| Fannie Mae | $ | 87,898 |
| | $ | 89,243 |
| | $ | 123,662 |
| | $ | 123,107 |
| 121,522 |
| | 123,933 |
| | 87,898 |
| | 89,243 |
|
| Government National Mortgage Association | 102,960 |
| | 106,200 |
| | 72,863 |
| | 74,305 |
| |
| Freddie Mac | 26,617 |
| | 27,129 |
| | 30,523 |
| | 30,822 |
| 22,995 |
| | 23,502 |
| | 26,617 |
| | 27,129 |
|
| U.S. Treasury securities | 39,946 |
| | 39,164 |
| | 46,576 |
| | 46,081 |
| 21,269 |
| | 21,305 |
| | 39,946 |
| | 39,164 |
|
The expected maturity distribution of the Corporation’s MBS and the contractual maturity distribution of the Corporation’s other AFS debt securities, and the yields on the Corporation’s AFS debt securities portfolio at December 31, 20112012 are summarized in the
table below. Actual maturities may differ from the contractual or expected maturities since borrowers may have the right to prepay obligations with or without prepayment penalties.
| | | | | | | | | | | | | | | | | | | | | | | | | | | | | | | | | | | | | | | | | |
| Debt Securities Maturities | Debt Securities Maturities | | | | | | | | | | | | | | | Debt Securities Maturities | | | | | | | | | | | | | | |
| | | | | | | | | | | | | | | | | | | | | | | | | | | | | | | | | | | | | | | |
| | December 31, 2011 | December 31, 2012 |
| | Due in One Year or Less | | Due after One Year through Five Years | | Due after Five Years through Ten Years | | Due after Ten Years | | Total | Due in One Year or Less | | Due after One Year through Five Years | | Due after Five Years through Ten Years | | Due after Ten Years | | Total |
| (Dollars in millions) | Amount | | Yield (1) | | Amount | | Yield (1) | | Amount | | Yield (1) | | Amount | | Yield (1) | | Amount | | Yield (1) | Amount | | Yield (1) | | Amount | | Yield (1) | | Amount | | Yield (1) | | Amount | | Yield (1) | | Amount | | Yield (1) |
| Amortized cost of AFS debt securities | |
| | |
| | |
| | |
| | |
| | |
| | |
| | |
| | |
| | |
| |
| | |
| | |
| | |
| | |
| | |
| | |
| | |
| | |
| | |
|
| U.S. Treasury and agency securities | $ | 556 |
| | 4.90 | % | | $ | 767 |
| | 5.40 | % | | $ | 2,377 |
| | 5.30 | % | | $ | 39,733 |
| | 2.70 | % | | $ | 43,433 |
| | 2.80 | % | $ | 548 |
| | 0.57 | % | | $ | 855 |
| | 2.12 | % | | $ | 1,884 |
| | 5.30 | % | | $ | 20,945 |
| | 2.80 | % | | $ | 24,232 |
| | 3.00 | % |
| Mortgage-backed securities: | |
| | |
| | |
| | |
| | |
| | |
| | |
| | |
| | |
| | |
| |
| | |
| | |
| | |
| | |
| | |
| | |
| | |
| | |
| | |
|
| Agency | 24 |
| | 4.40 |
| | 54,675 |
| | 3.30 |
| | 58,686 |
| | 3.60 |
| | 24,688 |
| | 3.40 |
| | 138,073 |
| | 3.50 |
| 7 |
| | 4.70 |
| | 59,880 |
| | 3.10 |
| | 123,075 |
| | 2.90 |
| | 285 |
| | 2.60 |
| | 183,247 |
| | 2.90 |
|
| Agency-collateralized mortgage obligations | 57 |
| | 0.70 |
| | 35,709 |
| | 2.50 |
| | 8,606 |
| | 3.80 |
| | 20 |
| | 1.10 |
| | 44,392 |
| | 2.70 |
| 11 |
| | 6.31 |
| | 12,876 |
| | 1.20 |
| | 23,427 |
| | 3.10 |
| | 15 |
| | 1.10 |
| | 36,329 |
| | 2.40 |
|
| Non-agency residential | 2,758 |
| | 4.30 |
| | 9,900 |
| | 5.10 |
| | 1,775 |
| | 4.70 |
| | 515 |
| | 3.30 |
| | 14,948 |
| | 4.80 |
| 750 |
| | 4.50 |
| | 5,112 |
| | 4.30 |
| | 2,767 |
| | 4.00 |
| | 602 |
| | 6.70 |
| | 9,231 |
| | 4.40 |
|
| Non-agency commercial | 227 |
| | 4.90 |
| | 4,484 |
| | 6.80 |
| | 64 |
| | 6.80 |
| | 119 |
| | 7.60 |
| | 4,894 |
| | 6.80 |
| 456 |
| | 5.70 |
| | 3,080 |
| | 5.90 |
| | 22 |
| | 3.70 |
| | 18 |
| | 4.03 |
| | 3,576 |
| | 5.90 |
|
| Non-U.S. securities | 2,271 |
| | 0.50 |
| | 2,429 |
| | 4.80 |
| | 172 |
| | 2.50 |
| | — |
| | — |
| | 4,872 |
| | 4.70 |
| 4,247 |
| | 1.46 |
| | 1,169 |
| | 6.10 |
| | 158 |
| | 2.20 |
| | — |
| | — |
| | 5,574 |
| | 2.65 |
|
| Corporate bonds | 586 |
| | 1.70 |
| | 1,353 |
| | 2.10 |
| | 901 |
| | 2.40 |
| | 153 |
| | 1.20 |
| | 2,993 |
| | 2.10 |
| |
| Corporate/Agency bonds | | 315 |
| | 2.40 |
| | 808 |
| | 2.80 |
| | 185 |
| | 4.52 |
| | 107 |
| | 0.90 |
| | 1,415 |
| | 2.92 |
|
| Other taxable securities | 2,228 |
| | 1.20 |
| | 7,364 |
| | 1.30 |
| | 1,811 |
| | 1.90 |
| | 1,486 |
| | 1.10 |
| | 12,889 |
| | 1.40 |
| 2,501 |
| | 1.10 |
| | 4,926 |
| | 1.10 |
| | 3,803 |
| | 1.82 |
| | 859 |
| | 1.10 |
| | 12,089 |
| | 1.37 |
|
| Total taxable securities | 8,707 |
| | 2.37 |
| | 116,681 |
| | 3.25 |
| | 74,392 |
| | 3.65 |
| | 66,714 |
| | 2.93 |
| | 266,494 |
| | 3.29 |
| 8,835 |
| | 1.84 |
| | 88,706 |
| | 2.91 |
| | 155,321 |
| | 2.95 |
| | 22,831 |
| | 2.83 |
| | 275,693 |
| | 2.86 |
|
| Tax-exempt securities | 54 |
| | 2.40 |
| | 1,046 |
| | 1.80 |
| | 857 |
| | 2.40 |
| | 2,721 |
| | 0.30 |
| | 4,678 |
| | 1.04 |
| 43 |
| | 2.63 |
| | 1,524 |
| | 1.40 |
| | 1,185 |
| | 2.02 |
| | 1,415 |
| | 1.10 |
| | 4,167 |
| | 1.68 |
|
| Total amortized cost of AFS debt securities | $ | 8,761 |
| | 2.37 |
| | $ | 117,727 |
| | 3.23 |
| | $ | 75,249 |
| | 3.63 |
| | $ | 69,435 |
| | 2.83 |
| | $ | 271,172 |
| | 3.25 |
| $ | 8,878 |
| | 1.84 |
| | $ | 90,230 |
| | 2.88 |
| | $ | 156,506 |
| | 2.95 |
| | $ | 24,246 |
| | 2.72 |
| | $ | 279,860 |
| | 2.84 |
|
Total amortized cost of held-to-maturity debt securities (2) | $ | 9 |
| | 3.00 |
| | $ | 60 |
| | 2.90 |
| | $ | 9,199 |
| | 2.90 |
| | $ | 25,997 |
| | 3.00 |
| | $ | 35,265 |
| | 3.00 |
| $ | 6 |
| | 5.00 |
| | $ | 8,616 |
| | 2.30 |
| | $ | 40,836 |
| | 2.40 |
| | $ | 23 |
| | 4.40 |
| | $ | 49,481 |
| | 2.40 |
|
| Fair value of AFS debt securities | |
| | |
| | |
| | |
| | |
| | |
| | |
| | |
| | |
| | |
| |
| | |
| | |
| | |
| | |
| | |
| | |
| | |
| | |
| | |
|
| U.S. Treasury and agency securities | $ | 558 |
| | |
| | $ | 794 |
| | |
| | $ | 2,580 |
| | |
| | $ | 38,932 |
| | |
| | $ | 42,864 |
| | |
| $ | 549 |
| | |
| | $ | 883 |
| | |
| | $ | 2,072 |
| | |
| | $ | 20,968 |
| | |
| | $ | 24,472 |
| | |
|
| Mortgage-backed securities: | |
| | |
| | |
| | |
| | |
| | |
| | |
| | |
| | |
| | |
| |
| | |
| | |
| | |
| | |
| | |
| | |
| | |
| | |
| | |
|
| Agency | 25 |
| | |
| | 56,084 |
| | |
| | 61,170 |
| | |
| | 25,284 |
| | |
| | 142,563 |
| | |
| 7 |
| | |
| | 61,234 |
| | |
| | 126,619 |
| | |
| | 289 |
| | |
| | 188,149 |
| | |
|
| Agency-collateralized mortgage obligations | 58 |
| | |
| | 36,057 |
| | |
| | 8,864 |
| | |
| | 20 |
| | |
| | 44,999 |
| | |
| 11 |
| | |
| | 12,827 |
| | |
| | 24,684 |
| | |
| | 16 |
| | |
| | 37,538 |
| | |
|
| Non-agency residential | 2,736 |
| | |
| | 9,851 |
| | |
| | 1,698 |
| | |
| | 482 |
| | |
| | 14,767 |
| | |
| 749 |
| | |
| | 5,239 |
| | |
| | 2,841 |
| | |
| | 665 |
| | |
| | 9,494 |
| | |
|
| Non-agency commercial | 229 |
| | |
| | 5,079 |
| | |
| | 72 |
| | |
| | 142 |
| | |
| | 5,522 |
| | |
| 477 |
| | |
| | 3,405 |
| | |
| | 24 |
| | |
| | 18 |
| | |
| | 3,924 |
| | |
|
| Non-U.S. securities | 2,270 |
| | |
| | 2,476 |
| | |
| | 174 |
| | |
| | — |
| | |
| | 4,920 |
| | |
| 4,244 |
| | |
| | 1,211 |
| | |
| | 163 |
| | |
| | — |
| | |
| | 5,618 |
| | |
|
| Corporate bonds | 590 |
| | |
| | 1,354 |
| | |
| | 945 |
| | |
| | 146 |
| | |
| | 3,035 |
| | |
| |
| Corporate/Agency bonds | | 320 |
| | |
| | 826 |
| | |
| | 207 |
| | |
| | 97 |
| | |
| | 1,450 |
| | |
|
| Other taxable securities | 2,228 |
| | |
| | 7,373 |
| | |
| | 1,796 |
| | |
| | 1,481 |
| | |
| | 12,878 |
| | |
| 2,502 |
| | |
| | 4,947 |
| | |
| | 3,825 |
| | |
| | 854 |
| | |
| | 12,128 |
| | |
|
| Total taxable securities | 8,694 |
| | |
| | 119,068 |
| | |
| | 77,299 |
| | |
| | 66,487 |
| | |
| | 271,548 |
| | |
| 8,859 |
| | |
| | 90,572 |
| | |
| | 160,435 |
| | |
| | 22,907 |
| | |
| | 282,773 |
| | |
|
| Tax-exempt securities | 54 |
| | |
| | 1,040 |
| | |
| | 853 |
| | |
| | 2,656 |
| | |
| | 4,603 |
| | |
| 43 |
| | |
| | 1,526 |
| | |
| | 1,184 |
| | |
| | 1,380 |
| | |
| | 4,133 |
| | |
|
| Total fair value of AFS debt securities | $ | 8,748 |
| | |
| | $ | 120,108 |
| | |
| | $ | 78,152 |
| | |
| | $ | 69,143 |
| | |
| | $ | 276,151 |
| | |
| $ | 8,902 |
| | |
| | $ | 92,098 |
| | |
| | $ | 161,619 |
| | |
| | $ | 24,287 |
| | |
| | $ | 286,906 |
| | |
|
Total fair value of held-to-maturity debt securities (2) | $ | 9 |
| | | | $ | 60 |
| | | | $ | 9,243 |
| | | | $ | 26,130 |
| | | | $ | 35,442 |
| | | $ | 6 |
| | | | $ | 8,790 |
| | | | $ | 41,451 |
| | | | $ | 23 |
| | | | $ | 50,270 |
| | |
| |
(1) | Average yield is computed using the effective yield of each security at the end of the period, weighted based on the amortized cost of each security. The effective yield considers the contractual coupon, amortization of premiums and accretion of discounts, and excludes the effect of related hedging derivatives. |
| |
(2) | Substantially all U.S. agency mortgage-backed securities. |
The gross realized gains and losses on sales of AFS debt securities for 2012, 2011 and 2010 are presented in the table below.
|
| | | | | | | | | | | |
| | | | | | |
| Gains and Losses on Sales of AFS Debt Securities |
| | | | | | |
| (Dollars in millions) | 2012 | | 2011 | | 2010 |
| Gross gains | $ | 2,128 |
| | $ | 3,685 |
| | $ | 3,995 |
|
| Gross losses | (466 | ) | | (311 | ) | | (1,469 | ) |
| Net gains on sales of AFS debt securities | $ | 1,662 |
| | $ | 3,374 |
| | $ | 2,526 |
|
| Income tax expense attributable to realized net gains on sales of AFS debt securities | $ | 615 |
| | $ | 1,248 |
| | $ | 935 |
|
Certain Corporate and Strategic Investments
At December 31, 2012 and 2011, the Corporation owned 2.0 billion shares representing approximately one percent of China
Construction Bank Corporation (CCB). Sales restrictions on these shares continue until August 2013. Because the sales restrictions on these shares will expire within one year, these securities are accounted for as AFS marketable equity securities and are carried at fair value with the after-tax unrealized gain included in accumulated OCI. At December 31, 2011, this investment was accounted for at cost. The carrying value of the investment at December 31, 2012 and 2011 was $1.4 billion and $716 million, and the cost basis and the fair value were $716 million and $1.4 billion for both periods. There is a strategic assistance agreement between the Corporation and CCB, which includes cooperation in specific business areas.
The Corporation’s 49 percent investment in a merchant services joint venture had a carrying value of $3.3 billion and $3.4 billion at December 31, 2012 and 2011. For additional information, see Note 13 – Commitments and Contingencies.
|
| | |
| | | Bank of America 2012 181187 |
The gross realized gains and losses on sales of AFS debt securities for 2011, 2010 and 2009 are presented in the table below.
|
| | | | | | | | | | | |
| | | | | | |
| Gains and Losses on Sales of AFS Debt Securities |
| | | | | | |
| (Dollars in millions) | 2011 | | 2010 | | 2009 |
| Gross gains | $ | 3,685 |
| | $ | 3,995 |
| | $ | 5,047 |
|
| Gross losses | (311 | ) | | (1,469 | ) | | (324 | ) |
| Net gains on sales of AFS debt securities | $ | 3,374 |
| | $ | 2,526 |
| | $ | 4,723 |
|
| Income tax expense attributable to realized net gains on sales of AFS debt securities | $ | 1,248 |
| | $ | 935 |
| | $ | 1,748 |
|
Certain Corporate and Strategic Investments
At December 31, 2011 and 2010, the Corporation owned 2.0 billion shares and 25.6 billion shares representing approximately one percent and 10 percent of China Construction Bank Corporation (CCB). During 2011, the Corporation sold shares of CCB and in connection therewith recorded gains of $6.5 billion. Sales restrictions on the remaining 2.0 billion CCB shares continue until August 2013 and accordingly these shares are carried at cost. At December 31, 2011 and 2010, the cost basis of the
Corporation’s total investment in CCB was $716 million and $9.2 billion, the carrying value was $716 million and $19.7 billion and the fair value was $1.4 billion and $20.8 billion. This investment is recorded in other assets. Dividend income on this investment is recorded in equity investment income and during 2011 and 2010, the Corporation recorded dividends of $836 million and $535 million from CCB. The strategic assistance agreement between the Corporation and CCB, which includes cooperation in specific business areas, remains in place.
During 2011, the Corporation sold its remaining ownership interest of approximately 13.6 million preferred shares, or seven percent of BlackRock, Inc. The investment was recorded in other assets at cost. In connection with the sale, the Corporation recorded a gain of $377 million.
During 2011, the Corporation recorded $1.1 billion of impairment charges on its investment in a merchant services joint venture. The joint venture had a carrying value of $3.4 billion and $4.7 billion at December 31, 2011 and 2010 with the reduction in carrying value primarily the result of the impairment charges. The impairment charges were based on the ongoing financial performance of the joint venture and updated forecasts of its long-term financial performance. For additional information, see Note 14 – Commitments and Contingencies.
NOTE 65 Outstanding Loans and Leases
The following tables present total outstanding loans and leases and an aging analysis for the Corporation’s Home Loans, Credit Card and Other Consumer, and Commercial portfolio segments, by class of financing receivables, at December December��31, 20112012 and 20102011.
The Legacy Asset Servicing portfolio, as shown in the table below, is a separately managed legacy mortgage portfolio. Legacy Asset Servicing, which was created on January 1, 2011 in connection with the re-alignment of the Consumer Real Estate Services (CRES) business segment, is responsible for servicing loans on its balance sheet and for others including loans held in other business segments and AllOther. This includes servicing
and managing the runoff and exposures related to selected residential mortgages and home equity loans, including discontinued real estate products, Countrywide PCI loans and certain loans that met a pre-defined delinquency status or probability of default threshold as of January 1, 2011. Since making the determination of the pool of loans to be included in the Legacy Asset Servicing portfolio, the criteria have not changed for this portfolio; however, the criteria will continue to be evaluated over time.
| | | | | | | | | | | | | | | | | | | | | | | | | | | | | | | | | |
| | December 31, 2011 | December 31, 2012 |
| (Dollars in millions) | 30-59 Days Past Due (1) | | 60-89 Days Past Due (1) | | 90 Days or
More Past Due (2) | | Total Past
Due 30 Days or More | | Total Current or Less Than 30 Days Past Due (3) | | Purchased
Credit-impaired (4) | | Loans Accounted for Under the Fair Value Option | | Total Outstandings | 30-59 Days Past Due (1) | | 60-89 Days Past Due (1) | | 90 Days or
More Past Due (2) | | Total Past
Due 30 Days or More | | Total Current or Less Than 30 Days Past Due (3) | | Purchased
Credit-impaired (4) | | Loans Accounted for Under the Fair Value Option | | Total Outstandings |
| Home loans | |
| | | | |
| | |
| | |
| | |
| | |
| | |
| |
| | | | |
| | |
| | |
| | |
| | |
| | |
|
| Core portfolio | | | | | | | | | | | | | | | | | | | | | | | | | | | | | | |
Residential mortgage (5) | $ | 2,151 |
| | $ | 751 |
| | $ | 3,017 |
| | $ | 5,919 |
| | $ | 172,418 |
| | $ | — |
| | | | $ | 178,337 |
| $ | 2,274 |
| | $ | 806 |
| | $ | 6,227 |
| | $ | 9,307 |
| | $ | 160,809 |
| | | | | | $ | 170,116 |
|
| Home equity | 260 |
| | 155 |
| | 429 |
| | 844 |
| | 66,211 |
| | — |
| | | | 67,055 |
| 273 |
| | 146 |
| | 591 |
| | 1,010 |
| | 59,841 |
| | | | | | 60,851 |
|
| Legacy Asset Servicing portfolio | | | | | | | | | | | | | | | | |
| Legacy Assets & Servicing portfolio | | | | | | | | | | | | | | | | |
| Residential mortgage | 3,195 |
| | 2,174 |
| | 32,167 |
| | 37,536 |
| | 36,451 |
| | 9,966 |
| | | | 83,953 |
| 2,891 |
| | 1,696 |
| | 26,494 |
| | 31,081 |
| | 33,247 |
| | $ | 8,737 |
| | | | 73,065 |
|
| Home equity | 845 |
| | 508 |
| | 1,735 |
| | 3,088 |
| | 42,578 |
| | 11,978 |
| | | | 57,644 |
| 607 |
| | 356 |
| | 1,444 |
| | 2,407 |
| | 36,191 |
| | 8,547 |
| | | | 47,145 |
|
Discontinued real estate (6) | 65 |
| | 24 |
| | 351 |
| | 440 |
| | 798 |
| | 9,857 |
| | | | 11,095 |
| 48 |
| | 19 |
| | 234 |
| | 301 |
| | 757 |
| | 8,834 |
| | | | 9,892 |
|
| Credit card and other consumer | | | | | | | | | | | | | | | | | | | | | | | | | | | | | | |
| U.S. credit card | 981 |
| | 772 |
| | 2,070 |
| | 3,823 |
| | 98,468 |
| | — |
| | | | 102,291 |
| 729 |
| | 582 |
| | 1,437 |
| | 2,748 |
| | 92,087 |
| | | | | | 94,835 |
|
| Non-U.S. credit card | 148 |
| | 120 |
| | 342 |
| | 610 |
| | 13,808 |
| | — |
| | | | 14,418 |
| 106 |
| | 85 |
| | 212 |
| | 403 |
| | 11,294 |
| | | | | | 11,697 |
|
Direct/Indirect consumer (7) | 805 |
| | 338 |
| | 779 |
| | 1,922 |
| | 87,791 |
| | — |
| | | | 89,713 |
| 569 |
| | 239 |
| | 573 |
| | 1,381 |
| | 81,824 |
| | | | | | 83,205 |
|
Other consumer (8) | 55 |
| | 21 |
| | 17 |
| | 93 |
| | 2,595 |
| | — |
| | | | 2,688 |
| 48 |
| | 19 |
| | 4 |
| | 71 |
| | 1,557 |
| | | | | | 1,628 |
|
| Total consumer loans | 8,505 |
| | 4,863 |
| | 40,907 |
| | 54,275 |
| | 521,118 |
| | 31,801 |
| | | | 607,194 |
| 7,545 |
| | 3,948 |
| | 37,216 |
| | 48,709 |
| | 477,607 |
| | 26,118 |
| | | | 552,434 |
|
Consumer loans accounted for under the fair value option (9) | |
| | |
| | |
| | |
| | |
| | |
| | $ | 2,190 |
| | 2,190 |
| |
| | |
| | |
| | |
| | |
| | |
| | $ | 1,005 |
| | 1,005 |
|
| Total consumer | 8,505 |
| | 4,863 |
| | 40,907 |
| | 54,275 |
| | 521,118 |
| | 31,801 |
| | 2,190 |
| | 609,384 |
| 7,545 |
| | 3,948 |
| | 37,216 |
| | 48,709 |
| | 477,607 |
| | 26,118 |
| | 1,005 |
| | 553,439 |
|
| Commercial | | | | | | | | | | | | | | | | | | | | | | | | | | | | | | |
| U.S. commercial | 272 |
| | 83 |
| | 2,249 |
| | 2,604 |
| | 177,344 |
| | — |
| | | | 179,948 |
| 323 |
| | 133 |
| | 639 |
| | 1,095 |
| | 196,031 |
| | | | | | 197,126 |
|
Commercial real estate (10) | 133 |
| | 44 |
| | 3,887 |
| | 4,064 |
| | 35,532 |
| | — |
| | | | 39,596 |
| 79 |
| | 144 |
| | 983 |
| | 1,206 |
| | 37,431 |
| | | | | | 38,637 |
|
| Commercial lease financing | 78 |
| | 13 |
| | 40 |
| | 131 |
| | 21,858 |
| | — |
| | | | 21,989 |
| 84 |
| | 79 |
| | 30 |
| | 193 |
| | 23,650 |
| | | | | | 23,843 |
|
| Non-U.S. commercial | 24 |
| | — |
| | 143 |
| | 167 |
| | 55,251 |
| | — |
| | | | 55,418 |
| 2 |
| | — |
| | — |
| | 2 |
| | 74,182 |
| | | | | | 74,184 |
|
| U.S. small business commercial | 142 |
| | 100 |
| | 331 |
| | 573 |
| | 12,678 |
| | — |
| | | | 13,251 |
| 101 |
| | 75 |
| | 168 |
| | 344 |
| | 12,249 |
| | | | | | 12,593 |
|
| Total commercial loans | 649 |
| | 240 |
| | 6,650 |
| | 7,539 |
| | 302,663 |
| | — |
| | | | 310,202 |
| 589 |
| | 431 |
| | 1,820 |
| | 2,840 |
| | 343,543 |
| | | | | | 346,383 |
|
Commercial loans accounted for under the fair value option (9) | |
| | |
| | |
| | |
| | |
| | |
| | 6,614 |
| | 6,614 |
| |
| | |
| | |
| | |
| | |
| | |
| | 7,997 |
| | 7,997 |
|
| Total commercial | 649 |
| | 240 |
| | 6,650 |
| | 7,539 |
| | 302,663 |
| | — |
| | 6,614 |
| | 316,816 |
| 589 |
| | 431 |
| | 1,820 |
| | 2,840 |
| | 343,543 |
| | | | 7,997 |
| | 354,380 |
|
| Total loans and leases | $ | 9,154 |
| | $ | 5,103 |
| | $ | 47,557 |
| | $ | 61,814 |
| | $ | 823,781 |
| | $ | 31,801 |
| | $ | 8,804 |
| | $ | 926,200 |
| $ | 8,134 |
| | $ | 4,379 |
| | $ | 39,036 |
| | $ | 51,549 |
| | $ | 821,150 |
| | $ | 26,118 |
| | $ | 9,002 |
| | $ | 907,819 |
|
| Percentage of outstandings | 0.99 | % | | 0.55 | % | | 5.13 | % | | 6.67 | % | | 88.95 | % | | 3.43 | % | | 0.95 | % | | |
| 0.90 | % | | 0.48 | % | | 4.30 | % | | 5.68 | % | | 90.45 | % | | 2.88 | % | | 0.99 | % | | |
|
| |
(1) | Home loans 30-59 days past due includes $3.62.3 billion of fully-insured loans and $770702 million of nonperforming loans. Home loans 60-89 days past due includes $1.3 billion of fully-insured loans and $119558 million of TDRs that were removed from the Countrywide PCI loan portfolio prior to the adoption of accounting guidance on PCI loans effective January 1, 2010.nonperforming loans. |
| |
(2) | Home loans includes $21.222.2 billion of fully-insured loans and $378 million of TDRs that were removed from the Countrywide PCI loan portfolio prior to the adoption of accounting guidance on PCI loans effective January 1, 2010.loans. |
| |
(3) | Home loans includes $1.85.5 billion and direct/indirect consumer includes $63 million of nonperforming loans as all principal and interest are not current or the loans are TDRs that have not demonstrated sustained repayment performance.loans. |
| |
(4) | PCI loan amounts are shown gross of the valuation allowance. |
| |
(5) | Total outstandings includes non-U.S. residential mortgagesmortgage loans of $93 million. |
| |
(6) | Total outstandings includes $8.8 billion of pay option loans and $1.1 billion of subprime loans. The Corporation no longer originates these products. |
| |
(7) | Total outstandings includes dealer financial services loans of $35.9 billion, consumer lending loans of $4.7 billion, U.S. securities-based lending margin loans of $28.3 billion, student loans of $4.8 billion, non-U.S. consumer loans of $8.3 billion and other consumer loans of $1.2 billion. |
| |
(8) | Total outstandings includes consumer finance loans of $1.4 billion, other non-U.S. consumer loans of $5 million and consumer overdrafts of $177 million. |
| |
(9) | Consumer loans accounted for under the fair value option were residential mortgage loans of $147 million and discontinued real estate loans of $858 million. Commercial loans accounted for under the fair value option were U.S. commercial loans of $2.3 billion and non-U.S. commercial loans of $5.7 billion. For additional information, see Note 21 – Fair Value Measurements and Note 22 – Fair Value Option. |
| |
(10) | Total outstandings includes U.S. commercial real estate loans of $37.2 billion and non-U.S. commercial real estate loans of $1.5 billion. |
|
| | | | | | | | | | | | | | | | | | | | | | | | | | | | | | | |
| | | | | | | | | | | | | | | | |
| | December 31, 2011 |
| (Dollars in millions) | 30-59 Days
Past Due (1) | | 60-89 Days Past Due (1) | | 90 Days or
More
Past Due (2) | | Total Past
Due 30 Days
or More | | Total Current or Less Than 30 Days Past Due (3) | | Purchased
Credit-impaired (4) | | Loans Accounted for Under the Fair Value Option | | Total Outstandings |
| Home loans | |
| | | | |
| | |
| | |
| | |
| | |
| | |
|
| Core portfolio | | | | | | | | | | | | | | | |
Residential mortgage (5) | $ | 2,151 |
| | $ | 751 |
| | $ | 3,017 |
| | $ | 5,919 |
| | $ | 172,418 |
| | | | |
| | $ | 178,337 |
|
| Home equity | 260 |
| | 155 |
| | 429 |
| | 844 |
| | 66,211 |
| | | | |
| | 67,055 |
|
| Legacy Assets & Servicing portfolio | | | |
| | |
| | |
| | |
| | |
| | |
| | |
|
| Residential mortgage | 3,195 |
| | 2,174 |
| | 32,167 |
| | 37,536 |
| | 36,451 |
| | $ | 9,966 |
| | |
| | 83,953 |
|
| Home equity | 845 |
| | 508 |
| | 1,735 |
| | 3,088 |
| | 42,578 |
| | 11,978 |
| | |
| | 57,644 |
|
Discontinued real estate (6) | 65 |
| | 24 |
| | 351 |
| | 440 |
| | 798 |
| | 9,857 |
| | |
| | 11,095 |
|
| Credit card and other consumer | | | |
| | |
| | |
| | |
| | |
| | |
| | |
|
| U.S. credit card | 981 |
| | 772 |
| | 2,070 |
| | 3,823 |
| | 98,468 |
| | | | |
| | 102,291 |
|
| Non-U.S. credit card | 148 |
| | 120 |
| | 342 |
| | 610 |
| | 13,808 |
| | | | |
| | 14,418 |
|
Direct/Indirect consumer (7) | 805 |
| | 338 |
| | 779 |
| | 1,922 |
| | 87,791 |
| | | | |
| | 89,713 |
|
Other consumer (8) | 55 |
| | 21 |
| | 17 |
| | 93 |
| | 2,595 |
| | | | |
| | 2,688 |
|
| Total consumer loans | 8,505 |
| | 4,863 |
| | 40,907 |
| | 54,275 |
| | 521,118 |
| | 31,801 |
| | |
| 607,194 |
|
Consumer loans accounted for under the fair value option (9) | | | | | | | | | | | | | $ | 2,190 |
|
| 2,190 |
|
| Total consumer | 8,505 |
| | 4,863 |
| | 40,907 |
| | 54,275 |
| | 521,118 |
| | 31,801 |
| | 2,190 |
| | 609,384 |
|
| Commercial | | | |
| | |
| | |
| | |
| | |
| | |
| | |
|
| U.S. commercial | 352 |
| | 166 |
| | 866 |
| | 1,384 |
| | 178,564 |
| | | | |
| | 179,948 |
|
Commercial real estate (10) | 288 |
| | 118 |
| | 1,860 |
| | 2,266 |
| | 37,330 |
| | | | |
| | 39,596 |
|
| Commercial lease financing | 78 |
| | 15 |
| | 22 |
| | 115 |
| | 21,874 |
| | | | |
| | 21,989 |
|
| Non-U.S. commercial | 24 |
| | — |
| | — |
| | 24 |
| | 55,394 |
| | | | |
| | 55,418 |
|
| U.S. small business commercial | 150 |
| | 106 |
| | 272 |
| | 528 |
| | 12,723 |
| | | | |
| | 13,251 |
|
| Total commercial loans | 892 |
| | 405 |
| | 3,020 |
| | 4,317 |
| | 305,885 |
| | | | |
| | 310,202 |
|
Commercial loans accounted for under the fair value option (9) | | | | | | | | | | | | | 6,614 |
| | 6,614 |
|
| Total commercial | 892 |
| | 405 |
| | 3,020 |
| | 4,317 |
| | 305,885 |
| | | | 6,614 |
| | 316,816 |
|
| Total loans and leases | $ | 9,397 |
| | $ | 5,268 |
| | $ | 43,927 |
| | $ | 58,592 |
| | $ | 827,003 |
| | $ | 31,801 |
| | $ | 8,804 |
| | $ | 926,200 |
|
| Percentage of outstandings | 1.02 | % | | 0.57 | % | | 4.74 | % | | 6.33 | % | | 89.29 | % | | 3.43 | % | | 0.95 | % | | |
|
| |
(1) | Home loans 30-59 days past due includes $2.2 billion of fully-insured loans and $372 million of nonperforming loans. Home loans 60-89 days past due includes $1.4 billion of fully-insured loans and $398 million of nonperforming loans. |
| |
(2) | Home loans includes $21.2 billion of fully-insured loans. |
| |
(3) | Home loans includes $1.8 billion and direct/indirect consumer includes $7 million of nonperforming loans. |
| |
(4) | PCI loan amounts are shown gross of the valuation allowance. |
| |
(5) | Total outstandings includes non-U.S. residential mortgage loans of $85 million at December 31, 2011. |
| |
(6) | Total outstandings includes $9.9 billion of pay option loans and $1.2 billion of subprime loans at December 31, 2011.loans. The Corporation no longer originates these products. |
| |
(7) | Total outstandings includes dealer financial services loans of $43.0 billion, consumer lending loans of $8.0 billion, U.S. securities-based lending margin loans of $23.6 billion, student loans of $6.0 billion, non-U.S. consumer loans of $7.6 billion and other consumer loans of $1.5 billion at December 31, 2011. |
| |
(8) | Total outstandings includes consumer finance loans of $1.7 billion, other non-U.S. consumer loans of $929 million and consumer overdrafts of $103 million at December 31, 2011. |
| |
(9) | Certain consumerConsumer loans are accounted for under the fair value option and includewere residential mortgage loans of $906 million and discontinued real estate loans of $1.3 billion at December 31, 2011. Certain commercialCommercial loans are accounted for under the fair value option and includewere U.S. commercial loans of $2.2 billion and non-U.S. commercial loans of $4.4 billion at December 31, 2011. SeeFor additional information, see Note 2221 – Fair Value Measurements and Note 2322 – Fair Value Option for additional information..
|
| |
(10) | Total outstandings includes U.S. commercial real estate loans of $37.8 billion and non-U.S. commercial real estate loans of $1.8 billion at December 31, 2011. |
|
| | |
| | | Bank of America 2012 183189 |
|
| | | | | | | | | | | | | | | | | | | | | | | | | | | | | | | |
| | | | | | | | | | | | | | | | |
| | December 31, 2010 |
| (Dollars in millions) | 30-59 Days
Past Due (1) | | 60-89 Days Past Due (1) | | 90 Days or
More
Past Due (2) | | Total Past
Due 30 Days
or More | | Total Current or Less Than 30 Days Past Due (3) | | Purchased
Credit-impaired (4) | | Loans Accounted for Under the Fair Value Option | | Total Outstandings |
| Home loans | |
| | | | |
| | |
| | |
| | |
| | |
| | |
|
| Core portfolio | | | | | | | | | | | | | | | |
Residential mortgage (5) | $ | 1,160 |
| | $ | 236 |
| | $ | 1,255 |
| | $ | 2,651 |
| | $ | 164,276 |
| | $ | — |
| | |
| | $ | 166,927 |
|
| Home equity | 186 |
| | 12 |
| | 105 |
| | 303 |
| | 71,216 |
| | — |
| | |
| | 71,519 |
|
| Legacy Asset Servicing portfolio | | | |
| | |
| | |
| | |
| | |
| | |
| | |
|
| Residential mortgage | 3,999 |
| | 2,879 |
| | 31,985 |
| | 38,863 |
| | 41,591 |
| | 10,592 |
| | |
| | 91,046 |
|
| Home equity | 1,096 |
| | 792 |
| | 2,186 |
| | 4,074 |
| | 49,798 |
| | 12,590 |
| | |
| | 66,462 |
|
Discontinued real estate (6) | 68 |
| | 39 |
| | 419 |
| | 526 |
| | 930 |
| | 11,652 |
| | |
| | 13,108 |
|
| Credit card and other consumer | | | |
| | |
| | |
| | |
| | |
| | |
| | |
|
| U.S. credit card | 1,398 |
| | 1,195 |
| | 3,320 |
| | 5,913 |
| | 107,872 |
| | — |
| | |
| | 113,785 |
|
| Non-U.S. credit card | 439 |
| | 316 |
| | 599 |
| | 1,354 |
| | 26,111 |
| | — |
| | |
| | 27,465 |
|
Direct/Indirect consumer (7) | 1,086 |
| | 522 |
| | 1,104 |
| | 2,712 |
| | 87,596 |
| | — |
| | |
| | 90,308 |
|
Other consumer (8) | 65 |
| | 25 |
| | 50 |
| | 140 |
| | 2,690 |
| | — |
| | |
| | 2,830 |
|
| Total consumer | 9,497 |
| | 6,016 |
| | 41,023 |
| | 56,536 |
| | 552,080 |
| | 34,834 |
| | |
| | 643,450 |
|
| Commercial | | | |
| | |
| | |
| | |
| | |
| | |
| | |
|
| U.S. commercial | 432 |
| | 222 |
| | 3,689 |
| | 4,343 |
| | 171,241 |
| | 2 |
| | |
| | 175,586 |
|
Commercial real estate (9) | 250 |
| | 70 |
| | 5,876 |
| | 6,196 |
| | 43,036 |
| | 161 |
| | |
| | 49,393 |
|
| Commercial lease financing | 82 |
| | 18 |
| | 135 |
| | 235 |
| | 21,707 |
| | — |
| | |
| | 21,942 |
|
| Non-U.S. commercial | 25 |
| | 2 |
| | 239 |
| | 266 |
| | 31,722 |
| | 41 |
| | |
| | 32,029 |
|
| U.S. small business commercial | 189 |
| | 158 |
| | 529 |
| | 876 |
| | 13,843 |
| | — |
| | |
| | 14,719 |
|
| Total commercial loans | 978 |
| | 470 |
| | 10,468 |
| | 11,916 |
| | 281,549 |
| | 204 |
| | |
| | 293,669 |
|
Commercial loans accounted for under the fair value option (10) | | | | | | | | | | | | | $ | 3,321 |
| | 3,321 |
|
| Total commercial | 978 |
| | 470 |
| | 10,468 |
| | 11,916 |
| | 281,549 |
| | 204 |
| | 3,321 |
| | 296,990 |
|
| Total loans and leases | $ | 10,475 |
| | $ | 6,486 |
| | $ | 51,491 |
| | $ | 68,452 |
| | $ | 833,629 |
| | $ | 35,038 |
| | $ | 3,321 |
| | $ | 940,440 |
|
| Percentage of outstandings | 1.11 | % | | 0.69 | % | | 5.48 | % | | 7.28 | % | | 88.64 | % | | 3.73 | % | | 0.35 | % | | |
|
| |
(1)
| Home loans includes $2.4 billion of fully-insured loans, $818 million of nonperforming loans and $156 million of TDRs that were removed from the Countrywide PCI loan portfolio prior to the adoption of accounting guidance on PCI loans effective January 1, 2010.
|
| |
(2)
| Home loans includes $16.8 billion of fully-insured loans and $372 million of TDRs that were removed from the Countrywide PCI loan portfolio prior to the adoption of accounting guidance on PCI loans effective January 1, 2010.
|
| |
(3)
| Home loans includes $1.1 billion of nonperforming loans as all principal and interest are not current or the loans are TDRs that have not demonstrated sustained repayment performance.
|
| |
(4)
| PCI loan amounts are shown gross of the valuation allowance and exclude $1.6 billion of PCI home loans from the Merrill Lynch acquisition which are included in their appropriate aging categories.
|
| |
(5)
| Total outstandings includes non-U.S. residential mortgages of $90 million at December 31, 2010.
|
| |
(6)
| Total outstandings includes $11.8 billion of pay option loans and $1.3 billion of subprime loans at December 31, 2010. The Corporation no longer originates these products.
|
| |
(7)
| Total outstandings includes dealer financial services loans of $43.3 billion, consumer lending loans of $12.4 billion, U.S. securities-based lending margin loans of $16.6 billion, student loans of $6.8 billion, non-U.S. consumer loans of $8.0 billion and other consumer loans of $3.2 billion at December 31, 2010.
|
| |
(8)
| Total outstandings includes consumer finance loans of $1.9 billion, other non-U.S. consumer loans of $803 million and consumer overdrafts of $88 million at December 31, 2010.
|
| |
(9)
| Total outstandings includes U.S. commercial real estate loans of $46.9 billion and non-U.S. commercial real estate loans of $2.5 billion at December 31, 2010.
|
| |
(10)
| Certain commercial loans are accounted for under the fair value option and include U.S. commercial loans of $1.6 billion, non-U.S. commercial loans of $1.7 billion and commercial real estate loans of $79 million at December 31, 2010. See Note 22 – Fair Value Measurements and Note 23 – Fair Value Option for additional information.
|
The Corporation mitigates a portion of its credit risk on the residential mortgage portfolio through the use of synthetic securitization vehicles. These vehicles issue long-term notes to investors, the proceeds of which are held as cash collateral. The Corporation pays a premium to the vehicles to purchase mezzanine loss protection on a portfolio of residential mortgagesmortgage loans owned by the Corporation. Cash held in the vehicles is used to reimburse the Corporation in the event that losses on the mortgage portfolio exceed 10 basis points (bps) of the original pool balance, up to the remaining amount of purchased loss protection of $783500 million and $1.1 billion783 million at December 31, 20112012 and 20102011. The vehicles from which the Corporation purchases credit protection are VIEs. The Corporation does not have a variable interest in these vehicles. Accordingly,vehicles, and accordingly, these vehicles are not consolidated by the Corporation. Amounts due from the vehicles are recorded in other income (loss) when the Corporation recognizes a reimbursable loss, as described above. Amounts are collected when reimbursable losses are realized through the sale of the underlying collateral. At December 31, 20112012 and 20102011, the Corporation had a receivable of $359305 million and $722359 million from these vehicles for reimbursement of losses, and principal of $23.917.6 billion and
$53.923.9 billion of residential mortgage loans was referenced under these agreements. The Corporation records an allowance for credit losses on these loans without regard to the existence of the purchased loss protection as the protection does not represent a guarantee of individual loans.
In addition, the Corporation has entered into long-term credit protection agreements with FNMA and FHLMC on principalloans totaling $23.824.3 billion and $12.924.4 billion at December 31, 20112012 and 20102011, providing full protection on residential mortgage loans that become severely delinquent. All of these loans are individually insured and therefore the Corporation does not record an allowance for credit losses related to these loans. For additional information, see Note 8 – Representations and Warranties Obligations and Corporate Guarantees.
Nonperforming Loans and Leases
In 2012, the bank regulatory agencies jointly issued interagency supervisory guidance on nonaccrual status for junior-lien consumer real estate loans. In accordance with this regulatory interagency guidance, the Corporation classifies junior-lien home equity loans as nonperforming when the first-lien loan becomes 90 days past due even if the junior-lien loan is performing, and as a result, an incremental $1.5 billion was included in nonperforming loans at December 31, 2012. The Credit Qualityregulatory interagency guidance had no impact on the Corporation’s allowance for loan and lease losses or provision for credit losses as the delinquency status of the underlying first-lien loans was already considered in the Corporation’s reserving process.
In 2012, new regulatory guidance was issued addressing certain consumer real estate loans that have been discharged in Chapter 7 bankruptcy. In accordance with this new guidance, the Corporation classifies consumer real estate and other secured consumer loans that have been discharged in Chapter 7 bankruptcy and not reaffirmed by the borrower as TDRs, irrespective of payment history or delinquency status, even if the repayment terms for the loan have not been otherwise modified. The Corporation continues to have a lien on the underlying collateral. Previously, such loans were classified as TDRs only if there had been a change in contractual payment terms that represented a concession to the borrower. The net impact upon implementation to the consumer loan portfolio of adopting this new regulatory guidance was $1.2 billion in net new nonperforming loans, and $1.1 billion of such loans were included in nonperforming loans at December 31, 2012. Of the $1.1 billion, $1.0 billion, or 92 percent, were current on their contractual payments. Of these contractually current nonperforming loans, more than 70 percent were discharged in Chapter 7 bankruptcy more than 12 months ago, and more than 40 percent were discharged 24 months or more ago. As subsequent cash payments are received, the interest component of the payments is generally recorded as interest income on a cash basis and the principal component is generally recorded as a reduction in the carrying value of the loan.
The table below presents the Corporation’s nonperforming loans and leases including nonperforming TDRs and loans accruing past due 90 days or more at December 31, 20112012 and 20102011. Nonperforming loans and leases exclude performing TDRs and loans accounted for under the fair value option. Nonperforming LHFS are excluded from nonperforming
loans and leases as they are recorded at either fair value or the lower of cost or fair value.
In addition, PCI loans, consumer credit card loans, business card loans and in general consumer loans not secured by real estate, including renegotiated loans, are not considered nonperforming and are therefore excluded from nonperforming loans and leases in the table below. Real estate-secured past due consumer fully-
insured loans are reported as performing since the principal repayment is insured. See Note 1 – Summary of Significant Accounting Principles for further information on the criteria for classification as nonperforming.
| | | | | | | | | | | | | | | | | |
| Credit Quality | Credit Quality | | | Credit Quality | | |
| | | | | | | | | | | | | | | |
| | Nonperforming Loans and Leases | | Accruing Past Due 90 Days or More | December 31 |
| | December 31 | | December 31 | Nonperforming Loans and Leases (1) | | Accruing Past Due 90 Days or More |
| (Dollars in millions) | 2011 | | 2010 | | 2011 | | 2010 | 2012 | | 2011 | | 2012 | | 2011 |
| Home loans | |
| | |
| | |
| | |
| |
| | |
| | |
| | |
|
| Core portfolio | | | | | | | | | | | | | | |
Residential mortgage (1)(2) | $ | 2,414 |
| | $ | 1,510 |
| | $ | 883 |
| | $ | 16 |
| $ | 3,190 |
| | $ | 2,414 |
| | $ | 3,984 |
| | $ | 883 |
|
| Home equity | 439 |
| | 107 |
| | — |
| | — |
| 1,265 |
| | 439 |
| | — |
| | — |
|
| Legacy Asset Servicing portfolio | |
| | |
| | |
| | | |
| Legacy Assets & Servicing portfolio | | |
| | |
| | |
| | |
Residential mortgage (1)(2) | 13,556 |
| | 16,181 |
| | 20,281 |
| | 16,752 |
| 11,618 |
| | 13,556 |
| | 18,173 |
| | 20,281 |
|
| Home equity | 2,014 |
| | 2,587 |
| | — |
| | — |
| 3,016 |
| | 2,014 |
| | — |
| | — |
|
| Discontinued real estate | 290 |
| | 331 |
| | — |
| | — |
| 248 |
| | 290 |
| | — |
| | — |
|
| Credit card and other consumer | |
| | |
| | | | | |
| | |
| | | | |
| U.S. credit card | n/a |
| | n/a |
| | 2,070 |
| | 3,320 |
| n/a |
| | n/a |
| | 1,437 |
| | 2,070 |
|
| Non-U.S. credit card | n/a |
| | n/a |
| | 342 |
| | 599 |
| n/a |
| | n/a |
| | 212 |
| | 342 |
|
| Direct/Indirect consumer | 40 |
| | 90 |
| | 746 |
| | 1,058 |
| 92 |
| | 40 |
| | 545 |
| | 746 |
|
| Other consumer | 15 |
| | 48 |
| | 2 |
| | 2 |
| 2 |
| | 15 |
| | 2 |
| | 2 |
|
| Total consumer | 18,768 |
| | 20,854 |
| | 24,324 |
| | 21,747 |
| 19,431 |
| | 18,768 |
| | 24,353 |
| | 24,324 |
|
| Commercial | |
| | |
| | |
| | |
| |
| | |
| | |
| | |
|
| U.S. commercial | 2,174 |
| | 3,453 |
| | 75 |
| | 236 |
| 1,484 |
| | 2,174 |
| | 65 |
| | 75 |
|
| Commercial real estate | 3,880 |
| | 5,829 |
| | 7 |
| | 47 |
| 1,513 |
| | 3,880 |
| | 29 |
| | 7 |
|
| Commercial lease financing | 26 |
| | 117 |
| | 14 |
| | 18 |
| 44 |
| | 26 |
| | 15 |
| | 14 |
|
| Non-U.S. commercial | 143 |
| | 233 |
| | — |
| | 6 |
| 68 |
| | 143 |
| | — |
| | — |
|
| U.S. small business commercial | 114 |
| | 204 |
| | 216 |
| | 325 |
| 115 |
| | 114 |
| | 120 |
| | 216 |
|
| Total commercial | 6,337 |
| | 9,836 |
| | 312 |
| | 632 |
| 3,224 |
| | 6,337 |
| | 229 |
| | 312 |
|
| Total consumer and commercial | $ | 25,105 |
| | $ | 30,690 |
| | $ | 24,636 |
| | $ | 22,379 |
| $ | 22,655 |
| | $ | 25,105 |
| | $ | 24,582 |
| | $ | 24,636 |
|
| |
(1) | Nonperforming loan balances do not include nonaccruing TDRs removed from the PCI portfolio prior to January 1, 2010 of $521 million and $477 million at December 31, 2012 and 2011. |
| |
(2) | Residential mortgage loans accruing past due 90 days or more are fully-insured loans. At December 31, 20112012 and 20102011, residential mortgage includes $17.017.8 billion and $8.317.0 billion of loans on which interest has been curtailed by the FHA, and therefore are no longer accruing interest, although principal is still insured, and $4.24.4 billion and $8.54.2 billion of loans on which interest is still accruing. |
n/a = not applicable
Included in certain loan categories in nonperforming loans and leases in the table above are TDRs that are classified as nonperforming. At December 31, 2011 and 2010, the Corporation had $4.7 billion and $3.0 billion of residential mortgages, $539 million and $535 million of home equity, $97 million and $75 million of discontinued real estate, $531 million and $175 million of U.S. commercial, $1.1 billion and $770 million of commercial real estate and $38 million and $7 million of non-U.S. commercial loans that were TDRs and classified as nonperforming.
Credit Quality Indicators
The Corporation monitors credit quality within its threeHome Loans, Credit Card and Other Consumer, and Commercial portfolio segments based on primary credit quality indicators. For more information on the portfolio segments, see Note 1 – Summary of Significant Accounting Principles. Within the home loansHome Loans portfolio segment, the primary credit quality indicators are refreshed LTV and refreshed FICO score. Refreshed LTV measures the carrying value of the loan as a percentage of the value of property securing the loan, refreshed quarterly. Home equity loans are evaluated using CLTV which measures the carrying value of the combined loans that have liens against the property and the available line
of credit as a percentage of the appraised value of the property securing the loan, refreshed quarterly. Refreshed FICO score measures the creditworthiness of the borrower based on the financial obligations of the borrower and the borrower’s credit history. At a minimum,
FICO scores are refreshed quarterly, and in many cases, more frequently. Refreshed FICO score isscores are also a primary credit quality indicator for the credit cardCredit Card and other consumerOther Consumer portfolio segment and the business card portfolio within U.S. small business commercial. The Corporation’s commercialWithin the Commercial portfolio segment, loans are evaluated using the internal classifications of pass rated or reservable criticized as the primary credit quality indicators. The term reservable criticized refers to those commercial loans that are internally classified or listed by the Corporation as Special Mention, Substandard or Doubtful, which are asset categories defined by regulatory authorities. These assets have an elevated level of risk and may have a high probability of default or total loss. Pass rated refers to all loans not considered reservable criticized. In addition to these primary credit quality indicators, the Corporation uses other credit quality indicators for certain types of loans.
|
| | |
| | | Bank of America 2012 185191 |
The following tables present certain credit quality indicators for the Corporation’s home loans, credit cardHome Loans, Credit Card and other consumer loans,Other Consumer, and commercial loanCommercial portfolio segments, by class of financing receivables, at December 31, 20112012 and 20102011.
| | | | | | | | | | | | | | | | | | | | | | | | | | | | | | | | | |
Home Loans - Credit Quality Indicators (1) | |
Home Loans – Credit Quality Indicators (1) | | Home Loans – Credit Quality Indicators (1) |
| | | |
| | December 31, 2011 | December 31, 2012 |
| (Dollars in millions) | Core Portfolio Residential Mortgage (2) | | Legacy Asset Servicing Residential Mortgage (2) | | Countrywide Residential Mortgage PCI | | Core Portfolio Home Equity (2) | | Legacy Asset Servicing Home Equity (2) | | Countrywide Home Equity PCI | | Legacy Asset Servicing Discontinued Real Estate (2) | | Countrywide
Discontinued
Real Estate PCI | Core Portfolio Residential Mortgage (2) | | Legacy Assets & Servicing Residential
Mortgage (2) | | Countrywide Residential Mortgage PCI | | Core Portfolio Home Equity (2) | | Legacy Assets & Servicing Home Equity (2) | | Countrywide Home Equity PCI | | Legacy Assets & Servicing Discontinued
Real Estate (2) | | Countrywide
Discontinued
Real Estate PCI |
Refreshed LTV (3) | |
| | |
| | |
| | |
| | | | | | |
| | |
| |
| | |
| | |
| | |
| | | | | | |
| | |
|
| Less than 90 percent | $ | 80,032 |
| | $ | 20,450 |
| | $ | 3,821 |
| | $ | 46,646 |
| | $ | 17,354 |
| | $ | 2,253 |
| | $ | 895 |
| | $ | 5,953 |
| $ | 80,585 |
| | $ | 19,904 |
| | $ | 3,516 |
| | $ | 44,971 |
| | $ | 15,907 |
| | $ | 2,050 |
| | $ | 719 |
| | $ | 5,093 |
|
| Greater than 90 percent but less than 100 percent | 11,838 |
| | 5,847 |
| | 1,468 |
| | 6,988 |
| | 4,995 |
| | 1,077 |
| | 122 |
| | 1,191 |
| 8,891 |
| | 5,000 |
| | 1,312 |
| | 5,825 |
| | 4,507 |
| | 788 |
| | 102 |
| | 1,067 |
|
| Greater than 100 percent | 17,673 |
| | 22,630 |
| | 4,677 |
| | 13,421 |
| | 23,317 |
| | 8,648 |
| | 221 |
| | 2,713 |
| 12,984 |
| | 16,226 |
| | 3,909 |
| | 10,055 |
| | 18,184 |
| | 5,709 |
| | 237 |
| | 2,674 |
|
Fully-insured loans (4) | 68,794 |
| | 25,060 |
| | — |
| | — |
| | — |
| | — |
| | — |
| | — |
| 67,656 |
| | 23,198 |
| | — |
| | — |
| | — |
| | — |
| | — |
| | — |
|
| Total home loans | $ | 178,337 |
| | $ | 73,987 |
| | $ | 9,966 |
| | $ | 67,055 |
| | $ | 45,666 |
| | $ | 11,978 |
| | $ | 1,238 |
| — |
| $ | 9,857 |
| $ | 170,116 |
| | $ | 64,328 |
| | $ | 8,737 |
| | $ | 60,851 |
| | $ | 38,598 |
| | $ | 8,547 |
| | $ | 1,058 |
| | $ | 8,834 |
|
| Refreshed FICO score | | | | | | | | | | | | | | | | | | | | | | | | | | | | | | |
| Less than 620 | $ | 7,020 |
| | $ | 17,337 |
| | $ | 3,749 |
| | $ | 4,148 |
| | $ | 8,990 |
| | $ | 3,203 |
| | $ | 548 |
| | $ | 5,968 |
| $ | 6,366 |
| | $ | 13,900 |
| | $ | 3,249 |
| | $ | 2,586 |
| | $ | 5,408 |
| | $ | 1,930 |
| | $ | 429 |
| | $ | 5,471 |
|
| Greater than or equal to 620 | 102,523 |
| | 31,590 |
| | 6,217 |
| | 62,907 |
| | 36,676 |
| | 8,775 |
| | 690 |
| | 3,889 |
| |
| Greater than or equal to 620 and less than 680 | | 8,561 |
| | 6,006 |
| | 1,381 |
| | 4,500 |
| | 5,885 |
| | 1,500 |
| | 160 |
| | 1,359 |
|
| Greater than or equal to 680 and less than 740 | | 25,141 |
| | 8,411 |
| | 1,886 |
| | 12,625 |
| | 10,387 |
| | 2,278 |
| | 206 |
| | 1,106 |
|
| Greater than or equal to 740 | | 62,392 |
| | 12,813 |
| | 2,221 |
| | 41,140 |
| | 16,918 |
| | 2,839 |
| | 263 |
| | 898 |
|
Fully-insured loans (4) | 68,794 |
| | 25,060 |
| | — |
| | — |
| | — |
| | — |
| | — |
| | — |
| 67,656 |
| | 23,198 |
| | — |
| | — |
| | — |
| | — |
| | — |
| | — |
|
| Total home loans | $ | 178,337 |
| | $ | 73,987 |
| | $ | 9,966 |
| | $ | 67,055 |
| | $ | 45,666 |
| | $ | 11,978 |
| | $ | 1,238 |
| | $ | 9,857 |
| $ | 170,116 |
| | $ | 64,328 |
| | $ | 8,737 |
| | $ | 60,851 |
| | $ | 38,598 |
| | $ | 8,547 |
| | $ | 1,058 |
| | $ | 8,834 |
|
| |
(1) | Excludes $1.0 billion of loans accounted for under the fair value option. |
| |
(2) | Excludes Countrywide PCI loans. |
| |
(3) | Refreshed LTV percentages for PCI loans are calculated using the carrying value net of the related valuation allowance. |
| |
(4) | Credit quality indicators are not reported for fully-insured loans as principal repayment is insured. |
|
| | | | | | | | | | | | | | | |
| | | | | | | | |
| Credit Card and Other Consumer – Credit Quality Indicators |
| | |
| | December 31, 2012 |
| (Dollars in millions) | U.S. Credit Card | | Non-U.S. Credit Card | | Direct/Indirect Consumer | | Other Consumer (1) |
| Refreshed FICO score | |
| | |
| | |
| | |
|
| Less than 620 | $ | 6,188 |
| | $ | — |
| | $ | 1,896 |
| | $ | 668 |
|
| Greater than or equal to 620 and less than 680 | 13,947 |
| | — |
| | 3,367 |
| | 301 |
|
| Greater than or equal to 680 and less than 740 | 37,167 |
| | — |
| | 9,592 |
| | 232 |
|
| Greater than or equal to 740 | 37,533 |
| | — |
| | 25,164 |
| | 212 |
|
Other internal credit metrics (2, 3, 4) | — |
| | 11,697 |
| | 43,186 |
| | 215 |
|
| Total credit card and other consumer | $ | 94,835 |
| | $ | 11,697 |
| | $ | 83,205 |
| | $ | 1,628 |
|
| |
(1) | 87 percent of the other consumer portfolio is associated with portfolios from certain consumer finance businesses that the Corporation previously exited. |
| |
(2) | Other internal credit metrics may include delinquency status, geography or other factors. |
| |
(3) | Direct/indirect consumer includes $36.5 billion of securities-based lending which is overcollateralized and therefore has minimal credit risk and $4.8 billion of loans the Corporation no longer originates. |
| |
(4) | Non-U.S. credit card represents the U.K. credit card portfolio which is evaluated using internal credit metrics, including delinquency status. At December 31, 2012, 97 percent of this portfolio was current or less than 30 days past due, one percent was 30-89 days past due and two percent was 90 days or more past due. |
|
| | | | | | | | | | | | | | | | | | | |
| | | | | | | | | | |
Commercial – Credit Quality Indicators (1) |
| | |
| | December 31, 2012 |
| (Dollars in millions) | U.S. Commercial | | Commercial Real Estate | | Commercial
Lease Financing | | Non-U.S. Commercial | | U.S. Small
Business Commercial (2) |
| Risk ratings | |
| | |
| | |
| | |
| | |
|
| Pass rated | $ | 189,602 |
| | $ | 34,968 |
| | $ | 22,874 |
| | $ | 72,688 |
| | $ | 1,690 |
|
| Reservable criticized | 7,524 |
| | 3,669 |
| | 969 |
| | 1,496 |
| | 573 |
|
Refreshed FICO score (3) | | | | | | | | | |
|
| Less than 620 | |
| | |
| | |
| | |
| | 400 |
|
| Greater than or equal to 620 and less than 680 | | | | | | | | | 580 |
|
| Greater than or equal to 680 and less than 740 | | | | | | | | | 1,553 |
|
| Greater than or equal to 740 | | | | | | | | | 2,496 |
|
Other internal credit metrics (3, 4) | | | | | | | | | 5,301 |
|
| Total commercial | $ | 197,126 |
| | $ | 38,637 |
| | $ | 23,843 |
| | $ | 74,184 |
| | $ | 12,593 |
|
| |
(1) | Excludes $8.0 billion of loans accounted for under the fair value option. |
| |
(2) | U.S. small business commercial includes $366 million of criticized business card and small business loans which are evaluated using refreshed FICO scores or internal credit metrics, including delinquency status, rather than risk ratings. At December 31, 2012, 98 percent of the balances where internal credit metrics are used were current or less than 30 days past due. |
| |
(3) | Refreshed FICO score and other internal credit metrics are applicable only to the U.S. small business commercial portfolio. |
| |
(4) | Other internal credit metrics may include delinquency status, application scores, geography or other factors. |
|
| | | | | | | | | | | | | | | | | | | | | | | | | | | | | | | |
| | | | | | | | | | | | | | | | |
Home Loans – Credit Quality Indicators (1) |
| | |
| | December 31, 2011 |
| (Dollars in millions) | Core Portfolio Residential Mortgage (2) | | Legacy Assets & Servicing Residential
Mortgage (2) | | Countrywide Residential Mortgage PCI | | Core Portfolio Home Equity (2) | | Legacy Assets & Servicing Home Equity (2) | | Countrywide Hone Equity PCI | | Legacy Assets & Servicing Discontinued
Real Estate (2) | | Countrywide
Discontinued
Real Estate PCI |
Refreshed LTV (3) | |
| | |
| | |
| | |
| | | | | | |
| | |
|
| Less than 90 percent | $ | 80,032 |
| | $ | 20,450 |
| | $ | 3,821 |
| | $ | 46,646 |
| | $ | 17,354 |
| | $ | 2,253 |
| | $ | 895 |
| | $ | 5,953 |
|
| Greater than 90 percent but less than 100 percent | 11,838 |
| | 5,847 |
| | 1,468 |
| | 6,988 |
| | 4,995 |
| | 1,077 |
| | 122 |
| | 1,191 |
|
| Greater than 100 percent | 17,673 |
| | 22,630 |
| | 4,677 |
| | 13,421 |
| | 23,317 |
| | 8,648 |
| | 221 |
| | 2,713 |
|
Fully-insured loans (4) | 68,794 |
| | 25,060 |
| | — |
| | — |
| | — |
| | — |
| | — |
| | — |
|
| Total home loans | $ | 178,337 |
| | $ | 73,987 |
| | $ | 9,966 |
| | $ | 67,055 |
| | $ | 45,666 |
| | $ | 11,978 |
| | $ | 1,238 |
|
| $ | 9,857 |
|
Refreshed FICO score (5) | |
| | |
| | |
| | |
| | |
| | |
| | |
| | |
|
| Less than 620 | $ | 7,020 |
| | $ | 17,337 |
| | $ | 3,924 |
| | $ | 2,843 |
| | $ | 7,293 |
| | $ | 4,140 |
| | $ | 548 |
| | $ | 6,275 |
|
| Greater than or equal to 620 and less than 680 | 9,331 |
| | 6,537 |
| | 1,381 |
| | 4,704 |
| | 6,866 |
| | 1,969 |
| | 175 |
| | 1,279 |
|
| Greater than or equal to 680 and less than 740 | 26,569 |
| | 9,439 |
| | 2,036 |
| | 13,561 |
| | 11,798 |
| | 2,538 |
| | 228 |
| | 1,223 |
|
| Greater than or equal to 740 | 66,623 |
| | 15,614 |
| | 2,625 |
| | 45,947 |
| | 19,709 |
| | 3,331 |
| | 287 |
| | 1,080 |
|
Fully-insured loans (4) | 68,794 |
| | 25,060 |
| | — |
| | — |
| | — |
| | — |
| | — |
| | — |
|
| Total home loans | $ | 178,337 |
| | $ | 73,987 |
| | $ | 9,966 |
| | $ | 67,055 |
| | $ | 45,666 |
| | $ | 11,978 |
| | $ | 1,238 |
| | $ | 9,857 |
|
| |
(1) | Excludes $2.2 billion of loans accounted for under the fair value option. |
| |
(2) | Excludes Countrywide PCI loans. |
| |
(3) | Refreshed LTV percentages for PCI loans are calculated using the carrying value grossnet of the related valuation allowance. |
| |
(4) | Credit quality indicators are not reported for fully-insured loans as principal repayment is insured. |
| |
(5) | During 2012, refreshed home equity FICO metrics reflected an updated scoring model that is more representative of the credit risk of the Corporation’s borrowers. Prior period amounts were adjusted to reflect these updates. |
| | | | | | | | | | | | | | | | | |
| Credit Card and Other Consumer - Credit Quality Indicators | |
| Credit Card and Other Consumer – Credit Quality Indicators | | Credit Card and Other Consumer – Credit Quality Indicators |
| | | |
| | December 31, 2011 | December 31, 2011 |
| (Dollars in millions) | U.S. Credit Card | | Non-U.S. Credit Card | | Direct/Indirect Consumer | | Other Consumer (1) | U.S. Credit Card | | Non-U.S. Credit Card | | Direct/Indirect Consumer | | Other Consumer (1) |
| Refreshed FICO score | |
| | |
| | |
| | |
| |
| | |
| | |
| | |
|
| Less than 620 | $ | 8,172 |
| | $ | — |
| | $ | 3,325 |
| | $ | 802 |
| $ | 8,172 |
| | $ | — |
| | $ | 3,325 |
| | $ | 802 |
|
| Greater than or equal to 620 | 94,119 |
| | — |
| | 46,981 |
| | 854 |
| |
| Greater than or equal to 620 and less than 680 | | 15,474 |
| | — |
| | 4,665 |
| | 348 |
|
| Greater than or equal to 680 and less than 740 | | 39,525 |
| | — |
| | 12,351 |
| | 262 |
|
| Greater than or equal to 740 | | 39,120 |
| | — |
| | 29,965 |
| | 244 |
|
Other internal credit metrics (2, 3, 4) | — |
| | 14,418 |
| | 39,407 |
| | 1,032 |
| — |
| | 14,418 |
| | 39,407 |
| | 1,032 |
|
| Total credit card and other consumer | $ | 102,291 |
| | $ | 14,418 |
| | $ | 89,713 |
| | $ | 2,688 |
| $ | 102,291 |
| | $ | 14,418 |
| | $ | 89,713 |
| | $ | 2,688 |
|
| |
(1) | 96 percent of the other consumer portfolio wasis associated with portfolios from certain consumer finance businesses that the Corporation previously exited. |
| |
(2) | Other internal credit metrics may include delinquency status, geography or other factors. |
| |
(3) | Direct/indirect consumer includes $31.1 billion of securities-based lending which is overcollateralized and therefore has minimal credit risk and $6.0 billion of loans the Corporation no longer originates. |
| |
(4) | Non-U.S. credit card represents the select European countries’U.K. credit card portfoliosportfolio which areis evaluated using internal credit metrics, including delinquency status. At December 31, 2011, 96 percent of this portfolio was current or less than 30 days past due, two percent was 30-89 days past due and two percent was 90 days or more past due. |
| | | | | | | | | | | | | | | | | | | | | |
Commercial - Credit Quality Indicators (1) | |
Commercial – Credit Quality Indicators (1) | | Commercial – Credit Quality Indicators (1) |
| | | |
| | December 31, 2011 | December 31, 2011 |
| (Dollars in millions) | U.S. Commercial | | Commercial Real Estate | | Commercial
Lease Financing | | Non-U.S. Commercial | | U.S. Small
Business Commercial (2) | U.S. Commercial | | Commercial Real Estate | | Commercial
Lease Financing | | Non-U.S. Commercial | | U.S. Small
Business Commercial (2) |
| Risk Ratings | |
| | |
| | |
| | |
| | |
| |
| Risk ratings | | |
| | |
| | |
| | |
| | |
|
| Pass rated | $ | 169,599 |
| | $ | 28,602 |
| | $ | 20,850 |
| | $ | 53,945 |
| | $ | 2,392 |
| $ | 169,599 |
| | $ | 28,602 |
| | $ | 20,850 |
| | $ | 53,945 |
| | $ | 2,392 |
|
| Reservable criticized | 10,349 |
| | 10,994 |
| | 1,139 |
| | 1,473 |
| | 836 |
| 10,349 |
| | 10,994 |
| | 1,139 |
| | 1,473 |
| | 836 |
|
Refreshed FICO score (3) | | | | | | | | | |
| | | | | | | | | |
| Less than 620 | |
| | |
| | |
| | |
| | 562 |
| | | | | | | | | 562 |
|
| Greater than or equal to 620 | | | | | | | | | 4,674 |
| |
| Greater than or equal to 620 and less than 680 | | | | | | | | | | 624 |
|
| Greater than or equal to 680 and less than 740 | | | | | | | | | | 1,612 |
|
| Greater than or equal to 740 | | | | | | | | | | 2,438 |
|
Other internal credit metrics (3, 4) | | | | | | | | | 4,787 |
| | | | | | | | | 4,787 |
|
| Total commercial credit | $ | 179,948 |
| | $ | 39,596 |
| | $ | 21,989 |
| | $ | 55,418 |
| | $ | 13,251 |
| |
| Total commercial | | $ | 179,948 |
| | $ | 39,596 |
| | $ | 21,989 |
| | $ | 55,418 |
| | $ | 13,251 |
|
| |
(1) | Excludes $6.6 billion of loans accounted for under the fair value option. |
| |
(2) | U.S. small business commercial includes $491 million of criticized business card and small business loans which are evaluated using refreshed FICO scores or internal credit metrics, including delinquency status, rather than risk ratings. At December 31, 2011, 97 percent of the balances where internal credit metrics are used were current or less than 30 days past due. |
| |
(3) | Refreshed FICO score and other internal credit metrics are applicable only to the U.S. small business commercial portfolio. |
| |
(4) | Other internal credit metrics may include delinquency status, application scores, geography or other factors. |
|
| | | | | | | | | | | | | | | | | | | | | | | | | | | | | | | | |
| | | | | | | | | | | | | | | | |
| Home Loans - Credit Quality Indicators |
| | |
| | December 31, 2010 |
| (Dollars in millions) | Core Portfolio Residential Mortgage (1) | | Legacy Asset Servicing Residential Mortgage (1) | | Countrywide Residential Mortgage PCI | | Core Portfolio Home Equity (1) | | Legacy Asset Servicing Home Equity (1) | | Countrywide Hone Equity PCI | | Legacy Asset Servicing Discontinued Real Estate (1) | | Countrywide
Discontinued
Real Estate PCI |
Refreshed LTV (2) | |
| | |
| | |
| | |
| | | | | | |
| | |
|
| Less than 90 percent | $ | 95,874 |
| | $ | 21,357 |
| | $ | 3,710 |
| | $ | 51,555 |
| | $ | 22,125 |
| | $ | 2,313 |
| | $ | 1,033 |
| | $ | 6,713 |
|
| Greater than 90 percent but less than 100 percent | 11,581 |
| | 8,234 |
| | 1,664 |
| | 7,534 |
| | 6,504 |
| | 1,215 |
| | 155 |
| | 1,319 |
|
| Greater than 100 percent | 14,047 |
| | 29,043 |
| | 5,218 |
| | 12,430 |
| | 25,243 |
| | 9,062 |
| | 268 |
| | 3,620 |
|
Fully-insured loans (3) | 45,425 |
| | 21,820 |
| | — |
| | — |
| | — |
| | — |
| | — |
| | — |
|
| Total home loans | $ | 166,927 |
| | $ | 80,454 |
| | $ | 10,592 |
| | $ | 71,519 |
| | $ | 53,872 |
| | $ | 12,590 |
| | $ | 1,456 |
| — |
| $ | 11,652 |
|
| Refreshed FICO score | |
| | |
| | |
| | |
| | |
| | |
| | |
| | |
|
| Less than 620 | $ | 5,193 |
| | $ | 22,126 |
| | $ | 4,016 |
| | $ | 3,932 |
| | $ | 11,562 |
| | $ | 3,206 |
| | $ | 663 |
| | $ | 7,168 |
|
| Greater than or equal to 620 | 116,309 |
| | 36,508 |
| | 6,576 |
| | 67,587 |
| | 42,310 |
| | 9,384 |
| | 793 |
| | 4,484 |
|
Fully-insured loans (3) | 45,425 |
| | 21,820 |
| | — |
| | — |
| | — |
| | — |
| | — |
| | — |
|
| Total home loans | $ | 166,927 |
| | $ | 80,454 |
| | $ | 10,592 |
| | $ | 71,519 |
| | $ | 53,872 |
| | $ | 12,590 |
| | $ | 1,456 |
| — |
| $ | 11,652 |
|
| |
(1)
| Excludes Countrywide PCI loans. |
| |
(2)
| Refreshed LTV percentages for PCI loans are calculated using the carrying value gross of the related valuation allowance. |
| |
(3)
| Credit quality indicators are not reported for fully-insured loans as principal repayment is insured. |
|
| | | | | | | | | | | | | | | |
| | | | | | | | |
| Credit Card and Other Consumer - Credit Quality Indicators |
| | |
| | December 31, 2010 |
| (Dollars in millions) | U.S. Credit Card | | Non-U.S. Credit Card | | Direct/Indirect Consumer | | Other Consumer (1) |
| Refreshed FICO score | |
| | |
| | |
| | |
|
| Less than 620 | $ | 14,159 |
| | $ | 631 |
| | $ | 6,748 |
| | $ | 979 |
|
| Greater than or equal to 620 | 99,626 |
| | 7,528 |
| | 48,209 |
| | 961 |
|
Other internal credit metrics (2, 3, 4) | — |
| | 19,306 |
| | 35,351 |
| | 890 |
|
| Total credit card and other consumer | $ | 113,785 |
| | $ | 27,465 |
| | $ | 90,308 |
| | $ | 2,830 |
|
| |
(1)
| 96 percent of the other consumer portfolio was associated with portfolios from certain consumer finance businesses that the Corporation previously exited.
|
| |
(2)
| Other internal credit metrics may include delinquency status, geography or other factors. |
| |
(3)
| Direct/indirect consumer includes $24.0 billion of securities-based lending which is overcollateralized and therefore has minimal credit risk and $7.4 billion of loans the Corporation no longer originates.
|
| |
(4)
| Non-U.S. credit card represents the select European countries’ credit card portfolios and a portion of the Canadian credit card portfolio which are evaluated using internal credit metrics, including delinquency status. At December 31, 2010, 95 percent of this portfolio was current or less than 30 days past due, three percent was 30-89 days past due and two percent was 90 days past due or more.
|
|
| | | | | | | | | | | | | | | | | | | |
| | | | | | | | | | |
Commercial - Credit Quality Indicators (1) |
| | |
| | December 31, 2010 |
| (Dollars in millions) | U.S. Commercial | | Commercial Real Estate | | Commercial
Lease Financing | | Non-U.S. Commercial | | U.S. Small
Business Commercial (2) |
| Risk Ratings | |
| | |
| | |
| | |
| | |
|
| Pass rated | $ | 160,154 |
| | $ | 29,757 |
| | $ | 20,754 |
| | $ | 30,180 |
| | $ | 3,139 |
|
| Reservable criticized | 15,432 |
| | 19,636 |
| | 1,188 |
| | 1,849 |
| | 988 |
|
Refreshed FICO score (3) | | | | | | | | | |
| Less than 620 | | | | | | | | | 888 |
|
| Greater than or equal to 620 | | | | | | | | | 5,083 |
|
Other internal credit metrics (3, 4) | | | | | | | | | 4,621 |
|
| Total commercial credit | $ | 175,586 |
| | $ | 49,393 |
| | $ | 21,942 |
| | $ | 32,029 |
| | $ | 14,719 |
|
| |
(1)
| Includes $204 million of PCI loans in the commercial portfolio segment and excludes $3.3 billion of loans accounted for under the fair value option.
|
| |
(2)
| U.S. small business commercial includes $690 million of criticized business card and small business loans which are evaluated using FICO scores or internal credit metrics, including delinquency status, rather than risk ratings. At December 31, 2010, 95 percent of the balances where internal credit metrics are used were current or less than 30 days past due.
|
| |
(3)
| Refreshed FICO score and other internal credit metrics are applicable only to the U.S. small business commercial portfolio. |
| |
(4)
| Other internal credit metrics may include delinquency status, application scores, geography or other factors. |
|
| | |
| | | Bank of America 2012 187193 |
Impaired Loans and Troubled Debt Restructurings
A loan is considered impaired when, based on current information, it is probable that the Corporation will be unable to collect all amounts due from the borrower in accordance with the contractual terms of the loan. Impaired loans include nonperforming commercial loans and all TDRs,consumer and the renegotiated credit card and other consumer TDR portfolio (the renegotiated credit card and other consumer TDR portfolio, collectively, the renegotiated TDR portfolio).commercial TDRs. Impaired loans exclude nonperforming consumer loans and nonperforming commercial leases unless they are classified as TDRs. Loans accounted for under the fair value option are also excluded. PCI loans are excluded and reported separately on page 194201.
Home Loans
Impaired home loans within the home loansHome Loans portfolio segment consist entirely of TDRs. Excluding PCI loans, substantially allmost modifications of home loans meet the definition of TDRs.TDRs when a binding offer is extended to a borrower. Modifications of home loans are done in accordance with the government’s Making Home Affordable Program (modifications under government programs) or the Corporation’s proprietary programs (modifications under proprietary programs). These modifications are considered to be TDRs if concessions have been granted to borrowers experiencing financial difficulties. Concessions may include reductions in interest rates, capitalization of past due amounts, principal and/or interest forbearance, payment extensions, principal and/or interest forgiveness, or combinations thereof. In 2012, the Corporation implemented a borrower assistance program that provides forgiveness of principal balances in connection with the settlement agreement among the Corporation and certain of its affiliates and subsidiaries, together with the U.S. Department of Justice (DOJ), the U.S. Department of Housing and Urban Development (HUD) and other federal agencies, and 49 state Attorneys General concerning the terms of a global settlement resolving investigations into certain origination, servicing and foreclosure practices (National Mortgage Settlement).
Prior to permanently modifying a loan, the Corporation may enter into trial modifications with certain borrowers under both government and proprietary programs.programs, including the borrower assistance program pursuant to the National Mortgage Settlement. Trial modifications generally represent a three- to four-month period during which the borrower makes monthly payments under the anticipated modified payment terms. Upon successful completion of the trial period, the Corporation and the borrower enter into a permanent modification. In accordance with new accounting guidance effective in 2011, a loan is classified as a TDR when a binding offer is extended to borrowers to enter into aBinding trial modification. At December 31, 2011, the Corporationmodifications are classified as TDRs when the trial offer is made and continue to be classified as TDRs regardless of whether the borrower enters into a permanent modification.
In 2012, new regulatory guidance was issued addressing certain home loans that have been discharged in Chapter 7 bankruptcy, and as a result, an additional $2.63.5 billion of home loans that were participatingincluded in or had been offered a binding trial modification. These home loans TDRs had an aggregate allowance of $154 million at December 31, 20112012. Approximately, of which 55 percent$1.2 billion were current or less than 60 days past due. Of the $3.5 billion of all loans that entered into a trial modification duringhome loan TDRs, approximately 27 percent, 42 percent and 31 percent had been discharged in Chapter 7 bankruptcy in 2012, 2011 became permanent modifications as of and prior years, respectively. For more information onDecember 31, 2011.
the new regulatory guidance on loans discharged in Chapter 7 bankruptcy, see Nonperforming Loans and Leases in this Note.
In accordance with applicable accounting guidance, a home loan, excluding PCI loans which are reported separately, is not classified as impaired loans unless they have been designated asit is a TDR. Once such a loan has been designated as a TDR, it is then individually assessed for impairment. Home loan
TDRs are measured primarily based on the net present value of the estimated cash flows discounted at the loan’s original effective interest rate.rate, as discussed in the paragraph below. If the carrying value of a TDR exceeds this amount, a specific allowance is recorded as a component of the allowance for loan and lease losses. Alternatively, home loan TDRs that are considered to be dependent solely on the collateral for repayment (e.g., due to the lack of income verification)verification or as a result of being discharged in Chapter 7 bankruptcy) are measured based on the estimated fair value of the collateral and a charge-off is recorded if the carrying value exceeds the fair value of the collateral. Home loans that reached 180 days past due prior to modification would havehad been charged-offcharged off to their net realizable value before they were modified as TDRs in accordance with established policy. Therefore, the modificationmodifications of home loans that are 180 days or more days past due as TDRs doesdo not have an impact on the allowance for creditloan and lease losses nor are additional charge-offs required at the time of modification. Subsequent declines in the fair value of the collateral after a loan has reached 180 days past due are recorded as charge-offs. Fully-insured loans are protected against principal loss, and therefore, the Corporation does not record an allowance for creditloan and lease losses on the outstanding principal balance, even after they have been modified in a TDR.
The net present value of the estimated cash flows is based on model-driven estimates of projected payments, prepayments, defaults and loss-given-default (LGD). Using statistical modeling methodologies, the Corporation estimates the probability that a loan will default prior to maturity based on the attributes of each loan. The factors that are most relevant to the probability of default are the refreshed LTV, or in the case of a subordinated lien, refreshed CLTV, borrower credit score, months since origination (i.e., vintage) and geography. Each of these factors is further broken down by present collection status (whether the loan is current, delinquent, in default or in bankruptcy). Severity (or LGD) is estimated based on the refreshed LTV for the first mortgages or CLTV for subordinated liens. The estimates are based on the Corporation’s historical experience, but are adjusted to reflect an assessment of environmental factors that may not be reflected in the historical data, such as changes in real estate values, local and national economies, underwriting standards and the regulatory environment. The probability of default models also incorporate recent experience with modification programs, a loan’s default history prior to modification and the change in borrower payments post-modification.
At December 31, 20112012 and 20102011, remaining commitments to lend additional funds to debtors whose terms have been modified in a home loan TDR were immaterial. Home loan foreclosed properties totaled $2.0 billion650 million and $1.22.0 billion at December 31, 20112012 and 20102011.
|
| | |
188194 Bank of America 20112012
| | |
The table below presents impaired loans in the Corporation’s home loansHome Loans portfolio segment at and for the years ended December 31, 20112012 and 20102011. The impaired home loans table below and includes primarily loans managed by Legacy AssetAssets & Servicing. Certain impaired home loans do not have a related allowance as the current valuation of these impaired loans exceeded the carrying value.
| | | | | | | | | | | | | | | | | | | | | |
Impaired Loans – Home Loans | | | | | | | | |
| | December 31, 2011 | | 2011 | December 31, 2012 | | 2012 |
| (Dollars in millions) | Unpaid
Principal Balance | | Carrying Value | | Related Allowance | | Average
Carrying Value | | Interest
Income Recognized (1) | Unpaid
Principal Balance | | Carrying Value | | Related Allowance | | Average
Carrying Value | | Interest
Income Recognized (1) |
| With no recorded allowance | |
| | |
| | |
| | |
| | |
| |
| | |
| | |
| | |
| | |
|
| Residential mortgage | $ | 10,907 |
| | $ | 8,168 |
| | n/a |
| | $ | 6,285 |
| | $ | 233 |
| $ | 19,758 |
| | $ | 14,707 |
| | n/a |
| | $ | 10,697 |
| | $ | 358 |
|
| Home equity | 1,747 |
| | 479 |
| | n/a |
| | 442 |
| | 23 |
| 2,624 |
| | 1,103 |
| | n/a |
| | 734 |
| | 49 |
|
| Discontinued real estate | 421 |
| | 240 |
| | n/a |
| | 222 |
| | 8 |
| 468 |
| | 260 |
| | n/a |
| | 240 |
| | 8 |
|
| With an allowance recorded | | | | | |
| | | | | | | | | |
| | | | |
| Residential mortgage | $ | 12,296 |
| | $ | 11,119 |
| | $ | 1,295 |
| | $ | 9,379 |
| | $ | 319 |
| 14,080 |
| | 13,051 |
| | $ | 1,233 |
| | 11,439 |
| | 417 |
|
| Home equity | 1,551 |
| | 1,297 |
| | 622 |
| | 1,357 |
| | 34 |
| 1,256 |
| | 1,022 |
| | 448 |
| | 1,145 |
| | 44 |
|
| Discontinued real estate | 213 |
| | 159 |
| | 29 |
| | 173 |
| | 6 |
| 143 |
| | 107 |
| | 19 |
| | 136 |
| | 6 |
|
| Total | |
| | |
| | |
| | |
| | |
| |
| | |
| | |
| | |
| | |
|
| Residential mortgage | $ | 23,203 |
| | $ | 19,287 |
| | $ | 1,295 |
| | $ | 15,664 |
| | $ | 552 |
| $ | 33,838 |
| | $ | 27,758 |
| | $ | 1,233 |
| | $ | 22,136 |
| | $ | 775 |
|
| Home equity | 3,298 |
| | 1,776 |
| | 622 |
| | 1,799 |
| | 57 |
| 3,880 |
| | 2,125 |
| | 448 |
| | 1,879 |
| | 93 |
|
| Discontinued real estate | 634 |
| | 399 |
| | 29 |
| | 395 |
| | 14 |
| 611 |
| | 367 |
| | 19 |
| | 376 |
| | 14 |
|
| | | | | | | | | | | | | | | | | | | |
| | December 31, 2010 | | 2010 | December 31, 2011 | | 2011 |
| With no recorded allowance | | | | | | | | | | | | | | | | | | |
| Residential mortgage | $ | 5,493 |
| | $ | 4,382 |
| | n/a |
| | $ | 4,429 |
| | $ | 184 |
| $ | 10,907 |
| | $ | 8,168 |
| | n/a |
| | $ | 6,285 |
| | $ | 233 |
|
| Home equity | 1,411 |
| | 437 |
| | n/a |
| | 493 |
| | 21 |
| 1,747 |
| | 479 |
| | n/a |
| | 442 |
| | 23 |
|
| Discontinued real estate | 361 |
| | 218 |
| | n/a |
| | 219 |
| | 8 |
| 421 |
| | 240 |
| | n/a |
| | 222 |
| | 8 |
|
| With an allowance recorded | | | | | | | | | | | | | | | | | | |
| Residential mortgage | $ | 8,593 |
| | $ | 7,406 |
| | $ | 1,154 |
| | $ | 5,226 |
| | $ | 196 |
| 12,296 |
| | 11,119 |
| | $ | 1,295 |
| | 9,379 |
| | 319 |
|
| Home equity | 1,521 |
| | 1,284 |
| | 676 |
| | 1,509 |
| | 23 |
| 1,551 |
| | 1,297 |
| | 622 |
| | 1,357 |
| | 34 |
|
| Discontinued real estate | 247 |
| | 177 |
| | 41 |
| | 170 |
| | 7 |
| 213 |
| | 159 |
| | 29 |
| | 173 |
| | 6 |
|
| Total | | | | | | | | | | | | | | | | | | |
| Residential mortgage | $ | 14,086 |
| | $ | 11,788 |
| | $ | 1,154 |
| | $ | 9,655 |
| | $ | 380 |
| $ | 23,203 |
| | $ | 19,287 |
| | $ | 1,295 |
| | $ | 15,664 |
| | $ | 552 |
|
| Home equity | 2,932 |
| | 1,721 |
| | 676 |
| | 2,002 |
| | 44 |
| 3,298 |
| | 1,776 |
| | 622 |
| | 1,799 |
| | 57 |
|
| Discontinued real estate | 608 |
| | 395 |
| | 41 |
| | 389 |
| | 15 |
| 634 |
| | 399 |
| | 29 |
| | 395 |
| | 14 |
|
| |
(1) | Interest income recognized includes interest accrued and collected on the outstanding balances of accruing impaired loans as well as interest cash collections on nonaccruing impaired loans for which the ultimate collectability of principal is not uncertain.considered collectible. |
n/a = not applicable
The table below presents the December 31, 2012 and 2011 unpaid principal balance, carrying value, and average pre- and post-modification interest rates of home loans that were modified in TDRs during 2012 and 2011, along withand net charge-offs that were recorded during the period in which the modification occurred. The2011. The table below consists primarily of
following Home Loans portfolio segment tables include loans that were initially classified as TDRs during the period and also loans that had previously been classified as TDRs and were modified again during the period. These TDRs are managed by Legacy AssetAssets & Servicing.
| | | | | | | | | | | | | | | | | | | | | |
| Home Loans - TDRs Entered into During 2011 | |
Home Loans – TDRs Entered into During 2012 and 2011 (1) | | Home Loans – TDRs Entered into During 2012 and 2011 (1) |
| | | |
| | December 31, 2011 | | 2011 | December 31, 2012 | | 2012 |
| (Dollars in millions) | Unpaid Principal Balance | | Carrying Value | | Pre-modification Interest Rate | | Post-modification Interest Rate | | Net Charge-offs | Unpaid Principal Balance | | Carrying Value | | Pre-modification Interest Rate | | Post-modification Interest Rate | | Net Charge-offs |
| Residential mortgage | $ | 10,293 |
| | $ | 8,872 |
| | 6.03 | % | | 5.28 | % | | $ | 188 |
| $ | 14,929 |
| | $ | 12,143 |
| | 5.52 | % | | 4.70 | % | | $ | 507 |
|
| Home equity | 899 |
| | 480 |
| | 7.05 |
| | 5.79 |
| | 184 |
| 1,721 |
| | 858 |
| | 5.22 |
| | 4.39 |
| | 716 |
|
| Discontinued real estate | 89 |
| | 59 |
| | 7.42 |
| | 5.94 |
| | 3 |
| 159 |
| | 85 |
| | 5.21 |
| | 4.35 |
| | 16 |
|
| Total | $ | 11,281 |
| | $ | 9,411 |
| | 6.12 |
| | 5.33 |
| | $ | 375 |
| $ | 16,809 |
| | $ | 13,086 |
| | 5.49 |
| | 4.66 |
| | $ | 1,239 |
|
| | | | | | | | | | | |
| | | December 31, 2011 | | 2011 |
| Residential mortgage | | $ | 11,623 |
| | $ | 9,903 |
| | 5.94 | % | | 5.16 | % | | $ | 299 |
|
| Home equity | | 1,112 |
| | 556 |
| | 6.58 |
| | 5.25 |
| | 239 |
|
| Discontinued real estate | | 141 |
| | 88 |
| | 6.68 |
| | 5.08 |
| | 9 |
|
| Total | | $ | 12,876 |
| | $ | 10,547 |
| | 6.01 |
| | 5.17 |
| | $ | 547 |
|
|
| | |
| (1) | BankTDRs entered into during 2012 include principal forgiveness as follows: residential mortgage modifications of America189$755 million, home equity modifications of $9 million and discontinued real estate modifications of $23 million. Prior to 2012, the principal forgiveness amount was not significant.
|
The table below presents the December 31, 2012 and 2011 carrying value for home loans whichthat were modified in a TDRTDRs during 2012 and 2011. The table below consists primarily by type of TDRs managed by Legacy Asset Servicing.modification.
| | | | | | | | | | | | | | | | | |
| Home Loans - Modification Programs | |
| Home Loans – Modification Programs | | Home Loans – Modification Programs |
| | | |
| | TDRs Entered into During 2011 | TDRs Entered into During 2012 |
| (Dollars in millions) | Residential Mortgage | | Home Equity | | Discontinued Real Estate | | Total Carrying Value | Residential Mortgage | | Home Equity | | Discontinued Real Estate | | Total Carrying Value |
| Modifications under government programs | | | | | | | | | | | | | | |
| Contractual interest rate reduction | $ | 969 |
| | $ | 181 |
| | $ | 9 |
| | $ | 1,159 |
| $ | 638 |
| | $ | 78 |
| | $ | 4 |
| | $ | 720 |
|
| Principal and/or interest forbearance | 179 |
| | 36 |
| | 2 |
| | 217 |
| 49 |
| | 31 |
| | 2 |
| | 82 |
|
Other modifications (1) | 18 |
| | 3 |
| | — |
| | 21 |
| 37 |
| | 1 |
| | — |
| | 38 |
|
| Total modifications under government programs | 1,166 |
| | 220 |
| | 11 |
| | 1,397 |
| 724 |
| | 110 |
| | 6 |
| | 840 |
|
| | | | | | | | | |
| Modifications under proprietary programs | | | | | | | | | | | | | | |
| Contractual interest rate reduction | 3,441 |
| | 83 |
| | 20 |
| | 3,544 |
| 3,343 |
| | 44 |
| | 7 |
| | 3,394 |
|
| Capitalization of past due amounts | 381 |
| | 1 |
| | 2 |
| | 384 |
| 143 |
| | — |
| | 1 |
| | 144 |
|
| Principal and/or interest forbearance | 845 |
| | 47 |
| | 7 |
| | 899 |
| 415 |
| | 16 |
| | 9 |
| | 440 |
|
Other modifications (1) | 405 |
| | 33 |
| | 1 |
| | 439 |
| 97 |
| | 21 |
| | — |
| | 118 |
|
| Total modifications under proprietary programs | 5,072 |
| | 164 |
| | 30 |
| | 5,266 |
| 3,998 |
| | 81 |
| | 17 |
| | 4,096 |
|
Trial modifications (2) | 2,634 |
| | 96 |
| | 18 |
| | 2,748 |
| |
| Trial modifications | | 4,505 |
| | 69 |
| | 42 |
| | 4,616 |
|
Loans discharged in Chapter 7 bankruptcy (2) | | 2,916 |
| | 598 |
| | 20 |
| | 3,534 |
|
| Total modifications | $ | 8,872 |
| | $ | 480 |
| | $ | 59 |
| | $ | 9,411 |
| $ | 12,143 |
| | $ | 858 |
| | $ | 85 |
| | $ | 13,086 |
|
| | | | | | | | | |
| | | TDRs Entered into During 2011 |
| Modifications under government programs | | | | | | | | |
| Contractual interest rate reduction | | $ | 984 |
| | $ | 189 |
| | $ | 10 |
| | $ | 1,183 |
|
| Principal and/or interest forbearance | | 187 |
| | 36 |
| | 2 |
| | 225 |
|
Other modifications (1) | | 64 |
| | 5 |
| | — |
| | 69 |
|
| Total modifications under government programs | | 1,235 |
| | 230 |
| | 12 |
| | 1,477 |
|
| Modifications under proprietary programs | | | | | | | | |
| Contractual interest rate reduction | | 3,508 |
| | 101 |
| | 23 |
| | 3,632 |
|
| Capitalization of past due amounts | | 408 |
| | 1 |
| | 2 |
| | 411 |
|
| Principal and/or interest forbearance | | 936 |
| | 49 |
| | 10 |
| | 995 |
|
Other modifications (1) | | 439 |
| | 34 |
| | 2 |
| | 475 |
|
| Total modifications under proprietary programs | | 5,291 |
| | 185 |
| | 37 |
| | 5,513 |
|
| Trial modifications | | 3,377 |
| | 141 |
| | 39 |
| | 3,557 |
|
| Total modifications | | $ | 9,903 |
| | $ | 556 |
| | $ | 88 |
| | $ | 10,547 |
|
| |
(1) | Includes other modifications such as term or payment extensions and repayment plans. |
| |
(2) | Includes $187 million of trial modifications that were consideredloans newly classified as TDRs prior to the application ofin accordance with new accountingregulatory guidance on loans discharged in Chapter 7 bankruptcy that was effectiveissued in 2011.2012. |
The table below presents the carrying value of loans that entered into payment default during2012 and 2011 and that were modified in a TDR during the 12 months preceding payment default. A payment default for home loan TDRs is recognized when a borrower has missed three monthly payments (not necessarily
consecutively) since modification. Payment default on trial modification where the borrower has not yet met the terms of the agreement are included in the table below if the borrower is 90 days or more past due three months after the offer to modify is made.
| | | | | | | | | | | | | | | | | |
| Home Loans - Payment Default | |
| Home Loans – TDRs Entering Payment Default That Were Modified During the Preceding Twelve Months | | Home Loans – TDRs Entering Payment Default That Were Modified During the Preceding Twelve Months |
| | | |
| | 2011 | 2012 |
| (Dollars in millions) | Residential Mortgage | | Home Equity | | Discontinued Real Estate | | Total Carrying Value | Residential Mortgage | | Home Equity | | Discontinued Real Estate | | Total Carrying Value |
| Modifications under government programs | $ | 348 |
| | $ | 1 |
| | $ | 2 |
| | $ | 351 |
| $ | 200 |
| | $ | 8 |
| | $ | 2 |
| | $ | 210 |
|
| Modifications under proprietary programs | 2,068 |
| | 42 |
| | 11 |
| | 2,121 |
| 933 |
| | 14 |
| | 9 |
| | 956 |
|
Loans discharged in Chapter 7 bankruptcy (1) | | 1,216 |
| | 53 |
| | 12 |
| | 1,281 |
|
| Trial modifications | 1,011 |
| | 15 |
| | 5 |
| | 1,031 |
| 2,323 |
| | 20 |
| | 28 |
| | 2,371 |
|
| Total modifications | $ | 3,427 |
| | $ | 58 |
| | $ | 18 |
| | $ | 3,503 |
| $ | 4,672 |
| | $ | 95 |
| | $ | 51 |
| | $ | 4,818 |
|
| | | | | | | | | |
| | | 2011 |
| Modifications under government programs | | $ | 350 |
| | $ | 2 |
| | $ | 2 |
| | $ | 354 |
|
| Modifications under proprietary programs | | 2,086 |
| | 42 |
| | 12 |
| | 2,140 |
|
| Trial modifications | | 1,094 |
| | 17 |
| | 7 |
| | 1,118 |
|
| Total modifications | | $ | 3,530 |
| | $ | 61 |
| | $ | 21 |
| | $ | 3,612 |
|
| |
(1) | Includes loans classified as TDRs at December 31, 2012 due to loans discharged in Chapter 7 bankruptcy in 2012 or 2011. |
Credit Card and Other Consumer
TheImpaired loans within the Credit Card and Other Consumer portfolio segment consist entirely of loans that have been modified in TDRs (the renegotiated credit card and other consumer TDR portfolio segment includes impaired loans that have been modifiedcollectively referred to as a TDR.the renegotiated TDR portfolio). The Corporation seeks to assist customers that are experiencing financial difficulty by modifying loans while ensuring compliance with federal laws and guidelines. Substantially all of the Corporation’s credit card and other consumer loan modifications involve reducing the interest rate on the account and placing the customer on a fixed payment plan not exceeding 60 months, all of which are considered TDRs. In all cases, the customer’s available line of credit is canceled. The Corporation makes loan modifications directly with borrowers for debt held only by the Corporation (internal programs). Additionally, the Corporation makes loan modifications for borrowers working with third-party renegotiation agencies which
that provide solutions to customers’ entire unsecured debt structures (external programs).
In 2012, new regulatory guidance was issued addressing certain consumer real estate loans that have been discharged in Chapter 7 bankruptcy. The Corporation applies this guidance to
other secured consumer loans that have been discharged in Chapter 7 bankruptcy, and such loans are classified as TDRs, written down to collateral value and placed on nonaccrual status no later than the time of discharge.
All credit card and substantially all other consumer loans not secured by real estate, includingthat have been modified loans,in TDRs remain on accrual status until the loan is either charged-off or paid in full. full or charged off, which occurs no later than the end of the month in which the loan becomes 180 days past due or 120 days past due for a loan that was placed on a fixed payment plan after July 1, 2012.
The allowance for impaired credit card loans is based on the present value of projected cash flows, which incorporates the Corporation’s historical payment default and loss experience on modified loans, discounted using the portfolio’s average contractual interest rate, excluding promotionally priced loans, in effect prior to restructuring. Prior to modification, credit card and other consumer loans are included in homogeneous pools which are collectively evaluated for impairment. For these portfolios, loss forecast models are utilized that consider a variety of factors including, but not limited to, historical loss experience, delinquencies, economic trends and credit scores.
|
| | |
| | 190Bank of America 20112012197
| | |
The table below provides information on the Corporation’s renegotiated TDR portfolio. Atportfolio at and for the years ended December 31, 20112012 and 20102011, the renegotiated TDR portfolio was considered impaired and had a related allowance as shown in the table below..
| | | | | | | | | | | | | | | | | | | | | |
Impaired Loans – Credit Card and Other Consumer – Renegotiated TDRs | | | | | | | | |
| | December 31, 2011 | | 2011 | December 31, 2012 | | 2012 |
| (Dollars in millions) | Unpaid
Principal Balance | | Carrying Value (1) | | Related Allowance | | Average
Carrying Value | | Interest
Income Recognized (2) | Unpaid
Principal Balance | | Carrying Value (1) | | Related Allowance | | Average
Carrying Value | | Interest
Income Recognized (2) |
| With an allowance recorded | |
| | |
| | |
| | |
| | |
| |
| | |
| | |
| | |
| | |
|
| U.S. credit card | $ | 5,272 |
| | $ | 5,305 |
| | $ | 1,570 |
| | $ | 7,211 |
| | $ | 433 |
| $ | 2,856 |
| | $ | 2,871 |
| | $ | 719 |
| | $ | 4,085 |
| | $ | 253 |
|
| Non-U.S. credit card | 588 |
| | 597 |
| | 435 |
| | 759 |
| | 6 |
| 311 |
| | 316 |
| | 198 |
| | 464 |
| | 10 |
|
| Direct/Indirect consumer | 1,193 |
| | 1,198 |
| | 405 |
| | 1,582 |
| | 85 |
| 633 |
| | 636 |
| | 210 |
| | 929 |
| | 50 |
|
| Without an allowance recorded | | |
| | |
| | |
| | |
| | |
|
| Direct/Indirect consumer | | 105 |
| | 58 |
| | — |
| | 58 |
| | — |
|
| Total | | |
| | |
| | |
| | |
| | |
|
| U.S. credit card | | $ | 2,856 |
| | $ | 2,871 |
| | $ | 719 |
| | $ | 4,085 |
| | $ | 253 |
|
| Non-U.S. credit card | | 311 |
| | 316 |
| | 198 |
| | 464 |
| | 10 |
|
| Direct/Indirect consumer | | 738 |
| | 694 |
| | 210 |
| | 987 |
| | 50 |
|
| | | | | | | | | | | | | | | | | | | |
| | December 31, 2010 | | 2010 | December 31, 2011 | | 2011 |
| With an allowance recorded | | | | | | | | | | | | | | | | | | |
| U.S. credit card | $ | 8,680 |
| | $ | 8,766 |
| | $ | 3,458 |
| | $ | 10,549 |
| | $ | 621 |
| $ | 5,272 |
| | $ | 5,305 |
| | $ | 1,570 |
| | $ | 7,211 |
| | $ | 433 |
|
| Non-U.S. credit card | 778 |
| | 797 |
| | 506 |
| | 973 |
| | 21 |
| 588 |
| | 597 |
| | 435 |
| | 759 |
| | 6 |
|
| Direct/Indirect consumer | 1,846 |
| | 1,858 |
| | 822 |
| | 2,126 |
| | 111 |
| 1,193 |
| | 1,198 |
| | 405 |
| | 1,582 |
| | 85 |
|
| |
(1) | Includes accrued interest and fees. |
| |
(2) | Interest income recognized includes interest accrued and collected on the outstanding balances of accruing impaired loans as well as interest cash collections on nonaccruing impaired loans for which the ultimate collectability of principal is not uncertain.considered collectible. |
The table below provides information on the Corporation’s primary modification programs for the renegotiated TDR portfolio at December 31, 20112012 and 20102011.
| | | | | | | | | | | | | | | | | | | | | | | | | | | | | | | | | | | | | | | | | |
| Credit Card and Other Consumer – Renegotiated TDR Portfolio by Program Type | |
| Credit Card and Other Consumer – Renegotiated TDRs by Program Type | | Credit Card and Other Consumer – Renegotiated TDRs by Program Type |
| | | | | | | | | | | | | | | | | | | |
| | Internal Programs | | External Programs | | Other (1) | | Total | | Percent of Balances Current or Less Than 30 Days Past Due | December 31 |
| | December 31 | | December 31 | | December 31 | | December 31 | | December 31 | Internal Programs | | External Programs | | Other | | Total | | Percent of Balances Current or Less Than 30 Days Past Due |
| (Dollars in millions) | 2011 | | 2010 | | 2011 | | 2010 | | 2011 | | 2010 | | 2011 | | 2010 | | 2011 | | 2010 | 2012 | | 2011 | | 2012 | | 2011 | | 2012 | | 2011 | | 2012 | | 2011 | | 2012 | | 2011 |
| U.S. credit card | $ | 3,788 |
| | $ | 6,592 |
| | $ | 1,436 |
| | $ | 1,927 |
| | $ | 81 |
| | $ | 247 |
| | $ | 5,305 |
| | $ | 8,766 |
| | 78.97 | % | | 77.66 | % | $ | 1,887 |
| | $ | 3,788 |
| | $ | 953 |
| | $ | 1,436 |
| | $ | 31 |
| | $ | 81 |
| | $ | 2,871 |
| | $ | 5,305 |
| | 81.48 | % | | 78.97 | % |
| Non-U.S. credit card | 218 |
| | 282 |
| | 113 |
| | 176 |
| | 266 |
| | 339 |
| | 597 |
| | 797 |
| | 54.02 |
| | 58.86 |
| 99 |
| | 218 |
| | 38 |
| | 113 |
| | 179 |
| | 266 |
| | 316 |
| | 597 |
| | 43.71 |
| | 54.02 |
|
| Direct/Indirect consumer | 784 |
| | 1,222 |
| | 392 |
| | 531 |
| | 22 |
| | 105 |
| | 1,198 |
| | 1,858 |
| | 80.01 |
| | 78.81 |
| 405 |
| | 784 |
| | 225 |
| | 392 |
| | 64 |
| | 22 |
| | 694 |
| | 1,198 |
| | 83.11 |
| | 80.01 |
|
| Total renegotiated TDR loans | $ | 4,790 |
| | $ | 8,096 |
| | $ | 1,941 |
| | $ | 2,634 |
| | $ | 369 |
| | $ | 691 |
| | $ | 7,100 |
| | $ | 11,421 |
| | 77.05 |
| | 76.51 |
| |
| Total renegotiated TDRs | | $ | 2,391 |
| | $ | 4,790 |
| | $ | 1,216 |
| | $ | 1,941 |
| | $ | 274 |
| | $ | 369 |
| | $ | 3,881 |
| | $ | 7,100 |
| | 78.69 |
| | 77.05 |
|
|
| | |
(1)198 Bank of America 2012
| Other programs include ineligible U.K. credit card and other consumer loans. | |
At December 31, 20112012 and 20102011, the Corporation had a renegotiated TDR portfolio of $7.13.9 billion and $11.47.1 billion of which $5.53.1 billion was current or less than 30 days past due under the modified terms at December 31, 20112012. The renegotiated TDR portfolio is excluded from nonperforming loans as the Corporation generally does not classify consumer loans not secured by real estate as nonperforming. Instead, these loans are charged off no later than the end of the month in which the loan becomes
180 days past due.
The table below provides information on the Corporation’s
renegotiated TDR portfolio including the unpaid principal balance, and carrying value and average pre- and post-modification interest rates of loans that were modified in TDRs during 2012 and 2011, along withand net charge-offs that were recorded during 2011. The table also presents the average pre- and post-modification interest rate.period in which the modification occurred.
| | | | | | | | | | | | | | | | | | | | | |
| Credit Card and Other Consumer – Renegotiated TDRs Entered into During 2011 | |
| Credit Card and Other Consumer – Renegotiated TDRs Entered into During 2012 and 2011 | | Credit Card and Other Consumer – Renegotiated TDRs Entered into During 2012 and 2011 |
| | | |
| | December 31, 2011 | | 2011 | December 31, 2012 | | 2012 |
| (Dollars in millions) | Unpaid Principal Balance | | Carrying Value (1) | | Pre-modification Interest Rate | | Post-modification Interest Rate | | Net Charge-offs | Unpaid Principal Balance | | Carrying Value (1) | | Pre-modification Interest Rate | | Post-modification Interest Rate | | Net Charge-offs |
| U.S. credit card | $ | 890 |
| | $ | 902 |
| | 19.04 | % | | 6.16 | % | | $ | 44 |
| $ | 396 |
| | $ | 400 |
| | 17.59 | % | | 6.36 | % | | $ | 45 |
|
| Non-U.S. credit card | 305 |
| | 322 |
| | 26.32 |
| | 1.04 |
| | 126 |
| 196 |
| | 206 |
| | 26.19 |
| | 1.15 |
| | 190 |
|
| Direct/Indirect consumer | 198 |
| | 199 |
| | 15.63 |
| | 5.22 |
| | 10 |
| 160 |
| | 113 |
| | 9.59 |
| | 5.72 |
| | 52 |
|
| Total | $ | 1,393 |
| | $ | 1,423 |
| | 20.20 |
| | 4.87 |
| | $ | 180 |
| $ | 752 |
| | $ | 719 |
| | 18.79 |
| | 4.77 |
| | $ | 287 |
|
| | | | | | | | | | | |
| | | December 31, 2011 | | 2011 |
| U.S. credit card | | $ | 890 |
| | $ | 902 |
| | 19.04 | % | | 6.16 | % | | $ | 106 |
|
| Non-U.S. credit card | | 305 |
| | 322 |
| | 26.32 |
| | 1.04 |
| | 291 |
|
| Direct/Indirect consumer | | 198 |
| | 199 |
| | 15.63 |
| | 5.22 |
| | 23 |
|
| Total | | $ | 1,393 |
| | $ | 1,423 |
| | 20.20 |
| | 4.87 |
| | $ | 420 |
|
| |
(1) | Includes accrued interest and fees. |
The table below provides information on the Corporation’s primary modification programs for the renegotiated TDR portfolio for loans that were modified in TDRs during 2012 and 2011.
| | | | | | | | | | | | | | | | | |
Credit Card and Other Consumer – Renegotiated TDRs by Program Type | | | | |
| | Renegotiated TDRs Entered into During 2011 | Renegotiated TDRs Entered into During 2012 |
| | December 31, 2011 | December 31, 2012 |
| (Dollars in millions) | Internal Programs | | External Programs | | Other | | Total | Internal Programs | | External Programs | | Other | | Total |
| U.S. credit card | $ | 492 |
| | $ | 407 |
| | $ | 3 |
| | $ | 902 |
| $ | 248 |
| | $ | 152 |
| | $ | — |
| | $ | 400 |
|
| Non-U.S. credit card | 163 |
| | 158 |
| | 1 |
| | 322 |
| 112 |
| | 94 |
| | — |
| | 206 |
|
| Direct/Indirect consumer | 112 |
| | 87 |
| | — |
| | 199 |
| 36 |
| | 19 |
| | 58 |
| | 113 |
|
| Total renegotiated TDR loans | $ | 767 |
| | $ | 652 |
| | $ | 4 |
| | $ | 1,423 |
| $ | 396 |
| | $ | 265 |
| | $ | 58 |
| | $ | 719 |
|
| | | | | | | | | |
| | | Renegotiated TDRs Entered into During 2011 |
| | | December 31, 2011 |
| U.S. credit card | | $ | 492 |
| | $ | 407 |
| | $ | 3 |
| | $ | 902 |
|
| Non-U.S. credit card | | 163 |
| | 158 |
| | 1 |
| | 322 |
|
| Direct/Indirect consumer | | 112 |
| | 87 |
| | — |
| | 199 |
|
| Total renegotiated TDR loans | | $ | 767 |
| | $ | 652 |
| | $ | 4 |
| | $ | 1,423 |
|
Credit card and other consumer loans are deemed to be in payment default during the quarter in which a borrower misses the second of two consecutive payments. Payment defaults are one of the factors considered when projecting future cash flows in the calculation of the allowance for loan losses for impaired credit card and other consumer loans. At December 31, 2012, the allowance for loan and lease losses on the Corporation’s renegotiated portfolio was 29.04 percent of the carrying value of these loans. Loans that entered into payment default during 20112012 and2011 that had been modified in a TDR during the 12 months preceding payment default were $203 million and $863 million for U.S. credit card,$298 million and $409 million for non-U.S. credit card and $35 million and $180 million for direct/indirect consumer.
CommercialPurchased Credit-impaired Loans
ImpairedThe Corporation purchases loans with and without evidence of credit quality deterioration since origination. Evidence of credit quality deterioration as of the purchase date may include statistics such as past due status, refreshed borrower credit scores and refreshed loan-to-value (LTV) ratios, some of which are not
immediately available as of the purchase date. Purchased loans with evidence of credit quality deterioration for which it is probable that the Corporation will not receive all contractually required payments receivable are accounted for as PCI loans. The excess of the cash flows expected to be collected on PCI loans, measured as of the acquisition date, over the estimated fair value is referred to as the accretable yield and is recognized in interest income over the remaining life of the loan using a level yield methodology. The difference between contractually required payments as of the acquisition date and the cash flows expected to be collected is referred to as the nonaccretable difference. PCI loans that have similar risk characteristics, primarily credit risk, collateral type and interest rate risk, are pooled and accounted for as a single asset with a single composite interest rate and an aggregate expectation of cash flows. Once a pool is assembled, it is treated as if it was one loan for purposes of applying the accounting guidance for PCI loans. An individual loan is removed from a PCI loan pool if it is sold, foreclosed, forgiven or the expectation of any future proceeds is remote. When a loan is removed from a PCI loan pool and the foreclosure or recovery value of the loan is less than the loan’s carrying value, the difference is first applied against the PCI pool’s nonaccretable difference. If the nonaccretable difference has been fully utilized, only then is the PCI pool’s basis applicable to that loan written-off against its valuation reserve; however, the integrity of the pool is maintained and it continues to be accounted for as if it was one loan.
The Corporation continues to estimate cash flows expected to be collected over the life of the PCI loans using internal credit risk, interest rate and prepayment risk models that incorporate management’s best estimate of current key assumptions such as default rates, loss severity and payment speeds. If, upon subsequent evaluation, the Corporation determines it is probable that the present value of the expected cash flows has decreased, the PCI loan is considered to be further impaired resulting in a charge to the provision for credit losses and a corresponding increase to a valuation allowance included in the allowance for loan and lease losses. If, upon subsequent evaluation, it is probable that there is an increase in the present value of the expected cash flows, the Corporation reduces any remaining valuation allowance. If there is no remaining valuation allowance, the Corporation recalculates the amount of accretable yield as the excess of the revised expected cash flows over the current carrying value resulting in a reclassification from nonaccretable difference to accretable yield. The present value of the expected cash flows is determined using the PCI loans’ effective interest rate, adjusted for changes in the PCI loans’ interest rate indices.
Leases
The Corporation provides equipment financing to its customers through a variety of lease arrangements. Direct financing leases are carried at the aggregate of lease payments receivable plus estimated residual value of the leased property less unearned income. Leveraged leases, which are a form of financing leases, are carried net of non-recourse debt. Unearned income on leveraged and direct financing leases is accreted to interest income over the lease terms using methods that approximate the interest method.
Allowance for Credit Losses
The allowance for credit losses, which includes the allowance for loan and lease losses and the reserve for unfunded lending
commitments, represents management’s estimate of probable losses inherent in the Corporation’s lending activities. The allowance for loan and lease losses and the reserve for unfunded lending commitments exclude amounts for loans and unfunded lending commitments accounted for under the fair value option as the fair values of these instruments reflect a credit component. The allowance for loan and lease losses does not include amounts related to accrued interest receivable, other than billed interest and fees on credit card receivables, as accrued interest receivable is reversed when a loan is placed on nonaccrual status. The allowance for loan and lease losses represents the estimated probable credit losses on funded consumer and commercial loans and leases while the reserve for unfunded lending commitments, including standby letters of credit (SBLCs) and binding unfunded loan commitments, represents estimated probable credit losses on these unfunded credit instruments based on utilization assumptions. Lending-related credit exposures deemed to be uncollectible, excluding loans carried at fair value, are charged against these accounts. Write-offs on PCI loans on which there is a valuation allowance are written-off against the valuation allowance. For additional information, see Purchased Credit-impaired Loans. Cash recovered on previously charged off amounts is recorded as a recovery to these accounts. Management evaluates the adequacy of the allowance for credit losses based on the combined total of the allowance for loan and lease losses and the reserve for unfunded lending commitments.
The Corporation performs periodic and systematic detailed reviews of its lending portfolios to identify credit risks and to assess the overall collectability of those portfolios. The allowance on certain homogeneous consumer loan portfolios, which generally consist of consumer real estate within the Home Loans portfolio segment and credit card loans within the Credit Card and Other Consumer portfolio segment, is based on aggregated portfolio segment evaluations generally by product type. Loss forecast models are utilized for these portfolios which consider a variety of factors including, but not limited to, historical loss experience, estimated defaults or foreclosures based on portfolio trends, delinquencies, bankruptcies, economic conditions and credit scores.
The Corporation’s Home Loans portfolio segment is comprised primarily of large groups of homogeneous consumer loans secured by residential real estate. The amount of losses incurred in the homogeneous loan pools is estimated based upon how many of the loans will default and the loss in the event of default. Using modeling methodologies, the Corporation estimates how many of the homogeneous loans will default based on the individual loans’ attributes aggregated into pools of homogeneous loans with similar attributes. The attributes that are most significant to the probability of default and are used to estimate default include refreshed LTV or in the case of a subordinated lien, refreshed combined loan-to-value (CLTV), borrower credit score, months since origination (referred to as vintage) and geography, all of which are further broken down by present collection status (whether the loan is current, delinquent, in default or in bankruptcy). This estimate is based on the Corporation’s historical experience with the loan portfolio. The estimate is adjusted to reflect an assessment of environmental factors not yet reflected in the historical data underlying the loss estimates, such as changes in real estate values, local and national economies, underwriting standards and the regulatory environment. The probability of default on a loan is based on an analysis of the movement of loans with the measured attributes from either current or any of the delinquency categories
to default over a twelve-month period. On home equity loans where the Corporation holds only a second-lien position and foreclosure is not the best alternative, the loss severity is estimated at 100 percent.
The allowance on certain commercial loans (except business card and certain small business loans) is calculated using loss rates delineated by risk rating and product type. Factors considered when assessing loss rates include the value of the underlying collateral, if applicable, the industry of the obligor, and the obligor’s liquidity and other financial indicators along with certain qualitative factors. These statistical models are updated regularly for changes in economic and business conditions. Included in the analysis of consumer and commercial loan portfolios are reserves which are maintained to cover uncertainties that affect the Corporation’s estimate of probable losses including domestic and global economic uncertainty and large single name defaults.
The remaining portfolios, including nonperforming commercial loans, as well as consumer and commercial loans modified in a troubled debt restructuring (TDR) are reviewed in accordance with applicable accounting guidance on impaired loans and TDRs. If necessary, a specific allowance is established for these loans if they are deemed to be impaired. A loan is considered impaired when, based on current information and events, it is probable that the Corporation will be unable to collect all amounts due, including principal and/or interest, in accordance with the contractual terms of the agreement, and once a loan has been identified as impaired, management measures impairment. Impaired loans and TDRs (both performing and nonperforming) are primarily measured based on the present value of payments expected to be received, discounted at the loan’sloans’ original effective contractual interest rate. Commercial impairedrates, or discounted at the portfolio average contractual annual percentage rate, excluding promotionally priced loans, in effect prior to restructuring. Impaired loans and TDRs may also be measured based on observable market prices, or for loans that are solely dependent on the collateral for repayment, the estimated fair value of the collateral less estimated costs to sell. If the recorded investment in impaired loans exceeds this amount, a specific allowance is established as a component of the allowance for loan and lease losses unless these are secured consumer loans that are solely dependent on the collateral for repayment, in which case the initial amount that exceeds the fair value of the collateral is charged off.
Generally, when determining the fair value of the collateral securing consumer real estate-secured loans that are solely dependent on the collateral for repayment, prior to performing a detailed property valuation including a walk-through of a property, the Corporation initially estimates the fair value of the collateral securing these consumer loans using an automated valuation method (AVM). An AVM is a tool that estimates the value of a property by reference to market data including sales of comparable properties and price trends specific to the Metropolitan Statistical Area in which the property being valued is located. In the event that an AVM value is not available, the Corporation utilizes publicized indices or if these methods provide less reliable valuations, the Corporation uses appraisals or broker price opinions to estimate the fair value of the collateral. While there is inherent imprecision in these valuations, the Corporation believes that they are representative of the portfolio in the aggregate.
In addition to the allowance for loan and lease losses, the Corporation also estimates probable losses related to unfunded lending commitments, such as letters of credit and financial guarantees, and binding unfunded loan commitments. The reserve for unfunded lending commitments excludes commitments
accounted for under the fair value option. Unfunded lending commitments are subject to individual reviews and are analyzed and segregated by risk according to the Corporation’s internal risk rating scale. These risk classifications, in conjunction with an analysis of historical loss experience, utilization assumptions, current economic conditions, performance trends within the portfolio and any other pertinent information, result in the estimation of the reserve for unfunded lending commitments.
The allowance for credit losses related to the loan and lease portfolio is reported separately on the Consolidated Balance Sheet whereas the reserve for unfunded lending commitments is reported on the Consolidated Balance Sheet in accrued expenses and other liabilities. The provision for credit losses related to the loan and lease portfolio and unfunded lending commitments is reported in the Consolidated Statement of Income.
Nonperforming Loans and Leases, Charge-offs and Delinquencies
Nonperforming loans and leases generally include loans and leases that have been placed on nonaccrual status, including nonaccruing loans whose contractual terms have been restructured in a manner that grants a concession to a borrower experiencing financial difficulties. Loans accounted for under the fair value option, PCI loans and LHFS are not reported as nonperforming loans and leases.
In accordance with the Corporation’s policies, consumer real estate-secured loans, including residential mortgages and home equity loans, are generally placed on nonaccrual status and classified as nonperforming at 90 days past due unless repayment of the loan is insured by the Federal Housing Administration (FHA) or through individually insured long-term standby agreements with Fannie Mae (FNMA) or Freddie Mac (FHLMC) (the fully-insured portfolio). Residential mortgage loans in the fully-insured portfolio are not placed on nonaccrual status and, therefore, are not reported as nonperforming loans. Junior-lien home equity loans are placed on nonaccrual status and classified as nonperforming when the underlying first-lien mortgage loan becomes 90 days past due even if the junior-lien loan is current. Accrued interest receivable is reversed when a consumer loan is placed on nonaccrual status. Interest collections on nonaccruing consumer loans for which the ultimate collectability of principal is uncertain are generally applied as principal reductions; otherwise, such collections are credited to interest income when received. These loans may be restored to accrual status when all principal and interest is current and full repayment of the remaining contractual principal and interest is expected, or when the loan otherwise becomes well-secured and is in the process of collection. The outstanding balance of real estate-secured loans that is in excess of the estimated property value, less estimated costs to sell, is charged off no later than the end of the month in which the account becomes 180 days past due unless the loan is fully insured. The estimated property value, less estimated costs to sell, is determined using the same process as described for impaired loans in the Allowance for Credit Losses section of this Note.
Consumer loans secured by personal property, credit card loans and other unsecured consumer loans are not placed on nonaccrual status prior to charge-off and, therefore, are not reported as nonperforming loans, except for certain secured consumer loans, including those that have been modified in a TDR. Personal property-secured loans are charged off to collateral value no later than the end of the month in which the account becomes 120
days past due or, for loans in bankruptcy, 60 days past due. Credit card and other unsecured consumer loans are charged off no later than the end of the month in which the account becomes 180 days past due or within 60 days after receipt of notification of death or bankruptcy.
Commercial loans and leases, excluding business card loans, that are past due 90 days or more as to principal or interest, or where reasonable doubt exists as to timely collection, including loans that are individually identified as being impaired, are generally placed on nonaccrual status and classified as nonperforming unless well-secured and in the process of collection.
Accrued interest receivable is reversed when commercial loans and leases are placed on nonaccrual status. Interest collections on nonaccruing commercial loans and leases for which the ultimate collectability of principal is uncertain are applied as principal reductions; otherwise, such collections are credited to income when received. Commercial loans and leases may be restored to accrual status when all principal and interest is current and full repayment of the remaining contractual principal and interest is expected, or when the loan otherwise becomes well-secured and is in the process of collection. Business card loans are charged off no later than the end of the month in which the account becomes 180 days past due or 60 days after receipt of notification of death or bankruptcy filing. These loans are not placed on nonaccrual status prior to charge-off and, therefore, are not reported as nonperforming loans. Other commercial loans and leases are generally charged off when all or a portion of the principal amount is determined to be uncollectible.
The entire balance of a consumer loan or commercial loan or lease is contractually delinquent if the minimum payment is not received by the specified due date on the customer’s billing statement. Interest and fees continue to accrue on past due loans and leases until the date the loan is placed on nonaccrual status, if applicable.
PCI loans are recorded at fair value at the acquisition date. Although the PCI loans may be contractually delinquent, the Corporation does not classify these loans as nonperforming as the loans were written down to fair value at the acquisition date and the accretable yield is recognized in interest income over the remaining life of the loan. In addition, reported net charge-offs exclude write-offs on PCI loans as the fair value already considers the estimated credit losses.
Troubled Debt Restructurings
Consumer loans and commercial loans and leases whose contractual terms have been restructured in a manner that grants a concession to a borrower experiencing financial difficulties are classified as TDRs. Concessions could include a reduction in the interest rate to a rate that is below market on the loan, payment extensions, forgiveness of principal, forbearance, or other actions designed to maximize collections. Secured consumer loans that have been discharged in Chapter 7 bankruptcy and have not been reaffirmed by the borrower are classified as TDRs at the time of discharge. Consumer real estate-secured loans for which a binding offer to restructure has been extended are also classified as TDRs. Loans classified as TDRs are considered impaired loans. Loans that are carried at fair value, LHFS and PCI loans are not classified as TDRs.
Secured consumer loans whose contractual terms have been modified in a TDR and are current at the time of restructuring generally remain on accrual status if there is demonstrated performance prior to the restructuring and payment in full under the restructured terms is expected. Otherwise, the loans are placed on nonaccrual status and reported as nonperforming, except for the fully-insured loans, until there is sustained repayment performance for a reasonable period, generally six months. If accruing consumer TDRs cease to perform in accordance with their modified contractual terms, they are placed on nonaccrual status and reported as nonperforming TDRs. Consumer TDRs that bear a below-market rate of interest are generally reported as TDRs throughout their remaining lives. Secured consumer loans that have been discharged in Chapter 7 bankruptcy are placed on nonaccrual status and written down to the collateral value, less estimated costs to sell, no later than the time of discharge. Interest collections on these loans are generally recorded in interest income on a cash basis. Credit card and other unsecured consumer loans that have been renegotiated in a TDR are not placed on nonaccrual status. Credit card and other unsecured consumer loans that have been renegotiated and placed on a fixed payment plan after July 1, 2012 are generally charged off no later than the end of the month in which the account becomes 120 days past due.
Commercial loans and leases whose contractual terms have been modified in a TDR are typically placed on nonaccrual status and reported as nonperforming until the loans or leases have performed for an adequate period of time under the restructured agreement, generally six months. If the borrower had demonstrated performance under the previous terms and the underwriting process shows the capacity to continue to perform under the modified terms, the loan may remain on accrual status. Accruing commercial TDRs are reported as performing TDRs through the end of the calendar year in which the loans are returned to accrual status. In addition, if accruing commercial TDRs bear less than a market rate of interest at the time of modification, they are reported as performing TDRs throughout their remaining lives unless and until they cease to perform in accordance with their modified contractual terms, at which time they are placed on nonaccrual status and reported as nonperforming TDRs.
A loan that had previously been modified in a TDR and is subsequently refinanced under current underwriting standards at a market rate with no concessionary terms is accounted for as a new loan and is no longer reported as a TDR.
Loans Held-for-sale
Loans that are intended to be sold in the foreseeable future, including residential mortgages, loan syndications, and to a lesser degree, commercial real estate, consumer finance and other loans, are reported as LHFS and are carried at the lower of aggregate cost or fair value. The Corporation accounts for certain LHFS, including first mortgage LHFS, under the fair value option. Mortgage loan origination costs related to LHFS that the Corporation accounts for under the fair value option are recognized
in noninterest expense when incurred. Mortgage loan origination costs for LHFS carried at the lower of cost or fair value are capitalized as part of the carrying amount of the loans and recognized as a reduction of mortgage banking income upon the sale of such loans. LHFS that are on nonaccrual status and are reported as nonperforming, as defined in the policy herein, are reported separately from nonperforming loans and leases.
Premises and Equipment
Premises and equipment are carried at cost less accumulated depreciation and amortization. Depreciation and amortization are recognized using the straight-line method over the estimated useful lives of the assets. Estimated lives range up to 40 years for buildings, up to 12 years for furniture and equipment, and the shorter of lease term or estimated useful life for leasehold improvements.
The Corporation capitalizes the costs associated with certain computer hardware, software and internally developed software, and amortizes the costs over the expected useful life. Direct project costs of internally developed software are capitalized when it is probable that the project will be completed and the software will be used for its intended function.
Mortgage Servicing Rights
The Corporation accounts for consumer-related MSRs at fair value with changes in fair value recorded in mortgage banking income (loss), while commercial-related and residential reverse mortgage MSRs are accounted for using the amortization method (lower of amortized cost or fair value) with impairment recognized as a reduction in mortgage banking income (loss). To reduce the volatility of earnings related to interest rate and market value fluctuations, U.S. Treasury securities, mortgage-backed securities (MBS) and derivatives such as options and interest rate swaps may be used as risk management derivatives to hedge certain market risks of the MSRs, but are not designated as qualifying accounting hedges. These instruments are carried at fair value with changes in fair value recognized in mortgage banking income (loss).
The Corporation estimates the fair value of consumer MSRs using a valuation model that calculates the present value of estimated future net servicing income and, when available, quoted prices from independent parties. The present value calculation is accomplished through an option-adjusted spread (OAS) valuation approach that factors in prepayment risk. This approach consists of projecting servicing cash flows under multiple interest rate scenarios and discounting these cash flows using risk-adjusted discount rates. The key economic assumptions used in MSR valuations include weighted-average lives of the MSRs and the OAS levels. The OAS represents the spread that is added to the discount rate so that the sum of the discounted cash flows equals the market price; therefore, it is a measure of the extra yield over
the reference discount factor that the Corporation expects to earn by holding the asset.
Goodwill and Intangible Assets
Goodwill is the purchase premium after adjusting for the fair value of net assets acquired. Goodwill is not amortized but is reviewed for potential impairment on an annual basis, or when events or circumstances indicate a potential impairment, at the reporting unit level. A reporting unit, as defined under applicable accounting guidance, is a business segment or one level below a business segment. The goodwill impairment analysis is a two-step test. The first step of the goodwill impairment test involves comparing the fair value of each reporting unit with its carrying amount including goodwill as measured by allocated equity. In certain circumstances, the first step may be performed using a qualitative assessment. If the fair value of the reporting unit exceeds its carrying amount, goodwill of the reporting unit is considered not
impaired; however, if the carrying amount of the reporting unit exceeds its fair value, the second step must be performed to measure potential impairment.
The second step involves calculating an implied fair value of goodwill for each reporting unit for which the first step indicated possible impairment. The implied fair value of goodwill is determined in the same manner as the amount of goodwill recognized in a business combination, which is the excess of the fair value of the reporting unit, as determined in the first step, over the aggregate fair values of the assets, liabilities and identifiable intangibles as if the reporting unit was being acquired in a business combination. Measurement of the fair values of the assets and liabilities of a reporting unit is consistent with the requirements of the fair value measurements accounting guidance, as described herein. The adjustments to measure the assets, liabilities and intangibles at fair value are for the purpose of measuring the implied fair value of goodwill and such adjustments are not reflected in the Consolidated Balance Sheet. If the implied fair value of goodwill exceeds the goodwill assigned to the reporting unit, there is no impairment. If the goodwill assigned to a reporting unit exceeds the implied fair value of goodwill, an impairment charge is recorded for the excess. An impairment loss recognized cannot exceed the amount of goodwill assigned to a reporting unit. An impairment loss establishes a new basis in the goodwill and subsequent reversals of goodwill impairment losses are not permitted under applicable accounting guidance.
For intangible assets subject to amortization, an impairment loss is recognized if the carrying amount of the intangible asset is not recoverable and exceeds fair value. The carrying amount of the intangible asset is considered not recoverable if it exceeds the sum of the undiscounted cash flows expected to result from the use of the asset.
Variable Interest Entities
A VIE is an entity that lacks equity investors or whose equity investors do not have a controlling financial interest in the entity through their equity investments. The entity that has a controlling financial interest in a VIE is referred to as the primary beneficiary and consolidates the VIE. The Corporation is deemed to have a controlling financial interest and is the primary beneficiary of a VIE if it has both the power to direct the activities of the VIE that most significantly impact the VIE’s economic performance and an obligation to absorb losses or the right to receive benefits that could potentially be significant to the VIE. On a quarterly basis, the Corporation reassesses whether it has a controlling financial interest in and is the primary beneficiary of a VIE. The quarterly reassessment process considers whether the Corporation has acquired or divested the power to direct the activities of the VIE through changes in governing documents or other circumstances. The reassessment also considers whether the Corporation has acquired or disposed of a financial interest that could be significant to the VIE, or whether an interest in the VIE has become significant or is no longer significant. The consolidation status of the VIEs with which the Corporation is involved may change as a result of such reassessments. Changes in consolidation status are applied prospectively, with assets and liabilities of a newly consolidated VIE initially recorded at fair value. A gain or loss may be recognized upon deconsolidation of a VIE depending on the carrying amounts of deconsolidated assets and liabilities compared to the fair value of retained interests and ongoing contractual arrangements.
The Corporation primarily uses VIEs for its securitization activities, in which the Corporation transfers whole loans or debt securities into a trust or other vehicle such that the assets are legally isolated from the creditors of the Corporation. Assets held in a trust can only be used to settle obligations of the trust. The creditors of these trusts typically have no recourse to the Corporation except in accordance with the Corporation’s obligations under standard representations and warranties.
When the Corporation is the servicer of whole loans held in a securitization trust, including non-agency residential mortgages, home equity loans, credit cards, automobile loans and student loans, the Corporation has the power to direct the most significant activities of the trust. The Corporation does not have the power to direct the most significant activities of a residential mortgage agency trust unless the Corporation holds substantially all of the issued securities and has the unilateral right to liquidate the trust. The power to direct the most significant activities of a commercial mortgage securitization trust is typically held by the special servicer or by the party holding specific subordinate securities which embody certain controlling rights. The Corporation consolidates a whole-loan securitization trust if it has the power to direct the most significant activities and also holds securities issued by the trust or has other contractual arrangements, other than standard representations and warranties, that could potentially be significant to the trust.
The Corporation may also transfer trading account securities and AFS securities into municipal bond or resecuritization trusts. The Corporation consolidates a municipal bond or resecuritization trust if it has control over the ongoing activities of the trust such as the remarketing of the trust’s liabilities or, if there are no ongoing activities, sole discretion over the design of the trust, including the identification of securities to be transferred in and the structure of securities to be issued, and also retains securities or has liquidity or other commitments that could potentially be significant to the trust. The Corporation does not consolidate a municipal bond or resecuritization trust if one or a limited number of third-party investors share responsibility for the design of the trust or have control over the significant activities of the trust through liquidation or other substantive rights.
Other VIEs used by the Corporation include collateralized debt obligations (CDOs), investment vehicles created on behalf of customers and other investment vehicles. The Corporation does not routinely serve as collateral manager for CDOs and, therefore, does not typically have the power to direct the activities that most significantly impact the economic performance of a CDO. However, following an event of default, if the Corporation is a majority holder of senior securities issued by a CDO and acquires the power to manage the assets of the CDO, the Corporation consolidates the CDO.
The Corporation consolidates a customer or other investment vehicle if it has control over the initial design of the vehicle or manages the assets in the vehicle and also absorbs potentially significant gains or losses through an investment in the vehicle, derivative contracts or other arrangements. The Corporation does not consolidate an investment vehicle if a single investor controlled the initial design of the vehicle or manages the assets in the vehicles or if the Corporation does not have a variable interest that could potentially be significant to the vehicle.
Retained interests in securitized assets are initially recorded at fair value. In addition, the Corporation may invest in debt securities issued by unconsolidated VIEs. Fair values of these debt securities, which are AFS debt securities or trading account assets,
are based primarily on quoted market prices. Generally, quoted market prices for retained residual interests are not available; therefore, the Corporation estimates fair values based on the present value of the associated expected future cash flows. This may require management to estimate credit losses, prepayment speeds, forward interest yield curves, discount rates and other factors that impact the value of retained interests. Retained residual interests in unconsolidated securitization trusts are classified in trading account assets or other assets with changes in fair value recorded in income. The Corporation may also enter into derivatives with unconsolidated VIEs, which are carried at fair value with changes in fair value recorded in income.
Fair Value
The Corporation measures the fair values of its financial instruments in accordance with accounting guidance that requires an entity to base fair value on exit price. A three-level hierarchy for inputs is utilized in measuring fair value which maximizes the use of observable inputs and minimizes the use of unobservable inputs by requiring that observable inputs be used to determine the exit price when available. Under applicable accounting guidance, the Corporation categorizes its financial instruments, based on the priority of inputs to the valuation technique, into this three-level hierarchy, as described below. Trading account assets and liabilities, derivative assets and liabilities, AFS debt and equity securities, MSRs and certain other assets are carried at fair value in accordance with applicable accounting guidance. The Corporation has also elected to account for certain assets and liabilities under the fair value option, including certain commercial and consumer loans and loan commitments, LHFS, other short-term borrowings, securities financing agreements, asset-backed secured financings, long-term deposits and long-term debt. The following describes the three-level hierarchy.
| |
| Level 1 | Unadjusted quoted prices in active markets for identical assets or liabilities. Level 1 assets and liabilities include debt and equity securities and derivative contracts that are traded in an active exchange market, as well as certain U.S. Treasury securities that are highly liquid and are actively traded in over-the-counter (OTC) markets. |
| |
| Level 2 | Observable inputs other than Level 1 prices, such as quoted prices for similar assets or liabilities, quoted prices in markets that are not active, or other inputs that are observable or can be corroborated by observable market data for substantially the full term of the assets or liabilities. Level 2 assets and liabilities include debt securities with quoted prices that are traded less frequently than exchange-traded instruments and derivative contracts where fair value is determined using a pricing model with inputs that are observable in the market or can be derived principally from or corroborated by observable market data. This category generally includes U.S. government and agency mortgage-backed debt securities, corporate debt securities, derivative contracts, residential mortgage loans and certain LHFS. |
| |
| Level 3 | Unobservable inputs that are supported by little or no market activity and that are significant to the overall fair value of the assets or liabilities. Level 3 assets and liabilities include financial instruments for which the determination of fair value requires significant management judgment or estimation. The fair value for |
such assets and liabilities is generally determined using pricing models, market comparables, discounted cash flow methodologies or similar techniques that incorporate the assumptions a market participant would use in pricing the asset or liability. This category generally includes certain private equity investments and other principal investments, retained residual interests in securitizations, residential MSRs, asset-backed securities (ABS), highly structured, complex or long-dated derivative contracts, certain LHFS, IRLCs and certain CDOs where independent pricing information cannot be obtained for a significant portion of the underlying assets.
Income Taxes
There are two components of income tax expense: current and deferred. Current income tax expense reflects taxes to be paid or refunded for the current period. Deferred income tax expense results from changes in deferred tax assets and liabilities between periods. These gross deferred tax assets and liabilities represent decreases or increases in taxes expected to be paid in the future because of future reversals of temporary differences in the bases of assets and liabilities as measured by tax laws and their bases as reported in the financial statements. Deferred tax assets are also recognized for tax attributes such as net operating loss (NOL) carryforwards and tax credit carryforwards. Valuation allowances are recorded to reduce deferred tax assets to the amounts management concludes are more-likely-than-not to be realized.
Income tax benefits are recognized and measured based upon a two-step model: first, a tax position must be more-likely-than-not to be sustained based solely on its technical merits in order to be recognized, and second, the benefit is measured as the largest dollar amount of that position that is more-likely-than-not to be sustained upon settlement. The difference between the benefit recognized and the tax benefit claimed on a tax return is referred to as an unrecognized tax benefit (UTB). The Corporation records income tax-related interest and penalties, if applicable, within income tax expense.
Retirement Benefits
The Corporation has established retirement plans covering substantially all full-time and certain part-time employees. Pension expense under these plans is charged to current operations and consists of several components of net pension cost based on various actuarial assumptions regarding future experience under the plans.
In addition, the Corporation has established unfunded supplemental benefit plans and supplemental executive retirement plans (SERPs) for selected officers of the Corporation and its subsidiaries that provide benefits that cannot be paid from a qualified retirement plan due to Internal Revenue Code restrictions. The Corporation’s current executive officers do not earn additional retirement income under SERPs. These plans are nonqualified under the Internal Revenue Code and assets used to fund benefit payments are not segregated from other assets of the Corporation; therefore, in general, a participant’s or beneficiary’s claim to benefits under these plans is as a general creditor. In addition, the Corporation has established several postretirement healthcare and life insurance benefit plans.
In connection with a redesign of the retirement plans, on January 24, 2012, the Corporation froze benefits earned in the
Qualified Pension Plans effective June 30, 2012. As a result of this action, a curtailment was triggered and a remeasurement of the qualified pension obligations and plan assets occurred as of January 24, 2012. For additional information, see Note 18 – Employee Benefit Plans.
Accumulated Other Comprehensive Income
The Corporation records unrealized gains and losses on AFS debt and marketable equity securities, gains and losses on cash flow accounting hedges, certain employee benefit plan adjustments, foreign currency translation adjustments and related hedges of net investments in foreign operations and the cumulative adjustment related to certain accounting changes in accumulated OCI, net-of-tax. Unrealized gains and losses on AFS debt and marketable equity securities are reclassified to earnings as the gains or losses are realized upon sale of the securities. Unrealized losses on AFS securities deemed to represent OTTI are reclassified to earnings at the time of the impairment charge. For AFS debt securities that the Corporation does not intend to sell or it is not more-likely-than-not that it will be required to sell, only the credit component of an unrealized loss is reclassified to earnings. Gains or losses on derivatives accounted for as cash flow hedges are reclassified to earnings when the hedged transaction affects earnings. Translation gains or losses on foreign currency translation adjustments are reclassified to earnings upon the substantial sale or liquidation of investments in foreign operations.
Revenue Recognition
The following summarizes the Corporation’s revenue recognition policies as they relate to certain noninterest income line items in the Consolidated Statement of Income.
Card income is derived from fees such as interchange, cash advance, annual, late, over-limit and other miscellaneous fees, which are recorded as revenue when earned, primarily on an accrual basis. Uncollected fees are included in the customer card receivables balances with an amount recorded in the allowance for loan and lease losses for estimated uncollectible card receivables. Uncollected fees are written off when a card receivable reaches 180 days past due.
Service charges include fees for insufficient funds, overdrafts and other banking services and are recorded as revenue when earned. Uncollected fees are included in outstanding loan balances with an amount recorded for estimated uncollectible service fees receivable. Uncollected fees are written off when a fee receivable reaches 60 days past due.
Investment and brokerage services revenue consists primarily of asset management fees and brokerage income that is recognized over the period the services are provided or when commissions are earned. Asset management fees consist primarily of fees for investment management and trust services and are generally based on the dollar amount of the assets being managed. Brokerage income is generally derived from commissions and fees earned on the sale of various financial products.
Investment banking income consists primarily of advisory and underwriting fees that are recognized in income as the services are provided and no contingencies exist. Revenues are generally recognized net of any direct expenses. Non-reimbursed expenses are recorded as noninterest expense.
Earnings Per Common Share
Earnings per common share (EPS) is computed by dividing net income (loss) allocated to common shareholders by the weighted-average common shares outstanding, except that it does not include unvested common shares subject to repurchase or cancellation. Net income (loss) allocated to common shareholders represents net income (loss) applicable to common shareholders which is net income (loss) adjusted for preferred stock dividends including dividends declared, accretion of discounts on preferred stock including accelerated accretion when preferred stock is repaid early, and cumulative dividends related to the current dividend period that have not been declared as of period end, less income allocated to participating securities (see below for additional information). Diluted EPS is computed by dividing income (loss) allocated to common shareholders plus dividends on dilutive convertible preferred stock and preferred stock that can be tendered to exercise warrants by the weighted-average common shares outstanding plus amounts representing the dilutive effect of stock options outstanding, restricted stock, restricted stock units (RSUs), outstanding warrants and the dilution resulting from the conversion of convertible preferred stock, if applicable. Certain warrants may be exercised, at the option of the holder, through tendering of the Corporation’s 6% Cumulative Perpetual Preferred Stock, Series T (the Series T Preferred Stock) or cash. Because it is currently more economical for the warrant holder to tender the Series T preferred stock, the common shares underlying these warrants are considered outstanding and the dividends on the preferred stock are added to income (loss) allocable to common shareholders in computing diluted EPS, unless the effect is antidilutive.
Unvested share-based payment awards that contain nonforfeitable rights to dividends are participating securities that are included in computing EPS using the two-class method. The two-class method is an earnings allocation formula under which EPS is calculated for common stock and participating securities according to dividends declared and participating rights in undistributed earnings. Under this method, all earnings, distributed and undistributed, are allocated to participating securities and common shares based on their respective rights to receive dividends.
In an exchange of non-convertible preferred stock, income allocated to common shareholders is adjusted for the difference between the carrying value of the preferred stock and the fair value of the consideration exchanged. In an induced conversion of convertible preferred stock, income allocated to common shareholders is reduced by the excess of the fair value of the consideration exchanged over the fair value of the common stock that would have been issued under the original conversion terms.
Foreign Currency Translation
Assets, liabilities and operations of foreign branches and subsidiaries are recorded based on the functional currency of each entity. For certain of the foreign operations, the functional currency is the local currency, in which case the assets, liabilities and operations are translated, for consolidation purposes, from the local currency to the U.S. dollar reporting currency at period-end rates for assets and liabilities and generally at average rates for results of operations. The resulting unrealized gains or losses as well as gains and losses from certain hedges, are reported as a component of accumulated OCI, net-of-tax. When the foreign entity’s functional currency is determined to be the U.S. dollar, the resulting remeasurement currency gains or losses on foreign currency-denominated assets or liabilities are included in earnings.
Credit Card and Deposit Arrangements
Endorsing Organization Agreements
The Corporation contracts with other organizations to obtain their endorsement of the Corporation’s loan and deposit products. This endorsement may provide to the Corporation exclusive rights to market to the organization’s members or to customers on behalf of the Corporation. These organizations endorse the Corporation’s loan and deposit products and provide the Corporation with their mailing lists and marketing activities. These agreements generally have terms that range from two to five years. The Corporation typically pays royalties in exchange for the endorsement. Compensation costs related to the credit card agreements are recorded as contra-revenue in card income.
Cardholder Reward Agreements
The Corporation offers reward programs that allow its cardholders to earn points that can be redeemed for a broad range of rewards including cash, travel and discounted products. The Corporation establishes a rewards liability based upon the points earned that are expected to be redeemed and the average cost per point redeemed. The points to be redeemed are estimated based on past redemption behavior, card product type, account transaction activity and other historical card performance. The liability is reduced as the points are redeemed. The estimated cost of the rewards programs is recorded as contra-revenue in card income.
Insurance Income and Insurance Expense
Property and casualty and credit life and disability premiums are generally recognized over the term of the policies on a pro-rata basis for all policies except for certain of the lender-placed auto insurance and the guaranteed auto protection (GAP) policies. For lender-placed auto insurance, premiums are recognized when collections become probable due to high cancellation rates experienced early in the life of the policy. For GAP insurance, revenue recognition is correlated to the exposure and accelerated over the life of the contract. Mortgage reinsurance premiums are recognized as earned. Insurance expense includes insurance claims, commissions and premium taxes, all of which are recorded in other general operating expense.
Accounting Policies
All significant accounting policies are discussed either in this Note or included in the Notes herein listed below.
|
| |
| Page |
| Note 3 – Derivatives | |
| Note 4 – Securities | |
| Note 5 – Outstanding Loans and Leases | |
| Note 7 – Securitizations and Other Variable Interest Entities | |
| Note 8 – Representations and Warranties Obligations and Corporate Guarantees | |
| Note 13 – Commitments and Contingencies | |
| Note 18 – Employee Benefit Plans | |
| Note 19 – Stock-based Compensation Plans | |
| Note 20 – Income Taxes | |
| Note 21 – Fair Value Measurements | |
| Note 24 – Mortgage Servicing Rights | |
NOTE 2 Trading Account Assets and Liabilities
The table below presents the components of trading account assets and liabilities at December 31, 2012 and 2011.
|
| | | | | | | |
| | | | |
| | December 31 |
| (Dollars in millions) | 2012 | | 2011 |
| Trading account assets | |
| | |
|
U.S. government and agency securities (1) | $ | 86,974 |
| | $ | 52,613 |
|
| Corporate securities, trading loans and other | 37,900 |
| | 36,571 |
|
| Equity securities | 43,315 |
| | 23,674 |
|
| Non-U.S. sovereign debt | 52,197 |
| | 42,946 |
|
| Mortgage trading loans and asset-backed securities | 16,840 |
| | 13,515 |
|
| Total trading account assets | $ | 237,226 |
| | $ | 169,319 |
|
| Trading account liabilities | |
| | |
|
| U.S. government and agency securities | $ | 23,430 |
| | $ | 20,710 |
|
| Equity securities | 22,492 |
| | 14,594 |
|
| Non-U.S. sovereign debt | 20,244 |
| | 17,440 |
|
| Corporate securities and other | 7,421 |
| | 7,764 |
|
| Total trading account liabilities | $ | 73,587 |
| | $ | 60,508 |
|
| |
(1) | Includes $30.6 billion and $27.3 billion of government-sponsored enterprise obligations at December 31, 2012 and 2011. |
NOTE 3 Derivatives
Derivative Balances
Derivatives are entered into on behalf of customers, for trading, or to support risk management activities. Derivatives used in risk management activities include derivatives that may or may not be designated in qualifying hedge accounting relationships. Derivatives that are not designated in qualifying hedge accounting relationships are referred to as other risk management derivatives. For additional information on the Corporation’s derivatives and hedging activities, see Note 1 – Summary of Significant Accounting
Principles. The following tables present derivative instruments included on the Corporation’s Consolidated Balance Sheet in derivative assets and liabilities at December 31, 2012 and 2011. Balances are presented on a gross basis, prior to the application of counterparty and cash collateral netting. Total derivative assets and liabilities are adjusted on an aggregate basis to take into consideration the effects of legally enforceable master netting agreements and have been reduced by the cash collateral received or paid.
|
| | | | | | | | | | | | | | | | | | | | | | | | | | | |
| | | | | | | | | | | | | | |
| | | | December 31, 2012 |
| | | | Gross Derivative Assets | | Gross Derivative Liabilities |
| (Dollars in billions) | Contract/ Notional (1) | | Trading Derivatives and Other Risk Management Derivatives | | Qualifying
Accounting Hedges | | Total | | Trading Derivatives and Other Risk Management Derivatives | | Qualifying
Accounting Hedges | | Total |
| Interest rate contracts | |
| | |
| | |
| | |
| | |
| | |
| | |
|
| Swaps | $ | 34,667.4 |
| | $ | 1,075.4 |
| | $ | 13.8 |
| | $ | 1,089.2 |
| | $ | 1,062.6 |
| | $ | 4.7 |
| | $ | 1,067.3 |
|
| Futures and forwards | 11,950.5 |
| | 2.8 |
| | — |
| | 2.8 |
| | 2.7 |
| | — |
| | 2.7 |
|
| Written options | 2,343.5 |
| | — |
| | — |
| | — |
| | 106.0 |
| | — |
| | 106.0 |
|
| Purchased options | 2,162.6 |
| | 105.5 |
| | — |
| | 105.5 |
| | — |
| | — |
| | — |
|
| Foreign exchange contracts | |
| | |
| | |
| | |
| | |
| | |
| | |
|
| Swaps | 2,489.0 |
| | 47.4 |
| | 1.4 |
| | 48.8 |
| | 53.2 |
| | 1.8 |
| | 55.0 |
|
| Spot, futures and forwards | 3,023.0 |
| | 31.5 |
| | 0.4 |
| | 31.9 |
| | 30.5 |
| | 0.8 |
| | 31.3 |
|
| Written options | 363.3 |
| | — |
| | — |
| | — |
| | 7.3 |
| | — |
| | 7.3 |
|
| Purchased options | 321.8 |
| | 6.5 |
| | — |
| | 6.5 |
| | — |
| | — |
| | — |
|
| Equity contracts | |
| | |
| | |
| | |
| | |
| | |
| | |
|
| Swaps | 127.1 |
| | 1.6 |
| | — |
| | 1.6 |
| | 2.0 |
| | — |
| | 2.0 |
|
| Futures and forwards | 58.4 |
| | 1.0 |
| | — |
| | 1.0 |
| | 1.0 |
| | — |
| | 1.0 |
|
| Written options | 295.3 |
| | — |
| | — |
| | — |
| | 20.2 |
| | — |
| | 20.2 |
|
| Purchased options | 271.0 |
| | 20.4 |
| | — |
| | 20.4 |
| | — |
| | — |
| | — |
|
| Commodity contracts | |
| | |
| | |
| | |
| | |
| | |
| | |
|
| Swaps | 60.5 |
| | 2.5 |
| | 0.1 |
| | 2.6 |
| | 4.0 |
| | — |
| | 4.0 |
|
| Futures and forwards | 498.9 |
| | 4.8 |
| | — |
| | 4.8 |
| | 2.7 |
| | — |
| | 2.7 |
|
| Written options | 166.4 |
| | — |
| | — |
| | — |
| | 7.4 |
| | — |
| | 7.4 |
|
| Purchased options | 168.2 |
| | 7.1 |
| | — |
| | 7.1 |
| | — |
| | — |
| | — |
|
| Credit derivatives | |
| | |
| | |
| | |
| | |
| | |
| | |
|
| Purchased credit derivatives: | |
| | |
| | |
| | |
| | |
| | |
| | |
|
| Credit default swaps | 1,559.5 |
| | 35.6 |
| | — |
| | 35.6 |
| | 22.1 |
| | — |
| | 22.1 |
|
| Total return swaps/other | 43.5 |
| | 2.5 |
| | — |
| | 2.5 |
| | 2.9 |
| | — |
| | 2.9 |
|
| Written credit derivatives: | |
| | |
| | |
| | |
| | |
| | |
| | |
|
| Credit default swaps | 1,531.5 |
| | 23.0 |
| | — |
| | 23.0 |
| | 32.6 |
| | — |
| | 32.6 |
|
| Total return swaps/other | 68.8 |
| | 0.2 |
| | — |
| | 0.2 |
| | 0.3 |
| | — |
| | 0.3 |
|
| Gross derivative assets/liabilities | |
| | $ | 1,367.8 |
| | $ | 15.7 |
| | $ | 1,383.5 |
| | $ | 1,357.5 |
| | $ | 7.3 |
| | $ | 1,364.8 |
|
| Less: Legally enforceable master netting agreements | |
| | |
| | |
| | (1,271.9 | ) | | |
| | |
| | (1,271.9 | ) |
| Less: Cash collateral received/paid | |
| | |
| | |
| | (58.1 | ) | | |
| | |
| | (46.9 | ) |
| Total derivative assets/liabilities | |
| | |
| | |
| | $ | 53.5 |
| | |
| | |
| | $ | 46.0 |
|
| |
(1) | Represents the total contract/notional amount of derivative assets and liabilities outstanding. |
|
| | | | | | | | | | | | | | | | | | | | | | | | | | | |
| | | | | | | | | | | | | | |
| | | | December 31, 2011 |
| | | | Gross Derivative Assets | | Gross Derivative Liabilities |
| (Dollars in billions) | Contract/ Notional (1) | | Trading Derivatives and Other Risk Management Derivatives | | Qualifying
Accounting Hedges | | Total | | Trading Derivatives and Other Risk Management Derivatives | | Qualifying
Accounting Hedges | | Total |
| Interest rate contracts | |
| | |
| | |
| | |
| | |
| | |
| | |
|
| Swaps | $ | 40,473.7 |
| | $ | 1,490.7 |
| | $ | 15.9 |
| | $ | 1,506.6 |
| | $ | 1,473.0 |
| | $ | 12.3 |
| | $ | 1,485.3 |
|
| Futures and forwards | 12,105.8 |
| | 2.9 |
| | 0.2 |
| | 3.1 |
| | 3.4 |
| | — |
| | 3.4 |
|
| Written options | 2,534.0 |
| | — |
| | — |
| | — |
| | 117.8 |
| | — |
| | 117.8 |
|
| Purchased options | 2,467.2 |
| | 120.0 |
| | — |
| | 120.0 |
| | — |
| | — |
| | — |
|
| Foreign exchange contracts | |
| | |
| | |
| | |
| | |
| | |
| | |
|
| Swaps | 2,381.6 |
| | 48.3 |
| | 2.6 |
| | 50.9 |
| | 58.9 |
| | 2.2 |
| | 61.1 |
|
| Spot, futures and forwards | 2,548.8 |
| | 37.2 |
| | 1.3 |
| | 38.5 |
| | 39.2 |
| | 0.3 |
| | 39.5 |
|
| Written options | 368.5 |
| | — |
| | — |
| | — |
| | 9.4 |
| | — |
| | 9.4 |
|
| Purchased options | 341.0 |
| | 9.0 |
| | — |
| | 9.0 |
| | — |
| | — |
| | — |
|
| Equity contracts | |
| | |
| | |
| | |
| | |
| | |
| | |
|
| Swaps | 75.5 |
| | 1.5 |
| | — |
| | 1.5 |
| | 1.7 |
| | — |
| | 1.7 |
|
| Futures and forwards | 52.1 |
| | 1.8 |
| | — |
| | 1.8 |
| | 1.5 |
| | — |
| | 1.5 |
|
| Written options | 367.1 |
| | — |
| | — |
| | — |
| | 17.7 |
| | — |
| | 17.7 |
|
| Purchased options | 360.2 |
| | 19.6 |
| | — |
| | 19.6 |
| | — |
| | — |
| | — |
|
| Commodity contracts | |
| | |
| | |
| | |
| | |
| | |
| | |
|
| Swaps | 73.8 |
| | 4.9 |
| | 0.1 |
| | 5.0 |
| | 5.9 |
| | — |
| | 5.9 |
|
| Futures and forwards | 470.5 |
| | 5.3 |
| | — |
| | 5.3 |
| | 3.2 |
| | — |
| | 3.2 |
|
| Written options | 142.3 |
| | — |
| | — |
| | — |
| | 9.5 |
| | — |
| | 9.5 |
|
| Purchased options | 141.3 |
| | 9.5 |
| | — |
| | 9.5 |
| | — |
| | — |
| | — |
|
| Credit derivatives | |
| | |
| | |
| | |
| | |
| | |
| | |
|
| Purchased credit derivatives: | |
| | |
| | |
| | |
| | |
| | |
| | |
|
| Credit default swaps | 1,944.8 |
| | 95.8 |
| | — |
| | 95.8 |
| | 13.8 |
| | — |
| | 13.8 |
|
| Total return swaps/other | 17.5 |
| | 0.6 |
| | — |
| | 0.6 |
| | 0.3 |
| | — |
| | 0.3 |
|
| Written credit derivatives: | |
| | |
| | |
| | |
| | |
| | |
| | |
|
| Credit default swaps | 1,885.9 |
| | 14.1 |
| | — |
| | 14.1 |
| | 90.5 |
| | — |
| | 90.5 |
|
| Total return swaps/other | 17.8 |
| | 0.5 |
| | — |
| | 0.5 |
| | 0.7 |
| | — |
| | 0.7 |
|
| Gross derivative assets/liabilities | |
| | $ | 1,861.7 |
| | $ | 20.1 |
| | $ | 1,881.8 |
| | $ | 1,846.5 |
| | $ | 14.8 |
| | $ | 1,861.3 |
|
| Less: Legally enforceable master netting agreements | |
| | |
| | |
| | (1,749.9 | ) | | |
| | |
| | (1,749.9 | ) |
| Less: Cash collateral received/paid | |
| | |
| | |
| | (58.9 | ) | | |
| | |
| | (51.9 | ) |
| Total derivative assets/liabilities | |
| | |
| | |
| | $ | 73.0 |
| | |
| | |
| | $ | 59.5 |
|
| |
(1) | Represents the total contract/notional amount of derivative assets and liabilities outstanding. |
ALM and Risk Management Derivatives
The Corporation’s ALM and risk management activities include the use of derivatives to mitigate risk to the Corporation including derivatives designated in qualifying hedge accounting relationships and derivatives used in other risk management activities. Interest rate, foreign exchange, equity, commodity and credit contracts are utilized in the Corporation’s ALM and risk management activities.
The Corporation maintains an overall interest rate risk management strategy that incorporates the use of interest rate contracts, which are generally non-leveraged generic interest rate and basis swaps, options, futures and forwards, to minimize significant fluctuations in earnings that are caused by interest rate volatility. The Corporation’s goal is to manage interest rate sensitivity and volatility so that movements in interest rates do not significantly adversely affect earnings or capital. As a result of interest rate fluctuations, hedged fixed-rate assets and liabilities appreciate or depreciate in fair value. Gains or losses on the derivative instruments that are linked to the hedged fixed-rate assets and liabilities are expected to substantially offset this unrealized appreciation or depreciation.
Market risk, including interest rate risk, can be substantial in the mortgage business. Market risk is the risk that values of mortgage assets or revenues will be adversely affected by changes
in market conditions such as interest rate movements. To mitigate the interest rate risk in mortgage banking production income, the Corporation utilizes forward loan sale commitments and other derivative instruments including purchased options and certain debt securities. The Corporation also utilizes derivatives such as interest rate options, interest rate swaps, forward settlement contracts and Eurodollar futures to hedge certain market risks of MSRs. For additional information on MSRs, see Note 24 – Mortgage Servicing Rights.
The Corporation uses foreign exchange contracts to manage the foreign exchange risk associated with certain foreign currency-denominated assets and liabilities, as well as the Corporation’s investments in non-U.S. subsidiaries. Foreign exchange contracts, which include spot and forward contracts, represent agreements to exchange the currency of one country for the currency of another country at an agreed-upon price on an agreed-upon settlement date. Exposure to loss on these contracts will increase or decrease over their respective lives as currency exchange and interest rates fluctuate.
The Corporation enters into derivative commodity contracts such as futures, swaps, options and forwards as well as non-derivative commodity contracts to provide price risk management services to customers or to manage price risk associated with its physical and financial commodity positions. The non-derivative
commodity contracts and physical inventories of commodities expose the Corporation to earnings volatility. Cash flow and fair value accounting hedges provide a method to mitigate a portion of this earnings volatility.
The Corporation purchases credit derivatives to manage credit risk related to certain funded and unfunded credit exposures. Credit derivatives include credit default swaps (CDS), total return swaps and swaptions. These derivatives are recorded on the Corporation’s Consolidated Balance Sheet at fair value with changes in fair value recorded in other income (loss).
Derivatives Designated as Accounting Hedges
The Corporation uses various types of interest rate, commodity and foreign exchange derivative contracts to protect against changes in the fair value of its assets and liabilities due to fluctuations in interest rates, commodity prices and exchange rates (fair value hedges). The Corporation also uses these types of contracts and equity derivatives to protect against changes in the cash flows of its assets and liabilities, and other forecasted transactions (cash flow hedges). The Corporation hedges its net
investment in consolidated non-U.S. operations determined to have functional currencies other than the U.S. dollar using forward exchange contracts and cross-currency basis swaps, and by issuing foreign currency-denominated debt (net investment hedges).
Fair Value Hedges
The table below summarizes certain information related to fair value hedges for 2012, 2011 and 2010, including hedges of interest rate risk on long-term debt that were acquired as part of a business combination and redesignated. At redesignation, the fair value of the derivatives was negative. As the derivatives mature, the fair value will approach zero. As a result, ineffectiveness may occur and the fair value changes in the derivatives and the long-term debt being hedged may be directionally the same in certain scenarios. Based on a regression analysis, the derivatives continue to be highly effective at offsetting changes in the fair value of the long-term debt attributable to interest rate risk.
|
| | | | | | | | | | | |
| | | |
| Derivatives Designated as Fair Value Hedges | | | | | |
| | | | | | |
| Gains (losses) | 2012 |
| (Dollars in millions) | Derivative | | Hedged Item | | Hedge Ineffectiveness |
Interest rate risk on long-term debt (1) | $ | (195 | ) | | $ | (770 | ) | | $ | (965 | ) |
Interest rate and foreign currency risk on long-term debt (1) | (1,482 | ) | | 1,225 |
| | (257 | ) |
Interest rate risk on AFS securities (2) | (4 | ) | | 91 |
| | 87 |
|
Commodity price risk on commodity inventory (3) | (6 | ) | | 6 |
| | — |
|
| Total | $ | (1,687 | ) | | $ | 552 |
| | $ | (1,135 | ) |
| | | | | | |
| | 2011 |
Interest rate risk on long-term debt (1) | $ | 4,384 |
| | $ | (4,969 | ) | | $ | (585 | ) |
Interest rate and foreign currency risk on long-term debt (1) | 780 |
| | (1,057 | ) | | (277 | ) |
Interest rate risk on AFS securities (2) | (11,386 | ) | | 10,490 |
| | (896 | ) |
Commodity price risk on commodity inventory (3) | 16 |
| | (16 | ) | | — |
|
| Total | $ | (6,206 | ) | | $ | 4,448 |
| | $ | (1,758 | ) |
| | | | | | |
| | 2010 |
Interest rate risk on long-term debt (1) | $ | 2,952 |
| | $ | (3,496 | ) | | $ | (544 | ) |
Interest rate and foreign currency risk on long-term debt (1) | (463 | ) | | 130 |
| | (333 | ) |
Interest rate risk on AFS securities (2) | (2,577 | ) | | 2,667 |
| | 90 |
|
Commodity price risk on commodity inventory (3) | 19 |
| | (19 | ) | | — |
|
| Total | $ | (69 | ) | | $ | (718 | ) | | $ | (787 | ) |
| |
(1) | Amounts are recorded in interest expense on long-term debt and in other income (loss). |
| |
(2) | Amounts are recorded in interest income on debt securities. |
| |
(3) | Amounts relating to commodity inventory are recorded in trading account profits. |
Cash Flow and Net Investment Hedges
The table below summarizes certain information related to cash flow hedges and net investment hedges for 2012, 2011 and 2010. During the next 12 months, net losses in accumulated OCI of $981 million ($618 million after-tax) on derivative instruments that qualify as cash flow hedges are expected to be reclassified into earnings. These net losses reclassified into earnings are expected to primarily reduce net interest income related to the respective hedged items. Amounts related to commodity price risk
reclassified from accumulated OCI are recorded in trading account profits with the underlying hedged item. Amounts related to price risk on restricted stock awards reclassified from accumulated OCI are recorded in personnel expense.
Amounts related to foreign exchange risk recognized in accumulated OCI on derivatives exclude pre-tax losses of $7 million, and pre-tax gains of $82 million and $192 million related to long-term debt designated as a net investment hedge for 2012, 2011 and 2010, respectively.
|
| | | | | | | | | | | |
| | | | | | |
| Derivatives Designated as Cash Flow and Net Investment Hedges | | | | | |
| | | | | | |
| | 2012 |
| (Dollars in millions, amounts pre-tax) | Gains (losses)
Recognized in
Accumulated OCI on Derivatives | | Gains (losses)
in Income
Reclassified from Accumulated OCI | | Hedge
Ineffectiveness and
Amounts Excluded
from Effectiveness Testing (1) |
| Cash flow hedges | |
| | |
| | |
|
| Interest rate risk on variable rate portfolios | $ | 10 |
| | $ | (957 | ) | | $ | — |
|
| Price risk on restricted stock awards | 420 |
| | (78 | ) | | — |
|
| Total | $ | 430 |
| | $ | (1,035 | ) | | $ | — |
|
| Net investment hedges | |
| | |
| | |
|
| Foreign exchange risk | $ | (771 | ) | | $ | (26 | ) | | $ | (269 | ) |
| | | | | | |
| | 2011 |
| Cash flow hedges | |
| | |
| | |
|
| Interest rate risk on variable rate portfolios | $ | (2,079 | ) | | $ | (1,392 | ) | | $ | (8 | ) |
| Commodity price risk on forecasted purchases and sales | (3 | ) | | 6 |
| | (3 | ) |
| Price risk on restricted stock awards | (408 | ) | | (231 | ) | | — |
|
| Total | $ | (2,490 | ) | | $ | (1,617 | ) | | $ | (11 | ) |
| Net investment hedges | |
| | |
| | |
|
| Foreign exchange risk | $ | 1,055 |
| | $ | 384 |
| | $ | (572 | ) |
| | | | | | |
| | 2010 |
| Cash flow hedges | |
| | |
| | |
|
| Interest rate risk on variable rate portfolios | $ | (1,876 | ) | | $ | (410 | ) | | $ | (30 | ) |
| Commodity price risk on forecasted purchases and sales | 32 |
| | 25 |
| | 11 |
|
| Price risk on restricted stock awards | (97 | ) | | (33 | ) | | — |
|
| Price risk on equity investments included in AFS securities | 186 |
| | (226 | ) | | — |
|
| Total | $ | (1,755 | ) | | $ | (644 | ) | | $ | (19 | ) |
| Net investment hedges | |
| | |
| | |
|
| Foreign exchange risk | $ | (482 | ) | | $ | — |
| | $ | (315 | ) |
| |
(1) | Amounts related to derivatives designated as cash flow hedges represent hedge ineffectiveness and amounts related to net investment hedges represent amounts excluded from effectiveness testing. |
The Corporation enters into equity total return swaps to hedge a portion of RSUs granted to certain employees as part of their compensation. Certain awards contain clawback provisions which permit the Corporation to cancel all or a portion of the award under specified circumstances, and certain awards may be settled in cash. These RSUs are accrued as liabilities over the vesting period and adjusted to fair value based on changes in the share price of the Corporation’s common stock. From time to time, the Corporation may enter into equity derivatives to minimize the change in the expense driven by fluctuations in the share price of
the common stock during the vesting period of any RSUs that may be granted, if any, subject to similar or other terms and conditions. Certain of these derivatives are designated as cash flow hedges of unrecognized unvested awards with changes in fair value of the hedge recorded in accumulated OCI and reclassified into earnings in the same period as the RSUs affect earnings. The remaining derivatives are other risk management derivatives and changes in fair value are recorded in personnel expense. For more information on RSUs and related hedges, see Note 19 – Stock-based Compensation Plans.
Other Risk Management Derivatives
Other risk management derivatives are used by the Corporation to reduce certain risk exposures. These derivatives are not qualifying accounting hedges because either they did not qualify for or were not designated as accounting hedges. The table below presents gains (losses) on these derivatives for 2012, 2011 and 2010. These gains (losses) are largely offset by the income or expense that is recorded on the hedged item.
|
| | | | | | | | | | | |
| | | | | | |
| Other Risk Management Derivatives | | | | | |
| | | | | | |
| Gains (losses) | | | | | |
| | | | | | |
| (Dollars in millions) | 2012 | | 2011 | | 2010 |
Price risk on mortgage banking production income (1, 2) | $ | 3,022 |
| | $ | 2,852 |
| | $ | 9,109 |
|
Market-related risk on mortgage banking servicing income (1) | 2,000 |
| | 3,612 |
| | 3,878 |
|
Credit risk on loans (3) | (95 | ) | | 30 |
| | (121 | ) |
Interest rate and foreign currency risk on long-term debt and other foreign exchange transactions (4) | 424 |
| | (48 | ) | | (2,080 | ) |
Price risk on restricted stock awards (5) | 1,008 |
| | (610 | ) | | (151 | ) |
| Other | 58 |
| | 281 |
| | 42 |
|
| Total | $ | 6,417 |
| | $ | 6,117 |
| | $ | 10,677 |
|
| |
(1) | Net gains on these derivatives are recorded in mortgage banking income (loss). |
| |
(2) | Includes net gains on interest rate lock commitments related to the origination of mortgage loans that are held-for-sale, which are considered derivative instruments, of $3.0 billion, $3.8 billion and $8.7 billion for 2012, 2011 and 2010, respectively. |
| |
(3) | Net gains (losses) on these derivatives are recorded in other income (loss). |
| |
(4) | The majority of the balance is related to the revaluation of derivatives used to mitigate risk related to foreign currency-denominated debt which is recorded in other income (loss). The offsetting revaluation of the foreign currency-denominated debt, while not included in the table above, is also recorded in other income (loss). |
| |
(5) | Gains (losses) on these derivatives are recorded in personnel expense. |
Sales and Trading Revenue
The Corporation enters into trading derivatives to facilitate client transactions, for principal trading purposes, and to manage risk exposures arising from trading account assets and liabilities. It is the Corporation’s policy to include these derivative instruments in its trading activities which include derivatives and non-derivative cash instruments. The resulting risk from these derivatives is managed on a portfolio basis as part of the Corporation’s Global Markets business segment. The related sales and trading revenue generated within Global Markets is recorded in various income statement line items including trading account profits and net interest income as well as other revenue categories. However, the majority of income related to derivative instruments is recorded in trading account profits.
Sales and trading revenue includes changes in the fair value and realized gains and losses on the sales of trading and other assets, net interest income, and fees primarily from commissions on equity securities. Revenue is generated by the difference in the client price for an instrument and the price at which the trading
desk can execute the trade in the dealer market. For equity securities, commissions related to purchases and sales are recorded in other income (loss). Changes in the fair value of these securities are included in trading account profits. For debt securities, revenue, with the exception of interest associated with the debt securities, is typically included in trading account profits. Unlike commissions for equity securities, the initial revenue related to broker/dealer services for debt securities is typically included in the pricing of the instrument rather than being charged through separate fee arrangements. Therefore, this revenue is recorded in trading account profits as part of the initial mark to fair value. For derivatives, all revenue is included in trading account profits. In transactions where the Corporation acts as agent, which include exchange-traded futures and options, fees are recorded in other income (loss).
Gains (losses) on certain instruments, primarily loans, that the Global Markets business segment shares with Global Banking are not considered trading instruments and are excluded from sales and trading revenue in their entirety.
The table below, which includes both derivatives and non-derivative cash instruments, identifies the amounts in the respective income statement line items attributable to the Corporation’s sales and trading revenue in Global Markets, categorized by primary risk, for 2012, 2011 and 2010. The difference between total trading account profits in the table below
and in the Corporation’s Consolidated Statement of Income represents trading activities in business segments other than Global Markets. Global Markets results inNote 26 – Business Segment Information are presented on a fully taxable-equivalent (FTE) basis. The table below is not presented on a FTE basis.
|
| | | | | | | | | | | | | | | |
| | | | | | | | |
| Sales and Trading Revenue | | | | | | | |
| | | | | | | | |
| | 2012 |
| (Dollars in millions) | Trading Account Profits | | Net Interest Income | | Other (1) | | Total |
| Interest rate risk | $ | 580 |
| | $ | 1,040 |
| | $ | (5 | ) | | $ | 1,615 |
|
| Foreign exchange risk | 909 |
| | 5 |
| | 7 |
| | 921 |
|
| Equity risk | 1,181 |
| | (57 | ) | | 1,890 |
| | 3,014 |
|
| Credit risk | 2,496 |
| | 2,321 |
| | 961 |
| | 5,778 |
|
| Other risk | 540 |
| | (219 | ) | | (42 | ) | | 279 |
|
| Total sales and trading revenue | $ | 5,706 |
| | $ | 3,090 |
| | $ | 2,811 |
| | $ | 11,607 |
|
| | | | | | | | |
| | 2011 |
| Interest rate risk | $ | 2,118 |
| | $ | 923 |
| | $ | (63 | ) | | $ | 2,978 |
|
| Foreign exchange risk | 1,088 |
| | 8 |
| | (10 | ) | | 1,086 |
|
| Equity risk | 1,482 |
| | 128 |
| | 2,346 |
| | 3,956 |
|
| Credit risk | 1,096 |
| | 2,604 |
| | 553 |
| | 4,253 |
|
| Other risk | 633 |
| | (184 | ) | | (72 | ) | | 377 |
|
| Total sales and trading revenue | $ | 6,417 |
| | $ | 3,479 |
| | $ | 2,754 |
| | $ | 12,650 |
|
| | | | | | | | |
| | 2010 |
| Interest rate risk | $ | 2,032 |
| | $ | 659 |
| | $ | 38 |
| | $ | 2,729 |
|
| Foreign exchange risk | 903 |
| | — |
| | (9 | ) | | 894 |
|
| Equity risk | 1,650 |
| | 16 |
| | 2,447 |
| | 4,113 |
|
| Credit risk | 4,592 |
| | 3,557 |
| | 266 |
| | 8,415 |
|
| Other risk | 447 |
| | (172 | ) | | (4 | ) | | 271 |
|
| Total sales and trading revenue | $ | 9,624 |
| | $ | 4,060 |
| | $ | 2,738 |
| | $ | 16,422 |
|
| |
(1) | Represents amounts in investment and brokerage services and other income (loss) that are recorded in Global Markets and included in the definition of sales and trading revenue. Includes investment and brokerage services revenue of $1.8 billion, $2.2 billion and $2.3 billion for 2012, 2011 and 2010, respectively, primarily included in equity risk. |
Credit Derivatives
The Corporation enters into credit derivatives primarily to facilitate client transactions and to manage credit risk exposures. Credit derivatives derive value based on an underlying third-party referenced obligation or a portfolio of referenced obligations and generally require the Corporation, as the seller of credit protection, to make payments to a buyer upon the occurrence of a pre-defined credit event. Such credit events generally include bankruptcy of
the referenced credit entity and failure to pay under the obligation, as well as acceleration of indebtedness and payment repudiation or moratorium. For credit derivatives based on a portfolio of referenced credits or credit indices, the Corporation may not be required to make payment until a specified amount of loss has occurred and/or may only be required to make payment up to a specified amount.
Credit derivative instruments where the Corporation is the seller of credit protection and their expiration are summarized at December 31, 2012 and 2011 in the table below. These instruments are classified as investment and non-investment grade based on the credit quality of the underlying referenced obligation. The Corporation considers ratings of BBB- or higher as investment grade. Non-investment grade includes non-rated credit derivative instruments.
|
| | | | | | | | | | | | | | | | | | | |
| | | | | | | | | | |
| Credit Derivative Instruments | |
| | |
| | December 31, 2012 |
| | Carrying Value |
| (Dollars in millions) | Less than One Year | | One to Three Years | | Three to Five Years | | Over Five Years | | Total |
| Credit default swaps: | |
| | |
| | |
| | |
| | |
|
| Investment grade | $ | 52 |
| | $ | 757 |
| | $ | 5,595 |
| | $ | 2,903 |
| | $ | 9,307 |
|
| Non-investment grade | 923 |
| | 4,403 |
| | 7,030 |
| | 10,959 |
| | 23,315 |
|
| Total | 975 |
| | 5,160 |
| | 12,625 |
| | 13,862 |
| | 32,622 |
|
| Total return swaps/other: | |
| | |
| | |
| | |
| | |
|
| Investment grade | 39 |
| | — |
| | — |
| | — |
| | 39 |
|
| Non-investment grade | 57 |
| | 104 |
| | 39 |
| | 37 |
| | 237 |
|
| Total | 96 |
| | 104 |
| | 39 |
| | 37 |
| | 276 |
|
| Total credit derivatives | $ | 1,071 |
| | $ | 5,264 |
| | $ | 12,664 |
| | $ | 13,899 |
| | $ | 32,898 |
|
Credit-related notes: (1) | |
| | |
| | |
| | |
| | |
|
| Investment grade | $ | 4 |
| | $ | 12 |
| | $ | 441 |
| | $ | 3,849 |
| | $ | 4,306 |
|
| Non-investment grade | 116 |
| | 161 |
| | 314 |
| | 1,425 |
| | 2,016 |
|
| Total credit-related notes | $ | 120 |
| | $ | 173 |
| | $ | 755 |
| | $ | 5,274 |
| | $ | 6,322 |
|
| | Maximum Payout/Notional |
| Credit default swaps: | |
| | |
| | |
| | |
| | |
|
| Investment grade | $ | 260,177 |
| | $ | 349,125 |
| | $ | 500,038 |
| | $ | 90,453 |
| | $ | 1,199,793 |
|
| Non-investment grade | 79,861 |
| | 99,043 |
| | 110,248 |
| | 42,559 |
| | 331,711 |
|
| Total | 340,038 |
| | 448,168 |
| | 610,286 |
| | 133,012 |
| | 1,531,504 |
|
| Total return swaps/other: | |
| | |
| | |
| | |
| | |
|
| Investment grade | 43,536 |
| | 15 |
| | — |
| | — |
| | 43,551 |
|
| Non-investment grade | 5,566 |
| | 11,028 |
| | 7,631 |
| | 1,035 |
| | 25,260 |
|
| Total | 49,102 |
| | 11,043 |
| | 7,631 |
| | 1,035 |
| | 68,811 |
|
| Total credit derivatives | $ | 389,140 |
| | $ | 459,211 |
| | $ | 617,917 |
| | $ | 134,047 |
| | $ | 1,600,315 |
|
|
| | | | | | | | | | | | | | | | | | | |
| | December 31, 2011 |
| (Dollars in millions) | Carrying Value |
| Credit default swaps: | |
| | |
| | |
| | |
| | |
|
| Investment grade | $ | 795 |
| | $ | 5,011 |
| | $ | 17,271 |
| | $ | 7,325 |
| | $ | 30,402 |
|
| Non-investment grade | 4,236 |
| | 11,438 |
| | 18,072 |
| | 26,339 |
| | 60,085 |
|
| Total | 5,031 |
| | 16,449 |
| | 35,343 |
| | 33,664 |
| | 90,487 |
|
| Total return swaps/other: | |
| | |
| | |
| | |
| | |
|
| Investment grade | — |
| | — |
| | 30 |
| | 1 |
| | 31 |
|
| Non-investment grade | 522 |
| | 2 |
| | 33 |
| | 128 |
| | 685 |
|
| Total | 522 |
| | 2 |
| | 63 |
| | 129 |
| | 716 |
|
| Total credit derivatives | $ | 5,553 |
| | $ | 16,451 |
| | $ | 35,406 |
| | $ | 33,793 |
| | $ | 91,203 |
|
Credit-related notes: (1) | |
| | |
| | |
| | |
| | |
|
| Investment grade | $ | — |
| | $ | 7 |
| | $ | 208 |
| | $ | 2,947 |
| | $ | 3,162 |
|
| Non-investment grade | 127 |
| | 85 |
| | 132 |
| | 1,732 |
| | 2,076 |
|
| Total credit-related notes | $ | 127 |
| | $ | 92 |
| | $ | 340 |
| | $ | 4,679 |
| | $ | 5,238 |
|
| | Maximum Payout/Notional |
| Credit default swaps: | |
| | |
| | |
| | |
| | |
|
| Investment grade | $ | 182,137 |
| | $ | 401,914 |
| | $ | 477,924 |
| | $ | 127,570 |
| | $ | 1,189,545 |
|
| Non-investment grade | 133,624 |
| | 228,327 |
| | 186,522 |
| | 147,926 |
| | 696,399 |
|
| Total | 315,761 |
| | 630,241 |
| | 664,446 |
| | 275,496 |
| | 1,885,944 |
|
| Total return swaps/other: | |
| | |
| | |
| | |
| | |
|
| Investment grade | — |
| | — |
| | 9,116 |
| | — |
| | 9,116 |
|
| Non-investment grade | 305 |
| | 2,023 |
| | 4,918 |
| | 1,476 |
| | 8,722 |
|
| Total | 305 |
| | 2,023 |
| | 14,034 |
| | 1,476 |
| | 17,838 |
|
| Total credit derivatives | $ | 316,066 |
| | $ | 632,264 |
| | $ | 678,480 |
| | $ | 276,972 |
| | $ | 1,903,782 |
|
| |
(1) | For credit-related notes, maximum payout/notional is the same as carrying value. |
The notional amount represents the maximum amount payable by the Corporation for most credit derivatives. However, the Corporation does not monitor its exposure to credit derivatives based solely on the notional amount because this measure does not take into consideration the probability of occurrence. As such, the notional amount is not a reliable indicator of the Corporation’s exposure to these contracts. Instead, a risk framework is used to define risk tolerances and establish limits to help ensure that certain credit risk-related losses occur within acceptable, predefined limits.
The Corporation manages its market risk exposure to credit derivatives by entering into a variety of offsetting derivative contracts and security positions. For example, in certain instances, the Corporation may purchase credit protection with identical underlying referenced names to offset its exposure. The carrying value and notional amount of written credit derivatives for which the Corporation held purchased credit derivatives with identical underlying referenced names and terms at December 31, 2012 was $20.7 billion and $1.1 trillion compared to $48.0 billion and $1.0 trillion at December 31, 2011.
Credit-related notes in the table on page 180 include investments in securities issued by CDO, collateralized loan obligation (CLO) and credit-linked note vehicles. These instruments are primarily classified as trading securities. The carrying value of these instruments equals the Corporation’s maximum exposure to loss. The Corporation is not obligated to make any payments to the entities under the terms of the securities owned. The Corporation discloses internal categorizations of investment grade and non-investment grade consistent with how risk is managed for these instruments.
Credit-related Contingent Features and Collateral
The Corporation executes the majority of its derivative contracts in the OTC market with large, international financial institutions, including broker/dealers and, to a lesser degree, with a variety of non-financial companies. Substantially all of the derivative transactions are executed on a daily margin basis. Therefore, events such as a credit rating downgrade (depending on the ultimate rating level) or a breach of credit covenants would typically require an increase in the amount of collateral required of the counterparty, where applicable, and/or allow the Corporation to take additional protective measures such as early termination of all trades. Further, as previously discussed on page 174, the Corporation enters into legally enforceable master netting agreements which reduce risk by permitting the closeout and netting of transactions with the same counterparty upon the occurrence of certain events.
A majority of the Corporation’s derivative contracts contain credit risk related contingent features, primarily in the form of International Swaps and Derivatives Association, Inc. (ISDA) master netting agreements and credit support documentation that enhance the creditworthiness of these instruments compared to other obligations of the respective counterparty with whom the Corporation has transacted. These contingent features may be for the benefit of the Corporation as well as its counterparties with respect to changes in the Corporation’s creditworthiness and the mark-to-market exposure under the derivative transactions. At December 31, 2012 and 2011, the Corporation held cash and securities collateral of $85.6 billion and $87.7 billion, and posted cash and securities collateral of $74.1 billion and $86.5 billion in the normal course of business under derivative agreements.
In connection with certain OTC derivative contracts and other trading agreements, the Corporation can be required to provide additional collateral or to terminate transactions with certain counterparties in the event of a downgrade of the senior debt ratings of the Corporation or certain subsidiaries. The amount of additional collateral required depends on the contract and is usually a fixed incremental amount and/or the market value of the exposure.
At December 31, 2012, the amount of collateral, calculated based on the terms of the contracts, that the Corporation and certain subsidiaries could be required to post to counterparties but had not yet posted to counterparties was approximately $2.2 billion, comprised of $721 million for BANA and $1.5 billion for Merrill Lynch & Co., Inc. (Merrill Lynch) and certain of its subsidiaries.
Some counterparties are currently able to unilaterally terminate certain contracts, or the Corporation or certain subsidiaries may be required to take other action such as find a suitable replacement or obtain a guarantee. At December 31, 2012, the current liability recorded for these derivative contracts was $1.7 billion, against which the Corporation and certain subsidiaries had posted approximately $1.6 billion of collateral.
At December 31, 2012, if the rating agencies had downgraded their long-term senior debt ratings for the Corporation or certain subsidiaries by one incremental notch, the amount of additional collateral contractually required by derivative contracts and other trading agreements would have been approximately$3.3 billioncomprised of$2.9 billionfor BANA and$418 millionfor Merrill Lynch and certain of its subsidiaries. If the agencies had downgraded their long-term senior debt ratings for these entities by a second incremental notch, approximately$4.4 billionin additional incremental collateral comprised of$455 millionfor BANA and$4.0 billionfor Merrill Lynch and certain of its subsidiaries would have been required.
Also, if the rating agencies had downgraded their long-term senior debt ratings for the Corporation or certain subsidiaries by one incremental notch, the derivative liability that would be subject to unilateral termination by counterparties as ofDecember 31, 2012was$3.8 billion, against which$3.0 billionof collateral has been posted. If the rating agencies had downgraded their long-term senior debt ratings for the Corporation and certain subsidiaries by a second incremental notch, the derivative liability that would be subject to unilateral termination by counterparties as ofDecember 31, 2012was an incremental$1.7 billion, against which$1.1 billionof collateral has been posted.
Valuation Adjustments on Derivatives
The Corporation records credit risk valuation adjustments on derivatives in order to properly reflect the credit quality of the counterparties and its own credit quality. The Corporation calculates valuation adjustments on derivatives based on a modeled expected exposure that incorporates current market risk factors. The exposure also takes into consideration credit mitigants such as enforceable master netting agreements and collateral. CDS spread data is used to estimate the default probabilities and severities that are applied to the exposures. Where no observable credit default data is available for counterparties, the Corporation uses proxies and other market data to estimate default probabilities and severity.
Valuation adjustments on derivatives are affected by changes in market spreads, non-credit related market factors such as
interest rate and currency changes that affect the expected exposure, and other factors like changes in collateral arrangements and partial payments. Credit spread changes and non-credit factors can move independently. For example, for an interest rate swap, changes in interest rates may increase the expected exposure which would increase the counterparty credit valuation adjustment (CVA). Independently, counterparty credit spreads may tighten, which would result in an offsetting decrease to CVA.
The Corporation may enter into risk management activities to offset market driven exposures. The Corporation often hedges the counterparty spread risk in CVA with CDS and often hedges the other market risks in both CVA and debit valuation adjustments (DVA) primarily with currency and interest rate swaps. Since the components of the valuation adjustments on derivatives move independently and the Corporation may not hedge all of the market driven exposures, the effect of a hedge may increase the gross valuation adjustments on derivatives or may result in a gross positive valuation adjustment on derivatives becoming a negative adjustment (or the reverse).
During 2012, the Corporation refined its methodology for calculating valuation adjustments on derivatives on a prospective basis. The Corporation no longer considers the probability of default for both the counterparty and the Corporation when calculating the counterparty CVA and DVA and now only considers the probability of the counterparty defaulting for CVA and the Corporation defaulting for DVA.
The table below presents CVA and DVA gains (losses) for the Corporation on a gross and net of hedge basis, which are recorded in trading account profits.
|
| | | | | | | | | | | | | |
| | | | | | |
| Valuation Adjustments on Derivatives |
| | | | | | |
| | 2012 | | 2011 |
| (Dollars in millions) | Gross | Net | | Gross | Net |
Derivative assets (CVA) (1) | $ | 1,022 |
| $ | 291 |
| | $ | (1,863 | ) | $ | (606 | ) |
Derivative liabilities (DVA) (2) | (2,212 | ) | (2,477 | ) | | 1,385 |
| 1,000 |
|
| |
(1) | At December 31, 2012 and 2011, the cumulative CVA reduced the derivative assets balance by $2.4 billion and $2.8 billion. |
| |
(2) | At December 31, 2012 and 2011, the Corporation’s cumulative DVA reduced the derivative liabilities balance by $807 million and $2.4 billion. |
NOTE 4 Securities
The table below presents the amortized cost, gross unrealized gains and losses, and fair value of debt and marketable equity securities at December 31, 2012 and 2011.
|
| | | | | | | | | | | | | | | |
| | | | | | | | |
| | December 31, 2012 |
| (Dollars in millions) | Amortized Cost | | Gross
Unrealized Gains | | Gross
Unrealized Losses | | Fair Value |
| Available-for-sale debt securities | | | | | | | |
| U.S. Treasury and agency securities | $ | 24,232 |
| | $ | 324 |
| | $ | (84 | ) | | $ | 24,472 |
|
| Mortgage-backed securities: | | | | | | | |
|
| Agency | 183,247 |
| | 5,048 |
| | (146 | ) | | 188,149 |
|
| Agency-collateralized mortgage obligations | 36,329 |
| | 1,427 |
| | (218 | ) | | 37,538 |
|
Non-agency residential (1) | 9,231 |
| | 391 |
| | (128 | ) | | 9,494 |
|
| Non-agency commercial | 3,576 |
| | 348 |
| | — |
| | 3,924 |
|
| Non-U.S. securities | 5,574 |
| | 50 |
| | (6 | ) | | 5,618 |
|
| Corporate/Agency bonds | 1,415 |
| | 51 |
| | (16 | ) | | 1,450 |
|
| Other taxable securities, substantially all asset-backed securities | 12,089 |
| | 54 |
| | (15 | ) | | 12,128 |
|
| Total taxable securities | 275,693 |
| | 7,693 |
| | (613 | ) | | 282,773 |
|
| Tax-exempt securities | 4,167 |
| | 13 |
| | (47 | ) | | 4,133 |
|
| Total available-for-sale debt securities | 279,860 |
| | 7,706 |
| | (660 | ) | | 286,906 |
|
| Held-to-maturity debt securities, substantially all U.S. agency mortgage-backed securities | 49,481 |
| | 815 |
| | (26 | ) | | 50,270 |
|
| Total debt securities | $ | 329,341 |
| | $ | 8,521 |
| | $ | (686 | ) | | $ | 337,176 |
|
Available-for-sale marketable equity securities (2) | $ | 780 |
| | $ | 732 |
| | $ | — |
| | $ | 1,512 |
|
| | | | | | | | |
| | December 31, 2011 |
| Available-for-sale debt securities | | | | | | | |
| U.S. Treasury and agency securities | $ | 43,433 |
| | $ | 242 |
| | $ | (811 | ) | | $ | 42,864 |
|
| Mortgage-backed securities: | |
| | |
| | |
| | |
|
| Agency | 138,073 |
| | 4,511 |
| | (21 | ) | | 142,563 |
|
| Agency-collateralized mortgage obligations | 44,392 |
| | 774 |
| | (167 | ) | | 44,999 |
|
Non-agency residential (1) | 14,948 |
| | 301 |
| | (482 | ) | | 14,767 |
|
| Non-agency commercial | 4,894 |
| | 629 |
| | (1 | ) | | 5,522 |
|
| Non-U.S. securities | 4,872 |
| | 62 |
| | (14 | ) | | 4,920 |
|
| Corporate/Agency bonds | 2,993 |
| | 79 |
| | (37 | ) | | 3,035 |
|
| Other taxable securities, substantially all asset-backed securities | 12,889 |
| | 49 |
| | (60 | ) | | 12,878 |
|
| Total taxable securities | 266,494 |
| | 6,647 |
| | (1,593 | ) | | 271,548 |
|
| Tax-exempt securities | 4,678 |
| | 15 |
| | (90 | ) | | 4,603 |
|
| Total available-for-sale debt securities | 271,172 |
| | 6,662 |
| | (1,683 | ) | | 276,151 |
|
| Held-to-maturity debt securities, substantially all U.S. agency mortgage-backed securities | 35,265 |
| | 181 |
| | (4 | ) | | 35,442 |
|
| Total debt securities | $ | 306,437 |
| | $ | 6,843 |
| | $ | (1,687 | ) | | $ | 311,593 |
|
Available-for-sale marketable equity securities (2) | $ | 65 |
| | $ | 10 |
| | $ | (7 | ) | | $ | 68 |
|
| |
(1) | At December 31, 2012 and 2011, includes approximately 91 percent and 89 percent prime, six percent and nine percent Alt-A, and three percent and two percent subprime. |
| |
(2) | Classified in other assets on the Corporation’s Consolidated Balance Sheet. |
At December 31, 2012, the accumulated net unrealized gains on AFS debt securities included in accumulated OCI were $4.4 billion, net of the related income tax expense of $2.6 billion. At December 31, 2012 and 2011, the Corporation had nonperforming AFS debt securities of $91 million and $140 million.
The Corporation recorded OTTI losses on AFS debt securities for 2012, 2011 and 2010 as presented in the table below. A debt security is impaired when its fair value is less than its amortized cost. If the Corporation intends or will more-likely-than-not be required to sell the debt securities prior to recovery, the entire impairment loss is recorded in the Corporation’s Consolidated Statement of Income. For debt securities the Corporation does not intend or will not more-likely-than-not be required to sell, an
analysis is performed to determine if any of the impairment is due to credit or whether it is due to other factors (e.g., interest rate). Credit losses are considered unrecoverable and are recorded in the Corporation’s Consolidated Statement of Income with the remaining unrealized losses recorded in accumulated OCI. In certain instances, the credit loss on a debt security may exceed the total impairment, in which case, the portion of the credit loss that exceeds the total impairment is recorded as an unrealized gain in accumulated OCI. Balances in the table below exclude $5 million, $9 million and $51 million of unrealized gains recorded in accumulated OCI related to these securities for 2012, 2011 and 2010, respectively.
|
| | | | | | | | | | | | | | | | | | | | | | | |
| | | | | | | | | | | | |
| Net Impairment Losses Recognized in Earnings | | | | | | |
| | | | | | | | | | | | |
| | 2012 |
| (Dollars in millions) | Non-agency
Residential
MBS | | Non-agency
Commercial
MBS | | Non-U.S.
Securities | | Corporate
Bonds | | Other
Taxable
Securities | | Total |
| Total OTTI losses (unrealized and realized) | $ | (50 | ) | | $ | (7 | ) | | $ | — |
| | $ | — |
| | $ | — |
| | $ | (57 | ) |
| Unrealized OTTI losses recognized in accumulated OCI | 4 |
| | — |
| | — |
| | — |
| | — |
| | 4 |
|
| Net impairment losses recognized in earnings | $ | (46 | ) | | $ | (7 | ) | | $ | — |
| | $ | — |
| | $ | — |
| | $ | (53 | ) |
| | | | | | | | | | | | |
| | 2011 |
| Total OTTI losses (unrealized and realized) | $ | (348 | ) | | $ | (10 | ) | | $ | — |
| | $ | — |
| | $ | (2 | ) | | $ | (360 | ) |
| Unrealized OTTI losses recognized in accumulated OCI | 61 |
| | — |
| | — |
| | — |
| | — |
| | 61 |
|
| Net impairment losses recognized in earnings | $ | (287 | ) | | $ | (10 | ) | | $ | — |
| | $ | — |
| | $ | (2 | ) | | $ | (299 | ) |
| | | | | | | | | | | | |
| | 2010 |
| Total OTTI losses (unrealized and realized) | $ | (1,305 | ) | | $ | (19 | ) | | $ | (276 | ) | | $ | (6 | ) | | $ | (568 | ) | | $ | (2,174 | ) |
| Unrealized OTTI losses recognized in accumulated OCI | 817 |
| | 15 |
| | 16 |
| | 2 |
| | 357 |
| | 1,207 |
|
| Net impairment losses recognized in earnings | $ | (488 | ) | | $ | (4 | ) | | $ | (260 | ) | | $ | (4 | ) | | $ | (211 | ) | | $ | (967 | ) |
The Corporation’s net impairment losses recognized in earnings consist of write-downs to fair value on AFS securities the Corporation has the intent to sell or will more-likely-than-not be required to sell and all credit losses. The table below presents a
rollforward of the credit losses recognized in earnings in 2012, 2011 and 2010 on AFS debt securities that the Corporation does not have the intent to sell or will not more-likely-than-not be required to sell.
|
| | | | | | | | | | | |
| | | | | | |
| Rollforward of Credit Losses Recognized | | | | |
| | | | | | |
| (Dollars in millions) | 2012 | | 2011 | | 2010 |
|
| Balance, January 1 | $ | 310 |
| | $ | 2,148 |
| | $ | 3,155 |
|
| Additions for credit losses recognized on debt securities that had no previous impairment losses | 7 |
| | 72 |
| | 487 |
|
| Additions for credit losses recognized on debt securities that had previously incurred impairment losses | 46 |
| | 149 |
| | 421 |
|
| Reductions for debt securities sold or intended to be sold | (120 | ) | | (2,059 | ) | | (1,915 | ) |
| Balance, December 31 | $ | 243 |
| | $ | 310 |
| | $ | 2,148 |
|
The Corporation estimates the portion of a loss on a security that is attributable to credit using a discounted cash flow model and estimates the expected cash flows of the underlying collateral using internal credit, interest rate and prepayment risk models that incorporate management’s best estimate of current key assumptions such as default rates, loss severity and prepayment rates. Assumptions used for the underlying loans that support the MBS can vary widely from loan to loan and are influenced by such
factors as loan interest rate, geographic location of the borrower, borrower characteristics and collateral type. Based on these assumptions, the Corporation then determines how the underlying collateral cash flows will be distributed to each MBS issued from the applicable special purpose entity. Expected principal and interest cash flows on an impaired AFS debt security are discounted using the effective yield of each individual impaired AFS debt security.
Significant assumptions used in estimating the expected cash flows for measuring credit losses on non-agency residential mortgage-backed securities (RMBS) were as follows at December 31, 2012.
|
| | | | | | | | |
| | | | | | |
| Significant Assumptions |
| | | | | | |
| | | | Range (1) |
| | Weighted- average | | 10th Percentile (2) | | 90th Percentile (2) |
| Prepayment speed | 12.9 | % | | 3.1 | % | | 29.7 | % |
| Loss severity | 49.5 |
| | 24.2 |
| | 63.1 |
|
| Life default rate | 52.4 |
| | 2.4 |
| | 98.2 |
|
| |
(1) | Represents the range of inputs/assumptions based upon the underlying collateral. |
| |
(2) | The value of a variable below which the indicated percentile of observations will fall. |
Annual constant prepayment speed and loss severity rates are projected considering collateral characteristics such as LTV, creditworthiness of borrowers as measured using FICO scores and geographic concentrations. The weighted-average severity by collateral type was 45.8 percent for prime, 50.6 percent for Alt-A and 55.9 percent for subprime at December 31, 2012. Additionally, default rates are projected by considering collateral characteristics including, but not limited to, LTV, FICO and geographic concentration. Weighted-average life default rates by collateral type were 39.5 percent for prime, 63.5 percent for Alt-A and 41.8 percent for subprime at December 31, 2012.
The table below presents the fair value and the associated gross unrealized losses on AFS securities with gross unrealized losses at December 31, 2012 and 2011, and whether these securities have had gross unrealized losses for less than twelve months or for twelve months or longer.
|
| | | | | | | | | | | | | | | | | | | | | | | |
| | | | | | | | | | | | |
| Temporarily Impaired and Other-than-temporarily Impaired Securities | | | | | | |
| | | | | | | | | | | | |
| | December 31, 2012 |
| | Less than Twelve Months | | Twelve Months or Longer | | Total |
| (Dollars in millions) | Fair Value | | Gross Unrealized Losses | | Fair Value | | Gross Unrealized Losses | | Fair Value | | Gross Unrealized Losses |
| Temporarily impaired available-for-sale debt securities | |
| | |
| | |
| | |
| | |
| | |
|
| U.S. Treasury and agency securities | $ | — |
| | $ | — |
| | $ | 5,608 |
| | $ | (84 | ) | | $ | 5,608 |
| | $ | (84 | ) |
| Mortgage-backed securities: | | | | | | | | | | | |
| Agency | 15,593 |
| | (133 | ) | | 735 |
| | (13 | ) | | 16,328 |
| | (146 | ) |
| Agency-collateralized mortgage obligations | 5,135 |
| | (121 | ) | | 4,994 |
| | (97 | ) | | 10,129 |
| | (218 | ) |
| Non-agency residential | 592 |
| | (13 | ) | | 1,555 |
| | (110 | ) | | 2,147 |
| | (123 | ) |
| Non-U.S. securities | 1,715 |
| | (1 | ) | | 563 |
| | (5 | ) | | 2,278 |
| | (6 | ) |
| Corporate/Agency bonds | — |
| | — |
| | 277 |
| | (16 | ) | | 277 |
| | (16 | ) |
| Other taxable securities | 1,678 |
| | (1 | ) | | 1,436 |
| | (14 | ) | | 3,114 |
| | (15 | ) |
| Total taxable securities | 24,713 |
| | (269 | ) | | 15,168 |
| | (339 | ) | | 39,881 |
| | (608 | ) |
| Tax-exempt securities | 1,609 |
| | (9 | ) | | 1,072 |
| | (38 | ) | | 2,681 |
| | (47 | ) |
| Total temporarily impaired available-for-sale debt securities | 26,322 |
| | (278 | ) | | 16,240 |
| | (377 | ) | | 42,562 |
| | (655 | ) |
Other-than-temporarily impaired available-for-sale debt securities (1) | | | | | | | | | | | |
| Non-agency residential mortgage-backed securities | 14 |
| | (1 | ) | | 74 |
| | (4 | ) | | 88 |
| | (5 | ) |
Total temporarily impaired and other-than-temporarily impaired available-for-sale securities (2) | $ | 26,336 |
| | $ | (279 | ) | | $ | 16,314 |
| | $ | (381 | ) | | $ | 42,650 |
| | $ | (660 | ) |
| | | | | | | | | | | | |
| | December 31, 2011 |
| Temporarily impaired available-for-sale debt securities | | | | | | | | | | | |
| U.S. Treasury and agency securities | $ | — |
| | $ | — |
| | $ | 38,269 |
| | $ | (811 | ) | | $ | 38,269 |
| | $ | (811 | ) |
| Mortgage-backed securities: | | | | | | | | | | | |
| Agency | 4,679 |
| | (13 | ) | | 474 |
| | (8 | ) | | 5,153 |
| | (21 | ) |
| Agency-collateralized mortgage obligations | 11,448 |
| | (134 | ) | | 976 |
| | (33 | ) | | 12,424 |
| | (167 | ) |
| Non-agency residential | 2,112 |
| | (59 | ) | | 3,950 |
| | (350 | ) | | 6,062 |
| | (409 | ) |
| Non-agency commercial | 55 |
| | (1 | ) | | — |
| | — |
| | 55 |
| | (1 | ) |
| Non-U.S. securities | 1,008 |
| | (13 | ) | | 165 |
| | (1 | ) | | 1,173 |
| | (14 | ) |
| Corporate/Agency bonds | 415 |
| | (29 | ) | | 111 |
| | (8 | ) | | 526 |
| | (37 | ) |
| Other taxable securities | 4,210 |
| | (41 | ) | | 1,361 |
| | (19 | ) | | 5,571 |
| | (60 | ) |
| Total taxable securities | 23,927 |
| | (290 | ) | | 45,306 |
| | (1,230 | ) | | 69,233 |
| | (1,520 | ) |
| Tax-exempt securities | 1,117 |
| | (25 | ) | | 2,754 |
| | (65 | ) | | 3,871 |
| | (90 | ) |
| Total temporarily impaired available-for-sale debt securities | 25,044 |
| | (315 | ) | | 48,060 |
| | (1,295 | ) | | 73,104 |
| | (1,610 | ) |
| Temporarily impaired available-for-sale marketable equity securities | 31 |
| | (1 | ) | | 6 |
| | (6 | ) | | 37 |
| | (7 | ) |
| Total temporarily impaired available-for-sale securities | 25,075 |
| | (316 | ) | | 48,066 |
| | (1,301 | ) | | 73,141 |
| | (1,617 | ) |
Other-than-temporarily impaired available-for-sale debt securities (1) | | | | | | | | | | | |
| Non-agency residential mortgage-backed securities | 158 |
| | (28 | ) | | 489 |
| | (45 | ) | | 647 |
| | (73 | ) |
Total temporarily impaired and other-than-temporarily impaired available-for-sale securities (2) | $ | 25,233 |
| | $ | (344 | ) | | $ | 48,555 |
| | $ | (1,346 | ) | | $ | 73,788 |
| | $ | (1,690 | ) |
| |
(1) | Includes other-than-temporarily impaired AFS debt securities on which an OTTI loss remains in OCI. |
| |
(2) | At December 31, 2012 and 2011, the amortized cost of approximately 2,600 and 3,800 AFS securities exceeded their fair value by $660 million and $1.7 billion. |
The amortized cost and fair value of the Corporation’s investment in AFS and HTM debt securities from FNMA, the Government National Mortgage Association (GNMA), FHLMC and U.S. Treasury securities where the investment exceeded 10 percent of consolidated shareholders’ equity at December 31, 2012 and 2011 are presented in the table below.
|
| | | | | | | | | | | | | | | |
| | | | | | | | |
| Selected Securities Exceeding 10 Percent of Shareholders’ Equity | | |
| | | | | | | | |
| | December 31 |
| | 2012 | | 2011 |
| (Dollars in millions) | Amortized Cost | | Fair Value | | Amortized Cost | | Fair Value |
| Government National Mortgage Association | $ | 124,348 |
| | $ | 127,541 |
| | $ | 102,960 |
| | $ | 106,200 |
|
| Fannie Mae | 121,522 |
| | 123,933 |
| | 87,898 |
| | 89,243 |
|
| Freddie Mac | 22,995 |
| | 23,502 |
| | 26,617 |
| | 27,129 |
|
| U.S. Treasury securities | 21,269 |
| | 21,305 |
| | 39,946 |
| | 39,164 |
|
The expected maturity distribution of the Corporation’s MBS and the contractual maturity distribution of the Corporation’s other AFS debt securities, and the yields on the Corporation’s AFS debt securities portfolio at December 31, 2012 are summarized in the
table below. Actual maturities may differ from the contractual or expected maturities since borrowers may have the right to prepay obligations with or without prepayment penalties.
|
| | | | | | | | | | | | | | | | | | | | | | | | | | | | | | | | | | |
| | | | | | | | | | | | | | | | | | | | |
| Debt Securities Maturities | | | | | | | | | | | | | | |
| | | | | | | | | | | | | | | | | | | | |
| | December 31, 2012 |
| | Due in One Year or Less | | Due after One Year through Five Years | | Due after Five Years through Ten Years | | Due after Ten Years | | Total |
| (Dollars in millions) | Amount | | Yield (1) | | Amount | | Yield (1) | | Amount | | Yield (1) | | Amount | | Yield (1) | | Amount | | Yield (1) |
| Amortized cost of AFS debt securities | |
| | |
| | |
| | |
| | |
| | |
| | |
| | |
| | |
| | |
|
| U.S. Treasury and agency securities | $ | 548 |
| | 0.57 | % | | $ | 855 |
| | 2.12 | % | | $ | 1,884 |
| | 5.30 | % | | $ | 20,945 |
| | 2.80 | % | | $ | 24,232 |
| | 3.00 | % |
| Mortgage-backed securities: | |
| | |
| | |
| | |
| | |
| | |
| | |
| | |
| | |
| | |
|
| Agency | 7 |
| | 4.70 |
| | 59,880 |
| | 3.10 |
| | 123,075 |
| | 2.90 |
| | 285 |
| | 2.60 |
| | 183,247 |
| | 2.90 |
|
| Agency-collateralized mortgage obligations | 11 |
| | 6.31 |
| | 12,876 |
| | 1.20 |
| | 23,427 |
| | 3.10 |
| | 15 |
| | 1.10 |
| | 36,329 |
| | 2.40 |
|
| Non-agency residential | 750 |
| | 4.50 |
| | 5,112 |
| | 4.30 |
| | 2,767 |
| | 4.00 |
| | 602 |
| | 6.70 |
| | 9,231 |
| | 4.40 |
|
| Non-agency commercial | 456 |
| | 5.70 |
| | 3,080 |
| | 5.90 |
| | 22 |
| | 3.70 |
| | 18 |
| | 4.03 |
| | 3,576 |
| | 5.90 |
|
| Non-U.S. securities | 4,247 |
| | 1.46 |
| | 1,169 |
| | 6.10 |
| | 158 |
| | 2.20 |
| | — |
| | — |
| | 5,574 |
| | 2.65 |
|
| Corporate/Agency bonds | 315 |
| | 2.40 |
| | 808 |
| | 2.80 |
| | 185 |
| | 4.52 |
| | 107 |
| | 0.90 |
| | 1,415 |
| | 2.92 |
|
| Other taxable securities | 2,501 |
| | 1.10 |
| | 4,926 |
| | 1.10 |
| | 3,803 |
| | 1.82 |
| | 859 |
| | 1.10 |
| | 12,089 |
| | 1.37 |
|
| Total taxable securities | 8,835 |
| | 1.84 |
| | 88,706 |
| | 2.91 |
| | 155,321 |
| | 2.95 |
| | 22,831 |
| | 2.83 |
| | 275,693 |
| | 2.86 |
|
| Tax-exempt securities | 43 |
| | 2.63 |
| | 1,524 |
| | 1.40 |
| | 1,185 |
| | 2.02 |
| | 1,415 |
| | 1.10 |
| | 4,167 |
| | 1.68 |
|
| Total amortized cost of AFS debt securities | $ | 8,878 |
| | 1.84 |
| | $ | 90,230 |
| | 2.88 |
| | $ | 156,506 |
| | 2.95 |
| | $ | 24,246 |
| | 2.72 |
| | $ | 279,860 |
| | 2.84 |
|
Total amortized cost of held-to-maturity debt securities (2) | $ | 6 |
| | 5.00 |
| | $ | 8,616 |
| | 2.30 |
| | $ | 40,836 |
| | 2.40 |
| | $ | 23 |
| | 4.40 |
| | $ | 49,481 |
| | 2.40 |
|
| Fair value of AFS debt securities | |
| | |
| | |
| | |
| | |
| | |
| | |
| | |
| | |
| | |
|
| U.S. Treasury and agency securities | $ | 549 |
| | |
| | $ | 883 |
| | |
| | $ | 2,072 |
| | |
| | $ | 20,968 |
| | |
| | $ | 24,472 |
| | |
|
| Mortgage-backed securities: | |
| | |
| | |
| | |
| | |
| | |
| | |
| | |
| | |
| | |
|
| Agency | 7 |
| | |
| | 61,234 |
| | |
| | 126,619 |
| | |
| | 289 |
| | |
| | 188,149 |
| | |
|
| Agency-collateralized mortgage obligations | 11 |
| | |
| | 12,827 |
| | |
| | 24,684 |
| | |
| | 16 |
| | |
| | 37,538 |
| | |
|
| Non-agency residential | 749 |
| | |
| | 5,239 |
| | |
| | 2,841 |
| | |
| | 665 |
| | |
| | 9,494 |
| | |
|
| Non-agency commercial | 477 |
| | |
| | 3,405 |
| | |
| | 24 |
| | |
| | 18 |
| | |
| | 3,924 |
| | |
|
| Non-U.S. securities | 4,244 |
| | |
| | 1,211 |
| | |
| | 163 |
| | |
| | — |
| | |
| | 5,618 |
| | |
|
| Corporate/Agency bonds | 320 |
| | |
| | 826 |
| | |
| | 207 |
| | |
| | 97 |
| | |
| | 1,450 |
| | |
|
| Other taxable securities | 2,502 |
| | |
| | 4,947 |
| | |
| | 3,825 |
| | |
| | 854 |
| | |
| | 12,128 |
| | |
|
| Total taxable securities | 8,859 |
| | |
| | 90,572 |
| | |
| | 160,435 |
| | |
| | 22,907 |
| | |
| | 282,773 |
| | |
|
| Tax-exempt securities | 43 |
| | |
| | 1,526 |
| | |
| | 1,184 |
| | |
| | 1,380 |
| | |
| | 4,133 |
| | |
|
| Total fair value of AFS debt securities | $ | 8,902 |
| | |
| | $ | 92,098 |
| | |
| | $ | 161,619 |
| | |
| | $ | 24,287 |
| | |
| | $ | 286,906 |
| | |
|
Total fair value of held-to-maturity debt securities (2) | $ | 6 |
| | | | $ | 8,790 |
| | | | $ | 41,451 |
| | | | $ | 23 |
| | | | $ | 50,270 |
| | |
| |
(1) | Average yield is computed using the effective yield of each security at the end of the period, weighted based on the amortized cost of each security. The effective yield considers the contractual coupon, amortization of premiums and accretion of discounts, and excludes the effect of related hedging derivatives. |
| |
(2) | Substantially all U.S. agency mortgage-backed securities. |
The gross realized gains and losses on sales of AFS debt securities for 2012, 2011 and 2010 are presented in the table below.
|
| | | | | | | | | | | |
| | | | | | |
| Gains and Losses on Sales of AFS Debt Securities |
| | | | | | |
| (Dollars in millions) | 2012 | | 2011 | | 2010 |
| Gross gains | $ | 2,128 |
| | $ | 3,685 |
| | $ | 3,995 |
|
| Gross losses | (466 | ) | | (311 | ) | | (1,469 | ) |
| Net gains on sales of AFS debt securities | $ | 1,662 |
| | $ | 3,374 |
| | $ | 2,526 |
|
| Income tax expense attributable to realized net gains on sales of AFS debt securities | $ | 615 |
| | $ | 1,248 |
| | $ | 935 |
|
Certain Corporate and Strategic Investments
At December 31, 2012 and 2011, the Corporation owned 2.0 billion shares representing approximately one percent of China
Construction Bank Corporation (CCB). Sales restrictions on these shares continue until August 2013. Because the sales restrictions on these shares will expire within one year, these securities are accounted for as AFS marketable equity securities and are carried at fair value with the after-tax unrealized gain included in accumulated OCI. At December 31, 2011, this investment was accounted for at cost. The carrying value of the investment at December 31, 2012 and 2011 was $1.4 billion and $716 million, and the cost basis and the fair value were $716 million and $1.4 billion for both periods. There is a strategic assistance agreement between the Corporation and CCB, which includes cooperation in specific business areas.
The Corporation’s 49 percent investment in a merchant services joint venture had a carrying value of $3.3 billion and $3.4 billion at December 31, 2012 and 2011. For additional information, see Note 13 – Commitments and Contingencies.
NOTE 5 Outstanding Loans and Leases
The following tables present total outstanding loans and leases and an aging analysis for the Corporation’s Home Loans, Credit Card and Other Consumer, and Commercial portfolio segments, by class of financing receivables, at December��31, 2012 and 2011.
|
| | | | | | | | | | | | | | | | | | | | | | | | | | | | | | | |
| | | | | | | | | | | | | | | | |
| | December 31, 2012 |
| (Dollars in millions) | 30-59 Days Past Due (1) | | 60-89 Days Past Due (1) | | 90 Days or
More Past Due (2) | | Total Past
Due 30 Days or More | | Total Current or Less Than 30 Days Past Due (3) | | Purchased
Credit-impaired (4) | | Loans Accounted for Under the Fair Value Option | | Total Outstandings |
| Home loans | |
| | | | |
| | |
| | |
| | |
| | |
| | |
|
| Core portfolio | | | | | | | | | | | | | | | |
Residential mortgage (5) | $ | 2,274 |
| | $ | 806 |
| | $ | 6,227 |
| | $ | 9,307 |
| | $ | 160,809 |
| | | | | | $ | 170,116 |
|
| Home equity | 273 |
| | 146 |
| | 591 |
| | 1,010 |
| | 59,841 |
| | | | | | 60,851 |
|
| Legacy Assets & Servicing portfolio | | | | | | | | | | | | | | | |
| Residential mortgage | 2,891 |
| | 1,696 |
| | 26,494 |
| | 31,081 |
| | 33,247 |
| | $ | 8,737 |
| | | | 73,065 |
|
| Home equity | 607 |
| | 356 |
| | 1,444 |
| | 2,407 |
| | 36,191 |
| | 8,547 |
| | | | 47,145 |
|
Discontinued real estate (6) | 48 |
| | 19 |
| | 234 |
| | 301 |
| | 757 |
| | 8,834 |
| | | | 9,892 |
|
| Credit card and other consumer | | | | | | | | | | | | | | | |
| U.S. credit card | 729 |
| | 582 |
| | 1,437 |
| | 2,748 |
| | 92,087 |
| | | | | | 94,835 |
|
| Non-U.S. credit card | 106 |
| | 85 |
| | 212 |
| | 403 |
| | 11,294 |
| | | | | | 11,697 |
|
Direct/Indirect consumer (7) | 569 |
| | 239 |
| | 573 |
| | 1,381 |
| | 81,824 |
| | | | | | 83,205 |
|
Other consumer (8) | 48 |
| | 19 |
| | 4 |
| | 71 |
| | 1,557 |
| | | | | | 1,628 |
|
| Total consumer loans | 7,545 |
| | 3,948 |
| | 37,216 |
| | 48,709 |
| | 477,607 |
| | 26,118 |
| | | | 552,434 |
|
Consumer loans accounted for under the fair value option (9) | |
| | |
| | |
| | |
| | |
| | |
| | $ | 1,005 |
| | 1,005 |
|
| Total consumer | 7,545 |
| | 3,948 |
| | 37,216 |
| | 48,709 |
| | 477,607 |
| | 26,118 |
| | 1,005 |
| | 553,439 |
|
| Commercial | | | | | | | | | | | | | | | |
| U.S. commercial | 323 |
| | 133 |
| | 639 |
| | 1,095 |
| | 196,031 |
| | | | | | 197,126 |
|
Commercial real estate (10) | 79 |
| | 144 |
| | 983 |
| | 1,206 |
| | 37,431 |
| | | | | | 38,637 |
|
| Commercial lease financing | 84 |
| | 79 |
| | 30 |
| | 193 |
| | 23,650 |
| | | | | | 23,843 |
|
| Non-U.S. commercial | 2 |
| | — |
| | — |
| | 2 |
| | 74,182 |
| | | | | | 74,184 |
|
| U.S. small business commercial | 101 |
| | 75 |
| | 168 |
| | 344 |
| | 12,249 |
| | | | | | 12,593 |
|
| Total commercial loans | 589 |
| | 431 |
| | 1,820 |
| | 2,840 |
| | 343,543 |
| | | | | | 346,383 |
|
Commercial loans accounted for under the fair value option (9) | |
| | |
| | |
| | |
| | |
| | |
| | 7,997 |
| | 7,997 |
|
| Total commercial | 589 |
| | 431 |
| | 1,820 |
| | 2,840 |
| | 343,543 |
| | | | 7,997 |
| | 354,380 |
|
| Total loans and leases | $ | 8,134 |
| | $ | 4,379 |
| | $ | 39,036 |
| | $ | 51,549 |
| | $ | 821,150 |
| | $ | 26,118 |
| | $ | 9,002 |
| | $ | 907,819 |
|
| Percentage of outstandings | 0.90 | % | | 0.48 | % | | 4.30 | % | | 5.68 | % | | 90.45 | % | | 2.88 | % | | 0.99 | % | | |
|
| |
(1) | Home loans 30-59 days past due includes $2.3 billion of fully-insured loans and $702 million of nonperforming loans. Home loans 60-89 days past due includes $1.3 billion of fully-insured loans and $558 million of nonperforming loans. |
| |
(2) | Home loans includes $22.2 billion of fully-insured loans. |
| |
(3) | Home loans includes $5.5 billion and direct/indirect consumer includes $63 million of nonperforming loans. |
| |
(4) | PCI loan amounts are shown gross of the valuation allowance. |
| |
(5) | Total outstandings includes non-U.S. residential mortgage loans of $93 million. |
| |
(6) | Total outstandings includes $8.8 billion of pay option loans and $1.1 billion of subprime loans. The Corporation no longer originates these products. |
| |
(7) | Total outstandings includes dealer financial services loans of $35.9 billion, consumer lending loans of $4.7 billion, U.S. securities-based lending margin loans of $28.3 billion, student loans of $4.8 billion, non-U.S. consumer loans of $8.3 billion and other consumer loans of $1.2 billion. |
| |
(8) | Total outstandings includes consumer finance loans of $1.4 billion, other non-U.S. consumer loans of $5 million and consumer overdrafts of $177 million. |
| |
(9) | Consumer loans accounted for under the fair value option were residential mortgage loans of $147 million and discontinued real estate loans of $858 million. Commercial loans accounted for under the fair value option were U.S. commercial loans of $2.3 billion and non-U.S. commercial loans of $5.7 billion. For additional information, see Note 21 – Fair Value Measurements and Note 22 – Fair Value Option. |
| |
(10) | Total outstandings includes U.S. commercial real estate loans of $37.2 billion and non-U.S. commercial real estate loans of $1.5 billion. |
|
| | | | | | | | | | | | | | | | | | | | | | | | | | | | | | | |
| | | | | | | | | | | | | | | | |
| | December 31, 2011 |
| (Dollars in millions) | 30-59 Days
Past Due (1) | | 60-89 Days Past Due (1) | | 90 Days or
More
Past Due (2) | | Total Past
Due 30 Days
or More | | Total Current or Less Than 30 Days Past Due (3) | | Purchased
Credit-impaired (4) | | Loans Accounted for Under the Fair Value Option | | Total Outstandings |
| Home loans | |
| | | | |
| | |
| | |
| | |
| | |
| | |
|
| Core portfolio | | | | | | | | | | | | | | | |
Residential mortgage (5) | $ | 2,151 |
| | $ | 751 |
| | $ | 3,017 |
| | $ | 5,919 |
| | $ | 172,418 |
| | | | |
| | $ | 178,337 |
|
| Home equity | 260 |
| | 155 |
| | 429 |
| | 844 |
| | 66,211 |
| | | | |
| | 67,055 |
|
| Legacy Assets & Servicing portfolio | | | |
| | |
| | |
| | |
| | |
| | |
| | |
|
| Residential mortgage | 3,195 |
| | 2,174 |
| | 32,167 |
| | 37,536 |
| | 36,451 |
| | $ | 9,966 |
| | |
| | 83,953 |
|
| Home equity | 845 |
| | 508 |
| | 1,735 |
| | 3,088 |
| | 42,578 |
| | 11,978 |
| | |
| | 57,644 |
|
Discontinued real estate (6) | 65 |
| | 24 |
| | 351 |
| | 440 |
| | 798 |
| | 9,857 |
| | |
| | 11,095 |
|
| Credit card and other consumer | | | |
| | |
| | |
| | |
| | |
| | |
| | |
|
| U.S. credit card | 981 |
| | 772 |
| | 2,070 |
| | 3,823 |
| | 98,468 |
| | | | |
| | 102,291 |
|
| Non-U.S. credit card | 148 |
| | 120 |
| | 342 |
| | 610 |
| | 13,808 |
| | | | |
| | 14,418 |
|
Direct/Indirect consumer (7) | 805 |
| | 338 |
| | 779 |
| | 1,922 |
| | 87,791 |
| | | | |
| | 89,713 |
|
Other consumer (8) | 55 |
| | 21 |
| | 17 |
| | 93 |
| | 2,595 |
| | | | |
| | 2,688 |
|
| Total consumer loans | 8,505 |
| | 4,863 |
| | 40,907 |
| | 54,275 |
| | 521,118 |
| | 31,801 |
| | |
| 607,194 |
|
Consumer loans accounted for under the fair value option (9) | | | | | | | | | | | | | $ | 2,190 |
|
| 2,190 |
|
| Total consumer | 8,505 |
| | 4,863 |
| | 40,907 |
| | 54,275 |
| | 521,118 |
| | 31,801 |
| | 2,190 |
| | 609,384 |
|
| Commercial | | | |
| | |
| | |
| | |
| | |
| | |
| | |
|
| U.S. commercial | 352 |
| | 166 |
| | 866 |
| | 1,384 |
| | 178,564 |
| | | | |
| | 179,948 |
|
Commercial real estate (10) | 288 |
| | 118 |
| | 1,860 |
| | 2,266 |
| | 37,330 |
| | | | |
| | 39,596 |
|
| Commercial lease financing | 78 |
| | 15 |
| | 22 |
| | 115 |
| | 21,874 |
| | | | |
| | 21,989 |
|
| Non-U.S. commercial | 24 |
| | — |
| | — |
| | 24 |
| | 55,394 |
| | | | |
| | 55,418 |
|
| U.S. small business commercial | 150 |
| | 106 |
| | 272 |
| | 528 |
| | 12,723 |
| | | | |
| | 13,251 |
|
| Total commercial loans | 892 |
| | 405 |
| | 3,020 |
| | 4,317 |
| | 305,885 |
| | | | |
| | 310,202 |
|
Commercial loans accounted for under the fair value option (9) | | | | | | | | | | | | | 6,614 |
| | 6,614 |
|
| Total commercial | 892 |
| | 405 |
| | 3,020 |
| | 4,317 |
| | 305,885 |
| | | | 6,614 |
| | 316,816 |
|
| Total loans and leases | $ | 9,397 |
| | $ | 5,268 |
| | $ | 43,927 |
| | $ | 58,592 |
| | $ | 827,003 |
| | $ | 31,801 |
| | $ | 8,804 |
| | $ | 926,200 |
|
| Percentage of outstandings | 1.02 | % | | 0.57 | % | | 4.74 | % | | 6.33 | % | | 89.29 | % | | 3.43 | % | | 0.95 | % | | |
|
| |
(1) | Home loans 30-59 days past due includes $2.2 billion of fully-insured loans and $372 million of nonperforming loans. Home loans 60-89 days past due includes $1.4 billion of fully-insured loans and $398 million of nonperforming loans. |
| |
(2) | Home loans includes $21.2 billion of fully-insured loans. |
| |
(3) | Home loans includes $1.8 billion and direct/indirect consumer includes $7 million of nonperforming loans. |
| |
(4) | PCI loan amounts are shown gross of the valuation allowance. |
| |
(5) | Total outstandings includes non-U.S. residential mortgage loans of $85 million. |
| |
(6) | Total outstandings includes $9.9 billion of pay option loans and $1.2 billion of subprime loans. The Corporation no longer originates these products. |
| |
(7) | Total outstandings includes dealer financial services loans of $43.0 billion, consumer lending loans of $8.0 billion, U.S. securities-based lending margin loans of $23.6 billion, student loans of $6.0 billion, non-U.S. consumer loans of $7.6 billion and other consumer loans of $1.5 billion. |
| |
(8) | Total outstandings includes consumer finance loans of $1.7 billion, other non-U.S. consumer loans of $929 million and consumer overdrafts of $103 million. |
| |
(9) | Consumer loans accounted for under the fair value option were residential mortgage loans of $906 million and discontinued real estate loans of $1.3 billion. Commercial loans accounted for under the fair value option were U.S. commercial loans of $2.2 billion and non-U.S. commercial loans of $4.4 billion. For additional information, see Note 21 – Fair Value Measurements and Note 22 – Fair Value Option. |
| |
(10) | Total outstandings includes U.S. commercial real estate loans of $37.8 billion and non-U.S. commercial real estate loans of $1.8 billion. |
The Corporation mitigates a portion of its credit risk on the residential mortgage portfolio through the use of synthetic securitization vehicles. These vehicles issue long-term notes to investors, the proceeds of which are held as cash collateral. The Corporation pays a premium to the vehicles to purchase mezzanine loss protection on a portfolio of residential mortgage loans owned by the Corporation. Cash held in the vehicles is used to reimburse the Corporation in the event that losses on the mortgage portfolio exceed 10 basis points (bps) of the original pool balance, up to the remaining amount of purchased loss protection of $500 million and $783 million at December 31, 2012 and 2011. The vehicles from which the Corporation purchases credit protection are VIEs. The Corporation does not have a variable interest in these vehicles, and accordingly, these vehicles are not consolidated by the Corporation. Amounts due from the vehicles are recorded in other income (loss) when the Corporation recognizes a reimbursable loss, as described above. Amounts are collected when reimbursable losses are realized through the sale of the underlying collateral. At December 31, 2012 and 2011, the Corporation had a receivable of $305 million and $359 million from these vehicles for reimbursement of losses, and principal of $17.6 billion and $23.9 billion of residential mortgage loans was referenced under these agreements. The Corporation records an allowance for credit losses on these loans without regard to the existence of the purchased loss protection as the protection does not represent a guarantee of individual loans.
In addition, the Corporation has entered into long-term credit protection agreements with FNMA and FHLMC on loans totaling $24.3 billion and $24.4 billion at December 31, 2012 and 2011, providing full protection on residential mortgage loans that become severely delinquent. All of these loans are individually insured and therefore the Corporation does not record an allowance for credit losses related to these loans. For additional information, see Note 8 – Representations and Warranties Obligations and Corporate Guarantees.
Nonperforming Loans and Leases
In 2012, the bank regulatory agencies jointly issued interagency supervisory guidance on nonaccrual status for junior-lien consumer real estate loans. In accordance with this regulatory interagency guidance, the Corporation classifies junior-lien home equity loans as nonperforming when the first-lien loan becomes 90 days past due even if the junior-lien loan is performing, and as a result, an incremental $1.5 billion was included in nonperforming loans at December 31, 2012. The regulatory interagency guidance had no impact on the Corporation’s allowance for loan and lease losses or provision for credit losses as the delinquency status of the underlying first-lien loans was already considered in the Corporation’s reserving process.
In 2012, new regulatory guidance was issued addressing certain consumer real estate loans that have been discharged in Chapter 7 bankruptcy. In accordance with this new guidance, the Corporation classifies consumer real estate and other secured consumer loans that have been discharged in Chapter 7 bankruptcy and not reaffirmed by the borrower as TDRs, irrespective of payment history or delinquency status, even if the repayment terms for the loan have not been otherwise modified. The Corporation continues to have a lien on the underlying collateral. Previously, such loans were classified as TDRs only if there had been a change in contractual payment terms that represented a concession to the borrower. The net impact upon implementation to the consumer loan portfolio of adopting this new regulatory guidance was $1.2 billion in net new nonperforming loans, and $1.1 billion of such loans were included in nonperforming loans at December 31, 2012. Of the $1.1 billion, $1.0 billion, or 92 percent, were current on their contractual payments. Of these contractually current nonperforming loans, more than 70 percent were discharged in Chapter 7 bankruptcy more than 12 months ago, and more than 40 percent were discharged 24 months or more ago. As subsequent cash payments are received, the interest component of the payments is generally recorded as interest income on a cash basis and the principal component is generally recorded as a reduction in the carrying value of the loan.
The table below presents the Corporation’s nonperforming loans and leases including nonperforming TDRs and loans accruing past due 90 days or more at December 31, 2012 and 2011. Nonperforming LHFS are excluded from nonperforming
loans and leases as they are recorded at either fair value or the lower of cost or fair value. See Note 1 – Summary of Significant Accounting Principles for further information on the criteria for classification as nonperforming.
|
| | | | | | | | | | | | | | | |
| | | | | | | | |
| Credit Quality | | |
| | | | | | | | |
| | December 31 |
| | Nonperforming Loans and Leases (1) | | Accruing Past Due 90 Days or More |
| (Dollars in millions) | 2012 | | 2011 | | 2012 | | 2011 |
| Home loans | |
| | |
| | |
| | |
|
| Core portfolio | | | | | | | |
Residential mortgage (2) | $ | 3,190 |
| | $ | 2,414 |
| | $ | 3,984 |
| | $ | 883 |
|
| Home equity | 1,265 |
| | 439 |
| | — |
| | — |
|
| Legacy Assets & Servicing portfolio | |
| | |
| | |
| | |
Residential mortgage (2) | 11,618 |
| | 13,556 |
| | 18,173 |
| | 20,281 |
|
| Home equity | 3,016 |
| | 2,014 |
| | — |
| | — |
|
| Discontinued real estate | 248 |
| | 290 |
| | — |
| | — |
|
| Credit card and other consumer | |
| | |
| | | | |
| U.S. credit card | n/a |
| | n/a |
| | 1,437 |
| | 2,070 |
|
| Non-U.S. credit card | n/a |
| | n/a |
| | 212 |
| | 342 |
|
| Direct/Indirect consumer | 92 |
| | 40 |
| | 545 |
| | 746 |
|
| Other consumer | 2 |
| | 15 |
| | 2 |
| | 2 |
|
| Total consumer | 19,431 |
| | 18,768 |
| | 24,353 |
| | 24,324 |
|
| Commercial | |
| | |
| | |
| | |
|
| U.S. commercial | 1,484 |
| | 2,174 |
| | 65 |
| | 75 |
|
| Commercial real estate | 1,513 |
| | 3,880 |
| | 29 |
| | 7 |
|
| Commercial lease financing | 44 |
| | 26 |
| | 15 |
| | 14 |
|
| Non-U.S. commercial | 68 |
| | 143 |
| | — |
| | — |
|
| U.S. small business commercial | 115 |
| | 114 |
| | 120 |
| | 216 |
|
| Total commercial | 3,224 |
| | 6,337 |
| | 229 |
| | 312 |
|
| Total consumer and commercial | $ | 22,655 |
| | $ | 25,105 |
| | $ | 24,582 |
| | $ | 24,636 |
|
| |
(1) | Nonperforming loan balances do not include nonaccruing TDRs removed from the PCI portfolio prior to January 1, 2010 of $521 million and $477 million at December 31, 2012 and 2011. |
| |
(2) | Residential mortgage loans accruing past due 90 days or more are fully-insured loans. At December 31, 2012 and 2011, residential mortgage includes $17.8 billion and $17.0 billion of loans on which interest has been curtailed by the FHA, and therefore are no longer accruing interest, although principal is still insured, and $4.4 billion and $4.2 billion of loans on which interest is still accruing. |
n/a = not applicable
Credit Quality Indicators
The Corporation monitors credit quality within its Home Loans, Credit Card and Other Consumer, and Commercial portfolio segments based on primary credit quality indicators. For more information on the portfolio segments, see Note 1 – Summary of Significant Accounting Principles. Within the Home Loans portfolio segment, the primary credit quality indicators are refreshed LTV and refreshed FICO score. Refreshed LTV measures the carrying value of the loan as a percentage of the value of property securing the loan, refreshed quarterly. Home equity loans are evaluated using CLTV which measures the carrying value of the combined loans that have liens against the property and the available line of credit as a percentage of the appraised value of the property securing the loan, refreshed quarterly. FICO score measures the creditworthiness of the borrower based on the financial obligations of the borrower and the borrower’s credit history. At a minimum,
FICO scores are refreshed quarterly, and in many cases, more frequently. FICO scores are also a primary credit quality indicator for the Credit Card and Other Consumer portfolio segment and the business card portfolio within U.S. small business commercial. Within the Commercial portfolio segment, loans are evaluated using the internal classifications of pass rated or reservable criticized as the primary credit quality indicators. The term reservable criticized refers to those commercial loans that are internally classified or listed by the Corporation as Special Mention, Substandard or Doubtful, which are asset categories defined by regulatory authorities. These assets have an elevated level of risk and may have a high probability of default or total loss. Pass rated refers to all loans not considered reservable criticized. In addition to these primary credit quality indicators, the Corporation uses other credit quality indicators for certain types of loans.
The following tables present certain credit quality indicators for the Corporation’s Home Loans, Credit Card and Other Consumer, and Commercial portfolio segments, by class of financing receivables, at December 31, 2012 and 2011.
|
| | | | | | | | | | | | | | | | | | | | | | | | | | | | | | | |
| | | | | | | | | | | | | | | | |
Home Loans – Credit Quality Indicators (1) |
| | |
| | December 31, 2012 |
| (Dollars in millions) | Core Portfolio Residential Mortgage (2) | | Legacy Assets & Servicing Residential
Mortgage (2) | | Countrywide Residential Mortgage PCI | | Core Portfolio Home Equity (2) | | Legacy Assets & Servicing Home Equity (2) | | Countrywide Home Equity PCI | | Legacy Assets & Servicing Discontinued
Real Estate (2) | | Countrywide
Discontinued
Real Estate PCI |
Refreshed LTV (3) | |
| | |
| | |
| | |
| | | | | | |
| | |
|
| Less than 90 percent | $ | 80,585 |
| | $ | 19,904 |
| | $ | 3,516 |
| | $ | 44,971 |
| | $ | 15,907 |
| | $ | 2,050 |
| | $ | 719 |
| | $ | 5,093 |
|
| Greater than 90 percent but less than 100 percent | 8,891 |
| | 5,000 |
| | 1,312 |
| | 5,825 |
| | 4,507 |
| | 788 |
| | 102 |
| | 1,067 |
|
| Greater than 100 percent | 12,984 |
| | 16,226 |
| | 3,909 |
| | 10,055 |
| | 18,184 |
| | 5,709 |
| | 237 |
| | 2,674 |
|
Fully-insured loans (4) | 67,656 |
| | 23,198 |
| | — |
| | — |
| | — |
| | — |
| | — |
| | — |
|
| Total home loans | $ | 170,116 |
| | $ | 64,328 |
| | $ | 8,737 |
| | $ | 60,851 |
| | $ | 38,598 |
| | $ | 8,547 |
| | $ | 1,058 |
| | $ | 8,834 |
|
| Refreshed FICO score | | | | | | | | | | | | | | | |
| Less than 620 | $ | 6,366 |
| | $ | 13,900 |
| | $ | 3,249 |
| | $ | 2,586 |
| | $ | 5,408 |
| | $ | 1,930 |
| | $ | 429 |
| | $ | 5,471 |
|
| Greater than or equal to 620 and less than 680 | 8,561 |
| | 6,006 |
| | 1,381 |
| | 4,500 |
| | 5,885 |
| | 1,500 |
| | 160 |
| | 1,359 |
|
| Greater than or equal to 680 and less than 740 | 25,141 |
| | 8,411 |
| | 1,886 |
| | 12,625 |
| | 10,387 |
| | 2,278 |
| | 206 |
| | 1,106 |
|
| Greater than or equal to 740 | 62,392 |
| | 12,813 |
| | 2,221 |
| | 41,140 |
| | 16,918 |
| | 2,839 |
| | 263 |
| | 898 |
|
Fully-insured loans (4) | 67,656 |
| | 23,198 |
| | — |
| | — |
| | — |
| | — |
| | — |
| | — |
|
| Total home loans | $ | 170,116 |
| | $ | 64,328 |
| | $ | 8,737 |
| | $ | 60,851 |
| | $ | 38,598 |
| | $ | 8,547 |
| | $ | 1,058 |
| | $ | 8,834 |
|
| |
(1) | Excludes $1.0 billion of loans accounted for under the fair value option. |
| |
(2) | Excludes Countrywide PCI loans. |
| |
(3) | Refreshed LTV percentages for PCI loans are calculated using the carrying value net of the related valuation allowance. |
| |
(4) | Credit quality indicators are not reported for fully-insured loans as principal repayment is insured. |
|
| | | | | | | | | | | | | | | |
| | | | | | | | |
| Credit Card and Other Consumer – Credit Quality Indicators |
| | |
| | December 31, 2012 |
| (Dollars in millions) | U.S. Credit Card | | Non-U.S. Credit Card | | Direct/Indirect Consumer | | Other Consumer (1) |
| Refreshed FICO score | |
| | |
| | |
| | |
|
| Less than 620 | $ | 6,188 |
| | $ | — |
| | $ | 1,896 |
| | $ | 668 |
|
| Greater than or equal to 620 and less than 680 | 13,947 |
| | — |
| | 3,367 |
| | 301 |
|
| Greater than or equal to 680 and less than 740 | 37,167 |
| | — |
| | 9,592 |
| | 232 |
|
| Greater than or equal to 740 | 37,533 |
| | — |
| | 25,164 |
| | 212 |
|
Other internal credit metrics (2, 3, 4) | — |
| | 11,697 |
| | 43,186 |
| | 215 |
|
| Total credit card and other consumer | $ | 94,835 |
| | $ | 11,697 |
| | $ | 83,205 |
| | $ | 1,628 |
|
| |
(1) | 87 percent of the other consumer portfolio is associated with portfolios from certain consumer finance businesses that the Corporation previously exited. |
| |
(2) | Other internal credit metrics may include delinquency status, geography or other factors. |
| |
(3) | Direct/indirect consumer includes $36.5 billion of securities-based lending which is overcollateralized and therefore has minimal credit risk and $4.8 billion of loans the Corporation no longer originates. |
| |
(4) | Non-U.S. credit card represents the U.K. credit card portfolio which is evaluated using internal credit metrics, including delinquency status. At December 31, 2012, 97 percent of this portfolio was current or less than 30 days past due, one percent was 30-89 days past due and two percent was 90 days or more past due. |
|
| | | | | | | | | | | | | | | | | | | |
| | | | | | | | | | |
Commercial – Credit Quality Indicators (1) |
| | |
| | December 31, 2012 |
| (Dollars in millions) | U.S. Commercial | | Commercial Real Estate | | Commercial
Lease Financing | | Non-U.S. Commercial | | U.S. Small
Business Commercial (2) |
| Risk ratings | |
| | |
| | |
| | |
| | |
|
| Pass rated | $ | 189,602 |
| | $ | 34,968 |
| | $ | 22,874 |
| | $ | 72,688 |
| | $ | 1,690 |
|
| Reservable criticized | 7,524 |
| | 3,669 |
| | 969 |
| | 1,496 |
| | 573 |
|
Refreshed FICO score (3) | | | | | | | | | |
|
| Less than 620 | |
| | |
| | |
| | |
| | 400 |
|
| Greater than or equal to 620 and less than 680 | | | | | | | | | 580 |
|
| Greater than or equal to 680 and less than 740 | | | | | | | | | 1,553 |
|
| Greater than or equal to 740 | | | | | | | | | 2,496 |
|
Other internal credit metrics (3, 4) | | | | | | | | | 5,301 |
|
| Total commercial | $ | 197,126 |
| | $ | 38,637 |
| | $ | 23,843 |
| | $ | 74,184 |
| | $ | 12,593 |
|
| |
(1) | Excludes $8.0 billion of loans accounted for under the fair value option. |
| |
(2) | U.S. small business commercial includes $366 million of criticized business card and small business loans which are evaluated using refreshed FICO scores or internal credit metrics, including delinquency status, rather than risk ratings. At December 31, 2012, 98 percent of the balances where internal credit metrics are used were current or less than 30 days past due. |
| |
(3) | Refreshed FICO score and other internal credit metrics are applicable only to the U.S. small business commercial portfolio. |
| |
(4) | Other internal credit metrics may include delinquency status, application scores, geography or other factors. |
|
| | | | | | | | | | | | | | | | | | | | | | | | | | | | | | | |
| | | | | | | | | | | | | | | | |
Home Loans – Credit Quality Indicators (1) |
| | |
| | December 31, 2011 |
| (Dollars in millions) | Core Portfolio Residential Mortgage (2) | | Legacy Assets & Servicing Residential
Mortgage (2) | | Countrywide Residential Mortgage PCI | | Core Portfolio Home Equity (2) | | Legacy Assets & Servicing Home Equity (2) | | Countrywide Hone Equity PCI | | Legacy Assets & Servicing Discontinued
Real Estate (2) | | Countrywide
Discontinued
Real Estate PCI |
Refreshed LTV (3) | |
| | |
| | |
| | |
| | | | | | |
| | |
|
| Less than 90 percent | $ | 80,032 |
| | $ | 20,450 |
| | $ | 3,821 |
| | $ | 46,646 |
| | $ | 17,354 |
| | $ | 2,253 |
| | $ | 895 |
| | $ | 5,953 |
|
| Greater than 90 percent but less than 100 percent | 11,838 |
| | 5,847 |
| | 1,468 |
| | 6,988 |
| | 4,995 |
| | 1,077 |
| | 122 |
| | 1,191 |
|
| Greater than 100 percent | 17,673 |
| | 22,630 |
| | 4,677 |
| | 13,421 |
| | 23,317 |
| | 8,648 |
| | 221 |
| | 2,713 |
|
Fully-insured loans (4) | 68,794 |
| | 25,060 |
| | — |
| | — |
| | — |
| | — |
| | — |
| | — |
|
| Total home loans | $ | 178,337 |
| | $ | 73,987 |
| | $ | 9,966 |
| | $ | 67,055 |
| | $ | 45,666 |
| | $ | 11,978 |
| | $ | 1,238 |
|
| $ | 9,857 |
|
Refreshed FICO score (5) | |
| | |
| | |
| | |
| | |
| | |
| | |
| | |
|
| Less than 620 | $ | 7,020 |
| | $ | 17,337 |
| | $ | 3,924 |
| | $ | 2,843 |
| | $ | 7,293 |
| | $ | 4,140 |
| | $ | 548 |
| | $ | 6,275 |
|
| Greater than or equal to 620 and less than 680 | 9,331 |
| | 6,537 |
| | 1,381 |
| | 4,704 |
| | 6,866 |
| | 1,969 |
| | 175 |
| | 1,279 |
|
| Greater than or equal to 680 and less than 740 | 26,569 |
| | 9,439 |
| | 2,036 |
| | 13,561 |
| | 11,798 |
| | 2,538 |
| | 228 |
| | 1,223 |
|
| Greater than or equal to 740 | 66,623 |
| | 15,614 |
| | 2,625 |
| | 45,947 |
| | 19,709 |
| | 3,331 |
| | 287 |
| | 1,080 |
|
Fully-insured loans (4) | 68,794 |
| | 25,060 |
| | — |
| | — |
| | — |
| | — |
| | — |
| | — |
|
| Total home loans | $ | 178,337 |
| | $ | 73,987 |
| | $ | 9,966 |
| | $ | 67,055 |
| | $ | 45,666 |
| | $ | 11,978 |
| | $ | 1,238 |
| | $ | 9,857 |
|
| |
(1) | Excludes $2.2 billion of loans accounted for under the fair value option. |
| |
(2) | Excludes Countrywide PCI loans. |
| |
(3) | Refreshed LTV percentages for PCI loans are calculated using the carrying value net of the related valuation allowance. |
| |
(4) | Credit quality indicators are not reported for fully-insured loans as principal repayment is insured. |
| |
(5) | During 2012, refreshed home equity FICO metrics reflected an updated scoring model that is more representative of the credit risk of the Corporation’s borrowers. Prior period amounts were adjusted to reflect these updates. |
|
| | | | | | | | | | | | | | | |
| | | | | | | | |
| Credit Card and Other Consumer – Credit Quality Indicators |
| | |
| | December 31, 2011 |
| (Dollars in millions) | U.S. Credit Card | | Non-U.S. Credit Card | | Direct/Indirect Consumer | | Other Consumer (1) |
| Refreshed FICO score | |
| | |
| | |
| | |
|
| Less than 620 | $ | 8,172 |
| | $ | — |
| | $ | 3,325 |
| | $ | 802 |
|
| Greater than or equal to 620 and less than 680 | 15,474 |
| | — |
| | 4,665 |
| | 348 |
|
| Greater than or equal to 680 and less than 740 | 39,525 |
| | — |
| | 12,351 |
| | 262 |
|
| Greater than or equal to 740 | 39,120 |
| | — |
| | 29,965 |
| | 244 |
|
Other internal credit metrics (2, 3, 4) | — |
| | 14,418 |
| | 39,407 |
| | 1,032 |
|
| Total credit card and other consumer | $ | 102,291 |
| | $ | 14,418 |
| | $ | 89,713 |
| | $ | 2,688 |
|
| |
(1) | 96 percent of the other consumer portfolio is associated with portfolios from certain consumer finance businesses that the Corporation previously exited. |
| |
(2) | Other internal credit metrics may include delinquency status, geography or other factors. |
| |
(3) | Direct/indirect consumer includes $31.1 billion of securities-based lending which is overcollateralized and therefore has minimal credit risk and $6.0 billion of loans the Corporation no longer originates. |
| |
(4) | Non-U.S. credit card represents the U.K. credit card portfolio which is evaluated using internal credit metrics, including delinquency status. At December 31, 2011, 96 percent of this portfolio was current or less than 30 days past due, two percent was 30-89 days past due and two percent was 90 days or more past due. |
|
| | | | | | | | | | | | | | | | | | | |
| | | | | | | | | | |
Commercial – Credit Quality Indicators (1) |
| | |
| | December 31, 2011 |
| (Dollars in millions) | U.S. Commercial | | Commercial Real Estate | | Commercial
Lease Financing | | Non-U.S. Commercial | | U.S. Small
Business Commercial (2) |
| Risk ratings | |
| | |
| | |
| | |
| | |
|
| Pass rated | $ | 169,599 |
| | $ | 28,602 |
| | $ | 20,850 |
| | $ | 53,945 |
| | $ | 2,392 |
|
| Reservable criticized | 10,349 |
| | 10,994 |
| | 1,139 |
| | 1,473 |
| | 836 |
|
Refreshed FICO score (3) | | | | | | | | | |
| Less than 620 | | | | | | | | | 562 |
|
| Greater than or equal to 620 and less than 680 | | | | | | | | | 624 |
|
| Greater than or equal to 680 and less than 740 | | | | | | | | | 1,612 |
|
| Greater than or equal to 740 | | | | | | | | | 2,438 |
|
Other internal credit metrics (3, 4) | | | | | | | | | 4,787 |
|
| Total commercial | $ | 179,948 |
| | $ | 39,596 |
| | $ | 21,989 |
| | $ | 55,418 |
| | $ | 13,251 |
|
| |
(1) | Excludes $6.6 billion of loans accounted for under the fair value option. |
| |
(2) | U.S. small business commercial includes $491 million of criticized business card and small business loans which are evaluated using refreshed FICO scores or internal credit metrics, including delinquency status, rather than risk ratings. At December 31, 2011, 97 percent of the balances where internal credit metrics are used were current or less than 30 days past due. |
| |
(3) | Refreshed FICO score and other internal credit metrics are applicable only to the U.S. small business commercial portfolio. |
| |
(4) | Other internal credit metrics may include delinquency status, application scores, geography or other factors. |
Impaired Loans and Troubled Debt Restructurings
A loan is considered impaired when, based on current information, it is probable that the Corporation will be unable to collect all amounts due from the borrower in accordance with the contractual terms of the loan. Impaired loans include nonperforming commercial loans and all consumer and commercial TDRs. Impaired loans exclude nonperforming consumer loans and nonperforming commercial leases unless they are classified as TDRs. Loans accounted for under the fair value option are also excluded. PCI loans are excluded and reported separately on page 201.
Home Loans
Impaired home loans within the Home Loans portfolio segment consist entirely of TDRs. Excluding PCI loans, most modifications of home loans meet the definition of TDRs when a binding offer is extended to a borrower. Modifications of home loans are done in accordance with the government’s Making Home Affordable Program (modifications under government programs) or the Corporation’s proprietary programs (modifications under proprietary programs). These modifications are considered to be TDRs if concessions have been granted to borrowers experiencing financial difficulties. Concessions may include reductions in interest rates, capitalization of past due amounts, principal and/or interest forbearance, payment extensions, principal and/or interest forgiveness, or combinations thereof. In 2012, the Corporation implemented a borrower assistance program that provides forgiveness of principal balances in connection with the settlement agreement among the Corporation and certain of its affiliates and subsidiaries, together with the U.S. Department of Justice (DOJ), the U.S. Department of Housing and Urban Development (HUD) and other federal agencies, and 49 state Attorneys General concerning the terms of a global settlement resolving investigations into certain origination, servicing and foreclosure practices (National Mortgage Settlement).
Prior to permanently modifying a loan, the Corporation may enter into trial modifications with certain borrowers under both government and proprietary programs, including the borrower assistance program pursuant to the National Mortgage Settlement. Trial modifications generally represent a three- to four-month period during which the borrower makes monthly payments under the anticipated modified payment terms. Upon successful completion of the trial period, the Corporation and the borrower enter into a permanent modification. Binding trial modifications are classified as TDRs when the trial offer is made and continue to be classified as TDRs regardless of whether the borrower enters into a permanent modification.
In 2012, new regulatory guidance was issued addressing certain home loans that have been discharged in Chapter 7 bankruptcy, and as a result, an additional $3.5 billion of home loans were included in TDRs at December 31, 2012, of which $1.2 billion were current or less than 60 days past due. Of the $3.5 billion of home loan TDRs, approximately 27 percent, 42 percent and 31 percent had been discharged in Chapter 7 bankruptcy in 2012, 2011 and prior years, respectively. For more information on
the new regulatory guidance on loans discharged in Chapter 7 bankruptcy, see Nonperforming Loans and Leases in this Note.
In accordance with applicable accounting guidance, a home loan, excluding PCI loans which are reported separately, is not classified as impaired unless it is a TDR. Once such a loan has been designated as a TDR, it is then individually assessed for impairment. Home loan TDRs are measured primarily based on the net present value of the estimated cash flows discounted at the loan’s original effective interest rate, as discussed in the paragraph below. If the carrying value of a loanTDR exceeds this amount, a specific allowance is recorded as a component of the allowance for loan and lease losses.
Modifications of loans to commercial borrowers Alternatively, home loan TDRs that are experiencing financial difficultyconsidered to be dependent solely on the collateral for repayment (e.g., due to the lack of income verification or as a result of being discharged in Chapter 7 bankruptcy) are designed to reducemeasured based on the Corporation’s loss exposure while providing the borrower with an opportunity to work through financial difficulties, often to avoid foreclosure or bankruptcy. Each modification is unique and reflects
the individual circumstancesestimated fair value of the borrower. Modifications that result incollateral and a TDR may include extensions of maturity at a concessionary (below market) rate of interest, payment forbearances or other actionsdesigned to benefitcharge-off is recorded if the customer while mitigatingcarrying value exceeds the Corporation’s risk exposure. Reductions in interest rates are rare. Instead, the interest rates are typically increased, although the increased rate may not represent a market rate of interest. Infrequently, concessions may also include principal forgiveness in connection with foreclosure, short sale or other settlement agreements leading to termination or salefair value of the loan.
At the timecollateral. Home loans that reached 180 days past due prior to modification had been charged off to their net realizable value before they were modified as TDRs in accordance with established policy. Therefore, modifications of restructuring, thehome loans that are remeasured to reflect the impact, if any, on projected cash flows, observable market prices180 days or collateral value resulting from the modified terms. If there was no forgiveness of principal and the interest rate wasmore past due as TDRs do not decreased, the modification may have little or noan impact on the allowance established for the loan. If a portion of the loan is deemed to be uncollectible, a charge-off may be recorded at the time of restructuring. Alternatively, a charge-off may have already been recorded in a previous period such that no charge-off isand lease losses nor are additional charge-offs required at the time of modification. Subsequent declines in the fair value of the collateral after a loan has reached 180 days past due are recorded as charge-offs. Fully-insured loans are protected against principal loss, and therefore, the Corporation does not record an allowance for loan and lease losses on the outstanding principal balance, even after they have been modified in a TDR.
The net present value of the estimated cash flows is based on model-driven estimates of projected payments, prepayments, defaults and loss-given-default (LGD). Using statistical modeling methodologies, the Corporation estimates the probability that a loan will default prior to maturity based on the attributes of each loan. The factors that are most relevant to the probability of default are the refreshed LTV, or in the case of a subordinated lien, refreshed CLTV, borrower credit score, months since origination (i.e., vintage) and geography. Each of these factors is further broken down by present collection status (whether the loan is current, delinquent, in default or in bankruptcy). Severity (or LGD) is estimated based on the refreshed LTV for first mortgages or CLTV for subordinated liens. The estimates are based on the Corporation’s historical experience, but are adjusted to reflect an assessment of environmental factors that may not be reflected in the historical data, such as changes in real estate values, local and national economies, underwriting standards and the regulatory environment. The probability of default models also incorporate recent experience with modification programs, a loan’s default history prior to modification and the change in borrower payments post-modification.
At December 31, 20112012 and 20102011, remaining commitments to lend additional funds to debtors whose terms have been modified in a commercialhome loan TDR were immaterial. CommercialHome loan foreclosed properties totaled $612650 million and $725 million2.0 billion at December 31, 20112012 and 20102011.
|
| | |
192194 Bank of America 20112012
| | |
The table below presents impaired loans in the Corporation’s commercial loanHome Loans portfolio segment at and for the years ended December 31, 20112012 and 20102011. and includes primarily loans managed by Legacy Assets & Servicing. Certain impaired commercialhome loans do not have a related allowance as the current valuation of these impaired loans exceeded the carrying value, which is net of previously recorded charge-offs.value.
|
| | | | | | | | | | | | | | | | | | | |
| | | | | | | | | | |
| Impaired Loans – Commercial |
| | | | |
| | December 31, 2011 | | 2011 |
| (Dollars in millions) | Unpaid
Principal Balance | | Carrying Value | | Related Allowance | | Average
Carrying Value | | Interest
Income Recognized (1) |
| With no recorded allowance | |
| | |
| | |
| | |
| | |
|
| U.S. commercial | $ | 1,482 |
| | $ | 985 |
| | n/a |
| | $ | 774 |
| | $ | 7 |
|
| Commercial real estate | 2,587 |
| | 2,095 |
| | n/a |
| | 1,994 |
| | 7 |
|
| Non-U.S. commercial | 216 |
| | 101 |
| | n/a |
| | 101 |
| | — |
|
U.S. small business commercial (2) | — |
| | — |
| | n/a |
| | — |
| | — |
|
| With an allowance recorded | | | | | | | | | |
| U.S. commercial | $ | 2,654 |
| | $ | 1,987 |
| | $ | 232 |
| | $ | 2,422 |
| | $ | 13 |
|
| Commercial real estate | 3,329 |
| | 2,384 |
| | 135 |
| | 3,309 |
| | 19 |
|
| Non-U.S. commercial | 308 |
| | 58 |
| | 6 |
| | 76 |
| | 3 |
|
U.S. small business commercial (2) | 531 |
| | 503 |
| | 172 |
| | 666 |
| | 23 |
|
| Total | |
| | |
| | |
| | |
| | |
|
| U.S. commercial | $ | 4,136 |
| | $ | 2,972 |
| | $ | 232 |
| | $ | 3,196 |
| | $ | 20 |
|
| Commercial real estate | 5,916 |
| | 4,479 |
| | 135 |
| | 5,303 |
| | 26 |
|
| Non-U.S. commercial | 524 |
| | 159 |
| | 6 |
| | 177 |
| | 3 |
|
U.S. small business commercial (2) | 531 |
| | 503 |
| | 172 |
| | 666 |
| | 23 |
|
| | | | | | | | | | |
| | December 31, 2010 | | 2010 |
| With no recorded allowance | | | | | | | | | |
| U.S. commercial | $ | 968 |
| | $ | 441 |
| | n/a |
| | $ | 547 |
| | $ | 3 |
|
| Commercial real estate | 2,655 |
| | 1,771 |
| | n/a |
| | 1,736 |
| | 8 |
|
| Non-U.S. commercial | 46 |
| | 28 |
| | n/a |
| | 9 |
| | — |
|
U.S. small business commercial (2) | — |
| | — |
| | n/a |
| | — |
| | — |
|
| With an allowance recorded | | | | | | | | | |
| U.S. commercial | $ | 3,891 |
| | $ | 3,193 |
| | $ | 336 |
| | $ | 3,389 |
| | $ | 36 |
|
| Commercial real estate | 5,682 |
| | 4,103 |
| | 208 |
| | 4,813 |
| | 29 |
|
| Non-U.S. commercial | 572 |
| | 217 |
| | 91 |
| | 190 |
| | — |
|
U.S. small business commercial (2) | 935 |
| | 892 |
| | 445 |
| | 1,028 |
| | 34 |
|
| Total | | | | | | | | | |
| U.S. commercial | $ | 4,859 |
| | $ | 3,634 |
| | $ | 336 |
| | $ | 3,936 |
| | $ | 39 |
|
| Commercial real estate | 8,337 |
| | 5,874 |
| | 208 |
| | 6,549 |
| | 37 |
|
| Non-U.S. commercial | 618 |
| | 245 |
| | 91 |
| | 199 |
| | — |
|
U.S. small business commercial (2) | 935 |
| | 892 |
| | 445 |
| | 1,028 |
| | 34 |
|
|
| | | | | | | | | | | | | | | | | | | |
| | | | | | | | | | |
| Impaired Loans – Home Loans |
| | | | |
| | December 31, 2012 | | 2012 |
| (Dollars in millions) | Unpaid
Principal Balance | | Carrying Value | | Related Allowance | | Average
Carrying Value | | Interest
Income Recognized (1) |
| With no recorded allowance | |
| | |
| | |
| | |
| | |
|
| Residential mortgage | $ | 19,758 |
| | $ | 14,707 |
| | n/a |
| | $ | 10,697 |
| | $ | 358 |
|
| Home equity | 2,624 |
| | 1,103 |
| | n/a |
| | 734 |
| | 49 |
|
| Discontinued real estate | 468 |
| | 260 |
| | n/a |
| | 240 |
| | 8 |
|
| With an allowance recorded | | | | | |
| | | | |
| Residential mortgage | 14,080 |
| | 13,051 |
| | $ | 1,233 |
| | 11,439 |
| | 417 |
|
| Home equity | 1,256 |
| | 1,022 |
| | 448 |
| | 1,145 |
| | 44 |
|
| Discontinued real estate | 143 |
| | 107 |
| | 19 |
| | 136 |
| | 6 |
|
| Total | |
| | |
| | |
| | |
| | |
|
| Residential mortgage | $ | 33,838 |
| | $ | 27,758 |
| | $ | 1,233 |
| | $ | 22,136 |
| | $ | 775 |
|
| Home equity | 3,880 |
| | 2,125 |
| | 448 |
| | 1,879 |
| | 93 |
|
| Discontinued real estate | 611 |
| | 367 |
| | 19 |
| | 376 |
| | 14 |
|
| | | | | | | | | | |
| | December 31, 2011 | | 2011 |
| With no recorded allowance | | | | | | | | | |
| Residential mortgage | $ | 10,907 |
| | $ | 8,168 |
| | n/a |
| | $ | 6,285 |
| | $ | 233 |
|
| Home equity | 1,747 |
| | 479 |
| | n/a |
| | 442 |
| | 23 |
|
| Discontinued real estate | 421 |
| | 240 |
| | n/a |
| | 222 |
| | 8 |
|
| With an allowance recorded | | | | | | | | | |
| Residential mortgage | 12,296 |
| | 11,119 |
| | $ | 1,295 |
| | 9,379 |
| | 319 |
|
| Home equity | 1,551 |
| | 1,297 |
| | 622 |
| | 1,357 |
| | 34 |
|
| Discontinued real estate | 213 |
| | 159 |
| | 29 |
| | 173 |
| | 6 |
|
| Total | | | | | | | | | |
| Residential mortgage | $ | 23,203 |
| | $ | 19,287 |
| | $ | 1,295 |
| | $ | 15,664 |
| | $ | 552 |
|
| Home equity | 3,298 |
| | 1,776 |
| | 622 |
| | 1,799 |
| | 57 |
|
| Discontinued real estate | 634 |
| | 399 |
| | 29 |
| | 395 |
| | 14 |
|
| |
(1) | Interest income recognized includes interest accrued and collected on the outstanding balances of accruing impaired loans as well as interest cash collections on nonaccruing impaired loans for which the ultimate collectability of principal is considered collectible. |
n/a = not applicable
The table below presents the December 31, 2012 and 2011 unpaid principal balance, carrying value, and average pre- and post-modification interest rates of home loans that were modified in TDRs during 2012 and 2011, and net charge-offs that were recorded during the period in which the modification occurred. The
following Home Loans portfolio segment tables include loans that were initially classified as TDRs during the period and also loans that had previously been classified as TDRs and were modified again during the period. These TDRs are managed by Legacy Assets & Servicing.
|
| | | | | | | | | | | | | | | | | |
| | | | | | | | | | |
Home Loans – TDRs Entered into During 2012 and 2011 (1) |
| | |
| | December 31, 2012 | | 2012 |
| (Dollars in millions) | Unpaid Principal Balance | | Carrying Value | | Pre-modification Interest Rate | | Post-modification Interest Rate | | Net Charge-offs |
| Residential mortgage | $ | 14,929 |
| | $ | 12,143 |
| | 5.52 | % | | 4.70 | % | | $ | 507 |
|
| Home equity | 1,721 |
| | 858 |
| | 5.22 |
| | 4.39 |
| | 716 |
|
| Discontinued real estate | 159 |
| | 85 |
| | 5.21 |
| | 4.35 |
| | 16 |
|
| Total | $ | 16,809 |
| | $ | 13,086 |
| | 5.49 |
| | 4.66 |
| | $ | 1,239 |
|
| | | | | | | | | | |
| | December 31, 2011 | | 2011 |
| Residential mortgage | $ | 11,623 |
| | $ | 9,903 |
| | 5.94 | % | | 5.16 | % | | $ | 299 |
|
| Home equity | 1,112 |
| | 556 |
| | 6.58 |
| | 5.25 |
| | 239 |
|
| Discontinued real estate | 141 |
| | 88 |
| | 6.68 |
| | 5.08 |
| | 9 |
|
| Total | $ | 12,876 |
| | $ | 10,547 |
| | 6.01 |
| | 5.17 |
| | $ | 547 |
|
| |
(1) | TDRs entered into during 2012 include principal forgiveness as follows: residential mortgage modifications of $755 million, home equity modifications of $9 million and discontinued real estate modifications of $23 million. Prior to 2012, the principal forgiveness amount was not uncertain.significant. |
The table below presents the December 31, 2012 and 2011 carrying value for home loans that were modified in TDRs during 2012 and 2011 by type of modification.
|
| | | | | | | | | | | | | | | |
| | | | | | | | |
| Home Loans – Modification Programs |
| | |
| | TDRs Entered into During 2012 |
| (Dollars in millions) | Residential Mortgage | | Home Equity | | Discontinued Real Estate | | Total Carrying Value |
| Modifications under government programs | | | | | | | |
| Contractual interest rate reduction | $ | 638 |
| | $ | 78 |
| | $ | 4 |
| | $ | 720 |
|
| Principal and/or interest forbearance | 49 |
| | 31 |
| | 2 |
| | 82 |
|
Other modifications (1) | 37 |
| | 1 |
| | — |
| | 38 |
|
| Total modifications under government programs | 724 |
| | 110 |
| | 6 |
| | 840 |
|
| Modifications under proprietary programs | | | | | | | |
| Contractual interest rate reduction | 3,343 |
| | 44 |
| | 7 |
| | 3,394 |
|
| Capitalization of past due amounts | 143 |
| | — |
| | 1 |
| | 144 |
|
| Principal and/or interest forbearance | 415 |
| | 16 |
| | 9 |
| | 440 |
|
Other modifications (1) | 97 |
| | 21 |
| | — |
| | 118 |
|
| Total modifications under proprietary programs | 3,998 |
| | 81 |
| | 17 |
| | 4,096 |
|
| Trial modifications | 4,505 |
| | 69 |
| | 42 |
| | 4,616 |
|
Loans discharged in Chapter 7 bankruptcy (2) | 2,916 |
| | 598 |
| | 20 |
| | 3,534 |
|
| Total modifications | $ | 12,143 |
| | $ | 858 |
| | $ | 85 |
| | $ | 13,086 |
|
| | | | | | | | |
| | TDRs Entered into During 2011 |
| Modifications under government programs | | | | | | | |
| Contractual interest rate reduction | $ | 984 |
| | $ | 189 |
| | $ | 10 |
| | $ | 1,183 |
|
| Principal and/or interest forbearance | 187 |
| | 36 |
| | 2 |
| | 225 |
|
Other modifications (1) | 64 |
| | 5 |
| | — |
| | 69 |
|
| Total modifications under government programs | 1,235 |
| | 230 |
| | 12 |
| | 1,477 |
|
| Modifications under proprietary programs | | | | | | | |
| Contractual interest rate reduction | 3,508 |
| | 101 |
| | 23 |
| | 3,632 |
|
| Capitalization of past due amounts | 408 |
| | 1 |
| | 2 |
| | 411 |
|
| Principal and/or interest forbearance | 936 |
| | 49 |
| | 10 |
| | 995 |
|
Other modifications (1) | 439 |
| | 34 |
| | 2 |
| | 475 |
|
| Total modifications under proprietary programs | 5,291 |
| | 185 |
| | 37 |
| | 5,513 |
|
| Trial modifications | 3,377 |
| | 141 |
| | 39 |
| | 3,557 |
|
| Total modifications | $ | 9,903 |
| | $ | 556 |
| | $ | 88 |
| | $ | 10,547 |
|
| |
(1) | Includes other modifications such as term or payment extensions and repayment plans. |
| |
(2) | Includes U.S. small business commercial renegotiated TDR loans and related allowance.newly classified as TDRs in accordance with new regulatory guidance on loans discharged in Chapter 7 bankruptcy that was issued in 2012. |
The table below presents the carrying value of loans that entered into payment default during 2012 and 2011 and that were modified in a TDR during the 12 months preceding payment default. A payment default for home loan TDRs is recognized when a borrower has missed three monthly payments (not necessarily
consecutively) since modification. Payment default on trial modification where the borrower has not yet met the terms of the agreement are included in the table below if the borrower is 90 days or more past due three months after the offer to modify is made.
|
| | | | | | | | | | | | | | | |
| | | | | | | | |
| Home Loans – TDRs Entering Payment Default That Were Modified During the Preceding Twelve Months |
| | |
| | 2012 |
| (Dollars in millions) | Residential Mortgage | | Home Equity | | Discontinued Real Estate | | Total Carrying Value |
| Modifications under government programs | $ | 200 |
| | $ | 8 |
| | $ | 2 |
| | $ | 210 |
|
| Modifications under proprietary programs | 933 |
| | 14 |
| | 9 |
| | 956 |
|
Loans discharged in Chapter 7 bankruptcy (1) | 1,216 |
| | 53 |
| | 12 |
| | 1,281 |
|
| Trial modifications | 2,323 |
| | 20 |
| | 28 |
| | 2,371 |
|
| Total modifications | $ | 4,672 |
| | $ | 95 |
| | $ | 51 |
| | $ | 4,818 |
|
| | | | | | | | |
| | 2011 |
| Modifications under government programs | $ | 350 |
| | $ | 2 |
| | $ | 2 |
| | $ | 354 |
|
| Modifications under proprietary programs | 2,086 |
| | 42 |
| | 12 |
| | 2,140 |
|
| Trial modifications | 1,094 |
| | 17 |
| | 7 |
| | 1,118 |
|
| Total modifications | $ | 3,530 |
| | $ | 61 |
| | $ | 21 |
| | $ | 3,612 |
|
| |
(1) | Includes loans classified as TDRs at December 31, 2012 due to loans discharged in Chapter 7 bankruptcy in 2012 or 2011. |
n/Credit Card and Other Consumer
Impaired loans within the Credit Card and Other Consumer portfolio segment consist entirely of loans that have been modified in TDRs (the renegotiated credit card and other consumer TDR portfolio collectively referred to as the renegotiated TDR portfolio). The Corporation seeks to assist customers that are experiencing financial difficulty by modifying loans while ensuring compliance with federal laws and guidelines. Substantially all of the Corporation’s credit card and other consumer loan modifications involve reducing the interest rate on the account and placing the customer on a =fixed payment plan not applicableexceeding 60 months, all of which are considered TDRs. In all cases, the customer’s available line of credit is canceled. The Corporation makes loan modifications directly with borrowers for debt held only by the Corporation (internal programs). Additionally, the Corporation makes loan modifications for borrowers working with third-party renegotiation agencies that provide solutions to customers’ entire unsecured debt structures (external programs).
In 2012, new regulatory guidance was issued addressing certain consumer real estate loans that have been discharged in Chapter 7 bankruptcy. The Corporation applies this guidance to
other secured consumer loans that have been discharged in Chapter 7 bankruptcy, and such loans are classified as TDRs, written down to collateral value and placed on nonaccrual status no later than the time of discharge.
All credit card and substantially all other consumer loans that have been modified in TDRs remain on accrual status until the loan is either paid in full or charged off, which occurs no later than the end of the month in which the loan becomes 180 days past due or 120 days past due for a loan that was placed on a fixed payment plan after July 1, 2012.
The allowance for impaired credit card loans is based on the present value of projected cash flows, which incorporates the Corporation’s historical payment default and loss experience on modified loans, discounted using the portfolio’s average contractual interest rate, excluding promotionally priced loans, in effect prior to restructuring. Prior to modification, credit card and other consumer loans are included in homogeneous pools which are collectively evaluated for impairment. For these portfolios, loss forecast models are utilized that consider a variety of factors including, but not limited to, historical loss experience, delinquencies, economic trends and credit scores.
|
| | |
| | | Bank of America 2012 193197 |
The table below provides information on the Corporation’s renegotiated TDR portfolio at and for the years ended December 31, 2012 and 2011.
|
| | | | | | | | | | | | | | | | | | | |
| | | | | | | | | | |
| Impaired Loans – Credit Card and Other Consumer – Renegotiated TDRs |
| | | | |
| | December 31, 2012 | | 2012 |
| (Dollars in millions) | Unpaid
Principal Balance | | Carrying Value (1) | | Related Allowance | | Average
Carrying Value | | Interest
Income Recognized (2) |
| With an allowance recorded | |
| | |
| | |
| | |
| | |
|
| U.S. credit card | $ | 2,856 |
| | $ | 2,871 |
| | $ | 719 |
| | $ | 4,085 |
| | $ | 253 |
|
| Non-U.S. credit card | 311 |
| | 316 |
| | 198 |
| | 464 |
| | 10 |
|
| Direct/Indirect consumer | 633 |
| | 636 |
| | 210 |
| | 929 |
| | 50 |
|
| Without an allowance recorded | |
| | |
| | |
| | |
| | |
|
| Direct/Indirect consumer | 105 |
| | 58 |
| | — |
| | 58 |
| | — |
|
| Total | |
| | |
| | |
| | |
| | |
|
| U.S. credit card | $ | 2,856 |
| | $ | 2,871 |
| | $ | 719 |
| | $ | 4,085 |
| | $ | 253 |
|
| Non-U.S. credit card | 311 |
| | 316 |
| | 198 |
| | 464 |
| | 10 |
|
| Direct/Indirect consumer | 738 |
| | 694 |
| | 210 |
| | 987 |
| | 50 |
|
| | | | | | | | | | |
| | December 31, 2011 | | 2011 |
| With an allowance recorded | | | | | | | | | |
| U.S. credit card | $ | 5,272 |
| | $ | 5,305 |
| | $ | 1,570 |
| | $ | 7,211 |
| | $ | 433 |
|
| Non-U.S. credit card | 588 |
| | 597 |
| | 435 |
| | 759 |
| | 6 |
|
| Direct/Indirect consumer | 1,193 |
| | 1,198 |
| | 405 |
| | 1,582 |
| | 85 |
|
| |
(1) | Includes accrued interest and fees. |
| |
(2) | Interest income recognized includes interest accrued and collected on the outstanding balances of accruing impaired loans as well as interest cash collections on nonaccruing impaired loans for which the principal is considered collectible. |
The table below provides information on the Corporation’s primary modification programs for the renegotiated TDR portfolio at December 31, 2012 and 2011.
|
| | | | | | | | | | | | | | | | | | | | | | | | | | | | | | | | | | | | | |
| | | | | | | | | | | | | | | | | | | | |
| Credit Card and Other Consumer – Renegotiated TDRs by Program Type |
| | | | | | | | | | |
| | December 31 |
| | Internal Programs | | External Programs | | Other | | Total | | Percent of Balances Current or Less Than 30 Days Past Due |
| (Dollars in millions) | 2012 | | 2011 | | 2012 | | 2011 | | 2012 | | 2011 | | 2012 | | 2011 | | 2012 | | 2011 |
| U.S. credit card | $ | 1,887 |
| | $ | 3,788 |
| | $ | 953 |
| | $ | 1,436 |
| | $ | 31 |
| | $ | 81 |
| | $ | 2,871 |
| | $ | 5,305 |
| | 81.48 | % | | 78.97 | % |
| Non-U.S. credit card | 99 |
| | 218 |
| | 38 |
| | 113 |
| | 179 |
| | 266 |
| | 316 |
| | 597 |
| | 43.71 |
| | 54.02 |
|
| Direct/Indirect consumer | 405 |
| | 784 |
| | 225 |
| | 392 |
| | 64 |
| | 22 |
| | 694 |
| | 1,198 |
| | 83.11 |
| | 80.01 |
|
| Total renegotiated TDRs | $ | 2,391 |
| | $ | 4,790 |
| | $ | 1,216 |
| | $ | 1,941 |
| | $ | 274 |
| | $ | 369 |
| | $ | 3,881 |
| | $ | 7,100 |
| | 78.69 |
| | 77.05 |
|
Table of Contents
The Commercial table below presents theAt December 31, 2012 and 2011, the Corporation had a renegotiated TDR portfolio of $3.9 billion and $7.1 billion of which $3.1 billion was current or less than 30 days past due under the modified terms at December 31, 2012.
The table below provides information on the Corporation’s
renegotiated TDR portfolio including the unpaid principal balance, and carrying value and average pre- and post-modification interest rates of commercial loans that were modified asin TDRs during 2012 and 2011, along withand net charge-offs that were recorded during the period in which the modification occurred.
|
| | | | | | | | | | | | | | | | | |
| | | | | | | | | | |
| Credit Card and Other Consumer – Renegotiated TDRs Entered into During 2012 and 2011 |
| | |
| | December 31, 2012 | | 2012 |
| (Dollars in millions) | Unpaid Principal Balance | | Carrying Value (1) | | Pre-modification Interest Rate | | Post-modification Interest Rate | | Net Charge-offs |
| U.S. credit card | $ | 396 |
| | $ | 400 |
| | 17.59 | % | | 6.36 | % | | $ | 45 |
|
| Non-U.S. credit card | 196 |
| | 206 |
| | 26.19 |
| | 1.15 |
| | 190 |
|
| Direct/Indirect consumer | 160 |
| | 113 |
| | 9.59 |
| | 5.72 |
| | 52 |
|
| Total | $ | 752 |
| | $ | 719 |
| | 18.79 |
| | 4.77 |
| | $ | 287 |
|
| | | | | | | | | | |
| | December 31, 2011 | | 2011 |
| U.S. credit card | $ | 890 |
| | $ | 902 |
| | 19.04 | % | | 6.16 | % | | $ | 106 |
|
| Non-U.S. credit card | 305 |
| | 322 |
| | 26.32 |
| | 1.04 |
| | 291 |
|
| Direct/Indirect consumer | 198 |
| | 199 |
| | 15.63 |
| | 5.22 |
| | 23 |
|
| Total | $ | 1,393 |
| | $ | 1,423 |
| | 20.20 |
| | 4.87 |
| | $ | 420 |
|
| |
(1) | Includes accrued interest and fees. |
The table below provides information on the Corporation’s primary modification programs for the renegotiated TDR portfolio for loans that were modified in TDRs during 2012 and 2011. As a result of the retrospective application of new accounting guidance on TDRs, the Corporation classified as TDRs $1.1 billion of commercial loan modifications. See Note 1 – Summary of Significant Accounting Principles for additional information.
|
| | | | | | | | | | | |
| | | | | | |
| Commercial - TDRs Entered into During 2011 |
| | |
| | |
| | December 31, 2011 | | 2011 |
| (Dollars in millions) | Unpaid Principal Balance | | Carrying Value | | Net Charge-offs |
| U.S commercial | $ | 1,381 |
| | $ | 1,211 |
| | $ | 74 |
|
| Commercial real estate | 1,604 |
| | 1,333 |
| | 152 |
|
| Non-U.S. commercial | 44 |
| | 44 |
| | — |
|
| U.S. small business commercial | 58 |
| | 59 |
| | 10 |
|
| Total | $ | 3,087 |
| | $ | 2,647 |
| | $ | 236 |
|
|
| | | | | | | | | | | | | | | |
| | | | | | | | |
| Credit Card and Other Consumer – Renegotiated TDRs by Program Type |
| | |
| | Renegotiated TDRs Entered into During 2012 |
| | December 31, 2012 |
| (Dollars in millions) | Internal Programs | | External Programs | | Other | | Total |
| U.S. credit card | $ | 248 |
| | $ | 152 |
| | $ | — |
| | $ | 400 |
|
| Non-U.S. credit card | 112 |
| | 94 |
| | — |
| | 206 |
|
| Direct/Indirect consumer | 36 |
| | 19 |
| | 58 |
| | 113 |
|
| Total renegotiated TDR loans | $ | 396 |
| | $ | 265 |
| | $ | 58 |
| | $ | 719 |
|
| | | | | | | | |
| | Renegotiated TDRs Entered into During 2011 |
| | December 31, 2011 |
| U.S. credit card | $ | 492 |
| | $ | 407 |
| | $ | 3 |
| | $ | 902 |
|
| Non-U.S. credit card | 163 |
| | 158 |
| | 1 |
| | 322 |
|
| Direct/Indirect consumer | 112 |
| | 87 |
| | — |
| | 199 |
|
| Total renegotiated TDR loans | $ | 767 |
| | $ | 652 |
| | $ | 4 |
| | $ | 1,423 |
|
A commercial TDR is generally deemed to be in payment default when the loan is 90 days or more past due, including delinquencies that were not resolved as part of the modification. U.S. small business commercial TDRsCredit card and other consumer loans are deemed to be in payment default during the quarter in which a borrower misses the second of two consecutive payments. Payment defaults are one of the factors considered when projecting future cash flows along with observable market prices or fair valuein the calculation of collateral when measuring the allowance for loan losses. TDRs that were in payment default atlosses for impaired credit card and other consumer loans. At December 31, 20112012, the allowance for loan and lease losses on the Corporation’s renegotiated portfolio was 29.04 percent had aof the carrying value of these loans. Loans that entered into payment default during 2012 and 2011 that had been modified in a TDR during the 12 months preceding payment default were $164203 million and $863 million for U.S. commercial,credit card, $446298 million and $409 million for commercial real estatenon-U.S. credit card and $6835 million and $180 million for U.S. small business commercial.direct/indirect consumer.
Purchased Credit-impaired Loans
PCIThe Corporation purchases loans with and without evidence of credit quality deterioration since origination. Evidence of credit quality deterioration as of the purchase date may include statistics such as past due status, refreshed borrower credit scores and refreshed loan-to-value (LTV) ratios, some of which are acquirednot
immediately available as of the purchase date. Purchased loans with evidence of credit quality deterioration since origination for which it is probable that the Corporation will not receive all contractually required payments receivable are accounted for as PCI loans. The excess of the cash flows expected to be collected on PCI loans, measured as of the acquisition date, over the estimated fair value is referred to as the accretable yield and is recognized in interest income over the remaining life of the loan using a level yield methodology. The difference between contractually required payments as of the acquisition date and the cash flows expected to be collected is referred to as the nonaccretable difference. PCI loans that have similar risk characteristics, primarily credit risk, collateral type and interest rate risk, are pooled and accounted for as a single asset with a single composite interest rate and an aggregate expectation of cash flows. Once a pool is assembled, it is treated as if it was one loan for purposes of applying the accounting guidance for PCI loans. An individual loan is removed from a PCI loan pool if it is sold, foreclosed, forgiven or the expectation of any future proceeds is remote. When a loan is removed from a PCI loan pool and the foreclosure or recovery value of the loan is less than the loan’s carrying value, the difference is first applied against the PCI pool’s nonaccretable difference. If the nonaccretable difference has been fully utilized, only then is the PCI pool’s basis applicable to that loan written-off against its valuation reserve; however, the integrity of the pool is maintained and it continues to be accounted for as if it was one loan.
The Corporation continues to estimate cash flows expected to be collected over the life of the PCI loans using internal credit risk, interest rate and prepayment risk models that incorporate management’s best estimate of current key assumptions such as default rates, loss severity and payment speeds. If, upon subsequent evaluation, the Corporation determines it is probable that the present value of the expected cash flows has decreased, the PCI loan is considered to be further impaired resulting in a charge to the provision for credit losses and a corresponding increase to a valuation allowance included in the allowance for loan and lease losses. If, upon subsequent evaluation, it is probable that there is an increase in the present value of the expected cash flows, the Corporation reduces any remaining valuation allowance. If there is no remaining valuation allowance, the Corporation recalculates the amount of accretable yield as the excess of the revised expected cash flows over the current carrying value resulting in a reclassification from nonaccretable difference to accretable yield. The present value of the expected cash flows is determined using the PCI loans’ effective interest rate, adjusted for changes in the PCI loans’ interest rate indices.
Leases
The Corporation provides equipment financing to its customers through a variety of lease arrangements. Direct financing leases are carried at purchase datethe aggregate of lease payments receivable plus estimated residual value of the leased property less unearned income. Leveraged leases, which are a form of financing leases, are carried net of non-recourse debt. Unearned income on leveraged and direct financing leases is accreted to interest income over the lease terms using methods that approximate the interest method.
Allowance for Credit Losses
The allowance for credit losses, which includes the allowance for loan and lease losses and the reserve for unfunded lending
commitments, represents management’s estimate of probable losses inherent in the Corporation’s lending activities. The allowance for loan and lease losses and the reserve for unfunded lending commitments exclude amounts for loans and unfunded lending commitments accounted for under the fair value option as the fair values of these instruments reflect a credit component. The allowance for loan and lease losses does not include amounts related to accrued interest receivable, other than billed interest and fees on credit card receivables, as accrued interest receivable is reversed when a loan is placed on nonaccrual status. The allowance for loan and lease losses represents the estimated probable credit losses on funded consumer and commercial loans and leases while the reserve for unfunded lending commitments, including standby letters of credit (SBLCs) and binding unfunded loan commitments, represents estimated probable credit losses on these unfunded credit instruments based on utilization assumptions. Lending-related credit exposures deemed to be uncollectible, excluding loans carried at fair value, are charged against these accounts. Write-offs on PCI loans on which there is a valuation allowance are written-off against the valuation allowance. For additional information, see Purchased Credit-impaired Loans. Cash recovered on previously charged off amounts is recorded as a recovery to these accounts. Management evaluates the adequacy of the allowance for credit losses based on the combined total of the allowance for loan and lease losses and the reserve for unfunded lending commitments.
The Corporation performs periodic and systematic detailed reviews of its lending portfolios to identify credit risks and to assess the overall collectability of those portfolios. The allowance on certain homogeneous consumer loan portfolios, which generally consist of consumer real estate within the Home Loans portfolio segment and credit card loans within the Credit Card and Other Consumer portfolio segment, is based on aggregated portfolio segment evaluations generally by product type. Loss forecast models are utilized for these portfolios which consider a variety of factors including, but not limited to, historical loss experience, estimated defaults or foreclosures based on portfolio trends, delinquencies, bankruptcies, economic conditions and credit scores.
The Corporation’s Home Loans portfolio segment is comprised primarily of large groups of homogeneous consumer loans secured by residential real estate. The amount of losses incurred in the homogeneous loan pools is estimated based upon how many of the loans will default and the loss in the event of default. Using modeling methodologies, the Corporation estimates how many of the homogeneous loans will default based on the individual loans’ attributes aggregated into pools of homogeneous loans with similar attributes. The attributes that are most significant to the probability of default and are used to estimate default include refreshed LTV or in the case of a subordinated lien, refreshed combined loan-to-value (CLTV), borrower credit score, months since origination (referred to as vintage) and geography, all of which are further broken down by present collection status (whether the loan is current, delinquent, in default or in bankruptcy). This estimate is based on the Corporation’s historical experience with the loan portfolio. The estimate is adjusted to reflect an assessment of environmental factors not yet reflected in the historical data underlying the loss estimates, such as changes in real estate values, local and national economies, underwriting standards and the regulatory environment. The probability of default on a loan is based on an analysis of the movement of loans with the measured attributes from either current or any of the delinquency categories
to default over a twelve-month period. On home equity loans where the Corporation holds only a second-lien position and foreclosure is not the best alternative, the loss severity is estimated at 100 percent.
The allowance on certain commercial loans (except business card and certain small business loans) is calculated using loss rates delineated by risk rating and product type. Factors considered when assessing loss rates include the value of the underlying collateral, if applicable, the industry of the obligor, and the obligor’s liquidity and other financial indicators along with certain qualitative factors. These statistical models are updated regularly for changes in economic and business conditions. Included in the analysis of consumer and commercial loan portfolios are reserves which are maintained to cover uncertainties that affect the Corporation’s estimate of probable losses including domestic and global economic uncertainty and large single name defaults.
The remaining portfolios, including nonperforming commercial loans, as well as consumer and commercial loans modified in a troubled debt restructuring (TDR) are reviewed in accordance with applicable accounting guidance on impaired loans and TDRs. If necessary, a specific allowance is established for these loans if they are deemed to be impaired. A loan is considered impaired when, based on current information and events, it is probable that the Corporation will be unable to collect all contractually required payments. PCIamounts due, including principal and/or interest, in accordance with the contractual terms of the agreement, and once a loan has been identified as impaired, management measures impairment. Impaired loans and TDRs are pooledprimarily measured based on similarthe present value of payments expected to be received, discounted at the loans’ original effective contractual interest rates, or discounted at the portfolio average contractual annual percentage rate, excluding promotionally priced loans, in effect prior to restructuring. Impaired loans and TDRs may also be measured based on observable market prices, or for loans that are solely dependent on the collateral for repayment, the estimated fair value of the collateral less estimated costs to sell. If the recorded investment in impaired loans exceeds this amount, a specific allowance is established as a component of the allowance for loan and lease losses unless these are secured consumer loans that are solely dependent on the collateral for repayment, in which case the initial amount that exceeds the fair value of the collateral is charged off.
Generally, when determining the fair value of the collateral securing consumer real estate-secured loans that are solely dependent on the collateral for repayment, prior to performing a detailed property valuation including a walk-through of a property, the Corporation initially estimates the fair value of the collateral securing these consumer loans using an automated valuation method (AVM). An AVM is a tool that estimates the value of a property by reference to market data including sales of comparable properties and price trends specific to the Metropolitan Statistical Area in which the property being valued is located. In the event that an AVM value is not available, the Corporation utilizes publicized indices or if these methods provide less reliable valuations, the Corporation uses appraisals or broker price opinions to estimate the fair value of the collateral. While there is inherent imprecision in these valuations, the Corporation believes that they are representative of the portfolio in the aggregate.
In addition to the allowance for loan and lease losses, the Corporation also estimates probable losses related to unfunded lending commitments, such as letters of credit and financial guarantees, and binding unfunded loan commitments. The reserve for unfunded lending commitments excludes commitments
characteristicsaccounted for under the fair value option. Unfunded lending commitments are subject to individual reviews and evaluatedare analyzed and segregated by risk according to the Corporation’s internal risk rating scale. These risk classifications, in conjunction with an analysis of historical loss experience, utilization assumptions, current economic conditions, performance trends within the portfolio and any other pertinent information, result in the estimation of the reserve for impairmentunfunded lending commitments.
The allowance for credit losses related to the loan and lease portfolio is reported separately on the Consolidated Balance Sheet whereas the reserve for unfunded lending commitments is reported on the Consolidated Balance Sheet in accrued expenses and other liabilities. The provision for credit losses related to the loan and lease portfolio and unfunded lending commitments is reported in the Consolidated Statement of Income.
Nonperforming Loans and Leases, Charge-offs and Delinquencies
Nonperforming loans and leases generally include loans and leases that have been placed on nonaccrual status, including nonaccruing loans whose contractual terms have been restructured in a manner that grants a concession to a borrower experiencing financial difficulties. Loans accounted for under the fair value option, PCI loans and LHFS are not reported as nonperforming loans and leases.
In accordance with the Corporation’s policies, consumer real estate-secured loans, including residential mortgages and home equity loans, are generally placed on nonaccrual status and classified as nonperforming at 90 days past due unless repayment of the loan is insured by the Federal Housing Administration (FHA) or through individually insured long-term standby agreements with Fannie Mae (FNMA) or Freddie Mac (FHLMC) (the fully-insured portfolio). Residential mortgage loans in the fully-insured portfolio are not placed on nonaccrual status and, therefore, are not reported as nonperforming loans. Junior-lien home equity loans are placed on nonaccrual status and classified as nonperforming when the underlying first-lien mortgage loan becomes 90 days past due even if the junior-lien loan is current. Accrued interest receivable is reversed when a consumer loan is placed on nonaccrual status. Interest collections on nonaccruing consumer loans for which the ultimate collectability of principal is uncertain are generally applied as principal reductions; otherwise, such collections are credited to interest income when received. These loans may be restored to accrual status when all principal and interest is current and full repayment of the remaining contractual principal and interest is expected, or when the loan otherwise becomes well-secured and is in the process of collection. The outstanding balance of real estate-secured loans that is in excess of the estimated property value, less estimated costs to sell, is charged off no later than the end of the month in which the account becomes 180 days past due unless the loan is fully insured. The estimated property value, less estimated costs to sell, is determined using the same process as described for impaired loans in the Allowance for Credit Losses section of this Note.
Consumer loans secured by personal property, credit card loans and other unsecured consumer loans are not placed on nonaccrual status prior to charge-off and, therefore, are not reported as nonperforming loans, except for certain secured consumer loans, including those that have been modified in a TDR. Personal property-secured loans are charged off to collateral value no later than the end of the month in which the account becomes 120
days past due or, for loans in bankruptcy, 60 days past due. Credit card and other unsecured consumer loans are charged off no later than the end of the month in which the account becomes 180 days past due or within 60 days after receipt of notification of death or bankruptcy.
Commercial loans and leases, excluding business card loans, that are past due 90 days or more as to principal or interest, or where reasonable doubt exists as to timely collection, including loans that are individually identified as being impaired, are generally placed on nonaccrual status and classified as nonperforming unless well-secured and in the process of collection.
Accrued interest receivable is reversed when commercial loans and leases are placed on nonaccrual status. Interest collections on nonaccruing commercial loans and leases for which the ultimate collectability of principal is uncertain are applied as principal reductions; otherwise, such collections are credited to income when received. Commercial loans and leases may be restored to accrual status when all principal and interest is current and full repayment of the remaining contractual principal and interest is expected, or when the loan otherwise becomes well-secured and is in the process of collection. Business card loans are charged off no later than the end of the month in which the account becomes 180 days past due or 60 days after receipt of notification of death or bankruptcy filing. These loans are not placed on nonaccrual status prior to charge-off and, therefore, are not reported as nonperforming loans. Other commercial loans and leases are generally charged off when all or a portion of the principal amount is determined to be uncollectible.
The entire balance of a consumer loan or commercial loan or lease is contractually delinquent if the minimum payment is not received by the specified due date on the customer’s billing statement. Interest and fees continue to accrue on past due loans and leases until the date the loan is placed on nonaccrual status, if applicable.
PCI loans are recorded at fair value at the acquisition date. Although the PCI loans may be contractually delinquent, the Corporation does not classify these loans as nonperforming as the loans were written down to fair value at the acquisition date and the accretable yield is recognized in interest income over the remaining life of the loan. In addition, reported net charge-offs exclude write-offs on PCI loans as the fair value already considers the estimated credit losses.
Troubled Debt Restructurings
Consumer loans and commercial loans and leases whose contractual terms have been restructured in a manner that grants a concession to a borrower experiencing financial difficulties are classified as TDRs. Concessions could include a reduction in the interest rate to a rate that is below market on the loan, payment extensions, forgiveness of principal, forbearance, or other actions designed to maximize collections. Secured consumer loans that have been discharged in Chapter 7 bankruptcy and have not been reaffirmed by the borrower are classified as TDRs at the time of discharge. Consumer real estate-secured loans for which a binding offer to restructure has been extended are also classified as TDRs. Loans classified as TDRs are considered impaired loans. Loans that are carried at fair value, LHFS and PCI loans are not classified as TDRs.
Secured consumer loans whose contractual terms have been modified in a TDR and are current at the time of restructuring generally remain on accrual status if there is demonstrated performance prior to the restructuring and payment in full under the restructured terms is expected. Otherwise, the loans are placed on nonaccrual status and reported as nonperforming, except for the fully-insured loans, until there is sustained repayment performance for a reasonable period, generally six months. If accruing consumer TDRs cease to perform in accordance with their modified contractual terms, they are placed on nonaccrual status and reported as nonperforming TDRs. Consumer TDRs that bear a below-market rate of interest are generally reported as TDRs throughout their remaining lives. Secured consumer loans that have been discharged in Chapter 7 bankruptcy are placed on nonaccrual status and written down to the collateral value, less estimated costs to sell, no later than the time of discharge. Interest collections on these loans are generally recorded in interest income on a poolcash basis. Credit card and other unsecured consumer loans that have been renegotiated in a TDR are not placed on nonaccrual status. Credit card and other unsecured consumer loans that have been renegotiated and placed on a fixed payment plan after July 1, 2012 are generally charged off no later than the end of the month in which the account becomes 120 days past due.
Commercial loans and leases whose contractual terms have been modified in a TDR are typically placed on nonaccrual status and reported as nonperforming until the loans or leases have performed for an adequate period of time under the restructured agreement, generally six months. If the borrower had demonstrated performance under the previous terms and the underwriting process shows the capacity to continue to perform under the modified terms, the loan may remain on accrual status. Accruing commercial TDRs are reported as performing TDRs through the end of the calendar year in which the loans are returned to accrual status. In addition, if accruing commercial TDRs bear less than a market rate of interest at the time of modification, they are reported as performing TDRs throughout their remaining lives unless and until they cease to perform in accordance with their modified contractual terms, at which time they are placed on nonaccrual status and reported as nonperforming TDRs.
A loan that had previously been modified in a TDR and is subsequently refinanced under current underwriting standards at a market rate with no concessionary terms is accounted for as a new loan and is no longer reported as a TDR.
Loans Held-for-sale
Loans that are intended to be sold in the foreseeable future, including residential mortgages, loan syndications, and to a lesser degree, commercial real estate, consumer finance and other loans, are reported as LHFS and are carried at the lower of aggregate cost or fair value. The Corporation accounts for certain LHFS, including first mortgage LHFS, under the fair value option. Mortgage loan origination costs related to LHFS that the Corporation accounts for under the fair value option are recognized
in noninterest expense when incurred. Mortgage loan origination costs for LHFS carried at the lower of cost or fair value are capitalized as part of the carrying amount of the loans and recognized as a reduction of mortgage banking income upon the sale of such loans. LHFS that are on nonaccrual status and are reported as nonperforming, as defined in the policy herein, are reported separately from nonperforming loans and leases.
Premises and Equipment
Premises and equipment are carried at cost less accumulated depreciation and amortization. Depreciation and amortization are recognized using the straight-line method over the estimated useful lives of the assets. Estimated lives range up to 40 years for buildings, up to 12 years for furniture and equipment, and the shorter of lease term or estimated useful life for leasehold improvements.
The Corporation capitalizes the costs associated with certain computer hardware, software and internally developed software, and amortizes the costs over the expected useful life. Direct project costs of internally developed software are capitalized when it is probable that the project will be completed and the software will be used for its intended function.
Mortgage Servicing Rights
The Corporation accounts for consumer-related MSRs at fair value with changes in fair value recorded in mortgage banking income (loss), while commercial-related and residential reverse mortgage MSRs are accounted for using the amortization method (lower of amortized cost or fair value) with impairment recognized as a reduction in mortgage banking income (loss). To reduce the volatility of earnings related to interest rate and market value fluctuations, U.S. Treasury securities, mortgage-backed securities (MBS) and derivatives such as options and interest rate swaps may be used as risk management derivatives to hedge certain market risks of the MSRs, but are not designated as qualifying accounting hedges. These instruments are carried at fair value with changes in fair value recognized in mortgage banking income (loss).
The Corporation estimates the fair value of consumer MSRs using a valuation model that calculates the present value of estimated future net servicing income and, when available, quoted prices from independent parties. The present value calculation is accomplished through an option-adjusted spread (OAS) valuation approach that factors in prepayment risk. This approach consists of projecting servicing cash flows under multiple interest rate scenarios and discounting these cash flows using risk-adjusted discount rates. The key economic assumptions used in MSR valuations include weighted-average lives of the MSRs and the OAS levels. The OAS represents the spread that is added to the discount rate so that the sum of the discounted cash flows equals the market price; therefore, it is a measure of the extra yield over
the reference discount factor that the Corporation expects to earn by holding the asset.
Goodwill and Intangible Assets
Goodwill is the purchase premium after adjusting for the fair value of net assets acquired. Goodwill is not amortized but is reviewed for potential impairment on an annual basis, or when events or circumstances indicate a potential impairment, at the reporting unit level. A reporting unit, as defined under applicable accounting guidance, is a business segment or one level below a business segment. The goodwill impairment analysis is a two-step test. The first step of the goodwill impairment test involves comparing the fair value of each reporting unit with its PCI loan portfoliocarrying amount including goodwill as measured by allocated equity. In certain circumstances, the first step may be performed using a qualitative assessment. If the fair value of the reporting unit exceeds its carrying amount, goodwill of the reporting unit is considered not
impaired; however, if the carrying amount of the reporting unit exceeds its fair value, the second step must be performed to measure potential impairment.
The second step involves calculating an implied fair value of goodwill for each reporting unit for which the first step indicated possible impairment. The implied fair value of goodwill is determined in the same manner as the amount of goodwill recognized in a business combination, which is the excess of the fair value of the reporting unit, as determined in the first step, over the aggregate fair values of the assets, liabilities and identifiable intangibles as if the reporting unit was being acquired in a business combination. Measurement of the fair values of the assets and liabilities of a reporting unit is consistent with the requirements of the fair value measurements accounting guidance, as described herein. The adjustments to measure the assets, liabilities and intangibles at fair value are for the purpose of measuring the implied fair value of goodwill and such adjustments are not reflected in the Consolidated Balance Sheet. If the implied fair value of goodwill exceeds the goodwill assigned to the reporting unit, there is no impairment. If the goodwill assigned to a reporting unit exceeds the implied fair value of goodwill, an impairment charge is recorded for the excess. An impairment loss recognized cannot exceed the amount of goodwill assigned to a reporting unit. An impairment loss establishes a new basis in the goodwill and subsequent reversals of goodwill impairment losses are not permitted under applicable accounting guidance.
For intangible assets subject to amortization, an impairment loss is recognized if the carrying amount of the intangible asset is not recoverable and exceeds fair value. The carrying amount of the intangible asset is considered not recoverable if it exceeds the sum of the undiscounted cash flows expected to result from the use of the asset.
Variable Interest Entities
A VIE is an entity that lacks equity investors or whose equity investors do not have a controlling financial interest in the entity through their equity investments. The entity that has a controlling financial interest in a VIE is referred to as the primary beneficiary and consolidates the VIE. The Corporation is deemed to have a controlling financial interest and is the primary beneficiary of a VIE if it has both the power to direct the activities of the VIE that most significantly impact the VIE’s economic performance and an obligation to absorb losses or the right to receive benefits that could potentially be significant to the VIE. On a quarterly basis, the Corporation reassesses whether it has a controlling financial interest in and is the primary beneficiary of a VIE. The quarterly reassessment process considers whether the Corporation has acquired or divested the power to direct the activities of the VIE through changes in governing documents or other circumstances. The reassessment also considers whether the Corporation has acquired or disposed of a financial interest that could be significant to the VIE, or whether an interest in the VIE has become significant or is no longer significant. The consolidation status of the VIEs with which the Corporation is involved may change as a result of such reassessments. Changes in consolidation status are applied prospectively, with assets and liabilities of a newly consolidated VIE initially recorded at fair value. A gain or loss may be recognized upon deconsolidation of a VIE depending on the carrying amounts of deconsolidated assets and liabilities compared to the fair value of retained interests and ongoing contractual arrangements.
The Corporation primarily uses VIEs for its securitization activities, in which the Corporation transfers whole loans or debt securities into a trust or other vehicle such that the assets are legally isolated from the creditors of the Corporation. Assets held in a trust can only be used to settle obligations of the trust. The creditors of these trusts typically have no recourse to the Corporation except in accordance with the Corporation’s obligations under standard representations and warranties.
When the Corporation is the servicer of whole loans held in a securitization trust, including non-agency residential mortgages, home equity loans, credit cards, automobile loans and student loans, the Corporation has the power to direct the most significant activities of the trust. The Corporation does not have the power to direct the most significant activities of a residential mortgage agency trust unless the Corporation holds substantially all of the issued securities and has the unilateral right to liquidate the trust. The power to direct the most significant activities of a commercial mortgage securitization trust is typically held by the special servicer or by the party holding specific subordinate securities which embody certain controlling rights. The Corporation consolidates a whole-loan securitization trust if it has the power to direct the most significant activities and also holds securities issued by the trust or has other contractual arrangements, other than standard representations and warranties, that could potentially be significant to the trust.
The Corporation may also transfer trading account securities and AFS securities into municipal bond or resecuritization trusts. The Corporation consolidates a municipal bond or resecuritization trust if it has control over the ongoing activities of the trust such as the remarketing of the trust’s liabilities or, if there are no ongoing activities, sole discretion over the design of the trust, including the identification of securities to be transferred in and the structure of securities to be issued, and also retains securities or has liquidity or other commitments that could potentially be significant to the trust. The Corporation does not consolidate a municipal bond or resecuritization trust if one or a limited number of third-party investors share responsibility for the design of the trust or have control over the significant activities of the trust through liquidation or other substantive rights.
Other VIEs used by the Corporation include collateralized debt obligations (CDOs), investment vehicles created on behalf of customers and other investment vehicles. The Corporation does not routinely serve as collateral manager for CDOs and, therefore, does not typically have the power to direct the activities that most significantly impact the economic performance of a CDO. However, following an event of default, if the Corporation is a majority holder of senior securities issued by a CDO and acquires the power to manage the assets of the CDO, the Corporation consolidates the CDO.
The Corporation consolidates a customer or other investment vehicle if it has control over the initial design of the vehicle or manages the assets in the vehicle and also absorbs potentially significant gains or losses through an investment in the vehicle, derivative contracts or other arrangements. The Corporation does not consolidate an investment vehicle if a single investor controlled the initial design of the vehicle or manages the assets in the vehicles or if the Corporation does not have a variable interest that could potentially be significant to the vehicle.
Retained interests in securitized assets are initially recorded at fair value. In addition, the Corporation may invest in debt securities issued by unconsolidated VIEs. Fair values of these debt securities, which are AFS debt securities or trading account assets,
are based primarily on quoted market prices. Generally, quoted market prices for retained residual interests are not available; therefore, the Corporation estimates fair values based on the present value of the associated expected future cash flows. This may require management to estimate credit losses, prepayment speeds, forward interest yield curves, discount rates and other factors that impact the value of retained interests. Retained residual interests in unconsolidated securitization trusts are classified in trading account assets or other assets with changes in fair value recorded in income. The Corporation may also enter into derivatives with unconsolidated VIEs, which are carried at fair value with changes in fair value recorded in income.
Fair Value
The Corporation measures the fair values of its financial instruments in accordance with accounting guidance that requires an entity to base fair value on exit price. A three-level hierarchy for inputs is utilized in measuring fair value which maximizes the use of observable inputs and minimizes the use of unobservable inputs by requiring that observable inputs be used to determine the exit price when available. Under applicable accounting guidance, the Corporation categorizes its financial instruments, based on the priority of inputs to the valuation technique, into this three-level hierarchy, as described below. Trading account assets and liabilities, derivative assets and liabilities, AFS debt and equity securities, MSRs and certain other assets are carried at fair value in accordance with applicable accounting guidanceguidance. The Corporation has also elected to account for certain assets and liabilities under the fair value option, including certain commercial and consumer loans and loan commitments, LHFS, other short-term borrowings, securities financing agreements, asset-backed secured financings, long-term deposits and long-term debt. The following describes the three-level hierarchy.
| |
| Level 1 | Unadjusted quoted prices in active markets for identical assets or liabilities. Level 1 assets and liabilities include debt and equity securities and derivative contracts that are traded in an active exchange market, as well as certain U.S. Treasury securities that are highly liquid and are actively traded in over-the-counter (OTC) markets. |
| |
| Level 2 | Observable inputs other than Level 1 prices, such as quoted prices for similar assets or liabilities, quoted prices in markets that are not active, or other inputs that are observable or can be corroborated by observable market data for substantially the full term of the assets or liabilities. Level 2 assets and liabilities include debt securities with quoted prices that are traded less frequently than exchange-traded instruments and derivative contracts where fair value is determined using a pricing model with inputs that are observable in the market or can be derived principally from or corroborated by observable market data. This category generally includes U.S. government and agency mortgage-backed debt securities, corporate debt securities, derivative contracts, residential mortgage loans and certain LHFS. |
| |
| Level 3 | Unobservable inputs that are supported by little or no market activity and that are significant to the overall fair value of the assets or liabilities. Level 3 assets and liabilities include financial instruments for which the determination of fair value requires significant management judgment or estimation. The fair value for |
such assets and liabilities is generally determined using pricing models, market comparables, discounted cash flow methodologies or similar techniques that incorporate the assumptions a market participant would use in pricing the asset or liability. This category generally includes certain private equity investments and other principal investments, retained residual interests in securitizations, residential MSRs, asset-backed securities (ABS), highly structured, complex or long-dated derivative contracts, certain LHFS, IRLCs and certain CDOs where independent pricing information cannot be obtained for a significant portion of the underlying assets.
Income Taxes
There are two components of income tax expense: current and deferred. Current income tax expense reflects taxes to be paid or refunded for the current period. Deferred income tax expense results from changes in deferred tax assets and liabilities between periods. These gross deferred tax assets and liabilities represent decreases or increases in taxes expected to be paid in the future because of future reversals of temporary differences in the bases of assets and liabilities as measured by tax laws and their bases as reported in the financial statements. Deferred tax assets are also recognized for tax attributes such as net operating loss (NOL) carryforwards and tax credit carryforwards. Valuation allowances are recorded to reduce deferred tax assets to the amounts management concludes are more-likely-than-not to be realized.
Income tax benefits are recognized and measured based upon a two-step model: first, a tax position must be more-likely-than-not to be sustained based solely on its technical merits in order to be recognized, and second, the benefit is measured as the largest dollar amount of that position that is more-likely-than-not to be sustained upon settlement. The difference between the benefit recognized and the tax benefit claimed on a tax return is referred to as an unrecognized tax benefit (UTB). The Corporation records income tax-related interest and penalties, if applicable, within income tax expense.
Retirement Benefits
The Corporation has established retirement plans covering substantially all full-time and certain part-time employees. Pension expense under these plans is charged to current operations and consists of several components of net pension cost based on various actuarial assumptions regarding future experience under the plans.
In addition, the Corporation has established unfunded supplemental benefit plans and supplemental executive retirement plans (SERPs) for selected officers of the Corporation and its subsidiaries that provide benefits that cannot be paid from a qualified retirement plan due to Internal Revenue Code restrictions. The Corporation’s current executive officers do not earn additional retirement income under SERPs. These plans are nonqualified under the Internal Revenue Code and assets used to fund benefit payments are not segregated from other assets of the Corporation; therefore, in general, a participant’s or beneficiary’s claim to benefits under these plans is as a general creditor. In addition, the Corporation has established several postretirement healthcare and life insurance benefit plans.
In connection with a redesign of the retirement plans, on January 24, 2012, the Corporation froze benefits earned in the
Qualified Pension Plans effective June 30, 2012. As a result of this action, a curtailment was triggered and a remeasurement of the qualified pension obligations and plan assets occurred as of January 24, 2012. For additional information, see Note 18 – Employee Benefit Plans.
Accumulated Other Comprehensive Income
The Corporation records unrealized gains and losses on AFS debt and marketable equity securities, gains and losses on cash flow accounting hedges, certain employee benefit plan adjustments, foreign currency translation adjustments and related hedges of net investments in foreign operations and the cumulative adjustment related to certain accounting changes in accumulated OCI, net-of-tax. Unrealized gains and losses on AFS debt and marketable equity securities are reclassified to earnings as the gains or losses are realized upon sale of the securities. Unrealized losses on AFS securities deemed to represent OTTI are reclassified to earnings at the time of the impairment charge. For AFS debt securities that the Corporation does not intend to sell or it is not more-likely-than-not that it will be required to sell, only the credit component of an unrealized loss is reclassified to earnings. Gains or losses on derivatives accounted for as cash flow hedges are reclassified to earnings when the hedged transaction affects earnings. Translation gains or losses on foreign currency translation adjustments are reclassified to earnings upon the substantial sale or liquidation of investments in foreign operations.
Revenue Recognition
The following summarizes the Corporation’s revenue recognition policies as they relate to certain noninterest income line items in the Consolidated Statement of Income.
Card income is derived from fees such as interchange, cash advance, annual, late, over-limit and other miscellaneous fees, which are recorded as revenue when earned, primarily on an accrual basis. Uncollected fees are included in the customer card receivables balances with an amount recorded in the allowance for loan and lease losses for estimated uncollectible card receivables. Uncollected fees are written off when a card receivable reaches 180 days past due.
Service charges include fees for insufficient funds, overdrafts and other banking services and are recorded as revenue when earned. Uncollected fees are included in outstanding loan balances with an amount recorded for estimated uncollectible service fees receivable. Uncollected fees are written off when a fee receivable reaches 60 days past due.
Investment and brokerage services revenue consists primarily of asset management fees and brokerage income that is recognized over the period the services are provided or when commissions are earned. Asset management fees consist primarily of fees for investment management and trust services and are generally based on the dollar amount of the assets being managed. Brokerage income is generally derived from commissions and fees earned on the sale of various financial products.
Investment banking income consists primarily of advisory and underwriting fees that are recognized in income as the services are provided and no contingencies exist. Revenues are generally recognized net of any direct expenses. Non-reimbursed expenses are recorded as noninterest expense.
Earnings Per Common Share
Earnings per common share (EPS) is computed by dividing net income (loss) allocated to common shareholders by the weighted-average common shares outstanding, except that it does not include unvested common shares subject to repurchase or cancellation. Net income (loss) allocated to common shareholders represents net income (loss) applicable to common shareholders which involves estimatingis net income (loss) adjusted for preferred stock dividends including dividends declared, accretion of discounts on preferred stock including accelerated accretion when preferred stock is repaid early, and cumulative dividends related to the current dividend period that have not been declared as of period end, less income allocated to participating securities (see below for additional information). Diluted EPS is computed by dividing income (loss) allocated to common shareholders plus dividends on dilutive convertible preferred stock and preferred stock that can be tendered to exercise warrants by the weighted-average common shares outstanding plus amounts representing the dilutive effect of stock options outstanding, restricted stock, restricted stock units (RSUs), outstanding warrants and the dilution resulting from the conversion of convertible preferred stock, if applicable. Certain warrants may be exercised, at the option of the holder, through tendering of the Corporation’s 6% Cumulative Perpetual Preferred Stock, Series T (the Series T Preferred Stock) or cash. Because it is currently more economical for the warrant holder to tender the Series T preferred stock, the common shares underlying these warrants are considered outstanding and the dividends on the preferred stock are added to income (loss) allocable to common shareholders in computing diluted EPS, unless the effect is antidilutive.
Unvested share-based payment awards that contain nonforfeitable rights to dividends are participating securities that are included in computing EPS using the two-class method. The two-class method is an earnings allocation formula under which EPS is calculated for common stock and participating securities according to dividends declared and participating rights in undistributed earnings. Under this method, all earnings, distributed and undistributed, are allocated to participating securities and common shares based on their respective rights to receive dividends.
In an exchange of non-convertible preferred stock, income allocated to common shareholders is adjusted for the difference between the carrying value of the preferred stock and the fair value of the consideration exchanged. In an induced conversion of convertible preferred stock, income allocated to common shareholders is reduced by the excess of the fair value of the consideration exchanged over the fair value of the common stock that would have been issued under the original conversion terms.
Foreign Currency Translation
Assets, liabilities and operations of foreign branches and subsidiaries are recorded based on the functional currency of each entity. For certain of the foreign operations, the functional currency is the local currency, in which case the assets, liabilities and operations are translated, for consolidation purposes, from the local currency to the U.S. dollar reporting currency at period-end rates for assets and liabilities and generally at average rates for results of operations. The resulting unrealized gains or losses as well as gains and losses from certain hedges, are reported as a component of accumulated OCI, net-of-tax. When the foreign entity’s functional currency is determined to be the U.S. dollar, the resulting remeasurement currency gains or losses on foreign currency-denominated assets or liabilities are included in earnings.
Credit Card and Deposit Arrangements
Endorsing Organization Agreements
The Corporation contracts with other organizations to obtain their endorsement of the Corporation’s loan and deposit products. This endorsement may provide to the Corporation exclusive rights to market to the organization’s members or to customers on behalf of the Corporation. These organizations endorse the Corporation’s loan and deposit products and provide the Corporation with their mailing lists and marketing activities. These agreements generally have terms that range from two to five years. The Corporation typically pays royalties in exchange for the endorsement. Compensation costs related to the credit card agreements are recorded as contra-revenue in card income.
Cardholder Reward Agreements
The Corporation offers reward programs that allow its cardholders to earn points that can be redeemed for a broad range of rewards including cash, travel and discounted products. The Corporation establishes a rewards liability based upon the points earned that are expected to be redeemed and the average cost per point redeemed. The points to be redeemed are estimated based on past redemption behavior, card product type, account transaction activity and other historical card performance. The liability is reduced as the points are redeemed. The estimated cost of the rewards programs is recorded as contra-revenue in card income.
Insurance Income and Insurance Expense
Property and casualty and credit life and disability premiums are generally recognized over the term of the policies on a pro-rata basis for all policies except for certain of the lender-placed auto insurance and the guaranteed auto protection (GAP) policies. For lender-placed auto insurance, premiums are recognized when collections become probable due to high cancellation rates experienced early in the life of the policy. For GAP insurance, revenue recognition is correlated to the exposure and accelerated over the life of the contract. Mortgage reinsurance premiums are recognized as earned. Insurance expense includes insurance claims, commissions and premium taxes, all of which are recorded in other general operating expense.
Accounting Policies
All significant accounting policies are discussed either in this Note or included in the Notes herein listed below.
|
| |
| Page |
| Note 3 – Derivatives | |
| Note 4 – Securities | |
| Note 5 – Outstanding Loans and Leases | |
| Note 7 – Securitizations and Other Variable Interest Entities | |
| Note 8 – Representations and Warranties Obligations and Corporate Guarantees | |
| Note 13 – Commitments and Contingencies | |
| Note 18 – Employee Benefit Plans | |
| Note 19 – Stock-based Compensation Plans | |
| Note 20 – Income Taxes | |
| Note 21 – Fair Value Measurements | |
| Note 24 – Mortgage Servicing Rights | |
NOTE 2 Trading Account Assets and Liabilities
The table below presents the components of trading account assets and liabilities at December 31, 2012 and 2011.
|
| | | | | | | |
| | | | |
| | December 31 |
| (Dollars in millions) | 2012 | | 2011 |
| Trading account assets | |
| | |
|
U.S. government and agency securities (1) | $ | 86,974 |
| | $ | 52,613 |
|
| Corporate securities, trading loans and other | 37,900 |
| | 36,571 |
|
| Equity securities | 43,315 |
| | 23,674 |
|
| Non-U.S. sovereign debt | 52,197 |
| | 42,946 |
|
| Mortgage trading loans and asset-backed securities | 16,840 |
| | 13,515 |
|
| Total trading account assets | $ | 237,226 |
| | $ | 169,319 |
|
| Trading account liabilities | |
| | |
|
| U.S. government and agency securities | $ | 23,430 |
| | $ | 20,710 |
|
| Equity securities | 22,492 |
| | 14,594 |
|
| Non-U.S. sovereign debt | 20,244 |
| | 17,440 |
|
| Corporate securities and other | 7,421 |
| | 7,764 |
|
| Total trading account liabilities | $ | 73,587 |
| | $ | 60,508 |
|
| |
(1) | Includes $30.6 billion and $27.3 billion of government-sponsored enterprise obligations at December 31, 2012 and 2011. |
NOTE 3 Derivatives
Derivative Balances
Derivatives are entered into on behalf of customers, for trading, or to support risk management activities. Derivatives used in risk management activities include derivatives that may or may not be designated in qualifying hedge accounting relationships. Derivatives that are not designated in qualifying hedge accounting relationships are referred to as other risk management derivatives. For additional information on the Corporation’s derivatives and hedging activities, see Note 1 – Summary of Significant Accounting
Principles. The following tables present derivative instruments included on the Corporation’s Consolidated Balance Sheet in derivative assets and liabilities at December 31, 2012 and 2011. Balances are presented on a gross basis, prior to the application of counterparty and cash collateral netting. Total derivative assets and liabilities are adjusted on an aggregate basis to take into consideration the effects of legally enforceable master netting agreements and have been reduced by the cash collateral received or paid.
|
| | | | | | | | | | | | | | | | | | | | | | | | | | | |
| | | | | | | | | | | | | | |
| | | | December 31, 2012 |
| | | | Gross Derivative Assets | | Gross Derivative Liabilities |
| (Dollars in billions) | Contract/ Notional (1) | | Trading Derivatives and Other Risk Management Derivatives | | Qualifying
Accounting Hedges | | Total | | Trading Derivatives and Other Risk Management Derivatives | | Qualifying
Accounting Hedges | | Total |
| Interest rate contracts | |
| | |
| | |
| | |
| | |
| | |
| | |
|
| Swaps | $ | 34,667.4 |
| | $ | 1,075.4 |
| | $ | 13.8 |
| | $ | 1,089.2 |
| | $ | 1,062.6 |
| | $ | 4.7 |
| | $ | 1,067.3 |
|
| Futures and forwards | 11,950.5 |
| | 2.8 |
| | — |
| | 2.8 |
| | 2.7 |
| | — |
| | 2.7 |
|
| Written options | 2,343.5 |
| | — |
| | — |
| | — |
| | 106.0 |
| | — |
| | 106.0 |
|
| Purchased options | 2,162.6 |
| | 105.5 |
| | — |
| | 105.5 |
| | — |
| | — |
| | — |
|
| Foreign exchange contracts | |
| | |
| | |
| | |
| | |
| | |
| | |
|
| Swaps | 2,489.0 |
| | 47.4 |
| | 1.4 |
| | 48.8 |
| | 53.2 |
| | 1.8 |
| | 55.0 |
|
| Spot, futures and forwards | 3,023.0 |
| | 31.5 |
| | 0.4 |
| | 31.9 |
| | 30.5 |
| | 0.8 |
| | 31.3 |
|
| Written options | 363.3 |
| | — |
| | — |
| | — |
| | 7.3 |
| | — |
| | 7.3 |
|
| Purchased options | 321.8 |
| | 6.5 |
| | — |
| | 6.5 |
| | — |
| | — |
| | — |
|
| Equity contracts | |
| | |
| | |
| | |
| | |
| | |
| | |
|
| Swaps | 127.1 |
| | 1.6 |
| | — |
| | 1.6 |
| | 2.0 |
| | — |
| | 2.0 |
|
| Futures and forwards | 58.4 |
| | 1.0 |
| | — |
| | 1.0 |
| | 1.0 |
| | — |
| | 1.0 |
|
| Written options | 295.3 |
| | — |
| | — |
| | — |
| | 20.2 |
| | — |
| | 20.2 |
|
| Purchased options | 271.0 |
| | 20.4 |
| | — |
| | 20.4 |
| | — |
| | — |
| | — |
|
| Commodity contracts | |
| | |
| | |
| | |
| | |
| | |
| | |
|
| Swaps | 60.5 |
| | 2.5 |
| | 0.1 |
| | 2.6 |
| | 4.0 |
| | — |
| | 4.0 |
|
| Futures and forwards | 498.9 |
| | 4.8 |
| | — |
| | 4.8 |
| | 2.7 |
| | — |
| | 2.7 |
|
| Written options | 166.4 |
| | — |
| | — |
| | — |
| | 7.4 |
| | — |
| | 7.4 |
|
| Purchased options | 168.2 |
| | 7.1 |
| | — |
| | 7.1 |
| | — |
| | — |
| | — |
|
| Credit derivatives | |
| | |
| | |
| | |
| | |
| | |
| | |
|
| Purchased credit derivatives: | |
| | |
| | |
| | |
| | |
| | |
| | |
|
| Credit default swaps | 1,559.5 |
| | 35.6 |
| | — |
| | 35.6 |
| | 22.1 |
| | — |
| | 22.1 |
|
| Total return swaps/other | 43.5 |
| | 2.5 |
| | — |
| | 2.5 |
| | 2.9 |
| | — |
| | 2.9 |
|
| Written credit derivatives: | |
| | |
| | |
| | |
| | |
| | |
| | |
|
| Credit default swaps | 1,531.5 |
| | 23.0 |
| | — |
| | 23.0 |
| | 32.6 |
| | — |
| | 32.6 |
|
| Total return swaps/other | 68.8 |
| | 0.2 |
| | — |
| | 0.2 |
| | 0.3 |
| | — |
| | 0.3 |
|
| Gross derivative assets/liabilities | |
| | $ | 1,367.8 |
| | $ | 15.7 |
| | $ | 1,383.5 |
| | $ | 1,357.5 |
| | $ | 7.3 |
| | $ | 1,364.8 |
|
| Less: Legally enforceable master netting agreements | |
| | |
| | |
| | (1,271.9 | ) | | |
| | |
| | (1,271.9 | ) |
| Less: Cash collateral received/paid | |
| | |
| | |
| | (58.1 | ) | | |
| | |
| | (46.9 | ) |
| Total derivative assets/liabilities | |
| | |
| | |
| | $ | 53.5 |
| | |
| | |
| | $ | 46.0 |
|
| |
(1) | Represents the total contract/notional amount of derivative assets and liabilities outstanding. |
|
| | | | | | | | | | | | | | | | | | | | | | | | | | | |
| | | | | | | | | | | | | | |
| | | | December 31, 2011 |
| | | | Gross Derivative Assets | | Gross Derivative Liabilities |
| (Dollars in billions) | Contract/ Notional (1) | | Trading Derivatives and Other Risk Management Derivatives | | Qualifying
Accounting Hedges | | Total | | Trading Derivatives and Other Risk Management Derivatives | | Qualifying
Accounting Hedges | | Total |
| Interest rate contracts | |
| | |
| | |
| | |
| | |
| | |
| | |
|
| Swaps | $ | 40,473.7 |
| | $ | 1,490.7 |
| | $ | 15.9 |
| | $ | 1,506.6 |
| | $ | 1,473.0 |
| | $ | 12.3 |
| | $ | 1,485.3 |
|
| Futures and forwards | 12,105.8 |
| | 2.9 |
| | 0.2 |
| | 3.1 |
| | 3.4 |
| | — |
| | 3.4 |
|
| Written options | 2,534.0 |
| | — |
| | — |
| | — |
| | 117.8 |
| | — |
| | 117.8 |
|
| Purchased options | 2,467.2 |
| | 120.0 |
| | — |
| | 120.0 |
| | — |
| | — |
| | — |
|
| Foreign exchange contracts | |
| | |
| | |
| | |
| | |
| | |
| | |
|
| Swaps | 2,381.6 |
| | 48.3 |
| | 2.6 |
| | 50.9 |
| | 58.9 |
| | 2.2 |
| | 61.1 |
|
| Spot, futures and forwards | 2,548.8 |
| | 37.2 |
| | 1.3 |
| | 38.5 |
| | 39.2 |
| | 0.3 |
| | 39.5 |
|
| Written options | 368.5 |
| | — |
| | — |
| | — |
| | 9.4 |
| | — |
| | 9.4 |
|
| Purchased options | 341.0 |
| | 9.0 |
| | — |
| | 9.0 |
| | — |
| | — |
| | — |
|
| Equity contracts | |
| | |
| | |
| | |
| | |
| | |
| | |
|
| Swaps | 75.5 |
| | 1.5 |
| | — |
| | 1.5 |
| | 1.7 |
| | — |
| | 1.7 |
|
| Futures and forwards | 52.1 |
| | 1.8 |
| | — |
| | 1.8 |
| | 1.5 |
| | — |
| | 1.5 |
|
| Written options | 367.1 |
| | — |
| | — |
| | — |
| | 17.7 |
| | — |
| | 17.7 |
|
| Purchased options | 360.2 |
| | 19.6 |
| | — |
| | 19.6 |
| | — |
| | — |
| | — |
|
| Commodity contracts | |
| | |
| | |
| | |
| | |
| | |
| | |
|
| Swaps | 73.8 |
| | 4.9 |
| | 0.1 |
| | 5.0 |
| | 5.9 |
| | — |
| | 5.9 |
|
| Futures and forwards | 470.5 |
| | 5.3 |
| | — |
| | 5.3 |
| | 3.2 |
| | — |
| | 3.2 |
|
| Written options | 142.3 |
| | — |
| | — |
| | — |
| | 9.5 |
| | — |
| | 9.5 |
|
| Purchased options | 141.3 |
| | 9.5 |
| | — |
| | 9.5 |
| | — |
| | — |
| | — |
|
| Credit derivatives | |
| | |
| | |
| | |
| | |
| | |
| | |
|
| Purchased credit derivatives: | |
| | |
| | |
| | |
| | |
| | |
| | |
|
| Credit default swaps | 1,944.8 |
| | 95.8 |
| | — |
| | 95.8 |
| | 13.8 |
| | — |
| | 13.8 |
|
| Total return swaps/other | 17.5 |
| | 0.6 |
| | — |
| | 0.6 |
| | 0.3 |
| | — |
| | 0.3 |
|
| Written credit derivatives: | |
| | |
| | |
| | |
| | |
| | |
| | |
|
| Credit default swaps | 1,885.9 |
| | 14.1 |
| | — |
| | 14.1 |
| | 90.5 |
| | — |
| | 90.5 |
|
| Total return swaps/other | 17.8 |
| | 0.5 |
| | — |
| | 0.5 |
| | 0.7 |
| | — |
| | 0.7 |
|
| Gross derivative assets/liabilities | |
| | $ | 1,861.7 |
| | $ | 20.1 |
| | $ | 1,881.8 |
| | $ | 1,846.5 |
| | $ | 14.8 |
| | $ | 1,861.3 |
|
| Less: Legally enforceable master netting agreements | |
| | |
| | |
| | (1,749.9 | ) | | |
| | |
| | (1,749.9 | ) |
| Less: Cash collateral received/paid | |
| | |
| | |
| | (58.9 | ) | | |
| | |
| | (51.9 | ) |
| Total derivative assets/liabilities | |
| | |
| | |
| | $ | 73.0 |
| | |
| | |
| | $ | 59.5 |
|
| |
(1) | Represents the total contract/notional amount of derivative assets and liabilities outstanding. |
ALM and Risk Management Derivatives
The Corporation’s ALM and risk management activities include the use of derivatives to mitigate risk to the Corporation including derivatives designated in qualifying hedge accounting relationships and derivatives used in other risk management activities. Interest rate, foreign exchange, equity, commodity and credit contracts are utilized in the Corporation’s ALM and risk management activities.
The Corporation maintains an overall interest rate risk management strategy that incorporates the use of interest rate contracts, which are generally non-leveraged generic interest rate and basis swaps, options, futures and forwards, to minimize significant fluctuations in earnings that are caused by interest rate volatility. The Corporation’s goal is to manage interest rate sensitivity and volatility so that movements in interest rates do not significantly adversely affect earnings or capital. As a result of interest rate fluctuations, hedged fixed-rate assets and liabilities appreciate or depreciate in fair value. Gains or losses on the derivative instruments that are linked to the hedged fixed-rate assets and liabilities are expected to substantially offset this unrealized appreciation or depreciation.
Market risk, including interest rate risk, can be substantial in the mortgage business. Market risk is the risk that values of mortgage assets or revenues will be adversely affected by changes
in market conditions such as interest rate movements. To mitigate the interest rate risk in mortgage banking production income, the Corporation utilizes forward loan sale commitments and other derivative instruments including purchased options and certain debt securities. The Corporation also utilizes derivatives such as interest rate options, interest rate swaps, forward settlement contracts and Eurodollar futures to hedge certain market risks of MSRs. For additional information on MSRs, see Note 24 – Mortgage Servicing Rights.
The Corporation uses foreign exchange contracts to manage the foreign exchange risk associated with certain foreign currency-denominated assets and liabilities, as well as the Corporation’s investments in non-U.S. subsidiaries. Foreign exchange contracts, which include spot and forward contracts, represent agreements to exchange the currency of one country for the currency of another country at an agreed-upon price on an agreed-upon settlement date. Exposure to loss on these contracts will increase or decrease over their respective lives as currency exchange and interest rates fluctuate.
The Corporation enters into derivative commodity contracts such as futures, swaps, options and forwards as well as non-derivative commodity contracts to provide price risk management services to customers or to manage price risk associated with its physical and financial commodity positions. The non-derivative
commodity contracts and physical inventories of commodities expose the Corporation to earnings volatility. Cash flow and fair value accounting hedges provide a method to mitigate a portion of this earnings volatility.
The Corporation purchases credit derivatives to manage credit risk related to certain funded and unfunded credit exposures. Credit derivatives include credit default swaps (CDS), total return swaps and swaptions. These derivatives are recorded on the Corporation’s Consolidated Balance Sheet at fair value with changes in fair value recorded in other income (loss).
Derivatives Designated as Accounting Hedges
The Corporation uses various types of interest rate, commodity and foreign exchange derivative contracts to protect against changes in the fair value of its assets and liabilities due to fluctuations in interest rates, commodity prices and exchange rates (fair value hedges). The Corporation also uses these types of contracts and equity derivatives to protect against changes in the cash flows of its assets and liabilities, and other forecasted transactions (cash flow hedges). The Corporation hedges its net
investment in consolidated non-U.S. operations determined to have functional currencies other than the U.S. dollar using forward exchange contracts and cross-currency basis swaps, and by issuing foreign currency-denominated debt (net investment hedges).
Fair Value Hedges
The table below summarizes certain information related to fair value hedges for 2012, 2011 and 2010, including hedges of interest rate risk on long-term debt that were acquired as part of a business combination and redesignated. At redesignation, the fair value of the derivatives was negative. As the derivatives mature, the fair value will approach zero. As a result, ineffectiveness may occur and the fair value changes in the derivatives and the long-term debt being hedged may be directionally the same in certain scenarios. Based on a regression analysis, the derivatives continue to be highly effective at offsetting changes in the fair value of the long-term debt attributable to interest rate risk.
|
| | | | | | | | | | | |
| | | |
| Derivatives Designated as Fair Value Hedges | | | | | |
| | | | | | |
| Gains (losses) | 2012 |
| (Dollars in millions) | Derivative | | Hedged Item | | Hedge Ineffectiveness |
Interest rate risk on long-term debt (1) | $ | (195 | ) | | $ | (770 | ) | | $ | (965 | ) |
Interest rate and foreign currency risk on long-term debt (1) | (1,482 | ) | | 1,225 |
| | (257 | ) |
Interest rate risk on AFS securities (2) | (4 | ) | | 91 |
| | 87 |
|
Commodity price risk on commodity inventory (3) | (6 | ) | | 6 |
| | — |
|
| Total | $ | (1,687 | ) | | $ | 552 |
| | $ | (1,135 | ) |
| | | | | | |
| | 2011 |
Interest rate risk on long-term debt (1) | $ | 4,384 |
| | $ | (4,969 | ) | | $ | (585 | ) |
Interest rate and foreign currency risk on long-term debt (1) | 780 |
| | (1,057 | ) | | (277 | ) |
Interest rate risk on AFS securities (2) | (11,386 | ) | | 10,490 |
| | (896 | ) |
Commodity price risk on commodity inventory (3) | 16 |
| | (16 | ) | | — |
|
| Total | $ | (6,206 | ) | | $ | 4,448 |
| | $ | (1,758 | ) |
| | | | | | |
| | 2010 |
Interest rate risk on long-term debt (1) | $ | 2,952 |
| | $ | (3,496 | ) | | $ | (544 | ) |
Interest rate and foreign currency risk on long-term debt (1) | (463 | ) | | 130 |
| | (333 | ) |
Interest rate risk on AFS securities (2) | (2,577 | ) | | 2,667 |
| | 90 |
|
Commodity price risk on commodity inventory (3) | 19 |
| | (19 | ) | | — |
|
| Total | $ | (69 | ) | | $ | (718 | ) | | $ | (787 | ) |
| |
(1) | Amounts are recorded in interest expense on long-term debt and in other income (loss). |
| |
(2) | Amounts are recorded in interest income on debt securities. |
| |
(3) | Amounts relating to commodity inventory are recorded in trading account profits. |
Cash Flow and Net Investment Hedges
The table below summarizes certain information related to cash flow hedges and net investment hedges for 2012, 2011 and 2010. During the next 12 months, net losses in accumulated OCI of $981 million ($618 million after-tax) on derivative instruments that qualify as cash flow hedges are expected to be reclassified into earnings. These net losses reclassified into earnings are expected to primarily reduce net interest income related to the respective hedged items. Amounts related to commodity price risk
reclassified from accumulated OCI are recorded in trading account profits with the underlying hedged item. Amounts related to price risk on restricted stock awards reclassified from accumulated OCI are recorded in personnel expense.
Amounts related to foreign exchange risk recognized in accumulated OCI on derivatives exclude pre-tax losses of $7 million, and pre-tax gains of $82 million and $192 million related to long-term debt designated as a net investment hedge for 2012, 2011 and 2010, respectively.
|
| | | | | | | | | | | |
| | | | | | |
| Derivatives Designated as Cash Flow and Net Investment Hedges | | | | | |
| | | | | | |
| | 2012 |
| (Dollars in millions, amounts pre-tax) | Gains (losses)
Recognized in
Accumulated OCI on Derivatives | | Gains (losses)
in Income
Reclassified from Accumulated OCI | | Hedge
Ineffectiveness and
Amounts Excluded
from Effectiveness Testing (1) |
| Cash flow hedges | |
| | |
| | |
|
| Interest rate risk on variable rate portfolios | $ | 10 |
| | $ | (957 | ) | | $ | — |
|
| Price risk on restricted stock awards | 420 |
| | (78 | ) | | — |
|
| Total | $ | 430 |
| | $ | (1,035 | ) | | $ | — |
|
| Net investment hedges | |
| | |
| | |
|
| Foreign exchange risk | $ | (771 | ) | | $ | (26 | ) | | $ | (269 | ) |
| | | | | | |
| | 2011 |
| Cash flow hedges | |
| | |
| | |
|
| Interest rate risk on variable rate portfolios | $ | (2,079 | ) | | $ | (1,392 | ) | | $ | (8 | ) |
| Commodity price risk on forecasted purchases and sales | (3 | ) | | 6 |
| | (3 | ) |
| Price risk on restricted stock awards | (408 | ) | | (231 | ) | | — |
|
| Total | $ | (2,490 | ) | | $ | (1,617 | ) | | $ | (11 | ) |
| Net investment hedges | |
| | |
| | |
|
| Foreign exchange risk | $ | 1,055 |
| | $ | 384 |
| | $ | (572 | ) |
| | | | | | |
| | 2010 |
| Cash flow hedges | |
| | |
| | |
|
| Interest rate risk on variable rate portfolios | $ | (1,876 | ) | | $ | (410 | ) | | $ | (30 | ) |
| Commodity price risk on forecasted purchases and sales | 32 |
| | 25 |
| | 11 |
|
| Price risk on restricted stock awards | (97 | ) | | (33 | ) | | — |
|
| Price risk on equity investments included in AFS securities | 186 |
| | (226 | ) | | — |
|
| Total | $ | (1,755 | ) | | $ | (644 | ) | | $ | (19 | ) |
| Net investment hedges | |
| | |
| | |
|
| Foreign exchange risk | $ | (482 | ) | | $ | — |
| | $ | (315 | ) |
| |
(1) | Amounts related to derivatives designated as cash flow hedges represent hedge ineffectiveness and amounts related to net investment hedges represent amounts excluded from effectiveness testing. |
The Corporation enters into equity total return swaps to hedge a portion of RSUs granted to certain employees as part of their compensation. Certain awards contain clawback provisions which permit the Corporation to cancel all or a portion of the award under specified circumstances, and certain awards may be settled in cash. These RSUs are accrued as liabilities over the vesting period and adjusted to fair value based on changes in the share price of the Corporation’s common stock. From time to time, the Corporation may enter into equity derivatives to minimize the change in the expense driven by fluctuations in the share price of
the common stock during the vesting period of any RSUs that may be granted, if any, subject to similar or other terms and conditions. Certain of these derivatives are designated as cash flow hedges of unrecognized unvested awards with changes in fair value of the hedge recorded in accumulated OCI and reclassified into earnings in the same period as the RSUs affect earnings. The remaining derivatives are other risk management derivatives and changes in fair value are recorded in personnel expense. For more information on RSUs and related hedges, see Note 19 – Stock-based Compensation Plans.
Other Risk Management Derivatives
Other risk management derivatives are used by the Corporation to reduce certain risk exposures. These derivatives are not qualifying accounting hedges because either they did not qualify for or were not designated as accounting hedges. The table below presents gains (losses) on these derivatives for 2012, 2011 and 2010. These gains (losses) are largely offset by the income or expense that is recorded on the hedged item.
|
| | | | | | | | | | | |
| | | | | | |
| Other Risk Management Derivatives | | | | | |
| | | | | | |
| Gains (losses) | | | | | |
| | | | | | |
| (Dollars in millions) | 2012 | | 2011 | | 2010 |
Price risk on mortgage banking production income (1, 2) | $ | 3,022 |
| | $ | 2,852 |
| | $ | 9,109 |
|
Market-related risk on mortgage banking servicing income (1) | 2,000 |
| | 3,612 |
| | 3,878 |
|
Credit risk on loans (3) | (95 | ) | | 30 |
| | (121 | ) |
Interest rate and foreign currency risk on long-term debt and other foreign exchange transactions (4) | 424 |
| | (48 | ) | | (2,080 | ) |
Price risk on restricted stock awards (5) | 1,008 |
| | (610 | ) | | (151 | ) |
| Other | 58 |
| | 281 |
| | 42 |
|
| Total | $ | 6,417 |
| | $ | 6,117 |
| | $ | 10,677 |
|
| |
(1) | Net gains on these derivatives are recorded in mortgage banking income (loss). |
| |
(2) | Includes net gains on interest rate lock commitments related to the origination of mortgage loans that are held-for-sale, which are considered derivative instruments, of $3.0 billion, $3.8 billion and $8.7 billion for 2012, 2011 and 2010, respectively. |
| |
(3) | Net gains (losses) on these derivatives are recorded in other income (loss). |
| |
(4) | The majority of the balance is related to the revaluation of derivatives used to mitigate risk related to foreign currency-denominated debt which is recorded in other income (loss). The offsetting revaluation of the foreign currency-denominated debt, while not included in the table above, is also recorded in other income (loss). |
| |
(5) | Gains (losses) on these derivatives are recorded in personnel expense. |
Sales and Trading Revenue
The Corporation enters into trading derivatives to facilitate client transactions, for principal trading purposes, and to manage risk exposures arising from trading account assets and liabilities. It is the Corporation’s policy to include these derivative instruments in its trading activities which include derivatives and non-derivative cash instruments. The resulting risk from these derivatives is managed on a portfolio basis as part of the Corporation’s Global Markets business segment. The related sales and trading revenue generated within Global Markets is recorded in various income statement line items including trading account profits and net interest income as well as other revenue categories. However, the majority of income related to derivative instruments is recorded in trading account profits.
Sales and trading revenue includes changes in the fair value and realized gains and losses on the sales of trading and other assets, net interest income, and fees primarily from commissions on equity securities. Revenue is generated by the difference in the client price for an instrument and the price at which the trading
desk can execute the trade in the dealer market. For equity securities, commissions related to purchases and sales are recorded in other income (loss). Changes in the fair value of these securities are included in trading account profits. For debt securities, revenue, with the exception of interest associated with the debt securities, is typically included in trading account profits. Unlike commissions for equity securities, the initial revenue related to broker/dealer services for debt securities is typically included in the pricing of the instrument rather than being charged through separate fee arrangements. Therefore, this revenue is recorded in trading account profits as part of the initial mark to fair value. For derivatives, all revenue is included in trading account profits. In transactions where the Corporation acts as agent, which include exchange-traded futures and options, fees are recorded in other income (loss).
Gains (losses) on certain instruments, primarily loans, that the Global Markets business segment shares with Global Banking are not considered trading instruments and are excluded from sales and trading revenue in their entirety.
The table below, which includes both derivatives and non-derivative cash instruments, identifies the amounts in the respective income statement line items attributable to the Corporation’s sales and trading revenue in Global Markets, categorized by primary risk, for 2012, 2011 and 2010. The difference between total trading account profits in the table below
and in the Corporation’s Consolidated Statement of Income represents trading activities in business segments other than Global Markets. Global Markets results inNote 26 – Business Segment Information are presented on a fully taxable-equivalent (FTE) basis. The table below is not presented on a FTE basis.
|
| | | | | | | | | | | | | | | |
| | | | | | | | |
| Sales and Trading Revenue | | | | | | | |
| | | | | | | | |
| | 2012 |
| (Dollars in millions) | Trading Account Profits | | Net Interest Income | | Other (1) | | Total |
| Interest rate risk | $ | 580 |
| | $ | 1,040 |
| | $ | (5 | ) | | $ | 1,615 |
|
| Foreign exchange risk | 909 |
| | 5 |
| | 7 |
| | 921 |
|
| Equity risk | 1,181 |
| | (57 | ) | | 1,890 |
| | 3,014 |
|
| Credit risk | 2,496 |
| | 2,321 |
| | 961 |
| | 5,778 |
|
| Other risk | 540 |
| | (219 | ) | | (42 | ) | | 279 |
|
| Total sales and trading revenue | $ | 5,706 |
| | $ | 3,090 |
| | $ | 2,811 |
| | $ | 11,607 |
|
| | | | | | | | |
| | 2011 |
| Interest rate risk | $ | 2,118 |
| | $ | 923 |
| | $ | (63 | ) | | $ | 2,978 |
|
| Foreign exchange risk | 1,088 |
| | 8 |
| | (10 | ) | | 1,086 |
|
| Equity risk | 1,482 |
| | 128 |
| | 2,346 |
| | 3,956 |
|
| Credit risk | 1,096 |
| | 2,604 |
| | 553 |
| | 4,253 |
|
| Other risk | 633 |
| | (184 | ) | | (72 | ) | | 377 |
|
| Total sales and trading revenue | $ | 6,417 |
| | $ | 3,479 |
| | $ | 2,754 |
| | $ | 12,650 |
|
| | | | | | | | |
| | 2010 |
| Interest rate risk | $ | 2,032 |
| | $ | 659 |
| | $ | 38 |
| | $ | 2,729 |
|
| Foreign exchange risk | 903 |
| | — |
| | (9 | ) | | 894 |
|
| Equity risk | 1,650 |
| | 16 |
| | 2,447 |
| | 4,113 |
|
| Credit risk | 4,592 |
| | 3,557 |
| | 266 |
| | 8,415 |
|
| Other risk | 447 |
| | (172 | ) | | (4 | ) | | 271 |
|
| Total sales and trading revenue | $ | 9,624 |
| | $ | 4,060 |
| | $ | 2,738 |
| | $ | 16,422 |
|
| |
(1) | Represents amounts in investment and brokerage services and other income (loss) that are recorded in Global Markets and included in the definition of sales and trading revenue. Includes investment and brokerage services revenue of $1.8 billion, $2.2 billion and $2.3 billion for 2012, 2011 and 2010, respectively, primarily included in equity risk. |
Credit Derivatives
The Corporation enters into credit derivatives primarily to facilitate client transactions and to manage credit risk exposures. Credit derivatives derive value based on an underlying third-party referenced obligation or a portfolio of referenced obligations and generally require the Corporation, as the seller of credit protection, to make payments to a buyer upon the occurrence of a pre-defined credit event. Such credit events generally include bankruptcy of
the referenced credit entity and failure to pay under the obligation, as well as acceleration of indebtedness and payment repudiation or moratorium. For credit derivatives based on a portfolio of referenced credits or credit indices, the Corporation may not be required to make payment until a specified amount of loss has occurred and/or may only be required to make payment up to a specified amount.
Credit derivative instruments where the Corporation is the seller of credit protection and their expiration are summarized at December 31, 2012 and 2011 in the table below. These instruments are classified as investment and non-investment grade based on the credit quality of the underlying referenced obligation. The Corporation considers ratings of BBB- or higher as investment grade. Non-investment grade includes non-rated credit derivative instruments.
|
| | | | | | | | | | | | | | | | | | | |
| | | | | | | | | | |
| Credit Derivative Instruments | |
| | |
| | December 31, 2012 |
| | Carrying Value |
| (Dollars in millions) | Less than One Year | | One to Three Years | | Three to Five Years | | Over Five Years | | Total |
| Credit default swaps: | |
| | |
| | |
| | |
| | |
|
| Investment grade | $ | 52 |
| | $ | 757 |
| | $ | 5,595 |
| | $ | 2,903 |
| | $ | 9,307 |
|
| Non-investment grade | 923 |
| | 4,403 |
| | 7,030 |
| | 10,959 |
| | 23,315 |
|
| Total | 975 |
| | 5,160 |
| | 12,625 |
| | 13,862 |
| | 32,622 |
|
| Total return swaps/other: | |
| | |
| | |
| | |
| | |
|
| Investment grade | 39 |
| | — |
| | — |
| | — |
| | 39 |
|
| Non-investment grade | 57 |
| | 104 |
| | 39 |
| | 37 |
| | 237 |
|
| Total | 96 |
| | 104 |
| | 39 |
| | 37 |
| | 276 |
|
| Total credit derivatives | $ | 1,071 |
| | $ | 5,264 |
| | $ | 12,664 |
| | $ | 13,899 |
| | $ | 32,898 |
|
Credit-related notes: (1) | |
| | |
| | |
| | |
| | |
|
| Investment grade | $ | 4 |
| | $ | 12 |
| | $ | 441 |
| | $ | 3,849 |
| | $ | 4,306 |
|
| Non-investment grade | 116 |
| | 161 |
| | 314 |
| | 1,425 |
| | 2,016 |
|
| Total credit-related notes | $ | 120 |
| | $ | 173 |
| | $ | 755 |
| | $ | 5,274 |
| | $ | 6,322 |
|
| | Maximum Payout/Notional |
| Credit default swaps: | |
| | |
| | |
| | |
| | |
|
| Investment grade | $ | 260,177 |
| | $ | 349,125 |
| | $ | 500,038 |
| | $ | 90,453 |
| | $ | 1,199,793 |
|
| Non-investment grade | 79,861 |
| | 99,043 |
| | 110,248 |
| | 42,559 |
| | 331,711 |
|
| Total | 340,038 |
| | 448,168 |
| | 610,286 |
| | 133,012 |
| | 1,531,504 |
|
| Total return swaps/other: | |
| | |
| | |
| | |
| | |
|
| Investment grade | 43,536 |
| | 15 |
| | — |
| | — |
| | 43,551 |
|
| Non-investment grade | 5,566 |
| | 11,028 |
| | 7,631 |
| | 1,035 |
| | 25,260 |
|
| Total | 49,102 |
| | 11,043 |
| | 7,631 |
| | 1,035 |
| | 68,811 |
|
| Total credit derivatives | $ | 389,140 |
| | $ | 459,211 |
| | $ | 617,917 |
| | $ | 134,047 |
| | $ | 1,600,315 |
|
|
| | | | | | | | | | | | | | | | | | | |
| | December 31, 2011 |
| (Dollars in millions) | Carrying Value |
| Credit default swaps: | |
| | |
| | |
| | |
| | |
|
| Investment grade | $ | 795 |
| | $ | 5,011 |
| | $ | 17,271 |
| | $ | 7,325 |
| | $ | 30,402 |
|
| Non-investment grade | 4,236 |
| | 11,438 |
| | 18,072 |
| | 26,339 |
| | 60,085 |
|
| Total | 5,031 |
| | 16,449 |
| | 35,343 |
| | 33,664 |
| | 90,487 |
|
| Total return swaps/other: | |
| | |
| | |
| | |
| | |
|
| Investment grade | — |
| | — |
| | 30 |
| | 1 |
| | 31 |
|
| Non-investment grade | 522 |
| | 2 |
| | 33 |
| | 128 |
| | 685 |
|
| Total | 522 |
| | 2 |
| | 63 |
| | 129 |
| | 716 |
|
| Total credit derivatives | $ | 5,553 |
| | $ | 16,451 |
| | $ | 35,406 |
| | $ | 33,793 |
| | $ | 91,203 |
|
Credit-related notes: (1) | |
| | |
| | |
| | |
| | |
|
| Investment grade | $ | — |
| | $ | 7 |
| | $ | 208 |
| | $ | 2,947 |
| | $ | 3,162 |
|
| Non-investment grade | 127 |
| | 85 |
| | 132 |
| | 1,732 |
| | 2,076 |
|
| Total credit-related notes | $ | 127 |
| | $ | 92 |
| | $ | 340 |
| | $ | 4,679 |
| | $ | 5,238 |
|
| | Maximum Payout/Notional |
| Credit default swaps: | |
| | |
| | |
| | |
| | |
|
| Investment grade | $ | 182,137 |
| | $ | 401,914 |
| | $ | 477,924 |
| | $ | 127,570 |
| | $ | 1,189,545 |
|
| Non-investment grade | 133,624 |
| | 228,327 |
| | 186,522 |
| | 147,926 |
| | 696,399 |
|
| Total | 315,761 |
| | 630,241 |
| | 664,446 |
| | 275,496 |
| | 1,885,944 |
|
| Total return swaps/other: | |
| | |
| | |
| | |
| | |
|
| Investment grade | — |
| | — |
| | 9,116 |
| | — |
| | 9,116 |
|
| Non-investment grade | 305 |
| | 2,023 |
| | 4,918 |
| | 1,476 |
| | 8,722 |
|
| Total | 305 |
| | 2,023 |
| | 14,034 |
| | 1,476 |
| | 17,838 |
|
| Total credit derivatives | $ | 316,066 |
| | $ | 632,264 |
| | $ | 678,480 |
| | $ | 276,972 |
| | $ | 1,903,782 |
|
| |
(1) | For credit-related notes, maximum payout/notional is the same as carrying value. |
The notional amount represents the maximum amount payable by the Corporation for most credit derivatives. However, the Corporation does not monitor its exposure to credit derivatives based solely on the notional amount because this measure does not take into consideration the probability of occurrence. As such, the notional amount is not a reliable indicator of the Corporation’s exposure to these contracts. Instead, a risk framework is used to define risk tolerances and establish limits to help ensure that certain credit risk-related losses occur within acceptable, predefined limits.
The Corporation manages its market risk exposure to credit derivatives by entering into a variety of offsetting derivative contracts and security positions. For example, in certain instances, the Corporation may purchase credit protection with identical underlying referenced names to offset its exposure. The carrying value and notional amount of written credit derivatives for which the Corporation held purchased credit derivatives with identical underlying referenced names and terms at December 31, 2012 was $20.7 billion and $1.1 trillion compared to $48.0 billion and $1.0 trillion at December 31, 2011.
Credit-related notes in the table on page 180 include investments in securities issued by CDO, collateralized loan obligation (CLO) and credit-linked note vehicles. These instruments are primarily classified as trading securities. The carrying value of these instruments equals the Corporation’s maximum exposure to loss. The Corporation is not obligated to make any payments to the entities under the terms of the securities owned. The Corporation discloses internal categorizations of investment grade and non-investment grade consistent with how risk is managed for these instruments.
Credit-related Contingent Features and Collateral
The Corporation executes the majority of its derivative contracts in the OTC market with large, international financial institutions, including broker/dealers and, to a lesser degree, with a variety of non-financial companies. Substantially all of the derivative transactions are executed on a daily margin basis. Therefore, events such as a credit rating downgrade (depending on the ultimate rating level) or a breach of credit covenants would typically require an increase in the amount of collateral required of the counterparty, where applicable, and/or allow the Corporation to take additional protective measures such as early termination of all trades. Further, as previously discussed on page 174, the Corporation enters into legally enforceable master netting agreements which reduce risk by permitting the closeout and netting of transactions with the same counterparty upon the occurrence of certain events.
A majority of the Corporation’s derivative contracts contain credit risk related contingent features, primarily in the form of International Swaps and Derivatives Association, Inc. (ISDA) master netting agreements and credit support documentation that enhance the creditworthiness of these instruments compared to other obligations of the respective counterparty with whom the Corporation has transacted. These contingent features may be for the benefit of the Corporation as well as its counterparties with respect to changes in the Corporation’s creditworthiness and the mark-to-market exposure under the derivative transactions. At December 31, 2012 and 2011, the Corporation held cash and securities collateral of $85.6 billion and $87.7 billion, and posted cash and securities collateral of $74.1 billion and $86.5 billion in the normal course of business under derivative agreements.
In connection with certain OTC derivative contracts and other trading agreements, the Corporation can be required to provide additional collateral or to terminate transactions with certain counterparties in the event of a downgrade of the senior debt ratings of the Corporation or certain subsidiaries. The amount of additional collateral required depends on the contract and is usually a fixed incremental amount and/or the market value of the exposure.
At December 31, 2012, the amount of collateral, calculated based on the terms of the contracts, that the Corporation and certain subsidiaries could be required to post to counterparties but had not yet posted to counterparties was approximately $2.2 billion, comprised of $721 million for BANA and $1.5 billion for Merrill Lynch & Co., Inc. (Merrill Lynch) and certain of its subsidiaries.
Some counterparties are currently able to unilaterally terminate certain contracts, or the Corporation or certain subsidiaries may be required to take other action such as find a suitable replacement or obtain a guarantee. At December 31, 2012, the current liability recorded for these derivative contracts was $1.7 billion, against which the Corporation and certain subsidiaries had posted approximately $1.6 billion of collateral.
At December 31, 2012, if the rating agencies had downgraded their long-term senior debt ratings for the Corporation or certain subsidiaries by one incremental notch, the amount of additional collateral contractually required by derivative contracts and other trading agreements would have been approximately$3.3 billioncomprised of$2.9 billionfor BANA and$418 millionfor Merrill Lynch and certain of its subsidiaries. If the agencies had downgraded their long-term senior debt ratings for these entities by a second incremental notch, approximately$4.4 billionin additional incremental collateral comprised of$455 millionfor BANA and$4.0 billionfor Merrill Lynch and certain of its subsidiaries would have been required.
Also, if the rating agencies had downgraded their long-term senior debt ratings for the Corporation or certain subsidiaries by one incremental notch, the derivative liability that would be subject to unilateral termination by counterparties as ofDecember 31, 2012was$3.8 billion, against which$3.0 billionof collateral has been posted. If the rating agencies had downgraded their long-term senior debt ratings for the Corporation and certain subsidiaries by a second incremental notch, the derivative liability that would be subject to unilateral termination by counterparties as ofDecember 31, 2012was an incremental$1.7 billion, against which$1.1 billionof collateral has been posted.
Valuation Adjustments on Derivatives
The Corporation records credit risk valuation adjustments on derivatives in order to properly reflect the credit quality of the counterparties and its own credit quality. The Corporation calculates valuation adjustments on derivatives based on a modeled expected exposure that incorporates current market risk factors. The exposure also takes into consideration credit mitigants such as enforceable master netting agreements and collateral. CDS spread data is used to estimate the default probabilities and severities that are applied to the exposures. Where no observable credit default data is available for counterparties, the Corporation uses proxies and other market data to estimate default probabilities and severity.
Valuation adjustments on derivatives are affected by changes in market spreads, non-credit related market factors such as
interest rate and currency changes that affect the expected exposure, and other factors like changes in collateral arrangements and partial payments. Credit spread changes and non-credit factors can move independently. For example, for an interest rate swap, changes in interest rates may increase the expected exposure which would increase the counterparty credit valuation adjustment (CVA). Independently, counterparty credit spreads may tighten, which would result in an offsetting decrease to CVA.
The Corporation may enter into risk management activities to offset market driven exposures. The Corporation often hedges the counterparty spread risk in CVA with CDS and often hedges the other market risks in both CVA and debit valuation adjustments (DVA) primarily with currency and interest rate swaps. Since the components of the valuation adjustments on derivatives move independently and the Corporation may not hedge all of the market driven exposures, the effect of a hedge may increase the gross valuation adjustments on derivatives or may result in a gross positive valuation adjustment on derivatives becoming a negative adjustment (or the reverse).
During 2012, the Corporation refined its methodology for calculating valuation adjustments on derivatives on a prospective basis. The Corporation no longer considers the probability of default for both the counterparty and the Corporation when calculating the counterparty CVA and DVA and now only considers the probability of the counterparty defaulting for CVA and the Corporation defaulting for DVA.
The table below presents CVA and DVA gains (losses) for the Corporation on a gross and net of hedge basis, which are recorded in trading account profits.
|
| | | | | | | | | | | | | |
| | | | | | |
| Valuation Adjustments on Derivatives |
| | | | | | |
| | 2012 | | 2011 |
| (Dollars in millions) | Gross | Net | | Gross | Net |
Derivative assets (CVA) (1) | $ | 1,022 |
| $ | 291 |
| | $ | (1,863 | ) | $ | (606 | ) |
Derivative liabilities (DVA) (2) | (2,212 | ) | (2,477 | ) | | 1,385 |
| 1,000 |
|
| |
(1) | At December 31, 2012 and 2011, the cumulative CVA reduced the derivative assets balance by $2.4 billion and $2.8 billion. |
| |
(2) | At December 31, 2012 and 2011, the Corporation’s cumulative DVA reduced the derivative liabilities balance by $807 million and $2.4 billion. |
NOTE 4 Securities
The table below presents the amortized cost, gross unrealized gains and losses, and fair value of debt and marketable equity securities at December 31, 2012 and 2011.
|
| | | | | | | | | | | | | | | |
| | | | | | | | |
| | December 31, 2012 |
| (Dollars in millions) | Amortized Cost | | Gross
Unrealized Gains | | Gross
Unrealized Losses | | Fair Value |
| Available-for-sale debt securities | | | | | | | |
| U.S. Treasury and agency securities | $ | 24,232 |
| | $ | 324 |
| | $ | (84 | ) | | $ | 24,472 |
|
| Mortgage-backed securities: | | | | | | | |
|
| Agency | 183,247 |
| | 5,048 |
| | (146 | ) | | 188,149 |
|
| Agency-collateralized mortgage obligations | 36,329 |
| | 1,427 |
| | (218 | ) | | 37,538 |
|
Non-agency residential (1) | 9,231 |
| | 391 |
| | (128 | ) | | 9,494 |
|
| Non-agency commercial | 3,576 |
| | 348 |
| | — |
| | 3,924 |
|
| Non-U.S. securities | 5,574 |
| | 50 |
| | (6 | ) | | 5,618 |
|
| Corporate/Agency bonds | 1,415 |
| | 51 |
| | (16 | ) | | 1,450 |
|
| Other taxable securities, substantially all asset-backed securities | 12,089 |
| | 54 |
| | (15 | ) | | 12,128 |
|
| Total taxable securities | 275,693 |
| | 7,693 |
| | (613 | ) | | 282,773 |
|
| Tax-exempt securities | 4,167 |
| | 13 |
| | (47 | ) | | 4,133 |
|
| Total available-for-sale debt securities | 279,860 |
| | 7,706 |
| | (660 | ) | | 286,906 |
|
| Held-to-maturity debt securities, substantially all U.S. agency mortgage-backed securities | 49,481 |
| | 815 |
| | (26 | ) | | 50,270 |
|
| Total debt securities | $ | 329,341 |
| | $ | 8,521 |
| | $ | (686 | ) | | $ | 337,176 |
|
Available-for-sale marketable equity securities (2) | $ | 780 |
| | $ | 732 |
| | $ | — |
| | $ | 1,512 |
|
| | | | | | | | |
| | December 31, 2011 |
| Available-for-sale debt securities | | | | | | | |
| U.S. Treasury and agency securities | $ | 43,433 |
| | $ | 242 |
| | $ | (811 | ) | | $ | 42,864 |
|
| Mortgage-backed securities: | |
| | |
| | |
| | |
|
| Agency | 138,073 |
| | 4,511 |
| | (21 | ) | | 142,563 |
|
| Agency-collateralized mortgage obligations | 44,392 |
| | 774 |
| | (167 | ) | | 44,999 |
|
Non-agency residential (1) | 14,948 |
| | 301 |
| | (482 | ) | | 14,767 |
|
| Non-agency commercial | 4,894 |
| | 629 |
| | (1 | ) | | 5,522 |
|
| Non-U.S. securities | 4,872 |
| | 62 |
| | (14 | ) | | 4,920 |
|
| Corporate/Agency bonds | 2,993 |
| | 79 |
| | (37 | ) | | 3,035 |
|
| Other taxable securities, substantially all asset-backed securities | 12,889 |
| | 49 |
| | (60 | ) | | 12,878 |
|
| Total taxable securities | 266,494 |
| | 6,647 |
| | (1,593 | ) | | 271,548 |
|
| Tax-exempt securities | 4,678 |
| | 15 |
| | (90 | ) | | 4,603 |
|
| Total available-for-sale debt securities | 271,172 |
| | 6,662 |
| | (1,683 | ) | | 276,151 |
|
| Held-to-maturity debt securities, substantially all U.S. agency mortgage-backed securities | 35,265 |
| | 181 |
| | (4 | ) | | 35,442 |
|
| Total debt securities | $ | 306,437 |
| | $ | 6,843 |
| | $ | (1,687 | ) | | $ | 311,593 |
|
Available-for-sale marketable equity securities (2) | $ | 65 |
| | $ | 10 |
| | $ | (7 | ) | | $ | 68 |
|
| |
(1) | At December 31, 2012 and 2011, includes approximately 91 percent and 89 percent prime, six percent and nine percent Alt-A, and three percent and two percent subprime. |
| |
(2) | Classified in other assets on the Corporation’s Consolidated Balance Sheet. |
At December 31, 2012, the accumulated net unrealized gains on AFS debt securities included in accumulated OCI were $4.4 billion, net of the related income tax expense of $2.6 billion. At December 31, 2012 and 2011, the Corporation had nonperforming AFS debt securities of $91 million and $140 million.
The Corporation recorded OTTI losses on AFS debt securities for 2012, 2011 and 2010 as presented in the table below. A debt security is impaired when its fair value is less than its amortized cost. If the Corporation intends or will more-likely-than-not be required to sell the debt securities prior to recovery, the entire impairment loss is recorded in the Corporation’s Consolidated Statement of Income. For debt securities the Corporation does not intend or will not more-likely-than-not be required to sell, an
analysis is performed to determine if any of the impairment is due to credit or whether it is due to other factors (e.g., interest rate). Credit losses are considered unrecoverable and are recorded in the Corporation’s Consolidated Statement of Income with the remaining unrealized losses recorded in accumulated OCI. In certain instances, the credit loss on a debt security may exceed the total impairment, in which case, the portion of the credit loss that exceeds the total impairment is recorded as an unrealized gain in accumulated OCI. Balances in the table below exclude $5 million, $9 million and $51 million of unrealized gains recorded in accumulated OCI related to these securities for 2012, 2011 and 2010, respectively.
|
| | | | | | | | | | | | | | | | | | | | | | | |
| | | | | | | | | | | | |
| Net Impairment Losses Recognized in Earnings | | | | | | |
| | | | | | | | | | | | |
| | 2012 |
| (Dollars in millions) | Non-agency
Residential
MBS | | Non-agency
Commercial
MBS | | Non-U.S.
Securities | | Corporate
Bonds | | Other
Taxable
Securities | | Total |
| Total OTTI losses (unrealized and realized) | $ | (50 | ) | | $ | (7 | ) | | $ | — |
| | $ | — |
| | $ | — |
| | $ | (57 | ) |
| Unrealized OTTI losses recognized in accumulated OCI | 4 |
| | — |
| | — |
| | — |
| | — |
| | 4 |
|
| Net impairment losses recognized in earnings | $ | (46 | ) | | $ | (7 | ) | | $ | — |
| | $ | — |
| | $ | — |
| | $ | (53 | ) |
| | | | | | | | | | | | |
| | 2011 |
| Total OTTI losses (unrealized and realized) | $ | (348 | ) | | $ | (10 | ) | | $ | — |
| | $ | — |
| | $ | (2 | ) | | $ | (360 | ) |
| Unrealized OTTI losses recognized in accumulated OCI | 61 |
| | — |
| | — |
| | — |
| | — |
| | 61 |
|
| Net impairment losses recognized in earnings | $ | (287 | ) | | $ | (10 | ) | | $ | — |
| | $ | — |
| | $ | (2 | ) | | $ | (299 | ) |
| | | | | | | | | | | | |
| | 2010 |
| Total OTTI losses (unrealized and realized) | $ | (1,305 | ) | | $ | (19 | ) | | $ | (276 | ) | | $ | (6 | ) | | $ | (568 | ) | | $ | (2,174 | ) |
| Unrealized OTTI losses recognized in accumulated OCI | 817 |
| | 15 |
| | 16 |
| | 2 |
| | 357 |
| | 1,207 |
|
| Net impairment losses recognized in earnings | $ | (488 | ) | | $ | (4 | ) | | $ | (260 | ) | | $ | (4 | ) | | $ | (211 | ) | | $ | (967 | ) |
The Corporation’s net impairment losses recognized in earnings consist of write-downs to fair value on AFS securities the Corporation has the intent to sell or will more-likely-than-not be required to sell and all credit losses. The table below presents a
rollforward of the credit losses recognized in earnings in 2012, 2011 and 2010 on AFS debt securities that the Corporation does not have the intent to sell or will not more-likely-than-not be required to sell.
|
| | | | | | | | | | | |
| | | | | | |
| Rollforward of Credit Losses Recognized | | | | |
| | | | | | |
| (Dollars in millions) | 2012 | | 2011 | | 2010 |
|
| Balance, January 1 | $ | 310 |
| | $ | 2,148 |
| | $ | 3,155 |
|
| Additions for credit losses recognized on debt securities that had no previous impairment losses | 7 |
| | 72 |
| | 487 |
|
| Additions for credit losses recognized on debt securities that had previously incurred impairment losses | 46 |
| | 149 |
| | 421 |
|
| Reductions for debt securities sold or intended to be sold | (120 | ) | | (2,059 | ) | | (1,915 | ) |
| Balance, December 31 | $ | 243 |
| | $ | 310 |
| | $ | 2,148 |
|
The Corporation estimates the portion of a loss on a security that is attributable to credit using a discounted cash flow model and estimates the expected cash flows of each poolthe underlying collateral using internal credit, risk, interest rate and prepayment risk models. Themodels that incorporate management’s best estimate of current key assumptions used in the models include the Corporation’s estimate ofsuch as default rates, loss severity and prepayment speeds.rates. Assumptions used for the underlying loans that support the MBS can vary widely from loan to loan and are influenced by such
factors as loan interest rate, geographic location of the borrower, borrower characteristics and collateral type. Based on these assumptions, the Corporation then determines how the underlying collateral cash flows will be distributed to each MBS issued from the applicable special purpose entity. Expected principal and interest cash flows on an impaired AFS debt security are discounted using the effective yield of each individual impaired AFS debt security.
Significant assumptions used in estimating the expected cash flows for measuring credit losses on non-agency residential mortgage-backed securities (RMBS) were as follows at December 31, 2012.
|
| | | | | | | | |
| | | | | | |
| Significant Assumptions |
| | | | | | |
| | | | Range (1) |
| | Weighted- average | | 10th Percentile (2) | | 90th Percentile (2) |
| Prepayment speed | 12.9 | % | | 3.1 | % | | 29.7 | % |
| Loss severity | 49.5 |
| | 24.2 |
| | 63.1 |
|
| Life default rate | 52.4 |
| | 2.4 |
| | 98.2 |
|
| |
(1) | Represents the range of inputs/assumptions based upon the underlying collateral. |
| |
(2) | The value of a variable below which the indicated percentile of observations will fall. |
Annual constant prepayment speed and loss severity rates are projected considering collateral characteristics such as LTV, creditworthiness of borrowers as measured using FICO scores and geographic concentrations. The weighted-average severity by collateral type was 45.8 percent for prime, 50.6 percent for Alt-A and 55.9 percent for subprime at December 31, 2012. Additionally, default rates are projected by considering collateral characteristics including, but not limited to, LTV, FICO and geographic concentration. Weighted-average life default rates by collateral type were 39.5 percent for prime, 63.5 percent for Alt-A and 41.8 percent for subprime at December 31, 2012.
The table below presents the fair value and the associated gross unrealized losses on AFS securities with gross unrealized losses at December 31, 2012 and 2011, and whether these securities have had gross unrealized losses for less than twelve months or for twelve months or longer.
|
| | | | | | | | | | | | | | | | | | | | | | | |
| | | | | | | | | | | | |
| Temporarily Impaired and Other-than-temporarily Impaired Securities | | | | | | |
| | | | | | | | | | | | |
| | December 31, 2012 |
| | Less than Twelve Months | | Twelve Months or Longer | | Total |
| (Dollars in millions) | Fair Value | | Gross Unrealized Losses | | Fair Value | | Gross Unrealized Losses | | Fair Value | | Gross Unrealized Losses |
| Temporarily impaired available-for-sale debt securities | |
| | |
| | |
| | |
| | |
| | |
|
| U.S. Treasury and agency securities | $ | — |
| | $ | — |
| | $ | 5,608 |
| | $ | (84 | ) | | $ | 5,608 |
| | $ | (84 | ) |
| Mortgage-backed securities: | | | | | | | | | | | |
| Agency | 15,593 |
| | (133 | ) | | 735 |
| | (13 | ) | | 16,328 |
| | (146 | ) |
| Agency-collateralized mortgage obligations | 5,135 |
| | (121 | ) | | 4,994 |
| | (97 | ) | | 10,129 |
| | (218 | ) |
| Non-agency residential | 592 |
| | (13 | ) | | 1,555 |
| | (110 | ) | | 2,147 |
| | (123 | ) |
| Non-U.S. securities | 1,715 |
| | (1 | ) | | 563 |
| | (5 | ) | | 2,278 |
| | (6 | ) |
| Corporate/Agency bonds | — |
| | — |
| | 277 |
| | (16 | ) | | 277 |
| | (16 | ) |
| Other taxable securities | 1,678 |
| | (1 | ) | | 1,436 |
| | (14 | ) | | 3,114 |
| | (15 | ) |
| Total taxable securities | 24,713 |
| | (269 | ) | | 15,168 |
| | (339 | ) | | 39,881 |
| | (608 | ) |
| Tax-exempt securities | 1,609 |
| | (9 | ) | | 1,072 |
| | (38 | ) | | 2,681 |
| | (47 | ) |
| Total temporarily impaired available-for-sale debt securities | 26,322 |
| | (278 | ) | | 16,240 |
| | (377 | ) | | 42,562 |
| | (655 | ) |
Other-than-temporarily impaired available-for-sale debt securities (1) | | | | | | | | | | | |
| Non-agency residential mortgage-backed securities | 14 |
| | (1 | ) | | 74 |
| | (4 | ) | | 88 |
| | (5 | ) |
Total temporarily impaired and other-than-temporarily impaired available-for-sale securities (2) | $ | 26,336 |
| | $ | (279 | ) | | $ | 16,314 |
| | $ | (381 | ) | | $ | 42,650 |
| | $ | (660 | ) |
| | | | | | | | | | | | |
| | December 31, 2011 |
| Temporarily impaired available-for-sale debt securities | | | | | | | | | | | |
| U.S. Treasury and agency securities | $ | — |
| | $ | — |
| | $ | 38,269 |
| | $ | (811 | ) | | $ | 38,269 |
| | $ | (811 | ) |
| Mortgage-backed securities: | | | | | | | | | | | |
| Agency | 4,679 |
| | (13 | ) | | 474 |
| | (8 | ) | | 5,153 |
| | (21 | ) |
| Agency-collateralized mortgage obligations | 11,448 |
| | (134 | ) | | 976 |
| | (33 | ) | | 12,424 |
| | (167 | ) |
| Non-agency residential | 2,112 |
| | (59 | ) | | 3,950 |
| | (350 | ) | | 6,062 |
| | (409 | ) |
| Non-agency commercial | 55 |
| | (1 | ) | | — |
| | — |
| | 55 |
| | (1 | ) |
| Non-U.S. securities | 1,008 |
| | (13 | ) | | 165 |
| | (1 | ) | | 1,173 |
| | (14 | ) |
| Corporate/Agency bonds | 415 |
| | (29 | ) | | 111 |
| | (8 | ) | | 526 |
| | (37 | ) |
| Other taxable securities | 4,210 |
| | (41 | ) | | 1,361 |
| | (19 | ) | | 5,571 |
| | (60 | ) |
| Total taxable securities | 23,927 |
| | (290 | ) | | 45,306 |
| | (1,230 | ) | | 69,233 |
| | (1,520 | ) |
| Tax-exempt securities | 1,117 |
| | (25 | ) | | 2,754 |
| | (65 | ) | | 3,871 |
| | (90 | ) |
| Total temporarily impaired available-for-sale debt securities | 25,044 |
| | (315 | ) | | 48,060 |
| | (1,295 | ) | | 73,104 |
| | (1,610 | ) |
| Temporarily impaired available-for-sale marketable equity securities | 31 |
| | (1 | ) | | 6 |
| | (6 | ) | | 37 |
| | (7 | ) |
| Total temporarily impaired available-for-sale securities | 25,075 |
| | (316 | ) | | 48,066 |
| | (1,301 | ) | | 73,141 |
| | (1,617 | ) |
Other-than-temporarily impaired available-for-sale debt securities (1) | | | | | | | | | | | |
| Non-agency residential mortgage-backed securities | 158 |
| | (28 | ) | | 489 |
| | (45 | ) | | 647 |
| | (73 | ) |
Total temporarily impaired and other-than-temporarily impaired available-for-sale securities (2) | $ | 25,233 |
| | $ | (344 | ) | | $ | 48,555 |
| | $ | (1,346 | ) | | $ | 73,788 |
| | $ | (1,690 | ) |
| |
(1) | Includes other-than-temporarily impaired AFS debt securities on which an OTTI loss remains in OCI. |
| |
(2) | At December 31, 2012 and 2011, the amortized cost of approximately 2,600 and 3,800 AFS securities exceeded their fair value by $660 million and $1.7 billion. |
The amortized cost and fair value of the Corporation’s investment in AFS and HTM debt securities from FNMA, the Government National Mortgage Association (GNMA), FHLMC and U.S. Treasury securities where the investment exceeded 10 percent of consolidated shareholders’ equity at December 31, 2012 and 2011 are presented in the table below.
|
| | | | | | | | | | | | | | | |
| | | | | | | | |
| Selected Securities Exceeding 10 Percent of Shareholders’ Equity | | |
| | | | | | | | |
| | December 31 |
| | 2012 | | 2011 |
| (Dollars in millions) | Amortized Cost | | Fair Value | | Amortized Cost | | Fair Value |
| Government National Mortgage Association | $ | 124,348 |
| | $ | 127,541 |
| | $ | 102,960 |
| | $ | 106,200 |
|
| Fannie Mae | 121,522 |
| | 123,933 |
| | 87,898 |
| | 89,243 |
|
| Freddie Mac | 22,995 |
| | 23,502 |
| | 26,617 |
| | 27,129 |
|
| U.S. Treasury securities | 21,269 |
| | 21,305 |
| | 39,946 |
| | 39,164 |
|
The expected maturity distribution of the Corporation’s MBS and the contractual maturity distribution of the Corporation’s other AFS debt securities, and the yields on the Corporation’s AFS debt securities portfolio at December 31, 2012 are summarized in the
table below. Actual maturities may differ from the contractual or expected maturities since borrowers may have the right to prepay obligations with or without prepayment penalties.
|
| | | | | | | | | | | | | | | | | | | | | | | | | | | | | | | | | | |
| | | | | | | | | | | | | | | | | | | | |
| Debt Securities Maturities | | | | | | | | | | | | | | |
| | | | | | | | | | | | | | | | | | | | |
| | December 31, 2012 |
| | Due in One Year or Less | | Due after One Year through Five Years | | Due after Five Years through Ten Years | | Due after Ten Years | | Total |
| (Dollars in millions) | Amount | | Yield (1) | | Amount | | Yield (1) | | Amount | | Yield (1) | | Amount | | Yield (1) | | Amount | | Yield (1) |
| Amortized cost of AFS debt securities | |
| | |
| | |
| | |
| | |
| | |
| | |
| | |
| | |
| | |
|
| U.S. Treasury and agency securities | $ | 548 |
| | 0.57 | % | | $ | 855 |
| | 2.12 | % | | $ | 1,884 |
| | 5.30 | % | | $ | 20,945 |
| | 2.80 | % | | $ | 24,232 |
| | 3.00 | % |
| Mortgage-backed securities: | |
| | |
| | |
| | |
| | |
| | |
| | |
| | |
| | |
| | |
|
| Agency | 7 |
| | 4.70 |
| | 59,880 |
| | 3.10 |
| | 123,075 |
| | 2.90 |
| | 285 |
| | 2.60 |
| | 183,247 |
| | 2.90 |
|
| Agency-collateralized mortgage obligations | 11 |
| | 6.31 |
| | 12,876 |
| | 1.20 |
| | 23,427 |
| | 3.10 |
| | 15 |
| | 1.10 |
| | 36,329 |
| | 2.40 |
|
| Non-agency residential | 750 |
| | 4.50 |
| | 5,112 |
| | 4.30 |
| | 2,767 |
| | 4.00 |
| | 602 |
| | 6.70 |
| | 9,231 |
| | 4.40 |
|
| Non-agency commercial | 456 |
| | 5.70 |
| | 3,080 |
| | 5.90 |
| | 22 |
| | 3.70 |
| | 18 |
| | 4.03 |
| | 3,576 |
| | 5.90 |
|
| Non-U.S. securities | 4,247 |
| | 1.46 |
| | 1,169 |
| | 6.10 |
| | 158 |
| | 2.20 |
| | — |
| | — |
| | 5,574 |
| | 2.65 |
|
| Corporate/Agency bonds | 315 |
| | 2.40 |
| | 808 |
| | 2.80 |
| | 185 |
| | 4.52 |
| | 107 |
| | 0.90 |
| | 1,415 |
| | 2.92 |
|
| Other taxable securities | 2,501 |
| | 1.10 |
| | 4,926 |
| | 1.10 |
| | 3,803 |
| | 1.82 |
| | 859 |
| | 1.10 |
| | 12,089 |
| | 1.37 |
|
| Total taxable securities | 8,835 |
| | 1.84 |
| | 88,706 |
| | 2.91 |
| | 155,321 |
| | 2.95 |
| | 22,831 |
| | 2.83 |
| | 275,693 |
| | 2.86 |
|
| Tax-exempt securities | 43 |
| | 2.63 |
| | 1,524 |
| | 1.40 |
| | 1,185 |
| | 2.02 |
| | 1,415 |
| | 1.10 |
| | 4,167 |
| | 1.68 |
|
| Total amortized cost of AFS debt securities | $ | 8,878 |
| | 1.84 |
| | $ | 90,230 |
| | 2.88 |
| | $ | 156,506 |
| | 2.95 |
| | $ | 24,246 |
| | 2.72 |
| | $ | 279,860 |
| | 2.84 |
|
Total amortized cost of held-to-maturity debt securities (2) | $ | 6 |
| | 5.00 |
| | $ | 8,616 |
| | 2.30 |
| | $ | 40,836 |
| | 2.40 |
| | $ | 23 |
| | 4.40 |
| | $ | 49,481 |
| | 2.40 |
|
| Fair value of AFS debt securities | |
| | |
| | |
| | |
| | |
| | |
| | |
| | |
| | |
| | |
|
| U.S. Treasury and agency securities | $ | 549 |
| | |
| | $ | 883 |
| | |
| | $ | 2,072 |
| | |
| | $ | 20,968 |
| | |
| | $ | 24,472 |
| | |
|
| Mortgage-backed securities: | |
| | |
| | |
| | |
| | |
| | |
| | |
| | |
| | |
| | |
|
| Agency | 7 |
| | |
| | 61,234 |
| | |
| | 126,619 |
| | |
| | 289 |
| | |
| | 188,149 |
| | |
|
| Agency-collateralized mortgage obligations | 11 |
| | |
| | 12,827 |
| | |
| | 24,684 |
| | |
| | 16 |
| | |
| | 37,538 |
| | |
|
| Non-agency residential | 749 |
| | |
| | 5,239 |
| | |
| | 2,841 |
| | |
| | 665 |
| | |
| | 9,494 |
| | |
|
| Non-agency commercial | 477 |
| | |
| | 3,405 |
| | |
| | 24 |
| | |
| | 18 |
| | |
| | 3,924 |
| | |
|
| Non-U.S. securities | 4,244 |
| | |
| | 1,211 |
| | |
| | 163 |
| | |
| | — |
| | |
| | 5,618 |
| | |
|
| Corporate/Agency bonds | 320 |
| | |
| | 826 |
| | |
| | 207 |
| | |
| | 97 |
| | |
| | 1,450 |
| | |
|
| Other taxable securities | 2,502 |
| | |
| | 4,947 |
| | |
| | 3,825 |
| | |
| | 854 |
| | |
| | 12,128 |
| | |
|
| Total taxable securities | 8,859 |
| | |
| | 90,572 |
| | |
| | 160,435 |
| | |
| | 22,907 |
| | |
| | 282,773 |
| | |
|
| Tax-exempt securities | 43 |
| | |
| | 1,526 |
| | |
| | 1,184 |
| | |
| | 1,380 |
| | |
| | 4,133 |
| | |
|
| Total fair value of AFS debt securities | $ | 8,902 |
| | |
| | $ | 92,098 |
| | |
| | $ | 161,619 |
| | |
| | $ | 24,287 |
| | |
| | $ | 286,906 |
| | |
|
Total fair value of held-to-maturity debt securities (2) | $ | 6 |
| | | | $ | 8,790 |
| | | | $ | 41,451 |
| | | | $ | 23 |
| | | | $ | 50,270 |
| | |
| |
(1) | Average yield is computed using the effective yield of each security at the end of the period, weighted based on the amortized cost of each security. The effective yield considers the contractual coupon, amortization of premiums and accretion of discounts, and excludes the effect of related hedging derivatives. |
| |
(2) | Substantially all U.S. agency mortgage-backed securities. |
The gross realized gains and losses on sales of AFS debt securities for 2012, 2011 and 2010 are presented in the table below.
|
| | | | | | | | | | | |
| | | | | | |
| Gains and Losses on Sales of AFS Debt Securities |
| | | | | | |
| (Dollars in millions) | 2012 | | 2011 | | 2010 |
| Gross gains | $ | 2,128 |
| | $ | 3,685 |
| | $ | 3,995 |
|
| Gross losses | (466 | ) | | (311 | ) | | (1,469 | ) |
| Net gains on sales of AFS debt securities | $ | 1,662 |
| | $ | 3,374 |
| | $ | 2,526 |
|
| Income tax expense attributable to realized net gains on sales of AFS debt securities | $ | 615 |
| | $ | 1,248 |
| | $ | 935 |
|
Certain Corporate and Strategic Investments
At December 31, 2012 and 2011, the Corporation owned 2.0 billion shares representing approximately one percent of China
Construction Bank Corporation (CCB). Sales restrictions on these shares continue until August 2013. Because the sales restrictions on these shares will expire within one year, these securities are accounted for as AFS marketable equity securities and are carried at fair value with the after-tax unrealized gain included in accumulated OCI. At December 31, 2011, this investment was accounted for at cost. The carrying value of the investment at December 31, 2012and 2011 was $1.4 billion and $716 million, and the cost basis and the fair value were $716 million and $1.4 billion for both periods. There is a strategic assistance agreement between the Corporation and CCB, which includes cooperation in specific business areas.
The Corporation’s 49 percent investment in a merchant services joint venture had a carrying value of $3.3 billion and $3.4 billion at December 31, 2012 and 2011. For additional information, see Note 13 – Commitments and Contingencies.
NOTE 5 Outstanding Loans and Leases
The following tables present total outstanding loans and leases and an aging analysis for the Corporation’s Home Loans, Credit Card and Other Consumer, and Commercial portfolio segments, by class of financing receivables, at December��31, 2012 and 2011.
|
| | | | | | | | | | | | | | | | | | | | | | | | | | | | | | | |
| | | | | | | | | | | | | | | | |
| | December 31, 2012 |
| (Dollars in millions) | 30-59 Days Past Due (1) | | 60-89 Days Past Due (1) | | 90 Days or
More Past Due (2) | | Total Past
Due 30 Days or More | | Total Current or Less Than 30 Days Past Due (3) | | Purchased
Credit-impaired (4) | | Loans Accounted for Under the Fair Value Option | | Total Outstandings |
| Home loans | |
| | | | |
| | |
| | |
| | |
| | |
| | |
|
| Core portfolio | | | | | | | | | | | | | | | |
Residential mortgage (5) | $ | 2,274 |
| | $ | 806 |
| | $ | 6,227 |
| | $ | 9,307 |
| | $ | 160,809 |
| | | | | | $ | 170,116 |
|
| Home equity | 273 |
| | 146 |
| | 591 |
| | 1,010 |
| | 59,841 |
| | | | | | 60,851 |
|
| Legacy Assets & Servicing portfolio | | | | | | | | | | | | | | | |
| Residential mortgage | 2,891 |
| | 1,696 |
| | 26,494 |
| | 31,081 |
| | 33,247 |
| | $ | 8,737 |
| | | | 73,065 |
|
| Home equity | 607 |
| | 356 |
| | 1,444 |
| | 2,407 |
| | 36,191 |
| | 8,547 |
| | | | 47,145 |
|
Discontinued real estate (6) | 48 |
| | 19 |
| | 234 |
| | 301 |
| | 757 |
| | 8,834 |
| | | | 9,892 |
|
| Credit card and other consumer | | | | | | | | | | | | | | | |
| U.S. credit card | 729 |
| | 582 |
| | 1,437 |
| | 2,748 |
| | 92,087 |
| | | | | | 94,835 |
|
| Non-U.S. credit card | 106 |
| | 85 |
| | 212 |
| | 403 |
| | 11,294 |
| | | | | | 11,697 |
|
Direct/Indirect consumer (7) | 569 |
| | 239 |
| | 573 |
| | 1,381 |
| | 81,824 |
| | | | | | 83,205 |
|
Other consumer (8) | 48 |
| | 19 |
| | 4 |
| | 71 |
| | 1,557 |
| | | | | | 1,628 |
|
| Total consumer loans | 7,545 |
| | 3,948 |
| | 37,216 |
| | 48,709 |
| | 477,607 |
| | 26,118 |
| | | | 552,434 |
|
Consumer loans accounted for under the fair value option (9) | |
| | |
| | |
| | |
| | |
| | |
| | $ | 1,005 |
| | 1,005 |
|
| Total consumer | 7,545 |
| | 3,948 |
| | 37,216 |
| | 48,709 |
| | 477,607 |
| | 26,118 |
| | 1,005 |
| | 553,439 |
|
| Commercial | | | | | | | | | | | | | | | |
| U.S. commercial | 323 |
| | 133 |
| | 639 |
| | 1,095 |
| | 196,031 |
| | | | | | 197,126 |
|
Commercial real estate (10) | 79 |
| | 144 |
| | 983 |
| | 1,206 |
| | 37,431 |
| | | | | | 38,637 |
|
| Commercial lease financing | 84 |
| | 79 |
| | 30 |
| | 193 |
| | 23,650 |
| | | | | | 23,843 |
|
| Non-U.S. commercial | 2 |
| | — |
| | — |
| | 2 |
| | 74,182 |
| | | | | | 74,184 |
|
| U.S. small business commercial | 101 |
| | 75 |
| | 168 |
| | 344 |
| | 12,249 |
| | | | | | 12,593 |
|
| Total commercial loans | 589 |
| | 431 |
| | 1,820 |
| | 2,840 |
| | 343,543 |
| | | | | | 346,383 |
|
Commercial loans accounted for under the fair value option (9) | |
| | |
| | |
| | |
| | |
| | |
| | 7,997 |
| | 7,997 |
|
| Total commercial | 589 |
| | 431 |
| | 1,820 |
| | 2,840 |
| | 343,543 |
| | | | 7,997 |
| | 354,380 |
|
| Total loans and leases | $ | 8,134 |
| | $ | 4,379 |
| | $ | 39,036 |
| | $ | 51,549 |
| | $ | 821,150 |
| | $ | 26,118 |
| | $ | 9,002 |
| | $ | 907,819 |
|
| Percentage of outstandings | 0.90 | % | | 0.48 | % | | 4.30 | % | | 5.68 | % | | 90.45 | % | | 2.88 | % | | 0.99 | % | | |
|
| |
(1) | Home loans 30-59 days past due includes $2.3 billion of fully-insured loans and $702 million of nonperforming loans. Home loans 60-89 days past due includes $1.3 billion of fully-insured loans and $558 million of nonperforming loans. |
| |
(2) | Home loans includes $22.2 billion of fully-insured loans. |
| |
(3) | Home loans includes $5.5 billion and direct/indirect consumer includes $63 million of nonperforming loans. |
| |
(4) | PCI loan amounts are shown gross of the valuation allowance. |
| |
(5) | Total outstandings includes non-U.S. residential mortgage loans of $93 million. |
| |
(6) | Total outstandings includes $8.8 billion of pay option loans and $1.1 billion of subprime loans. The Corporation no longer originates these products. |
| |
(7) | Total outstandings includes dealer financial services loans of $35.9 billion, consumer lending loans of $4.7 billion, U.S. securities-based lending margin loans of $28.3 billion, student loans of $4.8 billion, non-U.S. consumer loans of $8.3 billion and other consumer loans of $1.2 billion. |
| |
(8) | Total outstandings includes consumer finance loans of $1.4 billion, other non-U.S. consumer loans of $5 million and consumer overdrafts of $177 million. |
| |
(9) | Consumer loans accounted for under the fair value option were residential mortgage loans of $147 million and discontinued real estate loans of $858 million. Commercial loans accounted for under the fair value option were U.S. commercial loans of $2.3 billion and non-U.S. commercial loans of $5.7 billion. For additional information, see Note 21 – Fair Value Measurements and Note 22 – Fair Value Option. |
| |
(10) | Total outstandings includes U.S. commercial real estate loans of $37.2 billion and non-U.S. commercial real estate loans of $1.5 billion. |
|
| | | | | | | | | | | | | | | | | | | | | | | | | | | | | | | |
| | | | | | | | | | | | | | | | |
| | December 31, 2011 |
| (Dollars in millions) | 30-59 Days
Past Due (1) | | 60-89 Days Past Due (1) | | 90 Days or
More
Past Due (2) | | Total Past
Due 30 Days
or More | | Total Current or Less Than 30 Days Past Due (3) | | Purchased
Credit-impaired (4) | | Loans Accounted for Under the Fair Value Option | | Total Outstandings |
| Home loans | |
| | | | |
| | |
| | |
| | |
| | |
| | |
|
| Core portfolio | | | | | | | | | | | | | | | |
Residential mortgage (5) | $ | 2,151 |
| | $ | 751 |
| | $ | 3,017 |
| | $ | 5,919 |
| | $ | 172,418 |
| | | | |
| | $ | 178,337 |
|
| Home equity | 260 |
| | 155 |
| | 429 |
| | 844 |
| | 66,211 |
| | | | |
| | 67,055 |
|
| Legacy Assets & Servicing portfolio | | | |
| | |
| | |
| | |
| | |
| | |
| | |
|
| Residential mortgage | 3,195 |
| | 2,174 |
| | 32,167 |
| | 37,536 |
| | 36,451 |
| | $ | 9,966 |
| | |
| | 83,953 |
|
| Home equity | 845 |
| | 508 |
| | 1,735 |
| | 3,088 |
| | 42,578 |
| | 11,978 |
| | |
| | 57,644 |
|
Discontinued real estate (6) | 65 |
| | 24 |
| | 351 |
| | 440 |
| | 798 |
| | 9,857 |
| | |
| | 11,095 |
|
| Credit card and other consumer | | | |
| | |
| | |
| | |
| | |
| | |
| | |
|
| U.S. credit card | 981 |
| | 772 |
| | 2,070 |
| | 3,823 |
| | 98,468 |
| | | | |
| | 102,291 |
|
| Non-U.S. credit card | 148 |
| | 120 |
| | 342 |
| | 610 |
| | 13,808 |
| | | | |
| | 14,418 |
|
Direct/Indirect consumer (7) | 805 |
| | 338 |
| | 779 |
| | 1,922 |
| | 87,791 |
| | | | |
| | 89,713 |
|
Other consumer (8) | 55 |
| | 21 |
| | 17 |
| | 93 |
| | 2,595 |
| | | | |
| | 2,688 |
|
| Total consumer loans | 8,505 |
| | 4,863 |
| | 40,907 |
| | 54,275 |
| | 521,118 |
| | 31,801 |
| | |
| 607,194 |
|
Consumer loans accounted for under the fair value option (9) | | | | | | | | | | | | | $ | 2,190 |
|
| 2,190 |
|
| Total consumer | 8,505 |
| | 4,863 |
| | 40,907 |
| | 54,275 |
| | 521,118 |
| | 31,801 |
| | 2,190 |
| | 609,384 |
|
| Commercial | | | |
| | |
| | |
| | |
| | |
| | |
| | |
|
| U.S. commercial | 352 |
| | 166 |
| | 866 |
| | 1,384 |
| | 178,564 |
| | | | |
| | 179,948 |
|
Commercial real estate (10) | 288 |
| | 118 |
| | 1,860 |
| | 2,266 |
| | 37,330 |
| | | | |
| | 39,596 |
|
| Commercial lease financing | 78 |
| | 15 |
| | 22 |
| | 115 |
| | 21,874 |
| | | | |
| | 21,989 |
|
| Non-U.S. commercial | 24 |
| | — |
| | — |
| | 24 |
| | 55,394 |
| | | | |
| | 55,418 |
|
| U.S. small business commercial | 150 |
| | 106 |
| | 272 |
| | 528 |
| | 12,723 |
| | | | |
| | 13,251 |
|
| Total commercial loans | 892 |
| | 405 |
| | 3,020 |
| | 4,317 |
| | 305,885 |
| | | | |
| | 310,202 |
|
Commercial loans accounted for under the fair value option (9) | | | | | | | | | | | | | 6,614 |
| | 6,614 |
|
| Total commercial | 892 |
| | 405 |
| | 3,020 |
| | 4,317 |
| | 305,885 |
| | | | 6,614 |
| | 316,816 |
|
| Total loans and leases | $ | 9,397 |
| | $ | 5,268 |
| | $ | 43,927 |
| | $ | 58,592 |
| | $ | 827,003 |
| | $ | 31,801 |
| | $ | 8,804 |
| | $ | 926,200 |
|
| Percentage of outstandings | 1.02 | % | | 0.57 | % | | 4.74 | % | | 6.33 | % | | 89.29 | % | | 3.43 | % | | 0.95 | % | | |
|
| |
(1) | Home loans 30-59 days past due includes $2.2 billion of fully-insured loans and $372 million of nonperforming loans. Home loans 60-89 days past due includes $1.4 billion of fully-insured loans and $398 million of nonperforming loans. |
| |
(2) | Home loans includes $21.2 billion of fully-insured loans. |
| |
(3) | Home loans includes $1.8 billion and direct/indirect consumer includes $7 million of nonperforming loans. |
| |
(4) | PCI loan amounts are shown gross of the valuation allowance. |
| |
(5) | Total outstandings includes non-U.S. residential mortgage loans of $85 million. |
| |
(6) | Total outstandings includes $9.9 billion of pay option loans and $1.2 billion of subprime loans. The Corporation no longer originates these products. |
| |
(7) | Total outstandings includes dealer financial services loans of $43.0 billion, consumer lending loans of $8.0 billion, U.S. securities-based lending margin loans of $23.6 billion, student loans of $6.0 billion, non-U.S. consumer loans of $7.6 billion and other consumer loans of $1.5 billion. |
| |
(8) | Total outstandings includes consumer finance loans of $1.7 billion, other non-U.S. consumer loans of $929 million and consumer overdrafts of $103 million. |
| |
(9) | Consumer loans accounted for under the fair value option were residential mortgage loans of $906 million and discontinued real estate loans of $1.3 billion. Commercial loans accounted for under the fair value option were U.S. commercial loans of $2.2 billion and non-U.S. commercial loans of $4.4 billion. For additional information, see Note 21 – Fair Value Measurements and Note 22 – Fair Value Option. |
| |
(10) | Total outstandings includes U.S. commercial real estate loans of $37.8 billion and non-U.S. commercial real estate loans of $1.8 billion. |
The Corporation mitigates a portion of its credit risk on the residential mortgage portfolio through the use of synthetic securitization vehicles. These vehicles issue long-term notes to investors, the proceeds of which are held as cash collateral. The Corporation pays a premium to the vehicles to purchase mezzanine loss protection on a portfolio of residential mortgage loans owned by the Corporation. Cash held in the vehicles is used to reimburse the Corporation in the event that losses on the mortgage portfolio exceed 10 basis points (bps) of the original pool balance, up to the remaining amount of purchased loss protection of $500 million and $783 million at December 31, 2012 and 2011. The vehicles from which the Corporation purchases credit protection are VIEs. The Corporation does not have a variable interest in these vehicles, and accordingly, these vehicles are not consolidated by the Corporation. Amounts due from the vehicles are recorded in other income (loss) when the Corporation recognizes a reimbursable loss, as described above. Amounts are collected when reimbursable losses are realized through the sale of the underlying collateral. At December 31, 2012 and 2011, the Corporation had a receivable of $305 million and $359 million from these vehicles for reimbursement of losses, and principal of $17.6 billion and $23.9 billion of residential mortgage loans was referenced under these agreements. The Corporation records an allowance for Countrywidecredit losses on these loans without regard to the existence of the purchased loss protection as the protection does not represent a guarantee of individual loans.
In addition, the Corporation has entered into long-term credit protection agreements with FNMA and FHLMC on loans totaling $24.3 billion and $24.4 billion at December 31, 2012 and 2011, providing full protection on residential mortgage loans that become severely delinquent. All of these loans are individually insured and therefore the Corporation does not record an allowance for credit losses related to these loans. For additional information, see Note 8 – Representations and Warranties Obligations and Corporate Guarantees.
Nonperforming Loans and Leases
In 2012, the bank regulatory agencies jointly issued interagency supervisory guidance on nonaccrual status for junior-lien consumer real estate loans. In accordance with this regulatory interagency guidance, the Corporation classifies junior-lien home equity loans as nonperforming when the first-lien loan becomes 90 days past due even if the junior-lien loan is performing, and as a result, an incremental $1.5 billion was included in nonperforming loans at December 31, 2012. The regulatory interagency guidance had no impact on the Corporation’s allowance for loan and lease losses or provision for credit losses as the delinquency status of the underlying first-lien loans was already considered in the Corporation’s reserving process.
In 2012, new regulatory guidance was issued addressing certain consumer real estate loans that have been discharged in Chapter 7 bankruptcy. In accordance with this new guidance, the Corporation classifies consumer real estate and other secured consumer loans that have been discharged in Chapter 7 bankruptcy and not reaffirmed by the borrower as TDRs, irrespective of payment history or delinquency status, even if the repayment terms for the loan have not been otherwise modified. The Corporation continues to have a lien on the underlying collateral. Previously, such loans were classified as TDRs only if there had been a change in contractual payment terms that represented a concession to the borrower. The net impact upon implementation to the consumer loan portfolio of adopting this new regulatory guidance was $1.2 billion in net new nonperforming loans, and $1.1 billion of such loans were included in nonperforming loans at December 31, 2012. Of the $1.1 billion, $1.0 billion, or 92 percent, were current on their contractual payments. Of these contractually current nonperforming loans, more than 70 percent were discharged in Chapter 7 bankruptcy more than 12 months ago, and more than 40 percent were discharged 24 months or more ago. As subsequent cash payments are received, the interest component of the payments is generally recorded as interest income on a cash basis and the principal component is generally recorded as a reduction in the carrying value of the loan.
The table below presents the Corporation’s nonperforming loans and leases including nonperforming TDRs and loans accruing past due 90 days or more at December 31, 2012 and 2011. Nonperforming LHFS are excluded from nonperforming
loans and leases as they are recorded at either fair value or the lower of cost or fair value. See Note 1 – Summary of Significant Accounting Principles for further information on the criteria for classification as nonperforming.
|
| | | | | | | | | | | | | | | |
| | | | | | | | |
| Credit Quality | | |
| | | | | | | | |
| | December 31 |
| | Nonperforming Loans and Leases (1) | | Accruing Past Due 90 Days or More |
| (Dollars in millions) | 2012 | | 2011 | | 2012 | | 2011 |
| Home loans | |
| | |
| | |
| | |
|
| Core portfolio | | | | | | | |
Residential mortgage (2) | $ | 3,190 |
| | $ | 2,414 |
| | $ | 3,984 |
| | $ | 883 |
|
| Home equity | 1,265 |
| | 439 |
| | — |
| | — |
|
| Legacy Assets & Servicing portfolio | |
| | |
| | |
| | |
Residential mortgage (2) | 11,618 |
| | 13,556 |
| | 18,173 |
| | 20,281 |
|
| Home equity | 3,016 |
| | 2,014 |
| | — |
| | — |
|
| Discontinued real estate | 248 |
| | 290 |
| | — |
| | — |
|
| Credit card and other consumer | |
| | |
| | | | |
| U.S. credit card | n/a |
| | n/a |
| | 1,437 |
| | 2,070 |
|
| Non-U.S. credit card | n/a |
| | n/a |
| | 212 |
| | 342 |
|
| Direct/Indirect consumer | 92 |
| | 40 |
| | 545 |
| | 746 |
|
| Other consumer | 2 |
| | 15 |
| | 2 |
| | 2 |
|
| Total consumer | 19,431 |
| | 18,768 |
| | 24,353 |
| | 24,324 |
|
| Commercial | |
| | |
| | |
| | |
|
| U.S. commercial | 1,484 |
| | 2,174 |
| | 65 |
| | 75 |
|
| Commercial real estate | 1,513 |
| | 3,880 |
| | 29 |
| | 7 |
|
| Commercial lease financing | 44 |
| | 26 |
| | 15 |
| | 14 |
|
| Non-U.S. commercial | 68 |
| | 143 |
| | — |
| | — |
|
| U.S. small business commercial | 115 |
| | 114 |
| | 120 |
| | 216 |
|
| Total commercial | 3,224 |
| | 6,337 |
| | 229 |
| | 312 |
|
| Total consumer and commercial | $ | 22,655 |
| | $ | 25,105 |
| | $ | 24,582 |
| | $ | 24,636 |
|
| |
(1) | Nonperforming loan balances do not include nonaccruing TDRs removed from the PCI portfolio prior to January 1, 2010 of $521 million and $477 million at December 31, 2012 and 2011. |
| |
(2) | Residential mortgage loans accruing past due 90 days or more are fully-insured loans. At December 31, 2012 and 2011, residential mortgage includes $17.8 billion and $17.0 billion of loans on which interest has been curtailed by the FHA, and therefore are no longer accruing interest, although principal is still insured, and $4.4 billion and $4.2 billion of loans on which interest is still accruing. |
n/a = not applicable
Credit Quality Indicators
The Corporation monitors credit quality within its Home Loans, Credit Card and Other Consumer, and Commercial portfolio segments based on primary credit quality indicators. For more information on the portfolio segments, see Note 1 – Summary of Significant Accounting Principles. Within the Home Loans portfolio segment, the primary credit quality indicators are refreshed LTV and refreshed FICO score. Refreshed LTV measures the carrying value of the loan as a percentage of the value of property securing the loan, refreshed quarterly. Home equity loans are evaluated using CLTV which measures the carrying value of the combined loans that have liens against the property and the available line of credit as a percentage of the appraised value of the property securing the loan, refreshed quarterly. FICO score measures the creditworthiness of the borrower based on the financial obligations of the borrower and the borrower’s credit history. At a minimum,
FICO scores are refreshed quarterly, and in many cases, more frequently. FICO scores are also a primary credit quality indicator for the Credit Card and Other Consumer portfolio segment and the business card portfolio within U.S. small business commercial. Within the Commercial portfolio segment, loans are evaluated using the internal classifications of pass rated or reservable criticized as the primary credit quality indicators. The term reservable criticized refers to those commercial loans that are internally classified or listed by the Corporation as Special Mention, Substandard or Doubtful, which are asset categories defined by regulatory authorities. These assets have an elevated level of risk and may have a high probability of default or total loss. Pass rated refers to all loans not considered reservable criticized. In addition to these primary credit quality indicators, the Corporation uses other credit quality indicators for certain types of loans.
The following tables present certain credit quality indicators for the Corporation’s Home Loans, Credit Card and Other Consumer, and Commercial portfolio segments, by class of financing receivables, at December 31, 2012 and 2011.
|
| | | | | | | | | | | | | | | | | | | | | | | | | | | | | | | |
| | | | | | | | | | | | | | | | |
Home Loans – Credit Quality Indicators (1) |
| | |
| | December 31, 2012 |
| (Dollars in millions) | Core Portfolio Residential Mortgage (2) | | Legacy Assets & Servicing Residential
Mortgage (2) | | Countrywide Residential Mortgage PCI | | Core Portfolio Home Equity (2) | | Legacy Assets & Servicing Home Equity (2) | | Countrywide Home Equity PCI | | Legacy Assets & Servicing Discontinued
Real Estate (2) | | Countrywide
Discontinued
Real Estate PCI |
Refreshed LTV (3) | |
| | |
| | |
| | |
| | | | | | |
| | |
|
| Less than 90 percent | $ | 80,585 |
| | $ | 19,904 |
| | $ | 3,516 |
| | $ | 44,971 |
| | $ | 15,907 |
| | $ | 2,050 |
| | $ | 719 |
| | $ | 5,093 |
|
| Greater than 90 percent but less than 100 percent | 8,891 |
| | 5,000 |
| | 1,312 |
| | 5,825 |
| | 4,507 |
| | 788 |
| | 102 |
| | 1,067 |
|
| Greater than 100 percent | 12,984 |
| | 16,226 |
| | 3,909 |
| | 10,055 |
| | 18,184 |
| | 5,709 |
| | 237 |
| | 2,674 |
|
Fully-insured loans (4) | 67,656 |
| | 23,198 |
| | — |
| | — |
| | — |
| | — |
| | — |
| | — |
|
| Total home loans | $ | 170,116 |
| | $ | 64,328 |
| | $ | 8,737 |
| | $ | 60,851 |
| | $ | 38,598 |
| | $ | 8,547 |
| | $ | 1,058 |
| | $ | 8,834 |
|
| Refreshed FICO score | | | | | | | | | | | | | | | |
| Less than 620 | $ | 6,366 |
| | $ | 13,900 |
| | $ | 3,249 |
| | $ | 2,586 |
| | $ | 5,408 |
| | $ | 1,930 |
| | $ | 429 |
| | $ | 5,471 |
|
| Greater than or equal to 620 and less than 680 | 8,561 |
| | 6,006 |
| | 1,381 |
| | 4,500 |
| | 5,885 |
| | 1,500 |
| | 160 |
| | 1,359 |
|
| Greater than or equal to 680 and less than 740 | 25,141 |
| | 8,411 |
| | 1,886 |
| | 12,625 |
| | 10,387 |
| | 2,278 |
| | 206 |
| | 1,106 |
|
| Greater than or equal to 740 | 62,392 |
| | 12,813 |
| | 2,221 |
| | 41,140 |
| | 16,918 |
| | 2,839 |
| | 263 |
| | 898 |
|
Fully-insured loans (4) | 67,656 |
| | 23,198 |
| | — |
| | — |
| | — |
| | — |
| | — |
| | — |
|
| Total home loans | $ | 170,116 |
| | $ | 64,328 |
| | $ | 8,737 |
| | $ | 60,851 |
| | $ | 38,598 |
| | $ | 8,547 |
| | $ | 1,058 |
| | $ | 8,834 |
|
| |
(1) | Excludes $1.0 billion of loans accounted for under the fair value option. |
| |
(2) | Excludes Countrywide PCI loans. |
| |
(3) | Refreshed LTV percentages for PCI loans are calculated using the carrying value net of the related valuation allowance. |
| |
(4) | Credit quality indicators are not reported for fully-insured loans as principal repayment is insured. |
|
| | | | | | | | | | | | | | | |
| | | | | | | | |
| Credit Card and Other Consumer – Credit Quality Indicators |
| | |
| | December 31, 2012 |
| (Dollars in millions) | U.S. Credit Card | | Non-U.S. Credit Card | | Direct/Indirect Consumer | | Other Consumer (1) |
| Refreshed FICO score | |
| | |
| | |
| | |
|
| Less than 620 | $ | 6,188 |
| | $ | — |
| | $ | 1,896 |
| | $ | 668 |
|
| Greater than or equal to 620 and less than 680 | 13,947 |
| | — |
| | 3,367 |
| | 301 |
|
| Greater than or equal to 680 and less than 740 | 37,167 |
| | — |
| | 9,592 |
| | 232 |
|
| Greater than or equal to 740 | 37,533 |
| | — |
| | 25,164 |
| | 212 |
|
Other internal credit metrics (2, 3, 4) | — |
| | 11,697 |
| | 43,186 |
| | 215 |
|
| Total credit card and other consumer | $ | 94,835 |
| | $ | 11,697 |
| | $ | 83,205 |
| | $ | 1,628 |
|
| |
(1) | 87 percent of the other consumer portfolio is associated with portfolios from certain consumer finance businesses that the Corporation previously exited. |
| |
(2) | Other internal credit metrics may include delinquency status, geography or other factors. |
| |
(3) | Direct/indirect consumer includes $36.5 billion of securities-based lending which is overcollateralized and therefore has minimal credit risk and $4.8 billion of loans the Corporation no longer originates. |
| |
(4) | Non-U.S. credit card represents the U.K. credit card portfolio which is evaluated using internal credit metrics, including delinquency status. At December 31, 2012, 97 percent of this portfolio was current or less than 30 days past due, one percent was 30-89 days past due and two percent was 90 days or more past due. |
|
| | | | | | | | | | | | | | | | | | | |
| | | | | | | | | | |
Commercial – Credit Quality Indicators (1) |
| | |
| | December 31, 2012 |
| (Dollars in millions) | U.S. Commercial | | Commercial Real Estate | | Commercial
Lease Financing | | Non-U.S. Commercial | | U.S. Small
Business Commercial (2) |
| Risk ratings | |
| | |
| | |
| | |
| | |
|
| Pass rated | $ | 189,602 |
| | $ | 34,968 |
| | $ | 22,874 |
| | $ | 72,688 |
| | $ | 1,690 |
|
| Reservable criticized | 7,524 |
| | 3,669 |
| | 969 |
| | 1,496 |
| | 573 |
|
Refreshed FICO score (3) | | | | | | | | | |
|
| Less than 620 | |
| | |
| | |
| | |
| | 400 |
|
| Greater than or equal to 620 and less than 680 | | | | | | | | | 580 |
|
| Greater than or equal to 680 and less than 740 | | | | | | | | | 1,553 |
|
| Greater than or equal to 740 | | | | | | | | | 2,496 |
|
Other internal credit metrics (3, 4) | | | | | | | | | 5,301 |
|
| Total commercial | $ | 197,126 |
| | $ | 38,637 |
| | $ | 23,843 |
| | $ | 74,184 |
| | $ | 12,593 |
|
| |
(1) | Excludes $8.0 billion of loans accounted for under the fair value option. |
| |
(2) | U.S. small business commercial includes $366 million of criticized business card and small business loans which are evaluated using refreshed FICO scores or internal credit metrics, including delinquency status, rather than risk ratings. At December 31, 2012, 98 percent of the balances where internal credit metrics are used were current or less than 30 days past due. |
| |
(3) | Refreshed FICO score and other internal credit metrics are applicable only to the U.S. small business commercial portfolio. |
| |
(4) | Other internal credit metrics may include delinquency status, application scores, geography or other factors. |
|
| | | | | | | | | | | | | | | | | | | | | | | | | | | | | | | |
| | | | | | | | | | | | | | | | |
Home Loans – Credit Quality Indicators (1) |
| | |
| | December 31, 2011 |
| (Dollars in millions) | Core Portfolio Residential Mortgage (2) | | Legacy Assets & Servicing Residential
Mortgage (2) | | Countrywide Residential Mortgage PCI | | Core Portfolio Home Equity (2) | | Legacy Assets & Servicing Home Equity (2) | | Countrywide Hone Equity PCI | | Legacy Assets & Servicing Discontinued
Real Estate (2) | | Countrywide
Discontinued
Real Estate PCI |
Refreshed LTV (3) | |
| | |
| | |
| | |
| | | | | | |
| | |
|
| Less than 90 percent | $ | 80,032 |
| | $ | 20,450 |
| | $ | 3,821 |
| | $ | 46,646 |
| | $ | 17,354 |
| | $ | 2,253 |
| | $ | 895 |
| | $ | 5,953 |
|
| Greater than 90 percent but less than 100 percent | 11,838 |
| | 5,847 |
| | 1,468 |
| | 6,988 |
| | 4,995 |
| | 1,077 |
| | 122 |
| | 1,191 |
|
| Greater than 100 percent | 17,673 |
| | 22,630 |
| | 4,677 |
| | 13,421 |
| | 23,317 |
| | 8,648 |
| | 221 |
| | 2,713 |
|
Fully-insured loans (4) | 68,794 |
| | 25,060 |
| | — |
| | — |
| | — |
| | — |
| | — |
| | — |
|
| Total home loans | $ | 178,337 |
| | $ | 73,987 |
| | $ | 9,966 |
| | $ | 67,055 |
| | $ | 45,666 |
| | $ | 11,978 |
| | $ | 1,238 |
|
| $ | 9,857 |
|
Refreshed FICO score (5) | |
| | |
| | |
| | |
| | |
| | |
| | |
| | |
|
| Less than 620 | $ | 7,020 |
| | $ | 17,337 |
| | $ | 3,924 |
| | $ | 2,843 |
| | $ | 7,293 |
| | $ | 4,140 |
| | $ | 548 |
| | $ | 6,275 |
|
| Greater than or equal to 620 and less than 680 | 9,331 |
| | 6,537 |
| | 1,381 |
| | 4,704 |
| | 6,866 |
| | 1,969 |
| | 175 |
| | 1,279 |
|
| Greater than or equal to 680 and less than 740 | 26,569 |
| | 9,439 |
| | 2,036 |
| | 13,561 |
| | 11,798 |
| | 2,538 |
| | 228 |
| | 1,223 |
|
| Greater than or equal to 740 | 66,623 |
| | 15,614 |
| | 2,625 |
| | 45,947 |
| | 19,709 |
| | 3,331 |
| | 287 |
| | 1,080 |
|
Fully-insured loans (4) | 68,794 |
| | 25,060 |
| | — |
| | — |
| | — |
| | — |
| | — |
| | — |
|
| Total home loans | $ | 178,337 |
| | $ | 73,987 |
| | $ | 9,966 |
| | $ | 67,055 |
| | $ | 45,666 |
| | $ | 11,978 |
| | $ | 1,238 |
| | $ | 9,857 |
|
| |
(1) | Excludes $2.2 billion of loans accounted for under the fair value option. |
| |
(2) | Excludes Countrywide PCI loans. |
| |
(3) | Refreshed LTV percentages for PCI loans are calculated using the carrying value net of the related valuation allowance. |
| |
(4) | Credit quality indicators are not reported for fully-insured loans as principal repayment is insured. |
| |
(5) | During 2012, refreshed home equity FICO metrics reflected an updated scoring model that is more representative of the credit risk of the Corporation’s borrowers. Prior period amounts were adjusted to reflect these updates. |
|
| | | | | | | | | | | | | | | |
| | | | | | | | |
| Credit Card and Other Consumer – Credit Quality Indicators |
| | |
| | December 31, 2011 |
| (Dollars in millions) | U.S. Credit Card | | Non-U.S. Credit Card | | Direct/Indirect Consumer | | Other Consumer (1) |
| Refreshed FICO score | |
| | |
| | |
| | |
|
| Less than 620 | $ | 8,172 |
| | $ | — |
| | $ | 3,325 |
| | $ | 802 |
|
| Greater than or equal to 620 and less than 680 | 15,474 |
| | — |
| | 4,665 |
| | 348 |
|
| Greater than or equal to 680 and less than 740 | 39,525 |
| | — |
| | 12,351 |
| | 262 |
|
| Greater than or equal to 740 | 39,120 |
| | — |
| | 29,965 |
| | 244 |
|
Other internal credit metrics (2, 3, 4) | — |
| | 14,418 |
| | 39,407 |
| | 1,032 |
|
| Total credit card and other consumer | $ | 102,291 |
| | $ | 14,418 |
| | $ | 89,713 |
| | $ | 2,688 |
|
| |
(1) | 96 percent of the other consumer portfolio is associated with portfolios from certain consumer finance businesses that the Corporation previously exited. |
| |
(2) | Other internal credit metrics may include delinquency status, geography or other factors. |
| |
(3) | Direct/indirect consumer includes $31.1 billion of securities-based lending which is overcollateralized and therefore has minimal credit risk and $6.0 billion of loans the Corporation no longer originates. |
| |
(4) | Non-U.S. credit card represents the U.K. credit card portfolio which is evaluated using internal credit metrics, including delinquency status. At December 31, 2011, 96 percent of this portfolio was current or less than 30 days past due, two percent was 30-89 days past due and two percent was 90 days or more past due. |
|
| | | | | | | | | | | | | | | | | | | |
| | | | | | | | | | |
Commercial – Credit Quality Indicators (1) |
| | |
| | December 31, 2011 |
| (Dollars in millions) | U.S. Commercial | | Commercial Real Estate | | Commercial
Lease Financing | | Non-U.S. Commercial | | U.S. Small
Business Commercial (2) |
| Risk ratings | |
| | |
| | |
| | |
| | |
|
| Pass rated | $ | 169,599 |
| | $ | 28,602 |
| | $ | 20,850 |
| | $ | 53,945 |
| | $ | 2,392 |
|
| Reservable criticized | 10,349 |
| | 10,994 |
| | 1,139 |
| | 1,473 |
| | 836 |
|
Refreshed FICO score (3) | | | | | | | | | |
| Less than 620 | | | | | | | | | 562 |
|
| Greater than or equal to 620 and less than 680 | | | | | | | | | 624 |
|
| Greater than or equal to 680 and less than 740 | | | | | | | | | 1,612 |
|
| Greater than or equal to 740 | | | | | | | | | 2,438 |
|
Other internal credit metrics (3, 4) | | | | | | | | | 4,787 |
|
| Total commercial | $ | 179,948 |
| | $ | 39,596 |
| | $ | 21,989 |
| | $ | 55,418 |
| | $ | 13,251 |
|
| |
(1) | Excludes $6.6 billion of loans accounted for under the fair value option. |
| |
(2) | U.S. small business commercial includes $491 million of criticized business card and small business loans which are evaluated using refreshed FICO scores or internal credit metrics, including delinquency status, rather than risk ratings. At December 31, 2011, 97 percent of the balances where internal credit metrics are used were current or less than 30 days past due. |
| |
(3) | Refreshed FICO score and other internal credit metrics are applicable only to the U.S. small business commercial portfolio. |
| |
(4) | Other internal credit metrics may include delinquency status, application scores, geography or other factors. |
Impaired Loans and Troubled Debt Restructurings
A loan is considered impaired when, based on current information, it is probable that the Corporation will be unable to collect all amounts due from the borrower in accordance with the contractual terms of the loan. Impaired loans include nonperforming commercial loans and all consumer and commercial TDRs. Impaired loans exclude nonperforming consumer loans and nonperforming commercial leases unless they are classified as TDRs. Loans accounted for under the fair value option are also excluded. PCI loans are presentedexcluded and reported separately on page 201.
Home Loans
Impaired home loans within the Home Loans portfolio segment consist entirely of TDRs. Excluding PCI loans, most modifications of home loans meet the definition of TDRs when a binding offer is extended to a borrower. Modifications of home loans are done in accordance with the government’s Making Home Affordable Program (modifications under government programs) or the Corporation’s proprietary programs (modifications under proprietary programs). These modifications are considered to be TDRs if concessions have been granted to borrowers experiencing financial difficulties. Concessions may include reductions in interest rates, capitalization of past due amounts, principal and/or interest forbearance, payment extensions, principal and/or interest forgiveness, or combinations thereof. In 2012, the Corporation implemented a borrower assistance program that provides forgiveness of principal balances in connection with the settlement agreement among the Corporation and certain of its affiliates and subsidiaries, together with the U.S. Department of Justice (DOJ), the U.S. Department of Housing and Urban Development (HUD) and other federal agencies, and 49 state Attorneys General concerning the terms of a global settlement resolving investigations into certain origination, servicing and foreclosure practices (National Mortgage Settlement).
Prior to permanently modifying a loan, the Corporation may enter into trial modifications with certain borrowers under both government and proprietary programs, including the borrower assistance program pursuant to the National Mortgage Settlement. Trial modifications generally represent a three- to four-month period during which the borrower makes monthly payments under the anticipated modified payment terms. Upon successful completion of the trial period, the Corporation and the borrower enter into a permanent modification. Binding trial modifications are classified as TDRs when the trial offer is made and continue to be classified as TDRs regardless of whether the borrower enters into a permanent modification.
In 2012, new regulatory guidance was issued addressing certain home loans that have been discharged in Chapter 7 bankruptcy, and as a result, an additional $3.5 billion of home loans were included in TDRs at December 31, 2012, of which $1.2 billion were current or less than 60 days past due. Of the $3.5 billion of home loan TDRs, approximately 27 percent, 42 percent and 31 percent had been discharged in Chapter 7 bankruptcy in 2012, 2011 and prior years, respectively. For more information on
the new regulatory guidance on loans discharged in Chapter 7 bankruptcy, see Nonperforming Loans and Leases in this Note.
In accordance with applicable accounting guidance, a home loan, excluding PCI loans which are reported separately, is not classified as impaired unless it is a TDR. Once such a loan has been designated as a TDR, it is then individually assessed for impairment. Home loan TDRs are measured primarily based on the net present value of the estimated cash flows discounted at the loan’s original effective interest rate, as discussed in the paragraph below. If the carrying value of a TDR exceeds this amount, a specific allowance is recorded as a component of the allowance for loan and lease losses. See Note 7 – AllowanceAlternatively, home loan TDRs that are considered to be dependent solely on the collateral for Credit Losses for additional information.
The table below shows activity for the accretable yield on Countrywide consumer PCI loans. The $912 million reclassification from nonaccretable difference during 2011 is primarilyrepayment (e.g., due to an increase in the expected lifelack of the PCI loans. The reclassification did not increase the annual yield but,income verification or as a result of being discharged in Chapter 7 bankruptcy) are measured based on the estimated slower prepayment speeds, addedfair value of the collateral and a charge-off is recorded if the carrying value exceeds the fair value of the collateral. Home loans that reached 180 days past due prior to modification had been charged off to their net realizable value before they were modified as TDRs in accordance with established policy. Therefore, modifications of home loans that are 180 days or more past due as TDRs do not have an impact on the allowance for loan and lease losses nor are additional interest periodscharge-offs required at the time of modification. Subsequent declines in the fair value of the collateral after a loan has reached 180 days past due are recorded as charge-offs. Fully-insured loans are protected against principal loss, and therefore, the Corporation does not record an allowance for loan and lease losses on the outstanding principal balance, even after they have been modified in a TDR.
The net present value of the estimated cash flows is based on model-driven estimates of projected payments, prepayments, defaults and loss-given-default (LGD). Using statistical modeling methodologies, the Corporation estimates the probability that a loan will default prior to maturity based on the attributes of each loan. The factors that are most relevant to the expected cash flows.
|
| | | |
| | |
|
| Rollforward of Accretable Yield | |
| | |
| (Dollars in millions) | |
|
| Accretable yield, January 1, 2010 | $ | 7,317 |
|
| Accretion | (1,704 | ) |
| Disposals/transfers | (124 | ) |
| Reclassifications to nonaccretable difference | (8 | ) |
| Accretable yield, December 31, 2010 | 5,481 |
|
| Accretion | (1,285 | ) |
| Disposals/transfers | (118 | ) |
| Reclassifications from nonaccretable difference | 912 |
|
| Accretable yield, December 31, 2011 | $ | 4,990 |
|
Loans Held-for-Saleprobability of default are the refreshed LTV, or in the case of a subordinated lien, refreshed CLTV, borrower credit score, months since origination (i.e., vintage) and geography. Each of these factors is further broken down by present collection status (whether the loan is current, delinquent, in default or in bankruptcy). Severity (or LGD) is estimated based on the refreshed LTV for first mortgages or CLTV for subordinated liens. The estimates are based on the Corporation’s historical experience, but are adjusted to reflect an assessment of environmental factors that may not be reflected in the historical data, such as changes in real estate values, local and national economies, underwriting standards and the regulatory environment. The probability of default models also incorporate recent experience with modification programs, a loan’s default history prior to modification and the change in borrower payments post-modification.
The Corporation had LHFS ofAt December 31, 2012 and 2011, remaining commitments to lend additional funds to debtors whose terms have been modified in a home loan TDR were immaterial. Home loan foreclosed properties totaled $13.8 billion650 million and $35.12.0 billion at December 31, 20112012 and 2010. Proceeds from sales, securitizations and paydowns of LHFS were $147.5 billion, $281.7 billion and $365.1 billion for 2011, 2010 and 2009. Proceeds used for originations and purchases of LHFS were $118.2 billion, $263.0 billion and $369.4 billion for 2011, 2010 and 2009.
|
| | |
194 Bank of America 20112012 | | |
|
| | | | | | | | | | | | | | | | | | | |
| | | | | | | | | | |
| Impaired Loans – Home Loans |
| | | | |
| | December 31, 2012 | | 2012 |
| (Dollars in millions) | Unpaid
Principal Balance | | Carrying Value | | Related Allowance | | Average
Carrying Value | | Interest
Income Recognized (1) |
| With no recorded allowance | |
| | |
| | |
| | |
| | |
|
| Residential mortgage | $ | 19,758 |
| | $ | 14,707 |
| | n/a |
| | $ | 10,697 |
| | $ | 358 |
|
| Home equity | 2,624 |
| | 1,103 |
| | n/a |
| | 734 |
| | 49 |
|
| Discontinued real estate | 468 |
| | 260 |
| | n/a |
| | 240 |
| | 8 |
|
| With an allowance recorded | | | | | |
| | | | |
| Residential mortgage | 14,080 |
| | 13,051 |
| | $ | 1,233 |
| | 11,439 |
| | 417 |
|
| Home equity | 1,256 |
| | 1,022 |
| | 448 |
| | 1,145 |
| | 44 |
|
| Discontinued real estate | 143 |
| | 107 |
| | 19 |
| | 136 |
| | 6 |
|
| Total | |
| | |
| | |
| | |
| | |
|
| Residential mortgage | $ | 33,838 |
| | $ | 27,758 |
| | $ | 1,233 |
| | $ | 22,136 |
| | $ | 775 |
|
| Home equity | 3,880 |
| | 2,125 |
| | 448 |
| | 1,879 |
| | 93 |
|
| Discontinued real estate | 611 |
| | 367 |
| | 19 |
| | 376 |
| | 14 |
|
| | | | | | | | | | |
| | December 31, 2011 | | 2011 |
| With no recorded allowance | | | | | | | | | |
| Residential mortgage | $ | 10,907 |
| | $ | 8,168 |
| | n/a |
| | $ | 6,285 |
| | $ | 233 |
|
| Home equity | 1,747 |
| | 479 |
| | n/a |
| | 442 |
| | 23 |
|
| Discontinued real estate | 421 |
| | 240 |
| | n/a |
| | 222 |
| | 8 |
|
| With an allowance recorded | | | | | | | | | |
| Residential mortgage | 12,296 |
| | 11,119 |
| | $ | 1,295 |
| | 9,379 |
| | 319 |
|
| Home equity | 1,551 |
| | 1,297 |
| | 622 |
| | 1,357 |
| | 34 |
|
| Discontinued real estate | 213 |
| | 159 |
| | 29 |
| | 173 |
| | 6 |
|
| Total | | | | | | | | | |
| Residential mortgage | $ | 23,203 |
| | $ | 19,287 |
| | $ | 1,295 |
| | $ | 15,664 |
| | $ | 552 |
|
| Home equity | 3,298 |
| | 1,776 |
| | 622 |
| | 1,799 |
| | 57 |
|
| Discontinued real estate | 634 |
| | 399 |
| | 29 |
| | 395 |
| | 14 |
|
| |
(1) | Interest income recognized includes interest accrued and collected on the outstanding balances of accruing impaired loans as well as interest cash collections on nonaccruing impaired loans for which the principal is considered collectible. |
n/a = not applicable
The table below presents the December 31, 2012 and 2011 unpaid principal balance, carrying value, and average pre- and post-modification interest rates of home loans that were modified in TDRs during 2012 and 2011, and net charge-offs that were recorded during the period in which the modification occurred. The
following Home Loans portfolio segment tables include loans that were initially classified as TDRs during the period and also loans that had previously been classified as TDRs and were modified again during the period. These TDRs are managed by Legacy Assets & Servicing.
|
| | | | | | | | | | | | | | | | | |
| | | | | | | | | | |
Home Loans – TDRs Entered into During 2012 and 2011 (1) |
| | |
| | December 31, 2012 | | 2012 |
| (Dollars in millions) | Unpaid Principal Balance | | Carrying Value | | Pre-modification Interest Rate | | Post-modification Interest Rate | | Net Charge-offs |
| Residential mortgage | $ | 14,929 |
| | $ | 12,143 |
| | 5.52 | % | | 4.70 | % | | $ | 507 |
|
| Home equity | 1,721 |
| | 858 |
| | 5.22 |
| | 4.39 |
| | 716 |
|
| Discontinued real estate | 159 |
| | 85 |
| | 5.21 |
| | 4.35 |
| | 16 |
|
| Total | $ | 16,809 |
| | $ | 13,086 |
| | 5.49 |
| | 4.66 |
| | $ | 1,239 |
|
| | | | | | | | | | |
| | December 31, 2011 | | 2011 |
| Residential mortgage | $ | 11,623 |
| | $ | 9,903 |
| | 5.94 | % | | 5.16 | % | | $ | 299 |
|
| Home equity | 1,112 |
| | 556 |
| | 6.58 |
| | 5.25 |
| | 239 |
|
| Discontinued real estate | 141 |
| | 88 |
| | 6.68 |
| | 5.08 |
| | 9 |
|
| Total | $ | 12,876 |
| | $ | 10,547 |
| | 6.01 |
| | 5.17 |
| | $ | 547 |
|
| |
(1) | TDRs entered into during 2012 include principal forgiveness as follows: residential mortgage modifications of $755 million, home equity modifications of $9 million and discontinued real estate modifications of $23 million. Prior to 2012, the principal forgiveness amount was not significant. |
The table below presents the December 31, 2012 and 2011 carrying value for home loans that were modified in TDRs during 2012 and 2011 by type of modification.
|
| | | | | | | | | | | | | | | |
| | | | | | | | |
| Home Loans – Modification Programs |
| | |
| | TDRs Entered into During 2012 |
| (Dollars in millions) | Residential Mortgage | | Home Equity | | Discontinued Real Estate | | Total Carrying Value |
| Modifications under government programs | | | | | | | |
| Contractual interest rate reduction | $ | 638 |
| | $ | 78 |
| | $ | 4 |
| | $ | 720 |
|
| Principal and/or interest forbearance | 49 |
| | 31 |
| | 2 |
| | 82 |
|
Other modifications (1) | 37 |
| | 1 |
| | — |
| | 38 |
|
| Total modifications under government programs | 724 |
| | 110 |
| | 6 |
| | 840 |
|
| Modifications under proprietary programs | | | | | | | |
| Contractual interest rate reduction | 3,343 |
| | 44 |
| | 7 |
| | 3,394 |
|
| Capitalization of past due amounts | 143 |
| | — |
| | 1 |
| | 144 |
|
| Principal and/or interest forbearance | 415 |
| | 16 |
| | 9 |
| | 440 |
|
Other modifications (1) | 97 |
| | 21 |
| | — |
| | 118 |
|
| Total modifications under proprietary programs | 3,998 |
| | 81 |
| | 17 |
| | 4,096 |
|
| Trial modifications | 4,505 |
| | 69 |
| | 42 |
| | 4,616 |
|
Loans discharged in Chapter 7 bankruptcy (2) | 2,916 |
| | 598 |
| | 20 |
| | 3,534 |
|
| Total modifications | $ | 12,143 |
| | $ | 858 |
| | $ | 85 |
| | $ | 13,086 |
|
| | | | | | | | |
| | TDRs Entered into During 2011 |
| Modifications under government programs | | | | | | | |
| Contractual interest rate reduction | $ | 984 |
| | $ | 189 |
| | $ | 10 |
| | $ | 1,183 |
|
| Principal and/or interest forbearance | 187 |
| | 36 |
| | 2 |
| | 225 |
|
Other modifications (1) | 64 |
| | 5 |
| | — |
| | 69 |
|
| Total modifications under government programs | 1,235 |
| | 230 |
| | 12 |
| | 1,477 |
|
| Modifications under proprietary programs | | | | | | | |
| Contractual interest rate reduction | 3,508 |
| | 101 |
| | 23 |
| | 3,632 |
|
| Capitalization of past due amounts | 408 |
| | 1 |
| | 2 |
| | 411 |
|
| Principal and/or interest forbearance | 936 |
| | 49 |
| | 10 |
| | 995 |
|
Other modifications (1) | 439 |
| | 34 |
| | 2 |
| | 475 |
|
| Total modifications under proprietary programs | 5,291 |
| | 185 |
| | 37 |
| | 5,513 |
|
| Trial modifications | 3,377 |
| | 141 |
| | 39 |
| | 3,557 |
|
| Total modifications | $ | 9,903 |
| | $ | 556 |
| | $ | 88 |
| | $ | 10,547 |
|
| |
(1) | Includes other modifications such as term or payment extensions and repayment plans. |
| |
(2) | Includes loans newly classified as TDRs in accordance with new regulatory guidance on loans discharged in Chapter 7 bankruptcy that was issued in 2012. |
The table below presents the carrying value of loans that entered into payment default during 2012 and 2011 and that were modified in a TDR during the 12 months preceding payment default. A payment default for home loan TDRs is recognized when a borrower has missed three monthly payments (not necessarily
consecutively) since modification. Payment default on trial modification where the borrower has not yet met the terms of the agreement are included in the table below if the borrower is 90 days or more past due three months after the offer to modify is made.
|
| | | | | | | | | | | | | | | |
| | | | | | | | |
| Home Loans – TDRs Entering Payment Default That Were Modified During the Preceding Twelve Months |
| | |
| | 2012 |
| (Dollars in millions) | Residential Mortgage | | Home Equity | | Discontinued Real Estate | | Total Carrying Value |
| Modifications under government programs | $ | 200 |
| | $ | 8 |
| | $ | 2 |
| | $ | 210 |
|
| Modifications under proprietary programs | 933 |
| | 14 |
| | 9 |
| | 956 |
|
Loans discharged in Chapter 7 bankruptcy (1) | 1,216 |
| | 53 |
| | 12 |
| | 1,281 |
|
| Trial modifications | 2,323 |
| | 20 |
| | 28 |
| | 2,371 |
|
| Total modifications | $ | 4,672 |
| | $ | 95 |
| | $ | 51 |
| | $ | 4,818 |
|
| | | | | | | | |
| | 2011 |
| Modifications under government programs | $ | 350 |
| | $ | 2 |
| | $ | 2 |
| | $ | 354 |
|
| Modifications under proprietary programs | 2,086 |
| | 42 |
| | 12 |
| | 2,140 |
|
| Trial modifications | 1,094 |
| | 17 |
| | 7 |
| | 1,118 |
|
| Total modifications | $ | 3,530 |
| | $ | 61 |
| | $ | 21 |
| | $ | 3,612 |
|
| |
(1) | Includes loans classified as TDRs at December 31, 2012 due to loans discharged in Chapter 7 bankruptcy in 2012 or 2011. |
Credit Card and Other Consumer
Impaired loans within the Credit Card and Other Consumer portfolio segment consist entirely of loans that have been modified in TDRs (the renegotiated credit card and other consumer TDR portfolio collectively referred to as the renegotiated TDR portfolio). The Corporation seeks to assist customers that are experiencing financial difficulty by modifying loans while ensuring compliance with federal laws and guidelines. Substantially all of the Corporation’s credit card and other consumer loan modifications involve reducing the interest rate on the account and placing the customer on a fixed payment plan not exceeding 60 months, all of which are considered TDRs. In all cases, the customer’s available line of credit is canceled. The Corporation makes loan modifications directly with borrowers for debt held only by the Corporation (internal programs). Additionally, the Corporation makes loan modifications for borrowers working with third-party renegotiation agencies that provide solutions to customers’ entire unsecured debt structures (external programs).
In 2012, new regulatory guidance was issued addressing certain consumer real estate loans that have been discharged in Chapter 7 bankruptcy. The Corporation applies this guidance to
other secured consumer loans that have been discharged in Chapter 7 bankruptcy, and such loans are classified as TDRs, written down to collateral value and placed on nonaccrual status no later than the time of discharge.
All credit card and substantially all other consumer loans that have been modified in TDRs remain on accrual status until the loan is either paid in full or charged off, which occurs no later than the end of the month in which the loan becomes 180 days past due or 120 days past due for a loan that was placed on a fixed payment plan after July 1, 2012.
The allowance for impaired credit card loans is based on the present value of projected cash flows, which incorporates the Corporation’s historical payment default and loss experience on modified loans, discounted using the portfolio’s average contractual interest rate, excluding promotionally priced loans, in effect prior to restructuring. Prior to modification, credit card and other consumer loans are included in homogeneous pools which are collectively evaluated for impairment. For these portfolios, loss forecast models are utilized that consider a variety of factors including, but not limited to, historical loss experience, delinquencies, economic trends and credit scores.
The table below provides information on the Corporation’s renegotiated TDR portfolio at and for the years ended December 31, 2012 and 2011.
|
| | | | | | | | | | | | | | | | | | | |
| | | | | | | | | | |
| Impaired Loans – Credit Card and Other Consumer – Renegotiated TDRs |
| | | | |
| | December 31, 2012 | | 2012 |
| (Dollars in millions) | Unpaid
Principal Balance | | Carrying Value (1) | | Related Allowance | | Average
Carrying Value | | Interest
Income Recognized (2) |
| With an allowance recorded | |
| | |
| | |
| | |
| | |
|
| U.S. credit card | $ | 2,856 |
| | $ | 2,871 |
| | $ | 719 |
| | $ | 4,085 |
| | $ | 253 |
|
| Non-U.S. credit card | 311 |
| | 316 |
| | 198 |
| | 464 |
| | 10 |
|
| Direct/Indirect consumer | 633 |
| | 636 |
| | 210 |
| | 929 |
| | 50 |
|
| Without an allowance recorded | |
| | |
| | |
| | |
| | |
|
| Direct/Indirect consumer | 105 |
| | 58 |
| | — |
| | 58 |
| | — |
|
| Total | |
| | |
| | |
| | |
| | |
|
| U.S. credit card | $ | 2,856 |
| | $ | 2,871 |
| | $ | 719 |
| | $ | 4,085 |
| | $ | 253 |
|
| Non-U.S. credit card | 311 |
| | 316 |
| | 198 |
| | 464 |
| | 10 |
|
| Direct/Indirect consumer | 738 |
| | 694 |
| | 210 |
| | 987 |
| | 50 |
|
| | | | | | | | | | |
| | December 31, 2011 | | 2011 |
| With an allowance recorded | | | | | | | | | |
| U.S. credit card | $ | 5,272 |
| | $ | 5,305 |
| | $ | 1,570 |
| | $ | 7,211 |
| | $ | 433 |
|
| Non-U.S. credit card | 588 |
| | 597 |
| | 435 |
| | 759 |
| | 6 |
|
| Direct/Indirect consumer | 1,193 |
| | 1,198 |
| | 405 |
| | 1,582 |
| | 85 |
|
| |
(1) | Includes accrued interest and fees. |
| |
(2) | Interest income recognized includes interest accrued and collected on the outstanding balances of accruing impaired loans as well as interest cash collections on nonaccruing impaired loans for which the principal is considered collectible. |
The table below provides information on the Corporation’s primary modification programs for the renegotiated TDR portfolio at December 31, 2012 and 2011.
|
| | | | | | | | | | | | | | | | | | | | | | | | | | | | | | | | | | | | | |
| | | | | | | | | | | | | | | | | | | | |
| Credit Card and Other Consumer – Renegotiated TDRs by Program Type |
| | | | | | | | | | |
| | December 31 |
| | Internal Programs | | External Programs | | Other | | Total | | Percent of Balances Current or Less Than 30 Days Past Due |
| (Dollars in millions) | 2012 | | 2011 | | 2012 | | 2011 | | 2012 | | 2011 | | 2012 | | 2011 | | 2012 | | 2011 |
| U.S. credit card | $ | 1,887 |
| | $ | 3,788 |
| | $ | 953 |
| | $ | 1,436 |
| | $ | 31 |
| | $ | 81 |
| | $ | 2,871 |
| | $ | 5,305 |
| | 81.48 | % | | 78.97 | % |
| Non-U.S. credit card | 99 |
| | 218 |
| | 38 |
| | 113 |
| | 179 |
| | 266 |
| | 316 |
| | 597 |
| | 43.71 |
| | 54.02 |
|
| Direct/Indirect consumer | 405 |
| | 784 |
| | 225 |
| | 392 |
| | 64 |
| | 22 |
| | 694 |
| | 1,198 |
| | 83.11 |
| | 80.01 |
|
| Total renegotiated TDRs | $ | 2,391 |
| | $ | 4,790 |
| | $ | 1,216 |
| | $ | 1,941 |
| | $ | 274 |
| | $ | 369 |
| | $ | 3,881 |
| | $ | 7,100 |
| | 78.69 |
| | 77.05 |
|
At December 31, 2012 and 2011, the Corporation had a renegotiated TDR portfolio of $3.9 billion and $7.1 billion of which $3.1 billion was current or less than 30 days past due under the modified terms at December 31, 2012.
The table below provides information on the Corporation’s
renegotiated TDR portfolio including the unpaid principal balance, carrying value and average pre- and post-modification interest rates of loans that were modified in TDRs during 2012 and 2011, and net charge-offs that were recorded during the period in which the modification occurred.
|
| | | | | | | | | | | | | | | | | |
| | | | | | | | | | |
| Credit Card and Other Consumer – Renegotiated TDRs Entered into During 2012 and 2011 |
| | |
| | December 31, 2012 | | 2012 |
| (Dollars in millions) | Unpaid Principal Balance | | Carrying Value (1) | | Pre-modification Interest Rate | | Post-modification Interest Rate | | Net Charge-offs |
| U.S. credit card | $ | 396 |
| | $ | 400 |
| | 17.59 | % | | 6.36 | % | | $ | 45 |
|
| Non-U.S. credit card | 196 |
| | 206 |
| | 26.19 |
| | 1.15 |
| | 190 |
|
| Direct/Indirect consumer | 160 |
| | 113 |
| | 9.59 |
| | 5.72 |
| | 52 |
|
| Total | $ | 752 |
| | $ | 719 |
| | 18.79 |
| | 4.77 |
| | $ | 287 |
|
| | | | | | | | | | |
| | December 31, 2011 | | 2011 |
| U.S. credit card | $ | 890 |
| | $ | 902 |
| | 19.04 | % | | 6.16 | % | | $ | 106 |
|
| Non-U.S. credit card | 305 |
| | 322 |
| | 26.32 |
| | 1.04 |
| | 291 |
|
| Direct/Indirect consumer | 198 |
| | 199 |
| | 15.63 |
| | 5.22 |
| | 23 |
|
| Total | $ | 1,393 |
| | $ | 1,423 |
| | 20.20 |
| | 4.87 |
| | $ | 420 |
|
| |
(1) | Includes accrued interest and fees. |
The table below provides information on the Corporation’s primary modification programs for the renegotiated TDR portfolio for loans that were modified in TDRs during 2012 and 2011.
|
| | | | | | | | | | | | | | | |
| | | | | | | | |
| Credit Card and Other Consumer – Renegotiated TDRs by Program Type |
| | |
| | Renegotiated TDRs Entered into During 2012 |
| | December 31, 2012 |
| (Dollars in millions) | Internal Programs | | External Programs | | Other | | Total |
| U.S. credit card | $ | 248 |
| | $ | 152 |
| | $ | — |
| | $ | 400 |
|
| Non-U.S. credit card | 112 |
| | 94 |
| | — |
| | 206 |
|
| Direct/Indirect consumer | 36 |
| | 19 |
| | 58 |
| | 113 |
|
| Total renegotiated TDR loans | $ | 396 |
| | $ | 265 |
| | $ | 58 |
| | $ | 719 |
|
| | | | | | | | |
| | Renegotiated TDRs Entered into During 2011 |
| | December 31, 2011 |
| U.S. credit card | $ | 492 |
| | $ | 407 |
| | $ | 3 |
| | $ | 902 |
|
| Non-U.S. credit card | 163 |
| | 158 |
| | 1 |
| | 322 |
|
| Direct/Indirect consumer | 112 |
| | 87 |
| | — |
| | 199 |
|
| Total renegotiated TDR loans | $ | 767 |
| | $ | 652 |
| | $ | 4 |
| | $ | 1,423 |
|
Credit card and other consumer loans are deemed to be in payment default during the quarter in which a borrower misses the second of two consecutive payments. Payment defaults are one of the factors considered when projecting future cash flows in the calculation of the allowance for loan losses for impaired credit card and other consumer loans. At December 31, 2012, the allowance for loan and lease losses on the Corporation’s renegotiated portfolio was 29.04 percent of the carrying value of these loans. Loans that entered into payment default during 2012 and 2011 that had been modified in a TDR during the 12 months preceding payment default were $203 million and $863 million for U.S. credit card, $298 million and $409 million for non-U.S. credit card and $35 million and $180 million for direct/indirect consumer.
Commercial Loans
Impaired commercial loans, which include nonperforming loans and TDRs (both performing and nonperforming) are primarily
measured based on the present value of payments expected to be received, discounted at the loan’s original effective interest rate. Commercial impaired loans may also be measured based on observable market prices or, for loans that are solely dependent on the collateral for repayment, the estimated fair value of collateral less estimated costs to sell. If the carrying value of a loan exceeds this amount, a specific allowance is recorded as a component of the allowance for loan and lease losses.
Modifications of loans to commercial borrowers that are experiencing financial difficulty are designed to reduce the Corporation’s loss exposure while providing the borrower with an opportunity to work through financial difficulties, often to avoid foreclosure or bankruptcy. Each modification is unique and reflects the individual circumstances of the borrower. Modifications that result in a TDR may include extensions of maturity at a concessionary (below market) rate of interest, payment forbearances or other actionsdesigned to benefit the customer while mitigating the Corporation’s risk exposure. Reductions in
interest rates are rare. Instead, the interest rates are typically increased, although the increased rate may not represent a market rate of interest. Infrequently, concessions may also include principal forgiveness in connection with foreclosure, short sale or other settlement agreements leading to termination or sale of the loan.
At the time of restructuring, the loans are remeasured to reflect the impact, if any, on projected cash flows resulting from the modified terms. If there was no forgiveness of principal and the interest rate was not decreased, the modification may have little or no impact on the allowance established for the loan. If a portion of the loan is deemed to be uncollectible, a charge-off may be recorded at the time of restructuring. Alternatively, a charge-off may have already been recorded in a previous period such that no
charge-off is required at the time of modification. For information concerning modifications for the U.S. small business commercial portfolio, see Credit Card and Other Consumer in this Note.
At December 31, 2012 and 2011, remaining commitments to lend additional funds to debtors whose terms have been modified in a commercial loan TDR were immaterial. Commercial foreclosed properties totaled $250 million and $612 million at December 31, 2012 and 2011.
The table below presents impaired loans in the Corporation’s Commercial loan portfolio segment at and for the years ended December 31, 2012 and 2011. Certain impaired commercial loans do not have a related allowance as the valuation of these impaired loans exceeded the carrying value, which is net of previously recorded charge-offs.
|
| | | | | | | | | | | | | | | | | | | |
| | | | | | | | | | |
| Impaired Loans – Commercial |
| | | | |
| | December 31, 2012 | | 2012 |
| (Dollars in millions) | Unpaid
Principal Balance | | Carrying Value | | Related Allowance | | Average
Carrying Value | | Interest
Income Recognized (1) |
| With no recorded allowance | |
| | |
| | |
| | |
| | |
|
| U.S. commercial | $ | 1,220 |
| | $ | 1,109 |
| | n/a |
| | $ | 1,089 |
| | $ | 32 |
|
| Commercial real estate | 1,003 |
| | 902 |
| | n/a |
| | 1,496 |
| | 16 |
|
| Non-U.S. commercial | 240 |
| | 120 |
| | n/a |
| | 129 |
| | 2 |
|
| With an allowance recorded | | | | | | | | | |
| U.S. commercial | 1,782 |
| | 1,138 |
| | $ | 68 |
| | 1,603 |
| | 32 |
|
| Commercial real estate | 2,287 |
| | 1,262 |
| | 147 |
| | 1,749 |
| | 16 |
|
| Non-U.S. commercial | 280 |
| | 33 |
| | 18 |
| | 52 |
| | 2 |
|
U.S. small business commercial (2) | 361 |
| | 317 |
| | 97 |
| | 409 |
| | 13 |
|
| Total | |
| | |
| | |
| | |
| | |
|
| U.S. commercial | $ | 3,002 |
| | $ | 2,247 |
| | $ | 68 |
| | $ | 2,692 |
| | $ | 64 |
|
| Commercial real estate | 3,290 |
| | 2,164 |
| | 147 |
| | 3,245 |
| | 32 |
|
| Non-U.S. commercial | 520 |
| | 153 |
| | 18 |
| | 181 |
| | 4 |
|
U.S. small business commercial (2) | 361 |
| | 317 |
| | 97 |
| | 409 |
| | 13 |
|
| | | | | | | | | | |
| | December 31, 2011 | | 2011 |
| With no recorded allowance | | | | | | | | | |
| U.S. commercial | $ | 1,482 |
| | $ | 985 |
| | n/a |
| | $ | 774 |
| | $ | 7 |
|
| Commercial real estate | 2,587 |
| | 2,095 |
| | n/a |
| | 1,994 |
| | 7 |
|
| Non-U.S. commercial | 216 |
| | 101 |
| | n/a |
| | 101 |
| | — |
|
| With an allowance recorded | | | | | | | | | |
| U.S. commercial | 2,654 |
| | 1,987 |
| | $ | 232 |
| | 2,422 |
| | 13 |
|
| Commercial real estate | 3,329 |
| | 2,384 |
| | 135 |
| | 3,309 |
| | 19 |
|
| Non-U.S. commercial | 308 |
| | 58 |
| | 6 |
| | 76 |
| | 3 |
|
U.S. small business commercial (2) | 531 |
| | 503 |
| | 172 |
| | 666 |
| | 23 |
|
| Total | | | | | | | | | |
| U.S. commercial | $ | 4,136 |
| | $ | 2,972 |
| | $ | 232 |
| | $ | 3,196 |
| | $ | 20 |
|
| Commercial real estate | 5,916 |
| | 4,479 |
| | 135 |
| | 5,303 |
| | 26 |
|
| Non-U.S. commercial | 524 |
| | 159 |
| | 6 |
| | 177 |
| | 3 |
|
U.S. small business commercial (2) | 531 |
| | 503 |
| | 172 |
| | 666 |
| | 23 |
|
| |
(1) | Interest income recognized includes interest accrued and collected on the outstanding balances of accruing impaired loans as well as interest cash collections on nonaccruing impaired loans for which the principal is considered collectible. |
| |
(2) | Includes U.S. small business commercial renegotiated TDR loans and related allowance. |
n/a = not applicable
The table below presents the December 31, 2012 and 2011 unpaid principal balance and carrying value of commercial loans that were modified as TDRs during 2012 and 2011, and net charge-offs that were recorded during the period in which the modification occurred.
|
| | | | | | | | | | | |
| | | | | | |
| Commercial – TDRs Entered into During 2012 and 2011 |
| | |
| | |
| | December 31, 2012 | | 2012 |
| (Dollars in millions) | Unpaid Principal Balance | | Carrying Value | | Net Charge-offs |
| U.S. commercial | $ | 590 |
| | $ | 558 |
| | $ | 34 |
|
| Commercial real estate | 793 |
| | 721 |
| | 20 |
|
| Non-U.S. commercial | 90 |
| | 89 |
| | 1 |
|
U.S. small business commercial (1) | 22 |
| | 22 |
| | 5 |
|
| Total | $ | 1,495 |
| | $ | 1,390 |
| | $ | 60 |
|
| | | | | | |
| | December 31, 2011 | | 2011 |
| U.S. commercial | $ | 1,381 |
| | $ | 1,211 |
| | $ | 74 |
|
| Commercial real estate | 1,604 |
| | 1,333 |
| | 152 |
|
| Non-U.S. commercial | 44 |
| | 44 |
| | — |
|
U.S. small business commercial (1) | 58 |
| | 59 |
| | 10 |
|
| Total | $ | 3,087 |
| | $ | 2,647 |
| | $ | 236 |
|
| |
(1) | U.S. small business commercial TDRs are comprised of renegotiated small business card loans. |
A commercial TDR is generally deemed to be in payment default when the loan is 90 days or more past due, including delinquencies that were not resolved as part of the modification. U.S. small business commercial TDRs are deemed to be in payment default during the quarter in which a borrower misses the second of two consecutive payments. Payment defaults are one of the factors considered when projecting future cash flows, along with observable market prices or fair value of collateral when measuring the allowance for loan losses. TDRs that were in payment default at December 31, 2012 and 2011 had a carrying value of $130 million and $164 million for U.S. commercial, $455 million and $446 million for commercial real estate and $18 million and $68 million for U.S. small business commercial.
Purchased Credit-impaired Loans
The table below shows activity for the accretable yield on Countrywide consumer PCI loans. Reclassifications from nonaccretable difference primarily result when there is a change in expected cash flows due to various factors, including changes in interest rates on variable-rate loans and prepayment assumptions. Changes in the prepayment assumption affect the expected remaining life of the portfolio which results in a change to the amount of future interest cash flows.
|
| | | |
| | |
|
| Rollforward of Accretable Yield | |
| | |
| (Dollars in millions) | |
|
| Accretable yield, January 1, 2011 | $ | 5,481 |
|
| Accretion | (1,285 | ) |
| Disposals/transfers | (118 | ) |
| Reclassifications from nonaccretable difference | 912 |
|
| Accretable yield, December 31, 2011 | 4,990 |
|
| Accretion | (1,034 | ) |
| Disposals/transfers | (109 | ) |
| Reclassifications from nonaccretable difference | 797 |
|
| Accretable yield, December 31, 2012 | $ | 4,644 |
|
See Note 1 – Summary of Significant Accounting Principles for further information on PCI loans and Note 6 – Allowance for Credit Losses for the carrying value and valuation allowance for Countrywide PCI loans.
Loans Held-for-sale
The Corporation had LHFS of $19.4 billion and $13.8 billion at December 31, 2012 and 2011. Proceeds from sales, securitizations and paydowns of LHFS were $55.9 billion, $147.5 billion and $281.7 billion for 2012, 2011 and 2010, respectively. Amounts used for originations and purchases of LHFS were $59.8 billion, $118.2 billion and $263.0 billion for 2012, 2011 and 2010, respectively.
NOTE 76 Allowance for Credit Losses
The table below summarizes the changes in the allowance for credit losses by portfolio segment for 20112012, 20102011 and 20092010.
| | | | | | | | | | | | | | | | | | |
| | 2011 | | 2012 |
| (Dollars in millions) | Home Loans | | Credit Card and Other Consumer | | Commercial | | Total Allowance | | Home Loans | | Credit Card and Other Consumer | | Commercial | | Total Allowance |
| Allowance for loan and lease losses, January 1 | $ | 19,252 |
| | $ | 15,463 |
| | $ | 7,170 |
| | $ | 41,885 |
| | $ | 21,079 |
| | $ | 8,569 |
| | $ | 4,135 |
| | $ | 33,783 |
|
| Loans and leases charged off | (9,291 | ) | | (12,247 | ) | | (3,204 | ) | | (24,742 | ) | | (7,849 | ) | | (7,727 | ) | | (2,096 | ) | | (17,672 | ) |
| Recoveries of loans and leases previously charged off | 894 |
| | 2,124 |
| | 891 |
| | 3,909 |
| | 496 |
| | 1,519 |
| | 749 |
| | 2,764 |
|
| Net charge-offs | (8,397 | ) | | (10,123 | ) | | (2,313 | ) | | (20,833 | ) | | (7,353 | ) | | (6,208 | ) | | (1,347 | ) | | (14,908 | ) |
| Provision for loan and lease losses | 10,300 |
| | 4,025 |
| | (696 | ) | | 13,629 |
| | 4,073 |
| | 3,899 |
| | 338 |
| | 8,310 |
|
| Write-offs of home equity PCI loans | | (2,820 | ) | | — |
| | — |
| | (2,820 | ) |
| Other | (76 | ) | | (796 | ) | | (26 | ) | | (898 | ) | | (46 | ) | | (120 | ) | | (20 | ) | | (186 | ) |
| Allowance for loan and lease losses, December 31 | 21,079 |
| | 8,569 |
| | 4,135 |
| | 33,783 |
| | 14,933 |
| | 6,140 |
| | 3,106 |
| | 24,179 |
|
| Reserve for unfunded lending commitments, January 1 | — |
| | — |
| | 1,188 |
| | 1,188 |
| | — |
| | — |
| | 714 |
| | 714 |
|
| Provision for unfunded lending commitments | — |
| | — |
| | (219 | ) | | (219 | ) | | — |
| | — |
| | (141 | ) | | (141 | ) |
| Other | — |
| | — |
| | (255 | ) | | (255 | ) | | — |
| | — |
| | (60 | ) | | (60 | ) |
| Reserve for unfunded lending commitments, December 31 | — |
| | — |
| | 714 |
| | 714 |
| | — |
| | — |
| | 513 |
| | 513 |
|
| Allowance for credit losses, December 31 | $ | 21,079 |
| | $ | 8,569 |
| | $ | 4,849 |
| | $ | 34,497 |
| | $ | 14,933 |
| | $ | 6,140 |
| | $ | 3,619 |
| | $ | 24,692 |
|
| | | | 2010 | | | | | 2011 |
| | Home
Loans | | Credit Card
and Other
Consumer | | Commercial | | Total Allowance | |
| | | 2010 | | 2009 | |
Allowance for loan and lease losses, January 1 (1) | $ | 16,329 |
| | $ | 22,243 |
| | $ | 9,416 |
| | $ | 47,988 |
| | $ | 23,071 |
| |
| Allowance for loan and lease losses, January 1 | | $ | 19,252 |
| | $ | 15,463 |
| | $ | 7,170 |
| | $ | 41,885 |
|
| Loans and leases charged off | (10,915 | ) | | (20,865 | ) | | (5,610 | ) | | (37,390 | ) | | (35,483 | ) | (9,291 | ) | | (12,247 | ) | | (3,204 | ) | | (24,742 | ) |
| Recoveries of loans and leases previously charged off | 396 |
| | 2,034 |
| | 626 |
| | 3,056 |
| | 1,795 |
| 894 |
| | 2,124 |
| | 891 |
| | 3,909 |
|
| Net charge-offs | (10,519 | ) | | (18,831 | ) | | (4,984 | ) | | (34,334 | ) | | (33,688 | ) | (8,397 | ) | | (10,123 | ) | | (2,313 | ) | | (20,833 | ) |
| Provision for loan and lease losses | 13,335 |
| | 12,115 |
| | 2,745 |
| | 28,195 |
| | 48,366 |
| 10,300 |
| | 4,025 |
| | (696 | ) | | 13,629 |
|
| Other | 107 |
| | (64 | ) | | (7 | ) | | 36 |
| | (549 | ) | (76 | ) | | (796 | ) | | (26 | ) | | (898 | ) |
| Allowance for loan and lease losses, December 31 | 19,252 |
| | 15,463 |
| | 7,170 |
| | 41,885 |
| | 37,200 |
| 21,079 |
| | 8,569 |
| | 4,135 |
| | 33,783 |
|
| Reserve for unfunded lending commitments, January 1 | — |
| | — |
| | 1,487 |
| | 1,487 |
| | 421 |
| — |
| | — |
| | 1,188 |
| | 1,188 |
|
| Provision for unfunded lending commitments | — |
| | — |
| | 240 |
| | 240 |
| | 204 |
| — |
| | — |
| | (219 | ) | | (219 | ) |
| Other | — |
| | — |
| | (539 | ) | | (539 | ) | | 862 |
| — |
| | — |
| | (255 | ) | | (255 | ) |
| Reserve for unfunded lending commitments, December 31 | — |
| | — |
| | 1,188 |
| | 1,188 |
| | 1,487 |
| — |
| | — |
| | 714 |
| | 714 |
|
| Allowance for credit losses, December 31 | $ | 19,252 |
| | $ | 15,463 |
| | $ | 8,358 |
| | $ | 43,073 |
| | $ | 38,687 |
| $ | 21,079 |
| | $ | 8,569 |
| | $ | 4,849 |
| | $ | 34,497 |
|
| |
(1)
| The 2010 balance includes $10.8 billion of allowance for loan and lease losses related to the adoption of new consolidation guidance. This includes $573 million for the home loans portfolio segment and $10.2 billion for the credit card and other consumer portfolio segment.
|
|
| | | | | | | | | | | | | | | |
| | 2010 |
| Allowance for loan and lease losses, January 1 | $ | 16,329 |
| | $ | 22,243 |
| | $ | 9,416 |
| | $ | 47,988 |
|
| Loans and leases charged off | (10,915 | ) | | (20,865 | ) | | (5,610 | ) | | (37,390 | ) |
| Recoveries of loans and leases previously charged off | 396 |
| | 2,034 |
| | 626 |
| | 3,056 |
|
| Net charge-offs | (10,519 | ) | | (18,831 | ) | | (4,984 | ) | | (34,334 | ) |
| Provision for loan and lease losses | 13,335 |
| | 12,115 |
| | 2,745 |
| | 28,195 |
|
| Other | 107 |
| | (64 | ) | | (7 | ) | | 36 |
|
| Allowance for loan and lease losses, December 31 | 19,252 |
| | 15,463 |
| | 7,170 |
| | 41,885 |
|
| Reserve for unfunded lending commitments, January 1 | — |
| | — |
| | 1,487 |
| | 1,487 |
|
| Provision for unfunded lending commitments | — |
| | — |
| | 240 |
| | 240 |
|
| Other | — |
| | — |
| | (539 | ) | | (539 | ) |
| Reserve for unfunded lending commitments, December 31 | — |
| | — |
| | 1,188 |
| | 1,188 |
|
| Allowance for credit losses, December 31 | $ | 19,252 |
| | $ | 15,463 |
| | $ | 8,358 |
| | $ | 43,073 |
|
In 20112012, for the PCI loan portfolio, the Corporation recorded a benefit of $2.2 billion103 million in provision for credit losses with a corresponding increasedecrease in the valuation allowance included as part of the allowance for loan and lease losses. This compared to $2.2 billion in provision for credit losses and a corresponding increase in the valuation allowance in both 20102011 and 2010. In 2012, there were $3.52.8 billion of write-offs in 2009.the Countrywide home equity PCI loans that were acquiredloan portfolio primarily related to the National Mortgage Settlement with a corresponding decrease in the PCI valuation allowance. These write-offs had no impact on the provision for credit losses as part of the Merrill Lynch acquisition were excluded from current period PCI disclosures as the valuation allowance associated with these loans is no longer significant.were fully reserved. The valuation allowance associated with the PCI loan portfolio was $8.55.5 billion,
$6.48.5 billion and $3.96.4 billion at December 31, 20112012, 20102011 and 20092010, respectively.
The “other” amount under allowance for loan and lease losses forprimarily represents the net impact of portfolio sales, consolidations and deconsolidations, and foreign currency translation adjustments. The 2011 amount includes a $449 million reduction in the allowance for loan and lease losses related to Canadian consumer card loans that were transferred to LHFS. The 2009 “other” amount includes
a $750 million reduction in the allowance for loan and lease losses related to $8.5 billion of credit card loans that were exchanged for a $7.8 billion HTM debt security partially offset by a $340 million increase associated with the reclassification to other assets of the amount reimbursable under residential mortgage cash collateralized synthetic securitizations.
The “other” amount under the reserve for unfunded lending commitments for2012, 2011 and 2010 primarily represents accretion of the Merrill Lynch purchase accounting adjustment and the impact of funding previously unfunded positions. The 2009 amount includes the remaining balance of the acquired Merrill Lynch reserve excluding those commitments accounted for under the fair value option, net of accretion, and the impact of funding previously unfunded positions.
|
| | |
202 Bank of America 2012 | | Bank of America195
|
The table below presents the allowance and the carrying value of outstanding loans and leases by portfolio segment at December 31, 20112012 and 20102011.
| | | | | | | | | | | | | | | | | |
| Allowance and Carrying Value by Portfolio Segment | | | | | | | | | | | | | | |
| | | | | | | | | | | | | | | |
| | December 31, 2011 | December 31, 2012 |
| (Dollars in millions) | Home Loans | | Credit Card
and Other Consumer | | Commercial | | Total | Home Loans | | Credit Card
and Other Consumer | | Commercial | | Total |
Impaired loans and troubled debt restructurings (1) | |
| | |
| | |
| | |
| |
| | |
| | |
| | |
|
Allowance for loan and lease losses (2) | $ | 1,946 |
| | $ | 2,410 |
| | $ | 545 |
| | $ | 4,901 |
| $ | 1,700 |
| | $ | 1,127 |
| | $ | 330 |
| | $ | 3,157 |
|
Carrying value (3) | 21,462 |
| | 7,100 |
| | 8,113 |
| | 36,675 |
| 30,250 |
| | 3,881 |
| | 4,881 |
| | 39,012 |
|
| Allowance as a percentage of carrying value | 9.07 | % | | 33.94 | % | | 6.71 | % | | 13.36 | % | 5.62 | % | | 29.04 | % | | 6.76 | % | | 8.09 | % |
| Collectively evaluated for impairment | |
| | |
| | |
| | |
| |
| Loans collectively evaluated for impairment | | |
| | |
| | |
| | |
|
| Allowance for loan and lease losses | $ | 10,674 |
| | $ | 6,159 |
| | $ | 3,590 |
| | $ | 20,423 |
| $ | 7,697 |
| | $ | 5,013 |
| | $ | 2,776 |
| | $ | 15,486 |
|
Carrying value (3, 4) | 344,821 |
| | 202,010 |
| | 302,089 |
| | 848,920 |
| 304,701 |
| | 187,484 |
| | 341,502 |
| | 833,687 |
|
Allowance as a percentage of carrying value (4) | 3.10 | % | | 3.05 | % | | 1.19 | % | | 2.41 | % | 2.53 | % | | 2.67 | % | | 0.81 | % | | 1.86 | % |
| Purchased credit-impaired loans | |
| | | | |
| | |
| |
| | | | |
| | |
|
| Valuation allowance | $ | 8,459 |
| | n/a |
| | n/a |
| | $ | 8,459 |
| $ | 5,536 |
| | n/a |
| | n/a |
| | $ | 5,536 |
|
| Carrying value gross of valuation allowance | 31,801 |
| | n/a |
| | n/a |
| | 31,801 |
| 26,118 |
| | n/a |
| | n/a |
| | 26,118 |
|
| Valuation allowance as a percentage of carrying value | 26.60 | % | | n/a |
| | n/a |
| | 26.60 | % | 21.20 | % | | n/a |
| | n/a |
| | 21.20 | % |
| Total | |
| | |
| | |
| | |
| |
| | |
| | |
| | |
|
| Allowance for loan and lease losses | $ | 21,079 |
| | $ | 8,569 |
| | $ | 4,135 |
| | $ | 33,783 |
| $ | 14,933 |
| | $ | 6,140 |
| | $ | 3,106 |
| | $ | 24,179 |
|
Carrying value (3, 4) | 398,084 |
| | 209,110 |
| | 310,202 |
| | 917,396 |
| 361,069 |
| | 191,365 |
| | 346,383 |
| | 898,817 |
|
Allowance as a percentage of carrying value (4) | 5.30 | % | | 4.10 | % | | 1.33 | % | | 3.68 | % | 4.14 | % | | 3.21 | % | | 0.90 | % | | 2.69 | % |
| | | | December 31, 2010 | December 31, 2011 |
Impaired loans and troubled debt restructurings (1) | |
| | |
| | |
| | |
| |
| | |
| | |
| | |
|
Allowance for loan and lease losses (2) | $ | 1,871 |
| | $ | 4,786 |
| | $ | 1,080 |
| | $ | 7,737 |
| $ | 1,946 |
| | $ | 2,410 |
| | $ | 545 |
| | $ | 4,901 |
|
Carrying value (3) | 13,904 |
| | 11,421 |
| | 10,645 |
| | 35,970 |
| 21,462 |
| | 7,100 |
| | 8,113 |
| | 36,675 |
|
| Allowance as a percentage of carrying value | 13.46 | % | | 41.91 | % | | 10.15 | % | | 21.51 | % | 9.07 | % | | 33.94 | % | | 6.71 | % | | 13.36 | % |
| Collectively evaluated for impairment | |
| | |
| | |
| | | |
| Loans collectively evaluated for impairment | | |
| | |
| | |
| | |
| Allowance for loan and lease losses | $ | 10,964 |
| | $ | 10,677 |
| | $ | 6,078 |
| | $ | 27,719 |
| $ | 10,674 |
| | $ | 6,159 |
| | $ | 3,590 |
| | $ | 20,423 |
|
Carrying value (3, 4) | 358,765 |
| | 222,967 |
| | 282,820 |
| | 864,552 |
| 344,821 |
| | 202,010 |
| | 302,089 |
| | 848,920 |
|
Allowance as a percentage of carrying value (4) | 3.06 | % | | 4.79 | % | | 2.15 | % | | 3.21 | % | 3.10 | % | | 3.05 | % | | 1.19 | % | | 2.41 | % |
| Purchased credit-impaired loans | |
| | |
| | |
| | | |
| | |
| | |
| | |
| Valuation allowance | $ | 6,417 |
| | n/a |
| | $ | 12 |
| | $ | 6,429 |
| $ | 8,459 |
| | n/a |
| | n/a |
| | $ | 8,459 |
|
| Carrying value gross of valuation allowance | 36,393 |
| | n/a |
| | 204 |
| | 36,597 |
| 31,801 |
| | n/a |
| | n/a |
| | 31,801 |
|
| Valuation allowance as a percentage of carrying value | 17.63 | % | | n/a |
| | 5.76 | % | | 17.57 | % | 26.60 | % | | n/a |
| | n/a |
| | 26.60 | % |
| Total | |
| | |
| | |
| | | |
| | |
| | |
| | |
| Allowance for loan and lease losses | $ | 19,252 |
| | $ | 15,463 |
| | $ | 7,170 |
| | $ | 41,885 |
| $ | 21,079 |
| | $ | 8,569 |
| | $ | 4,135 |
| | $ | 33,783 |
|
Carrying value (3, 4) | 409,062 |
| | 234,388 |
| | 293,669 |
| | 937,119 |
| 398,084 |
| | 209,110 |
| | 310,202 |
| | 917,396 |
|
Allowance as a percentage of carrying value (4) | 4.71 | % | | 6.60 | % | | 2.44 | % | | 4.47 | % | 5.30 | % | | 4.10 | % | | 1.33 | % | | 3.68 | % |
| |
(1) | Impaired loans include nonperforming commercial loans and all TDRs, including both commercial and consumer TDRs. Impaired loans exclude nonperforming consumer loans unless they are classified as TDRs, and all consumer and commercial loans accounted for under the fair value option. |
| |
(2) | Commercial impaired allowance for loan and lease losses includes $17297 million and $445172 million at December 31, 2011 and 2010of renegotiated TDR loans related to U.S. small business commercial renegotiated TDR loans.at December 31, 2012 and 2011. |
| |
(3) | Amounts are presented gross of the allowance for loan and lease losses. |
| |
(4) | Outstanding loan and lease balances and ratios do not include loans accounted for under the fair value option of $8.89.0 billion and $3.38.8 billion at December 31, 20112012 and 20102011. |
n/a = not applicable
|
| | |
| | 196Bank of America 20112012203
| | |
NOTE 87 Securitizations and Other Variable Interest Entities
The Corporation utilizes VIEs in the ordinary course of business to support its own and its customers’ financing and investing needs. The Corporation routinely securitizes loans and debt securities using VIEs as a source of funding for the Corporation and as a means of transferring the economic risk of the loans or debt securities to third parties. The assets are transferred into a trust or other securitization vehicle such that the assets are legally isolated from the creditors of the Corporation and are not available to satisfy its obligations. These assets can only be used to settle obligations of the trust or other securitization vehicle. The Corporation also administers, structures or invests in other VIEs including CDOs, investment vehicles and other entities. For additional information on the Corporation’s utilization of VIEs, see Note 1 – Summary of Significant Accounting Principles.
The following tables within this Note present the assets and liabilities of consolidated and unconsolidated VIEs at December 31, 20112012 and 20102011, in situations where the Corporation has continuing involvement with transferred assets or if the Corporation otherwise has a variable interest in the VIE. The tables also present the Corporation’s maximum loss exposure to loss at December 31, 20112012 and 20102011 resulting from its involvement with consolidated VIEs and unconsolidated VIEs in which the Corporation holds a variable interest. The Corporation’s maximum loss exposure to loss is based on the unlikely event that all of the assets in the VIEs become worthless and incorporates not only potential losses associated with assets recorded on the Corporation’s Consolidated Balance Sheet but also potential losses associated with off-balance sheet commitments such as unfunded liquidity commitments and other contractual arrangements. The Corporation’s maximum loss exposure to loss does not include losses previously recognized through write-downs of assets.
The Corporation invests in ABS issued by third-party VIEs with which it has no other form of involvement. These securities are included in Note 32 – Trading Account Assets and Liabilities and Note 54 – Securities. In addition, the Corporation uses VIEs such as trust preferred securities trusts in connection with its funding activities as described inactivities.
For additional information, see Note 1312 – Long-term Debt. The Corporation also uses VIEs in the form of synthetic securitization vehicles to mitigate
a portion of the credit risk on its residential mortgage loan portfolio, as described in Note 65 – Outstanding Loans and Leases. The Corporation uses VIEs, such as cash funds managed within Global Wealth & Investment Management (GWIM), to provide investment opportunities for clients. These VIEs, which are not consolidated by the Corporation, are not included in the tables within this Note.
Except as described below, the Corporation did not provide financial support to consolidated or unconsolidated VIEs during 20112012 or 20102011 that it was not previously contractually required to provide, nor does it intend to do so.
Mortgage-related Securitizations
First-lien Mortgages
As part of its mortgage banking activities, the Corporation securitizes a portion of the first-lien residential mortgage loans it originates or purchases from third parties, generally in the form of MBS guaranteed by government-sponsored enterprises, FNMA and FHLMC (collectively the GSEs), or GNMA in the case of FHA-insured and U.S. Department of VeteranVeterans Affairs (VA)-guaranteed mortgage loans. Securitization usually occurs in conjunction with or shortly after loan closing or purchase. In addition, the Corporation may, from time to time, securitize commercial mortgages it originates or purchases from other entities. The Corporation typically services the loans it securitizes. Further, the Corporation may retain beneficial interests in the securitization trusts including senior and subordinate securities and equity tranches issued by the trusts. Except as described below and in Note 98 – Representations and Warranties Obligations and Corporate Guarantees, the Corporation does not provide guarantees or recourse to the securitization trusts other than standard representations and warranties.
The table below summarizes select information related to first-lien mortgage securitizations for 20112012 and 20102011.
| | | | | | | | | | | | | |
| First-lien Mortgage Securitizations | First-lien Mortgage Securitizations | | | | First-lien Mortgage Securitizations | | | |
| | | | | | | | | | | |
| | Residential Mortgage | | |
| |
| Residential Mortgage | | |
| |
|
| | |
| |
| | Non-Agency | | | Agency | | Non-agency | | Commercial Mortgage |
| | Agency | | Prime | Subprime | Alt-A | | Commercial Mortgage | |
| (Dollars in millions) | 2011 | 2010 | | 2011 | 2010 | 2011 | 2010 | 2011 | 2010 | | 2011 | 2010 | 2012 | 2011 | | 2012 | 2011 | | 2012 | 2011 |
Cash proceeds from new securitizations (1) | $ | 142,910 |
| $ | 243,901 |
| | $ | — |
| $ | — |
| $ | — |
| $ | — |
| $ | 36 |
| $ | 7 |
| | $ | 4,468 |
| $ | 4,227 |
| $ | 39,526 |
| $ | 142,910 |
| | $ | — |
| $ | 36 |
| | $ | 903 |
| $ | 4,468 |
|
Loss on securitizations, net of hedges (2) | (373 | ) | (473 | ) | | — |
| — |
| — |
| — |
| — |
| — |
| | — |
| — |
| (212 | ) | (373 | ) | | — |
| — |
| | — |
| — |
|
| Cash flows received on residual interests | — |
| — |
| | 3 |
| 18 |
| 38 |
| 58 |
| 6 |
| 2 |
| | 18 |
| 20 |
| |
| |
(1) | The Corporation sells residential mortgage loans to GSEs in the normal course of business and receives MBS in exchange which may then be sold into the market to third-party investors for cash proceeds. |
| |
(2) | Substantially all of the first-lien residential mortgage loans securitized are initially classified as LHFS and accounted for under the fair value option. As such, gains are recognized on these LHFS prior to securitization. During 20112012 and 20102011, the Corporation recognized $2.91.9 billion and $5.12.9 billion of gains on these LHFS, net of hedges. |
In addition to cash proceeds as reported in the table above, the Corporation received securities with an initial fair value of $54528 million and $23.7 billion545 million in connection with first-lien mortgage securitizations, principally residential agency securitizations, in 20112012 and 20102011. All of these securities were initially classified as Level 2 assets within the fair value hierarchy. During 20112012 and 20102011, there were no changes to the initial classification.
The Corporation recognizes consumer MSRs from the sale or securitization of first-lien mortgage loans. Servicing fee and ancillary fee income on consumer mortgage loans serviced, including securitizations where the Corporation has continuing
involvement, were$4.7 billion and $5.8 billion and $6.4 billionin 20112012 and 20102011. Servicing advances on consumer mortgage loans, including
securitizations where the Corporation has continuing involvement, were $26.023.2 billion and $24.326.0 billion at December 31, 20112012 and 20102011. The Corporation may have the option to repurchase delinquent loans out of securitization trusts, which reduces the amount of servicing advances it is required to make. During 20112012 and 20102011, $9.09.2 billion and $14.59.0 billion of loans were repurchased from first-lien securitization trusts as a result of loan delinquencies or in order to perform modifications. The majority of these loans repurchased were FHA-insured mortgages collateralizing GNMA
securities. In addition, the Corporation has retained commercial MSRs from the sale or securitization of commercial mortgage loans. Servicing fee and ancillary fee income on commercial mortgage loans serviced, including securitizations where the
Corporation has continuing involvement, were a loss of $12 million and a gain of $21 million in 2011 and 2010. Servicing advances on commercial mortgage loans, including securitizations where the Corporation has continuing involvement, were $152186 million and $156152 million at December 31, 2011 and 2010. For additional
2012 and 2011. For additional information on MSRs, see Note 2524 – Mortgage Servicing Rights.
The table below summarizes select information related to first-lien mortgage securitization trusts in which the Corporation held a variable interest at December 31, 20112012 and 20102011.
| | | | | | | | | | | | | | | | | | | | | |
| First-lien VIEs | First-lien VIEs | | | | | | | | First-lien VIEs | | | | | | | |
| | | | | | | | | | | | | | | | | | | |
| | Residential Mortgage | | |
| |
| Residential Mortgage | | |
| |
|
| | |
| |
| | Non-Agency | | |
| |
| |
| |
| | Non-agency | | |
| |
|
| | Agency | | Prime | | Subprime | | Alt-A | | Commercial Mortgage | Agency | | Prime | | Subprime | | Alt-A | | Commercial Mortgage |
| | December 31 | | December 31 | | December 31 | December 31 | | December 31 | | December 31 |
| (Dollars in millions) | 2011 | 2010 | | 2011 | 2010 | | 2011 | 2010 | | 2011 | 2010 | | 2011 | 2010 | 2012 | 2011 | | 2012 | 2011 | | 2012 | 2011 | | 2012 | 2011 | | 2012 | 2011 |
| Unconsolidated VIEs | |
| |
| | |
| |
| | |
| |
| | |
| |
| | |
| |
| |
| |
| | |
| |
| | |
| |
| | |
| |
| | |
| |
|
Maximum loss exposure (1) | $ | 37,519 |
| $ | 46,093 |
| | $ | 2,375 |
| $ | 2,794 |
| | $ | 289 |
| $ | 416 |
| | $ | 506 |
| $ | 651 |
| | $ | 981 |
| $ | 1,199 |
| $ | 28,591 |
| $ | 37,519 |
| | $ | 2,038 |
| $ | 2,375 |
| | $ | 410 |
| $ | 289 |
| | $ | 367 |
| $ | 506 |
| | $ | 702 |
| $ | 981 |
|
| On-balance sheet assets | |
| |
| | |
| |
| | |
| |
| | |
| |
| | |
| |
| |
| |
| | |
| |
| | |
| |
| | |
| |
| | |
| |
|
Senior securities held (2): | |
| |
| | |
| |
| | |
| |
| | |
| |
| | |
| |
| |
| |
| | |
| |
| | |
| |
| | |
| |
| | |
| |
|
| Trading account assets | $ | 8,744 |
| $ | 10,693 |
| | $ | 94 |
| $ | 147 |
| | $ | 3 |
| $ | 126 |
| | $ | 343 |
| $ | 645 |
| | $ | 21 |
| $ | 146 |
| $ | 619 |
| $ | 8,744 |
| | $ | 16 |
| $ | 94 |
| | $ | 14 |
| $ | 3 |
| | $ | — |
| $ | 343 |
| | $ | 12 |
| $ | 21 |
|
| AFS debt securities | 28,775 |
| 35,400 |
| | 2,001 |
| 2,593 |
| | 174 |
| 234 |
| | 163 |
| — |
| | 846 |
| 984 |
| |
| Available-for-sale debt securities | | 25,492 |
| 28,775 |
| | 1,388 |
| 2,001 |
| | 210 |
| 174 |
| | 128 |
| 163 |
| | 581 |
| 846 |
|
Subordinate securities held (2): | |
| |
| | |
| |
| | |
| |
| | |
| |
| | |
| |
| |
| |
| | |
| |
| | |
| |
| | |
| |
| | |
| |
|
| Trading account assets | — |
| — |
| | — |
| — |
| | 30 |
| 12 |
| | — |
| — |
| | 3 |
| 8 |
| — |
| — |
| | — |
| — |
| | 3 |
| 30 |
| | — |
| — |
| | 13 |
| 3 |
|
| AFS debt securities | — |
| — |
| | 26 |
| 39 |
| | 30 |
| 35 |
| | — |
| 6 |
| | — |
| — |
| |
| Available-for-sale debt securities | | — |
| — |
| | 21 |
| 26 |
| | 9 |
| 30 |
| | — |
| — |
| | — |
| — |
|
| Residual interests held | — |
| — |
| | 8 |
| 6 |
| | 9 |
| 9 |
| | — |
| — |
| | 43 |
| 61 |
| — |
| — |
| | 18 |
| 8 |
| | 9 |
| 9 |
| | — |
| — |
| | 40 |
| 43 |
|
All other assets | — |
| — |
| | — |
| 9 |
| | — |
| — |
| | — |
| — |
| | — |
| — |
| 2,480 |
| — |
| | 64 |
| — |
| | 1 |
| — |
| | 239 |
| — |
| | — |
| — |
|
| Total retained positions | $ | 37,519 |
| $ | 46,093 |
| | $ | 2,129 |
| $ | 2,794 |
| | $ | 246 |
| $ | 416 |
| | $ | 506 |
| $ | 651 |
| | $ | 913 |
| $ | 1,199 |
| $ | 28,591 |
| $ | 37,519 |
| | $ | 1,507 |
| $ | 2,129 |
| | $ | 246 |
| $ | 246 |
| | $ | 367 |
| $ | 506 |
| | $ | 646 |
| $ | 913 |
|
Principal balance outstanding (3)(4) | $ | 1,198,766 |
| $ | 1,297,159 |
| | $ | 61,207 |
| $ | 75,762 |
| | $ | 73,949 |
| $ | 92,710 |
| | $ | 101,622 |
| $ | 116,233 |
| | $ | 76,645 |
| $ | 73,597 |
| $ | 797,315 |
| $ | 1,198,766 |
| | $ | 45,819 |
| $ | 61,207 |
| | $ | 53,822 |
| $ | 73,949 |
| | $ | 71,990 |
| $ | 101,622 |
| | $ | 56,733 |
| $ | 76,645 |
|
| | | | | | | | | | | | | | | | | | | |
| Consolidated VIEs | |
| |
| | |
| |
| | |
| |
| | |
| |
| | |
| |
| |
| |
| | |
| |
| | |
| |
| | |
| |
| | |
| |
|
Maximum loss exposure (1) | $ | 50,648 |
| $ | 32,746 |
| | $ | 450 |
| $ | 46 |
| | $ | 419 |
| $ | 42 |
| | $ | — |
| $ | — |
| | $ | — |
| $ | — |
| $ | 46,959 |
| $ | 50,648 |
| | $ | 104 |
| $ | 450 |
| | $ | 390 |
| $ | 419 |
| | $ | — |
| $ | — |
| | $ | — |
| $ | — |
|
| On-balance sheet assets | |
| |
| | |
| |
| | |
| |
| | |
| |
| | |
| |
| |
| |
| | |
| |
| | |
| |
| | |
| |
| | |
| |
|
| Loans and leases | $ | 50,159 |
| $ | 32,563 |
| | $ | 1,298 |
| $ | — |
| | $ | 892 |
| $ | — |
| | $ | — |
| $ | — |
| | $ | — |
| $ | — |
| $ | 45,991 |
| $ | 50,159 |
| | $ | 283 |
| $ | 1,298 |
| | $ | 722 |
| $ | 892 |
| | $ | — |
| $ | — |
| | $ | — |
| $ | — |
|
| Allowance for loan and lease losses | (6 | ) | (37 | ) | | — |
| — |
| | — |
| — |
| | — |
| — |
| | — |
| — |
| (4 | ) | (6 | ) | | — |
| — |
| | — |
| — |
| | — |
| — |
| | — |
| — |
|
| Loans held-for-sale | — |
| — |
| | — |
| — |
| | 622 |
| 732 |
| | — |
| — |
| | — |
| — |
| — |
| — |
| | — |
| — |
| | 914 |
| 622 |
| | — |
| — |
| | — |
| — |
|
| All other assets | 495 |
| 220 |
| | 63 |
| 46 |
| | 59 |
| 16 |
| | — |
| — |
| | — |
| — |
| 972 |
| 495 |
| | 10 |
| 63 |
| | 91 |
| 59 |
| | — |
| — |
| | — |
| — |
|
| Total assets | $ | 50,648 |
| $ | 32,746 |
| | $ | 1,361 |
| $ | 46 |
| | $ | 1,573 |
| $ | 748 |
| | $ | — |
| $ | — |
| | $ | — |
| $ | — |
| $ | 46,959 |
| $ | 50,648 |
| | $ | 293 |
| $ | 1,361 |
| | $ | 1,727 |
| $ | 1,573 |
| | $ | — |
| $ | — |
| | $ | — |
| $ | — |
|
| On-balance sheet liabilities | |
| |
| | |
| |
| | |
| |
| | |
| |
| | |
| |
| |
| |
| | |
| |
| | |
| |
| | |
| |
| | |
| |
|
| Commercial paper and other short-term borrowings | $ | — |
| $ | — |
| | $ | — |
| $ | — |
| | $ | 650 |
| $ | 706 |
| | $ | — |
| $ | — |
| | $ | — |
| $ | — |
| |
| Other short-term borrowings | | $ | — |
| $ | — |
| | $ | — |
| $ | — |
| | $ | 741 |
| $ | 650 |
| | $ | — |
| $ | — |
| | $ | — |
| $ | — |
|
| Long-term debt | — |
| — |
| | 1,360 |
| — |
| | 911 |
| — |
| | — |
| — |
| | — |
| — |
| — |
| — |
| | 212 |
| 1,360 |
| | 941 |
| 911 |
| | — |
| — |
| | — |
| — |
|
| All other liabilities | — |
| 3 |
| | — |
| 9 |
| | 57 |
| 62 |
| | — |
| — |
| | — |
| — |
| — |
| — |
| | — |
| — |
| | — |
| 57 |
| | — |
| — |
| | — |
| — |
|
| Total liabilities | $ | — |
| $ | 3 |
| | $ | 1,360 |
| $ | 9 |
| | $ | 1,618 |
| $ | 768 |
| | $ | — |
| $ | — |
| | $ | — |
| $ | — |
| $ | — |
| $ | — |
| | $ | 212 |
| $ | 1,360 |
| | $ | 1,682 |
| $ | 1,618 |
| | $ | — |
| $ | — |
| | $ | — |
| $ | — |
|
| |
(1) | Maximum loss exposure excludes the liability for representations and warranties obligations and corporate guarantees and also excludes servicing advances and MSRs. For more information, see Note 98 – Representations and Warranties Obligations and Corporate Guarantees and Note 2524 – Mortgage Servicing Rights. |
| |
(2) | As a holder of these securities, the Corporation receives scheduled principal and interest payments. During 20112012 and 20102011, there were no OTTI losses recorded on those securities classified as AFS debt securities. |
| |
(3) | Not included in the table above are all other assets of $12.1 billion and $11.0 billion, representing the unpaid principal balance of mortgage loans eligible for repurchase from unconsolidated residential mortgage securitization vehicles, principally guaranteed by GNMA, and all other liabilities of $12.1 billion and $11.0 billion, representing the principal amount that would be payable to the securitization vehicles if the Corporation were to exercise the repurchase option, at December 31, 2012 and 2011. |
| |
(4) | Principal balance outstanding includes loans the Corporation transferred with which the Corporation has continuing involvement, which may include servicing the loans. |
During 2012, the Corporation deconsolidated several prime residential mortgage trusts with total assets of $1.2 billion following the transfer of servicing to a third party.
As a result of a settlement agreement with Assured Guaranty Ltd. and its subsidiaries (Assured Guaranty) in 2011, the Corporation entered into a loss-sharing reinsurance arrangement involving 21 first-lien RMBS trusts. This obligation is a variable interest that could potentially be significant to the trusts. To the extent that the Corporation services all or a majority of the loans
in any of the 21 trusts, the Corporation is the primary beneficiary. At December 31, 20112012, 12four of these trusts with total assets of $900 million were consolidated. Assets and liabilities of the consolidated trusts and the Corporation’s maximum loss exposure to consolidated and unconsolidated trusts are included in the table above as non-agency prime and subprime trusts. For additional information, see Note 98 – Representations and Warranties Obligations and Corporate Guarantees.
Home Equity Loans
The Corporation retains interests in home equity securitization trusts to which it transferred home equity loans. These retained interests include senior and subordinate securities and residual interests. In addition, the Corporation may be obligated to provide subordinate funding to the trusts during a rapid amortization event. The Corporation also services the loans in the trusts. Except as described below and in Note 98 – Representations and Warranties Obligations and Corporate Guarantees, the Corporation does not
provide guarantees or recourse to the securitization trusts other than standard representations and warranties. There were no securitizations of home equity loans during 20112012 and 20102011. All of the home equity trusts have entered the rapid amortization phase, and accordingly, there were no collections reinvested in revolving period securitizations in 2011. Collections reinvested in revolving period securitizations were $21 million2012 inand 20102011.
The table below summarizes select information related to home equity loan securitization trusts in which the Corporation held a variable interest at December 31, 20112012 and 20102011.
| | | | | | | | | | | | | | | | | | | | | | | | | |
| Home Equity Loan VIEs | Home Equity Loan VIEs | | | | | | | | | Home Equity Loan VIEs | | | | | | | | |
| | | | | | | | | | | | | | | | | | | | | | | |
| | December 31 | December 31 |
| | 2011 | | 2010 | 2012 | | 2011 |
| (Dollars in millions) | Consolidated VIEs | | Unconsolidated VIEs | | Total | | Consolidated VIEs | | Unconsolidated VIEs | | Total | Consolidated VIEs | | Unconsolidated VIEs | | Total | | Consolidated VIEs | | Unconsolidated VIEs | | Total |
Maximum loss exposure (1) | $ | 2,672 |
| | $ | 7,563 |
| | $ | 10,235 |
| | $ | 3,192 |
| | $ | 9,132 |
| | $ | 12,324 |
| $ | 2,004 |
| | $ | 6,707 |
| | $ | 8,711 |
| | $ | 2,672 |
| | $ | 7,563 |
| | $ | 10,235 |
|
| On-balance sheet assets | |
| | |
| | |
| | |
| | |
| | |
| |
| | |
| | |
| | |
| | |
| | |
|
Trading account assets (2, 3) | $ | — |
| | $ | 5 |
| | $ | 5 |
| | $ | — |
| | $ | 209 |
| | $ | 209 |
| |
Available-for-sale debt securities (3, 4) | — |
| | 13 |
| | 13 |
| | — |
| | 35 |
| | 35 |
| |
| Trading account assets | | $ | — |
| | $ | 8 |
| | $ | 8 |
| | $ | — |
| | $ | 5 |
| | $ | 5 |
|
| Available-for-sale debt securities | | — |
| | 14 |
| | 14 |
| | — |
| | 13 |
| | 13 |
|
| Loans and leases | 2,975 |
| | — |
| | 2,975 |
| | 3,529 |
| | — |
| | 3,529 |
| 2,197 |
| | — |
| | 2,197 |
| | 2,975 |
| | — |
| | 2,975 |
|
| Allowance for loan and lease losses | (303 | ) | | — |
| | (303 | ) | | (337 | ) | | — |
| | (337 | ) | (193 | ) | | — |
| | (193 | ) | | (303 | ) | | — |
| | (303 | ) |
| Total | $ | 2,672 |
| | $ | 18 |
| | $ | 2,690 |
| | $ | 3,192 |
| | $ | 244 |
| | $ | 3,436 |
| $ | 2,004 |
| | $ | 22 |
| | $ | 2,026 |
| | $ | 2,672 |
| | $ | 18 |
| | $ | 2,690 |
|
| On-balance sheet liabilities | |
| | |
| | |
| | |
| | |
| | |
| |
| | |
| | |
| | |
| | |
| | |
|
| Long-term debt | $ | 3,081 |
| | $ | — |
| | $ | 3,081 |
| | $ | 3,635 |
| | $ | — |
| | $ | 3,635 |
| $ | 2,331 |
| | $ | — |
| | $ | 2,331 |
| | $ | 3,081 |
| | $ | — |
| | $ | 3,081 |
|
| All other liabilities | 66 |
| | — |
| | 66 |
| | 23 |
| | — |
| | 23 |
| 92 |
| | — |
| | 92 |
| | 66 |
| | — |
| | 66 |
|
| Total | $ | 3,147 |
| | $ | — |
| | $ | 3,147 |
| | $ | 3,658 |
| | $ | — |
| | $ | 3,658 |
| $ | 2,423 |
| | $ | — |
| | $ | 2,423 |
| | $ | 3,147 |
| | $ | — |
| | $ | 3,147 |
|
| Principal balance outstanding | $ | 2,975 |
| | $ | 14,422 |
| | $ | 17,397 |
| | $ | 3,529 |
| | $ | 20,095 |
| | $ | 23,624 |
| $ | 2,197 |
| | $ | 12,644 |
| | $ | 14,841 |
| | $ | 2,975 |
| | $ | 14,422 |
| | $ | 17,397 |
|
| |
(1) | For unconsolidated VIEs, the maximum loss exposure includes outstanding trust certificates issued by trusts in rapid amortization, net of recorded reserves, and excludes the liability for representations and warranties obligations and corporate guarantees. |
| |
(2)
| At December 31, 2011 and 2010, $3 million and $204 million of the debt securities classified as trading account assets were senior securities and $2 million and $5 million were subordinate securities.
|
| |
(3)
| As a holder of these securities, the Corporation receives scheduled principal and interest payments. During 2011 and 2010, there were no OTTI losses recorded on those securities classified as AFS debt securities.
|
| |
(4)
| At December 31, 2011 and 2010, $13 million and $35 million were subordinate debt securities.
|
Included in the table above are consolidated and unconsolidated home equity loan securitizations that have entered a rapid amortization period and for which the Corporation is obligated to provide subordinated funding. During this period, cash payments from borrowers are accumulated to repay outstanding debt securities and the Corporation continues to make advances to borrowers when they draw on their lines of credit. The Corporation then transfers the newly generated receivables into the securitization vehicles and is reimbursed only after other parties in the securitization have received all of the cash flows to which they are entitled. If loan losses requiring draws on monoline insurers’ policies, which protect the bondholders in the securitization, exceed a certain level, the Corporation may not receive reimbursement for all of the funds advanced to borrowers, as the senior bondholders and the monoline insurers have priority for repayment. The Corporation evaluates each of these securitizations for potential losses due to non-recoverable advances by estimating the amount and timing of future losses on the underlying loans, the excess spread available to cover such losses and potential cash flow shortfalls during rapid amortization. This evaluation, which includes the number of loans still in revolving status, the amount of available credit and when those loans will lose revolving status, is also used to determine whether the
Corporation has a variable interest that is more than insignificant and must consolidate the trust. A maximum funding obligation
attributable to rapid amortization cannot be calculated as a home equity borrower has the ability to pay down and re-draw balances. At December 31, 20112012 and 20102011, home equity loan securitization transactionssecuritizations in rapid amortization for which the Corporation has a subordinatesubordinated funding obligation, including both consolidated and unconsolidated trusts, had $10.79.0 billion and $12.510.7 billion of trust certificates outstanding. This amount is significantly greater than the amount the Corporation expects to fund. The charges that will ultimately be recorded as a result of the rapid amortization events depend on the undrawn available credit on the home equity lines, which totaled $460196 million and $639460 million at December 31, 20112012 and 20102011, as well as performance of the loans, the amount of subsequent draws and the timing of related cash flows. At December 31, 20112012 and 20102011, the reserve for losses on expected future draw obligations on the home equity loan securitizations in rapid amortization for which the Corporation has a subordinated funding obligation was $6951 million and $13169 million.
The Corporation has consumer MSRs from the sale or securitization of home equity loans. The Corporation recorded $6259 million and $7962 million of servicing fee income related to home equity loan securitizations during 20112012 and 20102011. The Corporation repurchased $87 million and $28 million of loans from home equity securitization trusts in order to perform modifications during 2012 and 2011.
|
| | |
206 Bank of America 2012 | | Bank of America199
|
Credit Card Securitizations
The Corporation securitizes originated and purchased credit card loans. The Corporation’s continuing involvement with the securitization trusts includes servicing the receivables, retaining an undivided interest (seller’s interest) in the receivables, and holding certain retained interests including senior and subordinate securities, discount receivables, subordinate interests in accrued
interest and fees on the securitized receivables, and cash reserve
accounts. The seller’s interest in the trusts, which is pari passu to the investors’ interest, and the discount receivables are classified in loans and leases.
The table below summarizes select information related to consolidated credit card securitization trusts in which the Corporation held a variable interest at December 31, 20112012 and 20102011.
| | | | | | | | | |
Credit Card VIEs | | | | |
| | December 31 | December 31 |
| (Dollars in millions) | 2011 | | 2010 | 2012 | | 2011 |
| Consolidated VIEs | | | | | | |
| Maximum loss exposure | $ | 38,282 |
| | $ | 36,596 |
| $ | 42,487 |
| | $ | 38,282 |
|
| On-balance sheet assets | |
| | |
| |
| | |
|
| Derivative assets | $ | 788 |
| | $ | 1,778 |
| $ | 323 |
| | $ | 788 |
|
Loans and leases (1) | 74,793 |
| | 92,104 |
| 66,427 |
| | 74,793 |
|
| Allowance for loan and lease losses | (4,742 | ) | | (8,505 | ) | (3,445 | ) | | (4,742 | ) |
All other assets (2) | 723 |
| | 4,259 |
| 1,567 |
| | 723 |
|
| Total | $ | 71,562 |
| | $ | 89,636 |
| $ | 64,872 |
| | $ | 71,562 |
|
| On-balance sheet liabilities | |
| | |
| |
| | |
|
| Long-term debt | $ | 33,076 |
| | $ | 52,781 |
| $ | 22,291 |
| | $ | 33,076 |
|
| All other liabilities | 204 |
| | 259 |
| 94 |
| | 204 |
|
| Total | $ | 33,280 |
| | $ | 53,040 |
| $ | 22,385 |
| | $ | 33,280 |
|
| Trust loans | $ | 74,793 |
| | $ | 92,104 |
| |
| |
(1) | At December 31, 20112012 and 20102011, loans and leases included $28.733.5 billion and $20.428.7 billion of seller’s interest and $1.0 billion124 million and $3.81.0 billion of discount receivables. |
| |
(2) | At December 31, 20112012 and 20102011, all other assets included restricted cash and short-term investment accounts and unbilled accrued interest and fees. |
During 2010, $2.9 billion of new senior debt securities were issued to third-party investors from the credit card securitization trusts and none were issued in 2011.
During 2010,The Corporation holds subordinate securities with a notional principal amount of $11.510.1 billion and $11.9 billion at December 31, 2012 and 2011 and a stated interest rate of zero percent were issued by certain credit card securitization trusts to the Corporation.trusts. In addition, during 2010 and 2009, the Corporation elected to designate a specified percentage of new receivables transferred to the trusts as “discount receivables” such that principal collections thereon are added to finance charges which increases the yield in the trust.
Through the designation of newly transferred receivables as discount receivables, the Corporation has subordinated
a portion of its seller’s interest to the investors’ interest. These actions which were specifically permitted by the terms of the trust documents, were taken in an effort to address the decline in the excess spread of the U.S. and U.K. credit card securitization trusts.
During 2012, the Corporation transferred $553 million of credit card receivables to a third-party sponsored securitization vehicle. The U.S. election expired June 30, 2011. The issuanceCorporation no longer services the credit card receivables and does not consolidate the vehicle. At December 31, 2012, the Corporation held a senior interest of subordinate securities and the discount$309 million in these receivables, election had no impactclassified as loans on the Corporation’s results of operationsConsolidated Balance Sheet, that is not included in 2011 and 2010.the table above.
|
| | |
| | 200Bank of America 20112012207
| | |
Other Asset-backed Securitizations
Other asset-backed securitizations include resecuritization trusts, municipal bond trusts, and automobile and other securitization trusts. The table below summarizes select information related to other asset-backed securitizations in which the Corporation held a variable interest at December 31, 20112012 and 20102011.
| | | | | | | | | | | | | | | | | | | | | | | | | |
| Other Asset-backed VIEs | Other Asset-backed VIEs | | | | | | | | | Other Asset-backed VIEs | | | | | | | | |
| | | | | | | | | | | | | | | | | | | | | | | |
| | Resecuritization Trusts | | Municipal Bond Trusts | | Automobile and Other Securitization Trusts | Resecuritization Trusts | | Municipal Bond Trusts | | Automobile and Other Securitization Trusts |
| | December 31 | | December 31 | | December 31 | December 31 | | December 31 | | December 31 |
| (Dollars in millions) | 2011 | | 2010 | | 2011 | | 2010 | | 2011 | | 2010 | 2012 | | 2011 | | 2012 | | 2011 | | 2012 | | 2011 |
| Unconsolidated VIEs | |
| | |
| | |
| | |
| | |
| | |
| |
| | |
| | |
| | |
| | |
| | |
|
| Maximum loss exposure | $ | 31,140 |
| | $ | 20,320 |
| | $ | 3,752 |
| | $ | 4,261 |
| | $ | 93 |
| | $ | 141 |
| $ | 20,715 |
| | $ | 31,140 |
| | $ | 3,341 |
| | $ | 3,752 |
| | $ | 122 |
| | $ | 93 |
|
| On-balance sheet assets | |
| | |
| | |
| | |
| | |
| | |
| |
| | |
| | |
| | |
| | |
| | |
|
Senior securities held (1, 2): | |
| | |
| | |
| | |
| | |
| | |
| |
| | |
| | |
| | |
| | |
| | |
|
| Trading account assets | $ | 2,595 |
| | $ | 1,219 |
| | $ | 228 |
| | $ | 255 |
| | $ | — |
| | $ | — |
| $ | 1,281 |
| | $ | 2,595 |
| | $ | 12 |
| | $ | 228 |
| | $ | 37 |
| | $ | — |
|
| AFS debt securities | 27,616 |
| | 17,989 |
| | — |
| | — |
| | 81 |
| | 109 |
| |
| Available-for-sale debt securities | | 19,343 |
| | 27,616 |
| | 540 |
| | — |
| | 74 |
| �� | 81 |
|
Subordinate securities held (1, 2): | |
| | |
| | |
| | |
| | |
| | |
| |
| | |
| | |
| | |
| | |
| | |
|
| Trading account assets | — |
| | 2 |
| | — |
| | — |
| | — |
| | — |
| |
| AFS debt securities | 544 |
| | 1,036 |
| | — |
| | — |
| | — |
| | — |
| |
| Available-for-sale debt securities | | 75 |
| | 544 |
| | — |
| | — |
| | — |
| | — |
|
Residual interests held (3) | 385 |
| | 74 |
| | — |
| | — |
| | — |
| | — |
| 16 |
| | 385 |
| | — |
| | — |
| | — |
| | — |
|
| All other assets | — |
| | — |
| | — |
| | — |
| | 12 |
| | 17 |
| — |
| | — |
| | — |
| | — |
| | 11 |
| | 12 |
|
| Total retained positions | $ | 31,140 |
| | $ | 20,320 |
| | $ | 228 |
| | $ | 255 |
| | $ | 93 |
| | $ | 126 |
| $ | 20,715 |
| | $ | 31,140 |
| | $ | 552 |
| | $ | 228 |
| | $ | 122 |
| | $ | 93 |
|
| Total assets of VIEs | $ | 60,459 |
| | $ | 39,830 |
| | $ | 5,964 |
| | $ | 6,108 |
| | $ | 668 |
| | $ | 774 |
| |
Total assets of VIEs (4) | | $ | 42,818 |
| | $ | 60,459 |
| | $ | 4,980 |
| | $ | 5,964 |
| | $ | 1,890 |
| | $ | 668 |
|
| | | | | | | | | | | | | | | | | | | | | | | |
| Consolidated VIEs | |
| | |
| | |
| | |
| | |
| | |
| |
| | |
| | |
| | |
| | |
| | |
|
| Maximum loss exposure | $ | — |
| | $ | — |
| | $ | 3,901 |
| | $ | 4,716 |
| | $ | 1,087 |
| | $ | 2,061 |
| $ | 126 |
| | $ | — |
| | $ | 2,505 |
| | $ | 3,901 |
| | $ | 1,255 |
| | $ | 1,087 |
|
| On-balance sheet assets | |
| | |
| | |
| | |
| | |
| | |
| |
| | |
| | |
| | |
| | |
| | |
|
| Trading account assets | $ | — |
| | $ | 68 |
| | $ | 3,901 |
| | $ | 4,716 |
| | $ | — |
| | $ | — |
| $ | 220 |
| | $ | — |
| | $ | 2,505 |
| | $ | 3,901 |
| | $ | — |
| | $ | — |
|
| Loans and leases | — |
| | — |
| | — |
| | — |
| | 4,923 |
| | 9,583 |
| — |
| | — |
| | — |
| | — |
| | 2,523 |
| | 4,923 |
|
| Allowance for loan and lease losses | — |
| | — |
| | — |
| | — |
| | (7 | ) | | (29 | ) | — |
| | — |
| | — |
| | — |
| | (2 | ) | | (7 | ) |
| All other assets | — |
| | — |
| | — |
| | — |
| | 168 |
| | 196 |
| — |
| | — |
| | — |
| | — |
| | 250 |
| | 168 |
|
| Total assets | $ | — |
| | $ | 68 |
| | $ | 3,901 |
| | $ | 4,716 |
| | $ | 5,084 |
| | $ | 9,750 |
| $ | 220 |
| | $ | — |
| | $ | 2,505 |
| | $ | 3,901 |
| | $ | 2,771 |
| | $ | 5,084 |
|
| On-balance sheet liabilities | |
| | |
| | |
| | |
| | |
| | |
| |
| | |
| | |
| | |
| | |
| | |
|
| Commercial paper and other short-term borrowings | $ | — |
| | $ | — |
| | $ | 5,127 |
| | $ | 4,921 |
| | $ | — |
| | $ | — |
| |
| Other short-term borrowings | | $ | — |
| | $ | — |
| | $ | 2,859 |
| | $ | 5,127 |
| | $ | — |
| | $ | — |
|
| Long-term debt | — |
| | 68 |
| | — |
| | — |
| | 3,992 |
| | 7,681 |
| 94 |
| | — |
| | — |
| | — |
| | 1,513 |
| | 3,992 |
|
| All other liabilities | — |
| | — |
| | — |
| | — |
| | 90 |
| | 101 |
| — |
| | — |
| | — |
| | — |
| | 82 |
| | 90 |
|
| Total liabilities | $ | — |
| | $ | 68 |
| | $ | 5,127 |
| | $ | 4,921 |
| | $ | 4,082 |
| | $ | 7,782 |
| $ | 94 |
| | $ | — |
| | $ | 2,859 |
| | $ | 5,127 |
| | $ | 1,595 |
| | $ | 4,082 |
|
| |
(1) | As a holder of these securities, the Corporation receives scheduled principal and interest payments. During 20112012 and 20102011, there were no OTTI losses recorded on those securities classified as AFS debt securities. |
| |
(2) | The retained senior and subordinate securities were valued using quoted market prices or observable market inputs (Level 2 of the fair value hierarchy). |
| |
(3) | The retained residual interests are carried at fair value which was derived using model valuations (Level 2 of the fair value hierarchy). |
| |
(4) | Total assets include loans the Corporation transferred with which the Corporation has continuing involvement, which may include servicing the loan. |
Resecuritization Trusts
The Corporation transfers existing securities, typically MBS, into resecuritization vehicles at the request of customers seeking securities with specific characteristics. The Corporation may also enter into resecuritizations ofresecuritize securities within its investment portfolio for purposes of improving liquidity and capital, and managing credit or interest rate risk. Generally, there are no significant ongoing activities performed in a resecuritization trust and no single investor has the unilateral ability to liquidate the trust.
The Corporation resecuritized $33.645.6 billion of securities in 20112012 compared toand $97.733.6 billion in 2010. Net gains on sales totaled $909 million in 2011 compared. All of the securities transferred into resecuritization vehicles during 2012 were classified as trading account assets. As such, changes in fair value were recorded in trading account profits prior to net lossesthe resecuritization and no gain or loss on sale was recorded. Gains on sale of $144909 million were recorded in 20102011. The Corporation consolidates a resecuritization trust if it has sole discretion over the design of the trust, including the identification of securities to be transferred in and the structure of securities to be issued, and also retains a variable interest that could potentially be significant to the trust. If one or a limited number of third-party investors share responsibility for the design of the trust and purchase a significant
portion of securities, including subordinate securities issued by non-agency trusts, the Corporation does not consolidate the trust.
Municipal Bond Trusts
The Corporation administers municipal bond trusts that hold highly-rated, long-term, fixed-rate municipal bonds. A majority of the bonds are rated AAA or AA and some benefit from insurance provided by third parties. The trusts obtain financing by issuing floating-rate trust certificates that reprice on a weekly or other basis to third-party investors. The Corporation may serve as remarketing agent and/or liquidity provider for the trusts. The floating-rate investors have the right to tender the certificates at specified dates, often with as little as seven days’ notice. Should the Corporation be unable to remarket the tendered certificates, it is generally obligated to purchase them at par under standby liquidity facilities unless the bond’s credit rating has declined below investment grade or there has been an event of default or bankruptcy of the issuer and insurer.
The Corporation also provides credit enhancement to investors in certain municipal bond trusts whereby the Corporation guarantees the payment of interest and principal on floating-rate certificates issued by these trusts in the event of default by the
issuer of the underlying municipal bond. If a customer holds the residual interest in a trust, that customer typically has the unilateral ability to liquidate the trust at any time, while the
Corporation typically has the ability to trigger the liquidation of that trust if the market value of the bonds held in the trust declines below a specified threshold. This arrangement is designed to limit market losses to an amount that is less than the customer’s residual interest, effectively preventing the Corporation from absorbing losses incurred on assets held within that trust.
During 20112012 and 20102011, the Corporation was the transferor of assets into unconsolidated municipal bond trusts and received cash proceeds from new securitizations of $733879 million and $1.2 billion733 million. At December 31, 20112012 and 20102011, the principal balance outstanding for unconsolidated municipal bond securitization trusts for which the Corporation was transferor was $2.51.4 billion and $2.22.5 billion.
The Corporation’s liquidity commitments to unconsolidated municipal bond trusts, including those for which the Corporation was transferor, totaled $3.52.8 billion and $4.03.5 billion at December 31, 20112012 and 20102011. The weighted-average remaining life of bonds held in the trusts at December 31, 20112012 was 10.08.4 years. There were no material write-downs or downgrades of assets or issuers during2012 and 2011.
Automobile and Other Securitization Trusts
The Corporation transfers automobile and other loans into securitization trusts, typically to improve liquidity or manage credit risk. During 2012, the Corporation transferred automobile loans into an unconsolidated automobile trust, receiving cash proceeds of $2.4 billion and recording a loss on sale of $7 million. At December 31, 2012, the Corporation serviced assets or otherwise
had continuing involvement with automobile and other securitization trusts with outstanding balances of $4.7 billion, including trusts collateralized by automobile loans of $3.5 billion, student loans of $897 million and other loans of $290 million. At December 31, 2011, the Corporation serviced assets or otherwise had continuing involvement with automobile and other securitization trusts with outstanding balances of $5.8 billion, including trusts collateralized by automobile loans of $3.9 billion, student loans of $1.2 billion, and other loans and receivables of
$668 million. At December 31, 2010, the Corporation serviced assets or otherwise had continuing involvement with automobile and other securitization trusts with outstanding balances of $10.5 billion, including trusts collateralized by automobile loans of $8.4 billion, student loans of $1.3 billion, and other loans and receivables of $774668 million.
Collateralized Debt Obligation Vehicles
CDO vehicles hold diversified pools of fixed-income securities, typically corporate debt or ABS, which they fund by issuing multiple tranches of debt and equity securities. Synthetic CDOs enter into a portfolio of CDS to synthetically create exposure to fixed-income securities. CLOs, which are a subset of CDOs, which hold pools of loans, typically corporate loans or commercial mortgages. CDOs are typically managed by third-party portfolio managers. The Corporation transfers assets to these CDOs, holds securities issued by the CDOs and may be a derivative counterparty to the CDOs, including a CDS counterparty for synthetic CDOs. The Corporation has also entered into total return swaps with certain CDOs whereby the Corporation absorbs the economic returns generated by specified assets held by the CDO. The Corporation receives fees for structuring CDOs and providing liquidity support for super senior tranches of securities issued by certain CDOs. No third parties provide a significant amount of similar commitments to these CDOs.
The table below summarizes select information related to CDO vehicles in which the Corporation held a variable interest at December 31, 20112012 and 20102011.
| | | | | | | | | | | | | | | | | | | | | | | | | |
| CDO Vehicle VIEs | CDO Vehicle VIEs | | | | | | | | | CDO Vehicle VIEs | | | | | | | | |
| | | | | | | | | | | | | | | | | | | | | | | |
| | December 31 | December 31 |
| | 2011 | | 2010 | 2012 | | 2011 |
| (Dollars in millions) | Consolidated | | Unconsolidated | | Total | | Consolidated | | Unconsolidated | | Total | Consolidated | | Unconsolidated | | Total | | Consolidated | | Unconsolidated | | Total |
| Maximum loss exposure | $ | 1,695 |
| | $ | 2,272 |
| | $ | 3,967 |
| | $ | 2,971 |
| | $ | 3,828 |
| | $ | 6,799 |
| $ | 2,201 |
| | $ | 1,376 |
| | $ | 3,577 |
| | $ | 1,695 |
| | $ | 2,272 |
| | $ | 3,967 |
|
| On-balance sheet assets | |
| | |
| | |
| | |
| | |
| | |
| |
| | |
| | |
| | |
| | |
| | |
|
| Trading account assets | $ | 1,392 |
| | $ | 461 |
| | $ | 1,853 |
| | $ | 2,485 |
| | $ | 884 |
| | $ | 3,369 |
| $ | 2,191 |
| | $ | 258 |
| | $ | 2,449 |
| | $ | 1,392 |
| | $ | 461 |
| | $ | 1,853 |
|
| Derivative assets | 452 |
| | 678 |
| | 1,130 |
| | 207 |
| | 890 |
| | 1,097 |
| 10 |
| | 301 |
| | 311 |
| | 452 |
| | 678 |
| | 1,130 |
|
| AFS debt securities | — |
| | — |
| | — |
| | 769 |
| | 338 |
| | 1,107 |
| |
| All other assets | — |
| | 96 |
| | 96 |
| | 24 |
| | 123 |
| | 147 |
| — |
| | 76 |
| | 76 |
| | — |
| | 96 |
| | 96 |
|
| Total | $ | 1,844 |
| | $ | 1,235 |
| | $ | 3,079 |
| | $ | 3,485 |
| | $ | 2,235 |
| | $ | 5,720 |
| $ | 2,201 |
| | $ | 635 |
| | $ | 2,836 |
| | $ | 1,844 |
| | $ | 1,235 |
| | $ | 3,079 |
|
| On-balance sheet liabilities | |
| | |
| | |
| | |
| | |
| | |
| |
| | |
| | |
| | |
| | |
| | |
|
| Derivative liabilities | $ | — |
| | $ | 11 |
| | $ | 11 |
| | $ | — |
| | $ | 58 |
| | $ | 58 |
| $ | — |
| | $ | 9 |
| | $ | 9 |
| | $ | — |
| | $ | 11 |
| | $ | 11 |
|
| Long-term debt | 2,712 |
| | 2 |
| | 2,714 |
| | 3,162 |
| | — |
| | 3,162 |
| 2,806 |
| | 2 |
| | 2,808 |
| | 2,712 |
| | 2 |
| | 2,714 |
|
| Total | $ | 2,712 |
| | $ | 13 |
| | $ | 2,725 |
| | $ | 3,162 |
| | $ | 58 |
| | $ | 3,220 |
| $ | 2,806 |
| | $ | 11 |
| | $ | 2,817 |
| | $ | 2,712 |
| | $ | 13 |
| | $ | 2,725 |
|
| Total assets of VIEs | $ | 1,844 |
| | $ | 32,903 |
| | $ | 34,747 |
| | $ | 3,485 |
| | $ | 43,476 |
| | $ | 46,961 |
| $ | 2,201 |
| | $ | 26,985 |
| | $ | 29,186 |
| | $ | 1,844 |
| | $ | 32,903 |
| | $ | 34,747 |
|
The Corporation’s maximum loss exposure of $4.03.6 billion at December 31, 20112012 included $336 million of super senior CDO exposure, $1.72.2 billion of exposure to CDO financing facilities, $138 million of super senior CDO exposure and $2.01.3 billion of other non-super senior exposure. This exposure is calculated on a gross basis and does not reflect any benefit from insurance purchased from third parties. Net of this insurance but including securities retained from liquidations of CDOs, the Corporation’s net exposure to super senior CDO-related positions was $152 million at December 31, 2011. The CDO financing facilities, which are consolidated, obtain funding from third parties for CDO positions which are principally classified in trading account assets on the Corporation’s Consolidated Balance Sheet. The CDO financing facilities’ long-term debt at December 31, 20112012 totaled $2.62.8 billion, all of which has recourse to the general credit of the
Corporation. The Corporation’s maximum exposure to loss is significantly less than the total assets of theFor unconsolidated CDO vehicles in the table above, the Corporation’s maximum loss exposure is significantly less than
the total assets of the VIEs because the Corporation typically has exposure to only a portion of the total assets.
At December 31, 20112012, the Corporation had $2.41.5 billion of aggregate liquidity exposure to CDOs. This amount includedincludes $588108 million of commitments to CDOs to provide funding for super senior exposures and $1.81.4 billion notional amount of derivative contracts with unconsolidated VIEs, principally CDO vehicles, which hold non-super senior CDO debt securities or other debt securities on the Corporation’s behalf. See Note 1413 – Commitments and Contingencies for additional information. The Corporation’s liquidity exposure to CDOs at December 31, 20112012 is included in the table above to the extent that the Corporation sponsored the CDO vehicle or the liquidity exposure is more than insignificant
|
| | |
| | 202Bank of America 20112012209
| | |
CDO vehicle or the liquidity exposure is more than insignificant compared to total assets of the CDO vehicle. Liquidity exposure included in the table is reported net of previously recorded losses.
Customer Vehicles
Customer vehicles include credit-linked and equity-linked note vehicles, repackaging vehicles and asset acquisition vehicles,
which are typically created on behalf of customers who wish to obtain market or credit exposure to a specific company or financial instrument.
The table below summarizes select information related to customer vehicles in which the Corporation held a variable interest at December 31, 20112012 and 20102011.
| | | | | | | | | | | | | | | | | | | | | | | | | |
| Customer Vehicle VIEs | Customer Vehicle VIEs | | | | | | | | | Customer Vehicle VIEs | | | | | | | | |
| | | | | | | | | | | | | | | | | | | | | | | |
| | December 31 | December 31 |
| | 2011 | | 2010 | 2012 | | 2011 |
| (Dollars in millions) | Consolidated | | Unconsolidated | | Total | | Consolidated | | Unconsolidated | | Total | Consolidated | | Unconsolidated | | Total | | Consolidated | | Unconsolidated | | Total |
| Maximum loss exposure | $ | 3,264 |
| | $ | 2,116 |
| | $ | 5,380 |
| | $ | 4,449 |
| | $ | 2,735 |
| | $ | 7,184 |
| $ | 2,994 |
| | $ | 1,401 |
| | $ | 4,395 |
| | $ | 3,264 |
| | $ | 2,116 |
| | $ | 5,380 |
|
| On-balance sheet assets | |
| | |
| | |
| | |
| | |
| | |
| |
| | |
| | |
| | |
| | |
| | |
|
| Trading account assets | $ | 3,302 |
| | $ | 211 |
| | $ | 3,513 |
| | $ | 3,458 |
| | $ | 876 |
| | $ | 4,334 |
| $ | 2,882 |
| | $ | 98 |
| | $ | 2,980 |
| | $ | 3,302 |
| | $ | 211 |
| | $ | 3,513 |
|
| Derivative assets | — |
| | 905 |
| | 905 |
| | 1 |
| | 722 |
| | 723 |
| — |
| | 516 |
| | 516 |
| | — |
| | 905 |
| | 905 |
|
| Loans and leases | | 523 |
| | — |
| | 523 |
| | — |
| | — |
| | — |
|
| Loans held-for-sale | 907 |
| | — |
| | 907 |
| | 959 |
| | — |
| | 959 |
| 950 |
| | — |
| | 950 |
| | 907 |
| | — |
| | 907 |
|
| All other assets | 1,452 |
| | — |
| | 1,452 |
| | 1,429 |
| | — |
| | 1,429 |
| 763 |
| | — |
| | 763 |
| | 1,452 |
| | — |
| | 1,452 |
|
| Total | $ | 5,661 |
| | $ | 1,116 |
| | $ | 6,777 |
| | $ | 5,847 |
| | $ | 1,598 |
| | $ | 7,445 |
| $ | 5,118 |
| | $ | 614 |
| | $ | 5,732 |
| | $ | 5,661 |
| | $ | 1,116 |
| | $ | 6,777 |
|
| On-balance sheet liabilities | |
| | |
| | |
| | |
| | |
| | |
| |
| | |
| | |
| | |
| | |
| | |
|
| Derivative liabilities | $ | 4 |
| | $ | 42 |
| | $ | 46 |
| | $ | 1 |
| | $ | 23 |
| | $ | 24 |
| $ | 26 |
| | $ | 7 |
| | $ | 33 |
| | $ | 4 |
| | $ | 42 |
| | $ | 46 |
|
| Commercial paper and other short-term borrowings | — |
| | — |
| | — |
| | — |
| | — |
| | — |
| |
| Other short-term borrowings | | 131 |
| | — |
| | 131 |
| | — |
| | — |
| | — |
|
| Long-term debt | 3,912 |
| | — |
| | 3,912 |
| | 3,457 |
| | — |
| | 3,457 |
| 3,179 |
| | — |
| | 3,179 |
| | 3,912 |
| | — |
| | 3,912 |
|
| All other liabilities | 1 |
| | 448 |
| | 449 |
| | — |
| | 140 |
| | 140 |
| 3 |
| | 382 |
| | 385 |
| | 1 |
| | 448 |
| | 449 |
|
| Total | $ | 3,917 |
| | $ | 490 |
| | $ | 4,407 |
| | $ | 3,458 |
| | $ | 163 |
| | $ | 3,621 |
| $ | 3,339 |
| | $ | 389 |
| | $ | 3,728 |
| | $ | 3,917 |
| | $ | 490 |
| | $ | 4,407 |
|
| Total assets of VIEs | $ | 5,661 |
| | $ | 5,302 |
| | $ | 10,963 |
| | $ | 5,847 |
| | $ | 6,090 |
| | $ | 11,937 |
| $ | 5,118 |
| | $ | 4,055 |
| | $ | 9,173 |
| | $ | 5,661 |
| | $ | 5,302 |
| | $ | 10,963 |
|
Credit-linked and equity-linked note vehicles issue notes which pay a return that is linked to the credit or equity risk of a specified company or debt instrument. The vehicles purchase high-grade assets as collateral and enter into CDSsCDS or equity derivatives to synthetically create the credit or equity risk to pay the specified return on the notes. The Corporation is typically the counterparty for some or all of the credit and equity derivatives and, to a lesser extent, it may invest in securities issued by the vehicles. The Corporation may also enter into interest rate or foreign currency derivatives with the vehicles. The Corporation also had approximately $824 million of other liquidity commitments, including written put options and collateral value guarantees, with unconsolidated credit-linked and equity-linked note vehicles of $742 million and $824 millionat December 31, 2012 and 2011.
Repackaging vehicles issue notes that are designed to incorporate risk characteristics desired by customers. The vehicles hold debt instruments such as corporate bonds, convertible bonds or ABS with the desired credit risk profile. The Corporation enters into derivatives with the vehicles to change the interest rate or foreign currency profile of the debt instruments. If a vehicle holds convertible bonds and the Corporation retains the conversion option, the Corporation is deemed to have a controlling financial interest and consolidates the vehicle.
Asset acquisition vehicles acquire financial instruments, typically loans, at the direction of a single customer and obtain
funding through the issuance of structured liabilities to the
Corporation. At the time the vehicle acquires an asset, the Corporation enters into total return swaps with the customer such that the economic returns of the asset are passed through to the customer. The Corporation is exposed to counterparty credit risk if the asset declines in value and the customer defaults on its obligation to the Corporation under the total return swaps. The Corporation’s risk may be mitigated by collateral or other arrangements. The Corporation consolidates these vehicles because it has the power to manage the assets in the vehicles and ownsholds all of the structured liabilities issued by the vehicles.
The Corporation’s maximum loss exposure to loss from customer vehicles includes the notional amount of the credit or equity derivatives to which the Corporation is a counterparty, net of losses previously recorded, and the Corporation’s investment, if any, in securities issued by the vehicles. It has not been reduced to reflect the benefit of offsetting swaps with the customers or collateral arrangements.
Other Variable Interest Entities
Other consolidated VIEs primarily include investment vehicles and leveraged lease trusts and, at December 31, 2010, a collective investment fund and asset acquisition conduits.trusts. Other unconsolidated VIEs primarily include investment vehicles and real estate vehicles.
|
| | |
210 Bank of America 2012 | | Bank of America203
|
The table below summarizes select information related to other VIEs in which the Corporation held a variable interest at December 31, 20112012 and 20102011.
| | | | | | | | | | | | | | | | | | | | | | | | | |
| Other VIEs | Other VIEs | | | | | | | | | Other VIEs | | | | | | | | |
| | | | | | | | | | | | | | | | | | | | | | | |
| | December 31 | December 31 |
| | 2011 | | 2010 | 2012 | | 2011 |
| (Dollars in millions) | Consolidated | | Unconsolidated | | Total | | Consolidated | | Unconsolidated | | Total | Consolidated | | Unconsolidated | | Total | | Consolidated | | Unconsolidated | | Total |
| Maximum loss exposure | $ | 7,429 |
| | $ | 7,286 |
| | $ | 14,715 |
| | $ | 19,248 |
| | $ | 8,796 |
| | $ | 28,044 |
| $ | 5,608 |
| | $ | 6,492 |
| | $ | 12,100 |
| | $ | 7,429 |
| | $ | 7,286 |
| | $ | 14,715 |
|
| On-balance sheet assets | |
| | |
| | |
| | |
| | |
| | |
| |
| | |
| | |
| | |
| | |
| | |
|
| Trading account assets | $ | — |
| | $ | — |
| | $ | — |
| | $ | 8,900 |
| | $ | — |
| | $ | 8,900 |
| $ | 108 |
| | $ | — |
| | $ | 108 |
| | $ | — |
| | $ | — |
| | $ | — |
|
| Derivative assets | 394 |
| | 440 |
| | 834 |
| | — |
| | 228 |
| | 228 |
| — |
| | 460 |
| | 460 |
| | 394 |
| | 440 |
| | 834 |
|
| AFS debt securities | — |
| | 62 |
| | 62 |
| | 1,832 |
| | 73 |
| | 1,905 |
| |
| Available-for-sale debt securities | | — |
| | 39 |
| | 39 |
| | — |
| | 62 |
| | 62 |
|
| Loans and leases | 5,154 |
| | 357 |
| | 5,511 |
| | 7,690 |
| | 1,122 |
| | 8,812 |
| 4,561 |
| | 67 |
| | 4,628 |
| | 5,154 |
| | 357 |
| | 5,511 |
|
| Allowance for loan and lease losses | (8 | ) | | (1 | ) | | (9 | ) | | (27 | ) | | (22 | ) | | (49 | ) | (14 | ) | | — |
| | (14 | ) | | (8 | ) | | (1 | ) | | (9 | ) |
| Loans held-for-sale | 106 |
| | 598 |
| | 704 |
| | 262 |
| | 949 |
| | 1,211 |
| 105 |
| | 157 |
| | 262 |
| | 106 |
| | 598 |
| | 704 |
|
| All other assets | 1,809 |
| | 5,823 |
| | 7,632 |
| | 937 |
| | 6,440 |
| | 7,377 |
| 1,001 |
| | 5,768 |
| | 6,769 |
| | 1,809 |
| | 5,823 |
| | 7,632 |
|
| Total | $ | 7,455 |
| | $ | 7,279 |
| | $ | 14,734 |
| | $ | 19,594 |
| | $ | 8,790 |
| | $ | 28,384 |
| $ | 5,761 |
| | $ | 6,491 |
| | $ | 12,252 |
| | $ | 7,455 |
| | $ | 7,279 |
| | $ | 14,734 |
|
| On-balance sheet liabilities | |
| | |
| | |
| | |
| | |
| | |
| |
| | |
| | |
| | |
| | |
| | |
|
| Commercial paper and other short-term borrowings | $ | — |
| | $ | — |
| | $ | — |
| | $ | 1,115 |
| | $ | — |
| | $ | 1,115 |
| |
| Derivative liabilities | | $ | — |
| | $ | 9 |
| | $ | 9 |
| | $ | — |
| | $ | — |
| | $ | — |
|
| Long-term debt | 10 |
| | — |
| | 10 |
| | 229 |
| | — |
| | 229 |
| 889 |
| | — |
| | 889 |
| | 10 |
| | — |
| | 10 |
|
| All other liabilities | 694 |
| | 1,705 |
| | 2,399 |
| | 8,683 |
| | 1,666 |
| | 10,349 |
| 63 |
| | 1,683 |
| | 1,746 |
| | 694 |
| | 1,705 |
| | 2,399 |
|
| Total | $ | 704 |
| | $ | 1,705 |
| | $ | 2,409 |
| | $ | 10,027 |
| | $ | 1,666 |
| | $ | 11,693 |
| $ | 952 |
| | $ | 1,692 |
| | $ | 2,644 |
| | $ | 704 |
| | $ | 1,705 |
| | $ | 2,409 |
|
| Total assets of VIEs | $ | 7,455 |
| | $ | 11,055 |
| | $ | 18,510 |
| | $ | 19,594 |
| | $ | 13,416 |
| | $ | 33,010 |
| $ | 5,761 |
| | $ | 8,660 |
| | $ | 14,421 |
| | $ | 7,455 |
| | $ | 11,055 |
| | $ | 18,510 |
|
Investment Vehicles
The Corporation sponsors, invests in or provides financing to a variety of investment vehicles that hold loans, real estate, debt securities or other financial instruments and are designed to provide the desired investment profile to investors.investors or the Corporation. At December 31, 20112012 and 20102011, the Corporation’s consolidated investment vehicles had total assets of $2.61.3 billion and $5.62.6 billion. The Corporation also held investments in unconsolidated vehicles with total assets of $5.53.0 billion and $7.95.5 billion at December 31, 20112012 and 20102011. The Corporation’s maximum loss exposure to loss associated with both consolidated and unconsolidated investment vehicles totaled $4.42.1 billion and $8.74.4 billion at December 31, 20112012 and 20102011 comprised primarily of on-balance sheet assets less non-recourse liabilities.
Collective Investment Funds
The Corporation is trustee for certain common and collective investment funds that provide investment opportunities for eligible clients of GWIM. These funds, which had total assets of $11.1 billion and $21.2 billion at December 31, 2011 and 2010, hold a variety of cash, debt and equity investments. At December 31, 2011, the Corporation did not have a variable interest in these funds. The Corporation consolidated a stable value collective investment fund with total assets of $8.1 billion at December 31, 2010, for which the Corporation had the unilateral ability to replace the fund’s asset manager. The fund was liquidated during 2011.
Leveraged Lease Trusts
The Corporation’s net investment in consolidated leveraged lease trusts totaled $4.84.4 billion and $5.24.8 billion at December 31, 20112012 and 20102011. The trusts hold long-lived equipment such as rail cars, power generation and distribution equipment, and commercial
aircraft. The Corporation structures the trusts and holds a significant residual interest. The net investment represents the Corporation’s maximum loss exposure to the trusts in the unlikely event that the leveraged lease investments become worthless. Debt issued by the leveraged lease trusts is non-recourse to the Corporation. The Corporation has no liquidity exposure to these leveraged lease trusts.
Asset Acquisition Conduits
The Corporation administered two asset acquisition conduits which acquired assets on behalf of the Corporation or its customers. These conduits had total assets of $640 million at December 31, 2010. The conduits were liquidated during 2011. Liquidation of the conduits did not impact the Corporation’s results of operations.
Real Estate Vehicles
The Corporation held investments in unconsolidated real estate vehicles of $5.4 billion at both December 31, 20112012 and 20102011, which consistedprimarily consist of investments in unconsolidated limited partnerships that finance the construction and rehabilitation of affordable rental housing.housing and commercial real estate. An unrelated third party is typically the general partner and has control over the significant activities of the partnership. The Corporation earns a return primarily through the receipt of tax credits allocated to the affordable housing
real estate projects. The Corporation’s risk of loss is mitigated by policies requiring that the project qualify for the expected tax credits prior to making its investment. The Corporation may from time to time be asked to invest additional amounts to support a troubled project. Such additional investments have not been and are not expected to be significant.
Other Asset-backed Financing Arrangements
The Corporation transferred pools of securities to certain independent third parties and provided financing for approximatelyup to 75 percent of the purchase price under asset-backed financing arrangements. At December 31, 20112012 and 20102011, the Corporation’s maximum loss exposure under these financing arrangements was $4.72.5 billion and $6.54.7 billion, substantially all of which waswere classified as loans on the Corporation’s Consolidated Balance Sheet. All principal and interest payments have been received when due in accordance with thetheir contractual terms. These arrangements are not included in the Other VIEs table because the purchasers are not VIEs.
NOTE 98Representations and Warranties Obligations and Corporate Guarantees
Background
The Corporation securitizes first-lien residential mortgage loans generally in the form of MBS guaranteed by the GSEs or by GNMA in the case of FHA-insured, VA-guaranteed and Rural Housing Service-guaranteed mortgage loans. In addition, in prior years, legacy companies and certain subsidiaries sold pools of first-lien residential mortgage loans and home equity loans as private-label securitizations (in certain of these securitizations, monolines or financial guarantee providers insured all or some of the securities), or in the form of whole loans. In connection with these transactions, the Corporation or certain of its subsidiaries or legacy companies make or have made various representations and warranties. These representations and warranties, as set forth in the agreements,
related to, among other things, the ownership of the loan, the validity of the lien securing the loan, the absence of delinquent taxes or liens against the property securing the loan, the process used to select the loan for inclusion in a transaction, the loan’s compliance with any applicable loan criteria, including underwriting standards, and the loan’s compliance with applicable federal, state and local laws. Breaches of these representations and warranties may result in the requirement to repurchase mortgage loans or to otherwise make whole or provide other remedies to the GSEs, U.S. Department of Housing and Urban Development (HUD)HUD with respect to FHA-insured loans, VA, whole-loan buyers,investors, securitization trusts, monoline insurers or other financial guarantors (collectively, repurchases). In all such cases, the Corporation would be exposed to any credit loss on the repurchased mortgage loans after accounting for any mortgage insurance (MI) or mortgage guarantyguarantee payments that it may receive.
Subject to the requirements and limitations of the applicable sales and securitization agreements, these representations and warranties can be enforced by the GSEs, HUD, VA, the whole-loan buyer,investor, the securitization trustee or others as governed by the applicable agreement or, in certain first-lien and home equity securitizations where monoline insurers or other financial guarantee providers have insured all or some of the securities issued, by the monoline insurer or other financial guarantor.guarantor, where the contract so provides. In the case of loans sold to parties other than the GSEs or GNMA, the contractual liability to repurchase typically arises only if there is a breach of the representations and warranties that materially and adversely affects the interest of the investor, or investors, in the loan, or of the monoline insurer or other financial guarantor (as applicable). in the loan. Contracts with the GSEs do not contain equivalent language, while GNMA generally limits repurchases to loans that are not insured or guaranteed as required. The Corporation
believes that the longer a loan performs prior to default, the less likely it is that an alleged underwriting breach of representations and warranties hadwould have a material impact on the loan’s performance. Historically, most demands for repurchase have occurred within the first several years after origination, generally after a loan has defaulted. However, the time horizon in which repurchase claims are typically brought has lengthened primarily due to a significant increase in GSE claims related to loans where the borrower made at least 25 payments and to loans that had defaulted more than 18 months prior to the claim and to loans where the borrower made at least 25 payments.claim.
The Corporation’s credit loss would be reduced by any recourse it may have to organizations (e.g., correspondents) that, in turn, had sold such loans to the Corporation based upon its agreements with these organizations. When a loan is originated by a correspondent or other third party, the Corporation typically has the right to seek a recovery of related repurchase losses from that originator. Many of the correspondent originators of loans in 2004 through 2008 are no longer in business, or are in a weakened condition, and the Corporation’s ability to recover on valid claims is therefore impacted, or eliminated accordingly. In the event a loan is originated and underwritten by a correspondent who obtains FHA insurance, even if they are no longer in business, any breach of FHA guidelines is the direct obligation of the correspondent, not the Corporation. Generally the volume of unresolved repurchase claims from the FHA and VA for loans in GNMA-guaranteed securities is not significant because the requests are limited in number and are typically resolved quickly. At December 31, 20112012, approximately 2826 percent of the outstanding repurchase claims relate to loans purchased from correspondents or other parties
compared to approximately 2528 percent at December 31, 20102011. During 20112012, the Corporation experienced a decline in recoveriescontinued to recover repurchase losses from correspondents and other parties; however, the actual recovery rate may vary from period to period based upon the underlying mix of correspondents and other parties.
The Corporation currently structures its operations to limit the risk of repurchase and accompanying credit exposure by seeking to ensure consistent production of mortgages in accordance with its underwriting procedures and by servicing those mortgages consistent with its contractual obligations. In addition, certain securitizations include guarantees written to protect certain purchasers of the loans from credit losses up to a specified amount. The fair value of the obligations to be absorbed under the representations and warranties and guarantees provided is recorded as an accrued liability when the loans are sold. This liability for probable losses is updated by accruing a representations and warranties provision in mortgage banking income. This is done throughout the life of the loan, as necessary when additional relevant information becomes available.
The methodology used to estimate the liability for representations and warranties is a function of the representations and warranties given and considers a variety of factors, which include, depending on the counterparty, actual defaults, estimated future defaults, historical loss experience, estimated home prices, other economic conditions, estimated probability that a repurchase claim will be received, including consideration of whether presentation thresholds will be met, number of payments made by the borrower prior to default and estimated probability that a loan will be required to be repurchased. The Corporation also considers bulk settlements when determining its estimated liability for representations and warranties. The estimate of the liability for representations and warranties exposures and the corresponding estimated range of possible loss is based upon currently available information, significant judgment, and a number of factors and assumptions, including those set forth above,discussed under Liability for Representations and Warranties and Corporate Guarantees in this Note, that are subject to change. Changes to any one of these factors could significantly impact the estimate of the liability and could have a material adverse impact
on the Corporation’s results of operations for any particular period. Given that these factors vary by counterparty, the Corporation analyzes representations and warranties obligations based on the specific counterparty, or type of counterparty, with whom the sale was made. Generally the volume of unresolved repurchase claims from the FHA and VA for loans in GNMA-guaranteed securities is not significant because the requests are limited in number and are typically resolved quickly.
Settlement Actions
The Corporation has vigorously contested any request for repurchase when it has concludedconcludes that a valid basis for repurchase does not exist and will continue to do so in the future. However, in an effort to resolve these legacy mortgage-related issues, the Corporation has reached bulk settlements, or agreements for bulk settlements, including settlement amounts which have been material, with counterparties in lieu of a loan-by-loan review process. The Corporation may reach other settlements in the future if opportunities arise on terms it believes to be advantageousadvantageous. However, there can be no assurance that the Corporation will reach future settlements or, if it does, that the terms of past settlements can be relied upon to predict the Corporation.terms of future settlements. The following provides a summary of the larger bulk settlement actions beginning induring the fourth quarter of 2010 followed by details of the Corporation’s representations and warranties liability, including claims status.past few years.
Fannie Mae Settlement with the Bank of New York Mellon, as Trustee
On June 28, 2011January 6, 2013, the Corporation BAC Home Loans Servicing, LP (BAC HLS, which was subsequently merged with and into BANA in July 2011), and its legacy Countrywide affiliates entered into a settlementan agreement with the Bank of New York Mellon (BNY Mellon), as trustee (the Trustee),FNMA to resolve substantially all outstanding and potential claims related to alleged representations and warranties breaches (including repurchase claims), substantially all historical loan servicing claims and certain other historical claims with respectrelating to the origination, sale and delivery of residential mortgage loans originated and sold directly to FNMA from 525January 1, 2000 through December 31, 2008 by entities related to legacy Countrywide first-lien and BANA.
five second-lien non-GSE residential mortgage-backed securitization trusts (the Covered Trusts) containingThis agreement covers loans principally originated between 2004 and 2008 for which BNY Mellon acts as trustee or indenture trustee (the BNY Mellon Settlement). The Covered Trusts hadwith an aggregate original principal balance of approximately $424 billion, of which $409 billion was originated between 20041.4 trillion and 2008, and totalan aggregate outstanding principal balance of approximately $300 billion. Unresolved repurchase claims submitted by FNMA for alleged breaches of selling representations and warranties with respect to these loans totaled $12.2 billion of unpaid principal balance at December 31, 2012. This agreement extinguished substantially all of those unresolved repurchase claims, as well as any future representations and warranties repurchase claims associated with such loans, subject to certain exceptions which the Corporation does not expect to be material.
In January 2013, the Corporation made a cash payment to FNMA of $3.6 billion and also repurchased for $6.6 billion certain residential mortgage loans that had defaulted (collectively unpaid principal balance) of approximately $220 billion at June 28, 2011, ofpreviously been sold to FNMA, which$217 billion was originated between 2004 and 2008. The BNY Mellon Settlement is supported by a group of 22 institutional investors (the Investor Group) and is subject to final court approval and certain other conditions.
The BNY Mellon Settlement provides for a cash payment of $8.5 billion (the Settlement Payment) to the Trustee for distribution to the Covered Trusts after final court approval of the BNY Mellon Settlement. In addition to the Settlement Payment, the Corporation is obligatedhas valued at less than the purchase price.
This agreement also clarified the parties’ obligations with respect to pay attorneys’ feesMI including establishing timeframes for certain payments and costs to the Investor Group’s counsel as well as all feesother actions, setting parameters for potential bulk settlements and expenses incurred by the Trustee related to obtaining final court approval of the BNY Mellon Settlement and certain tax rulings, which are currently estimated at $100 million.
The BNY Mellon Settlement does not cover a small number of legacy Countrywide-issued first-lien non-GSE RMBS transactionsproviding for cooperation in future dealings with loans originated principally between 2004 and 2008 for various reasons, including for example, six legacy Countrywide-
issued first-lien non-GSE RMBS transactions in which BNY Mellon is not the trustee. The BNY Mellon Settlement also does not cover legacy Countrywide-issued second-lien securitization transactions in which a monoline insurer or other financial guarantor provides financial guaranty insurance. In addition, because the settlement is with the Trustee on behalf of the Covered Trusts and releases rights under the governing agreements for the Covered Trusts, the settlement does not release investors’ securities law or fraud claims based upon disclosures made in connection with their decision to purchase, sell or hold securities issued by the Covered Trusts. To date, various investors, including certain members of the Investor Group, are pursuing securities law or fraud claims related to one or more of the Covered Trusts. The Corporation is not able to determine whether any additional securities law or fraud claims will be made by investors in the Covered Trusts. For information about mortgage-related securities law or fraud claims, see Litigation and Regulatory Matters in Note 14 – Commitments and Contingencies. For those Covered Trusts where a monoline insurer or other financial guarantor has an independent right to assert repurchase claims directly, the BNY Mellon Settlement does not release such insurer’s or guarantor’s repurchase claims.
Under an order entered by the court in connection with the BNY Mellon Settlement, potentially interested persons had the opportunity to give notice of intent to object to the settlement (including on the basis that more information was needed) until August 30, 2011. Approximately 44 groups or entities appeared prior to the deadline; two of those groups or entities have subsequently withdrawn from the proceeding and one motion to intervene was denied. Certain of these groups or entities filed notices of intent to object, made motions to intervene, or both filed notices of intent to object and made motions to intervene. The parties filing motions to intervene include the Attorneys General of the states of New York and Delaware, whose motions to intervene were granted. Parties who filed notices stating that they wished to obtain more information about the settlement include the Federal Deposit Insurance Corporation (FDIC) and the Federal Housing Finance Agency (FHFA). Bank of America is not a party to the proceeding.
Certain of the motions to intervene and/or notices of intent to object allege various purported bases for opposition to the settlement, including challenges to the nature of the court proceeding and the lack of an opt-out mechanism, alleged conflicts of interest on the part of the Investor Group and/or the Trustee, the inadequacy of the settlement amount and the method of allocating the settlement amount among the Covered Trusts, while other motions do not make substantive objections but state that they need more information about the settlement. An investor opposed to the settlement removed the proceeding to federal court. On October 19, 2011, the federal court denied BNY Mellon’s motion to remand the proceeding to state court. BNY Mellon, as well as the investors that have intervened in support of the BNY Mellon Settlement, petitioned to appeal the denial of this motion. On November 4, 2011, the district court entered a written order setting a discovery schedule, and discovery is ongoing. On December 27, 2011, the U.S. Court of Appeals for the Second Circuit accepted the appeal and stated in an amended scheduling order that, pursuant to statute, it would rule on the appeal by February 27, 2012.
It is not currently possible to predict how many of the parties who have appeared in the court proceeding will ultimately object to the BNY Mellon Settlement, whether the objections will prevent receipt of final court approval or the ultimate outcome of the court
|
| | |
206212 Bank of America 20112012
| | |
approval process, which can include appeals and could takemortgage insurers. For additional information, see Mortgage Insurance Rescission Notices in this Note.
In addition, pursuant to a substantial period of time. In particular, conduct of discovery and the resolution of the objections to the settlement and any appeals could take a substantial period of time and these factors could materially delay the timing of final court approval. Accordingly, it is not possible to predict when the court approval process will be completed.
If final court approval is not obtained by December 31, 2015,separate agreement, the Corporation settled substantially all of FNMA’s outstanding and legacy Countrywide may withdraw fromfuture claims for compensatory fees arising out of past foreclosure delays.
Collectively, these agreements are the BNY MellonFNMA Settlement.
Monoline Settlements
Syncora Settlement if the Trustee consents. The BNY Mellon Settlement also provides that if Covered Trusts representing unpaid principal balance exceeding a specified amount are excluded from the final BNY Mellon Settlement, based on investor objections or otherwise,
On July 17, 2012, the Corporation entered into a settlement with a monoline insurer, Syncora Guarantee Inc. and legacy Countrywide have the optionSyncora Holdings, Ltd. (Syncora), to withdraw from the BNY Mellon Settlement pursuantresolve all of Syncora’s outstanding and potential claims related to the terms of the BNY Mellon Settlement agreement.
There can be no assurance that final court approval of the settlement will be obtained, that all conditions to the BNY Mellon Settlement will be satisfied or, if certain conditions to the BNY Mellon Settlement permitting withdrawal are met, that the Corporation and legacy Countrywide will not determine to withdraw from the settlement. If final court approval is not obtained or if the Corporation and legacy Countrywide determine to withdraw from the BNY Mellon Settlement in accordance with its terms, the Corporation’s futurealleged representations and warranties losses could be substantially different than existing accrualsbreaches involving eight first- and the estimated range of possible loss over existing accruals described under Whole Loan Sales and Private-label Securitizations Experiencesix on pagesecond-lien private-label securitization trusts where it provided financial guarantee insurance. The settlement covers private-label securitization trusts that had an original principal balance of first-lien mortgages of approximately 212$9.6 billion and second-lien mortgages of approximately $7.7 billion. The settlement provided for a cash payment of $375 million to Syncora and other transactions to terminate certain other relationships among the parties.
Settlement with Assured Guaranty
On April 14, 2011, the Corporation, including its legacy Countrywide affiliates, entered into an agreementa settlement with Assured Guaranty to resolve all of the monoline insurer’sAssured Guaranty’s outstanding and potential repurchase claims related to alleged representations and warranties breaches involving 2921 first- andeight second-lien RMBS trusts where Assured Guaranty provided financial guarantee insurance (the Assured Guaranty Settlement).insurance. The agreement alsosettlement resolves historical loan servicing issues and other potential liabilities with respect to thesethose trusts. The agreementsettlement covers21 first-lien RMBS trusts and eight second-lien RMBS trusts, whichthat had an original principal balance of approximately $35.8 billion and total unpaid principal balance of approximately $20.2 billion as of April 14, 2011.2011. The agreement includedsettlement provided for cash payments totaling approximately $1.1 billion to Assured Guaranty, as well as a loss-sharing reinsurance arrangement that hadwith an expected value of approximately $470 million at the time of the settlement and other terms, including termination of certain derivative contracts. During 2011, the Corporation made cash payments of $1.0 billion with the remaining $57 million payable on March 31, 2012. The total cost recognized for the Assured Guaranty Settlement as of December 31, 2011 was approximately $1.6 billion. As a result of this agreement,the settlement, the Corporation recorded$2.2 billion in consumer loans and the related trust debt on its Consolidated Balance Sheet at December 31, 2011, due to the
establishment of reinsurance contracts at the time of the Assured Guarantysettlement. The amount of these consumer loans and the related trust debt was $900 million and $2.2 billion at December 31, 2012 and 2011.
Settlement with the Bank of New York Mellon, as Trustee
On June 28, 2011, the Corporation, BAC Home Loans Servicing, LP (BAC HLS, which was subsequently merged with and into BANA in July 2011), and its legacy Countrywide affiliates entered into a settlement agreement with Bank of New York Mellon (BNY Mellon) as trustee (the Trustee), to resolve all outstanding and potential claims related to alleged representations and warranties breaches (including repurchase claims), substantially all historical loan servicing claims and certain other historical claims with respect to 525 legacy Countrywide first-lien and five second-lien non-GSE residential mortgage-backed securitization trusts (the Covered Trusts) containing loans principally originated between 2004 and 2008 for which BNY Mellon acts as trustee or indenture trustee (BNY Mellon Settlement). The Covered Trusts had an original
principal balance of approximately $424 billion, of which $409 billion was originated between 2004 and 2008, and total outstanding principal and unpaid principal balance of loans that had defaulted (collectively unpaid principal balance) of approximately $220 billion at June 28, 2011, of which $217 billion was originated between 2004 and 2008. The BNY Mellon Settlement is supported by a group of 22 institutional investors (the Investor Group) and is subject to final court approval and certain other conditions.
The BNY Mellon Settlement provides for a cash payment of $8.5 billion (the Settlement Payment) to the Trustee for distribution to the Covered Trusts after final court approval of the BNY Mellon Settlement. In addition to the Settlement Payment, the Corporation is obligated to pay attorneys’ fees and costs to the Investor Group’s counsel as well as all fees and expenses incurred by the Trustee related to obtaining final court approval of the BNY Mellon Settlement and certain tax rulings, which are currently estimated at $100 million.
The BNY Mellon Settlement does not cover a small number of legacy Countrywide-issued first-lien non-GSE RMBS transactions with loans originated principally between 2004 and 2008 for various reasons, including for example, six legacy Countrywide-issued first-lien non-GSE RMBS transactions in which BNY Mellon is not the trustee. The BNY Mellon Settlement also does not cover legacy Countrywide-issued second-lien securitization transactions in which a monoline insurer or other financial guarantor provides financial guaranty insurance. In addition, because the settlement is with the Trustee on behalf of the Covered Trusts and releases rights under the governing agreements for the Covered Trusts, the settlement does not release investors’ securities law or fraud claims based upon disclosures made in connection with their decision to purchase, sell or hold securities issued by the Covered Trusts. To date, various investors, including certain members of the Investor Group, are pursuing securities law or fraud claims related to one or more of the Covered Trusts. The Corporation is not able to determine whether any additional securities law or fraud claims will be made by investors in the Covered Trusts. For information about mortgage-related securities law or fraud claims, see Litigation and Regulatory Matters in Note 13 – Commitments and Contingencies. For those Covered Trusts where a monoline insurer or other financial guarantor has an independent right to assert repurchase claims directly, the BNY Mellon Settlement does not release such insurer’s or guarantor’s repurchase claims.
Under an order entered by the court in connection with the BNY Mellon Settlement, potentially interested persons had the opportunity to give notice of intent to object to the settlement (including on the basis that more information was needed) until August 30, 2011. Approximately 44 groups or entities appeared prior to the deadline; seven of those groups or entities have subsequently withdrawn from the proceeding and one motion to intervene was denied. Certain of these groups or entities filed notices of intent to object, made motions to intervene, or both filed notices of intent to object and made motions to intervene. The parties filing motions to intervene include the Attorneys General of the states of New York and Delaware, whose motions to intervene were granted. Parties who filed notices stating that they wished to obtain more information about the settlement include the Federal Deposit Insurance Corporation (FDIC) and the Federal Housing Finance Agency (FHFA). Bank of America is not a party to the proceeding.
Certain of the motions to intervene and/or notices of intent to object allege various purported bases for opposition to the settlement, including challenges to the nature of the court proceeding and the lack of an opt-out mechanism, alleged conflicts of interest on the part of the Investor Group and/or the Trustee, the inadequacy of the settlement amount and the method of allocating the settlement amount among the Covered Trusts, while other motions do not make substantive objections but state that they need more information about the settlement.
It is not currently possible to predict how many parties who have appeared in the court proceeding will ultimately object to the BNY Mellon Settlement, whether the objections will prevent receipt of final court approval or the ultimate outcome of the court approval process, which can include appeals and could take a substantial period of time. On August 10, 2012, the Court issued an order setting a schedule for discovery and other proceedings, and setting May 30, 2013 as the date for the final court hearing on the settlement to begin. However, there may be changes to the schedule for the final court hearing and any appeals could take a substantial period of time. Accordingly, it is not possible to predict when the court approval process will be completed.
If final court approval is not obtained by December 31, 2015, the Corporation and legacy Countrywide may withdraw from the BNY Mellon Settlement, if the Trustee consents. The BNY Mellon Settlement also provides that if Covered Trusts holding loans with an unpaid principal balance exceeding a specified amount are excluded from the final BNY Mellon Settlement, based on investor objections or otherwise, the Corporation and legacy Countrywide have the option to withdraw from the BNY Mellon Settlement pursuant to the terms of the BNY Mellon Settlement agreement.
There can be no assurance that final court approval of the settlement will be obtained, that all conditions to the BNY Mellon Settlement will be satisfied or, if certain conditions to the BNY Mellon Settlement permitting withdrawal are met, that the Corporation and legacy Countrywide will not withdraw from the settlement. If final court approval is not obtained or if the Corporation and legacy Countrywide withdraw from the BNY Mellon Settlement in accordance with its terms, the Corporation’s future representations and warranties losses could be substantially different than existing accruals and the estimated range of possible loss over existing accruals described under Whole Loan Sales and Private-label Securitizations Experience on page 219.
2010 Government-sponsored Enterprise Agreements
On December 31, 2010, the Corporation reached agreements with the GSEs,FHLMC and FNMA, under which the Corporation paid $2.8 billion to resolve certain repurchase claims involving first-lien residential mortgage loans sold directly to the GSEs by entities related to legacy Countrywide (the 2010 GSE Agreements). The agreement with FHLMC extinguished all outstanding and potential mortgage repurchase and make-whole claims arising out of any alleged breaches of selling representations and warranties related to loans sold directly by legacy Countrywide to FHLMC through 2008, subject to certain exceptions. The agreement with FNMA substantially resolved the existing pipeline of repurchase claims outstanding as of September 20, 2010 arising out of alleged breaches of selling representations and warranties related to loans sold directly by legacy Countrywide to FNMA. The 2010 GSE Agreements did not cover outstanding and potential mortgage repurchase claims arising out of any alleged breaches of selling representations and warranties related to legacy Bank of America first-lien residential mortgage loans sold directly to the GSEs or
other loans sold directly to the GSEs other than described above, loan servicing obligations, other contractual obligations or loans contained in private-label securitizations.
OutstandingUnresolved Repurchase Claims
The Outstanding Claims by Counterparty and Product table presents outstandingUnresolved representations and warranties repurchase claims represent the notional amount of repurchase claims made by counterparties, typically the outstanding principal balance or the unpaid principal balance at the time of default. In the case of first-lien mortgages, the claim amount is often significantly greater than the expected loss amount due to the benefit of collateral and, in some cases, MI or mortgage guarantee payments. Claims received from a counterparty remain outstanding until the underlying loan is repurchased, the claim is rescinded by the counterparty, or the claim is otherwise resolved. When a claim is denied and product typethe Corporation does not receive a response from the counterparty, the claim remains in the unresolved repurchase claims balance until resolution.
The table below presents unresolved repurchase claims at December 31, 2012 and 2011 and 2010. The unresolved repurchase claims include only claims where the Corporation believes that the counterparty has a basis to submit claims. For additional information, see Whole Loan Sales and Private-label Securitizations Experience on page 212 of in this Note and Note 1413 – Commitments and Contingencies. These repurchase claims include $1.7 billion in demands from investors in the Covered Trusts received in 2010, but otherwise do not include any repurchase claims related to the BNY Mellon Settlement regarding the Covered Trusts. During 2011, the Corporation received $17.5 billion in new repurchase claims, including $14.3 billion in new repurchase claims submitted by the GSEs for both legacy Countrywide originations not covered by the GSE Agreements and legacy Bank of America originations, and $3.2 billion in repurchase claims related to non-GSE transactions. During 2011, $14.1 billion in claims were resolved primarily with the GSEs and through the Assured Guaranty Settlement. Of the claims resolved, $7.5 billion were resolved through rescissions and $6.6 billion were resolved through mortgage repurchase and make-whole payments. Claims outstanding from the monolines declined as a result of the Assured Guaranty Settlement, and new claims from other monolines declined significantly during 2011, which the Corporation believes was due in part to the monolines focusing recent efforts towards litigation. Outstanding claims from whole loan, private-label securitization and other investors increased during 2011 primarily as a result of the increase in repurchase claims received from trustees in non-GSE transactions.
| | | | | | | | | |
| Outstanding Claims by Counterparty and Product | |
| Unresolved Repurchase Claims by Counterparty and Product Type | | Unresolved Repurchase Claims by Counterparty and Product Type |
| | | | | | | |
| | December 31 | December 31 |
| (Dollars in millions) | 2011 | | 2010 | 2012 | | 2011 |
By counterparty (1) | |
| | |
| |
By counterparty (1, 2) | | |
| | |
|
GSEs | $ | 6,258 |
| | $ | 2,821 |
| $ | 13,530 |
| | $ | 6,221 |
|
| Monolines | 3,082 |
| | 4,678 |
| 2,449 |
| | 3,082 |
|
Whole loan and private-label securitization investors and other (2) | 4,912 |
| | 3,188 |
| |
| Total outstanding claims by counterparty | $ | 14,252 |
| | $ | 10,687 |
| |
By product type (1) | |
| | |
| |
| Whole-loan investors, private-label securitization trustees, third-party securitization sponsors and other | | 12,299 |
| | 3,304 |
|
Total unresolved repurchase claims by counterparty (3) | | $ | 28,278 |
| | $ | 12,607 |
|
By product type (1, 2) | | |
| | |
|
| Prime loans | $ | 3,928 |
| | $ | 2,040 |
| $ | 8,793 |
| | $ | 3,925 |
|
| Alt-A | 2,333 |
| | 1,190 |
| 5,428 |
| | 2,286 |
|
| Home equity | 2,872 |
| | 3,658 |
| 2,394 |
| | 2,872 |
|
| Pay option | 3,588 |
| | 2,889 |
| 5,884 |
| | 1,993 |
|
| Subprime | 891 |
| | 734 |
| 3,687 |
| | 891 |
|
| Other | 640 |
| | 176 |
| 2,092 |
| | 640 |
|
| Total outstanding claims by product type | $ | 14,252 |
| | $ | 10,687 |
| |
Total unresolved repurchase claims by product type (3) | | $ | 28,278 |
| | $ | 12,607 |
|
| |
(1) | Excludes certain MI rescission notices. However, includesat December 31, 2012 and 2011, included $2.3 billion and $1.2 billion of repurchase requests received from the GSEs that have resulted solely from MI rescission notices. For additional information, see Mortgage Insurance Rescission Notices in this Note. |
| |
(2) | Amounts forAt December 31, 2012 and 2011, unresolved repurchase claims did not include repurchase demands of $1.6 billion and2010 included $1.7 billion in demands contained in correspondence from private-label securitizations investors inwhere the Covered Trusts that doCorporation believes the claimants have not havesatisfied the right to demand repurchasecontractual thresholds as noted on page 215.
|
| |
(3) | As a result of loans directly or the right to access loan files. For additional information, seeFNMA Settlement, Settlement with Bank of New York Mellon, as Trustee$12.2 billion of these claims were resolved in this Note.January 2013. |
The number ofDuring 2012, the Corporation received $22.4 billion in new repurchase claims, asincluding $10.3 billion submitted by FNMA and covered by the FNMA Settlement, $2.3 billion submitted by the GSEs for both legacy Countrywide and legacy Bank of America originations not covered by the 2010 GSE Agreements or the FNMA Settlement, $8.0 billion submitted by private-label securitization trustees, $1.5 billion from whole-loan investors, primarily third-
party securitization sponsors, and $295 million submitted by monolines. During 2012, $6.6 billion in claims were resolved, primarily with the GSEs and through the Syncora Settlement. Of the resolved claims, $4.6 billion were resolved through rescissions and $2.0 billion were resolved through mortgage repurchases and make-whole payments.
The notional amount of unresolved GSE repurchase claims totaled $13.5 billion at December 31, 2012 compared to $6.2 billion at December 31, 2011. As a percentageresult of the numberFNMA Settlement, $12.2 billion of loans purchased arising from loans sourced from brokers or purchased from third-party sellers is relatively consistentGSE repurchase claims outstanding at December 31, 2012 were resolved in January 2013. For further discussion of the Corporation’s experience with the numberGSEs, see Government-sponsored Enterprises Experience in this Note.
The notional amount of unresolved monoline repurchase claims as a percentagetotaled $2.4 billion at December 31, 2012 compared to $3.1 billion at December 31, 2011. The decrease in unresolved repurchase claims was driven by resolution of claims through the Syncora Settlement. The Corporation has had limited loan-level repurchase claims experience with monoline insurers due to ongoing litigation. The Corporation has reviewed and declined to repurchase substantially all of the numberunresolved repurchase claims at December 31, 2012 based on an assessment of whether a breach exists that materially and adversely affected the insurer’s interest in the mortgage loan. Further, in the Corporation’s experience, the monolines have been generally unwilling to withdraw repurchase claims, regardless of whether and what evidence was offered to refute a claim. Substantially all of the unresolved monoline claims pertain to second-lien loans originatedand are currently the subject of litigation. For further discussion of the Corporation’s practices regarding litigation accruals and range of possible loss for litigation and regulatory matters, which includes the status of its monoline litigation, see Estimated Range of Possible Loss in this Note.
The notional amount of unresolved repurchase claims from private-label securitization trustees, third-party securitization sponsors, whole-loan investors and others increased to $12.3 billion at December 31, 2012 compared to $3.3 billion at December 31, 2011. The increase in the notional amount of unresolved repurchase claims is primarily due to increases in the submission of claims by private-label securitization trustees and a third-party securitization sponsor; the level of detail, support and analysis which impacts overall claim quality and, therefore, claims resolution; and the lack of an established process to resolve disputes related to these claims. The Corporation anticipated an increase in aggregate non-GSE claims at the time of the BNY Mellon Settlement in June 2011, and such increase in aggregate non-GSE claims was taken into consideration in developing the increase in the Corporation’s representations and warranties liability at that time. The Corporation expects unresolved repurchase claims related to private-label securitizations to continue to increase as claims continue to be submitted by private-label securitization trustees and third-party securitization sponsors, and there is not an established process for the ultimate resolution of claims on which there is a disagreement. For further discussion of the Corporation’s experience with whole loans and private-label securitizations, see Whole Loan Sales and Private-label Securitizations Experience in this Note.
In addition to the total unresolved repurchase claims, the Corporation has received repurchase demands from private-label securitization investors and a master servicer where it believes the claimants have not satisfied the contractual thresholds to direct the securitization trustee to take action and/or its subsidiariesthat these
demands are otherwise procedurally or legacy companies.substantively invalid. The total amounts outstanding of such demands were $1.6 billion and $1.7 billion at December 31, 2012 and 2011. At December 31, 2011, the $1.7 billion of demands outstanding were related to Covered Trusts in the BNY Mellon Settlement of which $1.4 billion were subsequently resolved through the July 2012 dismissal of a lawsuit brought by Walnut Place (11 entities with the common name Walnut Place, including Walnut Place LLC, and Walnut Place II LLC through Walnut Place XI LLC). Additional demands totaling $1.3 billion were received during 2012. The Corporation does not believe that the $1.6 billion in demands outstanding at December 31, 2012 are valid repurchase claims, and therefore it is not possible to predict the resolution with respect to such demands.
Mortgage Insurance Rescission Notices
In addition to repurchase claims, the Corporation receives notices from mortgage insurance companies of claim denials, cancellations or coverage rescission (collectively, MI rescission notices) and the amountnumber of such notices havehas remained elevated. By way of background, MI compensates lenders or investors for certain losses resulting from borrower default on a mortgage loan. When there is disagreement with the mortgage insurer as to the resolution of a MI rescission notice, meaningful dialogue and negotiation between the mortgage insurance company and the Corporation are generally necessary between the parties to reach a conclusionresolution on an individual notice. The level of engagement of the mortgage insurance companies varies and on-goingongoing litigation involving some of the mortgage insurance companies over individual and bulk rescissions or claims for rescission limits the ability of the Corporation to engage in constructive dialogue leading to resolution.
For loans sold to GSEs or private-label securitization trusts (including those wrapped by the monoline bond insurers), when the Corporation receives a MI rescission notice from a mortgage insurance company, it may give rise to a claim for breach of the applicable representations and warranties from the GSEs or private-label securitization trusts, depending on the governing sales contracts. In those cases where the governing contract contains a MI-related representationrepresentations and warrantywarranties, which upon rescission requires the Corporation to repurchase the affected loan or indemnify the investor for the related loss, the Corporation realizes the loss without the benefit of MI. IfSee below for a discussion of the Corporation is required to repurchase a loan or indemnifyimpact of the investor as a result of a different breach of representations and warranties and there has been a MI rescission, or if the Corporation holds the loan for investment, it realizes the loss without the benefit of MI.FNMA Settlement. In addition, mortgage insurance companies have in some cases asserted the ability to curtail MI payments as a result of alleged foreclosure delays, which in these casesif successful, would reduce the MI proceeds available to reduce the loss on the loan. While a legitimate MI rescission may constitute a valid basis for repurchase or other remedies under the GSE agreements and a
small number of private-label MBS securitizations, and a MI rescission notice may result in a repurchase request,At December 31, 2012, the Corporation believeshad approximately 110,000 open MI rescission notices compared to 90,000 at December 31, 2011, including 49,000 pertaining principally to first-lien mortgages serviced for others, 11,000 pertaining to loans held-for-investment, and 50,000 pertaining to ongoing litigation for second-lien mortgages. Approximately 27,000 of the open MI rescission notices pertaining to first-lien mortgages serviced for others are related to loans sold to FNMA. As of December 31, 2012, 32 percent of the MI rescission notices received have been resolved. Of those resolved, 20 percent were resolved through the Corporation’s acceptance of the MI rescission, 58 percent were resolved through reinstatement of coverage or payment of the claim by the mortgage insurance company, and 22 percent were resolved on an aggregate basis through settlement, policy
commutation or similar arrangement. As of December 31, 2012, 68 percent of the MI rescission notices the Corporation has received have not yet been resolved. Of those not yet resolved, 46 percent are implicated by ongoing litigation where no loan-level review is currently contemplated nor required to preserve the Corporation’s legal rights. In this litigation, the litigating mortgage insurance companies are also seeking bulk rescission of certain policies, separate and apart from loan-by-loan denials or rescissions. The Corporation is in the process of reviewing 37 percent of the remaining open MI rescission notices, and it has reviewed and is contesting the MI rescission with respect to 63 percentof themselvesthese remaining open MI rescission notices. Of the remaining open MI rescission notices, 40 percent are also the subject of ongoing litigation; although, at present, these MI rescissions are being processed in a manner generally consistent with those not valid repurchase requests.affected by litigation.
On June 30,In addition to the discussion above, the FNMA Settlement resolved significant representations and warranties exposures including unresolved and potential repurchase claims from FNMA resulting solely from MI rescission notices relating to loans covered by the FNMA Settlement. The Corporation’s pipeline of unresolved repurchase claims from the GSEs resulting solely from MI rescission notices increased to $2.3 billion at December 31, 2012 from $1.2 billion at December 31, 2011. The FNMA Settlement resolved approximately $1.9 billion of such unresolved repurchase claims. In 2011, FNMA issued an announcement requiring servicers to report effective October 1, 2011, all MI rescissions, cancellations and claim denials (together, rescissions)rescission notices with respect to loans sold to FNMA. The announcement alsoFNMA and confirmed FNMA’s view of its position that a mortgage insurance company’s issuance of a MI rescission notice in and of itself constitutes a breach of the lender’s representations and warranties and permits FNMA to require the lender to repurchase the mortgage loan or promptly remit a make-whole payment covering FNMA’s loss even if the lender is contesting the MI rescission notice. A related announcement included a ban on bulk settlements with mortgage insurers that provide for loss sharing in lieu of rescission. According to FNMA’s announcement, through June 30, 2012, lenders have 90 days to appeal FNMA’s repurchase request and 30 days (or such other time frame specified by FNMA) to appeal after that date. According to FNMA’s announcement, in order to be successful in its appeal, a lender must provide documentation confirming reinstatement or continuation of coverage. This announcement could result in more repurchase requests from FNMA than the assumptions in the Corporation’s estimated liability contemplate. The Corporation also expects that in many cases (particularly in the context of individual or bulk rescissions being contested through litigation), it will not be able to resolve MI rescission notices with the mortgage insurance companies before the expiration of the appeal period prescribed by the FNMA announcement. The Corporation hashad informed FNMA that it doesdid not believe that the new policy iswas valid under its contracts with FNMA. The parties resolved this and other MI-related issues as part of the FNMA Settlement, which clarified the parties’ obligations with respect to MI including establishing timeframes for certain payments and that it does not intend to repurchase loans underother actions, setting parameters for
potential bulk settlements and providing for cooperation in future dealings with mortgage insurers. As a result, the terms set forth in the new policy. The Corporation’s pipeline of outstanding repurchase claims from the GSEs resulting solely on MI rescission notices has increased during 2011 by $935 million to $1.2 billion at December 31, 2011. If it isCorporation will be required to abide byremit to FNMA the termsamount of the new FNMA policy, the Corporation’s representations and warranties liability will likely increase.
At December 31, 2011, the Corporation had approximately 90,000 opencertain MI rescission notices compared to 72,000 at December 31, 2010. Through December 31, 2011, 26 percentcoverage as a result of the MI rescission notices received have been resolved. Of those resolved, 24 percent were resolved through the Corporation’s acceptanceclaims rescissions in advance of the MI rescission, 46 percent were resolved through reinstatement of coverage or payment of the claim bycollection from the mortgage insurance company,companies and, 30 percent were resolved on an aggregate basis through settlement, policy commutation or similar arrangement. As of December 31, 2011, 74 percent ofin certain cases, it may not ultimately collect all such amounts from the MI rescission notices the Corporation has received have not yet been resolved. Of those not yet resolved, 48 percent are implicated by ongoing litigation where no loan-level review is currently contemplated (nor required to preserve the Corporation’s legal rights). In this litigation, the litigating mortgage insurance companies are also seeking bulk rescission of certain policies, separate and apart from loan-by-loan denials or rescissions. The Corporation is in the process of reviewing 11 percent of the remaining open MI rescission notices, and the Corporation has reviewed and is contesting the MI rescission with respect to 89 percent of these remaining open MI rescission notices. Of the remaining open MI rescission notices, 29 percent are also the
subject of ongoing litigation although, at present, these MI rescissions are being processed in a manner generally consistent with those not affected by litigation.companies.
Cash Settlements
As presented in the Loan Repurchases and Indemnification Payments table below, during 20112012 and 20102011, the Corporation paid $5.21.8 billion and $5.2 billion to resolve $6.22.1 billion and $6.66.2 billion of repurchase claims through repurchase or reimbursement to the investor or securitization trust for losses they incurred, resulting in a loss on the related loans at the time of repurchase or reimbursement of $3.5 billion847 million and $3.5 billion. Cash paid for loan repurchases includes the unpaid principal balance of the loan plus past due interest. The amount of loss for loan repurchases is reduced by the fair value of the underlying loan collateral. The repurchase of loans and indemnification payments related to first-lien and home equity repurchase claims generally resulted from material breaches of representations and warranties related to
the loans’ material compliance with the applicable underwriting standards, including borrower misrepresentation, credit exceptions without sufficient compensating factors and non-compliance with underwriting procedures. The actual representations and warranties made in a sales transaction and the resulting repurchase and indemnification activity can vary by transaction or investor. A direct relationship between the type of defect that causes the breach of representations and warranties and the severity of the realized loss has not been observed. Transactions to repurchase or indemnification payments related to first-lien residential mortgages primarily involved the GSEs while transactions to repurchase or indemnification payments for home equity loans primarily involved the monoline insurers. In addition toThe amounts shown in the amounts previously discussed, the Corporation paidtable below do not include $1.01.8 billion during 2011in payments to Assured Guaranty as part of the Assured Guaranty Settlement.settle monoline claims. The table below presents first-lien and home equity loan repurchases and indemnification payments for 20112012 and 20102011.
| | | | | | | | | | | | | | | | | | | | | | | | | |
Loan Repurchases and Indemnification Payments | | | | | | | | | | | | | | | | | | | | | | | | |
| | December 31 | December 31 |
| | 2011 | | 2010 | 2012 | | 2011 |
| (Dollars in millions) | Unpaid
Principal
Balance | | Cash Paid for
Repurchases | | Loss | | Unpaid
Principal
Balance | | Cash Paid for
Repurchases | | Loss | Unpaid
Principal
Balance | | Cash Paid for
Repurchases | | Loss | | Unpaid
Principal
Balance | | Cash Paid for
Repurchases | | Loss |
| First-lien | |
| | |
| | |
| | |
| | |
| | |
| |
| | |
| | |
| | |
| | |
| | |
|
| Repurchases | $ | 2,713 |
| | $ | 3,067 |
| | $ | 1,346 |
| | $ | 2,557 |
| | $ | 2,799 |
| | $ | 1,142 |
| $ | 1,184 |
| | $ | 1,273 |
| | $ | 389 |
| | $ | 2,713 |
| | $ | 3,067 |
| | $ | 1,346 |
|
| Indemnification payments | 3,329 |
| | 2,026 |
| | 2,026 |
| | 3,785 |
| | 2,173 |
| | 2,173 |
| 831 |
| | 425 |
| | 425 |
| | 3,329 |
| | 2,026 |
| | 2,026 |
|
| Total first-lien | 6,042 |
| | 5,093 |
| | 3,372 |
| | 6,342 |
| | 4,972 |
| | 3,315 |
| 2,015 |
| | 1,698 |
| | 814 |
| | 6,042 |
| | 5,093 |
| | 3,372 |
|
| Home equity | |
| | |
| | |
| | |
| | |
| | |
| |
| | |
| | |
| | |
| | |
| | |
|
| Repurchases | 28 |
| | 28 |
| | 14 |
| | 78 |
| | 86 |
| | 44 |
| 24 |
| | 24 |
| | — |
| | 28 |
| | 28 |
| | 14 |
|
| Indemnification payments | 99 |
| | 99 |
| | 99 |
| | 149 |
| | 146 |
| | 146 |
| 36 |
| | 33 |
| | 33 |
| | 99 |
| | 99 |
| | 99 |
|
| Total home equity | 127 |
| | 127 |
| | 113 |
| | 227 |
| | 232 |
| | 190 |
| 60 |
| | 57 |
| | 33 |
| | 127 |
| | 127 |
| | 113 |
|
| Total first-lien and home equity | $ | 6,169 |
| | $ | 5,220 |
| | $ | 3,485 |
| | $ | 6,569 |
| | $ | 5,204 |
| | $ | 3,505 |
| $ | 2,075 |
| | $ | 1,755 |
| | $ | 847 |
| | $ | 6,169 |
| | $ | 5,220 |
| | $ | 3,485 |
|
Liability for Representations and Warranties and Corporate Guarantees
The liability for representations and warranties and corporate guarantees is included in accrued expenses and other liabilities on the Corporation’s Consolidated Balance Sheet and the related
provision is included in mortgage banking income (loss). The Representations and Warranties and Corporate Guarantees table presents a rollforward of the liability for representations and warranties and corporate guarantees.
|
| | | | | | | |
| | | | |
| Representations and Warranties and Corporate Guarantees |
| | | | |
| (Dollars in millions) | 2011 | | 2010 |
| Liability for representations and warranties and corporate guarantees, beginning of year | $ | 5,438 |
| | $ | 3,507 |
|
| Additions for new sales | 20 |
| | 30 |
|
| Charge-offs | (5,191 | ) | | (4,803 | ) |
| Provision | 15,591 |
| | 6,785 |
|
| Other | — |
| | (81 | ) |
| Liability for representations and warranties and corporate guarantees, December 31 | $ | 15,858 |
| | $ | 5,438 |
|
The liability for representations and warranties is established when those obligations are both probable and reasonably estimable. For
The Corporation’s estimated liability at 2011December 31, 2012, the provision for obligations under representations and warranties and corporate guarantees was $15.6 billion comparedgiven to $6.8 billion in 2010. Of the$15.6 billion provision recorded in 2011, $8.6 billion was attributable to the BNY Mellon Settlement and $7.0 billion was related to other exposures. The BNY Mellon Settlement led to the determination that the Corporation has sufficient experience to record a liability related to its exposure on certain other private-label securitizations. This determination combined with higher estimated GSE repurchase rates were the primary drivers of the balance of the provision in 2011. GSE repurchase rates increased driven by higher than expected claims during 2011, including claims on loans that defaulted more than 18 months prior to the repurchase request and on loans where the borrower has made a significant number of payments (e.g., at least 25 payments), in each case in numbers that were not expected based on historical claims.
|
| | |
216 Bank of America 2012 | | Bank of America209
|
Estimated RangeGSEs and the corresponding estimated range of Possible Loss
Government-sponsored Enterprises
The Corporation’s estimated provisionpossible loss is primarily driven by the FNMA Settlement and liability at December 31, 2011, for obligations under representations and warranties given to the GSEsalso considers, among other things, and is necessarily dependent on, and limited by, its historical claims experience with the GSEs. It includes the Corporation’s understanding of its agreements with the GSEs and projections of future defaults as well as certain other assumptions and judgmental factors. The Corporation’s estimate of the liability for these obligations has been accounted for in the recorded liability for representations and warranties for these loans. In recent periods, the Corporation has been experiencing elevated levels of new claims from the GSEs, including claims on loans on which borrowers have made a significant number of payments (e.g., at least 25 payments) or on loans which had defaulted more than 18 months prior to the repurchase request, in each case in numbers that were not expected based on historical experience. The criteria by which the GSEs are ultimately willing to resolve claims have changed in ways that are unfavorable to the Corporation. While the Corporation is seeking to resolve its differences with the GSEs concerning each party’s interpretation of the requirements of the governing contracts, whether it will be able to achieve a resolution of these differences on acceptable terms and timing thereof, is subject to significant uncertainty. The Corporation intends repurchase loans to the extent required under the contracts and standards that govern its relationships with the GSEs.
The Corporation is not able to predict changes in the behavior of the GSEs based on the Corporation’s past experiences. Therefore, it is not possible to reasonably estimate a possible loss or range of possible loss with respect to any such potential impact in excess of current accrued liabilities.
Counterparties other than Government-sponsored Enterprises
The population of private-label securitizations included in the BNY Mellon Settlement encompasses almost all legacy Countrywide first-lien private-label securitizations including loans originated principally in the 2004 through 2008 vintage. For the remainder of the population of private-label securitizations, the Corporation believes it is probable that other claimants in certain types of securitizations may come forward with claims that meet the requirements of the terms of the securitizations. The Corporation has seen an increased trend in requests for loan files from private-label securitization trustees and an increase in repurchase claims from private-label securitization trustees that meet required standards. The Corporation believes that the provisions recorded in connection with the BNY Mellon Settlement and the additional non-GSE representations and warranties provisions recorded in 2011 have provided for a substantial portion of the Corporation’s non-GSE representations and warranties exposures. However, it is reasonably possible that future representations and warranties losses may occur in excess of the amounts recorded for these exposures. In addition, as discussed below, the Corporation has not recorded any representations and warranties liability for certain potential monoline exposures and certain potential whole-loan and other private-label securitization exposures. The Corporation currently estimates that the range of possible loss related to non-GSE representations and warranties exposure as of December 31, 2011, could be up to $5 billion over existing accruals. This
estimated range of possible loss for non-GSE representations and warranties does not represent a probable loss, and is based on currently available information, significant judgment and a number of assumptions, including those set forth below, that are subject to change.
The methodology used to estimate the non-GSE representations and warranties liability and the corresponding range of possible loss considers a variety of factors, including the Corporation’s experience related to actual defaults, projected future defaults, historical loss experience, estimated home prices and other economic conditions. AmongThe methodology also considers such factors as the number of payments made by the borrower prior to default as well as certain other assumptions and judgmental factors. See the Estimated Range of Possible Loss section below for a discussion of the representations and warranties liability and the corresponding estimated range of possible loss.
The Corporation’s estimate of the non-GSE representations and warranties liability and the corresponding range of possible loss considers, among other things, repurchase experience based on the BNY Mellon Settlement, adjusted to reflect differences between the Covered Trusts and the remainder of the population of private-label securitizations, and assumes that the conditions to the BNY Mellon Settlement will be met. Since the non-GSE securitization trusts that were included in the BNY Mellon Settlement differ from those that were not included in the BNY Mellon Settlement, the Corporation adjusted the repurchase experience implied in the settlement in order to determine the estimated non-GSE representations and warranties liability and the corresponding range of possible loss. The judgmental adjustments made include consideration of the differences in the mix of products in the subject securitizations, loan originator, likelihood of claims expected, the differences in the number of payments that the borrower has made prior to default and the sponsor of the securitizations. Where relevant, the Corporation also takes into account more recent experience, such as increased claims and other facts and circumstances, such as bulk settlements, as the Corporation believes appropriate.
Additional factors that impact the non-GSE representations and warranties liability and the correspondingportion of the estimated range of possible loss are:corresponding to non-GSE representations and warranties exposures include: (1) contractual material adverse effect requirements,requirements; (2) the representations and warranties providedprovided; and (3) the requirement to meet certain presentation thresholds. The first factor is based on the Corporation’s belief that a non-GSE contractual liability to repurchase a loan generally arises only if the counterparties prove there is a breach of representations and warranties that materially and adversely affects the interest of the investor or all investors, or of the monoline insurer or other financial guarantor (as applicable), in a securitization trust and, accordingly, the Corporation believes that the repurchase claimants must prove that the alleged representations and warranties breach was the cause of the loss. The second factor is related tobased on the fact that non-GSE securitizations include differentdifferences in the types of representations and warranties thangiven in non-GSE securitizations from those provided to the GSEs. The Corporation believes the non-GSE securitizations’ representations and warranties are less rigorous and actionable than the explicit provisions of comparable agreements with the GSEs without regard to any variations that may have arisen as a result of dealings with the GSEs. The third factor is related to the fact that certain presentation thresholds that need to be met in order for any repurchase claim to be asserted on the initiative of investors under the non-GSE agreements. A securitization trustee may investigate or demand repurchase on its own action, and most agreements contain a presentation threshold, for example 25 percent of the voting rights per trust, that allows investors to declare a servicing event of default under
certain circumstances or to request certain action, such as requesting loan files, that the trustee may choose to accept and follow, exempt from liability, provided the trustee is acting in good faith. If there is an uncured servicing event of default and the trustee fails to bring suit during a 60-day60-day period, then, under most agreements, investors may file suit. In addition to this, most agreements also allow investors to direct the securitization trustee to investigate loan files or demand the repurchase of loans if security holders hold a specified percentage, for example, 25 percent, of the voting rights of each tranche of the outstanding securities. Although the Corporation continues to believe that presentation thresholds are a factor in the determination of probable loss, given the BNY Mellon Settlement, the estimated range of possible loss assumes that the presentation threshold can be met for all of the non-GSE securitization transactions.
In addition, in the case The population of private-label securitizations the methodology used to estimate the non-GSE representations and warranties liability and the corresponding range of possible loss considers the implied repurchase experience based on the BNY Mellon Settlement and assumes that the conditions to the BNY Mellon Settlement are satisfied. Since the non-GSE transactions that were included in the BNY Mellon Settlement differ from thoseencompasses almost all legacy Countrywide first-lien private-label securitizations including loans originated principally between 2004 and 2008. For the remainder of the population of private-label securitizations, other claimants have come forward and the Corporation believes it is probable that were notother claimants in certain types of securitizations may continue to come forward with claims that meet the requirements of the terms of the securitizations.
The table below presents a rollforward of the liability for representations and warranties and corporate guarantees.
|
| | | | | | | |
| | | | |
| Representations and Warranties and Corporate Guarantees |
| | | | |
| (Dollars in millions) | 2012 | | 2011 |
| Liability for representations and warranties and corporate guarantees, January 1 | $ | 15,858 |
| | $ | 5,438 |
|
| Additions for new sales | 28 |
| | 20 |
|
| Charge-offs | (804 | ) | | (5,191 | ) |
| Provision | 3,939 |
| | 15,591 |
|
| Liability for representations and warranties and corporate guarantees, December 31 | $ | 19,021 |
| | $ | 15,858 |
|
For 2012, the provision for representations and warranties and corporate guarantees was $3.9 billion compared to $15.6 billion for 2011. The provision in 2012 included $2.5 billionin provision related to the FNMA Settlement and $500 million for obligations to FNMA related to MI rescissions. The provision in 2011 included $8.6 billion in provision and other expenses related to the BNY Mellon Settlement to resolve nearly all of the legacy Countrywide-issued first-lien non-GSE repurchase exposures, and $7.0 billion in provision related to other non-GSE, and to a lesser extent, GSE exposures.
Estimated Range of Possible Loss
The representations and warranties liability represents the Corporation’s best estimate of probable incurred losses as of December 31, 2012. However, it is reasonably possible that future representations and warranties losses may occur in excess of the amounts recorded for these exposures. In addition, the Corporation adjustedhas not recorded any representations and warranties liability for certain potential private-label securitization and whole-loan exposures where it has little to no claim experience. The Corporation currently estimates that the experience implied in the settlement inrange of possible loss for representations and warranties exposures could be up to $4 billion
|
| | |
| | 210Bank of America 20112012217
| | |
orderover accruals at December 31, 2012 compared to determine the estimatedup to $5 billion over accruals at December 31, 2011 for only non-GSE representations and warranties liability and the correspondingexposures. The range of possible loss. The judgmental adjustments made include considerationloss at December 31, 2012 reflects the impact of the differencesFNMA Settlement and, as a result, addresses principally non-GSE exposures. The reduction in the mixrange of products inpossible loss from December 31, 2011 is the securitizations, loan originator, likelihoodnet impact of, claims differences, the differences in theamong other changes, updated assumptions and other developments. The estimated range of possible loss related to these representations and warranties exposures does not represent a probable loss, and is based on currently available information, significant judgment and a number of paymentsassumptions, including those set forth below, that the borrower has made priorare subject to default and the sponsor of the securitization.change.
Future provisions and/or ranges of possible loss for non-GSE representations and warranties may be significantly impacted if actual experiences are different from the Corporation’s assumptions in its predictive models, including, without limitation, those regarding the ultimate resolution of the BNY Mellon Settlement, estimated repurchase rates, economic conditions, estimated home prices, consumer and counterparty behavior, and a variety of other judgmental factors. Adverse developments with respect to one or more of the assumptions underlying the liability for representations and warranties and the corresponding estimated range of possible loss could result in significant increases to future provisions and/or the estimated range of possible loss. For example, if courts, in the context of claims brought by private-label securitization trustees, were to disagree with the Corporation’s interpretation that the underlying agreements require a claimant to prove that the representations and warranties breach was the cause of the loss, it could significantly impact thisthe estimated range of possible loss. For additional information, see Note 14 – Commitments and Contingencies. Additionally, if recent court rulings related to monoline litigation, including one related to the Corporation, that have allowed sampling of loan files instead of requiring a loan-by-loan review to determine if a representations and warranties breach has occurred, are followed generally by the courts in future monoline litigation, private-label securitization investorscounterparties may view litigation as a more attractive alternative as compared to a loan-by-loan review. Finally, although the Corporation believes that the representations and warranties typically given in non-GSE transactions are less rigorous and actionable than those given in GSE transactions, the Corporation does not have significant experience resolving loan-level experienceclaims in non-GSE transactions to measure the impact of these differences on the probability that a loan will be required to be repurchased.
The liability for obligations underand representations and warranties with respect to GSE and non-GSE exposures and the corresponding estimated range of possible loss for non-GSE representations and warranties exposures doesdo not includeconsider any losses related to litigation matters, disclosed in Note 14 – Commitments and Contingencies,including litigation brought by monoline insurers, nor do they include any separate foreclosure costs and related costs, assessments and compensatory fees or any other possible losses related to potential claims for breaches of performance of servicing obligations (except as such losses are included as potential costs of the BNY Mellon Settlement), potential securities law or fraud claims or potential indemnity or other claims against the Corporation, including claims related to loans insured by the FHA. The Corporation is not able to reasonably estimate the amount of any possible loss with respect to any such servicing, securities law, (exceptfraud or other claims against the Corporation, except to the extent reflected in the aggregate range of possible loss for litigation and regulatory matters disclosed in Note 1413 – Commitments and Contingencies), fraud or other claims against the Corporation;; however, such loss could be material.
Government-sponsored Enterprises Experience
The Corporation and its subsidiaries have an established history of working with the GSEs on repurchase claims. However, the GSEs’ repurchase requests, standards for rescission of repurchase
requests, and resolution processes have become increasingly inconsistent with GSEs’ prior conduct and the Corporation’s interpretation of its contractual obligations. Notably, in recent periods, the Corporation has been experiencing elevated levels of new claims, including claims on loans on which borrowers have made a significant number of payments (e.g., at least 25 payments) or on loans which had defaulted more than 18 months prior to the repurchase request, in each case, in numbers that were not expected based on historical experience. Additionally, the criteria and the processes by which the GSEs are ultimately willing to resolve claims have changed in ways that are unfavorable to the Corporation. These developments have resulted in an increase in claims outstanding from the GSEs. The Corporation intends to repurchase loans to the extent required under the contracts and standards that govern its relationship with the GSEs. For additional information, see Mortgage Insurance Rescission Notices in this Note on page 208.
Generally, the Corporation first becomes aware that a GSE is evaluating a particular loan for repurchase when the Corporation receives a request from a GSE to review the underlying loan file (file request). Upon completing its review, the GSE may submit a repurchase claim to the Corporation. As soon as practicable after receiving a repurchase claim from either of the GSEs,a GSE, the Corporation evaluates the claim and takes appropriate action. Claim disputes are generally handled through loan-level negotiations with the GSEs and the Corporation seeks to resolve the repurchase claim within 90 to 120 days of the receipt of the claim although tolerances exist for claims that remain open beyond this timeframe. Disputes include reasonableness of stated income, occupancy, undisclosed liabilities, and the validity of MI claim rescissions in the vintages with the highest default rates.
The Corporation and its subsidiaries have an established history of working with the GSEs on repurchase claims. In 2012, the Corporation continued to experience elevated levels of claims from FNMA, including claims on loans on which borrowers have made a significant number of payments (e.g., at least 25 payments) and, to a lesser extent, loans that defaulted more than 18 months prior to the repurchase request. The FNMA Settlement resolved substantially all of the claims with respect to loans originated and sold to FNMA between January 1, 2000 and December 31, 2008, as well as substantially all future representations and warranties repurchase claims associated with these loans.
Monoline Insurers Experience
ExperienceThe Corporation has had limited representations and warranties repurchase claims experience with most of the monoline insurers, has been varied anddue to ongoing litigation against legacy Countrywide and/or Bank of America. To the protocols and experience with these counterparties has not been predictable. The timetable forextent the loan file request,Corporation received repurchase claims from the repurchase claim, if any, response and resolution vary by monoline.monolines that are properly presented, it generally reviews them on a loan-by-loan basis. Where a breach of representations and warranties given by the Corporation or subsidiaries or legacy companies is confirmed on a given loan, settlement is generally reached as to that loan within 60 to 90 days.
The Corporation generally reviews properly presented repurchase claims fromFor the monolines on a loan-by-loan basis. As part of an ongoing claims process, if the Corporation does not believe a claim is valid, it will deny the claim and generally indicate the reason for the denial to facilitate meaningful dialogue with the counterparty although it is not contractually obligated to do so. When there is disagreement as to the resolution of a claim, meaningful dialogue and negotiation is generally necessary between the parties to reach conclusion on an individual claim. Although the Assured Guaranty Settlement does not cover all securitizations where Assured Guaranty and subsidiaries provided insurance, it covers the transactions that resulted in repurchase requests from this monoline. As a result, the on-going claims process with counterparties with a more consistent repurchase experience is substantially complete.
The remaining monolines have instituted litigation against legacy Countrywide andand/or Bank of America. WhenAmerica, when claims from these counterparties are denied, the Corporation does not indicate its reason for denial as it is not contractually obligated to do so. In the Corporation’s experience, the monolines have been generally
unwilling to withdraw repurchase claims, regardless of whether and what evidence was offered to refute a claim.
The pipeline of unresolved monoline claims where the Corporation believes a valid defect has not been identified which would constitute an actionable breach of representations and warranties decreased during 2011 as a result of the Assured Guaranty Settlement. Through December 31, 2011, approximately 30 percent of monoline claims that the Corporation initially denied have subsequently been resolved through the Assured Guaranty Settlement, 10 percent through repurchase or make-whole payments and one percent through rescission. When a claim has been denied and there has not been communication with the counterparty for six months, the Corporation views these claims as inactive; however, they remain in the outstanding claims balance until resolution.
To the extent there are repurchase claims based on valid identified loan defects and the Corporation has determined that there is a breach of a representation and warranty and that any other requirements for repurchase claims that are in the process of review,have been met, a liability for representations and warranties is established. ForOutside of the standard quality control process that is an integral part of the Corporation’s loan origination process, the Corporation does not generally review loan files until a repurchase claims in the process of review, the liabilityclaim is based on historical repurchase experiencereceived, including with specific monoline insurers to the extent such experience provides a reasonable basis on which to estimate incurred losses from repurchase activity. In prior periods, a liability was established for Assured Guaranty related to repurchase claims subject to negotiation and unasserted claims to repurchase current and future defaulted loans. The Assured Guaranty Settlement resolved this representations and warranties liability with the liability for the related loss sharing reinsurance arrangement being recorded in other accrued liabilities. With respect to the other monoline insurers, the Corporation has had limited experience in the repurchase process as these monoline insurers have instituted litigation against legacy Countrywide and Bank of America, which limits the Corporation’s ability to enter into constructive dialogue with these monolines to resolve the open claims. For these monolines, inexposures. In view of the inherent difficulty of predicting the outcome of those repurchase claims where a valid defect has not been identified or in predicting future claim requests and the related outcome in the case of
unasserted claims to repurchase loans from the securitization trusts in which these monolines have insured all or some of the related bonds, the Corporation cannot reasonably estimate the eventual outcome through the repurchase process. In addition, the timing of the ultimate resolution or the eventual loss through the repurchase process, if any, related to those repurchase claims cannot be reasonably estimated. Thus, with respect to these monolines,As a result, a liability for representations and warranties has not been established related to repurchase claims where a valid defect has not been identified, or in the case of any unasserted claims to repurchase loans from the securitization trusts in which such monolines have insured all or some of the related bonds. For additional information related to the monolines, see Note 1413 – Commitments and Contingencies.
Monoline Outstanding Claims
At December 31, 20112012, for loans originated between 2004 and 2008, the unpaid principal balance of loans related to unresolved monoline repurchase claims was $3.12.4 billion, substantially all of which the Corporation has reviewed and declined to repurchase based on an assessment of whether a material breach exists. As noted above, a portion of the repurchase claims that are initially denied are ultimately resolved through bulk settlement, repurchase or make-whole payments, after additional dialogue and negotiation with the monoline insurer. At December 31, 20112012, the
unpaid principal balance of loans in these vintages for which the monolines had requested loan files for review but for which no repurchase claim had been received was $6.15.3 billion, excluding loans that had been paid in full andor resolved through settlements. Of these file requests, for loans included in the trusts settled with Assured Guaranty.$4.0 billion are aged and subject to ongoing litigation. There will likely be additional requests for loan files in the future leading to repurchase claims. Such claims may relate to loans that are currently in securitization trusts or loans that have defaulted and are no longer included in the unpaid principal balance of the loans in the trusts. However, it is unlikely that a repurchase claim will be received for every loan in a securitization or every file requested or that a valid defect exists for every loan repurchase claim. In addition, amounts paid on repurchase claims from a monoline are paid to the securitization trust and are applied in accordance with the terms of the governing securitization documents which may include use by the securitization trust to repay any outstanding monoline advances or reduce future advances from the monolines. To the extent that a monoline has not advanced funds or does not anticipate that it will be required to advance funds to the securitization trust, the likelihood of receiving a repurchase claim from a monoline may be reduced as the monoline would receive limited or no benefit from the payment of repurchase claims. Moreover, some monolines are not currently performing their obligations under the financial guarantyguarantee policies they issued which may, in certain circumstances, impact their ability to present repurchase claims, although in those circumstances, investors may be able to bring claims if contractual thresholds are met.
Whole Loan Sales and Private-label Securitizations Experience
The majority of the repurchase claims that the Corporation has received and resolved outside of those from the GSEs and monolines are from third-party whole-loan investors. In connection with these transactions, theThe Corporation provided representations and warranties and the whole-loan investors may retain those rights even when the loans were aggregated with other collateral into private-label securitizations sponsored by the whole-loan investors. The Corporation reviews properly presented repurchase claims for these whole loans on a loan-by-loan basis. If, after the Corporation’s review, it does not believe a claim is valid, it will deny
the claim and generally indicate a reason for the denial. When the counterpartywhole-loan investor agrees with the Corporation’s denial of the claim, the counterpartywhole-loan investor may rescind the claim. When there is disagreement as to the resolution of the claim, meaningful dialogue and negotiation between the parties isare generally necessary to reach conclusiona resolution on an individual claim. Generally, a whole-loan sale claimantinvestor is engaged in the repurchase process and the Corporation and the claimantwhole-loan investor reach resolution, either through loan-by-loan negotiation or at times, through a bulk settlement. ThroughAs of December 31, 20112012, 2515 percent of the whole-loan claims that the Corporation initially denied have subsequently been resolved through repurchase or make-whole payments and 5044 percent have been resolved through rescission or repayment in full by the borrower. Although the timeline for resolution varies, once an actionable breach is identified on a given loan, settlement is generally reached as to that loan within 60 to 90 days. When a claim has been denied and the Corporation does not have communication with the counterparty for six months, the Corporation views these claims as inactive; however, they remain in the outstanding claims balance until resolution.
In private-label securitizations, certain presentation thresholds
need to be met in order for anyinvestors to direct a trustee to assert repurchase claimclaims. Recent increases in new private-label claims are primarily related to be asserted by investors. In 2011, there was an increase in repurchase claimsrequests received from trustees and third-party sponsors for private-label securitization trusteestransactions not included in the BNY Mellon Settlement, including claims related to first-lien third-party sponsored securitizations that meet the required standards. During 2011, the Corporation received $2.1 billion of such repurchase claims. In addition,include monoline insurance. Over time, there has been an increase in requests for loan files from certain private-label securitization trustees, as well as requests for tolling agreements to toll the applicable statutes of limitation relating to representations and warranties repurchase claims, and the Corporation believes it is likely that these requests will lead to an increase in repurchase claims from private-label securitization trustees that meet required standards.with standing to bring such claims. The representations and warranties, as governed by the private-label securitization agreements, generally require that counterparties have the ability to both assert a claim and actually prove that a loan has an actionable defect under the applicable contracts. While the Corporation believes the agreements for private-label securitizations generally contain less rigorous representations and warranties and place higher burdens on investors seeking repurchases than the express provisions of comparable agreements with the GSEs, without regard to any variations that may have arisen as a result of dealings with the GSEs, the agreements generally include a representation that underwriting practices were prudent and customary.
During 2010, In the Corporation received claim demands totaling $1.7 billion fromcase of private-label securitization investorstrustees and third-party sponsors, there is currently no established process in place for the Covered Trusts. Non-GSE investors generally do not haveparties to reach a conclusion on an individual loan if there is a disagreement on the contractual right to demand repurchaseresolution of the loans directly or the right to access loan files. The inclusion of theclaim. For additional information on repurchase demands, see $1.7 billionUnresolved Repurchase Claims in outstanding claims, as reflected in the table on page 208214.
At December 31, 2012, for loans originated between 2004 and 2008, the notional amount of unresolved repurchase claims submitted by private-label securitization trustees and whole-loan investors was $12.2 billion. The Corporation has performed an initial review with respect to $10.9 billion of these claims and does not mean thatbelieve a valid basis for repurchase has been established by the Corporation believes these claims have satisfiedclaimant and is still in the contractual thresholds required forprocess of reviewing the private-label securitization investors to direct the securitization trustee to take action or that these claims are otherwise procedurally or substantively valid. Oneremaining $1.3 billion of these claimants has filed litigation against the Corporation relating to certain of these claims; the claims in this litigation would be extinguished if there is final court approval of the BNY Mellon Settlement.claims.
NOTE 109 Goodwill and Intangible Assets
Goodwill
The Goodwill table below presents goodwill balances by business segment at December 31, 20112012 and 20102011. The reporting units utilized for goodwill impairment tests are the businessoperating segments or one level below. The majority of the decline in goodwill during 2011 was due to goodwill impairment charges as described in this Note.
|
| | | | | | | |
| | | | |
| Goodwill | | | |
| | | | |
| | December 31 |
| (Dollars in millions) | 2011 | | 2010 |
| Deposits | $ | 17,875 |
| | $ | 17,875 |
|
| Card Services | 10,014 |
| | 10,014 |
|
| Consumer Real Estate Services | — |
| | 2,796 |
|
| Global Commercial Banking | 20,668 |
| | 20,668 |
|
| Global Banking & Markets | 10,672 |
| | 10,672 |
|
| Global Wealth & Investment Management | 9,928 |
| | 9,928 |
|
| All Other | 810 |
| | 1,908 |
|
| Total goodwill | $ | 69,967 |
| | $ | 73,861 |
|
International Consumer Card Businesses |
| | | | | | | |
| | | | |
| Goodwill | | | |
| | | | |
| | December 31 |
| (Dollars in millions) | 2012 | | 2011 |
| Consumer & Business Banking | $ | 29,986 |
| | $ | 29,986 |
|
| Global Banking | 24,802 |
| | 24,802 |
|
| Global Markets | 4,451 |
| | 4,442 |
|
| Global Wealth & Investment Management | 9,698 |
| | 9,718 |
|
| All Other | 1,039 |
| | 1,019 |
|
| Total goodwill | $ | 69,976 |
| | $ | 69,967 |
|
In connection with2012, the Corporation’s announcement on August 15, 2011International Wealth Management (IWM) businesses within GWIM, including $230 million of its intention to exit the international consumer card businesses, goodwill, of approximately $1.9 billion was allocated, on a relative fair value basis, from Card Serviceswere moved to All Other as of September 30, 2011. Ofin connection with the Corporation’s agreement during 2012 to sell these businesses. Prior periods have been reclassified.
$1.9 billion2012 of goodwill allocated to the international consumer card businesses, $526 million of goodwill was allocated, on a relative fair value basis, to the Canadian consumer card business which was sold on December 1, 2011.Annual Impairment Test
During the three months ended September 30, 2012, the Corporation completed its annual goodwill impairment test as of June 30, 2012 for all reporting units. Based on the results of step
one of the annual goodwill impairment test, the Corporation determined that step two was not required for any of the reporting units as their respective fair values exceeded their carrying values indicating there was no impairment.
2011 Impairment Tests
During the three months ended December 31, 2011, a goodwill impairment test was performed for the European consumer card businesses reporting unit within All Other as it was likely that the carrying amount of the businesses exceeded the fair value due to a decrease in estimated future growth projections. The Corporation concluded that goodwill was impaired, and accordingly, recorded a non-cash, non-tax deductible goodwill impairment charge of $581 million for the European consumer card businesses.
Consumer Real Estate Services
In connection with the sale of Balboa Insurance Company’s lender-placed insurance business on June 1, 2011, the Corporation allocated, on a relative fair value basis, $193 million of CRES goodwill to the business in determining the gain on the sale..
During the three months ended June 30, 2011, as a consequence of the BNY Mellon Settlement entered into by the Corporation on June 28, 2011, the adverse impact of the incremental mortgage-related charges, and the continued economic slowdown in the mortgage business, the Corporation performed a goodwill impairment test for the CRESConsumer Real Estate Services (CRES) reporting unit. The Corporation concluded that the remaining balance of goodwill of $2.6 billion was impaired, and accordingly, recorded a non-cash, non-tax deductible goodwill impairment charge to reduce the carrying value of the goodwill in CRES to zero.
2011 Annual Impairment Test
During the three months ended September 30, 2011, the Corporation completed its annual goodwill impairment test as of June 30, 2011 for all reporting units. Based on the results of step one of the annual goodwill impairment test, the Corporation determined that step two was not required for any of the reporting units as their fair value exceeded their carrying value indicating there was no impairment.
2010 Impairment Tests
In 2010, the Corporation performed a goodwill impairment test for Card Services due to the continued stress on the business and the uncertain debit card interchange provisions under the Dodd-Frank Wall Street Reform and Consumer Protection Act (Financial Reform Act). The Corporation concluded that goodwill was impaired, and accordingly, recorded a non-cash, non-tax deductible goodwill impairment charge of $10.4 billion to reduce the carrying value of the goodwill in Card Services.
During the three months ended December 31, 2010, the Corporation performed a goodwill impairment test for the CRES reporting unit as it was likely that there was a decline in its fair value as a result of increased uncertainties, including existing and potential litigation exposure and other related risks, higher servicing costs including those related to loss mitigation, foreclosure related issues and the redeployment of centralized sales resources. The Corporation concluded that goodwill was
impaired, and accordingly, recorded a non-cash, non-tax deductible goodwill impairment charge of $2.0 billion in CRES.
Intangible Assets
The table below presents the gross carrying amountsamount and accumulated amortization related tofor intangible assets at December 31, 20112012 and 20102011.
| | | | | | | | | | | | | | | | | |
Intangible Assets | | | | | | | | | | | | | | |
| | | | | | | | | | | | | | | |
| | December 31 | December 31 |
| | 2011 | | 2010 | 2012 | | 2011 |
| (Dollars in millions) | Gross Carrying Value | | Accumulated Amortization | | Gross Carrying Value | | Accumulated Amortization | Gross Carrying Value | | Accumulated Amortization | | Gross Carrying Value | | Accumulated Amortization |
| Purchased credit card relationships | $ | 5,938 |
| | $ | 3,765 |
| | $ | 7,162 |
| | $ | 4,085 |
| $ | 6,184 |
| | $ | 4,494 |
| | $ | 6,948 |
| | $ | 4,775 |
|
| Core deposit intangibles | 3,903 |
| | 2,915 |
| | 5,394 |
| | 4,094 |
| 3,592 |
| | 2,858 |
| | 3,903 |
| | 2,915 |
|
| Customer relationships | 4,081 |
| | 1,532 |
| | 4,232 |
| | 1,222 |
| 4,025 |
| | 1,884 |
| | 4,081 |
| | 1,532 |
|
| Affinity relationships | 1,551 |
| | 948 |
| | 1,647 |
| | 902 |
| 1,572 |
| | 1,087 |
| | 1,569 |
| | 966 |
|
| Other intangibles | 2,476 |
| | 768 |
| | 3,087 |
| | 1,296 |
| 2,139 |
| | 505 |
| | 2,476 |
| | 768 |
|
| Total intangible assets | $ | 17,949 |
| | $ | 9,928 |
| | $ | 21,522 |
| | $ | 11,599 |
| $ | 17,512 |
| | $ | 10,828 |
| | $ | 18,977 |
| | $ | 10,956 |
|
| |
(1) | Excludes fully amortized intangible assets. |
Excluded fromAt December 31, 2012 and 2011 amounts are $3.2 billion of fully amortized intangible assets and $396 million of intangible assets sold as part of the consumer credit card portfolio sales that occurred during the year.
None, none of the intangible assets were impaired at December 31, 2011 or 2010.impaired. Amortization of intangibles expense was $1.5
1.3 billion,$1.5 billion and $1.7 billion and $2.0 billionin 20112012, 20102011 and 20092010, respectively. The Corporation estimates aggregate amortization
expense will be approximately$1.3 billion, $1.1 billion, $1.0 billion950 million, $870840 million, $770 million and $770670 million for 20122013 through 20162017, respectively.
NOTE 1110 Deposits
The Corporation had U.S. certificates of deposit and other U.S. time deposits of $100 thousand or more totaling $50.841.9 billion and $60.550.8 billion at December 31, 20112012 and 20102011. Non-U.S. certificates of deposit and other non-U.S. time deposits of $100 thousand or more totaled $34.029.1 billion and $40.634.0 billion at December 31, 20112012 and 20102011. The table below presents the contractual maturities for time deposits of $100 thousand or more at December 31, 20112012.
| | | | | | | | | | | | | | | | | |
| Time Deposits of $100 Thousand or More | | | | | | | | | | | | | | |
| | | | | | | | | | | | | | | |
| (Dollars in millions) | Three months or Less | | Over Three
Months to Twelve Months | | Thereafter | | Total | Three Months or Less | | Over Three
Months to Twelve Months | | Thereafter | | Total |
| U.S. certificates of deposit and other time deposits | $ | 20,402 |
| | $ | 21,321 |
| | $ | 9,091 |
| | $ | 50,814 |
| $ | 16,140 |
| | $ | 19,349 |
| | $ | 6,434 |
| | $ | 41,923 |
|
| Non-U.S. certificates of deposit and other time deposits | 30,060 |
| | 747 |
| | 3,180 |
| | 33,987 |
| 27,995 |
| | 927 |
| | 200 |
| | 29,122 |
|
The scheduled contractual maturities for total time deposits at December 31, 20112012 are presented in the table below.
| | | | | | | | | | | | | |
| Contractual Maturities of Total Time Deposits | | | | | | | | | | |
| | | | | | | | | | | |
| (Dollars in millions) | U.S. | | Non-U.S. | | Total | U.S. | | Non-U.S. | | Total |
| Due in 2012 | $ | 92,621 |
| | $ | 41,286 |
| | $ | 133,907 |
| |
| Due in 2013 | 10,956 |
| | 8 |
| | 10,964 |
| $ | 80,720 |
| | $ | 29,437 |
| | $ | 110,157 |
|
| Due in 2014 | 3,254 |
| | 10 |
| | 3,264 |
| 8,356 |
| | 865 |
| | 9,221 |
|
| Due in 2015 | 1,774 |
| | 3,098 |
| | 4,872 |
| 2,319 |
| | 58 |
| | 2,377 |
|
| Due in 2016 | 1,155 |
| | 67 |
| | 1,222 |
| 1,407 |
| | 28 |
| | 1,435 |
|
| Due in 2017 | | 1,116 |
| | 3 |
| | 1,119 |
|
| Thereafter | 3,197 |
| | — |
| | 3,197 |
| 2,671 |
| | — |
| | 2,671 |
|
| Total time deposits | $ | 112,957 |
| | $ | 44,469 |
| | $ | 157,426 |
| $ | 96,589 |
| | $ | 30,391 |
| | $ | 126,980 |
|
|
| | |
| | 214Bank of America 20112012221
| | |
NOTE 1211 Federal Funds Sold, Securities Borrowed or Purchased Under Agreements to Resell and Short-term Borrowings
The table below presents federal funds sold and securities borrowed or purchased under agreements to resell and short-term borrowings which include federal funds purchased, securities loaned or sold under agreements to repurchase, commercial paper and other short-term borrowings.
| | | | | | | | | | | | | | | | | | | | | | | | | |
| | 2011 | | 2010 | | 2009 | 2012 | | 2011 | | 2010 |
| (Dollars in millions) | Amount | | Rate | | Amount | | Rate | | Amount | | Rate | Amount | | Rate | | Amount | | Rate | | Amount | | Rate |
| Federal funds sold and securities borrowed or purchased under agreements to resell | |
| | |
| | |
| | |
| | |
| | |
| |
| | |
| | |
| | |
| | |
| | |
|
| At December 31 | $ | 211,183 |
| | 0.76 | % | | $ | 209,616 |
| | 0.85 | % | | $ | 189,933 |
| | 0.78 | % | $ | 219,924 |
| | 0.92 | % | | $ | 211,183 |
| | 0.76 | % | | $ | 209,616 |
| | 0.85 | % |
| Average during year | 245,069 |
| | 0.88 |
| | 256,943 |
| | 0.71 |
| | 235,764 |
| | 1.23 |
| 236,042 |
| | 0.64 |
| | 245,069 |
| | 0.88 |
| | 256,943 |
| | 0.71 |
|
| Maximum month-end balance during year | 270,473 |
| | n/a | | 314,932 |
| | n/a | | 271,321 |
| | n/a | 253,535 |
| | n/a | | 270,473 |
| | n/a | | 314,932 |
| | n/a |
| Federal funds purchased | |
| | |
| | |
| | |
| | |
| | |
| |
| | |
| | |
| | |
| | |
| | |
|
| At December 31 | 243 |
| | 0.06 |
| | 1,458 |
| | 0.14 |
| | 4,814 |
| | 0.09 |
| 1,151 |
| | 0.17 |
| | 243 |
| | 0.06 |
| | 1,458 |
| | 0.14 |
|
| Average during year | 1,658 |
| | 0.08 |
| | 4,718 |
| | 0.15 |
| | 4,239 |
| | 0.05 |
| 384 |
| | 0.11 |
| | 1,658 |
| | 0.08 |
| | 4,718 |
| | 0.15 |
|
| Maximum month-end balance during year | 4,133 |
| | n/a | | 8,320 |
| | n/a | | 4,814 |
| | n/a | 1,211 |
| | n/a | | 4,133 |
| | n/a | | 8,320 |
| | n/a |
| Securities loaned or sold under agreements to repurchase | |
| | |
| | |
| | |
| | |
| | |
| |
| | |
| | |
| | |
| | |
| | |
|
| At December 31 | 214,621 |
| | 1.08 |
| | 243,901 |
| | 1.15 |
| | 250,371 |
| | 0.39 |
| 292,108 |
| | 1.11 |
| | 214,621 |
| | 1.08 |
| | 243,901 |
| | 1.15 |
|
| Average during year | 270,718 |
| | 1.31 |
| | 348,936 |
| | 0.74 |
| | 365,624 |
| | 0.96 |
| 281,515 |
| | 0.98 |
| | 270,718 |
| | 1.31 |
| | 348,936 |
| | 0.74 |
|
| Maximum month-end balance during year | 293,519 |
| | n/a | | 458,532 |
| | n/a | | 407,967 |
| | n/a | 319,401 |
| | n/a | | 293,519 |
| | n/a | | 458,532 |
| | n/a |
| Commercial paper | |
| | |
| | |
| | |
| | |
| | |
| |
| | |
| | |
| | |
| | |
| | |
|
| At December 31 | 23 |
| | 1.70 |
| | 15,093 |
| | 0.65 |
| | 13,131 |
| | 0.65 |
| 100 |
| | 0.19 |
| | 23 |
| | 1.70 |
| | 15,093 |
| | 0.65 |
|
| Average during year | 8,897 |
| | 0.53 |
| | 25,923 |
| | 0.56 |
| | 26,697 |
| | 1.03 |
| 49 |
| | 0.30 |
| | 8,897 |
| | 0.53 |
| | 25,923 |
| | 0.56 |
|
| Maximum month-end balance during year | 21,212 |
| | n/a | | 36,236 |
| | n/a | | 37,025 |
| | n/a | 172 |
| | n/a | | 21,212 |
| | n/a | | 36,236 |
| | n/a |
| Other short-term borrowings | |
| | |
| | |
| | |
| | |
| | |
| |
| | |
| | |
| | |
| | |
| | |
|
| At December 31 | 35,675 |
| | 2.35 |
| | 44,869 |
| | 2.02 |
| | 56,393 |
| | 1.72 |
| 30,631 |
| | 3.14 |
| | 35,675 |
| | 2.35 |
| | 44,869 |
| | 2.02 |
|
| Average during year | 42,996 |
| | 2.31 |
| | 50,752 |
| | 1.88 |
| | 92,084 |
| | 1.87 |
| 36,452 |
| | 2.23 |
| | 42,996 |
| | 2.31 |
| | 50,752 |
| | 1.88 |
|
| Maximum month-end balance during year | 47,087 |
| | n/a | | 63,081 |
| | n/a | | 169,602 |
| | n/a | 40,129 |
| | n/a | | 47,087 |
| | n/a | | 63,081 |
| | n/a |
n/a = not applicable
Bank of America, N.A. maintains a global program to offer up to a maximum of $75 billion outstanding at any one time, of bank notes with fixed or floating rates and maturities of at least seven days from the date of issue. Short-term bank notes outstanding under this program totaled $1.43.9 billion and $14.66.3 billion at December 31, 20112012 and 20102011. These short-term bank notes,
along with Federal Home Loan Bank (FHLB) advances, U.S. Treasury tax and loan notes, and term federal funds purchased, are included in commercial paper and other short-term borrowings on the Corporation’s Consolidated Balance Sheet. See Note 1312 – Long-term Debt for information regarding the long-term notes that have been issued under the $75 billion bank note program.
|
| | |
222 Bank of America 2012 | | Bank of America215
|
NOTE 1312 Long-term Debt
Long-term debt consists of borrowings having an original maturity of one year or more. The table below presents the balance of long-term debt at December 31, 20112012 and 20102011, and the related contractual rates and maturity dates atas of December 31, 20112012.
| | | | | | | | | |
| | December 31 | December 31 |
| (Dollars in millions) | 2011 | | 2010 | 2012 | | 2011 |
| Notes issued by Bank of America Corporation | |
| | |
| |
| | |
|
| Senior notes: | |
| | |
| |
| | |
|
| Fixed, with a weighted-average rate of 4.81%, ranging from 1.42% to 7.85%, due 2012 to 2043 | $ | 95,199 |
| | $ | 85,157 |
| |
| Floating, with a weighted-average rate of 1.46%, ranging from 0.23% to 6.64%, due 2012 to 2041 | 28,064 |
| | 36,162 |
| |
| Fixed, with a weighted-average rate of 5.26%, ranging from 1.50% to 7.63%, due 2013 to 2043 | | $ | 79,575 |
| | $ | 95,199 |
|
| Floating, with a weighted-average rate of 1.15%, ranging from 0.16% to 5.21%, due 2013 to 2041 | | 13,439 |
| | 28,064 |
|
| Senior structured notes | 18,920 |
| | 18,796 |
| 21,936 |
| | 18,920 |
|
| Subordinated notes: | |
| | |
| |
| | |
|
| Fixed, with a weighted-average rate of 5.39%, ranging from 1.80% to 10.20%, due 2012 to 2038 | 24,509 |
| | 26,553 |
| |
| Floating, with a weighted-average rate of 2.02%, ranging from 0.12% to 5.06%, due 2016 to 2019 | 704 |
| | 705 |
| |
| Fixed, with a weighted-average rate of 5.39%, ranging from 2.40% to 10.20%, due 2013 to 2038 | | 14,787 |
| | 24,509 |
|
| Floating, with a weighted-average rate of 1.38%, ranging from 0.11% to 3.66%, due 2016 to 2019 | | 449 |
| | 704 |
|
| Junior subordinated notes (related to trust preferred securities): | |
| | |
| |
| | |
|
| Fixed, with a weighted-average rate of 6.93%, ranging from 5.25% to 11.45%, due 2026 to 2055 | 12,859 |
| | 15,709 |
| |
| Floating, with a weighted-average rate of 1.14%, ranging from 0.80% to 3.81%, due 2027 to 2056 | 1,165 |
| | 3,514 |
| |
| Fixed, with a weighted-average rate of 6.79%, ranging from 5.25% to 11.45%, due 2027 to 2036 | | 3,186 |
| | 12,859 |
|
| Floating, with a weighted-average rate of 1.03%, ranging from 0.89% to 3.69%, due 2027 to 2056 | | 567 |
| | 1,165 |
|
| Total notes issued by Bank of America Corporation | 181,420 |
| | 186,596 |
| 133,939 |
| | 181,420 |
|
| Notes issued by Merrill Lynch & Co., Inc. and subsidiaries | |
| | |
| |
| | |
|
| Senior notes: | |
| | |
| |
| | |
|
| Fixed, with a weighted-average rate of 5.64%, ranging from 1.10% to 17.61%, due 2012 to 2037 | 41,103 |
| | 43,495 |
| |
| Floating, with a weighted-average rate of 1.77%, ranging from 0.03% to 5.18%, due 2012 to 2044 | 18,480 |
| | 27,447 |
| |
| Fixed, with a weighted-average rate of 5.79%, ranging from 1.63% to 15.00%, due 2013 to 2034 | | 35,064 |
| | 41,103 |
|
| Floating, with a weighted-average rate of 0.67%, ranging from 0.12% to 5.06%, due 2013 to 2044 | | 11,964 |
| | 18,480 |
|
| Senior structured notes | 27,578 |
| | 38,891 |
| 27,288 |
| | 27,578 |
|
| Subordinated notes: | |
| | |
| |
| | |
|
| Fixed, with a weighted-average rate of 6.04%, ranging from 2.61% to 8.13%, due 2016 to 2038 | 11,454 |
| | 9,423 |
| |
| Floating, with a weighted-average rate of 1.59%, ranging from 0.98% to 2.89%, due 2017 to 2026 | 1,207 |
| | 1,935 |
| |
| Fixed, with a weighted-average rate of 5.98%, ranging from 2.61% to 8.13%, due 2016 to 2038 | | 9,331 |
| | 11,454 |
|
| Floating, with a weighted-average rate of 0.89%, ranging from 0.73% to 2.88%, due 2017 to 2026 | | 1,318 |
| | 1,207 |
|
| Junior subordinated notes (related to trust preferred securities): | |
| | |
| |
| | |
|
| Fixed, with a weighted-average rate of 6.91%, ranging from 6.45% to 7.38%, due 2048 to perpetual | 3,600 |
| | 3,576 |
| |
| Fixed, with a weighted-average rate of 6.91%, ranging from 6.45% to 7.38%, due 2017 to 2067 | | 3,809 |
| | 3,600 |
|
| Other long-term debt | 701 |
| | 986 |
| 992 |
| | 701 |
|
| Total notes issued by Merrill Lynch & Co., Inc. and subsidiaries | 104,123 |
| | 125,753 |
| 89,766 |
| | 104,123 |
|
| Notes issued by Bank of America, N.A. and other subsidiaries | |
| | |
| |
| | |
|
| Senior notes: | |
| | |
| |
| | |
|
| Fixed, with a weighted-average rate of 5.06%, ranging from 4.00% to 7.61%, due 2012 to 2027 | 164 |
| | 169 |
| |
| Floating, with a weighted-average rate of 0.28%, ranging from 0.21% to 0.77%, due 2012 to 2051 | 8,029 |
| | 12,562 |
| |
| Senior structured notes | — |
| | 1,319 |
| |
| Fixed, with a weighted-average rate of 7.00%, due 2014 | | 178 |
| | 164 |
|
| Floating, with a weighted-average rate of 0.53%, ranging from 0.39% to 0.75%, due 2026 to 2051 | | 2,686 |
| | 8,029 |
|
| Subordinated notes: | |
| | |
| |
| | |
|
| Fixed, with a weighted-average rate of 5.68%, ranging from 5.30% to 6.10%, due 2016 to 2036 | 5,273 |
| | 5,194 |
| 5,230 |
| | 5,273 |
|
| Floating, with a weighted-average rate of 0.83%, ranging from 0.37% to 0.85%, due 2016 to 2019 | 1,401 |
| | 2,023 |
| |
| Floating, with a weighted-average rate of 0.60%, ranging from 0.36% to 0.61%, due 2016 to 2019 | | 1,401 |
| | 1,401 |
|
| Total notes issued by Bank of America, N.A. and other subsidiaries | 14,867 |
| | 21,267 |
| 9,495 |
| | 14,867 |
|
| Other debt | |
| | |
| |
| | |
|
| Senior structured notes | 1,187 |
| | — |
| 864 |
| | 1,187 |
|
| Subordinated notes: | | | | |
| Fixed, with a weighted average rate of 6.87%, ranging from 6.63% to 7.13%, due 2012 | 983 |
| | — |
| |
| Subordinated notes | | — |
| | 983 |
|
| Advances from Federal Home Loan Banks: | |
| | |
| |
| | |
|
| Fixed, with a weighted-average rate of 3.42%, ranging from 0.95% to 7.72%, due 2012 to 2034 | 18,798 |
| | 41,001 |
| |
| Fixed, with a weighted-average rate of 4.87%, ranging from 0.01% to 7.72%, due 2013 to 2034 | | 6,277 |
| | 18,798 |
|
| Other | 1,833 |
| | 2,801 |
| 988 |
| | 1,833 |
|
| Total other debt | 22,801 |
| | 43,802 |
| 8,129 |
| | 22,801 |
|
| Total long-term debt excluding consolidated VIEs | 323,211 |
| | 377,418 |
| 241,329 |
| | 323,211 |
|
| Long-term debt of consolidated VIEs | 49,054 |
| | 71,013 |
| 34,256 |
| | 49,054 |
|
| Total long-term debt | $ | 372,265 |
| | $ | 448,431 |
| $ | 275,585 |
| | $ | 372,265 |
|
Bank of America Corporation, Merrill Lynch & Co., Inc. and subsidiaries, and Bank of America, N.A. maintain various U.S. and non-U.S. debt programs to offer both senior and subordinated notes. The notes may be denominated in U.S. dollars or foreign currencies. At December 31, 20112012 and 20102011, the amount of foreign currency-denominated debt translated into U.S. dollars included in total long-term debt was $117.095.3 billion and $145.9117.0 billion. Foreign currency contracts aremay be used to convert certain
foreign currency-denominated debt into U.S. dollars.
At December 31, 20112012, long-term debt of consolidated VIEs in the table above included credit card, automobile, home equity and other VIEs of $33.122.3 billion, $2.9 billion713 million, $3.12.3 billion and $10.08.9 billion, respectively. Long-term debt of VIEs is collateralized by the assets of the VIEs. For more information, see Note 87 – Securitizations and Other Variable Interest Entities.The majority of the floating rates are based on three- and six-month LIBOR.
|
| | |
| | 216Bank of America 20112012223
| | |
At December 31, 20112012 and 20102011, Bank of America Corporation had approximately $69.8154.9 billion and $88.469.8 billion of authorized, but unissued corporate debt and other securities under its existing U.S. shelf registration statements. At December 31, 20112012 and 20102011, Bank of America, N.A. had approximately $67.365.5 billion and $53.362.4 billion of authorized, but unissued bank notes under its existing $75 billion bank note program. Long-term bank notes issued and outstanding under the program totaled $6.35.6 billion and $7.16.3 billion at December 31, 20112012 and 20102011. At both December 31, 20112012 and 20102011, Bank of America, N.A. had approximately $20.6 billion of authorized, but unissued mortgage notes under its $30.0 billion mortgage bond program.
The weighted-average effective interest rates for total long-term debt (excluding senior structured notes), total fixed-rate debt and total floating-rate debt were 4.71 percent, 5.52 percent and 0.93 percent, respectively, at December 31, 2012 and 4.35 percent, 5.17 percent and 1.38 percent, respectively, at December 31, 2011 and 3.96 percent, 5.02 percent and 1.09 percent, respectively, at December 31, 2010. The Corporation’s ALM activities maintain an overall interest rate risk management strategy that incorporates the use of interest rate contracts to manage fluctuations in earnings that are caused by interest rate volatility. The Corporation’s goal is to manage interest rate sensitivity so that movements in interest
rates do not significantly adversely affect earnings and capital. The above weighted-average rates are the contractual interest rates on the debt and do not reflect the impacts of derivative transactions.
The weighted-average interest rate for debt, excluding senior structured notes, issued by Merrill Lynch & Co., Inc. and subsidiaries was 4.744.73 percent and 4.114.74 percent at December 31, 20112012 and 20102011. As of December 31, 20112012, the Corporation has not assumed or guaranteed the $105.689.0 billion of long-term debt that was issued or guaranteed by Merrill Lynch & Co., Inc. or its subsidiaries prior to the acquisition of Merrill Lynch by the Corporation. All existing Merrill Lynch & Co., Inc. guarantees of securities issued by certain Merrill Lynch subsidiaries under various non-U.S. securities offering programs will remain in full force and effect as long as those securities are outstanding, and the Corporation has not assumed any of those prior Merrill Lynch & Co., Inc. guarantees or otherwise guaranteed such securities.
Certain senior structured notes are accounted for under the fair value option. For more information on these senior structured notes, see Note 2322 – Fair Value Option.
The table below representsshows the carrying value for aggregate annual maturities of long-term debt at December 31, 20112012.
| | | | | | | | | | | | | | | | | | | | | | | | | | | | | |
| Long-term Debt by Maturity | | | | | | | | | | | | | | | | | | | | | | | | | | |
| | | | | | | | | | | | | | | | | | | | | | | | | | | |
| (Dollars in millions) | 2012 | | 2013 | | 2014 | | 2015 | | 2016 | | Thereafter | | Total | 2013 | | 2014 | | 2015 | | 2016 | | 2017 | | Thereafter | | Total |
| Bank of America Corporation | $ | 43,877 |
| | $ | 9,967 |
| | $ | 19,166 |
| | $ | 13,895 |
| | $ | 20,575 |
| | $ | 73,940 |
| | $ | 181,420 |
| $ | 12,457 |
| | $ | 20,888 |
| | $ | 16,812 |
| | $ | 20,401 |
| | $ | 19,575 |
| | $ | 43,806 |
| | $ | 133,939 |
|
| Merrill Lynch & Co., Inc. and subsidiaries | 22,494 |
| | 16,579 |
| | 17,784 |
| | 4,415 |
| | 3,897 |
| | 38,954 |
| | 104,123 |
| 24,000 |
| | 18,207 |
| | 5,156 |
| | 3,542 |
| | 8,886 |
| | 29,975 |
| | 89,766 |
|
| Bank of America, N.A. and other subsidiaries | 5,776 |
| | — |
| | 29 |
| | — |
| | 1,134 |
| | 7,928 |
| | 14,867 |
| 62 |
| | 1 |
| | — |
| | 1,095 |
| | 6,472 |
| | 1,865 |
| | 9,495 |
|
| Other debt | 13,738 |
| | 4,888 |
| | 1,658 |
| | 380 |
| | 15 |
| | 2,122 |
| | 22,801 |
| 4,858 |
| | 1,547 |
| | 204 |
| | 15 |
| | 17 |
| | 1,488 |
| | 8,129 |
|
| Total long-term debt excluding consolidated VIEs | 85,885 |
| | 31,434 |
| | 38,637 |
| | 18,690 |
| | 25,621 |
| | 122,944 |
| | 323,211 |
| 41,377 |
| | 40,643 |
| | 22,172 |
| | 25,053 |
| | 34,950 |
| | 77,134 |
| | 241,329 |
|
| Long-term debt of consolidated VIEs | 11,530 |
| | 14,353 |
| | 9,201 |
| | 1,330 |
| | 2,898 |
| | 9,742 |
| | 49,054 |
| 13,820 |
| | 8,734 |
| | 1,460 |
| | 2,091 |
| | 1,815 |
| | 6,336 |
| | 34,256 |
|
| Total long-term debt | $ | 97,415 |
| | $ | 45,787 |
| | $ | 47,838 |
| | $ | 20,020 |
| | $ | 28,519 |
| | $ | 132,686 |
| | $ | 372,265 |
| $ | 55,197 |
| | $ | 49,377 |
| | $ | 23,632 |
| | $ | 27,144 |
| | $ | 36,765 |
| | $ | 83,470 |
| | $ | 275,585 |
|
Included in the above table are certain structured notes that contain provisions whereby the borrowings are redeemable at the option of the holder (put options) at specified dates prior to maturity. Other structured notes have coupon or repayment terms linked to the performance of debt or equity securities, indices, currencies or commodities and the maturity may be accelerated based on the value of a referenced index or security. In both cases, the Corporation or a subsidiary may be required to settle the obligation for cash or other securities prior to the contractual maturity date. These borrowings are reflected in the above table as maturing at their earliest put or redemption date.
In 2012, in a combination of tender offers, calls and open-market transactions, the Corporation purchased senior and subordinated long-term debt with a carrying value of $12.4 billion and recorded net gains of $1.3 billion in connection with these transactions.
Trust Preferred and Hybrid Securities
Trust preferred securities (Trust Securities) are primarily issued by trust companies (the Trusts) that are not consolidated. These Trust Securities are mandatorily redeemable preferred security obligations of the Trusts. The sole assets of the Trusts generally are junior subordinated deferrable interest notes of the Corporation or its subsidiaries (the Notes). The Trusts generally are 100 percent-owned finance subsidiaries of the Corporation. Obligations associated with the Notes are included in the long-term debt table on page 216223.
Certain of the Trust Securities were issued at a discount and may be redeemed prior to maturity at the option of the Corporation. The Trusts generally have invested the proceeds of such Trust Securities in the Notes. Each issue of the Notes has an interest rate equal to the corresponding Trust Securities distribution rate.
The Corporation has the right to defer payment of interest on the Notes at any time or from time to time for a period not exceeding five years provided that no extension period may extend beyond the stated maturity of the relevant Notes. During any such extension period, distributions on the Trust Securities will also be deferred and the Corporation’s ability to pay dividends on its common and preferred stock will be restricted.
The Trust Securities generally are subject to mandatory redemption upon repayment of the related Notes at their stated maturity dates or their earlier redemption at a redemption price equal to their liquidation amount plus accrued distributions to the date fixed for redemption and the premium, if any, paid by the Corporation upon concurrent repayment of the related Notes.
Periodic cash payments and payments upon liquidation or redemption with respect to Trust Securities are guaranteed by the Corporation or its subsidiaries to the extent of funds held by the Trusts (the Preferred Securities Guarantee). The Preferred Securities Guarantee, when taken together with the Corporation’s other obligations including its obligations under the Notes, generally will constitute a full and unconditional guarantee, on a subordinated basis, by the Corporation of payments due on the Trust Securities.
Hybrid Income Term Securities (HITS) totaling $1.6 billion were issued by the Trusts to institutional investors during 2007. The BAC Capital Trust XIII Floating-Rate Preferred HITS had a distribution rate of three-month LIBOR plus 40 bps and the BAC Capital Trust XIV Fixed-to-Floating Rate Preferred HITS had an initial distribution rate of 5.63 percent. Both series of HITS represent
|
| | |
224 Bank of America 2012 | | Bank of America217
|
beneficial interestsIn 2012, as described in Note 14 – Shareholders’ Equity, the Corporation entered into various agreements with certain Trust Securities holders pursuant to which the Corporation issued 19 million shares of common stock valued at $159 million and paid $9.4 billion in cash in exchange for $9.8 billion aggregate liquidation amount of previously issued Trust Securities. Upon the exchange, the Corporation immediately surrendered the Trust Securities to the unconsolidated Trusts for cancellation, resulting in the assetscancellation of an equal amount of junior subordinated notes that had a carrying value of $9.9 billion, resulting in a gain on extinguishment of debt of $282 million.
During 2012, the Corporation remarketed the remaining outstanding $141 million in aggregate principal amount of its BAC Capital Trust XIII Floating-Rate Preferred Hybrid Income Term Securities (HITS) and the remaining outstanding $493 million in aggregate principal amount of its BAC Capital Trust XIV Fixed-to-Floating Rate Preferred HITS. The Corporation repurchased and retired all of the respective capital trust,remarketable notes in the remarketings. The net proceeds from the remarketing of the BAC Capital Trust XIII Floating-Rate Preferred HITS were used to satisfy the obligations of Trust XIII under a stockpurchase contract agreement, pursuant to which consist of a seriesTrust XIII was obligated to purchase, and the Corporation was obligated to sell, 1,409 shares of the Corporation’s junior subordinated notes andSeries F Floating Rate Non-Cumulative Preferred Stock (Series F Preferred Stock). The net proceeds from the remarketing of the BAC Capital Trust XIV Fixed-to-Floating Rate Preferred HITS were used to satisfy the obligations of Trust XIV under a stock purchase contract for a specified seriesagreement, pursuant to which Trust XIV was obligated to purchase, and the Corporation was obligated to sell, 4,926 shares of the Corporation’s preferred stock. The Corporation will remarket the junior subordinated notes underlying each series of HITS on or about the five-year anniversary of the issuance to obtain sufficient funds for the capital trusts to buy the Corporation’s preferred stock under the stock purchase contracts.Series G Adjustable Rate Non-Cumulative Preferred Stock (Series G Preferred Stock). Following the successful remarketing of the notes and the subsequent purchase of the Corporation’s preferred stock under the stock purchase contracts, the preferred stock will constituteconstitutes the sole asset of the applicable trust.
In connection with the HITS, the Corporation entered into two replacement capital covenants for the benefit of investors in certain series of the Corporation’s long-term indebtedness (Covered Debt). As of December 31, 2011, the Corporation’s 6.625% Junior Subordinated Notes due 2036 constitute the Covered Debt under the covenant corresponding to the Floating-Rate Preferred HITS and the Corporation’s 5.625% Junior Subordinated Notes due 2035 constitute the Covered Debt under the covenant corresponding to the Fixed-to-Floating Rate Preferred HITS. These covenants generally restrict the ability of the Corporation and its subsidiaries to redeem or purchase the HITS and related securities unless the Corporation has obtained the prior approval of the Federal Reserve if required under the Federal Reserve’s capital guidelines, the redemption or purchase price of the HITS does not exceed the amount received by the Corporation from the sale of certain qualifying securities, and such replacement securities qualify as Tier 1 capital and are not “restricted core capital elements” under the Federal Reserve’s guidelines.
In 2011, as part of the exchange agreements described in Note 15 – Shareholders’ Equity2011, the Corporation issued 282 million shares of common stock valued at $1.6 billion and senior notes valued at $1.5 billion in exchange for $3.8 billion aggregate liquidation amount of previously issued Trust Securities. Upon the exchange, the Corporation immediately surrendered the Trust Securities to the unconsolidated Trusts for cancellation, resulting in the cancellation of an equal amount of junior subordinated notes that had a carrying value of $4.3 billion, resulting in a gain on extinguishment of debt of $1.2 billion. In addition, the Corporation issued 26 million shares of common stock valued at $138 million and senior notes valued at $505 million in exchange for $917 million aggregate liquidation amount of HITS. Upon the exchange, the Corporation immediately surrendered the HITS to the unconsolidated Trusts for cancellation, resulting in the cancellation of an equal amount of junior subordinated notes that had a carrying value of $915 million, and the cancellation of a corresponding amount of the underlying stock purchase contract, resulting in a
$12 million loss on extinguishment of debt and an increase to additional paid-in capital of $284 million. For additional information regarding these exchanges, see Note 15 – Shareholders’ Equity.
The table below lists each series of Trust Securities or HITS, and the corresponding aggregate liquidation preference covered by the Exchange Agreements.Agreements described in Note 14 – Shareholders’ Equity, and other redemption activity.
|
| | | |
| | |
| Negotiated Exchanges | |
| | |
| | Aggregate Liquidation Amount Exchanged |
| |
| (Dollars in millions) |
| HITS | |
| Trust XIII | $ | 559 |
|
| Trust XIV | 358 |
|
| Trust Securities | |
| BAC Capital Trust I | 1 |
|
| BAC Capital Trust II | 2 |
|
| BAC Capital Trust III | 1 |
|
| BAC Capital Trust IV | 8 |
|
| BAC Capital Trust V | 4 |
|
| BAC Capital Trust VI | 823 |
|
BAC Capital Trust VII (1) | 1,114 |
|
| BAC Capital Trust VIII | 4 |
|
| BAC Capital Trust X | 9 |
|
| BAC Capital Trust XI | 198 |
|
| BAC Capital Trust XV | 446 |
|
| NB Capital Trust II | 76 |
|
| NB Capital Trust III | 269 |
|
| NB Capital Trust IV | 73 |
|
| Fleet Capital Trust II | 47 |
|
| Bank of America Capital III | 226 |
|
| Fleet Capital Trust V | 142 |
|
| BankBoston Capital Trust III | 136 |
|
| BankBoston Capital Trust IV | 95 |
|
| MBNA Capital B | 165 |
|
| Total exchanged | $ | 4,756 |
|
|
| | | | | | | | | | | |
| | | | | | |
| Negotiated Exchanges | | | | | |
| | | | | | |
| | 2012 Aggregate Liquidation Amount Exchanged | | 2011 Aggregate Liquidation Amount Exchanged | | Total Aggregate Liquidation Amount Exchanged |
| |
| (Dollars in millions) |
| HITS | | | | | |
| Trust XIII | $ | — |
| | $ | 559 |
| | $ | 559 |
|
| Trust XIV | — |
| | 358 |
| | 358 |
|
| Trust Securities | | | | | |
| Bank of America Capital Trust I | 574 |
| | 1 |
| | 575 |
|
| Bank of America Capital Trust II | 898 |
| | 2 |
| | 900 |
|
| Bank of America Capital Trust III | 499 |
| | 1 |
| | 500 |
|
| Bank of America Capital Trust IV | 367 |
| | 8 |
| | 375 |
|
| Bank of America Capital Trust V | 514 |
| | 4 |
| | 518 |
|
| Bank of America Capital Trust VI | 141 |
| | 823 |
| | 964 |
|
Bank of America Capital Trust VII (1) | 212 |
| | 1,114 |
| | 1,326 |
|
| Bank of America Capital Trust VIII | 2 |
| | 4 |
| | 6 |
|
| Bank of America Capital Trust X | 891 |
| | 9 |
| | 900 |
|
| Bank of America Capital Trust XI | 144 |
| | 198 |
| | 342 |
|
| Bank of America Capital Trust XII | 863 |
| | — |
| | 863 |
|
| Bank of America Capital Trust XV | 50 |
| | 446 |
| | 496 |
|
| NationsBank Capital Trust II | 289 |
| | 76 |
| | 365 |
|
| NationsBank Capital Trust III | 98 |
| | 269 |
| | 367 |
|
| NationsBank Capital Trust IV | 427 |
| | 73 |
| | 500 |
|
| BankAmerica Capital II | 450 |
| | — |
| | 450 |
|
| BankAmerica Capital III | 68 |
| | 226 |
| | 294 |
|
| BankAmerica Institutional Capital A | 450 |
| | — |
| | 450 |
|
| BankAmerica Institutional Capital B | 300 |
| | — |
| | 300 |
|
| Barnett Capital III | 186 |
| | — |
| | 186 |
|
| Fleet Capital Trust II | 203 |
| | 47 |
| | 250 |
|
| Fleet Capital Trust V | 29 |
| | 142 |
| | 171 |
|
| Fleet Capital Trust VIII | 534 |
| | — |
| | 534 |
|
| Fleet Capital Trust IX | 175 |
| | — |
| | 175 |
|
| BankBoston Capital Trust III | 59 |
| | 136 |
| | 195 |
|
| BankBoston Capital Trust IV | 52 |
| | 96 |
| | 148 |
|
| Progress Capital Trust I | 9 |
| | — |
| | 9 |
|
| Progress Capital Trust III | 10 |
| | — |
| | 10 |
|
| MBNA Capital Trust A | 250 |
| | — |
| | 250 |
|
| MBNA Capital Trust B | 45 |
| | 165 |
| | 210 |
|
| MBNA Capital Trust D | 300 |
| | — |
| | 300 |
|
| MBNA Capital Trust E | 200 |
| | — |
| | 200 |
|
| LaSalle Series I | 455 |
| | — |
| | 455 |
|
| LaSalle Series J | 67 |
| | — |
| | 67 |
|
| Total exchanged | $ | 9,811 |
| | $ | 4,757 |
| | $ | 14,568 |
|
| |
(1) | Notes were denominated in British Pound. Presentation currency is U.S. Dollar. |
On May 25, 2012, the Corporation completed the repurchase of $134 million aggregate liquidation amount of capital securities of BAC Capital Trust VI, pursuant to a previously announced tender offer for such securities, and the related cancellation and retirement of the underlying 5.625% Junior Subordinated Notes, were denominateddue 2035 of the Corporation issued to and held by BAC Capital Trust VI. As a result of this repurchase of capital securities and the related cancellation and retirement of the underlying 5.625% Junior Subordinated Notes, the series of covered debt benefiting from the Corporation’s replacement capital covenant,executed February 16, 2007 in British Pound. Presentation currency is U.S. Dollar.connection with the issuance by BAC Capital Trust XIV of its 5.63% Fixed-to-Floating Rate Preferred Hybrid Income Term Securities (the Replacement Capital Covenant), was redesignated. Effective as of May 25, 2012, the 5.625% Junior
Subordinated Notes ceased being the covered debt under the Replacement Capital Covenant. Also effective as of May 25, 2012, theCorporation’s 6.875% Junior Subordinated Notes, due 2055 underlying the capital securities of BAC CapitalTrust XII, became the covered debt with respect to and in accordance with the terms of the ReplacementCapital Covenant.
The Trust Securities Summary table details the outstanding Trust Securities HITS and the related Notes previously issued which remained outstanding at December 31, 20112012, as originated by Bank of America Corporation and its predecessor companies and subsidiaries, after consideration of the exchange agreements.subsidiaries. For additional information on Trust Securities for regulatory capital purposes, see Note 1817 – Regulatory Requirements and Restrictions.
| | | | | | | | | | | | | | | | | |
| Trust Securities Summary | Trust Securities Summary | | | | | | Trust Securities Summary | | | | | |
| | | | | | | | | | | | | | | |
| (Dollars in millions) | | | | | | | | | | | | | | | | | | |
| Issuer | Issuance Date | | Aggregate
Principal
Amount of Trust Securities | | Aggregate
Principal
Amount of the Notes | Stated Maturity of the Notes | Per Annum Interest Rate of the Notes | | Interest Payment Dates | | Redemption Period | Issuance Date | | Aggregate
Principal
Amount of Trust Securities | | Aggregate
Principal
Amount of the Notes | Stated Maturity of the Trust Securities | Per Annum Interest Rate of the Notes | | Interest Payment Dates | | Redemption Period |
| Bank of America | | | |
| | |
| | |
| | | | | | | |
| | |
| | |
| | | | |
| Capital Trust I | December 2001 | | $ | 574 |
| | $ | 592 |
| December 2031 | 7.00 | % | | 3/15,6/15,9/15,12/15 | | On or after 12/15/06 | |
| Capital Trust II | January 2002 | | 898 |
| | 926 |
| February 2032 | 7.00 |
| | 2/1,5/1,8/1,11/1 | | On or after 2/01/07 | |
| Capital Trust III | August 2002 | | 500 |
| | 516 |
| August 2032 | 7.00 |
| | 2/15,5/15,8/15,11/15 | | On or after 8/15/07 | |
| Capital Trust IV | April 2003 | | 367 |
| | 379 |
| May 2033 | 5.88 |
| | 2/1,5/1,8/1,11/1 | | On or after 5/01/08 | |
| Capital Trust V | November 2004 | | 514 |
| | 530 |
| November 2034 | 6.00 |
| | 2/3,5/3,8/3,11/3 | | On or after 11/03/09 | |
| Capital Trust VI | March 2005 | | 177 |
| | 208 |
| March 2035 | 5.63 |
| | 3/8,9/8 | | Any time | March 2005 | | $ | 36 |
| | $ | 37 |
| March 2035 | 5.63 | % | | 3/8,9/8 | | Any time |
Capital Trust VII (1) | August 2005 | | 260 |
| | 258 |
| August 2035 | 5.25 |
| | 2/10,8/10 | | Any time | August 2005 | | 9 |
| | 9 |
| August 2035 | 5.25 |
| | 2/10,8/10 | | Any time |
| Capital Trust VIII | August 2005 | | 526 |
| | 542 |
| August 2035 | 6.00 |
| | 2/25,5/25,8/25,11/25 | | On or after 8/25/10 | August 2005 | | 524 |
| | 540 |
| August 2035 | 6.00 |
| | 2/25,5/25,8/25,11/25 | | On or after 8/25/10 |
| Capital Trust X | March 2006 | | 891 |
| | 919 |
| March 2055 | 6.25 |
| | 3/29,6/29,9/29,12/29 | | On or after 3/29/11 | |
| Capital Trust XI | May 2006 | | 802 |
| | 833 |
| May 2036 | 6.63 |
| | 5/23,11/23 | | Any time | May 2006 | | 658 |
| | 678 |
| May 2036 | 6.63 |
| | 5/23,11/23 | | Any time |
| Capital Trust XII | August 2006 | | 863 |
| | 890 |
| August 2055 | 6.88 |
| | 2/2,5/2,8/2,11/2 | | On or after 8/02/11 | |
| Capital Trust XIII | February 2007 | | 141 |
| | 141 |
| March 2043 | 3-mo. LIBOR +40 bps |
| | 3/15,6/15,9/15,12/15 | | On or after 3/15/17 | |
| Capital Trust XIV | February 2007 | | 492 |
| | 492 |
| March 2043 | 5.63 |
| | 3/15,9/15 | | On or after 3/15/17 | |
| Capital Trust XV | May 2007 | | 54 |
| | 54 |
| June 2056 | 3-mo. LIBOR +80 bps |
| | 3/1,6/1,9/1,12/1 | | On or after 6/01/37 | May 2007 | | 4 |
| | 4 |
| June 2056 | 3-mo. LIBOR +80 bps |
| | 3/1,6/1,9/1,12/1 | | On or after 6/01/37 |
| NationsBank | | | |
| | |
| | |
| | | | | | | |
| | |
| | |
| | | | |
| Capital Trust II | December 1996 | | 289 |
| | 300 |
| December 2026 | 7.83 |
| | 6/15,12/15 | | On or after 12/15/06 | |
| Capital Trust III | February 1997 | | 231 |
| | 246 |
| January 2027 | 3-mo. LIBOR +55 bps |
| | 1/15,4/15,7/15,10/15 | | On or after 1/15/07 | February 1997 | | 133 |
| | 137 |
| January 2027 | 3-mo. LIBOR +55 bps |
| | 1/15,4/15,7/15,10/15 | | On or after 1/15/07 |
| Capital Trust IV | April 1997 | | 427 |
| | 442 |
| April 2027 | 8.25 |
| | 4/15,10/15 | | On or after 4/15/07 | |
| BankAmerica | | | |
| | |
| | |
| | | | | | | |
| | |
| | |
| | | | |
| Institutional Capital A | November 1996 | | 450 |
| | 464 |
| December 2026 | 8.07 |
| | 6/30,12/31 | | On or after 12/31/06 | |
| Institutional Capital B | November 1996 | | 300 |
| | 309 |
| December 2026 | 7.70 |
| | 6/30,12/31 | | On or after 12/31/06 | |
| Capital II | December 1996 | | 450 |
| | 464 |
| December 2026 | 8.00 |
| | 6/15,12/15 | | On or after 12/15/06 | |
| Capital III | January 1997 | | 174 |
| | 186 |
| January 2027 | 3-mo. LIBOR +57 bps |
| | 1/15,4/15,7/15,10/15 | | On or after 1/15/02 | January 1997 | | 106 |
| | 109 |
| January 2027 | 3-mo. LIBOR +57 bps |
| | 1/15,4/15,7/15,10/15 | | On or after 1/15/02 |
| Barnett | | | |
| | |
| | |
| | | | | | | |
| | |
| | |
| | | | |
| Capital III | January 1997 | | 250 |
| | 258 |
| February 2027 | 3-mo. LIBOR +62.5 bps |
| | 2/1,5/1,8/1,11/1 | | On or after 2/01/07 | January 1997 | | 64 |
| | 66 |
| February 2027 | 3-mo. LIBOR +62.5 bps |
| | 2/1,5/1,8/1,11/1 | | On or after 2/01/07 |
| Fleet | | | |
| | |
| | |
| | | | | | | |
| | |
| | |
| | | | |
| Capital Trust II | December 1996 | | 203 |
| | 211 |
| December 2026 | 7.92 |
| | 6/15,12/15 | | On or after 12/15/06 | |
| Capital Trust V | December 1998 | | 108 |
| | 116 |
| December 2028 | 3-mo. LIBOR +100 bps |
| | 3/18,6/18,9/18,12/18 | | On or after 12/18/03 | December 1998 | | 79 |
| | 82 |
| December 2028 | 3-mo. LIBOR +100 bps |
| | 3/18,6/18,9/18,12/18 | | On or after 12/18/03 |
| Capital Trust VIII | March 2002 | | 534 |
| | 550 |
| March 2032 | 7.20 |
| | 3/15,6/15,9/15,12/15 | | On or after 3/08/07 | |
| Capital Trust IX | July 2003 | | 175 |
| | 180 |
| August 2033 | 6.00 |
| | 2/1,5/1,8/1,11/1 | | On or after 7/31/08 | |
| BankBoston | | | |
| | |
| | |
| | | | | | | |
| | |
| | |
| | | | |
| Capital Trust III | June 1997 | | 114 |
| | 122 |
| June 2027 | 3-mo. LIBOR +75 bps |
| | 3/15,6/15,9/15,12/15 | | On or after 6/15/07 | June 1997 | | 55 |
| | 57 |
| June 2027 | 3-mo. LIBOR +75 bps |
| | 3/15,6/15,9/15,12/15 | | On or after 6/15/07 |
| Capital Trust IV | June 1998 | | 155 |
| | 163 |
| June 2028 | 3-mo. LIBOR +60 bps |
| | 3/8,6/8,9/8,12/8 | | On or after 6/08/03 | June 1998 | | 102 |
| | 106 |
| June 2028 | 3-mo. LIBOR +60 bps |
| | 3/8,6/8,9/8,12/8 | | On or after 6/08/03 |
| Progress | | | |
| | |
| | |
| | | | | | | |
| | |
| | |
| | | | |
| Capital Trust I | June 1997 | | 9 |
| | 9 |
| June 2027 | 10.50 |
| | 6/1,12/1 | | On or after 6/01/07 | |
| Capital Trust II | July 2000 | | 6 |
| | 6 |
| July 2030 | 11.45 |
| | 1/19,7/19 | | On or after 7/19/10 | July 2000 | | 6 |
| | 6 |
| July 2030 | 11.45 |
| | 1/19,7/19 | | On or after 7/19/10 |
| Capital Trust III | November 2002 | | 10 |
| | 10 |
| November 2032 | 3-mo. LIBOR +335 bps |
| | 2/15,5/15,8/15,11/15 | | On or after 11/15/07 | |
| Capital Trust IV | December 2002 | | 5 |
| | 5 |
| January 2033 | 3-mo. LIBOR +335 bps |
| | 1/7,4/7,7/7,10/7 | | On or after 1/07/08 | December 2002 | | 5 |
| | 5 |
| January 2033 | 3-mo. LIBOR +335 bps |
| | 1/7,4/7,7/7,10/7 | | On or after 1/07/08 |
| MBNA | | | |
| | |
| | |
| | | | | | | |
| | |
| | |
| | | | |
| Capital Trust A | December 1996 | | 250 |
| | 258 |
| December 2026 | 8.28 |
| | 6/1,12/1 | | On or after 12/01/06 | |
| Capital Trust B | January 1997 | | 115 |
| | 124 |
| February 2027 | 3-mo. LIBOR +80 bps |
| | 2/1,5/1,8/1,11/1 | | On or after 2/01/07 | January 1997 | | 70 |
| | 73 |
| February 2027 | 3-mo. LIBOR +80 bps |
| | 2/1,5/1,8/1,11/1 | | On or after 2/01/07 |
| Capital Trust D | June 2002 | | 300 |
| | 309 |
| October 2032 | 8.13 |
| | 1/1,4/1,7/1,10/1 | | On or after 10/01/07 | |
| Capital Trust E | November 2002 | | 200 |
| | 206 |
| February 2033 | 8.10 |
| | 2/15,5/15,8/15,11/15 | | On or after 2/15/08 | |
| ABN AMRO North America | | | |
| | |
| | |
| | | | | | | |
| | |
| | |
| | | | |
| Series I | May 2001 | | 77 |
| | 77 |
| Perpetual | 3-mo. LIBOR +175 bps |
| | 2/15,5/15,8/15,11/15 | | On or after 11/08/12 | May 2001 | | 77 |
| | 77 |
| Perpetual | 3-mo. LIBOR +275 bps |
| | 2/15,5/15,8/15,11/15 | | On or after 11/08/12 |
| Series II | May 2001 | | 77 |
| | 77 |
| Perpetual | 3-mo. LIBOR +175 bps |
| | 3/15,6/15,9/15,12/15 | | On or after 11/08/12 | May 2001 | | 77 |
| | 77 |
| Perpetual | 3-mo. LIBOR +275 bps |
| | 3/15,6/15,9/15,12/15 | | On or after 11/08/12 |
| Series III | May 2001 | | 77 |
| | 77 |
| Perpetual | 3-mo. LIBOR +175 bps |
| | 1/15,4/15,7/15,10/15 | | On or after 11/08/12 | May 2001 | | 77 |
| | 77 |
| Perpetual | 3-mo. LIBOR +275 bps |
| | 1/15,4/15,7/15,10/15 | | On or after 11/08/12 |
| Series IV | May 2001 | | 77 |
| | 77 |
| Perpetual | 3-mo. LIBOR +175 bps |
| | 2/28,5/30,8/30,11/30 | | On or after 11/08/12 | May 2001 | | 77 |
| | 77 |
| Perpetual | 3-mo. LIBOR +275 bps |
| | 2/28,5/30,8/30,11/30 | | On or after 11/08/12 |
| Series V | May 2001 | | 77 |
| | 77 |
| Perpetual | 3-mo. LIBOR +175 bps |
| | 3/30,6/30,9/30,12/30 | | On or after 11/08/12 | May 2001 | | 77 |
| | 77 |
| Perpetual | 3-mo. LIBOR +275 bps |
| | 3/30,6/30,9/30,12/30 | | On or after 11/08/12 |
| Series VI | May 2001 | | 77 |
| | 77 |
| Perpetual | 3-mo. LIBOR +175 bps |
| | 1/30,4/30,7/30,10/30 | | On or after 11/08/12 | May 2001 | | 77 |
| | 77 |
| Perpetual | 3-mo. LIBOR +275 bps |
| | 1/30,4/30,7/30,10/30 | | On or after 11/08/12 |
| Series VII | May 2001 | | 88 |
| | 88 |
| Perpetual | 3-mo. LIBOR +175 bps |
| | 3/15,6/15,9/15,12/15 | | On or after 11/08/12 | May 2001 | | 88 |
| | 88 |
| Perpetual | 3-mo. LIBOR +275 bps |
| | 3/15,6/15,9/15,12/15 | | On or after 11/08/12 |
| Series IX | June 2001 | | 70 |
| | 70 |
| Perpetual | 3-mo. LIBOR +175 bps |
| | 3/5,6/5,9/5,12/5 | | On or after 11/08/12 | June 2001 | | 70 |
| | 70 |
| Perpetual | 3-mo. LIBOR +275 bps |
| | 3/5,6/5,9/5,12/5 | | On or after 11/08/12 |
| Series X | June 2001 | | 53 |
| | 53 |
| Perpetual | 3-mo. LIBOR +175 bps |
| | 3/12,6/12,9/12,12/12 | | On or after 11/08/12 | June 2001 | | 53 |
| | 53 |
| Perpetual | 3-mo. LIBOR +275 bps |
| | 3/12,6/12,9/12,12/12 | | On or after 11/08/12 |
| Series XI | June 2001 | | 27 |
| | 27 |
| Perpetual | 3-mo. LIBOR +175 bps |
| | 3/26,6/26,9/26,12/26 | | On or after 11/08/12 | June 2001 | | 27 |
| | 27 |
| Perpetual | 3-mo. LIBOR +275 bps |
| | 3/26,6/26,9/26,12/26 | | On or after 11/08/12 |
| Series XII | June 2001 | | 80 |
| | 80 |
| Perpetual | 3-mo. LIBOR +175 bps |
| | 1/10,4/10,7/10,10/10 | | On or after 11/08/12 | June 2001 | | 80 |
| | 80 |
| Perpetual | 3-mo. LIBOR +275 bps |
| | 1/10,4/10,7/10,10/10 | | On or after 11/08/12 |
| Series XIII | June 2001 | | 70 |
| | 70 |
| Perpetual | 3-mo. LIBOR +175 bps |
| | 1/24,4/24,7/24,10/24 | | On or after 11/08/12 | June 2001 | | 70 |
| | 70 |
| Perpetual | 3-mo. LIBOR +275 bps |
| | 1/24,4/24,7/24,10/24 | | On or after 11/08/12 |
| LaSalle | | | |
| | |
| | |
| | | | | | | |
| | |
| | |
| | | | |
| Series I | August 2000 | | 491 |
| | 491 |
| Perpetual | 3-mo. LIBOR +105.5 bps
thereafter |
| | 3/15,6/15,9/15,12/15 | | On or after 9/15/10 | August 2000 | | 36 |
| | 36 |
| Perpetual | 3-mo. LIBOR +105.5 bps |
| | 3/15,6/15,9/15,12/15 | | On or after 9/15/10 |
| Series J | September 2000 | | 94 |
| | 94 |
| Perpetual | 3-mo. LIBOR +105.5 bps
thereafter |
| | 3/15,6/15,9/15,12/15 | | On or after 9/15/10 | September 2000 | | 27 |
| | 27 |
| Perpetual | 3-mo. LIBOR +105.5 bps |
| �� | 3/15,6/15,9/15,12/15 | | On or after 9/15/10 |
| Countrywide | | | |
| | |
| | |
| | | | | | | |
| | |
| | |
| | | | |
| Capital III | June 1997 | | 200 |
| | 206 |
| June 2027 | 8.05 |
| | 6/15,12/15 | | Only under special event | June 1997 | | 200 |
| | 206 |
| June 2027 | 8.05 |
| | 6/15,12/15 | | Only under special event |
| Capital IV | April 2003 | | 500 |
| | 515 |
| April 2033 | 6.75 |
| | 1/1,4/1,7/1,10/1 | | On or after 4/11/08 | April 2003 | | 500 |
| | 515 |
| April 2033 | 6.75 |
| | 1/1,4/1,7/1,10/1 | | On or after 4/11/08 |
| Capital V | November 2006 | | 1,495 |
| | 1,496 |
| November 2036 | 7.00 |
| | 2/1,5/1,8/1,11/1 | | On or after 11/01/11 | November 2006 | | 1,495 |
| | 1,496 |
| November 2036 | 7.00 |
| | 2/1,5/1,8/1,11/1 | | On or after 11/01/11 |
| Merrill Lynch | | | |
| | |
| | |
| | | | | | | |
| | |
| | |
| | | | |
| Preferred Capital Trust III | January 1998 | | 750 |
| | 900 |
| Perpetual | 7.00 |
| | 3/30,6/30,9/30,12/30 | | On or after 3/08 | January 1998 | | 750 |
| | 901 |
| Perpetual | 7.00 |
| | 3/30,6/30,9/30,12/30 | | On or after 3/08 |
| Preferred Capital Trust IV | June 1998 | | 400 |
| | 480 |
| Perpetual | 7.12 |
| | 3/30,6/30,9/30,12/30 | | On or after 6/08 | June 1998 | | 400 |
| | 480 |
| Perpetual | 7.12 |
| | 3/30,6/30,9/30,12/30 | | On or after 6/08 |
| Preferred Capital Trust V | November 1998 | | 850 |
| | 1,021 |
| Perpetual | 7.28 |
| | 3/30,6/30,9/30,12/30 | | On or after 9/08 | November 1998 | | 850 |
| | 1,021 |
| Perpetual | 7.28 |
| | 3/30,6/30,9/30,12/30 | | On or after 9/08 |
| Capital Trust I | December 2006 | | 1,050 |
| | 1,051 |
| December 2066 | 6.45 |
| | 3/15,6/15,9/15,12/15 | | On or after 12/11 | December 2006 | | 1,050 |
| | 1,051 |
| December 2066 | 6.45 |
| | 3/15,6/15,9/15,12/15 | | On or after 12/11 |
| Capital Trust II | May 2007 | | 950 |
| | 951 |
| June 2062 | 6.45 |
| | 3/15,6/15,9/15,12/15 | | On or after 6/12 | May 2007 | | 950 |
| | 951 |
| June 2062 | 6.45 |
| | 3/15,6/15,9/15,12/15 | | On or after 6/12 |
| Capital Trust III | August 2007 | | 750 |
| | 751 |
| September 2062 | 7.375 |
| | 3/15,6/15,9/15,12/15 | | On or after 9/12 | August 2007 | | 750 |
| | 751 |
| September 2062 | 7.375 |
| | 3/15,6/15,9/15,12/15 | | On or after 9/12 |
| Total | | | $ | 20,194 |
| | $ | 21,024 |
| | |
| | | | | | | $ | 9,709 |
| | $ | 10,194 |
| | |
| | | | |
| |
(1) | Notes were denominated in British Pound. Presentation currency is U.S. Dollar. |
|
| | |
226 Bank of America 2012 | | Bank of America219
|
NOTE 1413 Commitments and Contingencies
In the normal course of business, the Corporation enters into a number of off-balance sheet commitments. These commitments expose the Corporation to varying degrees of credit and market risk and are subject to the same credit and market risk limitation reviews as those instruments recorded on the Corporation’s Consolidated Balance Sheet.
Credit Extension Commitments
The Corporation enters into commitments to extend credit such as loan commitments, SBLCSBLCs and commercial letters of credit to meet the financing needs of its customers. The Credit Extension Commitments table below includes the notional amount of unfunded legally binding lending commitments net of amounts distributed (e.g., syndicated) to other financial institutions of $27.123.9 billion and $23.327.1 billion at December 31, 20112012 and 20102011. AtDecember 31, 2011, the
December 31, 2012, the carrying amount of these commitments, excluding commitments accounted for under the fair value option, was $741534 million, including deferred revenue of $2721 million and a reserve for unfunded lending commitments of $714513 million. At December 31, 20102011, the comparable amounts were $1.2 billion741 million, $2927 million and $1.2 billion714 million, respectively. The carrying amount of these commitments is classified in accrued expenses and other liabilities on the Corporation’s Consolidated Balance Sheet.
The table below also includes the notional amount of commitments of $25.718.3 billion and $27.325.7 billion at December 31, 20112012 and 20102011 that are accounted for under the fair value option. However, the table below excludes cumulative net fair value adjustments of $1.2 billion528 million and $866 million1.2 billion on these commitments, which are classified in accrued expenses and other liabilities. For information regarding the Corporation’s loan commitments accounted for under the fair value option, see Note 2322 – Fair Value Option.
| | | | | | | | | | | | | | | | | | | | | |
| Credit Extension Commitments | Credit Extension Commitments | | | | | Credit Extension Commitments | | | | |
| | | | | | | | | | | | | | | | | | | |
| | December 31, 2011 | December 31, 2012 |
| (Dollars in millions) | Expire in One
Year or Less | | Expire After One
Year Through
Three Years | | Expire After Three
Years Through
Five Years | | Expire After Five
Years | | Total | Expire in One
Year or Less | | Expire After One
Year Through
Three Years | | Expire After Three
Years Through
Five Years | | Expire After Five
Years | | Total |
| Notional amount of credit extension commitments | |
| | |
| | |
| | |
| | |
| |
| | |
| | |
| | |
| | |
|
| Loan commitments | $ | 96,291 |
| | $ | 85,413 |
| | $ | 120,770 |
| | $ | 15,009 |
| | $ | 317,483 |
| $ | 103,791 |
| | $ | 83,885 |
| | $ | 130,805 |
| | $ | 19,942 |
| | $ | 338,423 |
|
| Home equity lines of credit | 1,679 |
| | 7,765 |
| | 20,963 |
| | 37,066 |
| | 67,473 |
| 2,134 |
| | 13,584 |
| | 23,344 |
| | 21,856 |
| | 60,918 |
|
Standby letters of credit and financial guarantees (1) | 26,965 |
| | 18,932 |
| | 6,433 |
| | 5,505 |
| | 57,835 |
| 24,593 |
| | 11,387 |
| | 3,094 |
| | 4,751 |
| | 43,825 |
|
| Letters of credit | 2,828 |
| | 27 |
| | 5 |
| | 383 |
| | 3,243 |
| 2,003 |
| | 70 |
| | 10 |
| | 546 |
| | 2,629 |
|
| Legally binding commitments | 127,763 |
| | 112,137 |
| | 148,171 |
| | 57,963 |
| | 446,034 |
| 132,521 |
| | 108,926 |
| | 157,253 |
| | 47,095 |
| | 445,795 |
|
Credit card lines (2) | 449,097 |
| | — |
| | — |
| | — |
| | 449,097 |
| 414,044 |
| | — |
| | — |
| | — |
| | 414,044 |
|
| Total credit extension commitments | $ | 576,860 |
| | $ | 112,137 |
| | $ | 148,171 |
| | $ | 57,963 |
| | $ | 895,131 |
| $ | 546,565 |
| | $ | 108,926 |
| | $ | 157,253 |
| | $ | 47,095 |
| | $ | 859,839 |
|
| | | | | | | | | | | | | | | | | | | |
| | December 31, 2010 | December 31, 2011 |
| Notional amount of credit extension commitments | |
| | |
| | |
| | |
| | |
| |
| | |
| | |
| | |
| | |
|
| Loan commitments | $ | 152,926 |
| | $ | 144,461 |
| | $ | 43,465 |
| | $ | 16,172 |
| | $ | 357,024 |
| $ | 96,291 |
| | $ | 85,413 |
| | $ | 120,770 |
| | $ | 15,009 |
| | $ | 317,483 |
|
| Home equity lines of credit | 1,722 |
| | 4,290 |
| | 18,207 |
| | 55,886 |
| | 80,105 |
| 1,679 |
| | 7,765 |
| | 20,963 |
| | 37,066 |
| | 67,473 |
|
Standby letters of credit and financial guarantees (1) | 35,275 |
| | 18,940 |
| | 4,144 |
| | 5,897 |
| | 64,256 |
| 26,965 |
| | 18,932 |
| | 6,433 |
| | 5,505 |
| | 57,835 |
|
Letters of credit (3) | 3,698 |
| | 110 |
| | — |
| | 874 |
| | 4,682 |
| 2,828 |
| | 27 |
| | 5 |
| | 383 |
| | 3,243 |
|
| Legally binding commitments | 193,621 |
| | 167,801 |
| | 65,816 |
| | 78,829 |
| | 506,067 |
| 127,763 |
| | 112,137 |
| | 148,171 |
| | 57,963 |
| | 446,034 |
|
Credit card lines (2) | 497,068 |
| | — |
| | — |
| | — |
| | 497,068 |
| 449,097 |
| | — |
| | — |
| | — |
| | 449,097 |
|
| Total credit extension commitments | $ | 690,689 |
| | $ | 167,801 |
| | $ | 65,816 |
| | $ | 78,829 |
| | $ | 1,003,135 |
| $ | 576,860 |
| | $ | 112,137 |
| | $ | 148,171 |
| | $ | 57,963 |
| | $ | 895,131 |
|
| |
(1) | The notional amounts of SBLCs and financial guarantees classified as investment grade and non-investment grade based on the credit quality of the underlying reference name within the instrument were $31.5 billion and $11.6 billion at December 31, 2012, and $39.2 billion and $17.8 billion at December 31, 2011 and $41.1 billion and $22.4 billion at December 31, 2010. Amount includesAmounts include consumer SBLCs of$669 million and $859 million at December 31, 2012 and 2011. |
| |
(2) | Includes business card unused lines of credit. |
| |
(3)
| Amount includes $849 million of consumer letters of credit and $3.8 billion of commercial letters of credit at December 31, 2010.
|
Legally binding commitments to extend credit generally have specified rates and maturities. Certain of these commitments have adverse change clauses that help to protect the Corporation against deterioration in the borrower’s ability to pay.
Other Commitments
Global Principal Investments and Other Equity Investments
At December 31, 20112012 and 20102011, the Corporation had unfunded equity investment commitments of $772307 million and $1.5 billion772 million. In light of proposed Basel regulatory capital changes related to unfunded commitments, over the past twothree years, the Corporation has actively reduced these commitments in a series of sale transactions involving its private equity fund investments.
Other Commitments
At December 31, 20112012 and 20102011, the Corporation had commitments to purchase loans (e.g., residential mortgage and commercial real estate) of $2.51.3 billion and $2.62.5 billion, which upon settlement will be included in loans or LHFS.
At December 31, 20112012 and 20102011, the Corporation had commitments to enter into forward-dated resale and securities borrowing agreements of $67.067.3 billion and $39.467.0 billion. In addition, the Corporation had and commitments to enter into forward-dated repurchase and securities lending agreements of $42.042.3 billion and $33.542.0 billion. All of these commitments expire within the next 12 months.
The Corporation is a party to operating leases for certain of its premises and equipment. Commitments under these leases are approximately $3.0 billion, $2.62.5 billion, $2.02.1 billion, $1.61.7 billion and $1.31.5 billion for 20122013 through 20162017, respectively, and $6.16.2 billion in the aggregate for all years thereafter.
|
| | |
| | 220Bank of America 20112012227
| | |
The Corporation has entered into agreements with providers of market data, communications, systems consulting and other office-related services. At December 31, 2011 and 2010, the minimum fee commitments over the remaining terms of these agreements totaled $1.9 billion and $2.1 billion.
Other Guarantees
Bank-owned Life Insurance Book Value Protection
The Corporation sells products that offer book value protection to insurance carriers who offer group life insurance policies to corporations, primarily banks. The book value protection is provided on portfolios of intermediate investment-grade fixed-income securities and is intended to cover any shortfall in the event that policyholders surrender their policies and market value is below book value. To manage its exposure, the Corporation imposes significant restrictions on surrenders and the manner in which the portfolio is liquidated and the funds are accessed. In addition, investment parameters of the underlying portfolio are restricted. These constraints, combined with structural protections, including a cap on the amount of risk assumed on each policy, are designed to provide adequate buffers and guard against payments even under extreme stress scenarios. These guarantees are recorded as derivatives and carried at fair value in the trading portfolio. At both December 31, 20112012 and 20102011, the notional amount of these guarantees totaled$13.4 billion and $15.8 billion and the Corporation’s maximum exposure related to these guarantees totaled $5.13.0 billion and $5.03.4 billion with estimated maturity dates between 2030 and 2040. As of December 31, 2011, the Corporation had not made a payment under these products. The possibility of surrender or other payment associated with these guarantees exists. The net fair value ofincluding the liabilityfee receivable associated with these guarantees was $4852 million and $7848 million at December 31, 20112012 and 20102011 and reflects the probability of surrender as well as the multiple structural protection features in the contracts.
Employee Retirement Protection
The Corporation sells products that offer book value protection primarily to plan sponsors of the Employee Retirement Income Security Act of 1974 (ERISA) governed pension plans, such as 401(k) plans and 457 plans. The book value protection is provided on portfolios of intermediate/short-term investment-grade fixed-income securities and is intended to cover any shortfall in the event that plan participants continue to withdraw fundsmake qualified withdrawals after all securities have been liquidated and there is remaining book value. The Corporation retains the option to exit the contract at any time. If the Corporation exercises its option, the purchaser can requireinvestment manager will either terminate the Corporation to purchasecontract or convert the portfolio into a high-quality fixed-income securities,portfolio, typically all government or government-backed agency securities, with the proceeds of the liquidated assets to assure the return of principal. To manage its exposure, the Corporation imposes significant restrictions and constraints on the timing of the withdrawals, the manner in which the portfolio is liquidated and the funds are accessed, and the investment parameters of the underlying portfolio. These constraints, combined with significant structural protections, are designed to provide adequate buffers and guard against payments even under extreme stress scenarios. These guarantees are recorded as derivatives and carried at fair value in the trading portfolio. At December 31, 20112012 and 20102011, the notional amount of these guarantees totaled $28.818.4 billion and $33.828.8 billion with estimated maturity dates up to 2015 if the exit
option is exercised on all deals. As of December 31, 20112012, the Corporation had not made a payment under these products.
Indemnifications
In the ordinary course of business, the Corporation enters into various agreements that contain indemnifications, such as tax indemnifications, whereupon payment may become due if certain external events occur, such as a change in tax law. The indemnification clauses are often standard contractual terms and were entered into in the normal course of business based on an assessment that the risk of loss would be remote. These agreements typically contain an early termination clause that permits the Corporation to exit the agreement upon these events. The maximum potential future payment under indemnification agreements is difficult to assess for several reasons, including
the occurrence of an external event, the inability to predict future changes in tax and other laws, the difficulty in determining how such laws would apply to parties in contracts, the absence of exposure limits contained in standard contract language and the timing of the early termination clause. Historically, any payments made under these guarantees have been de minimis. The Corporation has assessed the probability of making such payments in the future as remote.
Merchant Services
During 2009, the Corporation contributed its merchant services business to a joint venture in exchange for a 46.5 percent ownership interest in the joint venture. In 2010, the joint venture purchased the interest held by one of the three initial investors bringing the Corporation’s ownership interest up to 49 percent. For additional information on the joint venture agreement, see Note 5 – Securities.
In accordance with credit and debit card association rules, the Corporation sponsors merchant processing servicers that process credit and debit card transactions on behalf of various merchants. In connection with these services, a liability may arise in the event of a billing dispute between the merchant and a cardholder that is ultimately resolved in the cardholder’s favor. If the merchant defaults on its obligation to reimburse the cardholder, the cardholder, through its issuing bank, generally has until six months after the date of the transaction to present a chargeback to the merchant processor, which is primarily liable for any losses on covered transactions. However, if the merchant processor fails to meet its obligation to reimburse the cardholder for disputed transactions, then the Corporation, as the sponsor, could be held liable for the disputed amount. In 20112012 and 20102011, the sponsored entities processed and settled $460.4604.2 billion and $339.4460.4 billion of transactions and recorded losses of $1110 million and $1711 million. A significant portion of this activity was processed by a joint venture in which the Corporation holds a 49 percent ownership. At December 31, 20112012 and 20102011, the Corporationsponsored merchant processing servicers held as collateral $238202 million and $25238 million of merchant escrow deposits which may be used to offset amounts due from the individual merchants.
The Corporation believes that the maximum potential exposure is not representative of the actual potential loss exposure. The Corporation believes the maximum potential exposure for chargebacks would not exceed the total amount of merchant transactions processed through Visa, MasterCard and Discover for the last six months, which represents the claim period for the cardholder, plus any outstanding delayed-delivery transactions. As of December 31, 20112012 and 20102011, the maximum potential exposure for sponsored transactions totaled approximately$263.9 billion and $236.0 billion
the actual potential loss exposure and$139.5 billion. The Corporation does not expect to make material payments in connection with these guarantees.
Other Derivative Contracts
The Corporation funds selected assets, including securities issued by CDOs and CLOs, through derivative contracts, typically total return swaps, with third parties and VIEs that are not consolidated on the Corporation’s Consolidated Balance Sheet. At December 31, 20112012 and 20102011, the total notional amount of these derivative contracts was approximately $3.22.9 billion and $4.33.2 billion with commercial banks and $1.81.4 billion and $1.71.8 billion with VIEs. The underlying securities are senior securities and substantially all of the Corporation’s exposures are insured. Accordingly, the Corporation’s exposure to loss consists principally of counterparty risk to the insurers. In certain circumstances, generally as a result of ratings downgrades, the Corporation may be required to purchase the underlying assets, which would not result in additional gain or loss to the Corporation as such exposure is already reflected in the fair value of the derivative contracts.
Other Guarantees
The Corporation sells products that guarantee the return of principal to investors at a preset future date. These guarantees cover a broad range of underlying asset classes and are designed to cover the shortfall between the market value of the underlying portfolio and the principal amount on the preset future date. To manage its exposure, the Corporation requires that these guarantees be backed by structural and investment constraints and certain pre-defined triggers that would require the underlying assets or portfolio to be liquidated and invested in zero-coupon bonds that mature at the preset future date. The Corporation is required to fund any shortfall between the proceeds of the liquidated assets and the purchase price of the zero-coupon bonds at the preset future date. These guarantees are recorded as derivatives and carried at fair value in the trading portfolio. At December 31, 2011 and 2010, the notional amount of these guarantees totaled $300 million and $666 million. These guarantees have various maturities ranging from two to five years. As of December 31, 2011 and 2010, the Corporation had not made a payment under these products and has assessed the probability of payments under these guarantees as remote.
The Corporation has entered into additional guarantee agreements and commitments, including lease-end obligation agreements, partial credit guarantees on certain leases, real estate joint venture guarantees, sold risk participation swaps, divested business commitments and sold put options that require gross settlement. The maximum potential future payment under these agreements was approximately $3.73.1 billion and $3.43.7 billion at December 31, 20112012 and 20102011. The estimated maturity dates of these obligations extend up to 2033. The Corporation has made no material payments under these guarantees.
In the normal course of business, the Corporation periodically guarantees the obligations of its affiliates in a variety of transactions including ISDA-related transactions and non ISDA-related transactions such as commodities trading, repurchase agreements, prime brokerage agreements and other transactions.
Payment Protection Insurance Claims Matter
In the U.K., the Corporation sellspreviously sold payment protection insurance (PPI) through its international card services business to credit card customers and has previously sold this insurance to consumer loan customers. PPI covers a consumer’s loan foror debt repayment if certain events occur such as loss of job or illness. In response to an elevated level of customer complaints of misleading sales tactics across the industry, heightened media coverage and pressure from consumer advocacy groups, the U.K. Financial Services Authority (FSA) investigated and raised concerns about the way some companies have handled complaints relatingrelated to the sale of these insurance policies. In August 2010, the FSA issued a policy statement (the FSA Policy Statement) on the assessment and remediation of PPI claims that is applicable to the Corporation’s U.K. consumer businesses and is intended to address concerns among consumers and regulators regarding the handling of PPI complaints across the industry. The FSA Policy Statement sets standards for the sale of PPI that apply to current and prior sales, and in the event a company does not or did not complyconnection with the standards, it is alleged that the insurance was incorrectly sold, giving the customer rights to remedies. The FSA Policy Statement also requires companies to review their sales practices and to proactively remediate non-complaining customers if evidence of a systematic breach of the newly articulated sales standards is discovered, which could include refunding premiums paid.
In October 2010, the British Bankers’ Association (BBA), on behalf of its members, includingthis matter, the Corporation challenged the provisions of the FSA Policy Statement and its retroactive application to sales of PPI to U.K. consumers throughestablished a judicial review process against the FSA and the U.K. Financial Ombudsman Service. On April 20, 2011, the U.K. court issued a judgment upholding the FSA Policy Statement as promulgated and dismissing the BBA’s challenge. The BBA did not appeal the decision. Following the conclusion of the judicial review and the subsequent completion of the detailed root cause analysis as required by the FSA Policy Statement, the Corporation reassessed its reserve for PPI claims during 2010.PPI. The total accrued liabilityreserve was $476510 million and $700476 million at December 31, 20112012 and 20102011. The Corporation recorded expense of $692 million and $77 million in 2012 and 2011. It is reasonably possible that the Corporation will incur additional expense related to PPI claims; however, the amount of such additional expense cannot be reasonably estimated.
Identity Theft Protection
The Corporation has received inquiries from and has been in discussions with regulatory authorities concerning activities related to identity theft protection services, including customers who may have paid for but did not receive certain of such services from third-party vendors of the Corporation, and whether appropriate oversight existed.
Litigation and Regulatory Matters
In the ordinary course of business, the Corporation and its subsidiaries are routinely defendants in or parties to many pending and threatened legal actions and proceedings, including actions brought on behalf of various classes of claimants. These actions and proceedings are generally based on alleged violations of consumer protection, securities, environmental, banking, employment, contract and other laws. In some of these actions and proceedings, claims for substantial monetary damages are asserted against the Corporation and its subsidiaries.
In the ordinary course of business, the Corporation and its subsidiaries are also subject to regulatory examinations, information gathering requests, inquiries, investigations, and investigations.threatened legal actions and proceedings. Certain subsidiaries of the Corporation are registered broker/dealers or investment advisors and are subject to regulation by
the SEC, the Financial Industry Regulatory Authority, the New York Stock Exchange, the FSA and other domestic,
international and state securities regulators. In connection with formal and informal inquiries by those agencies, such subsidiaries receive numerous requests, subpoenas and orders for documents, testimony and information in connection with various aspects of their regulated activities.
In view of the inherent difficulty of predicting the outcome of such litigation and regulatory matters, particularly where the claimants seek very large or indeterminate damages or where the matters present novel legal theories or involve a large number of parties, the Corporation generally cannot predict what the eventual outcome of the pending matters will be, what the timing of the ultimate resolution of these matters will be, or what the eventual loss, fines or penalties related to each pending matter may be.
In accordance with applicable accounting guidance, the Corporation establishes an accrued liability for litigation and regulatory matters when those matters present loss contingencies that are both probable and estimable. In such cases, there may be an exposure to loss in excess of any amounts accrued. When a loss contingency is not both probable and estimable, the Corporation does not establish an accrued liability. As a litigation or regulatory matter develops, the Corporation, in conjunction with any outside counsel handling the matter, evaluates on an ongoing basis whether such matter presents a loss contingency that is probable and estimable. If, at the time of evaluation, the loss contingency related to a litigation or regulatory matter is not both probable and estimable, the matter will continue to be monitored for further developments that would make such loss contingency both probable and estimable. Once the loss contingency related to a litigation or regulatory matter is deemed to be both probable and estimable, the Corporation will establish an accrued liability with respect to such loss contingency and record a corresponding amount of litigation-related expense. The Corporation continues to monitor the matter for further developments that could affect the amount of the accrued liability that has been previously established. Excluding expenses of internal or external legal service providers, litigation-related expense of $5.64.2 billion was recognized for 20112012 compared to $2.65.6 billion for 20102011.
For a limited number of the matters disclosed in this Note for which a loss is probable or reasonably possible in future periods, whether in excess of a related accrued liability or where there is no accrued liability, the Corporation is able to estimate a range of possible loss. In determining whether it is possible to provide an estimate of loss or range of possible loss, the Corporation reviews and evaluates its material litigation and regulatory matters on an ongoing basis, in conjunction with any outside counsel handling the matter, in light of potentially relevant factual and legal developments. These may include information learned through the discovery process, rulings on dispositive motions, settlement discussions, and other rulings by courts, arbitrators or others. In cases in which the Corporation possesses sufficient appropriate information to develop an estimate of loss or range of possible loss, that estimate is aggregated and disclosed below. There may be other disclosed matters for which a loss is probable or reasonably possible but such an estimate may not be possible. For those matters where an estimate is possible, management currently estimates the aggregate range of possible loss is $0 to $3.63.1 billion in excess of the accrued liability (if any) related to those matters. This estimated range of possible loss is based upon currently available information and is subject to significant judgment and a variety of assumptions, and known and unknown
uncertainties. The matters underlying the estimated range will change from time to time, and actual results may vary significantly
from the current estimate. Those matters for which an estimate is not possible are not included within this estimated range. Therefore, this estimated range of possible loss represents what the Corporation believes to be an estimate of possible loss only for certain matters meeting these criteria. It does not represent the Corporation’s maximum loss exposure. Information is provided below regarding the nature of all of these contingencies and, where specified, the amount of the claim associated with these loss contingencies. Based on current knowledge, management does not believe that loss contingencies arising from pending matters, including the matters described herein, will have a material adverse effect on the consolidated financial position or liquidity of the Corporation. However, in light of the inherent uncertainties involved in these matters, some of which are beyond the Corporation’s control, and the very large or indeterminate damages sought in some of these matters, an adverse outcome in one or more of these matters could be material to the Corporation’s results of operations or cash flows for any particular reporting period.
Auction Rate Securities Litigation
Since October 2007, the Corporation, Merrill Lynch and certain affiliates have been named as defendants in a variety of lawsuits and other proceedings brought by customers, and both individual and institutional investors, and issuers regarding auction rate securities (ARS). These actions generally allege that defendants: (i) misled plaintiffs into believing that there was a deeply liquid market for ARS, and (ii) failed to adequately disclose their or their affiliates’ practice of placing their own bids to support ARS auctions. Plaintiffs assert that ARS auctions started failing from August 2007 through February 2008 when defendants and other broker/dealers stopped placing those “support bids.” In addition to the matters described in more detail below, numerous arbitrations and individual lawsuits have been filed against the Corporation, Merrill Lynch and certain affiliates by parties who purchased ARS and are seeking relief that includes compensatory and punitive damages totaling in excess of $1.2 billion, as well asand rescission, among other relief.
Securities Actions
The Corporation and Merrill Lynch face a number of civil actions relating to the sales of ARS and management of ARS auctions, including two putative class action lawsuits in which plaintiffs seek to recover the alleged losses in market value of ARS securities purportedly caused by defendants’ actions. Plaintiffs also seek unspecified damages, including rescission, other compensatory and consequential damages, costs, fees and interest. The first action, In Re Merrill Lynch Auction Rate Securities Litigation, is the result of the consolidation of two class action suits in the U.S. District Court for the Southern District of New York. These suits were brought by two Merrill Lynch customers on behalf of all persons who purchased ARS in auctions managed by Merrill Lynch, against Merrill Lynch and Merrill Lynch, Pierce, Fenner & Smith Incorporated (MLPF&S). On March 31, 2010, the U.S. District Court for the Southern District of New York granted Merrill Lynch’s motion to dismiss. Plaintiffs appealed and on November 14, 2011, the U.S. Court of Appeals for the Second Circuit affirmed the district court’s dismissal. Plaintiffs’ time to seek a writ of certiorari to the U.S. Supreme Court expired on February 13, 2012, and, as a result,
this action is now concluded. The second action, Bondar v. Bank of America Corporation, was brought by a putative class of ARS purchasers against the Corporation and Banc of America Securities, LLC (BAS). On February 24, 2011, the U.S. District Court for the Northern District of California dismissed the amended complaint and directed plaintiffs to state whether they will file a further amended complaint or appeal the court’s dismissal. Following the Second Circuit’s decision in In Re Merrill Lynch Auction Rate Securities Litigation, plaintiffs voluntarily dismissed their action on January 4, 2012. The dismissal is subject to the district court’s approval.
Antitrust Actions
TheOn September 4, 2008, two putative antitrust class actions were filed against the Corporation, Merrill Lynch and other financial institutions were also named in two putative antitrust class actions in the U.S. District Court for the Southern District of New York. Plaintiffs in both actions assert federal antitrust claims under Section 1 of the Sherman Act based on allegations that defendants conspired to restrain trade in ARS by placing support bids in ARS auctions, only to collectively withdraw those bids in February 2008, which allegedly caused ARS auctions to fail. In the first action, Mayor and City Council of Baltimore, Maryland v. Citigroup, Inc., et al., plaintiff seeks to represent a class of issuers of ARS that defendants underwrote between May 12, 2003 and February 13, 2008. This issuer action seeks to recover, among other relief, the alleged above-market interest payments that ARS issuers allegedly have had to make after defendants allegedly stopped placing “support bids” in ARS auctions. In the second action, Mayfield, et al. v. Citigroup, Inc., et al., plaintiff seeks to represent a class of investors that purchased ARS from defendants and held those securities when ARS auctions failed on February 13, 2008. Plaintiff seeks to recover, among other relief, unspecified damages for losses in the ARS’ market value, and rescission of the investors’ ARS purchases. Both actions also seek treble damages and attorneys’ fees under the Sherman Act’s
private civil remedy. On January 25, 2010, the court dismissed both actions with prejudice and plaintiffs’ respective appeals are currently pending in the U.S. Court of Appeals for the Second Circuit.
Checking Account Overdraft Litigation
Bank of America, N.A. (BANA) is currently a defendant in several consumer suits challenging certain deposit account-related business practices. Four suits are part of a multi-district litigation proceeding (the MDL) involving approximately 65 individual cases against 30 financial institutions assigned by the Judicial Panel on Multi-district Litigation (JPML) to the U.S. District Court for the Southern District of Florida. The four cases: Tornes v. Bank of America, N.A.; Yourke, et al. v. Bank of America, N.A., et al.; Knighten v. Bank of America, N.A.; and Phillips, et al. v. Bank of America, N.A.; allege that BANA improperly and unfairly increased the number of overdraft fees it assessed on consumer deposit accounts by various means. The cases challenge the practice of reordering debit card transactions to post high-to-low and BANA’s failure to notify customers at the point of sale that the transaction may result in an overdraft charge. The cases also allege that BANA’s disclosures and advertising regarding the posting of debit card transactions are false, deceptive and misleading. These cases assert claims including breach of the implied covenant of good faith and fair dealing, conversion, unjust enrichment and violation of the unfair and deceptive practices statutes of various states. Plaintiffs generally seek restitution of all overdraft fees paid to
BANA as a result of BANA’s allegedly wrongful business practices, as well as disgorgement, punitive damages, injunctive relief, pre-judgment interest and attorneys’ fees. Omnibus motions to dismiss many of the complaints involved in the MDL, including Tornes, Yourke and Knighten, were denied on March 12, 2010.
Knighten was dismissed without prejudice on February 4, 2011. On November 22, 2011, the MDL court granted final approval of a settlement of all the remaining class matters in the MDL (including Tornes, Yourke and Phillips), providing for a payment by the Corporation of $410 million (which amount was fully accrued by the Corporation, as of December 31, 2011) in exchange for a complete release of claims asserted against the Corporation in the MDL. Several MDL settlement class members have appealed to the U.S. Court of Appeals for the Eleventh Circuit from the judgment granting final approval to the settlement.
Countrywide Bond Insurance Litigation
The Corporation, Countrywide Financial Corporation (CFC) and other Countrywide entities are subject to claims from several monoline bond insurance companies. These claims generally relate to bond insurance policies provided by the insurers on securitized pools of home equity linesline of credit (HELOC) and fixed-rate second-lien mortgage loans. Plaintiffs in these cases generally allege that they have paid claims as a result of defaults in the underlying loans and assert that these defaults are the resultCountrywide defendants misrepresented the characteristics of improperthe underlying loans and breached certain contractual representations and warranties regarding the underwriting by defendants.and servicing of the loans. Plaintiffs also allege that the Corporation is liable based on successor liability theories.
Ambac
The Corporation, CFCCountrywide and other Countrywide entities are named as defendants in an action filed on September 29, 2010 by Ambac Assurance Corporation (Ambac) entitled Ambac Assurance Corporation and The Segregated Account of Ambac Assurance Corporation v. Countrywide Home Loans, Inc., et al. This action, currently pending in New York Supreme Court, New York County, relates to bond insurance policies provided by Ambac on certain securitized pools of first-lien HELOC and fixed-rate second-lien mortgage loans. On September 8, 2011, plaintiffs filed an amended complaint, which assertsDamages sought by Ambac include the amount of payments for current and future claims involving five additional securitizations of first- and second-lien mortgage loans and alleges fraudulent inducement, breach of contractit has paid or will pay under the policies, increasing over time as well as otherit pays claims set forth in the initial complaint. The amended complaint also reasserts a claim that the Corporation is jointly and severally liable as the successor to Countrywide. The amended complaint seeks unspecified actual and punitive damages and equitable relief.under relevant policies.
FGIC
The Corporation, CFCCountrywide and other Countrywide entities are named as defendants in an action filed on December 11, 2009 by Financial Guaranty Insurance Company (FGIC) entitled Financial Guaranty Insurance Co. v. Countrywide Home Loans, Inc. This action, currently pending in New York Supreme Court, New York County, relates to bond insurance policies provided by FGIC on securitized pools of HELOC and fixed-rate second-lien mortgage loans. In June 2010,Damages sought by FGIC include the court entered an order that granted in partamount of payments for current and denied in partfuture claims it has paid or will pay under the Countrywide defendants’ motion to dismiss. On April 30, 2010, FGIC filed an amended complaint reasserting claims set forth in the initial complaint and asserting a claim that the Corporation is jointly and severally liablepolicies, increasing over time as the successor to Countrywide. In October 2011, following the appellate court’s June 30, 2011 order on the cross-appeals in MBIA Insurance Corporation, Inc. v. Countrywide Home Loans, et al., the parties entered a joint stipulated order
withdrawing cross-appeals from the court’s June 2010 order.
On March 24, 2010, CFC and other Countrywide entities filed a separate but related action against FGIC in New York Supreme Court seeking monetary damages of at least $100 million against FGIC in connection with FGIC’s failure to payit pays claims under certain bond insurancerelevant policies. The same day, CFC and the other Countrywide entities filed an action to enjoin the instruction of the New York State Department of Financial Services (NYSDFS) to FGIC to suspend payments claimed under various insurance agreements or its approval of FGIC’s plan to do so. This action is currently being voluntarily deferred at the request of the NYSDFS.
MBIA
The Corporation, CFCCountrywide and other Countrywide entities are named as defendants in two actions filed by MBIA Insurance Corporation (MBIA). The first action, MBIA Insurance Corporation, Inc. v. Countrywide Home Loans, et al., filed on September 30, 2008 is pending in New York Supreme Court, New York County. In April 2010,Damages sought by MBIA include the court granted in partamount of payments for current and denied in partfuture claims it has paid or will pay under the Countrywide defendants’ motion to dismiss and denied the Corporation’s motion to dismiss. The parties filed cross-appeals. On December 22, 2010, the court issued an order on MBIA’s motion for use of sampling at trial, in which the court held that MBIA may attempt to prove its breach of contract and fraudulent inducementpolicies, increasing over time as it pays claims through examination of statistically significant samples of the securitizations at issue. In its order, the court did not endorse any of MBIA’s specific sampling proposals and stated that defendants have “significant valid challenges” to MBIA’s methodology that they may present at trial, together with defendants’ own views and evidence. On June 30, 2011, the appellate court issued a decision on the parties’ cross-appeals. The appellate court dismissed MBIA’s breach of implied covenant of good faith and fair dealing claim, which reversed the trial court ruling on that claim, and otherwise affirmed the trial court’s decisions.under relevant policies.
On May 25, 2011, MBIA moved for partial summary judgment, seeking rulings that: (i) MBIA does not have to show that Countrywide’s alleged fraud and breaches of contract proximately caused MBIA’s losses; and (ii) the term “materially and adversely affects” in the transaction documents does not limit the repurchase remedy to defaulted loans, or require MBIA to show that Countrywide’s breaches of the representations and warranties
caused the loans to default. On January 3, 2012, the court issued an order that granted in part and denied in part MBIA’s motion. The court ruled that under New York insurance law, MBIA does not need to prove a causal link between Countrywide’s alleged misrepresentations and the payments made pursuant to the policies. The court also held that plaintiff could recover “rescissory damages” (the amounts it has been required to pay pursuant to the policies less premiums received) on such claims, but must prove that it was damaged as a direct result of Countrywide’s alleged material misrepresentations. The court denied the motion in its entirety on the issue of the interpretation of the “materially and adversely affects” language. On January 25, 2012, Countrywide appealed the court’s decision and order to the extent it granted MBIA’s motion. On February 6, 2012, MBIA filed a cross-appeal of the court’s decision and order to the extent it denied MBIA’s motion.
On September 19, 2012, Countrywide moved for summary judgment on MBIA’s fraud, indemnification and punitive damages claims and for partial summary judgment on MBIA’s breach of contract claim. On that same date, MBIA moved for summary judgment on its insurance breach and repurchase breach claims. The court heard oral argument on the motions on December 12 and 13, 2012.
On September 28, 2012, the Corporation moved for summary judgment with respect to MBIA’s successor liability claims. On the same day, MBIA moved for summary judgment in its favor with respect to such claims. The motions were argued to the court on January 9 and 10, 2013.
The second MBIA action, MBIA Insurance Corporation, Inc. v. Bank of America Corporation, Countrywide Financial Corporation, Countrywide Home Loans, Inc., Countrywide Securities Corporation,
et al., filed on July 10, 2009, is pending in California Superior Court, Los Angeles County. MBIA purports to bring this action as subrogee to the note holders for certain securitized pools of HELOC and fixed-rate second-lien mortgage loans and seeks unspecified damages and declaratory relief. On May 17, 2010, the court dismissed the claims against the Countrywide defendants with leave to amend, but denied the request to dismiss MBIA’s successor liability claims against the Corporation. On June 21, 2010, MBIA filed an amended complaint re-asserting its previously dismissed claims against the Countrywide defendants, re-asserting the successor liability claim against the Corporation and adding Countrywide Capital Markets, LLC as a defendant. The Countrywide defendants filed a demurrer to the amended complaint, but the court declined to rule on the demurrer and instead entered an order staying the case until August 2011. On August 18, 2011, the court ordered a partial lifting of the stay to permit certain limited discovery to proceed. The stay otherwise remains in effect.
SyncoraFIRREA and False Claims Act Litigation
The Corporation, CFC and other Countrywide entities are named as defendants in an action filed by Syncora Guarantee Inc. (Syncora) entitled Syncora Guarantee Inc. v. Countrywide Home Loans, Inc., et al. This action, currently pending in New York Supreme Court, New York County, relates to bond insurance policies provided by Syncora on certain securitized pools of HELOC. In March 2010, the court issued an order that granted in part and denied in part the Countrywide defendants’ motion to dismiss. Syncora and the Countrywide defendants filed cross-appeals from this order. In May 2010, Syncora amended its complaint. Defendants filed an answer to Syncora’s amended complaint on July 9, 2010, as well as a counterclaim for breach of contract and declaratory judgment. The parties subsequently stipulated to the dismissal of defendants’ counterclaim without prejudice. Following the appellate court’s June 30, 2011 order on the cross-appeals in MBIA Insurance Corporation, Inc. v. Countrywide Home Loans, et al., the parties entered a joint stipulated order withdrawing their cross-appeals.
On August 16, 2011, Syncora moved for partial summary judgment, seeking rulings that: (i) Syncora does not have to show that Countrywide’s alleged fraud and breaches of contract proximately caused Syncora’s losses; and (ii) the term “materially and adversely affects” in the transaction documents does not limit the repurchase remedy to defaulted loans, or require Syncora to show that Countrywide’s breaches of the representations and warranties caused the loans to default. On January 3,February 24, 2012, the court issued a decision and order that granted in part and denied in part Syncora’s motion. The court ruled that under New York insurance law, Syncora does not need to prove a causal link between Countrywide’s alleged misrepresentations and the payments made pursuant to the policies. The Court also held plaintiff could recover “rescissory damages” (the amounts it has been required to pay pursuant to the polices less premiums received) on such claims, but must prove that it was damaged as a direct result of Countrywide’s alleged material misrepresentations. The court denied the motion in its entirety on the issue of the interpretation of the “materially and adversely affects” language. On January 6, 2012, Syncora appealed the decision and order to the extent it denied Syncora’s motion. On January 25, 2012, CountrywideEdward O’Donnell filed a cross-appeal ofsealed qui tam complaint against the court’s decisionCorporation, individually, and orderas successor to the extent it granted Syncora’s motion.
Fair Lending Investigation
On December 21, 2011, CFC,Countrywide, Countrywide Home Loans, Inc. (CHL), and Countrywide Bank (which was merged into BANA effective July 1, 2011) entered into a consent order to resolve an investigation byFull Spectrum Lending. On October 24, 2012, the U.S. DepartmentDOJ filed a complaint-in-intervention to join the matter, adding BANA, Countrywide and CHL as defendants. The action is entitled United States of Justice (DOJ) into legacy lending practicesAmerica, ex rel, Edward O’Donnell, appearing Qui Tam v. Bank of Countrywide. The investigation concerned alleged discriminatory lending practices by CountrywideAmerica Corp et al., and was filed in the extension of residential credit and in residential real estate-related transactions. The investigation and resulting consent order did not relate to the current lending practices of the Corporation or of its affiliates. The consent order does not require any injunctive provisions against the Corporation or BANA concerning its lending practices. The consent order requires the establishment of a restitution fund of $335 million to be paid to allegedly aggrieved borrowers. This amount was fully accrued by the Corporation as of December 31, 2011. The consent order was entered by the U.S. District Court for the CentralSouthern District of California on December 28, 2011.New York. The complaint-in-intervention asserts certain fraud claims in connection with the sale of loans to FNMA and FHLMC by a Countrywide business division known
as Full Spectrum Lending and by the Corporation and BANA from 2006 continuing through 2009 and also asserts successor liability against the Corporation and BANA. Plaintiff seeks, among other relief, civil penalties pursuant to the Financial Institutions Reform, Recovery, and Enforcement Act of 1989 (FIRREA) and treble damages pursuant to the False Claims Act. On January 11, 2013, the government filed an amended complaint which added Countrywide Bank, FSB and a former officer of the Corporation as defendants.
Fontainebleau Las Vegas Litigation
On June 9, 2009, Fontainebleau Las Vegas, LLC (FBLV), then a Chapter 11 debtor-in-possession, commenced an adversary proceeding entitled Fontainebleau Las Vegas, LLC v. Bank of America, N.A., Merrill Lynch Capital Corporation, et al. (FBLV action), against a group of lenders, including BANA and Merrill Lynch Capital Corporation (MLCC). The action was originally filed in the U.S. Bankruptcy Court, Southern District of Florida, but is now beforewas transferred to the U.S. District Court for the Southern District of Florida. On April 12, 2010, FBLV’s Chapter 11 case was converted to a Chapter 7 case and a trustee was appointed (the Bankruptcy Trustee). The complaint alleges, among other things, that defendants breached an agreement to lend their respective committed amounts under an $800 million revolving loan facility, of which BANA and MLCC had each committed $100 million, in connection with the construction of a resort and casino development. The complaint seeks damages in excess of $3 billion and a “turnover” order under Section 542 of the Bankruptcy Code requiring the lenders to fund their respective commitments. On September 21, 2010,May 10, 2012, the revolving lender group and the trustee agreed to settle all outstanding issues (including the original breach of commitment claims), and the settlement was approved by the court dismissedon June 12, 2012; the breachCorporation’s share of contract and turnover claims to allow the Bankruptcy Trustee, as plaintiff, to pursue an immediate appeal of the court’s August 2009 decision denying partial summary judgment of certain of FBLV’s claims. The Bankruptcy Trustee filed a notice of appeal on October 18, 2010this settlement was not material to the U.S. CourtCorporation’s results of Appeals for the Eleventh Circuit.operations.
On June 9, 2009, a related lawsuit, Avenue CLO Fund Ltd., et al. v. Bank of America, N.A., Merrill Lynch Capital Corporation, et al. (the Avenue action), was filed in the U.S. District Court for the District of Nevada by certain project lenders. On September 21, 2009, another related lawsuit, ACP Master, Ltd., et al. v. Bank of America, N.A., Merrill Lynch Capital Corporation, et al. (the ACP action), was filed in the U.S. District Court for the Southern District of New York by the purported successors-in-interest to certain project lenders. These two actions were subsequently transferred by the JPMLU.S. Judicial Panel on Multidistrict Litigation (JPML) to the U.S. District Court for the Southern District of Florida for coordinated pretrial proceedings with the FBLV action. Plaintiffs in the Avenue and ACP actions (the Term Lenders) repeat FBLV’s allegations that BANA, MLCC and the other defendants breached their revolving loan facility commitments to FBLV. In addition, they
allege that BANA breached its duties as disbursement agent under a separate agreement governing the disbursement of loaned funds to FBLV. The Term Lenders seek unspecified money damages on their claims.
On May 28, 2010,
the district court in the Avenue action and the ACP action granted defendants’ motion to dismiss the revolving loan facility commitment claims, but denied BANA’s motion to dismiss the disbursement agent claims. On January 13, 2011, the district court granted the Term Lenders’ motion for entry of a partial final judgment on their revolving loan facility commitment claims. TheBy decision dated February 20, 2013, the U.S. Court of Appeals for the 11th Circuit affirmed the dismissal, holding that the Term Lenders filed a notice of appeal with respectlacked standing to those claims on January 19, 2011.enforce the lending commitments.
On April 19, 2011, the district court dismissed the disbursement agent claims against BANA in the ACP action after the Avenue action plaintiffs represented that they had acquired the claims belonging to the ACP action plaintiffs and would be pursuing those claims in the Avenue action. On September 27, 2011,March 19, 2012, the Avenue action parties submitted their respective motionsdistrict court granted BANA’s motion for summary judgment on theall causes of action against it in its capacity as disbursement agent claims.
In re Initial Public Offering Securities Litigation
BAS, Merrill Lynch & Co., MLPF&S, and certain of their subsidiaries, along with other underwriters, and various issuers and others, were named as defendants in a number of putative class action lawsuits that have been consolidated in the U.S. District CourtAvenue Action, and denied plaintiffs’ motion for the Southern District of New York as In re Initial Public Offering Securities Litigation.summary judgment on those claims. Plaintiffs contend, among other things, that defendants failed to make certain required disclosures in the registration statements and prospectuses for applicable offerings regarding alleged agreements with institutional investors that tied allocations in certain offerings to the purchase orders by those investors in the aftermarket. Plaintiffs allege that such agreements allowed defendants to manipulate the price of the securities sold in these offerings in violation of Section 11 of the Securities Act of 1933 and Section 10(b) of the Securities Exchange Act of 1934, and SEC rules promulgated thereunder. The parties agreed to settle the matter, for which the court granted final approval. Certain putative class members filed an appeal into the U.S. Court of Appeals for the Second Circuit seeking reversal of the final approval. On August 25, 2011, the district court, on remand from the U.S. Court of Appeals for the Second Circuit, dismissed the objection by the last remaining putative class member, concluding that he was not a class member. On January 9, 2012, that objector dismissed with prejudice an appeal of the court’s dismissal pursuant to a settlement agreement. On November 28, 2011, an objector whose appeals were dismissed by the Second Circuit filed a petition for a writ of certiorari with the U.S. Supreme Court that was rejected as procedurally defective. On January 17, 2012, the Supreme Court advised the objector that the petition was untimely and should not be resubmitted to the Supreme Court.Eleventh Circuit.
Interchange and Related Litigation
AIn 2005, a group of merchants have filed a series of putative class actions and individual actions with regard todirected at interchange fees associated with Visa and MasterCard payment card transactions. These actions, which have beenwere consolidated in the U.S. District Court for the Eastern District of New York under the caption In Re Payment Card Interchange Fee and Merchant Discount Anti-Trust Litigation (Interchange), namenamed Visa, MasterCard and several banks and bank holding companies,BHCs, including the Corporation, as defendants. Plaintiffs allege that defendants conspired to fix the level of default interchange rates, which represent the fee an issuing bank charges an acquiring bank on every transaction. Plaintiffs also challengechallenged as unreasonable restraints of trade under Section 1 of the Sherman Act certain rules of Visa and MasterCard related to merchant acceptance of payment cards at the point of sale.
Plaintiffs seeksought unspecified damages and injunctive relief based on their assertion that interchange would be lower or eliminated absent the alleged conduct. On January 8, 2008, the court granted defendants’ motion to dismiss all claims for pre-2004 damages. Motions to dismiss the remainder of the complaint and plaintiffs’ motion for class certification are pending. In February 2011, the parties cross-moved for summary judgment.
In addition, plaintiffs filed supplemental complaints against certain defendants, including the Corporation, relating to initial public offerings (the IPOs) of MasterCard and Visa. Plaintiffs allegealleged that the IPOs violated Section 7 of the Clayton Act and Section 1 of the Sherman Act. Plaintiffs also assertasserted that the MasterCard IPO was a fraudulent conveyance. Plaintiffs seeksought unspecified damages and to undo the IPOs. Motions
On October 19, 2012, defendants entered an agreement to dismiss both supplemental complaints, as well as summary judgment motions challenging both supplemental complaints, remain pending.settle the class plaintiffs’ claims. The defendants also separately agreed to resolve the claims brought by a group of individual retailers that opted out of the class to pursue independent litigation. The settlement agreements provide for, among other things, (i) payments by defendants to the class and individual plaintiffs totaling approximately $6.6 billion; (ii) distribution to class merchants of an amount equal to 10 bps of default interchange across all Visa and MasterCard credit card transactions for a period of eight consecutive months, to begin by July 29, 2013, which otherwise would have been paid to issuers and which effectively reduces credit interchange for that period of time; and (iii) modifications to Visa and MasterCard rules regarding merchant point of sale practices.
TheSubject to the loss-sharing agreements the Corporation and certain affiliates havepreviously entered into loss-sharing agreements with Visa, MastercardMasterCard and other financial institutions, in connection with certain antitrust litigation, including Interchange. Collectively, the loss-sharing agreements require the Corporation and/or certain affiliateswill contribute a total of $738 million to pay 11.6 percentthe settlement of the monetary portion of any comprehensiveclass and individual actions. Of that amount, Interchange$539 million settlement. Inwill be paid from the event ofproceeds that Visa previously placed into an adverse judgment, the agreements require the Corporation and/or certain affiliatesescrow fund pursuant to pay 12.8 percent of any damages associated with Visa-related claims (Visa-related damages), 9.1 percent of any damages associated with MasterCard-related claims, and 11.6 percent of any damages associated with internetwork claims (internetwork damages) or not associated specifically with Visa or MasterCard-related claims (unassigned damages).
Pursuant to Visa’s publicly-disclosed Retrospective Responsibility Plan (the RRP), Visa placed certain proceeds from its IPO into an escrow fund (the Escrow). Under the RRP, funds in the Escrow may be accessed by Visa and its members, including Bank of America, to pay monetary damages in Interchange, withcover the Corporation’s payments from the Escrow capped at share of Visa-related claims.12.81 percent
The court granted preliminary approval of the funds that Visa places therein. Subjectclass settlement agreement on November 9, 2012, over the objections of several class members. The objecting class members appealed to that cap, the Corporation may use Escrow funds to cover 73.9 percentU.S. Court of its monetary payment towards a comprehensive Interchange settlement, 100 percentAppeals for the Second Circuit, which denied
appellants’ motion for expedited appeal and deferred briefing until after final approval of its paymentthe settlement. The final approval hearing is scheduled for any Visa-related damages and 73.9 percent of its payment for any internetwork and unassigned damages.September 12, 2013.
Two actions,On March 28, 2011, an action entitled Watson v. Bank of America Corp. (Watson) ,was filed on March 28, 2011 in the Supreme Court of British Columbia, Canada, and Bancroft-Snell v. Visa Canada Corp., filed on May 16, 2011 in Ontario Superior Court, were filed by a purported nationwide classesclass of merchants that accept Visa and/or MasterCard credit cards in Canada. The actions nameaction names as defendants Visa, MasterCard, and a number of other banks and bank holding companies,BHCs, including the Corporation. Plaintiffs allegeThe action alleges that defendants conspired to fix the merchant discount fees that merchants pay to acquiring banks on credit card transactions. PlaintiffsIt also allegealleges that defendants conspired to impose certain rules relating to merchant acceptance of credit cards at the point of sale. The actions assertaction asserts claims under section 45 of the Competition Act and other common law claims, and seekseeks unspecified damages and injunctive relief based on theirthe assertion that merchant discount fees would be lower absent the challenged conduct. These actions areThe action is not covered by the RRP or loss-sharing agreements previously entered into in connection with certain antitrust litigation, including Interchange. In addition to Watson, the Corporation has been named as a defendant in similar putative class action claims filed in other jurisdictions in Canada.
Merrill Lynch Acquisition-related MattersIn re Bank of America Securities, Derivative and Employee Retirement Income Security Act (ERISA) Litigation
SinceBeginning in January 2009, the Corporation, andas well as certain of its current and former officers and directors, among others, have beenwere named as defendants in a variety of actions filed in state and federal courts relatingin connection with securities filings by the Corporation. The securities filings contained information with respect to events that took place from September 2008 through January 2009 contemporaneous with the Corporation’s acquisition of Merrill Lynch (the Acquisition). These Acquisition-related cases consist ofincluded class action and individual securities actions,lawsuits, derivative actions, and actions under ERISA. the ERISA, and an action brought by the New York Attorney General (NYAG) under the Martin Act and the New York Executive Law. Certain federal court actions were consolidated and/or coordinated in the U.S. District Court for the Southern District of New York under the caption In re Bank of America Securities, Derivative and Employee Retirement Income Security Act (ERISA) Litigation (the Consolidated Action).
The claims in these actions generally concern:concern alleged material misrepresentations and/or material omissions with respect to: (i) the Acquisition; (ii) the financial condition of and 2008 fourth-quarter losses experienced by the Corporation and Merrill Lynch; (iii) due diligence conducted in connection with the Acquisition; (iv) the terms of the Acquisition agreements’ termsagreements regarding Merrill Lynch’s ability to pay bonuses to Merrill Lynch employees of up to $5.8 billion; for the year 2008; (v) the Corporation’s discussions with government officials in December 2008 regarding the Corporation’s consideration of invoking the material adverse change clause in the Acquisition agreement andagreement; (vi) the Corporation’s discussions with government officials in December 2008 regarding the possibility of obtaining government assistance in completing the Acquisition; and/or (vi) alleged material misrepresentations and/or material omissions in(vii) the proxy statement and related materials for the Acquisition.
Consolidated Securities ActionsClass Action
Plaintiffs in In re Bank of America Securities, Derivative and Employment Retirement Income Security Act (ERISA) Litigation (Securities Plaintiffs), a putative in the securities class action filed in the U.S. District Court for the Southern District of New York, represent all: (i) purchasers of the Corporation’s common and preferred securities between September 15, 2008 and January 21, 2009 and its January 2011 options; (ii) holders of the Corporation’s common stock as of October 10, 2008; and (iii) purchasers of the Corporation’s common stock issued in the offering that occurred on or about October 7, 2008. During the purported class period, the Corporation had between 4,560,112,687 and 5,017,579,321 common shares outstanding and the price of those shares declined from $33.74 on September 12, 2008 to $6.68 on January 21, 2009.Consolidated Action (Consolidated Securities Plaintiffs claim violations of Sections 10(b), 14(a) and 20(a) of the Securities Exchange Act of 1934, and SEC rules promulgated thereunder. Securities Plaintiffs’ amended complaint also alleges violations of Sections 11, 12(a)(2) and 15 of the Securities Act of 1933 related to the offering of the Corporation’s common stock that occurred on or about October 7, 2008, and names BAS and MLPF&S, among others, as defendants on certain claims. The Corporation and its co-defendants filed motions to dismiss, which the court granted in part in August 2010 by dismissing certain of the Securities Plaintiffs’ claims under Section 10(b) of the Securities Exchange Act of 1934. Securities Plaintiffs filed a second amended complaint which repleaded some of the dismissed claims as well as addedClass Action) asserted claims under Sections 14(a), 10(b) and 20(a) of the Securities Exchange Act of 1934 on behalf of holders of certain debt, preferred securities and option securities. In July 2011, the court granted in part defendants’ motion to dismiss the second amended complaint. As a result of the court’s July 2011 ruling, the Securities Plaintiffs were (in addition to the claims sustained in the court’s August 2010 ruling) permitted to pursue a claim under Section 10(b) asserting that defendants should have made additional disclosures in connection with the Acquisition about the financial condition and 2008 fourth-quarter losses experienced by Merrill Lynch. Securities Plaintiffs seek unspecified monetary damages, legal costs and attorneys’ fees. On February 6, 2012, the court granted Securities Plaintiffs’
|
| | |
232 Bank of America 2012 | | Bank of America227
|
Securities Exchange Act of 1934 (the Exchange Act), and Sections 11, 12(a)(2) and 15 of the SecuritiesAct of 1933 (the Securities Act) and asserted damages based on the drop in the stock price upon subsequent disclosures.
In February 2012, the court granted a motion for class certification. On February 21,November 30, 2012, the parties entered into a settlement agreement. The agreement, which is subject to court approval, provides for a payment by the Corporation filed a petition requestingof $2.4 billion, an amount that was fully accrued as of September 30, 2012, and the U.S. Courtinstitution and/or continuation of Appeals forcertain corporate governance enhancements until the Second Circuit reviewlater of January 1, 2015 or 18 months following the district court’s final approval of the settlement. In exchange, Securities Plaintiffs released their claims against all defendants and certain other persons or entities affiliated with defendants.
On December 4, 2012, the court issued an order granting preliminary approval of the settlement and scheduling a final settlement hearing for April 5, 2013.
Individual Securities Plaintiffs’ motion for class certification.Actions
Several individual plaintiffsCertain shareholders have opted to pursue their claims under the Exchange Act and/or Securities Act apart from the In re Bank of AmericaConsolidated Securities Derivative,Class Action, and Employment Retirement Income Security Act (ERISA) Litigation and, accordingly, have initiatedthese individual actions were coordinated for pre-trial purposes in the U.S. District Court for the Southern District of New York relying onConsolidated Action. These individual plaintiffs assert substantially the same facts and claims as the Securities Plaintiffs.
On January 13, 2010, the Corporation, Merrill Lynch and certain of the Corporation’s current and former officers and directors were named in a purported class action filed in the U.S. District Court for the Southern District of New York entitled Dornfest v. Bank of America Corp., et al. The action is purportedly brought on behalf of investors in Corporation option contracts between September 15, 2008 and January 22, 2009 and alleges that during the class period approximately 9.5 million Corporation call option contracts and approximately eight million Corporation put option contracts were traded on seven of the Options Clearing Corporation exchanges. The complaint alleges that defendants violated Sections 10(b) and 20(a) of the Securities Exchange Act of 1934 and SEC rules promulgated thereunder. Plaintiffs seek unspecified monetary damages, legal costs and attorneys’ fees. On April 9, 2010, the court consolidated this action with the consolidated securities action in the In re Bank of America Securities, Derivative and Employment Retirement Income Security Act (ERISA) Litigation, and ruled that plaintiffs may pursue the action as an individual action. In August 2011, plaintiff again asked the court for permission to pursue claims on a class basis, which the court again denied in an order issued in September 2011. Plaintiffs have attempted to appeal that ruling.plaintiffs.
Derivative Actions
The Corporation and certain current and former directors are named as defendants in several putative class and derivative actions in the Delaware Court of Chancery, including: Rothbaum v. Lewis; Southeastern Pennsylvania Transportation Authority v. Lewis; Tremont Partners LLC v. Lewis; Kovacs v. Lewis; Stern v. Lewis; and Houx v. Lewis, brought by shareholders alleging breaches of fiduciary duties and waste of corporate assets in connection with the Acquisition. On April 27, 2009, the Delaware Court of Chancery consolidated the derivative actions under the caption In re Bank of America Corporation Stockholder Derivative Litigation. The consolidated derivative complaint seeks, among other things, unspecified monetary damages, equitable remedies and other relief. On April 30, 2009, the putative class claims in the Stern v. Lewis and Houx v. Lewis actions were voluntarily dismissed without prejudice. Trial is scheduled for October 2012.
In addition, the JPML ordered the transfer of actions related to the Acquisition that had been pending in various federal courts to the U.S. District Court for the Southern District of New York for coordinated or consolidated pretrial proceedings. These actions have been separately consolidated and are now pending under the caption In re Bank of America Securities, Derivative and Employment Retirement Income Security Act (ERISA) Litigation.
On October 9, 2009, plaintiffs in the derivative actionsaction in the In re Bank of America Securities, Derivative and Employment Retirement Income Security Act (ERISA) Litigation (the DerivativeConsolidated Action (Derivative Plaintiffs) filed a consolidated amended derivative and class action complaint. The amended complaint namesnamed as defendants certain of the Corporation’s current and former directors, officers and
financial advisors, and certain of Merrill Lynch’s current and former directors and officers. The Corporation iswas named as a nominal defendant with respect to the derivative claims. The amended complaint assertsDerivative Plaintiffs asserted claims for, among other things: (i) violation of federal securities laws; (ii) breach of fiduciary duties; (iii) the return of incentive compensation that is alleged to be inappropriate in view of the work performed and the results achieved by certain of the defendants; and (iv) contribution in connection with the Corporation’s exposure to significant liability under state and federal law. The amended complaint seeks unspecified monetary damages, equitable remedies and other relief.contribution. On February 8, 2010, the Derivative Plaintiffs voluntarily dismissed their claims against each of the former Merrill Lynch officers and directors without prejudice.
On June 19, 2012, the parties entered into a settlement agreement. On January 11, 2013, the district court granted final approval of the settlement.
The Corporation and its co-defendants filed motionscertain current and former directors are also named as defendants in a consolidated derivative action in the Delaware Court of Chancery under the caption In re Bank of America Corporation Stockholder Derivative Litigation brought by shareholders alleging breaches of fiduciary duties and waste of corporate assets in connection with the Acquisition. The consolidated derivative complaint seeks, among other things, unspecified monetary damages, equitable remedies and other relief. On May 9, 2012, the court stayed the action pending the New York court’s consideration of the proposed settlement in the derivative action in the Consolidated Action. In the settlement of the derivative action in the Consolidated Action, plaintiffs in the Delaware action agreed to dismiss, which were granted in part on August 27, 2010. On October 18, 2010, the Corporation and its co-defendants answered the remaining allegations asserted by the Derivative Plaintiffs.withdraw their claims.
ERISA Actions
On October 9, 2009, plaintiffs in the ERISA actions in the In re Bank of America Securities, Derivative and Employment Retirement Income Security Act (ERISA) Litigation (the ERISAConsolidated Action (ERISA Plaintiffs) filed a consolidated amended complaint for breaches of duty under ERISA. The amended complaint is broughtasserted claims on behalf of a purported class that consistsconsisting of participants in certain of the Corporation’s 401(k) Plan, the Corporation’s 401(k) Plan for Legacy Companies, the CFC 401(k) Planplans (collectively, the 401(k) Plans) and the Corporation’s Pension Plan. The amended complaint alleges. ERISA Plaintiffs alleged violations of ERISA based on, among other things: (i) an alleged failure to prudently and loyally manage the 401(k) Plans and Pension Plan by continuing to offer the Corporation’s common stock as an investment option or measure for participant contributions; (ii) an alleged failure to monitor the fiduciaries of the 401(k) Plans and Pension Plan; (iii) an alleged failure to provide complete and accurate information to the 401(k) Plans and Pension Plan participants with respect to the Merrill Lynch and Countrywide acquisitions and related matters; and (iv) alleged co-fiduciary liability for these purported fiduciary breaches. The amended complaint seekssought unspecified monetary damages, equitable remedies and other relief. On August 27, 2010, the court dismissed the complaint brought by plaintiffs in the consolidated ERISA action in its entirety. Theand ERISA Plaintiffs filed a notice of appeal ofappealed. On January 14, 2013, the court’s dismissal of their actions. The parties then stipulated to the dismissalwithdrawal of the appeal with the agreement that the ERISA Plaintiffs can reinstate their appeal at any time up until July 27, 2012.prejudice.
NYAG Action
On February 4, 2010, the New York Attorney General (NYAG)NYAG filed a civil complaint in New York Supreme Court entitled People of the State of New York v. Bank of America, et al. The complaint names as defendants the Corporation and the Corporation’s former CEO and CFO, and alleges violations of Sections 352, 352-c(1)(a), 352-c(1)(c) and 353 of the New York General Business Law, commonly known as the Martin Act, and Section 63(12) of the New York Executive Law. The complaint seeks an unspecified amount in disgorgement, penalties, restitution, and damages and other equitable relief.
LIBOR and Other Reference Rate Inquiries and Litigation
In addition, the Corporation and BANA have been named as defendants along with most of the other LIBOR panel banks in a series of individual and class actions in various U.S. federal and state courts relating to defendants’ LIBOR contributions. All cases naming the Corporation have been or are in the process of being consolidated for pre-trial purposes in the U.S. District Court for the Southern District of New York by the JPML. The Corporation expects that any future cases naming the Corporation will similarly be consolidated for pre-trial purposes. Plaintiffs allege that they held or transacted in U.S. dollar LIBOR-based derivatives or other financial instruments and sustained losses as a result of collusion or manipulation by defendants regarding the setting of U.S. dollar LIBOR. Plaintiffs assert a variety of claims, including antitrust and Racketeer Influenced and Corrupt Organizations claims and seek compensatory, treble and punitive damages, and injunctive relief.
Montgomery
The Corporation, several current and former officers and directors, BAS, MLPF&SBanc of America Securities LLC (BAS), Merrill Lynch, Pierce, Fenner & Smith (MLPF&S) and other unaffiliated underwriters have been named as defendants in a putative class action filed in the U.S. District Court for the Southern District of New York entitled Montgomery v. Bank of America, et al. Plaintiff filed an amended complaint on January 14, 2011. Plaintiff seeks to sue on behalf of all persons who acquired certain series of preferred stock offered by the Corporation pursuant to a shelf registration statement dated May 5, 2006. Plaintiff’s claims arise from three offerings dated January 24, 2008, January 28, 2008 and May 20, 2008, from which the Corporation allegedly received proceeds of $15.8 billion. The amended complaint asserts claims under Sections 11, 12(a)(2) and 15 of the Securities Act of 1933, and alleges that the prospectus supplements associated with the
offerings: (i) failed to disclose that the Corporation’s loans, leases, CDOs and commercial MBS were impaired to a greater extent than disclosed; (ii) misrepresented the extent of the impaired assets by failing to establish adequate reserves or properly record losses for its impaired assets; (iii) misrepresented the adequacy of the Corporation’s internal controls in light of the alleged impairment of its assets; (iv) misrepresented the Corporation’s capital base and Tier 1 leverage ratio for risk-based capital in light of the allegedly impaired assets; and (v) misrepresented the thoroughness and adequacy of the Corporation’s due diligence in connection with its acquisition of Countrywide. The amended complaint seeks rescission, compensatory and other damages. Defendants moved to dismiss for failure to state a claim. On February 9, 2012, the magistrate judge (to whom dispositive motions were referred for a report and recommendation) concluded that the amended complaint does not adequately plead claims under the Securities Act of 1933 and recommended that the district court dismiss the amended complaint in its entirety and deny plaintiffs’ request to amend the complaint without prejudice, whichprejudice.
On March 15, 2012, plaintiffs moved to file a second amended complaint to add additional factual allegations. On March 16, 2012, the district court will consider.granted defendants’ motion to dismiss the first amended complaint and referred the motion to amend to the magistrate judge. On February 15, 2013, the magistrate judge issued an opinion and order denying the motion to amend.
Mortgage-backed Securities Litigation
The Corporation and its affiliates, Countrywide entities and their affiliates, and Merrill Lynch entities and their affiliates have been named as defendants in a number of cases relating to their various roles as issuer, originator, seller, depositor, sponsor, underwriter and/or controlling entity in MBS offerings, pursuant to which the MBS investors were entitled to a portion of the cash flow from the underlying pools of mortgages. These cases generally include purported class action suits and actions by individual MBS purchasers. Although the allegations vary by lawsuit, these cases generally allege that the registration statements, prospectuses and prospectus supplements for securities issued by securitization trusts contained material misrepresentations and omissions, in violation of Sections 11, 12 andand/or 15 of the Securities Act of 1933, Sections 10(b) andand/or 20 of the Securities Exchange Act of 1934 and/or state securities laws and other state statutory and common laws.
These cases generally involve allegations of false and misleading statements regarding: (i) the process by which the properties that served as collateral for the mortgage loans underlying the MBS were appraised; (ii) the percentage of equity that mortgage borrowers had in their homes; (iii) the borrowers’ ability to repay their mortgage loans; (iv) the underwriting practices by which those mortgage loans were originated; (v) the ratings
given to the different tranches of MBS by rating agencies; and (vi) the validity of each issuing trust’s title to the mortgage loans comprising the pool for that securitization (collectively, MBS Claims). Plaintiffs in these cases generally seek unspecified compensatory damages, unspecified costs and legal fees and, in some instances, seek rescission. A number of other entities (including the National Credit Union Administration) have threatened legal actions against the Corporation and its affiliates, Countrywide entities and their affiliates, and Merrill Lynch entities and their affiliates concerning MBS offerings. On January 11, 2013, the Corporation preliminarily agreed on a settlement amount with the National Credit Union Administration (NCUA) to resolve claims concerning certain MBS offerings that the NCUA had threatened to bring against the Corporation, Merrill Lynch,
Countrywide and certain of their affiliates. The agreement is subject to the negotiation and execution of mutually agreeable settlement documentation and approval by the NCUA board. The settlement amount would be covered by existing reserves.
On August 15, 2011, the JPML ordered multiple federal court cases involving Countrywide MBS consolidated for pretrial purposes in the U.S. District Court for the Central District of California, in a multi-district litigation entitled In re Countrywide Financial Corp. Mortgage-Backed Securities Litigation (the Countrywide RMBS MDL).
AIG Litigation
On August 8, 2011, American International Group, Inc. and certain of its affiliates (collectively, AIG) filed a complaint in New York Supreme Court, New York County, in a case entitled American International Group, Inc. et al. v. Bank of America Corporation et al. AIG has named the Corporation, Merrill Lynch, CHL and a number of related entities as defendants. AIG’s complaint asserts certain MBS Claims pertaining to 347 MBS offerings and two private placements in which it alleges that it purchased securities between 2005 and 2007. AIG seeks rescission of its purchases or a rescissory measure of damages or, in the alternative, compensatory damages of no less than $10 billion; punitive damages; and other unspecified relief. Defendants removed the case to the U.S. District Court for the Southern District of New York and filed a notice with the JMDL seeking to add the case to the Countrywide RMBS MDL. The district court denied AIG’s motion to remand the case to state court. Plaintiffs are seeking an interlocutory appeal to the U.S. Court of Appeals for the Second Circuit following the district court’s certification. On December 21, 2011, the JMDL transferred the Countrywide MBS claims to the Countrywide RMBS MDL. The non-Countrywide MBS claims will be heard in the U.S. District Court for the Southern District of New York.
Dexia Litigation
Dexia Holdings, Inc. and others filed an action on January 24, 2011 against CFC, the Corporation, several related entities, and former directors and officers of Countrywide in New York Supreme Court, New York County entitled Dexia Holdings, Inc., et al., v. Countrywide Financial Corporation, et al. The complaint asserts certain MBS Claims relating to plaintiffs’ alleged purchases of MBS issued by CFC-related entities in 142 MBS offerings and six private placements between April 2004 and August 2007 and seeks unspecified compensatory and/or rescissory damages, punitive damages and other unspecified relief. Defendants removed the case to the U.S. District Court for the Southern District of New York, and on August 15,York. The district court denied AIG’s motion to remand the case to state court.
On December 21, 2011, the JMDLJPML transferred the caseCountrywide MBS claims to the Countrywide RMBS MDL. MDL in the Central District of California. The non-Countrywide MBS claims will be heard in the U.S. District Court for the Southern District of New York.
On November 8, 2011,April 24, 2012, the Countrywide RMBS MDL deniedU.S. Court of Appeals for the Second Circuit granted plaintiffs’ petition for leave to appeal the ruling of the district court in the Southern District of New York denying plaintiffs’ motion to remand the case to the New York Supreme Court. The appeal is pending.
On February 17,May 23, 2012, the Countrywide RMBS MDL granteddistrict court in substantial part defendants' motion to dismiss, dismissingthe Central District of California dismissed with prejudice allplaintiffs’ federal lawsecurities claims
|
| | |
| | Bank and certain of America229
|
as to 146 of the 148 offerings at issue, dismissing with leave to amend the state law negligent misrepresentation, aidingcommon law claims. On August 31, 2012, AIG filed an amended complaint, which, among other things, added claims against the Corporation and abetting,certain related entities for constructive fraudulent conveyance and successor liability claims and substantially denying the motion to dismiss as to the state law fraud andintentional fraudulent inducement claims.conveyance.
FHFA Litigation
The FHFA, as conservator for FNMA and FHLMC, filed an action on September 2, 2011 against the Corporation and related entities, CFCCountrywide and related entities, certain former officers of these entities, and NB Holdings Corporation in New York Supreme Court, New York County, entitled Federal Housing Finance Agency v. Countrywide Financial Corporation, et al. (the FHFA Countrywide Litigation). FHFA’s complaint asserts certain MBS Claims in connection with allegations that FNMA and FHLMC purchased MBS issued by CFC-relatedCountrywide-related entities in 86 MBS offerings between 2005 and 2008. The FHFA seeks among other relief, rescission of the consideration paid for the securities or alternatively damages allegedly incurred by FNMA and FHLMC.FHLMC, including consequential damages. The FHFA also seeks recovery of punitive damages.
On September 30, 2011, CFCCountrywide removed the FHFA Countrywide Litigation from New York Supreme Court to the U.S.
District Court for the Southern District of New York. On February 7, 2012, the JPML transferred the matter to the Countrywide RMBS MDL. TheOn April 5, 2012, the court denied the FHFA’s motion to remand the caseFHFA Countrywide Litigation to New York Supreme Court is pending.Court. On October 18, 2012, the court dismissed as untimely FHFA’s Section 11 claims as to 24 of the 86 MBS allegedly purchased by FNMA and FHLMC, but otherwise denied the motion to dismiss on statute of limitations and statute of repose grounds.
Also on September 2, 2011, the FHFA, as conservator for FNMA and FHLMC, filed complaints in the U.S. District Court for the Southern District of New York against the Corporation and Merrill Lynch related entities, and certain current and former officers and directors of these entities. The actions are entitled Federal Housing Finance Agency v. Bank of America Corporation, et al. (the FHFA Bank of America Litigation) and Federal Housing Finance Agency v. Merrill Lynch & Co., Inc., et alal. (the FHFA Merrill Lynch Litigation). The complaints assert certain MBS Claims relating to MBS issued and/or underwritten by the Corporation, Merrill Lynch and related entities in 23 MBS offerings and in 72 MBS offerings, respectively, between 2005 and 2008 and allegedly purchased by either FNMA or FHLMC in their investment portfolio. The FHFA seeks among other relief, rescission of the consideration paid for the securities or alternatively damages allegedly incurred by FNMA and FHLMC.FHLMC, including consequential damages. The FHFA also seeks recovery of punitive damages in the FHFA Merrill Lynch Litigation. The FHFA Bank of America Litigation and the FHFA Merrill Lynch Litigation, along with 14 action.other cases filed by the FHFA against other financial institutions, have been coordinated before a single judge in the U.S. District Court for the Southern District of New York. One action, FHFA v. UBS Americas, Inc., et al. (the UBS Action), was designated the lead action with respect to allegations and claims common to the pending FHFA cases. On May 4, 2012, the court denied in part and granted in part a motion to dismiss in the UBS Action. The court subsequently denied motions to dismiss in the FHFA Merrill Lynch Litigation and the FHFA Bank of America Litigation on November 8, 2012 and November 28, 2012, respectively. On August 14, 2012, the U.S. Court of Appeals for the Second Circuit granted the UBS defendants’ application for an interlocutory appeal of the district court’s ruling pertaining to the statute of repose on the federal and state securities law claims and the statute of limitations on the federal securities law claims asserted in the UBS Action. The FHFA has asserted similar claims in the FHFA Merrill Lynch Litigation and the FHFA Bank of America Litigation.
Federal Home Loan Bank Litigation
On January 18, 2011, the Federal Home Loan Bank of Atlanta (FHLB Atlanta) filed a complaint asserting certain MBS Claims against the Corporation, CFCCountrywide and other Countrywide entities in Georgia State Court, Fulton County, entitled Federal Home Loan Bank of Atlanta v. Countrywide Financial Corporation, et al. FHLB Atlanta seeks rescission of its purchases or a rescissory measure of damages, unspecified punitive damages and other unspecified relief in connection with its alleged purchase of 16 MBS offerings issued and/or underwritten by Countrywide-related entities between 2004 and 2007.
On October 15, 2010, the Federal Home Loan Bank of Chicago (FHLB Chicago) filed a complaint against the Corporation, Countrywide, MLPF&S and related entities in Illinois Circuit Court, Cook County, entitled Federal Home Loan Bank of Chicago v. Banc of America Funding Corp., et al. On April 8, 2011, FHLB Chicago filed an amended complaint adding Merrill Lynch Mortgage Investors (MLMI) and others as defendants. FHLB Chicago asserts
certain MBS Claims arising from FHLB Chicago’s alleged purchase in 13 MBS offerings issued and/or underwritten by affiliates of the Corporation, Merrill Lynch or Countrywide between 2005 and 2006 and seeks rescission, unspecified damages and other unspecified relief.
On March 15, 2010, the Federal Home Loan Bank of San Francisco (FHLB San Francisco) filed an action in California Superior Court, San Francisco County, entitled Federal Home Loan Bank of San Francisco v. Credit Suisse Securities (USA) LLC, et al. FHLB San Francisco’s complaint asserts certain MBS Claims against BAS, CFCCountrywide and several related entities in
connection with its alleged purchases in purchase of 51 MBS offerings and one private placement issued and/or underwritten by those defendants between 2004 and 2007 and seeks rescission and unspecified damages. FHLB San Francisco dismissed the federal claims with prejudice on August 11, 2011. On September 8, 2011, the court denied defendants’ motions to dismiss the state law claims.
Luther Litigation and Related Actions
On November 14, 2007, David H. Luther and various pension funds (collectively, the Luther Plaintiffs) commenced a putative class action against CFC,Countrywide, several of its affiliates, MLPF&S and certain former officers of these in California Superior Court, Los Angeles County, entitled Luther v. Countrywide Financial Corporation, et al. (the Luther Action). The Luther Plaintiffs’ complaint asserts certain MBS Claims in connection with MBS issued by subsidiaries of CFCCountrywide in 429 offerings between 2005 and 2007. The Luther Plaintiffs certified that they collectively purchased securities in 63 of 429 offerings for approximately $216 million. The Luther Plaintiffs seek compensatory and/or rescissory damages and other unspecified relief. On January 6, 2010, the court granted CFC’sCountrywide’s motion to dismiss with prejudice due to lack of subject matter jurisdiction. On May 18, 2011, the California Court of Appeal reversed the dismissal and remanded to the Superior Court. Defendants have filed aOn June 12, 2012, the Countrywide defendants removed the case from the California Superior Court to the U.S. District Court for the Central District of California. On August 31, 2012, the U.S. District Court for the Central District of California denied the plaintiffs’ motion to dismiss.remand to the California Superior Court.
Following the previous dismissal of the Luther Action on January 6, 2010, the Maine State Retirement System filed a putative class action in the U.S. District Court for the Central District of California, entitled Maine State Retirement System v. Countrywide Financial Corporation, et al. (the Maine Action). The Maine Action names the same defendants as the Luther Action, as well as the Corporation and NB Holdings Corporation, and asserts substantially the same allegations regarding 427 of the MBS offerings that were at issue in the Luther Action. Plaintiffs in the Maine Action (Maine Plaintiffs) seek compensatory and/or rescissory damages and other unspecified relief.
On November 4, 2010, the court granted CFC’sCountrywide’s motion to dismiss the amended complaint in its entirety and held that the Maine Plaintiffs only have standing to sue over the 81 offerings in which they actually purchased MBS. The court also held that the applicable statute of limitations could be tolled by the filing of the Luther Action only with respect to the offerings in which the Luther Plaintiffs actually purchased MBS. As a result of these standing and tolling rulings, the number of offerings at issue in the Maine Action was reduced from 427 to 14.14. On December 6, 2010, the Maine Plaintiffs filed a second amended complaint that relates to 14 MBS offerings. On April 21, 2011, the court dismissed with prejudice the successor liability claims against the Corporation and NB Holdings Corporation. On May 6, 2011, the court held that the Maine Plaintiffs only have standing to sue over the specific MBS tranches that they purchased, and that the applicable statute of limitations could be tolled by the filing of the Luther Action only
with respect to the specific tranches of MBS that the Luther Plaintiffs purchased. As a result of these tranche-specific standing and tolling rulings, the Maine Action was further reduced from 14 offerings to eight tranches. On June 6, 2011, the Maine Plaintiffs filed a third amended complaint that related to eight MBS tranches. On June 15, 2011, the court denied the Maine Plaintiffs’ motion
to permit immediate interlocutory appeal of the court’s orders on standing, tolling of the statute of limitations and successor liability. On October 12, 2011, upon stipulation by the parties, the court certified a class consisting of eight subclasses, one for each of the eight MBS tranches at issue.
On November 17, 2010, Western Conference of Teamsters Pension Trust Fund (Western Teamsters) filed a putative class action against the same defendants named in the Maine Action in California Superior Court, Los Angeles County, entitled Western Conference of Teamsters Pension Trust Fund v. Countrywide Financial Corporation, et al. Western Teamsters’ complaint asserts that Western Teamsters and other unspecified investors purchased MBS issued in the 428 offerings that were also at issue in the Luther Action and asserts substantially the same allegations as the Luther Action. The Western Teamsters action has been coordinated with the Luther Action. Western Teamsters seekseeks unspecified compensatory and/or rescissory damages and other unspecified relief. On June 12, 2012, the Countrywide defendants removed the case from the California Superior Court to the U.S. District Court for the Central District of California. On August 31, 2012, the U.S. District Court for the Central District of California denied the plaintiffs’ motion to remand to the California Superior Court.
On January 27, 2011, Putnam Bank filed a putative class action lawsuit against CFC,Countrywide, the Corporation and several related entities, among others, in the U.S. District Court for the District of Connecticut, entitled Putnam Bank v. Countrywide Financial Corporation, et al. Putnam Bank’s complaint asserts certain MBS Claims in connection with alleged purchases in eight MBS offerings issued by CFCCountrywide subsidiaries between 2005 and 2007. Putnam Bank seeks rescission of its purchases or a rescissory measure of unspecified damages and/or compensatory damages and other unspecified relief. On August 15, 2011, the case was transferred to the Countrywide RMBS MDL.
Sealink Litigation
On September 29, 2011, Sealink Funding Limited filed aMarch 9, 2012, the court dismissed the complaint against the Corporation and related entities, Countrywide entities, NB Holdings Corporation and certain former officers of Countrywide. The action is entitledin Sealink Funding LimitedPutnam Bank v. Countrywide Financial Corp.Corporation, et al., and was filed in New York Supreme Court, New York County. The complaint asserts certain MBS Claims in connectionas time-barred, with alleged purchases in 31 MBS offerings issued and/or underwritten by Countrywide entities between 2005 and 2007. Sealink seeks among other relief, rescissionprejudice. On May 23, 2012, the court denied Putnam Bank’s motion to seek immediate interlocutory appeal of the consideration Sealink allegedly paid for the securities, or alternatively, damages allegedly incurred by Sealink, as well as punitive damages. On October 6, 2011, defendants removed the action to the U.S District Court for the Southern District of New York. The JMDL transferredcourt’s order dismissing the case, to the Countrywide RMBS MDL.
Merrill Lynch MBS Litigation
Merrill Lynch, MLPF&S, MLMI,in its entirety and certain current and former directors of MLMI are named as defendants in a consolidated class action in the U.S. District Court in the Southern District of New York, entitled Public Employees’ Ret. System of Mississippi v. Merrill Lynch & Co. Inc. Plaintiffs assert certain MBS Claims in connection with their purchase of MBS. In March 2010, the court dismissed claims related to 65 of 84 offerings with prejudice, dueas time-barred.
to lack of standing as no named plaintiff purchased securities in those offerings. On November 8, 2010, the court dismissed claims related to one additional offering on separate grounds. On December 14, 2011, the court granted preliminary approval of a settlement providing for a payment by the Corporation in an amount not material to the Corporation’s results of operations (which amount was fully accrued by the Corporation as of December 31, 2011).
Stichting Pensioenfonds ABP (Merrill Lynch) Litigation
On August 19, 2010, Stichting Pensioenfonds ABP (ABP) filed a complaint against Merrill Lynch related entities, and certain current and former directors of MLMI and other defendants, in New York Supreme Court, New York County, entitled Stichting Pensioenfonds v. Merrill Lynch & Co., Inc., et al. The action was removed to the U.S. District Court for the Southern District of New York. ABP’s complaint asserts certain MBS Claims in connection with alleged purchases in 13 offerings of Merrill Lynch-related MBS issued between 2006 and 2007. On October 12, 2011, ABP filed an amended complaint regarding the same offerings and adding additional federal securities law and state law claims. ABP seeks unspecified compensatory damages, interest and legal fees, or alternatively, rescission.
Regulatory Investigations
The Corporation has received a number of subpoenas and other requests for information from regulators and governmental authorities regarding MBS and other mortgage-related matters, including inquiries, investigations and investigationspotential proceedings related to a number of transactions involving the Corporation’s underwriting and issuance of MBS and its participation in certain CDO offerings. These inquiries and investigations include, among others, an investigation by the SEC related to Merrill Lynch’s risk control, valuation, structuring, marketing and purchase of CDOs.CDOs, and an investigation by the New York State Attorney General concerning the purchase, securitization and underwriting of mortgage loans and MBS. The Corporation has provided documents and testimony and continues to cooperate fully with these inquiries and investigations.
Bank of America, Merrill Lynch and Countrywide may also be subject to contractual indemnification for the benefit of certain individuals involvedobligations in the MBS matters discussed above.
Mortgage Repurchase Litigation
Walnut Place Litigation
On February 23, 2011, 11 entities with the common name Walnut Place (including Walnut Place LLC, and Walnut Place II LLC through Walnut Place XI LLC) filed a lawsuit, entitled Walnut Place LLC, et al. v. Countrywide Home Loans, Inc. et al., in New York Supreme Court, New York County, against CHL and several unaffiliated defendants (collectively, Sellers), as well as the Corporation and the Bank of New York Mellon in its capacity as trustee. The initial complaint was a purported derivative action for alleged breaches of a pooling and servicing agreement under which the Sellers sold residential mortgage loans to a securitization trust. Plaintiffs are alleged holders of certificates in several classes of the securitization trust who purport to sue derivatively in the place of the trustee. Plaintiffs allege that Sellers breached representations and warranties in the pooling and servicing agreement regarding mortgage loans. Plaintiffs seek a court order requiring Sellers to repurchase the mortgage loans at issue, or alternatively, damages for breach of contract, and allege that the Corporation is a successor in liability to CHL. On April 12, 2011, plaintiffs amended
their complaint to add similar allegations with respect to an additional securitization trust. On May 17, 2011, the Corporation and Sellers jointly moved to dismiss the amended complaint.
On August 2, 2011, plaintiffs filed a separate action entitled Walnut Place LLC, et al. v. Countrywide Home Loans, Inc. et al., in New York Supreme Court, New York County, against the Corporation and Sellers, and The Bank of New York Mellon in its capacity as trustee. This action makes allegations similar to those in the prior Walnut Place LLC, et al. v. Countrywide Home Loans, Inc. et al. lawsuit with respect to an additional securitization trust. On October 7, 2011, the Corporation and Sellers jointly moved to dismiss the complaint.
TMST, Inc. Litigation
On April 29, 2011, the Chapter 11 bankruptcy trustee for TMST, Inc. (formerly known as Thornburg Mortgage, Inc.) and for certain affiliated entities (collectively, Thornburg), along with Zuni Investors, LLC (ZI), filed an adversary proceeding in the U.S. Bankruptcy Court for the District of Maryland entitled In Re TMST, Inc., f/k/a Thornburg Mortgage, Inc. against CHL and the Corporation. Plaintiffs filed an amended complaint on July 29, 2011, in which they allege, among other things, that CHL sold residential mortgage loans to Thornburg pursuant to two agreements, and that CHL allegedly breached certain representations and warranties contained in those agreements concerning property appraisals, prudent and customary loan origination practices, accuracy of mortgage loan schedules and occupancy status. The complaint further alleges that those loans were deposited by Thornburg into a securitization trust, that ZI purchased certificates issued by that trust, and that the securitization trustee subsequently assigned to ZI and the bankruptcy trustee the right to pursue representation and warranty claims. Plaintiffs seek a court order requiring CHL to repurchase the mortgage loans at issue, or alternatively, unspecified damages for alleged breach of contract. CHL and the Corporation have filed motions to dismiss the case, to withdraw the reference to the Bankruptcy Court, and for transfer of venue to the United States District Court for the Central District of California. On July 12, 2012, the case was transferred to the U.S. District Court for the District of Maryland, which on August 21, 2012, granted CHL’s and the Corporation’s motions to transfer venue to the United States District Court for the Central District of California. That court heard argument on CHL’s motion to dismiss on November 27, 2012. On February 26, 2013, the parties agreed to settle the case for an amount not material to the Corporation’s results of operations. The agreement is subject to, among other things, approval by the bankruptcy court overseeing the Thornburg bankruptcy. On February 26, 2013, the bankruptcy trustee filed a motion to approve the settlement. The motion is tentatively scheduled to be heard on March 20, 2013.
U.S. Bank Litigation
On August 29, 2011, U.S. Bank, National Association (U.S. Bank), as trustee for the HarborView Mortgage Loan Trust 2005-10 (the Trust), a mortgage pool backed by loans originated by CHL, filed a complaint in New York Supreme Court, New York County, in a case entitled U.S. Bank National Association, as Trustee for HarborView Mortgage Loan Trust, Series 2005-10 v. Countrywide Home Loans, Inc. (dba Bank of America Home Loans), Bank of America Corporation, Countrywide Financial Corporation, Bank of America, N.A., and NB Holdings Corporation. U.S. Bank seeks a declarationasserts that, as a result of alleged misrepresentations by CHL in connection with its sale of the loans, defendants must repurchase all the loans. U.S. Bank further assertsloans in the pool, or in the alternative that defendants are liable for breach of contract for the alleged failure toit must repurchase a subset of those loans.loans as to which U.S. Bank alleges that defendants have refused specific repurchase demands. U.S. Bank asserts claims for breach of contract and seeks specific performance of defendants’ alleged obligation to repurchase the entire pool of loans (alleged to have an original aggregate principal balance of $1.75 billion) or alternatively the aforementioned subset (alleged to have an aggregate principal balance of “over $100 million”), together with reimbursement of costs and expenses and other unspecified relief. Defendants removed the case to the U.S. District Court for
the Southern District of New York. U.S. Bank filed a motion to remand which is currently pending. On February 7, 2012,York, and the JPML issued an order transferring the case to the Countrywide RMBS MDL in the U.S. District Court for the Central District of California.
On April 5, 2012, the U.S. District Court for the Central District of California remanded the case to New York Supreme Court.Mortgage Servicing Investigations andPolicemen’s Annuity Litigation
The Corporation entered into a consent order withOn April 11, 2012, the OfficePolicemen’s Annuity & Benefit Fund of the ComptrollerCity of the Currency (OCC)Chicago, on April 13, 2011, which requires servicers to make several enhancements to their servicing operations, including implementationits own behalf and on behalf of a single pointproposed class of contact model for borrowers throughout the loss mitigation and foreclosure processes, adoptionpurchasers of measures designed to ensure that foreclosure activity is halted once41 RMBS trusts collateralized by Washington Mutual-originated (WaMu) mortgages, filed a borrower has been approved for a modification unless the borrower fails to make payments under the modified loan and implementation of enhanced controls over third-party vendors that provide default servicing support services. In addition, the consent order required that servicers retain an independent consultant, approved by the OCC, to conduct a review of all foreclosure actions pending, or foreclosure sales that occurred between January 1, 2009 and December 31, 2010 and submit a plan to the OCC to remediate all financial injury to borrowers caused by any deficiencies identified through the review. The review is comprised of two parts: a sample file review conducted by the independent consultant, which began in October 2011, and file reviews by the independent consultant based upon requests for review from customers with in-scope foreclosures. The Corporation began outreach to those customers in November 2011 and additional outreach efforts are underway. Because the review process is available to a large number of potentially eligible borrowers and involves an examination of many details and documents, each review could take several months to complete. The Corporation cannot yet accurately determine how many borrowers will request a review, how many borrowers will meet the eligibility requirements or how much in compensation might ultimately be paid to eligible borrower.
On February 9, 2012, the Corporation reached agreements in principle (collectively, the Servicing Resolution Agreements) with (i) the DOJ, various federal regulatory agencies and 49 attorneys general to resolve federal and state investigations into certain origination, servicing and foreclosure practices (the Global AIP), (ii) the Federal Housing Administration (the FHA) to resolve certain claims relating to the origination of FHA-insured mortgage loans, primarily by Countrywide prior to and for a period following the acquisition of that lender (the FHA AIP) and (iii) each of the Federal Reserve and the OCC regarding civil monetary penalties related to conduct that was the subject of consent orders entered into with the banking regulators in April 2011 (the Consent Order AIPs).
The Servicing Resolution Agreements are subject to ongoing discussions among the parties and completion and execution of definitive documentation, as well as required regulatory and court approvals. The Global AIP is subject to, among other things, Federal court approvalproposed class action complaint in the United States District Court for the Southern District of New York, entitled Policemen’s Annuity and Benefit Fund of the City of Chicago v. Bank of America, NA and U.S. Bank National Association. BANA and U.S. Bank are named as defendants in their capacities as trustees, with BANA (formerly LaSalle Bank National Association) having served as the original trustee and U.S. Bank having replaced BANA as trustee. Plaintiff asserts claims under the federal Trust Indenture Act as well as state common law claims. Plaintiff alleges that, in light of the performance of the RMBS at issue, and in the Districtwake of Columbia and regulatory approvalspublicly-available information about the quality of loans originated by WaMu, the trustees were required to take certain steps to protect plaintiff’s interest in the value of the United States Departmentsecurities, and that plaintiff was damaged by defendants’ failures to notify it of deficiencies in the loans and of defaults under the relevant agreements, to ensure that the underlying mortgages could properly be foreclosed, and to enforce remedies available for loans that contained breaches of representations and warranties. Plaintiff seeks unspecified compensatory damages and/or equitable relief, and costs and expenses.
On December 7, 2012, the court granted in part and denied in part defendants’ motion to dismiss, and granted plaintiff leave to replead some of the Treasury and other federal agencies.dismissed claims. The Consent Order AIPs are subject to,court ruled, among other things, the finalizationthat plaintiff has standing to pursue claims on behalf of the Global AIP.
The Global AIP calls for the establishmentpurchasers of certificates in certain uniform servicing standards, upfront cash payments of approximately $1.9 billion to the state and federal governments and for borrower restitution, approximately $7.6 billion in borrower assistance in the form of, among other things, principal reduction, short sales and deeds-in-lieu of foreclosure, and approximately $1.0 billion of refinancing assistance. The Corporation could be required to make additional payments if it fails to meet its borrower assistance and
refinancing assistance commitments over a three-year period. In addition, the Corporation could be required to pay an additional $350 million if the Corporation fails to meet certain first-lien principal reduction thresholds over a three-year period. The Corporation also entered into agreements with several states under which it committed to perform certain minimum levels of principal reduction and related activities within those states as part of the Global AIP, and under which it could be required to make additional payments if it fails to meet such minimum levels. The Corporation may also incur additional operating costs (e.g., servicing costs) to implement certain terms of the Global AIP in future periods. The FHA AIP provides for an upfront cash payment by the Corporationtranches of $500 million. The FHA would release the Corporation from all claims arising from loans originated prior to April 30, 2009 that were submitted for FHA insurance claim payments prior to January 1, 2012, and from multiple damages and penalties for loans that were originated on or before April 30, 2009, but had not been submitted for FHA insurance claim payment. The Corporation would have the obligation to pay an additional $500 millionfive if the Corporation fails to meet certain principal reduction thresholds overtrusts. Plaintiffs filed a three-year period.
Pursuant to an agreement in principle, the OCC agreed to hold in abeyance the imposition of a civil monetary penalty ofsecond amended complaint on January 13, 2013, which added plaintiffs and asserted claims concerning $164 million. Pursuant to a separate agreement in principle, the Federal Reserve will assess a civil monetary penalty in the amount of $176 million19 against the Corporation. Satisfying its payment, borrower assistance and remediation obligations under the Global AIP will satisfy any civil monetary penalty obligations arising under these agreements in principle. If, however, the Corporation does not make certain required payments or undertake certain required actions under the Global AIP, the OCC will assess, and the Federal Reserve will require the Corporation to pay the difference between the aggregate value of the payments and actions under these agreements in principle and the penalty amounts.trusts.
Under the terms of the Global AIP, the federal and participating state governments would release the Corporation from further liability for certain alleged residential mortgage origination, servicing and foreclosure deficiencies. In settling origination issues related to FHA guaranteed loans originated on or before April 30, 2009, the FHA would provide the Corporation and its affiliates a release for all claims with respect to such loans if an insurance claim had been submitted to the FHA prior to January 1, 2012 and a release of multiple damages and penalties (but not single damages) if no such claim had been submitted.
The Servicing Resolution Agreements do not cover claims arising out of securitization, including representations made to investors respecting MBS, criminal claims, private claims by borrowers, claims by certain states for injunctive relief or actual economic damages to borrowers related to the Mortgage Electronic Registration System, and claims by the GSEs (including repurchase demands), among other items.
The Corporation continues to be subject to additional borrower and non-borrower litigation and governmental and regulatory scrutiny related to its past and current servicing and foreclosure activities, including those claims not covered by the Servicing Resolution Agreements. This scrutiny may extend beyond the Corporation’s pending foreclosure matters to issues arising out of alleged irregularities with respect to previously completed foreclosure activities. The current environment of heightened regulatory scrutiny may subject the Corporation to inquiries or investigations.
Ocala Litigation
Ocala Investor Actions
On November 25, 2009, BNP Paribas Mortgage Corporation and Deutsche Bank AG each filed claims (the 2009 Actions) against BANA in the U.S. District Court for the Southern District of New York entitled BNP Paribas Mortgage Corporation v. Bank of America, N.A. and Deutsche Bank AG v. Bank of America, N.A. Plaintiffs allege that BANA failed to properly perform its duties as indenture trustee, collateral agent, custodian and depositary for Ocala Funding, LLC (Ocala), a home mortgage warehousing facility, resulting in the loss of plaintiffs’ investment in Ocala. Ocala was a wholly-owned subsidiary of Taylor, Bean & Whitaker Mortgage Corp. (TBW), a home mortgage originator and servicer which is alleged to have committed fraud that led to its eventual bankruptcy. Ocala provided funding for TBW’s mortgage origination activities by issuing notes, the proceeds of which were to be used by TBW to originate home mortgages. Such mortgages and other Ocala assets in turn were pledged to BANA, as collateral agent, to secure the notes. Plaintiffs lost most or all of their investment in Ocala when, as the result of the alleged fraud committed by TBW, Ocala was unable to repay the notes purchased by plaintiffs and there was insufficient collateral to satisfy Ocala’s debt obligations. Plaintiffs allege that
BANA breached its contractual, fiduciary and other duties to Ocala, thereby permitting TBW’s alleged fraud to go undetected. Plaintiffs seek compensatory damages and other relief from BANA, including interest and attorneys’ fees, in an unspecified amount, but which plaintiffs allege exceeds $1.6 billion.
On March 23, 2011, the U.S. District Court for the Southern District of New York issued an order granting in part and denying in part BANA’s motions to dismiss the 2009 Actions. The court dismissed plaintiffs’ claims against BANA in its capacity as custodian and depositary, as well as plaintiffs’ claims for contractual indemnification and other claims. The court retained the claims questioning BANA’s performance as indenture trustee and collateral agent. Finally, the court agreed with BANA that plaintiffs may not pursue claims for any breach that arosebased upon Ocala notes issued prior to July 20, 2009 (the date on which plaintiffs purchased the last issuance of Ocala notes). On December 29, 2011, plaintiffs moved for leave to amend their complaints to include additional contractual, tort and equitable claims.
On June 22, 2011, BANA filed third-party complaints in the 2009 Actions against BNP Paribas Securities Corp. (BNP Securities) and Deutsche Bank Securities, Inc. (Deutsche Securities) seeking contribution for damages sustained by BANA in the underlying actions. BNP Securities and Deutsche Securities (collectively, the Note Dealers) served as note dealers and private placement agents for the Ocala notes that are the subject of the underlying actions. On September 15, 2011, the Note Dealers moved to dismiss the third-party complaints.
On August 30, 2010, plaintiffs each filed new lawsuits (the 2010 Actions) against BANA in the U.S. District Court for the Southern District of Florida entitled BNP Paribas Mortgage Corporation v. Bank of America, N.A. and Deutsche Bank AG v. Bank of America, N.A., which the parties agreed to transfer to the U.S. District Court for the Southern District of New York as related to the 2009 Actions. On December 29, 2011, plaintiffs voluntarily dismissed the 2010 Actions without prejudice and moved for leave to amend their complaints in the 2009 Actions as discussed above.to include additional contractual, tort and equitable claims. On June 5, 2012, the court granted plaintiffs’ motion. Plaintiffs filed amended complaints on October 1, 2012.
FDIC Action
On October 1, 2010, BANA on behalf of Ocala’s investors, filed suit in the U.S. District Court for the District of Columbia against the FDIC as receiver of Colonial Bank, TBW’s primary bank, and Platinum Community Bank (Platinum, a wholly-owned subsidiary
of TBW) entitled Bank of America, National Association as indenture trustee, custodian and collateral agent for Ocala Funding, LLC v. Federal Deposit Insurance Corporation(the FDIC Action). The suit seeks judicial review of the FDIC’s denial of the administrative claims brought by BANA in the FDIC’s Colonial and Platinum receivership proceedings. BANA’s claims allege that Ocala’s losses were in whole or in part the result of Colonial and Platinum’s participation in TBW’s alleged fraud. BANA seeks a court order requiring the FDIC to allow BANA’s claims in an amount equal to Ocala’s losses and, accordingly, to permit BANA, as trustee, collateral agent, custodian and depositary for Ocala, to share appropriately in distributions of any receivership assets that the FDIC makes to creditors of the two failed banks.
On March 14, 2011, the FDIC moved to dismiss BANA’s action, primarily on the ground that Ocala Funding had not exhausted its administrative remedies. BANA filed an amended complaint alleging that it had exhausted its administrative remedies. On August 5, 2011, the FDIC answered and moved to dismiss the amended complaint, and asserted counterclaims against BANA in itsBANA’s individual capacity seeking approximately $900 million in damages. The counterclaims allege that Colonial sent 4,808 loans to BANA as bailee; that BANA converted the loans into Ocala collateral without first ensuring that Colonial was paid; and that Colonial was never paid for these loans. BANA filed an opposition to the FDIC’s motion to dismiss on October 21, 2011, along with a motion to dismiss the FDIC’s counterclaims.
On December 10, 2012, the U.S. District Court for the District of Columbia granted in part and denied in part the FDIC’s motion to dismiss BANA’s amended complaint. The court dismissed BANA’s claims to the extent they were brought on behalf of Ocala, holding that those claims were not administratively exhausted, and also dismissed three equitable claims, but allowed BANA to continue to pursue claims in its individual capacity and on behalf
of Ocala’s secured parties, principally plaintiffs in the 2009 Actions. The court also granted in part and denied in part BANA’s motion to dismiss the FDIC’s counterclaims, allowing all but one of the FDIC’s 16 counterclaims to go forward.
Ocala Bankruptcy
On July 10, 2012, Ocala filed a pre-arranged voluntary Chapter 11 bankruptcy petition in the U.S. Bankruptcy Court for the Middle District of Florida, pursuant to an agreement among Ocala, BANA, BNP Paribas Mortgage Corporation, Deutsche Bank AG, the FDIC and Ocala’s owner, TBW. Among other things, the proposed bankruptcy plan and certain side agreements would permit the Ocala bankruptcy trustee to pursue litigation against third parties to mitigate BANA’s potential losses in the FDIC Action and the 2009 Actions. Certain agreements embodied by that plan, including an agreement among the parties to allow BANA to assign claims held in its representative capacities to the Ocala bankruptcy estate, were approved by the Court on August 23, 2012. The remainder of the proposed plan is subject to approval by the bankruptcy court.
NOTE 1514 Shareholders’ Equity
Common Stock
|
| | | | | | | | |
| | | | | | | |
| Declared Quarterly Cash Dividends on Common Stock |
| | | | | | | |
| Declaration Date | | Record Date | | Payment Date | | Dividend Per Share |
| | | |
| January 23, 2013 | | March 1, 2013 | | March 22, 2013 | | $ | 0.01 |
|
| October 24, 2012 | | December 7, 2012 | | December 28, 2012 | | 0.01 |
|
| July 11, 2012 | | September 7, 2012 | | September 28, 2012 | | 0.01 |
|
| April 11, 2012 | | June 1, 2012 | | June 22, 2012 | | 0.01 |
|
| January 11, 2012 | | March 2, 2012 | | March 23, 2012 | | 0.01 |
|
In November 2011, August 2011, May 2011 and January 2011, the Corporation’s Board of Directors (the Board) declared the fourth, third, second and first quarter cash dividends of $0.01 per common share, which were paid on December 23, 2011, September 23, 2011, June 24, 20112012 and March 25, 2011 to common shareholders of record on December 2, 2011, September 2, 2011, June 3, 2011 and March 4, 2011, respectively. In addition, in January 2012, the Board declared a first quarter cash dividend of $0.01 per common share payable on March 23, 2012 to common shareholders of record on March 2, 2012.
In connection with the exchanges described below in Preferred Stock in this Note, the Corporation issued50 million and 400 million shares of common stock.
On September 1, 2011, the Corporation closed the sale to Berkshire Hathaway, Inc. (Berkshire) of 50,000 shares of the Series T Preferred Stock and a warrant (the Warrant) to purchase 700 million shares of the Corporation’s common stock for an aggregate purchase price of $5.0 billion in cash. Of the $5.0 billion in cash proceeds, $2.9 billion was allocated to preferred stock and $2.1 billion to the Warrant on a relative fair value basis. The discount on the Series T Preferred Stock is not subject to accretion. The portion of proceeds allocated to the Warrant was recorded as additional paid-in capital. The Warrant is exercisable at the holder’s option at any time, in whole or in part, until September 1, 2021, at an exercise price of $7.142857 per share of common stock. The Warrant may be settled in cash or by exchanging all or a portion of the Series T Preferred Stock. For additional information on the Berkshire investment and Series T Preferred Stock, see Preferred Stock in this Note.
On February 23, 2010, the Corporation held a special meeting of stockholders at which it obtained shareholder approval of an amendment to the Corporation’s amended and restated certificate of incorporation to increase the number of authorized shares of common stock fromAt 10.0 billionDecember 31, 2012 to 11.3 billion. On April 28, 2010, at the Corporation’s 2010 annual meeting of stockholders, the Corporation obtained shareholder approval of an amendment to the Corporation’s amended and restated certificate of incorporation to increase the number of authorized shares of common stock from 11.3 billion to 12.8 billion.
In January 2009, the Corporation issued 1.4 billion shares of common stock in connection with its acquisition of Merrill Lynch. During 2009 and 2008, in connection with preferred stock issuances to the U.S. government under the Troubled Asset Relief Program (TARP), the Corporation issuedhad warrants outstanding and exercisable to purchase 121.8 million shares of common stock at an exercise price of $30.79 per share expiring on October 28, 2018, and warrants outstanding and exercisable to purchase 150.4 million shares of common stock at an exercise price of $13.30 per share. Theshare expiring on January 16, 2019. These warrants were originally issued in connection with preferred stock
issuances to the U.S. Department of the Treasury auctioned these warrants in March 2010.
In May 2009,2010 and are listed on the Corporation issued 1.3 billion shares of its common stock at an average price of $10.77 per share through an at-the-market issuance program resulting in gross proceeds of approximately $13.5 billion.New York Stock Exchange.
In connection with employee stock plans, in 20112012, the Corporation issued approximately 51297 million shares and repurchased approximately 28104 million shares of its common stock to satisfy tax withholding obligations. At December 31, 20112012, the Corporation had reserved 2.21.9 billion unissued shares of common stock for future issuances under employee stock plans, common stock warrants, convertible notes and preferred stock.
There is no existing Board authorized share repurchase program.
Preferred Stock
During both 2011 and 2010, theThe dividends declared on preferred stock were $1.4 billion for 2012, 2011 and 2010.
In 2012, the Corporation entered into various agreements with certain preferred stock and Trust Securities holders pursuant to which the Corporation and the holders of these securities agreed to exchange shares of various series of non-convertible preferred stock with a carrying value of $296 million and Trust Securities with a carrying value of $760 million for 50 million shares of the Corporation’s common stock with a fair value of $412 million, and $4.5 billion398 million in cash. The $246 million difference between the carrying value of the preferred stock and Trust Securities retired and the fair value of consideration issued was recorded in retained earnings as a $44 million reduction to preferred stock dividends and a $202 million gain in noninterest income.
In 2012, the Corporation issued shares of the Corporation’s Series F Preferred Stock and Series G Preferred Stock for 2009$633 million under stock purchase contracts. For additional information, see Preferred Stock Summary in this Note and Note 12 – Long-term Debt.
In 2011, the Corporation entered into separate agreements with certain institutional preferred stock and Trust SecuritySecurities holders (the Exchange Agreements) pursuant to which the Corporation and each security holderthe holders of these securities agreed to exchange shares, or depository shares representing fractional interests in shares, of various series of the Corporation’s preferred stock, par value $0.01 per share, or Trust Securities for an aggregate of 400 million shares of the Corporation’s common stock valued at $2.2 billion and $2.3 billion aggregate principal amount of senior notes. The exchanges, in the aggregate, increased Tier 1 common capital by $3.9 billion, or approximately 29 bps. The Exchange Agreements related to Trust Securities are described in Note 1312 – Long-term Debt and the Exchange Agreements related to preferred stock are described below.
As part of the Exchange Agreements, the Corporation exchanged non-convertible preferred stock, with an aggregate liquidation preference of $815 million and carrying value of $814 million, for 72 million shares of common stock valued at $399 million and senior notes valued at $231 million. The $184 million difference between the carrying value of the non-convertible preferred stock and the fair value of the consideration issued to the holders of the non-convertible preferred stock was recorded in retained earnings as a non-cash reduction to preferred stock dividends.
Additionally, as a part of the Exchange Agreements, a portion of the Series L 7.25% Non-Cumulative Perpetual Convertible Preferred Stock (Series L Preferred Stock) with an aggregate liquidation preference and carrying value of $269 million was exchanged for 20 million common shares valued at $123 million and senior notes valued at $129 million. The $17 million difference between the carrying value of the Series L Preferred Stock and the fair value of the consideration issued to holders of the Series L
Preferred Stock was reclassified from preferred stock to common stock and additional paid-in capital. Because the number of common shares issued to the Series L Preferred Stock holders was in excess of the number of common shares issuable pursuant to the original conversion terms, the $220 million fair value of consideration transferred to the Series L Preferred Stock holders in excess of the $32 million fair value of securities issuable pursuant to the original conversion terms was recorded as a non-cash preferred stock dividend. The dividend did not impact total
shareholders’ equity assince it reduced retained earnings and increased common stock and additional paid-in capital by the same amount.
The table below lists the aggregate liquidation value of each series of preferred stock exchanged.exchanged in 2012 and 2011.
| | | | | | | | | |
| Preferred Stock Exchanged | | | | | | |
| | | | | | | |
| | Preferred Shares Exchanged | | Liquidation Value (1, 2) | Preferred Shares Exchanged | | Liquidation Value (1, 2) |
| (Dollars in millions, actual shares) | | |
| Non-convertible | | | | | | |
| Series D | 260 |
| | $ | 7 |
| 260 |
| | $ | 7 |
|
| Series E | 5,915 |
| | 148 |
| 6,800 |
| | 170 |
|
| Series J | 1,058 |
| | 26 |
| 1,058 |
| | 26 |
|
| Series K | 4,929 |
| | 123 |
| 4,929 |
| | 123 |
|
| Series M | 4,958 |
| | 124 |
| 4,958 |
| | 124 |
|
| Series 1 | 1,215 |
| | 36 |
| 1,587 |
| | 47 |
|
| Series 2 | 5,436 |
| | 163 |
| 7,579 |
| | 227 |
|
| Series 3 | 563 |
| | 17 |
| 563 |
| | 17 |
|
| Series 4 | 2,203 |
| | 66 |
| 5,965 |
| | 179 |
|
| Series 5 | 3,288 |
| | 99 |
| 6,134 |
| | 185 |
|
| Series 6 | 5,612 |
| | 6 |
| 5,612 |
| | 6 |
|
| Total non-convertible | 35,437 |
| | 815 |
| 45,445 |
| | 1,111 |
|
| Convertible | | | | | | |
| Series L | 269,139 |
| | 269 |
| 269,139 |
| | 269 |
|
| Total exchanged | 304,576 |
| | $ | 1,084 |
| 314,584 |
| | $ | 1,380 |
|
| |
(1) | Amounts shown are before third-party issuance costs. |
| |
(2) | Carrying value of preferred stock exchanged was $1,0831,379 million. |
The Series T Preferred Stock issued as part of the Berkshire investment has a liquidation value of $100,000 per share and dividends on the Series T Preferred Stock accrue on the liquidation value at a rate per annum of six percent but will be paid only when and if declared by the Board out of legally available funds. Subject to the approval of the Board of Governors of the Federal Reserve System, the Series T Preferred Stock may be redeemed by the Corporation at any time at a redemption price of $105,000 per share plus any accrued, unpaid dividends. The Series T Preferred Stock has no maturity date and ranks senior to the outstanding common stock with respect to the payment of dividends and distributions in liquidation. At any time when dividends on the Series T Preferred Stock have not been paid in full, the unpaid amounts will accrue dividends at a rate per annum of eight percent and the Corporation will not be permitted to pay dividends or other distributions on, or to repurchase, any outstanding common stock or any of the Corporation’s outstanding preferred stock of any series. Following payment in full of accrued but unpaid dividends
on the Series T Preferred Stock, the dividend rate remains at eight percent per annum.
In connection with the Merrill Lynch acquisition, Merrill Lynch non-convertible preferred shareholders received Bank of America Corporation preferred stock having substantially identical terms. On October 15, 2010, all of the outstanding shares of the mandatory convertible preferred stock of Merrill Lynch automatically converted into an aggregate of 50 million shares of the Corporation’s common stock in accordance with the terms of these preferred securities.
In January 2009, in connection with TARP and the Merrill Lynch acquisition, the Corporation issued to the U.S. Treasury non-voting perpetual preferred stock for $30.0 billion.
In December 2009, the Corporation repurchased the non-voting perpetual preferred stock previously issued to the U.S. Treasury (TARP Preferred Stock) in 2009 and 2008 through the use of $25.7 billion in excess liquidity and $19.3 billion in proceeds from the sale of 1.3 billion Common Equivalent Securities (CES) valued at $15.00 per unit. The CES consisted of depositary shares representing interests in shares of Common Equivalent Junior Preferred Stock, Series S (Common Equivalent Stock) and contingent warrants to purchase an aggregate of 60 million shares of the Corporation’s common stock. On February 23, 2010, the Corporation held a special meeting of stockholders at which it obtained shareholder approval of an amendment to the Corporation’s amended and restated certificate of incorporation to increase the number of authorized shares of common stock. Accordingly, the Common Equivalent Stock automatically converted in full into 1.286 billion shares of common stock on February 24, 2010. In addition, as a result, the contingent warrants expired without having become exercisable and the CES ceased to exist.
During 2009, the Corporation entered into agreements with certain holders of non-government perpetual preferred stock to exchange their holdings of approximately $7.3 billion aggregate liquidation preference, before third-party issuance costs, of 323 million shares of perpetual preferred stock for 545 million shares of common stock with a fair value of $6.1 billion. In addition, the Corporation exchanged $3.9 billion aggregate liquidation preference, before third-party issuance costs, of 144 million shares of non-government preferred stock for 200 million shares of common stock in an exchange offer with a fair value of stock issued of $2.5 billion. In total, these exchanges resulted in the exchange of $11.3 billion aggregate liquidation preference, before third-party issuance costs, or 467 million shares of preferred stock into 745 million shares of common stock with a fair value of $8.6 billion.
In addition, during 2009, the Corporation exchanged 3.6 million shares, or $3.6 billion aggregate liquidation preference of Series L Preferred Stock into 255 million shares of common stock with a fair value of $2.8 billion, which was accounted for as an induced conversion of preferred stock.
As a result of these 2009 exchanges, the Corporation recorded an increase to retained earnings and net income (loss) applicable to common shareholders of $576 million. This represents the net of a $2.62 billion benefit due to the excess of the carrying value of the Corporation’s non-convertible preferred stock over the fair value of the common stock exchanged, partially offset by a $2.04 billion inducement representing the excess of the fair value of the common stock exchanged over the fair value of the common stock that would have been issued under the original conversion terms.
|
| | |
| | | Bank of America 2012 235239 |
The table below presents a summary of perpetual preferred stock previously issued by the Corporation and remaining outstanding at December 31, 20112012.
| | | | | | | | | | | | | | | | | | | | | |
| Preferred Stock Summary | Preferred Stock Summary | | | | | | | | | | Preferred Stock Summary | | | | | | | | | |
| | | | | | | | | | | | | | | | | | | |
| (Dollars in millions, except as noted) | (Dollars in millions, except as noted) | | | | | | | | | | | (Dollars in millions, except as noted) | | | | | | | | | | |
| Series | Description | | Initial Issuance Date | | Total Shares Outstanding | | Liquidation
Preference per Share (in dollars) | | Carrying Value (1) | | Per Annum Dividend Rate | | Redemption Period | Description | | Initial Issuance Date | | Total Shares Outstanding | | Liquidation
Preference per Share (in dollars) | | Carrying Value (1) | | Per Annum Dividend Rate | | Redemption Period |
Series B (2) | 7% Cumulative Redeemable | | June
1997 | | 7,571 |
| | $ | 100 |
| | $ | 1 |
| | 7.00 | % | | n/a | 7% Cumulative Redeemable | | June
1997 | | 7,571 |
| | $ | 100 |
| | $ | 1 |
| | 7.00 | % | | n/a |
Series D (3, 8) | 6.204% Non-Cumulative | | September
2006 | | 26,174 |
| | 25,000 |
| | 654 |
| | 6.204 | % | | On or after
September 14, 2011 | 6.204% Non-Cumulative | | September
2006 | | 26,174 |
| | 25,000 |
| | 654 |
| | 6.204 | % | | On or after
September 14, 2011 |
Series E (3, 8) | Floating Rate Non-Cumulative | | November
2006 | | 13,576 |
| | 25,000 |
| | 340 |
| | Annual rate equal to the greater of (a) 3-mo. LIBOR + 35 bps and (b) 4.00% |
| | On or after
November 15, 2011 | Floating Rate Non-Cumulative | | November
2006 | | 12,691 |
| | 25,000 |
| | 317 |
| | 3-mo. LIBOR + 35 bps (6) |
| | On or after
November 15, 2011 |
Series F (3, 8) | | Floating Rate Non-Cumulative | | March
2012 | | 1,409 |
| | 100,000 |
| | 141 |
| | 3-mo. LIBOR + 40 bps (6) |
| | On or after
March 15, 2012 |
Series G (3, 8) | | Adjustable Rate Non-Cumulative | | March
2012 | | 4,926 |
| | 100,000 |
| | 493 |
| | 3-mo. LIBOR + 40 bps (6) |
| | On or after
March 15, 2012 |
Series H (3, 8) | 8.20% Non-Cumulative | | May
2008 | | 114,483 |
| | 25,000 |
| | 2,862 |
| | 8.20 | % | | On or after
May 1, 2013 | 8.20% Non-Cumulative | | May
2008 | | 114,483 |
| | 25,000 |
| | 2,862 |
| | 8.20 | % | | On or after
May 1, 2013 |
Series I (3, 8) | 6.625% Non-Cumulative | | September
2007 | | 14,584 |
| | 25,000 |
| | 365 |
| | 6.625 | % | | On or after
October 1, 2017 | 6.625% Non-Cumulative | | September
2007 | | 14,584 |
| | 25,000 |
| | 365 |
| | 6.625 | % | | On or after
October 1, 2017 |
Series J (3, 8) | 7.25% Non-Cumulative | | November
2007 | | 38,053 |
| | 25,000 |
| | 951 |
| | 7.25 | % | | On or after
November 1, 2012 | 7.25% Non-Cumulative | | November
2007 | | 38,053 |
| | 25,000 |
| | 951 |
| | 7.25 | % | | On or after
November 1, 2012 |
Series K (3, 9) | Fixed-to-Floating Rate Non-Cumulative | | January
2008 | | 61,773 |
| | 25,000 |
| | 1,544 |
| | 8.00% through 1/29/18; 3-mo. LIBOR + 363 bps thereafter |
| | On or after
January 30, 2018 | Fixed-to-Floating Rate Non-Cumulative | | January
2008 | | 61,773 |
| | 25,000 |
| | 1,544 |
| | 8.00% through 1/29/18; 3-mo. LIBOR + 363 bps thereafter |
| | On or after
January 30, 2018 |
| Series L | 7.25% Non-Cumulative Perpetual Convertible | | January
2008 | | 3,080,182 |
| | 1,000 |
| | 3,080 |
| | 7.25 | % | | n/a | 7.25% Non-Cumulative Perpetual Convertible | | January
2008 | | 3,080,182 |
| | 1,000 |
| | 3,080 |
| | 7.25 | % | | n/a |
Series M (3, 9) | Fixed-to-Floating Rate Non-Cumulative | | April
2008 | | 52,399 |
| | 25,000 |
| | 1,310 |
| | 8.125% through 5/14/18;
3-mo. LIBOR + 364 bps thereafter |
| | On or after
May 15, 2018 | Fixed-to-Floating Rate Non-Cumulative | | April
2008 | | 52,399 |
| | 25,000 |
| | 1,310 |
| | 8.125% through 5/14/18;
3-mo. LIBOR + 364 bps thereafter |
| | On or after
May 15, 2018 |
| Series T | 6% Cumulative | | September
2011 | | 50,000 |
| | 100,000 |
| | 2,918 |
| | 6.00 | % | | See description in Preferred Stock in this Note | 6% Cumulative | | September
2011 | | 50,000 |
| | 100,000 |
| | 2,918 |
| | 6.00 | % | | See description in Preferred Stock in this Note |
Series 1 (3, 4) | Floating Rate Non-Cumulative | | November
2004 | | 3,646 |
| | 30,000 |
| | 109 |
| | 3-mo. LIBOR + 75 bps (5) |
| | On or after
November 28, 2009 | Floating Rate Non-Cumulative | | November
2004 | | 3,275 |
| | 30,000 |
| | 98 |
| | 3-mo. LIBOR + 75 bps (5) |
| | On or after
November 28, 2009 |
Series 2 (3, 4) | Floating Rate Non-Cumulative | | March
2005 | | 12,111 |
| | 30,000 |
| | 363 |
| | 3-mo. LIBOR + 65 bps (5) |
| | On or after
November 28, 2009 | Floating Rate Non-Cumulative | | March
2005 | | 9,967 |
| | 30,000 |
| | 299 |
| | 3-mo. LIBOR + 65 bps (5) |
| | On or after
November 28, 2009 |
Series 3 (3, 4) | 6.375% Non-Cumulative | | November
2005 | | 21,773 |
| | 30,000 |
| | 653 |
| | 6.375 | % | | On or after
November 28, 2010 | 6.375% Non-Cumulative | | November
2005 | | 21,773 |
| | 30,000 |
| | 653 |
| | 6.375 | % | | On or after
November 28, 2010 |
Series 4 (3, 4) | Floating Rate Non-Cumulative | | November
2005 | | 10,773 |
| | 30,000 |
| | 323 |
| | 3-mo. LIBOR + 75 bps (6) |
| | On or after
November 28, 2010 | Floating Rate Non-Cumulative | | November
2005 | | 7,010 |
| | 30,000 |
| | 210 |
| | 3-mo. LIBOR + 75 bps (6) |
| | On or after
November 28, 2010 |
Series 5 (3, 4) | Floating Rate Non-Cumulative | | March
2007 | | 16,902 |
| | 30,000 |
| | 507 |
| | 3-mo. LIBOR + 50 bps (6) |
| | On or after
May 21, 2012 | Floating Rate Non-Cumulative | | March
2007 | | 14,056 |
| | 30,000 |
| | 422 |
| | 3-mo. LIBOR + 50 bps (6) |
| | On or after
May 21, 2012 |
Series 6 (3, 7) | 6.70% Non-Cumulative Perpetual | | September
2007 | | 59,388 |
| | 1,000 |
| | 60 |
| | 6.70 | % | | On or after
February 3, 2009 | 6.70% Non-Cumulative Perpetual | | September
2007 | | 59,388 |
| | 1,000 |
| | 59 |
| | 6.70 | % | | On or after
February 3, 2009 |
Series 7 (3, 7) | 6.25% Non-Cumulative Perpetual | | September
2007 | | 16,596 |
| | 1,000 |
| | 17 |
| | 6.25 | % | | On or after
March 18, 2010 | 6.25% Non-Cumulative Perpetual | | September
2007 | | 16,596 |
| | 1,000 |
| | 17 |
| | 6.25 | % | | On or after
March 18, 2010 |
Series 8 (3, 4) | 8.625% Non-Cumulative | | April
2008 | | 89,100 |
| | 30,000 |
| | 2,673 |
| | 8.625 | % | | On or after
May 28, 2013 | 8.625% Non-Cumulative | | April
2008 | | 89,100 |
| | 30,000 |
| | 2,673 |
| | 8.625 | % | | On or after
May 28, 2013 |
| Total | | | | | 3,689,084 |
| | |
| | $ | 18,730 |
| | |
| | | | | | | 3,685,410 |
| | |
| | $ | 19,067 |
| | |
| | |
| |
(1) | Amounts shown are before third-party issuance costs and other Merrill Lynch purchase accounting related adjustments of $333299 million. |
| |
(2) | Series B Preferred Stock does not have early redemption/call rights. |
| |
(3) | The Corporation may redeem series of preferred stock on or after the redemption date, in whole or in part, at its option, at the liquidation preference plus declared and unpaid dividends. |
| |
(4) | Ownership is held in the form of depositary shares, each representing a 1/1200th1,200th interest in a share of preferred stock, paying a quarterly cash dividend, if and when declared. |
| |
(5) | Subject to 3.00% minimum rate per annum. |
| |
(6) | Subject to 4.00% minimum rate per annum. |
| |
(7) | Ownership is held in the form of depositary shares, each representing a 1/40th interest in a share of preferred stock, paying a quarterly cash dividend, if and when declared. |
| |
(8) | Ownership is held in the form of depositary shares, each representing a 1/1000th1,000th interest in a share of preferred stock, paying a quarterly cash dividend, if and when declared. |
| |
(9) | Ownership is held in the form of depositary shares, each representing a 1/25th interest in a share of preferred stock, paying a semi-annual cash dividend, if and when declared, until the redemption date adjusts to a quarterly cash dividend, if and when declared, thereafter. |
n/a = not applicable
|
| | |
236240 Bank of America 20112012
| | |
Series L Preferred Stock listed in the Preferred Stock Summary table does not have early redemption/call rights. Each share of the Series L Preferred Stock may be converted at any time, at the option of the holder, into 20 shares of the Corporation’s common stock plus cash in lieu of fractional shares. On or after January 30, 2013, theThe Corporation may cause some or all of the Series L Preferred Stock, at its option, at any time or from time to time, to be converted into shares of common stock at the then-applicable conversion rate if, for 20 trading days during any period of 30 consecutive trading days, the closing price of common stock exceeds 130 percent of the then-applicable conversion price of the Series L Preferred Stock. If the Corporation exercises its rights to cause the automatica conversion of Series L Preferred Stock on January 30, 2013, itoccurs subsequent to a dividend record date but prior to the dividend payment date, the Corporation will still pay any accrued dividends payable on January 30, 2013 to the applicable holders of record.payable.
All series of preferred stock in the Preferred Stock Summary table have a par value of $0.01 per share, are not subject to the operation of a sinking fund, have no participation rights, and with the exception of the Series L Preferred Stock, are not convertible.
The holders of the Series B Preferred Stock and Series 1 through
8 Preferred Stock have general voting rights, and the holders of the other series included in the table have no general voting rights. All outstanding series of preferred stock of the Corporation have preference over the Corporation’s common stock with respect to the payment of dividends and distribution of the Corporation’s assets in the event of a liquidation or dissolution. With the exception of the Series T Preferred Stock, if any dividend payable on these series is in arrears for three or more semi-annual or six or more quarterly dividend periods, as applicable (whether consecutive or not), the holders of these series and any other class or series of preferred stock ranking equally as to payment of dividends and upon which equivalent voting rights have been conferred and are exercisable (voting as a single class), will be entitled to vote for the election of two additional directors. These voting rights terminate when the Corporation has paid in full dividends on these series for at least two semi-annual or four quarterly dividend periods, as applicable, following the dividend arrearage.
NOTE 1615Accumulated Other Comprehensive Income (Loss)
The table below presents the changes in accumulated OCI inafter-tax for 20092010, 20102011 and 20112012, net-of-tax..
|
| | | | | | | | | | | | | | | | | | | | | | | |
| | | | | | | | | | | | |
| (Dollars in millions) | Available-for-
Sale Debt Securities | | Available-for-
Sale Marketable Equity Securities | | Derivatives | | Employee Benefit Plans (1) | | Foreign Currency (2) | | Total |
| Balance, December 31, 2008 | $ | (5,956 | ) | | $ | 3,935 |
| | $ | (3,458 | ) | | $ | (4,642 | ) | | $ | (704 | ) | | $ | (10,825 | ) |
Cumulative adjustment for accounting change – OTTI (3) | (71 | ) | | — |
| | — |
| | — |
| | — |
| | (71 | ) |
| Net change in fair value recorded in accumulated OCI | 6,364 |
| | 2,651 |
| | 153 |
| | 318 |
| | 211 |
| | 9,697 |
|
| Net realized (gains) losses reclassified into earnings | (965 | ) | | (4,457 | ) | | 770 |
| | 232 |
| | — |
| | (4,420 | ) |
| Balance, December 31, 2009 | $ | (628 | ) | | $ | 2,129 |
| | $ | (2,535 | ) | | $ | (4,092 | ) | | $ | (493 | ) | | $ | (5,619 | ) |
Cumulative adjustments for accounting changes: (3) | |
| | |
| | |
| | |
| | |
| | |
|
| Consolidation of certain variable interest entities | (116 | ) | | — |
| | — |
| | — |
| | — |
| | (116 | ) |
| Credit-related notes | 229 |
| | — |
| | — |
| | — |
| | — |
| | 229 |
|
| Net change in fair value recorded in accumulated OCI | 2,210 |
| | 5,657 |
| | (1,108 | ) | | (104 | ) | | (44 | ) | | 6,611 |
|
| Net realized (gains) losses reclassified into earnings | (981 | ) | | (1,127 | ) | | 407 |
| | 249 |
| | 281 |
| | (1,171 | ) |
| Balance, December 31, 2010 | $ | 714 |
| | $ | 6,659 |
| | $ | (3,236 | ) | | $ | (3,947 | ) | | $ | (256 | ) | | $ | (66 | ) |
| Net change in fair value recorded in accumulated OCI | 4,331 |
| | (2,539 | ) | | (1,567 | ) | | (714 | ) | | (34 | ) | | (523 | ) |
| Net realized (gains) losses reclassified into earnings | (1,945 | ) | | (4,117 | ) | | 1,018 |
| | 270 |
| | (74 | ) | | (4,848 | ) |
| Balance, December 31, 2011 | $ | 3,100 |
| | $ | 3 |
| | $ | (3,785 | ) | | $ | (4,391 | ) | | $ | (364 | ) | | $ | (5,437 | ) |
|
| | | | | | | | | | | | | | | | | | | | | | | |
| | | | | | | | | | | | |
| (Dollars in millions) | Available-for-
Sale Debt Securities | | Available-for-
Sale Marketable Equity Securities | | Derivatives | | Employee Benefit Plans (1) | | Foreign Currency (2) | | Total |
| Balance, December 31, 2009 | $ | (628 | ) | | $ | 2,129 |
| | $ | (2,535 | ) | | $ | (4,092 | ) | | $ | (493 | ) | | $ | (5,619 | ) |
| Net change | 1,342 |
| | 4,530 |
| | (701 | ) | | 145 |
| | 237 |
| | 5,553 |
|
| Balance, December 31, 2010 | $ | 714 |
| | $ | 6,659 |
| | $ | (3,236 | ) | | $ | (3,947 | ) | | $ | (256 | ) | | $ | (66 | ) |
| Net change | 2,386 |
| | (6,656 | ) | | (549 | ) | | (444 | ) | | (108 | ) | | (5,371 | ) |
| Balance, December 31, 2011 | $ | 3,100 |
| | $ | 3 |
| | $ | (3,785 | ) | | $ | (4,391 | ) | | $ | (364 | ) | | $ | (5,437 | ) |
| Net change | 1,343 |
| | 459 |
| | 916 |
| | (65 | ) | | (13 | ) | | 2,640 |
|
| Balance, December 31, 2012 | $ | 4,443 |
| | $ | 462 |
| | $ | (2,869 | ) | | $ | (4,456 | ) | | $ | (377 | ) | | $ | (2,797 | ) |
| |
(1) | Net change in fair value represents after-tax adjustments based on the final year-end actuarial valuations. For more information on employee benefit plans, see Note 1918 – Employee Benefit Plans. |
| |
(2) | Net change in fair value represents only the impact of changes in spot foreign exchange rates on the Corporation’s net investment in non-U.S. operations, and related hedges. |
| |
(3)The table below presents the before- and after-tax changes in accumulated OCI for 2012, 2011 and 2010. | | | | | | | | | | | | | | | | | | | | | | | | | | | | | | | | | | | | | | | | | | | | | | | | | | | | | | | | | | 2012 | | 2011 | | 2010 | | (Dollars in millions) | Before-tax | | Tax effect | | After-tax | | Before-tax | | Tax effect | | After-tax | | Before-tax | | Tax effect | | After-tax | | Available-for-sale debt securities: | | | | | | | | | | | | | | | | | | | Cumulative adjustments for accounting changes: | | | | | | | | | | | | | | | | | | | Consolidation of certain variable interest entities | $ | — |
| | $ | — |
| | $ | — |
| | $ | — |
| | $ | — |
| | $ | — |
| | $ | (184 | ) | | $ | 68 |
| | $ | (116 | ) | | Credit-related notes | — |
| | — |
| | — |
| | — |
| | — |
| | — |
| | 364 |
| | (135 | ) | | 229 |
| | Net change in fair value recorded in accumulated OCI | 3,676 |
| | (1,319 | ) | | 2,357 |
| | 6,925 |
| | (2,594 | ) | | 4,331 |
| | 3,541 |
| | (1,331 | ) | | 2,210 |
| | Net realized (gains) losses reclassified into earnings | (1,609 | ) | | 595 |
| | (1,014 | ) | | (3,087 | ) | | 1,142 |
| | (1,945 | ) | | (1,557 | ) | | 576 |
| | (981 | ) | | Net change | 2,067 |
| | (724 | ) | | 1,343 |
| | 3,838 |
| | (1,452 | ) | | 2,386 |
| | 2,164 |
| | (822 | ) | | 1,342 |
| | Available-for-sale marketable equity securities: | | | | | | | | | | | | | | | | | | | Net change in fair value recorded in accumulated OCI | 748 |
| | (277 | ) | | 471 |
| | (4,114 | ) | | 1,575 |
| | (2,539 | ) | | 9,029 |
| | (3,372 | ) | | 5,657 |
| | Net realized (gains) losses reclassified into earnings | (19 | ) | | 7 |
| | (12 | ) | | (6,501 | ) | | 2,384 |
| | (4,117 | ) | | (1,789 | ) | | 662 |
| | (1,127 | ) | | Net change | 729 |
| | (270 | ) | | 459 |
| | (10,615 | ) | | 3,959 |
| | (6,656 | ) | | 7,240 |
| | (2,710 | ) | | 4,530 |
| | Derivatives: | | | | | | | | | | | | | | | | | | | Net change in fair value recorded in accumulated OCI | 430 |
| | (166 | ) | | 264 |
| | (2,490 | ) | | 923 |
| | (1,567 | ) | | (1,755 | ) | | 647 |
| | (1,108 | ) | | Net realized (gains) losses reclassified into earnings | 1,035 |
| | (383 | ) | | 652 |
| | 1,617 |
| | (599 | ) | | 1,018 |
| | 644 |
| | (237 | ) | | 407 |
| | Net change | 1,465 |
| | (549 | ) | | 916 |
| | (873 | ) | | 324 |
| | (549 | ) | | (1,111 | ) | | 410 |
| | (701 | ) | | Employee benefit plans: | | | | | | | | | | | | | | | | | | | Net change in fair value recorded in accumulated OCI | (1,891 | ) | | 660 |
| | (1,231 | ) | | (1,171 | ) | | 457 |
| | (714 | ) | | (162 | ) | | 58 |
| | (104 | ) | | Net realized (gains) losses reclassified into earnings | 490 |
| | (192 | ) | | 298 |
| | 437 |
| | (167 | ) | | 270 |
| | 396 |
| | (147 | ) | | 249 |
| | Settlements and curtailments | 1,378 |
| | (510 | ) | | 868 |
| | — |
| | — |
| | — |
| | — |
| | — |
| | — |
| | Net change | (23 | ) | | (42 | ) | | (65 | ) | | (734 | ) | | 290 |
| | (444 | ) | | 234 |
| | (89 | ) | | 145 |
| | Foreign currency: | | | | | | | | | | | | | | | | | | | Net change in fair value recorded in accumulated OCI | (226 | ) | | 233 |
| | 7 |
| | 145 |
| | (179 | ) | | (34 | ) | | (204 | ) | | 160 |
| | (44 | ) | | Net realized (gains) losses reclassified into earnings | (30 | ) | | 10 |
| | (20 | ) | | (65 | ) | | (9 | ) | | (74 | ) | | 446 |
| | (165 | ) | | 281 |
| | Net change | (256 | ) | | 243 |
| | (13 | ) | | 80 |
| | (188 | ) | | (108 | ) | | 242 |
| | (5 | ) | | 237 |
| | Total other comprehensive income (loss) | $ | 3,982 |
| | $ | (1,342 | ) | | $ | 2,640 |
| | $ | (8,304 | ) | | $ | 2,933 |
| | $ | (5,371 | ) | | $ | 8,769 |
| | $ | (3,216 | ) | | $ | 5,553 |
|
| For additional information on the adoption of new accounting guidance, see Note 1 – Summary of Significant Accounting Principles and Note 5 – Securities.
|
|
| | |
242 Bank of America 2012 | | Bank of America237
|
NOTE 1716 Earnings Per Common Share
The calculation of EPS and diluted EPS for 20112012, 20102011 and 20092010 is presented below. See Note 1 – Summary of Significant Accounting Principles for additional information on the calculation of EPS.
| | | | | | | | | | | | | |
| (Dollars in millions, except per share information; shares in thousands) | 2011 | | 2010 | | 2009 | 2012 | | 2011 | | 2010 |
| Earnings (loss) per common share | |
| | |
| | |
| |
| | |
| | |
|
| Net income (loss) | $ | 1,446 |
| | $ | (2,238 | ) | | $ | 6,276 |
| $ | 4,188 |
| | $ | 1,446 |
| | $ | (2,238 | ) |
| Preferred stock dividends | (1,361 | ) | | (1,357 | ) | | (4,494 | ) | (1,428 | ) | | (1,361 | ) | | (1,357 | ) |
| Accelerated accretion from redemption of preferred stock issued to the U.S. Treasury | — |
| | — |
| | (3,986 | ) | |
| Net income (loss) applicable to common shareholders | 85 |
| | (3,595 | ) | | (2,204 | ) | 2,760 |
| | 85 |
| | (3,595 | ) |
| Dividends and undistributed earnings allocated to participating securities | (1 | ) | | (4 | ) | | (6 | ) | (2 | ) | | (1 | ) | | (4 | ) |
| Net income (loss) allocated to common shareholders | $ | 84 |
| | $ | (3,599 | ) | | $ | (2,210 | ) | $ | 2,758 |
| | $ | 84 |
| | $ | (3,599 | ) |
| Average common shares issued and outstanding | 10,142,625 |
| | 9,790,472 |
| | 7,728,570 |
| 10,746,028 |
| | 10,142,625 |
| | 9,790,472 |
|
| Earnings (loss) per common share | $ | 0.01 |
| | $ | (0.37 | ) | | $ | (0.29 | ) | $ | 0.26 |
| | $ | 0.01 |
| | $ | (0.37 | ) |
| | | | | | | |
| Diluted earnings (loss) per common share | |
| | |
| | |
| |
| | |
| | |
|
| Net income (loss) applicable to common shareholders | $ | 85 |
| | $ | (3,595 | ) | | $ | (2,204 | ) | $ | 2,760 |
| | $ | 85 |
| | $ | (3,595 | ) |
| Dividends and undistributed earnings allocated to participating securities | (1 | ) | | (4 | ) | | (6 | ) | (2 | ) | | (1 | ) | | (4 | ) |
| Net income (loss) allocated to common shareholders | $ | 84 |
| | $ | (3,599 | ) | | $ | (2,210 | ) | $ | 2,758 |
| | $ | 84 |
| | $ | (3,599 | ) |
| Average common shares issued and outstanding | 10,142,625 |
| | 9,790,472 |
| | 7,728,570 |
| 10,746,028 |
| | 10,142,625 |
| | 9,790,472 |
|
Dilutive potential common shares (1) | 112,199 |
| | — |
| | — |
| 94,826 |
| | 112,199 |
| | — |
|
| Total diluted average common shares issued and outstanding | 10,254,824 |
| | 9,790,472 |
| | 7,728,570 |
| 10,840,854 |
| | 10,254,824 |
| | 9,790,472 |
|
| Diluted earnings (loss) per common share | $ | 0.01 |
| | $ | (0.37 | ) | | $ | (0.29 | ) | $ | 0.25 |
| | $ | 0.01 |
| | $ | (0.37 | ) |
| |
(1) | Includes incremental shares from RSUs, restricted stock, shares, stock options and warrants. |
Due to the net loss applicable to common shareholders forFor 20102012 and2009, no dilutive potential common shares were included in the calculation of diluted EPS because they would have been antidilutive.
For 2011, 2010 and 2009, average options to purchase 217 million, 27162 million and315 million shares, respectively, of common stock were outstanding but not included in the computation of EPS because they were antidilutive under the treasury stock method. For both 2011 and 2010, average warrants to purchase 272 million shares of common stock and 265 million for 2009, were outstanding but not included in the computation of EPS because they were antidilutive under the treasury stock method. For 2011, 66 million average dilutive potential common shares associated with the Series L Preferred Stock were excluded fromnot included in the diluted share count because the result would have been antidilutive under the “if-converted” method. For 2010 and 2009, 107 million and 147 million average dilutive potential common shares associated with the Series L Preferred Stock, and the mandatory convertible Preferred Stock Series 2 and Series 3 of Merrill Lynch were excluded fromnot included in the diluted share count because the result would have been antidilutive under the “if-converted” method. For 20092012 and 2011, 81700 million and 234 million average dilutive potential common shares associated with the CESSeries T Preferred Stock were excluded fromnot included in the diluted share count because the result would have been antidilutive under the “if-converted” method. For 20112012, 2342011 and 2010, average options to purchase 163 million average dilutive potential, 217 million and 271 million shares, respectively, of common shares associated withstock were outstanding but not included in the Series T Preferred Stock issued in 2011 were excluded from the diluted share countcomputation of EPS because the result would have been antidilutive under the “if-converted”treasury stock method. For 2012, 2011 and 2010, average warrants to purchase 272 million shares of common stock were outstanding but not included in the computation of EPS because the result would have been antidilutive under the treasury stock method.
For purposes of computing basic EPS, CES were consideredDue to be participating securities priorthe net loss applicable to February 24, 2010, however, due to a net losscommon shareholders for 2010, earningsno dilutive potential common shares were not allocated toincluded in the CES. The two-class method prohibits allocationcalculation of an undistributed loss to participating securities. For purposes of computing diluted EPS there was no dilutive effect of the CES, which were outstanding prior to February 24, 2010, due to a net loss forbecause they would have been antidilutive.
In 20102012.
In and 2011, in connection with the exchanges described in Note 1514 – Shareholders’ Equity, the Corporation recorded a $44 million reduction to preferred stock dividends and a net $36 million non-cash preferred stock dividend which isare included in the calculation of net income allocated to common shareholders.
For 2009, as a result of repurchasing the TARP Preferred Stock, the Corporation accelerated the remaining accretion of the issuance discount on the TARP Preferred Stock of $4.0 billion and recorded a corresponding charge to retained earnings and income (loss) applicable to common shareholders in the calculation of diluted EPS. In addition, in 2009, the Corporation recorded an increase to retained earnings and net income (loss) applicable to common shareholders of $576 million related to the Corporation’s preferred stock exchange for common stock.
NOTE 1817 Regulatory Requirements and Restrictions
The Federal Reserve requires the Corporation’s banking subsidiariesCorporation manages regulatory capital to maintain reserve balancesadhere to internal capital guidelines and regulatory standards of capital adequacy based on a percentageits current understanding of certain deposits. Average daily reserve balances required by the Federal Reserve were $14.6 billionrules and $12.9 billion for 2011 and 2010. Currency and coin residing in branches and cash vaults (vault cash) are used to partially satisfy the reserve requirement. The average daily reserve balances, in excessapplication of vault cash, held with the Federal Reserve amounted to $6.5 billion and $5.5 billion for 2011 and 2010.
The primary sources of funds for cash distributions by the Corporationsuch rules to its shareholders are dividends received from its banking subsidiaries, Bank of America, N.A. and FIA Card Services, N.A. In 2011, the Corporation received $9.8 billion in dividends from Bank of America, N.A. and FIA Card Services, N.A., returned capital of $7.0 billion to the Corporation. In 2012, Bank of America, N.A. and FIA Card Services, N.A. can declare and pay dividends to the Corporation of $4.5 billion and $0 plus an additional amount equal to their net profits for 2012,business as defined by statute, up to the date of any such dividend declaration. The other subsidiary national banks can pay dividends in aggregate of $1.0 billion in 2012 plus an additional amount equal to their net profits for 2012, as defined by statute, up to the date of any such dividend
declaration. The amount of dividends that each subsidiary bank may declare in a calendar year without approval by the OCC is the subsidiary bank’s net profits for that year combined with its net retained profits, as defined, for the preceding two years.currently conducted.
The Federal Reserve, OCC (Office of the Comptroller of the Currency) and FDIC (collectively, joint agencies) have in place regulatory capital guidelines for U.S. banking organizations. Failure to meet the capital requirements can initiate certain mandatory and discretionary actions by regulators that could have a material effect on the Corporation’s financial position. The regulatory capital guidelines measure capital in relation to the credit and market risks of both on- and off-balance sheet items using various risk weights. Under the regulatory capital guidelines, Total capital consists of three tiers of capital. Tier 1 capital includes the sum of “core capital elements,” the principal components of which are qualifying common shareholders’ equity and qualifying noncumulativenon-cumulative perpetual preferred stock,stock. Also included in Tier 1 capital are qualifying Trust Securities,trust preferred securities (Trust Securities), hybrid securities and qualifying non-controllingnoncontrolling interests less goodwillin subsidiaries which are subject to the rules governing “restricted core capital elements.” Goodwill, other disallowed intangible assets, disallowed deferred tax assets and other adjustments.the cumulative changes in fair value of all financial liabilities accounted for under the fair value option that are included in retained earnings and are attributable to changes in the company’s own creditworthiness are deducted from the sum of core capital elements. Tier 2 capital consists of qualifying subordinated debt, a limited portion of the allowance for loan and lease losses, a portion of net unrealized gains on AFS marketable equity securities and other adjustments. Tier 3 capital includes subordinated debt that is unsecured, fully paid, has an original maturity of at least two years, is not redeemable before maturity without prior approval by the Federal Reserve and includes a lock-in clause precluding payment of either interest or principal if the payment would cause the issuing bank’s risk-based capital ratio to fall or remain below the required minimum. Tier 3 capital can only be used to satisfy the Corporation’s market risk capital requirement and may not be used to support its credit risk requirement. At December 31, 20112012 and 20102011, the Corporation had no subordinated debt that qualified as
Tier 3 capital.
Certain corporate-sponsored trust companies which issue Trust Securities are not consolidated. In accordance with Federal Reserve guidance, Trust Securities continue to qualify as Total capital for the Corporation is Tier 1 capital with revised quantitative limits effective March 31, 2011. As a result, the Corporation includes Trust Securities inplus supplementary Tier 12 capital. The Financial Reform Act includes a provision under which the Corporation’s previously issued and outstanding Trust Securities in the aggregate amount of $16.1 billion (approximately 125 bps of Tier 1 capital) at December 31, 2011, will no longer qualify as Tier 1 capital effective January 1, 2013. This amount excludes $633 million of hybrid Trust Securities that are expected to be converted to preferred stock prior to the date of implementation. The exclusion of Trust Securities from Tier 1 capital will be phased in incrementally over a three-year phase-in period. The treatment of Trust Securities during the phase-in period remains unclear and is subject to future rulemaking.
Current limits restrict core capital elements to 15 percent of
total core capital elements for internationally active bank holding companies. Internationally active bank holding companies are those that have significant activities in non-U.S. markets with consolidated assets greater than $250 billion or on-balance sheet non-U.S. exposure greater than $10 billion. In addition, the Federal Reserve revised the qualitative standards for capital instruments included in regulatory capital. At December 31, 2011, the Corporation’s restricted core capital elements comprised 9.1 percent of total core capital elements. The Corporation is and expects to remain compliant with the revised limits.
To meet minimum, adequately capitalized regulatory requirements, an institution must maintain a Tier 1 capital ratio of four percent and a Total capital ratio of eight percent. A “well-capitalized” institution must generally maintain capital ratios 200 bps higher than the minimum guidelines. The risk-based capital rules have been further supplemented by a Tier 1 leverage ratio, defined as Tier 1 capital divided by quarterly average total assets, after certain adjustments. “Well-capitalized” bank holding companiesBHCs must have a minimum Tier 1 leverage ratio of at least four percent. National banks must maintain a Tier 1 leverage ratio of at least five percent to be classified as “well-capitalized.” Failure to meet the capital requirements established by the joint agencies can lead to certain mandatory and discretionary actions by regulators that could have a material adverse effect on the Corporation’s financial position. At December 31, 20112012, the Corporation’s Tier 1 capital, Total capital and Tier 1 leverage ratios were 12.4012.89 percent, 16.7516.31 percent and 7.537.37 percent, respectively. This classifies
Current guidelines restrict certain core capital elements to 15 percent of total core capital elements for internationally active BHCs. Internationally active BHCs are those that have significant activities in non-U.S. markets with consolidated assets greater than $250 billion or on-balance sheet non-U.S. exposure greater than $10 billion, which includes the Corporation. In addition, the Federal Reserve revised the qualitative standards for capital instruments included in regulatory capital. At December 31, 2012, the Corporation’s restricted core capital elements comprised 3.6 percent of total core capital elements. The Corporation as “well-capitalized” for regulatory purposes,is and expects to remain in compliance with the highest classification.revised guidelines.
Net unrealized gains or losses on AFS debt securities and marketable equity securities, net unrealized gains and losses on derivatives, and employee benefit plan adjustments in shareholders’ equity are excluded from the calculations of Tier 1 common capital as discussed below, Tier 1 capital and leverage ratios. The Total capitalis not an official regulatory ratio, excludes all ofbut was introduced by the above withFederal Reserve during the exception of up to 45 percent of the pre-tax net unrealized gains on AFS marketable equity securities.
The Corporation calculatesSupervisory Capital Assessment Program in 2009. Tier 1 common capital asis Tier 1 capital including any CES less preferred stock, qualifying Trust Securities, hybrid securities and qualifying noncontrolling interestinterests in subsidiaries. CES was included in Tier 1 common capital based upon applicable regulatory guidance and the expectation at December 31, 2009 that the underlying Common Equivalent Junior Preferred Stock, Series S would convert into common stock following shareholder approval of additional authorized shares. Shareholders approved the increase in the number of authorized shares of common stock and the Common Equivalent Stock converted into common stock on February 24, 2010.The Corporation’s Tier 1 common capital was $126.7133.4 billion and $125.1126.7 billion and the Tier 1 common capital ratio was 9.8611.06 percent and 8.609.86 percent at December 31, 20112012 and 20102011.
The table below presents actual and minimum required regulatory capital amounts for 20112012 and 20102011.
| | | | | | | | | | | | | | | | | | | | | | | | | |
| Regulatory Capital | Regulatory Capital | | | | | | | | | Regulatory Capital | | | | | | | | |
| | | | | | | | | | | | | | | | | | | | | | | |
| | December 31 | December 31 |
| | 2011 | | 2010 | 2012 | | 2011 |
| | Actual | | | | Actual | | | Actual | | | | Actual | | |
| (Dollars in millions) | Ratio | | Amount | | Minimum Required (1) | | Ratio | | Amount | | Minimum Required (1) | Ratio | | Amount | | Minimum Required (1) | | Ratio | | Amount | | Minimum Required (1) |
| Risk-based capital | |
| | |
| | |
| | |
| | |
| | |
| |
| | |
| | |
| | |
| | |
| | |
|
| Tier 1 common | |
| | |
| | |
| | |
| | |
| | |
| |
| | |
| | |
| | |
| | |
| | |
|
| Bank of America Corporation | 9.86 | % | | $ | 126,690 |
| | n/a |
| | 8.60 | % | | $ | 125,139 |
| | n/a |
| 11.06 | % | | $ | 133,403 |
| | n/a |
| | 9.86 | % | | $ | 126,690 |
| | n/a |
|
| Tier 1 | |
| | |
| | |
| | |
| | |
| | |
| |
| | |
| | |
| | |
| | |
| | |
|
| Bank of America Corporation | 12.40 |
| | 159,232 |
| | $ | 51,379 |
| | 11.24 |
| | 163,626 |
| | $ | 58,238 |
| 12.89 |
| | 155,461 |
| | $ | 72,359 |
| | 12.40 |
| | 159,232 |
| | $ | 77,068 |
|
| Bank of America, N.A. | 11.74 |
| | 119,881 |
| | 40,830 |
| | 10.78 |
| | 114,345 |
| | 42,416 |
| 12.44 |
| | 118,431 |
| | 57,099 |
| | 11.74 |
| | 119,881 |
| | 61,245 |
|
| FIA Card Services, N.A. | 17.63 |
| | 24,660 |
| | 5,596 |
| | 15.30 |
| | 25,589 |
| | 6,691 |
| 17.34 |
| | 22,061 |
| | 7,632 |
| | 17.63 |
| | 24,660 |
| | 8,393 |
|
| Total | |
| | |
| | |
| | |
| | |
| | |
| |
| | |
| | |
| | |
| | |
| | |
|
| Bank of America Corporation | 16.75 |
| | 215,101 |
| | 102,757 |
| | 15.77 |
| | 229,594 |
| | 116,476 |
| 16.31 |
| | 196,680 |
| | 120,598 |
| | 16.75 |
| | 215,101 |
| | 128,447 |
|
| Bank of America, N.A. | 15.17 |
| | 154,885 |
| | 81,661 |
| | 14.26 |
| | 151,255 |
| | 84,831 |
| 14.76 |
| | 140,434 |
| | 95,165 |
| | 15.17 |
| | 154,885 |
| | 102,076 |
|
| FIA Card Services, N.A. | 19.01 |
| | 26,594 |
| | 11,191 |
| | 16.94 |
| | 28,343 |
| | 13,383 |
| 18.64 |
| | 23,707 |
| | 12,719 |
| | 19.01 |
| | 26,594 |
| | 13,989 |
|
| Tier 1 leverage | |
| | |
| | |
| | |
| | |
| | |
| |
| | |
| | |
| | |
| | |
| | |
|
| Bank of America Corporation | 7.53 |
| | 159,232 |
| | 84,557 |
| | 7.21 |
| | 163,626 |
| | 90,811 |
| 7.37 |
| | 155,461 |
| | 84,429 |
| | 7.53 |
| | 159,232 |
| | 84,557 |
|
| Bank of America, N.A. | 8.65 |
| | 119,881 |
| | 55,454 |
| | 7.83 |
| | 114,345 |
| | 58,391 |
| 8.59 |
| | 118,431 |
| | 68,957 |
| | 8.65 |
| | 119,881 |
| | 69,318 |
|
| FIA Card Services, N.A. | 14.22 |
| | 24,660 |
| | 6,935 |
| | 13.21 |
| | 25,589 |
| | 7,748 |
| 13.67 |
| | 22,061 |
| | 8,067 |
| | 14.22 |
| | 24,660 |
| | 8,669 |
|
| |
(1) | Dollar amount required to meet guidelines for adequately capitalizedwell-capitalized institutions. |
n/a = not applicable
The Federal Reserve requires BHCs to submit a capital plan and requests for capital actions on an annual basis, consistent with the rules governing the Comprehensive Capital Analysis and Review (CCAR). The CCAR is the central element of the Federal Reserve’s approach to ensuring large BHCs have adequate capital and robust processes for managing their capital. Requests for capital actions by a BHC must be reviewed on an annual basis by the Federal Reserve. In January 2012, the Corporation submitted its 2012 capital plan and the Federal Reserve did not object to the Corporation’s 2012 capital plan. On January 7, 2013, the Corporation submitted its 2013 capital plan and related supervisory stress tests. The Federal Reserve has announced its intention to notify the 2013 CCAR participants of the supervisory stress test results on March 7, 2013 and the capital plan on March 14, 2013.
Regulatory Capital Developments
TheAt December 31, 2012, the Corporation manages regulatorymeasured and reported its capital to adhere to regulatory standards of capital adequacy based on current understanding of the rulesratios and related information in accordance with Basel 1 and the application of such rules to the Corporation’s business as currently conducted. The regulatory capital rules as written bycontinue to expand and evolve. In June 2012, U.S. banking regulators issued the Market Risk Final Rule that amends the Basel Committee on Banking Supervision (the Basel Committee) continue to evolve.1 Market Risk rules (Market Risk Final Rule) which were effective January 1, 2013. The Market Risk Final Rule introduces new measures of market risk, a stressed Value-at-Risk charge, an incremental risk charge and a comprehensive risk measure, as well as other technical modifications.
In December 2007, U.S. banking regulators published a final Basel II rule2 rules (Basel II) in December 2007, which requires the Corporation to implement2). Basel II at the holding company level as well as at certain U.S. bank subsidiaries, establishes requirements for the U.S. implementation and2 provides detailed requirements for a new regulatory capital framework related to credit and operational risk, (Pillar 1), supervisory requirements (Pillar 2) and disclosure requirements (Pillar 3).requirements. Under Basel 2, market risk is measured consistent with Basel 1 guidelines, in accordance with the Market Risk Final
Rule. The Corporation is currently inmeasures and reports its capital ratios and related information under Basel 2 on a confidential basis to U.S. banking regulators during the required parallel period which will continue until the Corporation receives regulatory approval to exit parallel reporting and subsequently begin publicly reporting Basel II parallel period.2 regulatory capital results and related disclosures.
On December 15, 2010,In June 2012, U.S. banking regulators announced a noticeissued three notices of proposed rulemaking (NPR) on(collectively, the Risk-based Capital GuidelinesBasel 3 NPRs), which, if adopted as proposed, would materially change Tier 1 common, Tier 1 and Total capital calculations, introduce new minimum capital ratios and buffer requirements, expand and modify the calculation of risk-weighted assets for Market Risk. On December 29, 2011, U.S. regulators issued an NPR thatcredit and market risk (the Advanced Approach) and introduce a Standardized Approach for the calculation of risk-weighted assets, which would amend the December 2010 NPR. This amended NPR is expected to increase thereplace Basel 1 and provide a floor for minimum, adequately capitalized regulatory capital requirements forunder the Corporation’s trading assets and liabilities.Prompt Corrective Action framework. The Corporation continues to evaluate the capital impactPrompt Corrective Action framework establishes categories of the proposed rules and currently anticipates it will be in compliance with any final rules by the projected implementation date in late 2012.
In addition, the Basel Committee issued capital standards entitled “Basel III: A globalcapitalization, including “well-capitalized,” based on regulatory framework for more resilient banks and banking systems,” together with liquidity standards discussed below (Basel III) in December 2010. The Corporation expects to be in compliance with the Basel III capital standards within the regulatory timelines. If implemented byratio requirements. U.S. banking regulators as proposed,are required to take certain mandatory actions depending on the category of capitalization. No mandatory actions are required under the Prompt Corrective Action framework for “well-capitalized” banking entities.
Under the Basel III could significantly increase the Corporation’s capital requirements. Basel III and the Financial Reform Act propose the disqualification of3 NPRs, Trust Securities fromwill be phased out of Tier 1 capital within equal annual installments over a three-year transition period. Many of the Financial Reform Act proposing thatchanges to the
disqualification be composition of regulatory capital are subject to a transition period where the impact is recognized in 20 percent increments, phased in from 2013 to 2015. Basel III also proposesincrementally each year over a five-year period. The majority of the deductionother aspects of certain assets from capital (deferred tax assets, MSRs, investments in financial firms and pension assets, among others, within prescribed limitations), the inclusion of accumulated OCI in capital, increased capital for counterparty credit risk, and new minimum capital and buffer requirements. For additional information on deferred tax assets and MSRs, see Note 21 – Income Taxes and Note 25 – Mortgage Servicing Rights. The phase-in period for the capital deductions isAdvanced Approach were proposed to occur in 20 percent increments from 2014 through 2018 with full implementation by December 31, 2018. An increase in capital requirements for counterparty credit is proposed to bebecome effective on January 1, 2013. The phase-in period for the new minimum capital requirements and related buffers is proposed to occur between 2013 andfrom the effective date of the Basel 3 NPRs through 2019. U.S. banking regulators have indicated a goal to adopt final rules in 2012.
Preparing for the implementationannounced that they did not expect any of the new capitalBasel 3 NPRs to become effective January 1, 2013. Final rules is a top strategic priority for Basel 3 have not yet been issued by U.S. banking regulators.
Under the Corporation. TheBasel 3 NPRs the Corporation intendswill be subject to continue to build capital through retaining earnings, actively reducing legacy asset portfolios and implementing other capital related initiatives, including focusing on reducing both higherthe Advanced Approach for measuring risk-weighted assets (Basel 3 Advanced Approach) when finalized and assets currently deducted, or expected to be deducted underimplemented. The Basel III, from capital.
On June 17, 2011,3 Advanced Approach also requires approval by the U.S. banking regulators proposed rules requiring all large bank holding companies (BHCs) to submit a comprehensive capital plan to the Federal Reserveregulatory agencies of analytical models used as part of capital measurement. If these models are not approved, it would likely lead to an annual Comprehensive Capital Analysis and Review (CCAR).increase in the Corporation’s risk-weighted assets, which in some cases could be significant. The Basel 3 Advanced Approach, if adopted as proposed, regulations require BHCsis expected to demonstrate adequatesubstantially increase the Corporation’s capital to support planned capital actions, such as dividends, share repurchases or other forms of distributing capital. CCAR submissions are subject to approval by the Federal Reserve. The Federal Reserve may require BHCs to provide prior notice under certain circumstances before making a capital distribution. On January 5, 2012, the Corporation submitted a capital plan to the Federal Reserve consistent with the proposed rules.
On July 19,In 2011, the Basel Committee published the consultative document “Globally systemic important banks: Assessment methodology and the additional loss absorbency requirement” which sets out measureson Banking Supervision issued guidance on capital requirements for global, systemically important financial institutions, including the methodology for measuring systemic importance the additional capital required (the SIFI buffer), and the arrangements by which theythe guidance will be phased in. As proposed, the SIFI buffer would be met with additionalincrease minimum capital requirements for Tier 1 common equity rangingcapital from one percent to 2.5 percent, and in certain circumstances, 3.5 percent. This will be phased in from 2016 through 2018. U.S. banking regulators have not yet provided similarissued proposed or final rules for U.S. implementation of arelated to the SIFI buffer.
Given that the U.S. regulatory agencies have issued neither proposed rulemaking nor supervisory guidance on Basel III, significant uncertainty exists regarding the eventual impacts of Basel III on U.S. financial institutions, including the Corporation. These regulatory changes also require approval by the U.S. regulatory agencies of analytical models used as part of the Corporation’s capital measurement and assessment, especially in the case of more complex models. If these more complex models are not approved, it could require financial institutions to hold additional capital, which in some cases could be significant.
On December 20, 2011, the Federal Reserve issued proposed rules to implement enhanced supervisory and prudential requirements and the early remediation requirements established under the FinancialDodd-Frank Wall Street Reform and Consumer Protection Act. The enhanced standards include risk-based capital and
leverage requirements, liquidity standards, requirements for overall risk management, single-counterparty credit limits, stress test requirements and a debt-to-equity limit for certain companies determined to pose a threat to financial stability. Comments on the proposed rules are due by March 31, 2012. The final rules are likely to influence the Corporation’s regulatory capital and liquidity planning process,processes, and may impose additional operational and compliance costs on the Corporation.
Other Regulatory Requirements
The Federal Reserve requires the Corporation’s banking subsidiaries to maintain reserve balances based on a percentage of certain deposits. Average daily reserve balances required by the Federal Reserve were $16.3 billion and $14.6 billion for 2012 and 2011. Currency and coin residing in branches and cash vaults (vault cash) are used to partially satisfy the reserve requirement. The average daily reserve balances, in excess of vault cash, held with the Federal Reserve amounted to $7.9 billion and $6.5 billion for 2012 and 2011. As of December 31, 2012, the Corporation had cash in the amount of $8.5 billion and securities with a fair value of $5.9 billion that were segregated in compliance with securities regulations or deposited with clearing organizations.
The primary sources of funds for cash distributions by the Corporation to its shareholders are capital distributions received from its banking subsidiaries, BANA and FIA. In 2012, the Corporation received $14.1 billion in dividends from BANA and FIA, and returned capital of $6.6 billion to the Corporation. In 2013, BANA can declare and pay dividends to the Corporation equal to their retained net profits for 2013 up to the date of any dividend declaration. The other subsidiary national banks paid $1.6 billion in dividends to the Corporation in 2012 and can pay dividends in aggregate of $203 million in 2013 plus an additional amount equal to their retained net profits for 2013 up to the date of any such dividend declaration. The amount of dividends that each subsidiary bank may declare in a calendar year is the subsidiary bank’s net profits for that year combined with its retained net profits for the preceding two years. Retained net profits, as defined by the OCC, consist of net income less dividends declared during the period.
NOTE 1918 Employee Benefit Plans
Pension and Postretirement Plans
The Corporation sponsors noncontributory trusteed pension plans, that cover substantially all officers and employees, a number of noncontributory nonqualified pension plans, and postretirement health and life plans.plans that cover eligible employees. As discussed below, certain of the pension plans were amended, effective June 30, 2012, to freeze benefits earned. The plans provide defined benefits based on an employee’s compensation and years of service. The Bank of America Pension Plan (the Pension Plan) provides participants with compensation credits, generally based on years of service. For account balances based on compensation credits prior to January 1, 2008, the Pension Plan allows participants to select from various earnings measures, which are based on the returns of certain funds or common stock of the Corporation. The participant-selected earnings measures determine the earnings rate on the individual participant account balances in the Pension Plan. Participants may elect to modify earnings measure allocations on a periodic basis subject to the provisions of the Pension Plan. For account balances based on compensation credits subsequent to December 31, 2007, the account balance earnings rate is based on a benchmark rate. For eligible employees
in the Pension Plan on or after January 1, 2008,
the benefits become vested upon completion of three years of service. It is the policy of the Corporation to fund notno less than the minimum funding amount required by ERISA.
The Pension Plan has a balance guarantee feature for account balances with participant-selected earnings, applied at the time a benefit payment is made from the plan that effectively provides principal protection for participant balances transferred and certain compensation credits. The Corporation is responsible for funding any shortfall on the guarantee feature.
As a result of acquisitions, the Corporation assumed the obligations related to the pension plans of certain legacy companies. These acquired pension plans have been merged into a separate defined benefit pension plan which, together with the Pension Plan, are referred to as the Qualified Pension Plans. The benefit structures under these acquired plans have not changed and remain intact in the merged plan. Certain benefit structures are substantially similar to the Pension Plan discussed above; however, certain of these structures do not allow participants to select various earnings measures; rather the earnings rate is based on a benchmark rate. In addition, these benefit structures include participants with benefits determined under formulas based on average or career compensation and years of service rather than by reference to a pension account. Certain of the other benefit structures provide a participant’s retirement benefits based on the number of years of benefit service and a percentage of the participant’s average annual compensation during the five highest paid consecutive years of the last ten years of employment.
In connection with a redesign of the Corporation’s retirement plans, afteron January 24, 2012, the endCompensation and Benefits Committee of 2011, the Corporation announced that it willBoard approved amendments to freeze the benefits earned in the Qualified Pension Plans effective June 30, 2012. The Corporation will continue to offer retirement benefits through its defined contribution plans and will increase its contributions to certain of these plans.
As a result of freezing the Merrill Lynch acquisition,Qualified Pension Plans, a curtailment was triggered and a remeasurement of the qualified pension obligations and plan assets occurred as of January 24, 2012. As of the remeasurement date, the plan assets had increased in value from the prior measurement date resulting in an increase in the funded status of the plan of $431 million. Additionally, the curtailment impact reduced the projected benefit obligation by $889 million. The combined impact resulted in a $1.3 billion increase to the net pension assets recognized in other assets and a corresponding decrease in unrecognized losses in accumulated OCI of $1.3 billion ($832 million after-tax). The impact of the immediate recognition of the prior service cost of $58 million was recorded in personnel expense as a curtailment loss in 2012. All economic assumptions were consistent with the prior year end including the weighted-average discount rate of 4.95 percent used for remeasurement of the qualified pension plans.
As a result of freezing the Qualified Pension Plans, the amortization period for actuarial gains and losses was changed from the average working life to the estimated average lifetime of benefits being paid. In addition, in 2013, the long-term expected return on asset assumption for the Qualified Pension Plans was reduced to 6.5 percent from 8.0 percent to reflect current market conditions and long-term financial goals. The reduction in net pension costs in 2013 due to these assumption changes is not expected to be significant.
The Corporation assumed the obligations related to the plans of Merrill Lynch. These plans include a terminated U.S. pension plan (the Other Pension Plan), non-U.S. pension plans, nonqualified pension plans and postretirement plans. The non-U.S. pension plans vary based on the country and local practices. The terminated U.S. pension plan is referred to as the Other Pension Plan.
In 1988,The Corporation has an annuity contract, previously purchased by Merrill Lynch, purchased a group annuity contract that guarantees the payment of benefits vested under the terminated U.S. pension plan.Other Pension Plan. The Corporation, under a supplemental agreement, may be responsible for, or benefit from actual experience and investment performance of the annuity assets. The Corporation made no contribution under this agreement in 20112012 or 20102011. Contributions may be required in the future under this agreement.
The Corporation sponsors a number of noncontributory, nonqualified pension plans (the Nonqualified Pension Plans). As a result of acquisitions, the Corporation assumed the obligations related to the noncontributory, nonqualified pension plans of certain legacy companies including Merrill Lynch. These plans, which are unfunded, provide defined pension benefits to certain employees.
In addition to retirement pension benefits, full-time, salaried employees and certain part-time employees may become eligible to continue participation as retirees in health care and/or life insurance plans sponsored by the Corporation. Based on the other provisions of the individual plans, certain retirees may also have the cost of these benefits partially paid by the Corporation. The obligations assumed as a result of acquisitions are substantially similar to the Corporation’s postretirement health and life plans, except for Countrywide which did not have a postretirement health and life plan. Collectively, these plans are referred to as the Postretirement Health and Life Plans.
The Pension and Postretirement Plans table summarizes the changes in the fair value of plan assets, changes in the projected benefit obligation (PBO), the funded status of both the accumulated benefit obligation (ABO) and the PBO, and the weighted-average assumptions used to determine benefit obligations for the pension plans and postretirement plans at December 31, 20112012 and 20102011. Amounts recognized at December
31, 20112012 and 20102011 are reflected in other assets, and accrued expenses and other liabilities on the Corporation’s Consolidated Balance Sheet. The discount rate assumption is based on a cash flow matching technique and is subject to change each year. This technique utilizes yield curves that are based on Aa-rated corporate bonds with cash flows that match estimated benefit payments of each of the plans to produce the discount rate assumptions. The asset valuation method for the Qualified Pension Plans recognizes 60 percent of the prior year’s market gains or losses at the next measurement date with the remaining 40 percent spread equally over the subsequent four years.
The Corporation’s best estimate of its contributions to be made to the Non-U.S. Pension Plans, Nonqualified and Other Pension Plans, and Postretirement Health and Life Plans in 20122013 is $98109 million, $124103 million and $115107 million, respectively. The Corporation does not expect to make a contribution to the Qualified Pension plansPlans in 20122013.
| | | | | | | | | | | | | | | | | |
| Pension and Postretirement Plans | | | | | | | | | | | | | | |
| | | | | | | | | | | | | | | |
| | Qualified Pension Plans (1) | | Non-U.S. Pension Plans (1) | | Nonqualified and Other Pension Plans (1) | | Postretirement Health and Life Plans (1) | Qualified Pension Plans (1) | | Non-U.S. Pension Plans (1) | | Nonqualified and Other Pension Plans (1) | | Postretirement Health and Life Plans (1) |
| (Dollars in millions) | 2011 | | 2010 | | 2011 | | 2010 | | 2011 | | 2010 | | 2011 | | 2010 | 2012 | | 2011 | | 2012 | | 2011 | | 2012 | | 2011 | | 2012 | | 2011 |
| Change in fair value of plan assets | |
| | |
| | |
| | |
| | |
| | |
| | |
| | |
| |
| | |
| | |
| | |
| | |
| | |
| | |
| | |
|
| Fair value, January 1 | $ | 15,648 |
| | $ | 14,527 |
| | $ | 1,691 |
| | $ | 1,522 |
| | $ | 2,689 |
| | $ | 2,535 |
| | $ | 108 |
| | $ | 113 |
| $ | 15,070 |
| | $ | 15,648 |
| | $ | 2,022 |
| | $ | 1,691 |
| | $ | 3,061 |
| | $ | 2,689 |
| | $ | 91 |
| | $ | 108 |
|
| Actual return on plan assets | 182 |
| | 1,835 |
| | 295 |
| | 166 |
| | 493 |
| | 272 |
| | 2 |
| | 13 |
| 2,020 |
| | 182 |
| | 115 |
| | 295 |
| | 126 |
| | 493 |
| | 10 |
| | 2 |
|
| Company contributions | — |
| | — |
| | 104 |
| | 99 |
| | 99 |
| | 196 |
| | 84 |
| | 100 |
| — |
| | — |
| | 152 |
| | 104 |
| | 112 |
| | 99 |
| | 117 |
| | 84 |
|
| Plan participant contributions | — |
| | — |
| | 3 |
| | 2 |
| | — |
| | — |
| | 133 |
| | 139 |
| — |
| | — |
| | 3 |
| | 3 |
| | — |
| | — |
| | 139 |
| | 133 |
|
| Benefits paid | (760 | ) | | (714 | ) | | (63 | ) | | (63 | ) | | (220 | ) | | (314 | ) | | (255 | ) | | (275 | ) | (816 | ) | | (760 | ) | | (77 | ) | | (63 | ) | | (236 | ) | | (220 | ) | | (290 | ) | | (255 | ) |
| Plan transfer | — |
| | — |
| | 10 |
| | — |
| | — |
| | — |
| | — |
| | — |
| — |
| | — |
| | — |
| | 10 |
| | — |
| | — |
| | — |
| | — |
|
| Federal subsidy on benefits paid | n/a |
| | n/a |
| | n/a |
| | n/a |
| | n/a |
| | n/a |
| | 19 |
| | 18 |
| n/a |
| | n/a |
| | n/a |
| | n/a |
| | n/a |
| | n/a |
| | 19 |
| | 19 |
|
| Foreign currency exchange rate changes | n/a |
| | n/a |
| | (18 | ) | | (35 | ) | | n/a |
| | n/a |
| | — |
| | — |
| n/a |
| | n/a |
| | 91 |
| | (18 | ) | | n/a |
| | n/a |
| | — |
| | — |
|
| Fair value, December 31 | $ | 15,070 |
| | $ | 15,648 |
| | $ | 2,022 |
| | $ | 1,691 |
| | $ | 3,061 |
| | $ | 2,689 |
| | $ | 91 |
| | $ | 108 |
| $ | 16,274 |
| | $ | 15,070 |
| | $ | 2,306 |
| | $ | 2,022 |
| | $ | 3,063 |
| | $ | 3,061 |
| | $ | 86 |
| | $ | 91 |
|
| Change in projected benefit obligation | |
| | |
| | |
| | |
| | |
| | |
| | |
| | |
| |
| | |
| | |
| | |
| | |
| | |
| | |
| | |
|
| Projected benefit obligation, January 1 | $ | 13,938 |
| | $ | 13,048 |
| | $ | 1,916 |
| | $ | 1,813 |
| | $ | 3,078 |
| | $ | 2,918 |
| | $ | 1,704 |
| | $ | 1,620 |
| $ | 14,891 |
| | $ | 13,938 |
| | $ | 1,984 |
| | $ | 1,916 |
| | $ | 3,137 |
| | $ | 3,078 |
| | $ | 1,619 |
| | $ | 1,704 |
|
| Service cost | 423 |
| | 397 |
| | 43 |
| | 32 |
| | 3 |
| | 3 |
| | 15 |
| | 14 |
| 236 |
| | 423 |
| | 40 |
| | 43 |
| | 1 |
| | 3 |
| | 13 |
| | 15 |
|
| Interest cost | 746 |
| | 748 |
| | 99 |
| | 95 |
| | 152 |
| | 163 |
| | 80 |
| | 92 |
| 681 |
| | 746 |
| | 97 |
| | 99 |
| | 138 |
| | 152 |
| | 71 |
| | 80 |
|
| Plan participant contributions | — |
| | — |
| | 3 |
| | 2 |
| | — |
| | — |
| | 133 |
| | 139 |
| — |
| | — |
| | 3 |
| | 3 |
| | — |
| | — |
| | 139 |
| | 133 |
|
| Plan amendments | (11 | ) | | — |
| | 2 |
| | 2 |
| | — |
| | — |
| | (21 | ) | | 64 |
| — |
| | (11 | ) | | 2 |
| | 2 |
| | — |
| | — |
| | — |
| | (21 | ) |
| Curtailment | | (889 | ) | | — |
| | — |
| | — |
| | — |
| | — |
| | — |
| | — |
|
| Actuarial loss (gain) | 555 |
| | 459 |
| | (19 | ) | | 78 |
| | 124 |
| | 308 |
| | (56 | ) | | 32 |
| 1,552 |
| | 555 |
| | 328 |
| | (19 | ) | | 294 |
| | 124 |
| | (4 | ) | | (56 | ) |
| Benefits paid | (760 | ) | | (714 | ) | | (63 | ) | | (63 | ) | | (220 | ) | | (314 | ) | | (255 | ) | | (275 | ) | (816 | ) | | (760 | ) | | (77 | ) | | (63 | ) | | (236 | ) | | (220 | ) | | (290 | ) | | (255 | ) |
| Plan transfer | — |
| | — |
| | 15 |
| | — |
| | — |
| | — |
| | — |
| | — |
| — |
| | — |
| | — |
| | 15 |
| | — |
| | — |
| | — |
| | — |
|
| Federal subsidy on benefits paid | n/a |
| | n/a |
| | n/a |
| | n/a |
| | n/a |
| | n/a |
| | 19 |
| | 18 |
| n/a |
| | n/a |
| | n/a |
| | n/a |
| | n/a |
| | n/a |
| | 19 |
| | 19 |
|
| Foreign currency exchange rate changes | n/a |
| | n/a |
| | (12 | ) | | (43 | ) | | — |
| | — |
| | — |
| | — |
| n/a |
| | n/a |
| | 83 |
| | (12 | ) | | — |
| | — |
| | 7 |
| | — |
|
| Projected benefit obligation, December 31 | $ | 14,891 |
| | $ | 13,938 |
| | $ | 1,984 |
| | $ | 1,916 |
| | $ | 3,137 |
| | $ | 3,078 |
| | $ | 1,619 |
| | $ | 1,704 |
| $ | 15,655 |
| | $ | 14,891 |
| | $ | 2,460 |
| | $ | 1,984 |
| | $ | 3,334 |
| | $ | 3,137 |
| | $ | 1,574 |
| | $ | 1,619 |
|
| Amount recognized, December 31 | $ | 179 |
| | $ | 1,710 |
| | $ | 38 |
| | $ | (225 | ) | | $ | (76 | ) | | $ | (389 | ) | | $ | (1,528 | ) | | $ | (1,596 | ) | $ | 619 |
| | $ | 179 |
| | $ | (154 | ) | | $ | 38 |
| | $ | (271 | ) | | $ | (76 | ) | | $ | (1,488 | ) | | $ | (1,528 | ) |
| Funded status, December 31 | |
| | |
| | |
| | |
| | |
| | |
| | |
| | |
| |
| | |
| | |
| | |
| | |
| | |
| | |
| | |
|
| Accumulated benefit obligation | $ | 13,968 |
| | $ | 13,192 |
| | $ | 1,883 |
| | $ | 1,781 |
| | $ | 3,135 |
| | $ | 3,077 |
| | n/a |
| | n/a |
| $ | 15,655 |
| | $ | 13,968 |
| | $ | 2,345 |
| | $ | 1,883 |
| | $ | 3,334 |
| | $ | 3,135 |
| | n/a |
| | n/a |
|
| Overfunded (unfunded) status of ABO | 1,102 |
| | 2,456 |
| | 139 |
| | (90 | ) | | (74 | ) | | (388 | ) | | n/a |
| | n/a |
| 619 |
| | 1,102 |
| | (39 | ) | | 139 |
| | (271 | ) | | (74 | ) | | n/a |
| | n/a |
|
| Provision for future salaries | 923 |
| | 746 |
| | 101 |
| | 135 |
| | 2 |
| | 1 |
| | n/a |
| | n/a |
| — |
| | 923 |
| | 115 |
| | 101 |
| | — |
| | 2 |
| | n/a |
| | n/a |
|
| Projected benefit obligation | 14,891 |
| | 13,938 |
| | 1,984 |
| | 1,916 |
| | 3,137 |
| | 3,078 |
| | $ | 1,619 |
| | $ | 1,704 |
| 15,655 |
| | 14,891 |
| | 2,460 |
| | 1,984 |
| | 3,334 |
| | 3,137 |
| | $ | 1,574 |
| | $ | 1,619 |
|
| Weighted-average assumptions, December 31 | |
| | |
| | |
| | |
| | |
| | |
| | |
| | |
| |
| | |
| | |
| | |
| | |
| | |
| | |
| | |
|
| Discount rate | 4.95 | % | | 5.45 | % | | 4.87 | % | | 5.32 | % | | 4.65 | % | | 5.20 | % | | 4.65 | % | | 5.10 | % | 4.00 | % | | 4.95 | % | | 4.23 | % | | 4.87 | % | | 3.65 | % | | 4.65 | % | | 3.65 | % | | 4.65 | % |
| Rate of compensation increase | 4.00 |
| | 4.00 |
| | 4.42 |
| | 4.85 |
| | 4.00 |
| | 4.00 |
| | n/a |
| | n/a |
| n/a |
| | 4.00 |
| | 4.37 |
| | 4.42 |
| | 4.00 |
| | 4.00 |
| | n/a |
| | n/a |
|
| |
(1) | The measurement date for the Qualified Pension Plans, Non-U.S. Pension Plans, Nonqualified and Other Pension Plans, and Postretirement Health and Life Plans was December 31 of each year reported. |
n/a = not applicable
Amounts recognized in the Corporation’s Consolidated Balance Sheet at December 31, 20112012 and 20102011 are presented in the table below.
| | | | | | | | | | | | | | | | | |
| Amounts Recognized on Consolidated Balance Sheet | Amounts Recognized on Consolidated Balance Sheet | | | | | | | | | Amounts Recognized on Consolidated Balance Sheet | | | | | | | | |
| | | | | | | | | | | | | | | |
| | Qualified Pension Plans | | Non-U.S. Pension Plans | | Nonqualified and Other Pension Plans | | Postretirement Health and Life Plans | Qualified Pension Plans | | Non-U.S. Pension Plans | | Nonqualified and Other Pension Plans | | Postretirement Health and Life Plans |
| (Dollars in millions) | 2011 | | 2010 | | 2011 | | 2010 | | 2011 | | 2010 | | 2011 | | 2010 | 2012 | | 2011 | | 2012 | | 2011 | | 2012 | | 2011 | | 2012 | | 2011 |
| Other assets | $ | 246 |
| | $ | 1,710 |
| | $ | 342 |
| | $ | 33 |
| | $ | 1,096 |
| | $ | 809 |
| | $ | — |
| | $ | — |
| $ | 676 |
| | $ | 246 |
| | $ | 220 |
| | $ | 342 |
| | $ | 908 |
| | $ | 1,096 |
| | $ | — |
| | $ | — |
|
| Accrued expenses and other liabilities | (67 | ) | | — |
| | (304 | ) | | (258 | ) | | (1,172 | ) | | (1,198 | ) | | (1,528 | ) | | (1,596 | ) | (57 | ) | | (67 | ) | | (374 | ) | | (304 | ) | | (1,179 | ) | | (1,172 | ) | | (1,488 | ) | | (1,528 | ) |
| Net amount recognized at December 31 | $ | 179 |
| | $ | 1,710 |
| | $ | 38 |
| | $ | (225 | ) | | $ | (76 | ) | | $ | (389 | ) | | $ | (1,528 | ) | | $ | (1,596 | ) | $ | 619 |
| | $ | 179 |
| | $ | (154 | ) | | $ | 38 |
| | $ | (271 | ) | | $ | (76 | ) | | $ | (1,488 | ) | | $ | (1,528 | ) |
Pension Plans with ABO and PBO in excess of plan assets as of December 31, 20112012 and 20102011 are presented in the table below. For the non-qualified plans not subject to ERISA or non-U.S. pension plans, funding strategies vary due to legal requirements and local practices.
| | | | | | | | | | | | | | | | | | | | | | | | | |
| Plans with ABO and PBO in Excess of Plan Assets | | | | | | | | | | | | | | | | | | | | | | |
| | | | | | | | | | | | | | | | | | | | | | | |
| | Qualified Pension Plans | | Non-U.S. Pension Plans | | Nonqualified and Other Pension Plans | Qualified Pension Plans | | Non-U.S. Pension Plans | | Nonqualified and Other Pension Plans |
| (Dollars in millions) | 2011 | | 2010 | | 2011 | | 2010 | | 2011 | | 2010 | 2012 | | 2011 | | 2012 | | 2011 | | 2012 | | 2011 |
| Plans with ABO in excess of plan assets | | | | | |
| | |
| | | | |
| | | | | |
| | |
| | | | |
|
| PBO | $ | — |
| | $ | — |
| | $ | 732 |
| | $ | 477 |
| | $ | 1,174 |
| | $ | 1,200 |
| $ | 7,171 |
| | $ | — |
| | $ | 883 |
| | $ | 732 |
| | $ | 1,182 |
| | $ | 1,174 |
|
| ABO | — |
| | — |
| | 698 |
| | 466 |
| | 1,173 |
| | 1,199 |
| 7,171 |
| | — |
| | 843 |
| | 698 |
| | 1,181 |
| | 1,173 |
|
| Fair value of plan assets | — |
| | — |
| | 428 |
| | 259 |
| | 2 |
| | 2 |
| 7,114 |
| | — |
| | 510 |
| | 428 |
| | 2 |
| | 2 |
|
| Plans with PBO in excess of plan assets | | | | | | | |
| | | | |
| | | | | | | |
| | | | |
|
| PBO | $ | 6,624 |
| | $ | — |
| | $ | 732 |
| | $ | 642 |
| | $ | 1,174 |
| | $ | 1,200 |
| $ | 7,171 |
| | $ | 6,624 |
| | $ | 896 |
| | $ | 732 |
| | $ | 1,182 |
| | $ | 1,174 |
|
| Fair value of plan assets | 6,557 |
| | — |
| | 428 |
| | 384 |
| | 2 |
| | 2 |
| 7,114 |
| | 6,557 |
| | 522 |
| | 428 |
| | 2 |
| | 2 |
|
Net periodic benefit cost of the Corporation’s plans for 20112012, 20102011 and 20092010 included the following components.
| | | | | | | | | | | | | | | | | | | | | | | | | |
| Net Periodic Benefit Cost | | | | | | | | | | | | |
| Components of Net Periodic Benefit Cost | | | | | | | | | | | | |
| | | | | | | | | | | | | | | | | | | | | | | |
| | Qualified Pension Plans | | Non-U.S. Pension Plans | Qualified Pension Plans | | Non-U.S. Pension Plans |
| (Dollars in millions) | 2011 | | 2010 | | 2009 | | 2011 | | 2010 | | 2009 | 2012 | | 2011 | | 2010 | | 2012 | | 2011 | | 2010 |
| Components of net periodic benefit cost | |
| | |
| | |
| | |
| | |
| | |
| |
| | |
| | |
| | |
| | |
| | |
|
| Service cost | $ | 423 |
| | $ | 397 |
| | $ | 387 |
| | $ | 43 |
| | $ | 32 |
| | $ | 30 |
| $ | 236 |
| | $ | 423 |
| | $ | 397 |
| | $ | 40 |
| | $ | 43 |
| | $ | 32 |
|
| Interest cost | 746 |
| | 748 |
| | 740 |
| | 99 |
| | 95 |
| | 76 |
| 681 |
| | 746 |
| | 748 |
| | 97 |
| | 99 |
| | 95 |
|
| Expected return on plan assets | (1,296 | ) | | (1,263 | ) | | (1,231 | ) | | (115 | ) | | (97 | ) | | (74 | ) | (1,246 | ) | | (1,296 | ) | | (1,263 | ) | | (137 | ) | | (115 | ) | | (97 | ) |
| Amortization of prior service cost | 20 |
| | 28 |
| | 39 |
| | — |
| | — |
| | — |
| 9 |
| | 20 |
| | 28 |
| | — |
| | — |
| | — |
|
| Amortization of net actuarial loss (gain) | 387 |
| | 362 |
| | 377 |
| | — |
| | (1 | ) | | — |
| 469 |
| | 387 |
| | 362 |
| | (9 | ) | | — |
| | (1 | ) |
| Recognized gain due to settlements and curtailments | — |
| | — |
| | — |
| | — |
| | — |
| | (2 | ) | |
| Recognized termination benefit costs | — |
| | — |
| | 36 |
| | — |
| | — |
| | — |
| |
| Net periodic benefit cost | $ | 280 |
| | $ | 272 |
| | $ | 348 |
| | $ | 27 |
| | $ | 29 |
| | $ | 30 |
| |
| Recognized loss due to settlements and curtailments | | 58 |
| | — |
| | — |
| | — |
| | — |
| | — |
|
| Net periodic benefit cost (income) | | $ | 207 |
| | $ | 280 |
| | $ | 272 |
| | $ | (9 | ) | | $ | 27 |
| | $ | 29 |
|
| Weighted-average assumptions used to determine net cost for years ended December 31 | |
| | |
| | |
| | |
| | |
| | |
| |
| | |
| | |
| | |
| | |
| | |
|
| Discount rate | 5.45 | % | | 5.75 | % | | 6.00 | % | | 5.32 | % | | 5.41 | % | | 5.55 | % | 4.95 | % | | 5.45 | % | | 5.75 | % | | 4.87 | % | | 5.32 | % | | 5.41 | % |
| Expected return on plan assets | 8.00 |
| | 8.00 |
| | 8.00 |
| | 6.58 |
| | 6.60 |
| | 6.78 |
| 8.00 |
| | 8.00 |
| | 8.00 |
| | 6.65 |
| | 6.58 |
| | 6.60 |
|
| Rate of compensation increase | 4.00 |
| | 4.00 |
| | 4.00 |
| | 4.85 |
| | 4.67 |
| | 4.61 |
| 4.00 |
| | 4.00 |
| | 4.00 |
| | 4.42 |
| | 4.85 |
| | 4.67 |
|
| | | | | | | | | | | | | | | | | | | | | | | |
| | Nonqualified and
Other Pension Plans | | Postretirement Health
and Life Plans | Nonqualified and
Other Pension Plans (1) | | Postretirement Health
and Life Plans |
| (Dollars in millions) | 2011 | | 2010 | | 2009 | | 2011 | | 2010 | | 2009 | 2012 | | 2011 | | 2010 | | 2012 | | 2011 | | 2010 |
| Components of net periodic benefit cost | |
| | |
| | |
| | |
| | |
| | |
| |
| | |
| | |
| | |
| | |
| | |
|
| Service cost | $ | 3 |
| | $ | 3 |
| | $ | 4 |
| | $ | 15 |
| | $ | 14 |
| | $ | 16 |
| $ | 1 |
| | $ | 3 |
| | $ | 3 |
| | $ | 13 |
| | $ | 15 |
| | $ | 14 |
|
| Interest cost | 152 |
| | 163 |
| | 167 |
| | 80 |
| | 92 |
| | 93 |
| 138 |
| | 152 |
| | 163 |
| | 71 |
| | 80 |
| | 92 |
|
| Expected return on plan assets | (141 | ) | | (138 | ) | | (148 | ) | | (9 | ) | | (9 | ) | | (8 | ) | (152 | ) | | (141 | ) | | (138 | ) | | (8 | ) | | (9 | ) | | (9 | ) |
| Amortization of transition obligation | — |
| | — |
| | — |
| | 31 |
| | 31 |
| | 31 |
| — |
| | — |
| | — |
| | 32 |
| | 31 |
| | 31 |
|
| Amortization of prior service cost (credits) | (8 | ) | | (8 | ) | | (8 | ) | | 4 |
| | 6 |
| | — |
| (3 | ) | | (8 | ) | | (8 | ) | | 4 |
| | 4 |
| | 6 |
|
| Amortization of net actuarial loss (gain) | 16 |
| | 10 |
| | 5 |
| | (17 | ) | | (49 | ) | | (77 | ) | 8 |
| | 16 |
| | 10 |
| | (38 | ) | | (17 | ) | | (49 | ) |
| Recognized loss due to settlements and curtailments | 3 |
| | 17 |
| | 2 |
| | — |
| | — |
| | — |
| — |
| | 3 |
| | 17 |
| | — |
| | — |
| | — |
|
| Net periodic benefit cost | $ | 25 |
| | $ | 47 |
| | $ | 22 |
| | $ | 104 |
| | $ | 85 |
| | $ | 55 |
| |
| Net periodic benefit cost (income) | | $ | (8 | ) | | $ | 25 |
| | $ | 47 |
| | $ | 74 |
| | $ | 104 |
| | $ | 85 |
|
| Weighted-average assumptions used to determine net cost for years ended December 31 | |
| | |
| | |
| | |
| | |
| | |
| |
| | |
| | |
| | |
| | |
| | |
|
| Discount rate | 5.20 | % | | 5.75 | % | | 6.00 | % | | 5.10 | % | | 5.75 | % | | 6.00 | % | 4.65 | % | | 5.20 | % | | 5.75 | % | | 4.65 | % | | 5.10 | % | | 5.75 | % |
| Expected return on plan assets | 5.25 |
| | 5.25 |
| | 5.25 |
| | 8.00 |
| | 8.00 |
| | 8.00 |
| 5.25 |
| | 5.25 |
| | 5.25 |
| | 8.00 |
| | 8.00 |
| | 8.00 |
|
| Rate of compensation increase | 4.00 |
| | 4.00 |
| | 4.00 |
| | n/a |
| | n/a |
| | n/a |
| 4.00 |
| | 4.00 |
| | 4.00 |
| | n/a |
| | n/a |
| | n/a |
|
| |
(1) | Includes nonqualified pension plans and the terminated Merrill Lynch U.S. pension plan. |
n/a = not applicable
Net periodic postretirement health and life expense was determined using the “projected unit credit” actuarial method. Gains and losses for all benefits except postretirement health care are recognized in accordance with the standard amortization provisions of the applicable accounting guidance. For the Postretirement Health Care Plans, 50 percent of the unrecognized gain or loss at the beginning of the fiscal year (or at subsequent remeasurement) is recognized on a level basis during the year.
The discount rate and expected return on plan assets impact the net periodic benefit cost (income) recorded for the plans. With all other assumptions held constant, a 25-basis point25 bps decline in the discount rate andwould not have a significant impact while a 25 bps decline in the expected return on plan assets would result in an increase of approximately $55 million and $2733 million for the Qualified Pension Plans. For the Non-U.S. Pension Plans, the Nonqualified and Other
Pension Plans, and Postretirement Health
and Life Plans, the 25-basis point25 bps decline in rates would not have a significant impact.
Assumed health care cost trend rates affect the postretirement benefit obligation and benefit cost reported for the Postretirement Health and Life Plans. The assumed health care cost trend rate used to measure the expected cost of benefits covered by the Postretirement Health and Life Plans was 8.007.50 percent for 20122013, reducing in steps to 5.00 percent in 2019 and later years. A one-percentage-point increase in assumed health care cost trend rates
would have increased the service and interest costs, and the benefit obligation by $43 million and $59 million in 20112012. A one-percentage-point decrease in assumed health care cost trend rates would have lowered the service and interest costs, and the benefit obligation by $3 million and $52 million in 20112012.
Pre-tax amounts included in accumulated OCI for employee benefit plans at December 31, 20112012 and 20102011 are presented in the table below.
| | | | | | | | | | | | | | | | | | | | | | | | | | | | | | | | | | | | | | | | | |
| Pre-tax Amounts included in Accumulated OCI | Pre-tax Amounts included in Accumulated OCI | | | | | | | | | | | | | | | | | Pre-tax Amounts included in Accumulated OCI | | | | | | | | | | | | | | | | |
| | | | | | | | | | | | | | | | | | | | | | | | | | | | | | | | | | | | | | | |
| | Qualified Pension Plans | | Non-U.S. Pension Plans | | Nonqualified and Other Pension Plans | | Postretirement Health and Life Plans | | Total | Qualified Pension Plans | | Non-U.S. Pension Plans | | Nonqualified and Other Pension Plans | | Postretirement Health and Life Plans | | Total |
| (Dollars in millions) | 2011 | | 2010 | | 2011 | | 2010 | | 2011 | | 2010 | | 2011 | | 2010 | | 2011 | | 2010 | 2012 | | 2011 | | 2012 | | 2011 | | 2012 | | 2011 | | 2012 | | 2011 | | 2012 | | 2011 |
| Net actuarial (gain) loss | $ | 6,743 |
| | $ | 5,461 |
| | $ | (212 | ) | | $ | (20 | ) | | $ | 409 |
| | $ | 656 |
| | $ | (59 | ) | | $ | (27 | ) | | $ | 6,881 |
| | $ | 6,070 |
| |
| Net actuarial loss (gain) | | $ | 6,164 |
| | $ | 6,743 |
| | $ | 144 |
| | $ | (212 | ) | | $ | 718 |
| | $ | 409 |
| | $ | (28 | ) | | $ | (59 | ) | | $ | 6,998 |
| | $ | 6,881 |
|
| Transition obligation | — |
| | — |
| | — |
| | — |
| | — |
| | — |
| | 32 |
| | 63 |
| | 32 |
| | 63 |
| — |
| | — |
| | — |
| | — |
| | — |
| | — |
| | — |
| | 32 |
| | — |
| | 32 |
|
| Prior service cost (credits) | 67 |
| | 98 |
| | 3 |
| | 1 |
| | (7 | ) | | (15 | ) | | 33 |
| | 58 |
| | 96 |
| | 142 |
| — |
| | 67 |
| | 5 |
| | 3 |
| | — |
| | (7 | ) | | 29 |
| | 33 |
| | 34 |
| | 96 |
|
| Amounts recognized in accumulated OCI | $ | 6,810 |
| | $ | 5,559 |
| | $ | (209 | ) | | $ | (19 | ) | | $ | 402 |
| | $ | 641 |
| | $ | 6 |
| | $ | 94 |
| | $ | 7,009 |
| | $ | 6,275 |
| $ | 6,164 |
| | $ | 6,810 |
| | $ | 149 |
| | $ | (209 | ) | | $ | 718 |
| | $ | 402 |
| | $ | 1 |
| | $ | 6 |
| | $ | 7,032 |
| | $ | 7,009 |
|
Pre-tax amounts recognized in OCI for employee benefit plans in 20112012 included the following components.
| | | | | | | | | | | | | | | | | | | | | |
| Pre-tax Amounts Recognized in OCI | | | | | | | | | | | | | | | | | | |
| | | | | | | | | | | | | | | | | | | |
| (Dollars in millions) | Qualified Pension Plans | | Non-U.S. Pension Plans | | Nonqualified
and Other Pension Plans | | Postretirement
Health and Life Plans | | Total | Qualified Pension Plans | | Non-U.S. Pension Plans | | Nonqualified
and Other Pension Plans | | Postretirement
Health and Life Plans | | Total |
| Other changes in plan assets and benefit obligations recognized in OCI | |
| | |
| | |
| | |
| | |
| |
| | |
| | |
| | |
| | |
|
| Current year actuarial (gain) loss | $ | 1,669 |
| | $ | (192 | ) | | $ | (228 | ) | | $ | (49 | ) | | $ | 1,200 |
| |
| Current year actuarial loss (gain) | | $ | (110 | ) | | $ | 347 |
| | $ | 321 |
| | $ | (7 | ) | | $ | 551 |
|
| Amortization of actuarial gain (loss) | (387 | ) | | — |
| | (19 | ) | | 17 |
| | (389 | ) | (469 | ) | | 9 |
| | (12 | ) | | 38 |
| | (434 | ) |
| Current year prior service cost (credit) | (11 | ) | | 2 |
| | — |
| | (21 | ) | | (30 | ) | |
| Amortization of prior service credit (cost) | (20 | ) | | — |
| | 8 |
| | (4 | ) | | (16 | ) | |
| Current year prior service cost | | — |
| | 2 |
| | — |
| | — |
| | 2 |
|
| Amortization of prior service credits (cost) | | (67 | ) | | — |
| | 7 |
| | (4 | ) | | (64 | ) |
| Amortization of transition obligation | — |
| | — |
| | — |
| | (31 | ) | | (31 | ) | — |
| | — |
| | — |
| | (32 | ) | | (32 | ) |
| Amounts recognized in OCI | $ | 1,251 |
| | $ | (190 | ) | | $ | (239 | ) | | $ | (88 | ) | | $ | 734 |
| $ | (646 | ) | | $ | 358 |
| | $ | 316 |
| | $ | (5 | ) | | $ | 23 |
|
The estimated pre-tax amounts that will be amortized from accumulated OCI into period costexpense in 20122013 are presented in the table below.
| | | | | | | | | | | | | | | | | | | | | |
| Estimated Pre-tax Amounts from Accumulated OCI into Period Cost | Estimated Pre-tax Amounts from Accumulated OCI into Period Cost | | | | | | | | | Estimated Pre-tax Amounts from Accumulated OCI into Period Cost |
| | | | | | | | | | | | | | | | | | | |
| (Dollars in millions) | Qualified Pension Plans (1) | | Non-U.S. Pension Plans | | Nonqualified
and Other Pension Plans | | Postretirement
Health and Life Plans | | Total | Qualified Pension Plans | | Non-U.S. Pension Plans | | Nonqualified
and Other Pension Plans | | Postretirement
Health and Life Plans | | Total |
| Net actuarial (gain) loss | $ | 598 |
| | $ | (8 | ) | | $ | 10 |
| | $ | (19 | ) | | $ | 581 |
| |
| Prior service cost (credit) | 18 |
| | — |
| | (7 | ) | | 4 |
| | 15 |
| |
| Transition obligation | — |
| | — |
| | — |
| | 31 |
| | 31 |
| |
| Net actuarial loss (gain) | | $ | 284 |
| | $ | 4 |
| | $ | 26 |
| | $ | (20 | ) | | $ | 294 |
|
| Prior service cost | | — |
| | 1 |
| | — |
| | 4 |
| | 5 |
|
| Total amortized from accumulated OCI | $ | 616 |
| | $ | (8 | ) | | $ | 3 |
| | $ | 16 |
| | $ | 627 |
| $ | 284 |
| | $ | 5 |
| | $ | 26 |
| | $ | (16 | ) | | $ | 299 |
|
|
| | |
(1)
| | Estimates are subject to change based on final calculations related to the pension plan freeze discussed on page Bank of America 2012241.249
|
Plan Assets
The Qualified Pension Plans have been established as retirement vehicles for participants, and trusts have been established to secure benefits promised under the Qualified Pension Plans. The Corporation’s policy is to invest the trust assets in a prudent manner for the exclusive purpose of providing benefits to participants and defraying reasonable expenses of administration. The Corporation’s investment strategy is designed to provide a total return that, over the long term, increases the ratio of assets to liabilities. The strategy attempts to maximize the investment return on assets at a level of risk deemed appropriate by the Corporation while complying with ERISA and any applicable regulations and laws. The investment strategy utilizes asset allocation as a principal determinant for establishing the risk/return profile of the assets. Asset allocation ranges are established, periodically reviewed and adjusted as funding levels and liability characteristics change. Active and passive investment managers are employed to help enhance the risk/return profile of the assets. An additional aspect of the investment strategy used
to minimize risk (part of the asset allocation plan) includes matching the equity exposure of participant-selected earnings measures. For example, the common stock of the Corporation held in the trust is maintained as an offset to the exposure related to participants who elected to receive an earnings measure based on the return performance of common stock of the Corporation. No plan assets are expected to be returned to the Corporation during 20122013.
The assets of the Non-U.S. Pension Plans are primarily attributable to a U.K. pension plan. This U.K. pension plan’s assets
are invested prudently so that the benefits promised to members are provided with consideration given to the nature and the duration of the plan’s liabilities. The current planned investment strategy was set following an asset-liability study and advice from the trustee’s investment advisors. The selected asset allocation strategy is designed to achieve a higher return than the lowest risk strategy while maintaining a prudent approach to meeting the plan’s liabilities.
The Expected Returnexpected return on Assetasset assumption (EROA assumption) was developed through analysis of historical market returns, historical asset class volatility and correlations, current market conditions, anticipated future asset allocations, the funds’ past experience, and expectations on potential future market returns. The EROAexpected return on asset assumption is determined using the calculated market-related value for the Qualified Pension Plans and the Other Pension Plan and the fair value for the Non-U.S. Pension Plans and Postretirement Health and Life Plans. The EROAexpected return on asset assumption represents a long-term average view of the performance of the assets in the Qualified Pension Plans, the Non-U.S. Pension Plans, the Other Pension Plan, and Postretirement Health and Life Plans, a return that may or may not be achieved during any one calendar
year. Some of the building blocks used to arrive at the long-term return assumption include an implied return from equity securities of 8.75 percent, debt securities of 5.75 percent and real estate of 7.00 percent for the Qualified Pension Plans, the Non-U.S. Pension Plans, the Other Pension Plan, and Postretirement Health and Life Plans. The terminated U.S. pension planPension Plan is invested solely invested in a groupan annuity contract which is primarily invested in fixed-income securities structured such that asset maturities match the duration of the plan’s obligations.
The target allocations for 20122013 by asset category for the Qualified Pension Plans, Non-U.S. Pension Plans, Nonqualified and Other Pension Plans, and Postretirement Health and Life Plans are presented in the table below.
|
| | | | |
| | | | | |
20122013 Target Allocation Percentage | |
| | | | | |
| Asset Category | Qualified Pension Plans | Non-U.S. Pension Plans | Nonqualified and Other Pension Plans | Postretirement Health and Life Plans |
| Equity securities | 6050 – 80 | 2510 – 7560 | 0 – 5 | 50 – 75 |
| Debt securities | 25 – 50 | 20 – 40 | 10 – 6065 | 95 – 100 | 25 – 45 |
| Real estate | 0 – 5 | 0 – 15 | 0 – 5 | 0 – 5 |
| Other | 0 – 10 | 5 – 40 | 0 – 5 | 0 – 5 |
Equity securities for the Qualified Pension Plans include common stock of the Corporation in the amounts of $156 million (0.96 percent of total plan assets) and $82 million (0.55 percent of total plan assets) and $189 million (1.21 percent of total plan assets) at December 31, 20112012 and 20102011.
Fair Value Measurements
For information on fair value measurements, including descriptions of Level 1, 2 and 3 of the fair value hierarchy and the valuation methods employed by the Corporation, see Note 1 – Summary of Significant Accounting Principles and Note 2221 – Fair Value Measurements.
|
| | |
246250 Bank of America 20112012
| | |
Plan investment assets measured at fair value by level and in total at December 31, 20112012 and 20102011 are summarized in the Fair Value Measurements table.
| | | | | | | | | | | | | | | | | |
| Fair Value Measurements | | | | | | | | | | | | | | |
| | | | | | | | | | | | | | | |
| | December 31, 2011 | December 31, 2012 |
| (Dollars in millions) | Level 1 | | Level 2 | | Level 3 | | Total | Level 1 | | Level 2 | | Level 3 | | Total |
| Cash and short-term investments | |
| | |
| | |
| | |
| |
| | |
| | |
| | |
|
| Money market and interest-bearing cash | $ | 1,065 |
| | $ | — |
| | $ | — |
| | $ | 1,065 |
| $ | 1,404 |
| | $ | — |
| | $ | — |
| | $ | 1,404 |
|
| Cash and cash equivalent commingled/mutual funds | — |
| | 30 |
| | — |
| | 30 |
| — |
| | 96 |
| | — |
| | 96 |
|
| Fixed income | |
| | |
| | |
| | |
| |
| | |
| | |
| | |
|
| U.S. government and government agency securities | 1,197 |
| | 2,899 |
| | 13 |
| | 4,109 |
| 1,317 |
| | 2,829 |
| | 13 |
| | 4,159 |
|
| Corporate debt securities | — |
| | 1,058 |
| | — |
| | 1,058 |
| — |
| | 1,062 |
| | — |
| | 1,062 |
|
| Asset-backed securities | — |
| | 907 |
| | — |
| | 907 |
| — |
| | 1,109 |
| | — |
| | 1,109 |
|
| Non-U.S. debt securities | 53 |
| | 479 |
| | 10 |
| | 542 |
| 70 |
| | 535 |
| | 10 |
| | 615 |
|
| Fixed income commingled/mutual funds | 82 |
| | 1,487 |
| | — |
| | 1,569 |
| 99 |
| | 1,432 |
| | — |
| | 1,531 |
|
| Equity | |
| | |
| | |
| | |
| |
| | |
| | |
| | |
|
| Common and preferred equity securities | 6,862 |
| | — |
| | — |
| | 6,862 |
| 7,432 |
| | — |
| | — |
| | 7,432 |
|
| Equity commingled/mutual funds | 390 |
| | 2,094 |
| | — |
| | 2,484 |
| 290 |
| | 2,316 |
| | — |
| | 2,606 |
|
| Public real estate investment trusts | 200 |
| | — |
| | — |
| | 200 |
| 236 |
| | — |
| | — |
| | 236 |
|
| Real estate | |
| | |
| | |
| | |
| |
| | |
| | |
| | |
|
| Private real estate | — |
| | — |
| | 113 |
| | 113 |
| — |
| | — |
| | 110 |
| | 110 |
|
| Real estate commingled/mutual funds | — |
| | 11 |
| | 249 |
| | 260 |
| — |
| | 10 |
| | 324 |
| | 334 |
|
| Limited partnerships | — |
| | 105 |
| | 232 |
| | 337 |
| — |
| | 110 |
| | 231 |
| | 341 |
|
Other investments (1) | 14 |
| | 572 |
| | 122 |
| | 708 |
| 22 |
| | 543 |
| | 129 |
| | 694 |
|
| Total plan investment assets, at fair value | $ | 9,863 |
| | $ | 9,642 |
| | $ | 739 |
| | $ | 20,244 |
| $ | 10,870 |
| | $ | 10,042 |
| | $ | 817 |
| | $ | 21,729 |
|
| | | | | | | | | | | | | | | |
| | December 31, 2010 | December 31, 2011 |
| Cash and short-term investments | |
| | |
| | |
| | |
| |
| | |
| | |
| | |
|
| Money market and interest-bearing cash | $ | 1,471 |
| | $ | — |
| | $ | — |
| | $ | 1,471 |
| $ | 1,065 |
| | $ | — |
| | $ | — |
| | $ | 1,065 |
|
| Cash and cash equivalent commingled/mutual funds | — |
| | 45 |
| | — |
| | 45 |
| — |
| | 30 |
| | — |
| | 30 |
|
| Fixed income | |
| | |
| | |
| | |
| |
| | |
| | |
| | |
|
| U.S. government and government agency securities | 701 |
| | 2,604 |
| | 14 |
| | 3,319 |
| 1,197 |
| | 2,899 |
| | 13 |
| | 4,109 |
|
| Corporate debt securities | — |
| | 1,106 |
| | — |
| | 1,106 |
| — |
| | 1,058 |
| | — |
| | 1,058 |
|
| Asset-backed securities | — |
| | 796 |
| | — |
| | 796 |
| — |
| | 907 |
| | — |
| | 907 |
|
| Non-U.S. debt securities | 36 |
| | 420 |
| | 9 |
| | 465 |
| 53 |
| | 479 |
| | 10 |
| | 542 |
|
| Fixed income commingled/mutual funds | 240 |
| | 1,503 |
| | — |
| | 1,743 |
| 82 |
| | 1,487 |
| | — |
| | 1,569 |
|
| Equity | |
| | |
| | |
| | |
| |
| | |
| | |
| | |
|
| Common and preferred equity securities | 6,980 |
| | 1 |
| | — |
| | 6,981 |
| 6,862 |
| | — |
| | — |
| | 6,862 |
|
| Equity commingled/mutual funds | 637 |
| | 2,374 |
| | — |
| | 3,011 |
| 390 |
| | 2,094 |
| | — |
| | 2,484 |
|
| Public real estate investment trusts | — |
| | 168 |
| | — |
| | 168 |
| 200 |
| | — |
| | — |
| | 200 |
|
| Real estate | |
| | |
| | |
| | |
| |
| | |
| | |
| | |
|
| Private real estate | — |
| | — |
| | 110 |
| | 110 |
| — |
| | — |
| | 113 |
| | 113 |
|
| Real estate commingled/mutual funds | 30 |
| | 2 |
| | 215 |
| | 247 |
| — |
| | 11 |
| | 249 |
| | 260 |
|
| Limited partnerships | — |
| | 101 |
| | 230 |
| | 331 |
| — |
| | 105 |
| | 232 |
| | 337 |
|
Other investments (1) | 19 |
| | 230 |
| | 94 |
| | 343 |
| 14 |
| | 572 |
| | 122 |
| | 708 |
|
| Total plan investment assets, at fair value | $ | 10,114 |
| | $ | 9,350 |
| | $ | 672 |
| | $ | 20,136 |
| $ | 9,863 |
| | $ | 9,642 |
| | $ | 739 |
| | $ | 20,244 |
|
| |
(1) | Other investments representinclude interest rate swaps of $467311 million and $198467 million, participant loans of $7576 million and $7975 million, commodity and balanced funds of $116239 million and $38116 million and other various investments of $5068 million and $2850 million at December 31, 20112012 and 20102011. |
|
| | |
| | | Bank of America 2012 247251 |
The Level 3 - Fair Value Measurements table presents a reconciliation of all plan investment assets measured at fair value using significant unobservable inputs (Level 3) during 2012, 2011 and 2010.
| | | | | | | | | | | | | | | | | | | | | | | | | |
| Level 3 – Fair Value Measurements | | | | | | | |
| Level 3 Fair Value Measurements | | Level 3 Fair Value Measurements | | | | | | |
| | | | | | | | | | | | | | | | | | | | | | | |
| | 2011 | 2012 |
| (Dollars in millions) | Balance January 1 | | Actual Return on
Plan Assets Still
Held at the Reporting Date | | Purchases | | Sales and Settlements | | Transfers into/ (out of) Level 3 | | Balance December 31 | Balance January 1 | | Actual Return on
Plan Assets Still
Held at the Reporting Date | | Purchases | | Sales and Settlements | | Transfers into/ (out of) Level 3 | | Balance December 31 |
| Fixed income | |
| | |
| | |
| | | | |
| | |
| |
| | |
| | |
| | | | |
| | |
|
| U.S. government and government agency securities | $ | 14 |
| | $ | (1 | ) | | $ | — |
| | $ | — |
| | $ | — |
| | $ | 13 |
| $ | 13 |
| | $ | — |
| | $ | — |
| | $ | — |
| | $ | — |
| | $ | 13 |
|
| Non-U.S. debt securities | 9 |
| | — |
| | 3 |
| | (2 | ) | | — |
| | 10 |
| 10 |
| | (1 | ) | | 1 |
| | (1 | ) | | 1 |
| | 10 |
|
| Real estate | |
| | |
| | | | |
| | |
| | |
| |
| | |
| | | | |
| | |
| | |
|
| Private real estate | 110 |
| | — |
| | 3 |
| | — |
| | — |
| | 113 |
| 113 |
| | (2 | ) | | 2 |
| | (3 | ) | | — |
| | 110 |
|
| Real estate commingled/mutual funds | 215 |
| | 26 |
| | 9 |
| | (1 | ) | | — |
| | 249 |
| 249 |
| | 13 |
| | 62 |
| | — |
| | — |
| | 324 |
|
| Limited partnerships | 230 |
| | (6 | ) | | 13 |
| | (5 | ) | | — |
| | 232 |
| 232 |
| | 8 |
| | 11 |
| | (20 | ) | | — |
| | 231 |
|
| Other investments | 94 |
| | 1 |
| | 26 |
| | — |
| | 1 |
| | 122 |
| 122 |
| | 7 |
| | 4 |
| | (4 | ) | | — |
| | 129 |
|
| Total | $ | 672 |
| | $ | 20 |
| | $ | 54 |
| | $ | (8 | ) | | $ | 1 |
| | $ | 739 |
| $ | 739 |
| | $ | 25 |
| | $ | 80 |
| | $ | (28 | ) | | $ | 1 |
| | $ | 817 |
|
| | | | | | | | | | | | | | | | | | | | | | | |
| | 2010 | 2011 |
| Fixed income | |
| | |
| | |
| | | | |
| | |
| |
| | |
| | |
| | | | |
| | |
|
| U.S. government and government agency securities | $ | — |
| | $ | — |
| | $ | — |
| | $ | — |
| | $ | 14 |
| | $ | 14 |
| $ | 14 |
| | $ | (1 | ) | | $ | — |
| | $ | — |
| | $ | — |
| | $ | 13 |
|
| Non-U.S. debt securities | 6 |
| | 1 |
| | — |
| | — |
| | 2 |
| | 9 |
| 9 |
| | — |
| | 3 |
| | (2 | ) | | — |
| | 10 |
|
| Real estate | |
| | |
| | | | |
| | |
| | |
| |
| | |
| | | | |
| | |
| | |
|
| Private real estate | 119 |
| | (9 | ) | | 1 |
| | (1 | ) | | — |
| | 110 |
| 110 |
| | — |
| | 3 |
| | — |
| | — |
| | 113 |
|
| Real estate commingled/mutual funds | 195 |
| | (4 | ) | | 24 |
| | — |
| | — |
| | 215 |
| 215 |
| | 26 |
| | 9 |
| | (1 | ) | | — |
| | 249 |
|
| Limited partnerships | 162 |
| | 13 |
| | 7 |
| | (5 | ) | | 53 |
| | 230 |
| 230 |
| | (6 | ) | | 13 |
| | (5 | ) | | — |
| | 232 |
|
| Other investments | 188 |
| | — |
| | 18 |
| | (1 | ) | | (111 | ) | | 94 |
| 94 |
| | 1 |
| | 26 |
| | — |
| | 1 |
| | 122 |
|
| Total | $ | 670 |
| | $ | 1 |
| | $ | 50 |
| | $ | (7 | ) | | $ | (42 | ) | | $ | 672 |
| $ | 672 |
| | $ | 20 |
| | $ | 54 |
| | $ | (8 | ) | | $ | 1 |
| | $ | 739 |
|
| | | | | | | | | | | | | | | | | | | | | | | |
| | 2009 | 2010 |
| Fixed income | | | | | | | | | | | | | | | | | | | | | | |
| Corporate debt securities | $ | 1 |
| | $ | (1 | ) | | $ | — |
| | $ | — |
| | $ | — |
| | $ | — |
| |
| U.S. government and government agency securities | | $ | — |
| | $ | — |
| | $ | — |
| | $ | — |
| | $ | 14 |
| | $ | 14 |
|
| Non-U.S. debt securities | 6 |
| | — |
| | — |
| | — |
| | — |
| | 6 |
| 6 |
| | 1 |
| | — |
| | — |
| | 2 |
| | 9 |
|
| Real estate | | | | | | | | | | | |
| | | | | | | | | | | |
|
| Private real estate | 149 |
| | (29 | ) | | — |
| | (1 | ) | | — |
| | 119 |
| 119 |
| | (9 | ) | | 1 |
| | (1 | ) | | — |
| | 110 |
|
| Real estate commingled/mutual funds | 281 |
| | (92 | ) | | 6 |
| | — |
| | — |
| | 195 |
| 195 |
| | (4 | ) | | 24 |
| | — |
| | — |
| | 215 |
|
| Limited partnerships | 91 |
| | 14 |
| | 41 |
| | (4 | ) | | 20 |
| | 162 |
| 162 |
| | 13 |
| | 7 |
| | (5 | ) | | 53 |
| | 230 |
|
| Other investments | 293 |
| | (106 | ) | | 5 |
| | (4 | ) | | — |
| | 188 |
| 188 |
| | — |
| | 18 |
| | (1 | ) | | (111 | ) | | 94 |
|
| Total | $ | 821 |
| | $ | (214 | ) | | $ | 52 |
| | $ | (9 | ) | | $ | 20 |
| | $ | 670 |
| $ | 670 |
| | $ | 1 |
| | $ | 50 |
| | $ | (7 | ) | | $ | (42 | ) | | $ | 672 |
|
Projected Benefit Payments
Benefit payments projected to be made from the Qualified Pension Plans, Non-U.S. Pension Plans, Nonqualified and Other Pension Plans, and Postretirement Health and Life Plans are presented in the table below.
| | | | | | | | | | | | | | | | | | | | | |
| Projected Benefit Payments | Projected Benefit Payments | | | | | Projected Benefit Payments | | | | |
| | | | | | | | | | | | | | | | | | | |
| | | | | | | | Postretirement Health and Life Plans | | | | | | | Postretirement Health and Life Plans |
| (Dollars in millions) | Qualified Pension Plans (1) | | Non-U.S. Pension Plans (2) | | Nonqualified and Other Pension Plans (2) | | Net Payments (3) | | Medicare Subsidy | Qualified Pension Plans (1) | | Non-U.S. Pension Plans (2) | | Nonqualified and Other Pension Plans (2) | | Net Payments (3) | | Medicare Subsidy |
| 2012 | $ | 1,054 |
| | $ | 67 |
| | $ | 251 |
| | $ | 159 |
| | $ | 18 |
| |
| 2013 | 1,059 |
| | 69 |
| | 244 |
| | 160 |
| | 18 |
| $ | 887 |
| | $ | 63 |
| | $ | 234 |
| | $ | 147 |
| | $ | 18 |
|
| 2014 | 1,062 |
| | 71 |
| | 238 |
| | 161 |
| | 18 |
| 931 |
| | 67 |
| | 238 |
| | 147 |
| | 18 |
|
| 2015 | 1,062 |
| | 72 |
| | 238 |
| | 160 |
| | 18 |
| 913 |
| | 68 |
| | 239 |
| | 145 |
| | 18 |
|
| 2016 | 1,060 |
| | 74 |
| | 238 |
| | 157 |
| | 18 |
| 900 |
| | 73 |
| | 240 |
| | 141 |
| | 18 |
|
| 2017 – 2021 | 5,283 |
| | 392 |
| | 1,128 |
| | 702 |
| | 81 |
| |
| 2017 | | 888 |
| | 76 |
| | 237 |
| | 136 |
| | 17 |
|
| 2018 – 2022 | | 4,329 |
| | 455 |
| | 1,133 |
| | 595 |
| | 80 |
|
| |
(1) | Benefit payments expected to be made from the plans’ assets. |
| |
(2) | Benefit payments expected to be made from a combination of the plans’ and the Corporation’s assets. |
| |
(3) | Benefit payments (net of retiree contributions) expected to be made from a combination of the plans’ and the Corporation’s assets. |
|
| | |
248252 Bank of America 20112012
| | |
Defined Contribution Plans
The Corporation maintains qualified defined contribution retirement plans and nonqualified defined contribution retirement plans. As a result of the Merrill Lynch acquisition, the Corporation also maintains the defined contribution plans of Merrill Lynch which include the 401(k) Savings & Investment Plan (SIP), the Retirement and Accumulation Plan (RAP) and the Employee Stock Ownership Plan (ESOP).Plan. In 2012, these plans were merged with the SIP being the successor plan and is closed to new participants with certain exceptions. The Corporation contributed approximately$886 million, $723 million, and $670 million and $605 millionin 20112012, 20102011 and 20092010, respectively, in cash to the qualified defined contribution plans. In connection with the redesign of the Corporation’s retirement plans, an additional annual contribution will be made to certain of these plans. The expense in 2012 related to the additional annual contribution was $174 million. At December 31, 20112012 and 20102011, 232235 million shares and 208232 million shares of the Corporation’s common stock were held by these plans. Payments to the plans for dividends on common stock were $910 million, $89 million and $8 million in 20112012, 20102011 and 20092010, respectively.
In addition, certainCertain non-U.S. employees within the Corporation are covered under defined contribution pension plans that are separately administered in accordance with local laws.
NOTE 2019 Stock-based Compensation Plans
The Corporation administers a number of equity compensation plans, including the Key Employee Stock Plan, the Key Associate Stock Plan and the Merrill Lynch Employee Stock Compensation Plan. Descriptions of the significant features of the equity compensation plans are below. Under these plans, the Corporation grants stock-based awards, including stock options, restricted stock shares and RSUs. For grantsGrants in 20112012, restricted stock awards include RSUs which generally vest in three equal annual installments beginning one year from the grant date.date, awards of restricted stock that were vested and released from restrictions on the grant date and certain awards which will vest subject to the attainment of specified performance goals.
For most awards, expense is generally recognized ratably over the vesting period net of estimated forfeitures, unless the employee meets certain retirement eligibility criteria. For awards to employees that meet retirement eligibility criteria, the Corporation records the expense upon grant. For employees that become retirement eligible during the vesting period, the Corporation recognizes expense from the grant date to the date on which the employee becomes retirement eligible, net of estimated forfeitures. The compensation cost for the stock-based plans was $2.62.3 billion, $2.02.6 billion and $2.42.0 billion in 20112012, 20102011 and 20092010, respectively. The related income tax benefit was $969839 million, $727969 million and $892727 million for 20112012, 20102011 and 20092010, respectively.
For capital purposes, the Corporation issued approximately 122 million of immediately tradable shares of common stock, or approximately $1.0 billion (after-tax) to certain employees in February 2012 in lieu of a portion of their 2011 year-end cash incentive.
Key Employee Stock Plan
The Key Employee Stock Plan, as amended and restated, provided for different types of awards including stock options, restricted stock shares and RSUs. Under the plan, 10-year options to purchase approximately 260 million shares of common stock were granted through December 31, 2002 to certain employees at the closing market price on the respective grant dates. At December 31, 20112012, approximatelythere were 21 millionno fully vested options were outstanding awards remaining under this plan. Noplan and no further awards may be granted.
Key Associate Stock Plan
The Key Associate Stock Plan became effective January 1, 2003. It provides for different types of awards, including stock options, restricted stock shares and RSUs. As of December 31, 20112012, the shareholders had authorized approximately 1.1 billion shares for grant under this plan. Additionally, any shares covered by awards under the Key Employee Stock Plan or certain legacy company plans that cancel, terminate, expire, lapse or settle in cash after a specified date may be re-granted under the Key Associate Stock Plan.
During 20112012, the Corporation issued approximately 193290 million RSUs to certain employees under the Key Associate Stock Plan. Certain awards are earned based on the achievement of specified performance criteria. Vested RSUs may be settled in cash or in shares of common stock depending on the terms of the applicable award. In 20112012, approximately 1267 million of these RSUs were authorized to be settled in shares of common stock.stock with the remainder in cash only. Certain awards contain clawback provisions which permit the Corporation to cancel all or a portion of the award under specified circumstances. The compensationcost for cash-settled awards and awards subject to certain clawback provisions, which in the aggregate represent substantially all of the awards in 2012, is accrued over the vesting period and is adjusted to fair value based upon changes in the share price of the Corporation’s common stock. The compensation cost for
From time to time, the remaining awards is fixed and based on the share price of the Corporation’s common stock on the date of grant. The Corporation hedgesenters into equity total return swaps to hedge a portion of its exposureRSUs granted to variabilitycertain employees as part of their compensation in prior periods to minimize the change in the expected cash flows for certain unvested awards using a combinationexpense to the Corporation driven by fluctuations in the fair value of economic andthe RSUs. Certain of these derivatives are designated as cash flow hedges of unrecognized unvested awards with the changes in fair value of the hedge recorded in accumulated OCI and reclassified into earnings in the same period as describedthe RSUs affect earnings. The remaining derivatives are used to hedge the price risk of cash-settled awards with changes in Note 4 – Derivatives.fair value recorded in personnel expense.
At December 31, 20112012, approximately 135130 million options were outstanding under this plan. There were no options granted under this plan during2012, 2011 or 2010.
Merrill Lynch Employee Stock Compensation Plan
The Corporation assumed the Merrill Lynch Employee Stock Compensation Plan with the acquisition of Merrill Lynch. Approximately 8 million RSUs were granted in 2011 which generally vest in three equal annual installments beginning one year from the grant date. There were no shares granted under this plan during 2012 or 2010. Awards granted in 2009 generally vest in three equal annual installments beginning one year from the grant date, and awards granted prior to 2009 generally vest in four equal annual installments beginning one year from the grant date. At December 31, 20112012, there were approximately 205 million unvested shares outstanding.
Other Stock Plans
As a result of the Merrill Lynch acquisition, the Corporation assumed the obligations of outstanding awards granted under the Merrill Lynch Financial Advisor Capital Accumulation Award Plan (FACAAP) and the Merrill Lynch Employee Stock Purchase Plan (ESPP). The FACAAP is no longer an active plan and no awards were granted in2012, 2011 or 2010. Awards granted in 2003 and thereafter are generally payable eight years from the grant date in a fixed number of the Corporation’s common shares. For outstanding awards granted prior to 2003, payment is generally made ten10 years from the grant date in a fixed number of the Corporation’s common shares unless the fair value of such shares
is less than a specified minimum value, in which case the minimum value is paid in cash. At December 31, 20112012, there were 1211 million shares outstanding under this plan.
The ESPP allowswas discontinued on March 31, 2012. The final discounted purchase was made on April 13, 2012. The ESPP allowed eligible employees to invest from one percent to 10 percent of eligible compensation to purchase the Corporation’s common stock, subject to legal limits. Purchases were made at a discount of five percent of the average high and low market price on the relevant purchase date and the maximum annual contribution per employee was $23,750 in 2011. Approximately 107 million shares were authorized for issuance under the ESPP in 2009. There were 6 million shares available at December 31, 20112012.
The weighted-average fair value of the ESPP stock purchase rights representing the five percent discount on the Corporation’s common stock purchases exercised by employees in 20112012 was $0.540.39 per stock purchase right.
Restricted Stock/Unit DetailsUnits
The table below presents the status of the share-settled restricted stock/units at December 31, 20112012 and changes during 20112012.
| | | | | | | | | |
| Restricted Stock/Unit Details | |
| Restricted Stock/Units | | Restricted Stock/Units |
| | | | | | | |
| | Shares | | Weighted- average Exercise Price | Shares/Units | | Weighted- average Grant Date Fair Value |
| Outstanding at January 1, 2011 | 212,072,669 |
| | $ | 13.37 |
| |
| Outstanding at January 1, 2012 | | 253,966,818 |
| | $ | 13.46 |
|
| Granted | 138,083,421 |
| | 14.49 |
| 196,979,019 |
| | 7.78 |
|
| Vested | (80,788,009 | ) | | 14.90 |
| (293,968,254 | ) | | 9.80 |
|
| Canceled | (15,401,263 | ) | | 13.99 |
| (9,407,186 | ) | | 13.46 |
|
| Outstanding at December 31, 2011 | 253,966,818 |
| | $ | 13.46 |
| |
| Outstanding at December 31, 2012 | | 147,570,397 |
| | $ | 13.18 |
|
Of the 197 million share-settled shares/units granted above, 190 million were granted as awards of restricted stock shares that vested and were released from restrictions on the grant date.
The table below presents the status at December 31, 2012 of the cash-settled RSUs granted under the Key Associate Stock Plan and changes during 2012.
|
| | |
| |
| Restricted Unit Details | |
| |
| Units |
| Outstanding at January 1, 2012 | 117,439,155 |
|
| Granted | 283,196,745 |
|
| Vested | (53,912,279 | ) |
| Canceled | (17,167,153 | ) |
| Outstanding at December 31, 2012 | 329,556,468 |
|
At December 31, 20112012, there was $1.21.7 billion of total unrecognized compensation cost related to share-based compensation arrangements for all awards and it is expected to be recognized over a period up to seven years, with a weighted
averageweighted-average period of 1.4.5 years. The total fair value of restricted stock vested in 2012, 2011 and 2010 was $2.9 billion, $1.7 billion. and $2.4 billion, respectively. In 2012, 2011, and 2010 the amount of cash paid to settle equity-based awards for all equity compensation plans was$779 million, $489 million and $186 million, which included cash-settled RSUs not reflected in the Restricted Stock/Unit Details table.respectively.
Stock Options
The table below presents the status of all option plans at December 31, 20112012 and changes during 20112012. Outstanding options at December 31, 20112012 include 21 million options under the Key Employee Stock Plan, 135130 million options under the Key Associate Stock Plan and 5225 million options to employees of predecessor company plans assumed in mergers.
| | | | | | | | | |
Stock Options | | | | | | | | |
| | Options | | Weighted- average Exercise Price | Options | | Weighted- average Exercise Price |
| Outstanding at January 1, 2011 | 261,122,819 |
| | $ | 50.61 |
| |
| Outstanding at January 1, 2012 | | 208,269,549 |
| | $ | 46.93 |
|
| Forfeited | (52,853,270 | ) | | 65.12 |
| (53,345,926 | ) | | 49.02 |
|
| Outstanding at December 31, 2011 | 208,269,549 |
| | 46.93 |
| |
| Options exercisable at December 31, 2011 | 208,259,354 |
| | 46.93 |
| |
| Outstanding at December 31, 2012 | | 154,923,623 |
| | 46.22 |
|
| Options exercisable at December 31, 2012 | | 154,922,583 |
| | 46.22 |
|
Options vested and expected to vest (1) | 208,269,549 |
| | 46.93 |
| 154,923,623 |
| | 46.22 |
|
| |
(1) | Includes vested shares and nonvested shares after a forfeiture rate is applied. |
At December 31, 20112012, there was no aggregate intrinsic value of options outstanding, exercisable, and vested and expected to vest. The weighted-average remaining contractual term of options outstanding, was 2.7 years, options exercisable, was 2.6 years, and options vested and expected to vest was 2.62.4 years at December 31, 20112012. These remaining contractual terms are similarthe same because options have not been granted since 2008 and they generally vest over three years.
|
| | |
250254 Bank of America 20112012
| | |
NOTE 2120 Income Taxes
The components of income tax expense (benefit) for 20112012, 20102011 and 20092010 were asare presented in the table below.
| | | | | | | | | | | | | |
| Income Tax Expense (Benefit) | Income Tax Expense (Benefit) | | | | | Income Tax Expense (Benefit) | | | | |
| | | | | | | | | | | |
| (Dollars in millions) | 2011 | | 2010 | | 2009 | 2012 | | 2011 | | 2010 |
| Current income tax expense (benefit) | |
| | |
| | |
| |
| | |
| | |
|
| U.S. federal | $ | (733 | ) | | $ | (666 | ) | | $ | (3,576 | ) | $ | 458 |
| | $ | (733 | ) | | $ | (666 | ) |
| U.S. state and local | 393 |
| | 158 |
| | 555 |
| 592 |
| | 393 |
| | 158 |
|
| Non-U.S. | 613 |
| | 815 |
| | 735 |
| 569 |
| | 613 |
| | 815 |
|
| Total current expense (benefit) | 273 |
| | 307 |
| | (2,286 | ) | |
| Total current expense | | 1,619 |
| | 273 |
| | 307 |
|
| Deferred income tax expense (benefit) | |
| | |
| | |
| |
| | |
| | |
|
| U.S. federal | (2,673 | ) | | (287 | ) | | 792 |
| (3,433 | ) | | (2,673 | ) | | (287 | ) |
| U.S. state and local | (584 | ) | | 201 |
| | (620 | ) | (55 | ) | | (584 | ) | | 201 |
|
| Non-U.S. | 1,308 |
| | 694 |
| | 198 |
| 753 |
| | 1,308 |
| | 694 |
|
| Total deferred expense (benefit) | (1,949 | ) | | 608 |
| | 370 |
| (2,735 | ) | | (1,949 | ) | | 608 |
|
| Total income tax expense (benefit) | $ | (1,676 | ) | | $ | 915 |
| | $ | (1,916 | ) | $ | (1,116 | ) | | $ | (1,676 | ) | | $ | 915 |
|
Total income tax expense (benefit) does not reflect the deferred tax effects of unrealized gains and losses on AFS debt and marketable equity securities, foreign currency translation adjustments, derivatives and employee benefit plan adjustments that are included in accumulated OCI. As a result of these tax effects, accumulated OCI increaseddecreased $3.01.3 billion and $3.2 billion in 2011 and decreased $3.2 billion2012 and 2010, and increased $1.62.9 billion in 2010 and 20092011. In addition, total income tax expense (benefit) does not reflect tax effects associated with the Corporation’s employee stock plans which decreased common stock and additional paid-in capital $277 million and $98 million in 2012 and 2010, and increased common stock and additional paid-in capital $19 million in 2011 and decreased common stock and additional paid-in capital $98 million and $295 million in 2010 and 2009.
Income tax expense (benefit) for 20112012, 20102011 and 20092010 varied from the amount computed by applying the statutory income tax rate to income (loss) before income taxes. A reconciliation betweenof the expected U.S. federal income tax expense usingapplying the federal statutory tax rate of 35 percent to the Corporation’s actual income tax expense (benefit) and resulting effective tax rate for 20112012, 20102011 and 20092010 isare presented in the Reconciliation of Income Tax Expense (Benefit) table.
| | | | | | | | | | | | | | | | | | | | | | | | | |
| Reconciliation of Income Tax Expense (Benefit) | Reconciliation of Income Tax Expense (Benefit) | | | | | | | | | | | Reconciliation of Income Tax Expense (Benefit) | | | | | | | | | | |
| | | | | | | | | | | | | | | | | | | | | | | |
| | 2011 | | 2010 | | 2009 | 2012 | | 2011 | | 2010 |
| (Dollars in millions) | Amount | | Percent | | Amount | | Percent | | Amount | | Percent | Amount |
| Percent |
| Amount |
| Percent |
| Amount |
| Percent |
| Expected U.S. federal income tax expense (benefit) | $ | (81 | ) | | 35.0 | % | | $ | (463 | ) | | 35.0 | % | | $ | 1,526 |
| | 35.0 | % | $ | 1,075 |
| | 35.0 | % | | $ | (81 | ) | | 35.0 | % | | $ | (463 | ) | | 35.0 | % |
| Increase (decrease) in taxes resulting from: | |
| | (10 | )% | | |
| | |
| | |
| | |
| |
| | | | |
| | (1 | )% | | |
| | |
|
| State tax expense (benefit), net of federal effect | (124 | ) | |
|
| | 233 |
| | (17.6 | ) | | (42 | ) | | (1.0 | ) | 349 |
| | 11.4 |
| | (124 | ) | |
|
| | 233 |
| | (17.6 | ) |
| Change in federal and non-U.S. valuation allowances | (1,102 | ) | |
|
| | (1,657 | ) | | 125.4 |
| | (650 | ) | | (14.9 | ) | |
| Subsidiary sales and liquidations | (823 | ) | |
|
| | — |
| | — |
| | (595 | ) | | (13.7 | ) | |
Non-U.S. tax differential (1) | | (1,968 | ) | | (64.1 | ) | | (383 | ) | |
|
| | (190 | ) | | 14.4 |
|
| Low-income housing credits/other credits | (800 | ) | |
|
| | (732 | ) | | 55.4 |
| | (668 | ) | | (15.3 | ) | (783 | ) | | (25.5 | ) | | (800 | ) | |
|
| | (732 | ) | | 55.4 |
|
| Tax-exempt income, including dividends | (614 | ) | |
|
| | (981 | ) | | 74.2 |
| | (863 | ) | | (19.8 | ) | (576 | ) | | (18.8 | ) | | (614 | ) | |
|
| | (981 | ) | | 74.2 |
|
| Non-U.S. tax differential | (383 | ) | |
|
| | (190 | ) | | 14.4 |
| | (709 | ) | | (16.3 | ) | |
| Changes in prior period UTBs (including interest) | (239 | ) | |
|
| | (349 | ) | | 26.4 |
| | 87 |
| | 2.0 |
| (198 | ) | | (6.4 | ) | | (239 | ) | |
|
| | (349 | ) | | 26.4 |
|
| Goodwill - impairment and other | 1,420 |
| |
|
| | 4,508 |
| | (341.0 | ) | | — |
| | — |
| |
| Non-U.S. statutory rate reductions | 860 |
| |
|
| | 392 |
| | (29.7 | ) | | — |
| | — |
| 788 |
| | 25.7 |
| | 860 |
| |
|
| | 392 |
| | (29.7 | ) |
| Nondeductible expenses | | 231 |
| | 7.5 |
| | 119 |
| |
|
| | 99 |
| | (7.5 | ) |
| Leveraged lease tax differential | 121 |
| |
|
| | 98 |
| | (7.4 | ) | | 59 |
| | 1.4 |
| 83 |
| | 2.7 |
| | 121 |
| |
|
| | 98 |
| | (7.4 | ) |
| Nondeductible expenses | 119 |
| |
|
| | 99 |
| | (7.5 | ) | | 69 |
| | 1.6 |
| |
| Change in federal and non-U.S. valuation allowances | | 41 |
| | 1.3 |
| | (1,102 | ) | |
|
| | (1,657 | ) | | 125.4 |
|
| Goodwill – impairment and other | | — |
| | — |
| | 1,420 |
| |
|
| | 4,508 |
| | (341.0 | ) |
| Subsidiary sales and liquidations | | — |
| | — |
| | (823 | ) | |
|
| | — |
| | — |
|
| Other | (30 | ) | |
|
| | (43 | ) | | 3.2 |
| | (130 | ) | | (3.0 | ) | (158 | ) | | (5.1 | ) | | (30 | ) | |
|
| | (43 | ) | | 3.2 |
|
| Total income tax expense (benefit) | $ | (1,676 | ) | | n/m |
| | $ | 915 |
| | (69.2 | )% | | $ | (1,916 | ) | | (44.0 | )% | $ | (1,116 | ) | | (36.3 | )% | | $ | (1,676 | ) | | n/m |
| | $ | 915 |
| | (69.2 | )% |
| |
(1) | Includes in 2012, $1.7 billion income tax benefit attributable to the excess of foreign tax credits recognized in the U.S. upon repatriation of the earnings of certain non-U.S. subsidiaries over the related U.S. tax liability. |
n/m = not meaningful
The reconciliation of the beginning unrecognized tax benefits (UTB) balance to the ending balance is presented in the table below.
| | | | | | | | | | | | | |
Reconciliation of the Change in Unrecognized Tax Benefits | | | | | | | | | | | | |
| (Dollars in millions) | 2011 | | 2010 | | 2009 | 2012 | | 2011 | | 2010 |
| Beginning balance | $ | 5,169 |
| | $ | 5,253 |
| | $ | 3,541 |
| $ | 4,203 |
| | $ | 5,169 |
| | $ | 5,253 |
|
| Increases related to positions taken during the current year | 219 |
|
| 172 |
|
| 181 |
| 352 |
| | 219 |
| | 172 |
|
| Positions acquired or assumed in business combinations | — |
| | — |
| | 1,924 |
| |
Increases related to positions taken during prior years (1) | 879 |
| | 755 |
| | 791 |
| 142 |
| | 879 |
| | 755 |
|
Decreases related to positions taken during prior years (1) | (1,669 | ) | | (657 | ) | | (554 | ) | (711 | ) | | (1,669 | ) | | (657 | ) |
| Settlements | (277 | ) | | (305 | ) | | (615 | ) | (205 | ) | | (277 | ) | | (305 | ) |
| Expiration of statute of limitations | (118 | ) | | (49 | ) | | (15 | ) | (104 | ) | | (118 | ) | | (49 | ) |
| Ending balance | $ | 4,203 |
| | $ | 5,169 |
| | $ | 5,253 |
| $ | 3,677 |
| | $ | 4,203 |
| | $ | 5,169 |
|
| |
(1) | The sum per year of positions taken during prior years differs from the $(239)198 million, $(349)239 million and $87349 million in the Reconciliation of Income Tax Expense (Benefit) table due to temporary items and jurisdictional offsets, as well as the inclusion of interest in the Reconciliation of Income Tax Expense (Benefit) table. |
|
| | |
| | | Bank of America 2012 251255 |
At December 31, 20112012, 20102011 and 20092010, the balance of the Corporation’s UTBs which would, if recognized, affect the Corporation’s effective tax rate was $3.33.1 billion, $3.43.3 billion and $4.03.4 billion, respectively. Included in the UTB balance are some items the recognition of which would not affect the effective tax rate, such as the tax effect of certain temporary differences, the portion of gross state UTBs that would be offset by the tax benefit of the associated federal deduction and the portion of gross non-U.S. UTBs that would be offset by tax reductions in other jurisdictions.
The Corporation files income tax returns in more than 100 state and non-U.S. jurisdictions each year. The IRS and other tax authorities in countries and states in which itthe Corporation has significant business operations examine tax returns periodically (continuously in some jurisdictions). The Tax Examination Status table summarizes the status of significant examinations (U.S. federal unless otherwise noted) for the Corporation and various acquired subsidiaries as of December 31, 20112012.
|
| | | |
| | | | |
| Tax Examination Status | | | |
| | | | |
| | Years under Examination(1) | | Status at December 31 2011
2012 |
| Bank of America Corporation – U.S. | 2001 – 2009 | | See below |
| Bank of America Corporation – U.S. | 2010 – 2011 | | Field examination |
Bank of America Corporation – New York(1) | 19992004 – 20032008 | | Field examination |
| Merrill Lynch – U.S. | 2004 --– 2008 | | See below |
| Various – U.K. | 2007 -- 20092011 | | Field examination |
Fleet Boston – U.S. | 2001 – 2004 | | In Appeals process |
| |
(1) | All tax years subsequent to the years shown remain open to examination. |
During 20112012, the Corporation and the IRS made significantcontinued to make progress toward resolving all federal income tax examinations for Bank of America Corporation tax years through 2009 and Merrill Lynch tax years through 2008. While subject to final agreement, including review by the Joint Committee on Taxation of the U.S. Congress for certain years, the Corporation believes that all federalthese examinations in the Tax Examination Status table may be concluded during 20122013.
Considering all examinations, it is reasonably possible that the UTB balance may decrease by as much as $2.6 billion during the next twelve months, since resolved items will be removed from the balance whether their resolution results in payment or recognition. If such decrease were to occur, it likely would primarily result from outcomes consistent with management expectations.
During 2011 and 20102012, the Corporation recognized a $99 million expense and, in income tax expense2011, a benefit of $168 million and expense of $99 millionfor interest and penalties, net-of-tax.net-of-tax, in income tax benefit. At December 31, 20112012 and 20102011, the Corporation’s accrual for interest and penalties that related to income taxes, net of taxes and remittances, was $787775 million and $1.1 billion787 million.
Significant components of the Corporation’s net deferred tax assets and liabilities at December 31, 20112012 and 20102011 are presented in the Deferred Tax Assets and Liabilities table.
|
| | | | | | | |
| | | | |
| Deferred Tax Assets and Liabilities | | | |
| | | | |
| | December 31 |
| (Dollars in millions) | 2011 | | 2010 |
| Deferred tax assets | |
| | |
|
| Net operating loss (NOL) carryforwards | $ | 14,307 |
| | $ | 18,732 |
|
| Allowance for credit losses | 11,824 |
| | 14,659 |
|
| Accrued expenses | 8,340 |
| | 3,550 |
|
| Employee compensation and retirement benefits | 4,792 |
| | 3,868 |
|
| Credit carryforwards | 4,510 |
| | 4,183 |
|
| State income taxes | 2,489 |
| | 1,791 |
|
| Security and loan valuations | 1,091 |
| | 427 |
|
| Capital loss carryforwards | — |
| | 1,530 |
|
| Other | 1,654 |
| | 1,960 |
|
| Gross deferred tax assets | 49,007 |
| | 50,700 |
|
| Valuation allowance | (1,796 | ) | | (2,976 | ) |
| Total deferred tax assets, net of valuation allowance | 47,211 |
| | 47,724 |
|
| | | | |
| Deferred tax liabilities | |
| | |
|
| Long-term borrowings | 3,360 |
| | 3,328 |
|
| Equipment lease financing | 3,042 |
| | 2,957 |
|
| Mortgage servicing rights | 1,993 |
| | 4,280 |
|
| Intangibles | 1,894 |
| | 2,146 |
|
| Available-for-sale securities | 1,811 |
| | 4,330 |
|
| Fee income | 1,038 |
| | 1,235 |
|
| Other | 2,074 |
| | 2,375 |
|
| Gross deferred tax liabilities | 15,212 |
| | 20,651 |
|
| Net deferred tax assets | $ | 31,999 |
| | $ | 27,073 |
|
The 2010 U.S. federal deferred tax asset excludes $56 million related to certain employee stock plan deductions that was recognized and increased additional paid-in capital in 2011. |
| | | | | | | |
| | | | |
| Deferred Tax Assets and Liabilities | | | |
| | | | |
| | December 31 |
| (Dollars in millions) | 2012 | | 2011 |
| Deferred tax assets | |
| | |
|
| Net operating loss carryforwards | $ | 13,863 |
| | $ | 14,307 |
|
| Tax credit carryforwards | 9,529 |
| | 4,510 |
|
| Allowance for credit losses | 8,463 |
| | 11,824 |
|
| Accrued expenses | 8,099 |
| | 8,340 |
|
| Employee compensation and retirement benefits | 4,612 |
| | 4,792 |
|
| Security, loan and debt valuations | 2,712 |
| | 1,091 |
|
| State income taxes | 2,766 |
| | 2,489 |
|
| Other | 725 |
| | 1,654 |
|
| Gross deferred tax assets | 50,769 |
| | 49,007 |
|
| Valuation allowance | (2,211 | ) | | (1,796 | ) |
| Total deferred tax assets, net of valuation allowance | 48,558 |
| | 47,211 |
|
| | | | |
| Deferred tax liabilities | |
| | |
|
| Equipment lease financing | 3,371 |
| | 3,042 |
|
| Long-term borrowings | 3,215 |
| | 3,360 |
|
| Available-for-sale securities | 2,877 |
| | 1,811 |
|
| Mortgage servicing rights | 1,986 |
| | 1,993 |
|
| Intangibles | 1,708 |
| | 1,894 |
|
| Fee income | 901 |
| | 1,038 |
|
| Other | 1,462 |
| | 2,074 |
|
| Gross deferred tax liabilities | 15,520 |
| | 15,212 |
|
| Net deferred tax assets | $ | 33,038 |
| | $ | 31,999 |
|
The table below summarizes the deferred tax assets and related valuation allowances recognized for the net operating lossNOL and tax credit carryforwards at December 31, 20112012.
| | | | | | | | | | | | | | | |
| NOL and Tax Credit Carryforwards | | |
| Net Operating Loss and Tax Credit Carryforwards | | Net Operating Loss and Tax Credit Carryforwards |
| | | | | | | | | | | | | |
| (Dollars in millions) | Deferred Tax Asset | | Valuation Allowance | | Net
Deferred Tax Asset | | First Year Expiring | Deferred Tax Asset | | Valuation Allowance | | Net
Deferred Tax Asset | | First Year Expiring |
| Net operating losses – U.S. | $ | 5,088 |
| | $ | — |
| | $ | 5,088 |
| | After 2027 | $ | 4,911 |
| | $ | — |
| | $ | 4,911 |
| | After 2027 |
| Net operating losses – U.K. | 8,836 |
| | — |
| | 8,836 |
| | None (1) | 8,483 |
| | — |
| | 8,483 |
| | None (1) |
| Net operating losses – other non-U.S. | 383 |
| | (251 | ) | | 132 |
| | Various | 469 |
| | (296 | ) | | 173 |
| | Various |
Net operating losses – U.S. states (2) | 1,879 |
| | (915 | ) | | 964 |
| | Various | 2,136 |
| | (932 | ) | | 1,204 |
| | Various |
| General business credits | 2,327 |
| | — |
| | 2,327 |
| | After 2027 | 3,349 |
| | — |
| | 3,349 |
| | After 2027 |
| Foreign tax credits | 2,183 |
| | (246 | ) | | 1,937 |
| | After 2017 | 6,180 |
| | (271 | ) | | 5,909 |
| | After 2017 |
| |
(1) | The U.K. NOLsnet operating losses may be carried forward indefinitely. |
| |
(2) | The NOLsnet operating losses and related valuation allowances for U.S. states before considering the benefit of federal deductions were $2.93.3 billion and $1.4 billion. |
|
| | |
252256 Bank of America 20112012
| | |
The CorporationManagement concluded that no valuation allowance is necessary to reduce the U.K. NOLs,NOL carryforwards and U.S. NOL and general business credit carryforwards since estimated future taxable income will be sufficient to utilize these assets prior to their expiration. During 2011,The majority of the Corporation’s U.K. net deferred tax assets, which consist primarily of NOLs, are realizable by certain subsidiaries that have a recent history of cumulative losses. For the deferred tax assets of those subsidiaries, the cessation of certain business activities, changes to capital and funding, forecasts of business volumes and the indefinite period to carry forward NOLs represent significant positive evidence supporting management’s conclusion. However, significant changes to those estimates, such as changes that would be caused by a substantial and prolonged worsening of the condition of Europe’s capital markets, could lead management to reassess its U.K. valuation allowance decreased due to the utilization of the remaining acquired capital loss carryforward and increased primarily against net operating loss carryforwards in non-U.S. and state jurisdictions.conclusions.
At December 31, 2011 and 20102012, U.S. federal income taxes had not been provided on $18.5 billion and $17.917.2 billion of undistributed earnings of non-U.S. subsidiaries earned prior to 1987 and after 1997 that management has determined have been reinvested for an indefinite period of time. If the Corporation were to record a deferred tax liability associated with these undistributed earnings, were distributed, an additionalthe amount would be approximately $2.54.3 billion and $2.6 billion of tax expense, net of credits for non-U.S. taxes paid on such earnings and for the related non-U.S. withholding taxes, would have resulted as ofat December 31, 2011 and 20102012.
NOTE 2221 Fair Value Measurements
Under applicable accounting guidance, fair value is defined as the exchange price that would be received for an asset or paid to transfer a liability (an exit price) in the principal or most advantageous market for the asset or liability in an orderly transaction between market participants on the measurement date. The Corporation determines the fair values of its financial instruments based on the fair value hierarchy established under applicable accounting guidance which requires an entity to maximize the use of observable inputs and minimize the use of unobservable inputs when measuring fair value. There are three levels of inputs used to measure fair value. The Corporation conducts a review of its fair value hierarchy classifications on a quarterly basis. Transfers into or out of fair value hierarchy classifications are made if the significant inputs used in the financial models measuring the fair values of the assets and liabilities became unobservable or observable, respectively, in the current marketplace. These transfers are considered to be effective as of the beginning of the quarter in which they occur. For more information regarding the fair value hierarchy and how the Corporation measures fair value, see Note 1 – Summary of Significant Accounting Principles. The Corporation accounts for certain financial instruments under the fair value option. For more information, see Note 2322 – Fair Value Option.
Valuation Processes and Techniques
The Corporation has various processes and controls in place to ensure that fair value is reasonably estimated. A model validation policy governs the use and control of valuation models used to estimate fair value. This policy requires review and approval of models by personnel who are independent of the front office, and periodic re-assessments of models to ensure that they are continuing to perform as designed. In addition, detailed reviews of trading gains and losses are conducted on a daily basis by personnel who are independent of the front office. A price verification group, which is also independent of the front office, utilizes available market information including executed trades,
market prices and market-observable valuation model inputs to ensure that fair values are reasonably estimated. The Corporation performs due diligence procedures over third-party pricing service providers in order to support their use in the valuation process. Where market information is not available to support internal valuations, independent reviews of the valuations are performed and any material exposures are escalated through a management review process.
While the Corporation believes its valuation methods are appropriate and consistent with other market participants, the use of different methodologies or assumptions to determine the fair value of certain financial instruments could result in a different estimate of fair value at the reporting date.
During 2012, there were no changes to the valuation techniques that had, or are expected to have, a material impact on its consolidated financial position or results of operations.
Level 1, 2 and 3 Valuation Techniques
Financial instruments are considered Level 1 when the valuation is based on quoted prices in active markets for identical assets or liabilities. Level 2 financial instruments are valued using quoted prices for similar assets or liabilities, quoted prices in markets that are not active, or models using inputs that are observable or can be corroborated by observable market data for substantially the full term of the assets or liabilities. Financial instruments are considered Level 3 when their values are determined using pricing models, discounted cash flow methodologies or similar techniques, and at least one significant model assumption or input is unobservable and when determination of the fair value requires significant management judgment or estimation.
Trading Account Assets and Liabilities and Available-for-SaleAvailable-for-sale Debt Securities
The fair values of trading account assets and liabilities are primarily based on actively traded markets where prices are based on either direct market quotes or observed transactions. The fair values of AFS debt securities are generally based on quoted market prices or market prices for similar assets. Liquidity is a significant factor in the determination of the fair values of trading account assets
and liabilities and AFS debt securities. Market price quotes may not be readily available for some positions, or positions within a market sector where trading activity has slowed significantly or ceased. Some of these instruments are valued using a discounted cash flow model, which estimates the fair value of the securities using internal credit risk, interest rate and prepayment risk models that incorporate management’s best estimate of current key assumptions such as default rates, loss severity and prepayment rates. Principal and interest cash flows are discounted using an observable discount rate for similar instruments with adjustments that management believes a market participant would consider in determining fair value for the specific security. Other instruments are valued using a net asset value approach which considers the value of the underlying securities. Underlying assets are valued using external pricing services, where available, or matrix pricing based on the vintages and ratings. Situations of illiquidity generally are triggered by the market’s perception of credit uncertainty regarding a single company or a specific market sector. In these instances, fair value is determined based on limited available market information and other factors, principally from reviewing the issuer’s financial statements and changes in credit ratings made by one or more rating agencies.
Derivative Assets and Liabilities
The fair values of derivative assets and liabilities traded in the OTC market are determined using quantitative models that utilize multiple market inputs including interest rates, prices and indices to generate continuous yield or pricing curves and volatility factors to value the position. The majority of market inputs are actively quoted and can be validated through external sources, including brokers, market transactions and third-party pricing services. When third-party pricing services are used, the methods and assumptions used are reviewed by the Corporation. Estimation risk is greater for derivative asset and liability positions that are either option-based or have longer maturity dates where observable market inputs are less readily available, or are unobservable, in which case, quantitative-based extrapolations of rate, price or index scenarios are used in determining fair values. The fair values of derivative assets and liabilities include adjustments for market liquidity, counterparty credit quality and other instrument-specific factors, where appropriate. In addition, the Corporation incorporates within its fair value measurements of OTC derivatives a valuation adjustment to reflect the credit risk associated with the net position. Positions are netted by counterparty, and fair value for net long exposures is adjusted for counterparty credit risk while the fair value for net short exposures is adjusted for the Corporation’s own credit risk. An estimate of severity of loss is also used in the determination of fair value, primarily based on market data.
Loans and Loan Commitments
The fair values of loans and loan commitments are based on market prices, where available, or discounted cash flow analyses using market-based credit spreads of comparable debt instruments or credit derivatives of the specific borrower or comparable borrowers. Results of discounted cash flow calculations may be adjusted, as appropriate, to reflect other market conditions or the perceived credit risk of the borrower.
Mortgage Servicing Rights
The fair values of MSRs are determined using models that rely on estimates of prepayment rates, the resultant weighted-average lives of the MSRs and the OAS levels. For more information on MSRs, see Note 2524 – Mortgage Servicing Rights.
Loans Held-for-SaleHeld-for-sale
The fair values of LHFS are based on quoted market prices, where available, or are determined by discounting estimated cash flows using interest rates approximating the Corporation’s current origination rates for similar loans adjusted to reflect the inherent credit risk.
Other Assets
The fair values of certain debt securities and AFS marketable equity securities are generally based on quoted market prices or market prices for similar assets. However, non-public investments are initially valued at the transaction price and subsequently adjusted when evidence is available to support such adjustments.
Securities Financing Agreements
The fair values of certain reverse repurchase agreements, repurchase agreements and securities borrowed transactions are determined using quantitative models, including discounted cash flow models that require the use of multiple market inputs including interest rates and spreads to generate continuous yield or pricing curves, and volatility factors. The majority of market inputs are actively quoted and can be validated through external sources, including brokers, market transactions and third-party pricing services.
Deposits and Other Short-term Borrowings
The fair values of deposits and other short-term borrowings are determined using quantitative models, including discounted cash flow models that require the use of multiple market inputs including interest rates and spreads to generate continuous yield or pricing curves, and volatility factors. The majority of market inputs are actively quoted and can be validated through external sources, including brokers, market transactions and third-party pricing services. The Corporation considers the impact of its own credit spreads in the valuation of these liabilities. The credit risk is determined by reference to observable credit spreads in the secondary cash market.
Long-term Debt
The Corporation issues structured liabilities that have coupons or repayment terms linked to the performance of debt or equity securities, indices, currencies or commodities. The fair values of these structured liabilities are estimated using valuationquantitative models for the combined derivative and debt portions of the notes. These models incorporate observable and, in some instances, unobservable inputs including security prices, interest rate yield curves, option volatility, currency, commodity or equity rates and correlations between these inputs. The Corporation also considers the impact of its own credit spreads in determining the valuation ofdiscount rate used to value these liabilities. The credit riskspread is determined by reference to observable credit spreads in the secondary bond market.
Asset-backed Secured Financings
The fair values of asset-backed secured financings are based on external broker bids, where available, or are determined by discounting estimated cash flows using interest rates approximating the Corporation’s current origination rates for similar loans adjusted to reflect the inherent credit risk.
|
| | |
254258 Bank of America 20112012
| | |
Recurring Fair Value
Assets and liabilities carried at fair value on a recurring basis at December 31, 20112012 and 20102011, including financial instruments which the Corporation accounts for under the fair value option, are summarized in the following tables.
| | | | | | | | | | | | | | | | | | | | | |
| | December 31, 2011 | December 31, 2012 |
| | Fair Value Measurements | | | | | Fair Value Measurements | | | | |
| (Dollars in millions) | Level 1 (1) | | Level 2 (1) | | Level 3 | | Netting Adjustments (2) | | Assets/Liabilities at Fair Value | Level 1 (1) | | Level 2 (1) | | Level 3 | | Netting Adjustments (2) | | Assets/Liabilities at Fair Value |
| Assets | |
| | |
| | |
| | |
| | |
| |
| | |
| | |
| | |
| | |
|
| Federal funds sold and securities borrowed or purchased under agreements to resell | $ | — |
| | $ | 87,453 |
| | $ | — |
| | $ | — |
| | $ | 87,453 |
| $ | — |
| | $ | 98,670 |
| | $ | — |
| | $ | — |
| | $ | 98,670 |
|
| Trading account assets: | |
| | |
| | |
| | |
| | |
| |
| | |
| | |
| | |
| | |
|
| U.S. government and agency securities | 30,540 |
| | 22,073 |
| | — |
| | — |
| | 52,613 |
| 57,655 |
| | 29,319 |
| | — |
| | — |
| | 86,974 |
|
| Corporate securities, trading loans and other | 1,067 |
| | 28,624 |
| | 6,880 |
| | — |
| | 36,571 |
| 1,292 |
| | 32,882 |
| | 3,726 |
| | — |
| | 37,900 |
|
| Equity securities | 17,181 |
| | 5,949 |
| | 544 |
| | — |
| | 23,674 |
| 28,144 |
| | 14,626 |
| | 545 |
| | — |
| | 43,315 |
|
| Non-U.S. sovereign debt | 33,667 |
| | 8,937 |
| | 342 |
| | — |
| | 42,946 |
| 38,405 |
| | 13,439 |
| | 353 |
| | — |
| | 52,197 |
|
| Mortgage trading loans and ABS | — |
| | 9,826 |
| | 3,689 |
| | — |
| | 13,515 |
| — |
| | 11,905 |
| | 4,935 |
| | — |
| | 16,840 |
|
| Total trading account assets | 82,455 |
| | 75,409 |
| | 11,455 |
| | — |
| | 169,319 |
| 125,496 |
| | 102,171 |
| | 9,559 |
| | — |
| | 237,226 |
|
Derivative assets (3) | 2,186 |
| | 1,865,310 |
| | 14,366 |
| | (1,808,839 | ) | | 73,023 |
| 2,997 |
| | 1,372,398 |
| | 8,073 |
| | (1,329,971 | ) | | 53,497 |
|
| AFS debt securities: | |
| | |
| | |
| | |
| | |
| |
| | |
| | |
| | |
| | |
|
| U.S. Treasury securities and agency securities | 39,389 |
| | 3,475 |
| | — |
| | — |
| | 42,864 |
| 21,514 |
| | 2,958 |
| | — |
| | — |
| | 24,472 |
|
| Mortgage-backed securities: | |
| | |
| | |
| | |
| | |
| |
| | |
| | |
| | |
| | |
|
| Agency | — |
| | 142,526 |
| | 37 |
| | — |
| | 142,563 |
| — |
| | 188,149 |
| | — |
| | — |
| | 188,149 |
|
| Agency-collateralized mortgage obligations | — |
| | 44,999 |
| | — |
| | — |
| | 44,999 |
| — |
| | 37,538 |
| | — |
| | — |
| | 37,538 |
|
| Non-agency residential | — |
| | 13,907 |
| | 860 |
| | — |
| | 14,767 |
| — |
| | 9,494 |
| | — |
| | — |
| | 9,494 |
|
| Non-agency commercial | — |
| | 5,482 |
| | 40 |
| | — |
| | 5,522 |
| — |
| | 3,914 |
| | 10 |
| | — |
| | 3,924 |
|
| Non-U.S. securities | 1,664 |
| | 3,256 |
| | — |
| | — |
| | 4,920 |
| 2,637 |
| | 2,981 |
| | — |
| | — |
| | 5,618 |
|
| Corporate/Agency bonds | — |
| | 2,873 |
| | 162 |
| | — |
| | 3,035 |
| — |
| | 1,358 |
| | 92 |
| | — |
| | 1,450 |
|
| Other taxable securities | 20 |
| | 8,593 |
| | 4,265 |
| | — |
| | 12,878 |
| 20 |
| | 8,180 |
| | 3,928 |
| | — |
| | 12,128 |
|
| Tax-exempt securities | — |
| | 1,955 |
| | 2,648 |
| | — |
| | 4,603 |
| — |
| | 3,072 |
| | 1,061 |
| | — |
| | 4,133 |
|
| Total AFS debt securities | 41,073 |
| | 227,066 |
| | 8,012 |
| | — |
| | 276,151 |
| 24,171 |
| | 257,644 |
| | 5,091 |
| | — |
| | 286,906 |
|
| Loans and leases | — |
| | 6,060 |
| | 2,744 |
| | — |
| | 8,804 |
| — |
| | 6,715 |
| | 2,287 |
| | — |
| | 9,002 |
|
| Mortgage servicing rights | — |
| | — |
| | 7,378 |
| | — |
| | 7,378 |
| — |
| | — |
| | 5,716 |
| | — |
| | 5,716 |
|
| Loans held-for-sale | — |
| | 4,243 |
| | 3,387 |
| | — |
| | 7,630 |
| — |
| | 8,926 |
| | 2,733 |
| | — |
| | 11,659 |
|
| Other assets | 18,963 |
| | 13,886 |
| | 4,235 |
| | — |
| | 37,084 |
| 19,026 |
| | 18,828 |
| | 3,129 |
| | — |
| | 40,983 |
|
| Total assets | $ | 144,677 |
| | $ | 2,279,427 |
| | $ | 51,577 |
| | $ | (1,808,839 | ) | | $ | 666,842 |
| $ | 171,690 |
| | $ | 1,865,352 |
| | $ | 36,588 |
| | $ | (1,329,971 | ) | | $ | 743,659 |
|
| Liabilities | |
| | |
| | |
| | |
| | |
| |
| | |
| | |
| | |
| | |
|
| Interest-bearing deposits in U.S. offices | $ | — |
| | $ | 3,297 |
| | $ | — |
| | $ | — |
| | $ | 3,297 |
| $ | — |
| | $ | 2,262 |
| | $ | — |
| | $ | — |
| | $ | 2,262 |
|
| Federal funds purchased and securities loaned or sold under agreements to repurchase | — |
| | 34,235 |
| | — |
| | — |
| | 34,235 |
| — |
| | 42,639 |
| | — |
| | — |
| | 42,639 |
|
| Trading account liabilities: | |
| | |
| | |
| | |
| | | |
| | |
| | |
| | |
| | |
| U.S. government and agency securities | 19,120 |
| | 1,590 |
| | — |
| | — |
| | 20,710 |
| 22,351 |
| | 1,079 |
| | — |
| | — |
| | 23,430 |
|
| Equity securities | 13,259 |
| | 1,335 |
| | — |
| | — |
| | 14,594 |
| 19,852 |
| | 2,640 |
| | — |
| | — |
| | 22,492 |
|
| Non-U.S. sovereign debt | 16,760 |
| | 680 |
| | — |
| | — |
| | 17,440 |
| 18,875 |
| | 1,369 |
| | — |
| | — |
| | 20,244 |
|
| Corporate securities and other | 829 |
| | 6,821 |
| | 114 |
| | — |
| | 7,764 |
| 487 |
| | 6,870 |
| | 64 |
| | — |
| | 7,421 |
|
| Total trading account liabilities | 49,968 |
| | 10,426 |
| | 114 |
| | — |
| | 60,508 |
| 61,565 |
| | 11,958 |
| | 64 |
| | — |
| | 73,587 |
|
Derivative liabilities (3) | 2,055 |
| | 1,850,804 |
| | 8,500 |
| | (1,801,839 | ) | | 59,520 |
| 2,859 |
| | 1,355,309 |
| | 6,605 |
| | (1,318,757 | ) | | 46,016 |
|
| Other short-term borrowings | — |
| | 6,558 |
| | — |
| | — |
| | 6,558 |
| — |
| | 4,074 |
| | — |
| | — |
| | 4,074 |
|
| Accrued expenses and other liabilities | 13,832 |
| | 1,897 |
| | 14 |
| | — |
| | 15,743 |
| 15,457 |
| | 1,122 |
| | 15 |
| | — |
| | 16,594 |
|
| Long-term debt | — |
| | 43,296 |
| | 2,943 |
| | — |
| | 46,239 |
| — |
| | 46,860 |
| | 2,301 |
| | — |
| | 49,161 |
|
| Total liabilities | $ | 65,855 |
| | $ | 1,950,513 |
| | $ | 11,571 |
| | $ | (1,801,839 | ) | | $ | 226,100 |
| $ | 79,881 |
| | $ | 1,464,224 |
| | $ | 8,985 |
| | $ | (1,318,757 | ) | | $ | 234,333 |
|
| |
(1) | Gross transfers betweenDuring 2012, $2.0 billion and $350 million of assets and liabilities were transferred from Level 1 andto Level 2, and $785 million and $40 million of assets and liabilities were not significanttransferred from Level 2 to Level 1. Of the asset transfers from Level 1 to Level 2, $940 million was due to a restriction that became effective for a private equity investment during 2012, while 2011$535 million. of the transfers from Level 2 to Level 1 was due to the lapse of this restriction during 2012. The remaining transfers were the result of additional information associated with certain equities, derivative contracts and private equity investments.
|
| |
(2) | Amounts represent the impact of legally enforceable master netting agreements and also cash collateral held or placed with the same counterparties. |
| |
(3) | For further disaggregation of derivative assets and liabilities, see Note 43 – Derivatives. |
|
| | |
| | | Bank of America 2012 255259 |
| | | | | | | | | | | | | | | | | | | | | |
| | December 31, 2010 | December 31, 2011 |
| | Fair Value Measurements | | | | | Fair Value Measurements | | | | |
| (Dollars in millions) | Level 1 (1) | | Level 2 (1) | | Level 3 | | Netting Adjustments (2) | | Assets/Liabilities at Fair Value | Level 1 (1) | | Level 2 (1) | | Level 3 | | Netting Adjustments (2) | | Assets/Liabilities at Fair Value |
| Assets | |
| | |
| | |
| | |
| | |
| |
| | |
| | |
| | |
| | |
|
| Federal funds sold and securities borrowed or purchased under agreements to resell | $ | — |
| | $ | 78,599 |
| | $ | — |
| | $ | — |
| | $ | 78,599 |
| $ | — |
| | $ | 87,453 |
| | $ | — |
| | $ | — |
| | $ | 87,453 |
|
| Trading account assets: | |
| | |
| | |
| | |
| | |
| |
| | |
| | |
| | |
| | |
|
| U.S. government and agency securities | 28,237 |
| | 32,574 |
| | — |
| | — |
| | 60,811 |
| 30,540 |
| | 22,073 |
| | — |
| | — |
| | 52,613 |
|
| Corporate securities, trading loans and other | 732 |
| | 40,869 |
| | 7,751 |
| | — |
| | 49,352 |
| 1,067 |
| | 28,624 |
| | 6,880 |
| | — |
| | 36,571 |
|
| Equity securities | 23,249 |
| | 8,257 |
| | 623 |
| | — |
| | 32,129 |
| 17,181 |
| | 5,949 |
| | 544 |
| | — |
| | 23,674 |
|
| Non-U.S. sovereign debt | 24,934 |
| | 8,346 |
| | 243 |
| | — |
| | 33,523 |
| 33,667 |
| | 8,937 |
| | 342 |
| | — |
| | 42,946 |
|
| Mortgage trading loans and ABS | — |
| | 11,948 |
| | 6,908 |
| | — |
| | 18,856 |
| — |
| | 9,826 |
| | 3,689 |
| | — |
| | 13,515 |
|
| Total trading account assets | 77,152 |
| | 101,994 |
| | 15,525 |
| | — |
| | 194,671 |
| 82,455 |
| | 75,409 |
| | 11,455 |
| | — |
| | 169,319 |
|
Derivative assets (3) | 2,627 |
| | 1,516,244 |
| | 18,773 |
| | (1,464,644 | ) | | 73,000 |
| 2,186 |
| | 1,865,310 |
| | 14,366 |
| | (1,808,839 | ) | | 73,023 |
|
| AFS debt securities: | |
| | |
| | |
| | |
| | |
| |
| | |
| | |
| | |
| | |
|
| U.S. Treasury securities and agency securities | 46,003 |
| | 3,102 |
| | — |
| | — |
| | 49,105 |
| 39,389 |
| | 3,475 |
| | — |
| | — |
| | 42,864 |
|
| Mortgage-backed securities: | |
| | |
| | |
| | |
| | |
| |
| | |
| | |
| | |
| | |
|
| Agency | — |
| | 191,213 |
| | 4 |
| | — |
| | 191,217 |
| — |
| | 142,526 |
| | 37 |
| | — |
| | 142,563 |
|
| Agency-collateralized mortgage obligations | — |
| | 37,017 |
| | — |
| | — |
| | 37,017 |
| — |
| | 44,999 |
| | — |
| | — |
| | 44,999 |
|
| Non-agency residential | — |
| | 21,649 |
| | 1,468 |
| | — |
| | 23,117 |
| — |
| | 13,907 |
| | 860 |
| | — |
| | 14,767 |
|
| Non-agency commercial | — |
| | 6,833 |
| | 19 |
| | — |
| | 6,852 |
| — |
| | 5,482 |
| | 40 |
| | — |
| | 5,522 |
|
| Non-U.S. securities | 1,440 |
| | 2,696 |
| | 3 |
| | — |
| | 4,139 |
| 1,664 |
| | 3,256 |
| | — |
| | — |
| | 4,920 |
|
| Corporate/Agency bonds | — |
| | 5,154 |
| | 137 |
| | — |
| | 5,291 |
| — |
| | 2,873 |
| | 162 |
| | — |
| | 3,035 |
|
| Other taxable securities | 20 |
| | 2,354 |
| | 13,018 |
| | — |
| | 15,392 |
| 20 |
| | 8,593 |
| | 4,265 |
| | — |
| | 12,878 |
|
| Tax-exempt securities | — |
| | 4,273 |
| | 1,224 |
| | — |
| | 5,497 |
| — |
| | 1,955 |
| | 2,648 |
| | — |
| | 4,603 |
|
| Total AFS debt securities | 47,463 |
| | 274,291 |
| | 15,873 |
| | — |
| | 337,627 |
| 41,073 |
| | 227,066 |
| | 8,012 |
| | — |
| | 276,151 |
|
| Loans and leases | — |
| | — |
| | 3,321 |
| | — |
| | 3,321 |
| — |
| | 6,060 |
| | 2,744 |
| | — |
| | 8,804 |
|
| Mortgage servicing rights | — |
| | — |
| | 14,900 |
| | — |
| | 14,900 |
| — |
| | — |
| | 7,378 |
| | — |
| | 7,378 |
|
| Loans held-for-sale | — |
| | 21,802 |
| | 4,140 |
| | — |
| | 25,942 |
| — |
| | 4,243 |
| | 3,387 |
| | — |
| | 7,630 |
|
| Other assets | 32,624 |
| | 31,051 |
| | 6,856 |
| | — |
| | 70,531 |
| 18,963 |
| | 13,886 |
| | 4,235 |
| | — |
| | 37,084 |
|
| Total assets | $ | 159,866 |
| | $ | 2,023,981 |
| | $ | 79,388 |
| | $ | (1,464,644 | ) | | $ | 798,591 |
| $ | 144,677 |
| | $ | 2,279,427 |
| | $ | 51,577 |
| | $ | (1,808,839 | ) | | $ | 666,842 |
|
| Liabilities | |
| | |
| | |
| | |
| | |
| |
| | |
| | |
| | |
| | |
|
| Interest-bearing deposits in U.S. offices | $ | — |
| | $ | 2,732 |
| | $ | — |
| | $ | — |
| | $ | 2,732 |
| $ | — |
| | $ | 3,297 |
| | $ | — |
| | $ | — |
| | $ | 3,297 |
|
| Federal funds purchased and securities loaned or sold under agreements to repurchase | — |
| | 37,424 |
| | — |
| | — |
| | 37,424 |
| — |
| | 34,235 |
| | — |
| | — |
| | 34,235 |
|
| Trading account liabilities: | |
| | |
| | |
| | |
| | | |
| | |
| | |
| | |
| | |
| U.S. government and agency securities | 23,357 |
| | 5,983 |
| | — |
| | — |
| | 29,340 |
| 19,120 |
| | 1,590 |
| | — |
| | — |
| | 20,710 |
|
| Equity securities | 14,568 |
| | 914 |
| | — |
| | — |
| | 15,482 |
| 13,259 |
| | 1,335 |
| | — |
| | — |
| | 14,594 |
|
| Non-U.S. sovereign debt | 14,748 |
| | 1,065 |
| | — |
| | — |
| | 15,813 |
| 16,760 |
| | 680 |
| | — |
| | — |
| | 17,440 |
|
| Corporate securities and other | 224 |
| | 11,119 |
| | 7 |
| | — |
| | 11,350 |
| 829 |
| | 6,821 |
| | 114 |
| | — |
| | 7,764 |
|
| Total trading account liabilities | 52,897 |
| | 19,081 |
| | 7 |
| | — |
| | 71,985 |
| 49,968 |
| | 10,426 |
| | 114 |
| | — |
| | 60,508 |
|
Derivative liabilities (3) | 1,799 |
| | 1,492,963 |
| | 11,028 |
| | (1,449,876 | ) | | 55,914 |
| 2,055 |
| | 1,850,804 |
| | 8,500 |
| | (1,801,839 | ) | | 59,520 |
|
| Other short-term borrowings | — |
| | 6,472 |
| | 706 |
| | — |
| | 7,178 |
| — |
| | 6,558 |
| | — |
| | — |
| | 6,558 |
|
| Accrued expenses and other liabilities | 31,470 |
| | 931 |
| | 828 |
| | — |
| | 33,229 |
| 13,832 |
| | 1,897 |
| | 14 |
| | — |
| | 15,743 |
|
| Long-term debt | — |
| | 47,998 |
| | 2,986 |
| | — |
| | 50,984 |
| — |
| | 43,296 |
| | 2,943 |
| | — |
| | 46,239 |
|
| Total liabilities | $ | 86,166 |
| | $ | 1,607,601 |
| | $ | 15,555 |
| | $ | (1,449,876 | ) | | $ | 259,446 |
| $ | 65,855 |
| | $ | 1,950,513 |
| | $ | 11,571 |
| | $ | (1,801,839 | ) | | $ | 226,100 |
|
| |
(1) | Gross transfers between Level 1 and Level 2 were approximately $1.3 billionduring 20102011. were not significant. |
| |
(2) | Amounts represent the impact of legally enforceable master netting agreements and also cash collateral held or placed with the same counterparties. |
| |
(3) | For further disaggregation of derivative assets and liabilities, see Note 43 – Derivatives. |
|
| | |
256260 Bank of America 20112012
| | |
The following tables present a reconciliation of all assets and liabilities measured at fair value on a recurring basis using significant unobservable inputs (Level 3) during 20112012, 20102011 and 20092010, including net realized and unrealized gains (losses) included in earnings and accumulated OCI.
| | | | | |
Level 3 – Fair Value Measurements (1) | Level 3 – Fair Value Measurements (1) | | Level 3 – Fair Value Measurements (1) | |
| | | |
| | 2011 | 2012 |
| | | Gross | | | Gross | |
| (Dollars in millions) | Balance
January 1 2011 | Consolidation of VIEs | Gains
(Losses)
in Earnings | Gains
(Losses)
in OCI | Purchases | Sales | Issuances | Settlements | Gross
Transfers
into Level 3 | Gross
Transfers
out of Level 3 | Balance
December 31 2011 | Balance
January 1 2012 | Gains
(Losses)
in Earnings | Gains
(Losses)
in OCI | Purchases | Sales | Issuances | Settlements | Gross
Transfers
into Level 3 | Gross
Transfers
out of Level 3 | Balance December 31 2012 |
| Trading account assets: | |
| |
| |
| |
| |
| | |
| |
| |
| |
| |
| |
| |
| | |
| |
| |
|
Corporate securities, trading loans and other (2) | $ | 7,751 |
| $ | — |
| $ | 490 |
| $ | — |
| $ | 5,683 |
| $ | (6,664 | ) | $ | — |
| $ | (1,362 | ) | $ | 1,695 |
| $ | (713 | ) | $ | 6,880 |
| $ | 6,880 |
| $ | 195 |
| $ | — |
| $ | 2,798 |
| $ | (4,556 | ) | $ | — |
| $ | (1,077 | ) | $ | 436 |
| $ | (950 | ) | $ | 3,726 |
|
| Equity securities | 557 |
| — |
| 49 |
| — |
| 335 |
| (362 | ) | — |
| (140 | ) | 132 |
| (27 | ) | 544 |
| 544 |
| 31 |
| — |
| 201 |
| (271 | ) | — |
| 27 |
| 90 |
| (77 | ) | 545 |
|
| Non-U.S. sovereign debt | 243 |
| — |
| 87 |
| — |
| 188 |
| (137 | ) | — |
| (3 | ) | 8 |
| (44 | ) | 342 |
| 342 |
| 8 |
| — |
| 388 |
| (359 | ) | — |
| (5 | ) | — |
| (21 | ) | 353 |
|
Mortgage trading loans and ABS | 6,908 |
| — |
| 442 |
| — |
| 2,222 |
| (4,713 | ) | — |
| (440 | ) | 75 |
| (805 | ) | 3,689 |
| 3,689 |
| 215 |
| — |
| 2,574 |
| (1,536 | ) | — |
| (678 | ) | 844 |
| (173 | ) | 4,935 |
|
| Total trading account assets | 15,459 |
| — |
| 1,068 |
| — |
| 8,428 |
| (11,876 | ) | — |
| (1,945 | ) | 1,910 |
| (1,589 | ) | 11,455 |
| 11,455 |
| 449 |
| — |
| 5,961 |
| (6,722 | ) | — |
| (1,733 | ) | 1,370 |
| (1,221 | ) | 9,559 |
|
Net derivative assets (3) | 7,745 |
| — |
| 5,199 |
| — |
| 1,235 |
| (1,553 | ) | — |
| (7,779 | ) | 1,199 |
| (180 | ) | 5,866 |
| 5,866 |
| (221 | ) | — |
| 893 |
| (1,012 | ) | — |
| (3,328 | ) | (269 | ) | (461 | ) | 1,468 |
|
| AFS debt securities: | |
| |
| |
| |
| |
| |
| |
| |
| |
| |
| |
| |
| |
| |
| |
| |
| |
| |
| |
| |
| |
|
| Mortgage-backed securities: | |
| |
| |
| |
| |
| |
| |
| |
| |
| |
| |
| |
| |
| |
| |
| |
| |
| |
| |
| |
| |
|
| Agency | 4 |
| — |
| — |
| — |
| 14 |
| (11 | ) | — |
| — |
| 34 |
| (4 | ) | 37 |
| 37 |
| — |
| — |
| — |
| — |
| — |
| (4 | ) | — |
| (33 | ) | — |
|
| Agency-collateralized mortgage obligations | — |
| — |
| — |
| — |
| 56 |
| (56 | ) | — |
| — |
| — |
| — |
| — |
| |
| Non-agency residential | 1,468 |
| — |
| (158 | ) | 41 |
| 11 |
| (307 | ) | — |
| (568 | ) | 373 |
| — |
| 860 |
| 860 |
| (69 | ) | 19 |
| — |
| (306 | ) | — |
| (2 | ) | — |
| (502 | ) | — |
|
| Non-agency commercial | 19 |
| — |
| — |
| — |
| 15 |
| — |
| — |
| — |
| 6 |
| — |
| 40 |
| 40 |
| — |
| — |
| — |
| (24 | ) | — |
| (6 | ) | — |
| — |
| 10 |
|
| Non-U.S. securities | 3 |
| — |
| — |
| — |
| — |
| — |
| — |
| — |
| 88 |
| (91 | ) | — |
| |
| Corporate/Agency bonds | 137 |
| — |
| (12 | ) | (8 | ) | 304 |
| (17 | ) | — |
| — |
| 7 |
| (249 | ) | 162 |
| 162 |
| (2 | ) | — |
| (2 | ) | — |
| — |
| (39 | ) | — |
| (27 | ) | 92 |
|
| Other taxable securities | 13,018 |
| — |
| 26 |
| 21 |
| 3,876 |
| (2,245 | ) | — |
| (5,112 | ) | 2 |
| (5,321 | ) | 4,265 |
| 4,265 |
| 23 |
| 26 |
| 3,196 |
| (28 | ) | — |
| (3,345 | ) | — |
| (209 | ) | 3,928 |
|
| Tax-exempt securities | 1,224 |
| — |
| 21 |
| (35 | ) | 2,862 |
| (92 | ) | — |
| (697 | ) | 38 |
| (673 | ) | 2,648 |
| 2,648 |
| 61 |
| 20 |
| — |
| (133 | ) | — |
| (1,535 | ) | — |
| — |
| 1,061 |
|
| Total AFS debt securities | 15,873 |
| — |
| (123 | ) | 19 |
| 7,138 |
| (2,728 | ) | — |
| (6,377 | ) | 548 |
| (6,338 | ) | 8,012 |
| 8,012 |
| 13 |
| 65 |
| 3,194 |
| (491 | ) | — |
| (4,931 | ) | — |
| (771 | ) | 5,091 |
|
Loans and leases (2, 4) | 3,321 |
| 5,194 |
| (55 | ) | — |
| 21 |
| (2,644 | ) | 3,118 |
| (1,830 | ) | 5 |
| (4,386 | ) | 2,744 |
| |
Mortgage servicing rights (4) | 14,900 |
| — |
| (5,661 | ) | — |
| — |
| (896 | ) | 1,656 |
| (2,621 | ) | — |
| — |
| 7,378 |
| |
Loans held-for-sale (2) | 4,140 |
| — |
| 36 |
| — |
| 157 |
| (483 | ) | — |
| (961 | ) | 565 |
| (67 | ) | 3,387 |
| |
Other assets (5) | 6,922 |
| — |
| 140 |
| — |
| 1,932 |
| (2,391 | ) | — |
| (768 | ) | 375 |
| (1,975 | ) | 4,235 |
| |
Loans and leases (4, 5) | | 2,744 |
| 334 |
| — |
| 564 |
| (1,520 | ) | — |
| (274 | ) | 450 |
| (11 | ) | 2,287 |
|
Mortgage servicing rights (5) | | 7,378 |
| (430 | ) | — |
| — |
| (122 | ) | 374 |
| (1,484 | ) | — |
| — |
| 5,716 |
|
Loans held-for-sale (4) | | 3,387 |
| 352 |
| — |
| 794 |
| (834 | ) | — |
| (414 | ) | 80 |
| (632 | ) | 2,733 |
|
Other assets (6) | | 4,235 |
| (54 | ) | — |
| 109 |
| (1,039 | ) | 270 |
| (381 | ) | — |
| (11 | ) | 3,129 |
|
| Trading account liabilities – Corporate securities and other | (7 | ) | — |
| 4 |
| — |
| 133 |
| (189 | ) | — |
| — |
| (65 | ) | 10 |
| (114 | ) | (114 | ) | 4 |
| — |
| 116 |
| (136 | ) | — |
| 80 |
| (68 | ) | 54 |
| (64 | ) |
Other short-term borrowings (2) | (706 | ) | — |
| (30 | ) | — |
| — |
| — |
| — |
| 86 |
| — |
| 650 |
| — |
| |
Accrued expenses and other liabilities (2) | (828 | ) | — |
| 61 |
| — |
| — |
| (2 | ) | (9 | ) | 3 |
| — |
| 761 |
| (14 | ) | |
Long-term debt (2) | (2,986 | ) | — |
| (188 | ) | — |
| 520 |
| (72 | ) | (520 | ) | 838 |
| (2,111 | ) | 1,576 |
| (2,943 | ) | |
Other short-term borrowings (4) | | — |
| — |
| — |
| — |
| — |
| (232 | ) | 232 |
| — |
| — |
| — |
|
Accrued expenses and other liabilities (4) | | (14 | ) | (4 | ) | — |
| 8 |
| — |
| (9 | ) | — |
| — |
| 4 |
| (15 | ) |
Long-term debt (4) | | (2,943 | ) | (307 | ) | — |
| 290 |
| (33 | ) | (259 | ) | 1,239 |
| (2,040 | ) | 1,752 |
| (2,301 | ) |
| |
(1) | Assets (liabilities). For assets, increase / (decrease) to Level 3 and for liabilities, (increase) / decrease to Level 3. |
| |
(2) | During 2012, approximately $900 million was reclassified from Trading account assets - Corporate securities, trading loans and other to Trading account assets - Mortgage trading loans and ABS. In the table above, this reclassification is presented as a sale of Trading account assets - Corporate securities, trading loans and other and as a purchase of Trading account assets - Mortgage trading loans and ABS. |
| |
(3) | Net derivatives include derivative assets of $8.1 billion and derivative liabilities of $6.6 billion. |
| |
(4) | Amounts represent itemsinstruments that are accounted for under the fair value option. |
| |
(3)(5)
| Issuances represent loan originations and mortgage servicing rights retained following securitizations or whole loan sales. |
| |
(6) | Other assets is primarily comprised of net monoline exposure to a single counterparty and private equity investments. |
During 2012, the transfers into Level 3 included $1.4 billion of trading account assets, $269 million of net derivative assets, $450 million of loans and leases, and $2.0 billion of long-term debt. Transfers into Level 3 for trading account assets were primarily the result of decreased market liquidity for certain corporate loans and updated information related to certain CLOs. Transfers into Level 3 for net derivative assets primarily related to decreased price observability for certain long-dated equity derivative liabilities due to a lack of independent pricing. Transfers into Level 3 for loans and leases were due to updated information related to certain commercial loans. Transfers into Level 3 for long-term debt were primarily due to changes in the impact of unobservable inputs on the value of certain structured liabilities. Transfers occur on a regular basis for these long-term debt instruments due to changes in the impact of unobservable inputs on the value of the embedded derivative in relation to the instrument as a whole.
During 2012, the transfers out of Level 3 included $1.2 billion of trading account assets, $461 million of net derivative assets, $771 million of AFS debt securities, $632 million of LHFS and $1.8 billion of long-term debt. Transfers out of Level 3 for trading account assets primarily related to increased market liquidity for certain corporate and commercial real estate loans. Transfers out of Level 3 for net derivative assets primarily related to increased price observability (i.e., market comparables for the referenced instruments) for certain total return swaps and foreign exchange swaps. Transfers out of Level 3 for AFS debt securities primarily related to increased price observability for certain non-agency RMBS and ABS. Transfers out of Level 3 for LHFS primarily related to increased observable inputs, primarily liquid comparables. Transfers out of Level 3 for long-term debt were primarily due to changes in the impact of unobservable inputs on the value of certain structured liabilities.
|
| | | | | | | | | | | | | | | | | | | | | | | | | | | | | | | | | |
| | | | | | | | | | | | |
Level 3 – Fair Value Measurements (1) | | | | | | | |
| | | | | | | | | | | | |
| | 2011 |
| | | | | | Gross | | | |
| (Dollars in millions) | Balance
January 1 2011 | Consolidation of VIEs | Gains
(Losses)
in Earnings | Gains
(Losses)
in OCI | Purchases | Sales | Issuances | Settlements | Gross
Transfers
into Level 3 | Gross
Transfers
out of Level 3 | Balance
December 31 2011 |
| Trading account assets: | |
| |
| |
| |
| | | | |
| | |
| |
|
| Corporate securities, trading loans and other | $ | 7,751 |
| $ | — |
| $ | 490 |
| $ | — |
| $ | 5,683 |
| $ | (6,664 | ) | $ | — |
| $ | (1,362 | ) | $ | 1,695 |
| $ | (713 | ) | $ | 6,880 |
|
| Equity securities | 557 |
| — |
| 49 |
| — |
| 335 |
| (362 | ) | — |
| (140 | ) | 132 |
| (27 | ) | 544 |
|
| Non-U.S. sovereign debt | 243 |
| — |
| 87 |
| — |
| 188 |
| (137 | ) | — |
| (3 | ) | 8 |
| (44 | ) | 342 |
|
| Mortgage trading loans and ABS | 6,908 |
| — |
| 442 |
| — |
| 2,222 |
| (4,713 | ) | — |
| (440 | ) | 75 |
| (805 | ) | 3,689 |
|
| Total trading account assets | 15,459 |
| — |
| 1,068 |
| — |
| 8,428 |
| (11,876 | ) | — |
| (1,945 | ) | 1,910 |
| (1,589 | ) | 11,455 |
|
Net derivative assets (2) | 7,745 |
| — |
| 5,199 |
| — |
| 1,235 |
| (1,553 | ) | — |
| (7,779 | ) | 1,199 |
| (180 | ) | 5,866 |
|
| AFS debt securities: | |
| |
| |
| |
| | | | |
| |
| |
| |
|
| Mortgage-backed securities: | | | | | | | | | | | |
| Agency | 4 |
| — |
| — |
| — |
| 14 |
| (11 | ) | — |
| — |
| 34 |
| (4 | ) | 37 |
|
| Agency collateralized mortgage obligations | — |
| — |
| — |
| — |
| 56 |
| (56 | ) | — |
| — |
| — |
| — |
| — |
|
| Non-agency residential | 1,468 |
| — |
| (158 | ) | 41 |
| 11 |
| (307 | ) | — |
| (568 | ) | 373 |
| — |
| 860 |
|
| Non-agency commercial | 19 |
| — |
| — |
| — |
| 15 |
| — |
| — |
| — |
| 6 |
| — |
| 40 |
|
| Non-U.S. securities | 3 |
| — |
| — |
| — |
| — |
| — |
| — |
| — |
| 88 |
| (91 | ) | — |
|
| Corporate/Agency bonds | 137 |
| — |
| (12 | ) | (8 | ) | 304 |
| (17 | ) | — |
| — |
| 7 |
| (249 | ) | 162 |
|
| Other taxable securities | 13,018 |
| — |
| 26 |
| 21 |
| 3,876 |
| (2,245 | ) | — |
| (5,112 | ) | 2 |
| (5,321 | ) | 4,265 |
|
| Tax-exempt securities | 1,224 |
| — |
| 21 |
| (35 | ) | 2,862 |
| (92 | ) | — |
| (697 | ) | 38 |
| (673 | ) | 2,648 |
|
| Total AFS debt securities | 15,873 |
| — |
| (123 | ) | 19 |
| 7,138 |
| (2,728 | ) | — |
| (6,377 | ) | 548 |
| (6,338 | ) | 8,012 |
|
Loans and leases (3, 4) | 3,321 |
| 5,194 |
| (55 | ) | — |
| 21 |
| (2,644 | ) | 3,118 |
| (1,830 | ) | 5 |
| (4,386 | ) | 2,744 |
|
Mortgage servicing rights (4) | 14,900 |
| — |
| (5,661 | ) | — |
| — |
| (896 | ) | 1,656 |
| (2,621 | ) | — |
| — |
| 7,378 |
|
Loans held-for-sale (3) | 4,140 |
| — |
| 36 |
| — |
| 157 |
| (483 | ) | — |
| (961 | ) | 565 |
| (67 | ) | 3,387 |
|
Other assets (5) | 6,922 |
| — |
| 140 |
| — |
| 1,932 |
| (2,391 | ) | — |
| (768 | ) | 375 |
| (1,975 | ) | 4,235 |
|
| Trading account liabilities – Corporate securities and other | (7 | ) | — |
| 4 |
| — |
| 133 |
| (189 | ) | — |
| — |
| (65 | ) | 10 |
| (114 | ) |
Other short-term borrowings (3) | (706 | ) | — |
| (30 | ) | — |
| — |
| — |
| — |
| 86 |
| — |
| 650 |
| — |
|
Accrued expenses and other liabilities (3) | (828 | ) | — |
| 61 |
| — |
| — |
| (2 | ) | (9 | ) | 3 |
| — |
| 761 |
| (14 | ) |
Long-term debt (3) | (2,986 | ) | — |
| (188 | ) | — |
| 520 |
| (72 | ) | (520 | ) | 838 |
| (2,111 | ) | 1,576 |
| (2,943 | ) |
| |
(1) | Assets (liabilities). For assets, increase / (decrease) to Level 3 and for liabilities, (increase) / decrease to Level 3. |
| |
(2) | Net derivatives at December 31, 2011 include derivative assets of $14.4 billion and derivative liabilities of $8.5 billion. |
| |
(3) | Amounts represent instruments that are accounted for under the fair value option. |
| |
(4) | Issuances represent loan originations and mortgage servicing rights retained following securitizations or whole loan sales. |
| |
(5) | Other assets is primarily comprised of net monoline exposure to a single counterparty and private equity investments. |
During 2011, the transfers into Level 3 included $1.9 billion of trading account assets, $1.2 billion of net derivative assets and $2.1 billion of long-term debt accounted for under the fair value option.debt. Transfers into Level 3 for trading account assets were primarily certain CLOs, corporate loans and bonds whichthat were transferred due to decreased market activity. Transfers into Level 3 for net derivative assets were the result of changes in the valuation methodology for certain total return swaps, in addition to increases in certain equity derivatives with significant unobservable inputs. Transfers into Level 3 for long-term debt were primarily due to changes in the impact of unobservable inputs on the value of certain structured liabilities. Transfers occur on a regular basis for these long-term debt instruments baseddue to changes in the impact of unobservable inputs on the fair value of the embedded derivative in relation to the instrument as a whole.
During 2011, the transfers out of Level 3 included $1.6 billion of trading account assets, $6.3 billion of AFS debt securities, $4.4 billion of loans and leases, $2.0 billion of other assets and $1.6
billion of long-term debt. Transfers out of Level 3 for trading account assets were primarily driven bydue to increased price observability on certain RMBS, commercial mortgage-backed securities (CMBS) and consumer ABS portfolios, as well as certain corporate bond positions due to increased trading volume. Transfers out of Level 3 for AFS debt securities primarily related to auto, credit card and student loan ABS portfolios due to increased trading volume in the secondary market for similar securities. Transfers out of Level 3 for loans and leases were driven bydue to increased observable inputs, primarily marketliquid comparables, for certain corporate loans accounted for under the fair value option.loans. Transfers out of Level 3 for other assets were primarily the result of an initial public offeringIPO of an equity investment. Transfers out of Level 3 for long-term debt were primarily due to changes in the impact of unobservable inputs on the value of certain structured liabilities. Transfers occur on a regular basis for these long-term debt instruments based on the fair value of the embedded derivative in relation to the instrument as a whole.
|
| | |
262 Bank of America 2012 | | Bank of America257
|
| | | | | | | | | | | | | | | | | | | | | | | | | | | | | | | | | |
Level 3 – Fair Value Measurements (1) | Level 3 – Fair Value Measurements (1) | | | | | | | | | Level 3 – Fair Value Measurements (1) | | | | | | | | | | |
| | | | | | | | | | | | | | | | | | | | | | | | | | | | �� | | | |
| | 2010 | 2010 |
| (Dollars in millions) | Balance
January 1 2010 | | Consolidation of VIEs | | Gains
(Losses)
in Earnings | | Gains
(Losses)
in OCI | | Purchases,
Issuances and Settlements | | Gross
Transfers
into Level 3 | | Gross
Transfers
out of Level 3 | | Balance
December 31 2010 | Balance
January 1 2010 | | Consolidation of VIEs | | Gains
(Losses) in Earnings | | Gains
(Losses) in OCI | | Purchases,
Issuances and Settlements | | Gross Transfers into Level 3 | | Gross Transfers
out of Level 3 | | Balance
December 31 2010 |
| Trading account assets: | |
| | |
| | |
| | |
| | |
| | | | |
| | |
| | | | | | | | | | | | | | | |
Corporate securities, trading loans and other (2) | $ | 11,080 |
| | $ | 117 |
| | $ | 848 |
| | $ | — |
| | $ | (4,852 | ) | | $ | 2,599 |
| | $ | (2,041 | ) | | $ | 7,751 |
| $ | 11,080 |
| | $ | 117 |
| | $ | 848 |
| | $ | — |
| | $ | (4,852 | ) | | $ | 2,599 |
| | $ | (2,041 | ) | | $ | 7,751 |
|
| Equity securities | 1,084 |
| | — |
| | (81 | ) | | — |
| | (342 | ) | | 131 |
| | (169 | ) | | 623 |
| 1,084 |
| | — |
| | (81 | ) | | — |
| | (342 | ) | | 131 |
| | (169 | ) | | 623 |
|
| Non-U.S. sovereign debt | 1,143 |
| | — |
| | (138 | ) | | — |
| | (157 | ) | | 115 |
| | (720 | ) | | 243 |
| 1,143 |
| | — |
| | (138 | ) | | — |
| | (157 | ) | | 115 |
| | (720 | ) | | 243 |
|
| Mortgage trading loans and ABS | 7,770 |
| | 175 |
| | 653 |
| | — |
| | (1,659 | ) | | 396 |
| | (427 | ) | | 6,908 |
| 7,770 |
| | 175 |
| | 653 |
| | — |
| | (1,659 | ) | | 396 |
| | (427 | ) | | 6,908 |
|
| Total trading account assets | 21,077 |
| | 292 |
| | 1,282 |
| | — |
| | (7,010 | ) | | 3,241 |
| | (3,357 | ) | | 15,525 |
| 21,077 |
| | 292 |
| | 1,282 |
| | — |
| | (7,010 | ) | | 3,241 |
| | (3,357 | ) | | 15,525 |
|
Net derivative assets (3)(2) | 7,863 |
| | — |
| | 8,118 |
| | — |
| | (8,778 | ) | | 1,067 |
| | (525 | ) | | 7,745 |
| 7,863 |
| | — |
| | 8,118 |
| | — |
| | (8,778 | ) | | 1,067 |
| | (525 | ) | | 7,745 |
|
| AFS debt securities: | |
| | |
| | |
| | |
| | |
| | |
| | |
| | |
| |
| | |
| | |
| | |
| | |
| | | | | | |
|
| Mortgage-backed securities: | | | | | | | | | | | | | | | | |
| | |
| | |
| | |
| | |
| | | | |
| | |
|
| Agency | — |
| | — |
| | — |
| | — |
| | 4 |
| | — |
| | — |
| | 4 |
| — |
| | — |
| | — |
| | — |
| | 4 |
| | — |
| | — |
| | 4 |
|
| Non-agency residential | 7,216 |
| | 113 |
| | (646 | ) | | (169 | ) | | (6,767 | ) | | 1,909 |
| | (188 | ) | | 1,468 |
| 7,216 |
| | 113 |
| | (646 | ) | | (169 | ) | | (6,767 | ) | | 1,909 |
| | (188 | ) | | 1,468 |
|
| Non-agency commercial | 258 |
| | — |
| | (13 | ) | | (31 | ) | | (178 | ) | | 71 |
| | (88 | ) | | 19 |
| 258 |
| | — |
| | (13 | ) | | (31 | ) | | (178 | ) | | 71 |
| | (88 | ) | | 19 |
|
| Non-U.S. securities | 468 |
| | — |
| | (125 | ) | | (75 | ) | | (321 | ) | | 56 |
| | — |
| | 3 |
| 468 |
| | — |
| | (125 | ) | | (75 | ) | | (321 | ) | | 56 |
| | — |
| | 3 |
|
| Corporate/Agency bonds | 927 |
| | — |
| | (3 | ) | | 47 |
| | (847 | ) | | 32 |
| | (19 | ) | | 137 |
| 927 |
| | — |
| | (3 | ) | | 47 |
| | (847 | ) | | 32 |
| | (19 | ) | | 137 |
|
| Other taxable securities | 9,854 |
| | 5,603 |
| | (296 | ) | | 44 |
| | (3,263 | ) | | 1,119 |
| | (43 | ) | | 13,018 |
| 9,854 |
| | 5,603 |
| | (296 | ) | | 44 |
| | (3,263 | ) | | 1,119 |
| | (43 | ) | | 13,018 |
|
| Tax-exempt securities | 1,623 |
| | — |
| | (25 | ) | | (9 | ) | | (574 | ) | | 316 |
| | (107 | ) | | 1,224 |
| 1,623 |
| | — |
| | (25 | ) | | (9 | ) | | (574 | ) | | 316 |
| | (107 | ) | | 1,224 |
|
| Total AFS debt securities | 20,346 |
| | 5,716 |
| | (1,108 | ) | | (193 | ) | | (11,946 | ) | | 3,503 |
| | (445 | ) | | 15,873 |
| 20,346 |
| | 5,716 |
| | (1,108 | ) | | (193 | ) | | (11,946 | ) | | 3,503 |
| | (445 | ) | | 15,873 |
|
Loans and leases (2)(3) | 4,936 |
| | — |
| | (89 | ) | | — |
| | (1,526 | ) | | — |
| | — |
| | 3,321 |
| 4,936 |
| | — |
| | (89 | ) | | — |
| | (1,526 | ) | | — |
| | — |
| | 3,321 |
|
| Mortgage servicing rights | 19,465 |
| | — |
| | (4,321 | ) | | — |
| | (244 | ) | | — |
| | — |
| | 14,900 |
| 19,465 |
| | — |
| | (4,321 | ) | | — |
| | (244 | ) | | — |
| | — |
| | 14,900 |
|
Loans held-for-sale (2)(3) | 6,942 |
| | — |
| | 482 |
| | — |
| | (3,714 | ) | | 624 |
| | (194 | ) | | 4,140 |
| 6,942 |
| | — |
| | 482 |
| | — |
| | (3,714 | ) | | 624 |
| | (194 | ) | | 4,140 |
|
Other assets (4) | 7,821 |
| | — |
| | 1,946 |
| | — |
| | (2,612 | ) | | — |
| | (299 | ) | | 6,856 |
| 7,821 |
| | — |
| | 1,946 |
| | — |
| | (2,612 | ) | | — |
| | (299 | ) | | 6,856 |
|
| Trading account liabilities: | |
| | |
| | | | |
| | |
| | |
| | |
| | |
| |
| | |
| | | | |
| | |
| | | | |
| | |
|
| Non-U.S. sovereign debt | (386 | ) | | — |
| | 23 |
| | — |
| | (17 | ) | | — |
| | 380 |
| | — |
| (386 | ) | | — |
| | 23 |
| | — |
| | (17 | ) | | — |
| | 380 |
| | — |
|
| Corporate securities and other | (10 | ) | | — |
| | (5 | ) | | — |
| | 11 |
| | (52 | ) | | 49 |
| | (7 | ) | (10 | ) | | — |
| | (5 | ) | | — |
| | 11 |
| | (52 | ) | | 49 |
| | (7 | ) |
| Total trading account liabilities | (396 | ) | | — |
| | 18 |
| | — |
| | (6 | ) | | (52 | ) | | 429 |
| | (7 | ) | (396 | ) | | — |
| | 18 |
| | — |
| | (6 | ) | | (52 | ) | | 429 |
| | (7 | ) |
Other short-term borrowings (2)(3) | (707 | ) | | — |
| | (95 | ) | | — |
| | 96 |
| | — |
| | — |
| | (706 | ) | (707 | ) | | — |
| | (95 | ) | | — |
| | 96 |
| | — |
| | — |
| | (706 | ) |
Accrued expenses and other liabilities (2)(3) | (891 | ) | | — |
| | 146 |
| | — |
| | (83 | ) | | — |
| | — |
| | (828 | ) | (891 | ) | | — |
| | 146 |
| | — |
| | (83 | ) | | — |
| | — |
| | (828 | ) |
Long-term debt (2)(3) | (4,660 | ) | | — |
| | 697 |
| | — |
| | 1,074 |
| | (1,881 | ) | | 1,784 |
| | (2,986 | ) | (4,660 | ) | | — |
| | 697 |
| | — |
| | 1,074 |
| | (1,881 | ) | | 1,784 |
| | (2,986 | ) |
| |
(1) | Assets (liabilities). For assets, increase / (decrease) to Level 3 and for liabilities, (increase) / decrease to Level 3. |
| |
(2) | Amounts represent items that are accounted for under the fair value option. |
| |
(3)
| Net derivatives at December 31, 2010 include derivative assets of $18.8 billion and derivative liabilities of $11.0 billion. |
| |
(3) | Amounts represent instruments that are accounted for under the fair value option. |
| |
(4) | Other assets is primarily comprised of AFS marketable equity securities. |
During 2010, the transfers into Level 3 included $3.2 billion of trading account assets, $3.5 billion of AFS debt securities, $1.1 billion of net derivative contractsassets and $1.9 billion of long-term debt. Transfers into Level 3 for trading account assets were driven bydue to reduced price transparency as a result of lower levels of trading activity for certain municipal auction rate securitiesARS and corporate debt securities as well as a change in valuation methodology for certain ABS to a discounted cash flow model. Transfers into Level 3 for AFS debt securities were due to an increase in the number of non-agency RMBS and other taxable securities priced using a discounted cash flow model. Transfers into Level 3 for net derivative contracts were primarily related to a lack of price
observability for certain credit default and total return swaps. Transfers into Level 3 for long-term
debt were primarily due to changes in the impact of unobservable inputs on the value of certain structured liabilities. Transfers occur on a regular basis for these long-term debt instruments due to changes in the impact of unobservable inputs on the value of the embedded derivative in relation to the instrument as a whole.
During 2010, the transfers out of Level 3 included $3.4 billion of trading account assets and $1.8 billion of long-term debt. Transfers out of Level 3 for trading account assets were driven bydue to increased price verification of certain MBS, corporate debt and non-U.S. government and agency securities. Transfers out of Level 3 for long-term debt were primarily due to changes in the impact of unobservable inputs on the value of certain structured liabilities.
|
| | | | | | | | | | | | | | | | | | | | | | | | | | | |
| | | | | | | | | | | | | | |
Level 3 – Fair Value Measurements (1) | | | | | | | | |
| | | | | | | | | | | | | | |
| | 2009 |
| (Dollars in millions) | Balance
January 1 2009 | | Merrill
Lynch Acquisition | | Gains
(Losses)
Included in Earnings | | Gains
(Losses)
Included in OCI | | Purchases,
Issuances and Settlements | | Transfers
into/(out of) Level 3 | | Balance
December 31 2009 |
| Trading account assets: | | | | | | | | | | | | | |
| Corporate securities, trading loans and other | $ | 4,540 |
| | $ | 7,012 |
| | $ | 370 |
| | $ | — |
| | $ | (2,015 | ) | | $ | 1,173 |
| | $ | 11,080 |
|
| Equity securities | 546 |
| | 3,848 |
| | (396 | ) | | — |
| | (2,425 | ) | | (489 | ) | | 1,084 |
|
| Non-U.S. sovereign debt | — |
| | 30 |
| | 136 |
| | — |
| | 167 |
| | 810 |
| | 1,143 |
|
| Mortgage trading loans and ABS | 1,647 |
| | 7,294 |
| | (262 | ) | | — |
| | 933 |
| | (1,842 | ) | | 7,770 |
|
| Total trading account assets | 6,733 |
| | 18,184 |
| | (152 | ) | | — |
| | (3,340 | ) | | (348 | ) | | 21,077 |
|
Net derivative assets (2) | 2,270 |
| | 2,307 |
| | 5,526 |
| | — |
| | (7,906 | ) | | 5,666 |
| | 7,863 |
|
| AFS debt securities: | |
| | |
| | |
| | |
| | |
| | | | |
|
| Non-agency MBS: | |
| | |
| | |
| | |
| | |
| | |
| | |
|
| Residential | 5,439 |
| | 2,509 |
| | (1,159 | ) | | 2,738 |
| | (4,187 | ) | | 1,876 |
| | 7,216 |
|
| Commercial | 657 |
| | — |
| | (185 | ) | | (7 | ) | | (155 | ) | | (52 | ) | | 258 |
|
| Non-U.S. securities | 1,247 |
| | — |
| | (79 | ) | | (226 | ) | | (73 | ) | | (401 | ) | | 468 |
|
| Corporate/Agency bonds | 1,598 |
| | — |
| | (22 | ) | | 127 |
| | 324 |
| | (1,100 | ) | | 927 |
|
| Other taxable securities | 9,599 |
| | — |
| | (75 | ) | | 669 |
| | 815 |
| | (1,154 | ) | | 9,854 |
|
| Tax-exempt securities | 162 |
| | — |
| | 2 |
| | 26 |
| | 788 |
| | 645 |
| | 1,623 |
|
| Total AFS debt securities | 18,702 |
| | 2,509 |
| | (1,518 | ) | | 3,327 |
| | (2,488 | ) | | (186 | ) | | 20,346 |
|
Loans and leases (3) | 5,413 |
| | 2,452 |
| | 515 |
| | — |
| | (3,718 | ) | | 274 |
| | 4,936 |
|
| Mortgage servicing rights | 12,733 |
| | 209 |
| | 5,286 |
| | — |
| | 1,237 |
| | — |
| | 19,465 |
|
Loans held-for-sale (3) | 3,382 |
| | 3,872 |
| | 678 |
| | — |
| | (1,048 | ) | | 58 |
| | 6,942 |
|
Other assets (4) | 4,157 |
| | 2,696 |
| | 1,273 |
| | — |
| | (308 | ) | | 3 |
| | 7,821 |
|
| Trading account liabilities: | |
| | |
| | | | |
| | |
| | |
| | |
|
| Non-U.S. sovereign debt | — |
| | — |
| | (38 | ) | | — |
| | — |
| | (348 | ) | | (386 | ) |
| Corporate securities and other | — |
| | — |
| | — |
| | — |
| | 4 |
| | (14 | ) | | (10 | ) |
| Total trading account liabilities | — |
| | — |
| | (38 | ) | | — |
| | 4 |
| | (362 | ) | | (396 | ) |
Other short-term borrowings (3) | (816 | ) | | — |
| | (11 | ) | | — |
| | 120 |
| | — |
| | (707 | ) |
Accrued expenses and other liabilities (3) | (1,124 | ) | | (1,337 | ) | | 1,396 |
| | — |
| | 174 |
| | — |
| | (891 | ) |
Long-term debt (3) | — |
| | (7,481 | ) | | (2,310 | ) | | — |
| | 830 |
| | 4,301 |
| | (4,660 | ) |
| |
(1)
| Assets (liabilities). For assets, increase / (decrease) to Level 3 and for liabilities, (increase) / decrease to Level 3. |
| |
(2)
| Net derivatives at December 31, 2009 include derivative assets of $23.0 billion and derivative liabilities of $15.2 billion.
|
| |
(3)
| Amounts represent items that are accounted for under the fair value option. |
| |
(4)
| Other assets is primarily comprised of AFS marketable equity securities. |
|
| | |
| | | Bank of America 2012 259263 |
The following tables summarize gains (losses) due to changes in fair value, including both realized and unrealized gains (losses), recorded in earnings for Level 3 assets and liabilities during 20112012, 20102011 and 20092010. These amounts include gains (losses) on loans, LHFS, loan commitments and structured liabilities that are accounted for under the fair value option.
| | | | | | | | | | | | | | | | | | | | | |
Level 3 – Total Realized and Unrealized Gains (Losses) Included in Earnings | | | | | | | | | | | | | | | | | | | | |
| | 2011 | 2012 |
| (Dollars in millions) | Equity
Investment
Income (Loss) | | Trading
Account
Profits (Losses) | | Mortgage
Banking
Income (Loss) (1) | | Other
Income (Loss) | | Total | Equity
Investment
Income (Loss) | | Trading
Account
Profits (Losses) | | Mortgage
Banking
Income (Loss) (1) | | Other
Income (Loss) | | Total |
| Trading account assets: | |
| | |
| | |
| | |
| | |
| |
| | |
| | |
| | |
| | |
|
Corporate securities, trading loans and other (2) | $ | — |
| | $ | 490 |
| | $ | — |
| | $ | — |
| | $ | 490 |
| |
| Corporate securities, trading loans and other | | $ | — |
| | $ | 195 |
| | $ | — |
| | $ | — |
| | $ | 195 |
|
| Equity securities | | — |
| | 31 |
| | — |
| | — |
| | 31 |
|
| Non-U.S. sovereign debt | | — |
| | 8 |
| | — |
| | — |
| | 8 |
|
| Mortgage trading loans and ABS | | — |
| | 215 |
| | — |
| | — |
| | 215 |
|
| Total trading account assets | | — |
| | 449 |
| | — |
| | — |
| | 449 |
|
| Net derivative assets | | — |
| | (3,208 | ) | | 2,987 |
| | — |
| | (221 | ) |
| AFS debt securities: | | |
| | |
| | |
| | |
| | |
|
| Non-agency residential MBS | | — |
| | — |
| | — |
| | (69 | ) | | (69 | ) |
| Corporate/Agency bonds | | — |
| | — |
| | — |
| | (2 | ) | | (2 | ) |
| Other taxable securities | | — |
| | 2 |
| | — |
| | 21 |
| | 23 |
|
| Tax-exempt securities | | — |
| | — |
| | — |
| | 61 |
| | 61 |
|
| Total AFS debt securities | | — |
| | 2 |
| | — |
| | 11 |
| | 13 |
|
Loans and leases (2) | | — |
| | — |
| | — |
| | 334 |
| | 334 |
|
| Mortgage servicing rights | | — |
| | — |
| | (430 | ) | | — |
| | (430 | ) |
Loans held-for-sale (2) | | — |
| | — |
| | 148 |
| | 204 |
| | 352 |
|
| Other assets | | 97 |
| | — |
| | (74 | ) | | (77 | ) | | (54 | ) |
| Trading account liabilities – Corporate securities and other | | — |
| | 4 |
| | — |
| | — |
| | 4 |
|
Accrued expenses and other liabilities (2) | | — |
| | — |
| | — |
| | (4 | ) | | (4 | ) |
Long-term debt (2) | | — |
| | (133 | ) | | — |
| | (174 | ) | | (307 | ) |
| Total | | $ | 97 |
| | $ | (2,886 | ) | | $ | 2,631 |
| | $ | 294 |
| | $ | 136 |
|
| | | | | | | | | | | |
| | | 2011 |
| Trading account assets: | | |
| | |
| | |
| | |
| | |
|
| Corporate securities, trading loans and other | | $ | — |
| | $ | 490 |
| | $ | — |
| | $ | — |
| | $ | 490 |
|
| Equity securities | — |
| | 49 |
| | — |
| | — |
| | 49 |
| — |
| | 49 |
| | — |
| | — |
| | 49 |
|
| Non-U.S. sovereign debt | — |
| | 87 |
| | — |
| | — |
| | 87 |
| — |
| | 87 |
| | — |
| | — |
| | 87 |
|
| Mortgage trading loans and ABS | — |
| | 442 |
| | — |
| | — |
| | 442 |
| — |
| | 442 |
| | — |
| | — |
| | 442 |
|
| Total trading account assets | — |
| | 1,068 |
| | — |
| | — |
| | 1,068 |
| — |
| | 1,068 |
| | — |
| | — |
| | 1,068 |
|
| Net derivative assets | — |
| | 1,516 |
| | 3,683 |
| | — |
| | 5,199 |
| — |
| | 1,516 |
| | 3,683 |
| | — |
| | 5,199 |
|
| AFS debt securities: | |
| | |
| | |
| | |
| | |
| |
| | |
| | |
| | |
| | |
|
| Non-agency residential MBS | — |
| | — |
| | — |
| | (158 | ) | | (158 | ) | — |
| | — |
| | — |
| | (158 | ) | | (158 | ) |
| Corporate/Agency bonds | — |
| | — |
| | — |
| | (12 | ) | | (12 | ) | — |
| | — |
| | — |
| | (12 | ) | | (12 | ) |
| Other taxable securities | — |
| | 16 |
| | — |
| | 10 |
| | 26 |
| — |
| | 16 |
| | — |
| | 10 |
| | 26 |
|
| Tax-exempt securities | — |
| | (3 | ) | | — |
| | 24 |
| | 21 |
| — |
| | (3 | ) | | — |
| | 24 |
| | 21 |
|
| Total AFS debt securities | — |
| | 13 |
| | — |
| | (136 | ) | | (123 | ) | — |
| | 13 |
| | — |
| | (136 | ) | | (123 | ) |
Loans and leases (2) | — |
| | — |
| | (13 | ) | | (42 | ) | | (55 | ) | — |
| | — |
| | (13 | ) | | (42 | ) | | (55 | ) |
| Mortgage servicing rights | — |
| | — |
| | (5,661 | ) | | — |
| | (5,661 | ) | — |
| | — |
| | (5,661 | ) | | — |
| | (5,661 | ) |
Loans held-for-sale (2) | — |
| | — |
| | (108 | ) | | 144 |
| | 36 |
| — |
| | — |
| | (108 | ) | | 144 |
| | 36 |
|
| Other assets | 242 |
| | — |
| | (51 | ) | | (51 | ) | | 140 |
| 242 |
| | — |
| | (51 | ) | | (51 | ) | | 140 |
|
| Trading account liabilities – Corporate securities and other | — |
| | 4 |
| | — |
| | — |
| | 4 |
| — |
| | 4 |
| | — |
| | — |
| | 4 |
|
Other short-term borrowings (2) | — |
| | — |
| | (30 | ) | | — |
| | (30 | ) | — |
| | — |
| | (30 | ) | | — |
| | (30 | ) |
Accrued expenses and other liabilities (2) | — |
| | (10 | ) | | 71 |
| | — |
| | 61 |
| — |
| | (10 | ) | | 71 |
| | — |
| | 61 |
|
Long-term debt (2) | — |
| | (106 | ) | | — |
| | (82 | ) | | (188 | ) | — |
| | (106 | ) | | — |
| | (82 | ) | | (188 | ) |
| Total | $ | 242 |
| | $ | 2,485 |
| | $ | (2,109 | ) | | $ | (167 | ) | | $ | 451 |
| $ | 242 |
| | $ | 2,485 |
| | $ | (2,109 | ) | | $ | (167 | ) | | $ | 451 |
|
| | | | | | | | | | | |
| | 2010 | |
| Trading account assets: | |
| | |
| | |
| | |
| | |
| |
Corporate securities, trading loans and other (2) | $ | — |
| | $ | 848 |
| | $ | — |
| | $ | — |
| | $ | 848 |
| |
| Equity securities | — |
| | (81 | ) | | — |
| | — |
| | (81 | ) | |
| Non-U.S. sovereign debt | — |
| | (138 | ) | | — |
| | — |
| | (138 | ) | |
| Mortgage trading loans and ABS | — |
| | 653 |
| | — |
| | — |
| | 653 |
| |
| Total trading account assets | — |
| | 1,282 |
| | — |
| | — |
| | 1,282 |
| |
| Net derivative assets | — |
| | (1,257 | ) | | 9,375 |
| | — |
| | 8,118 |
| |
| AFS debt securities: | |
| | |
| | |
| | |
| | |
| |
| Non-agency MBS: | |
| | |
| | |
| | |
| | |
| |
| Residential | — |
| | — |
| | (16 | ) | | (630 | ) | | (646 | ) | |
| Commercial | — |
| | — |
| | — |
| | (13 | ) | | (13 | ) | |
| Non-U.S. securities | — |
| | — |
| | — |
| | (125 | ) | | (125 | ) | |
| Corporate/Agency bonds | — |
| | — |
| | — |
| | (3 | ) | | (3 | ) | |
| Other taxable securities | — |
| | (295 | ) | | — |
| | (1 | ) | | (296 | ) | |
| Tax-exempt securities | — |
| | 23 |
| | — |
| | (48 | ) | | (25 | ) | |
| Total AFS debt securities | — |
| | (272 | ) | | (16 | ) | | (820 | ) | | (1,108 | ) | |
Loans and leases (2) | — |
| | — |
| | — |
| | (89 | ) | | (89 | ) | |
| Mortgage servicing rights | — |
| | — |
| | (4,321 | ) | | — |
| | (4,321 | ) | |
Loans held-for-sale (2) | — |
| | — |
| | 72 |
| | 410 |
| | 482 |
| |
| Other assets | 1,967 |
| | — |
| | (21 | ) | | — |
| | 1,946 |
| |
| Trading account liabilities: | | | | | | | | | | |
| Non-U.S. sovereign debt | — |
| | 23 |
| | — |
| | — |
| | 23 |
| |
| Corporate securities and other | — |
| | (5 | ) | | — |
| | — |
| | (5 | ) | |
| Total trading account liabilities | — |
| | 18 |
| | — |
| | — |
| | 18 |
| |
Other short-term borrowings (2) | — |
| | — |
| | (95 | ) | | — |
| | (95 | ) | |
Accrued expenses and other liabilities (2) | — |
| | (26 | ) | | — |
| | 172 |
| | 146 |
| |
Long-term debt (2) | — |
| | 677 |
| | — |
| | 20 |
| | 697 |
| |
| Total | $ | 1,967 |
| | $ | 422 |
| | $ | 4,994 |
| | $ | (307 | ) | | $ | 7,076 |
| |
| |
(1) | Mortgage banking income (loss) does not reflect the impact of Level 1 and Level 2 hedges on MSRs. |
| |
(2) | Amounts represent itemsinstruments that are accounted for under the fair value option. |
|
| | |
260264 Bank of America 20112012
| | |
| | | | | | | | | | | | | | | | | | | | | |
Level 3 – Total Realized and Unrealized Gains (Losses) Included in Earnings | | | | | | | | | | | | | | | | | | | | |
| | 2009 | 2010 |
| (Dollars in millions) | Equity
Investment
Income (Loss) | | Trading
Account
Profits (Losses) | | Mortgage
Banking
Income (Loss) (1) | | Other
Income (Loss) | | Total | Equity
Investment
Income (Loss) | | Trading
Account
Profits (Losses) | | Mortgage
Banking
Income (Loss) (1) | | Other
Income (Loss) | | Total |
| Trading account assets: | |
| | |
| | |
| | |
| | |
| |
| | |
| | |
| | |
| | |
|
| Corporate securities, trading loans and other | $ | — |
| | $ | 370 |
| | $ | — |
| | $ | — |
| | $ | 370 |
| $ | — |
| | $ | 848 |
| | $ | — |
| | $ | — |
| | $ | 848 |
|
| Equity securities | — |
| | (396 | ) | | — |
| | — |
| | (396 | ) | — |
| | (81 | ) | | — |
| | — |
| | (81 | ) |
| Non-U.S. sovereign debt | — |
| | 136 |
| | — |
| | — |
| | 136 |
| — |
| | (138 | ) | | — |
| | — |
| | (138 | ) |
| Mortgage trading loans and ABS | — |
| | (262 | ) | | — |
| | — |
| | (262 | ) | — |
| | 653 |
| | — |
| | — |
| | 653 |
|
| Total trading account assets | — |
| | (152 | ) | | — |
| | — |
| | (152 | ) | — |
| | 1,282 |
| | — |
| | — |
| | 1,282 |
|
| Net derivative assets | — |
| | (2,526 | ) | | 8,052 |
| | — |
| | 5,526 |
| — |
| | (1,257 | ) | | 9,375 |
| | — |
| | 8,118 |
|
| AFS debt securities: | |
| | |
| | |
| | |
| | |
| |
| | |
| | |
| | |
| | |
|
| Non-agency MBS: | |
| | |
| | |
| | |
| | |
| |
| | |
| | |
| | |
| | |
|
| Residential | — |
| | — |
| | (20 | ) | | (1,139 | ) | | (1,159 | ) | — |
| | — |
| | (16 | ) | | (630 | ) | | (646 | ) |
| Commercial | — |
| | — |
| | — |
| | (185 | ) | | (185 | ) | — |
| | — |
| | — |
| | (13 | ) | | (13 | ) |
| Non-U.S. securities | — |
| | — |
| | — |
| | (79 | ) | | (79 | ) | — |
| | — |
| | — |
| | (125 | ) | | (125 | ) |
| Corporate/Agency bonds | — |
| | — |
| | — |
| | (22 | ) | | (22 | ) | — |
| | — |
| | — |
| | (3 | ) | | (3 | ) |
| Other taxable securities | — |
| | — |
| | — |
| | (75 | ) | | (75 | ) | — |
| | (295 | ) | | — |
| | (1 | ) | | (296 | ) |
| Tax-exempt securities | — |
| | — |
| | — |
| | 2 |
| | 2 |
| — |
| | 23 |
| | — |
| | (48 | ) | | (25 | ) |
| Total AFS debt securities | — |
| | — |
| | (20 | ) | | (1,498 | ) | | (1,518 | ) | — |
| | (272 | ) | | (16 | ) | | (820 | ) | | (1,108 | ) |
Loans and leases (2) | — |
| | (11 | ) | | — |
| | 526 |
| | 515 |
| — |
| | — |
| | — |
| | (89 | ) | | (89 | ) |
| Mortgage servicing rights | — |
| | — |
| | 5,286 |
| | — |
| | 5,286 |
| — |
| | — |
| | (4,321 | ) | | — |
| | (4,321 | ) |
Loans held-for-sale (2) | — |
| | (216 | ) | | 306 |
| | 588 |
| | 678 |
| — |
| | — |
| | 72 |
| | 410 |
| | 482 |
|
| Other assets | 968 |
| | — |
| | 244 |
| | 61 |
| | 1,273 |
| 1,967 |
| | — |
| | (21 | ) | | — |
| | 1,946 |
|
| Trading account liabilities – Non-U.S. sovereign debt | — |
| | (38 | ) | | — |
| | — |
| | (38 | ) | |
| Trading account liabilities: | | | | | | | | | | |
| Non-U.S. sovereign debt | | — |
| | 23 |
| | — |
| | — |
| | 23 |
|
| Corporate securities and other | | — |
| | (5 | ) | | — |
| | — |
| | (5 | ) |
| Total trading account liabilities | | — |
| | 18 |
| | — |
| | — |
| | 18 |
|
Other short-term borrowings (2) | — |
| | — |
| | (11 | ) | | — |
| | (11 | ) | — |
| | — |
| | (95 | ) | | — |
| | (95 | ) |
Accrued expenses and other liabilities (2) | — |
| | 36 |
| | — |
| | 1,360 |
| | 1,396 |
| — |
| | (26 | ) | | — |
| | 172 |
| | 146 |
|
Long-term debt (2) | — |
| | (2,083 | ) | | — |
| | (227 | ) | | (2,310 | ) | — |
| | 677 |
| | — |
| | 20 |
| | 697 |
|
| Total | $ | 968 |
| | $ | (4,990 | ) | | $ | 13,857 |
| | $ | 810 |
| | $ | 10,645 |
| $ | 1,967 |
| | $ | 422 |
| | $ | 4,994 |
| | $ | (307 | ) | | $ | 7,076 |
|
| |
(1) | Mortgage banking income (loss) does not reflect the impact of Level 1 and Level 2 hedges on MSRs. |
| |
(2) | Amounts represent itemsinstruments that are accounted for under the fair value option. |
|
| | |
| | | Bank of America 2012 261265 |
The following tables summarize changes in unrealized gains (losses) recorded in earnings during 20112012, 20102011 and 20092010 for Level 3 assets and liabilities that were still held at December 31, 20112012, 20102011 and 20092010. These amounts include changes in fair value on loans, LHFS, loan commitments and structured liabilities that are accounted for under the fair value option.
| | | | | | | | | | | | | | | | | | | | | |
Level 3 – Changes in Unrealized Gains (Losses) Relating to Assets and Liabilities Still Held at Reporting Date | | | | | | | | | | | | | | | | | | | | |
| | 2011 | 2012 |
| (Dollars in millions) | Equity
Investment
Income (Loss) | | Trading
Account
Profits (Losses) | | Mortgage
Banking
Income (Loss) (1) | | Other
Income (Loss) | | Total | Equity
Investment
Income (Loss) | | Trading
Account
Profits (Losses) | | Mortgage
Banking
Income (Loss) (1) | | Other
Income (Loss) | | Total |
| Trading account assets: | |
| | |
| | |
| | |
| | |
| |
| | |
| | |
| | |
| | |
|
Corporate securities, trading loans and other (2) | $ | — |
| | $ | (86 | ) | | $ | — |
| | $ | — |
| | $ | (86 | ) | |
| Corporate securities, trading loans and other | | $ | — |
| | $ | (19 | ) | | $ | — |
| | $ | — |
| | $ | (19 | ) |
| Equity securities | | — |
| | 17 |
| | — |
| | — |
| | 17 |
|
| Non-U.S. sovereign debt | | — |
| | 20 |
| | — |
| | — |
| | 20 |
|
| Mortgage trading loans and ABS | | — |
| | 36 |
| | — |
| | — |
| | 36 |
|
| Total trading account assets | | — |
| | 54 |
| | — |
| | — |
| | 54 |
|
| Net derivative assets | | — |
| | (2,782 | ) | | 2,020 |
| | — |
| | (762 | ) |
| AFS debt securities – Other taxable securities | | — |
| | 2 |
| | — |
| | — |
| | 2 |
|
Loans and leases (2) | | — |
| | — |
| | — |
| | 291 |
| | 291 |
|
| Mortgage servicing rights | | — |
| | — |
| | (1,100 | ) | | — |
| | (1,100 | ) |
Loans held-for-sale (2) | | — |
| | — |
| | 121 |
| | 168 |
| | 289 |
|
| Other assets | | 141 |
| | — |
| | (71 | ) | | (74 | ) | | (4 | ) |
| Trading account liabilities – Corporate securities and other | | — |
| | 4 |
| | — |
| | — |
| | 4 |
|
Accrued expenses and other liabilities (2) | | — |
| | — |
| | — |
| | (2 | ) | | (2 | ) |
Long-term debt (2) | | — |
| | (136 | ) | | — |
| | (173 | ) | | (309 | ) |
| Total | | $ | 141 |
| | $ | (2,858 | ) | | $ | 970 |
| | $ | 210 |
| | $ | (1,537 | ) |
| | | | | | | | | | | |
| | | 2011 |
| Trading account assets: | | |
| | |
| | |
| | |
| | |
|
| Corporate securities, trading loans and other | | $ | — |
| | $ | (86 | ) | | $ | — |
| | $ | — |
| | $ | (86 | ) |
| Equity securities | — |
| | (60 | ) | | — |
| | — |
| | (60 | ) | — |
| | (60 | ) | | — |
| | — |
| | (60 | ) |
| Non-U.S. sovereign debt | — |
| | 101 |
| | — |
| | — |
| | 101 |
| — |
| | 101 |
| | — |
| | — |
| | 101 |
|
| Mortgage trading loans and ABS | — |
| | 30 |
| | — |
| | — |
| | 30 |
| — |
| | 30 |
| | — |
| | — |
| | 30 |
|
| Total trading account assets | — |
| | (15 | ) | | — |
| | — |
| | (15 | ) | — |
| | (15 | ) | | — |
| | — |
| | (15 | ) |
| Net derivative assets | — |
| | 1,430 |
| | 1,351 |
| | — |
| | 2,781 |
| — |
| | 1,430 |
| | 1,351 |
| | — |
| | 2,781 |
|
| AFS debt securities: | |
| | |
| | |
| | |
| | |
| | | | | | | | | |
| Non-agency residential MBS | — |
| | — |
| | — |
| | (195 | ) | | (195 | ) | — |
| | — |
| | — |
| | (195 | ) | | (195 | ) |
| Corporate/Agency bonds | — |
| | — |
| | — |
| | (14 | ) | | (14 | ) | — |
| | — |
| | — |
| | (14 | ) | | (14 | ) |
| Other taxable securities | — |
| | — |
| | — |
| | 13 |
| | 13 |
| — |
| | — |
| | — |
| | 13 |
| | 13 |
|
| Total AFS debt securities | — |
| | — |
| | — |
| | (196 | ) | | (196 | ) | — |
| | — |
| | — |
| | (196 | ) | | (196 | ) |
Loans and leases (2) | — |
| | — |
| | — |
| | (260 | ) | | (260 | ) | — |
| | — |
| | — |
| | (260 | ) | | (260 | ) |
| Mortgage servicing rights | — |
| | — |
| | (6,958 | ) | | — |
| | (6,958 | ) | — |
| | — |
| | (6,958 | ) | | — |
| | (6,958 | ) |
Loans held-for-sale (2) | — |
| | — |
| | (153 | ) | | 5 |
| | (148 | ) | — |
| | — |
| | (153 | ) | | 5 |
| | (148 | ) |
| Other assets | (309 | ) | | — |
| | (53 | ) | | (51 | ) | | (413 | ) | (309 | ) | | — |
| | (53 | ) | | (51 | ) | | (413 | ) |
| Trading account liabilities – Corporate securities and other | — |
| | 3 |
| | — |
| | — |
| | 3 |
| — |
| | 3 |
| | — |
| | — |
| | 3 |
|
Long-term debt (2) | — |
| | (107 | ) | | — |
| | (94 | ) | | (201 | ) | — |
| | (107 | ) | | — |
| | (94 | ) | | (201 | ) |
| Total | $ | (309 | ) | | $ | 1,311 |
| | $ | (5,813 | ) | | $ | (596 | ) | | $ | (5,407 | ) | $ | (309 | ) | | $ | 1,311 |
| | $ | (5,813 | ) | | $ | (596 | ) | | $ | (5,407 | ) |
| | | | | | | | | | | |
| | 2010 | |
| Trading account assets: | |
| | |
| | |
| | |
| | |
| |
Corporate securities, trading loans and other (2) | $ | — |
| | $ | 289 |
| | $ | — |
| | $ | — |
| | $ | 289 |
| |
| Equity securities | — |
| | (50 | ) | | — |
| | — |
| | (50 | ) | |
| Non-U.S. sovereign debt | — |
| | (144 | ) | | — |
| | — |
| | (144 | ) | |
| Mortgage trading loans and ABS | — |
| | 227 |
| | — |
| | — |
| | 227 |
| |
| Total trading account assets | — |
| | 322 |
| | — |
| | — |
| | 322 |
| |
| Net derivative assets | — |
| | (945 | ) | | 676 |
| | — |
| | (269 | ) | |
| Non-agency residential MBS AFS debt securities | — |
| | — |
| | (2 | ) | | (162 | ) | | (164 | ) | |
Loans and leases (2) | — |
| | — |
| | — |
| | (142 | ) | | (142 | ) | |
| Mortgage servicing rights | — |
| | — |
| | (5,740 | ) | | — |
| | (5,740 | ) | |
Loans held-for-sale (2) | — |
| | 10 |
| | (9 | ) | | 258 |
| | 259 |
| |
| Other assets | 50 |
| | — |
| | (22 | ) | | — |
| | 28 |
| |
| Trading account liabilities – Non-U.S. sovereign debt | — |
| | 52 |
| | — |
| | — |
| | 52 |
| |
Other short-term borrowings (2) | — |
| | — |
| | (46 | ) | | — |
| | (46 | ) | |
Accrued expenses and other liabilities (2) | — |
| | — |
| | — |
| | (182 | ) | | (182 | ) | |
Long-term debt (2) | — |
| | 585 |
| | — |
| | 43 |
| | 628 |
| |
| Total | $ | 50 |
| | $ | 24 |
| | $ | (5,143 | ) | | $ | (185 | ) | | $ | (5,254 | ) | |
| |
(1) | Mortgage banking income (loss) does not reflect the impact of Level 1 and Level 2 hedges on MSRs. |
| |
(2) | Amounts represent itemsinstruments that are accounted for under the fair value option. |
|
| | |
262266 Bank of America 20112012
| | |
| | | | | | | | | | | | | | | | | | | | | |
Level 3 – Changes in Unrealized Gains (Losses) Relating to Assets and Liabilities Still Held at Reporting Date | | | | | | | | | | | | | | | | | | | | |
| | 2009 | 2010 |
| (Dollars in millions) | Equity
Investment
Income (Loss) | | Trading
Account
Profits (Losses) | | Mortgage
Banking
Income (Loss) (1) | | Other
Income (Loss) | | Total | Equity
Investment
Income (Loss) | | Trading
Account
Profits (Losses) | | Mortgage
Banking
Income (Loss) (1) | | Other
Income (Loss) | | Total |
| Trading account assets: | | | | | | | | | | | | | | | | | | |
| Corporate securities, trading loans and other | $ | — |
| | $ | 89 |
| | $ | — |
| | $ | — |
| | $ | 89 |
| $ | — |
| | $ | 289 |
| | $ | — |
| | $ | — |
| | $ | 289 |
|
| Equity securities | — |
| | (328 | ) | | — |
| | — |
| | (328 | ) | — |
| | (50 | ) | | — |
| | — |
| | (50 | ) |
| Non-U.S. sovereign debt | — |
| | 137 |
| | — |
| | — |
| | 137 |
| — |
| | (144 | ) | | — |
| | — |
| | (144 | ) |
| Mortgage trading loans and ABS | — |
| | (332 | ) | | — |
| | — |
| | (332 | ) | — |
| | 227 |
| | — |
| | — |
| | 227 |
|
| Total trading account assets | — |
| | (434 | ) | | — |
| | — |
| | (434 | ) | — |
| | 322 |
| | — |
| | — |
| | 322 |
|
| Net derivative assets | — |
| | (2,761 | ) | | 348 |
| | — |
| | (2,413 | ) | — |
| | (945 | ) | | 676 |
| | — |
| | (269 | ) |
| AFS debt securities: | |
| | |
| | |
| | |
| | |
| |
| Non-agency residential MBS | — |
| | — |
| | (20 | ) | | (659 | ) | | (679 | ) | |
| Other taxable securities | — |
| | (11 | ) | | — |
| | (3 | ) | | (14 | ) | |
| Tax-exempt securities | — |
| | (2 | ) | | — |
| | (8 | ) | | (10 | ) | |
| Total AFS debt securities | — |
| | (13 | ) | | (20 | ) | | (670 | ) | | (703 | ) | |
| Non-agency residential MBS AFS debt securities | | — |
| | — |
| | (2 | ) | | (162 | ) | | (164 | ) |
Loans and leases (2) | — |
| | — |
| | — |
| | 210 |
| | 210 |
| — |
| | — |
| | — |
| | (142 | ) | | (142 | ) |
| Mortgage servicing rights | — |
| | — |
| | 4,100 |
| | — |
| | 4,100 |
| — |
| | — |
| | (5,740 | ) | | — |
| | (5,740 | ) |
Loans held-for-sale (2) | — |
| | (195 | ) | | 164 |
| | 695 |
| | 664 |
| — |
| | 10 |
| | (9 | ) | | 258 |
| | 259 |
|
| Other assets | (177 | ) | | — |
| | 6 |
| | 1,061 |
| | 890 |
| 50 |
| | — |
| | (22 | ) | | — |
| | 28 |
|
| Trading account liabilities – Non-U.S. sovereign debt | — |
| | (38 | ) | | — |
| | — |
| | (38 | ) | — |
| | 52 |
| | — |
| | — |
| | 52 |
|
Other short-term borrowings (2) | — |
| | — |
| | (11 | ) | | — |
| | (11 | ) | — |
| | — |
| | (46 | ) | | — |
| | (46 | ) |
Accrued expenses and other liabilities (2) | — |
| | — |
| | — |
| | 1,740 |
| | 1,740 |
| — |
| | — |
| | — |
| | (182 | ) | | (182 | ) |
Long-term debt (2) | — |
| | (2,303 | ) | | — |
| | (225 | ) | | (2,528 | ) | — |
| | 585 |
| | — |
| | 43 |
| | 628 |
|
| Total | $ | (177 | ) | | $ | (5,744 | ) | | $ | 4,587 |
| | $ | 2,811 |
| | $ | 1,477 |
| $ | 50 |
| | $ | 24 |
| | $ | (5,143 | ) | | $ | (185 | ) | | $ | (5,254 | ) |
| |
(1) | Mortgage banking income (loss) does not reflect the impact of Level 1 and Level 2 hedges on MSRs. |
| |
(2) | Amounts represent itemsinstruments that are accounted for under the fair value option. |
The following tables present information about significant unobservable inputs related to the Corporation’s material categories of Level 3 financial assets and liabilities at December 31, 2012.
|
| | | | | | | | |
| | | | | | |
| Quantitative Information about Level 3 Fair Value Measurements | |
| | | | | |
| (Dollars in millions) | | | Inputs |
| Financial Instrument | Fair Value | Valuation Technique | Significant Unobservable Inputs | Ranges of Inputs | Weighted Average |
Loans and Securities (1) | | | | | |
| Instruments backed by residential real estate assets | $ | 4,478 |
| Discounted cash flow, Market comparables | Yield | 2% to 25% | 6 | % |
| Trading account assets – Mortgage trading loans and ABS | 459 |
| Prepayment speed | 1% to 30% CPR | 11 | % |
| Loans and leases | 1,286 |
| Default rate | 0% to 44% CDR | 8 | % |
| Loans held-for-sale | 2,733 |
| Loss severity | 6% to 85% | 36 | % |
| Instruments backed by commercial real estate assets | $ | 1,910 |
| Discounted cash flow | Yield | 5% | n/a |
|
| Other assets | 1,910 |
| Loss severity | 51% to 100% | 88 | % |
| Commercial loans, debt securities and other | $ | 10,778 |
| Discounted cash flow, Market comparables | Yield | 0% to 25% | 4 | % |
| Trading account assets – Corporate securities, trading loans and other | 2,289 |
| Enterprise value/EBITDA multiple | 2x to 11x | 5 | x |
| Trading account assets – Mortgage trading loans and ABS | 4,476 |
| Prepayment speed | 5% to 30% | 20 | % |
| AFS debt securities – Other taxable securities | 3,012 |
| Default rate | 1% to 5% | 4 | % |
| Loans and leases | 1,001 |
| Loss severity | 25% to 40% | 35 | % |
| Auction rate securities | $ | 3,414 |
| Discounted cash flow, Market comparables | Discount rate | 0% to 10% | 4 | % |
| Trading account assets – Corporate securities, trading loans and other | 1,437 |
| Projected tender price/Re-financing level | 50% to 100% | 92 | % |
| AFS debt securities – Other taxable securities | 916 |
| | |
| AFS debt securities – Tax-exempt securities | 1,061 |
| | | |
| Structured liabilities | | | | | |
Long-term debt (2) | $ | (2,301 | ) | Industry standard derivative pricing (3) | Equity correlation | 30% to 97% | n/m |
|
| | | Long-dated volatilities | 20% to 70% | n/m |
|
| | | | | |
| |
(1) | The categories are aggregated based on product type which differs from financial statement classification. The following is a reconciliation to the line items in the table on page 261: Trading account assets – Corporate securities, trading loans and other of $3.7 billion, Trading account assets – Mortgage trading loans and ABS of $4.9 billion, AFS debt securities – Other taxable securities of $3.9 billion, AFS debt securities – Tax-exempt securities of $1.1 billion, Loans and leases of $2.3 billion, LHFS of $2.7 billion and Other assets of $1.9 billion. |
| |
(2) | For additional information on the ranges of inputs for equity correlation and long-dated volatilities, see the qualitative equity derivatives discussion on page 268. |
| |
(3) | Includes models such as Monte Carlo simulation and Black-Scholes. |
n/a = not applicable
n/m = not meaningful
CPR = Constant Prepayment Rate
CDR = Constant Default Rate
EBITDA = Earnings before interest, taxes, depreciation and amortization
|
| | | | | | |
| | | | | |
| Quantitative Information about Level 3 Fair Value Measurements (continued) |
| | | | |
| (Dollars in millions) | | | Inputs |
| Financial Instrument | Fair Value | Valuation Technique | Significant Unobservable Inputs | Ranges of Inputs |
| Net derivatives assets | | | | |
| Credit derivatives | $ | 2,327 |
| Discounted cash flow, Stochastic recovery correlation model | Yield | 2% to 25% |
| | | Credit spreads | 58 bps to 615 bps |
| | | Upfront points | 25 points to 99 points |
| | | Spread to index | -2,080 bps to 1,972 bps |
| | | Credit correlation | 19% to 75% |
| | | Prepayment speed | 3% to 30% CPR |
| | | Default rate | 0% to 8% CDR |
| | | Loss severity | 25% to 42% |
| Equity derivatives | $ | (1,295 | ) | Industry standard derivative pricing (4) | Equity correlation | 30% to 97% |
| | | Long-dated volatilities | 20% to 70% |
| | | | |
| Commodity derivatives | $ | (5 | ) | Discounted cash flow | Long-term natural gas basis | -$0.30 to $0.30 |
| Interest rate derivatives | $ | 441 |
| Industry standard derivative pricing (4) | Correlation (IR/IR) | 15% to 99% |
| | | Correlation (FX/IR) | -65% to 50% |
| | | Long-dated inflation rates | 2% to 3% |
| | �� | Long-dated inflation volatilities | 0% to 1% |
| | | Long-dated volatilities (FX) | 5% to 36% |
| | | Long-dated swap rates | 8% to 10% |
| Total net derivative assets | $ | 1,468 |
| | | |
(4) Includes models such as Monte Carlo simulation, Black-Scholes and other methods that model the joint dynamics of interest, inflation and foreign exchange rates.
CPR = Constant Prepayment Rate
CDR = Constant Default Rate
IR = Interest Rate
FX = Foreign Exchange
In the tables above, instruments backed by residential and commercial real estate assets include RMBS, CMBS, whole loans, mortgage CDOs and net monoline exposure. Commercial loans, debt securities and other includes corporate CLOs and CDOs, commercial loans and bonds, and securities backed by non-real estate assets. Structured liabilities primarily includes equity-linked notes that are accounted for under the fair value option.
In addition to the instruments in the tables above, the Corporation holds $1.2 billion of instruments consisting primarily of certain direct private equity investments and private equity funds that are classified as Level 3 and reported within other assets. Valuations of direct private equity investments are based on the most recent company financial information. Inputs generally include market and acquisition comparables, entry level multiples, as well as other variables. The Corporation selects a valuation methodology (e.g., market comparables) for each investment and, in certain instances, multiple inputs are weighted to derive the most representative value. Discounts are applied as appropriate to consider the lack of liquidity and marketability versus publicly-traded companies. For private equity funds, fair value is determined using the net asset value as provided by the individual fund’s general partner.
For information on the inputs and techniques used in the valuation of MSRs, see Note 24 – Mortgage Servicing Rights.
The Corporation uses multiple market approaches in valuing certain of its Level 3 financial instruments. For example, market comparables and discounted cash flows are used together. For a given product, such as corporate debt securities, market comparables may be used to estimate some of the unobservable inputs and then these inputs are incorporated into a discounted cash flow model. Therefore, the balances disclosed encompass both of these techniques.
The level of aggregation and diversity within the products disclosed in the table result in certain ranges of inputs being wide and unevenly distributed across asset and liability categories.
For credit derivatives, the range of credit spreads represents positions with varying levels of default risk to the underlying instruments. The lower end of the credit spread range typically represents shorter-dated instruments and those with better perceived credit risk. The higher end of the range comprises longer-dated instruments and those referencing debt issuances that are more likely to be impaired or nonperforming. The majority of inputs are concentrated in the lower end of the range. Similarly, the spread to index can vary significantly based on the risk of the instrument. The spread will be positive for instruments that have a higher risk of default than the index (which is based on a weighted average of its components) and negative for instruments that have a lower risk of default than the index. Inputs are distributed evenly throughout the range for spread to index. For yield and credit correlation, the majority of the inputs are concentrated in the center of the range. Inputs are concentrated in the middle to lower end of the range for upfront points. The range for loss severity reflects exposures that are concentrated in the middle to upper end of the range while the ranges for prepayment speed and default rates reflect exposures that are concentrated in the lower end of the range.
For equity derivatives, including those embedded in long-term debt, the range for equity correlation represents exposure primarily concentrated toward the upper end of the range. The range for long-dated volatilities represents exposure primarily concentrated toward the lower end of the range.
For interest rate derivatives, the diversity in the portfolio is reflected in wide ranges of inputs because the variety of currencies and tenors of the transactions requires the use of numerous foreign exchange and interest rate curves. Since foreign exchange
and interest rate correlations are measured between curves and across the various tenors on the same curve, the range of potential values can include both negative and positive values. For the correlation (IR/IR) range, the exposure represents the valuation of interest rate correlations on less liquid pairings and is concentrated at the upper end of the range. For the correlation (FX/IR) range, the exposure is the sensitivity to a broad mix of interest rate and foreign exchange correlations and is distributed evenly throughout the range. For long-dated inflation rates and volatilities as well as long-dated volatilities (FX), the inputs are concentrated in the middle of the range.
Sensitivity of Fair Value Measurements to Changes in Unobservable Inputs
Loans and Securities
For instruments backed by residential real estate assets, commercial real estate assets, and commercial loans, debt securities and other, a significant increase in market yields, default rates or loss severities would result in a significantly lower fair value for long positions. Short positions would be impacted in a directionally opposite way. The impact of changes in prepayment speeds would have differing impacts depending on the seniority of the instrument and, in the case of CLOs, whether prepayments can be reinvested.
For closed-end ARS, a significant increase in discount rates would result in a significantly lower fair value. For student loan and municipal ARS, a significant increase in projected tender price/refinancing levels would result in a significantly higher fair value.
Structured Liabilities and Derivatives
For credit derivatives, a significant increase in market yield, including spreads to indices, upfront points (i.e., a single upfront payment made by a protection buyer at inception), credit spreads, default rates or loss severities would result in a significantly lower fair value for protection sellers and higher fair value for protection buyers. The impact of changes in prepayment speeds would have differing impacts depending on the seniority of the instrument and, in the case of CLOs, whether prepayments can be reinvested.
Structured credit derivatives, which include tranched portfolio CDS and derivatives with derivative product company (DPC) and monoline counterparties, are impacted by credit correlation, including default and wrong-way correlation. Default correlation is a parameter that describes the degree of dependence among credit default rates within a credit portfolio that underlies a credit derivative instrument. The sensitivity of this input on the fair value varies depending on the level of subordination of the tranche. For
senior tranches that are net purchases of protection, a significant increase in default correlation would result in a significantly higher fair value. Net short protection positions would be impacted in a directionally opposite way. Wrong-way correlation is a parameter that describes the probability that as exposure to a counterparty increases, the credit quality of the counterparty decreases. A significantly higher degree of wrong-way correlation between a DPC counterparty and underlying derivative exposure would result in a significantly lower fair value.
For equity derivatives, equity-linked long-term debt (structured liabilities) and interest rate derivatives, a significant change in long-dated rates and volatilities and correlation inputs (e.g., the degree of correlation between an equity security and an index, between two different interest rates, or between interest rates and foreign exchange rates) would result in a significant impact to the fair value; however, the magnitude and direction of the impact depends on whether the Corporation is long or short the exposure.
Nonrecurring Fair Value
The Corporation heldholds certain assets that are measured at fair value, on a nonrecurring basisbut only in certain situations (for example, impairment) and these measurements are not included in the previous tables in this Note.referred to herein as nonrecurring. These assets primarily include LHFS, certain loans and leases, and foreclosed properties. The amounts below represent only balances measured at fair value during 20112012, 20102011 and 20092010, and still held as of the reporting date.
| | | | | | | | | | | | | | | | | |
Assets Measured at Fair Value on a Nonrecurring Basis | | | | | | | | | | | | | | | | |
| | December 31 | December 31 |
| | 2011 | | 2010 | 2012 | | 2011 |
| (Dollars in millions) | Level 2 | | Level 3 | | Level 2 | | Level 3 | Level 2 | | Level 3 | | Level 2 | | Level 3 |
| Assets | |
| | |
| | | | |
| |
| | |
| | | | |
|
| Loans held-for-sale | $ | 2,662 |
| | $ | 1,008 |
| | $ | 931 |
| | $ | 6,408 |
| $ | 5,692 |
| | $ | 1,136 |
| | $ | 2,662 |
| | $ | 1,008 |
|
| Loans and leases | 9 |
| | 10,629 |
| | 23 |
| | 11,917 |
| 21 |
| | 9,184 |
| | 9 |
| | 10,629 |
|
Foreclosed properties (1) | — |
| | 2,531 |
| | 10 |
| | 2,125 |
| 33 |
| | 1,918 |
| | — |
| | 2,531 |
|
| Other assets | 44 |
| | 885 |
| | 8 |
| | 95 |
| 36 |
| | 12 |
| | 44 |
| | 885 |
|
| | | | Gains (Losses) | | Gains (Losses) |
| (Dollars in millions) | 2011 | | 2010 | | 2009 | | 2012 | | 2011 | | 2010 |
| Assets | |
| | |
| | |
| | |
| | |
| | |
|
| Loans held-for-sale | $ | (181 | ) | | $ | 174 |
| | $ | (1,288 | ) | | $ | (8 | ) | | $ | (181 | ) | | $ | 174 |
|
Loans and leases (2) | (4,813 | ) | | (6,074 | ) | | (5,596 | ) | | (3,116 | ) | | (4,813 | ) | | (6,074 | ) |
| Foreclosed properties | (333 | ) | | (240 | ) | | (322 | ) | | (188 | ) | | (333 | ) | | (240 | ) |
| Other assets | — |
| | (50 | ) | | (268 | ) | | (16 | ) | | — |
| | (50 | ) |
| |
(1) | Amounts are included in other assets on the Corporation’s Consolidated Balance Sheet and represent fair value and related losses on foreclosed properties that were written down subsequent to their initial classification as foreclosed properties. |
| |
(2) | Gains (losses)Losses represent charge-offs on real estate-secured loans. |
The table below presents information about significant unobservable inputs related to the Corporation’s nonrecurring Level 3 financial assets and liabilities at December 31, 2012.
|
| | | | | | | | |
| | | | | | |
| Quantitative Information about Nonrecurring Level 3 Fair Value Measurements | |
| | | | | |
| (Dollars in millions) | | | Inputs |
| Financial Instrument | Fair Value | Valuation Technique | Significant Unobservable Inputs | Ranges of Inputs | Weighted Average |
| Instruments backed by residential real estate assets | $ | 9,932 |
| Discounted cash flow, Market comparables | Yield | 3% to 5% | 3 | % |
| Loans held-for-sale | 748 |
| Prepayment speed | 3% to 30% | 15 | % |
| Loans and leases | 9,184 |
| Default rate | 0% to 55% | 7 | % |
| | | Loss severity | 6% to 66% | 48 | % |
| | | OREO discount | 0% to 28% | 15 | % |
| | | Cost to sell | 8% | n/a |
|
| Instruments backed by commercial real estate assets | $ | 388 |
| Discounted cash flow | Yield | 4% to 13% | 6 | % |
| Loans held-for-sale | 388 |
| Loss severity | 24% to 88% | 53 | % |
n/a = not applicable
Instruments backed by residential real estate assets represent residential mortgages where the loan has been written down to the fair value of the underlying collateral or, in the case of LHFS, are carried at the lower of cost or fair value.
In addition to the instruments disclosed in the table above, the Corporation holds foreclosed residential properties where the fair value is based on unadjusted third-party appraisals or broker price opinions. Appraisals are conducted every 90 days. Factors considered in determining the fair value include geographic sales trends, the value of comparable surrounding properties as well as the condition of the property.
NOTE 2322 Fair Value Option
Loans and Loan Commitments
The Corporation electedelects to account for certain consumer and commercial loans and loan commitments that exceeded the Corporation’s single name credit risk concentration guidelines under the fair value option. Lending commitments, both funded and unfunded, are actively managed and monitored and, as appropriate, credit risk for these lending relationships may be mitigated through the use of credit derivatives, with the Corporation’s public side credit view and market perspectives determining the size and timing of the hedging activity. These credit derivatives do not meet the requirements for designation as accounting hedges and therefore are carried at fair value with changes in fair value recorded in other income (loss). Electing the fair value option allows the Corporation to carry these loans and loan commitments at fair value, which is more consistent with management’s view of the underlying economics and the manner in which they are managed. In addition, election of the fair value option allows the Corporation to reduce the accounting volatility that would otherwise result from the asymmetry created by accounting for the financial instruments at historical cost and the economic hedgescredit derivatives at fair value. An immaterial portion ofOf the changes in fair value for these loans, $1.2 billionwas attributable to changes in borrower-specific credit risk.
Loans Held-for-SaleHeld-for-sale
The Corporation electedelects to account for residential mortgage LHFS, commercial mortgage LHFS and other LHFS under the fair value option with interest income on these LHFS recorded in other interest income. These loans are actively managed and monitored and, as appropriate, certain market risks of the loans may be mitigated through the use of derivatives. The Corporation has elected not to designate the derivatives as qualifying accounting hedges and therefore they are carried at fair value with changes in fair value recorded in other income (loss). The changes in fair value of the loans are largely offset by hedging activities. An immaterial portionchanges in the fair value of the derivatives. Of the changes in fair value for these loans,$425 million was attributable to changes in borrower-specific credit risk. Election of the fair value option allows the Corporation to reduce the accounting volatility that would otherwise result from the asymmetry created by accounting for the financial instruments at historicalthe lower of cost or fair value and the economic hedgesderivatives at fair value. The Corporation has not elected to account for other LHFS under the fair value option primarily because these loans are floating-rate loans that are not economically hedged using derivative instruments.
Loans Reported as Trading Account Assets
The Corporation electedelects to account for certain loans that are held for the purpose of trading and risk-managed on a fair value basis under the fair value option. An immaterial portion of the changes in fair value for these loans was attributable to changes in borrower-specific credit risk.
Other Assets
The Corporation electedelects to account for certain private equity investments that are not in an investment company under the fair value option as this measurement basis is consistent with applicable accounting guidance for similar investments that are in an investment company. The Corporation also elects to account for certain long-term fixed-rate margin loans that are hedged with derivatives under the fair value option. Election of the fair value option allows the Corporation to reduce the accounting volatility that would otherwise result from the asymmetry created by accounting for the financial instruments at historical cost and the derivatives at fair value.
Securities Financing Agreements
The Corporation electedelects to account for certain securities financing agreements, including resale and repurchase agreements, under the fair value option based on the tenor of the agreements, which reflects the magnitude of the interest rate risk. The majority of securities financing agreements collateralized by U.S. government securities are not accounted for under the fair value option as these contracts are generally short-dated and therefore the interest rate risk is not significant.
Long-term Deposits
The Corporation electedelects to account for certain long-term fixed-rate and rate-linked deposits that are economically hedged with derivatives and do not qualify for hedge accounting under the fair value option. Election of the fair value option allows the Corporation to reduce the accounting volatility that would otherwise result from the asymmetry created by accounting for the financial instruments at historical cost and the economic hedgesderivatives at fair value. The Corporation did not elect to carry other long-term deposits at fair value because they were not economically hedged using derivatives.
Other Short-term Borrowings
The Corporation electedelects to account for certain other short-term borrowings under the fair value option because this debt is risk-managed on a fair value basis.
Long-term Debt
The Corporation electedelects to account for certain long-term debt, primarily structured liabilities, under the fair value option. This long-term debt is either risk-managed on a fair value basis. Election ofbasis or the fair value option allows the Corporation to reduce the accounting volatility that would otherwise result from the asymmetry created by accountingrelated hedges do not qualify for these financial instruments at historical cost and the economic hedges at fair value.hedge accounting.
Asset-backed Secured Financings
The Corporation electedelects to account for certain asset-backed secured financings, which are classified in other short-term borrowings, under the fair value option. Election of the fair value option allows the Corporation to reduce the accounting volatility that would otherwise result from the asymmetry created by accounting for the asset-backed secured financings at historical cost and the corresponding mortgage LHFS securing these financings at fair value.
The table below provides information about the fair value carrying amount and the contractual principal outstanding of assets and liabilities accounted for under the fair value option at December 31, 20112012 and 20102011.
| | | | | | | | | | | | | | | | | | | | | | | | | |
| Fair Value Option Elections | | | | | | | | | | | | | | | | | | | | | | |
| | | | | | | | | | | | | | | | | | | | | | | |
| | December 31 | December 31 |
| | 2011 | | 2010 | 2012 | | 2011 |
| (Dollars in millions) | Fair Value Carrying Amount | | Contractual Principal Outstanding | | Fair Value Carrying Amount Less Unpaid Principal | | Fair Value Carrying Amount | | Contractual Principal Outstanding | | Fair Value Carrying Amount Less Unpaid Principal | Fair Value Carrying Amount | | Contractual Principal Outstanding | | Fair Value Carrying Amount Less Unpaid Principal | | Fair Value Carrying Amount | | Contractual Principal Outstanding | | Fair Value Carrying Amount Less Unpaid Principal |
| Loans reported as trading account assets | $ | 1,151 |
| | $ | 2,371 |
| | $ | (1,220 | ) | | $ | 964 |
| | $ | 1,917 |
| | $ | (953 | ) | $ | 1,663 |
| | $ | 2,879 |
| | $ | (1,216 | ) | | $ | 1,151 |
| | $ | 2,371 |
| | $ | (1,220 | ) |
| Trading inventory - other | | 2,170 |
| | n/a |
| | n/a |
| | 1,173 |
| | n/a |
| | n/a |
|
| Consumer and commercial loans | 8,804 |
| | 10,823 |
| | (2,019 | ) | | 3,269 |
| | 3,638 |
| | (369 | ) | 9,002 |
| | 9,576 |
| | (574 | ) | | 8,804 |
| | 10,823 |
| | (2,019 | ) |
| Loans held-for-sale | 7,630 |
| | 9,673 |
| | (2,043 | ) | | 25,942 |
| | 28,370 |
| | (2,428 | ) | 11,659 |
| | 12,676 |
| | (1,017 | ) | | 7,630 |
| | 9,673 |
| | (2,043 | ) |
| Securities financing agreements | 121,688 |
| | 121,092 |
| | 596 |
| | 116,023 |
| | 115,053 |
| | 970 |
| 141,309 |
| | 140,791 |
| | 518 |
| | 121,688 |
| | 121,092 |
| | 596 |
|
| Other assets | 251 |
| | n/a |
| | n/a |
| | 310 |
| | n/a |
| | n/a |
| 453 |
| | 270 |
| | 183 |
| | 251 |
| | n/a |
| | n/a |
|
| Long-term deposits | 3,297 |
| | 3,035 |
| | 262 |
| | 2,732 |
| | 2,692 |
| | 40 |
| 2,262 |
| | 2,046 |
| | 216 |
| | 3,297 |
| | 3,035 |
| | 262 |
|
| Asset-backed secured financings | 650 |
| | 1,271 |
| | (621 | ) | | 706 |
| | 1,356 |
| | (650 | ) | 741 |
| | 1,176 |
| | (435 | ) | | 650 |
| | 1,271 |
| | (621 | ) |
| Unfunded loan commitments | 1,249 |
| | n/a |
| | n/a |
| | 866 |
| | n/a |
| | n/a |
| 528 |
| | n/a |
| | n/a |
| | 1,249 |
| | n/a |
| | n/a |
|
| Other short-term borrowings | 5,908 |
| | 5,909 |
| | (1 | ) | | 6,472 |
| | 6,472 |
| | — |
| 3,333 |
| | 3,333 |
| | — |
| | 5,908 |
| | 5,909 |
| | (1 | ) |
Long-term debt (1) | 46,239 |
| | 55,854 |
| | (9,615 | ) | | 50,984 |
| | 54,656 |
| | (3,672 | ) | 49,161 |
| | 50,792 |
| | (1,631 | ) | | 46,239 |
| | 55,854 |
| | (9,615 | ) |
| |
(1) | The majority of the difference between the fair value carrying amount and contractual principal outstanding at December 31, 2012 and 2011 relates to the impact of widening of the Corporation’s credit spreads as well as the fair value of the embedded derivative, where applicable. |
n/a = not applicable
|
| | |
| | | Bank of America 2012 265271 |
The following tables providetable below provides information about where changes in the fair value of assets and liabilities accounted for under the fair value option are included in the Corporation’s Consolidated Statement of Income for 20112012, 20102011 and 20092010.
| | | | | | | | | | | | | | | | | |
Gains (Losses) Relating to Assets and Liabilities Accounted for Under the Fair Value Option | | | | | | | | | | | | | | | | |
| | 2011 | 2012 |
| (Dollars in millions) | Trading Account Profits (Losses) | | Mortgage Banking Income (Loss) | | Other Income (Loss) (1) | | Total | Trading Account Profits (Losses) | | Mortgage Banking Income (Loss) | | Other Income (Loss) | | Total |
| Loans reported as trading account assets | $ | 73 |
| | $ | — |
| | $ | — |
| | $ | 73 |
| $ | 232 |
| | $ | — |
| | $ | — |
| | $ | 232 |
|
| Consumer and commercial loans | 15 |
| | — |
| | (275 | ) | | (260 | ) | 17 |
| | — |
| | 542 |
| | 559 |
|
| Loans held-for-sale | (20 | ) | | 4,137 |
| | 148 |
| | 4,265 |
| 75 |
| | 2,116 |
| | 190 |
| | 2,381 |
|
| Securities financing agreements | — |
| | — |
| | 127 |
| | 127 |
| (90 | ) | | — |
| | — |
| | (90 | ) |
| Other assets | — |
| | — |
| | 196 |
| | 196 |
| — |
| | — |
| | 12 |
| | 12 |
|
| Long-term deposits | — |
| | — |
| | (77 | ) | | (77 | ) | — |
| | — |
| | 29 |
| | 29 |
|
| Asset-backed secured financings | — |
| | (30 | ) | | — |
| | (30 | ) | — |
| | (180 | ) | | — |
| | (180 | ) |
| Unfunded loan commitments | — |
| | — |
| | (429 | ) | | (429 | ) | — |
| | — |
| | 704 |
| | 704 |
|
| Other short-term borrowings | 261 |
| | — |
| | — |
| | 261 |
| 1 |
| | — |
| | — |
| | 1 |
|
Long-term debt (2) | 2,149 |
| | — |
| | 3,320 |
| | 5,469 |
| |
Long-term debt (1) | | (1,888 | ) | | — |
| | (5,107 | ) | | (6,995 | ) |
| Total | | $ | (1,653 | ) | | $ | 1,936 |
| | $ | (3,630 | ) | | $ | (3,347 | ) |
| | | | | | | | | |
| | | 2011 |
| Loans reported as trading account assets | | $ | 73 |
| | $ | — |
| | $ | — |
| | $ | 73 |
|
| Consumer and commercial loans | | 15 |
| | — |
| | (275 | ) | | (260 | ) |
| Loans held-for-sale | | (20 | ) | | 4,137 |
| | 148 |
| | 4,265 |
|
| Securities financing agreements | | 127 |
| | — |
| | — |
| | 127 |
|
| Other assets | | — |
| | — |
| | 196 |
| | 196 |
|
| Long-term deposits | | — |
| | — |
| | (77 | ) | | (77 | ) |
| Asset-backed secured financings | | — |
| | (30 | ) | | — |
| | (30 | ) |
| Unfunded loan commitments | | — |
| | — |
| | (429 | ) | | (429 | ) |
| Other short-term borrowings | | 261 |
| | — |
| | — |
| | 261 |
|
Long-term debt (1) | | 2,149 |
| | — |
| | 3,320 |
| | 5,469 |
|
| Total | $ | 2,478 |
| | $ | 4,107 |
| | $ | 3,010 |
| | $ | 9,595 |
| $ | 2,605 |
| | $ | 4,107 |
| | $ | 2,883 |
| | $ | 9,595 |
|
| | | | | | | | | | | | | | | |
| | 2010 | 2010 |
| Loans reported as trading account assets | $ | 157 |
| | $ | — |
| | $ | — |
| | $ | 157 |
| $ | 157 |
| | $ | — |
| | $ | — |
| | $ | 157 |
|
| Commercial loans | 2 |
| | — |
| | 82 |
| | 84 |
| 2 |
| | — |
| | 82 |
| | 84 |
|
| Loans held-for-sale | — |
| | 9,091 |
| | 493 |
| | 9,584 |
| — |
| | 9,091 |
| | 493 |
| | 9,584 |
|
| Securities financing agreements | — |
| | — |
| | 52 |
| | 52 |
| 52 |
| | — |
| | — |
| | 52 |
|
| Other assets | — |
| | — |
| | 107 |
| | 107 |
| — |
| | — |
| | 107 |
| | 107 |
|
| Long-term deposits | — |
| | — |
| | (48 | ) | | (48 | ) | — |
| | — |
| | (48 | ) | | (48 | ) |
| Asset-backed secured financings | — |
| | (95 | ) | | — |
| | (95 | ) | — |
| | (95 | ) | | — |
| | (95 | ) |
| Unfunded loan commitments | — |
| | — |
| | 23 |
| | 23 |
| — |
| | — |
| | 23 |
| | 23 |
|
| Other short-term borrowings | (192 | ) | | — |
| | — |
| | (192 | ) | (192 | ) | | — |
| | — |
| | (192 | ) |
Long-term debt (2) | (621 | ) | | — |
| | 18 |
| | (603 | ) | |
Long-term debt (1) | | (621 | ) | | — |
| | 18 |
| | (603 | ) |
| Total | $ | (654 | ) | | $ | 8,996 |
| | $ | 727 |
| | $ | 9,069 |
| $ | (602 | ) | | $ | 8,996 |
| | $ | 675 |
| | $ | 9,069 |
|
| | | | | | | | | |
| | 2009 | |
| Loans reported as trading account assets | $ | 259 |
| | $ | — |
| | $ | — |
| | $ | 259 |
| |
| Commercial loans | 25 |
| | — |
| | 521 |
| | 546 |
| |
| Loans held-for-sale | (211 | ) | | 8,251 |
| | 588 |
| | 8,628 |
| |
| Securities financing agreements | — |
| | — |
| | (292 | ) | | (292 | ) | |
| Other assets | 379 |
| | — |
| | (177 | ) | | 202 |
| |
| Long-term deposits | — |
| | — |
| | 35 |
| | 35 |
| |
| Asset-backed secured financings | — |
| | (11 | ) | | — |
| | (11 | ) | |
| Unfunded loan commitments | — |
| | — |
| | 1,365 |
| | 1,365 |
| |
| Other short-term borrowings | (236 | ) | | — |
| | — |
| | (236 | ) | |
Long-term debt (2) | (3,938 | ) | | — |
| | (4,900 | ) | | (8,838 | ) | |
| Total | $ | (3,722 | ) | | $ | 8,240 |
| | $ | (2,860 | ) | | $ | 1,658 |
| |
| |
(1) | Other assets includes $177 millionThe majority of equity investment loss for 2009.
|
| |
(2)
| Balancesthe net gains (losses) in trading account profits (losses) relate to the embedded derivative in structured liabilities and are offset by gains (losses) on derivatives and securities that hedge these liabilities. The net gains (losses) in other income (loss) for long-term debt relate to changes in fair value that were attributable tothe impact on structured liabilities of changes in the Corporation’s credit spreads.spread. |
NOTE 2423 Fair Value of Financial Instruments
The fair values of financial instruments and their classifications within the fair value hierarchy have been derived using methodologies described in Note 2221 – Fair Value Measurements. The following disclosures include financial instruments where only a portion of the ending balance at December 31, 20112012 and 20102011 was carried at fair value on the Corporation’s Consolidated Balance Sheet.
Short-term Financial Instruments
The carrying value of short-term financial instruments, including cash and cash equivalents, time deposits placed and other short-term investments, federal funds sold and purchased, resale and certain repurchase agreements, customer and other receivables, customer payables (within accrued expenses and other liabilities
on the Corporation’s Consolidated Balance Sheet), and other short-term investments and borrowings approximates the fair value of these instruments. These financial instruments generally expose the Corporation to limited credit risk and have
no stated maturities or have short-term maturities and carry interest rates that approximate market. The Corporation elected to account for certain repurchase agreements under the fair value option.
Under the fair value hierarchy, cash and cash equivalents are classified as Level 1. Time deposits placed and other short-term investments, such as U.S. government securities and short-term commercial paper, are classified as Level 1 and Level 2. Federal funds sold and purchased are classified as Level 2. Resale and repurchase agreements are classified as Level 2 because they are generally short-dated and/or variable-rate instruments collateralized by U.S. government or agency securities. Customer
and other receivables primarily consist of margin loans, servicing advances and other accounts receivable and are classified as Level 2 and Level 3. Customer payables (within accrued expenses and other liabilities) and other short-term borrowings are classified as Level 2.
Held-to-maturity Debt Securities
HTM debt securities, which consist of U.S. agency debt securities, are classified as Level 2 using the same methodologies as AFS U.S. agency debt securities. For additional information on HTM debt securities, see Note 4 – Securities.
Loans
Fair values were generally determined by discounting both principal and interest cash flows expected to be collected using an observablea discount rate for similar instruments with adjustments that the Corporation believes a market participant would consider in determining fair value. The Corporation estimates the cash flows expected to be collected using internal credit risk, interest rate and prepayment risk models that incorporate the Corporation’s best estimate of current key assumptions, such as default rates, loss severity and prepayment speeds for the life of the loan. The
carrying value of loans is presented net of the applicable allowance for loan losses and excludes leases. The Corporation elected to account for certain large corporatecommercial loans that exceeded the Corporation’s single name credit risk concentration guidelines by an amount that would require hedging under the fair value option.
Mortgage Servicing Rights
Commercial and residential reverse MSRs, which are carried at the lower of cost or market value and accounted for using the amortization method, are classified as Level 3. For additional information on MSRs, see Note 24 – Mortgage Servicing Rights.
Deposits
The fair value for certain deposits with stated maturities was determined by discounting contractual cash flows using current market rates for instruments with similar maturities. The carrying value of non-U.S. time deposits approximates fair value. For deposits with no stated maturities, the carrying value was considered to approximate fair value and does not take into account the significant value of the cost advantage and stability of the Corporation’s long-term relationships with depositors. The Corporation accounts for certain long-term fixed-rate deposits that are economically hedged with derivatives on a risk management basis under the fair value option.
Long-term Debt
The Corporation uses quoted market prices, when available, to estimate fair value for its long-term debt. When quoted market prices are not available, fair value is estimated based on current market interest rates and credit spreads for debt with similar terms and maturities. The Corporation accounts for certain structured liabilities under the fair value option.
Fair Value of Financial Instruments
The carrying values and fair values by fair value hierarchy of certain financial instruments where only a portion of the ending balance was carried at fair value are presented in the table below.
|
| | | | | | | | | | | | | | | |
| | | | | | | | |
| Fair Value of Financial Instruments |
| | | | | | | | |
| | December 31, 2012 |
| | | | Fair Value |
| (Dollars in millions) | Carrying Value | | Level 2 | | Level 3 | | Total |
| Financial assets | | | | | | | |
| Loans | $ | 859,875 |
| | $ | 105,119 |
| | $ | 772,761 |
| | $ | 877,880 |
|
| Loans held-for-sale | 19,413 |
| | 15,087 |
| | 4,321 |
| | 19,408 |
|
| Financial liabilities | | | | | | | |
| Deposits | 1,105,261 |
| | 1,105,669 |
| | — |
| | 1,105,669 |
|
| Long-term debt | 275,585 |
| | 281,173 |
| | 2,301 |
| | 283,474 |
|
The carrying values and fair values of certain financial instruments where only a portion of the ending balance at December 31, 2011 and 2010was carried at fair value are presented in the table below.
| | | | | | | | | | | | | |
Fair Value of Financial Instruments | | | | | | | | | | | | |
| | December 31 | December 31, 2011 |
| | 2011 | | 2010 | |
| (Dollars in millions) | Carrying Value | | Fair Value | | Carrying Value | | Fair Value | Carrying Value | | Fair Value |
| Financial assets | |
| | |
| | |
| | |
| |
| | |
|
| Held-to-maturity debt securities | $ | 35,265 |
| | $ | 35,442 |
| | $ | 427 |
| | $ | 427 |
| |
| Loans | 870,520 |
| | 843,392 |
| | 876,739 |
| | 861,695 |
| $ | 870,520 |
| | $ | 849,685 |
|
| Financial liabilities | |
| | |
| | |
| | |
| |
| | |
|
| Deposits | 1,033,041 |
| | 1,033,248 |
| | 1,010,430 |
| | 1,010,460 |
| 1,033,041 |
| | 1,033,248 |
|
| Long-term debt | 372,265 |
| | 343,211 |
| | 448,431 |
| | 441,672 |
| 372,265 |
| | 343,211 |
|
Commercial Unfunded Lending Commitments
Fair values were generally determined using a discounted cash flow valuation approach which is applied using market-based CDS or internally developed benchmark credit curves. The Corporation accounts for certain loan commitments under the fair value option.
The carrying values and fair values of the Corporation’s commercial unfunded lending commitments were $1.0 billion and $4.5 billion at December 31, 2012, and $2.0 billion and $7.1 billion at December 31, 2011. Commercial unfunded lending commitments are primarily classified as Level 3. The carrying value of these commitments is classified in accrued expenses and other liabilities on the Corporation’s Consolidated Balance Sheet.
The Corporation does not estimate the fair values of consumer unfunded lending commitments because, in many instances, the Corporation can reduce or cancel these commitments by providing notice to the borrower. For additional information on commitments, see Note 13 – Commitments and Contingencies.
NOTE 2524 Mortgage Servicing Rights
The Corporation accounts for consumer MSRs at fair value with changes in fair value recorded in the Corporation’s Consolidated Statement of Income in mortgage banking income (loss). The Corporation economically hedgesmanages the risk in these MSRs with certain derivatives and securities including MBS and U.S. Treasuries.Treasuries, as well as certain derivatives such as options and interest rate swaps, which are not designated as accounting hedges. The securities that economically hedgeused to manage the risk in the MSRs are classified in other assets with changes in the fair value of the securities and the related interest income recorded in mortgage banking income (loss).
The table below presents activity for residential first-lien MSRs for 20112012 and 20102011. Commercial and residential reverse MSRs, which are carried at the lower of carryingcost or market value and accounted for using the amortization method, totaled $132135 million and $277132 million at December 31, 20112012 and 20102011, and are not included in the tables in this Note.
| | | | | | | |
| Rollforward of Mortgage Servicing Rights | | Rollforward of Mortgage Servicing Rights |
| | | | | | | |
| (Dollars in millions) | 2011 | | 2010 | 2012 | | 2011 |
| Balance, January 1 | $ | 14,900 |
| | $ | 19,465 |
| $ | 7,378 |
| | $ | 14,900 |
|
| Additions | 1,656 |
| | 3,626 |
| 374 |
| | 1,656 |
|
| Sales | (896 | ) | | (110 | ) | (122 | ) | | (896 | ) |
Impact of customer payments (1) | (2,621 | ) | | (3,760 | ) | (1,484 | ) | | (2,621 | ) |
Impact of changes in interest rates and other market factors (2) | (4,890 | ) | | (3,224 | ) | (867 | ) | | (4,890 | ) |
Model and other cash flow assumption changes: (3) | |
| | |
| |
| | |
|
| Projected cash flows, primarily due to increases in cost to service loans | (2,306 | ) | | (3,161 | ) | |
Projected cash flows, primarily due to (increases) decreases in costs to service loans (4) | | 443 |
| | (2,306 | ) |
| Impact of changes in the Home Price Index | 428 |
| | 937 |
| (112 | ) | | 428 |
|
| Impact of changes in the prepayment model | 1,818 |
| | 1,298 |
| |
| Impact of changes to the prepayment model | | 435 |
| | 1,818 |
|
| Other model changes | (711 | ) | | (171 | ) | (329 | ) | | (711 | ) |
| Balance, December 31 | $ | 7,378 |
| | $ | 14,900 |
| $ | 5,716 |
| | $ | 7,378 |
|
| Mortgage loans serviced for investors (in billions) | $ | 1,379 |
| | $ | 1,628 |
| $ | 1,045 |
| | $ | 1,379 |
|
| |
(1) | Represents the change in the market value of the MSR asset due to the impact of customer payments received during the period. |
| |
(2) | These amounts reflect the changes in the modeled MSR fair value largelyprimarily due to observed changes in interest rates, volatility, spreads and the shape of the forward swap curve. |
| |
(3) | These amounts reflect periodic adjustments to the valuation model as well as changes in certain cash flow assumptions such as costscost to service and ancillary income per loan. |
| |
(4) | As part of the MSR fair value estimation process, the Corporation increased its estimated cost to service during 2011 due to higher costs expected from foreclosure delays and procedures, the implementation of various loan modification programs, and compliance with new banking regulations. During 2012, the Corporation has continued to refine its estimates of cost to service and ancillary income to be consistent with market participants’ view which resulted in a decrease to the estimated cost to service. |
The Corporation primarily uses an OAS valuation approach which factors in prepayment risk to determine the fair value of MSRs. This approach consists of projecting servicing cash flows under multiple interest rate scenarios and discounting these cash flows using risk-adjusted discount rates. In late 2012, the Corporation solicited and received multiple proposals from independent third parties for the purchase of a portion of the
MSRs. The Corporation used the prices in the proposals, as adjusted to exclude the portion of the pricing that was not specific to the MSRs, as a third-party pricing source in the valuation of the MSRs. Use of this pricing source had the effect of increasing the fair value of the MSRs by $342 million, which is included in Other model changes in the table above, to bring the fair value of the MSRs to an amount consistent with the third-party price discovery.
The significant economic assumptions used in determining the fair value of MSRs at December 31, 20112012 and 20102011 are presented below.
| | | | | | | | | | | | | | | | | |
Significant Economic Assumptions | | | | | | | | | | | | | | | | |
| | December 31 | December 31 |
| | 2011 | | 2010 | 2012 | | 2011 |
| (Dollars in millions) | Fixed | | Adjustable | | Fixed | | Adjustable | |
| | | Fixed | | Adjustable | | Fixed | | Adjustable |
| Weighted-average OAS | 2.80 | % | | 5.61 | % | | 2.17 | % | | 5.12 | % | 4.00 | % | | 6.63 | % | | 2.80 | % | | 5.61 | % |
| Weighted-average life, in years | 3.78 |
| | 2.10 |
| | 4.85 |
| | 2.29 |
| 3.65 |
| | 2.10 |
| | 3.78 |
| | 2.10 |
|
The table below presents the sensitivity of the weighted-average lives and fair value of MSRs to changes in modeled assumptions. These sensitivities are hypothetical and should be used with caution. As the amounts indicate, changes in fair value based on variations in assumptions generally cannot be extrapolated because the relationship of the change in assumption to the change in fair value may not be linear. Also, the effect of a variation in a particular assumption on the fair value of MSRs that continue to be held by the Corporation is calculated without changing any other assumption. In reality, changes in one factor may result in changes in another, which might magnify or counteract the sensitivities. The below sensitivities do not reflect any hedge strategies that may be undertaken to mitigate such risk.
|
| | | | | | | | | | | |
| | | | | | | | |
| Sensitivity Impacts |
| | | | | | | | |
| | December 31, 2012 |
| | Change in Weighted-average Lives | | |
| (Dollars in millions) | Fixed | | Adjustable | | Change in Fair Value |
| Prepayment rates | |
| | | |
| | | |
|
| Impact of 10% decrease | 0.31 |
| years | | 0.20 |
| years | | $ | 510 |
|
| Impact of 20% decrease | 0.67 |
| | | 0.43 |
| | | 1,094 |
|
| Impact of 10% increase | (0.27 | ) | | | (0.17 | ) | | | (450 | ) |
| Impact of 20% increase | (0.51 | ) | | | (0.32 | ) | | | (849 | ) |
| OAS level | |
| | | |
| | | |
|
| Impact of 100 bps decrease | | | | | | | $ | 256 |
|
| Impact of 200 bps decrease | | | | | | | 535 |
|
| Impact of 100 bps increase | | | | | | | (237 | ) |
| Impact of 200 bps increase | | | | | | | (455 | ) |
|
| | | | | | | | | | | |
| | | | | | | | |
| Sensitivity Impacts |
| | | | | | | | |
| | December 31, 2011 |
| | Change in Weighted-average Lives | | |
| (Dollars in millions) | Fixed | | Adjustable | | Change in Fair Value |
| Prepayment rates | |
| | | |
| | | |
|
| Impact of 10% decrease | 0.29 |
| years | | 0.14 |
| years | | $ | 639 |
|
| Impact of 20% decrease | 0.63 |
| | | 0.31 |
| | | 1,375 |
|
| Impact of 10% increase | (0.25 | ) | | | (0.12 | ) | | | (561 | ) |
| Impact of 20% increase | (0.48 | ) | | | (0.23 | ) | | | (1,056 | ) |
| OAS level | |
| | | |
| | | |
|
| Impact of 100 bps decrease | n/a |
| | | n/a |
| | | $ | 375 |
|
| Impact of 200 bps decrease | n/a |
| | | n/a |
| | | 782 |
|
| Impact of 100 bps increase | n/a |
| | | n/a |
| | | (345 | ) |
| Impact of 200 bps increase | n/a |
| | | n/a |
| | | (664 | ) |
NOTE 25 Merger and Restructuring Activity
n/Merger and restructuring charges are recorded in the Corporation’s Consolidated Statement of Income and include incremental costs to integrate the operations of the Corporation and its most recent acquisitions. These charges represent costs associated with these activities and do not represent ongoing costs of the fully integrated combined organization. The table below presents the components of merger and restructuring charges.
|
| | | | | | | | |
| | | | | |
| Merger and Restructuring Charges |
| | | | | |
| (Dollars in millions) | | 2011 | | 2010 |
| Severance and employee-related charges | | $ | 226 |
| | $ | 455 |
|
| Systems integrations and related charges | | 285 |
| | 1,137 |
|
| Other | | 127 |
| | 228 |
|
| Total merger and restructuring charges | | $ | 638 |
| | $ | 1,820 |
|
There were no merger and restructuring charges in 2012. For 2011, all merger-related charges related to the Merrill Lynch acquisition. For 2010, merger-related charges include $1.6 billion related to the Merrill Lynch acquisition and $202 million related to earlier acquisitions.
The table below presents the changes in restructuring reserves for 2012 and 2011. Restructuring reserves are established by a = not applicablecharge to merger and restructuring charges, and the restructuring charges are included in the table. Substantially all of the amounts in the table relate to the Merrill Lynch acquisition.
|
| | | | | | | |
| | | | |
| Restructuring Reserves |
| | |
| (Dollars in millions) | 2012 | | 2011 |
| Balance, January 1 | $ | 234 |
| | $ | 336 |
|
| Exit costs and restructuring charges | — |
| | 217 |
|
| Cash payments and other | (234 | ) | | (319 | ) |
| Balance, December 31 | $ | — |
| | $ | 234 |
|
Amounts added to the restructuring reserves in 2011 related to severance and other employee-related costs.
NOTE 26Business Segment Information
The Corporation reports the results of its operations through sixfive business segments: Deposits, Card Services,Consumer & Business Banking (CBB), Consumer Real Estate Services (CRES), formerly Home Loans & Insurance, Global Commercial Banking, Global Banking & Markets (GBAM) and Global Wealth & Investment Management (GWIM),, with the remaining operations recorded in All Other. The Corporation may periodically reclassify business segment results based on modifications to its management reporting methodologies and changes in organizational alignment. Prior period amounts have been reclassified to conform to current period presentation.
DepositsConsumer & Business Banking
DepositsCBB includes the results of consumer deposits activities which consist ofoffers a comprehensivediversified range of credit, banking and investment products providedand services to consumers and small businesses. Deposit productsCBB product offerings include traditional savings accounts, money market savings accounts, CDs and IRAs, noninterest- and interest-bearing checking accounts, investment accounts and products as well as investment accountscredit and products. These products providedebit cards in the U.S. to consumers and small businesses. Customers and clients have access to a relatively stable sourcefranchise that stretches coast to coast through 32 states and the District of fundingColumbia. The franchise network includes approximately 5,500 banking centers, 16,300 ATMs, nationwide call centers, and liquidity. The Corporation earns net interest spread revenue from investing this liquidity in earning assets through client-facing lendingonline and ALM activities. The revenue is allocated to the deposit products using a funds transfer pricing process which takes into account the interest rates and implied maturity of the deposits.mobile platforms. DepositsCBB also generates fees such as account service fees, non-sufficient funds fees, overdraft charges and ATM fees, as well as investment and brokerage fees from Merrill Edge accounts. In addition, Deposits includes the netoffers a wide range of lending-
impactrelated products and services, integrated working capital management and treasury solutions through a network of migrating customersoffices and client relationship teams along with various product partners to U.S.-based companies generally with annual sales of $1 million to $50 million. CBB results are impacted by the migration of clients and their related deposit and loan balances between DepositsCBB and other client-managed businesses. Subsequent to the date of migration, the associated net interest income, service chargesnoninterest income and noninterest expense are recorded in the business to which deposits were transferred.
Card Services
Card Services is one of the leading issuers of credit and debit cards in the U.S. to consumers and small businesses providing a broad offering of lending products including co-branded and affinity products. During 2011, the Corporation sold its Canadian consumer card business and is evaluating its remaining international consumer card operations. In light of these actions, the international consumer card business results were moved to All Other effective July 1, 2011, prior periods have been reclassified and the Global Card Services business segment was renamed Card Services.
The Corporation reports its Card Services results in accordance with new consolidation guidance that was effective on January 1, 2010. Under this new consolidation guidance, the Corporation consolidated all previously unconsolidated credit card trusts. Accordingly, 2011 and 2010 results are comparable to 2009 results that were presented on a managed basis, which was consistent with the way that management evaluated the results of the business. Managed basis assumed that securitized loans were not sold and presented earnings on these loans in a manner similar to the way loans that have not been sold are presented.clients migrated.
Consumer Real Estate Services
CRES provides an extensive line of consumer real estate products and services to customers nationwide. CRES products include fixed- and adjustable-rate first-lien mortgage loans for home purchase and refinancing needs, HELOC and home equity loans. First mortgage products are either sold into the secondary mortgage market to investors, while generally retaining MSRs and the Bank of America customer relationships, or are held on the Corporation’s Consolidated Balance Sheet in All Other for ALM purposes. HELOC and home equity loans are retained on the CRES balance sheet. CRES services mortgage loans, including those loans it owns, loans owned by other business segments and All Other, and loans owned by outside investors.
The financial results of the on-balance sheet loans are reported in the business segment that owns the loans or All Other. CRES is not impacted by the Corporation’s first mortgage production retention decisions as CRES is compensated for loans held for ALM purposes on a management accounting basis, with a corresponding offset recorded in All Other, and for servicing loans owned by other business segments and All Other. CRES also includes the impact of transferring customers and their related loan balances between GWIM and CRES based on client segmentation thresholds. Subsequent to the date of transfer, the associated net interest income and noninterest expense are recorded in the business segment to which loans were transferred.
Global Commercial Banking
Global Commercial Banking provides a wide range of lending-related products and services, integrated working capital management and treasury solutions to clients, and underwriting and advisory services through the Corporation’s network of offices and client relationship teams along with various product partners. ClientsGlobal Banking’s lending products and services include commercial loans, leases, commitment facilities, trade finance, real estate lending, asset-based lending and direct/indirect consumer loans. Global Banking’s treasury solutions business includes treasury management, foreign exchange and short-term investing options. Global Banking also works with clients to provide investment banking products such as debt and equity underwriting and distribution, and merger-related and other advisory services. The economics of certain investment banking and underwriting activities are shared primarily between Global Banking and Global Markets based on the contribution by, and involvement of each segment. Global Banking clients include middle-market companies, commercial real estate firms, auto dealerships, not-for-profit companies, federal and state governments, municipalities, large global corporations, financial institutions and leasing clients.
|
| | |
| | 268Bank of America 20112012275
| | |
Global Markets
firmsGlobal Markets offers sales and governments,trading services, including research, to institutional clients across fixed income, credit, currency, commodity and are generally defined as companies with sales up to $2 billion. Lending products and services include commercial loans and commitment facilities, real estate lending, asset-based lending and indirect consumer loans. Capital management and treasury solutions include treasury management, foreign exchange and short-term investing options. In 2011, management responsibility for the merchant services joint venture was moved from GBAM toequity businesses. Global Commercial BankingMarkets. Prior periods have been reclassified to reflect product coverage includes securities and derivative products in both the change.primary and secondary markets.
Global Banking & Markets
GBAM provides advisory services,market-making, financing, securities clearing, settlement and custody services globally to institutional investor clients in support of their investing and trading activities. GBAMGlobal Markets also works with commercial and corporate clients to provide debt and equity underwriting and distribution capabilities, merger-related and other advisory services, and risk management products using interest rate, equity, credit, currency and commodity derivatives, foreign exchange, fixed-income and mortgage-related products. As a result of the Corporation’s market-making activities in these products, it Global Markets may be required to manage positionsrisk in government securities, equity and equity-linked securities, high-grade and high-yield corporate debt securities, commercial paper, MBS, commodities and ABS. CorporateThe economics of certain investment banking services provide a wide range of lending-related products and services, integrated working capital management underwriting activities are shared primarily between Global Markets and treasury solutions to clients through Global Banking based on the Corporation’s network of offices and client relationship teams along with various product partners. Corporate clients are generally defined as companies with annual sales greater than $2 billion.activities performed by each segment.
Global Wealth & Investment Management
GWIM provides comprehensive wealth management capabilitiessolutions to a broad base of clients from emerging affluent to the ultra-high-net-worth.ultra-wealthy. These services include investment and brokerage services, estate and financial planning, fiduciary portfolio management, cash and liability management, and specialty asset management. GWIM also provides retirement and benefit plan services, philanthropic management and asset management to individual and institutional clients. GWIM results are impacted by the migration of clients and their related deposit and loan balances to or frombetween DepositsGWIM , CRESand the ALM portfolio. Migration in the current year includes the additional movement of balances to Merrill Edge, which is in Deposits.other client-managed businesses. Subsequent to the date of migration, the associated net interest income, noninterest income and noninterest expense are recorded in the business to which the clients migrated. In 2012, the Corporation entered into an agreement to sell the GWIM IWM businesses based outside of the U.S. and sold its Japanese brokerage joint venture. As a result of these actions, the IWM businesses and the Japanese brokerage joint venture results were moved to All Other and prior periods have been reclassified.
All Other
All Other consists of ALM activities, equity investment activities including Global Principal Investments, Strategic and other investments, and Corporate Investments. All Other also includes liquidating businesses merger and restructuring charges,other. ALM functions such asactivities encompass the whole-loan residential mortgage portfolio and investment securities, interest rate and
related foreign currency risk management activities including economic hedges andthe residual net interest income allocation, gains/losses on structured liabilities, and the impact of certain allocation methodologies and accounting hedge ineffectiveness. Additionally, All Other includes
certain residential mortgage and discontinued real estate loans that are managed by CRES. During 2011,In 2012, the Corporation sold its Canadian consumer card businessIWM businesses and is evaluating its remaining international consumer card operations. As a result of these actions, the international consumer card businessJapanese brokerage joint venture results were moved to All Otherfrom Card Servicesfrom GWIM and prior periods have been reclassified.reclassified.
Basis of Presentation
The management accounting and reporting process derives segment and business results by utilizing allocation methodologies for revenue and expense. The net income derived for the businesses is dependent upon revenue and cost allocations using an activity-based costing model, funds transfer pricing, and other methodologies and assumptions management believes are appropriate to reflect the results of the business.
Total revenue, net of interest expense, includes net interest income on a fully taxable-equivalent (FTE)FTE basis and noninterest income. The adjustment of net interest income to a FTE basis results in a corresponding increase in income tax expense. The segment results also reflect certain revenue and expense methodologies that are utilized to determine net income. The net interest income of the businesses includes the results of a funds transfer pricing process that matches assets and liabilities with similar interest rate sensitivity and maturity characteristics. For presentation purposes, in segments where the total of liabilities and equity exceeds assets, which are generally deposit-taking segments, the Corporation allocates assets to match liabilities. Net interest income of the business segments also includes an allocation of net interest income generated by the Corporation’s ALM activities.
The Corporation’s ALM activities include an overall interest rate risk management strategy that incorporates the use of interest rate contractsvarious derivatives and cash instruments to manage fluctuations in earnings and capital that are caused by interest rate volatility. The Corporation’s goal is to manage interest rate sensitivity so that movements in interest rates do not significantly adversely affect earnings and capital. The majority of the Corporation’s ALM activities are allocated to the business segments and fluctuate based on performance. ALM activities include external product pricing decisions including deposit pricing strategies, the effects of the Corporation’s internal funds transfer pricing process and the net effects of other ALM activities.
Certain expenses not directly attributable to a specific business segment are allocated to the segments. The most significant of these expenses include data and item processing costs and certain centralized or shared functions. Data processing costs are allocated to the segments based on equipment usage. Item processing costs are allocated to the segments based on the volume of items processed for each segment. The costs of certain other centralized or shared functions are allocated based on methodologies that reflect utilization.
|
| | |
276 Bank of America 2012 | | Bank of America269
|
The following tables present total revenue, net of interest expense, on a FTE basis, and net income (loss) for 20112012, 20102011 and 20092010, and total assets at December 31, 20112012 and 20102011 for each business segment, as well as All Other.
| | | | | | | | | | | | | |
| Business Segments | | | | | | | | | | |
| | | | | | | | | | | |
| At and for the Year Ended December 31 | Total Corporation (1) | | Deposits | | Card Services (2) | Total Corporation (1) | | Consumer & Business Banking | | Consumer Real Estate Services |
| (Dollars in millions) | 2011 | 2010 | 2009 | | 2011 | 2010 | 2009 | | 2011 | 2010 | 2009 | 2012 | 2011 | 2010 | | 2012 | 2011 | 2010 | | 2012 | 2011 | 2010 |
| Net interest income (FTE basis) | $ | 45,588 |
| $ | 52,693 |
| $ | 48,410 |
| | $ | 8,471 |
| $ | 8,278 |
| $ | 7,195 |
| | $ | 11,507 |
| $ | 14,413 |
| $ | 16,502 |
| $ | 41,557 |
| $ | 45,588 |
| $ | 52,693 |
| | $ | 19,125 |
| $ | 21,378 |
| $ | 24,299 |
| | $ | 2,959 |
| $ | 3,207 |
| $ | 4,662 |
|
| Noninterest income | 48,838 |
| 58,697 |
| 72,534 |
| | 4,218 |
| 5,284 |
| 7,041 |
| | 6,636 |
| 7,927 |
| 8,275 |
| |
| Total revenue, net of interest expense | 94,426 |
| 111,390 |
| 120,944 |
| | 12,689 |
| 13,562 |
| 14,236 |
| | 18,143 |
| 22,340 |
| 24,777 |
| |
| Noninterest income (loss) | | 42,678 |
| 48,838 |
| 58,697 |
| | 9,898 |
| 11,502 |
| 13,888 |
| | 5,800 |
| (6,361 | ) | 5,667 |
|
| Total revenue, net of interest expense (FTE basis) | | 84,235 |
| 94,426 |
| 111,390 |
| | 29,023 |
| 32,880 |
| 38,187 |
| | 8,759 |
| (3,154 | ) | 10,329 |
|
| Provision for credit losses | 13,410 |
| 28,435 |
| 48,570 |
| | 173 |
| 201 |
| 341 |
| | 3,072 |
| 10,962 |
| 26,351 |
| 8,169 |
| 13,410 |
| 28,435 |
| | 3,941 |
| 3,490 |
| 11,647 |
| | 1,442 |
| 4,524 |
| 8,490 |
|
| Amortization of intangibles | 1,509 |
| 1,731 |
| 1,978 |
| | 154 |
| 194 |
| 237 |
| | 599 |
| 668 |
| 746 |
| 1,264 |
| 1,509 |
| 1,731 |
| | 626 |
| 759 |
| 870 |
| | — |
| 11 |
| 38 |
|
| Goodwill impairment | 3,184 |
| 12,400 |
| — |
| | — |
| — |
| — |
| | — |
| 10,400 |
| — |
| — |
| 3,184 |
| 12,400 |
| | — |
| — |
| 10,400 |
| | — |
| 2,603 |
| 2,000 |
|
| Other noninterest expense | 75,581 |
| 68,977 |
| 64,735 |
| | 10,479 |
| 11,002 |
| 9,451 |
| | 5,425 |
| 5,289 |
| 5,857 |
| 70,829 |
| 75,581 |
| 68,977 |
| | 16,167 |
| 16,960 |
| 17,316 |
| | 17,306 |
| 19,177 |
| 12,762 |
|
| Income (loss) before income taxes | 742 |
| (153 | ) | 5,661 |
| | 1,883 |
| 2,165 |
| 4,207 |
| | 9,047 |
| (4,979 | ) | (8,177 | ) | 3,973 |
| 742 |
| (153 | ) | | 8,289 |
| 11,671 |
| (2,046 | ) | | (9,989 | ) | (29,469 | ) | (12,961 | ) |
| Income tax expense (benefit) (FTE basis) | (704 | ) | 2,085 |
| (615 | ) | | 691 |
| 803 |
| 1,530 |
| | 3,259 |
| 2,001 |
| (2,965 | ) | (215 | ) | (704 | ) | 2,085 |
| | 2,968 |
| 4,224 |
| 3,089 |
| | (3,482 | ) | (10,004 | ) | (4,068 | ) |
| Net income (loss) | $ | 1,446 |
| $ | (2,238 | ) | $ | 6,276 |
| | $ | 1,192 |
| $ | 1,362 |
| $ | 2,677 |
| | $ | 5,788 |
| $ | (6,980 | ) | $ | (5,212 | ) | $ | 4,188 |
| $ | 1,446 |
| $ | (2,238 | ) | | $ | 5,321 |
| $ | 7,447 |
| $ | (5,135 | ) | | $ | (6,507 | ) | $ | (19,465 | ) | $ | (8,893 | ) |
| Year-end total assets | $ | 2,129,046 |
| $ | 2,264,909 |
| |
| | $ | 445,680 |
| $ | 440,954 |
| |
| | $ | 127,636 |
| $ | 138,491 |
| |
| $ | 2,209,974 |
| $ | 2,129,046 |
| |
| | $ | 554,878 |
| $ | 521,097 |
| |
| | $ | 132,388 |
| $ | 163,712 |
| |
|
| | | | | | | | | | | |
| | Consumer Real Estate Services | | Global Commercial Banking | | Global Banking & Markets | | | Global Banking | | Global Markets |
| | 2011 | 2010 | 2009 | | 2011 | 2010 | 2009 | | 2011 | 2010 | 2009 | | | 2012 | 2011 | 2010 | | 2012 | 2011 | 2010 |
| Net interest income (FTE basis) | $ | 3,207 |
| $ | 4,662 |
| $ | 4,961 |
| | $ | 7,176 |
| $ | 8,007 |
| $ | 8,022 |
| | $ | 7,401 |
| $ | 8,000 |
| $ | 9,557 |
| | | $ | 9,225 |
| $ | 9,490 |
| $ | 10,062 |
| | $ | 3,310 |
| $ | 3,682 |
| $ | 4,332 |
|
| Noninterest income | (6,361 | ) | 5,667 |
| 11,677 |
| | 3,377 |
| 3,219 |
| 7,438 |
| | 16,217 |
| 19,949 |
| 18,624 |
| | | 7,982 |
| 7,822 |
| 7,682 |
| | 10,209 |
| 11,116 |
| 14,799 |
|
| Total revenue, net of interest expense | (3,154 | ) | 10,329 |
| 16,638 |
| | 10,553 |
| 11,226 |
| 15,460 |
| | 23,618 |
| 27,949 |
| 28,181 |
| |
| Total revenue, net of interest expense (FTE basis) | | | | 17,207 |
| 17,312 |
| 17,744 |
| | 13,519 |
| 14,798 |
| 19,131 |
|
| Provision for credit losses | | | | (103 | ) | (1,118 | ) | 1,298 |
| | 3 |
| (56 | ) | 30 |
|
| Amortization of intangibles | | | | 79 |
| 102 |
| 121 |
| | 64 |
| 66 |
| 66 |
|
| Other noninterest expense | | | | 8,229 |
| 8,782 |
| 8,548 |
| | 10,775 |
| 12,178 |
| 11,708 |
|
| Income before income taxes | | | | 9,002 |
| 9,546 |
| 7,777 |
| | 2,677 |
| 2,610 |
| 7,327 |
|
| Income tax expense (FTE basis) | | | | 3,277 |
| 3,500 |
| 2,887 |
| | 1,623 |
| 1,622 |
| 3,076 |
|
| Net income | | | | $ | 5,725 |
| $ | 6,046 |
| $ | 4,890 |
| | $ | 1,054 |
| $ | 988 |
| $ | 4,251 |
|
| Year-end total assets | | | | $ | 362,797 |
| $ | 348,773 |
| |
| | $ | 615,297 |
| $ | 501,867 |
| |
|
| | | | | | | |
| | | | | Global Wealth & Investment Management | | All Other |
| | | | | 2012 | 2011 | 2010 | | 2012 | 2011 | 2010 |
| Net interest income (FTE basis) | | | | $ | 5,827 |
| $ | 5,885 |
| $ | 5,547 |
| | $ | 1,111 |
| $ | 1,946 |
| $ | 3,791 |
|
| Noninterest income (loss) | | | | 10,690 |
| 10,610 |
| 9,836 |
| | (1,901 | ) | 14,149 |
| 6,825 |
|
| Total revenue, net of interest expense (FTE basis) | | | | 16,517 |
| 16,495 |
| 15,383 |
| | (790 | ) | 16,095 |
| 10,616 |
|
| Provision for credit losses | 4,524 |
| 8,490 |
| 11,244 |
| | (634 | ) | 1,979 |
| 7,782 |
| | (296 | ) | (166 | ) | 1,998 |
| | | 266 |
| 398 |
| 646 |
| | 2,620 |
| 6,172 |
| 6,324 |
|
| Amortization of intangibles | 11 |
| 38 |
| 63 |
| | 57 |
| 72 |
| 100 |
| | 116 |
| 123 |
| 129 |
| | | 414 |
| 438 |
| 458 |
| | 81 |
| 133 |
| 178 |
|
| Goodwill impairment | 2,603 |
| 2,000 |
| ��� |
| | — |
| — |
| — |
| | — |
| — |
| — |
| | | — |
| — |
| — |
| | — |
| 581 |
| — |
|
| Other noninterest expense | 19,279 |
| 12,848 |
| 11,437 |
| | 4,177 |
| 4,058 |
| 4,120 |
| | 18,063 |
| 17,412 |
| 15,135 |
| | | 12,341 |
| 12,945 |
| 11,861 |
| | 6,011 |
| 5,539 |
| 6,782 |
|
| Income (loss) before income taxes | (29,571 | ) | (13,047 | ) | (6,106 | ) | | 6,953 |
| 5,117 |
| 3,458 |
| | 5,735 |
| 10,580 |
| 10,919 |
| | | 3,496 |
| 2,714 |
| 2,418 |
| | (9,502 | ) | 3,670 |
| (2,668 | ) |
| Income tax expense (benefit) (FTE basis) | (10,042 | ) | (4,100 | ) | (2,217 | ) | | 2,551 |
| 1,899 |
| 1,279 |
| | 2,768 |
| 4,283 |
| 3,246 |
| | | 1,273 |
| 996 |
| 1,076 |
| | (5,874 | ) | (1,042 | ) | (3,975 | ) |
| Net income (loss) | $ | (19,529 | ) | $ | (8,947 | ) | $ | (3,889 | ) | | $ | 4,402 |
| $ | 3,218 |
| $ | 2,179 |
| | $ | 2,967 |
| $ | 6,297 |
| $ | 7,673 |
| | | $ | 2,223 |
| $ | 1,718 |
| $ | 1,342 |
| | $ | (3,628 | ) | $ | 4,712 |
| $ | 1,307 |
|
| Year-end total assets | $ | 163,712 |
| $ | 212,412 |
| |
| | $ | 289,985 |
| $ | 312,807 |
| |
| | $ | 637,754 |
| $ | 653,737 |
| |
| | | $ | 297,330 |
| $ | 273,106 |
| |
| | $ | 247,284 |
| $ | 320,491 |
| |
|
| | | | | | | |
| | | | Global Wealth & Investment Management | | All Other (2) | |
| | | | 2011 | 2010 | 2009 | | 2011 | 2010 | 2009 | |
| Net interest income (FTE basis) | | | $ | 6,046 |
| $ | 5,677 |
| $ | 5,882 |
| | $ | 1,780 |
| $ | 3,656 |
| $ | (3,709 | ) | |
| Noninterest income | | | 11,330 |
| 10,612 |
| 9,904 |
| | 13,421 |
| 6,039 |
| 9,575 |
| |
| Total revenue, net of interest expense | | | 17,376 |
| 16,289 |
| 15,786 |
| | 15,201 |
| 9,695 |
| 5,866 |
| |
| Provision for credit losses | | | 398 |
| 646 |
| 1,060 |
| | 6,173 |
| 6,323 |
| (206 | ) | |
| Amortization of intangibles | | | 438 |
| 458 |
| 480 |
| | 134 |
| 178 |
| 223 |
| |
| Goodwill impairment | | | — |
| — |
| — |
| | 581 |
| — |
| — |
| |
| Other noninterest expense | | | 13,957 |
| 12,769 |
| 11,641 |
| | 4,201 |
| 5,599 |
| 7,094 |
| |
| Income (loss) before income taxes | | | 2,583 |
| 2,416 |
| 2,605 |
| | 4,112 |
| (2,405 | ) | (1,245 | ) | |
| Income tax expense (benefit) (FTE basis) | | | 948 |
| 1,076 |
| 936 |
| | (879 | ) | (3,877 | ) | (2,424 | ) | |
| Net income | | | $ | 1,635 |
| $ | 1,340 |
| $ | 1,669 |
| | $ | 4,991 |
| $ | 1,472 |
| $ | 1,179 |
| |
| Year-end total assets | | | $ | 283,844 |
| $ | 296,251 |
| |
| | $ | 180,435 |
| $ | 210,257 |
| |
| |
| |
(1) | There were no material intersegment revenues. |
| |
(2)
| 2011 and 2010 are presented in accordance with new consolidation guidance. 2009 Card Services results are presented on a managed basis with a corresponding offset recorded in All Other.
|
|
| | |
| | 270Bank of America 20112012277
| | |
The following tables present a reconciliation of the sixfive business segments’ total revenue, net of interest expense, on a FTE basis, and net income (loss) to the Corporation’s Consolidated Statement of Income, and total assets to the Corporation’s Consolidated Balance Sheet. The adjustments presented in the following tables include consolidated income, expense and asset amounts not specifically allocated to individual business segments.
| | | | | | | | | | | | | |
| Business Segment Reconciliations | | | | | | | | | | |
| | | | | | | | | | | |
| (Dollars in millions) | 2011 | | 2010 | | 2009 | 2012 | | 2011 | | 2010 |
| Segments’ total revenue, net of interest expense (FTE basis) | $ | 79,225 |
| | $ | 101,695 |
| | $ | 115,078 |
| $ | 85,025 |
| | $ | 78,331 |
| | $ | 100,774 |
|
| Adjustments: | |
| | |
| | |
| |
| | |
| | |
|
| ALM activities | 7,576 |
| | 1,899 |
| | (766 | ) | |
ALM activities (1) | | (2,412 | ) | | 7,576 |
| | 1,872 |
|
| Equity investment income | 7,037 |
| | 4,549 |
| | 10,589 |
| 1,135 |
| | 7,105 |
| | 4,629 |
|
| Liquidating businesses | 2,708 |
| | 5,155 |
| | 6,932 |
| 2,279 |
| | 3,526 |
| | 6,005 |
|
| FTE basis adjustment | (972 | ) | | (1,170 | ) | | (1,301 | ) | (901 | ) | | (972 | ) | | (1,170 | ) |
| Managed securitization impact to total revenue, net of interest expense | n/a |
| | n/a |
| | (11,399 | ) | |
| Other | (2,120 | ) | | (1,908 | ) | | 510 |
| (1,792 | ) | | (2,112 | ) | | (1,890 | ) |
| Consolidated revenue, net of interest expense | $ | 93,454 |
| | $ | 110,220 |
| | $ | 119,643 |
| $ | 83,334 |
| | $ | 93,454 |
| | $ | 110,220 |
|
| Segments’ net income (loss) | $ | (3,545 | ) | | $ | (3,710 | ) | | $ | 5,097 |
| $ | 7,816 |
| | $ | (3,266 | ) | | $ | (3,545 | ) |
| Adjustments, net of taxes: | |
| | |
| | |
| |
| | |
| | |
|
| ALM activities | 515 |
| | (2,462 | ) | | (6,597 | ) | (4,088 | ) | | 513 |
| | (2,480 | ) |
| Equity investment income | 4,433 |
| | 2,866 |
| | 6,671 |
| 715 |
| | 4,476 |
| | 2,916 |
|
| Liquidating businesses | (103 | ) | | 718 |
| | 412 |
| 226 |
| | (263 | ) | | 635 |
|
| Merger and restructuring charges | (402 | ) | | (1,146 | ) | | (1,714 | ) | — |
| | (402 | ) | | (1,146 | ) |
| Other | 548 |
| | 1,496 |
| | 2,407 |
| (481 | ) | | 388 |
| | 1,382 |
|
| Consolidated net income (loss) | $ | 1,446 |
| | $ | (2,238 | ) | | $ | 6,276 |
| $ | 4,188 |
| | $ | 1,446 |
| | $ | (2,238 | ) |
| | | | | | | | | | | |
| | | | December 31 | | | December 31 |
| | | | 2011 | | 2010 | | | 2012 | | 2011 |
| Segments’ total assets | | | $ | 1,948,611 |
| | $ | 2,054,652 |
| | | $ | 1,962,690 |
| | $ | 1,808,555 |
|
| Adjustments: | | | |
| | |
| | | |
| | |
|
| ALM activities, including securities portfolio | | | 647,569 |
| | 601,307 |
| | | 622,722 |
| | 611,793 |
|
| Equity investments | | | 6,923 |
| | 34,185 |
| | | 5,508 |
| | 7,098 |
|
| Liquidating businesses | | | 29,746 |
| | 43,288 |
| | | 32,597 |
| | 37,570 |
|
| Elimination of segment excess asset allocations to match liabilities | | | (531,702 | ) | | (476,471 | ) | | | (554,426 | ) | | (492,251 | ) |
| Other | | | 27,899 |
| | 7,948 |
| | | 140,883 |
| | 156,281 |
|
| Consolidated total assets | | | $ | 2,129,046 |
| | $ | 2,264,909 |
| | | $ | 2,209,974 |
| | $ | 2,129,046 |
|
n/a = not applicable
| |
(1) | Includes negative fair value adjustments on structured liabilities of $5.1 billion in 2012 and positive fair value adjustments on structured liabilities of $3.3 billion and $18 million in 2011 and 2010. |
|
| | |
278 Bank of America 2012 | | Bank of America271
|
NOTE 27 Parent Company Information
The following tables present the Parent Company onlyCompany-only financial information.
| | | | | | | | | | | | | |
| Condensed Statement of Income | | | | | | | | | | |
| | | | | | | | | | | |
| (Dollars in millions) | 2011 | | 2010 | | 2009 | 2012 | | 2011 | | 2010 |
| Income | |
| | |
| | |
| |
| | |
| | |
|
| Dividends from subsidiaries: | |
| | |
| | |
| |
| | |
| | |
|
| Bank holding companies and related subsidiaries | $ | 10,277 |
| | $ | 7,263 |
| | $ | 4,100 |
| $ | 16,213 |
| | $ | 10,277 |
| | $ | 7,263 |
|
| Nonbank companies and related subsidiaries | 553 |
| | 226 |
| | 27 |
| 542 |
| | 553 |
| | 226 |
|
| Interest from subsidiaries | 869 |
| | 999 |
| | 1,179 |
| 627 |
| | 869 |
| | 999 |
|
Other income (1) | 10,603 |
| | 2,781 |
| | 7,784 |
| |
Other income (loss) (1) | | (304 | ) | | 10,603 |
| | 2,781 |
|
| Total income | 22,302 |
| | 11,269 |
| | 13,090 |
| 17,078 |
| | 22,302 |
| | 11,269 |
|
| Expense | |
| | |
| | |
| |
| | |
| | |
|
| Interest on borrowed funds | 6,234 |
| | 4,484 |
| | 4,737 |
| 5,376 |
| | 6,234 |
| | 4,484 |
|
Noninterest expense (2) | 11,861 |
| | 8,030 |
| | 4,238 |
| 11,643 |
| | 11,861 |
| | 8,030 |
|
| Total expense | 18,095 |
| | 12,514 |
| | 8,975 |
| 17,019 |
| | 18,095 |
| | 12,514 |
|
| Income (loss) before income taxes and equity in undistributed earnings of subsidiaries | 4,207 |
| | (1,245 | ) | | 4,115 |
| 59 |
| | 4,207 |
| | (1,245 | ) |
| Income tax benefit | (2,783 | ) | | (3,709 | ) | | (85 | ) | (5,883 | ) | | (2,783 | ) | | (3,709 | ) |
| Income before equity in undistributed earnings of subsidiaries | 6,990 |
| | 2,464 |
| | 4,200 |
| 5,942 |
| | 6,990 |
| | 2,464 |
|
| Equity in undistributed earnings (losses) of subsidiaries: | |
| | |
| | |
| |
| | |
| | |
|
| Bank holding companies and related subsidiaries | 6,650 |
| | 7,647 |
| | (21,614 | ) | 1,072 |
| | 6,650 |
| | 7,647 |
|
| Nonbank companies and related subsidiaries | (12,194 | ) | | (12,349 | ) | | 23,690 |
| (2,826 | ) | | (12,194 | ) | | (12,349 | ) |
| Total equity in undistributed earnings (losses) of subsidiaries | (5,544 | ) | | (4,702 | ) | | 2,076 |
| |
| Total equity in undistributed losses of subsidiaries | | (1,754 | ) | | (5,544 | ) | | (4,702 | ) |
| Net income (loss) | $ | 1,446 |
| | $ | (2,238 | ) | | $ | 6,276 |
| $ | 4,188 |
| | $ | 1,446 |
| | $ | (2,238 | ) |
| Net income (loss) applicable to common shareholders | $ | 85 |
| | $ | (3,595 | ) | | $ | (2,204 | ) | $ | 2,760 |
| | $ | 85 |
| | $ | (3,595 | ) |
| |
(1) | Includes $6.5 billion and $7.3 billionof gains related to the sale of the Corporation’s investment in CCB duringin 2011 and 2009. |
| |
(2) | Includes, in aggregate, $6.94.1 billion, $3.56.9 billion and $225 million3.5 billion in 20112012, 20102011 and 20092010 of representations and warranties provision, which is presented as a component of mortgage banking income on the Corporation’s Consolidated Statement of Income, litigation expense and litigation expense.in 2012 an expense related to an agreement with the Federal Reserve and the OCC to cease the Independent Foreclosure Review and replace it with an accelerated remediation process. The Parent Company-only financial information is presented in accordance with bank regulatory reporting requirements. |
| | | | | | | | | |
| Condensed Balance Sheet | | | | | | |
| | | | | | | |
| | December 31 | December 31 |
| (Dollars in millions) | 2011 | | 2010 | 2012 | | 2011 |
| Assets | |
| | |
| |
| | |
|
| Cash held at bank subsidiaries | $ | 124,991 |
| | $ | 117,124 |
| $ | 101,831 |
| | $ | 124,991 |
|
| Securities | 515 |
| | 19,518 |
| 1,959 |
| | 515 |
|
| Receivables from subsidiaries: | | | |
| | | |
|
| Bank holding companies and related subsidiaries | 48,679 |
| | 50,589 |
| 33,481 |
| | 48,679 |
|
| Nonbank companies and related subsidiaries | 7,385 |
| | 8,320 |
| 3,861 |
| | 7,385 |
|
| Investments in subsidiaries: | |
| | |
| |
| | |
|
| Bank holding companies and related subsidiaries | 191,278 |
| | 188,538 |
| 185,803 |
| | 191,278 |
|
| Nonbank companies and related subsidiaries | 53,213 |
| | 61,374 |
| 65,300 |
| | 53,213 |
|
| Other assets | 11,720 |
| | 10,837 |
| 15,208 |
| | 11,720 |
|
| Total assets | $ | 437,781 |
| | $ | 456,300 |
| $ | 407,443 |
| | $ | 437,781 |
|
| Liabilities and shareholders’ equity | |
| | |
| |
| | |
|
| Commercial paper and other short-term borrowings | $ | 401 |
| | $ | 13,899 |
| $ | 100 |
| | $ | 401 |
|
| Accrued expenses and other liabilities | 22,419 |
| | 22,803 |
| 34,364 |
| | 22,419 |
|
| Payables to subsidiaries: | |
| | |
| |
| | |
|
| Bank holding companies and related subsidiaries | 2,925 |
| | 4,241 |
| 1,396 |
| | 2,925 |
|
| Nonbank companies and related subsidiaries | 515 |
| | 513 |
| 688 |
| | 515 |
|
| Long-term debt | 181,420 |
| | 186,596 |
| 133,939 |
| | 181,420 |
|
| Shareholders’ equity | 230,101 |
| | 228,248 |
| 236,956 |
| | 230,101 |
|
| Total liabilities and shareholders’ equity | $ | 437,781 |
| | $ | 456,300 |
| $ | 407,443 |
| | $ | 437,781 |
|
|
| | |
| | 272Bank of America 20112012279
| | |
| | | | | | | | | | | | | |
| Condensed Statement of Cash Flows | | | | | | | | | | |
| | | | | | | | | | | |
| (Dollars in millions) | 2011 | | 2010 | | 2009 | 2012 | | 2011 | | 2010 |
| Operating activities | |
| | |
| | |
| |
| | |
| | |
|
| Net income (loss) | $ | 1,446 |
| | $ | (2,238 | ) | | $ | 6,276 |
| $ | 4,188 |
| | $ | 1,446 |
| | $ | (2,238 | ) |
| Reconciliation of net income (loss) to net cash provided by operating activities: | |
| | |
| | |
| |
| | |
| | |
|
| Equity in undistributed (earnings) losses of subsidiaries | 5,544 |
| | 4,702 |
| | (2,076 | ) | |
| Equity in undistributed losses of subsidiaries | | 1,754 |
| | 5,544 |
| | 4,702 |
|
| Other operating activities, net | 6,716 |
| | (996 | ) | | 4,400 |
| (3,432 | ) | | 6,716 |
| | (996 | ) |
| Net cash provided by operating activities | 13,706 |
| | 1,468 |
| | 8,600 |
| 2,510 |
| | 13,706 |
| | 1,468 |
|
| Investing activities | |
| | |
| | |
| |
| | |
| | |
|
| Net sales of securities | 8,444 |
| | 5,972 |
| | 3,729 |
| 13 |
| | 8,444 |
| | 5,972 |
|
| Net payments from (to) subsidiaries | 5,780 |
| | 3,531 |
| | (25,437 | ) | |
| Net payments from subsidiaries | | 12,973 |
| | 5,780 |
| | 3,531 |
|
| Other investing activities, net | (8 | ) | | 2,592 |
| | (17 | ) | 445 |
| | (8 | ) | | 2,592 |
|
| Net cash provided by (used in) investing activities | 14,216 |
| | 12,095 |
| | (21,725 | ) | |
| Net cash provided by investing activities | | 13,431 |
| | 14,216 |
| | 12,095 |
|
| Financing activities | |
| | |
| | |
| |
| | |
| | |
|
| Net increase (decrease) in commercial paper and other short-term borrowings | (13,172 | ) | | 8,052 |
| | (20,673 | ) | (616 | ) | | (13,172 | ) | | 8,052 |
|
| Proceeds from issuance of long-term debt | 16,047 |
| | 29,275 |
| | 30,347 |
| 17,176 |
| | 16,047 |
| | 29,275 |
|
| Retirement of long-term debt | (21,742 | ) | | (27,176 | ) | | (20,180 | ) | (63,851 | ) | | (21,742 | ) | | (27,176 | ) |
| Proceeds from issuance of preferred stock and warrants | 5,000 |
| | — |
| | 49,244 |
| 667 |
| | 5,000 |
| | — |
|
| Repayment of preferred stock | — |
| | — |
| | (45,000 | ) | |
| Proceeds from issuance of common stock | — |
| | — |
| | 13,468 |
| |
| Cash dividends paid | (1,738 | ) | | (1,762 | ) | | (4,863 | ) | (1,909 | ) | | (1,738 | ) | | (1,762 | ) |
| Other financing activities, net | (4,450 | ) | | 3,280 |
| | 4,149 |
| 9,432 |
| | (4,450 | ) | | 3,280 |
|
| Net cash provided by (used in) financing activities | (20,055 | ) | | 11,669 |
| | 6,492 |
| (39,101 | ) | | (20,055 | ) | | 11,669 |
|
| Net increase (decrease) in cash held at bank subsidiaries | 7,867 |
| | 25,232 |
| | (6,633 | ) | (23,160 | ) | | 7,867 |
| | 25,232 |
|
| Cash held at bank subsidiaries at January 1 | 117,124 |
| | 91,892 |
| | 98,525 |
| 124,991 |
| | 117,124 |
| | 91,892 |
|
| Cash held at bank subsidiaries at December 31 | $ | 124,991 |
| | $ | 117,124 |
| | $ | 91,892 |
| $ | 101,831 |
| | $ | 124,991 |
| | $ | 117,124 |
|
NOTE 28 Performance by Geographical Area
Since the Corporation’s operations are highly integrated, certain asset, liability, income and expense amounts must be allocated to arrive at total assets, total revenue, net of interest expense, income (loss) before income taxes and net income (loss) by geographic area. The Corporation identifies its geographic performance based on the business unit structure used to manage the capital or expense deployed in the region as applicable. This requires certain judgments related to the allocation of revenue so that revenue can be appropriately matched with the related expense or capital deployed in the region.
| | | | | | | | | | | | | | | | | | | |
| | | | December 31 | | Year Ended December 31 | | | December 31 | | Year Ended December 31 |
| (Dollars in millions) | Year | | Total Assets (1) | | Total Revenue, Net of Interest Expense (2) | | Income (Loss) Before Income Taxes | | Net Income (Loss) | Year | | Total Assets (1) | | Total Revenue, Net of Interest Expense (2) | | Income (Loss) Before Income Taxes | | Net Income (Loss) |
U.S. (3) | 2011 | | $ | 1,856,654 |
| | $ | 73,613 |
| | $ | (9,261 | ) | | $ | (3,471 | ) | 2012 | | $ | 1,902,946 |
| | $ | 72,175 |
| | $ | 1,867 |
| | $ | 4,116 |
|
| | 2010 | | 1,975,640 |
| | 95,115 |
| | (5,676 | ) | | (4,727 | ) | 2011 | | 1,856,654 |
| | 73,613 |
| | (9,261 | ) | | (3,471 | ) |
| | 2009 | | |
| | 98,278 |
| | (6,901 | ) | | (1,025 | ) | 2010 | | |
| | 95,115 |
| | (5,676 | ) | | (4,727 | ) |
Asia (4) | 2011 | | 95,776 |
| | 10,890 |
| | 7,598 |
| | 4,787 |
| 2012 | | 102,492 |
| | 3,478 |
| | 353 |
| | 282 |
|
| | 2010 | | 107,140 |
| | 4,187 |
| | 1,372 |
| | 864 |
| 2011 | | 95,776 |
| | 10,890 |
| | 7,598 |
| | 4,787 |
|
| | 2009 | | |
| | 10,685 |
| | 8,096 |
| | 5,101 |
| 2010 | | |
| | 4,187 |
| | 1,372 |
| | 864 |
|
| Europe, Middle East and Africa | 2011 | | 151,956 |
| | 7,320 |
| | 1,009 |
| | (137 | ) | 2012 | | 171,209 |
| | 6,011 |
| | 323 |
| | (543 | ) |
| | 2010 | | 160,621 |
| | 8,490 |
| | 1,549 |
| | 723 |
| 2011 | | 151,956 |
| | 7,320 |
| | 1,009 |
| | (137 | ) |
| | 2009 | | |
| | 9,085 |
| | 2,295 |
| | 1,652 |
| 2010 | | |
| | 8,490 |
| | 1,549 |
| | 723 |
|
| Latin America and the Caribbean | 2011 | | 24,660 |
| | 1,631 |
| | 424 |
| | 267 |
| 2012 | | 33,327 |
| | 1,670 |
| | 529 |
| | 333 |
|
| | 2010 | | 21,508 |
| | 2,428 |
| | 1,432 |
| | 902 |
| 2011 | | 24,660 |
| | 1,631 |
| | 424 |
| | 267 |
|
| | 2009 | | |
| | 1,595 |
| | 870 |
| | 548 |
| 2010 | | |
| | 2,428 |
| | 1,432 |
| | 902 |
|
| Total Non-U.S. | 2011 | | 272,392 |
| | 19,841 |
| | 9,031 |
| | 4,917 |
| 2012 | | 307,028 |
| | 11,159 |
| | 1,205 |
| | 72 |
|
| | 2010 | | 289,269 |
| | 15,105 |
| | 4,353 |
| | 2,489 |
| 2011 | | 272,392 |
| | 19,841 |
| | 9,031 |
| | 4,917 |
|
| | 2009 | | |
| | 21,365 |
| | 11,261 |
| | 7,301 |
| 2010 | | |
| | 15,105 |
| | 4,353 |
| | 2,489 |
|
| Total Consolidated | 2011 | | $ | 2,129,046 |
| | $ | 93,454 |
| | $ | (230 | ) | | $ | 1,446 |
| 2012 | | $ | 2,209,974 |
| | $ | 83,334 |
| | $ | 3,072 |
| | $ | 4,188 |
|
| | 2010 | | 2,264,909 |
| | 110,220 |
| | (1,323 | ) | | (2,238 | ) | 2011 | | 2,129,046 |
| | 93,454 |
| | (230 | ) | | 1,446 |
|
| | 2009 | | |
| | 119,643 |
| | 4,360 |
| | 6,276 |
| 2010 | | |
| | 110,220 |
| | (1,323 | ) | | (2,238 | ) |
| |
(1) | Total assets include long-lived assets, which are primarily located in the U.S. |
| |
(2) | There were no material intercompany revenues between geographic regions for any of the periods presented. |
| |
(3) | Includes the Corporation’s Canadian operations, which had total assets of $8.18.3 billion and $16.18.1 billion at December 31, 20112012 and 20102011; total revenue, net of interest expense of $1.3 billion317 million, $1.3 billion and $2.51.3 billion; income before income taxes of $621202 million, $458621 million and $723458 million; and net income of $528141 million, $328528 million and $488328 million for 20112012, 20102011 and 20092010, respectively. |
| |
(4) | Amounts include pre-tax gains of $6.5 billion and $7.3 billion($4.1 billion and $4.6 billion net-of-tax) on the sale of common shares of the Corporation’s investment in CCB during 2011 and 2009. |
|
| | |
280 Bank of America 2012 | | Bank of America273
|
Item 9. Changes in and Disagreements with Accountants on Accounting and Financial Disclosure
None
Item 9A. Controls Andand Procedures
Disclosure Controls and Procedures
As of the end of the period covered by this report and pursuant to Rule 13a-15 of the Securities Exchange Act of 1934 (Exchange
Act), Bank of America’s management, including the Chief Executive Officer and Chief Financial Officer, conducted an evaluation of the effectiveness and design of our disclosure controls and procedures (as that term is defined in Rule 13a-15(e) of the Exchange Act). Based upon that evaluation, Bank of America’s Chief Executive Officer and Chief Financial Officer concluded that Bank of America’s disclosure controls and procedures were effective, as of the end of the period covered by this report, in recording, processing, summarizing and reporting information required to be disclosed, within the time periods specified in the SEC’s rules and forms.
|
| | |
| | 274Bank of America 20112012281
| | |
Report of Independent Registered Public Accounting Firm
To the Board of Directors of Bank of America Corporation:
We have examined, based on criteria established in Internal Control – Integrated Framework issued by the Committee of Sponsoring Organizations of the Treadway Commission, Bank of America Corporation’s (the “Corporation”) assertion, included under Item 9A, that the Corporation’s disclosure controls and procedures were effective as of December 31, 20112012 (“Management’s Assertion”). Disclosure controls and procedures mean controls and other procedures of an issuer that are designed to ensure that information required to be disclosed by an issuer in reports that it files or submits under the Securities Exchange Act of 1934 is recorded, processed, summarized, and reported within the time periods specified in the Securities and Exchange Commission’s rules and forms, and that information required to be disclosed by an issuer in reports that it files or submits under the Securities Exchange Act of 1934 is accumulated and communicated to the issuer’s management, including its principal executive and principal financial officer, or persons performing similar functions, as appropriate, to allow timely decisions regarding required disclosure. The Corporation’s management is responsible for maintaining effective disclosure controls and procedures and for Management’s Assertion of the effectiveness of its disclosure controls and procedures. Our responsibility is to express an opinion on Management’s Assertion based on our examination.
There are inherent limitations to disclosure controls and procedures. Because of these inherent limitations, effective disclosure controls and procedures can only provide reasonable assurance of achieving the intended objectives. Disclosure controls and procedures may not prevent, or detect and correct, material misstatements, and they may not identify all information relating to the Corporation to be accumulated and communicated to the Corporation’s management to allow timely decisions regarding required disclosures. Also, projections of any evaluation
of effectiveness to future periods are subject to the risk that disclosure controls and procedures may become inadequate because of changes in conditions, or that the degree of compliance with the policies or procedures may deteriorate.
We conducted our examination in accordance with attestation standards established by the Public Company Accounting Oversight Board (United States). Those standards require that we plan and perform the examination to obtain reasonable assurance about whether effective disclosure controls and procedures were maintained in all material respects. Our examination included obtaining an understanding of the Corporation’s disclosure controls and procedures and testing and evaluating the design and operating effectiveness of the Corporation’s disclosure controls and procedures based on the assessed risk. Our examination also included performing such other procedures as we considered necessary in the circumstances. We believe that our examination provides a reasonable basis for our opinion. Our examination was not conducted for the purpose of expressing an opinion, and accordingly we express no opinion, on the accuracy or completeness of the Corporation’s disclosures in its reports, or whether such disclosures comply with the rules and regulations adopted by the Securities and Exchange Commission.
In our opinion, Management’s Assertion that the Corporation’s disclosure controls and procedures were effective as of December 31, 20112012 is fairly stated, in all material respects, based on criteria established in Internal Control – Integrated Framework issued by the Committee of Sponsoring Organizations of the Treadway Commission.
Charlotte, North Carolina
February 23, 201228, 2013
|
| | |
282 Bank of America 2012 | | Bank of America275
|
Report of Management on Internal Control Over Financial Reporting
The Report of Management on Internal Control over Financial Reporting is set forth on page 151154 and incorporated herein by reference. The Report of our Independent Registered Public Accounting Firm with respect to the Corporation’s internal control over financial reporting is set forth on page 152155 and incorporated herein by reference.
Changes in Internal Control Over Financial Reporting
There have been no changes in our internal control over financial reporting (as defined in Rule 13a-15(f) of the Exchange Act) during the quarter ended December 31, 20112012, that materially affected, or are reasonably likely to materially affect, our internal control over financial reporting.
Item 9B. Other Information
None
|
| | |
| | 276Bank of America 20112012283
| | |
Part III
Bank of America Corporation and Subsidiaries
Item 10. Directors, Executive Officers and Corporate Governance
Executive Officers of The Registrant
The name, age, position and office, and business experience during the last five years of our current executive officers are:
David C. Darnell (59) Co-Chief(60) Co-chief Operating Officer since September 2011; and President, Global Commercial Banking from July 2005 to September 2011. Mr. Darnell joined the Corporation in 1979 and served in a number of senior leadership roles prior to July 2005.
Terrence P. Laughlin (57)(58) Chief Risk Officer since August 2011; Legacy Asset Servicing Executive from February 2011 to August 2011; Credit Loss Mitigation Strategies & Secondary Markets Executive from August 2010 to February 2011; Chief Executive Officer and President of OneWest Bank, FSB from March 2009 to July 2010; and Chairman of Merrill Lynch Bank & Trust Co., FSB, and Managing Director of Merrill Lynch & Co., Inc. from February 2005 to May 2008.
Gary G. Lynch (61) (62) Global General Counsel and Head of Compliance and Regulatory Relations since September 2012; Global Chief of Legal, Compliance and Regulatory Relationssince from July 2011;2011 to September 2012; Vice Chairman of Morgan Stanley from May 2009 to July 2011; and Chief Legal Officer of Morgan Stanley from October 2005 to September 2010.
Thomas K. Montag (55) Co-Chief(56) Co-chief Operating Officer since September 2011; President, Global Banking and Markets from August 2009 to September 2011; President, Global Markets from January 2009 to August 2009; Executive Vice President and Head of Global Sales and Trading of Merrill Lynch & Co., Inc. from August 2008 to December 2008; Co-head, Global Securities of The Goldman Sachs Group, Inc. from 2006 to 2008; Co-president, Japanese Operations of The Goldman Sachs Group, Inc. from 2002 to 2007; Member, Management Committee of The Goldman Sachs Group, Inc. from 2002 to 2008; and Member, Fixed Income, Currency and Commodities & Equities Executive Committee of The Goldman Sachs Group, Inc. from 2000 to 2008.
Brian T. Moynihan (52)(53) President and Chief Executive Officer and member of the Board of Directors since January 2010; President, Consumer and Small Business Banking from August
2009 to December 2009; President, Global Banking and Wealth Management from January 2009 to August 2009; General Counsel from December 2008 to January 2009; and President, Global Corporate and Investment Banking from October 2007 to December 2008; President, Global Wealth and Investment Management from April 2004 to October 2007.
Edward P. O’Keefe (56) General Counselsince January 2009; Deputy General Counsel and Head of Litigation from December 2008 to January 2009; Global Compliance and Operational Risk Executive and Senior Privacy Executive from September 2008 to December 2008; Deputy General Counsel for Staff Support from January 2005 to September 2008.
Bruce R. Thompson (47)(48) Chief Financial Officer since June 2011; Chief Risk Officer from January 2010 to June 2011; Head of Global Capital Markets from July 2008 to January 2010; and Co-head of Capital Markets from October 2007 to July 2008; Co-head of Global Credit Products from June 2007 to October 2007; Co-head of Global Leveraged Finance from March 2007 to June 2007; Head of U.S. Leveraged Finance Capital Markets from May 2006 to March 2007.2008.
Information included under the following captions in the Corporation’s proxy statement relating to its 20122013 annual meeting of stockholders, scheduled to be held on May 9, 20128, 2013 (the 20122013 Proxy Statement), is incorporated herein by reference:
| |
| Ÿ | “Proposal 1: Election of Directors – The Nominees”; |
| |
| Ÿ | “Section 16(a) Beneficial Ownership Reporting Compliance”; and |
| |
| Ÿ | “Corporate Governance – Additional Corporate Governance Information Available”.Available.” |
Item 11. Executive Compensation
Incorporated
Information included under the following captions in the 2013 Proxy Statement is incorporated herein by reference to:reference:
| |
| Ÿ | “Proposal 2: An Advisory (Non-Binding) vote to Approve Executive Compensation – Compensation Discussion and Analysis”; |
| |
| Ÿ | “– Executive Compensation”; |
| |
| Ÿ | “Director Compensation”– Compensation and Benefits Committee Report”; and |
| |
| Ÿ | “Compensation and Benefits Committee Report” in the 2012 Proxy Statement. Corporate Governance – Non-Management Director Compensation.” |
|
| | |
284 Bank of America 2012 | | Bank of America277
|
Item 12. Security Ownership of Certain Beneficial Owners and Management and Related Stockholder Matters
IncorporatedInformation included under the following caption in the 2013 Proxy Statement is incorporated herein by reference to:reference:
| |
| Ÿ | “Stock Ownership of Directors, Executive Officers”Officers and Certain Beneficial Ownership in the 2012 Proxy Statement.Owners.” |
The table below presents information on equity compensation plans at December 31, 20112012:
| | | | | | | | | | | | | | |
Plan Category (1, 2) | Number of Shares to
be Issued Under
Outstanding Options and Rights (3) | | Weighted-Average
Exercise Price of
Outstanding Options (4) | | Number of Shares Remaining for Future Issuance Under Equity Compensation Plans | Number of Shares to
be Issued Under
Outstanding Options and Rights (3) |
| | Weighted-Average
Exercise Price of
Outstanding Options (4) | | Number of Shares Remaining for Future Issuance Under Equity Compensation Plans | |
| Plans approved by the Corporation’s shareholders | 376,823,957 |
| | $ | 42.36 |
| | 433164259 (5) |
| 261,245,118 |
| | $ | 44.18 |
| | 273,528,943 |
| (5) |
Plans not approved by the Corporation’s shareholders (6) | 61,795,083 |
| | 59.52 |
| | 90615828 (7) |
| 21,885,428 |
| | 54.82 |
| | 115,311,552 |
|
|
| Total | 438,619,040 |
| | $ | 45.93 |
| | 523,780,087 |
| 283,130,546 |
| | $ | 45.38 |
| | 388,840,495 |
| |
| |
(1) | This table does not include outstanding options to purchase 4,297,7621,978,440 shares of the Corporation’s common stock that were assumed by the Corporation in connection with prior acquisitions, under whose plans the options were originally granted. The weighted-average option price of these assumed options was $90.83$108.19 at December 31, 2011.2012. Also, at December 31, 20112012 there were 178,052148,272 vested deferred restricted stock units associated with these plans. No additional awards were granted under these plans following the respective dates of acquisition. |
| |
(2) | This table does not include outstanding options to purchase 6,929,8926,047,487 shares of the Corporation’s common stock that were assumed by the Corporation in connection with the Merrill Lynch acquisition, which were originally issued under certain Merrill Lynch plans. The weighted-average option price of these assumed options was $48.28$46.20 at December 31, 2011.2012. Also, at December 31, 20112012 there were 12,268,36611,146,796 outstanding restricted stock units and 1,598,1511,373,950 vested deferred restricted stock units and stock option gain deferrals associated with such plans. These Merrill Lynch plans were frozen at the time of the acquisition and no additional awards may be granted under these plans. However, as previously approved by the Corporation’s shareholders, if any of the outstanding awards under these frozen plans subsequently are canceled, forfeited or settled in cash, the shares relating to such awards thereafter will be available for future awards issued under the Corporation’s Key Associate Stock Plan (KASP). |
| |
(3) | Includes 220,749,862130,922,245 outstanding restricted stock units under plans approved by the Corporation’s shareholders and 20,827,2835,310,605 outstanding restricted stock units under plans not approved by the Corporation’s shareholders. |
| |
(4) | Does not reflect restricted stock units included in the first column, which do not have an exercise price. |
| |
(5) | Includes 432,578,282273,017,832 shares of common stock available for future issuance under the KASP (including 26,499,39628,052,090 shares originally subject to awards outstanding under frozen Merrill Lynch plans at the time of the acquisition which subsequently have been canceled, forfeited or settled in cash and become available for issuance under the KASP, as described in footnote (2) above) and 585,977511,111 shares of common stock which are available for future issuance under the Corporation’s Directors’ Stock Plan. |
| |
(6) | In connection with the Merrill Lynch acquisition, the Corporation assumed and has continued to issue awards in accordance with applicable NYSE listing standards under the following plans, which were not approved by the Corporation’s shareholders: the Merrill Lynch Employee Stock Compensation Plan (ESCP) and the Merrill Lynch Employee Stock Purchase Plan (ESPP), both of which were. The ESCP was approved by Merrill Lynch’s shareholders prior to the acquisition.acquisition, but has not been approved by the Corporation’s shareholders. The material features of these plansthe ESCP are described below under the heading “Description of Plans Not Approved by the Corporation’s Shareholders.” |
| |
(7)
| This amount includes 84,782,676 shares of common stock available for future issuance under the ESCP and 5,833,152 shares of common stock available for future issuance under the ESPP. |
Description of Plans Not Approved by the Corporation’s Shareholders
Merrill Lynch Employee Stock Compensation Plan (ESCP). The ESCP covers employees who were salaried key employees of Merrill Lynch or its subsidiaries immediately prior to the effective date of the Merrill Lynch acquisition, other than executive officers. Under the ESCP, the Corporation may award restricted shares, restricted units, incentive stock options, nonqualified stock options and stock appreciation rights. Awards of restricted shares and restricted units are subject to a vesting schedule specified in the grant documentation. Restricted shares and restricted units under the ESCP may generally be canceled prior to the vesting date in the event of (i) violation of covenants specified in the grant documentation (including, but not limited to, non-competition, non-solicitation, nondisparagement and confidentiality covenants) or (ii) termination of employment prior to the end of the vesting period (except in certain limited circumstances, such as death, disability and retirement). Options have an exercise price equal to the fair market value of the stock on the date of grant. Options granted under the ESCP expire not more than 10 years from the date of grant, and the applicable grant documentation specifies the extent to which options may be exercised during their respective terms, including in the event of an employee’s death, disability or termination of employment. Shares that are canceled, forfeited or
settled in cash from an additional frozen Merrill Lynch plan also will become available for grant under the ESCP.
Merrill Lynch Employee Stock Purchase Plan (ESPP). The purpose of the ESPP is to give employees employed by Merrill Lynch or an eligible subsidiary an opportunity to purchase the Corporation’s common stock through payroll deductions (an
employee can elect either payroll deductions of one percent to 10 percent of current compensation or an annual dollar amount equal to a maximum of 10 percent of current eligible compensation). Shares are purchased quarterly at 95 percent of the fair market value (average of the highest and lowest share prices)ESCP expired on theFebruary 24, 2013, after which date of the purchase and the maximum annual contribution is $23,750. An employee is eligible to participate if he or she was employed by Merrill Lynch or any participating subsidiary for at least 12 months prior to the start of the new plan year.no additional awards may be granted thereunder.
For additional information on our equity compensation plans, see Note 2019 – Stock-based Compensation Plans to the Consolidated Financial Statements which is incorporated herein by reference.
Item 13. Certain Relationships and RelatedTransactions, and Director Independence
IncorporatedInformation included under the following captions in the 2013 Proxy Statement is incorporated herein by reference to:reference:
| |
Ÿ | “Review of Related Person and Certain Other Transactions” and |
| |
| Ÿ | “Corporate Governance – Review of Related Person and Certain Other Transactions”; and |
| |
| Ÿ | “– Director Independence” in the 2012 Proxy Statement.Independence.” |
Item 14. Principal Accounting Fees and Services
IncorporatedInformation included under the following captions in the 2013 Proxy Statement is incorporated herein by reference to:reference:
| |
| Ÿ | “Proposal 3: Ratification of the Appointment of the Registered Independent Public Accounting Firm for 20122013 – PwC’s 2012 and 2011 Fees”; and 2010 Fees” and “– |
| |
| Ÿ | “– Audit Committee Pre-Approval Policies and Procedures” in the 2012 Proxy Statement.Procedures.” |
|
| | |
| | 278Bank of America 20112012285
| | |
Part IV
Bank of America Corporation and Subsidiaries
Item 15. Exhibits, Financial Statement Schedules
The following documents are filed as part of this report:
(1) Financial Statements:
Report of Independent Registered Public Accounting Firm
Consolidated Statement of Income for the years ended December 31, 2012, 2011 2010 and 20092010
Consolidated Statement of Comprehensive Income for the years ended December 31, 2012, 2011 and 2010
Consolidated Balance Sheet at December 31, 20112012 and 20102011
Consolidated Statement of Changes in Shareholders'Shareholders’ Equity for the years ended December 31, 2012, 2011 2010 and 20092010
Consolidated Statement of Cash Flows for the years ended December 31, 2012, 2011 2010 and 20092010
Notes to Consolidated Financial Statements
(2) Schedules:
None
(3) The exhibits filed as part of this report and exhibits incorporated herein by reference to other documents are listed in the Index to Exhibits to this Annual Report on Form 10-K (pages E-1 through E-6,E-4, including executive compensation plans and arrangements which are listed under Exhibit Nos. 10(a) through 10(III)10(aaa)).
With the exception of the information expressly incorporated herein by reference, the 20122013 Proxy Statement shall not be deemed filed as part of this Annual Report on Form 10-K.
|
| | |
286 Bank of America 2012 | | Bank of America279
|
Signatures
Pursuant to the requirements of Section 13 of the Securities Exchange Act of 1934, the registrant has duly caused this report to be signed on its behalf by the undersigned, thereunto duly authorized.
Date: February 23, 201228, 2013
|
| |
| Bank of America Corporation |
| | |
| By: | */s/ Brian T. Moynihan |
| | Brian T. Moynihan |
| | Chief Executive Officer and President |
Pursuant to the requirements of the Securities Exchange Act of 1934, this report has been signed below by the following persons on behalf of the registrant and in the capacities and on the dates indicated.
|
| | | | | |
| Signature | | Title | | Date |
| | | | | | |
* | /s/ Brian T. Moynihan | | Chief Executive Officer, President and Director (Principal Executive Officer) | | February 23, 201228, 2013 |
| Brian T. Moynihan | | |
| | | | | | |
| */s/ Bruce R. Thompson | | Chief Financial Officer (Principal Financial Officer) | | February 23, 201228, 2013 |
| Bruce R. Thompson | | |
| | | | | | |
| */s/ Neil A. Cotty | | Chief Accounting Officer (Principal Accounting Officer) | | February 23, 201228, 2013 |
| Neil A. Cotty | | |
| | | | | | |
| */s/ Sharon L. Allen | | Director | | February 28, 2013 |
| Sharon L. Allen | | |
| | | | | |
| */s/ Mukesh D. Ambani | | Director | | February 23, 201228, 2013 |
| Mukesh D. Ambani | | |
| | | | | | |
| */s/ Susan S. Bies | | Director | | February 23, 201228, 2013 |
| Susan S. Bies | | |
| | | | | | |
| */s/ Jack O. Bovender | | Director | | February 28, 2013 |
| Jack O. Bovender | | |
| | | | | |
| */s/ Frank P. Bramble, Sr. | | Director | | February 23, 201228, 2013 |
| Frank P. Bramble, Sr. | | |
| | | | | | |
| */s/ Virgis W. Colbert | | Director | | February 23, 201228, 2013 |
| Virgis W. Colbert | | |
| | | | | | |
| */s/ Charles K. Gifford | | Director | | February 23, 201228, 2013 |
| Charles K. Gifford | | |
| | | | | | |
| */s/ Charles O. Holliday, Jr. | | Director | | February 23, 201228, 2013 |
| Charles O. Holliday, Jr. | | |
| | | | |
*/s/ D. Paul Jones | | Director | | February 23, 2012 |
D. Paul Jones | | |
| | | | |
*/s/ Monica C. Lozano | | Director | | February 23, 2012 |
Monica C. Lozano | | |
|
| | |
| | 280Bank of America 20112012287
| | |
|
| | | | | |
| Signature | | Title | | Date |
| | | | | | |
| */s/ Linda P. Hudson | | Director | | February 28, 2013 |
| Linda P. Hudson | | |
| | | | | |
| */s/ Monica C. Lozano | | Director | | February 28, 2013 |
| Monica C. Lozano | | |
| | | | | |
| */s/ Thomas J. May | | Director | | February 23, 201228, 2013 |
| Thomas J. May | | |
| | | | | | |
| */s/ Donald E. Powell | | Director | | February 23, 201228, 2013 |
| Donald E. Powell | | |
| | | | | | |
| */s/ Charles O. Rossotti | | Director | | February 23, 201228, 2013 |
| Charles O. Rossotti | | |
| | | | | | |
| */s/ Robert W. Scully | | Director | | February 23, 201228, 2013 |
| Robert W. Scully | | |
| | | | | | |
| */s/ Craig T. BeazerR. David Yost | | Director | | February 28, 2013 |
| R. David Yost | | |
| | | | | |
| *By | /s/ Lauren A. Mogensen | | | | |
| Craig T. BeazerLauren A. Mogensen
Attorney-in-Fact | | | | |
|
| | |
288 Bank of America 2012 | | Bank of America281
|
Index to Exhibits
|
| | |
| Exhibit No. | | Description |
2(a) | | Agreement and Plan of Merger dated as of September 15, 2008 by and between Merrill Lynch & Co., Inc. and registrant, incorporated by reference to Exhibit 2.1 of registrant’s Current Report on Form 8-K (File No. 1-6523) filed on September 18, 2008. |
| 3(a) | | Amended and Restated Certificate of Incorporation of registrant, as in effect on the date hereof, incorporated by reference to Exhibit 3(a) of registrant’s Quarterly Report on Form 10-Q (File No. 1-6523) for the quarterly period ended September 30, 2011 filed on November 3, 2011. |
| (b) | | Amended and Restated Bylaws of registrant, as of February 24, 2011, as in effect on the date hereof, incorporated by reference to Exhibit 3(b) of registrant’s 2010 Annual Report on Form 10-K (File No. 1-6523) filed on February 25, 2011 (the “2010 10-K”). |
| 4(a) | | Indenture dated as of January 1, 1995 between registrant (successor to NationsBank Corporation) and BankAmerica National Trust Company incorporated by reference to Exhibit 4.1 of registrant’s Registration Statement on Form S-3 (Registration No. 33-57533) filed on February 1, 1995; First Supplemental Indenture thereto dated as of September 18, 1998, between registrant and U.S. Bank Trust National Association (successor to BankAmerica National Trust Company), incorporated by reference to Exhibit 4.3 of registrant’s Current Report on Form 8-K (File No. 1-6523) filed on November 18, 1998; Second Supplemental Indenture thereto dated as of May 7, 2001 between registrant, U.S. Bank Trust National Association, as Prior Trustee, and The Bank of New York, as Successor Trustee, incorporated by reference to Exhibit 4.4 of registrant’s Current Report on Form 8-K (File No. 1-6523) filed on June 14, 2001; Third Supplemental Indenture thereto dated as of July 28, 2004, between registrant and The Bank of New York, incorporated by reference to Exhibit 4.2 of registrant’s Current Report on Form 8-K (File No. 1-6523) filed on August 27, 2004; Fourth Supplemental Indenture thereto dated as of April 28, 2006 between the registrant and The Bank of New York, incorporated by reference to Exhibit 4.6 of registrant’s Registration Statement on Form S-3 (Registration No. 333-133852) filed on May 5, 2006; Fifth Supplemental Indenture dated as of December 1, 2008 between registrant and The Bank of New York Mellon Trust Company, N.A. (successor to The Bank of New York), incorporated by reference to Exhibit 4.1 of registrant’s Current Report on Form 8-K (File No. 1-6523) filed on December 5, 2008; and Sixth Supplemental Indenture dated as of February 23, 2011 between registrant and The Bank of New York Mellon Trust Company, N.A., incorporated by reference to Exhibit 4(ee) of the 2010 10-K. |
| (b) | | Form of Senior Registered Note, incorporated by reference to Exhibit 4.7 of registrant’s Registration Statement on Form S-3 (Registration No. 333-133852) filed on May 5, 2006. |
(c) | | Form of Global Senior Medium-Term Note, Series L, incorporated by reference to Exhibit 4.12 of registrant’s Registration Statement on Form S-3 (Registration No. 333-158663) filed on April 20, 2009. |
(d) | | Indenture dated as of January 1,Successor Trustee Agreement effective December 15, 1995 between registrant (successor to NationsBank Corporation) and The BankFirst Trust of New York, incorporated by referenceNational Association, as successor trustee to Exhibit 4.5 of registrant’s Registration Statement on Form S-3 (Registration No. 33-57533) filed on February 1, 1995; First Supplemental Indenture thereto dated as of August 28, 1998, between registrant and The Bank of New York, incorporated by reference to Exhibit 4.8 of registrant’s Current Report on Form 8-K (File No. 1-6523) filed on November 18, 1998; Second Supplemental Indenture thereto dated as of January 25, 2007, between registrant and The Bank of New YorkBankAmerica National Trust Company, N.A. (successor to The Bank of New York), incorporated by reference to Exhibit 4.3 of registrant’s Registration Statement on Form S-4 (Registration No. 333-141361) filed on March 16, 2007; and Third Supplemental Indenture dated as of February 23, 2011 between registrant and The Bank of New York Mellon Trust Company, N.A., incorporated by reference to Exhibit 4(ff) of the 2010 10-K. |
(e) | | Form of Subordinated Registered Note, incorporated by reference to Exhibit 4.10 of registrant’s Registration Statement on Form S-3 (Registration No. 333-133852) filed on May 5, 2006. |
(f) | | Form of Global Subordinated Medium-Term Note, Series L, incorporated by reference to Exhibit 4.17 of registrant’s Registration Statement on Form S-3 (Registration No. 333-158663) filed on April 20, 2009. |
(g) | | Amended and Restated Agency Agreement dated as of July 22, 2010, among registrant, Bank of America, N.A., London Branch, as Principal Agent, and Merrill Lynch International Bank Limited, as Registrar and Transfer Agent, incorporated by reference to Exhibit 4.1 of registrant’s Current Report on Form 8-K (File No. 1-6523) filed on July 27, 2010. |
(h) | | Amended and Restated Senior Indenture dated as of July 1, 2001 between registrant and The Bank of New York, pursuant to which registrant issued its Senior InterNotesSM, incorporated by reference to Exhibit 4.1 of registrant’s Registration Statement on Form S-3 (Registration No. 333-65750) filed on July 24, 2001; and First Supplemental Indenture dated as of February 23, 2011 between registrant and The Bank of New York Mellon Trust Company, N.A. (successor to The Bank of New York ), incorporated by reference to Exhibit 4(gg) of the 2010 10-K.
|
(i) | | Amended and Restated Subordinated Indenture dated as of July 1, 2001 between registrant and The Bank of New York, pursuant to which registrant issued its Subordinated InterNotesSM, incorporated by reference to Exhibit 4.2 of registrant’s Registration Statement on Form S-3 (Registration No. 333-65750) filed on July 24, 2001; and First Supplemental Indenture dated as of February 23, 2011 between registrant and The Bank of New York Mellon Trust Company, N.A. (successor to The Bank of New York), incorporated by reference to Exhibit 4(hh) of the 2010 10-K.333-07229).
|
(j) | | Restated Indenture dated as of November 1, 2001 between registrant and The Bank of New York, incorporated by reference to Exhibit 4.10 of amendment No. 1 to registrant’s Registration Statement on Form S-3 (Registration No. 333-70984) filed on November 15, 2001. |
(k) | | First Supplemental Indenture dated as of December 14, 2001 to the Restated Indenture dated as of November 1, 2001 between registrant and The Bank of New York pursuant to which registrant issued its 7% Junior Subordinated Notes due 2031, incorporated by reference to Exhibit 4.3 of registrant’s Current Report on Form 8-K (File No. 1-6523) filed on December 14, 2001. |
(l) | | Second Supplemental Indenture dated as of January 31, 2002 to the Restated Indenture dated as of November 1, 2001 between registrant and The Bank of New York pursuant to which registrant issued its 7% Junior Subordinated Notes due 2032, incorporated by reference to Exhibit 4.3 of registrant’s Current Report on Form 8-K (File No. 1-6523) filed on January 31, 2002. |
(m) | | Third Supplemental Indenture dated as of August 9, 2002 to the Restated Indenture dated as of November 1, 2001 between registrant and The Bank of New York pursuant to which registrant issued its 7% Junior Subordinated Notes due 2032, incorporated by reference to Exhibit 4.3 of registrant’s Current Report on Form 8-K (File No. 1-6523) filed on August 9, 2002. |
(n) | | Fourth Supplemental Indenture dated as of April 30, 2003 to the Restated Indenture dated as of November 1, 2001 between registrant and The Bank of New York pursuant to which registrant issued its 57/8% Junior Subordinated Notes due 2033, incorporated by reference to Exhibit 4.3 of registrant’s Current Report on Form 8-K (File No. 1-6523) filed on April 30, 2003.
|
(o) | | Fifth Supplemental Indenture dated as of November 3, 2004 to the Restated Indenture dated as of November 1, 2001 between registrant and The Bank of New York pursuant to which registrant issued its 6% Junior Subordinated Notes due 2034, incorporated by reference to Exhibit 4.3 of registrant’s Current Report on Form 8-K (File No. 1-6523) filed on November 3, 2004. |
(p) | | Sixth Supplemental Indenture dated as of March 8, 2005 to the Restated Indenture dated as of November 1, 2001 between registrant and The Bank of New York pursuant to which registrant issued its 55/8% Junior Subordinated Notes due 2035, incorporated by reference to Exhibit 4.3 of registrant’s Current Report on Form 8-K (File No. 1-6523) filed on March 9, 2005.
|
|
| | |
Exhibit No. | | Description |
(q) | | Seventh Supplemental Indenture dated as of August 10, 2005 to the Restated Indenture dated as of November 1, 2001 between registrant and The Bank of New York pursuant to which registrant issued its 51/4% Junior Subordinated Notes due 2035, incorporated by reference to Exhibit 4.3 of registrant’s Current Report on Form 8-K (File No. 1-6523) filed on August 11, 2005.
|
(r) | | Eighth Supplemental Indenture dated as of August 25, 2005 to the Restated Indenture dated as of November 1, 2001 between registrant and The Bank of New York pursuant to which registrant issued its 6% Junior Subordinated Notes due 2035, incorporated by reference to Exhibit 4.3 of the Current Report on Form 8-K (File No. 1-6523) filed on August 26, 2005. |
(s) | | Tenth Supplemental Indenture dated as of March 28, 2006 to the Restated Indenture dated as of November 1, 2001 between registrant and The Bank of New York pursuant to which registrant issued its 61/4% Junior Subordinated Notes due 2055, incorporated by reference to Exhibit 4(bb) of registrant’s 2006 Annual Report on Form 10-K (File No. 1-6523) filed on February 28, 2007 (the “2006 10-K”).
|
(t) | | Eleventh Supplemental Indenture dated as of May 23, 2006 to the Restated Indenture dated as of November 1, 2001 between registrant and The Bank of New York pursuant to which registrant issued its 65/8% Junior Subordinated Notes due 2036, incorporated by reference to Exhibit 4(cc) of the 2006 10-K.
|
(u) | | Twelfth Supplemental Indenture dated as of August 2, 2006 to the Restated Indenture dated as of November 1, 2001 between registrant and The Bank of New York pursuant to which registrant issued its 67/8% Junior Subordinated Notes due 2055, incorporated by reference to Exhibit 4(dd) of the 2006 10-K.
|
(v) | | Thirteenth Supplemental Indenture dated as of February 16, 2007 to the Restated Indenture dated as of November 1, 2001 between registrant and The Bank of New York Trust Company, N.A. (successor to The Bank of New York) pursuant to which registrant issued its Remarketable Floating Rate Junior Subordinated Notes due 2043, incorporated by reference to Exhibit 4.6 of registrant’s Current Report on Form 8-K (File No. 1-6523) filed on February 16, 2007. |
(w) | | Fourteenth Supplemental Indenture dated as of February 16, 2007 to the Restated Indenture dated as of November 1, 2001 between registrant and The Bank of New York Trust Company, N.A. (successor to The Bank of New York) pursuant to which registrant issued its Remarketable Fixed Rate Junior Subordinated Notes due 2043, incorporated by reference to Exhibit 4.7 of registrant’s Current Report on Form 8-K (File No. 1-6523) filed on February 16, 2007. |
(x) | | Fifteenth Supplemental Indenture dated as of May 31, 2007 to the Restated Indenture dated as of November 1, 2001 between registrant and The Bank of New York Trust Company, N.A. (successor to The Bank of New York) pursuant to which registrant issued its Floating Rate Junior Subordinated Notes due 2056, incorporated by reference to Exhibit 4.4 of registrant’s Current Report on Form 8-K (File No. 1-6523) filed on June 1, 2007. |
(y) | | Form of Supplemental Indenture to be used in connection with the issuance of registrant’s junior subordinated notes, including form of Junior Subordinated Note, incorporated by reference to Exhibit 4.44 of registrant’s Registration Statement on Form S-3 (Registration No. 333-133852) filed on May 5, 2006. |
(z) | | Form of Guarantee with respect to capital securities to be issued by various capital trusts, incorporated by reference to Exhibit 4.47 of registrant’s Registration Statement on Form S-3 (Registration No. 333-133852) filed on May 5, 2006. |
(aa)(c) | | Agreement of Appointment and Acceptance dated as of December 29, 2006 between registrant and The Bank of New York Trust Company, N.A., incorporated by reference to Exhibit 4(aaa) of theregistrant’s 2006 10-K. |
(bb) | | Global Agency Agreement dated as of July 25, 2007 among Bank of America, N.A., Deutsche Bank Trust Company Americas, Deutsche Bank AG, London Branch, and Deutsche Bank Luxembourg S.A, incorporated by reference to Exhibit 4(x) of registrant’s 2008 Annual Report on Form 10-K (File No. 1-6523) filed on February 27, 2009 (the “2008 10-K”).28, 2007. |
(cc)(d) | | Supplement to Global Agency Agreement dated asForm of December 19, 2008 among Bank of America, N.A., Deutsche Bank Trust Company Americas, Deutsche Bank AG, London Branch and Deutsche Bank Luxembourg S.A,Senior Registered Note, incorporated by reference to Exhibit 4(y)4.7 of the 2008 10-K.registrant’s Registration Statement on Form S-3 (Registration No. 333-133852) filed on May 5, 2006.
|
(dd)(e) | | Supplement toForm of Global Agency Agreement dated as of April 30, 2010 among Bank of America, N.A., Deutsche Bank Trust Company Americas, Deutsche Bank AG, London Branch and Deutsche Bank Luxembourg, S.A.,Senior Medium-Term Note, Series L, incorporated by reference to Exhibit 4(a)4.13 of registrant’s Quarterly ReportRegistration Statement on Form 10-Q (FileS-3 (Registration No. 1-6523) for the quarterly period ended June 30, 2010333-180488) filed on August 6, 2010.March 30, 2012.
|
(ee)(f) | | Supplemental Agreement to the Amended and Restated Agency Agreement dated asForm of July 22, 2011 among registrant, Bank of America, N.A. (operating through its London branch), as Principal Agent, and Merrill Lynch International Bank Limited, as Registrar and Transfer Agent,Master Global Senior Medium-Term Note, Series L, incorporated by reference to Exhibit 4(a)4.14 of registrant’s Quarterly ReportRegistration Statement on Form 10-Q (FileS-3 (Registration No. 1-6523) for the quarterly period ended June 30, 2011333-180488) filed on August 4, 2011. |
(ff) | | Sixteenth Supplemental Indenture dated as of December 8, 2011 to the Restated Indenture dated as of November 1, 2001, between registrant and The Bank of New York Mellon Trust Company, N.A. (successor to The Bank of New York), filed herewith. |
(gg) | | Seventeenth Supplemental Indenture dated as of December 8, 2011 to the Restated Indenture dated as of November 1, 2001, between registrant and The Bank of New York Mellon Trust Company, N.A. (successor to The Bank of New York), filed herewith. |
(hh) | | Eighteenth Supplemental Indenture dated as of January 12, 2012 to the Restated Indenture dated as of November 1, 2001, between registrant and The Bank of New York Mellon Trust Company, N.A. (successor to The Bank of New York), incorporated by reference to Exhibit 4.1 of registrant’s Current Report on Form 8-K (File No. 1-6523) filed on January 13, 2012. |
(ii) | | Nineteenth Supplemental Indenture dated as of January 12, 2012 to the Restated Indenture dated as of November 1, 2001, between registrant and The Bank of New York Mellon Trust Company, N.A. (successor to The Bank of New York), incorporated by reference to Exhibit 4.2 of registrant’s Current Report on Form 8-K (File No. 1-6523) filed on January 13,March 30, 2012. |
| | | Registrant and its subsidiaries have other long-term debt agreements, but these are omitted pursuant Item 601(b)(4)(iii) of Regulation S-K. Copies of these agreements will be furnished to the Commission on request. |
10(a) | | | | Exhibit No. | | Description | 10(a) | | NationsBank Corporation and Designated Subsidiaries Supplemental Executive Retirement Plan, incorporated by reference to Exhibit 10(j) of registrant’s 1994 Annual Report on Form 10-K (File No. 1-6523) filed on March 30, 1995 (the “1994 10-K”); Amendment thereto dated as of June 28, 1989, incorporated by reference to Exhibit 10(g) of registrant’s 1989 Annual Report on Form 10-K (File No. 1-6523) (the “1989 10-K”); Amendment thereto dated as of June 27, 1990, incorporated by reference to Exhibit 10(g) of registrant’s 1990 Annual Report on Form 10-K (File No. 1-6523) (the “1990 10-K”); Amendment thereto dated as of July 21, 1991, incorporated by reference to Exhibit 10(bb) of registrant’s 1991 Annual Report on Form 10-K (File No. 1-6523) (the “1991 10-K”); Amendments thereto dated as of December 3, 1992 and December 15, 1992, incorporated by reference to Exhibit 10(l) of registrant’s 1992 Annual Report on Form 10-K (File No. 1-6523) (the “1992 10-K”); Amendment thereto dated as of September 28, 1994, incorporated by reference to Exhibit 10(j) of registrant’s 1994 10-K; Amendments thereto dated March 27, 1996 and June 25, 1997, incorporated by reference to Exhibit 10(c) of registrant’s 1997 Annual Report on Form 10-K filed on March 13, 1998; Amendments thereto dated April 10, 1998, June 24, 1998 and October 1, 1998, incorporated by reference to Exhibit 10(b) of registrant’s 1998 Annual Report on Form 10-K (File No. 1-6523) filed on March 22, 1999 (the “1998 10-K”); Amendment thereto dated December 14, 1999, incorporated by reference to Exhibit 10(b) of registrant’s 1999 Annual Report on Form 10-K filed on March 20, 2000; Amendment thereto dated as of March 28, 2001, incorporated by reference to Exhibit 10(b) of registrant’s 2001 Annual Report on Form 10-K (File No. 1-6523) filed on March 27, 2002 (the “2001 10-K”); and Amendment thereto dated December 10, 2002, incorporated by reference to Exhibit 10(b) of registrant’s 2002 Annual Report on Form 10-K (File No. 1-6523) filed on March 3, 2003 (the “2002 10-K”).* | (b) | | NationsBank Corporation and Designated Subsidiaries Deferred Compensation Plan for Key Employees, incorporated by reference to Exhibit 10(k) of the 1994 10-K; Amendment thereto dated as of June 28, 1989, incorporated by reference to Exhibit 10(h) of the 1989 10-K; Amendment thereto dated as of June 27, 1990, incorporated by reference to Exhibit 10(h) of the 1990 10-K; Amendment thereto dated as of July 21, 1991, incorporated by reference to Exhibit 10(bb) of the 1991 10-K; Amendment thereto dated as of December 3, 1992, incorporated by reference to Exhibit 10(m) of the 1992 10-K; and Amendments thereto dated April 10, 1998 and October 1, 1998, incorporated by reference to Exhibit 10(b) of the 1998 10-K.* | (c)
| | Bank of America Pension Restoration Plan, as amended and restated effective January 1, 2009, incorporated by reference to Exhibit 10(c) of registrant’s 2008 10-K; Amendment thereto dated December 18, 2009, incorporated by reference to Exhibit 10(c) of registrant’s 2009 Annual Report on Form 10-K (File No. 1-6523) filed on February 26, 2010 (the “2009 10-K”); and Amendment thereto dated December 16, 2010, incorporated by reference to Exhibit 10(c) of the 2010 10-K.10-K; and Amendment thereto dated June 29, 2012, filed herewith.* | (d)(b) | | NationsBank Corporation Benefit Security Trust dated as of June 27, 1990, incorporated by reference to Exhibit 10(t) of the 1990 10-K; First Supplement thereto dated as of November 30, 1992, incorporated by reference to Exhibit 10(v) of the 1992 10-K; and Trustee Removal/Appointment Agreement dated as of December 19, 1995, incorporated by reference to Exhibit 10(o) of registrant’s 1995 Annual Report on Form 10-K (File No. 1-6523) filed on March 29, 1996.* | (e)(c) | | Bank of America 401(k) Restoration Plan, as amended and restated effective January 1, 2009, incorporated by reference to Exhibit 10(a) of registrant’s Quarterly Report on Form 10-Q (File No. 1-6523) for the quarterly period ended September 30, 20092013, filed on November 6, 2009; Amendment thereto dated December 18, 2009, incorporated by reference to Exhibit 10(e) of the 2009 10-K; and Amendment thereto dated December 16, 2010, incorporated by reference to Exhibit 10(c) of the 2010 10-K.herewith.* | (f)(d) | | Bank of America Executive Incentive Compensation Plan, as amended and restated effective December 10, 2002, incorporated by reference to Exhibit 10(g) of the 2002 10-K.10-K; and Amendment thereto dated January 23, 2013, filed herewith.* | (g)(e) | | Bank of America Director Deferral Plan, as amended and restated effective January 1, 2005, incorporated by reference to Exhibit 10(g) of the 2006 10-K.*
| (h)(f) | | Bank of America Corporation Directors’ Stock Plan as amended and restated effective April 26, 2006, incorporated by reference to Exhibit 10.2 to the registrant’s Current Report on Form 8-K filed on December 14, 2005 and the following terms of award agreements: |
| | • Form of Restricted Stock Award Agreement incorporated by reference to Exhibit 10(h) of registrant’s 2004 Annual Report on Form 10-K (File No. 1-6523) filed on March 1, 2005 (the “2004 10-K”); • Form of Directors Stock Plan Restricted Stock Award Agreement for NonemployeeNon-Employee Chairman, incorporated by reference to Exhibit 10(b) of registrant’s Quarterly Report on Form 10-Q (File No. 1-6523) for the quarterly period ended September 30, 2009 filed on November 6, 2009; • Form of Directors’ Stock Plan Restricted Stock Award Agreement for Non-U.S. Director incorporated by reference to Exhibit 10(a) of registrant’s Quarterly Report on Form 10-Q (File No. 1-6523) for the quarterly period ended March 30,31, 2011 filed on May 5, 2011; and • Form of Directors’ Stock Plan Conditional Restricted Stock Award Agreement for Non-U.S. Director incorporated by reference to Exhibit 10(a) of registrant’s Quarterly Report on Form 10-Q (File No. 1-6523) for the quarterly period ended June 30, 2011 filed on August 4, 2011. |
| (i) | | | | | Bank of America 2012E-1 |
| | | | | Exhibit No. | | Description | | (g) | | Bank of America Corporation Key Associate Stock Plan, as amended and restated effective April 28, 2010, incorporated by reference to Exhibit 10.2 of registrant’s Current Report on Form 8-K (File No. 1-6523) filed on May 3, 2010*; and the following forms of award agreement under the plan: |
| | • Form of Restricted Stock Units Award Agreement (February 2007 grant), incorporated by reference to Exhibit 10(i) of the registrant’s 2007 Annual Report on Form 10-K (File No. 1-6523) filed on February 28, 2008 (the “2007 10-K”)*; • Form of Stock Option Award Agreement (February 2007 grant), incorporated by reference to Exhibit 10(i) of the 2007 10-K*; • Form of Restricted Stock Units Award Agreement for non-executives (February 2008 grant), incorporated by reference to Exhibit 10(i) of the 2009 10-K*; • Form of Stock Option Award Agreement for non-executives (February 2008 grant), incorporated by reference to Exhibit 10(i) of the 2009 10-K*; • Restricted Stock Units Award Agreement for Sallie L. Krawcheck dated January 15, 2010, incorporated by reference to Exhibit 10(i) of the 2010 10-K.*;
• Form of Restricted Stock Units Award Agreement for executives (February 2010 grant), incorporated by reference to Exhibit 10(i) of the 2010 10-K.*; • Form of Restricted Stock Award Agreement (February 2010 grant), incorporated by reference to Exhibit 10(i) of the 2010 10-K.*; • Form of Performance Contingent Restricted Stock Units Award Agreement, incorporated by reference to Exhibit 10.3 of registrant’s Current Report on Form 8-K (File No. 1-6523) filed on January 31, 2011*; • Form of Performance Contingent Restricted Stock Units Award Agreement (February 2011 grant), incorporated by reference to Exhibit 10(i) of the 2010 10-K.*; and • Form of Restricted Stock Units Award Agreement for non-executives (February 2011 grant), incorporated by reference to Exhibit 10(i) of the 2010 10-K.*. • Form of Restricted Stock Units Award Agreement (February 2012 grant), filed herewith.incorporated by reference to Exhibit 10(i) of the 2011 10-K.* • Form of Performance Contingent Restricted Stock Units Award Agreement (February 2012 grant), incorporated by reference to Exhibit 10(i) of the 2011 10-K.* • Restricted Stock Units Award Agreement for Gary G. Lynch dated July 12, 2011, incorporated by reference to Exhibit 10(a) of registrant’s Quarterly Report on Form 10-Q (File No. 1-6523) for the quarterly period ended January 31, 2012 filed herewith.on May 3, 2012. * | (j)(h) | | Amendment to various plans in connection with FleetBoston Financial Corporation merger, incorporated by reference to Exhibit 10(v) of registrant’s 2003 Annual Report on Form 10-K filed on March 1, 2004.*
| (k)(i) | | FleetBoston Supplemental Executive Retirement Plan, as amended by Amendment One thereto effective January 1, 1997, Amendment Two thereto effective October 15, 1997, Amendment Three thereto effective July 1, 1998, Amendment Four thereto effective August 15, 1999, Amendment Five thereto effective January 1, 2000, Amendment Six thereto effective October 10, 2001, Amendment Seven thereto effective February 19, 2002, Amendment Eight thereto effective October 15, 2002, Amendment Nine thereto effective January 1, 2003, Amendment Ten thereto effective October 21, 2003, and Amendment Eleven thereto effective December 31, 2004, incorporated by reference to Exhibit 10(r) of the 2004 10-K.*
| (l)(j) | | FleetBoston Amended and Restated 1992 Stock Option and Restricted Stock Plan, incorporated by reference to Exhibit 10(s) of the 2004 10-K.* |
| | | | Exhibit No. | | Description | (m) | | FleetBoston Executive Deferred Compensation Plan No. 2, as amended by Amendment One thereto effective February 1, 1999, Amendment Two thereto effective January 1, 2000, Amendment Three thereto effective January 1, 2002, Amendment Four thereto effective October 15, 2002, Amendment Five thereto effective January 1, 2003, and Amendment Six thereto effective December 16, 2003, incorporated by reference to Exhibit 10(u) of the 2004 10-K.*
| (n)(k) | | FleetBoston Executive Supplemental Plan, as amended by Amendment One thereto effective January 1, 2000, Amendment Two thereto effective January 1, 2002, Amendment Three thereto effective January 1, 2003, Amendment Four thereto effective January 1, 2003, and Amendment Five thereto effective December 31, 2004, incorporated by reference to Exhibit 10(v) of the 2004 10-K.*
| (o)(l) | | Retirement Income Assurance Plan for Legacy Fleet, as amended and restated effective January 1, 2009, incorporated by reference to Exhibit 10(p) of the 2009 10-K; and Amendment thereto dated December 16, 2010, incorporated by reference to Exhibit 10(c) of the 2010 10-K.10-K; and Amendment thereto dated June 29, 2012, filed herewith.*
| (p)(m) | | Trust Agreement for the FleetBoston Executive Deferred Compensation Plans No. 1 and 2, incorporated by reference to Exhibit 10(x) of the 2004 10-K.
| (q)(n) | | Trust Agreement for the FleetBoston Executive Supplemental Plan, incorporated by reference to Exhibit 10(y) of the 2004 10-K.*
| (r)(o) | | Trust Agreement for the FleetBoston Retirement Income Assurance Plan and the FleetBoston Supplemental Executive Retirement Plan, incorporated by reference to Exhibit 10(z) of the 2004 10-K.*
| (s)(p) | | FleetBoston Directors Deferred Compensation and Stock Unit Plan, as amended by an amendment thereto effective as of July 1, 2000, a Second Amendment thereto effective as of January 1, 2003, a Third Amendment thereto dated April 14, 2003, and a Fourth Amendment thereto effective January 1, 2004, incorporated by reference to Exhibit 10(aa) of the 2004 10-K.*
| (t)(q) | | FleetBoston 1996 Long-Term Incentive Plan, incorporated by reference to Exhibit 10(bb) of the 2004 10-K.* | (u) | | BankBoston Corporation and its Subsidiaries Deferred Compensation Plan, as amended by a First Amendment thereto, a Second Amendment thereto, a Third Amendment thereto, an Instrument thereto (providing for the cessation of accruals effective December 31, 2000) and an Amendment thereto dated December 24, 2001, incorporated by reference to Exhibit 10(cc) of the 2004 10-K.*
| (v)(r) | | BankBoston, N.A. Bonus Supplemental Employee Retirement Plan, as amended by a First Amendment, a Second Amendment, a Third Amendment and a Fourth Amendment thereto, incorporated by reference to Exhibit 10(dd) of the 2004 10-K.*
| (w)(s) | | Description of BankBoston Supplemental Life Insurance Plan, incorporated by reference to Exhibit 10(ee) of the 2004 10-K.*
| (x)(t) | | BankBoston, N.A. Excess Benefit Supplemental Employee Retirement Plan, as amended by a First Amendment, a Second Amendment, a Third Amendment thereto (assumed by FleetBoston on October 1, 1999) and an Instrument thereto, incorporated by reference to Exhibit 10(ff) of the 2004 10-K.*
| (y)(u) | | Description of BankBoston Supplemental Long-Term Disability Plan, incorporated by reference to Exhibit 10(gg) of the 2004 10-K.*
| (z)(v) | | BankBoston Director Stock Award Plan, incorporated by reference to Exhibit 10(hh) of the 2004 10-K.*
| (aa)(w) | | BankBoston Directors Deferred Compensation Plan, as amended by a First Amendment and a Second Amendment thereto, incorporated by reference to Exhibit 10(ii) of the 2004 10-K.*
| (bb)(x) | | BankBoston, N.A. Directors’ Deferred Compensation Plan, as amended by a First Amendment and a Second Amendment thereto, incorporated by reference to Exhibit 10(jj) of the 2004 10-K.*
| (cc)(y) | | BankBoston 1997 Stock Option Plan for Non-Employee Directors, as amended by an amendment thereto dated as of October 16, 2001, incorporated by reference to Exhibit 10(kk) of the 2004 10-K.*
| (dd)(z) | | Description of BankBoston Director Retirement Benefits Exchange Program, incorporated by reference to Exhibit 10(ll) of the 2004 10-K.*
| (ee)(aa) | | Employment Agreement, dated as of March 14, 1999, between FleetBoston and Charles K. Gifford, as amended by an amendment thereto effective as of February 7, 2000, a Second Amendment thereto effective as of April 22, 2002, and a Third Amendment thereto effective as of October 1, 2002, incorporated by reference to Exhibit 10(mm) of the 2004 10-K.*
| (ff)(bb) | | Form of Change in Control Agreement entered into with Charles K. Gifford, incorporated by reference to Exhibit 10(nn) of the 2004 10-K.*
|
| (gg) | | | E-2 Bank of America 2012 | | |
| | | | | Exhibit No. | | Description | | (cc) | | Global amendment to definition of “change in control” or “change of control,” together with a list of plans affected by such amendment, incorporated by reference to Exhibit 10(oo) of the 2004 10-K.*
| (hh)(dd) | | Retirement Agreement dated January 26, 2005 between Bank of America Corporation and Charles K. Gifford, incorporated by reference to Exhibit 10.1 to registrant’s Current Report on Form 8-K (File No. 1-6523) filed on January 26, 2005.*
| (ii)(ee) | | Amendment to various FleetBoston stock option awards, dated March 25, 2004, incorporated by reference to Exhibit 10(ss) of the 2004 10-K.* | (jj) | | Merrill Lynch & Co., Inc. Employee Stock Compensation Plan, incorporated by reference to Exhibit 10(rr) of the 2008 10-K, and 2009 Restricted Stock Unit Award Agreement for Thomas K. Montag, incorporated by reference to Exhibit 10(qq) of the 2009 10-K.*
| (kk)(ff) | | Employment Agreement dated October 27, 2003 between Bank of America Corporation and Brian T. Moynihan, incorporated by reference to Exhibit 10(d) of registrant’s Registration Statement on Form S-4 (Registration No. 333-110924) filed on December 4, 2003.*
| (ll)(gg) | | Cancellation Agreement dated October 26, 2005 between Bank of America Corporation and Brian T. Moynihan, incorporated by reference to Exhibit 10.1 of registrant’s Current Report on Form 8-K (File No. 1-6523) filed on October 26, 2005.*
| (mm)(hh) | | Agreement Regarding Participation in the Fleet Boston Supplemental Executive Retirement Plan dated October 26, 2005 between Bank of America Corporation and Brian T. Moynihan, incorporated by reference to Exhibit 10.2 of registrant’s Current Report on Form 8-K (File No. 1-6523) filed on October 26, 2005.*
| (nn)(ii) | | Forms of Stock Unit Agreements for salary stock units awarded to certain executive officers in connection with registrant’s participation in the U.S. Department of Treasury’s Troubled Asset Relief Program, incorporated by reference to Exhibit 10(uu) of the 2009 10-K.*
| (oo)(jj) | | Bank of America Corporation Equity Incentive Plan amended and restated effective as of January 1, 2008, incorporated by reference to Exhibit 10(zz) of the 2009 10-K.*
| (pp)(kk) | | Merrill Lynch & Co., Inc. Long-Term Incentive Compensation Plan amended as of January 1, 2009 and 2008 Restricted Units/Stock Option Grant Document for Thomas K. Montag, incorporated by reference to Exhibit 10(aaa) of the 2009 10-K.*
| (qq)(ll) | | Employment Letter dated May 1, 2008 between Merrill Lynch & Co., Inc. and Thomas K. Montag and Summary of Agreement with respect to Post-Employment Medical Coverage, incorporated by reference to Exhibit 10(bbb) of the 2009 10-K.* |
| | | | Exhibit No.(mm) | | Description | (rr) | | AmendmentForm of Warrant to various plans as required to the extent necessary to comply with Section III of the Emergency Economic Stabilization Act of 2008 (EESA) and form of waiver for any changes to compensation or benefits required to comply with the EESA, all in connection with registrant’spurchase common stock (expiring October 26, 2008 participation in the U.S. Department of Treasury’s Troubled Assets Relief Program,28, 2018), incorporated by reference to Exhibit 10(ss)4.2 of the 2008 10-K.*registrant’s Registration Statement on Form 8-A (File No. 1-6523) filed on March 4, 2010.
| (ss)(nn) | | Further amendmentForm of Warrant to various plans and further form of waiver for any changes to compensation or benefits in connection with registrant’spurchase common stock (expiring January 15, 2009 participation in the U.S. Department of Treasury’s Troubled Assets Relief Program,16, 2019), incorporated by reference to Exhibit 10(tt)4.2 of the 2008 10-K.* | (tt) | | Letter Agreement, dated October 26, 2008, between registrant and U.S. Department of the Treasury, with respect to the issuance and sale of registrant’s Fixed Rate Cumulative Perpetual Preferred Stock, Series N and a warrant to purchase common stock, incorporated by reference to Exhibit 10.1 of registrant’s Current ReportRegistration Statement on Form 8-K8-A (File No. 1-6523) filed on October 30, 2008.March 4, 2010.
| (uu)(oo) | | Letter Agreement, dated January 9, 2009, between registrant and U.S. Department of the Treasury, with respect to the issuance and sale of registrant’s Fixed Rate Cumulative Perpetual Preferred Stock, Series Q and a warrant to purchase common stock, incorporated by reference to Exhibit 10.1 of registrant’s Current Report on Form 8-K (File No. 1-6523) filed on January 13, 2009. | (vv) | | Securities Purchase Agreement, dated January 15, 2009, between registrant and U.S. Department of the Treasury, with respect to the issuance and sale of registrant’s Fixed Rate Cumulative Perpetual Preferred Stock, Series R and a warrant to purchase common stock, incorporated by reference to Exhibit 10.1 of registrant’s Current Report on Form 8-K (File No. 1-6523) filed on January 22, 2009. | (ww) | | Summary of Terms, dated January 15, 2009, incorporated by reference to Exhibit 10.2 of registrant’s Current Report on Form 8-K (File No. 1-6523) filed on January 22, 2009. | (xx) | | Letter Agreement dated December 9, 2009 between registrant and the U.S. Department of the Treasury, amending the Securities Purchase Agreement dated January 9, 2009, incorporated by reference to Exhibit 10(iii) of the 2009 10-K. | (yy) | | Letter Agreement dated December 9, 2009 between registrant and the U.S. Department of the Treasury, amending the Securities Purchase Agreement dated January 15, 2009, incorporated by reference to Exhibit 10(jjj) of the 2009 10-K. | (zz) | | Retention Award Letter Agreement with Bruce R. Thompson dated January 26, 2009, incorporated by reference to Exhibit 10(ddd) of the 2010 10-K.*
| (aaa) | | Offer letter between registrant and Sallie L. Krawcheck dated August 3, 2009, incorporated by reference to Exhibit 10(eee) of the 2010 10-K.* | (bbb)(pp) | | Offer letter between registrant and Charles H. Noski dated April 13, 2010, incorporated by reference to Exhibit 10.1 of registrant’s Current Report on Form 8-K (File No. 1-6523) filed on April 16, 2010.*
| (ccc)(qq) | | Form of Cash-Settled Stock Unit Award Agreement, incorporated by reference to Exhibit 10.2 of registrant’s Current Report on Form 8-K (File No. 1-6523) filed on January 31, 2011.*
| (ddd)(rr) | | Form of Cash-Settled Stock Unit Award Agreement (February 2011 grant), incorporated by reference to Exhibit 10(iii) of the 2010 10-K.*
| (eee)(ss) | | Aircraft Time Sharing Agreement (Multiple Aircraft) dated February 24, 2011 between Bank of America, N. A. and Brian T. Moynihan, incorporated by reference to Exhibit 10(jjj) of the 2010 10-K.*
| (fff)(tt) | | Form of Bank of America Corporation Long-Term Cash Award Agreement for non-executives (February 2009 EIP award), incorporated by reference to Exhibit 10(kkk) of the 2010 10-K.*
| (ggg)(uu) | | Form of Bank of America Corporation Long-Term Cash Award Agreement for non-executives (February 2009 APP award), incorporated by reference to Exhibit 10(lll) of the 2010 10-K.*
| (hhh)(vv) | | General Release and Separation Agreement between registrant and Sallie L. Krawcheck dated October 6, 2011, incorporated by reference to Exhibit 10.1 of registrant’s Current Report on Form 8-K (File no. 1-6523) filed on October 7, 2011. | (iii) | | General Release and Separation Agreement between registrant and Joe L. Price dated October 6, 2011, incorporated by reference to Exhibit 10.1 of registrant’s Current Report on Form 8-K (File no. 1-6523) filed on October 7, 2011. | (jjj) | | Bank of America Corporation and Designated Subsidiaries Supplemental Executive Retirement Plan for Senior Management Employees effective as of January 1, 1989, reflecting the following amendments: Amendments thereto dated as of June 28, 1989, June 27, 1990, July 21, 1991, December 3, 1992, December 15, 1992, September 28, 1994, March 27, 1996, June 25, 1997, April 10, 1998, June 24, 1998, October 1, 1998, December 14, 1999, and March 28, 2001; and Amendment thereto dated December 10, 2002, filed herewith.incorporated by reference to Exhibit 10(jjj) of the 2011 10-K.*
| (kkk)(ww) | | Settlement Agreement dated as of June 28, 2011, among The Bank of New York Mellon, registrant, BAC Home Loans Servicing, LP, Countrywide Financial Corporation, and Countrywide Home Loans, Inc., incorporated by reference to Exhibit 99.2 of registrant’s Current Report on Form 8-K (File no. 1-6523) filed on June 29, 2011.
| (lll)(xx) | | Institutional Investor Agreement dated as of June 28, 2011, among The Bank of New York Mellon, registrant, BAC Home Loans Servicing, LP, Countrywide Financial Corporation, Countrywide Home Loans, Inc. and the other parties thereto, incorporated by reference to Exhibit 99.3 of registrant’s Current Report on Form 8-K (File no. 1-6523) filed on June 29, 2011.
| (mmm)(yy) | | Securities Purchase Agreement dated August 25, 2011 between registrant and Berkshire Hathaway Inc. (including forms of the Certificate of Designations, Warrant and Registration Rights Agreement), incorporated by reference to Exhibit 1.1 of registrant’s Current Report on Form 8-K (File No. 1-6523) filed on August 25, 2011.
| | (zz) | | Long-Term Cash Award Agreement for Gary G. Lynch dated July 12, 2011, incorporated by reference to Exhibit 10(b) of registrant’s Quarterly Report on Form 10-Q (File No. 1-6523) for the quarterly period ended January 31, 2012 filed on May 3, 2012. * | | (aaa) | | Offer Letter between registrant and Gary G. Lynch dated April 14, 2011, incorporated by reference to Exhibit 10(c) of registrant’s Quarterly Report on Form 10-Q (File No. 1-6523) for the quarterly period ended January 31, 2012 filed on May 3, 2012. *
| | 12 | | Ratio of Earnings to Fixed Charges, filed herewith. | | | | Ratio of Earnings to Fixed Charges and Preferred Dividends, filed herewith. | | 21 | | List of Subsidiaries, filed herewith. | | 23(a) | | Consent of PricewaterhouseCoopers LLP, filed herewith. | | (b) | | Consent of PricewaterhouseCoopers LLP, filed herewith. | 24(a) 24 | | Power of Attorney, filed herewith. | (b) | | Corporate Resolution, filed herewith. | | 31(a) | | Certification of the Chief Executive Officer pursuant to Section 302 of the Sarbanes-Oxley Act of 2002, filed herewith. | | (b) | | Certification of the Chief Financial Officer pursuant to Section 302 of the Sarbanes-Oxley Act of 2002, filed herewith. | | 32(a) | | Certification of the Chief Executive Officer pursuant to 18 U.S.C. Section 1350, as adopted pursuant to Section 906 of the Sarbanes-Oxley Act of 2002, filed herewith. |
| | | | | Exhibit No. | | Description | | (b) | | Certification of the Chief Financial Officer pursuant to 18 U.S.C. Section 1350, as adopted pursuant to Section 906 of the Sarbanes-Oxley Act of 2002, filed herewith. | | 99(a) | | Resolution Agreement with Respect to Certain Repurchase and Make-Whole Obligations and Claims dated as of December 31, 2010,January 6, 2013 by and among Fannie Mae, and Bank of America, N.A., BAC Home Loans Servicing LPNational Association and Countrywide Home Loans, Inc., filed herewith.herewith. We have requested confidential treatment of certain provisions contained in this exhibit. The copy filed as an exhibit omits the information subject to the confidentiality request. The schedules to this agreement were filed in paper on February 23, 2012,28, 2013, pursuant to a temporarycontinuing hardship exemption.
| | (b) | | Settlement Agreement dated as of December 31, 2010 by and between Federal Home Loan Mortgage Corporation, Bank of America, National Association, BAC Home Loans Servicing, L.P. and Countrywide Home Loans, Inc., filed herewith. We have requested confidential treatment of certain provisions contained in this exhibit. The copy filed as an exhibit omits the information subject to the confidentiality request. Exhibits A-1, A-2 and C to this agreement were filed in paper on February 23, 2012, pursuant to a temporarycontinuing hardship exemption.
| | (c) | | Resolution Agreement with Respect to Certain Repurchase and Make-Whole Obligations and Claims dated as of December 31, 2010, by and among Fannie Mae, and Bank of America, N.A., BAC Home Loans Servicing LP and Countrywide Home Loans, Inc., incorporated by reference to Exhibit 99(a) of registrant’s 2011 Annual Report on Form 10-K (File No. 1-6523) filed on February 23, 2012.
| | Exhibit 101.INS | | XBRL Instance Document, filed herewith | | Exhibit 101.SCH | | XBRL Taxonomy Extension Schema Document, filed herewith | | Exhibit 101.CAL | | XBRL Taxonomy Extension Calculation Linkbase Document, filed herewith | | Exhibit 101.LAB | | XBRL Taxonomy Extension Label Linkbase Document, filed herewith | | Exhibit 101.PRE | | XBRL Taxonomy Extension Presentation Linkbase Document, filed herewith | | Exhibit 101.DEF | | XBRL Taxonomy Extension Definitions Linkbase Document, filed herewith |
___________________________ | | * | Exhibit is a management contract or a compensatory plan or arrangement. |
|